Embed Size (px)
Citation preview

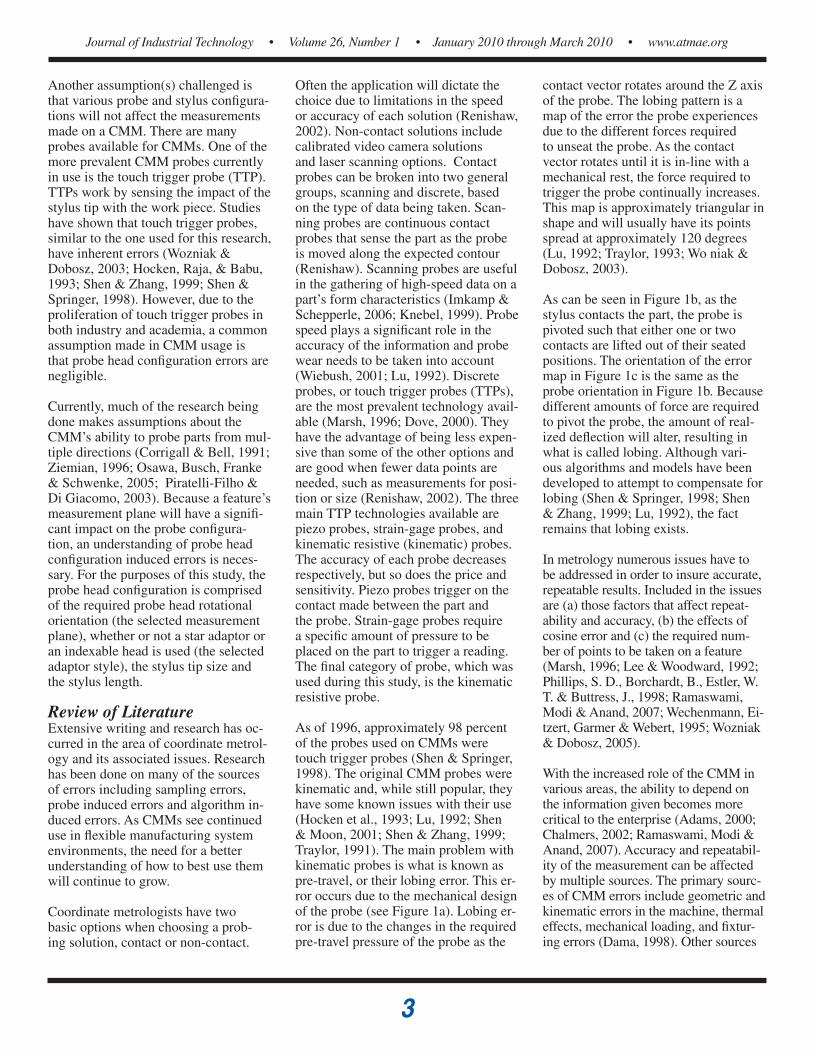
The Official Electronic Publication of The Association of Technology, Management, and Applied Engineering • www.atmae.org
© 2010
Coordinate Measuring Machine Variations for Selected Probe Head Configurations
By Dr. Kevin Berisso & Dr. Troy Ollison
Volume 26, Number 1 - January 2010 through March 2010
Peer-RefereedApplied Papers
ManufacturingMetrologyResearch
KeywoRd SeaRCH

2
Journal of Industrial Technology • Volume 26, Number 1 • January 2010 through March 2010 • www.atmae.org
Coordinate Measuring Machine Variations for Selected Probe Head Configurations By Dr. Kevin Berisso & Dr. Troy Ollison
AbstractIn coordinate measuring machine (CMM) research, there is often a need to measure the same feature repeatedly using multiple settings. However, the effects of changing the probe head con-figuration were previously unknown. The goal of this research was the determination of what effects the selec-tion of the measurement plane, adap-tor style, stylus length, and stylus size would have on the CMM’s ability to repeatedly measure a single diameter.
An analysis of variance (ANOVA) study was conducted using a Brown & Sharpe MicroVal CMM. Three mea-surement planes (XY, XZ, and YZ), two adaptor styles (a star probe and an indexable head), two stylus lengths, and two stylus sizes were selected for the study. Ten measurements were taken on a single gage ring for each variable combination and the data were pro-cessed in SPSS.
The results of this study indicate that if the measurement plane, stylus length, or stylus size were changed, the CMM would not repeatedly result in the same measurement reading. However, the user would be able to alter the adaptor style without affecting the resulting measurement. Additionally, the inter-actions of (a) measurement plane and adaptor style; (b) measurement plane and stylus length; (c) measurement plane, adaptor style and stylus length; (d) measurement plane, adaptor style and stylus size; and (e) measurement plane, adaptor style, stylus length, and stylus size all show significant measurement variations for the same feature. As future research is done on CMMs, care will be needed with
the assumptions that are made when researching a specific effect. Based on this study, future researchers will have to determine whether observed changes are due to the probe head configuration or the changes they are studying.
IntroductionReductions in product life-cycle durations are driving companies to develop and produce products at an ever-increasing rate. Industry experts are predicting the arrival of rapid manu-facturing through the use of flexible manufacturing systems. Even a brief examination of industry periodicals such as Manufacturing Engineering, Technometrics, Production, Quality or Supply Chain Systems, would reveal discussions about highly integrated systems that are flexible, agile and lean. One result of these trends is the incorporation of coordinate measuring machines (CMMs), which allow com-panies to perform data collection and process verification within the manu-facturing cell.
Research on various coordinate me-trology issues have paralleled the increased usage of CMMs in industry as inadequacies are uncovered and new needs develop. Research topics have covered such areas as the development of new probe compensation algorithms, sampling strategies, part orientation optimization, and computer generated inspection paths. As is often the case in research, assumptions have to be made in the interest of ensuring study feasibility. One such assumption is that the part orientation will not affect the measurements made by the CMM. This is one of the assumptions that this study challenged.
Dr. Troy Ollison is an Assistant Professor of Technology and Engineering Technology at the University of Central Missouri in Warrensburg, Missouri. Ollison has been teaching both gradu-ate and undergraduate courses for eight years. He is also an active member of the Society of Manufacturing Engineers as well as the Asso-ciation of Technology Management and Applied Engineering (ATMAE). His primary interest and research areas are in metrology, rapid prototyping and materials processing and testing.
Dr. Kevin Berisso is the Director of the AIDC Lab at Ohio University as well as an Assistant Profes-sor in the Department of Industrial Technology. He received his BS in Industrial Technology from Ohio University and a MS in Industrial Technology from Indiana State University before taking a posi-tion with Applied Tactical Systems, a warehouse management software company. While at ATS, Dr. Berisso worked as a project engineer with companies such as Colgate-Palmolive and TRW. He then went to work for Delphi Automotive as a manufacturing engineer in the automotive battery division. In 2003 Dr. Berisso received his PhD in Technology Management from Indiana State University. He then proceeded to teach at Central Missouri State University before returning to OU in the summer of 2005. Included in Dr. Berisso’s research interests are RFID, direct part marking and the integration of AIDC with manufacturing processes and automation.”
3
Journal of Industrial Technology • Volume 26, Number 1 • January 2010 through March 2010 • www.atmae.org
Another assumption(s) challenged is that various probe and stylus configura-tions will not affect the measurements made on a CMM. There are many probes available for CMMs. One of the more prevalent CMM probes currently in use is the touch trigger probe (TTP). TTPs work by sensing the impact of the stylus tip with the work piece. Studies have shown that touch trigger probes, similar to the one used for this research, have inherent errors (Wozniak & Dobosz, 2003; Hocken, Raja, & Babu, 1993; Shen & Zhang, 1999; Shen & Springer, 1998). However, due to the proliferation of touch trigger probes in both industry and academia, a common assumption made in CMM usage is that probe head configuration errors are negligible.
Currently, much of the research being done makes assumptions about the CMM’s ability to probe parts from mul-tiple directions (Corrigall & Bell, 1991; Ziemian, 1996; Osawa, Busch, Franke & Schwenke, 2005; Piratelli-Filho & Di Giacomo, 2003). Because a feature’s measurement plane will have a signifi-cant impact on the probe configura-tion, an understanding of probe head configuration induced errors is neces-sary. For the purposes of this study, the probe head configuration is comprised of the required probe head rotational orientation (the selected measurement plane), whether or not a star adaptor or an indexable head is used (the selected adaptor style), the stylus tip size and the stylus length.
Review of LiteratureExtensive writing and research has oc-curred in the area of coordinate metrol-ogy and its associated issues. Research has been done on many of the sources of errors including sampling errors, probe induced errors and algorithm in-duced errors. As CMMs see continued use in flexible manufacturing system environments, the need for a better understanding of how to best use them will continue to grow.
Coordinate metrologists have two basic options when choosing a prob-ing solution, contact or non-contact.
Often the application will dictate the choice due to limitations in the speed or accuracy of each solution (Renishaw, 2002). Non-contact solutions include calibrated video camera solutions and laser scanning options. Contact probes can be broken into two general groups, scanning and discrete, based on the type of data being taken. Scan-ning probes are continuous contact probes that sense the part as the probe is moved along the expected contour (Renishaw). Scanning probes are useful in the gathering of high-speed data on a part’s form characteristics (Imkamp & Schepperle, 2006; Knebel, 1999). Probe speed plays a significant role in the accuracy of the information and probe wear needs to be taken into account (Wiebush, 2001; Lu, 1992). Discrete probes, or touch trigger probes (TTPs), are the most prevalent technology avail-able (Marsh, 1996; Dove, 2000). They have the advantage of being less expen-sive than some of the other options and are good when fewer data points are needed, such as measurements for posi-tion or size (Renishaw, 2002). The three main TTP technologies available are piezo probes, strain-gage probes, and kinematic resistive (kinematic) probes. The accuracy of each probe decreases respectively, but so does the price and sensitivity. Piezo probes trigger on the contact made between the part and the probe. Strain-gage probes require a specific amount of pressure to be placed on the part to trigger a reading. The final category of probe, which was used during this study, is the kinematic resistive probe.
As of 1996, approximately 98 percent of the probes used on CMMs were touch trigger probes (Shen & Springer, 1998). The original CMM probes were kinematic and, while still popular, they have some known issues with their use (Hocken et al., 1993; Lu, 1992; Shen & Moon, 2001; Shen & Zhang, 1999; Traylor, 1991). The main problem with kinematic probes is what is known as pre-travel, or their lobing error. This er-ror occurs due to the mechanical design of the probe (see Figure 1a). Lobing er-ror is due to the changes in the required pre-travel pressure of the probe as the
contact vector rotates around the Z axis of the probe. The lobing pattern is a map of the error the probe experiences due to the different forces required to unseat the probe. As the contact vector rotates until it is in-line with a mechanical rest, the force required to trigger the probe continually increases. This map is approximately triangular in shape and will usually have its points spread at approximately 120 degrees (Lu, 1992; Traylor, 1993; Woźniak & Dobosz, 2003).
As can be seen in Figure 1b, as the stylus contacts the part, the probe is pivoted such that either one or two contacts are lifted out of their seated positions. The orientation of the error map in Figure 1c is the same as the probe orientation in Figure 1b. Because different amounts of force are required to pivot the probe, the amount of real-ized deflection will alter, resulting in what is called lobing. Although vari-ous algorithms and models have been developed to attempt to compensate for lobing (Shen & Springer, 1998; Shen & Zhang, 1999; Lu, 1992), the fact remains that lobing exists.
In metrology numerous issues have to be addressed in order to insure accurate, repeatable results. Included in the issues are (a) those factors that affect repeat-ability and accuracy, (b) the effects of cosine error and (c) the required num-ber of points to be taken on a feature (Marsh, 1996; Lee & Woodward, 1992; Phillips, S. D., Borchardt, B., Estler, W. T. & Buttress, J., 1998; Ramaswami, Modi & Anand, 2007; Wechenmann, Ei-tzert, Garmer & Webert, 1995; Wozniak & Dobosz, 2005).
With the increased role of the CMM in various areas, the ability to depend on the information given becomes more critical to the enterprise (Adams, 2000; Chalmers, 2002; Ramaswami, Modi & Anand, 2007). Accuracy and repeatabil-ity of the measurement can be affected by multiple sources. The primary sourc-es of CMM errors include geometric and kinematic errors in the machine, thermal effects, mechanical loading, and fixtur-ing errors (Dama, 1998). Other sources

4
Journal of Industrial Technology • Volume 26, Number 1 • January 2010 through March 2010 • www.atmae.org
of error that may not be quite as obvious include the length of the probe stylus, the probe diameter, the probe contact angles, the required probe contact force (Dove, 2000), user errors, humidity, dust, part cleanliness (Knebel, 1998), probe geometry, work piece imperfec-tions, and probe-feature interactions (Elshennawy, 1987). In Marsh’s 1993 study (as cited in Marsh, 1996), it was found that there was a significant improvement in the repeatability of the machine as the number of points taken was increased One of the more prevalent methods of determining a feature based on discrete data points is least squares (Dowling, Griffin, Tsui, & Zhou, 1997; Ramas-wami, Kanagaraj & Anand, 2009). In the least squares method, the computer will calculate the minimum variance of each point from a theoretical feature. With the least squares method, the system will be able to give a best guess at what the correct value should be. As can be imagined, the more points that are collected, the better the estimation (measurement) of the actual diameter. The available literature implies that there is no single answer for the determination of the proper sampling strategy (how many data points to collect). While all authors agree that more points will provide better repre-sentations (Choi, W., Kurfess, T. R. & Cagan, J., 1998; Marsh, 1996; Hocken et al., 1993; Ramaswami, Kanagaraj & Anand, 2009; Weckenmann, A., Eitzert, H., Garmer, M. & Webert, H., 1995), the maximum required number varies. The study by Hocken et al.(1993) sup-port between seven and eleven points on a circle as the appropriate number of points, whereas Dowling et al. (1997) suggest that four to eight points will be enough. In his review, Ziemian’s 1996 study discusses research that indicates that no more than sixteen points will be needed. Furthermore, in his study of multi-baseline repeatability, Marsh’s study (1993) selected between three and ten measurement points on a diam-eter. For the purposes of this study, a sampling strategy of ten measurement points was selected. This selection was based upon the balancing of time with improved feature definition.
Figure 1. Kinematic Probe Illustration. The existence of probe lobing is due to the three-point design of kinematic probes. Image (a) illustrates the internal parts of a kinematic probe. Image (b) shows that as the probe is forced in a given direction, it can be pivoted onto either one or two of the contacts, resulting in different required forces, as shown in image (c). Images (a) and (b) are derived from Renishaw. Image
(c) is reprinted with permission from Brown & Sharpe.
MethodologyAs mentioned previously, the goal of this study was the determination of whether various probe head configura-tions and measurement orientations would have an effect on the CMM’s ability to repeatedly measure a feature. The methodology for this study was to measure an inside diameter gage ring in each combination of measurement plane, adaptor style, stylus size and sty-lus length. The independent variables investigated in this study were the mea-surement plane, the adaptor style, the stylus length, and the stylus size. The
dependant variable was the measured diameter of the gage ring.
The following null and alternative hy-potheses, and their associated interac-tions, were tested. For all hypotheses, an alpha of 0.01 was selected.
1. Ho1: µ xy plane = µ xz plane = µ yz plane. There is no difference in the mean measurement of the part based on the measurement plane (measurements in the XY, XZ, or YZ planes) of the part.
2. Ho2: µ star probe = µ indexable head. There is no difference in the mean measure-

5
Journal of Industrial Technology • Volume 26, Number 1 • January 2010 through March 2010 • www.atmae.org
ment of the part based on the adaptor style.
3. Ho3: µ stylus length 1 = µ stylus length 2. There is no difference in the mean mea-surement of the part based on the stylus length that is used.
4. Ho4: µ stylus tip 1 = µ stylus tip 2. There is no difference in the mean measurement of the part based on the stylus tip that is used.
As seen in Figure 2, the part (gage ring) was oriented along one of three axial planes (XY, XZ, and YZ). Parts orient-ed on the XY plane were situated such that only the X and Y axes were used to obtain the points, because all points were taken the same distance from the top surface of the ring. Parts oriented on the XZ and YZ planes were situated such that the axes listed in the orienta-tion were the only ones used (for the XZ plane, only the X and Z planes were manipulated).
As parts are moved from one mea-surement plane to another, the probe orientation was moved as well. The two methods used to achieve this were: 1) the use of a star probe adaptor and 2) the use of an indexable head (see Figure 3).
Increased stylus lengths have the po-tential of magnifying CMM measure-ment errors. Due to this possibility, two lengths were chosen in this study which represent the shortest length currently available for the machine and a longer stylus that incorporates a single shank extension.
The size or diameter of the stylus also has the potential to induce measure-ment errors. Stylus size selection is often made based on the surface of the part being measured, as smaller probes are more susceptible to irregular surfaces. However, as the size of the stylus tip increases the weight of the probe could induce an error. The tips that were selected for this study were a small spherical stylus tip and a disk shaped tip that is actually a slice of a larger sphere. During this research, the temperature was recorded during the data collection periods, but not
controlled. However, if the tempera-ture change had exceeded two degrees Fahrenheit during a run, that run would be performed again. A two degree change was chosen because the thermal expansion of two degrees is sufficiently small such that it is outside the CMM’s measuring capability.
The machine used for this study was a Brown & Sharpe MicroVal PFx Direct Computer Controlled (DCC) Coordi-
nate Measuring Machine. The software available allowed for program inspec-tion routines and the automatic collec-tion of the data. A Renishaw MH20i indexable head with a TP20 extended force probe module and Renishaw’s basic tip kit were used as the selected probing hardware. Prior to the begin-ning of the research, the machine was calibrated and received a certification from Brown & Sharpe’s service depart-ment. Also, all other use of the CMM
Figure 2. Selected Ring Orientations. Each ring is oriented on a separate CMM plane that has been designated by the two axes that are moved during the measurement process.
Figure 3. Adaptor Styles. The image on the left is an indexable probe head. The image on the right is a star-adaptor that would be used with a non-indexable probe head.
Reprinted with permission from Brown & Sharpe.

6
Journal of Industrial Technology • Volume 26, Number 1 • January 2010 through March 2010 • www.atmae.org
was suspended until after the data for this research was collected to protect the CMM from possible abuse through misuse.
Because external sources of variation would have brought the validity of any conclusions into question, various precautions were taken to help limit the impact of any extraneous sources. Among these efforts were climate con-trol, vibration control and part variation issues. Because all CMMs are con-strained by their volumetric accuracy, movement of the part between data col-lection runs could inadvertently intro-duce volumetric inaccuracies into data sets (Piratelli-Filho & Di Giacomo, 2003). The chosen method of account-ing for this possible issue was to keep the locations of the part (gage ring) as static as possible and moving the part only when absolutely necessary. By sequencing the variables in the pattern shown in Figure 4, the movement of the parts within the area of the CMM was minimized. For example, based on Marsh’s methodology, the parts were not moved between the data collec-tion runs for the small and large stylus lengths. This minimized the effects of volumetric inaccuracies between most variables (Marsh, 1996).
The actual data collection was done au-tomatically by the CMM. The research-er developed two programs that allowed the system to automatically collect data on each variable group with a minimal level of user intervention. When the program was finished, the stylus length, stylus size, or adaptor style was altered as required, per the flow shown in Fig-ure 4. Based on Marsh’s (1993) meth-odology, all measurement combinations were done before advancing to the next adjustment to minimize temperature variations among the variable groups (Marsh, 1996).
Prior to each physical probe configu-ration, the probe was re-qualified to account for changes in the probe tip location. Previous observations have noted that the qualification process can produce varying stylus diameters. Because calculations are being made
during the qualification process, some level of variation was expected.
Multiple analysis techniques have been used to examine the results of the study. Descriptive statistics were run on all data, and average diameters were calcu-lated for each probe head configuration combination.
An ANOVA analysis technique was used to evaluate the hypotheses pre-sented. ANOVA was selected due to its ability to make multiple comparisons without accumulating the effects of alpha (α). In the case of this study, the ANOVA allowed for a simultaneous comparison of each of the variables, including all interactions. Specific at-tention was paid to the various inter-
actions, because they would indicate which combinations of variables either encouraged or discouraged use.
An α of .01 was selected for this research. The logic of picking this alpha level was two-fold. First, it was desirable to minimize the chances of incorrectly accepting a false alternative hypothesis (Type I error). Because the α level had been reduced to .01, or a one-in-a-hundred chance, the possibil-ity of making a Type I error was re-duced. In addition, the power of the test was increased by placing 10 data points in each cell of the ANOVA, reducing the chances of falsely accepting an alternative hypothesis (Type II error). A larger data set size could have been selected, but the additional increase in
Figure 4. The Data Collection Sequence. As each variable was addressed, the collection sequence progressed down one level until all variables had been addressed without moving the part. At that point, the part was adjusted and the sequence was repeated.

7
Journal of Industrial Technology • Volume 26, Number 1 • January 2010 through March 2010 • www.atmae.org
power could not be justified in light of the potential negative effects, specifi-cally, the identification of insignificant differences due to extreme sample size and the additional processing time which would potentially allow for more temperature variation. ResultsThe observations were reported to 1/100,000th of an inch (five places past the decimal point). To aid in the analysis process and to help insure that any differences were visible, all of the temperature adjusted points were analyzed in SPSS as 1/1,000th of an inch (thus, 3.60124 was processed in SPSS as 1.24). Also, the variable being affected for each hypothesis was given a short name (see Table 1).
A brief look at the box plots in Figure 5 shows that there seems to be some dif-ferences in the amount of variance for the measurement plane, adaptor style, and stylus size variables. This visual inspection is supported by SPSS’ test of homogeneity (see Table 2), which show statistical differences in variances for the independent variables, with the exception of the stylus length.
As can be seen in Figure 6, the observa-tions approximate a normal distribution that is skewed to the right (the tail is on the right). This visual observa-tion is further quantified through the skewedness value that was calculated in SPSS. Although the skewedness value in this instance is greater than one, it is not excessively so and the assumption that the data is not drastically skewed can be made. The same can be said for the kurtosis of the distribution (see Figure 6). Figure 6 also shows that the distribution is somewhat high, but that the kurtosis value is only 1.162. The implication of the kurtosis and skewedness values is that while the data may appear abnormal, it is not exceed-ingly so to where it is detrimental to the study.
Hypotheses Testing ResultsThe first, second, third and fourth hypotheses investigated the CMM’s ability to report the same measure-
Hypothesis SPSS Variable Description
1 Plane Measurement plane being investigated (XY, XZ, YZ)
2 Adaptor Probe angle adjustment used (star probe, index-able head)
3 Length Length of probe stylus (short, long)
4 Size Probe stylus size (small, large)
Table 1. Hypothesis Variable Coding. The following table shows the SPSS variable names given for each hypothesis being tested.
Figure 5. Box-plots of the Variables. The figure contains the box-plot output from SPSS, showing the amount of variability for each group of data. Indications above
some of the plots are data outliers.
ment based upon: 1) the effects of the measurement plane, 2) the effects of the adaptor style, 3) the effects of the stylus length and 4) the effects of the stylus size. Ten measurements were taken for each measurement plane, stylus size, stylus length, and adaptor style combi-
nation. The analysis shows that there is a statistically significant difference in measurements between the various planes, stylus lengths and stylus size. However, the analysis of the second hypothesis fails to show that there may be a statistically significant difference

8
Journal of Industrial Technology • Volume 26, Number 1 • January 2010 through March 2010 • www.atmae.org
in measurements between the various adaptor styles.
The fifth and sixth hypotheses inves-tigated the effects of the interaction between the measurement plane and adaptor style as well as the interaction between the measurement plane and stylus length. The analysis shows that there is a statistically significant differ-ence in measurements for both interac-tions.
The seventh, eighth, ninth and tenth hypotheses investigated the effects of the interaction between the 1) measure-ment plane and stylus size, 2) adaptor style and stylus length, 3) adaptor style and stylus size and 4) stylus length and stylus size. The analysis fails to show that there may be a statistically signifi-cant difference in measurements for any of the interactions.
The eleventh, twelfth and thirteenth hypothesis investigated the effects of the interaction between the 1) measure-ment plane, adaptor style, and stylus length, 2) measurement plane, adaptor style, and stylus size and 3) measure-ment plane, stylus length, and stylus size. The analysis shows that there is a statistically significant difference in measurements for the interactions.
The fourteenth hypothesis investigated the effects of the interaction between the adaptor style, stylus length, and stylus size. The analysis shows that there may not be a statistically signifi-cant difference in measurements for the interaction.
The fifteenth hypothesis investigated the effects of the interaction between the measurement plane, adaptor style, stylus length, and stylus size. The analysis shows that there is a statisti-cally significant difference in measure-ments for the interaction.
Based on the results from the ANOVA table (see Table 3), the adaptor and approximately half of the interactions show that there is no significant dif-ference in the measurements between levels. The measurement plane, stylus
Table 2. Homogeneity of Variance. The following table is a list of the results from SPSS’ test for homogeneity for the independent variables.
Levene Statistic df1 df2 Sig.
Measurement plane Based on Mean 10.98948 2 237 0.000
Adaptor style Based on Mean 37.94873 1 238 0.000
Stylus length Based on Mean 6.1533 1 238 0.014
Stylus diameter Based on Mean 62.69586 1 238 0.000
Figure 6. Data Distribution. The figure above is a histogram of the data collected during the study. SPSS has overlaid an approximation of a normal distribution curve
for the data set shown.
length, stylus size, and the remain-ing interactions do show a statistically significant difference. These results indicate that the coordinate metrologist should be careful about measuring the same feature multiple times with differ-ent probe head configurations or across multiple planes.
ConclusionsThe purpose of this research, as stated previously, was that without a clear un-derstanding of how probe head configu-rations would affect any measurements taken by a CMM, researchers, man-agers, and quality assurance experts would not be able to make accurate, in-
formed decisions during the probe head configuration process. As previously discussed, this analysis was not meant to be a traditional repeatability study, but was intended to be an investigation into the common research assumption that the part could be moved between measurement planes without inducing an effect on the measurements being taken.
There is a statistical difference in measurements between levels for the measurement plane, stylus length, and stylus size. This should tell both the re-searcher and the coordinate metrology practitioner that care will be needed

9
Journal of Industrial Technology • Volume 26, Number 1 • January 2010 through March 2010 • www.atmae.org
when making decisions about the selec-tion of orientation, stylus length, and stylus size when repeatedly measuring the same feature.
For practical applications this means that if a feature is to be used as a da-tum, and that datum is to be measured using multiple stylus sizes and lengths, or in multiple planes, the results would be different. A shift in measurements would mean that the diameter would be different; however, it may also mean that the location of that center point will be different. If the latter were the case, then the relative location of the datum would change, resulting in the theoretical movement of the measure-ment datum.
These results have shown that the measurement plane, stylus length, and stylus size will result in a significant amount of variation when they are changed. However, the adaptor style can be changed without inducing a difference. As researchers are faced with decisions concerning the effects of selecting adaptor styles, they can be rel-atively confident in switching between indexable heads and star adaptors as needed. However, when testing other variables, the alteration of the measure-ment plane, stylus length, or the stylus size must be considered because it has been shown that they will induce different results on their own, without changing anything else.
The implications of these are of im-portance to quality assurance experts and researchers alike. However, it may be the researcher more than the prac-titioner who will be impacted by these results. This is because manufacturing quality requirements probably do not require the user to repeatedly re-mea-sure the same feature using multiple probe head configurations, whereas the researcher could easily find the need to re-measure the same feature multiple times, in multiple orientations, while investigating the results of various variables.
As shown in the results of the ANOVA table (see Table 3), the selection of
Table 3. SPSS ANOVA Results. The following is the output from SPSS for the data collected. A significance that is less than .01 results in the rejection of the null hypothesis.
ANOVA TableDependent Variable: DIAMETER
Source
Type III Sum of Squares df
Mean Square F Sig.
Corrected Model 5.905a 24 .246 262.926 .0000Intercept 4.223E-04 1 4.223E-04 .451 .5025TEMP 3.203E-04 1 3.203E-04 .342 .5591PLANE .207 2 .104 110.637 .0000ADAPTOR 2.716E-04 1 2.716E-04 .290 .5906LENGTH 1.250E-02 1 1.250E-02 13.360 .0003SIZE 3.167E-02 1 3.167E-02 33.849 .0000PLANE * ADAPTOR 1.986E-02 2 9.931E-03 10.613 .0000PLANE * LENGTH .203 2 .102 108.701 .0000PLANE * SIZE 2.912E-03 2 1.456E-03 1.556 .2134ADAPTOR * LENGTH 2.686E-04 1 2.686E-04 .287 .5927ADAPTOR * SIZE 5.152E-03 1 5.152E-03 5.506 .0199LENGTH * SIZE 2.730E-06 1 2.730E-06 .003 .9570PLANE * ADAPTOR * LENGTH .133 2 6.659E-02 71.159 .0000
PLANE * ADAPTOR * SIZE 9.675E-02 2 4.838E-02 51.699 .0000PLANE * LENGTH * SIZE .697 2 .348 372.409 .0000ADAPTOR * LENGTH * SIZE 1.382E-03 1 1.382E-03 1.477 .2256
PLANE * ADAPTOR * LENGTH * SIZE .263 2 .131 140.348 .0000
Error .201 215 9.357E-04Total 81.3026 240Corrected Total 6.105785 239 a R Squared = .967 (Adjusted R Squared = .963)
different measurement planes, stylus lengths and stylus sizes will induce sig-nificant measurement variations for the same feature when any single variable is altered. Additionally, the interactions of (a) measurement plane and adaptor style; (b) measurement plane and stylus length; (c) measurement plane, adaptor style, and stylus length; (d) measure-ment plane, adaptor style, and stylus size and (e) measurement plane, adap-tor style, stylus length, and stylus size will all result in significant measure-ments variations for the same feature.
These results have the potential of in-curring significant issues for research-
ers, because it means that they will have to be careful with the assumptions that are made when researching a spe-cific effect. Because of these results, re-searchers will have to attempt to deter-mine whether any observed changes in their research are due to these effects, or to the changes they are inducing. For example, if research is being done on the effectiveness of a new algorithm or sampling strategy, the researcher will need to design the experiments so that the effects of the probe head configura-tion could be partitioned out.
It should be noted, however, that these results cannot be expanded beyond

10
Journal of Industrial Technology • Volume 26, Number 1 • January 2010 through March 2010 • www.atmae.org
the use of a B89-calibrated Brown & Sharpe CMM using a TP20 extended force probe body. This limit, as previ-ously stated, is because the extended force probe body required higher probing pressures that result in a lower repeatability. While this repeatability has been assumed to be negligible for this study, it does have to be acknowl-edged.
Recommendations For Further ResearchBased on the conclusions, implica-tions, and lessons learned from this research there were six recommenda-tions for further research developed which are: 1) the inclusion of additional levels to some of the existing variables to determine if a multiple regression model is feasible, 2) the inclusion of multiple part sizes with the exist-ing probe head study, 3) the inclusion of different probe modules with the MH20i probe head, 4) to replicate this study across multiple machines other than the MicroVal PFx, 5) to introduce various machine movement speeds into the research and 6) to further explore the interactions that occur between the adaptor style and the stylus size.
ReferencesAdams, L. (2000). CMM meets shop-
floor requirements. Quality, 39(13), 26-29.
Chalmers, R. E. (2002). Metrology for manufacturing means business. Manufacturing Engineering, 128(4), 58-64.
Choi, W., Kurfess, T. R. & Cagan, J. (1998) Sampling uncertainty in coordinate measurement data analy-sis. Precision Engineering, 22(3), 153-163.
Corrigall, M. J. & Bell, R. (1991). Probe and component setup planning for coordinate measuring machines. International Journal of Computer Integrated Manufacturing, 4(1), 33-44.
Dama, R. (1998). Uncertainties in the error compensation of coordinate measuring machines. Dissertations Abstracts International, 59(06), 3002B. (UMI. No. 9836651).
Dove, J. (2000). Probe qualification and precision coordinate metrology. Manu-facturing Engineering, 125(5), 18.
Dowling, M. M., Griffin, P. M., Tsui, K. L. & Zhou, C. (1997). Statistical issues in geometric feature inspec-tion using coordinate measuring machines. Technometrics 39, 3-17.
Elshennawy, A. K. M. (1987). Per-formance evaluation of coordinate measuring machines. Dissertation Abstracts International, 49(04), 1332B. (UMI No. 8807779).
Hocken, R. J., Raja, J. & Babu, U. (1993). Sampling issues in coor-dinate metrology. Manufacturing Review. 6(4), 282-294.
Imkamp, D., Schepperle, K. (2006). The Application Determines the Sen-sor: VAST Scanning Probe Systems. Innovation SPECIAL Metrology, 8, 30-33.
Knebel, R. (1998). Gage R&R for CMMs. Manufacturing Engineering, 121 (4), 16.
Knebel, R. (1999). Better Math Makes Scanning Stronger . Modern Ma-chine Shop Online, Retrieved August 26, 2007 from: http://www.mmson-line.com/articles/109905.html
Lee, G & Woodward, M. (1992). Accurate coordinate measurement demands the right machine. Manu-facturing Systems, 10(10), 82-85.
Lu, E. (1992). Improvement of CMM throughput using path planning, dy-namic lobing error compensation and structural vibration control. Disserta-tion Abstracts International, 53(05), 2506B. (UMI No. 9226959).
Marsh, B. (1996). An investigation of diameter measurement repeatability using a coordinate measuring ma-chine and a multi-baseline repeat-ability assessment methodology. Dissertation Abstracts International, 57(08), 5251B. (UMI No. 9701107).
Osawa, S., Busch, K., Franke, M., & Schwenke, H. (2005, January). Mul-tiple orientation technique for the calibration of cylindrical workpieces on CMMs. Precision Engineer-ing, 29(1), 56-64. Retrieved March 2, 2009, doi:10.1016/j.precision-eng.2004.04.006
Phillips, S. D., Borchardt, B., Estler, W. T. & Buttress, J. (1998). The estima-tion of measurement uncertainty of small circular features measured by coordinate measuring machines. Pre-cision Engineering, 22(2), 87-97.
Piratelli-Filho, A., & Di Giacomo, B. (2003, July). CMM uncertainty anal-ysis with factorial design. Precision Engineering, 27(3), 283. Retrieved March 2, 2009, doi:10.1016/S0141-6359(03)00035-7
Ramaswami, H., Modi, A., & Anand, S. (2007, January). A design advisor for the optimal inspection of circularity tolerance. International Journal of Advanced Manufacturing Technol-ogy, 31(9/10), 857-870. Retrieved March 2, 2009, doi:10.1007/s00170-005-0273-9
Ramaswami, H., Kanagaraj, S., & Anand, S. (2009, February). An inspection advisor for form error in cylindrical features. International Journal of Advanced Manufacturing Technology, 40(1/2), 128-143. Re-trieved March 2, 2009, doi:10.1007/s00170-007-1321-4
Renishaw (2002). Measurement on CMMs. CD ROM (version 1, part number H-1000-3218-01). United Kingdom: Renishaw plc.
Shen, Y. & Moon, S. (2001). Investiga-tion of point-to-point performance test of touch trigger probes on coordinate-measuring machines. Robotics and Computer Integrated Manufacturing, 17(3), 247-254.
Shen, Y. & Springer, M. E. (1998). A robust pretravel model for touch trig-ger probes in coordinate metrology. Journal of Manufacturing Science and Engineering, 120(3), 532-539.
Shen, Y. & Zhang, X. (1999). Pre-travel compensation for horizontally oriented touch trigger probes with straight styli. Journal of Manufactur-ing Systems, 18(3), 175-186.
Traylor, A. (1991). CMM Gaging. Quality, 40(4), 50-51.
Traylor, A. (1993). Probes keep pace with DCC CMMs. Quality, 32(8), 36-38.

11
Journal of Industrial Technology • Volume 26, Number 1 • January 2010 through March 2010 • www.atmae.org
Weckenmann, A., Eitzert, H., Garmer, M. & Webert, H. (1995) Functional-ity-oriented evaluation and sampling strategy in coordinate metrology. Precision Engineering, 17(4), 244-252.
Wiebusch, B. (2001). Triangular bridge design improves CMM scanning. Design News, 56(22), 32-33.
Wozniak, A., & Dobosz, M. (2003, December). Metrological feasibili-ties of CMM touch trigger probes. Part I: 3D theoretical model of probe pretravel. Measurement (02632241), 34(4), 273. Retrieved March 2, 2009, doi:10.1016/j.measure-ment.2003.05.001
Wozniak, A., & Dobosz, M. (2005, December). Factors Influencing Probing Accuracy of a Coordinate Measuring Machine. IEEE Transac-tions on Instrumentation & Mea-surement, 54(6), 2540-2548. Re-trieved March 2, 2009, doi:10.1109/TIM.2005.858541
Ziemian, C. W. (1996). Automated inspection planning for coordinate measuring machines: Feature acces-sibility and work piece orientation analysis. Dissertation Abstracts International, 57(04), 2792B. (UMI No. 9628216)


