Embed Size (px)
Citation preview
Cc
Ka
b
AA
KPCGFM
1
tvtSfc
a&rcVp
og
0h
Journal of Mathematical Behavior 32 (2013) 461– 473
Contents lists available at ScienceDirect
The Journal of Mathematical Behavior
journa l h om epa ge: ww w.elsev ier .com/ locate / jmathb
ovariational reasoning and invariance amongoordinate systems
evin C. Moorea,∗, Teo Paoletti a, Stacy Musgraveb
Department of Mathematics and Science Education, University of Georgia, 105G Aderhold Hall, Athens, GA 30602-7124, United StatesDepartment of Mathematics, University of Georgia, Athens, GA 30602, United States
a r t i c l e i n f o
rticle history:vailable online 5 July 2013
eywords:olar coordinatesovariational reasoningraphingunctionultiple representations
a b s t r a c t
Researchers continue to emphasize the importance of covariational reasoning in the con-text of students’ function concept, particularly when graphing in the Cartesian coordinatesystem (CCS). In this article, we extend the body of literature on function by characterizingtwo pre-service teachers’ thinking during a teaching experiment focused on graphing inthe polar coordinate system (PCS). We illustrate how the participants engaged in covaria-tional reasoning to make sense of graphing in the PCS and make connections with graphingin the CCS. By foregrounding covariational relationships, the students came to understandgraphs in different coordinate systems as representative of the same relationship despitedifferences in the perceptual shapes of these graphs. In synthesizing the students’ activ-ity, we provide remarks on instructional approaches to graphing and how the PCS forms apotential context for promoting covariational reasoning.
© 2013 Elsevier Inc. All rights reserved.
. Introduction
First introduced at the elementary level, graphs are essential representations for the study of numerous mathematicalopics including modeling relationships between quantities, exploring characteristics of functions, solving for unknownalues, and investigating geometric transformations. Highlighting the central role of graphing in mathematics education,he Common Core State Standards for Mathematics (National Governors Association Center for Best Practices Council of Chieftate School Officers, 2010) contains some form of the term graph on more than a third of the document’s pages. Buildingrom the emphasis on graphing at the K-12 level, graphing is central to the study of several undergraduate mathematicsourses: calculus, differential equations, and analysis, to name a few.
Reflecting the heavy focus on graphing in school mathematics, mathematics education research has given significantttention to graphing, with a multitude of studies (e.g., Carlson, 1998; Leinhardt, Zaslavsky, & Stein, 1990; Oehrtman, Carlson,
Thompson, 2008) having investigated students’ meanings for graphing in the context of function. Although graphingeceives significant attention in mathematics education research, little of this focus has been given to graphing in the polaroordinate system (PCS). Complicating the matter, the sparse research (Montiel, Vidakovic, & Kabael, 2008; Montiel, Wilhelmi,idakovic, & Elstak, 2009; Sayre & Wittman, 2007) available on students’ meanings for the PCS highlights student difficulties,
articularly pointing to difficulties involving problematic connections with the Cartesian coordinate system (CCS).In the present study, we explore students’ thinking when graphing in the PCS and draw connections with existing researchn graphing and function. Specifically, we discuss two undergraduate students’ reasoning when graphing in the PCS. Toraph relationships in the PCS, both students engaged in several ways of thinking that ranged from determining and plotting
∗ Corresponding author. Tel.: +1 706 542 3211; fax: +1 706 542 4511.E-mail addresses: [email protected] (K.C. Moore), [email protected] (T. Paoletti), [email protected] (S. Musgrave).
732-3123/$ – see front matter © 2013 Elsevier Inc. All rights reserved.ttp://dx.doi.org/10.1016/j.jmathb.2013.05.002
462 K.C. Moore et al. / Journal of Mathematical Behavior 32 (2013) 461– 473
discrete points to reasoning about how quantities continuously vary in tandem. We illustrate these ways of thinking acrossseveral different tasks and draw attention to the implications of these ways of thinking relative to the students’ abilityto flexibly use the PCS and CCS to represent relationships between quantities. Against the backdrop of these findings, weconclude by discussing how the PCS offers a potential setting for promoting quantitative and covariational reasoning.
2. Background
Often first introduced in a precalculus course, the PCS is critical for the study of advanced mathematics and can be foundin numerous applications in engineering and the sciences. The PCS also plays a central role in exploring complex numbers.For instance, the operations of multiplication, division, and exponentiation are more readily explored when using the polarform of complex numbers. Although the PCS plays an important role in the aforementioned areas, research on studentthinking in the context of the PCS is sparse, with a pair of studies by Montiel et al. (2008, 2009) forming the most applicableworks to the present study. Both studies included a focus on the PCS, with the earlier study (Montiel et al., 2008) havingexplored relationships among two-dimensional coordinate systems and the subsequent study (Montiel et al., 2009) havingincluded two- and three-dimensional coordinate systems. The authors made several important observations across thesestudies including how students’ function meanings can cause difficulties when extended to the PCS.
Of relevance to the present study, Montiel et al. (2008) identified that the connections students create between the CCSand PCS are tied to their meanings for function and graphing in the CCS. For instance, students often relied on rules learnedin the context of the CCS to determine whether a given relation is a function. These rules included applying the vertical linetest to determine whether a graphed relationship in the PCS is a function. Some students also referenced “known” functionswhen determining whether graphs were functions. By “known,” we interpret the authors to mean that the students recalleda shape in the plane that they had previously deemed a function (e.g., a student claiming that a parabola opening down isa function because parabolas are defined as such). Compatible with the earlier study (Montiel et al., 2008), Montiel et al.(2009) noted that when students moved among representational systems, the students’ function meanings did not entailcoordinating the different conventions of the representational systems, with the students often relying on the conventionsfrom one representational system (e.g., the CCS).
Montiel and colleagues’ findings (Montiel et al., 2008, 2009), and specifically students’ difficulty in coordinating rep-resentational systems, speak to several researchers’ (Lobato & Bowers, 2000; Thompson, 1994c, 2013) statements aboutmultiple representations. Lobato and Bowers (2000) questioned, “. . .whether tables, graphs, and equations are multiplerepresentations of anything to students” (p. 4). Thompson (1994c) explained:
Tables, graphs, and expressions might be multiple representations of functions to us, but I have seen no evidencethat they are multiple representations of anything to students. In fact, I am now unconvinced that they are multiplerepresentations even to us, but instead may be, as Moschkovich et al. (1993) have said, areas of representational activityamong which we have built rich and varied connections. . .I agree with Kaput (1993) that it may be wrongheaded tofocus on graphs, expressions, or tables as representations of function, but instead focus on them as representationsof something that, from the students’ perspective, is representable, such as some aspect of a specific situation. Thekey issue then becomes twofold: (1) to find situations that are sufficiently propitious for engendering multitudes ofrepresentational activity and (2) orient students to draw connections among their representational activities in regardto the situation that engendered them. (Thompson, 1994c, pp. 39–40)
Moreover, if students are to conceive multiple representations of something, then it is necessary that they not onlyconstruct the something that is to be represented, but also have meanings for the representational systems such that whenthe students operate within and move among systems, they can think about their representational activity as conveying thesame something. Returning to the studies by Montiel and colleagues, the students did not appear to have distinct meaningsfor the coordinate systems that simultaneously supported connections among the systems. Instead, their meanings wereinherently tied to the conventions of one coordinate system (e.g., the vertical line test and the CCS). In short, representationsare not external to the person doing the representing but instead consist of a system of mental actions and meanings thatthe individual has organized into some cognitive structure (von Glasersfeld, 1987).
The construct of covariational reasoning (e.g., Carlson, Jacobs, Coe, Larsen, & Hsu, 2002; Saldanha & Thompson, 1998)foregrounds students’ construction of “the something that, from the students’ perspective, is representable.” Covariationalreasoning entails the mental actions involved in conceiving two quantities as varying in tandem (Carlson et al., 2002;Saldanha & Thompson, 1998) and is central to students’ understanding of numerous secondary mathematics topics includingquadratic relationships (Ellis, 2011), exponential relationships (Castillo-Garsow, 2010; Confrey & Smith, 1995), trigonometricrelationships (Moore, 2012), rate of change (Carlson et al., 2002; Thompson, 1994a), function (Oehrtman et al., 2008), andthe Fundamental Theorem of Calculus (Thompson, 1994b).
In characterizing second-semester calculus students’ thinking, Carlson et al. (2002) identified how the students’ covaria-
tional reasoning influenced their ability to make sense of dynamic situations, interpret graphs, and create graphs. Specifically,the authors identified several mental actions that the students engaged in when coordinating quantities that vary in tan-dem. These mental actions included, but were not limited to, coordinating directional change (e.g., quantity A increases whilequantity B increases), coordinating amounts of change (e.g., the increase in quantity A decreases for successive increases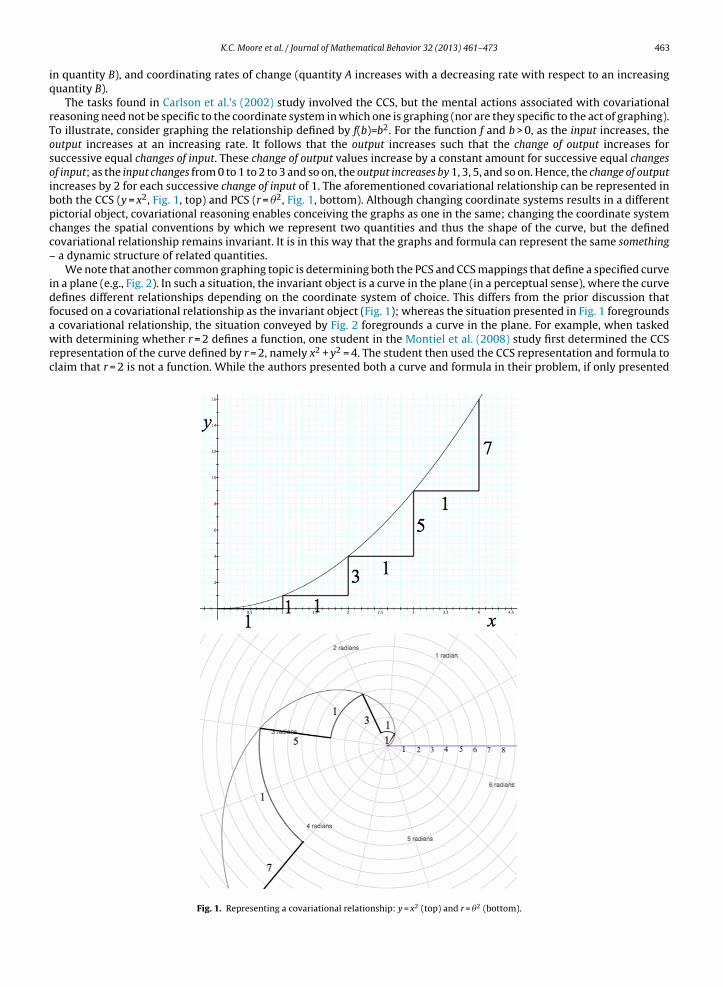
iq
rTosoibpcc–
idfawrc
K.C. Moore et al. / Journal of Mathematical Behavior 32 (2013) 461– 473 463
n quantity B), and coordinating rates of change (quantity A increases with a decreasing rate with respect to an increasinguantity B).
The tasks found in Carlson et al.’s (2002) study involved the CCS, but the mental actions associated with covariationaleasoning need not be specific to the coordinate system in which one is graphing (nor are they specific to the act of graphing).o illustrate, consider graphing the relationship defined by f(b)=b2. For the function f and b > 0, as the input increases, theutput increases at an increasing rate. It follows that the output increases such that the change of output increases foruccessive equal changes of input. These change of output values increase by a constant amount for successive equal changesf input; as the input changes from 0 to 1 to 2 to 3 and so on, the output increases by 1, 3, 5, and so on. Hence, the change of outputncreases by 2 for each successive change of input of 1. The aforementioned covariational relationship can be represented inoth the CCS (y = x2, Fig. 1, top) and PCS (r = �2, Fig. 1, bottom). Although changing coordinate systems results in a differentictorial object, covariational reasoning enables conceiving the graphs as one in the same; changing the coordinate systemhanges the spatial conventions by which we represent two quantities and thus the shape of the curve, but the definedovariational relationship remains invariant. It is in this way that the graphs and formula can represent the same something
a dynamic structure of related quantities.We note that another common graphing topic is determining both the PCS and CCS mappings that define a specified curve
n a plane (e.g., Fig. 2). In such a situation, the invariant object is a curve in the plane (in a perceptual sense), where the curveefines different relationships depending on the coordinate system of choice. This differs from the prior discussion thatocused on a covariational relationship as the invariant object (Fig. 1); whereas the situation presented in Fig. 1 foregrounds
covariational relationship, the situation conveyed by Fig. 2 foregrounds a curve in the plane. For example, when taskedith determining whether r = 2 defines a function, one student in the Montiel et al. (2008) study first determined the CCS
epresentation of the curve defined by r = 2, namely x2 + y2 = 4. The student then used the CCS representation and formula tolaim that r = 2 is not a function. While the authors presented both a curve and formula in their problem, if only presented
Fig. 1. Representing a covariational relationship: y = x2 (top) and r = �2 (bottom).
464 K.C. Moore et al. / Journal of Mathematical Behavior 32 (2013) 461– 473
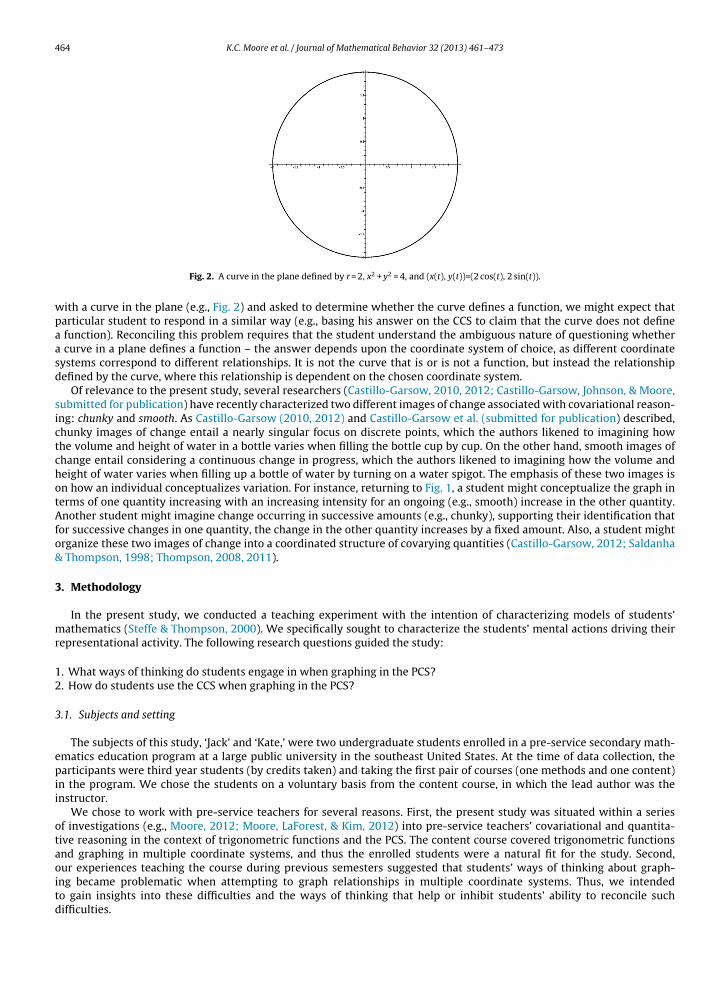
Fig. 2. A curve in the plane defined by r = 2, x2 + y2 = 4, and (x(t), y(t))=(2 cos(t), 2 sin(t)).
with a curve in the plane (e.g., Fig. 2) and asked to determine whether the curve defines a function, we might expect thatparticular student to respond in a similar way (e.g., basing his answer on the CCS to claim that the curve does not definea function). Reconciling this problem requires that the student understand the ambiguous nature of questioning whethera curve in a plane defines a function – the answer depends upon the coordinate system of choice, as different coordinatesystems correspond to different relationships. It is not the curve that is or is not a function, but instead the relationshipdefined by the curve, where this relationship is dependent on the chosen coordinate system.
Of relevance to the present study, several researchers (Castillo-Garsow, 2010, 2012; Castillo-Garsow, Johnson, & Moore,submitted for publication) have recently characterized two different images of change associated with covariational reason-ing: chunky and smooth. As Castillo-Garsow (2010, 2012) and Castillo-Garsow et al. (submitted for publication) described,chunky images of change entail a nearly singular focus on discrete points, which the authors likened to imagining howthe volume and height of water in a bottle varies when filling the bottle cup by cup. On the other hand, smooth images ofchange entail considering a continuous change in progress, which the authors likened to imagining how the volume andheight of water varies when filling up a bottle of water by turning on a water spigot. The emphasis of these two images ison how an individual conceptualizes variation. For instance, returning to Fig. 1, a student might conceptualize the graph interms of one quantity increasing with an increasing intensity for an ongoing (e.g., smooth) increase in the other quantity.Another student might imagine change occurring in successive amounts (e.g., chunky), supporting their identification thatfor successive changes in one quantity, the change in the other quantity increases by a fixed amount. Also, a student mightorganize these two images of change into a coordinated structure of covarying quantities (Castillo-Garsow, 2012; Saldanha& Thompson, 1998; Thompson, 2008, 2011).
3. Methodology
In the present study, we conducted a teaching experiment with the intention of characterizing models of students’mathematics (Steffe & Thompson, 2000). We specifically sought to characterize the students’ mental actions driving theirrepresentational activity. The following research questions guided the study:
1. What ways of thinking do students engage in when graphing in the PCS?2. How do students use the CCS when graphing in the PCS?
3.1. Subjects and setting
The subjects of this study, ‘Jack’ and ‘Kate,’ were two undergraduate students enrolled in a pre-service secondary math-ematics education program at a large public university in the southeast United States. At the time of data collection, theparticipants were third year students (by credits taken) and taking the first pair of courses (one methods and one content)in the program. We chose the students on a voluntary basis from the content course, in which the lead author was theinstructor.
We chose to work with pre-service teachers for several reasons. First, the present study was situated within a seriesof investigations (e.g., Moore, 2012; Moore, LaForest, & Kim, 2012) into pre-service teachers’ covariational and quantita-tive reasoning in the context of trigonometric functions and the PCS. The content course covered trigonometric functionsand graphing in multiple coordinate systems, and thus the enrolled students were a natural fit for the study. Second,
our experiences teaching the course during previous semesters suggested that students’ ways of thinking about graph-ing became problematic when attempting to graph relationships in multiple coordinate systems. Thus, we intendedto gain insights into these difficulties and the ways of thinking that help or inhibit students’ ability to reconcile suchdifficulties.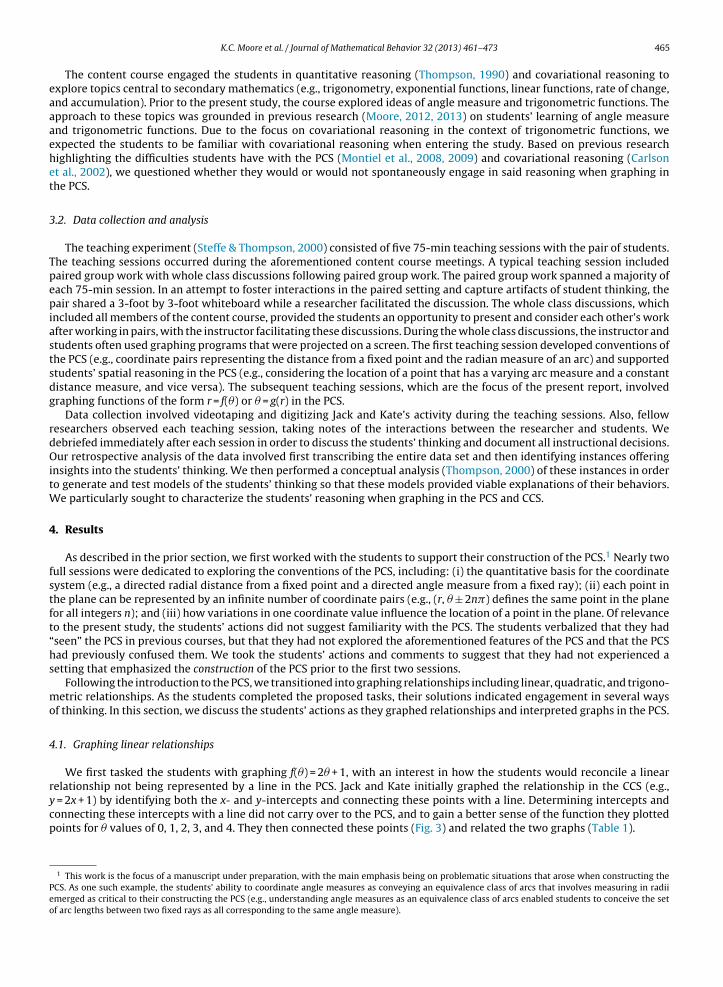
eaaaehet
3
Tpepiastsdg
rdOitW
4
fstft“hs
mo
4
rycp
Peo
K.C. Moore et al. / Journal of Mathematical Behavior 32 (2013) 461– 473 465
The content course engaged the students in quantitative reasoning (Thompson, 1990) and covariational reasoning toxplore topics central to secondary mathematics (e.g., trigonometry, exponential functions, linear functions, rate of change,nd accumulation). Prior to the present study, the course explored ideas of angle measure and trigonometric functions. Thepproach to these topics was grounded in previous research (Moore, 2012, 2013) on students’ learning of angle measurend trigonometric functions. Due to the focus on covariational reasoning in the context of trigonometric functions, wexpected the students to be familiar with covariational reasoning when entering the study. Based on previous researchighlighting the difficulties students have with the PCS (Montiel et al., 2008, 2009) and covariational reasoning (Carlsont al., 2002), we questioned whether they would or would not spontaneously engage in said reasoning when graphing inhe PCS.
.2. Data collection and analysis
The teaching experiment (Steffe & Thompson, 2000) consisted of five 75-min teaching sessions with the pair of students.he teaching sessions occurred during the aforementioned content course meetings. A typical teaching session includedaired group work with whole class discussions following paired group work. The paired group work spanned a majority ofach 75-min session. In an attempt to foster interactions in the paired setting and capture artifacts of student thinking, theair shared a 3-foot by 3-foot whiteboard while a researcher facilitated the discussion. The whole class discussions, which
ncluded all members of the content course, provided the students an opportunity to present and consider each other’s workfter working in pairs, with the instructor facilitating these discussions. During the whole class discussions, the instructor andtudents often used graphing programs that were projected on a screen. The first teaching session developed conventions ofhe PCS (e.g., coordinate pairs representing the distance from a fixed point and the radian measure of an arc) and supportedtudents’ spatial reasoning in the PCS (e.g., considering the location of a point that has a varying arc measure and a constantistance measure, and vice versa). The subsequent teaching sessions, which are the focus of the present report, involvedraphing functions of the form r = f(�) or � = g(r) in the PCS.
Data collection involved videotaping and digitizing Jack and Kate’s activity during the teaching sessions. Also, fellowesearchers observed each teaching session, taking notes of the interactions between the researcher and students. Weebriefed immediately after each session in order to discuss the students’ thinking and document all instructional decisions.ur retrospective analysis of the data involved first transcribing the entire data set and then identifying instances offering
nsights into the students’ thinking. We then performed a conceptual analysis (Thompson, 2000) of these instances in ordero generate and test models of the students’ thinking so that these models provided viable explanations of their behaviors.
e particularly sought to characterize the students’ reasoning when graphing in the PCS and CCS.
. Results
As described in the prior section, we first worked with the students to support their construction of the PCS.1 Nearly twoull sessions were dedicated to exploring the conventions of the PCS, including: (i) the quantitative basis for the coordinateystem (e.g., a directed radial distance from a fixed point and a directed angle measure from a fixed ray); (ii) each point inhe plane can be represented by an infinite number of coordinate pairs (e.g., (r, � ± 2n�) defines the same point in the planeor all integers n); and (iii) how variations in one coordinate value influence the location of a point in the plane. Of relevanceo the present study, the students’ actions did not suggest familiarity with the PCS. The students verbalized that they hadseen” the PCS in previous courses, but that they had not explored the aforementioned features of the PCS and that the PCSad previously confused them. We took the students’ actions and comments to suggest that they had not experienced aetting that emphasized the construction of the PCS prior to the first two sessions.
Following the introduction to the PCS, we transitioned into graphing relationships including linear, quadratic, and trigono-etric relationships. As the students completed the proposed tasks, their solutions indicated engagement in several ways
f thinking. In this section, we discuss the students’ actions as they graphed relationships and interpreted graphs in the PCS.
.1. Graphing linear relationships
We first tasked the students with graphing f(�) = 2� + 1, with an interest in how the students would reconcile a linear
elationship not being represented by a line in the PCS. Jack and Kate initially graphed the relationship in the CCS (e.g.,= 2x + 1) by identifying both the x- and y-intercepts and connecting these points with a line. Determining intercepts andonnecting these intercepts with a line did not carry over to the PCS, and to gain a better sense of the function they plottedoints for � values of 0, 1, 2, 3, and 4. They then connected these points (Fig. 3) and related the two graphs (Table 1).
1 This work is the focus of a manuscript under preparation, with the main emphasis being on problematic situations that arose when constructing theCS. As one such example, the students’ ability to coordinate angle measures as conveying an equivalence class of arcs that involves measuring in radiimerged as critical to their constructing the PCS (e.g., understanding angle measures as an equivalence class of arcs enabled students to conceive the setf arc lengths between two fixed rays as all corresponding to the same angle measure).
466 K.C. Moore et al. / Journal of Mathematical Behavior 32 (2013) 461– 473
Fig. 3. Students’ graphs of a “linear” relationship.
Table 1Jack and Kate discuss two “linear” graphs.
Kate: They went out by two, like you know here (pointing at the two in the formula r = 2� + 1) the slope is like two(tapping along the CCS graph).
Int.: This has no slope (pointing to the PCS graph). . .
Kate: No, I’m relating the slope here (pointing to the CCS graph), to the difference in the radius of two each time(tapping along the PCS graph). Like [the radius is] one, three, five, seven, nine, eleven (pointing to thecorresponding points on the polar graph), [the radius] increases by two.
Suggestive of chunky thinking, Kate reasoned that both graphs convey some quantity changing by amounts of two forsuccessive changes of one in the other quantity. In the case of the CCS, she related this feature to “slope,” meaning the amountby which y increased for successive equal changes in x. In the case of the PCS, she illustrated the increase in the distancefrom the pole, which she referred to as the “radius,” for successive changes of angle measure.
As the interaction continued, Jack and Kate denoted the aforementioned amounts of change (Fig. 3) and claimed that bothgraphs convey a “constant rate of change” between the input and output values. Kate then added, “That’s cool. . .becauseyou’d never see this (referring to the PCS graph) and be like, that’s a linear function.” Kate’s comment underscores an importantaspect of the pair’s thinking. From a shape standpoint, their PCS graph is not “linear.” Yet, by considering the graphs in termsof covarying quantities, they conceived both graphs as representative of the same relationship (e.g., a relationship such thatthere is a constant rate of change between the quantities).
4.2. Graphing a quadratic relationship
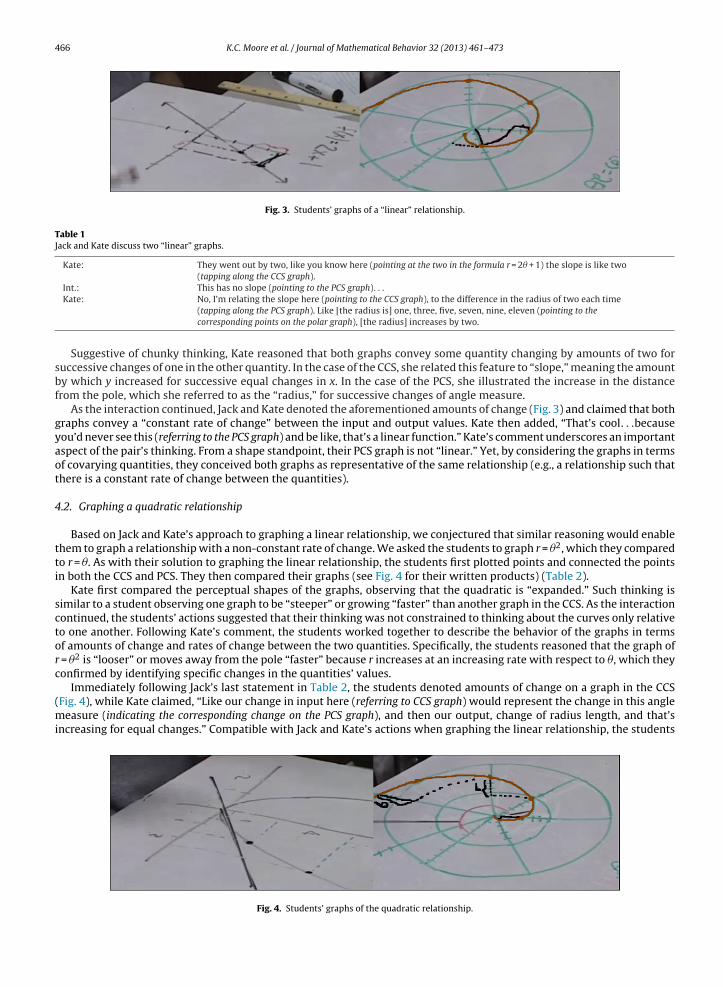
Based on Jack and Kate’s approach to graphing a linear relationship, we conjectured that similar reasoning would enablethem to graph a relationship with a non-constant rate of change. We asked the students to graph r = �2, which they comparedto r = �. As with their solution to graphing the linear relationship, the students first plotted points and connected the pointsin both the CCS and PCS. They then compared their graphs (see Fig. 4 for their written products) (Table 2).
Kate first compared the perceptual shapes of the graphs, observing that the quadratic is “expanded.” Such thinking issimilar to a student observing one graph to be “steeper” or growing “faster” than another graph in the CCS. As the interactioncontinued, the students’ actions suggested that their thinking was not constrained to thinking about the curves only relativeto one another. Following Kate’s comment, the students worked together to describe the behavior of the graphs in termsof amounts of change and rates of change between the two quantities. Specifically, the students reasoned that the graph ofr = �2 is “looser” or moves away from the pole “faster” because r increases at an increasing rate with respect to �, which theyconfirmed by identifying specific changes in the quantities’ values.
Immediately following Jack’s last statement in Table 2, the students denoted amounts of change on a graph in the CCS(Fig. 4), while Kate claimed, “Like our change in input here (referring to CCS graph) would represent the change in this anglemeasure (indicating the corresponding change on the PCS graph), and then our output, change of radius length, and that’sincreasing for equal changes.” Compatible with Jack and Kate’s actions when graphing the linear relationship, the students
Fig. 4. Students’ graphs of the quadratic relationship.
K.C. Moore et al. / Journal of Mathematical Behavior 32 (2013) 461– 473 467
Table 2Jack and Kate discuss a quadratic relationship.
Kate: r of �, but compared to r of �2, [r of �2 is] like expanded (Kate points to the two PCS graphs and then spreads herhands apart). Like, like, this one’s (referring to linear) like much more tighter swirled (moving her hands in a circularmotion) but then this one (referring to quadratic) is just like looser I guess.
Jack: Yeah, we can see better, with both of them, both graphs, that the change in radius (referring to quadratic) for everyradian further that the angle is increasing (rotating his hand in successive rotations while spreading his index andmiddle finger apart). . .Um, the radius, every time is increasing at an increasing rate (referring to quadratic).
Int.: Okay now what’s that mean in terms of amounts of change?Jack: We could do equal changes in � and then. . ..Kate: Like, if we looked at first these two then these two points (indicating the points (9, 3) to (16, 4), and then (16, 4) to
(25, 5)), the change of � here would be this, that length (drawing an arc from (9, 3) to (9, 4)). But then the change isradius would be up that line (drawing a segment from the point (9, 4) to (16, 4)).
Jack: Which is seven.Kate: And then we have the same thing (draws an arc from (16, 4) to (16, 5) and a segment from (16, 5) to (25, 5)). . .so you
can see these black lines, the [change in radius] is increasing.
ca
Kotssf
4
cgqsep
ststt
gtf
Jack: So that’s like nine to sixteen (pointing to the segment connecting the points (9, 4) and (16, 4)), which is seven, andthis one is sixteen to twenty-five (pointing to the segment connecting the points (16, 5) and (25, 5)), which is nine,which we can see there too (pointing to the CCS graph).
onceived both graphs in terms of a structure of covarying quantities, which enabled them to understand a graph in the PCSnd a graph in the CCS as one in the same; to Jack and Kate, both graphs represented the same covariational relationship.
We also note that Jack and Kate’s actions on this task are suggestive of both smooth and chunky images of change. Initially,ate’s focus on the qualitative features of the graph might have entailed imagining how the radial length is increasing for anngoing increase in angle measure. Jack’s move to consider successive changes of angle measure and subsequently discusshese intervals indicates chunky thinking, while his motions (e.g., rotating his fingers while spreading apart his fingersuccessively) also imply that he might have imagined smooth variation over these intervals. However, at this time in thetudy, we were not attune to the role of chunky and smooth thinking in their activity and did not question the studentsurther.
.3. Covariational reasoning and conceiving a trigonometric relationship
During the first two tasks, Jack and Kate revealed a tendency to engage in covariational reasoning when graphing in bothoordinate systems. Such reasoning not only enabled them to create graphs in the PCS, but it also enabled them to connectraphs in the PCS to their CCS counterparts. While the students engaged in covariational reasoning to create graphs, weuestioned whether or not they would engage in such reasoning to interpret given graphs. As Montiel et al. (2008) showed,tudents have a tendency to rely on the CCS representations of curves in a plane. Likewise, students in previous semestersncountered much difficulty thinking about curves in a plane independent of the CCS. We conjectured that Jack and Kate’sropensity to engage in covariational reasoning might result in an avoidance of these tendencies.
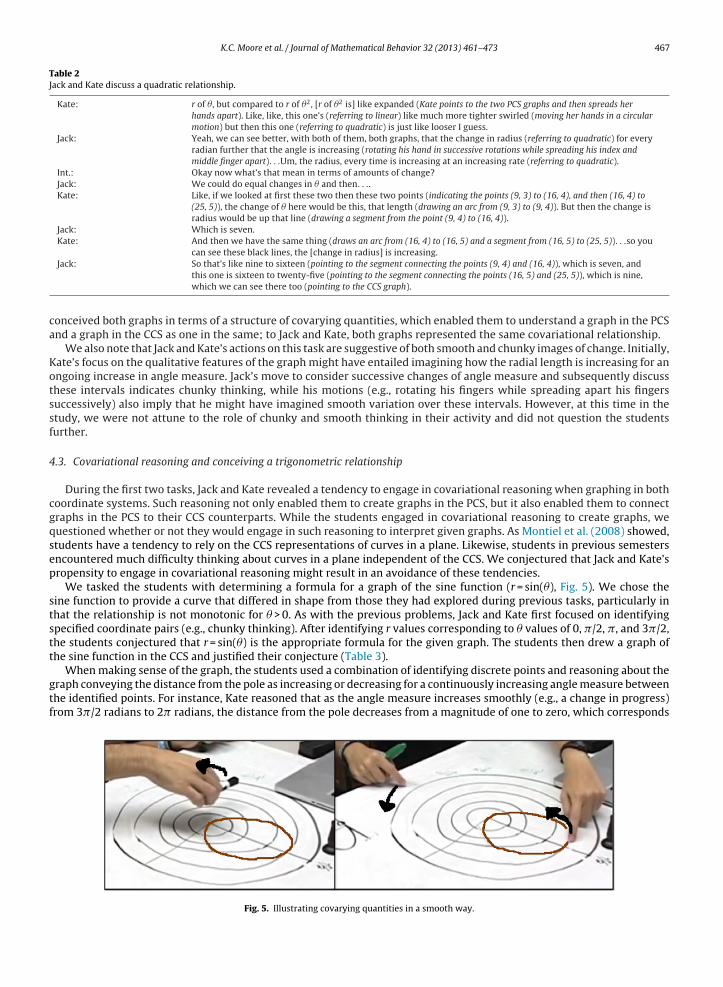
We tasked the students with determining a formula for a graph of the sine function (r = sin(�), Fig. 5). We chose theine function to provide a curve that differed in shape from those they had explored during previous tasks, particularly inhat the relationship is not monotonic for � > 0. As with the previous problems, Jack and Kate first focused on identifyingpecified coordinate pairs (e.g., chunky thinking). After identifying r values corresponding to � values of 0, �/2, �, and 3�/2,he students conjectured that r = sin(�) is the appropriate formula for the given graph. The students then drew a graph ofhe sine function in the CCS and justified their conjecture (Table 3).
When making sense of the graph, the students used a combination of identifying discrete points and reasoning about theraph conveying the distance from the pole as increasing or decreasing for a continuously increasing angle measure betweenhe identified points. For instance, Kate reasoned that as the angle measure increases smoothly (e.g., a change in progress)rom 3�/2 radians to 2� radians, the distance from the pole decreases from a magnitude of one to zero, which corresponds
Fig. 5. Illustrating covarying quantities in a smooth way.
468 K.C. Moore et al. / Journal of Mathematical Behavior 32 (2013) 461– 473
Table 3Jack and Kate discuss a trigonometric relationship.
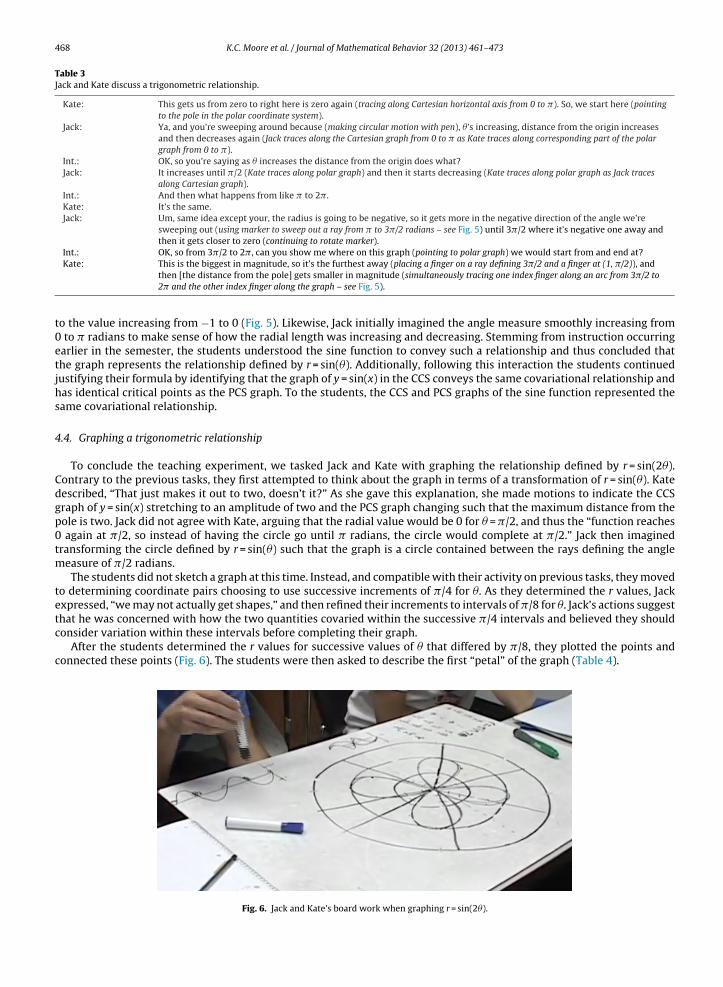
Kate: This gets us from zero to right here is zero again (tracing along Cartesian horizontal axis from 0 to �). So, we start here (pointingto the pole in the polar coordinate system).
Jack: Ya, and you’re sweeping around because (making circular motion with pen), �’s increasing, distance from the origin increasesand then decreases again (Jack traces along the Cartesian graph from 0 to � as Kate traces along corresponding part of the polargraph from 0 to �).
Int.: OK, so you’re saying as � increases the distance from the origin does what?Jack: It increases until �/2 (Kate traces along polar graph) and then it starts decreasing (Kate traces along polar graph as Jack traces
along Cartesian graph).Int.: And then what happens from like � to 2�.Kate: It’s the same.Jack: Um, same idea except your, the radius is going to be negative, so it gets more in the negative direction of the angle we’re
sweeping out (using marker to sweep out a ray from � to 3�/2 radians – see Fig. 5) until 3�/2 where it’s negative one away andthen it gets closer to zero (continuing to rotate marker).
Int.: OK, so from 3�/2 to 2�, can you show me where on this graph (pointing to polar graph) we would start from and end at?Kate: This is the biggest in magnitude, so it’s the furthest away (placing a finger on a ray defining 3�/2 and a finger at (1, �/2)), and
then [the distance from the pole] gets smaller in magnitude (simultaneously tracing one index finger along an arc from 3�/2 to2� and the other index finger along the graph – see Fig. 5).
to the value increasing from −1 to 0 (Fig. 5). Likewise, Jack initially imagined the angle measure smoothly increasing from0 to � radians to make sense of how the radial length was increasing and decreasing. Stemming from instruction occurringearlier in the semester, the students understood the sine function to convey such a relationship and thus concluded thatthe graph represents the relationship defined by r = sin(�). Additionally, following this interaction the students continuedjustifying their formula by identifying that the graph of y = sin(x) in the CCS conveys the same covariational relationship andhas identical critical points as the PCS graph. To the students, the CCS and PCS graphs of the sine function represented thesame covariational relationship.
4.4. Graphing a trigonometric relationship
To conclude the teaching experiment, we tasked Jack and Kate with graphing the relationship defined by r = sin(2�).Contrary to the previous tasks, they first attempted to think about the graph in terms of a transformation of r = sin(�). Katedescribed, “That just makes it out to two, doesn’t it?” As she gave this explanation, she made motions to indicate the CCSgraph of y = sin(x) stretching to an amplitude of two and the PCS graph changing such that the maximum distance from thepole is two. Jack did not agree with Kate, arguing that the radial value would be 0 for � = �/2, and thus the “function reaches0 again at �/2, so instead of having the circle go until � radians, the circle would complete at �/2.” Jack then imaginedtransforming the circle defined by r = sin(�) such that the graph is a circle contained between the rays defining the anglemeasure of �/2 radians.
The students did not sketch a graph at this time. Instead, and compatible with their activity on previous tasks, they movedto determining coordinate pairs choosing to use successive increments of �/4 for �. As they determined the r values, Jackexpressed, “we may not actually get shapes,” and then refined their increments to intervals of �/8 for �. Jack’s actions suggestthat he was concerned with how the two quantities covaried within the successive �/4 intervals and believed they should
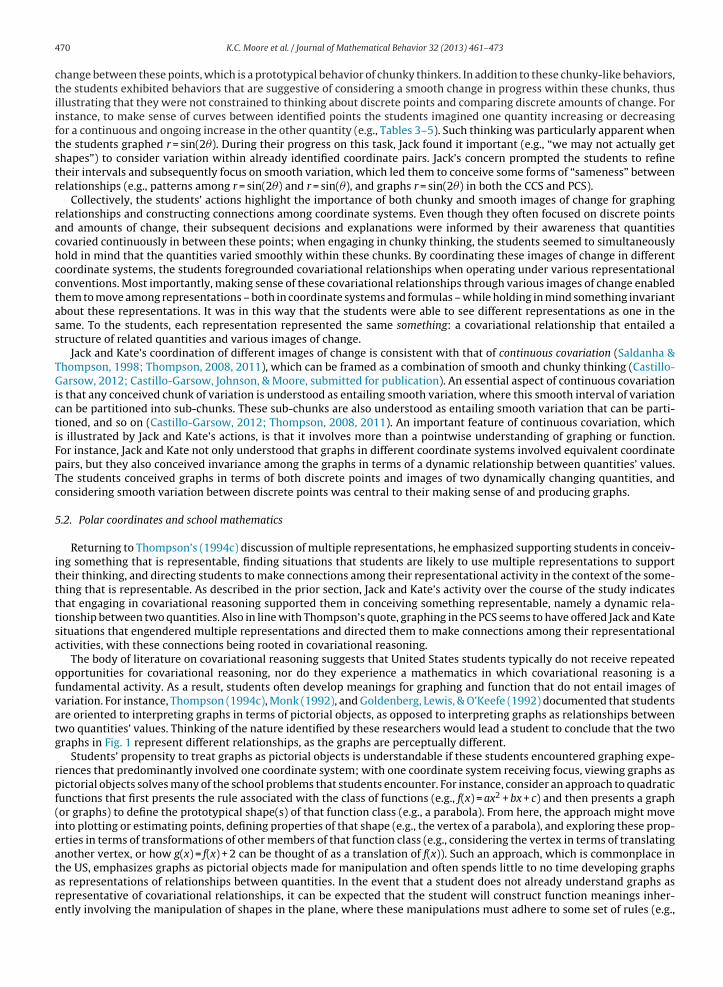
consider variation within these intervals before completing their graph.After the students determined the r values for successive values of � that differed by �/8, they plotted the points andconnected these points (Fig. 6). The students were then asked to describe the first “petal” of the graph (Table 4).
Fig. 6. Jack and Kate’s board work when graphing r = sin(2�).
K.C. Moore et al. / Journal of Mathematical Behavior 32 (2013) 461– 473 469
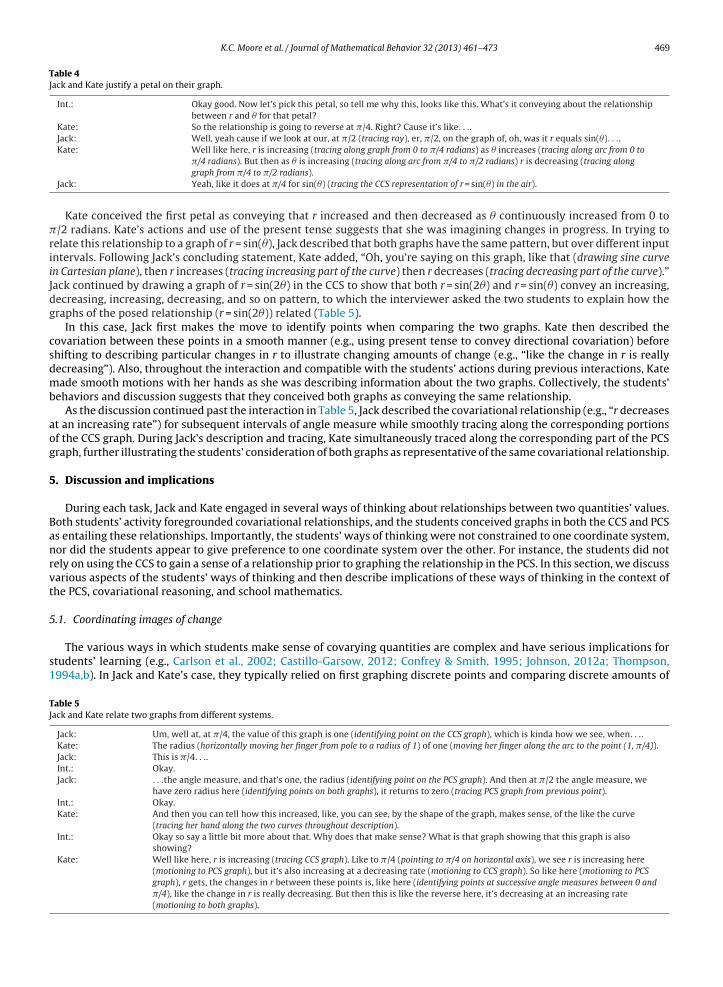
Table 4Jack and Kate justify a petal on their graph.
Int.: Okay good. Now let’s pick this petal, so tell me why this, looks like this. What’s it conveying about the relationshipbetween r and � for that petal?
Kate: So the relationship is going to reverse at �/4. Right? Cause it’s like. . ..Jack: Well, yeah cause if we look at our, at �/2 (tracing ray), er, �/2, on the graph of, oh, was it r equals sin(�). . ..Kate: Well like here, r is increasing (tracing along graph from 0 to �/4 radians) as � increases (tracing along arc from 0 to
�riiJdg
csdmb
aog
5
Banrvt
5
s1
TJ
�/4 radians). But then as � is increasing (tracing along arc from �/4 to �/2 radians) r is decreasing (tracing alonggraph from �/4 to �/2 radians).
Jack: Yeah, like it does at �/4 for sin(�) (tracing the CCS representation of r = sin(�) in the air).
Kate conceived the first petal as conveying that r increased and then decreased as � continuously increased from 0 to/2 radians. Kate’s actions and use of the present tense suggests that she was imagining changes in progress. In trying to
elate this relationship to a graph of r = sin(�), Jack described that both graphs have the same pattern, but over different inputntervals. Following Jack’s concluding statement, Kate added, “Oh, you’re saying on this graph, like that (drawing sine curven Cartesian plane), then r increases (tracing increasing part of the curve) then r decreases (tracing decreasing part of the curve).”ack continued by drawing a graph of r = sin(2�) in the CCS to show that both r = sin(2�) and r = sin(�) convey an increasing,ecreasing, increasing, decreasing, and so on pattern, to which the interviewer asked the two students to explain how theraphs of the posed relationship (r = sin(2�)) related (Table 5).
In this case, Jack first makes the move to identify points when comparing the two graphs. Kate then described theovariation between these points in a smooth manner (e.g., using present tense to convey directional covariation) beforehifting to describing particular changes in r to illustrate changing amounts of change (e.g., “like the change in r is reallyecreasing”). Also, throughout the interaction and compatible with the students’ actions during previous interactions, Kateade smooth motions with her hands as she was describing information about the two graphs. Collectively, the students’
ehaviors and discussion suggests that they conceived both graphs as conveying the same relationship.As the discussion continued past the interaction in Table 5, Jack described the covariational relationship (e.g., “r decreases
t an increasing rate”) for subsequent intervals of angle measure while smoothly tracing along the corresponding portionsf the CCS graph. During Jack’s description and tracing, Kate simultaneously traced along the corresponding part of the PCSraph, further illustrating the students’ consideration of both graphs as representative of the same covariational relationship.
. Discussion and implications
During each task, Jack and Kate engaged in several ways of thinking about relationships between two quantities’ values.oth students’ activity foregrounded covariational relationships, and the students conceived graphs in both the CCS and PCSs entailing these relationships. Importantly, the students’ ways of thinking were not constrained to one coordinate system,or did the students appear to give preference to one coordinate system over the other. For instance, the students did notely on using the CCS to gain a sense of a relationship prior to graphing the relationship in the PCS. In this section, we discussarious aspects of the students’ ways of thinking and then describe implications of these ways of thinking in the context ofhe PCS, covariational reasoning, and school mathematics.
.1. Coordinating images of change
The various ways in which students make sense of covarying quantities are complex and have serious implications fortudents’ learning (e.g., Carlson et al., 2002; Castillo-Garsow, 2012; Confrey & Smith, 1995; Johnson, 2012a; Thompson,994a,b). In Jack and Kate’s case, they typically relied on first graphing discrete points and comparing discrete amounts of
able 5ack and Kate relate two graphs from different systems.
Jack: Um, well at, at �/4, the value of this graph is one (identifying point on the CCS graph), which is kinda how we see, when. . ..Kate: The radius (horizontally moving her finger from pole to a radius of 1) of one (moving her finger along the arc to the point (1, �/4)).Jack: This is �/4. . ..Int.: Okay.Jack: . . .the angle measure, and that’s one, the radius (identifying point on the PCS graph). And then at �/2 the angle measure, we
have zero radius here (identifying points on both graphs), it returns to zero (tracing PCS graph from previous point).Int.: Okay.Kate: And then you can tell how this increased, like, you can see, by the shape of the graph, makes sense, of the like the curve
(tracing her hand along the two curves throughout description).Int.: Okay so say a little bit more about that. Why does that make sense? What is that graph showing that this graph is also
showing?Kate: Well like here, r is increasing (tracing CCS graph). Like to �/4 (pointing to �/4 on horizontal axis), we see r is increasing here
(motioning to PCS graph), but it’s also increasing at a decreasing rate (motioning to CCS graph). So like here (motioning to PCSgraph), r gets, the changes in r between these points is, like here (identifying points at successive angle measures between 0 and�/4), like the change in r is really decreasing. But then this is like the reverse here, it’s decreasing at an increasing rate(motioning to both graphs).
470 K.C. Moore et al. / Journal of Mathematical Behavior 32 (2013) 461– 473
change between these points, which is a prototypical behavior of chunky thinkers. In addition to these chunky-like behaviors,the students exhibited behaviors that are suggestive of considering a smooth change in progress within these chunks, thusillustrating that they were not constrained to thinking about discrete points and comparing discrete amounts of change. Forinstance, to make sense of curves between identified points the students imagined one quantity increasing or decreasingfor a continuous and ongoing increase in the other quantity (e.g., Tables 3–5). Such thinking was particularly apparent whenthe students graphed r = sin(2�). During their progress on this task, Jack found it important (e.g., “we may not actually getshapes”) to consider variation within already identified coordinate pairs. Jack’s concern prompted the students to refinetheir intervals and subsequently focus on smooth variation, which led them to conceive some forms of “sameness” betweenrelationships (e.g., patterns among r = sin(2�) and r = sin(�), and graphs r = sin(2�) in both the CCS and PCS).
Collectively, the students’ actions highlight the importance of both chunky and smooth images of change for graphingrelationships and constructing connections among coordinate systems. Even though they often focused on discrete pointsand amounts of change, their subsequent decisions and explanations were informed by their awareness that quantitiescovaried continuously in between these points; when engaging in chunky thinking, the students seemed to simultaneouslyhold in mind that the quantities varied smoothly within these chunks. By coordinating these images of change in differentcoordinate systems, the students foregrounded covariational relationships when operating under various representationalconventions. Most importantly, making sense of these covariational relationships through various images of change enabledthem to move among representations – both in coordinate systems and formulas – while holding in mind something invariantabout these representations. It was in this way that the students were able to see different representations as one in thesame. To the students, each representation represented the same something: a covariational relationship that entailed astructure of related quantities and various images of change.
Jack and Kate’s coordination of different images of change is consistent with that of continuous covariation (Saldanha &Thompson, 1998; Thompson, 2008, 2011), which can be framed as a combination of smooth and chunky thinking (Castillo-Garsow, 2012; Castillo-Garsow, Johnson, & Moore, submitted for publication). An essential aspect of continuous covariationis that any conceived chunk of variation is understood as entailing smooth variation, where this smooth interval of variationcan be partitioned into sub-chunks. These sub-chunks are also understood as entailing smooth variation that can be parti-tioned, and so on (Castillo-Garsow, 2012; Thompson, 2008, 2011). An important feature of continuous covariation, whichis illustrated by Jack and Kate’s actions, is that it involves more than a pointwise understanding of graphing or function.For instance, Jack and Kate not only understood that graphs in different coordinate systems involved equivalent coordinatepairs, but they also conceived invariance among the graphs in terms of a dynamic relationship between quantities’ values.The students conceived graphs in terms of both discrete points and images of two dynamically changing quantities, andconsidering smooth variation between discrete points was central to their making sense of and producing graphs.
5.2. Polar coordinates and school mathematics
Returning to Thompson’s (1994c) discussion of multiple representations, he emphasized supporting students in conceiv-ing something that is representable, finding situations that students are likely to use multiple representations to supporttheir thinking, and directing students to make connections among their representational activity in the context of the some-thing that is representable. As described in the prior section, Jack and Kate’s activity over the course of the study indicatesthat engaging in covariational reasoning supported them in conceiving something representable, namely a dynamic rela-tionship between two quantities. Also in line with Thompson’s quote, graphing in the PCS seems to have offered Jack and Katesituations that engendered multiple representations and directed them to make connections among their representationalactivities, with these connections being rooted in covariational reasoning.
The body of literature on covariational reasoning suggests that United States students typically do not receive repeatedopportunities for covariational reasoning, nor do they experience a mathematics in which covariational reasoning is afundamental activity. As a result, students often develop meanings for graphing and function that do not entail images ofvariation. For instance, Thompson (1994c), Monk (1992), and Goldenberg, Lewis, & O’Keefe (1992) documented that studentsare oriented to interpreting graphs in terms of pictorial objects, as opposed to interpreting graphs as relationships betweentwo quantities’ values. Thinking of the nature identified by these researchers would lead a student to conclude that the twographs in Fig. 1 represent different relationships, as the graphs are perceptually different.
Students’ propensity to treat graphs as pictorial objects is understandable if these students encountered graphing expe-riences that predominantly involved one coordinate system; with one coordinate system receiving focus, viewing graphs aspictorial objects solves many of the school problems that students encounter. For instance, consider an approach to quadraticfunctions that first presents the rule associated with the class of functions (e.g., f(x) = ax2 + bx + c) and then presents a graph(or graphs) to define the prototypical shape(s) of that function class (e.g., a parabola). From here, the approach might moveinto plotting or estimating points, defining properties of that shape (e.g., the vertex of a parabola), and exploring these prop-erties in terms of transformations of other members of that function class (e.g., considering the vertex in terms of translatinganother vertex, or how g(x) = f(x) + 2 can be thought of as a translation of f(x)). Such an approach, which is commonplace in
the US, emphasizes graphs as pictorial objects made for manipulation and often spends little to no time developing graphsas representations of relationships between quantities. In the event that a student does not already understand graphs asrepresentative of covariational relationships, it can be expected that the student will construct function meanings inher-ently involving the manipulation of shapes in the plane, where these manipulations must adhere to some set of rules (e.g.,
gmm
smrberwg
ciattdCdcetc“
ft(crastwwacttsm
6
(cCPoiiCtm&ss
K.C. Moore et al. / Journal of Mathematical Behavior 32 (2013) 461– 473 471
(x) = f(x) + 2 means move the graph “up by 2 units”); if a student’s activity is dominated by transforming shapes, then theeanings that he or she abstracts will be rooted in such activity and promote the treatment of graphs as pictorial objectsade for manipulation.Students who develop graph and function meanings rooted in shapes and operations on these shapes are posited to
olve problems set within the system in which those meanings were developed. But when they move to a different system,eanings that inherently involve activity dependent on system conventions become problematic because shapes and the
epresentational conventions are changed. For instance, if a student relies on the vertical line test as in the example providedy Montiel et al. (2008), then a circle in the plane is not a function even when defined by a rule in polar form. As anotherxample, for a student who interprets a formula of the form y = x + 2 as line or constant slope (slope meaning tilt), graphing
= � + 2 in the PCS can become problematic because the graph is not a line, nor does it have a constant tilt. As Kate mentionedhen graphing a constant rate of change function in the PCS, “That’s cool. . .because you’d never see this (referring to the PCS
raph) and be like, that’s a linear function.”In Kate’s case, conceiving the PCS graph as a linear relationship was not problematic because her reasoning included
onsidering how two quantities covary. Likewise, both students’ activity throughout the presented interactions (Tables 1–5)llustrates how covariational reasoning can give common meaning to different representational systems; as the studentsttempted to work within the PCS, covariational reasoning enabled seeing something as the same among their representa-ional activity and was thus beneficial to the tasks at hand. Such activity illustrates that a potential benefit of incorporatinghe PCS in the study of mathematics is generating a context in which covariational reasoning can be emphasized as a pro-uctive way of thinking, particularly in the setting of using multiple representations. Investigating graphing only in theCS has the possible consequence of reinforcing problematic student conceptions of function and graphing, many of whicho not entail reasoning about covarying quantities (e.g., conceiving graphs as pictorial objects). By prompting students toonsider multiple coordinate systems, a need can be established for ways of thinking (e.g., covariational reasoning) thatnable conceiving graphs in each system as conveying the same relationship. As such, graphing in both systems might fos-er abstractions stemming from various operations involved in covariational reasoning (e.g., rate of change reasoning andoordinating amounts of change). For instance, for Kate, graphing in both coordinate systems seemed to foreground theconstant rate of change” of a linear relationship (see Table 1), as opposed to the visual tilt of a line.
While the potential use of the PCS to promote covariational reasoning is a conjecture on our part, our conjecture does haveoundations in learning theory, and particularly that of abstraction (Piaget, 1970, 1997, 2001). As Oehrtman (2008) charac-erized when discussing abstraction and the instruction of limit concepts, abstraction theory has the following implications:i) students’ activity should reflect the structure of the intended understandings, (ii) these actions should be repeated andoordinated in a reflective way, and (iii) the development of a concept or way of thinking continually evolves through thee-construction of that concept or way of thinking in new situations. It is possible that infusing the PCS into instructionalpproaches to graphing can support a focus on covariational reasoning that is consistent with such a theory. Returning to theituation in which students’ graphing experiences lead to meanings that are tied to activity dependent upon the represen-ational conventions (e.g., treating curves as pictorial objects for manipulation), it is likely that they will face perturbationshen moving to the PCS (e.g., a linear relationship is not represented by a line in the PCS), thus creating a need for alternativeays of thinking about graphs in both the CCS and PCS. Covariational reasoning offers one such a way of thinking, and in such
case has the potential to change one’s understanding of graphing in CCS while also supporting graphing in the PCS. In thease that a student already predominantly engages in covariational reasoning when operating in the CCS, then introducinghe PCS will provide a situation in which they can repeat and coordinate these actions, while reflecting on such activity inhe context of graphing in the CCS. In both cases, including multiple coordinate systems provides an opportunity to engagetudents in multiple representational activities and support their abstraction of meanings rooted in the connections theyake among these activities.
. Looking forward
Whereas the National Council of Teachers of Mathematics’s Curriculum and Evaluation Standards for School Mathematics1989) and Principles and Standards for School Mathematics (2000) both mentioned the importance of graphing in multipleoordinate systems, as currently written the CCSSM (National Governors Association Center for Best Practices Council ofhief State School Officers, 2010) only outlines graphing relationships in the CCS. One could argue that the removal of theCS is the appropriate course of action since students encounter well-documented difficulties with the CCS and instructionn the PCS tends to be shallow and poorly understood by students. On the other hand, not including occasions for work-ng with other coordinate systems, and specifically the PCS, might deprive students of valuable learning opportunities. Fornstance, having students experience multiple coordinate systems may help them develop a deeper understanding of theCS, possibly addressing some of the common issues seen in the literature (e.g., viewing graphs solely as pictorial objectso be manipulated). Furthermore, numerous researchers have highlighted the pedagogical benefits and importance of using
ultiple representations to support student learning (e.g., Goldenberg, 1995; Oehrtman et al., 2008; Romberg, Fennema, Carpenter, 1993). Future research is needed to understand the potential use of multiple coordinate systems to supporttudent learning, and such research should provide a finer-grained characterization of students’ mental actions as they con-truct these coordinate systems and attempt to coordinate their activity among representational systems. The present study
472 K.C. Moore et al. / Journal of Mathematical Behavior 32 (2013) 461– 473
illustrates that using multiple coordinate systems can aid pre-service teachers in foregrounding covariational reasoning, andsubsequent studies should involve additional pre-service teachers and secondary or undergraduate mathematics students.
Our goal of the present study was to investigate student thinking when graphing in the PCS, with specific attentiongiven to their use (or lack thereof) of covariational reasoning. Based on our previous teaching of the course and interactionswith the students earlier in the semester, a covariational approach to graphing and function was not something familiar tothe students. Such observations speak to the reported lack of emphasis on covariational reasoning in school mathematics(Carlson et al., 2002; Oehrtman et al., 2008). Because of this, we did not expect the students to spontaneously engage incovariational reasoning during the study. Standing in stark contrast with this conjecture, we found that the students engagedin covariational reasoning to make sense of and conceive invariant relationships among multiple representations. This leadsto the question: what fostered such reasoning?
We do not argue that the tasks in the present study caused covariational reasoning per se, as the tasks themselves werenot novel or designed with an explicit focus on covariational reasoning. But, graphing in the PCS and comparing this tographing in the CCS did create a setting in which covariational reasoning enabled the students to engage in meaning makingand construct connections among their activity. As several researchers have argued, students’ covariational reasoning is ahighly complex process that requires time and the proper support (e.g., Carlson et al., 2002; Castillo-Garsow, 2012; Confrey& Smith, 1995; Ellis, 2011; Oehrtman et al., 2008; Saldanha & Thompson, 1998). While researchers have highlighted howcritical covariational reasoning is for sophisticated images of major calculus ideas like rate of change and accumulation, thesame researchers have stressed that educators must not hold off on developing such reasoning until calculus (Carlson et al.,2002; Oehrtman et al., 2008; Thompson, 1994b). Thus, it becomes necessary to find places throughout school mathematics toengender covariational reasoning through rich tasks and effective instructional practices, and future studies should explorethe potential of using multiple coordinate systems in that regard.
A significant limitation of this study is that it included only two students, neither of which encountered significantdifficulties over the course of the teaching experiment. Because of this, the results speak to the affordances of covariationalreasoning when investigating multiple coordinate systems, but not the development of such reasoning. An area of interestis thus investigating how students with a range of covariational reasoning abilities work in the PCS, and particularly thosestudents who have not encountered instruction on quantitative and covariational reasoning. Such studies can offer deeperinsights into students’ development of covariational reasoning, including how different images of change might influencestudents’ covariational reasoning, in the PCS. For instance, Johnson (2012a,b) has made progress in characterizing nuancesin early secondary school students’ covariational reasoning. Determining how such nuances evolve over time and in variouscontexts, including the implications of these developments, forms an important area of study. As Saldanha and Thompson(1998) described, covariational reasoning is developmental in nature (e.g., to conceive covarying quantities requires thatone first conceive varying quantities to be considered in tandem), and a critical area of need for mathematics education isunderstanding this development and its implications for students’ mathematical thinking and learning.
Acknowledgments
Research reported in this paper was supported by National Science Foundation (NSF) Grant no. EHR-0412537 and theUniversity of Georgia College of Education Early Career Faculty Grant. Any conclusions or recommendations stated here arethose of the authors and do not necessarily reflect official positions of NSF or the University of Georgia. We would also liketo thank Jackie Gammaro for contributing to an earlier version of this article, and thank you to Leslie P. Steffe for aiding inthe design and data collection efforts.
References
Carlson, M. (1998). A cross-sectional investigation of the development of the function concept. In E. Dubinsky, A. H. Shoenfeld, & J. J. Kaput (Eds.), Researchin Collegiate Mathematics Education III. Issues in Mathematics Education, Vol. 7 (pp. 114–162).
Carlson, M., Jacobs, S., Coe, E., Larsen, S., & Hsu, E. (2002). Applying covariational reasoning while modeling dynamic events: A framework and a study.Journal for Research in Mathematics Education, 33(5), 352–378.
Castillo-Garsow, C. C. (2010). Teaching the Verhulst model: A teaching experiment in covariational reasoning and exponential growth. USA: Arizona StateUniversity (Ph.D. Dissertation).
Castillo-Garsow, C. W. (2012). Continuous quantitative reasoning. In R. Mayes, R. Bonillia, L. L. Hatfield, & S. Belbase (Eds.), Quantitative Reasoning andMathematical Modeling: A Driver for STEM Integrated Education and Teaching in Context. WISDOMe Monographs, Vol. 2 (pp. 55–73). Laramie, WY: Universityof Wyoming Press.
Castillo-Garsow, C. C., Johnson, H. L., & Moore, K. C. (2013). Chunky and smooth images of change. (submitted for publication).Confrey, J., & Smith, E. (1995). Splitting, covariation, and their role in the development of exponential functions. Journal for Research in Mathematics Education,
26.(66-86).Ellis, A. (2011). Middle school algebra from a functional perspective: A conceptual analysis of quadratic functions. In L. R. Wiest, & T. Lamberg (Eds.),
Proceedings of the 33rd Annual Meeting of the North American Chapter of the International Group for the Psychology of Mathematics Education. Reno, NV:University of Nevada Reno.
Goldenberg, E. P. (1995). Multiple representations: A vehicle for understanding understanding. In D. Perkins, J. Schwartz, M. West, & M. Wiske (Eds.),Software Goes to School: Teaching for Understanding with New Technologies (pp. 155–171). New York: Oxford University Press.
Goldenberg, E. P., Lewis, P., & O’Keefe, J. (1992). Dynamic representation and the development of a process understanding of function. In G. Harel, &E. Dubinsky (Eds.), The Concept of Function: Aspects of Epistemology and Pedagogy, MAA Notes, Vol. 25 (pp. 235–260). Washington, DC: MathematicalAssociation of America.
Johnson, H. L. (2012a). Reasoning about variation in the intensity of change in covarying quantities involved in rate of change. The Journal of MathematicalBehavior, 31(3), 313–330.
J
LL
M
M
M
MM
M
NNN
O
O
PPPR
S
S
S
T
T
T
T
T
T
T
T
v
K.C. Moore et al. / Journal of Mathematical Behavior 32 (2013) 461– 473 473
ohnson, H. L. (2012b). Two forms of reasoning about amounts of change in covarying quantities’. In L. R. Van Zoest, J.-J. Lo, & J. L. Kratky (Eds.), Proceedingsof the Annual Meeting of the Psychology of Mathematics Education – North America (pp. 143–150). Kalamazoo, MI: Western Michigan University.
einhardt, G., Zaslavsky, O., & Stein, M. K. (1990). Functions, graphs, and graphing: Tasks, learning, and teaching. Review of Educational Research, 60(1), 1–64.obato, J., & Bowers, J. (2000). Three perspectives in research on functions: Multi-representational, quantitative, and phenomenological. In Paper presented
at the annual meeting of the American Educational Research Association New Orleans, LA.onk, S. (1992). Students’ understanding of a function given by a physical model. In G. Harel, & E. Dubinsky (Eds.), The Concept of Function: Aspects of
Epistemology and Pedagogy (pp. 175–193). Washington, DC: Mathematical Association of America.ontiel, M., Vidakovic, D., & Kabael, T. (2008). Relationship between students’ understanding of functions in Cartesian and polar coordinate systems.
Investigations in Mathematics Learning, 1(2), 52–70.ontiel, M., Wilhelmi, M., Vidakovic, D., & Elstak, I. (2009). Using the onto-semiotic approach to identify and analyze mathematical meaning when transiting
between different coordinate systems in a multivariate context. Educational Studies in Mathematics, 72(2), 139–160.oore, K. C. (2013). Making sense by measuring arcs: A teaching experiment in angle measure. Educational Studies in Mathematics, 83(2), 225–245.oore, K. C. (2012). Coherence, quantitative reasoning, and the trigonometry of students. In R. Mayes, & L. L. Hatfield (Eds.), Quantitative Reasoning and
Mathematical Modeling: A Driver for STEM Integrated Education and Teaching in Context (pp. 75–92). Laramie, WY: University of Wyoming.oore, K. C., LaForest, K., & Kim, H. J. (2012). The unit circle and unit conversions. In S. Brown, S. Larsen, K. Marrongelle, & M. Oehrtman (Eds.), Proceedings
of the Fifteenth Annual Conference on Research in Undergraduate Mathematics Education (pp. 16–31). Portland: Portland State University.ational Council of Teachers of Mathematics (NCTM). (1989). Curriculum and Evaluation Standards for School Mathematics. Reston, VA: NCTM.CTM. (2000). Principles and Standards for School Mathematics. Reston, VA: NCTM.ational Governors Association Center for Best Practices, Council of Chief State School Officers. (2010). Common Core State Standards for Mathematics.
Retrieved from http://www.corestandards.org/the-standards/mathematicsehrtman, M. (2008). Layers of abstraction: Theory and design for the instruction of limit concepts. In M. P. Carlson, & C. Rasmussen (Eds.), Making the
Connection: Research and Teaching in Undergraduate Mathematics Education (pp. 55–64). Washington, DC: Mathematical Association of America.ehrtman, M., Carlson, M., & Thompson, P. W. (2008). Foundational reasoning abilities that promote coherence in students’ function understanding. In M.
P. Carlson, & C. Rasmussen (Eds.), Making the Connection: Research and Teaching in Undergraduate Mathematics Education (pp. 27–42). Washington, DC:Mathematical Association of America.
iaget, J. (1970). Genetic Epistemology. New York: W. W. Norton & Company, Inc.iaget, J. (1997). The Principles of Genetic Epistemology. New York: Routledge.iaget, J. (2001). Studies in Reflecting Abstraction. Hove, UK: Psychology Press Ltd.omberg, T. A., Fennema, E., & Carpenter, T. P. (Eds.). (1993). Integrating Research on the Graphical Representation of Functions. Hillsdale, NJ: Lawrence Erlbaum
Associates.aldanha, L., & Thompson, P. W. (1998). Re-thinking co-variation from a quantitative perspective: Simultaneous continuous variation. In S. B. Berensah, &
W. N. Coulombe (Eds.), Proceedings of the Annual Meeting of the Psychology of Mathematics Education – North America. Raleigh, NC: North Carolina StateUniversity.
ayre, E., & Wittman, M. (2007). Intermediate mechanics students’ coordinate system choice. In Electronic Proceedings for the Tenth Special Interest Groupof the Mathematical Association of America on Research in Undergraduate Mathematics Education Conference on Research in Undergraduate MathematicsEducation San Diego State University, San Diego.
teffe, L. P., & Thompson, P. W. (2000). Teaching experiment methodology: Underlying principles and essential elements. In R. Lesh, & A. E. Kelly (Eds.),Research Design in Mathematics and Science Education (pp. 267–307). Hillside, NJ: Erlbaum.
hompson, P. W. (1990). A theoretical Model of Quantity-based Reasoning in Arithmetic and Algebra. Center for Research in Mathematics & Science Education:San Diego State University.
hompson, P. W. (1994a). The development of the concept of speed and its relationship to concepts of rate. In G. Harel, & J. Confrey (Eds.), The Developmentof Multiplicative Reasoning in the Learning of Mathematics. Albany, NY: SUNY Press.
hompson, P. W. (1994b). Images of rate and operational understanding of the fundamental theorem of calculus. Educational Studies in Mathematics, 26(2–3),229–274.
hompson, P. W. (1994c). Students, functions, and the undergraduate curriculum. In E. Dubinsky, A. H. Schoenfeld, & J. J. Kaput (Eds.), Research in CollegiateMathematics Education: Issues in Mathematics Education, Vol. 4 (pp. 21–44). Providence, RI: American Mathematical Society.
hompson, P. W. (2000). Radical constructivism: Reflections and directions. In L. P. Steffe, & P. W. Thompson (Eds.), Radical Constructivism in Action: Buildingon the Pioneering Work of Ernst von Glaserfeld (pp. 412–448). London: Falmer Press.
hompson, P. W. (2008). ‘One approach to a coherent K-12 mathematics. Or, it takes 12 years to learn calculus’. In Paper presented at the Pathways to AlgebraConference.
hompson, P. W. (2011). Quantitative reasoning and mathematical modeling. In L. L. Hatfield, S. Chamberlain, & S. Belbase (Eds.), New Perspectives and
Directions for Collaborative Research in Mathematics Education (pp. 33–56). Laramie, WY: University of Wyoming.hompson, P. W. (2013). In the absence of meaning. In K. Leatham (Ed.), Vital Directions for Research in Mathematics Education (pp. 57–93). New York:Springer.
on Glasersfeld, E. (1987). Preliminaries to any theory of representation. In C. Janvier (Ed.), Problems of Representation in the Teaching and Learning ofMathematics (pp. 215–225). Hillsdale, NJ: Lawrence Erlbaum.