Embed Size (px)
Citation preview
Corrosion Science 90 (2015) 248–258
Contents lists available at ScienceDirect
Corrosion Science
journal homepage: www.elsevier .com/locate /corsc i
Copper corrosion in bentonite/saline groundwater solution: Effectsof solution and bentonite chemistry
http://dx.doi.org/10.1016/j.corsci.2014.10.0170010-938X/� 2014 Published by Elsevier Ltd.
⇑ Corresponding author. Tel.: +386 1 2804547.E-mail address: [email protected] (T. Kosec).
T. Kosec a,⇑, Z. Qin b, J. Chen b, A. Legat a, D.W. Shoesmith b,c
a Slovenian National Building and Civil Engineering Institute, Dimiceva 12, SI-1000 Ljubljana, Sloveniab Department of Chemistry, University of Western Ontario, London, Ontario N6A 5B7, Canadac Surface Science Western, University of Western Ontario, 999 Collip Circle, London N6G 0J3, Canada
a r t i c l e i n f o
Article history:Received 9 May 2014Accepted 17 October 2014Available online 24 October 2014
Keywords:A. CopperB. EISB. Raman spectroscopy
a b s t r a c t
Copper corrosion has been studied in simulated groundwater with and without added bentonite clayusing different electrochemical techniques. The corroded surfaces were characterised by SEM/EDS,Raman spectroscopy and Auger depth profiling. In both environments small amounts of sulphide(0.005 mM) control the early corrosion behaviour. Under aerated conditions an initially formed Cu2S filmis rapidly converted to a non-protective layer of cuprite and corrosion proceeds with the deposition of anouter layer of atacamite. In the presence of bentonite corrosion proceeds slowly under O2 transport con-trol. No atacamite is observed and the Cu surface appears slightly pitted.
� 2014 Published by Elsevier Ltd.
1. Introduction
Both the Scandinavian and Canadian high-level radioactivewaste disposal programs propose to place spent nuclear fuel intightly sealed copper canisters in a geologic repository backfilledwith compacted bentonite clay [1,2]. By supplementing engineeredbarriers with naturally occurring materials, it is hoped to closelyimitate nature [3]. Since the Cu container is the only absolute bar-rier to the release of radionuclides, its corrosion has been studiedextensively [2,3–14].
The initial rate of Cu corrosion will be determined by factorssuch as moisture, temperature, and the presence of aggressivegroundwater species like chlorides, nitrates and sulphates [1]. Inthe longer term the corrosion process will evolve towards steadystate at a rate depending on the corrosive environment (chemicalcomposition, pH, resistivity), and the metallurgical properties ofthe container.
When exposed to humid air, Cu oxidises to Cu2O, which pro-tects it from further corrosion [15]. However, in the presence ofaggressive species, secondary corrosion processes occur. In thefields of atmospheric and archaeological corrosion the resultingfilm is referred to as a patina [16,17]. The structure of natural pati-nas grown on artefacts exposed for long periods of time dependson whether exposure was to soil, atmosphere, water or seawater.For atmospheric corrosion, the rates over a 20-year exposure
period were reported to be 1 lm/year, 0.8 lm/year and 0.5 lm/year for industrial, marine and rural atmospheres, respectively[17]. Cu is also resistant to corrosion in seawater [17].
The design lifetime of the Cu container is >106 years [2]. Onsealing, a limited amount of air will be trapped in the repositoryin the low permeability groundwater-saturated bentonite sur-rounding the container [1]. This O2 will be consumed by reactionswith minerals and organic material in the rock and the bentonite aswell as container corrosion. Once this O2 has been consumed, fur-ther corrosion is most likely to be sustained by a supply of dis-solved SH� to the copper surface [1]. Consequently, extensivestudy of Cu corrosion in sulphide systems under anoxic conditionshas been undertaken [9–13]. However, it is likely that smallamounts of sulphide could also influence corrosion during theearly oxic repository period.
The influence of sulphide in chloride environments has beeninvestigated under different conditions, especially on Cu–Ni alloycorrosion in seawater polluted by SH� [18–24], including studiesin the presence of inhibitors [20–22,24]. Small concentrations ofSH� have been shown to accelerate the anodic reaction in the over-all corrosion process [23], and it has been suggested that SH� ionscompete with BTAH inhibitor molecules for adsorption on a Cu sur-face [21].
Our previous studies on Cu corrosion under oxic conditions inthe presence of bentonite saturated with groundwater yielded acorrosion rate around 1 lm/year after 3.5 years of exposure[14,24]. In that study, Cu corrosion sensors and impedancespectroscopy were used to evaluate the corrosion rate, but many
T. Kosec et al. / Corrosion Science 90 (2015) 248–258 249
questions remained unanswered, including the effects of solutionchemistry in the presence of bentonite.
The focus of this paper is on a comparison of the initial corro-sion behaviour of Cu in oxic saline groundwater with and withoutbentonite. A range of electrochemical techniques including electro-chemical impedance spectroscopy (EIS) has been used and supple-mented by spectroscopic analyses using Raman and Augerspectroscopy and FIB/SEM analysis.
2. Experimental
2.1. Electrode preparation and solutions
Discs, 16 mm in diameter, were cut from 2 mm thick oxygenfree high conductivity (OHPC) Cu (99.99%) foil (Goodfellow Cam-bridge Ltd., UK). A Cu wire was attached to the back side of the disc,and the sides and the back of the electrode protected with epoxypaint. This assembly was embedded in a Teflon holder leaving asingle exposed face with a surface area of 0.785 cm2. Prior to mea-surements, the electrode was abraded with 1200-grit emery paper,polished to a mirror finish with 0.15 lm Al2O3 powder, ultrasoni-cally treated in acetone for 3 min, and then dried. A saturated cal-omel reference electrode (SCE) and a Pt-grid counter electrodecompleted the cell. All potentials are quoted on the SCE scale.
Two long term corrosion experiments were performed, one in asimulated groundwater solution and a second in a bentonite/simulated groundwater slurry. The solution was prepared fromanalytical grade chemicals to simulate groundwater from theAspö Laboratory (Sweden) as used in previous experiments(0.181 M Cl�, 0.44 mM HCO3
�, 4.6 mM SO42� and 0.005 mM SH�)
[14,24]. Only sodium compounds were used in the preparation ofthis simulated groundwater solution, and the pH was 7.2 at21 �C. Additional experiments were conducted in 0.181 M Cl� withand without 0.005 mM SH�. The slurry was prepared by mixing180 g of bentonite with 800 mL of simulated groundwater until athick and homogeneous suspension was obtained. The mainmineral constituent in bentonite clay (Wyoming bentonite,MX-80) is sodium montmorillonite (�75%) with a sheet-likecrystal structure [5].
2.2. EIS measurements
EIS measurements were performed using a Solartron 1287 elec-trochemical interface and a Solartron 1255B frequency responseanalyser. The validity of impedance data was checked using theKramers–Kronig transform. All measurements were performed atroom temperature with the potential held at the value of the cor-rosion potential (Ecorr) using a perturbation voltage signal of 5 mV(rms) applied over the frequency range from 105 to 10�3 Hz. Elevendata points per decade were recorded. The corrosion potential wasrecorded prior to each EIS measurement. Zview 3.1c software wasused to fit and analyse the impedance spectra.
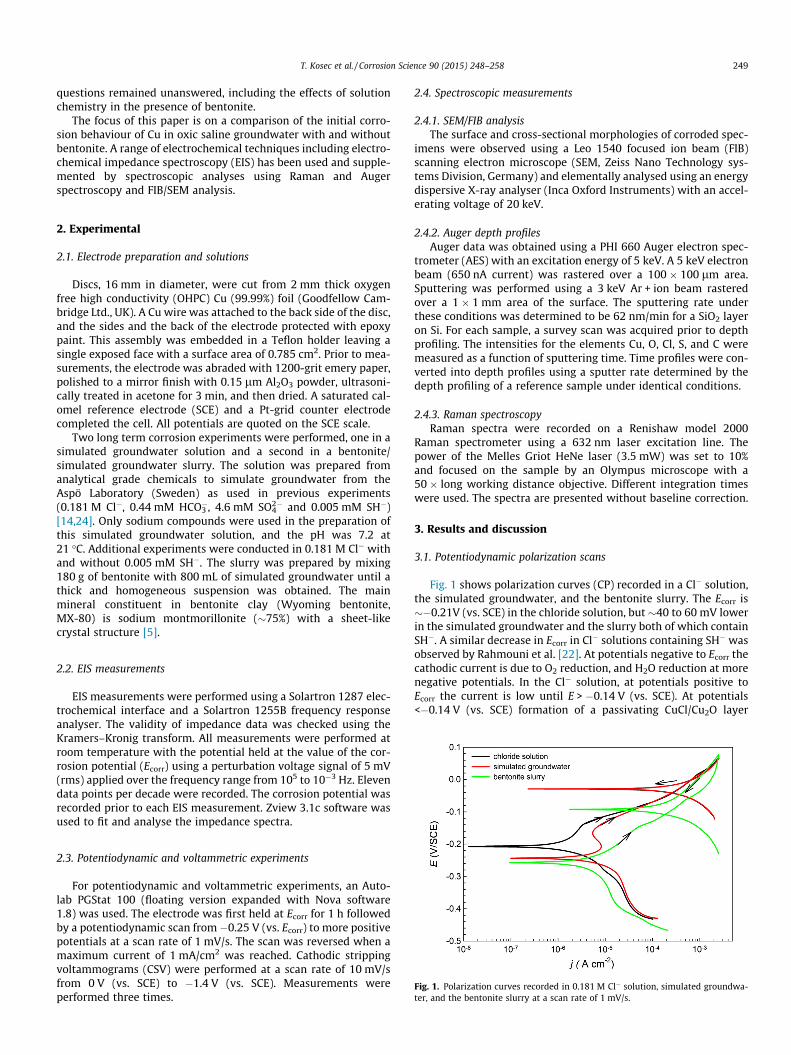
Fig. 1. Polarization curves recorded in 0.181 M Cl� solution, simulated groundwa-ter, and the bentonite slurry at a scan rate of 1 mV/s.
2.3. Potentiodynamic and voltammetric experiments
For potentiodynamic and voltammetric experiments, an Auto-lab PGStat 100 (floating version expanded with Nova software1.8) was used. The electrode was first held at Ecorr for 1 h followedby a potentiodynamic scan from �0.25 V (vs. Ecorr) to more positivepotentials at a scan rate of 1 mV/s. The scan was reversed when amaximum current of 1 mA/cm2 was reached. Cathodic strippingvoltammograms (CSV) were performed at a scan rate of 10 mV/sfrom 0 V (vs. SCE) to �1.4 V (vs. SCE). Measurements wereperformed three times.
2.4. Spectroscopic measurements
2.4.1. SEM/FIB analysisThe surface and cross-sectional morphologies of corroded spec-
imens were observed using a Leo 1540 focused ion beam (FIB)scanning electron microscope (SEM, Zeiss Nano Technology sys-tems Division, Germany) and elementally analysed using an energydispersive X-ray analyser (Inca Oxford Instruments) with an accel-erating voltage of 20 keV.
2.4.2. Auger depth profilesAuger data was obtained using a PHI 660 Auger electron spec-
trometer (AES) with an excitation energy of 5 keV. A 5 keV electronbeam (650 nA current) was rastered over a 100 � 100 lm area.Sputtering was performed using a 3 keV Ar + ion beam rasteredover a 1 � 1 mm area of the surface. The sputtering rate underthese conditions was determined to be 62 nm/min for a SiO2 layeron Si. For each sample, a survey scan was acquired prior to depthprofiling. The intensities for the elements Cu, O, Cl, S, and C weremeasured as a function of sputtering time. Time profiles were con-verted into depth profiles using a sputter rate determined by thedepth profiling of a reference sample under identical conditions.
2.4.3. Raman spectroscopyRaman spectra were recorded on a Renishaw model 2000
Raman spectrometer using a 632 nm laser excitation line. Thepower of the Melles Griot HeNe laser (3.5 mW) was set to 10%and focused on the sample by an Olympus microscope with a50 � long working distance objective. Different integration timeswere used. The spectra are presented without baseline correction.
3. Results and discussion
3.1. Potentiodynamic polarization scans
Fig. 1 shows polarization curves (CP) recorded in a Cl� solution,the simulated groundwater, and the bentonite slurry. The Ecorr is��0.21V (vs. SCE) in the chloride solution, but �40 to 60 mV lowerin the simulated groundwater and the slurry both of which containSH�. A similar decrease in Ecorr in Cl� solutions containing SH� wasobserved by Rahmouni et al. [22]. At potentials negative to Ecorr thecathodic current is due to O2 reduction, and H2O reduction at morenegative potentials. In the Cl� solution, at potentials positive toEcorr the current is low until E > �0.14 V (vs. SCE). At potentials<�0.14 V (vs. SCE) formation of a passivating CuCl/Cu2O layer
250 T. Kosec et al. / Corrosion Science 90 (2015) 248–258
occurs, while above this potential the rapid increase in current hasbeen attributed to the dissolution of Cu2+ [25]. Since the currentcontinues to rise as the potential increases there is no indicationthat the anodic process is suppressed by the accumulation of CuI/CuII corrosion product deposits. On the reverse scan the currentrapidly switches to cathodic indicating that any corrosion productsformed anodically are readily reducible and/or capable of catalys-ing O2 reduction.
In the simulated groundwater containing SH� an apparentsmall active to passive transition is observed at E > Ecorr. Sincethe constituent of the groundwater likely to influence Cu reactivityat these potentials is SH�, this can be taken as an indication thateven at these small concentrations SH� can influence the anodicprocess with the current peak being assigned to the formation ofCu2S which retards active dissolution but only partially passivatesthe surface. At more positive potentials, and on the reverse scan,the behaviour is very similar to that observed in the Cl� solution.In the bentonite slurry the cathodic current is significantly sup-pressed suggesting some O2 may have been consumed by oxidiz-able species in the clay. At potentials positive to Ecorr, the currentis significantly increased compared to the other two solutions,especially within the potential range (�0.24 to �0.28 V (vs. SCE))where the active to passive transition is observed in the simulatedgroundwater. This very large increase in anodic current suggests avery significant anodic activation of the surface both in the CuI
(Ecorr to �0.14 V (vs. SCE)) and CuII (>�0.14 V (vs. SCE)) regions.
3.2. Short-term corrosion experiments
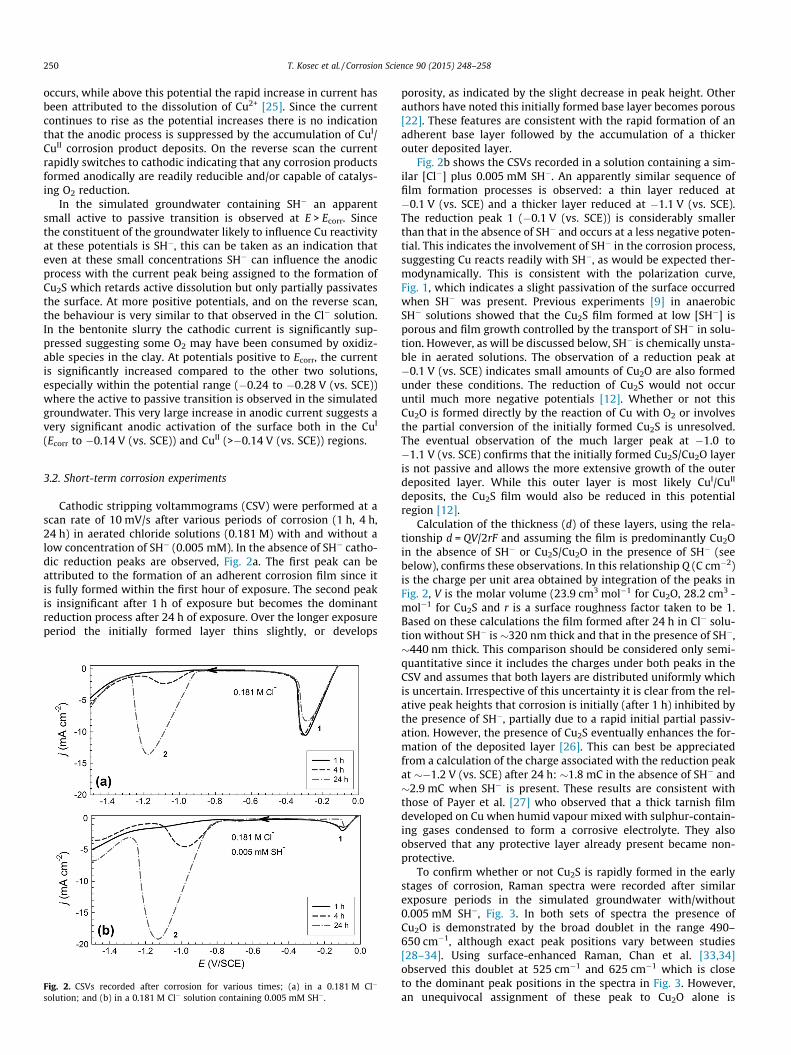
Cathodic stripping voltammograms (CSV) were performed at ascan rate of 10 mV/s after various periods of corrosion (1 h, 4 h,24 h) in aerated chloride solutions (0.181 M) with and without alow concentration of SH� (0.005 mM). In the absence of SH� catho-dic reduction peaks are observed, Fig. 2a. The first peak can beattributed to the formation of an adherent corrosion film since itis fully formed within the first hour of exposure. The second peakis insignificant after 1 h of exposure but becomes the dominantreduction process after 24 h of exposure. Over the longer exposureperiod the initially formed layer thins slightly, or develops
Fig. 2. CSVs recorded after corrosion for various times; (a) in a 0.181 M Cl�
solution; and (b) in a 0.181 M Cl� solution containing 0.005 mM SH�.
porosity, as indicated by the slight decrease in peak height. Otherauthors have noted this initially formed base layer becomes porous[22]. These features are consistent with the rapid formation of anadherent base layer followed by the accumulation of a thickerouter deposited layer.
Fig. 2b shows the CSVs recorded in a solution containing a sim-ilar [Cl�] plus 0.005 mM SH�. An apparently similar sequence offilm formation processes is observed: a thin layer reduced at�0.1 V (vs. SCE) and a thicker layer reduced at �1.1 V (vs. SCE).The reduction peak 1 (�0.1 V (vs. SCE)) is considerably smallerthan that in the absence of SH� and occurs at a less negative poten-tial. This indicates the involvement of SH� in the corrosion process,suggesting Cu reacts readily with SH�, as would be expected ther-modynamically. This is consistent with the polarization curve,Fig. 1, which indicates a slight passivation of the surface occurredwhen SH� was present. Previous experiments [9] in anaerobicSH� solutions showed that the Cu2S film formed at low [SH�] isporous and film growth controlled by the transport of SH� in solu-tion. However, as will be discussed below, SH� is chemically unsta-ble in aerated solutions. The observation of a reduction peak at�0.1 V (vs. SCE) indicates small amounts of Cu2O are also formedunder these conditions. The reduction of Cu2S would not occuruntil much more negative potentials [12]. Whether or not thisCu2O is formed directly by the reaction of Cu with O2 or involvesthe partial conversion of the initially formed Cu2S is unresolved.The eventual observation of the much larger peak at �1.0 to�1.1 V (vs. SCE) confirms that the initially formed Cu2S/Cu2O layeris not passive and allows the more extensive growth of the outerdeposited layer. While this outer layer is most likely CuI/CuII
deposits, the Cu2S film would also be reduced in this potentialregion [12].
Calculation of the thickness (d) of these layers, using the rela-tionship d = QV/2rF and assuming the film is predominantly Cu2Oin the absence of SH� or Cu2S/Cu2O in the presence of SH� (seebelow), confirms these observations. In this relationship Q (C cm�2)is the charge per unit area obtained by integration of the peaks inFig. 2, V is the molar volume (23.9 cm3 mol�1 for Cu2O, 28.2 cm3 -mol�1 for Cu2S and r is a surface roughness factor taken to be 1.Based on these calculations the film formed after 24 h in Cl� solu-tion without SH� is �320 nm thick and that in the presence of SH�,�440 nm thick. This comparison should be considered only semi-quantitative since it includes the charges under both peaks in theCSV and assumes that both layers are distributed uniformly whichis uncertain. Irrespective of this uncertainty it is clear from the rel-ative peak heights that corrosion is initially (after 1 h) inhibited bythe presence of SH�, partially due to a rapid initial partial passiv-ation. However, the presence of Cu2S eventually enhances the for-mation of the deposited layer [26]. This can best be appreciatedfrom a calculation of the charge associated with the reduction peakat ��1.2 V (vs. SCE) after 24 h: �1.8 mC in the absence of SH� and�2.9 mC when SH� is present. These results are consistent withthose of Payer et al. [27] who observed that a thick tarnish filmdeveloped on Cu when humid vapour mixed with sulphur-contain-ing gases condensed to form a corrosive electrolyte. They alsoobserved that any protective layer already present became non-protective.
To confirm whether or not Cu2S is rapidly formed in the earlystages of corrosion, Raman spectra were recorded after similarexposure periods in the simulated groundwater with/without0.005 mM SH�, Fig. 3. In both sets of spectra the presence ofCu2O is demonstrated by the broad doublet in the range 490–650 cm�1, although exact peak positions vary between studies[28–34]. Using surface-enhanced Raman, Chan et al. [33,34]observed this doublet at 525 cm�1 and 625 cm�1 which is closeto the dominant peak positions in the spectra in Fig. 3. However,an unequivocal assignment of these peak to Cu2O alone is
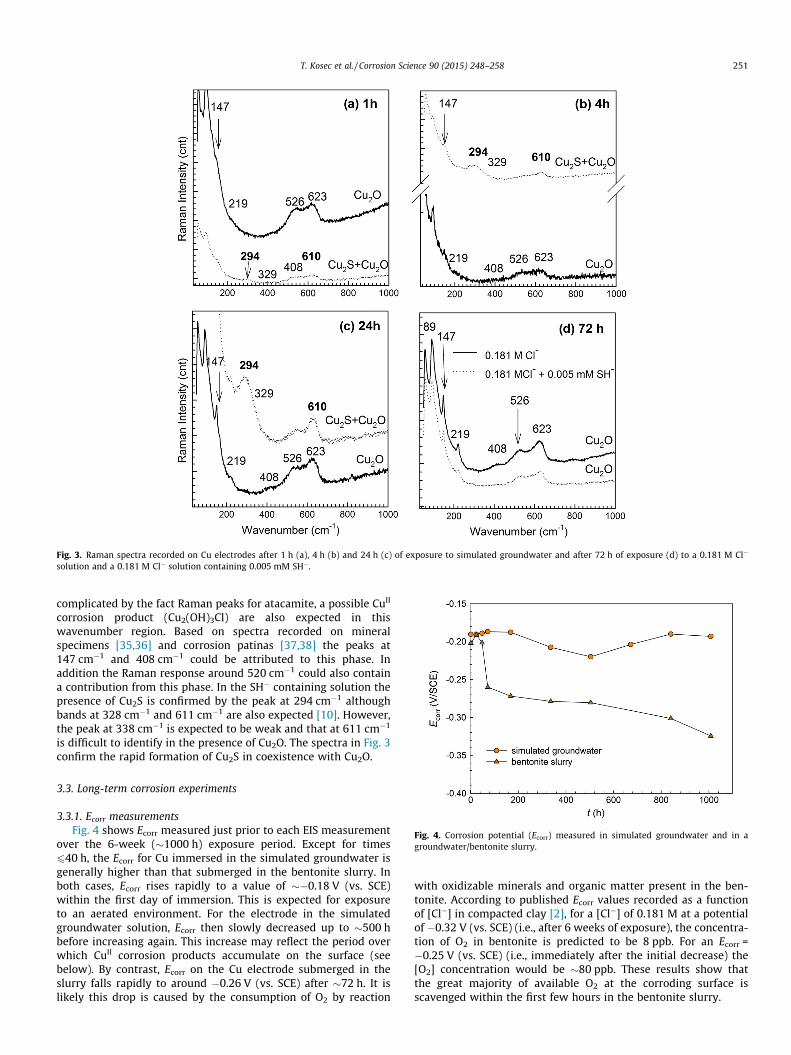
Fig. 3. Raman spectra recorded on Cu electrodes after 1 h (a), 4 h (b) and 24 h (c) of exposure to simulated groundwater and after 72 h of exposure (d) to a 0.181 M Cl�
solution and a 0.181 M Cl� solution containing 0.005 mM SH�.
Fig. 4. Corrosion potential (Ecorr) measured in simulated groundwater and in agroundwater/bentonite slurry.
T. Kosec et al. / Corrosion Science 90 (2015) 248–258 251
complicated by the fact Raman peaks for atacamite, a possible CuII
corrosion product (Cu2(OH)3Cl) are also expected in thiswavenumber region. Based on spectra recorded on mineralspecimens [35,36] and corrosion patinas [37,38] the peaks at147 cm�1 and 408 cm�1 could be attributed to this phase. Inaddition the Raman response around 520 cm�1 could also containa contribution from this phase. In the SH� containing solution thepresence of Cu2S is confirmed by the peak at 294 cm�1 althoughbands at 328 cm�1 and 611 cm�1 are also expected [10]. However,the peak at 338 cm�1 is expected to be weak and that at 611 cm�1
is difficult to identify in the presence of Cu2O. The spectra in Fig. 3confirm the rapid formation of Cu2S in coexistence with Cu2O.
3.3. Long-term corrosion experiments
3.3.1. Ecorr measurementsFig. 4 shows Ecorr measured just prior to each EIS measurement
over the 6-week (�1000 h) exposure period. Except for times640 h, the Ecorr for Cu immersed in the simulated groundwater isgenerally higher than that submerged in the bentonite slurry. Inboth cases, Ecorr rises rapidly to a value of ��0.18 V (vs. SCE)within the first day of immersion. This is expected for exposureto an aerated environment. For the electrode in the simulatedgroundwater solution, Ecorr then slowly decreased up to �500 hbefore increasing again. This increase may reflect the period overwhich CuII corrosion products accumulate on the surface (seebelow). By contrast, Ecorr on the Cu electrode submerged in theslurry falls rapidly to around �0.26 V (vs. SCE) after �72 h. It islikely this drop is caused by the consumption of O2 by reaction
with oxidizable minerals and organic matter present in the ben-tonite. According to published Ecorr values recorded as a functionof [Cl�] in compacted clay [2], for a [Cl�] of 0.181 M at a potentialof �0.32 V (vs. SCE) (i.e., after 6 weeks of exposure), the concentra-tion of O2 in bentonite is predicted to be 8 ppb. For an Ecorr =�0.25 V (vs. SCE) (i.e., immediately after the initial decrease) the[O2] concentration would be �80 ppb. These results show thatthe great majority of available O2 at the corroding surface isscavenged within the first few hours in the bentonite slurry.
252 T. Kosec et al. / Corrosion Science 90 (2015) 248–258
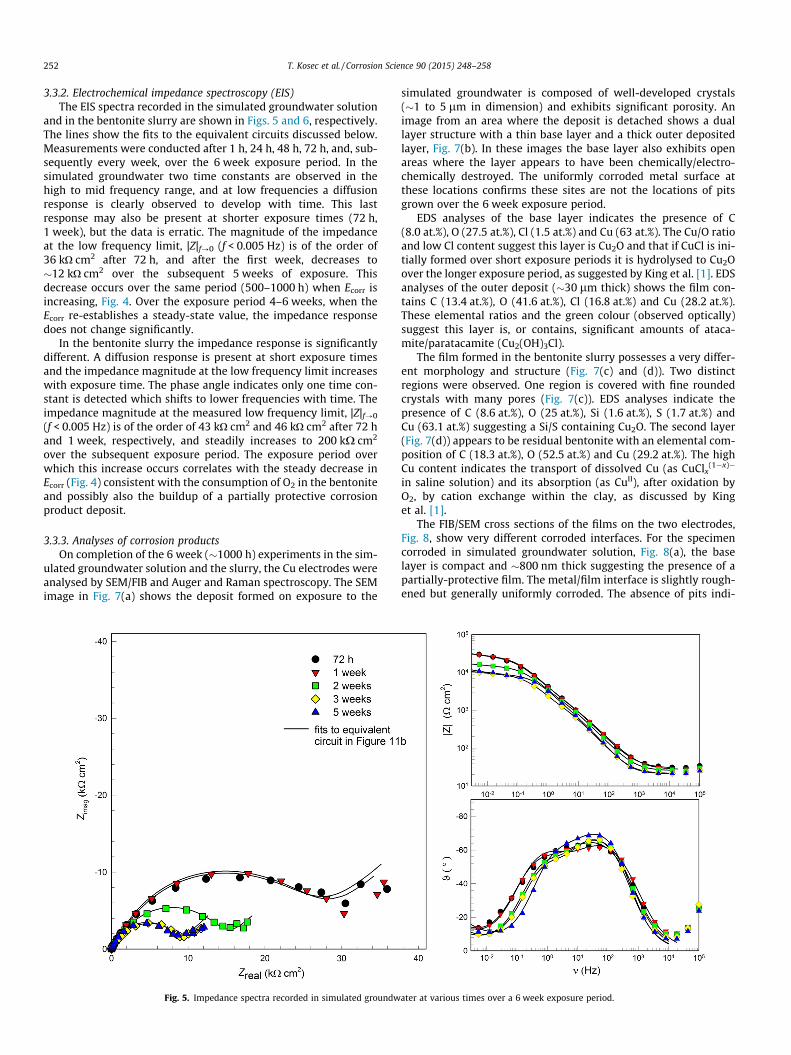
3.3.2. Electrochemical impedance spectroscopy (EIS)The EIS spectra recorded in the simulated groundwater solution
and in the bentonite slurry are shown in Figs. 5 and 6, respectively.The lines show the fits to the equivalent circuits discussed below.Measurements were conducted after 1 h, 24 h, 48 h, 72 h, and, sub-sequently every week, over the 6 week exposure period. In thesimulated groundwater two time constants are observed in thehigh to mid frequency range, and at low frequencies a diffusionresponse is clearly observed to develop with time. This lastresponse may also be present at shorter exposure times (72 h,1 week), but the data is erratic. The magnitude of the impedanceat the low frequency limit, |Z|f?0 (f < 0.005 Hz) is of the order of36 kO cm2 after 72 h, and after the first week, decreases to�12 kO cm2 over the subsequent 5 weeks of exposure. Thisdecrease occurs over the same period (500–1000 h) when Ecorr isincreasing, Fig. 4. Over the exposure period 4–6 weeks, when theEcorr re-establishes a steady-state value, the impedance responsedoes not change significantly.
In the bentonite slurry the impedance response is significantlydifferent. A diffusion response is present at short exposure timesand the impedance magnitude at the low frequency limit increaseswith exposure time. The phase angle indicates only one time con-stant is detected which shifts to lower frequencies with time. Theimpedance magnitude at the measured low frequency limit, |Z|f?0
(f < 0.005 Hz) is of the order of 43 kO cm2 and 46 kO cm2 after 72 hand 1 week, respectively, and steadily increases to 200 kX cm2
over the subsequent exposure period. The exposure period overwhich this increase occurs correlates with the steady decrease inEcorr (Fig. 4) consistent with the consumption of O2 in the bentoniteand possibly also the buildup of a partially protective corrosionproduct deposit.
3.3.3. Analyses of corrosion productsOn completion of the 6 week (�1000 h) experiments in the sim-
ulated groundwater solution and the slurry, the Cu electrodes wereanalysed by SEM/FIB and Auger and Raman spectroscopy. The SEMimage in Fig. 7(a) shows the deposit formed on exposure to the
Fig. 5. Impedance spectra recorded in simulated groundw
simulated groundwater is composed of well-developed crystals(�1 to 5 lm in dimension) and exhibits significant porosity. Animage from an area where the deposit is detached shows a duallayer structure with a thin base layer and a thick outer depositedlayer, Fig. 7(b). In these images the base layer also exhibits openareas where the layer appears to have been chemically/electro-chemically destroyed. The uniformly corroded metal surface atthese locations confirms these sites are not the locations of pitsgrown over the 6 week exposure period.
EDS analyses of the base layer indicates the presence of C(8.0 at.%), O (27.5 at.%), Cl (1.5 at.%) and Cu (63 at.%). The Cu/O ratioand low Cl content suggest this layer is Cu2O and that if CuCl is ini-tially formed over short exposure periods it is hydrolysed to Cu2Oover the longer exposure period, as suggested by King et al. [1]. EDSanalyses of the outer deposit (�30 lm thick) shows the film con-tains C (13.4 at.%), O (41.6 at.%), Cl (16.8 at.%) and Cu (28.2 at.%).These elemental ratios and the green colour (observed optically)suggest this layer is, or contains, significant amounts of ataca-mite/paratacamite (Cu2(OH)3Cl).
The film formed in the bentonite slurry possesses a very differ-ent morphology and structure (Fig. 7(c) and (d)). Two distinctregions were observed. One region is covered with fine roundedcrystals with many pores (Fig. 7(c)). EDS analyses indicate thepresence of C (8.6 at.%), O (25 at.%), Si (1.6 at.%), S (1.7 at.%) andCu (63.1 at.%) suggesting a Si/S containing Cu2O. The second layer(Fig. 7(d)) appears to be residual bentonite with an elemental com-position of C (18.3 at.%), O (52.5 at.%) and Cu (29.2 at.%). The highCu content indicates the transport of dissolved Cu (as CuClx
(1�x)�
in saline solution) and its absorption (as CuII), after oxidation byO2, by cation exchange within the clay, as discussed by Kinget al. [1].
The FIB/SEM cross sections of the films on the two electrodes,Fig. 8, show very different corroded interfaces. For the specimencorroded in simulated groundwater solution, Fig. 8(a), the baselayer is compact and �800 nm thick suggesting the presence of apartially-protective film. The metal/film interface is slightly rough-ened but generally uniformly corroded. The absence of pits indi-
ater at various times over a 6 week exposure period.
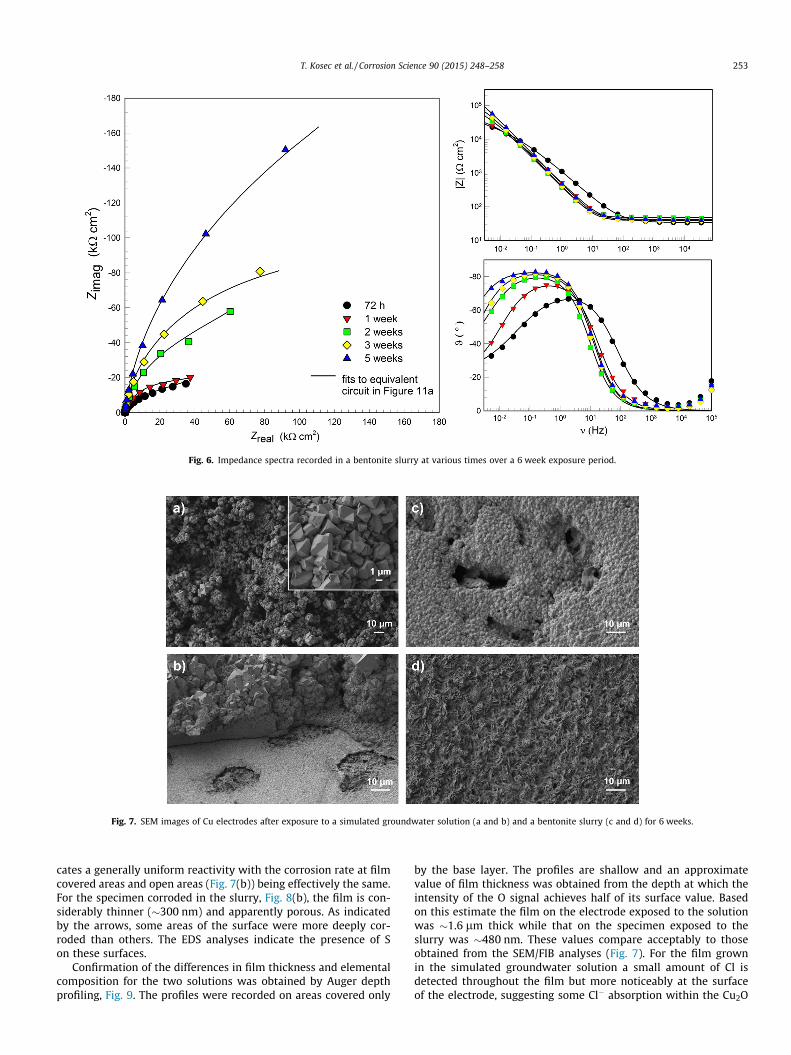
Fig. 6. Impedance spectra recorded in a bentonite slurry at various times over a 6 week exposure period.
Fig. 7. SEM images of Cu electrodes after exposure to a simulated groundwater solution (a and b) and a bentonite slurry (c and d) for 6 weeks.
T. Kosec et al. / Corrosion Science 90 (2015) 248–258 253
cates a generally uniform reactivity with the corrosion rate at filmcovered areas and open areas (Fig. 7(b)) being effectively the same.For the specimen corroded in the slurry, Fig. 8(b), the film is con-siderably thinner (�300 nm) and apparently porous. As indicatedby the arrows, some areas of the surface were more deeply cor-roded than others. The EDS analyses indicate the presence of Son these surfaces.
Confirmation of the differences in film thickness and elementalcomposition for the two solutions was obtained by Auger depthprofiling, Fig. 9. The profiles were recorded on areas covered only
by the base layer. The profiles are shallow and an approximatevalue of film thickness was obtained from the depth at which theintensity of the O signal achieves half of its surface value. Basedon this estimate the film on the electrode exposed to the solutionwas �1.6 lm thick while that on the specimen exposed to theslurry was �480 nm. These values compare acceptably to thoseobtained from the SEM/FIB analyses (Fig. 7). For the film grownin the simulated groundwater solution a small amount of Cl isdetected throughout the film but more noticeably at the surfaceof the electrode, suggesting some Cl� absorption within the Cu2O
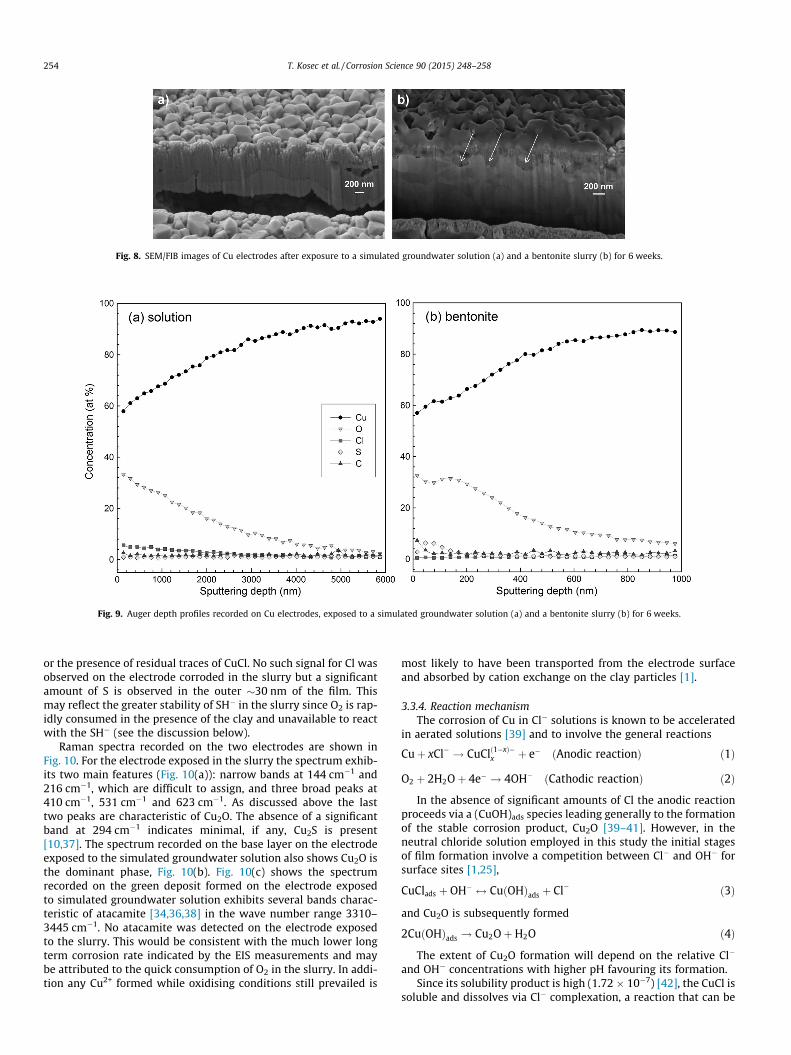
Fig. 8. SEM/FIB images of Cu electrodes after exposure to a simulated groundwater solution (a) and a bentonite slurry (b) for 6 weeks.
Fig. 9. Auger depth profiles recorded on Cu electrodes, exposed to a simulated groundwater solution (a) and a bentonite slurry (b) for 6 weeks.
254 T. Kosec et al. / Corrosion Science 90 (2015) 248–258
or the presence of residual traces of CuCl. No such signal for Cl wasobserved on the electrode corroded in the slurry but a significantamount of S is observed in the outer �30 nm of the film. Thismay reflect the greater stability of SH� in the slurry since O2 is rap-idly consumed in the presence of the clay and unavailable to reactwith the SH� (see the discussion below).
Raman spectra recorded on the two electrodes are shown inFig. 10. For the electrode exposed in the slurry the spectrum exhib-its two main features (Fig. 10(a)): narrow bands at 144 cm�1 and216 cm�1, which are difficult to assign, and three broad peaks at410 cm�1, 531 cm�1 and 623 cm�1. As discussed above the lasttwo peaks are characteristic of Cu2O. The absence of a significantband at 294 cm�1 indicates minimal, if any, Cu2S is present[10,37]. The spectrum recorded on the base layer on the electrodeexposed to the simulated groundwater solution also shows Cu2O isthe dominant phase, Fig. 10(b). Fig. 10(c) shows the spectrumrecorded on the green deposit formed on the electrode exposedto simulated groundwater solution exhibits several bands charac-teristic of atacamite [34,36,38] in the wave number range 3310–3445 cm�1. No atacamite was detected on the electrode exposedto the slurry. This would be consistent with the much lower longterm corrosion rate indicated by the EIS measurements and maybe attributed to the quick consumption of O2 in the slurry. In addi-tion any Cu2+ formed while oxidising conditions still prevailed is
most likely to have been transported from the electrode surfaceand absorbed by cation exchange on the clay particles [1].
3.3.4. Reaction mechanismThe corrosion of Cu in Cl� solutions is known to be accelerated
in aerated solutions [39] and to involve the general reactions
Cuþ xCl� ! CuClð1�xÞ�x þ e� ðAnodic reactionÞ ð1Þ
O2 þ 2H2Oþ 4e� ! 4OH� ðCathodic reactionÞ ð2Þ
In the absence of significant amounts of Cl the anodic reactionproceeds via a (CuOH)ads species leading generally to the formationof the stable corrosion product, Cu2O [39–41]. However, in theneutral chloride solution employed in this study the initial stagesof film formation involve a competition between Cl� and OH� forsurface sites [1,25],
CuClads þ OH� $ CuðOHÞads þ Cl� ð3Þ
and Cu2O is subsequently formed
2CuðOHÞads ! Cu2OþH2O ð4Þ
The extent of Cu2O formation will depend on the relative Cl�
and OH� concentrations with higher pH favouring its formation.Since its solubility product is high (1.72 � 10�7) [42], the CuCl is
soluble and dissolves via Cl� complexation, a reaction that can be
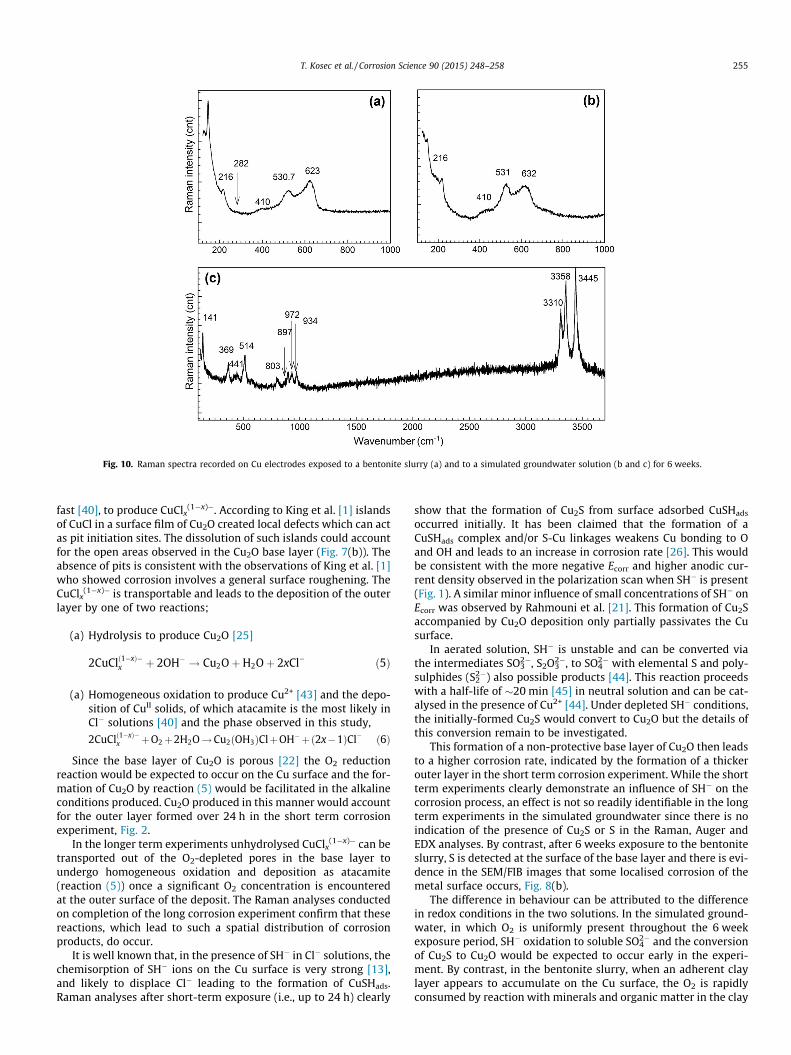
Fig. 10. Raman spectra recorded on Cu electrodes exposed to a bentonite slurry (a) and to a simulated groundwater solution (b and c) for 6 weeks.
T. Kosec et al. / Corrosion Science 90 (2015) 248–258 255
fast [40], to produce CuClx(1�x)�. According to King et al. [1] islands
of CuCl in a surface film of Cu2O created local defects which can actas pit initiation sites. The dissolution of such islands could accountfor the open areas observed in the Cu2O base layer (Fig. 7(b)). Theabsence of pits is consistent with the observations of King et al. [1]who showed corrosion involves a general surface roughening. TheCuClx
(1�x)� is transportable and leads to the deposition of the outerlayer by one of two reactions;
(a) Hydrolysis to produce Cu2O [25]
ð1�xÞ� � �
2CuClx þ 2OH ! Cu2OþH2Oþ 2xCl ð5Þ(a) Homogeneous oxidation to produce Cu2+ [43] and the depo-sition of CuII solids, of which atacamite is the most likely inCl� solutions [40] and the phase observed in this study,
2CuClð1�xÞ�x þO2þ2H2O!Cu2ðOH3ÞClþOH� þð2x�1ÞCl� ð6Þ
Since the base layer of Cu2O is porous [22] the O2 reductionreaction would be expected to occur on the Cu surface and the for-mation of Cu2O by reaction (5) would be facilitated in the alkalineconditions produced. Cu2O produced in this manner would accountfor the outer layer formed over 24 h in the short term corrosionexperiment, Fig. 2.
In the longer term experiments unhydrolysed CuClx(1�x)� can be
transported out of the O2-depleted pores in the base layer toundergo homogeneous oxidation and deposition as atacamite(reaction (5)) once a significant O2 concentration is encounteredat the outer surface of the deposit. The Raman analyses conductedon completion of the long corrosion experiment confirm that thesereactions, which lead to such a spatial distribution of corrosionproducts, do occur.
It is well known that, in the presence of SH� in Cl� solutions, thechemisorption of SH� ions on the Cu surface is very strong [13],and likely to displace Cl� leading to the formation of CuSHads.Raman analyses after short-term exposure (i.e., up to 24 h) clearly
show that the formation of Cu2S from surface adsorbed CuSHads
occurred initially. It has been claimed that the formation of aCuSHads complex and/or S-Cu linkages weakens Cu bonding to Oand OH and leads to an increase in corrosion rate [26]. This wouldbe consistent with the more negative Ecorr and higher anodic cur-rent density observed in the polarization scan when SH� is present(Fig. 1). A similar minor influence of small concentrations of SH� onEcorr was observed by Rahmouni et al. [21]. This formation of Cu2Saccompanied by Cu2O deposition only partially passivates the Cusurface.
In aerated solution, SH� is unstable and can be converted viathe intermediates SO3
2�, S2O32�, to SO4
2� with elemental S and poly-sulphides (S2
2�) also possible products [44]. This reaction proceedswith a half-life of �20 min [45] in neutral solution and can be cat-alysed in the presence of Cu2+ [44]. Under depleted SH� conditions,the initially-formed Cu2S would convert to Cu2O but the details ofthis conversion remain to be investigated.
This formation of a non-protective base layer of Cu2O then leadsto a higher corrosion rate, indicated by the formation of a thickerouter layer in the short term corrosion experiment. While the shortterm experiments clearly demonstrate an influence of SH� on thecorrosion process, an effect is not so readily identifiable in the longterm experiments in the simulated groundwater since there is noindication of the presence of Cu2S or S in the Raman, Auger andEDX analyses. By contrast, after 6 weeks exposure to the bentoniteslurry, S is detected at the surface of the base layer and there is evi-dence in the SEM/FIB images that some localised corrosion of themetal surface occurs, Fig. 8(b).
The difference in behaviour can be attributed to the differencein redox conditions in the two solutions. In the simulated ground-water, in which O2 is uniformly present throughout the 6 weekexposure period, SH� oxidation to soluble SO4
2� and the conversionof Cu2S to Cu2O would be expected to occur early in the experi-ment. By contrast, in the bentonite slurry, when an adherent claylayer appears to accumulate on the Cu surface, the O2 is rapidlyconsumed by reaction with minerals and organic matter in the clay
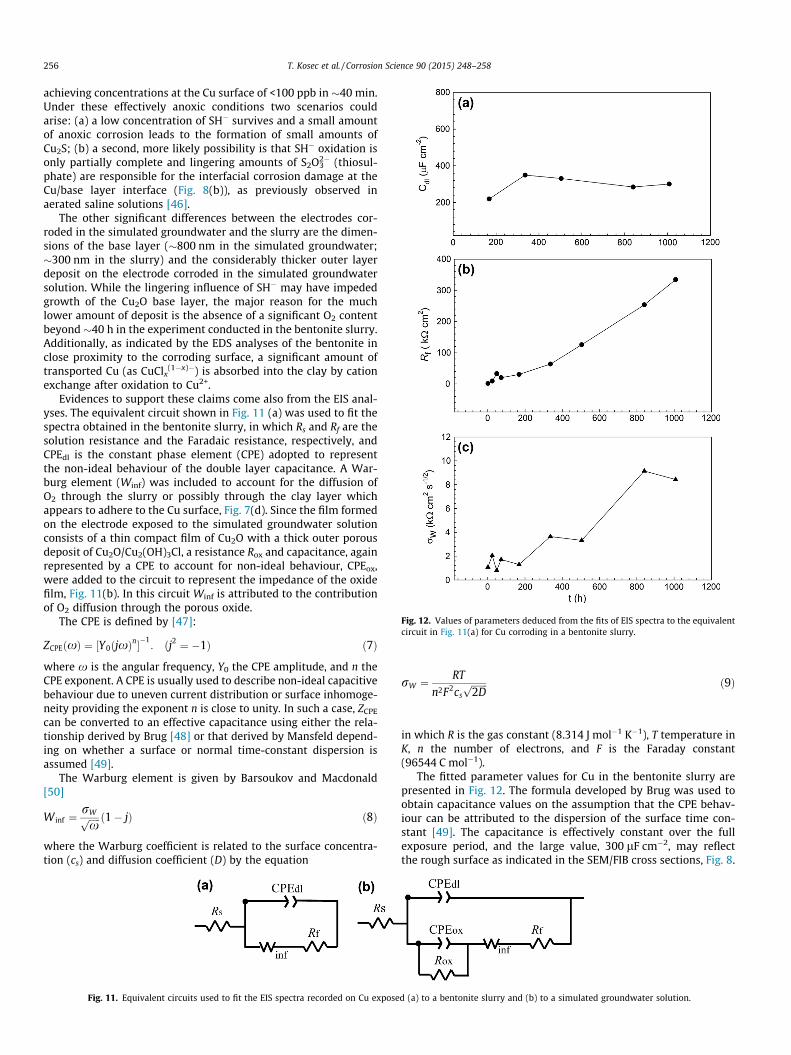
Fig. 12. Values of parameters deduced from the fits of EIS spectra to the equivalentcircuit in Fig. 11(a) for Cu corroding in a bentonite slurry.
256 T. Kosec et al. / Corrosion Science 90 (2015) 248–258
achieving concentrations at the Cu surface of <100 ppb in �40 min.Under these effectively anoxic conditions two scenarios couldarise: (a) a low concentration of SH� survives and a small amountof anoxic corrosion leads to the formation of small amounts ofCu2S; (b) a second, more likely possibility is that SH� oxidation isonly partially complete and lingering amounts of S2O3
2� (thiosul-phate) are responsible for the interfacial corrosion damage at theCu/base layer interface (Fig. 8(b)), as previously observed inaerated saline solutions [46].
The other significant differences between the electrodes cor-roded in the simulated groundwater and the slurry are the dimen-sions of the base layer (�800 nm in the simulated groundwater;�300 nm in the slurry) and the considerably thicker outer layerdeposit on the electrode corroded in the simulated groundwatersolution. While the lingering influence of SH� may have impededgrowth of the Cu2O base layer, the major reason for the muchlower amount of deposit is the absence of a significant O2 contentbeyond �40 h in the experiment conducted in the bentonite slurry.Additionally, as indicated by the EDS analyses of the bentonite inclose proximity to the corroding surface, a significant amount oftransported Cu (as CuClx
(1�x)�) is absorbed into the clay by cationexchange after oxidation to Cu2+.
Evidences to support these claims come also from the EIS anal-yses. The equivalent circuit shown in Fig. 11 (a) was used to fit thespectra obtained in the bentonite slurry, in which Rs and Rf are thesolution resistance and the Faradaic resistance, respectively, andCPEdl is the constant phase element (CPE) adopted to representthe non-ideal behaviour of the double layer capacitance. A War-burg element (Winf) was included to account for the diffusion ofO2 through the slurry or possibly through the clay layer whichappears to adhere to the Cu surface, Fig. 7(d). Since the film formedon the electrode exposed to the simulated groundwater solutionconsists of a thin compact film of Cu2O with a thick outer porousdeposit of Cu2O/Cu2(OH)3Cl, a resistance Rox and capacitance, againrepresented by a CPE to account for non-ideal behaviour, CPEox,were added to the circuit to represent the impedance of the oxidefilm, Fig. 11(b). In this circuit Winf is attributed to the contributionof O2 diffusion through the porous oxide.
The CPE is defined by [47]:
ZCPEðxÞ ¼ ½Y0ðjxÞn��1: ðj2 ¼ �1Þ ð7Þ
where x is the angular frequency, Y0 the CPE amplitude, and n theCPE exponent. A CPE is usually used to describe non-ideal capacitivebehaviour due to uneven current distribution or surface inhomoge-neity providing the exponent n is close to unity. In such a case, ZCPE
can be converted to an effective capacitance using either the rela-tionship derived by Brug [48] or that derived by Mansfeld depend-ing on whether a surface or normal time-constant dispersion isassumed [49].
The Warburg element is given by Barsoukov and Macdonald[50]
W inf ¼rWffiffiffiffiffi
xp ð1� jÞ ð8Þ
where the Warburg coefficient is related to the surface concentra-tion (cs) and diffusion coefficient (D) by the equation
Fig. 11. Equivalent circuits used to fit the EIS spectra recorded on Cu expose
rW ¼RT
n2F2cs
ffiffiffiffiffiffiffi
2Dp ð9Þ
in which R is the gas constant (8.314 J mol�1 K�1), T temperature inK, n the number of electrons, and F is the Faraday constant(96544 C mol�1).
The fitted parameter values for Cu in the bentonite slurry arepresented in Fig. 12. The formula developed by Brug was used toobtain capacitance values on the assumption that the CPE behav-iour can be attributed to the dispersion of the surface time con-stant [49]. The capacitance is effectively constant over the fullexposure period, and the large value, 300 lF cm�2, may reflectthe rough surface as indicated in the SEM/FIB cross sections, Fig. 8.
d (a) to a bentonite slurry and (b) to a simulated groundwater solution.
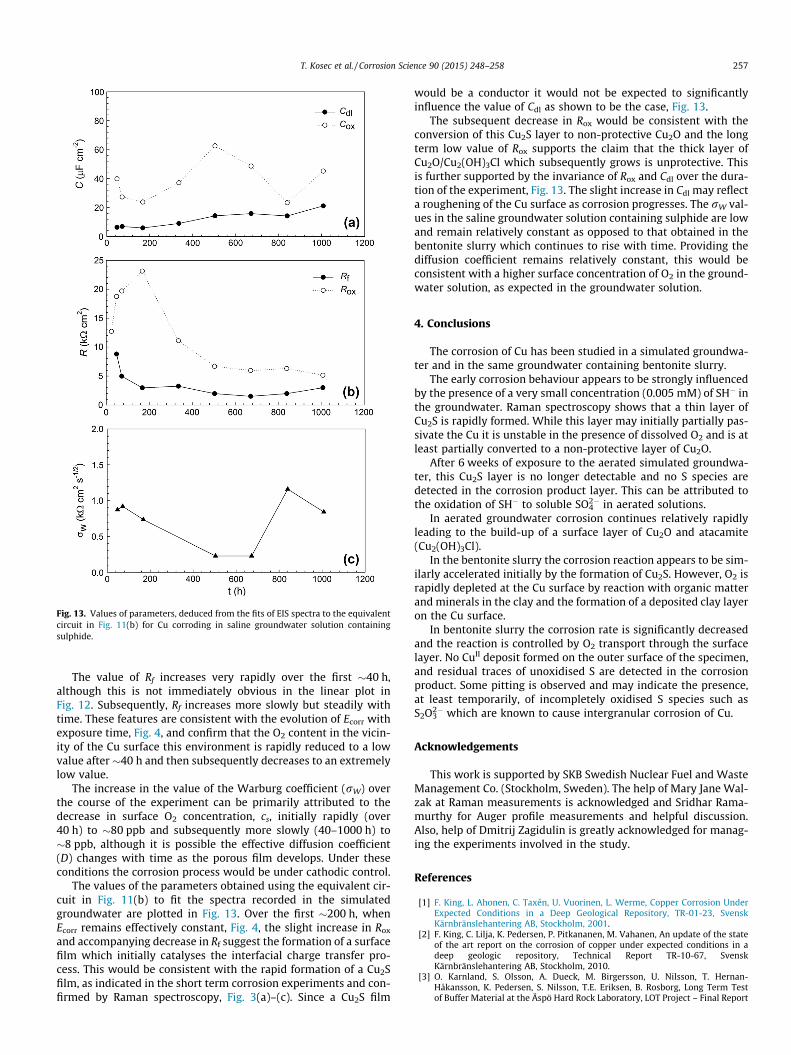
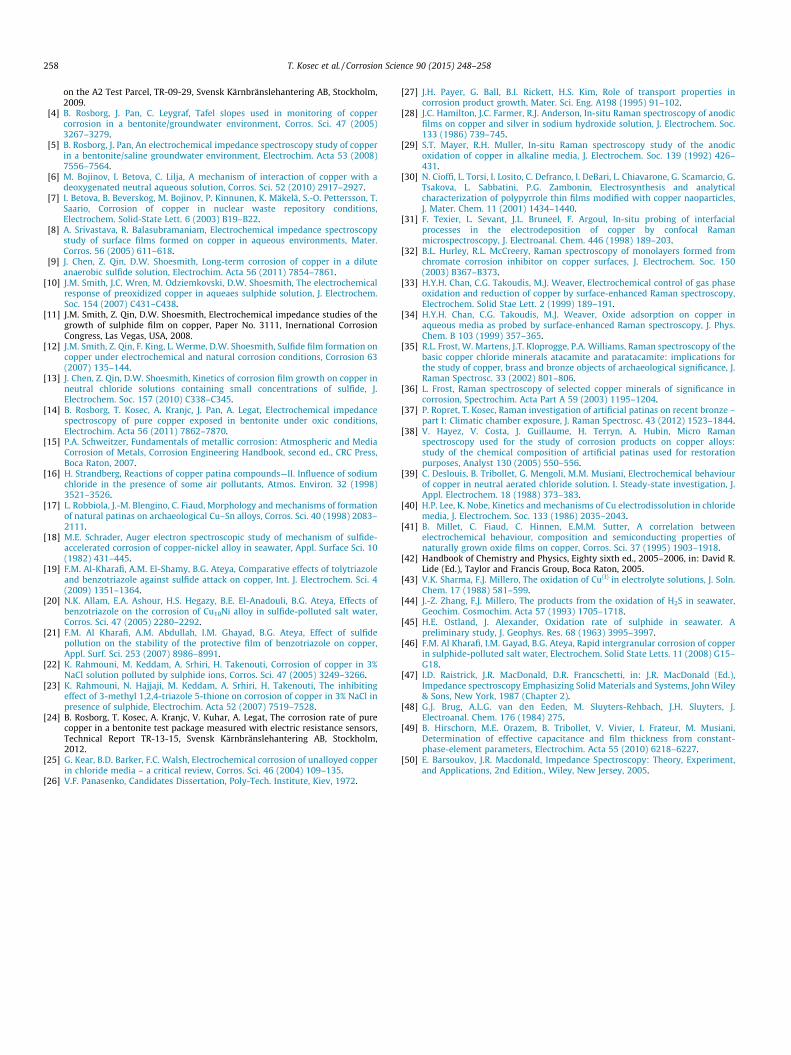
Fig. 13. Values of parameters, deduced from the fits of EIS spectra to the equivalentcircuit in Fig. 11(b) for Cu corroding in saline groundwater solution containingsulphide.
T. Kosec et al. / Corrosion Science 90 (2015) 248–258 257
The value of Rf increases very rapidly over the first �40 h,although this is not immediately obvious in the linear plot inFig. 12. Subsequently, Rf increases more slowly but steadily withtime. These features are consistent with the evolution of Ecorr withexposure time, Fig. 4, and confirm that the O2 content in the vicin-ity of the Cu surface this environment is rapidly reduced to a lowvalue after �40 h and then subsequently decreases to an extremelylow value.
The increase in the value of the Warburg coefficient (rW) overthe course of the experiment can be primarily attributed to thedecrease in surface O2 concentration, cs, initially rapidly (over40 h) to �80 ppb and subsequently more slowly (40–1000 h) to�8 ppb, although it is possible the effective diffusion coefficient(D) changes with time as the porous film develops. Under theseconditions the corrosion process would be under cathodic control.
The values of the parameters obtained using the equivalent cir-cuit in Fig. 11(b) to fit the spectra recorded in the simulatedgroundwater are plotted in Fig. 13. Over the first �200 h, whenEcorr remains effectively constant, Fig. 4, the slight increase in Rox
and accompanying decrease in Rf suggest the formation of a surfacefilm which initially catalyses the interfacial charge transfer pro-cess. This would be consistent with the rapid formation of a Cu2Sfilm, as indicated in the short term corrosion experiments and con-firmed by Raman spectroscopy, Fig. 3(a)–(c). Since a Cu2S film
would be a conductor it would not be expected to significantlyinfluence the value of Cdl as shown to be the case, Fig. 13.
The subsequent decrease in Rox would be consistent with theconversion of this Cu2S layer to non-protective Cu2O and the longterm low value of Rox supports the claim that the thick layer ofCu2O/Cu2(OH)3Cl which subsequently grows is unprotective. Thisis further supported by the invariance of Rox and Cdl over the dura-tion of the experiment, Fig. 13. The slight increase in Cdl may reflecta roughening of the Cu surface as corrosion progresses. The rW val-ues in the saline groundwater solution containing sulphide are lowand remain relatively constant as opposed to that obtained in thebentonite slurry which continues to rise with time. Providing thediffusion coefficient remains relatively constant, this would beconsistent with a higher surface concentration of O2 in the ground-water solution, as expected in the groundwater solution.
4. Conclusions
The corrosion of Cu has been studied in a simulated groundwa-ter and in the same groundwater containing bentonite slurry.
The early corrosion behaviour appears to be strongly influencedby the presence of a very small concentration (0.005 mM) of SH� inthe groundwater. Raman spectroscopy shows that a thin layer ofCu2S is rapidly formed. While this layer may initially partially pas-sivate the Cu it is unstable in the presence of dissolved O2 and is atleast partially converted to a non-protective layer of Cu2O.
After 6 weeks of exposure to the aerated simulated groundwa-ter, this Cu2S layer is no longer detectable and no S species aredetected in the corrosion product layer. This can be attributed tothe oxidation of SH� to soluble SO4
2� in aerated solutions.In aerated groundwater corrosion continues relatively rapidly
leading to the build-up of a surface layer of Cu2O and atacamite(Cu2(OH)3Cl).
In the bentonite slurry the corrosion reaction appears to be sim-ilarly accelerated initially by the formation of Cu2S. However, O2 israpidly depleted at the Cu surface by reaction with organic matterand minerals in the clay and the formation of a deposited clay layeron the Cu surface.
In bentonite slurry the corrosion rate is significantly decreasedand the reaction is controlled by O2 transport through the surfacelayer. No CuII deposit formed on the outer surface of the specimen,and residual traces of unoxidised S are detected in the corrosionproduct. Some pitting is observed and may indicate the presence,at least temporarily, of incompletely oxidised S species such asS2O3
2� which are known to cause intergranular corrosion of Cu.
Acknowledgements
This work is supported by SKB Swedish Nuclear Fuel and WasteManagement Co. (Stockholm, Sweden). The help of Mary Jane Wal-zak at Raman measurements is acknowledged and Sridhar Rama-murthy for Auger profile measurements and helpful discussion.Also, help of Dmitrij Zagidulin is greatly acknowledged for manag-ing the experiments involved in the study.
References
[1] F. King, L. Ahonen, C. Taxén, U. Vuorinen, L. Werme, Copper Corrosion UnderExpected Conditions in a Deep Geological Repository, TR-01-23, SvenskKärnbränslehantering AB, Stockholm, 2001.
[2] F. King, C. Lilja, K. Pedersen, P. Pitkananen, M. Vahanen, An update of the stateof the art report on the corrosion of copper under expected conditions in adeep geologic repository, Technical Report TR-10-67, SvenskKärnbränslehantering AB, Stockholm, 2010.
[3] O. Karnland, S. Olsson, A. Dueck, M. Birgersson, U. Nilsson, T. Hernan-Håkansson, K. Pedersen, S. Nilsson, T.E. Eriksen, B. Rosborg, Long Term Testof Buffer Material at the Äspö Hard Rock Laboratory, LOT Project – Final Report
258 T. Kosec et al. / Corrosion Science 90 (2015) 248–258
on the A2 Test Parcel, TR-09-29, Svensk Kärnbränslehantering AB, Stockholm,2009.
[4] B. Rosborg, J. Pan, C. Leygraf, Tafel slopes used in monitoring of coppercorrosion in a bentonite/groundwater environment, Corros. Sci. 47 (2005)3267–3279.
[5] B. Rosborg, J. Pan, An electrochemical impedance spectroscopy study of copperin a bentonite/saline groundwater environment, Electrochim. Acta 53 (2008)7556–7564.
[6] M. Bojinov, I. Betova, C. Lilja, A mechanism of interaction of copper with adeoxygenated neutral aqueous solution, Corros. Sci. 52 (2010) 2917–2927.
[7] I. Betova, B. Beverskog, M. Bojinov, P. Kinnunen, K. Mäkelä, S.-O. Pettersson, T.Saario, Corrosion of copper in nuclear waste repository conditions,Electrochem. Solid-State Lett. 6 (2003) B19–B22.
[8] A. Srivastava, R. Balasubramaniam, Electrochemical impedance spectroscopystudy of surface films formed on copper in aqueous environments, Mater.Corros. 56 (2005) 611–618.
[9] J. Chen, Z. Qin, D.W. Shoesmith, Long-term corrosion of copper in a diluteanaerobic sulfide solution, Electrochim. Acta 56 (2011) 7854–7861.
[10] J.M. Smith, J.C. Wren, M. Odziemkovski, D.W. Shoesmith, The electrochemicalresponse of preoxidized copper in aqueaes sulphide solution, J. Electrochem.Soc. 154 (2007) C431–C438.
[11] J.M. Smith, Z. Qin, D.W. Shoesmith, Electrochemical impedance studies of thegrowth of sulphide film on copper, Paper No. 3111, Inernational CorrosionCongress, Las Vegas, USA, 2008.
[12] J.M. Smith, Z. Qin, F. King, L. Werme, D.W. Shoesmith, Sulfide film formation oncopper under electrochemical and natural corrosion conditions, Corrosion 63(2007) 135–144.
[13] J. Chen, Z. Qin, D.W. Shoesmith, Kinetics of corrosion film growth on copper inneutral chloride solutions containing small concentrations of sulfide, J.Electrochem. Soc. 157 (2010) C338–C345.
[14] B. Rosborg, T. Kosec, A. Kranjc, J. Pan, A. Legat, Electrochemical impedancespectroscopy of pure copper exposed in bentonite under oxic conditions,Electrochim. Acta 56 (2011) 7862–7870.
[15] P.A. Schweitzer, Fundamentals of metallic corrosion: Atmospheric and MediaCorrosion of Metals, Corrosion Engineering Handbook, second ed., CRC Press,Boca Raton, 2007.
[16] H. Strandberg, Reactions of copper patina compounds—II. Influence of sodiumchloride in the presence of some air pollutants, Atmos. Environ. 32 (1998)3521–3526.
[17] L. Robbiola, J.-M. Blengino, C. Fiaud, Morphology and mechanisms of formationof natural patinas on archaeological Cu–Sn alloys, Corros. Sci. 40 (1998) 2083–2111.
[18] M.E. Schrader, Auger electron spectroscopic study of mechanism of sulfide-accelerated corrosion of copper-nickel alloy in seawater, Appl. Surface Sci. 10(1982) 431–445.
[19] F.M. Al-Kharafi, A.M. El-Shamy, B.G. Ateya, Comparative effects of tolytriazoleand benzotriazole against sulfide attack on copper, Int. J. Electrochem. Sci. 4(2009) 1351–1364.
[20] N.K. Allam, E.A. Ashour, H.S. Hegazy, B.E. El-Anadouli, B.G. Ateya, Effects ofbenzotriazole on the corrosion of Cu10Ni alloy in sulfide-polluted salt water,Corros. Sci. 47 (2005) 2280–2292.
[21] F.M. Al Kharafi, A.M. Abdullah, I.M. Ghayad, B.G. Ateya, Effect of sulfidepollution on the stability of the protective film of benzotriazole on copper,Appl. Surf. Sci. 253 (2007) 8986–8991.
[22] K. Rahmouni, M. Keddam, A. Srhiri, H. Takenouti, Corrosion of copper in 3%NaCl solution polluted by sulphide ions, Corros. Sci. 47 (2005) 3249–3266.
[23] K. Rahmouni, N. Hajjaji, M. Keddam, A. Srhiri, H. Takenouti, The inhibitingeffect of 3-methyl 1,2,4-triazole 5-thione on corrosion of copper in 3% NaCl inpresence of sulphide, Electrochim. Acta 52 (2007) 7519–7528.
[24] B. Rosborg, T. Kosec, A. Kranjc, V. Kuhar, A. Legat, The corrosion rate of purecopper in a bentonite test package measured with electric resistance sensors,Technical Report TR-13-15, Svensk Kärnbränslehantering AB, Stockholm,2012.
[25] G. Kear, B.D. Barker, F.C. Walsh, Electrochemical corrosion of unalloyed copperin chloride media – a critical review, Corros. Sci. 46 (2004) 109–135.
[26] V.F. Panasenko, Candidates Dissertation, Poly-Tech. Institute, Kiev, 1972.
[27] J.H. Payer, G. Ball, B.I. Rickett, H.S. Kim, Role of transport properties incorrosion product growth, Mater. Sci. Eng. A198 (1995) 91–102.
[28] J.C. Hamilton, J.C. Farmer, R.J. Anderson, In-situ Raman spectroscopy of anodicfilms on copper and silver in sodium hydroxide solution, J. Electrochem. Soc.133 (1986) 739–745.
[29] S.T. Mayer, R.H. Muller, In-situ Raman spectroscopy study of the anodicoxidation of copper in alkaline media, J. Electrochem. Soc. 139 (1992) 426–431.
[30] N. Cioffi, L. Torsi, I. Losito, C. Defranco, I. DeBari, L. Chiavarone, G. Scamarcio, G.Tsakova, L. Sabbatini, P.G. Zambonin, Electrosynthesis and analyticalcharacterization of polypyrrole thin films modified with copper naoparticles,J. Mater. Chem. 11 (2001) 1434–1440.
[31] F. Texier, L. Sevant, J.L. Bruneel, F. Argoul, In-situ probing of interfacialprocesses in the electrodeposition of copper by confocal Ramanmicrospectroscopy, J. Electroanal. Chem. 446 (1998) 189–203.
[32] B.L. Hurley, R.L. McCreery, Raman spectroscopy of monolayers formed fromchromate corrosion inhibitor on copper surfaces, J. Electrochem. Soc. 150(2003) B367–B373.
[33] H.Y.H. Chan, C.G. Takoudis, M.J. Weaver, Electrochemical control of gas phaseoxidation and reduction of copper by surface-enhanced Raman spectroscopy,Electrochem. Solid Stae Lett. 2 (1999) 189–191.
[34] H.Y.H. Chan, C.G. Takoudis, M.J. Weaver, Oxide adsorption on copper inaqueous media as probed by surface-enhanced Raman spectroscopy, J. Phys.Chem. B 103 (1999) 357–365.
[35] R.L. Frost, W. Martens, J.T. Kloprogge, P.A. Williams, Raman spectroscopy of thebasic copper chloride minerals atacamite and paratacamite: implications forthe study of copper, brass and bronze objects of archaeological significance, J.Raman Spectrosc. 33 (2002) 801–806.
[36] L. Frost, Raman spectroscopy of selected copper minerals of significance incorrosion, Spectrochim. Acta Part A 59 (2003) 1195–1204.
[37] P. Ropret, T. Kosec, Raman investigation of artificial patinas on recent bronze –part I: Climatic chamber exposure, J. Raman Spectrosc. 43 (2012) 1523–1844.
[38] V. Hayez, V. Costa, J. Guillaume, H. Terryn, A. Hubin, Micro Ramanspectroscopy used for the study of corrosion products on copper alloys:study of the chemical composition of artificial patinas used for restorationpurposes, Analyst 130 (2005) 550–556.
[39] C. Deslouis, B. Tribollet, G. Mengoli, M.M. Musiani, Electrochemical behaviourof copper in neutral aerated chloride solution. I. Steady-state investigation, J.Appl. Electrochem. 18 (1988) 373–383.
[40] H.P. Lee, K. Nobe, Kinetics and mechanisms of Cu electrodissolution in chloridemedia, J. Electrochem. Soc. 133 (1986) 2035–2043.
[41] B. Millet, C. Fiaud, C. Hinnen, E.M.M. Sutter, A correlation betweenelectrochemical behaviour, composition and semiconducting properties ofnaturally grown oxide films on copper, Corros. Sci. 37 (1995) 1903–1918.
[42] Handbook of Chemistry and Physics, Eighty sixth ed., 2005–2006, in: David R.Lide (Ed.), Taylor and Francis Group, Boca Raton, 2005.
[43] V.K. Sharma, F.J. Millero, The oxidation of Cu(I) in electrolyte solutions, J. Soln.Chem. 17 (1988) 581–599.
[44] J.-Z. Zhang, F.J. Millero, The products from the oxidation of H2S in seawater,Geochim. Cosmochim. Acta 57 (1993) 1705–1718.
[45] H.E. Ostland, J. Alexander, Oxidation rate of sulphide in seawater. Apreliminary study, J. Geophys. Res. 68 (1963) 3995–3997.
[46] F.M. Al Kharafi, I.M. Gayad, B.G. Ateya, Rapid intergranular corrosion of copperin sulphide-polluted salt water, Electrochem. Solid State Letts. 11 (2008) G15–G18.
[47] I.D. Raistrick, J.R. MacDonald, D.R. Francschetti, in: J.R. MacDonald (Ed.),Impedance spectroscopy Emphasizing Solid Materials and Systems, John Wiley& Sons, New York, 1987 (Chapter 2).
[48] G.J. Brug, A.L.G. van den Eeden, M. Sluyters-Rehbach, J.H. Sluyters, J.Electroanal. Chem. 176 (1984) 275.
[49] B. Hirschorn, M.E. Orazem, B. Tribollet, V. Vivier, I. Frateur, M. Musiani,Determination of effective capacitance and film thickness from constant-phase-element parameters, Electrochim. Acta 55 (2010) 6218–6227.
[50] E. Barsoukov, J.R. Macdonald, Impedance Spectroscopy: Theory, Experiment,and Applications, 2nd Edition., Wiley, New Jersey, 2005.


