Embed Size (px)
Citation preview
Surfactant Modi�ed Bentonite Characterization:Effects and Comparative AnalysisSamirsinh P Parmar ( [email protected] )
Dharmasinh Desai UniversityBhoomika S Patel
Dharmasinh Desai UniversityAtindra Shukla
Dharmasinh Desai UniversityManish Dixit
Dharmasinh Desai University
Research Article
Keywords: Bentonite clay, expansive soils, swelling pressure, surface modi�cation, physio-chemicalproperties, XRD, BET, Contact angle, surface area
Posted Date: April 12th, 2022
DOI: https://doi.org/10.21203/rs.3.rs-1536012/v1
License: This work is licensed under a Creative Commons Attribution 4.0 International License. Read Full License
Page 1 of 15
Surfactant Modified Bentonite Characterization: Effects and
Comparative Analysis
Samirsinh P Parmar*, Bhoomika S Patel2, Atindra Shukla3, Manish Dixit4
* Dept. of Civil Engg. Dharmasinh Desai University, Nadiad. Mail: [email protected], 2Ph.D. Research Scholar, Marwadi University, Rajkot.Mail: [email protected]
3Director, Shah-Schulman Nano technology and Surface science center, Mail: [email protected] Dharmasinh Desai University, Nadiad, Gujarat, India.
4 Govt. Girls Collage, Seoni Malwa, MP, India.Mail: [email protected]
Abstract Extensive soils can be found all over the world. The clay mineral montmorillonite is predominantly responsible for soil expansion. Because of their ability to shrink and swell with seasonal changes in moisture content, these expansive soils can cause significant damage to engineering construction. To stabilize the effects of swelling soil various ground improvement techniques, incorporate mineralogical modification of clays. The application of nanotechnology increased in past few years to deal with clay minerals as it possesses the same dimensional properties. To understand the behaviour of Nano modified clay, bentonite was selected as it represents the montmorillonite clay mineral. The characterization of surface-treated bentonite by nanomaterial was carried out. The study of physio-chemical properties and textural properties of surface-modified bentonite clay was carried out. Swelling pressure was evaluated by consolidometer test. With the advanced nanotechnology instrumentation technique, particle size analysis, zeta potential, wettability, contact angle, infra-red spectroscopy, rheological properties, BET surface area, pH values, XRD, TGA, etc was carried out for treated and untreated soil, so as to understand the comparative behaviour of surface modification. It was found that by using Nano surfactant, liquid limit and shrinkage limit reduced considerably. The increase in the quantity of surfactant increases the d-spacing. Thermal stability and particle size increase after surface treatment of bentonite clay. Soil reaches a visco-elastic state and BET surface area decreased after surface modification. Key words: Bentonite clay, expansive soils, swelling pressure, surface modification, physio-chemical properties,
XRD, BET, Contact angle, surface area. Abbreviations
USBR United States Bureau of Reclamation
USAEWES United States Army Engineer Waterways Experiment Station
FT Fourier Transformation Infrared
TGA Thermogravimetric Analyzer
QAS Quaternary Ammonium Surfactant
BET Brunauer, Emmett and Teller (used to evaluate the gas adsorption data and generate a specific surface area result expressed in units of area per mass of sample (m2/g).)
G Storage modulus
G'' Loss modulus
Τ Shear stress
XRD XRD X- Ray Diffraction
MMT Montmorillonite
XRD X-ray diffraction
CNS non swelling soil
1. Introduction The three most important groups of clay minerals are montmorillonite, Illite, and kaolinite, which are crystalline hydrous aluminosilicates. Montmorillonite is the clay mineral that presents in most of the expansive soil problems, these types of soils are generally resulting due to weathering of rocks. However, smectite clay minerals become unstable with the increasing age, depth of burial, and digenesis, and alter to mixed-layer, illite-smectite clays, sometimes referred to a K- or meta-bentonites, in which their valuable properties have been largely destroyed. Consequently, pure smectite clay minerals are essentially absent in rocks of the pre-Mesozoic age. Such deposits are of two markedly different types: (i) those resulting from sub-aqueous alteration of fine-grained volcanic ash and (ii) those resulting from in situ hydrothermal alterations of acid volcanic rocks.
Page 2 of 15
2.Review of literature
Taha M.R. & Taha O.M. (2012) made pioneering work to investigate, Influence of nano-material on the expansive and shrinkage soil behaviour. The expansion and shrinkage tests were conducted to investigate the effect of three types of nano-materials (nano-clay, nano alumina, and nano-copper) additive on repressing strains in compacted residual soil mixed with different ratios of bentonite (S1 = 0 % bentonite, S2 = 5 % bentonite, S3 = 10 % bentonite, and S4 = 20 % bentonite). The soil specimens were compacted under the condition of maximum dry unit weight and optimum water content (wopt) using a standard compaction test. The physical and mechanical results of the treated samples were determined. The untreated soil values were used as control points for comparison purposes. It was found that with the addition of the optimum percentage of nano-material, both the swell strain and shrinkage strain reduced. The results show that nano-material decreases the development of desiccation cracks on the surface of compacted samples without a decrease in the hydraulic conductivity. Shukla A.D. (2013) investigated, Controlling Wettability and hydrophobicity of organoclays modified with quaternary ammonium surfactants. The montmorillonite clays were modified with quaternary ammonium salts (QASs) having different alkyl chain lengths and a benzyl substitute group. The modified organoclays were characterized by different analytical techniques. The wettability and hydrophilicity/hydrophobicity of the modified clays was evaluated using water or oil penetration (adsorption) and contact angle measurements. The loading of QASs was in the range of 0.60–0.75mmol/g per clay, irrespective of the type of QAS used for the modification of the clay. From the analytical investigations, it was elucidated that the modification of clay with QAS affected the structural, textural, and surface properties. David a. et al. (2014) made Modification of bentonite by the combination of reactions of acid-activation, silylation, and ionic exchange. Six samples of modified bentonite were prepared: silylated bentonite (S-Bent), acid-activated bentonite (A-Bent), exchanged clay (E-Bent), silylated and acid-activated clay (S–A-Bent), exchanged and acid-activated clay (E–A-Bent), and exchanged, silylated and acid-activated bentonite (E–S–A-Bent). To study the effectiveness of the different treatments, X-ray diffraction analysis, thermogravimetric analysis, Fourier transform infrared spectroscopy and water absorption tests were performed. The silylated bentonite presented a significant reduction in the equilibrium water uptake percentage with respect to the unmodified clay, even when small amounts of silane were incorporated into the clay. On the other hand, no significant changes in the organic content were obtained when the silylation reaction was performed on previously acid-activated bentonite. When a sample of silylated and activated bentonite was further modified by cationic exchange reaction, it was found that the previous treatments allowed increasing the up taken an amount of surfactant cations during the exchange reaction. In fact, the combination of the three treatments (acid activation, silylation, and cationic exchange) gave place to the modified bentonite with the biggest basal spacing and the lower equilibrium water uptake percentage. Sharma R. et al. (2012) X-ray diffraction: a powerful method of characterizing nanomaterials. XRD was used to determine the thickness of thin films, as well as the atomic arrangements in amorphous materials such as polymers. This paper reports the importance of the X-ray diffraction technique for the characterization of nanomaterials. 3. Experimental Investigations
3.1 Materials and methods
Clays Bentonite clay sample was collected from Rajasthan. All the experiments were carried out in raw water and the oil used is n-tetra decane.
Surfactants: Zycosil was obtained from Zydex industries Baroda. Benzalkonium chloride is obtained from S.D. fines industries. Zycosil is esters of silicon, it has a Si-O bond when it combines with soil it forms permanent SiO2bond after the hydrolysis of ester in water in the form of acid.
3.2 Methods for treatment of soil using Zycosil
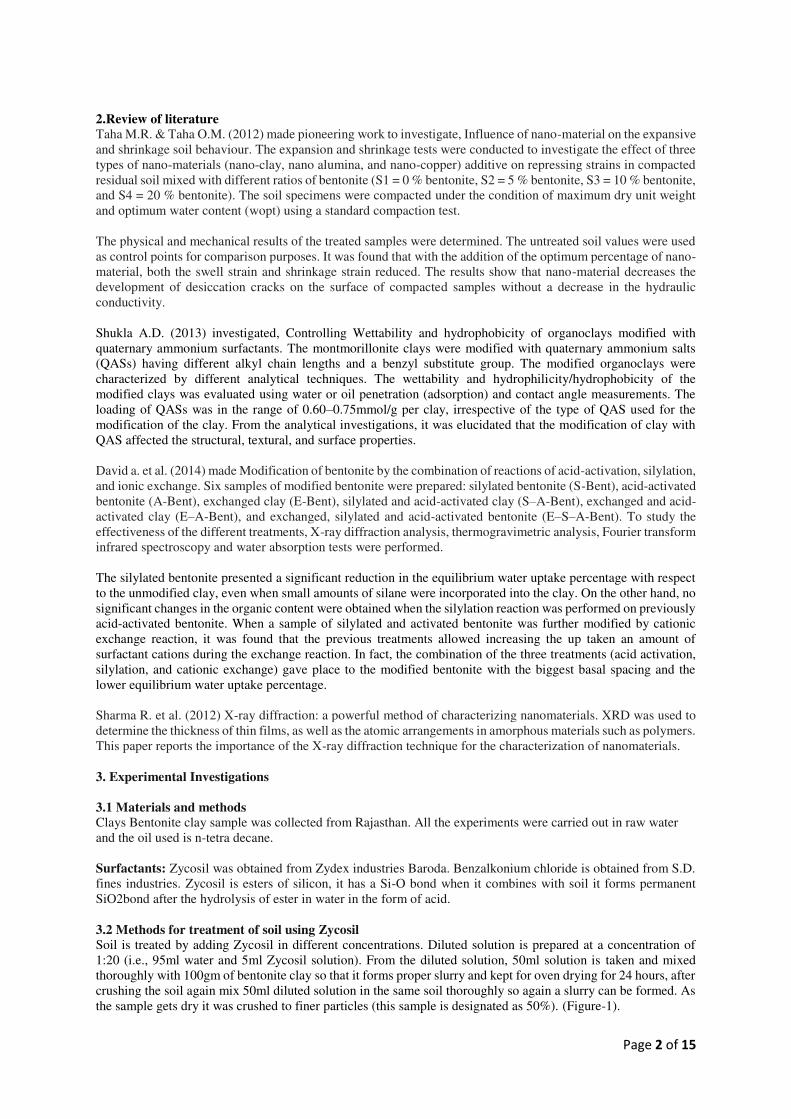
Soil is treated by adding Zycosil in different concentrations. Diluted solution is prepared at a concentration of 1:20 (i.e., 95ml water and 5ml Zycosil solution). From the diluted solution, 50ml solution is taken and mixed thoroughly with 100gm of bentonite clay so that it forms proper slurry and kept for oven drying for 24 hours, after crushing the soil again mix 50ml diluted solution in the same soil thoroughly so again a slurry can be formed. As the sample gets dry it was crushed to finer particles (this sample is designated as 50%). (Figure-1).
Page 3 of 15
Similarly, 50%, 40%and 30% concentration samples were prepared. Using treated soil, which is not totally hydrophobized was targeted to reduce the swelling potential. So, by using different concentrations such as 20% and 15% concentration liquid limit was reduced to a considerable amount but it is not satisfying the IS 9451: 1994 for preparing the CNS layer as the liquid limit was higher than 50% and plasticity index was less than 15%. Hence, a series of soil samples were tried to optimize the sample so that we can prepare the CNS layer and finally the sample was optimized i.e., 40% concentration treating for only one time.
Figure-1 Schematic diagram for Zycosil treated silicates
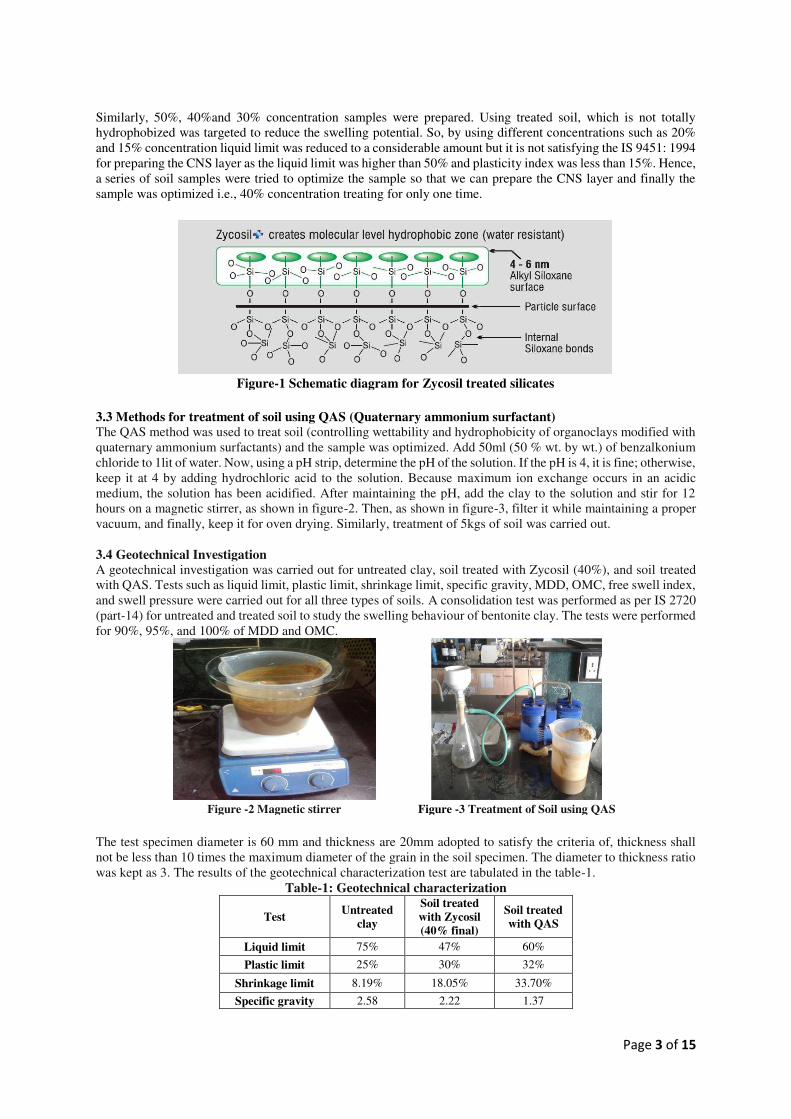
3.3 Methods for treatment of soil using QAS (Quaternary ammonium surfactant) The QAS method was used to treat soil (controlling wettability and hydrophobicity of organoclays modified with quaternary ammonium surfactants) and the sample was optimized. Add 50ml (50 % wt. by wt.) of benzalkonium chloride to 1lit of water. Now, using a pH strip, determine the pH of the solution. If the pH is 4, it is fine; otherwise, keep it at 4 by adding hydrochloric acid to the solution. Because maximum ion exchange occurs in an acidic medium, the solution has been acidified. After maintaining the pH, add the clay to the solution and stir for 12 hours on a magnetic stirrer, as shown in figure-2. Then, as shown in figure-3, filter it while maintaining a proper vacuum, and finally, keep it for oven drying. Similarly, treatment of 5kgs of soil was carried out. 3.4 Geotechnical Investigation
A geotechnical investigation was carried out for untreated clay, soil treated with Zycosil (40%), and soil treated with QAS. Tests such as liquid limit, plastic limit, shrinkage limit, specific gravity, MDD, OMC, free swell index, and swell pressure were carried out for all three types of soils. A consolidation test was performed as per IS 2720 (part-14) for untreated and treated soil to study the swelling behaviour of bentonite clay. The tests were performed for 90%, 95%, and 100% of MDD and OMC.
Figure -2 Magnetic stirrer Figure -3 Treatment of Soil using QAS
The test specimen diameter is 60 mm and thickness are 20mm adopted to satisfy the criteria of, thickness shall not be less than 10 times the maximum diameter of the grain in the soil specimen. The diameter to thickness ratio was kept as 3. The results of the geotechnical characterization test are tabulated in the table-1.
Table-1: Geotechnical characterization
Test Untreated
clay
Soil treated
with Zycosil
(40% final)
Soil treated
with QAS
Liquid limit 75% 47% 60%
Plastic limit 25% 30% 32%
Shrinkage limit 8.19% 18.05% 33.70%
Specific gravity 2.58 2.22 1.37
Page 4 of 15
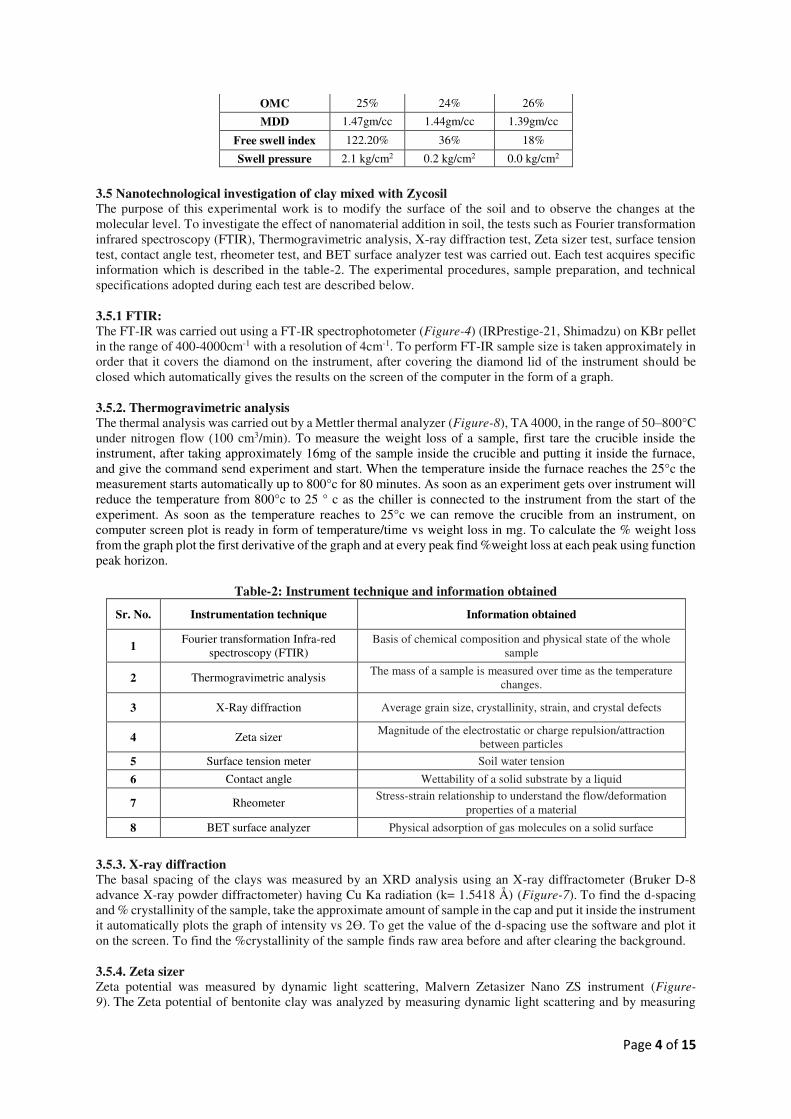
OMC 25% 24% 26%
MDD 1.47gm/cc 1.44gm/cc 1.39gm/cc
Free swell index 122.20% 36% 18%
Swell pressure 2.1 kg/cm2 0.2 kg/cm2 0.0 kg/cm2
3.5 Nanotechnological investigation of clay mixed with Zycosil
The purpose of this experimental work is to modify the surface of the soil and to observe the changes at the molecular level. To investigate the effect of nanomaterial addition in soil, the tests such as Fourier transformation infrared spectroscopy (FTIR), Thermogravimetric analysis, X-ray diffraction test, Zeta sizer test, surface tension test, contact angle test, rheometer test, and BET surface analyzer test was carried out. Each test acquires specific information which is described in the table-2. The experimental procedures, sample preparation, and technical specifications adopted during each test are described below.
3.5.1 FTIR:
The FT-IR was carried out using a FT-IR spectrophotometer (Figure-4) (IRPrestige-21, Shimadzu) on KBr pellet in the range of 400-4000cm-1 with a resolution of 4cm-1. To perform FT-IR sample size is taken approximately in order that it covers the diamond on the instrument, after covering the diamond lid of the instrument should be closed which automatically gives the results on the screen of the computer in the form of a graph.
3.5.2. Thermogravimetric analysis
The thermal analysis was carried out by a Mettler thermal analyzer (Figure-8), TA 4000, in the range of 50–800°C under nitrogen flow (100 cm3/min). To measure the weight loss of a sample, first tare the crucible inside the instrument, after taking approximately 16mg of the sample inside the crucible and putting it inside the furnace, and give the command send experiment and start. When the temperature inside the furnace reaches the 25°c the measurement starts automatically up to 800°c for 80 minutes. As soon as an experiment gets over instrument will reduce the temperature from 800°c to 25 ° c as the chiller is connected to the instrument from the start of the experiment. As soon as the temperature reaches to 25°c we can remove the crucible from an instrument, on computer screen plot is ready in form of temperature/time vs weight loss in mg. To calculate the % weight loss from the graph plot the first derivative of the graph and at every peak find %weight loss at each peak using function peak horizon.
Table-2: Instrument technique and information obtained
Sr. No. Instrumentation technique Information obtained
1 Fourier transformation Infra-red
spectroscopy (FTIR) Basis of chemical composition and physical state of the whole
sample
2 Thermogravimetric analysis The mass of a sample is measured over time as the temperature
changes.
3 X-Ray diffraction Average grain size, crystallinity, strain, and crystal defects
4 Zeta sizer Magnitude of the electrostatic or charge repulsion/attraction
between particles
5 Surface tension meter Soil water tension
6 Contact angle Wettability of a solid substrate by a liquid
7 Rheometer Stress-strain relationship to understand the flow/deformation
properties of a material
8 BET surface analyzer Physical adsorption of gas molecules on a solid surface
3.5.3. X-ray diffraction
The basal spacing of the clays was measured by an XRD analysis using an X-ray diffractometer (Bruker D-8 advance X-ray powder diffractometer) having Cu Ka radiation (k= 1.5418 Å) (Figure-7). To find the d-spacing and % crystallinity of the sample, take the approximate amount of sample in the cap and put it inside the instrument it automatically plots the graph of intensity vs 2ϴ. To get the value of the d-spacing use the software and plot it on the screen. To find the %crystallinity of the sample finds raw area before and after clearing the background.
3.5.4. Zeta sizer
Zeta potential was measured by dynamic light scattering, Malvern Zetasizer Nano ZS instrument (Figure-
9). The Zeta potential of bentonite clay was analyzed by measuring dynamic light scattering and by measuring
Page 5 of 15
the zeta potential of catalyst using zeta sizer (Malvern) by dispersing the clay in water, by using instrument shown in figure 3.9. For measuring zeta potential 0.01 gm of soil was dissolved in 2ml water and is filled in cells with the help of an injection. The cell is directly fitted in instrument and it gives results on a computer screen in the form of a graph.
3.5.5. Surface tension meter
Wettability was measured as water adsorption by a digital penetration meter model DS210 instrument (Figure-5), with a specially designed cylinder of 80mm height and 18.5mm diameter. The same measurement measurements were performed on a force tensiometer model (attention sigma 700, Biolin Scientific) with penetration rate plotted as a change in the mass of the sample per second. Wettability was measured as water adsorption by digital penetration meter instrument, prepared by instrumentation and control department, DDU, with the specially designed cylinder of 80mm height and 18.5mm diameter, plotting changes in sample mass as a function of time in the one-second interval. For preparing sample 2-3gm of the sample was filled in the cylinder and is inserted in the instrument which automatically gives results. For measuring the wettability by using force tensiometer model the same cylinder of diameter 18.5mm and height 18.5mm is filled with 2gm soil sample and is placed in the instrument shown in fig below and it measures the amount of water absorbed in a specific interval of time by capillary rise. Wettability was performed in two mediums water and oil separately.
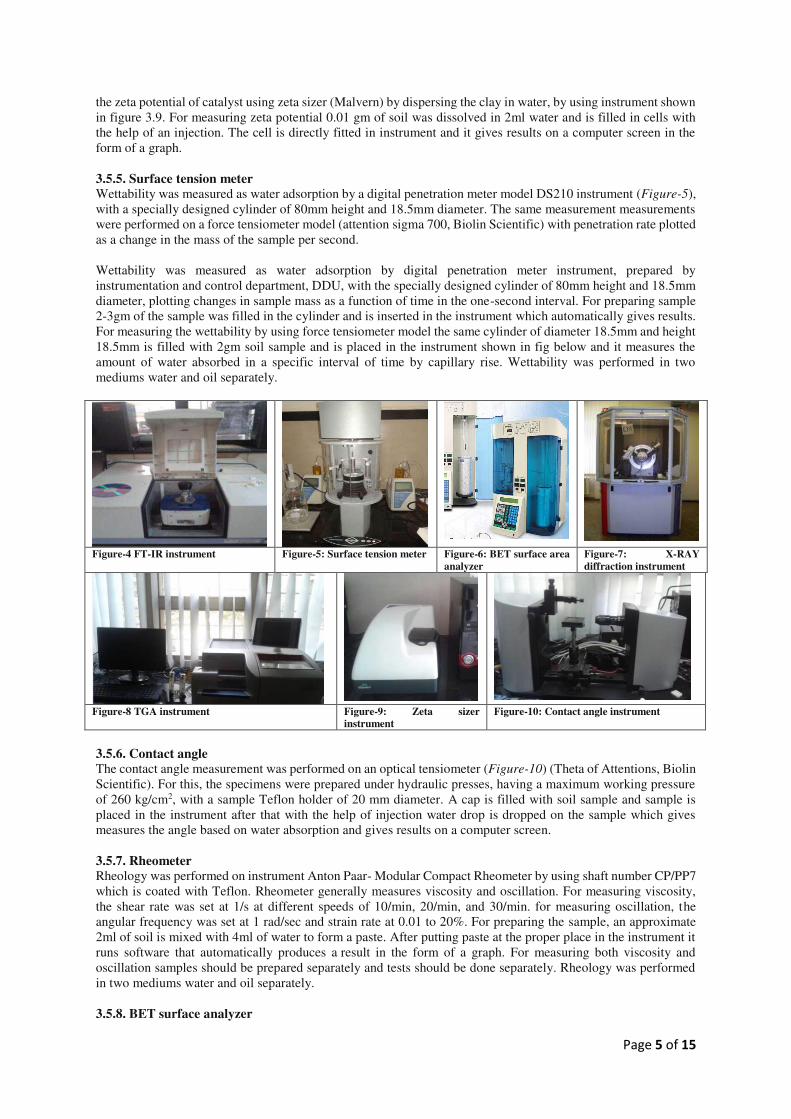
Figure-4 FT-IR instrument Figure-5: Surface tension meter Figure-6: BET surface area
analyzer Figure-7: X-RAY
diffraction instrument
Figure-8 TGA instrument Figure-9: Zeta sizer
instrument Figure-10: Contact angle instrument
3.5.6. Contact angle
The contact angle measurement was performed on an optical tensiometer (Figure-10) (Theta of Attentions, Biolin Scientific). For this, the specimens were prepared under hydraulic presses, having a maximum working pressure of 260 kg/cm2, with a sample Teflon holder of 20 mm diameter. A cap is filled with soil sample and sample is placed in the instrument after that with the help of injection water drop is dropped on the sample which gives measures the angle based on water absorption and gives results on a computer screen. 3.5.7. Rheometer
Rheology was performed on instrument Anton Paar- Modular Compact Rheometer by using shaft number CP/PP7 which is coated with Teflon. Rheometer generally measures viscosity and oscillation. For measuring viscosity, the shear rate was set at 1/s at different speeds of 10/min, 20/min, and 30/min. for measuring oscillation, the angular frequency was set at 1 rad/sec and strain rate at 0.01 to 20%. For preparing the sample, an approximate 2ml of soil is mixed with 4ml of water to form a paste. After putting paste at the proper place in the instrument it runs software that automatically produces a result in the form of a graph. For measuring both viscosity and oscillation samples should be prepared separately and tests should be done separately. Rheology was performed in two mediums water and oil separately. 3.5.8. BET surface analyzer
Page 6 of 15
The BET surface area was measured at five points by N2 adsorption-desorption isotherm using a NOVA1000e surface area analyzer (Figure-6). The BET surface area (activated at 110degree C for 2 hours under vacuum) was determined from nitrogen adsorption data (by using BET equation) measured at 77K using quanta chrome Nova surface area analyzer. 0.14gm of degassed was placed in the sample tube, further the nitrogen adsorption- de adsorption was calculated on the instrument at liquid nitrogen equation. 4. 2 Results of Nanotechnical investigation and discussion
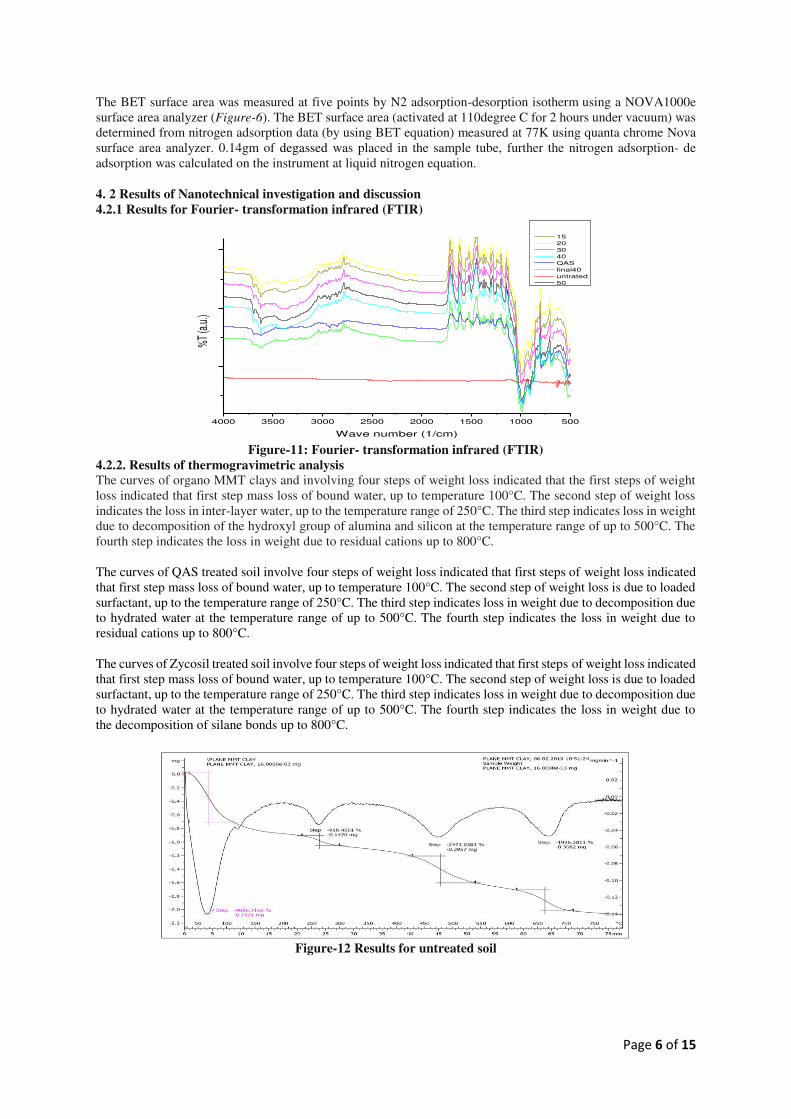
4.2.1 Results for Fourier- transformation infrared (FTIR)
Figure-11: Fourier- transformation infrared (FTIR)
4.2.2. Results of thermogravimetric analysis
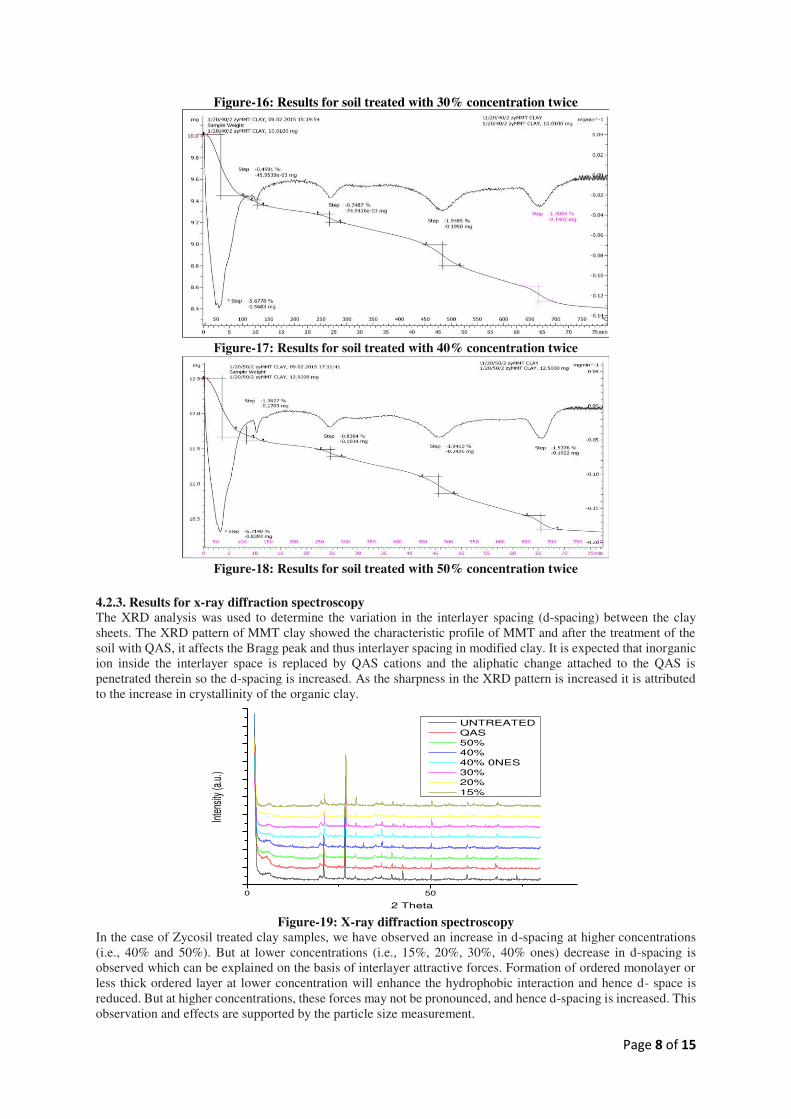
The curves of organo MMT clays and involving four steps of weight loss indicated that the first steps of weight loss indicated that first step mass loss of bound water, up to temperature 100°C. The second step of weight loss indicates the loss in inter-layer water, up to the temperature range of 250°C. The third step indicates loss in weight due to decomposition of the hydroxyl group of alumina and silicon at the temperature range of up to 500°C. The fourth step indicates the loss in weight due to residual cations up to 800°C.
The curves of QAS treated soil involve four steps of weight loss indicated that first steps of weight loss indicated that first step mass loss of bound water, up to temperature 100°C. The second step of weight loss is due to loaded surfactant, up to the temperature range of 250°C. The third step indicates loss in weight due to decomposition due to hydrated water at the temperature range of up to 500°C. The fourth step indicates the loss in weight due to residual cations up to 800°C.
The curves of Zycosil treated soil involve four steps of weight loss indicated that first steps of weight loss indicated that first step mass loss of bound water, up to temperature 100°C. The second step of weight loss is due to loaded surfactant, up to the temperature range of 250°C. The third step indicates loss in weight due to decomposition due to hydrated water at the temperature range of up to 500°C. The fourth step indicates the loss in weight due to the decomposition of silane bonds up to 800°C.
Figure-12 Results for untreated soil
4000 3500 3000 2500 2000 1500 1000 500
%T
(a.u
.)
Wave number (1/cm)
15
20
30
40
QAS
final40
untrated
50
Page 7 of 15
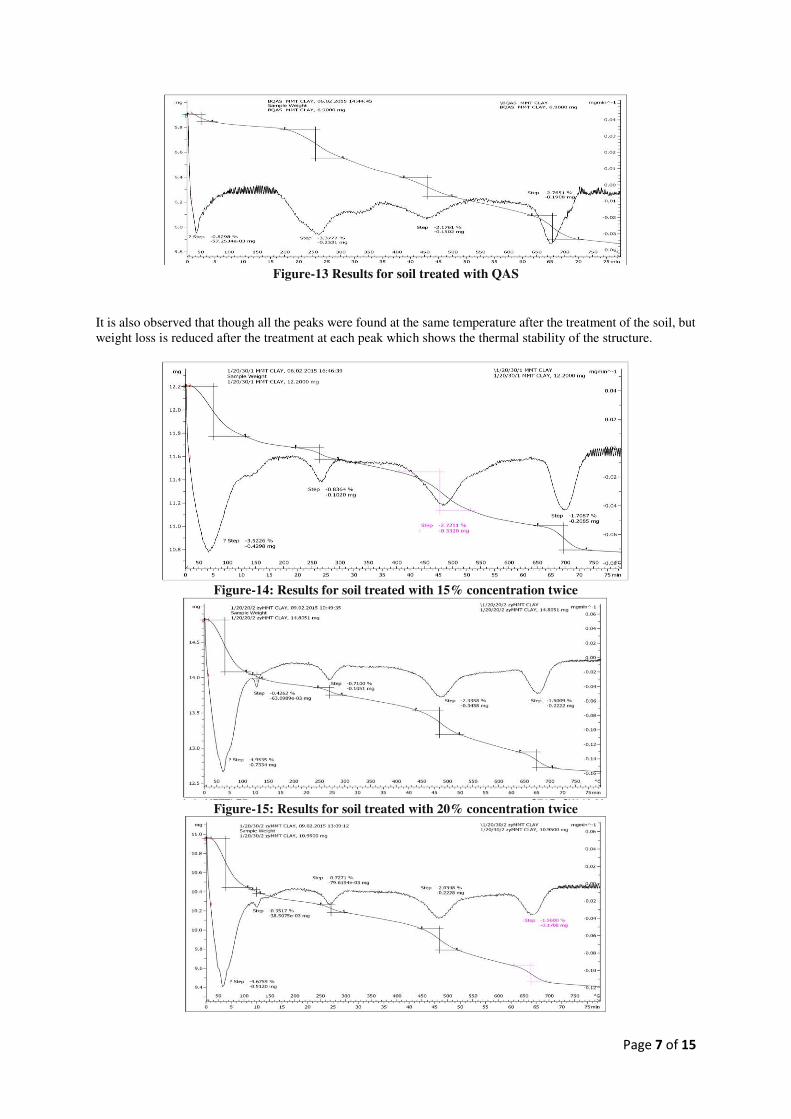
Figure-13 Results for soil treated with QAS
It is also observed that though all the peaks were found at the same temperature after the treatment of the soil, but weight loss is reduced after the treatment at each peak which shows the thermal stability of the structure.
Figure-14: Results for soil treated with 15% concentration twice
Figure-15: Results for soil treated with 20% concentration twice
Page 8 of 15
Figure-16: Results for soil treated with 30% concentration twice
Figure-17: Results for soil treated with 40% concentration twice
Figure-18: Results for soil treated with 50% concentration twice
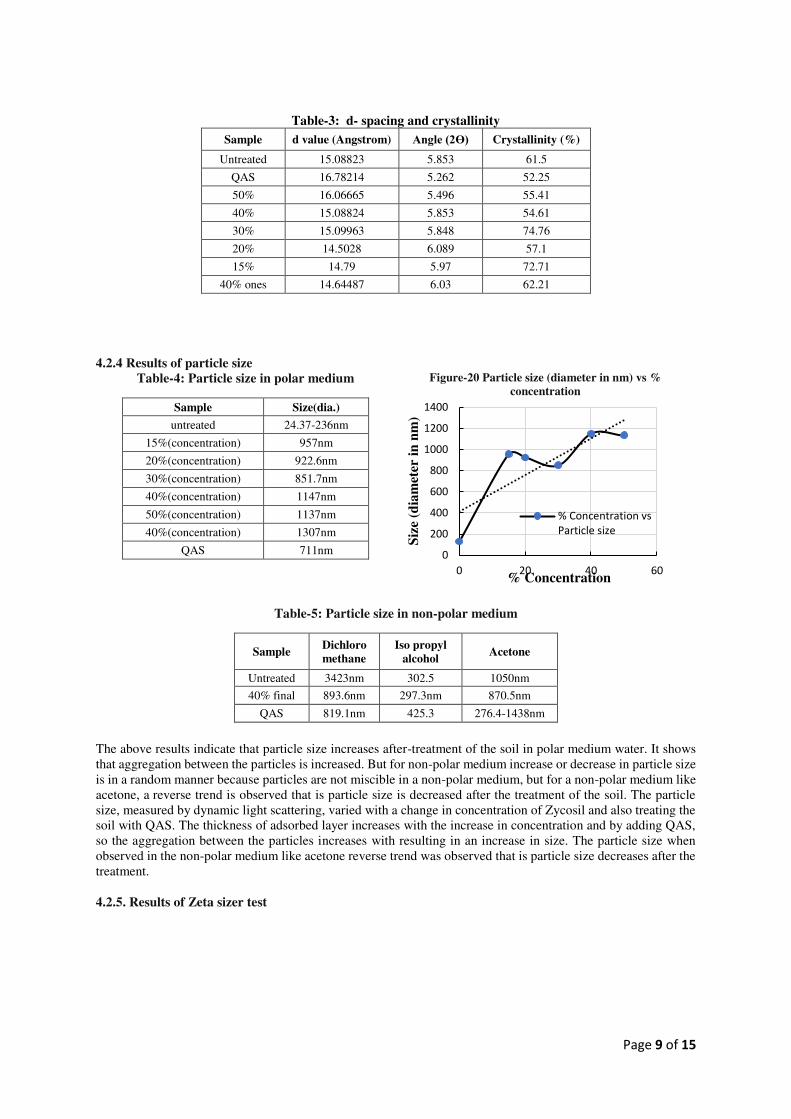
4.2.3. Results for x-ray diffraction spectroscopy
The XRD analysis was used to determine the variation in the interlayer spacing (d-spacing) between the clay sheets. The XRD pattern of MMT clay showed the characteristic profile of MMT and after the treatment of the soil with QAS, it affects the Bragg peak and thus interlayer spacing in modified clay. It is expected that inorganic ion inside the interlayer space is replaced by QAS cations and the aliphatic change attached to the QAS is penetrated therein so the d-spacing is increased. As the sharpness in the XRD pattern is increased it is attributed to the increase in crystallinity of the organic clay.
Figure-19: X-ray diffraction spectroscopy
In the case of Zycosil treated clay samples, we have observed an increase in d-spacing at higher concentrations (i.e., 40% and 50%). But at lower concentrations (i.e., 15%, 20%, 30%, 40% ones) decrease in d-spacing is observed which can be explained on the basis of interlayer attractive forces. Formation of ordered monolayer or less thick ordered layer at lower concentration will enhance the hydrophobic interaction and hence d- space is reduced. But at higher concentrations, these forces may not be pronounced, and hence d-spacing is increased. This observation and effects are supported by the particle size measurement.
0 50
Inte
nsity
(a.u
.)
2 Theta
UNTREATED
QAS
50%
40%
40% 0NES
30%
20%
15%
Page 9 of 15
Table-3: d- spacing and crystallinity
Sample d value (Angstrom) Angle (2ϴ) Crystallinity (%)
Untreated 15.08823 5.853 61.5
QAS 16.78214 5.262 52.25
50% 16.06665 5.496 55.41
40% 15.08824 5.853 54.61
30% 15.09963 5.848 74.76
20% 14.5028 6.089 57.1
15% 14.79 5.97 72.71
40% ones 14.64487 6.03 62.21
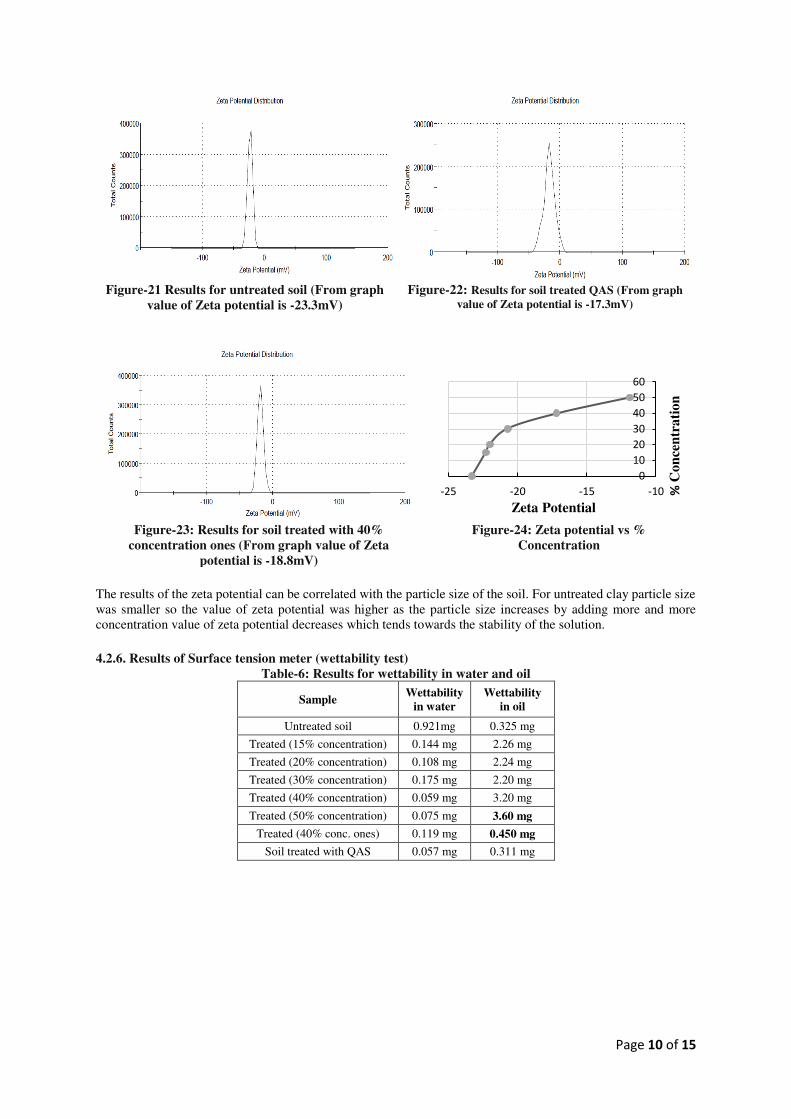
4.2.4 Results of particle size
Table-4: Particle size in polar medium Figure-20 Particle size (diameter in nm) vs %
concentration Sample Size(dia.)
untreated 24.37-236nm
15%(concentration) 957nm
20%(concentration) 922.6nm
30%(concentration) 851.7nm
40%(concentration) 1147nm
50%(concentration) 1137nm
40%(concentration) 1307nm
QAS 711nm
Table-5: Particle size in non-polar medium
Sample Dichloro
methane
Iso propyl
alcohol Acetone
Untreated 3423nm 302.5 1050nm
40% final 893.6nm 297.3nm 870.5nm
QAS 819.1nm 425.3 276.4-1438nm
The above results indicate that particle size increases after-treatment of the soil in polar medium water. It shows that aggregation between the particles is increased. But for non-polar medium increase or decrease in particle size is in a random manner because particles are not miscible in a non-polar medium, but for a non-polar medium like acetone, a reverse trend is observed that is particle size is decreased after the treatment of the soil. The particle size, measured by dynamic light scattering, varied with a change in concentration of Zycosil and also treating the soil with QAS. The thickness of adsorbed layer increases with the increase in concentration and by adding QAS, so the aggregation between the particles increases with resulting in an increase in size. The particle size when observed in the non-polar medium like acetone reverse trend was observed that is particle size decreases after the treatment.
4.2.5. Results of Zeta sizer test
0
200
400
600
800
1000
1200
1400
0 20 40 60
Siz
e (d
iam
eter
in
nm
)
% Concentration
% Concentration vs
Particle size
Page 10 of 15
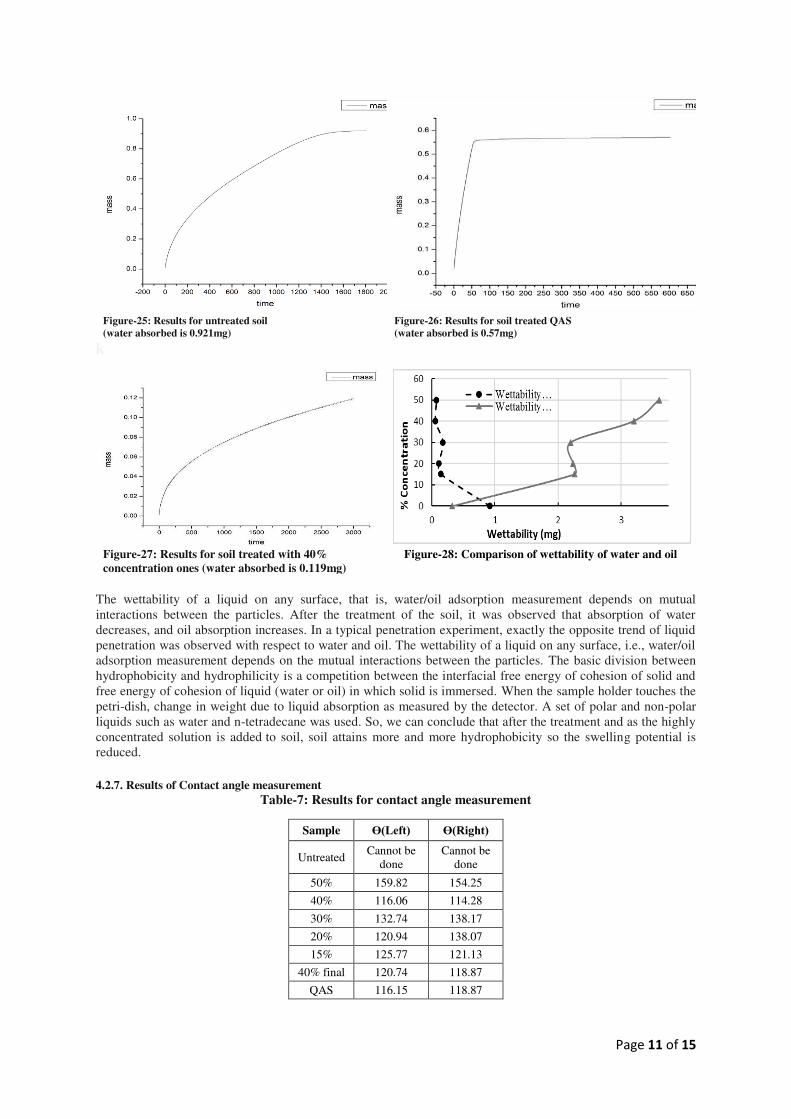
Figure-21 Results for untreated soil (From graph
value of Zeta potential is -23.3mV)
Figure-22: Results for soil treated QAS (From graph
value of Zeta potential is -17.3mV)
Figure-23: Results for soil treated with 40%
concentration ones (From graph value of Zeta
potential is -18.8mV)
Figure-24: Zeta potential vs %
Concentration
The results of the zeta potential can be correlated with the particle size of the soil. For untreated clay particle size was smaller so the value of zeta potential was higher as the particle size increases by adding more and more concentration value of zeta potential decreases which tends towards the stability of the solution. 4.2.6. Results of Surface tension meter (wettability test)
Table-6: Results for wettability in water and oil
Sample Wettability
in water
Wettability
in oil
Untreated soil 0.921mg 0.325 mg
Treated (15% concentration) 0.144 mg 2.26 mg
Treated (20% concentration) 0.108 mg 2.24 mg
Treated (30% concentration) 0.175 mg 2.20 mg
Treated (40% concentration) 0.059 mg 3.20 mg
Treated (50% concentration) 0.075 mg 3.60 mg
Treated (40% conc. ones) 0.119 mg 0.450 mg
Soil treated with QAS 0.057 mg 0.311 mg
0
10
20
30
40
50
60
-25 -20 -15 -10 % C
on
cen
tra
tio
n
Zeta Potential
Page 11 of 15
Figure-25: Results for untreated soil
(water absorbed is 0.921mg)
Figure-26: Results for soil treated QAS
(water absorbed is 0.57mg) k
Figure-27: Results for soil treated with 40%
concentration ones (water absorbed is 0.119mg)
Figure-28: Comparison of wettability of water and oil
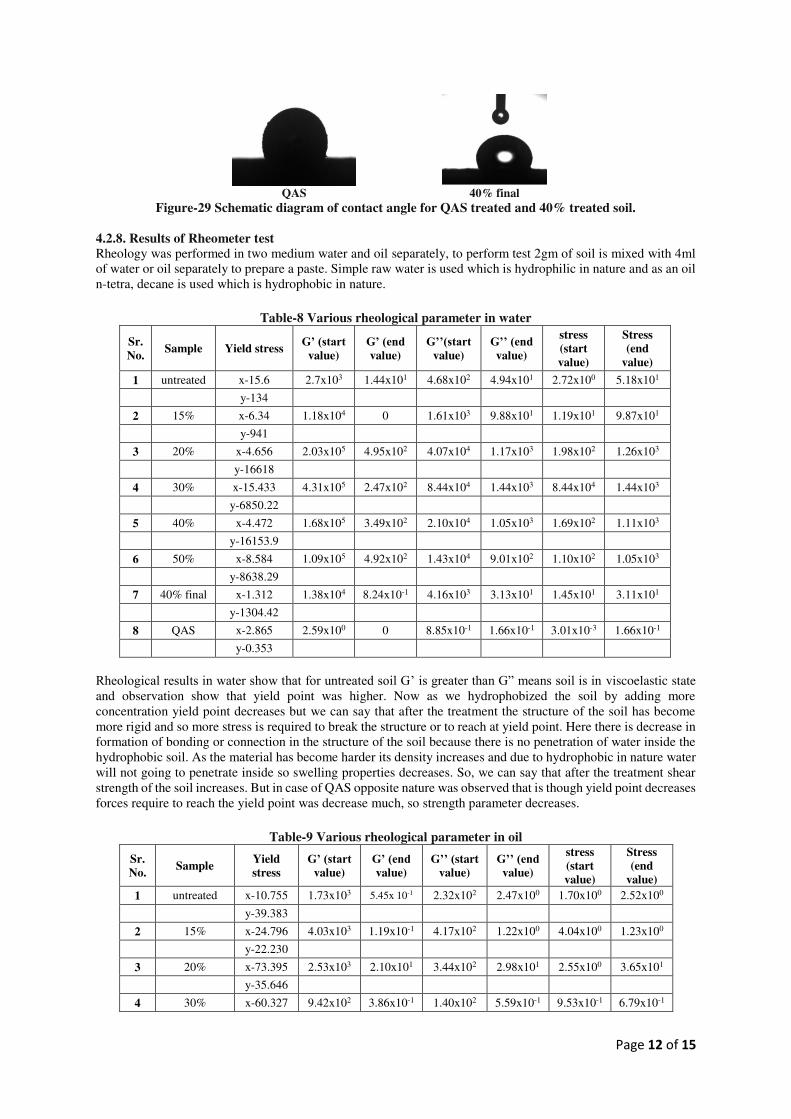
The wettability of a liquid on any surface, that is, water/oil adsorption measurement depends on mutual interactions between the particles. After the treatment of the soil, it was observed that absorption of water decreases, and oil absorption increases. In a typical penetration experiment, exactly the opposite trend of liquid penetration was observed with respect to water and oil. The wettability of a liquid on any surface, i.e., water/oil adsorption measurement depends on the mutual interactions between the particles. The basic division between hydrophobicity and hydrophilicity is a competition between the interfacial free energy of cohesion of solid and free energy of cohesion of liquid (water or oil) in which solid is immersed. When the sample holder touches the petri-dish, change in weight due to liquid absorption as measured by the detector. A set of polar and non-polar liquids such as water and n-tetradecane was used. So, we can conclude that after the treatment and as the highly concentrated solution is added to soil, soil attains more and more hydrophobicity so the swelling potential is reduced. 4.2.7. Results of Contact angle measurement
Table-7: Results for contact angle measurement
Sample ϴ(Left) ϴ(Right)
Untreated Cannot be
done Cannot be
done
50% 159.82 154.25
40% 116.06 114.28
30% 132.74 138.17
20% 120.94 138.07
15% 125.77 121.13
40% final 120.74 118.87
QAS 116.15 118.87
Page 12 of 15
QAS 40% final
Figure-29 Schematic diagram of contact angle for QAS treated and 40% treated soil.
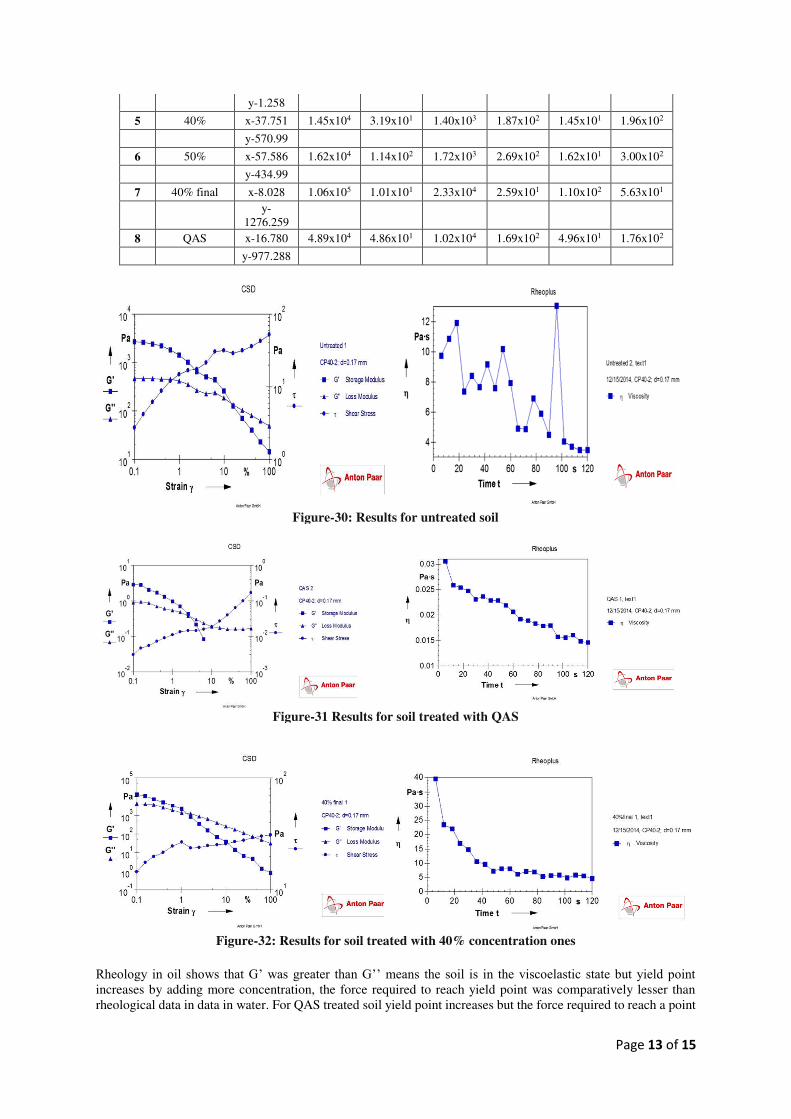
4.2.8. Results of Rheometer test
Rheology was performed in two medium water and oil separately, to perform test 2gm of soil is mixed with 4ml of water or oil separately to prepare a paste. Simple raw water is used which is hydrophilic in nature and as an oil n-tetra, decane is used which is hydrophobic in nature.
Table-8 Various rheological parameter in water
Sr.
No. Sample Yield stress
G’ (start value)
G’ (end value)
G’’(start value)
G’’ (end value)
stress
(start
value)
Stress
(end
value)
1 untreated x-15.6 2.7x10³ 1.44x101 4.68x10² 4.94x101 2.72x100 5.18x101
y-134
2 15% x-6.34 1.18x10⁴ 0 1.61x10³ 9.88x101 1.19x101 9.87x101
y-941
3 20% x-4.656 2.03x10⁵ 4.95x10² 4.07x10⁴ 1.17x10³ 1.98x10² 1.26x10³
y-16618
4 30% x-15.433 4.31x10⁵ 2.47x10² 8.44x10⁴ 1.44x10³ 8.44x10⁴ 1.44x10³
y-6850.22
5 40% x-4.472 1.68x10⁵ 3.49x10² 2.10x10⁴ 1.05x10³ 1.69x10² 1.11x10³
y-16153.9
6 50% x-8.584 1.09x10⁵ 4.92x10² 1.43x10⁴ 9.01x10² 1.10x10² 1.05x10³
y-8638.29
7 40% final x-1.312 1.38x10⁴ 8.24x10⁻¹ 4.16x10³ 3.13x101 1.45x101 3.11x101
y-1304.42
8 QAS x-2.865 2.59x100 0 8.85x10⁻¹ 1.66x10⁻¹ 3.01x10⁻³ 1.66x10⁻¹
y-0.353
Rheological results in water show that for untreated soil G’ is greater than G” means soil is in viscoelastic state and observation show that yield point was higher. Now as we hydrophobized the soil by adding more concentration yield point decreases but we can say that after the treatment the structure of the soil has become more rigid and so more stress is required to break the structure or to reach at yield point. Here there is decrease in formation of bonding or connection in the structure of the soil because there is no penetration of water inside the hydrophobic soil. As the material has become harder its density increases and due to hydrophobic in nature water will not going to penetrate inside so swelling properties decreases. So, we can say that after the treatment shear strength of the soil increases. But in case of QAS opposite nature was observed that is though yield point decreases forces require to reach the yield point was decrease much, so strength parameter decreases.
Table-9 Various rheological parameter in oil
Sr.
No. Sample
Yield
stress
G’ (start value)
G’ (end value)
G’’ (start
value)
G’’ (end value)
stress
(start
value)
Stress
(end
value)
1 untreated x-10.755 1.73x10³ 5.45x 10⁻¹ 2.32x10² 2.47x100 1.70x100 2.52x100
y-39.383
2 15% x-24.796 4.03x10³ 1.19x10⁻¹ 4.17x10² 1.22x100 4.04x100 1.23x100
y-22.230
3 20% x-73.395 2.53x10³ 2.10x101 3.44x10² 2.98x101 2.55x100 3.65x101
y-35.646
4 30% x-60.327 9.42x10² 3.86x10⁻¹ 1.40x10² 5.59x10⁻¹ 9.53x10⁻¹ 6.79x10⁻¹
Page 13 of 15
y-1.258
5 40% x-37.751 1.45x10⁴ 3.19x101 1.40x10³ 1.87x10² 1.45x101 1.96x10²
y-570.99
6 50% x-57.586 1.62x10⁴ 1.14x10² 1.72x10³ 2.69x10² 1.62x101 3.00x10²
y-434.99
7 40% final x-8.028 1.06x10⁵ 1.01x101 2.33x10⁴ 2.59x101 1.10x10² 5.63x101
y-
1276.259
8 QAS x-16.780 4.89x10⁴ 4.86x101 1.02x10⁴ 1.69x10² 4.96x101 1.76x10²
y-977.288
Figure-30: Results for untreated soil
Figure-31 Results for soil treated with QAS
Figure-32: Results for soil treated with 40% concentration ones Rheology in oil shows that G’ was greater than G’’ means the soil is in the viscoelastic state but yield point increases by adding more concentration, the force required to reach yield point was comparatively lesser than rheological data in data in water. For QAS treated soil yield point increases but the force required to reach a point
Page 14 of 15
or stress required is much greater than rheology in oil or Zycosil. So, in oil shear strength for a soil treated with QAS has more strength than treated with Zycosil. Viscosity in water has decreased and in oil, the medium has increased. So totally opposite behavior is noticed in the case of rheology in water and oil. 4.2.9. Results of BET surface analyzer test
Table-10: Results for BET surface area
Sr. No. Sample Surface area (m2/g)
1 Untreated bentonite 46
2 Treated (15% concentration) 38
3 Treated (20% concentration) 13.45
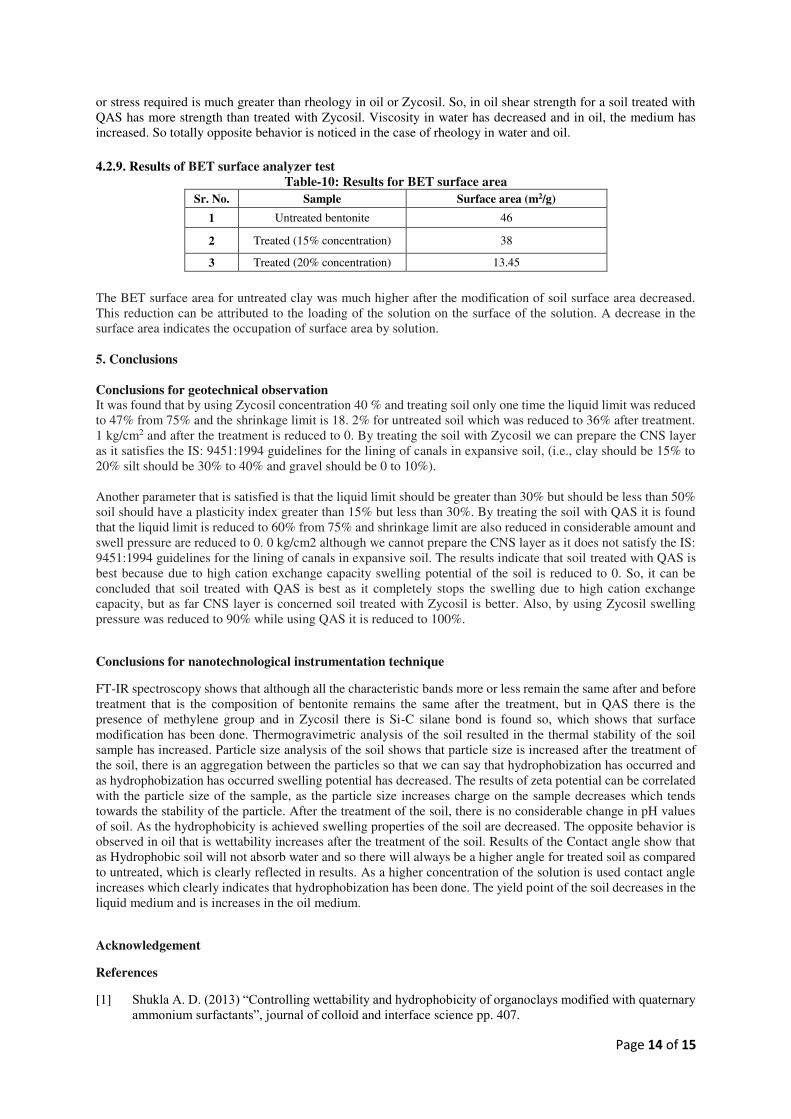
The BET surface area for untreated clay was much higher after the modification of soil surface area decreased. This reduction can be attributed to the loading of the solution on the surface of the solution. A decrease in the surface area indicates the occupation of surface area by solution.
5. Conclusions
Conclusions for geotechnical observation
It was found that by using Zycosil concentration 40 % and treating soil only one time the liquid limit was reduced to 47% from 75% and the shrinkage limit is 18. 2% for untreated soil which was reduced to 36% after treatment. 1 kg/cm2 and after the treatment is reduced to 0. By treating the soil with Zycosil we can prepare the CNS layer as it satisfies the IS: 9451:1994 guidelines for the lining of canals in expansive soil, (i.e., clay should be 15% to 20% silt should be 30% to 40% and gravel should be 0 to 10%). Another parameter that is satisfied is that the liquid limit should be greater than 30% but should be less than 50% soil should have a plasticity index greater than 15% but less than 30%. By treating the soil with QAS it is found that the liquid limit is reduced to 60% from 75% and shrinkage limit are also reduced in considerable amount and swell pressure are reduced to 0. 0 kg/cm2 although we cannot prepare the CNS layer as it does not satisfy the IS: 9451:1994 guidelines for the lining of canals in expansive soil. The results indicate that soil treated with QAS is best because due to high cation exchange capacity swelling potential of the soil is reduced to 0. So, it can be concluded that soil treated with QAS is best as it completely stops the swelling due to high cation exchange capacity, but as far CNS layer is concerned soil treated with Zycosil is better. Also, by using Zycosil swelling pressure was reduced to 90% while using QAS it is reduced to 100%.
Conclusions for nanotechnological instrumentation technique
FT-IR spectroscopy shows that although all the characteristic bands more or less remain the same after and before treatment that is the composition of bentonite remains the same after the treatment, but in QAS there is the presence of methylene group and in Zycosil there is Si-C silane bond is found so, which shows that surface modification has been done. Thermogravimetric analysis of the soil resulted in the thermal stability of the soil sample has increased. Particle size analysis of the soil shows that particle size is increased after the treatment of the soil, there is an aggregation between the particles so that we can say that hydrophobization has occurred and as hydrophobization has occurred swelling potential has decreased. The results of zeta potential can be correlated with the particle size of the sample, as the particle size increases charge on the sample decreases which tends towards the stability of the particle. After the treatment of the soil, there is no considerable change in pH values of soil. As the hydrophobicity is achieved swelling properties of the soil are decreased. The opposite behavior is observed in oil that is wettability increases after the treatment of the soil. Results of the Contact angle show that as Hydrophobic soil will not absorb water and so there will always be a higher angle for treated soil as compared to untreated, which is clearly reflected in results. As a higher concentration of the solution is used contact angle increases which clearly indicates that hydrophobization has been done. The yield point of the soil decreases in the liquid medium and is increases in the oil medium.
Acknowledgement
References
[1] Shukla A. D. (2013) “Controlling wettability and hydrophobicity of organoclays modified with quaternary ammonium surfactants”, journal of colloid and interface science pp. 407.
Page 15 of 15
[2] Bjorn Geyer et al. (2014) “Predicting thermal and thermo-oxidative stability of silane-modified clay minerals using thermogravimetry and is conversional kinetic analysis”, Applied clay science. 101 pp. 253-259.
[3] Charles Lucian (2008) “Geotechnical Aspects of Buildings on Expansive Soils in Kibaha”, Doctoral Thesis Sweden.
[4] David A. et al. (2014), “Modification of bentonite by combination of reactions of acid-activation, silylation and ionic exchange”, applied clay science ,99, pp 254-260.
[5] D.J.Morgan, S.D.J.Inglethorpe (1993), “Industrial mineral laboratory manual Bentonite”, British Geological Survey, Technical report WG/93/20 Mineralogy and Petrology Series. Pp 1-125.
[6] Ebrahim Kadwa et al. (2014) “Characterization and application of montmorillonite-supported Fe Schiff base complexes as catalysts for the oxidation of n-octane”, Applied Clay Science 95, 340–347
[7] IS 9451: 1994: Guidelines for lining of canals in expansive soil. [8] Mesfin Kassa (2005), “Relationship between Consolidation and Swelling Characteristics of Expansive
Soils of Addis Ababa”, MTech Thesis, Addis Ababa university March-2005. [9] Taha M.R. et al. (2012) “Influence of nano-material on the expansive and shrinkage soil behaviour”, J
Nano part. Res. [10] Narayan V. Nayak: “Foundation Design Manual” [11] N. K. Ameta, Dr. D. M. Purohit, A. S. Wayal: “Characteristics, Problems and Remedies of Expansive soils
of Rajasthan”, India (2007) [12] Rank kinjal P. (2012) “swelling potential of different expansive soil placed at different dry density and
initial moisture content”, MTech Thesis. [13] Sharma R. et al. (2012) “X-ray diffraction: a powerful method of characterizing nanomaterials”, Recent
Research in Science and Technology. Vol.4. [14] Ralph E. Grim, Richard A. Rowland (1942) “Differential thermal analysis of clay minerals and other
hydrous material”, State Geological survey, Urbana, Illinois [15] Ronald G. Gibbs (1967) “Quantitively X-Ray diffraction analysis using clay mineral standards extracted
from the sample to be analysed”, Department of geology, university of California, Los angles, Clay Minerals (1967) 7, 79.
[16] SP 36(part 1-1987): “laboratory testing of soils for civil engineering”, part-I. [17] V Kartik Ganesh (2015) “Nanotechnology in Civil Engineering”, Proceedings of Indian Geotechnical
International Conference on Geo-Engineering and Climate Change Technologies for Sustainable Environmental Management (GCCT-2015) At, MNIT Allahabad.
[18] W. Markgraf, R. Horn: “An Introduction to Rheology in Soil Mechanics – Structural Behaviour of Bentonite against Salt Concentration and Water Content”, Annual transactions of the Nordic Rheology society, vol. 13, 2005Yuling Gao, Yangyong Dai, Hui Ghang: “Effect of organic modification of montmorillonite


