Embed Size (px)
Citation preview

minerals
Article
Copper Slag of Pyroxene Composition as a Partial Replacementof Natural Aggregate for Concrete Production
Sandra Filipovic 1,* , Olivera Ðokic 2 , Aleksandar Radevic 3 and Dimitrije Zakic 3
�����������������
Citation: Filipovic, S.; Ðokic, O.;
Radevic, A.; Zakic, D. Copper Slag of
Pyroxene Composition as a Partial
Replacement of Natural Aggregate
for Concrete Production. Minerals
2021, 11, 439. https://doi.org/
10.3390/min11050439
Academic Editors:
Nikolaos Koukouzas,
Petros Petrounias and Panagiota
P. Giannakopoulou
Received: 26 March 2021
Accepted: 18 April 2021
Published: 21 April 2021
Publisher’s Note: MDPI stays neutral
with regard to jurisdictional claims in
published maps and institutional affil-
iations.
Copyright: © 2021 by the authors.
Licensee MDPI, Basel, Switzerland.
This article is an open access article
distributed under the terms and
conditions of the Creative Commons
Attribution (CC BY) license (https://
creativecommons.org/licenses/by/
4.0/).
1 Mining and Metallurgy Institute Bor, 19210 Bor, Serbia2 Highway Institute Belgrade, 11010 Belgrade, Serbia; [email protected] Faculty of Civil Engineering, The University of Belgrade, 11000 Belgrade, Serbia;
[email protected] (A.R.); [email protected] (D.Z.)* Correspondence: [email protected]; Tel.: +381-(64)2916545
Abstract: Copper slag, a by-product of the pyrometallurgical process used for obtaining copper fromcopper ore in Bor, Serbia, contains mainly silicon, iron, calcium, and aluminium oxides. Due tosuch properties, it is disposed of in landfills. Despite the favourable technical properties copper slagaggregates possess, such as low-water absorption (WA24 0.6%), low resistance to fragmentation (LA10%), and low resistance to wear (MDE 4%), its use in the construction industry is still limited. Theresults of testing the technical properties of copper slag aggregates (CSAs) as a potential replacementfor natural river aggregate (RA) are presented in this paper. The experiments included tests onthree concrete mixtures with partial replacement of coarse natural aggregate with copper slag. Thereplacement of RA particle sizes of 8/16 mm and 16/31.5 mm with CSA in the amount of 20% + 50%and 50% + 50% resulted in an increase in the compressive strength of 12.4% and 10.5%, respectively.The increase of CSA content led to a decrease in water penetration resistance and salt-frost resistanceof concrete, whereas the resistance to chloride ion penetration did not change significantly.
Keywords: copper slag; recycled aggregate; natural aggregate; concrete; compressive strength;water permeability
1. Introduction
The global use of about 25 × 109 metric tons per year makes concrete one of the mostcommonly used construction materials [1]. The possibility of combining with differentaggregates in different ratios, wide availability, and economic cost of production estab-lished the dominance of concrete in the construction industry [2]. Concrete is widely usedin building, bridge, and highway construction and the production of precast concreteelements such as curbs, slabs, pipes, drain channels, etc. The aggregate constitutes upto 80% of the total volume of concrete [3]. Natural aggregates are obtained by crushingrock masses in quarries or extracting sand and gravel from riverbeds. Due to the devel-opment of infrastructure in developed and developing countries, there is a huge demandfor aggregates, mostly fine aggregates with a high share in the concrete mixture. Activeextraction of aggregate deposits from riverbeds can cause serious environmental problems(bed degradation, bank erosion, loss of vegetation, etc.) [4]. The growing need that existsin the construction industry cannot be fulfilled by the available resources. For example,the current river aggregate extraction rate can satisfy only 9% of the total annual demandin China [5]. However, different industrial activities accompanied by the production ofprimary products result in various by-products that have almost no practical industrial ap-plication. These industrial by-products, which are generated in high quantities worldwide,present severe challenges regarding their disposal [6]. This is why it is necessary to findother alternatives that would be acceptable from the ecological aspect. One solution wouldbe the use of copper slag aggregates as a substitute for natural aggregate in concrete [7].
Minerals 2021, 11, 439. https://doi.org/10.3390/min11050439 https://www.mdpi.com/journal/minerals

Minerals 2021, 11, 439 2 of 19
Considering that for each metric ton of produced copper in the world, about 2.2 t ofcopper slag is generated, almost 24.6 × 10⁶ t of copper slag is generated every year that isdisposed of in landfills as waste [8]. Copper slag was thought to be an extremely dangerousmaterial for the environment in the past. This is why the United States EnvironmentalProtection Agency (USEPA) passed a law in 1991 that qualified about 20 waste mineralsubstances, such as copper slag, as a waste material harmful to the environment [9,10]. In1996, the UN Basel Convention on the Control of Transboundary Movements of HazardousWastes and their Disposal described copper slag as a non-hazardous material, based onwhich its use was not seen as a threat to the environment [9,10]. Due to the fact that copperslag is composed of non-hazardous chemical materials, its application as a raw material invarious industries has been enabled [10].
Copper slag obtained during the first phase of the pyrometallurgical production ofcopper by oxidizing melting in the blast furnace is an essential recyclable raw materialthat, in addition to copper (content < 1%), can also contain Zn, Ni, Co, Mo, Sn, andother chemical elements. Further processing of copper slag protects the environment,land, and mineral resources and offers economic benefits. Oxidizing melting of copperconcentrate at high temperatures (1200 ◦C) with the addition of flux (SiO2) forms coppermatte and silicate slag, which floats to the surface due to its lower density (high meltingphase) compared to copper matte. After it floats to the surface, it is removed from thesmelting system. Part of the iron sulphide oxidizes and reacts with SiO2, thus producingliquid copper slag with the ferro-silicate matrix as a base, i.e., fayalite (Fe2SiO4), while acertain amount is oxidized to magnetite (Fe3O4) [11]. While pouring, the hot copper slagis transformed into a solid dark grey mass by abruptly going through the cooling phaseand instantaneous crystallization. Due to the drastic temperature change, different-sizedgranular and incoherent material is formed. Based on the structure, copper slag’s qualitydepends on several factors: type and quality of the raw material used in the smeltingprocess, smelting method, and cooling and rapid crystallization method. As a result,copper slag of different chemical and granulometric composition is obtained [12]. Thepercentage of different chemical elements in copper slag also depends on the hot copperslag’s cooling method at the waste dump [13].
Ravindra et al. [14] investigated the geotechnical properties of copper slag. It wasdetermined that copper slag was a non-plastic material with higher compressibility thansand. The angle of internal friction of copper slag is similar to sand, and its use as backfillbehind supporting structures reduces the active lateral resistance. Copper slag is alsosuitable for use in construction as fill material. Because it does not have any harmful impacton the environment, it can be added to the soil as a material with adequate bearing capacityfor road or railway construction or as an aggregate base layer for building foundations.
The investigated physical and chemical properties of copper slag allow it to be used inconcrete production as a successful substitute for common aggregates. Due to high particledensity, it is suitable for application in mass concrete, concrete slab foundations, or materialfor the construction of rigid pavement layers [15,16]. By replacing natural aggregate withcopper slag aggregate, some concrete properties can be improved, such as compressivestrength, density, workability, durability, and flexural strength [17]. M. Khanzadi andA. Behnood [18] showed that the complete replacement of coarse natural aggregate withcopper slag increased compressive and tensile strength by 11% and 12%, respectively. Theincrease of the replacement percentage of natural aggregate with copper slag graduallyincreased concrete density [19]. Recently, copper slag has been used as a replacementfor cement, e.g., in the production of cement clinker [20,21], and as a substitute for fineand coarse aggregate fractions in concrete mixtures and mortar [22]. Copper slag hasbeen tested as a pozzolanic replacement for cement because 70% of the total amount ofcopper slag in the world contains a favourable combination of SiO2 + Al2O3 + Fe2O3 [16].Due to its pozzolanic activity, it can be used as a cement additive [23]. Depending on theslag’s granulated state at the landfill and due to its large specific surface (approximately

Minerals 2021, 11, 439 3 of 19
400 m2/kg), the process of grinding and crushing of copper slag requires a high level ofenergy consumption [13].
As a part of experimental investigation and durability studies [24], tests on resistanceto chloride penetration of concrete with partial replacement of natural aggregate with cop-per slag aggregate were performed. Depending on the method of addition and percentageof copper slag in concrete, the obtained ASTM C1202 results showed that the degree ofchloride ingress in concrete with partial replacement of river aggregate with copper slagaggregate was “moderate” or “very low”. Concrete formed by adding copper slag as asubstitute for natural aggregate is water-permeable, which provides the advantage of usein sidewalks for collecting atmospheric water in cities. Research showed that 100% volumereplacement of dolomite with copper slag aggregate in permeable concrete increased theporosity by 3% compared to the control mixture. It can be concluded that the increaseof the replacement percentage of dolomite aggregate with copper slag aggregate led toan increase of pore-size distribution in the system, which was further reflected in theincrease of water absorption in concrete [25]. This increase seemed to be related to theshape and glassy appearance of the copper slag aggregate’s grain surface. Therefore, theporosity of the control concrete samples differed from concrete samples that containedcopper slag. Another study showed that water-penetration resistance depended on thepore-size distribution present in the concrete [26]. The shape of the aggregate grains hadno significant effect on the freeze-thaw resistance of concrete. However, the content ofcoarse fractions of aggregate in the concrete determined the frost resistance. The analysisof the obtained results showed a significant relationship between the density of coarsefraction in concrete, water absorption, frost resistance, and durability of concrete [27]. Thehigher the capillary pores’ density and size, the lower the frost resistance [28]. The porosityof concrete mainly depends on the aggregate’s grain size, shape, and fraction percentagein the mixture. It was noticed that when the percentage of copper slag in the aggregatemixture was increased, the porosity of concrete increased as well [29,30].
As a manufactured aggregate of the pyrometallurgical process of copper productionin Bor, Serbia, copper slag potentially can be used in concrete production. Previous studiesperformed on this slag confirmed good technical properties [31,32]; however, technicalregulations in Serbia viewed copper slag as waste until recently [33,34]. The adjustmentfollowing the regulations from the European Union offered the possibility of using copperslag from landfills as a construction material. Therefore, the research presented in this paperis aimed at considering the possibility of using copper slag as an aggregate in concrete. Thetechnical properties of natural aggregate, copper slag aggregate, and concrete mixtures(prepared with partial replacement of natural aggregate with copper slag that had 8/16and 16/31.5 mm particle sizes) were examined in this paper. Frost resistance, as well as theresistance of concrete to chloride ion penetration, were tested on concrete mixtures madewith partial replacement of natural aggregate with copper slag aggregate in order to checkthe durability of concrete, which has been insufficiently investigated so far.
2. Materials and Methods
Copper slag used in the study was produced by industrial processing in the flotationplant of RTB Bor (Serbia). It was deposited near the processing facilities. The copper slagat the landfill was formed by the process of abrupt cooling of hot copper slag. As theinput for the technological process of primary crushing, copper slag grains with sizes up to600 mm were used, and the output product was loose material with grain size 0–100 mm.The application of these coarse grains could be possible only after further crushing andgrinding. Due to economic reasons, for utilizing copper slag in the production of concrete,only aggregate fractions of 8/16 mm (III) and 16/31.5 mm (IV) were used in the research.This decision was based on the initial sample’s particle-size distribution curve, whichshowed that 70% of grains with such size were present at the landfill. Copper slag occurredat the landfill in the form of grains of different sizes that were grey-ochre-purple on thesurface (Figure 1a). The samples of copper slag aggregate at the landfill are shown in

Minerals 2021, 11, 439 4 of 19
Figure 1b. The samples of copper slag aggregate (CSA) used for testing were sieved andthen separated into fractions of 8/16 (Figure 1c) and 16/31.5 mm (Figure 1d).
Minerals 2021, 11, x 4 of 19
research. This decision was based on the initial sample’s particle-size distribution curve, which showed that 70% of grains with such size were present at the landfill. Copper slag occurred at the landfill in the form of grains of different sizes that were grey-ochre-purple on the surface (Figure 1a). The samples of copper slag aggregate at the landfill are shown in Figure 1b. The samples of copper slag aggregate (CSA) used for testing were sieved and then separated into fractions of 8/16 (Figure 1c) and 16/31.5 mm (Figure 1d).
(a) (c)
(b) (d)
Figure 1. (a) Landfill of copper slag aggregates in the vicinity of the processing facilities of the Mining and Smelting Basin Bor; (b) macroscopic view of copper slag aggregate at the landfill; (c) macroscopic view of copper slag aggregate (8/16 mm); (d) macroscopic view of copper slag aggregate (16/31.5 mm).
The natural aggregate used in the research, which was obtained from the separation plant “New Separation”, originally was acquired from the river Velika Morava near Paraćin (Serbia). Four standard fractions of this river aggregate (RA) were used in the study: 0/4 mm, 4/8 mm, 8/16 mm, and 16/31.5 mm. The particle-size distribution of the fractions used in the study is shown in Figure 2.
Figure 1. (a) Landfill of copper slag aggregates in the vicinity of the processing facilities of the Mining and Smelting BasinBor; (b) macroscopic view of copper slag aggregate at the landfill; (c) macroscopic view of copper slag aggregate (8/16 mm);(d) macroscopic view of copper slag aggregate (16/31.5 mm).
The natural aggregate used in the research, which was obtained from the separationplant “New Separation”, originally was acquired from the river Velika Morava near Paracin(Serbia). Four standard fractions of this river aggregate (RA) were used in the study:0/4 mm, 4/8 mm, 8/16 mm, and 16/31.5 mm. The particle-size distribution of the fractionsused in the study is shown in Figure 2.
The mean particle sizes for cumulative percentages passing 50% (d50%) of river aggre-gate fractions 8/16 mm and 16/31.5 mm were 12.6 mm and 21.1 mm, respectively, while inthe case of copper slag aggregate fractions, d50% was 10.9 mm and 24.2 mm, respectively.
The cement used in the study for concrete preparation was blended Portland cement(PC), designated as CEM II/ A-L 42.5R, with a specific density of 3.15 mg/m3. The cementwas classified according to the European standard EN 197-1.
The chemical analyses of the copper slag aggregate were performed by differentanalytical methods: G—gravimetry; ICP-AES—inductively coupled plasma atomic emis-sion spectroscopy; C—obtained by calculation; AAS—atomic absorption spectrophotom-etry; AES—atomic emission spectrophotometry; ACS—carbon and sulphur analyser;PHOT—photometry; SP—spectrophotometry; EG—electrogravimetry; V—volumetry; andA-Fe3O4—magnetite content analyser.

Minerals 2021, 11, 439 5 of 19Minerals 2021, 11, x 5 of 19
Figure 2. Particle-size distribution curves of river aggregate (RA) and copper slag aggregate (CSA).
The mean particle sizes for cumulative percentages passing 50% (d50%) of river aggregate fractions 8/16 mm and 16/31.5 mm were 12.6 mm and 21.1 mm, respectively, while in the case of copper slag aggregate fractions, d50% was 10.9 mm and 24.2 mm, respectively.
The cement used in the study for concrete preparation was blended Portland cement (PC), designated as CEM II/ A-L 42.5R, with a specific density of 3.15 Mg/m3. The cement was classified according to the European standard EN 197-1.
The chemical analyses of the copper slag aggregate were performed by different analytical methods: G—gravimetry; ICP-AES—inductively coupled plasma atomic emission spectroscopy; C—obtained by calculation; AAS—atomic absorption spectro-photometry; AES—atomic emission spectrophotometry; ACS—carbon and sulphur ana-lyser; PHOT—photometry; SP—spectrophotometry; EG—electrogravimetry; V—volumetry; and A-Fe3O4—magnetite content analyser.
A copper slag aggregate sample was mounted in epoxy resin, polished, and car-bon-coated for SEM-EDS analysis. The analysis was performed using a JSM-IT300 (JEOL Ltd., Tokyo, Japan) coupled with an EDS AZtec Oxford Instruments XMax 50 mm2 SDD energy-dispersive spectrometer, in high-vacuum mode, at an accelerating voltage of 20 kV and a probe current of ∼0.1 nA. SEM images were acquired at a magnification of 1000×, according to the grain size of the analysed sample. Phase fractions (in vol %) were calculated using ImageJ software (v1.53a, National Institutes of Health, USA). The EDS elemental analysis was performed on all detected phases at multiple points. The internal standards were used for quantification, and all results were normalised to 100%. For homogenous crystalline phases, crystallochemical formulas were calculated based on the average composition.
Qualitative and quantitative assessment of the mineral composition of natural river aggregate was performed on 10/14 mm fraction according to EN 932-3.
The shape index of the previously prepared samples of both aggregates (CSA and RA) was determined according to EN 933-4, particle density and water absorption were determined according to EN 1097-6, and then a magnesium sulphate test was performed according to EN 1367-2. Resistance to fragmentation (Los Angeles test) was examined according to ASTM C 131, resistance to wear (MDE) in a wet state was examined by a mi-cro-Deval test according to EN 1097-1, and polished stone value (PSV) of the slag was determined according to EN 1097-8. The tests on the aggregates were performed in ac-cordance with harmonized European standards (EN) and the American Society for
Figure 2. Particle-size distribution curves of river aggregate (RA) and copper slag aggregate (CSA).
A copper slag aggregate sample was mounted in epoxy resin, polished, and carbon-coated for SEM-EDS analysis. The analysis was performed using a JSM-IT300 (JEOL Ltd.,Tokyo, Japan) coupled with an EDS AZtec Oxford Instruments XMax 50 mm2 SDD energy-dispersive spectrometer, in high-vacuum mode, at an accelerating voltage of 20 kV and aprobe current of ~0.1 nA. SEM images were acquired at a magnification of 1000×, accordingto the grain size of the analysed sample. Phase fractions (in vol%) were calculated usingImageJ software (v1.53a, National Institutes of Health, USA). The EDS elemental analysiswas performed on all detected phases at multiple points. The internal standards were usedfor quantification, and all results were normalised to 100%. For homogenous crystallinephases, crystallochemical formulas were calculated based on the average composition.
Qualitative and quantitative assessment of the mineral composition of natural riveraggregate was performed on 10/14 mm fraction according to EN 932-3.
The shape index of the previously prepared samples of both aggregates (CSA andRA) was determined according to EN 933-4, particle density and water absorption weredetermined according to EN 1097-6, and then a magnesium sulphate test was performedaccording to EN 1367-2. Resistance to fragmentation (Los Angeles test) was examinedaccording to ASTM C 131, resistance to wear (MDE) in a wet state was examined by amicro-Deval test according to EN 1097-1, and polished stone value (PSV) of the slagwas determined according to EN 1097-8. The tests on the aggregates were performedin accordance with harmonized European standards (EN) and the American Society forTesting and Materials (ASTM) standard, which are shown in Figure 3. The categorization ofthe obtained test results was performed according to the EN 12620 standard for aggregates.
The testing of the physical and mechanical properties of three concrete mixtures,according to the standards shown in Figure 3, was performed as well. The first groupconsisted of control concrete specimens based on natural river aggregate; the concretemixture in which 20% of 8/16 mm fraction and 50% of 16/31.5 mm fraction were substitutedby volume (20% III + 50% IV) belonged in the second group; while in the third group,50% of RA in both fractions 8/16 mm and 16/31.5 mm was replaced with correspondingfractions of CSA (50% III + 50% IV). Concrete mixes were prepared according to the recipeof the local concrete factory in order to facilitate the commercialization of concrete madewith copper slag aggregate.

Minerals 2021, 11, 439 6 of 19
Minerals 2021, 11, x 6 of 19
Testing and Materials (ASTM) standard, which are shown in Figure 3. The categorization of the obtained test results was performed according to the EN 12620 standard for ag-gregates.
The testing of the physical and mechanical properties of three concrete mixtures, according to the standards shown in Figure 3, was performed as well. The first group consisted of control concrete specimens based on natural river aggregate; the concrete mixture in which 20% of 8/16 mm fraction and 50% of 16/31.5 mm fraction were substi-tuted by volume (20% III + 50% IV) belonged in the second group; while in the third group, 50% of RA in both fractions 8/16 mm and 16/31.5 mm was replaced with corre-sponding fractions of CSA (50% III + 50% IV). Concrete mixes were prepared according to the recipe of the local concrete factory in order to facilitate the commercialization of concrete made with copper slag aggregate.
Figure 3. Diagram of testing methods for aggregates and concrete mixtures.
After the preparation of concrete mixtures and before casting into moulds, the con-sistency of fresh concrete (EN 12350-5), density (EN 12350-6), and air content (EN 12350-7) were determined. The density of hardened concrete (EN 12390-7) and compres-sive strength (EN 12390-3) were determined on 150 mm cubic samples. The compressive strength was examined after 1, 7, and 28 days of curing (EN 12390-2).
The test of water penetration under pressure was performed on 150 mm concrete cubes. The samples were tested after 28 days of curing, according to EN 12390-8. The samples were exposed to a constant water pressure of 5 bar for 72 h.
The resistance of concrete to chloride ion penetration was investigated on a (50 ± 2) mm section of a cast cylinder Ø100/H100 mm after 28 curing days, according to NT Build 492. The chloride ion migration through the concrete sample was performed with an electric current of 20 V for 24 h.
Samples in the shape of plates (150 × 150 × 50 mm) were cut out from 150 mm con-crete cubes in order to test the freeze-thaw resistance of concrete in the presence of de-icing salts. The test was performed after 28 curing days, according to EN 12390-9. The samples were subjected to cyclic freezing and thawing for 28 cycles. Visual assessment of
Figure 3. Diagram of testing methods for aggregates and concrete mixtures.
After the preparation of concrete mixtures and before casting into moulds, the consis-tency of fresh concrete (EN 12350-5), density (EN 12350-6), and air content (EN 12350-7)were determined. The density of hardened concrete (EN 12390-7) and compressive strength(EN 12390-3) were determined on 150 mm cubic samples. The compressive strength wasexamined after 1, 7, and 28 days of curing (EN 12390-2).
The test of water penetration under pressure was performed on 150 mm concretecubes. The samples were tested after 28 days of curing, according to EN 12390-8. Thesamples were exposed to a constant water pressure of 5 bar for 72 h.
The resistance of concrete to chloride ion penetration was investigated on a (50 ± 2) mmsection of a cast cylinder Ø100/H100 mm after 28 curing days, according to NT Build 492.The chloride ion migration through the concrete sample was performed with an electriccurrent of 20 V for 24 h.
Samples in the shape of plates (150 × 150 × 50 mm) were cut out from 150 mmconcrete cubes in order to test the freeze-thaw resistance of concrete in the presence ofdeicing salts. The test was performed after 28 curing days, according to EN 12390-9. Thesamples were subjected to cyclic freezing and thawing for 28 cycles. Visual assessment ofthe condition of the samples and measurements of the amount of chipped material wasdone after every 7 cycles.
3. Results3.1. Chemical Analysis of Copper Slag Aggregate
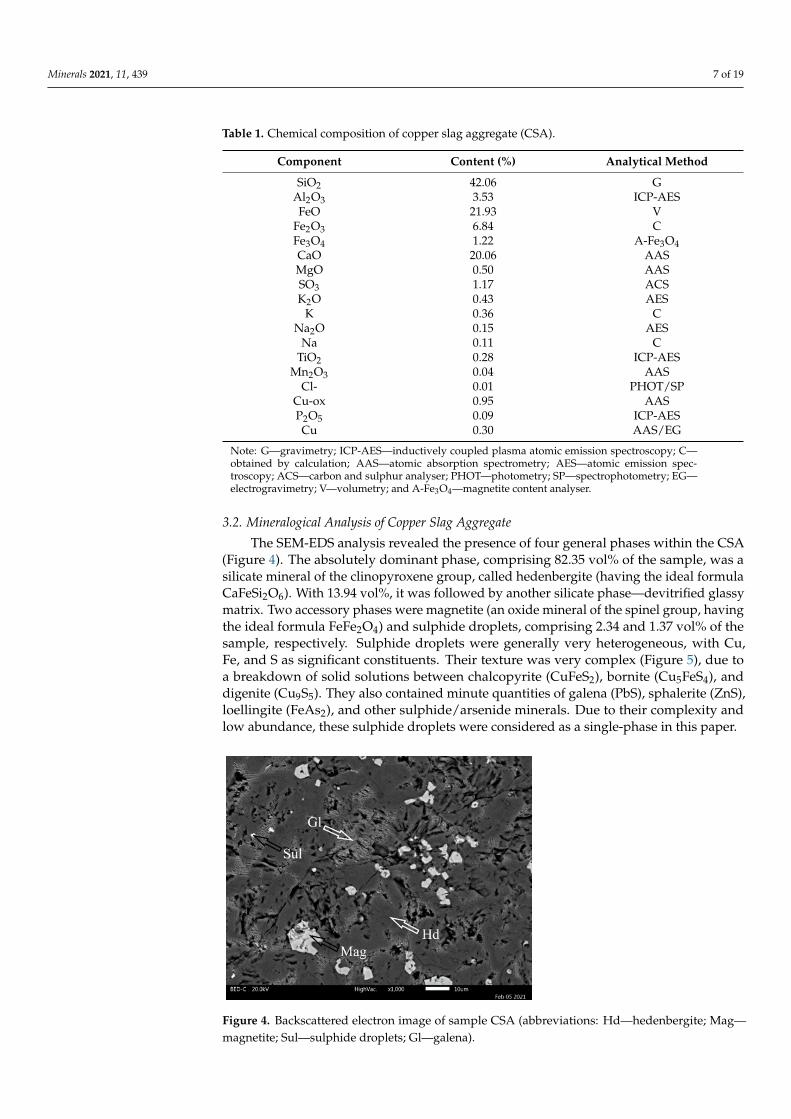
Table 1 shows the chemical composition of the copper slag aggregate. It was deter-mined that the slag predominantly consisted of silicon, iron, calcium, and aluminiumoxides. The oxides of other elements were significantly less present. The copper contentwas below 0.50%.
Minerals 2021, 11, 439 7 of 19
Table 1. Chemical composition of copper slag aggregate (CSA).
Component Content (%) Analytical Method
SiO2 42.06 GAl2O3 3.53 ICP-AESFeO 21.93 V
Fe2O3 6.84 CFe3O4 1.22 A-Fe3O4CaO 20.06 AASMgO 0.50 AASSO3 1.17 ACSK2O 0.43 AES
K 0.36 CNa2O 0.15 AES
Na 0.11 CTiO2 0.28 ICP-AES
Mn2O3 0.04 AASCl- 0.01 PHOT/SP
Cu-ox 0.95 AASP2O5 0.09 ICP-AESCu 0.30 AAS/EG
Note: G—gravimetry; ICP-AES—inductively coupled plasma atomic emission spectroscopy; C—obtained by calculation; AAS—atomic absorption spectrometry; AES—atomic emission spec-troscopy; ACS—carbon and sulphur analyser; PHOT—photometry; SP—spectrophotometry; EG—electrogravimetry; V—volumetry; and A-Fe3O4—magnetite content analyser.
3.2. Mineralogical Analysis of Copper Slag Aggregate
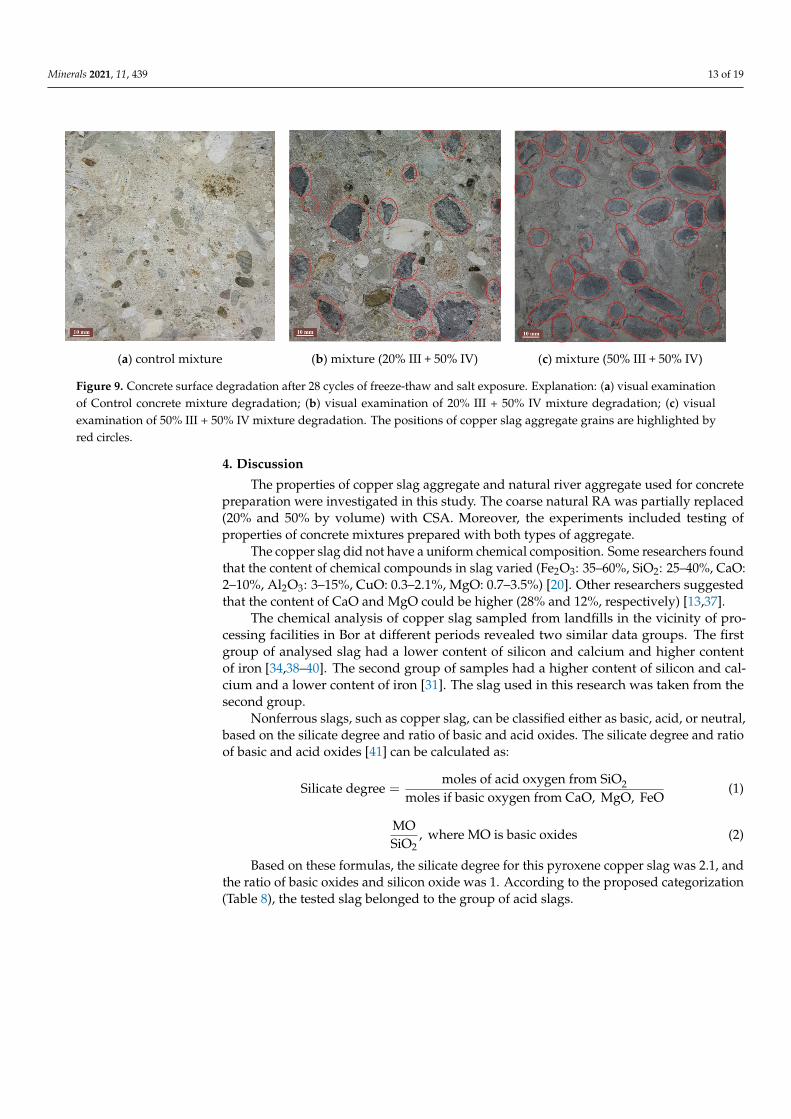
The SEM-EDS analysis revealed the presence of four general phases within the CSA(Figure 4). The absolutely dominant phase, comprising 82.35 vol% of the sample, was asilicate mineral of the clinopyroxene group, called hedenbergite (having the ideal formulaCaFeSi2O6). With 13.94 vol%, it was followed by another silicate phase—devitrified glassymatrix. Two accessory phases were magnetite (an oxide mineral of the spinel group, havingthe ideal formula FeFe2O4) and sulphide droplets, comprising 2.34 and 1.37 vol% of thesample, respectively. Sulphide droplets were generally very heterogeneous, with Cu,Fe, and S as significant constituents. Their texture was very complex (Figure 5), due toa breakdown of solid solutions between chalcopyrite (CuFeS2), bornite (Cu5FeS4), anddigenite (Cu9S5). They also contained minute quantities of galena (PbS), sphalerite (ZnS),loellingite (FeAs2), and other sulphide/arsenide minerals. Due to their complexity andlow abundance, these sulphide droplets were considered as a single-phase in this paper.
Minerals 2021, 11, x 8 of 19
Figure 4. Backscattered electron image of sample CSA (abbreviations: Hd—hedenbergite; Mag—magnetite; Sul—sulphide droplets; Gl—galena).
Figure 5. Backscattered electron image of a sulphide droplet (abbreviations: Ccp—chalcopyrite; Bn—bornite; Dg—digenite; Gn—galena; Sp—sphalerite).
The composition of all four phases detected in the CSA sample is given in Table 2, along with their abundances in vol %.
Table 2. Phase analysis of CSA using SEM-EDS.
Phase Hedenbergite Glassy Matrix Magnetite Sulphide Droplets Element wt%
O 38.57 36.40 28.80 Na 0.28 Mg 0.58 0.02 0.06 Al 1.56 4.18 1.27 Si 21.18 17.93 P 0.13 S 32.89
Figure 4. Backscattered electron image of sample CSA (abbreviations: Hd—hedenbergite; Mag—magnetite; Sul—sulphide droplets; Gl—galena).

Minerals 2021, 11, 439 8 of 19
Minerals 2021, 11, x 8 of 19
Figure 4. Backscattered electron image of sample CSA (abbreviations: Hd—hedenbergite; Mag—magnetite; Sul—sulphide droplets; Gl—galena).
Figure 5. Backscattered electron image of a sulphide droplet (abbreviations: Ccp—chalcopyrite; Bn—bornite; Dg—digenite; Gn—galena; Sp—sphalerite).
The composition of all four phases detected in the CSA sample is given in Table 2, along with their abundances in vol %.
Table 2. Phase analysis of CSA using SEM-EDS.
Phase Hedenbergite Glassy Matrix Magnetite Sulphide Droplets Element wt%
O 38.57 36.40 28.80 Na 0.28 Mg 0.58 0.02 0.06 Al 1.56 4.18 1.27 Si 21.18 17.93 P 0.13 S 32.89
Figure 5. Backscattered electron image of a sulphide droplet (abbreviations: Ccp—chalcopyrite;Bn—bornite; Dg—digenite; Gn—galena; Sp—sphalerite).
The composition of all four phases detected in the CSA sample is given in Table 2,along with their abundances in vol%.
Table 2. Phase analysis of CSA using SEM-EDS.
Phase Hedenbergite Glassy Matrix Magnetite Sulphide Droplets
Element wt%
O 38.57 36.40 28.80Na 0.28Mg 0.58 0.02 0.06Al 1.56 4.18 1.27Si 21.18 17.93P 0.13S 32.89K 0.90Ca 15.17 4.65 0.44Ti 0.13 0.19 1.16V 0.20Cr 0.02Mn 0.03 0.02Fe 22.73 33.31 67.98 19.50Cu 47.61Zn 0.05 0.09 0.07As 0.07Ba 1.83
Σ 100.00 100.00 100.00 100.00
vol% 82.35 13.94 2.34 1.37
n * 10 8 4 7* Number of measurement points.
Based on the values in Table 2, the crystallochemical formulas were calculated as follows:(Fe0.967Zn0.002Mg0.006Ca0.025Mn0.000)1.000(Fe1.826Al0.108Ti0.056Cr0.001V0.009)2.000O4.000 for
magnetite and (Ca0.942Fe1.013Mg0.059Zn0.002Mn0.001Ti0.007Al0.021)2.045(Si1.877Al0.123)2.000O6.000for hedenbergite.
Compared to the ideal formulas, both hedenbergite and magnetite showed enrichmentin aluminium, with minor substitutions with magnesium, titanium, and other cations. Sincethe principal silicate crystal phase was hedenbergite, the glassy matrix remained very richin iron. Having other minor elements distributed between crystal phases (hedenbergite,magnetite, and sulphides), it was enriched in aluminium and incompatible elements, suchas barium, potassium, sodium, phosphorus, and arsenic.

Minerals 2021, 11, 439 9 of 19
3.3. Petrographic Analysis of River Aggregate
The petrographic analysis of gravel from the river Velika Morava, acquired from theseparation plant “New Separation”, is shown in Figure 6.
Minerals 2021, 11, x 9 of 19
K 0.90 Ca 15.17 4.65 0.44 Ti 0.13 0.19 1.16 V 0.20 Cr 0.02 Mn 0.03 0.02 Fe 22.73 33.31 67.98 19.50 Cu 47.61 Zn 0.05 0.09 0.07 As 0.07 Ba 1.83 Σ 100.00 100.00 100.00 100.00
Vol.% 82.35 13.94 2.34 1.37 n* 10 8 4 7
* Number of measurement points.
Based on the values in Table 2, the crystallochemical formulas were calculated as follows:
(Fe0.967Zn0.002Mg0.006Ca0.025Mn0.000)1.000(Fe1.826Al0.108Ti0.056Cr0.001V0.009)2.000O4.000 for magnet-ite and (Ca0.942Fe1.013Mg0.059Zn0.002Mn0.001Ti0.007Al0.021)2.045(Si1.877Al0.123)2.000O6.000 for heden-bergite.
Compared to the ideal formulas, both hedenbergite and magnetite showed enrich-ment in aluminium, with minor substitutions with magnesium, titanium, and other cat-ions. Since the principal silicate crystal phase was hedenbergite, the glassy matrix re-mained very rich in iron. Having other minor elements distributed between crystal phases (hedenbergite, magnetite, and sulphides), it was enriched in aluminium and in-compatible elements, such as barium, potassium, sodium, phosphorus, and arsenic.
3.3. Petrographic Analysis of River Aggregate The petrographic analysis of gravel from the river Velika Morava, acquired from the
separation plant “New Separation”, is shown in Figure 6.
Figure 6. Chart of natural river aggregates (RA) shows different rock fragments in the 10/14 mm fraction. An image of the gravel used is in the background.
Figure 6. Chart of natural river aggregates (RA) shows different rock fragments in the 10/14 mmfraction. An image of the gravel used is in the background.
The 10/14 mm fraction consisted mostly of fragments of metamorphic rocks (56%)and the same quantity of sedimentary (23%) and igneous rocks (21%). Within the fragmentsof metamorphic rocks, the most represented were quartzites, then fragments of gneissesand schists. Among sedimentary rocks, sandstones were the most common, but a smallnumber of limestones and cherts were also found. Igneous rocks formed fragments ofspilite-diabase, dacite-andesites, and peridotites (often serpentinized) (Figure 6). Thegravel fragments mostly had spherical and elongated shapes and smooth surfaces. Nomineral grains were found in the tested fraction.
3.4. Geometric, Mechanical and Physical Characteristics of Aggregates
The particle size distribution of the RA and CSA fractions used in the study is shownin Figure 2. The percentage of undersized and oversized grains in the 8/16 mm fraction was3.98% and 2.00%, respectively. For the 16/31.5 mm fraction, the percentage of undersizedgrains was 5.02%, while oversized grains were not detected.
The CSA grains were predominantly cubical and oblong with sharp edges, and theirsurface was smooth to glassy (Figure 1b). The average grain content with an unacceptable(flat) shape was low, amounting only to 5% (Table 3). The shape of natural aggregategrains was mostly oblong and cubical, and the grains had smooth, slightly rough, andsandy-rough surfaces due to the composition of rocks. In contrast, the average percentageof grain with an unfavourable shape was somewhat higher, at 16% (Table 3). The CSAwas classified in the SI15 category and the RA in the SI20 category based on the geometriccharacteristics and grains with unfavourable shape content.
The value of the “Los Angeles” coefficient (LA 10) for the copper slag aggregate usedin the study was almost three times better than the value obtained for the natural aggregate(LA 27). A similar conclusion was reached for resistance to wear: MDE 4% for the CSA,compared to MDE 10% for the natural aggregate (RA). The polished stone value for the CSAwas 43. The results of the particle density test showed that the apparent particle densityof CSA grains (3.33 mg/m3) was higher than the particle density of natural aggregate

Minerals 2021, 11, 439 10 of 19
(2.58 mg/m3). The CSA water-absorption percentage was two times lower than that ofnatural aggregate—0.6% and 1.2%, respectively. The magnesium sulphate test for salt-frostresistance showed that both aggregates were resistant to the effects of frost; i.e., they wereclassified in the highest category, MS18 (Table 3).
Table 3. Physical and mechanical characteristics of aggregates.
Test Methods StandardFraction
(mm)Determined Values Categorised EN 12620
CSA RA CSA RA
Shape index EN 933-48/11 5 SI 15
10/14 16 SI 20
Resistance tofragmentation
SRPS B.B8.045(ASTM C 131) grading B 10 27 - -
Resistance towear
EN 1097-18/11 4 MDE10
10/14 10 MDE10
Polished stonevalue EN 1097-8 standardized 43 -* PSV44 -
Particle density EN 1097-6
8/11ρa 3.40 ρa 3.40ρrd 3.33 ρrd 3.33ρssd 3.36 ρssd 3.36
10/14ρa 2.66 ρa 2.66ρrd 2.58 ρrd 2.58ρssd 2.61 ρssd 2.61
Waterabsorption EN 1097-6
8/11 0.6 WA24 1
10/14 1.2 WA24 2
Magnesiumsulphate test EN 1367-2 10/14 7 12 MS18 MS18
Note: CSA—copper slag aggregate; RA—river aggregate, SI—shape index 3:1 (%); LA—resistance to fragmentation (%); MDE—resistanceto wear (micro-Deval) in a wet state (%); PSV—polished stone value (coefficient); ρa—apparent particle density (mg/m3); ρrd—oven-dried(real) particle density (mg/m3); ρssd—saturated and surface-dried particle density (mg/m3); WA24—water absorption of aggregate (%);MS—magnesium sulphate test (%). * Test was not performed because gravel was not used for wearing course (except for roads with lowtraffic loads and pedestrian and bike lanes).
3.5. Concrete Composition and Characteristics of Fresh Concrete
Three concrete mixtures with different content of recycled aggregate were preparedto examine the influence of CSA on the properties of fresh and hardened concrete. Theparticle size distribution of aggregates used for concrete mixtures is shown in Table 4.
Table 4. Particle size distribution of aggregates used for concrete mixtures
MixturePassing (%) through Sieve Opening (mm)
0.125 0.25 0.5 1 2 4 8 11.2 16 22.4 31.5
Control 1.0 4.0 18.4 28.3 33.8 39.9 54.8 61.2 78.0 90.0 99.620% III + 50% IV 1.0 4.0 18.4 28.3 33.8 39.9 55.4 62.6 77.0 87.4 99.850% III + 50% IV 1.0 4.0 18.4 28.3 33.8 39.9 55.6 64.1 76.9 87.4 99.8
Note: Control—control mixture; III—aggregate fraction 8/16 mm; IV—aggregate fraction 16/31.5 mm.
The concrete mix designs of all mixtures are presented in Table 5. The control concretemixture was designed to meet the requirements for the C25/30 strength class, which is themost commonly used concrete strength class, with a 65% share [35]. The idea was to showthat the CSA could be used in mixtures that were most common in practice. The mass ofall components had constant values during the concrete design; only the second and third

Minerals 2021, 11, 439 11 of 19
mixture had coarse natural aggregate partially replaced with the CSA in vol%. This helpedthe assessment of the impact of the CSA on the behaviour of fresh and hardened concrete.
Table 5. Concrete mix design
Mixture Water River Aggregate (RA) CSA Aggregate Cement W/CM *
mv (0/4) (4/8) (8/16) (16/31.5) (8/16) (16/31.5) mc ω
(kg/m3) (kg/m3) (kg/m3) (kg/m3) (kg/m3) (kg/m3) (kg/m3) (kg/m3) (–)
Control212 732 274
343 428398 0.53320% III + 50% IV 265 143 100 294
50% III + 50% IV 171 214 235 294
* ratio of water to cementitious materials.
The results of tests on fresh concrete mixtures (consistency, density, and air content)are given in Table 6. Based on the obtained results, it can be concluded that the increase inCSA content increased the stiffness of fresh concrete. On the other hand, the mixtures withhigher CSA content had higher densities and lower air content.
Table 6. Results of tests on fresh concrete mixtures.
Mixture Flow Table Test(cm)
Density(kg/m3)
Air Content(%) Categorized EN 12350-5
Control 33.5 2331 1.9 F120% III + 50% IV 32.0 2431 1.7 F150% III + 50% IV 28.5 2443 1.7 F1
Note: Control—control mixture; III—aggregate fraction 8/16 mm; IV—aggregate fraction 16/31.5 mm.
3.6. Physical and Mechanical Characteristics of Hardened Concrete
The results showed that compressive strength was higher for mixtures with CSAthan for the control mixture, regardless of the curing period (Table 7). For example, thecompressive strength for the second (20% III + 50% IV) and third mixture (50% III + 50%IV) showed increases of 12.4% and 10.5%, respectively, after 28 curing days, compared tothe control mixture. The same trend was observed in the case of the concrete density in thehardened state, which was higher by 5% and 7%, respectively.
Based on the obtained results, water penetration depth increased in mixtures withCSA (Table 7). Water absorption in the second (20% III + 50% IV) and third mixture (50%III + 50% IV) was higher by 55% and 28%, respectively, compared to the control mixture.
Table 7. Water penetration depth, compressive strength, and density of concrete.
Compressive Strength (MPa)
Mixture Average WaterPenetration Depth (mm)
After1 Day
After 7Days
After28 Days
Density(kg/m3)
Control 83 16.7 28.0 36.3 230320% III + 50% IV 129 20.1 34.1 40.8 242150% III + 50% IV 106 18.6 30.6 40.1 2462
Standarddeviation 1.7 3.1 2.4
Note: Control—control mixture; III—aggregate fraction 8/16 mm; IV—aggregate fraction 16/31.5 mm.
Resistance to chloride ion penetration was investigated on concrete samples preparedaccording to NT Build 492 standard. Based on the obtained values for chloride penetrationdepth, the effective chloride migration coefficient DRCM was calculated [36]. These valuesare shown in Figure 7.

Minerals 2021, 11, 439 12 of 19
Minerals 2021, 11, x 12 of 19
3.6. Physical and Mechanical Characteristics of Hardened Concrete The results showed that compressive strength was higher for mixtures with CSA
than for the control mixture, regardless of the curing period (Table 7). For example, the compressive strength for the second (20% III + 50% IV) and third mixture (50% III + 50% IV) showed increases of 12.4% and 10.5%, respectively, after 28 curing days, compared to the control mixture. The same trend was observed in the case of the concrete density in the hardened state, which was higher by 5% and 7%, respectively.
Based on the obtained results, water penetration depth increased in mixtures with CSA (Table 7). Water absorption in the second (20% III + 50% IV) and third mixture (50% III + 50% IV) was higher by 55% and 28%, respectively, compared to the control mixture.
Table 7. Water penetration depth, compressive strength, and density of concrete.
Compressive Strength (MPa)
Mixture Average Water
Penetration Depth (mm)
After 1 Day After 7 Days After
28 Days Density (kg/m3)
Control 83 16.7 28.0 36.3 2303 20% III + 50% IV 129 20.1 34.1 40.8 2421 50% III + 50% IV 106 18.6 30.6 40.1 2462
Standard deviation
1.7 3.1 2.4
Note: Control—control mixture; III—aggregate fraction 8/16 mm; IV—aggregate fraction 16/31.5 mm.
Resistance to chloride ion penetration was investigated on concrete samples pre-pared according to NT Build 492 standard. Based on the obtained values for chloride penetration depth, the effective chloride migration coefficient DRCM was calculated [36]. These values are shown in Figure 7.
Figure 7. Results of resistance to chloride ion penetration.
The recorded effective chloride migration coefficient DRCM for the control concrete showed a value of 39.7 × 10⁻¹² cm2/m, while for the second (20% III + 50% IV) and third mixtures (50% III + 50% IV), DRCM was 46.8 × 10⁻¹² cm2/m and 36.0 × 10⁻¹² cm2/m, respec-tively.
Freeze-thaw resistance of concrete in the presence of de-icing salts was tested ac-cording to EN 12390-9. After 28 cycles, mass loss of 0.132 mg/mm2 and 0.181 mg/mm2 were measured on concrete samples from the control and second (20% III + 50% IV) mixture, respectively. The third concrete mixture (50% III + 50% IV) had a significantly higher mass loss of 0.596 mg/mm2 (Figure 8). Visual examination of all concrete mixtures
0
5
10
15
20
25
30
35
40
45
50
Control 20% III + 50% IV 50% III + 50% IV
Chl
orid
e m
igra
tion
coef
ficie
nt D
RCM
,
(x10
-12
m2/
s)
Figure 7. Results of resistance to chloride ion penetration.
The recorded effective chloride migration coefficient DRCM for the control concrete showeda value of 39.7 × 10⁻¹² cm2/m, while for the second (20% III + 50% IV) and third mixtures(50% III + 50% IV), DRCM was 46.8 × 10⁻¹² cm2/m and 36.0 × 10⁻¹² cm2/m, respectively.
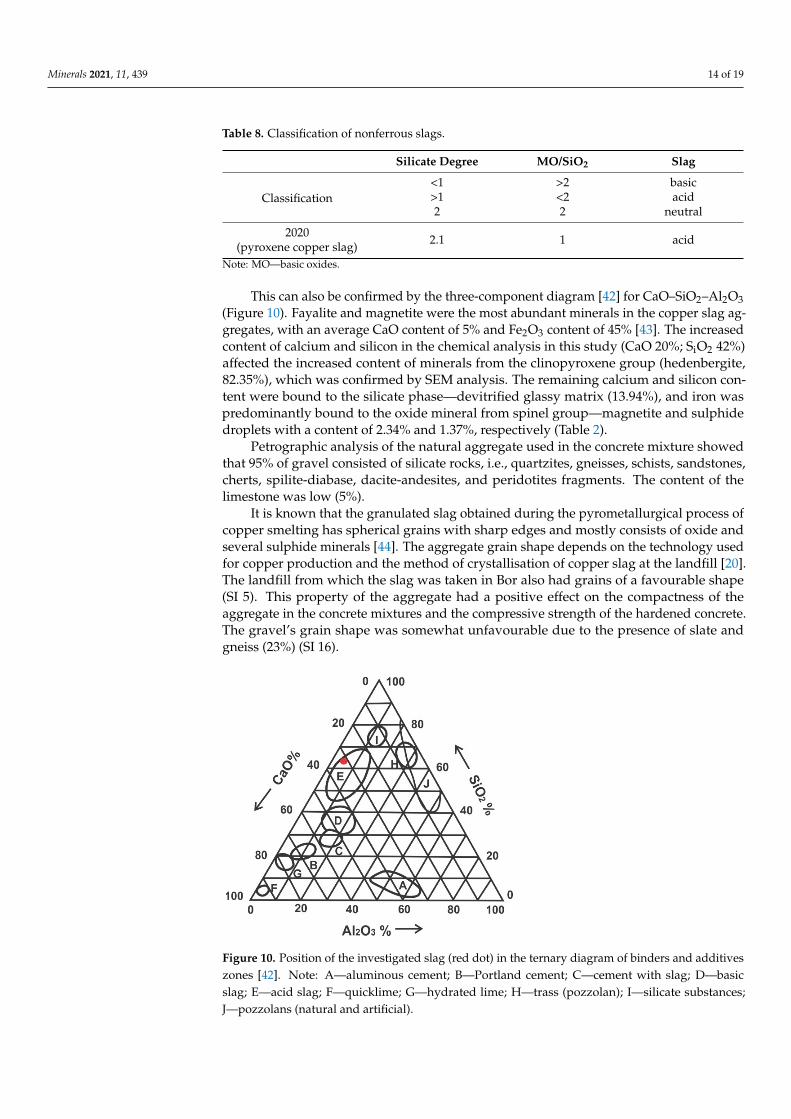
Freeze-thaw resistance of concrete in the presence of de-icing salts was tested accordingto EN 12390-9. After 28 cycles, mass loss of 0.132 mg/mm2 and 0.181 mg/mm2 weremeasured on concrete samples from the control and second (20% III + 50% IV) mixture,respectively. The third concrete mixture (50% III + 50% IV) had a significantly higher massloss of 0.596 mg/mm2 (Figure 8). Visual examination of all concrete mixtures showeddifferent degrees of degradation of the concrete surface (Figure 9). The concrete mixture(50% III + 50% IV) showed not only superficial damage of the fine material, but alsoplucking of the coarse aggregate grains (Figure 9c).
Minerals 2021, 11, x 13 of 19
showed different degrees of degradation of the concrete surface (Figure 9). The concrete mixture (50% III + 50% IV) showed not only superficial damage of the fine material, but also plucking of the coarse aggregate grains (Figure 9c).
Figure 8. Results of salt-frost resistance tests.
(a) control mixture (b) mixture (20% III + 50% IV) (c) mixture (50% III + 50% IV)
Figure 9. Concrete surface degradation after 28 cycles of freeze-thaw and salt exposure. Explanation: (a) visual examina-tion of Control concrete mixture degradation; (b) visual examination of 20% III + 50% IV mixture degradation; (c) visual examination of 50% III + 50% IV mixture degradation. The positions of copper slag aggregate grains are highlighted by red circles.
4. Discussion The properties of copper slag aggregate and natural river aggregate used for con-
crete preparation were investigated in this study. The coarse natural RA was partially replaced (20% and 50% by volume) with CSA. Moreover, the experiments included test-ing of properties of concrete mixtures prepared with both types of aggregate.
The copper slag did not have a uniform chemical composition. Some researchers found that the content of chemical compounds in slag varied (Fe2O3: 35–60%, SiO2: 25–40%, CaO: 2–10%, Al2O3: 3–15%, CuO: 0.3–2.1%, MgO: 0.7–3.5%) [20]. Other researchers suggested that the content of CaO and MgO could be higher (28% and 12%, respectively) [13,37].
The chemical analysis of copper slag sampled from landfills in the vicinity of pro-cessing facilities in Bor at different periods revealed two similar data groups. The first group of analysed slag had a lower content of silicon and calcium and higher content of iron [34,38–40]. The second group of samples had a higher content of silicon and calcium
0
0.1
0.2
0.3
0.4
0.5
0.6
0.7
Control 20% III + 50% IV 50% III + 50%IV
Mas
s los
s (m
g/m
m2)
Concrete mixtures
Figure 8. Results of salt-frost resistance tests.
Minerals 2021, 11, 439 13 of 19
Minerals 2021, 11, x 13 of 19
showed different degrees of degradation of the concrete surface (Figure 9). The concrete mixture (50% III + 50% IV) showed not only superficial damage of the fine material, but also plucking of the coarse aggregate grains (Figure 9c).
Figure 8. Results of salt-frost resistance tests.
(a) control mixture (b) mixture (20% III + 50% IV) (c) mixture (50% III + 50% IV)
Figure 9. Concrete surface degradation after 28 cycles of freeze-thaw and salt exposure. Explanation: (a) visual examina-tion of Control concrete mixture degradation; (b) visual examination of 20% III + 50% IV mixture degradation; (c) visual examination of 50% III + 50% IV mixture degradation. The positions of copper slag aggregate grains are highlighted by red circles.
4. Discussion The properties of copper slag aggregate and natural river aggregate used for con-
crete preparation were investigated in this study. The coarse natural RA was partially replaced (20% and 50% by volume) with CSA. Moreover, the experiments included test-ing of properties of concrete mixtures prepared with both types of aggregate.
The copper slag did not have a uniform chemical composition. Some researchers found that the content of chemical compounds in slag varied (Fe2O3: 35–60%, SiO2: 25–40%, CaO: 2–10%, Al2O3: 3–15%, CuO: 0.3–2.1%, MgO: 0.7–3.5%) [20]. Other researchers suggested that the content of CaO and MgO could be higher (28% and 12%, respectively) [13,37].
The chemical analysis of copper slag sampled from landfills in the vicinity of pro-cessing facilities in Bor at different periods revealed two similar data groups. The first group of analysed slag had a lower content of silicon and calcium and higher content of iron [34,38–40]. The second group of samples had a higher content of silicon and calcium
0
0.1
0.2
0.3
0.4
0.5
0.6
0.7
Control 20% III + 50% IV 50% III + 50%IV
Mas
s los
s (m
g/m
m2)
Concrete mixtures
Figure 9. Concrete surface degradation after 28 cycles of freeze-thaw and salt exposure. Explanation: (a) visual examinationof Control concrete mixture degradation; (b) visual examination of 20% III + 50% IV mixture degradation; (c) visualexamination of 50% III + 50% IV mixture degradation. The positions of copper slag aggregate grains are highlighted byred circles.
4. Discussion
The properties of copper slag aggregate and natural river aggregate used for concretepreparation were investigated in this study. The coarse natural RA was partially replaced(20% and 50% by volume) with CSA. Moreover, the experiments included testing ofproperties of concrete mixtures prepared with both types of aggregate.
The copper slag did not have a uniform chemical composition. Some researchers foundthat the content of chemical compounds in slag varied (Fe2O3: 35–60%, SiO2: 25–40%, CaO:2–10%, Al2O3: 3–15%, CuO: 0.3–2.1%, MgO: 0.7–3.5%) [20]. Other researchers suggestedthat the content of CaO and MgO could be higher (28% and 12%, respectively) [13,37].
The chemical analysis of copper slag sampled from landfills in the vicinity of pro-cessing facilities in Bor at different periods revealed two similar data groups. The firstgroup of analysed slag had a lower content of silicon and calcium and higher contentof iron [34,38–40]. The second group of samples had a higher content of silicon and cal-cium and a lower content of iron [31]. The slag used in this research was taken from thesecond group.
Nonferrous slags, such as copper slag, can be classified either as basic, acid, or neutral,based on the silicate degree and ratio of basic and acid oxides. The silicate degree and ratioof basic and acid oxides [41] can be calculated as:
Silicate degree =moles of acid oxygen from SiO2
moles if basic oxygen from CaO, MgO, FeO(1)
MOSiO2
, where MO is basic oxides (2)
Based on these formulas, the silicate degree for this pyroxene copper slag was 2.1, andthe ratio of basic oxides and silicon oxide was 1. According to the proposed categorization(Table 8), the tested slag belonged to the group of acid slags.
Minerals 2021, 11, 439 14 of 19
Table 8. Classification of nonferrous slags.
Silicate Degree MO/SiO2 Slag
Classification<1 >2 basic>1 <2 acid2 2 neutral
2020(pyroxene copper slag) 2.1 1 acid
Note: MO—basic oxides.
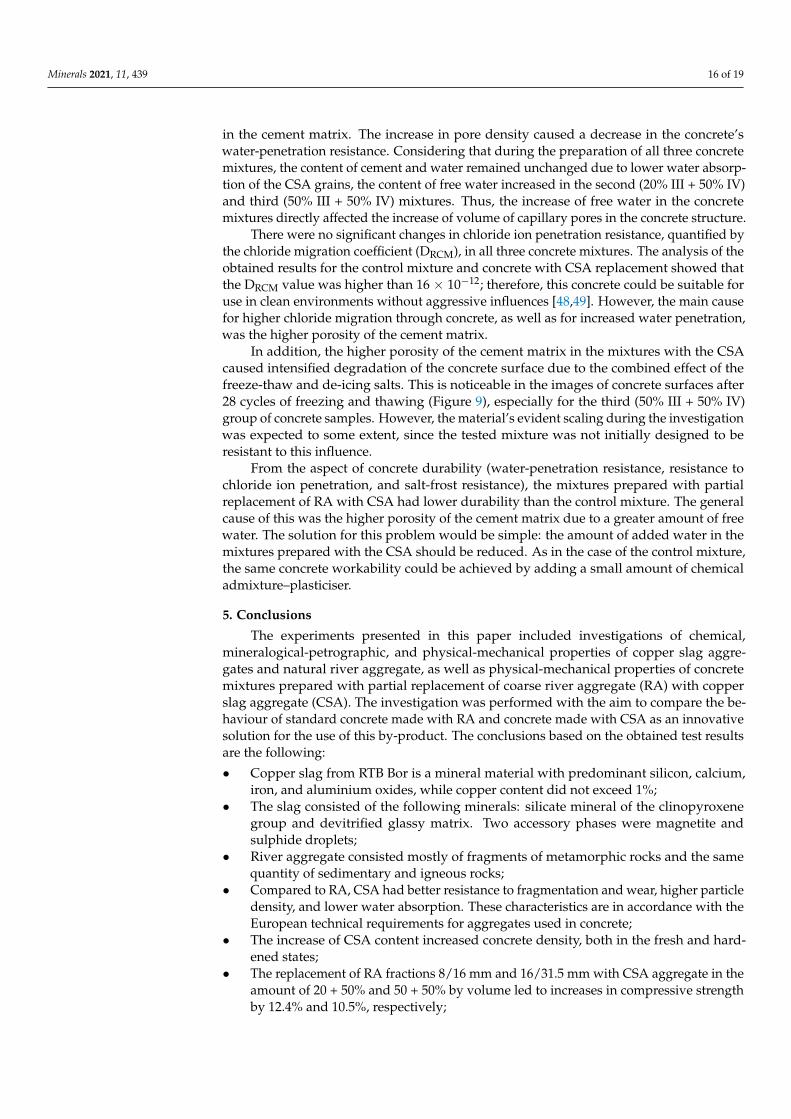
This can also be confirmed by the three-component diagram [42] for CaO–SiO2–Al2O3(Figure 10). Fayalite and magnetite were the most abundant minerals in the copper slag ag-gregates, with an average CaO content of 5% and Fe2O3 content of 45% [43]. The increasedcontent of calcium and silicon in the chemical analysis in this study (CaO 20%; SiO2 42%)affected the increased content of minerals from the clinopyroxene group (hedenbergite,82.35%), which was confirmed by SEM analysis. The remaining calcium and silicon con-tent were bound to the silicate phase—devitrified glassy matrix (13.94%), and iron waspredominantly bound to the oxide mineral from spinel group—magnetite and sulphidedroplets with a content of 2.34% and 1.37%, respectively (Table 2).
Petrographic analysis of the natural aggregate used in the concrete mixture showedthat 95% of gravel consisted of silicate rocks, i.e., quartzites, gneisses, schists, sandstones,cherts, spilite-diabase, dacite-andesites, and peridotites fragments. The content of thelimestone was low (5%).
It is known that the granulated slag obtained during the pyrometallurgical process ofcopper smelting has spherical grains with sharp edges and mostly consists of oxide andseveral sulphide minerals [44]. The aggregate grain shape depends on the technology usedfor copper production and the method of crystallisation of copper slag at the landfill [20].The landfill from which the slag was taken in Bor also had grains of a favourable shape(SI 5). This property of the aggregate had a positive effect on the compactness of theaggregate in the concrete mixtures and the compressive strength of the hardened concrete.The gravel’s grain shape was somewhat unfavourable due to the presence of slate andgneiss (23%) (SI 16).
Minerals 2021, 11, x 14 of 19
and a lower content of iron [31]. The slag used in this research was taken from the second group.
Nonferrous slags, such as copper slag, can be classified either as basic, acid, or neu-tral, based on the silicate degree and ratio of basic and acid oxides. The silicate degree and ratio of basic and acid oxides [41] can be calculated as: Silicate degree = moles of acid oxygen from SiOmoles if basic oxygen from CaO, MgO, FeO (1)
MOSiO , where MO is basic oxides (2)
Based on these formulas, the silicate degree for this pyroxene copper slag was 2.1, and the ratio of basic oxides and silicon oxide was 1. According to the proposed catego-rization (Table 8), the tested slag belonged to the group of acid slags.
Table 8. Classification of nonferrous slags.
Silicate Degree MO/SiO2 Slag
Classification <1 >2 basic >1 <2 acid 2 2 neutral
2020 (pyroxene copper slag)
2.1 1 acid
Note: MO—basic oxides.
This can also be confirmed by the three-component diagram [42] for CaO–SiO2–Al2O3 (Figure 10). Fayalite and magnetite were the most abundant minerals in the copper slag aggregates, with an average CaO content of 5% and Fe2O3 content of 45% [43]. The increased content of calcium and silicon in the chemical analysis in this study (CaO 20%; SiO2 42%) affected the increased content of minerals from the clinopyroxene group (hedenbergite, 82.35%), which was confirmed by SEM analysis. The remaining calcium and silicon content were bound to the silicate phase—devitrified glassy matrix (13.94%), and iron was predominantly bound to the oxide mineral from spinel group—magnetite and sulphide droplets with a content of 2.34% and 1.37%, respectively (Table 2).
Figure 10. Position of the investigated slag (red dot) in the ternary diagram of binders and addi-tives zones [42]. Note: A—aluminous cement; B—Portland cement; C—cement with slag; D—basic slag; E—acid slag; F—quicklime; G—hydrated lime; H—trass (pozzolan); I—silicate substances; J—pozzolans (natural and artificial).
Figure 10. Position of the investigated slag (red dot) in the ternary diagram of binders and additiveszones [42]. Note: A—aluminous cement; B—Portland cement; C—cement with slag; D—basicslag; E—acid slag; F—quicklime; G—hydrated lime; H—trass (pozzolan); I—silicate substances;J—pozzolans (natural and artificial).

Minerals 2021, 11, 439 15 of 19
The resistance to fragmentation of the CSA was more favourable compared to the RA.The obtained values for resistance to fragmentation of the CSA and RA were LA 10% and26%, respectively. This means that the CSA grains were almost three times more resistant tofragmentation than the RA grains. The results of the micro-Deval test on resistance to wearfor the CSA and RA samples were MDE 4% and 10%, respectively. The obtained valuesindicated better resistance to wear for the CSA samples. This confirmed that granulatedcopper slag had favourable technical properties such as strength and resistance to wear [45].
The polished stone value of CSA was PSV 43. The obtained value was in accordancewith the visual perception of a strong, compact aggregate with fine-grained, smooth toglassy grain surfaces (Figure 1b). The polished stone value of this type of slag was lowerthan the determined value for steel slag (PSV 54); however, it was higher than the valuedetermined for limestone (PSV 34, 37) [46].
The particle-density tests results showed that the actual particle density of the CSAwas 3.33 mg/m3, which was 22.5% higher compared to the RA (2.58 mg/m3). However,water absorption of the CSA was two times lower than water absorption of the RA (0.6%and 1.2%, respectively). The investigated aggregates’ properties indicated that the concretemixture with a higher copper slag aggregate content had higher values of density than thecontrol mixture, both in fresh and hardened states.
Some researchers determined that the values of water absorption and particle densityalso depended on the method of crystallization of copper slag at the landfill. Amorphousstructures created by adding water during the cooling process had higher water absorptionand lower particle density than those cooled in the air due to a more porous texture [20].The internal structure of the granulated copper slag was glassy [47]. Compared to theabove-mentioned slag, the slag from the landfill at RTB Bor was cooled in air, withoutwater, and therefore it had a higher particle density and lower water absorption. The slag’scavities were sporadically present (Figure 1c, d); however, they had micrometre dimensionsand did not retain water, which was determined by lower water absorption of the copperslag aggregate (CSA) compared to the natural aggregate (NA).
Both investigated aggregates were resistant to frost and belonged to the MS18 category.However, the copper slag was more resistant to frost (MS 7) than the river gravel (MS 12)because the presence of slate and peridotite reduced its frost resistance.
The increase of CSA content in concrete mixtures resulted in stiffer consistency com-pared to the control mixture. This occurred because the CSA grains had a larger specificsurface and less mobility. The CSA grains were rougher and had sharper edges than theRA grains, which caused greater friction between the grains. The amount of used CSA didnot have a significant effect on entrained air content in the fresh concrete mixtures.
The densities of fresh concrete from the second (20% III + 50% IV) and the third group(50% III + 50% IV) were higher by 4% and 5%, respectively, compared to the control mixture.The hardened concrete densities from the second (20% III + 50% IV) and the third group(50% III + 50% IV) were higher by 5% and 7%, respectively, compared to the control mixture.This occurred due to the higher particle density of the CSA compared to the RA. Basedon the flow-table test, the tested concrete mixtures were categorized as class F1. Concretemixtures from the second (20% III + 50% IV) and third (50% III + 50% IV) groups had highercompressive strength by 12.4% and 10.5%, respectively, after 28 days of curing. The highercompressive strength of the CSA grains and better interaction between them due to theirroughness and sharp edges caused the increase in the mixtures’ compressive strengths.The standard deviations for compressive strength of control mixture and concrete mixturesfrom the second and third group after 1, 7, and 28 days of curing amounted to 1.7, 3.1, and2.4, respectively.
The water-penetration resistance of concrete from the second (20% III + 50% IV) andthird (50% III + 50% IV) groups were lower by 55.4% and 27.7%, respectively, comparedto the control mixture. At first, this did not seem logical since the CSA grains had lowerwater absorption than the RA. However, the water-penetration resistance of concretelargely depends on the concrete mixture’s compactness, i.e., the presence of capillary pores
Minerals 2021, 11, 439 16 of 19
in the cement matrix. The increase in pore density caused a decrease in the concrete’swater-penetration resistance. Considering that during the preparation of all three concretemixtures, the content of cement and water remained unchanged due to lower water absorp-tion of the CSA grains, the content of free water increased in the second (20% III + 50% IV)and third (50% III + 50% IV) mixtures. Thus, the increase of free water in the concretemixtures directly affected the increase of volume of capillary pores in the concrete structure.
There were no significant changes in chloride ion penetration resistance, quantified bythe chloride migration coefficient (DRCM), in all three concrete mixtures. The analysis of theobtained results for the control mixture and concrete with CSA replacement showed thatthe DRCM value was higher than 16 × 10−12; therefore, this concrete could be suitable foruse in clean environments without aggressive influences [48,49]. However, the main causefor higher chloride migration through concrete, as well as for increased water penetration,was the higher porosity of the cement matrix.
In addition, the higher porosity of the cement matrix in the mixtures with the CSAcaused intensified degradation of the concrete surface due to the combined effect of thefreeze-thaw and de-icing salts. This is noticeable in the images of concrete surfaces after28 cycles of freezing and thawing (Figure 9), especially for the third (50% III + 50% IV)group of concrete samples. However, the material’s evident scaling during the investigationwas expected to some extent, since the tested mixture was not initially designed to beresistant to this influence.
From the aspect of concrete durability (water-penetration resistance, resistance tochloride ion penetration, and salt-frost resistance), the mixtures prepared with partialreplacement of RA with CSA had lower durability than the control mixture. The generalcause of this was the higher porosity of the cement matrix due to a greater amount of freewater. The solution for this problem would be simple: the amount of added water in themixtures prepared with the CSA should be reduced. As in the case of the control mixture,the same concrete workability could be achieved by adding a small amount of chemicaladmixture–plasticiser.
5. Conclusions
The experiments presented in this paper included investigations of chemical,mineralogical-petrographic, and physical-mechanical properties of copper slag aggre-gates and natural river aggregate, as well as physical-mechanical properties of concretemixtures prepared with partial replacement of coarse river aggregate (RA) with copperslag aggregate (CSA). The investigation was performed with the aim to compare the be-haviour of standard concrete made with RA and concrete made with CSA as an innovativesolution for the use of this by-product. The conclusions based on the obtained test resultsare the following:
• Copper slag from RTB Bor is a mineral material with predominant silicon, calcium,iron, and aluminium oxides, while copper content did not exceed 1%;
• The slag consisted of the following minerals: silicate mineral of the clinopyroxenegroup and devitrified glassy matrix. Two accessory phases were magnetite andsulphide droplets;
• River aggregate consisted mostly of fragments of metamorphic rocks and the samequantity of sedimentary and igneous rocks;
• Compared to RA, CSA had better resistance to fragmentation and wear, higher particledensity, and lower water absorption. These characteristics are in accordance with theEuropean technical requirements for aggregates used in concrete;
• The increase of CSA content increased concrete density, both in the fresh and hard-ened states;
• The replacement of RA fractions 8/16 mm and 16/31.5 mm with CSA aggregate in theamount of 20 + 50% and 50 + 50% by volume led to increases in compressive strengthby 12.4% and 10.5%, respectively;
Minerals 2021, 11, 439 17 of 19
• Lower water absorption of the CSA compared to the RA, with an unchanged amountof cement and water, caused an increase in the porosity of the cement matrix;
• Increased cement-matrix porosity resulted in reduced water penetration resistanceand salt-frost resistance in concrete mixtures with CSA;
• The resistance to chloride ion penetration of the CSA mixtures was not significantlychanged compared to the control mixture.
In order to increase the durability of concrete made with CSA, the amount of waterused for mixture preparation should be reduced because of the lower water absorption ofCSA. This way, the effective amount of water could stay constant, which would increasethe overall durability of concrete.
Author Contributions: Conceptualization, D.Z.; methodology, formal analysis, investigation, re-sources and data curation, S.F., O.Ð., and A.R.; writing—original draft preparation, S.F.; writing—review and editing, O.Ð., A.R., and D.Z.; visualization, S.F. and O.Ð.; supervision, A.R. and D.Z.;project administration, D.Z. and S.F.; funding acquisition, S.F. All authors have read and agreed tothe published version of the manuscript.
Funding: The presented study is a part of the research financially supported by the Ministry ofEducation, Science and Technological Development of the Republic of Serbia, research project GrantNo. 451-03-9/2021-14/200052 and No. 200092, Faculty of Civil Engineering University of Belgrade.
Data Availability Statement: The data presented in this study are available on request from thecorresponding author.
Acknowledgments: We are kindly thankful to the Laboratory for Mineral Processing of the Miningand Metallurgy Institute Bor and Laboratory for stone and stone aggregates, and the HighwayInstitute Belgrade for funding part of the laboratory work. The authors wish to thank TamaraUroševic and Marija Zec for help with the chemical analyses, Vedran Carevic for help with resistanceto chloride ion penetration tests, and Silvana Dimitrijevic for help with SEM-EDS analyses.
Conflicts of Interest: The authors declare no conflict of interest.
References1. Tam, C.; Taylor, M.; Gielen, D.; Twigg, C.; Klee, H.; Rocha, P.; Meer, R. Cement Technology Roadmap 2009—Carbon Emissions
Reductions up to 2050; World Business Council for Sustainable Development: Geneva, Switzerland, 2009.2. Zhao, Q.; Liu, X.; Jiang, J. Effect of curing temperature on creep behavior of fly ash concrete. Constr. Build. Mater. 2015, 96,
326–333. [CrossRef]3. Al-Jabri, K.S.; Hisada, M.; Al-Saidy, A.H.; Al-Oraimi, S.K. Performance of high strength concrete made with copper slag as a fine
aggregate. Constr. Build. Mater. 2009, 23, 2132–2140. [CrossRef]4. Sankh, A.C.; Biradar, P.M.; Naghathan, S.J.; Ishwargol, M.B. Recent Trends in Replacement of Natural Sand with Different
Alternatives Akshay. IOSR J. Mech. Civ. Eng. (IOSR-JMCE) 2002, 12, 180–183.5. De Leeuw, J.; Shankman, D.; Wu, G.; de Boer, W.F.; Burnham, J.; He, Q.; Yesou, H.; Xiao, J. Strategic assessment of the magnitude
and impacts of sand mining in Poyang Lake, China. Reg. Environ. Chang. 2010, 10, 95–102. [CrossRef]6. Kuntikana, G.; Singh, D.N. Contemporary Issues Related to Utilization of Industrial Byproducts. Adv. Civ. Eng. Mater. 2017,
6, 20160050. [CrossRef]7. Maharishi, A.; Singh, S.P.; Gupta, L.K. Shehnazdeep Strength and durability studies on slag cement concrete made with copper
slag as fine aggregates. Mater. Today Proc. 2020. [CrossRef]8. Prasad, P.S.; Ramana, G.V. Feasibility study of copper slag as a structural fill in reinforced soil structures. Geotext. Geomembr. 2016,
44, 623–640. [CrossRef]9. Alter, H. The composition and environmental hazard of copper slags in the context of the Basel Convention. Resour. Conserv.
Recycl. 2005, 43, 353–360. [CrossRef]10. Sharma, R.; Khan, R.A. Sustainable use of copper slag in self compacting concrete containing supplementary cementitious
materials. J. Clean. Prod. 2017, 151, 179–192. [CrossRef]11. Baghalha, M.; Papangelakis, V.G.; Curlook, W. Factors affecting the leachability of Ni/Co/Cu slags at high temperature.
Hydrometallurgy 2007, 85, 42–52. [CrossRef]12. Zivkovic, Z.; Mitevska, N.; Mihajlovic, I.; Nikolic, D. The influence of the silicate slag composition on copper losses during
smelting of the sulfide concentrates. J. Min. Metall. Sect. B Metall. 2009, 45, 23–34. [CrossRef]13. Wang, D.; Wang, Q.; Huang, Z. Reuse of copper slag as a supplementary cementitious material: Reactivity and safety. Resour.
Conserv. Recycl. 2020, 162, 105037. [CrossRef]

Minerals 2021, 11, 439 18 of 19
14. Dhir, R.K.; de Brito, J.; Mangabhai, R.; Lye, C.Q. Use of Copper Slag in Geotechnical Applications. In Sustainable ConstructionMaterials: Copper Slag; Elsevier: Amsterdam, The Netherlands, 2017; pp. 211–245.
15. Dimitrijevic, M.; Urosevic, D.; Milic, S.; Sokic, M.; Markovic, R. Dissolution of copper from smelting slag by leaching in chloridemedia. J. Min. Metall. Sect. B Metall. 2017, 53, 407–412. [CrossRef]
16. Sharma, R.; Khan, R.A. Durability assessment of self compacting concrete incorporating copper slag as fine aggregates. Constr.Build. Mater. 2017, 155, 617–629. [CrossRef]
17. Dey, A.; Dev, D.; Saha, P. Use of copper slag as sustainable aggregate. Icsci 2014 2015, 1, 229–240.18. Khanzadi, M.; Behnood, A. Mechanical properties of high-strength concrete incorporating copper slag as coarse aggregate. Constr.
Build. Mater. 2009, 23, 2183–2188. [CrossRef]19. Al-Jabri, K.S.; Al-Saidy, A.H.; Taha, R. Effect of copper slag as a fine aggregate on the properties of cement mortars and concrete.
Constr. Build. Mater. 2011, 25, 933–938. [CrossRef]20. Shi, C.; Meyer, C.; Behnood, A. Utilization of copper slag in cement and concrete. Resour. Conserv. Recycl. 2008, 52, 1115–1120.
[CrossRef]21. Neves, R.; Branco, F.; de Brito, J. Field assessment of the relationship between natural and accelerated concrete carbonation
resistance. Cem. Concr. Compos. 2013, 41, 9–15. [CrossRef]22. Gorai, B.; Jana, R.K. Premchand Characteristics and utilisation of copper slag—A review. Resour. Conserv. Recycl. 2003, 39,
299–313. [CrossRef]23. Shi, C.; Qian, J. High performance cementing materials from industrial slags—A review. Resour. Conserv. Recycl. 2000, 29, 195–207.
[CrossRef]24. Mavroulidou, M. Mechanical Properties and Durability of Concrete with Water Cooled Copper Slag Aggregate. Waste Biomass
Valorization 2017, 8, 1841–1854. [CrossRef]25. Lori, A.R.; Hassani, A.; Sedghi, R. Investigating the mechanical and hydraulic characteristics of pervious concrete containing
copper slag as coarse aggregate. Constr. Build. Mater. 2019, 197, 130–142. [CrossRef]26. Ibrahim, H.A.; Abdul Razak, H. Effect of palm oil clinker incorporation on properties of pervious concrete. Constr. Build. Mater.
2016, 115, 70–77. [CrossRef]27. Zarauskas, L.; Skripkiunas, G.; Girskas, G. Influence of Aggregate Granulometry on Air Content in Concrete Mixture and
Freezing—Thawing Resistance of Concrete. Procedia Eng. 2017, 172, 1278–1285. [CrossRef]28. Aligizaki, K.K. Pore Structure of Cement-Based Materials; CRC Press: Boca Raton, FL, USA, 2005; ISBN 9780429079313.29. Yeih, W.; Fu, T.C.; Chang, J.J.; Huang, R. Properties of pervious concrete made with air-cooling electric arc furnace slag as
aggregates. Constr. Build. Mater. 2015, 93, 737–745. [CrossRef]30. Zhang, Z.; Zhang, Y.; Yan, C.; Liu, Y. Influence of crushing index on properties of recycled aggregates pervious concrete. Constr.
Build. Mater. 2017, 135, 112–118. [CrossRef]31. Cadjenovic, B.; Marjanovic, V.; Ljubojev, V.; Milanovic, D. Possibilities of use the copper matte from smelter slag in its direct
bakrenca of smelting slag in its direct discharge from furnace. Min. Eng. 2012, 143–148. [CrossRef]32. Ðordevic, J.; Oreškovic, M.; Mladenovic, G. The possibility of the application of copper slag in asphalt mixtures. J. Road Traffic
Eng. 2018, 64. [CrossRef]33. Maluckov, B. Waste from mining-metallurgical production of copper and treatment of it. Tehnika 2017, 72, 819–824. [CrossRef]34. Stanojlovic, R.; Štirbanovic, Z.; Sokolovic, J. New technological procedure for sustainable processing of mining technological
waste. Min. Eng. 2012, 1, 75–88. [CrossRef]35. Jevtic, D.; Zakic, D.; Savic, A.; Radevic, A. Statistical analysis of concrete quality testing results. Build. Mater. Struct. 2014, 57,
45–52. [CrossRef]36. Castellote, M.; Andrade, C.; Alonso, C. Measurement of the steady and non-steady-state chloride diffusion coefficients in a
migration test by means of monitoring the conductivity in the anolyte chamber. Comparison with natural diffusion tests. Cem.Concr. Res. 2001, 31, 1411–1420. [CrossRef]
37. Killick, D.; Miller, D.; Thondhlana, T.P.; Martinón-Torres, M. Copper mining and smelting technology in the northern Lowveld,South Africa, ca. 1000 CE to ca. 1880 CE. J. Archaeol. Sci. 2016, 75, 10–26. [CrossRef]
38. Marinkovic, L. Contribution to Investigations on the Possibility of Copper Blast Furnace Slag from Bor Usage in Pavements Construction;The University of Belgrade, Faculty of Civil Engineering: Belgrade, Serbia, 1989.
39. Gržetic, I.; Brceski, I. Degradation of Bor slags as the contamination process. In Proceedings of the Naša ekološka istina ’95, Hotel“Jezero”, Borsko jezero, Bor, Serbia, 31 May–2 June 1995; pp. 95–100.
40. Uroševic, D. Copper Extraction from Smelting Slag by Combined Methods; University of Belgrade, Technical faculty in Bor: Belgrade,Serbia, 2016.
41. Ray, H.S.; Sridhar, R.; Abraham, K.P. Extraction of Nonferrous Metals; EWP: New Delhi, India, 2014; ISBN 8185095639.42. Brzakovic, P. Prilog problemu sistematizacije veziva na bazi cementnog klinkera i dodataka nemetalicnog porekla. Gradevinski
Mater. Konstr. 2002, 45, 23–33.43. Dhir Obe, R.K.; de Brito, J.; Mangabhai, R.; Lye, C.Q. Sustainable Construction Materials: Copper Slag; Woodhead Publishing:
London, UK, 2016; ISBN 9780081009864.44. Ljubojev, V.; Marjanovic, V.; Milanovic, D.; Stankovic, S. Mineralogical characteristics of slag (from the Flotation plant of RTB Bor)
granulated in the laboratory conditions. Min. Metall. Eng. Bor. 2015, 1–12. [CrossRef]

Minerals 2021, 11, 439 19 of 19
45. Moosberg, H.; Lagerblad, B.; Forssberg, E. The use of by-products from metallurgical and mineral industries as filler in cement-based materials. Waste Manag. Res. 2003, 21, 29–37. [CrossRef]
46. Crisman, B.; Ossich, G.; Bevilacqua, P.; Roberti, R. Degradation prediction model for friction of road pavements with naturalaggregates and steel slags. Appl. Sci. 2020, 10, 32. [CrossRef]
47. Feng, Y.; Yang, Q.; Chen, Q.; Kero, J.; Andersson, A.; Ahmed, H.; Engström, F.; Samuelsson, C. Characterization and evaluation ofthe pozzolanic activity of granulated copper slag modified with CaO. J. Clean. Prod. 2019, 232, 1112–1120. [CrossRef]
48. Yuan, Q.; Santhanam, M. Erratum to: Test Methods for Chloride Transport in Concrete. In Performance of Cement-Based Materials inAggressive Aqueous Environments; Springer: Dordrecht, The Netherlands, 2013; p. E1.
49. Ugur, I.; Demirdag, S.; Yavuz, H. Effect of rock properties on the Los Angeles abrasion and impact test characteristics of theaggregates. Mater. Charact. 2010, 61, 90–96. [CrossRef]


![Impact analysis of Mg slag[1]](https://img.pdfslide.net/doc/110x75/631df2590ff042c6110c1bf6/impact-analysis-of-mg-slag1.jpg)


