Embed Size (px)
Citation preview
Applied Catalysis A: General 268 (2004) 127–138
Coprecipitated iron-containing catalysts (Fe-Al2O3, Fe-Co-Al2O3,Fe-Ni-Al2O3) for methane decomposition at moderate temperatures
I. Genesis of calcined and reduced catalysts
T.V. Reshetenkoa,∗, L.B. Avdeevaa, A.A. Khassina, G.N. Kustovaa, V.A. Ushakova,E.M. Moroza, A.N. Shmakova, V.V. Kriventsova, D.I. Kochubeya, Yu.T. Pavlyukhinb,
A.L. Chuvilin a, Z.R. Ismagilova
a Boreskov Institute of Catalysis, Pr. Akademika Lavrentieva 5, Novosibirsk 630090, Russiab Institute of Solid State Chemistry and Mechanochemistry, Ul. Kutateladze 18, Novosibirsk 630128, Russia
Received in revised form 9 February 2004; accepted 17 March 2004
Abstract
Genesis of the composition and structure of the active component of coprecipitated iron containing catalysts (Fe-Al2O3, Fe-Co-Al2O3,Fe-Ni-Al2O3) with high metal loadings (>50 wt.%) for methane decomposition at moderate temperatures (600–650◦C) has been investigated byXRD, EXAFS, radial electron density distribution (REDD), TEM, FTIR and Mössbauer spectroscopy. The main stages of the catalyst genesisduring drying, thermal decomposition and reduction have been studied. For bimetallic systems (Fe-Co-Al2O3, Fe-Ni-Al2O3) intermediatespinel phases with a composition (MII , Fe)3O4 (M = Co, Ni) have been shown to form during heat treatment and reduction. This leads toa decrease of the reduction temperature for iron oxides. Reduced bimetallic catalysts (Fe-Co-Al2O3, Fe-Ni-Al2O3) are composed of alloys.The structure and parameters of their crystal lattices depend on the type and concentration of the added metal. Alumina has been shown tobehave as a structural promoter. A model of the reduced catalysts consisting of highly dispersed (20–50 nm) metal and alumina particles witha spinel phase at their interface has been suggested.© 2004 Elsevier B.V. All rights reserved.
Keywords: Iron-alumina; Iron-cobalt-alumina; Iron-nickel-alumina; Reduction; FTIR spectroscopy; X-ray diffraction; EXAFS; Radial electron densitydistribution
1. Introduction
Methane decomposition over metal catalysts based on irongroup metals (Ni, Co, Fe) and their alloys (Ni–Cu) has greatpractical importance, primarily, as a promising ecologicallybenign method for methane conversion to hydrogen and car-bon [1–9]. Numerous studies of Ni, Co and Fe catalysts inCO disproportionation, methane reforming, and decomposi-tion of hydrocarbons showed that these catalysts initiate theformation of filamentary carbon with graphite-like structure[3,10–16]. Development of electron microscopy techniquesresulted in the appearance of a number of studies devoted tothe investigation of the structure of catalytic filamentary car-
∗ Corresponding author. Fax:+7-3832-34-30-56.E-mail address: t [email protected] (T.V. Reshetenko).
bon (CFC)[17–19]. Its study led to development of effectivecatalysts for methane decomposition based on Fe, Co and Ni.
For instance, coprecipitated Ni-Al2O3 and Co-Al2O3catalysts with high metal loadings have been found to ex-hibit considerable activity in methane decomposition at500–550◦C. The amount of CFC formed over a catalyst canbe as high as 100 g/gcat for 90 wt.% Ni-Al2O3 and 45 g/gcatfor 75 wt.% Co-Al2O3 at 550 and 500◦C, correspondingly[3,4]. CFC formed in this reaction is classic filamentarycarbon having one carbon filament growing from a singlecatalyst particle located at the growing end of the filament.In this case, the filament consists of graphite-like layersinserted into each other in the form of cones. The meandiameter of the carbon filaments is 50 nm for CFC (Ni) and20 nm for CFC (Co). The nature of the catalyst affects themicrostructure of the carbon filaments. This is reflected inthe variation of the angle between the graphite-like layers
0926-860X/$ – see front matter © 2004 Elsevier B.V. All rights reserved.doi:10.1016/j.apcata.2004.03.045
128 T.V. Reshetenko et al. / Applied Catalysis A: General 268 (2004) 127–138
and the filament axis, which varies from 45◦ for CFC (Ni)to 15◦ for CFC (Co)[3,4].
Investigation of iron-containing catalysts for methanedecomposition is of great interest because one can expectthe formation of CFC with different filament microstruc-ture. Our analysis of the literature data indicates that COdisproportionation and decomposition of hydrocarbons, in-cluding methane, over iron catalysts is accompanied by theformation of carbon nanotubes[7,9,11,20–26]. First studiesof catalytic decomposition of methane over iron catalystswere performed at 800–900◦C with the goal of obtaininghydrogen. However, the catalysts rapidly deactivated underthese conditions[27]. The mechanism of carbon nanotubeformation during decomposition of CH4 + H2 mixture athigh temperatures (1000–1100◦C) using a suspension of12 nm Fe particles was studied in[20,21]. Investigation ofthe effect of the type of oxide promoter resistant to reduction(SiO2, TiO2, Al2O3, ZrO2) on the activity of iron catalystsfor methane decomposition prepared by a sol–gel techniqueshowed that the highest carbon yield (45 g/gFe) was obtainedover 85 wt.% Fe-SiO2 at temperatures above 680◦C [9].
Our group was the first to study iron-containing cata-lysts in methane decomposition at moderate temperatures(600–650◦C) [7,8,28]. Coprecipitation of the componentsfrom solution of their salts with aqueous ammonia and am-monium bicarbonate was shown to be an optimum methodfor synthesis of Fe-Al2O3, Fe-Co-Al2O3 and Fe-Ni-Al2O3catalysts for carbon accumulation. We showed that theintroduction of 3–10 wt.% Co (or Ni) to a Fe-Al2O3 cat-alyst led to a two–three-fold increase in the yield ofcarbon with nanotube structure. It reached 52.4 g/gcat for50 wt.% Fe–6 wt.% Co–44 wt.% Al2O3 catalyst. Thus, asecond metal has a promoting effect on the performance ofiron-containing catalysts.
The current work is a continuation of these earlier studies.Its goal was a detailed study of the active component genesisin coprecipitated Fe-Al2O3, Fe-Co-Al2O3 and Fe-Ni-Al2O3catalysts and determination of factors responsible for thepromoting effect of the second metal during drying, heattreatment and reduction of the catalysts.
2. Experimental section
The catalysts were prepared by coprecipitation as de-scribed elsewhere[29,30]. Precipitation was carried outfrom aqueous solutions of metal nitrates: Fe(NO3)3·9H2O,Co(NO3)2·6H2O, Ni(NO3)2·6H2O and Al(NO3)3·9H2O inknown proportions at room temperature. Aqueous ammoniawas used as a precipitation agent for synthesis of Fe-Al2O3and Fe-Co-Al2O3. Ammonium bicarbonate was used forFe-Ni-Al2O3. Table 1presents data on studied samples ofthe catalysts, their composition and type of precipitationagent. Coprecipitated samples were thoroughly washed withdistilled water and dried at 110◦C in air, then they werecalcined in air at 450◦C for 3 h. The catalysts were reduced
Table 1The composition and the conditions of coprecipitation of the catalystsamples under the study
No. Sample Composition (wt.%) Precipitate
1 90Fe-Al2O3 Fe:Al2O3 = 90:10 NH4OH2 50Fe-Al2O3 Fe:Al2O3 = 50:50 NH4OH3 85Fe-5Co-Al2O3 Fe:Co:Al2O3 = 85:5:10 NH4OH4 70Fe-20Co-Al2O3 Fe:Co:Al2O3 = 70:20:10 NH4OH5 60Fe-30Co-Al2O3 Fe:Co:Al2O3 = 60:30:10 NH4OH6 50Fe-6Co-Al2O3 Fe:Co:Al2O3 = 50:6:44 NH4OH7 85Fe-5Ni-Al2O3 Fe:Ni:Al2O3 = 85:5:10 NH4HCO3
8 70Fe-20Ni-Al2O3 Fe:Ni:Al2O3 = 70:20:10 NH4HCO3
9 62Fe-8Ni-Al2O3 Fe:Ni:Al2O3 = 62:8:30 NH4HCO3
in hydrogen flow at 580◦C for 5 h. To minimize pyrophoricbehavior of the reduced catalysts, the samples were insitu passivated in ethanol and drying at room temperature.This procedure does not influence the properties of thecatalysts.
The samples of precursors and reduced catalysts werestudied by in situ themogravimetric analysis (STA), FTIRspectroscopy, transmission electron microscopy (TEM),Mössbauer spectroscopy, XRD, X-ray radial electron den-sity distribution (REDD) and extended X-ray absorptionfine structure (EXAFS) spectroscopy.
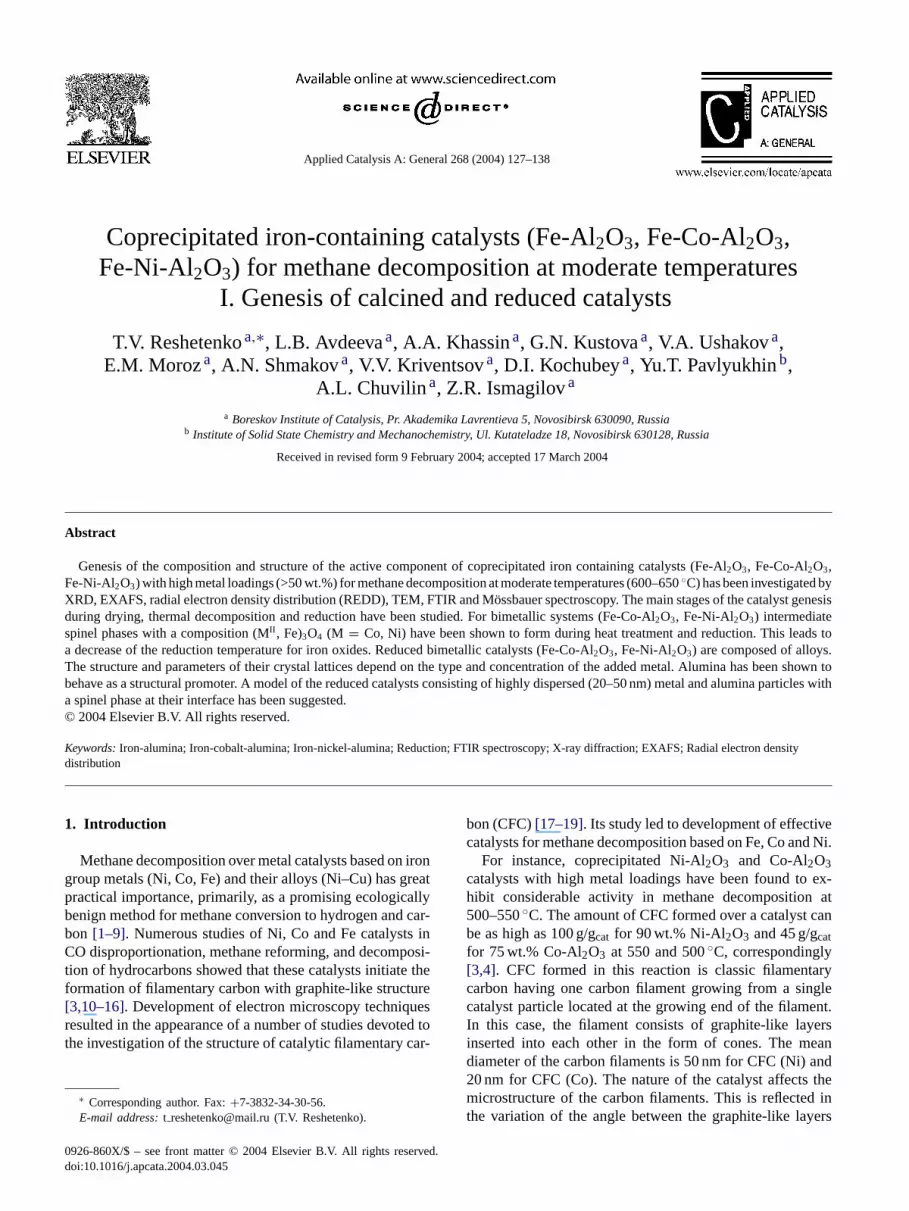
Fig. 1. The evolution of the IR spectra of the 50Fe-Al2O3 sample duringcalcination and reduction: (1) dried sample 50Fe-Al2O3, (2) calcined inthe Ar flow at 450◦C, (3) reduced in the H2 flow at 200◦C, (4) reducedin the H2 flow at 350◦C and (5) reduced in the H2 flow at 650◦C.

T.V. Reshetenko et al. / Applied Catalysis A: General 268 (2004) 127–138 129
In situ thermal gravimetry (STA) data were performedusing a NETZSCH STA 409 installation. The weight of acatalyst sample was 100–350 mg. High purity (99.99%) ar-gon and hydrogen additionally purified from oxygen im-purities over a Ni-Cr catalyst down to 0.1 ppm and driedover silica gel were used for treatments. The gas flow ratewas 150–250 ml/min. The temperature increase rates were10 K/m in the argon flow and 5 K/min in the hydrogen flow.Parameters for the STA TPR studies were optimized in orderto minimize criterionP defined in[31,32]: P = βS0/FC0,whereβ is the heating rate (K/min),F—the gas flow rate(ml/min), C0—the initial hydrogen concentration (mol/ml)andS0—the number of reducible sites in the sample (mol).The value ofP should be below 20 K. In our experiments,we hadP ≈ 5(2 × 10⁻³)/150(4.5 × 10−5) ≈ 1.5 K.
FTIR spectra of the samples were recorded in the250–4000 cm−1 range using a Bomem MB–102 FTIR spec-trometer. Powdered catalyst samples were diluted with CsI(or KBr).
Mössbauer spectra were recorded using a NZ-640 spec-trometer with Co57 source in a rhodium matrix at roomtemperature. TEM and high-resolution TEM studies wereperformed using JEM-100CX and JEM-2010 electron mi-croscopes, respectively.
XRD studies were conducted using a HZG-4 diffractome-ter with monochromatic Cu K� irradiation. The coherentscattering area (CSA) were determined using the Schererequation from the half-widths of the following diffractionpeaks: (1 1 0) for�-Fe, (4 4 0) for Fe-Al spinel, and (0 0 2)for carbon.
Radial electron density distribution curves were calcu-lated using an earlier described procedure[33] from X-rayspectra recorded using a high resolution diffractrometer atSiberian Synchrotron Radiation Center (Institute of NuclearPhysics, SB RAS). The spectra were recorded by scan-ning in the 2θ range from 5◦ to 135◦. A monochromatorplaced at the diffraction beam (silicon monocrystal (1 1 1)plane) provided monochromation degreeλ/λ ≈ 10−4,λ = 0.695 Å.
Spectra of Fe-K and Co-K edges for all samples wereobtained at the EXAFS station of Siberian SynchrotronRadiation Center using transmission and fluorescence tech-niques at 2 GeV energy of electrons and 80 mA averagecurrent in the accumulator during measurement. A split sin-gle block Si (1 1 1) crystal was used as a monochromator.Ionization cameras filled with argon or photoelectric mul-tipliers were used for registration of the X-ray irradiation.The oscillating partχ(k) was separated using a standardprocedure[34]. Fourier transformationk3χ(k) in the wavenumber range 4–12.0 Å was used for obtaining the atomicradial distribution function. Structural information, i.e.distances, coordination numbers and Debye factors, wereextracted by a curve fitting procedure using EXCURV92computer program[35] after preliminary Fourier filtrationusing literature X-ray structural data for bulk compounds atfixed Debye factor values (2σ2 = 0.01 Å2).
3. Results and discussion
3.1. Samples after drying at 110 ◦C
X-ray diffraction spectra of all dried precursors of the cat-alysts do not have any peaks. This indicates that all samplesconsist of finely dispersed X-ray amorphous phases. TheFTIR spectra of the dried precursor of 50Fe-Al2O3 (Fig. 1,curve 1) contain an absorption band (a.b.) at 562 cm−1 char-acterizing M–O stretching vibrations. Vibrations at 975 and1020 cm−1 correspond to vibrationsδ–(Me–O–H). Bands at3424, 3473 and 3574 cm−1 belong to stretching vibrationsof –OH groups. The absorption band about 1620 cm−1 cor-responds to vibrationsδ–H2O. The appearance of absorp-tion bands in the absorption range of hydroxyls indicatesthe formation of a metal hydroxide during precipitation.Note that the IR spectrum in this region is similar to that ofhydroxide with the bayerite structure. This means that thissample contains a large amount of the structural promoterAl2O3 (up to 50 wt.%)[36]. Frequencies characterizing ab-sorption of CO3
2− groups: 851 (ν2), 1096 (ν1), 1400 (ν3),1510 (ν3) cm−1 are also observed in the spectrum. Theyare formed, most likely, due to interaction of the hydroxidewith air. Consequently, the dried samples contain iron andaluminum predominantly in the form of hydroxides. How-ever, the hydration degree seems to be intermediate between
Fig. 2. The IR spectra of the 90Fe-Al2O3 samples: (1) dried sample90Fe-Al2O3, (2) calcined in the Ar flow at 450◦C and (3) reduced in theH2 flow at 670◦C.

130 T.V. Reshetenko et al. / Applied Catalysis A: General 268 (2004) 127–138
Fig. 3. The IR spectra of the 70Fe-20Co-Al2O3 sample under calcinationand reduction: (1) dried sample 70Fe-20Co-Al2O3, (2) calcined in the Arflow at 450◦C, (3) reduced in the H2 flow at 350◦C and (4) reduced inthe H2 flow at 650◦C.
M(OH)3 and MOOH, because it significantly depends onthe precipitation and drying conditions.
The IR spectra of dried samples with high loadingsof iron group metals (as high as 90 wt.%) 90Fe-Al2O3,70Fe-20Co-Al2O3, 70Fe-20Ni-Al2O3 (Figs. 2–4, curve1) contain absorption bands at 442–475, 569–585 and685–690 cm−1 typical for M–O stretching vibrations.The bands at 832–846, 1065–1080, 1361–1373 and1474–1491 cm−1 correspond to vibrations of CO32− groups.The frequency range 1618–1625 cm−1 is attributed to H2Obending vibrations. Thus, the observed shape of the spec-tra supports the idea that coprecipitation of these samplesleads to the formation of metal hydroxides. Also we cannotexclude the formation of amorphous hydrated hematite as aresult of ageing and drying of the samples in air. Accordingto [37], the absorption bands at 475, 581 and 690 cm−1 maybe attributed to Fe(III) oxide.
3.2. Samples calcined at 450 ◦C
Fig. 5 reports STA data on thermal decomposition of theinitial samples in the argon flow. STA profiles show theweight loss in three temperature ranges. The endothermicweight loss with maximum at 170–190◦C was observed forall catalysts. The endothermic weight loss at 270–290◦Cwas most readily observed for the catalyst precursors
Fig. 4. The evolution of the IR spectra of the 70Fe-20Ni-Al2O3 sampleduring calcination and reduction: (1) dried sample 70Fe-20Ni-Al2O3, (2)calcined in the Ar flow at 450◦C, (3) reduced in the H2 flow at 350◦Cand (4) reduced in the H2 flow at 650◦C.
50Fe-Al2O3 and 50Fe-6Co-Al2O3 containing 50 wt.% alu-mina. For other samples it becomes apparent in the formof a shoulder near the low-temperature peak. An obviousexothermic weight loss at 350◦C was observed only for90Fe-Al2O3.
The observed weight losses should be attributed to theescape of water from the samples during their decomposi-tion from hydroxides to anhydrous oxides. The magnitudeof the weight loss during the calcination exhibits only smallchanges when changing the sample composition and variesfrom 18 to 23 wt.% and is higher for the samples with higheraluminum loading. At that these values are significantlyhigher than the theoretical value of the weight loss for de-composition of MeOOH oxide monohydrates (11–13 wt.%)and also lower than that for Me(OH)3 oxide trihydrates(27.2–31 wt.%). Thus, the extent of hydration of the initialsamples is somewhat intermediate and, most plausibly, de-termined by the drying conditions.
Exothermic effect at 350◦C observed for the iron-richsample is similar to that, which was earlier observed in[38].There it was attributed to decomposition of� iron hydrox-ide (�-FeOOH) to Fe2O3 accompanied by the exothermalcrystallization of�-Fe2O3 (hematite). In the same work,it was observed, that decomposition of� iron hydroxide(�-FeOOH) is endothermic and leads to the formation of the

T.V. Reshetenko et al. / Applied Catalysis A: General 268 (2004) 127–138 131
Fig. 5. STA data (DTG, solid line; DTA, dashed line) on the calcina-tion in the Ar flow of the samples: (1) 90Fe-Al2O3, (2) 50Fe-Al2O3,(3) 85Fe-5Co-Al2O3, (4) 85Fe-5Ni-Al2O3, (5) 50Fe-6Co-Al2O3, (6)70Fe-20Co-Al2O3 and (7) 70Fe-20Ni-Al2O3.
poor-crystallized iron oxide. Unfortunately, our XRD datado not support these attribution for the sample under thediscussion, since no�-Fe2O3 phase was observed after thedecomposition of the sample 90% Fe-Al2O3 in the argonflow.
The diffraction patterns of samples 90Fe-Al2O3,50Fe-Al2O3 and 70Fe-20Ni-Al2O3 heat treated both in airand in argon testify to formation of finely dispersed amor-phous phases. Small amounts of�-Fe2O3 were observedonly after calcination of 90Fe-Al2O3 in air at 450◦C. TheFTIR spectra indicate that the shapes of the spectra ofheat treated samples 90Fe-Al2O3 and 50Fe-Al2O3 did notchange much compared to the untreated samples (Figs. 1and 2, curves 1 and 2). Only a slight decrease in the in-tensity of bands corresponding to the vibrations of CO3
2−groups was observed. The spectrum of 70Fe-20Co-Al2O3after thermal decomposition in argon at 450◦C (Fig. 3,curve 2) contains bands at 398 and 589 cm−1 that belongto a spinel structure with a composition CoFe2O4 (ferrite)[39,40]. The XRD data for this sample prove the formationof the spinel with the lattice parametera = 8.31 Å. ForFe-Co samples the calcination is known to result in the for-mation of an inverse spinel structure where divalent cationsoccupy octahedral positions whereas trivalent cations oc-
cupy tetrahedral ones[41,42]. Usually such spinels arepartially inverted. The spectrum of 70Fe-20Ni-Al2O3 alsoundergoes significant changes after calcination (Fig. 4,curve 2). Absorption bands are observed at 492, 573 and712 cm−1 and bands of low intensity are observed at 1083,1394 and 1629 cm−1. The shift of the M–O absorptionbands and decrease in the intensity of the bands related toCO3
2− groups is consistent with the possible formation ofan oxide.
3.3. Reduction of catalyst samples
Fig. 6 presents STA TPR profiles of calcined samples at450◦C. Several reduction regions can be distinguished
(1) 200–230◦C—an exothermal effect observed for all sam-ples. It can be related to the surface reduction of theoxides and removal of –OH groups adsorbed on the sur-faces.
(2) 290–310◦C—a strongly exothermal effect observedonly for samples containing Co or Ni. Also, it is notobserved for 50Fe-6Co-Al2O3.
(3) 350–360◦C—a weakly endothermic effect observed for90Fe-Al2O3, 50Fe-Al2O3 and 50Fe-6Co-Al2O3.
Fig. 6. STA data (DTG, solid line; DTA, dashed line) on the reductionin the hydrogen flow of the samples: (1) 90Fe-Al2O3, (2) 50Fe-Al2O3,(3) 85Fe-5Co-Al2O3, (4) 85Fe-5Ni-Al2O3, (5) 50Fe-6Co-Al2O3, (6)70Fe-20Co-Al2O3 and (7) 70Fe-20Ni-Al2O3.

132 T.V. Reshetenko et al. / Applied Catalysis A: General 268 (2004) 127–138
(4) 500–600◦C—the most intense effect with slight absorp-tion of heat. It is observed for all samples. The intro-duction of Co or Ni shifts the position of the maximumto lower temperatures.
(5) 740–790◦C—weight loss in this region is observed onlyfor samples containing Co or Ni. Apparently, it is dueto the reduction of spinel structures.
To determine the regularities of the catalyst phase com-position genesis during reduction, the samples were stud-ied by XRD and FTIR. The shapes of the IR spectra of50Fe-Al2O3 sample reduced at 200 and 350◦C are almostthe same (Fig. 1, curves 3 and 4). Further reduction up to650◦C results in the appearance of an a.b. at 680 cm−1 andpoorly resolved bands at 510, 596, 737, 794 and 850 cm−1
(Fig. 1, curve 5). These bands correspond to a defect Fe-Alspinel with part of aluminum ions located in tetrahedral po-sitions, as indicated by the bands at 737, 794 and 850 cm−1
[43]. The formation of the Fe-Al spinel is supported by theXRD data. The presence of absorption bands at 379, 485,598, 686 and 778 cm−1 for 90Fe-Al2O3 sample reduced at670◦C (Fig. 2, curve 3) also agrees with the possible for-mation of a spinel-like structure with aluminum cations par-tially occupying tetrahedral positions.
Sample 70Fe-20Co-Al2O3 after heat treatment in argonwas characterized by the presence of the spinel phase. Ab-sorption bands at 390 and 587 cm−1 grew in intensity afterreduction in hydrogen at 350◦C (Fig. 3, curve 3). Destruc-tion of the structure of the Co-Fe spinel takes place at 650◦Cand leads to the formation of�-Al2O3 (bands at 720 and
Fig. 7. RDA curves of the iron (Fe K-edge) and cobalt (Co K-edge) environments in the 85Fe-5Co-Al2O3, 60Fe-30Co-Al2O3 samples reduced at 580◦C.
820 cm−1) [43]. The presence of a.b. at 385 and 585 cm−1
indicates incomplete destruction of the ferrite structure un-der these conditions (Fig. 3, curve 4).
The IR spectrum of 70Fe-20Ni-Al2O3 catalyst reducedat 350◦C with bands at 394 and 592 cm−1 corresponds toferrite with a composition NiFe2O4 [39,40] (Fig. 3, curve3). Its formation is also supported by the XRD data (a =8.329 Å [44]). A similar result was obtained for supported5 wt.% (4Fe:Ni)/SiO2 catalyst[45]. The authors of this paperstudied the catalyst reduced at 350◦C by Mössbauer spec-troscopy. This study showed the formation of a spinel withinverted structure where Fe3+ ions occupied both tetrahe-dral and octahedral positions, while Fe2+ ions were locatedonly in octahedral positions. The fraction of iron cations lo-cated in octahedral positions was lower than in the case of5 wt.% Fe/SiO2. This observation led the authors to a con-clusion that nickel cations occupied some of the octahedralpositions in the spinel. After reduction at 650◦C ferrite in70Fe-20Ni-Al2O3 sample was destroyed with the formationof a spinel-like structure with absorption bands at 481, 682and 784 cm−1 [43] (Fig. 3, curve 4). The presence of bandsat 395 and 594 cm−1 indicates its incomplete destruction.
Reduction of Fe2O3 is known to occur in two steps[46,47]
Fe2O3350◦C−−→ Fe3O4
650◦C−−→ Feo
In our case, the weight loss at 350–360◦C, most likely,corresponds to Fe2O3 reduction to Fe3O4. The lack ofabsorption bands typical for Fe3O4 in the IR spectra of50Fe-Al2O3 is apparently due to the oxidation of Fe2+

T.V. Reshetenko et al. / Applied Catalysis A: General 268 (2004) 127–138 133
cations with oxygen from the air as the IR studies wereperformed ex situ. The endothermic effect at 500–600◦Cmay be attributed to the Fe3O4 reduction to iron metal.However, complete reduction of iron does not occur atthese conditions. The decrease of the reduction temperatureof both bulk and supported oxide two-component systems(Fe-Co, Fe-Ni) has been described in a number of papers[42,45,48,49]. Some of the authors[42,48] attribute the ob-served phenomenon to a more facile reduction of intermedi-ate Fe-Co or Fe-Ni partially inverted spinels in comparisonwith Fe3O4. An easier activation of hydrogen over bimetal-lic systems leading a decrease in the reduction temperatureof the whole system also cannot be excluded[45].
The presented data indicate that the introduction of Co orNi in Fe-Al2O3 catalysts results in the formation of interme-diate compounds—partially inverted spinels (MII , Fe)3O4(M = Co, Ni) at the stages of the sample calcination andreduction. The presence of the such ferrites with the spinelstructure appears to facilitate reduction of iron oxides, lead-ing to a decrease of their reduction temperature to 530◦C incomparison with Fe-Al2O3.
3.4. Phase composition of reduced catalysts
The phase composition of reduced catalysts was studiedex situ using a number of physicochemical methods: XRD,X-ray structural method of atomic radial electron densitydistribution, Mössbauer spectroscopy, EXAFS and TEM.
For the Fe-Al2O3 series of catalysts, the XRD patternsof reduced samples are characterized by diffraction lines re-lated to two phases:�-Fe and spinel. The XRD data (Table 2)indicate that the variation of the iron/alumina ratio in the cat-alysts does not change their qualitative phase composition.However, an increase of the alumina concentration leads tothe growth of the concentration of the Fe-Al spinel in thereduced sample. If one assumes that a solid solution of twospinels Fe3O4 (a = 8.391 Å) and FeAl2O4 (a = 8.158 Å)is formed and the system complies with the Vegard linearlaw, the chemical composition of the spinel can be estimatedfrom the experimentally observed parameter. Then, the for-mula of the spinel can be represented as Fe1.72Al1.28O4. Asimilar result has also been reported earlier[50].
Table 3EXAFS data (distances, effective coordination numbers) describing Fe and Co local arrangement of the samples studied
85Fe-5Co-Al2O3 60Fe-30Co-Al2O3 �-Fe (bcc)[53] Co (fcc) [54]
Fe-Me (Me= Fe, Co) Co-Me (Me= Fe, Co) Fe-Me (Me= Fe, Co) Co-Me (Me= Fe, Co) Fe-Fe Co-Co
R (Å) N R (Å) N R (Å) N R (Å) N R (Å) N R (Å) N
2.49 3.3 2.49 6.1 2.50 4.6 2.50 5.9 2.482 8 2.506 122.85 1.3 2.87 2.7 2.89 2.0 2.9 2.5 2.866 6 3.544 64.06 2.4 4.10 5.5 4.08 3.4 4.07 4.5 4.053 12 4.341 244.79 9 4.78 16 4.81 13 4.82 15 4.753 24 5.012 12
23.4a 25.6a 22.8a 23.5a
R: distance Me–Me (Å);N: effective coordination number.a R-factor (%).
Table 2X-ray diffraction data for the catalysts reduced in hydrogen at 580◦C (a:lattice parameter, CSA: coherent scattering area)
Type ofcatalyst
Sample Phase a (Å) CSA(nm)
Fe-Al2O3 90Fe-Al2O3 �-Fe 2.866 50Fe-Al spinel (traces)
50Fe-Al2O3 �-Fe 2.867 50Fe-Al spinel 8.242 10
Fe-Co-Al2O3 85Fe-5Co-Al2O3 �-Fe 2.861 50Spinel (traces)
60Fe-30Co-Al2O3 Fe-Co 2.855 30Spinel (traces)
50Fe-6Co-Al2O3 �-Fe 2.863 30Fe-Co-Al spinel 8.261 15
Fe-Ni-Al2O3 85Fe-5Ni-Al2O3 �-Fe 2.868 14Spinel (traces)
70Fe-20Ni-Al2O3 �-Fe 2.87 27Fe-Ni 3.583 11Spinel (traces)
62Fe-8Ni-Al2O3 �-Fe 2.87 7.5Fe-Ni 3.571 7.5Fe-Al spinel 8.246 10
�-Fe (bcc)a = 2.866 Å; �-Fe (fcc) a = 3.637 Å; Ni a = 3.523 Å; �-Co(hex) a = 2.503 Å, c = 4.061 Å; �-Co (fcc) a = 3.545 Å; Fe-Co (bcc)a = 2.851 Å [51].
The diffraction pattern of Fe-Co-Al2O3 catalysts containsreflections corresponding to a metallic phase based on bcc�-Fe lattice and a spinel. An increase of the cobalt con-centration to 30 wt.% (sample 60Fe-30Co-Al2O3) leads toa decrease of the lattice parameter of the metallic phase incomparison with that of�-Fe (Table 2). This fact indicatespossible formation of a Fe-Co alloy based on the bcc struc-ture of�-Fe. For Fe-Co (1:1) the lattice parameter is knownto equal 2.851 Å[51]. An increase of the spinel lattice pa-rameter for 50Fe-6Co-Al2O3 up to 8.261 Å in comparisonwith 50Fe-Al2O3 means that the former contains a largeamount of a bivalent metal with a large ionic radius. Notethat no diffraction peaks related to metallic cobalt (fcc) areobserved in the diffraction pattern. This fact may be causedby a number of reasons: formation of a Fe-Co-Al spinel, aFe-Co alloy or a finely dispersed cobalt metal phase that isnot detected by XRD. Also, it is necessary to note that, incontrast to the Fe-Al2O3 series of catalysts, an increase in

134 T.V. Reshetenko et al. / Applied Catalysis A: General 268 (2004) 127–138
the concentrations of cobalt and alumina leads to a decreaseof the coherent scattering area (CSA) size of the metallicphase.
The RDA curves describing local iron and cobaltarrangement for the 85Fe-5Co-Al2O3 and 60Fe-30Co-Al2O3samples are shown inFig. 7. Comparison of the EXAFS data(interatomic distances and effective coordination numbers)of the Fe and Co local arrangements for the 85Fe-5Co-Al2O3and 60Fe-30Co-Al2O3 are presented inTable 3. Analysis ofthe RDA curves of the local iron and cobalt arrangements forthe 85Fe-5Co-Al2O3 and 60Fe-30Co-Al2O3 samples andreference foils[52] (Fig. 7) and EXAFS data (Table 3) allowus to make the following conclusions concerning the formedstructures and the phase composition. For all samples stud-ied, iron mainly presents both�-Fe metallic phase (bcc)[53] and Fe–Co alloy based on the (bcc) structure of�-Fe.It is likely that most amount of cobalt exists as Fe–Co alloybased on the (bcc) structure of�-Fe. RDA curves (Co-Kedge) reveal weak features of the presence of the metal-lic cobalt (fcc) [52,54]. Perhaps the amount of this phaseis low.
Although fitting gives a good evidence (Table 3) for abovementioned suggestions, it should be noted that catalysts arecharacterized by lower values of effective coordination num-bers (both iron and cobalt local arrangements) in comparisonwith real coordination numbers. This seems to be related tostructural distortion due to formation of the bimetallic sys-tem and the influence of Al2O3. Earlier similar situation wasobserved for modified intermetallic TiFe system[55]. Thelack of short distances M–O (M= Fe, Co) correspondingto spinel structures indicates that the concentration of thesephases in the studied samples is less than 10% (method lim-itation).
The introduction of 5 wt.% Ni to the iron catalyst(85Fe-5Ni-Al2O3) (Table 2) does not result in any signif-icant changes of its phase composition, which is similarto those of 90Fe-Al2O3 and 85Fe-5Co-Al2O3 samples.The only exception is the fact that the average CSA size
Fig. 8. Curves of radial electron density distribution for the 50Fe-Al2O3,50Fe-6Co-Al2O3 and 62Fe-8Ni-Al2O3 samples reduced at 580◦C.
of the metallic phase for Fe-Ni-Al2O3 is significantlysmaller (14 nm). The XRD patterns of samples with highconcentrations of nickel and alumina (70Fe-20Ni-Al2O3,62Fe-8Ni-Al2O3) are characterized by diffraction lines thatcan be attributed to three phases: metallic phase based onthe bcc structure of�-Fe, a Fe-Ni alloy based on the fccstructure and a Fe-Al spinel (seeTable 2). Based on the factthat the parameters of the fcc lattices of�-Fe (a = 3.637 Å)and Ni (a = 3.523 Å) comply with the Vegard linear law,one can estimate the composition of the alloy based on thefcc structure. Its formula can be represented as Fe0.42Ni0.58.62Fe-8Ni-Al2O3 sample is characterized by a very smallvalue of the CSA size for the metallic phases (7.5 nm). Suchincreased dispersity is, probably, due to the retardation ofthe �-Fe phase crystallization in the presence of a secondfcc alloy [56,57].
The XRD data are fully supported by the results obtainedby X-ray radial electron density distribution method. Ananalysis of REDD curves for samples 50Fe-6Co-Al2O3 and62Fe-8Ni-Al2O3 (Fig. 8) has shown that
(1) There are maxima for�-Fe with atomic spacings 2.54,2.95, 4.12 and 4.85 Å.
(2) Coordination peaks at 2.01 and 3.44 Å may be attributedto a distances in a spinel phase.
(3) The intensity ratio of peaks at 2.54, 2.95 and 4.85 Åshould be 8:6:30 if they belong to the�-Fe phase. How-ever, one can see (Fig. 8) that this ratio is disturbed bythe presence of an additional phase that has atomic spac-ings in the same region. For instance, this phase could
Fig. 9. Mössbauer spectra of the reduced at 580◦C catalysts: (1)90Fe-Al2O3, (2) 85Fe-5Co-Al2O3 and (3) 85Fe-5Ni-Al2O3.

T.V. Reshetenko et al. / Applied Catalysis A: General 268 (2004) 127–138 135
Fig. 10. Particle size distribution of the reduced catalysts (H2, 580◦C) obtained by TEM.
be �-Al2O3, which has intense maxima at 2.90, 3.34and 4.45 Å.
The XRD and REDD data were used for estimation ofthe fraction of iron present in the form of�-Fe. A compar-ison of the intensities of reflexes (2 0 0), (2 1 1) and (3 1 1)in the diffraction patterns of 50Fe-Al2O3 and a mechani-cal mixture containing 30 wt.%�-Fe and 70 wt.%�-Al2O3indicated that the intensities of the reflexes were compara-
ble. Consequently, the fraction of iron in the form of�-Feis about 30% relative to the whole mass of the sample.A calculation of the area of the coordination peak atr =2.54 Å in the REDD curve shows that 62% of iron intro-duced into the sample is present in the form of�-Fe. Thiscorresponds to 31% relative to the sample weight. For sam-ples 50Fe-6Co-Al2O3 and 62Fe-8Ni-Al2O3 the fraction ofiron in the form of�-Fe is comparable with that for sample50Fe-Al2O3 and varies from 30 to 38%.

136 T.V. Reshetenko et al. / Applied Catalysis A: General 268 (2004) 127–138
The Mössbauer spectroscopy is widely used for investiga-tion of iron alloys. Systematic studies on the determinationof the hyperfine field at57Fe nuclei in the environment ofdifferent metals, e.g. Fe-Co or Fe-Ni, have been reported inearly papers by Johnson et al.[58,59]. The dependence of thehyperfine field on the concentration of the second metal inan iron-containing alloy appeared to have a complex shape.Nevertheless, an increase of the hyperfine field at57Fe nuclei
Fig. 11. TEM microphotographs of the reduced samples at 580◦C: (a) 90Fe-Al2O3 and (b) 50Fe-6Co-Al2O3, where M: metal particle and C: crystalliteof amorphous Al2O3.
in bimetallic systems (Fe-Co, Fe-Ni) qualitatively provesthe formation of the corresponding alloy. The Mössbauerspectra of the samples (90Fe-Al2O3, 85Fe-5Co-Al2O3,85Fe-5Ni-Al2O3) consist of a sextet of lines (Fig. 9). Be-sides the sextet, in the spectrum of 85Fe-5Ni-Al2O3 there isa singlet with the isomer shift−0.12 mm/s. Its appearancein the spectrum is likely due to the formation of a paramag-netic fcc phase[59,60]. Numerical values of the magnetic

T.V. Reshetenko et al. / Applied Catalysis A: General 268 (2004) 127–138 137
hyperfine field (H), isomer shift (δ) and quadrupole splitting(ε) are reported inTable 4. The hyperfine field at57Fe nu-clei increases in the bimetallic systems in comparison with90Fe-Al2O3, indicating the formation of Fe-Co and Fe-Nialloys.
The analysis of the particle size distribution in re-duced catalysts based on the TEM data indicates that thedistribution is affected by the concentration of the structuralpromoter (Al2O3) and the presence of a second metal inthe system (Fig. 10). Modification of the iron-containingsamples with cobalt or nickel dopants results in a narrowerparticle size distribution with a maximum at 25–50 nm incomparison with 20–80 nm for 90Fe-Al2O3. This conclusionis supported by the XRD data. This effect is most evident forsamples containing larger amounts of Al2O3 (50Fe-Al2O3,50Fe-6Co-Al2O3 and 62Fe-8Ni-Al2O3). In this case, the dis-tribution maximum is at 25-35 nm. Note that these samplesare the most active catalysts in their corresponding series[7,8,28].
The TEM images of the reduced catalysts 50Fe-Al2O3(Fig. 11a) and 50Fe-6Co-Al2O3 (Fig. 11b) show that metalparticles (M) are surrounded by crystallites (C) with con-trast different from that of the metal phase. Most likely,these crystallites consist of amorphous Al2O3 that stabilizesthe structure and size of the active metal particles due tothe formation of spinel structures at the places of contactbetween Al2O3 and the metal particles. A similar result wasobtained for the Ni-Al2O3 system as well. An investigationof coprecipitated Ni-Al2O3 catalysts with high metal load-ings was performed by TEM, XRD and Auger spectroscopy[61,62]. According to the suggested model for distributionof nickel particles and aluminum compounds for catalysts90 wt.% Ni-Al2O3 and 57 wt.% Ni-Al2O3, the nickel par-ticles are stabilized by the Al2O3 carcass. For 90Ni-Al2O3system, direct contact between 15–17 nm metal particlesis possible. However, for the catalyst with higher concen-tration of the structural promoter 57 wt.% Ni-Al2O3, themetal phase is dispersed as separate particles that have nocontact with each other. Based on the obtained results, it ispossible to suggest that Al2O3 acts as a structural promoterand provides the formation of the particle size distributionof the metal phase with a maximum at 25–35 nm. The pres-ence of particles of this size is one of the conditions for thegenesis of a essential state of iron-containing catalysts formethane decomposition and carbon nanotubes production[8,9,28].
Table 4Mössbauer parameters for reduced iron-containing catalysts at 580◦C
Sample Phase H (T) δ (mm/s) ε (mm/s) S (%)
90Fe-Al2O3 �-Fe 32.9 −0.02 0.00 10085Fe-5Co-Al2O3 bcc Fe-Co 34.3 0.01 0.00 10085Fe-5Ni-Al2O3 bcc Fe-Ni 33.6 0.01 0.00 96
– −0.12 – 4
δ: isomer shift;ε: quadrupole splitting;H: magnetic field.
4. Conclusions
Investigation of the genesis of the active component incoprecipitated iron-containing catalysts with high metalloadings by a complex of physicochemical methods led usto the following conclusions:
• Intermediate formation of ferrites with spinel structure(MII , Fe)3O4, (M = Co, Ni) takes place during prepara-tion of bimetallic systems (Fe-Co-Al2O3, Fe-Ni-Al2O3)at the stages of calcination and reduction of their precur-sors. This leads to a decrease of the reduction temperatureof iron oxides in comparison with Fe-Al2O3 samples.
• The reduction of bimetallic catalysts results in the forma-tion of alloys (Fe-Co, Fe-Ni). The structure of their crys-tal lattices, their parameters and crystallite sizes dependon the type and concentration of the added metal (cobaltor nickel).
• The introduction of a second metal (cobalt or nickel) and30–50 wt.% Al2O3 into iron containing catalysts leads tothe formation of metal particles 20–50 nm in size. Theyappear to be stabilized by the carcass of Al2O3 due tothe formation of spinel structures at places of contact, i.e.Al2O3 acts as a structural promoter.
Acknowledgements
We are grateful to Dr. S.V. Tsybulya for the some XRDdata. The research described in this publication was sup-ported by Award No. REC-008 from the US Civilian Re-search and Development Foundation for the IndependentStates of the Former Soviet Union (CRDF) and by theNetherlands Organization for Scientific Research (NWO)in the year of 2001.
References
[1] C.A. Bernardo, I. Alstrup, J.R. Rostrup-Nielsen, J. Catal. 96 (1985)517.
[2] P.K. De Bokx, A.J.H.M. Kock, E. Boellaard, W. Klop, J.W. Geus,J. Catal. 96 (1985) 454.
[3] L.B. Avdeeva, O.V. Goncharova, D.I. Kochubey, V.I. Zaikovskii,L.M. Plyasova, B.N. Novgorodov, Sh.K. Shaikhutdinov, Appl. Catal.A 141 (1996) 117.
[4] L.B. Avdeeva, D.I. Kochubey, Sh.K. Shaikhutdinov, Appl. Catal. A177 (1999) 43.
[5] T. Zhang, M.D. Amiridis, Appl. Catal. A 167 (1998) 161.[6] Y. Li, J. Chen, Y. Qin, L. Chang, Energy Fuels 14 (2000) 1188.[7] L.B. Avdeeva, V.A. Likholobov, Rus. Patent 2146648, 2000.[8] L.B. Avdeeva, T.V. Reshetenko, Z.R. Ismagilov, V.A. Likholobov,
Appl. Catal. A 228 (2002) 53.[9] M.A. Ermakova, D.Yu. Ermakov, A.L. Chuvilin, G.G. Kuvshinov, J.
Catal. 201 (2001) 183.[10] M. Audier, A. Oberlin, M. Oberlin, M. Coulon, L. Bonnetain, Carbon
19 (1981) 217.[11] L. Bonnetain, P. Gadelle, M. Audier, in: J.L. Figuieredo, C.A.
Bernardo, R.T.K. Baker, K.J. Huttinger (Eds.), Carbon Fibers

138 T.V. Reshetenko et al. / Applied Catalysis A: General 268 (2004) 127–138
Filaments and Composites, Kluwer Academic Publishers Dordct,Boston/London, 1990, p. 507.
[12] N.M. Rodriguez, M.S. Kim, M.S. Downs, R.T.K. Baker, in: J.L.Figuieredo, C.A. Bernardo, R.T.K. Baker, K.J. Huttinger (Eds.), Car-bon Fibers Filaments and Composites, Kluwer Academic PublishersDordct, Boston/London, 1990, p. 541.
[13] N.M. Rodriguez, M.S. Kim, F. Fortin, I. Mochida, R.T.K. Baker,Appl. Catal. A 148 (1997) 265.
[14] C. Park, R.T.K. Baker, J. Catal. 179 (1998) 361.[15] R.T. Yang, J.P. Chen, J. Catal. 115 (1989) 52.[16] P.C.M. Van Stiphout, D.E. Stobbe, F.Th.V.D. Scheur, J.W. Geus,
Appl. Catal. 40 (1988) 219.[17] S.D. Robertson, Nature 221 (1969) 1044.[18] T. Baird, J.R. Fryer, B. Grant, Nature 233 (1971) 329.[19] N.M. Rodriguez, A. Chamber, R.T.K. Baker, Langmuir 11 (1995)
3862.[20] G. Tibbetts, M. Devour, E. Rodda, Carbon 25 (1987) 357.[21] F. Benissad, P. Gadelle, M. Coulon, L. Bonnetain, Carbon 26 (1988)
61.[22] A. Oberlin, M. Endo, T. Koyama, J. Cryst. Growth 32 (1976) 335.[23] K. Hernadi, A. Fonseca, J.B. Nagy, B. Bernaerts, A.A. Lucas, Carbon
34 (1996) 1249.[24] M. Jose-Yacaman, M. Miki-Yoshida, L. Rendon, Appl. Phys. Lett.
62 (1993) 657.[25] W.Z. Li, S.S. Xie, L.X. Qian, B.H. Chang, B.S. Zou, W.Y. Zhou,
R.A. Zhao, G. Wang, Science 274 (1996) 1701.[26] A. Peigney, Ch. Laurent, F. Dobigeon, A. Rousset, J. Mater. Res. 12
(1997) 613.[27] V.V. Veselov, T.A. Levanyuk, P.S. Pilinenko, N.T. Meshenko, in: V.V.
Veselov (Ed.), Scientific Basics of Hydrocarbon Catalytic Conversion,Kiev, Naukova dumka, 1977, p. 84 (in Russian).
[28] T.V. Reshetenko, L.B. Avdeeva, Z.R. Ismagilov, V.A. Ushakov,A.L. Chuvilin, Yu.T. Pavlyukhin, Chem. Sustainable Dev. 11 (2003)239.
[29] D.W. Taylor, P.J. Smith, D.A. Dowden, C. Kemball, D.A. Whah,Appl. Catal. 3 (1982) 161.
[30] R.J. Best, W.W. Russell, J. Am. Chem. Soc. 76 (1954) 838.[31] D.A.M. Monti, A. Baiker, J. Catal. 83 (1983) 323.[32] B. Ernst, S. Libs, P. Chaumette, A. Kiennemann, Appl. Catal. A 186
(1999) 145.[33] E.M. Moroz, Russ. Chem. Rev. 61 (1992) 188.[34] D.I. Kochubey, EXAFS Spectroscopy of Catalysts, Novosibirsk,
Nauka, 1992.[35] N. Binsted, J.V. Campbell, S.J. Gurman, P.C. Stephenson, SERC
Daresbury Laboratory EXCURV92 Program, 1991.[36] L.D. Frederickson, Anal. Chem. 26 (1954) 1883.
[37] G.N. Kustova, E.B. Burgina, V.A. Sadykov, S.G. Poryvaev, Phys.Chem. Miner. 18 (1992) 379.
[38] I.G. Mitov, D.G. Paneva, B.N. Kunev, Bulgarian Chem. Commun.32 (2000) 315.
[39] S. Hafner, F. Laves, Zeitschrift Fur Kristallographie 115 (1961) 331.[40] W.B. White, B.A. DeAngelis, Spectrochim. Acta 23A (1967) 985.[41] St.G. Christoskova, M. Stoyanova, M. Georgieva, Appl. Catal. A 208
(2001) 235.[42] W.-X. Wang, H.-Q. Zhao, B.-S. Du, J.-M. Wen, F. Li, D.-M. Wang,
Appl. Catal. A 122 (1995) 5.[43] S. Hafner, F. Laves, Zeitschrift Fur Kristallographie 115 (1961) 321.[44] PCPDF Win, ver. 1.30, JCPDS ICDD, Swarthmore, PA, USA, 1997
(No. 10-0325).[45] E.E. Unmuth, L.H. Schwartz, J.B. Butt, J. Catal. 61 (1980) 242.[46] A.J.H.M. Kock, H.M. Fortuin, J.W. Geus, J. Catal. 96 (1985) 261.[47] D.B. Bukur, K. Okabe, M.P. Rosynek, C. Li, D. Wang, K.R.P.M.
Rao, G.P. Huffman, J. Catal. 155 (1995) 353.[48] R. Brown, M.E. Cooper, D.A. Whah, Appl. Catal. 3 (1982) 177.[49] D.J. Duvenhage, N.J. Coville, Appl. Catal. A 153 (1997) 43.[50] H. Ludwiczek, A. Preisinger, J. Catal. 51 (1978) 326.[51] J.L. Moran-Lopez, H. Wise, Appl. Surf. Sci. 4 (1980) 93.[52] International XAFS Society, XAFS database,http://ixs.csrri.iit.
edu/database.[53] 64998, ICSD/Retrieve 2.01 database, 1997.[54] 44989, ICSD/Retrieve 2.01 database, 1997.[55] V.V. Kriventsov, D.I. Kochubey, M.V. Tsodikov, J.A. Navio, M.C.
Hidalgo, G. Colon, Yu.V. Maksimov, I.P. Suzdalev, XAFS study ofintermetallic TiFe0.95Zr0.03Mo0.02 system of CO2 conversion, Nucl.Instrum. Methods Phys. Res. (NIMB), Section B: Beam Interact.Mater. Atoms 199 (2003) 216–221.
[56] I.M. Vasserman Chemical Precipitation from the Solution, Leningrad,Khimiya, 1980 (in Russian).
[57] V.V. Sviridov, T.P. Adamovich, Izv. USSR Inorg. Mater. 4 (1968)2217 (in Russian).
[58] C.E. Johnson, M.S. Ridout, T.E. Cranshaw, P.E. Madsen, Phys. Rev.Lett. 6 (1961) 450.
[59] C.E. Johnson, M.S. Ridout, T.E. Cranshaw, Proc. Phys. Soc. 81(1963) 1079.
[60] Yu.I. Petrov, E.A. Shafranskii, Dokl. Akad. Nauk 368 (1999) 39 (inRussian).
[61] Sh.K. Shaikhutdinov, L.B. Avdeeva, O.V. Goncharova, D.I.Kochubey, B.N. Novgorodov, L.M. Plyasova, Appl. Catal. A 126(1995) 125.
[62] O.V. Goncharova, L.B. Avdeeva, V.B. Fenelonov, L.M. Plyasova,V.V. Malakhov, G.S. Litvak, A.A. Vlasov, Kinet. Katal. 36 (1995)293 (in Russian).


