Embed Size (px)
Citation preview
Institutional Equities
Coromandel International
2QF
Y20
Res
ult U
pdat
e
Reuters: CORF.NS; Bloomberg: CRIN IN
Upgrading to Accumulate on revised earnings, TP Coromandel International (CRIN) positively surprised the street with better than expected 2QFY20 results despite the delayed monsoon. During the post-results conference call CRIN management sounded upbeat on future prospects in nutrients and crop protection chemicals businesses. The company was especially positive on the 2HFY20E outlook based on an extended Kharif season and prospects for a robust Rabi cropping season supported by near full reservoir levels and expectations of a normal northeast monsoon. Based on these factors, we are upgrading our rating on CRIN from Sell to Accumulate after raising our TP 23.4% to Rs468 using 14x PE on revised Sept 21E EPS (0.34% up from CMP).
Raising earnings by 19.4%/24.9%/21.5 over FY20-22E: This is based on i) revised assumptions on CPC business growth and margins as well as ii) improved unit margins for nutrients business and iii) lower interest costs following the sharp 42% reduction in debt as a result of 23% fall in subsidy receivables and 22% fall in inventories.
2QFY20 results conference call take-away: Coromandel management sounded positive on growth prospects in both Nutrients and CPC segments after posting good results that beat street and our expectations. The company’s prospects in 2QFY20 were boosted by adequate rainfall and improving trend in acreage sown in August-September, which made up for the delayed monsoon and weak sowing trend in July. The 0.1 mn tonne additional train for phosphoric acid (PA) was completed in September and is running from this month. As a result, the Vizag unit is now 100% on captive PA, while the need for imports has now reduced to 0.55 mn tonne. This increase in captive PA production will result in additional value addition of US$100-120/tonne. Management also expects better prospects for the CPC business based on 4 new products launched YTD FY20 and further new launches in the offing across technical grades as well as formulations, especially in the B2C segment.
Subsidy and receivables: Subsidy receivable is down from Rs23.93bn to Rs18.48bn and the company has received subsidy payments worth Rs7.2bn vs. Rs2.2bn a year ago. As a result, gross debt has declined by 42% to Rs17.25bn. Core interest expense before the IND-AS impact has shown a decline. However, this benefit has been partly offset by the additional interest on lease liability applicable this year as a result of lease accounting changes. Notwithstanding this, we expect the company to benefit from the lower interest expense on the reduced borrowings.
Capex: The capex over FY20E is estimated at Rs5bn. This includes Rs2bn on the phosphoric acid capacity expansion and Rs1.2bn on CPC. The balance amount is towards normal maintenance capex.
CPC business: The plan going forward is to set up multipurpose plants for technical grades and formulations as well as securing raw materials and technology for key technical grades from potential innovator partners from Japan, China or Germany with whom the company is in discussions. The company is aiming at new launches on its own and through co-marketing tie ups based on its own R&D initiatives and those sourced from innovator partners. Management is also looking to strengthen the company’s presence in B2C in the overseas market. The company is expecting CPC segment revenues for FY20 to be flat YoY while maintaining margins at par with 2QFY20 levels. The operations at Sarigam have stabilized after resuming in the middle of 2Q. CRIN admitted that Mancozeb sales is likely to be under pressure because of weak dispatches YTD and it is unlikely to pick up in the near term.
ACCUMULATE
Sector: Chemicals
CMP: Rs466
Target Price: Rs468
Upside: 0.34%
Amit Agarwal Research Analyst [email protected] +91-22-6273 8145
Key Data
Current Shares O/S (mn) 292.6
Mkt Cap (Rsbn/US$bn) 136.3/1.9
52 Wk H / L (Rs) 520/337
Daily Vol. (3M NSE Avg.) 199,917
Price Performance (%)
1-M 6-M 1-Y
CRIN 11.7 6.6 20.0
Nifty Index (0.0) (1.2) 13.3
Source: Bloomberg
Exhibit 1: 2QFY20 Result
25 October 2019
Y/E March (Rs Mn) 2QFY19 2QFY20 Ch YoY % 1QFY20 Ch QoQ % 2QFY20E Var. (%)
Net sales 50,083 48,580 -3 21,307 128 43,661 11
Cost of goods 36,369 35,215 -3 14,217 148 30,005 17
Employee benefits expenses 1,063 1,128 6 1,107 2 1,117 1
Other expenses 5,988 5,107 -15 4,030 27 6,630 -23
EBITDA 6,663 7,130 7 1,953 265 5,909 21
EBITDAM (%) 13.30 14.68 137 9.17 551 13.53 114
Depreciation and amortization 263 417 59 305 37 333 25
Other income 98 95 -3 100 -5 108 -12
Interest expenses 696 664 -5 796 -17 848 -22
Exceptional income/ (exp) (197) -
-
Profit before tax 5,605 6,145 10 952 546 4,836 27
Tax expenses 1,944 1,110 -43 326 240 1,132 -2
Share of JV and assoc. +/- (5) 4
(2)
3
Adj.Consol. PAT 3,853 5,039 31 624 707 3,708 36
NPM (%) 7.69 10.37 268 2.93 744 8.49 188
EPS 13.18 17.23 31 2.14 -93 12.68 36
Source: Company, Nirmal Bang Institutional Equities Research
Institutional Equities
2 Coromandel International
Investment Rationale:
We have raised earnings for FY20E -FY22E post the decent 2QFY20 results that beat market expectations. We have also raised TP by 23.4% from Rs379 to Rs468 based on a PE of 14x FY21E September (10% discount to 5-year median PE). Based on the new TP we have upgraded the rating on CRIN from Sell to Accumulate.
Exhibit 2: Change in our estimates
Revised estimate Earlier estimate % Revision
Rs Mn FY20E FY21E FY22E FY20E FY21E FY22E FY20E FY21E FY22E
Nutrient Revenue 111,562 120,640 127,884 107,275 116,012 121,818 4.0 4.0 5.0
CPC Revenue 16,555 19,997 22,406 13,960 16,068 18,490 18.6 24.5 21.2
Total Revenue 128,117 140,637 150,290 121,235 132,080 140,308 5.7 6.5 7.1
EBITDA 14,950 16,306 17,493 14,008 14,516 15,640 6.7 12.3 11.8
EBITDA margin (%) 11.67 11.59 11.64 11.55 10.99 11.15 - - -
Nutrient EBIT 11,169 11,578 12,333 10,860 10,475 11,226 2.8 10.5 9.9
CPC EBIT 1,946 2,768 3,149 1,636 2,141 2,778 18.9 29.3 13.3
Total EBIT 13,115 14,346 15,482 12,496 12,615 14,004 5.0 13.7 10.6
EBIT margin 10.24 10.20 10.30 10.31 9.55 9.98 - - -
PAT 8,760 9,457 10,148 7,337 7,571 8,353 19.4 24.9 21.5
EPS 29.86 32.17 34.44 25.00 25.75 28.35 19.4 24.9 21.5
TP
468
379
23.4
Source: Nirmal Bang Institutional Equities Research
The positives for the stock have been largely priced in following the stock’s sharp surge post results and the 22.08% rise over the last 1 year.
Our target multiple of 14x at a 10% discount to 5 year median PE, in our view captures the risk reward in the stock based on our assessment of positives and concerns.
Exhibit 3: Valuation
Sep 21E EPS Rs 33.31
Premium/(Disc) -0.1
5 yr Median PE (x) 15.6
Target PE 10% dis on 5 Yr Median (x) 14.04
Target Price Rs 468
CMP Rs 466
Upside % 0.34
Source: Nirmal Bang Institutional Equities Research
Institutional Equities
3 Coromandel International
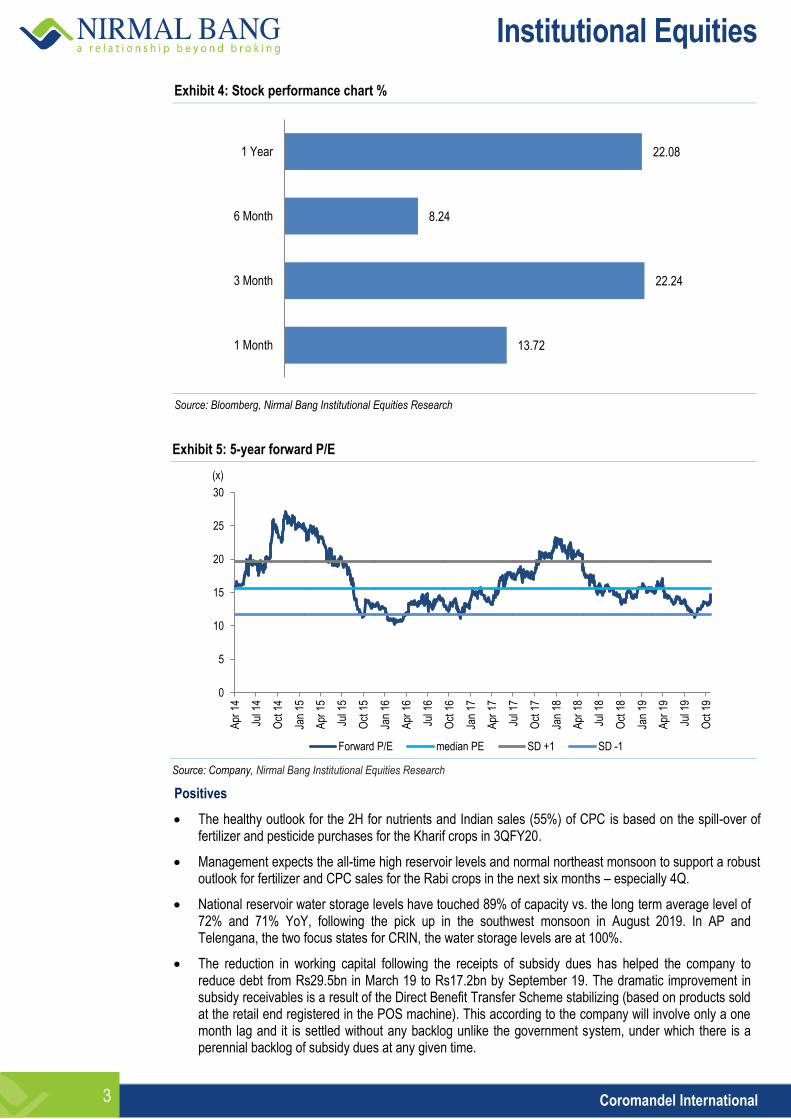
Exhibit 4: Stock performance chart %
Source: Bloomberg, Nirmal Bang Institutional Equities Research
Exhibit 5: 5-year forward P/E
Source: Company, Nirmal Bang Institutional Equities Research
Positives
The healthy outlook for the 2H for nutrients and Indian sales (55%) of CPC is based on the spill-over of fertilizer and pesticide purchases for the Kharif crops in 3QFY20.
Management expects the all-time high reservoir levels and normal northeast monsoon to support a robust outlook for fertilizer and CPC sales for the Rabi crops in the next six months – especially 4Q.
National reservoir water storage levels have touched 89% of capacity vs. the long term average level of 72% and 71% YoY, following the pick up in the southwest monsoon in August 2019. In AP and Telengana, the two focus states for CRIN, the water storage levels are at 100%.
The reduction in working capital following the receipts of subsidy dues has helped the company to reduce debt from Rs29.5bn in March 19 to Rs17.2bn by September 19. The dramatic improvement in subsidy receivables is a result of the Direct Benefit Transfer Scheme stabilizing (based on products sold at the retail end registered in the POS machine). This according to the company will involve only a one month lag and it is settled without any backlog unlike the government system, under which there is a perennial backlog of subsidy dues at any given time.
13.72
22.24
8.24
22.08
1 Month
3 Month
6 Month
1 Year
0
5
10
15
20
25
30
Apr
14
Jul
14
Oct
14
Jan
15
Apr
15
Jul
15
Oct
15
Jan
16
Apr
16
Jul
16
Oct
16
Jan
17
Apr
17
Jul
17
Oct
17
Jan
18
Apr
18
Jul
18
Oct
18
Jan
19
Apr
19
Jul
19
Oct
19
Forward P/E median PE SD +1 SD -1
(x)
Institutional Equities
4 Coromandel International
The increase in MSP for key crops as well as AP and Telengana government schemes to provide subsidy worth Rs13500 for farmers for buying agri-inputs support a positive outlook for fertilizer and CPC demand.
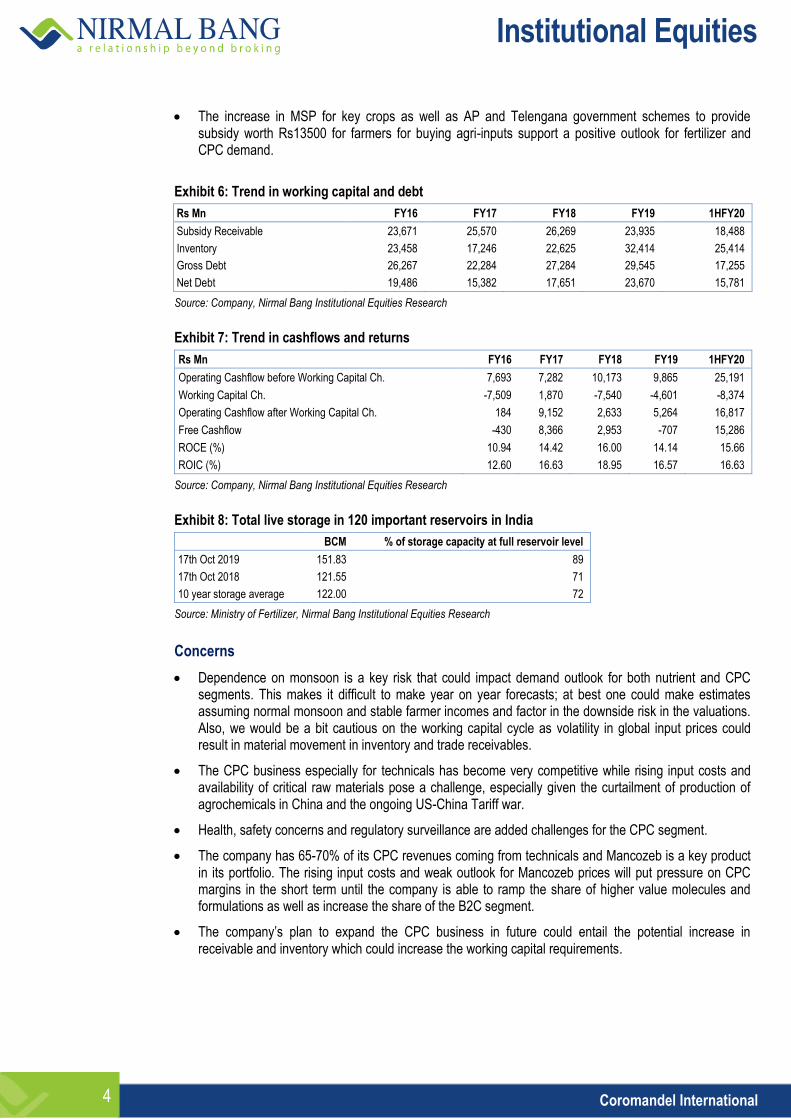
Exhibit 6: Trend in working capital and debt
Rs Mn FY16 FY17 FY18 FY19 1HFY20
Subsidy Receivable 23,671 25,570 26,269 23,935 18,488
Inventory 23,458 17,246 22,625 32,414 25,414
Gross Debt 26,267 22,284 27,284 29,545 17,255
Net Debt 19,486 15,382 17,651 23,670 15,781
Source: Company, Nirmal Bang Institutional Equities Research
Exhibit 7: Trend in cashflows and returns
Rs Mn FY16 FY17 FY18 FY19 1HFY20
Operating Cashflow before Working Capital Ch. 7,693 7,282 10,173 9,865 25,191
Working Capital Ch. -7,509 1,870 -7,540 -4,601 -8,374
Operating Cashflow after Working Capital Ch. 184 9,152 2,633 5,264 16,817
Free Cashflow -430 8,366 2,953 -707 15,286
ROCE (%) 10.94 14.42 16.00 14.14 15.66
ROIC (%) 12.60 16.63 18.95 16.57 16.63
Source: Company, Nirmal Bang Institutional Equities Research
Exhibit 8: Total live storage in 120 important reservoirs in India
BCM % of storage capacity at full reservoir level
17th Oct 2019 151.83 89
17th Oct 2018 121.55 71
10 year storage average 122.00 72
Source: Ministry of Fertilizer, Nirmal Bang Institutional Equities Research
Concerns
Dependence on monsoon is a key risk that could impact demand outlook for both nutrient and CPC segments. This makes it difficult to make year on year forecasts; at best one could make estimates assuming normal monsoon and stable farmer incomes and factor in the downside risk in the valuations. Also, we would be a bit cautious on the working capital cycle as volatility in global input prices could result in material movement in inventory and trade receivables.
The CPC business especially for technicals has become very competitive while rising input costs and availability of critical raw materials pose a challenge, especially given the curtailment of production of agrochemicals in China and the ongoing US-China Tariff war.
Health, safety concerns and regulatory surveillance are added challenges for the CPC segment.
The company has 65-70% of its CPC revenues coming from technicals and Mancozeb is a key product in its portfolio. The rising input costs and weak outlook for Mancozeb prices will put pressure on CPC margins in the short term until the company is able to ramp the share of higher value molecules and formulations as well as increase the share of the B2C segment.
The company’s plan to expand the CPC business in future could entail the potential increase in receivable and inventory which could increase the working capital requirements.
Institutional Equities
5 Coromandel International
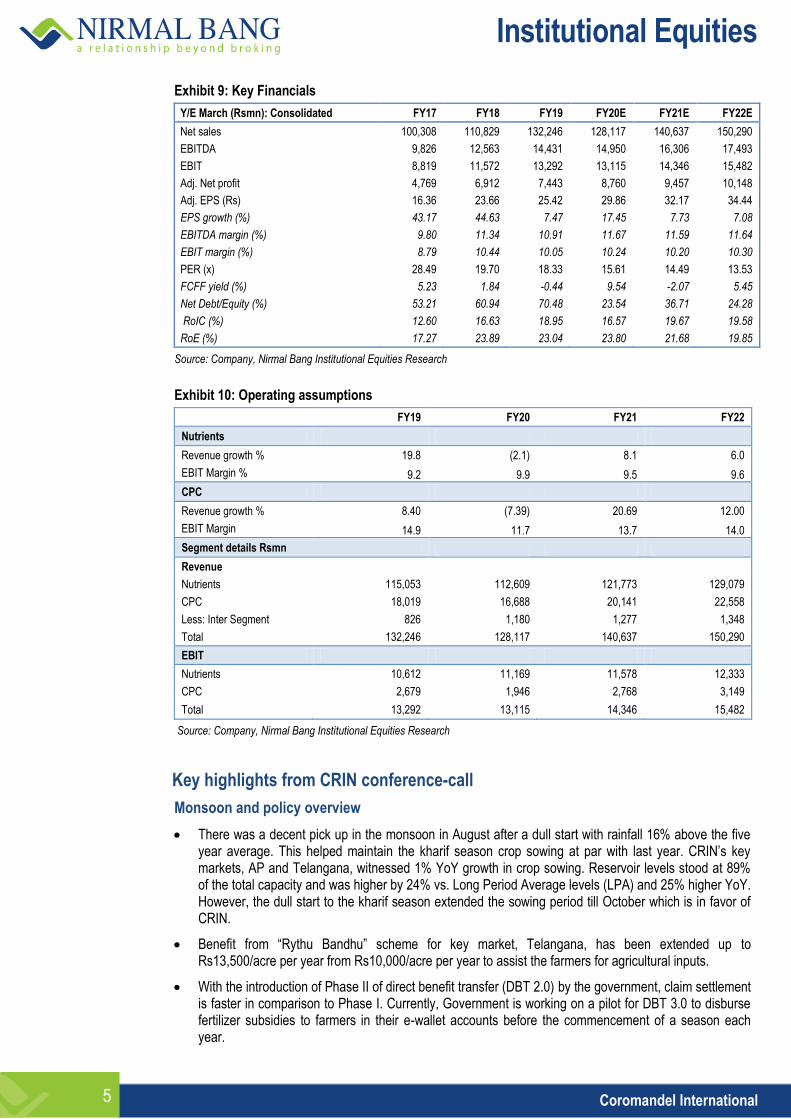
Exhibit 9: Key Financials
Y/E March (Rsmn): Consolidated FY17 FY18 FY19 FY20E FY21E FY22E
Net sales 100,308 110,829 132,246 128,117 140,637 150,290
EBITDA 9,826 12,563 14,431 14,950 16,306 17,493
EBIT 8,819 11,572 13,292 13,115 14,346 15,482
Adj. Net profit 4,769 6,912 7,443 8,760 9,457 10,148
Adj. EPS (Rs) 16.36 23.66 25.42 29.86 32.17 34.44
EPS growth (%) 43.17 44.63 7.47 17.45 7.73 7.08
EBITDA margin (%) 9.80 11.34 10.91 11.67 11.59 11.64
EBIT margin (%) 8.79 10.44 10.05 10.24 10.20 10.30
PER (x) 28.49 19.70 18.33 15.61 14.49 13.53
FCFF yield (%) 5.23 1.84 -0.44 9.54 -2.07 5.45
Net Debt/Equity (%) 53.21 60.94 70.48 23.54 36.71 24.28
RoIC (%) 12.60 16.63 18.95 16.57 19.67 19.58
RoE (%) 17.27 23.89 23.04 23.80 21.68 19.85
Source: Company, Nirmal Bang Institutional Equities Research
Exhibit 10: Operating assumptions
FY19 FY20 FY21 FY22
Nutrients
Revenue growth % 19.8 (2.1) 8.1 6.0
EBIT Margin % 9.2 9.9 9.5 9.6
CPC
Revenue growth % 8.40 (7.39) 20.69 12.00
EBIT Margin 14.9 11.7 13.7 14.0
Segment details Rsmn
Revenue
Nutrients 115,053 112,609 121,773 129,079
CPC 18,019 16,688 20,141 22,558
Less: Inter Segment 826 1,180 1,277 1,348
Total 132,246 128,117 140,637 150,290
EBIT
Nutrients 10,612 11,169 11,578 12,333
CPC 2,679 1,946 2,768 3,149
Total 13,292 13,115 14,346 15,482
Source: Company, Nirmal Bang Institutional Equities Research
Key highlights from CRIN conference-call
Monsoon and policy overview
There was a decent pick up in the monsoon in August after a dull start with rainfall 16% above the five year average. This helped maintain the kharif season crop sowing at par with last year. CRIN’s key markets, AP and Telangana, witnessed 1% YoY growth in crop sowing. Reservoir levels stood at 89% of the total capacity and was higher by 24% vs. Long Period Average levels (LPA) and 25% higher YoY. However, the dull start to the kharif season extended the sowing period till October which is in favor of CRIN.
Benefit from “Rythu Bandhu” scheme for key market, Telangana, has been extended up to Rs13,500/acre per year from Rs10,000/acre per year to assist the farmers for agricultural inputs.
With the introduction of Phase II of direct benefit transfer (DBT 2.0) by the government, claim settlement is faster in comparison to Phase I. Currently, Government is working on a pilot for DBT 3.0 to disburse fertilizer subsidies to farmers in their e-wallet accounts before the commencement of a season each year.
Institutional Equities
6 Coromandel International
Upcoming irrigation projects in CRIN’s key markets AP and Telangana are expected to cover a combined 4 lakh hectares of land. This will likely help improve the agricultural prospects by pushing farmers to change the cropping pattern from core cereals or pulses towards more agricultural input products like paddy and maize.
Industry overview:
Phosphatic fertilizers industry sales grew to 6.1mn tonne from 6.08mn tonne last year. The increase has come from south-10%, west- 5% and north- 2%, while central and east had deficit of 25% and 7%, respectively.
Raw material prices in the fertilizer segment are showing a softening trend. Phos acid prices for 3Q were at USD$625 per tonne compared to 2Q prices last year of USD $655 per tonne. Industry has passed on the benefit of stable currency and softer raw material prices to the consumer and overall MRP has been brought down by 4% to 10%.
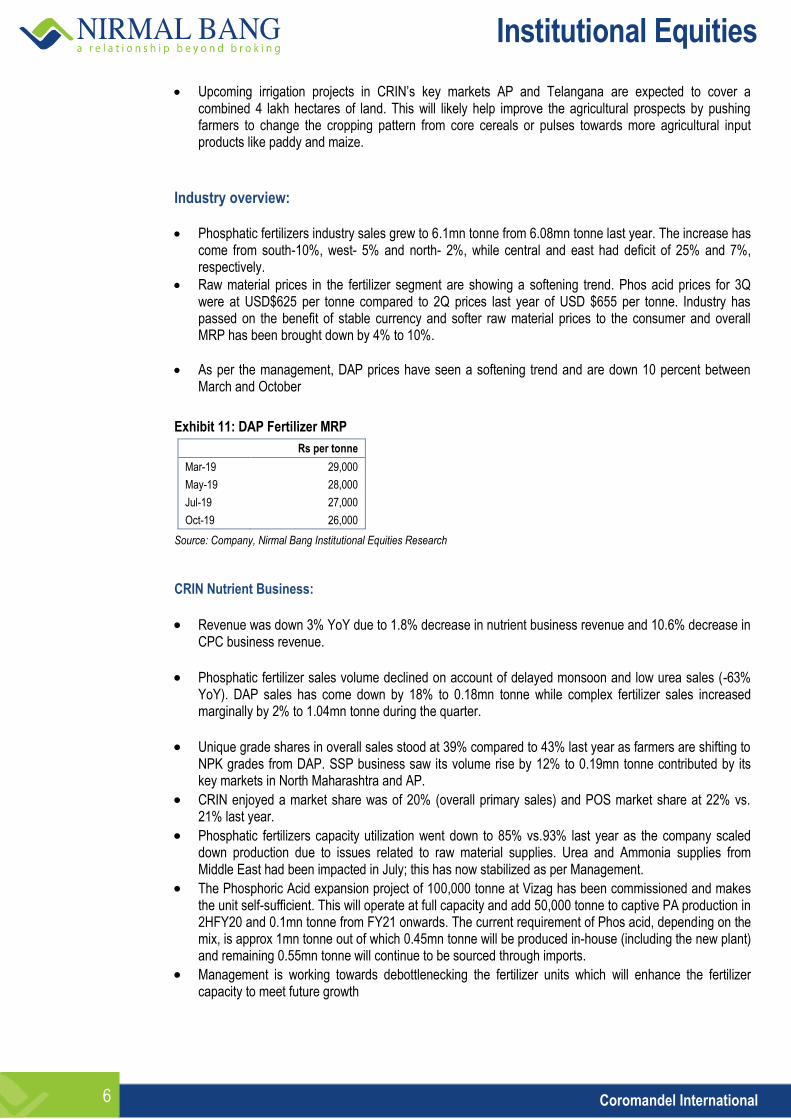
As per the management, DAP prices have seen a softening trend and are down 10 percent between March and October
Exhibit 11: DAP Fertilizer MRP
Rs per tonne
Mar-19 29,000
May-19 28,000
Jul-19 27,000
Oct-19 26,000
Source: Company, Nirmal Bang Institutional Equities Research
CRIN Nutrient Business:
Revenue was down 3% YoY due to 1.8% decrease in nutrient business revenue and 10.6% decrease in CPC business revenue.
Phosphatic fertilizer sales volume declined on account of delayed monsoon and low urea sales (-63% YoY). DAP sales has come down by 18% to 0.18mn tonne while complex fertilizer sales increased marginally by 2% to 1.04mn tonne during the quarter.
Unique grade shares in overall sales stood at 39% compared to 43% last year as farmers are shifting to NPK grades from DAP. SSP business saw its volume rise by 12% to 0.19mn tonne contributed by its key markets in North Maharashtra and AP.
CRIN enjoyed a market share was of 20% (overall primary sales) and POS market share at 22% vs. 21% last year.
Phosphatic fertilizers capacity utilization went down to 85% vs.93% last year as the company scaled down production due to issues related to raw material supplies. Urea and Ammonia supplies from Middle East had been impacted in July; this has now stabilized as per Management.
The Phosphoric Acid expansion project of 100,000 tonne at Vizag has been commissioned and makes the unit self-sufficient. This will operate at full capacity and add 50,000 tonne to captive PA production in 2HFY20 and 0.1mn tonne from FY21 onwards. The current requirement of Phos acid, depending on the mix, is approx 1mn tonne out of which 0.45mn tonne will be produced in-house (including the new plant) and remaining 0.55mn tonne will continue to be sourced through imports.
Management is working towards debottlenecking the fertilizer units which will enhance the fertilizer capacity to meet future growth
Institutional Equities
7 Coromandel International
CRIN CPC business:
Revenue from CPC segment declined by 10.6% YoY to Rs5.1bn due to the following factors:
The Sarigam unit started operation in late July after a prolonged outage due to the fire mishap in January this year. This curtailed the output from this unit to just 45 days
Mancozeb is seeing pricing pressure as well as some shipping problem in the international market, which impacted the CPC revenue.
Pymetrozin plant has been commissioned for pilot testing at Dahej.
The management mentioned that it has created separate B2B and B2C verticals in for the overseas markets to grow its B2C sales and is working on its product mix to help both its domestic and international markets.
The company stated that the WDG facility for Mancozeb is ready and will support Mancozeb sales in export markets once the registration is complete.
The company expects new launches to support growth in the CPC business over 2H FY20 and beyond.
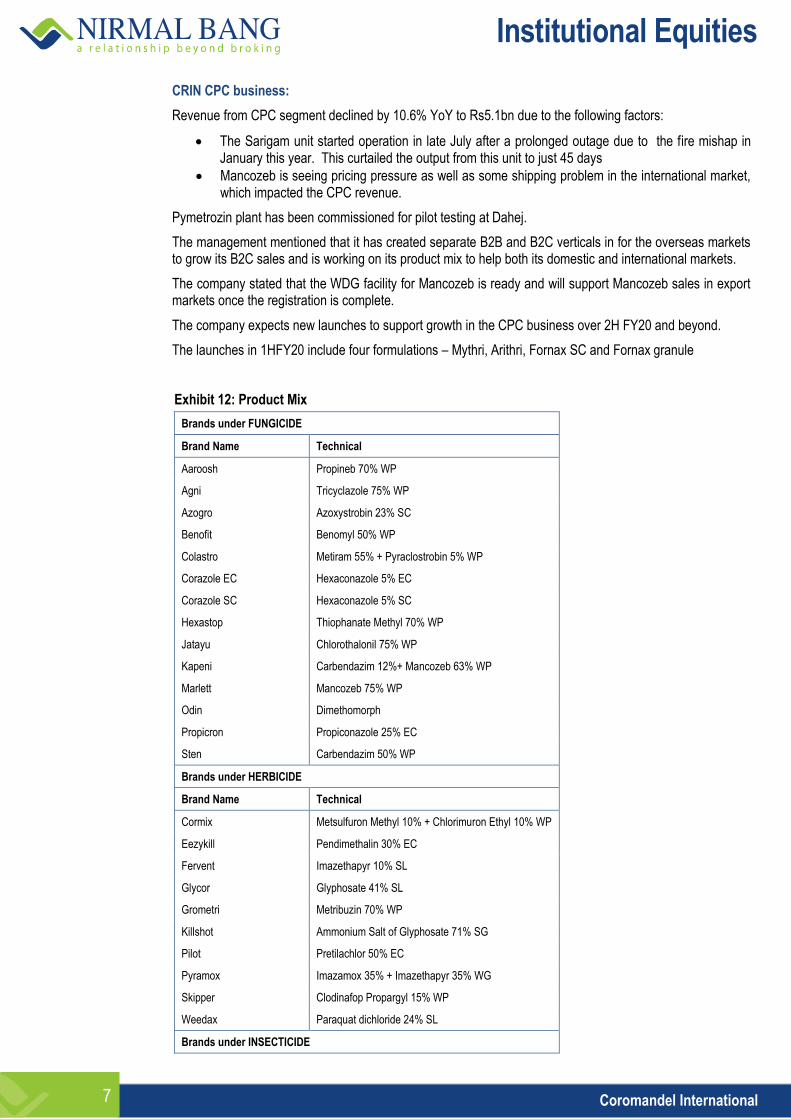
The launches in 1HFY20 include four formulations – Mythri, Arithri, Fornax SC and Fornax granule
Exhibit 12: Product Mix
Brands under FUNGICIDE
Brand Name Technical
Aaroosh Propineb 70% WP
Agni Tricyclazole 75% WP
Azogro Azoxystrobin 23% SC
Benofit Benomyl 50% WP
Colastro Metiram 55% + Pyraclostrobin 5% WP
Corazole EC Hexaconazole 5% EC
Corazole SC Hexaconazole 5% SC
Hexastop Thiophanate Methyl 70% WP
Jatayu Chlorothalonil 75% WP
Kapeni Carbendazim 12%+ Mancozeb 63% WP
Marlett Mancozeb 75% WP
Odin Dimethomorph
Propicron Propiconazole 25% EC
Sten Carbendazim 50% WP
Brands under HERBICIDE
Brand Name Technical
Cormix Metsulfuron Methyl 10% + Chlorimuron Ethyl 10% WP
Eezykill Pendimethalin 30% EC
Fervent Imazethapyr 10% SL
Glycor Glyphosate 41% SL
Grometri Metribuzin 70% WP
Killshot Ammonium Salt of Glyphosate 71% SG
Pilot Pretilachlor 50% EC
Pyramox Imazamox 35% + Imazethapyr 35% WG
Skipper Clodinafop Propargyl 15% WP
Weedax Paraquat dichloride 24% SL
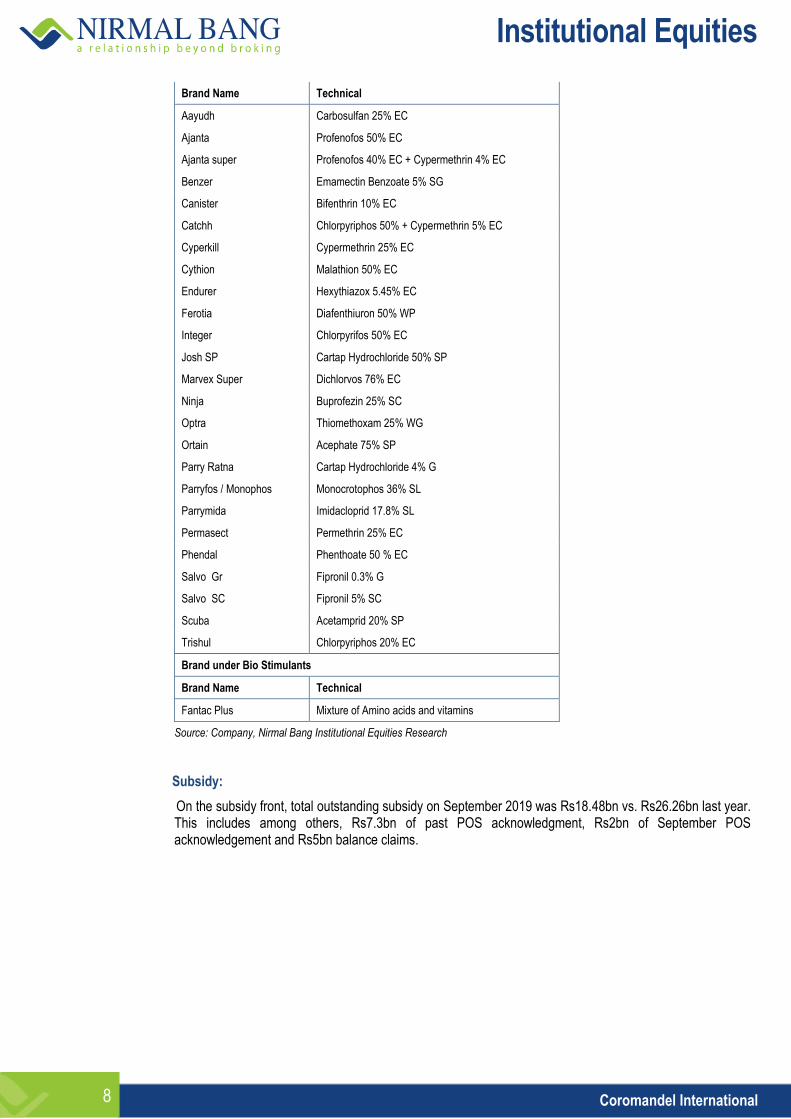
Brands under INSECTICIDE
Institutional Equities
8 Coromandel International
Brand Name Technical
Aayudh Carbosulfan 25% EC
Ajanta Profenofos 50% EC
Ajanta super Profenofos 40% EC + Cypermethrin 4% EC
Benzer Emamectin Benzoate 5% SG
Canister Bifenthrin 10% EC
Catchh Chlorpyriphos 50% + Cypermethrin 5% EC
Cyperkill Cypermethrin 25% EC
Cythion Malathion 50% EC
Endurer Hexythiazox 5.45% EC
Ferotia Diafenthiuron 50% WP
Integer Chlorpyrifos 50% EC
Josh SP Cartap Hydrochloride 50% SP
Marvex Super Dichlorvos 76% EC
Ninja Buprofezin 25% SC
Optra Thiomethoxam 25% WG
Ortain Acephate 75% SP
Parry Ratna Cartap Hydrochloride 4% G
Parryfos / Monophos Monocrotophos 36% SL
Parrymida Imidacloprid 17.8% SL
Permasect Permethrin 25% EC
Phendal Phenthoate 50 % EC
Salvo Gr Fipronil 0.3% G
Salvo SC Fipronil 5% SC
Scuba Acetamprid 20% SP
Trishul Chlorpyriphos 20% EC
Brand under Bio Stimulants
Brand Name Technical
Fantac Plus Mixture of Amino acids and vitamins
Source: Company, Nirmal Bang Institutional Equities Research
Subsidy:
On the subsidy front, total outstanding subsidy on September 2019 was Rs18.48bn vs. Rs26.26bn last year. This includes among others, Rs7.3bn of past POS acknowledgment, Rs2bn of September POS acknowledgement and Rs5bn balance claims.
Institutional Equities
9 Coromandel International
Exhibit 13: CRIN 2QFY20 Segment results
Segment Revenue (Rs Mn) 2Q FY19 2Q FY20 Change YoY % 1Q FY20 Change QoQ %
Nutrient & Other 44,734 43,914 -1.8 18,816 133
Crop protection 5,704 5,099 -10.6 2,710 88
Total Revenue 50,439 49,013 -3 21,526 128
Less: Inter-segment 356 433 22 218 98
Net revenues 50,083 48,580 -3 21,307 128
Segment EBIT
Nutrient & Other 5,669 6,282 11 2,020 211
Crop Protection 1,051 834 -21 59 1,322
Corp. exp 320 403 -94 430 -6
Total EBIT 6,400 6,713 5 1,648 307
Segment EBIT %
bps Change
bps Change
Nutrient and Other 12.7 14.3 163 10.7 357
Crop protection 18.4 16.3 -207.5 2.2 1,418.4
Total EBIT Margin 12.8 13.8 104.0 7.7 608.3
Segment EBIT/Assets %
bps Change
bps Change
Nutrient & Other 7.2 7.9 70 1.8 605
Crop Protection 6.5 5.5 -91.1 0.1 546
Total 6.4 6.9 46.8 1.5 539
Source: Company, Nirmal Bang Institutional Equities Research
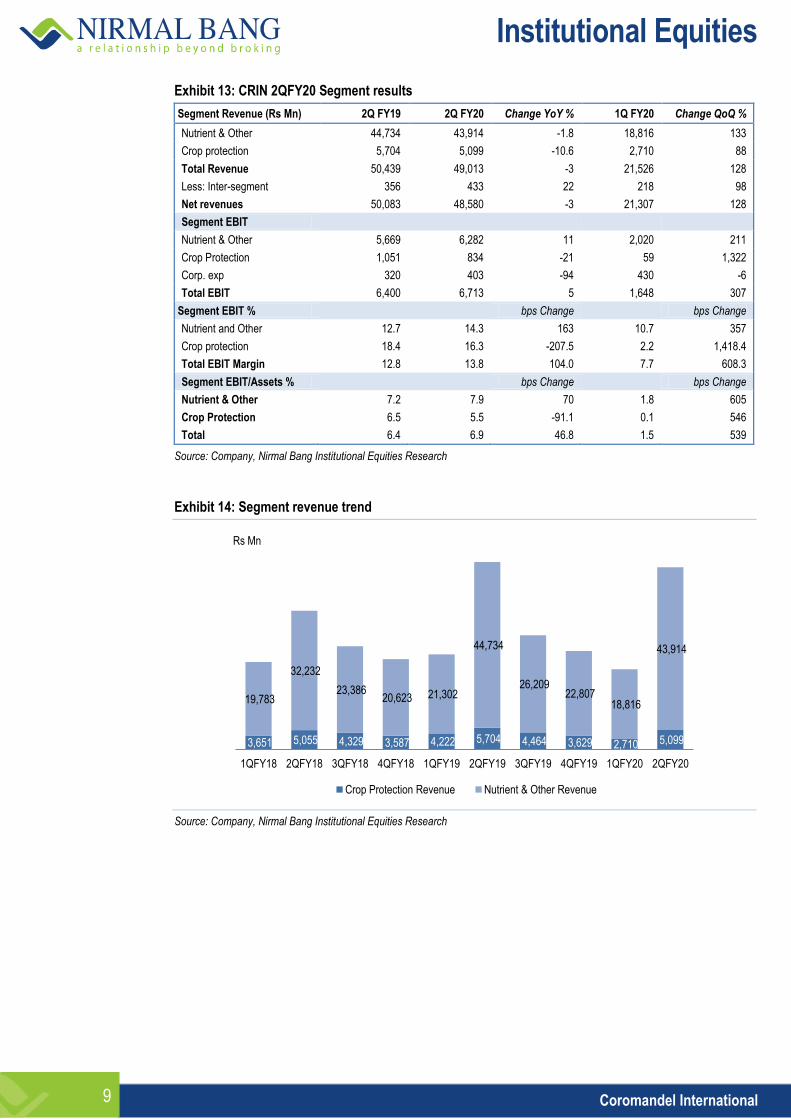
Exhibit 14: Segment revenue trend
Source: Company, Nirmal Bang Institutional Equities Research
3,651 5,055 4,329 3,587 4,222 5,704 4,464 3,629 2,710 5,099
19,783
32,232
23,386 20,623 21,302
44,734
26,209 22,807
18,816
43,914
1QFY18 2QFY18 3QFY18 4QFY18 1QFY19 2QFY19 3QFY19 4QFY19 1QFY20 2QFY20
Rs Mn
Crop Protection Revenue Nutrient & Other Revenue
Institutional Equities
10 Coromandel International
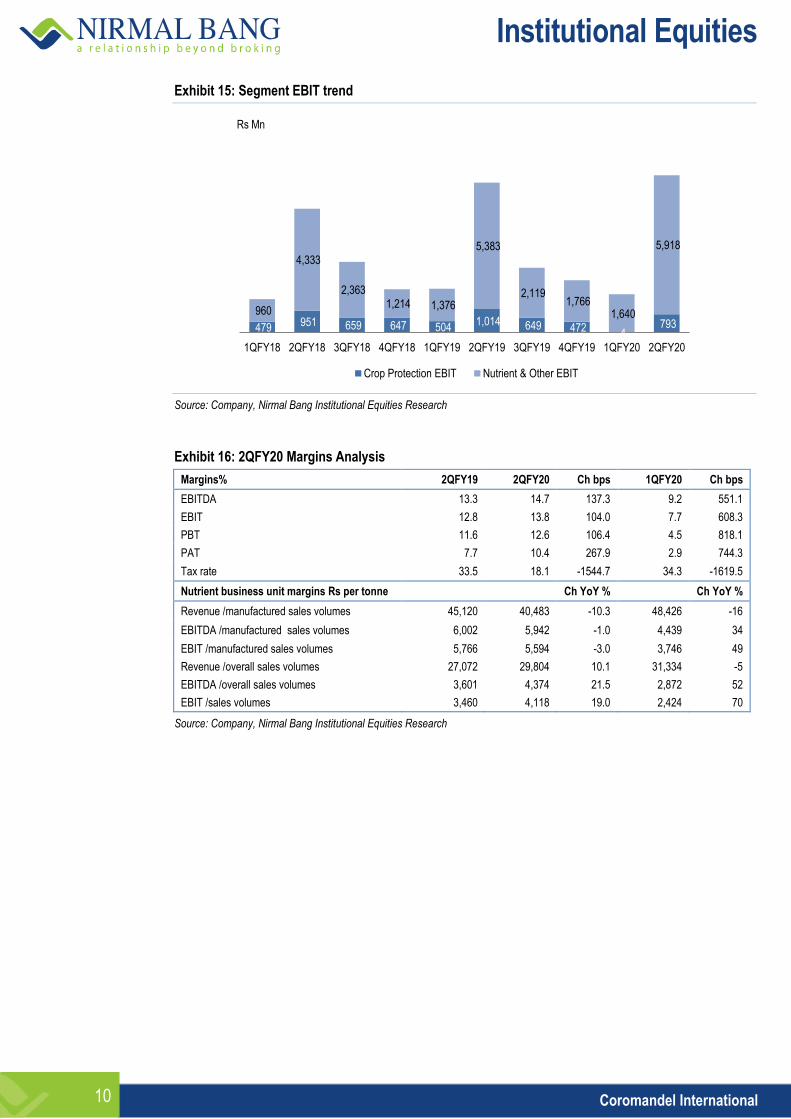
Exhibit 15: Segment EBIT trend
Source: Company, Nirmal Bang Institutional Equities Research
Exhibit 16: 2QFY20 Margins Analysis
Margins% 2QFY19 2QFY20 Ch bps 1QFY20 Ch bps
EBITDA 13.3 14.7 137.3 9.2 551.1
EBIT 12.8 13.8 104.0 7.7 608.3
PBT 11.6 12.6 106.4 4.5 818.1
PAT 7.7 10.4 267.9 2.9 744.3
Tax rate 33.5 18.1 -1544.7 34.3 -1619.5
Nutrient business unit margins Rs per tonne
Ch YoY %
Ch YoY %
Revenue /manufactured sales volumes 45,120 40,483 -10.3 48,426 -16
EBITDA /manufactured sales volumes 6,002 5,942 -1.0 4,439 34
EBIT /manufactured sales volumes 5,766 5,594 -3.0 3,746 49
Revenue /overall sales volumes 27,072 29,804 10.1 31,334 -5
EBITDA /overall sales volumes 3,601 4,374 21.5 2,872 52
EBIT /sales volumes 3,460 4,118 19.0 2,424 70
Source: Company, Nirmal Bang Institutional Equities Research
479 951 659 647 504 1,014 649 472 4
793 960
4,333
2,363 1,214 1,376
5,383
2,119 1,766
1,640
5,918
1QFY18 2QFY18 3QFY18 4QFY18 1QFY19 2QFY19 3QFY19 4QFY19 1QFY20 2QFY20
Rs Mn
Crop Protection EBIT Nutrient & Other EBIT
Institutional Equities
11 Coromandel International
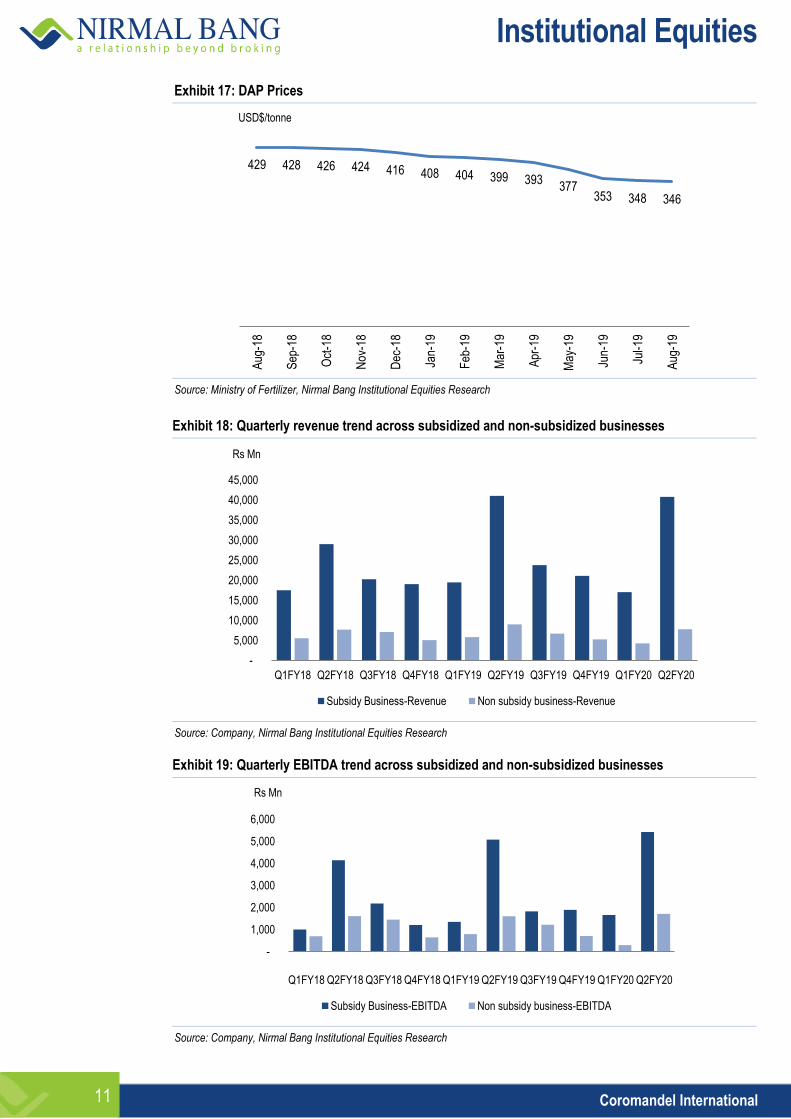
Exhibit 17: DAP Prices
Source: Ministry of Fertilizer, Nirmal Bang Institutional Equities Research
Exhibit 18: Quarterly revenue trend across subsidized and non-subsidized businesses
Source: Company, Nirmal Bang Institutional Equities Research
Exhibit 19: Quarterly EBITDA trend across subsidized and non-subsidized businesses
Source: Company, Nirmal Bang Institutional Equities Research
429 428 426 424 416 408 404 399 393 377
353 348 346
Aug
-18
Sep
-18
Oct
-18
Nov
-18
Dec
-18
Jan-
19
Feb
-19
Mar
-19
Apr
-19
May
-19
Jun-
19
Jul-1
9
Aug
-19
USD$/tonne
-
5,000
10,000
15,000
20,000
25,000
30,000
35,000
40,000
45,000
Q1FY18 Q2FY18 Q3FY18 Q4FY18 Q1FY19 Q2FY19 Q3FY19 Q4FY19 Q1FY20 Q2FY20
Rs Mn
Subsidy Business-Revenue Non subsidy business-Revenue
-
1,000
2,000
3,000
4,000
5,000
6,000
Q1FY18
Q2FY18
Q3FY18
Q4FY18
Q1FY19
Q2FY19
Q3FY19
Q4FY19
Q1FY20
Q2FY20
Rs Mn
Subsidy Business-EBITDA Non subsidy business-EBITDA
Institutional Equities
12 Coromandel International
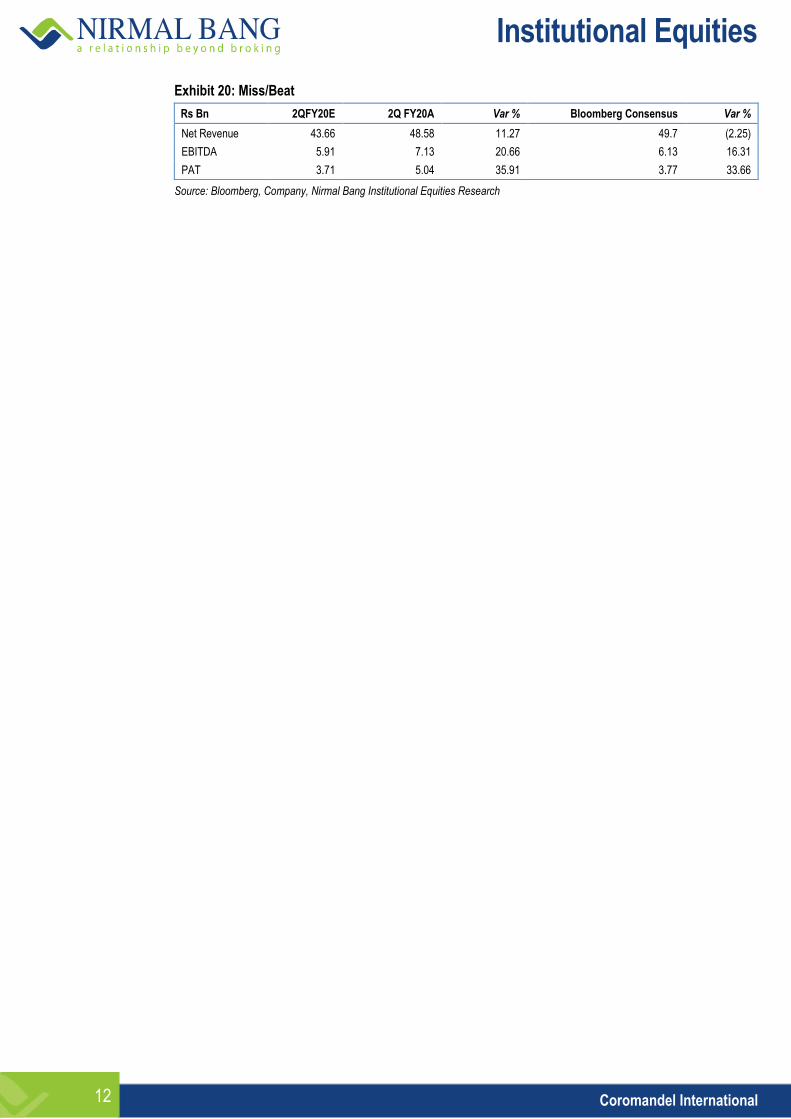
Exhibit 20: Miss/Beat
Rs Bn 2QFY20E 2Q FY20A Var % Bloomberg Consensus Var %
Net Revenue 43.66 48.58 11.27 49.7 (2.25)
EBITDA 5.91 7.13 20.66 6.13 16.31
PAT 3.71 5.04 35.91 3.77 33.66
Source: Bloomberg, Company, Nirmal Bang Institutional Equities Research
Institutional Equities
13 Coromandel International
Consolidated Financials
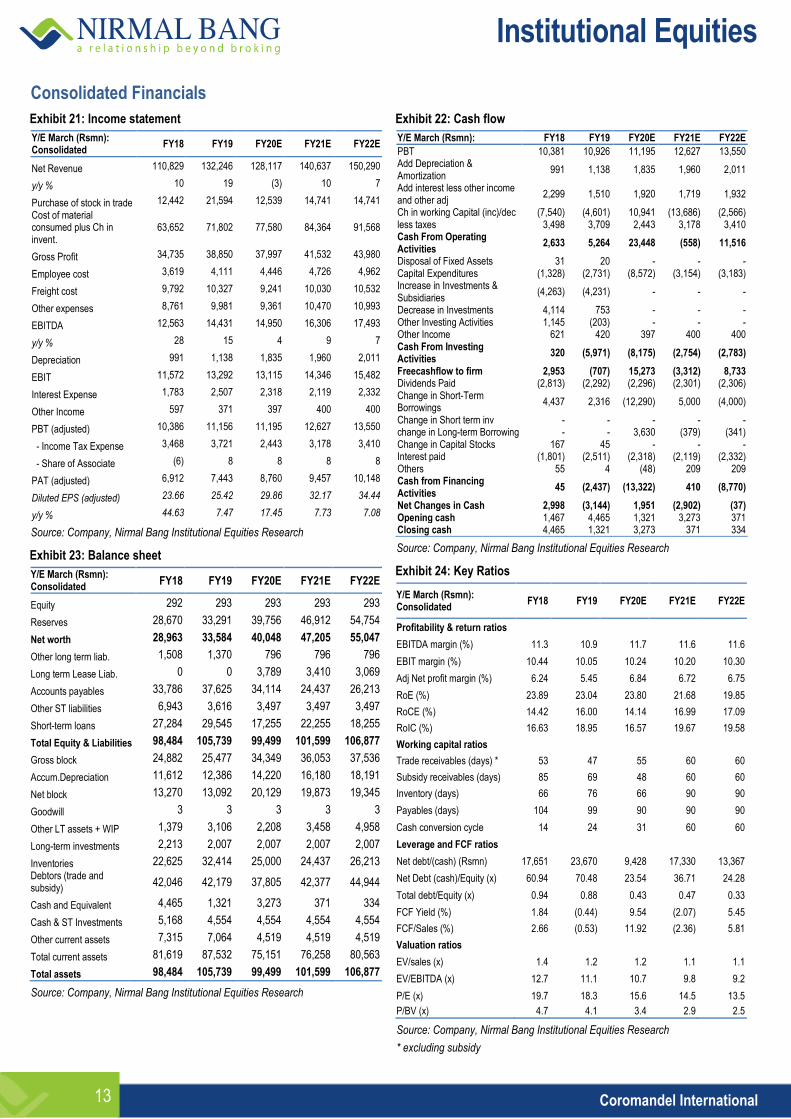
Exhibit 21: Income statement
Y/E March (Rsmn): Consolidated
FY18 FY19 FY20E FY21E FY22E
Net Revenue 110,829 132,246 128,117 140,637 150,290
y/y % 10 19 (3) 10 7
Purchase of stock in trade 12,442 21,594 12,539 14,741 14,741
Cost of material consumed plus Ch in invent.
63,652 71,802 77,580 84,364 91,568
Gross Profit 34,735 38,850 37,997 41,532 43,980
Employee cost 3,619 4,111 4,446 4,726 4,962
Freight cost 9,792 10,327 9,241 10,030 10,532
Other expenses 8,761 9,981 9,361 10,470 10,993
EBITDA 12,563 14,431 14,950 16,306 17,493
y/y % 28 15 4 9 7
Depreciation 991 1,138 1,835 1,960 2,011
EBIT 11,572 13,292 13,115 14,346 15,482
Interest Expense 1,783 2,507 2,318 2,119 2,332
Other Income 597 371 397 400 400
PBT (adjusted) 10,386 11,156 11,195 12,627 13,550
- Income Tax Expense 3,468 3,721 2,443 3,178 3,410
- Share of Associate (6) 8 8 8 8
PAT (adjusted) 6,912 7,443 8,760 9,457 10,148
Diluted EPS (adjusted) 23.66 25.42 29.86 32.17 34.44
y/y % 44.63 7.47 17.45 7.73 7.08
Source: Company, Nirmal Bang Institutional Equities Research
Exhibit 23: Balance sheet
Y/E March (Rsmn): Consolidated
FY18 FY19 FY20E FY21E FY22E
Equity 292 293 293 293 293
Reserves 28,670 33,291 39,756 46,912 54,754
Net worth 28,963 33,584 40,048 47,205 55,047
Other long term liab. 1,508 1,370 796 796 796
Long term Lease Liab. 0 0 3,789 3,410 3,069
Accounts payables 33,786 37,625 34,114 24,437 26,213
Other ST liabilities 6,943 3,616 3,497 3,497 3,497
Short-term loans 27,284 29,545 17,255 22,255 18,255
Total Equity & Liabilities 98,484 105,739 99,499 101,599 106,877
Gross block 24,882 25,477 34,349 36,053 37,536
Accum.Depreciation 11,612 12,386 14,220 16,180 18,191
Net block 13,270 13,092 20,129 19,873 19,345
Goodwill 3 3 3 3 3
Other LT assets + WIP 1,379 3,106 2,208 3,458 4,958
Long-term investments 2,213 2,007 2,007 2,007 2,007
Inventories 22,625 32,414 25,000 24,437 26,213
Debtors (trade and subsidy)
42,046 42,179 37,805 42,377 44,944
Cash and Equivalent 4,465 1,321 3,273 371 334
Cash & ST Investments 5,168 4,554 4,554 4,554 4,554
Other current assets 7,315 7,064 4,519 4,519 4,519
Total current assets 81,619 87,532 75,151 76,258 80,563
Total assets 98,484 105,739 99,499 101,599 106,877
Source: Company, Nirmal Bang Institutional Equities Research
Exhibit 22: Cash flow
Y/E March (Rsmn): FY18 FY19 FY20E FY21E FY22E
PBT 10,381 10,926 11,195 12,627 13,550 Add Depreciation & Amortization
991 1,138 1,835 1,960 2,011
Add interest less other income and other adj
2,299 1,510 1,920 1,719 1,932
Ch in working Capital (inc)/dec (7,540) (4,601) 10,941 (13,686) (2,566) less taxes 3,498 3,709 2,443 3,178 3,410 Cash From Operating Activities
2,633 5,264 23,448 (558) 11,516
Disposal of Fixed Assets 31 20 - - - Capital Expenditures (1,328) (2,731) (8,572) (3,154) (3,183) Increase in Investments & Subsidiaries
(4,263) (4,231) - - -
Decrease in Investments 4,114 753 - - - Other Investing Activities 1,145 (203) - - - Other Income 621 420 397 400 400 Cash From Investing Activities
320 (5,971) (8,175) (2,754) (2,783)
Freecashflow to firm 2,953 (707) 15,273 (3,312) 8,733 Dividends Paid (2,813) (2,292) (2,296) (2,301) (2,306) Change in Short-Term Borrowings
4,437 2,316 (12,290) 5,000 (4,000)
Change in Short term inv - - - - - change in Long-term Borrowing - - 3,630 (379) (341) Change in Capital Stocks 167 45 - - - Interest paid (1,801) (2,511) (2,318) (2,119) (2,332) Others 55 4 (48) 209 209 Cash from Financing Activities
45 (2,437) (13,322) 410 (8,770)
Net Changes in Cash 2,998 (3,144) 1,951 (2,902) (37) Opening cash 1,467 4,465 1,321 3,273 371 Closing cash 4,465 1,321 3,273 371 334
Source: Company, Nirmal Bang Institutional Equities Research
Exhibit 24: Key Ratios
Y/E March (Rsmn): Consolidated
FY18 FY19 FY20E FY21E FY22E
Profitability & return ratios
EBITDA margin (%) 11.3 10.9 11.7 11.6 11.6
EBIT margin (%) 10.44 10.05 10.24 10.20 10.30
Adj Net profit margin (%) 6.24 5.45 6.84 6.72 6.75
RoE (%) 23.89 23.04 23.80 21.68 19.85
RoCE (%) 14.42 16.00 14.14 16.99 17.09
RoIC (%) 16.63 18.95 16.57 19.67 19.58
Working capital ratios
Trade receivables (days) * 53 47 55 60 60
Subsidy receivables (days) 85 69 48 60 60
Inventory (days) 66 76 66 90 90
Payables (days) 104 99 90 90 90
Cash conversion cycle 14 24 31 60 60
Leverage and FCF ratios
Net debt/(cash) (Rsmn) 17,651 23,670 9,428 17,330 13,367
Net Debt (cash)/Equity (x) 60.94 70.48 23.54 36.71 24.28
Total debt/Equity (x) 0.94 0.88 0.43 0.47 0.33
FCF Yield (%) 1.84 (0.44) 9.54 (2.07) 5.45
FCF/Sales (%) 2.66 (0.53) 11.92 (2.36) 5.81
Valuation ratios
EV/sales (x) 1.4 1.2 1.2 1.1 1.1
EV/EBITDA (x) 12.7 11.1 10.7 9.8 9.2
P/E (x) 19.7 18.3 15.6 14.5 13.5
P/BV (x) 4.7 4.1 3.4 2.9 2.5
Source: Company, Nirmal Bang Institutional Equities Research
* excluding subsidy
Institutional Equities
14 Coromandel International
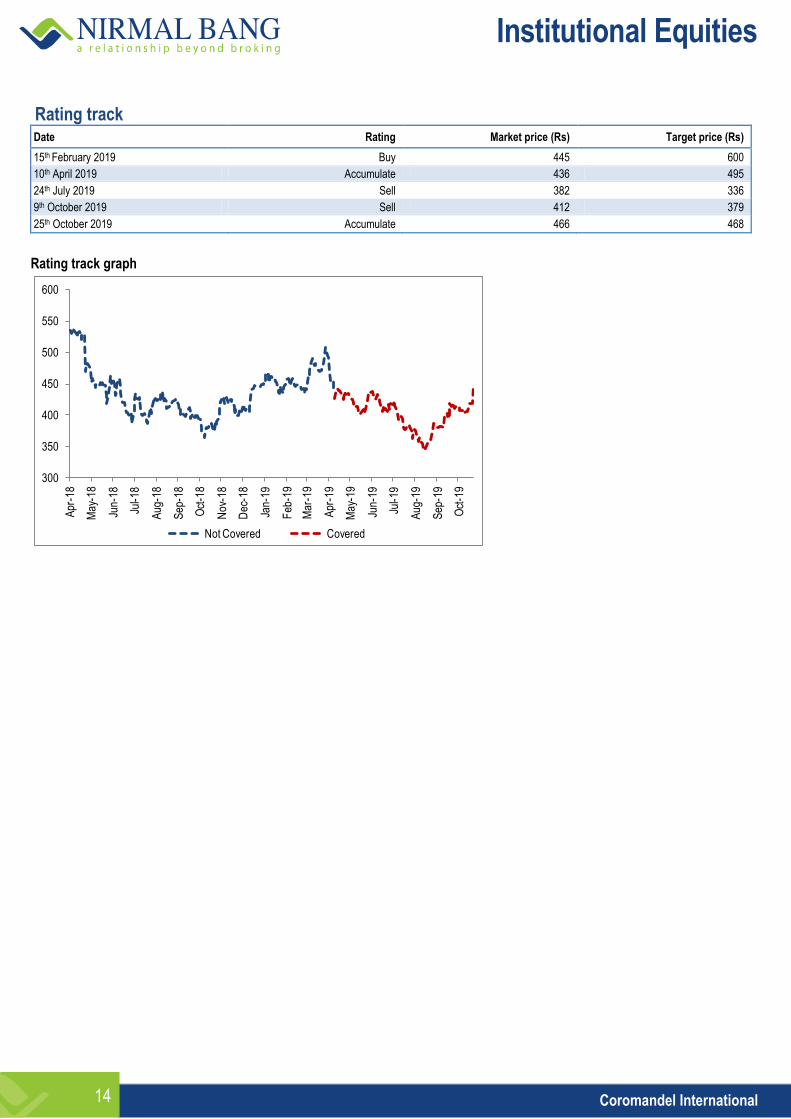
Rating track Date Rating Market price (Rs) Target price (Rs)
15th February 2019 Buy 445 600
10th April 2019 Accumulate 436 495
24th July 2019 Sell 382 336
9th October 2019 Sell 412 379
25th October 2019 Accumulate 466 468
Rating track graph
300
350
400
450
500
550
600
Apr
-18
May
-18
Jun-
18
Jul-1
8
Aug
-18
Sep
-18
Oct
-18
Nov
-18
Dec
-18
Jan-
19
Feb
-19
Mar
-19
Apr
-19
May
-19
Jun-
19
Jul-1
9
Aug
-19
Sep
-19
Oct
-19
Not Covered Covered
Institutional Equities
15 Coromandel International
DISCLOSURES
This Report is published by Nirmal Bang Equities Private Limited (hereinafter referred to as “NBEPL”) for private circulation. NBEPL is a registered Research Analyst under SEBI (Research Analyst) Regulations, 2014 having Registration no. INH000001436. NBEPL is also a registered Stock Broker with National Stock Exchange of India Limited and BSE Limited in cash and derivatives segments. NBEPL has other business divisions with independent research teams separated by Chinese walls, and therefore may, at times, have different or contrary views on stocks and markets. NBEPL or its associates have not been debarred / suspended by SEBI or any other regulatory authority for accessing / dealing in securities Market. NBEPL, its associates or analyst or his relatives do not hold any financial interest in the subject company. NBEPL or its associates or Analyst do not have any conflict or material conflict of interest at the time of publication of the research report with the subject company. NBEPL or its associates or Analyst or his relatives do not hold beneficial ownership of 1% or more in the subject company at the end of the month immediately preceding the date of publication of this research report. NBEPL or its associates / analyst has not received any compensation / managed or co-managed public offering of securities of the company covered by Analyst during the past twelve months. NBEPL or its associates have not received any compensation or other benefits from the company covered by Analyst or third party in connection with the research report. Analyst has not served as an officer, director or employee of Subject Company and NBEPL / analyst has not been engaged in market making activity of the subject company. Analyst Certification: I, Amit Agarwal, research analyst and the author of this report, hereby certify that the views expressed in this research report accurately reflects my personal views about the subject securities, issuers, products, sectors or industries. It is also certified that no part of the compensation of the analyst was, is, or will be directly or indirectly related to the inclusion of specific recommendations or views in this research. The analyst is principally responsible for the preparation of this research report and has taken reasonable care to achieve and maintain independence and objectivity in making any recommendations.
Institutional Equities
16 Coromandel International
Disclaimer
Stock Ratings Absolute Returns
BUY > 15%
ACCUMULATE -5% to15%
SELL < -5%
This report is for the personal information of the authorized recipient and does not construe to be any investment, legal or taxation advice to you. NBEPL is not soliciting any action based upon it. Nothing in this research shall be construed as a solicitation to buy or sell any security or product, or to engage in or refrain from engaging in any such transaction. In preparing this research, we did not take into account the investment objectives, financial situation and particular needs of the reader.
This research has been prepared for the general use of the clients of NBEPL and must not be copied, either in whole or in part, or distributed or redistributed to any other person in any form. If you are not the intended recipient you must not use or disclose the information in this research in any way. Though disseminated to all the customers simultaneously, not all customers may receive this report at the same time. NBEPL will not treat recipients as customers by virtue of their receiving this report. This report is not directed or intended for distribution to or use by any person or entity resident in a state, country or any jurisdiction, where such distribution, publication, availability or use would be contrary to law, regulation or which would subject NBEPL & its group companies to registration or licensing requirements within such jurisdictions.
The report is based on the information obtained from sources believed to be reliable, but we do not make any representation or warranty that it is accurate, complete or up-to-date and it should not be relied upon as such. We accept no obligation to correct or update the information or opinions in it. NBEPL or any of its affiliates or employees shall not be in any way responsible for any loss or damage that may arise to any person from any inadvertent error in the information contained in this report. NBEPL or any of its affiliates or employees do not provide, at any time, any express or implied warranty of any kind, regarding any matter pertaining to this report, including without limitation the implied warranties of merchantability, fitness for a particular purpose, and non-infringement. The recipients of this report should rely on their own investigations.
This information is subject to change without any prior notice. NBEPL reserves its absolute discretion and right to make or refrain from making modifications and alterations to this statement from time to time. Nevertheless, NBEPL is committed to providing independent and transparent recommendations to its clients, and would be happy to provide information in response to specific client queries.
Before making an investment decision on the basis of this research, the reader needs to consider, with or without the assistance of an adviser, whether the advice is appropriate in light of their particular investment needs, objectives and financial circumstances. There are risks involved in securities trading. The price of securities can and does fluctuate, and an individual security may even become valueless. International investors are reminded of the additional risks inherent in international investments, such as currency fluctuations and international stock market or economic conditions, which may adversely affect the value of the investment. Opinions expressed are subject to change without any notice. Neither the company nor the director or the employees of NBEPL accept any liability whatsoever for any direct, indirect, consequential or other loss arising from any use of this research and/or further communication in relation to this research. Here it may be noted that neither NBEPL, nor its directors, employees, agents or representatives shall be liable for any damages whether direct or indirect, incidental, special or consequential including lost revenue or lost profit that may arise from or in connection with the use of the information contained in this report.
Copyright of this document vests exclusively with NBEPL.
Our reports are also available on our website www.nirmalbang.com
Access all our reports on Bloomberg, Thomson Reuters and Factset.
Team Details:
Name Email Id Direct Line
Rahul Arora CEO [email protected] -
Girish Pai Head of Research [email protected] +91 22 6273 8017 / 18
Dealing
Ravi Jagtiani Dealing Desk [email protected] +91 22 6273 8230, +91 22 6636 8833
Pradeep Kasat Dealing Desk [email protected] +91 22 6273 8100/8101, +91 22 6636 8831
Michael Pillai Dealing Desk [email protected] +91 22 6273 8102/8103, +91 22 6636 8830
Nirmal Bang Equities Pvt. Ltd.
Correspondence Address
B-2, 301/302, Marathon Innova,
Nr. Peninsula Corporate Park,
Lower Parel (W), Mumbai-400013.
Board No. : 91 22 6273 8000/1; Fax. : 022 6273 8010


