Embed Size (px)
Citation preview
In s t itu tio n a l E q u it ie s
Coromandel International
4QF
Y20
Res
ult U
pdat
e
Reuters: CORF.NS; Bloomberg: CRIN IN
May take a pause post recent rally We maintain our Accumulate rating after raising our PE-based target price (TP) for Coromandel International (CRIN) by 26% to Rs714 (8.24% upside from CMP), following our 31%/26% upward revision in FY21-22E earnings. This is based on the good 4QFY20 results with PAT doubling YoY to Rs2.34bn - a beat of 40%/37% on consensus/NBIE estimates. The positive surprise was driven by the 17% growth in phosphatic sales (volume), 400bps/334bps beat in nutrient/CPC segment EBIT margins and 13.63% beat in CPC revenue, defying our expectation of lower volume/margin and the impact of lockdown in end Mar’20. During the 4QFY20 results concall, the management guided about healthy growth prospects and a favourable kharif crop in the coming season on indications of a good monsoon. Long term prospects look healthy, but hinge on execution of the company’s plans to invest in (a) debottlenecking its fertilizer plants (b) new products and formulations in CPC and (c) new generation fertilizers and specialty nutrients with a focus on branding and B2C model. However, we believe that the stock’s 57% surge in the last one year has priced in the good results and offers limited margin of safety in case of any setbacks, especially in 1QFY21 due to the following risks – i) weaker/delayed monsoon or labour shortages hampering progress in sowing and ii) the risk of damage to crops from a fresh locust swarm hitting India. Indian government’s proposal to ban 27 pesticides. This includes 4 of CRIN’s products (worth Rs8bn-8.5bn in revenue). The proposal is open for public comments within 45 days of the issue of the gazette notification last week. Management stated that the industry is submitting requested data while making representations to the government against banning these chemicals, based on benefits to farmers and export prospects. Revenue up 9%: Fertilizer revenue was up 6.8% YoY in 4QFY20 based on growth of 21.4% YoY in manufactured volume. CPC revenue was up 21.8% YoY. EBITDA margin up 380bps at 13.62%: The company’s share of revenue from the subsidy business remained unchanged at 80% compared to last year. The EBITDA share of the subsidy business came in at 75% for 4QFY20 vs.73% a year ago. Fertilizer EBIT per tonne was up by 60% at Rs3,249/tonne, which boosted segment EBIT by 56% to Rs3.1bn. Growth in fertilizer earnings was supported by soft input prices, operational efficiencies and brand equity enjoyed by its grades. Capex of Rs3bn -4bn to develop new products in high margin CPC segment, increasing footprint of retail business, capacity augmentation for future growth in fertilizers and for R&D for developing new molecules and speciality nutrients. Additionally, some capex is planned for the debottlenecking of fertilizer plants. Management stated that cash level would continue to remain healthy going ahead. CPC margin under pressure. CPC EBIT margin dipped 53bps to 13.5%. CPC’s share of revenue was 15.4% vs 13.1% a year ago. New products launched include Astra – new generation insecticide. The company plans to invest in new projects to introduce combination molecules and increase its B2C presence. Healthy balance sheet: Net debt for FY20 stood at Rs11.1bn vs Rs23.6bn last year and net debt/EBITDA for FY20 is comfortable at 0.64x. The company’s subsidy dues have increased from Rs20.2bn last year to Rs23bn as of Mar’20. The ROCE for FY20 has come in at 18.96%.
ACCUMULATE
Sector: Chemicals
CMP: Rs660
Target Price: Rs714
Upside: 8%
Amit Agarwal Research Analyst [email protected] +91-22-6273 8145
Key Data
Current Shares O/S (mn) 293.0
Mkt Cap (Rsbn/US$bn) 193.5/2.6
52 Wk H / L (Rs) 700/337
Daily Vol. (3M NSE Avg.) 323,068
Price Performance (%)
1-M 6-M 1-Y
CRIN 18.2 39.5 57
Nifty Index 0.4 (23.0) (21.9)
Source: Bloomberg
Exhibit 1: 4QFY20 Result
28 May 2020
Y/E March (Rsmn) 4QFY19 4QFY20 Ch YoY % 3QFY20 Ch QoQ % 4QFY20E Var. (%)
Net sales 26,383 28,693 9 32,787 -12 29,489 -3
Cost of goods 18,527 18,658 1 22,466 -17 20,118 -7
Employee benefits expenses 1,054 1,169 11 1,207 -3 1,048 11
Other expenses 4,212 4,959 18 4,794 3 4,939 0
EBITDA 2,590 3,907 51 4,320 -10 3,384 15
EBITDAM (%) 9.82 13.62 380 13.18 44 11.48 214
Depreciation and amortization 351 451 28 408 10 705 -36
Other income 86 115 33 91 27 96 20
Interest expenses 653 434 -33 459 -5 479 -9
Exceptional income/ (exp) (37) - - -
- -
Profit before tax 1,635 3,137 92 3,544 -11 2,296 37
Tax expenses 533 800 50 899 -11 586 37
Share of JV and assoc. +/- 2 4 - 1
3 -
Adj.Consol. PAT 1,141 2,342 105 2,645 -11 1,713 37
NPM (%) 4.32 8.16 384 8.07 9 5.81 235
EPS 3.90 8.01 105 9.05 -91 5.86 37
Source: Company, Nirmal Bang Institutional Equities Research
In s t itu tio n a l E q u it ie s
2 Coromandel International
Exhibit 2: 4QFY20 results vs NBIE and Bloomberg estimates
Rs Bn NBIE 4QFY20E 4Q FY20A Var % Bloomberg Consensus
estimates Var %
Net Revenue 29.49 28.69 (2.70) 27.79 3.24
EBITDA 3.38 3.91 15.45 3.17 23.16
PAT 1.71 2.34 36.68 1.67 40.36
Source: Bloomberg, Company, Nirmal Bang Institutional Equities Research
Investment Rationale
We have raised our TP by 26% to Rs714 based on 16.6x PE on our revised FY22E EPS. Our target multiple is at 6% premium to CRIN’s 5-year average PE. We believe this is justified based on the company’s cost leadership, brand equity with farmers and best in class management. Our TP revision follows 31.3%/26.1% upgrade in FY21-22E earnings, based on the strong FY20 performance and healthy long term prospects under normal monsoon assumptions, supported by the government’s thrust to increase farm incomes and the company’s long term growth initiatives on CPC and specialties to increase the share of non-subsidy business revenue currently at around 20%.
Exhibit 3: Earnings revision
Revised estimate Earlier estimate % Revision
Rs Mn FY20 FY21E FY22E FY20 FY21E FY22E FY20 FY21E FY22E
Nutrient Revenue 1,14,665 1,13,031 1,14,950 1,16,002 99,594 1,16,812 -1.2 13.5 -1.6
CPC Revenue 16,702 19,874 22,279 16,161 19,312 21,622 3.3 2.9 3.0
Total Revenue 1,31,367 1,32,905 1,37,229 1,32,163 1,18,906 1,38,434 -0.6 11.8 -0.9
EBITDA 17,310 17,906 20,143 16,787 14,721 17,115 3.1 21.6 17.7
EBITDA margin (%) 13.18 13.47 14.68 12.70 12.38 12.36 - - -
Nutrient EBIT 13,764 12,771 14,410 13,130 9,548 12,031 4.8 33.7 19.8
CPC EBIT 1,966 3,078 3,604 1,823 3,212 3,073 7.8 -4.2 17.3
Total EBIT 15,730 15,849 18,014 14,954 12,760 15,104 5.2 24.2 19.3
EBIT margin 11.97 11.92 13.13 11.31 10.73 10.91 - - -
PAT 10,650 10,862 12,679 10,020 8,271 10,052 6.3 31.3 26.1
EPS 36.30 36.95 43.03 34.15 28.13 34.12 6.3 31.3 26.1
TP
714
567
26.1
Source: Nirmal Bang Institutional Equities Research
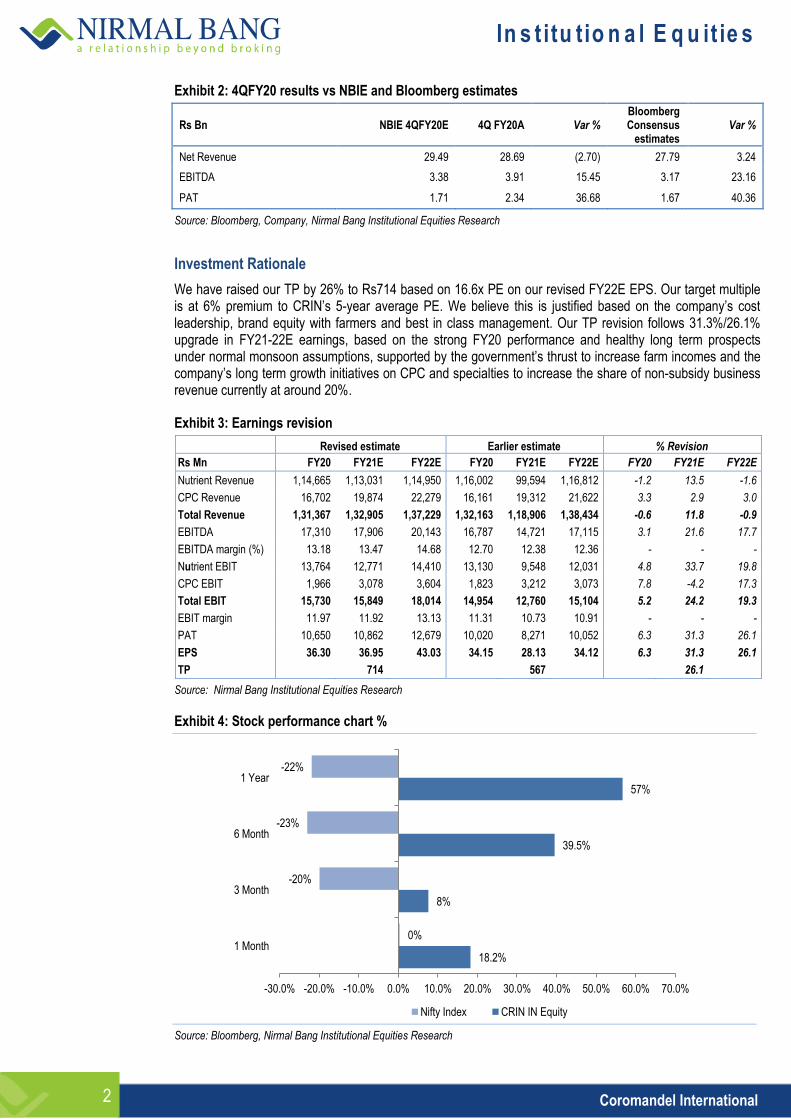
Exhibit 4: Stock performance chart %
Source: Bloomberg, Nirmal Bang Institutional Equities Research
18.2%
8%
39.5%
57%
0%
-20%
-23%
-22%
-30.0% -20.0% -10.0% 0.0% 10.0% 20.0% 30.0% 40.0% 50.0% 60.0% 70.0%
1 Month
3 Month
6 Month
1 Year
Nifty Index CRIN IN Equity
In s t itu tio n a l E q u it ie s
3 Coromandel International
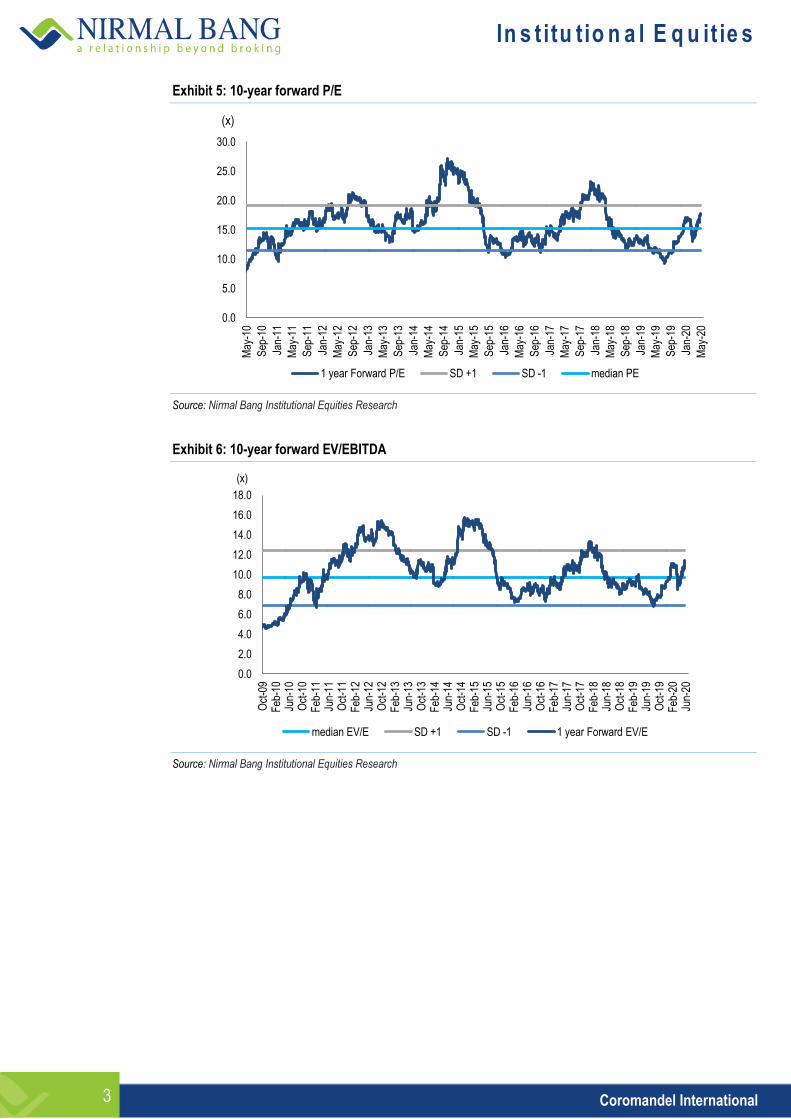
Exhibit 5: 10-year forward P/E
Source: Nirmal Bang Institutional Equities Research
Exhibit 6: 10-year forward EV/EBITDA
Source: Nirmal Bang Institutional Equities Research
0.0
5.0
10.0
15.0
20.0
25.0
30.0
May
-10
Sep
-10
Jan-
11
May
-11
Sep
-11
Jan-
12
May
-12
Sep
-12
Jan-
13
May
-13
Sep
-13
Jan-
14
May
-14
Sep
-14
Jan-
15
May
-15
Sep
-15
Jan-
16
May
-16
Sep
-16
Jan-
17
May
-17
Sep
-17
Jan-
18
May
-18
Sep
-18
Jan-
19
May
-19
Sep
-19
Jan-
20
May
-20
1 year Forward P/E SD +1 SD -1 median PE
(x)
0.0
2.0
4.0
6.0
8.0
10.0
12.0
14.0
16.0
18.0
Oct
-09
Feb
-10
Jun-
10
Oct
-10
Feb
-11
Jun-
11
Oct
-11
Feb
-12
Jun-
12
Oct
-12
Feb
-13
Jun-
13
Oct
-13
Feb
-14
Jun-
14
Oct
-14
Feb
-15
Jun-
15
Oct
-15
Feb
-16
Jun-
16
Oct
-16
Feb
-17
Jun-
17
Oct
-17
Feb
-18
Jun-
18
Oct
-18
Feb
-19
Jun-
19
Oct
-19
Feb
-20
Jun-
20
median EV/E SD +1 SD -1 1 year Forward EV/E
(x)
In s t itu tio n a l E q u it ie s
4 Coromandel International
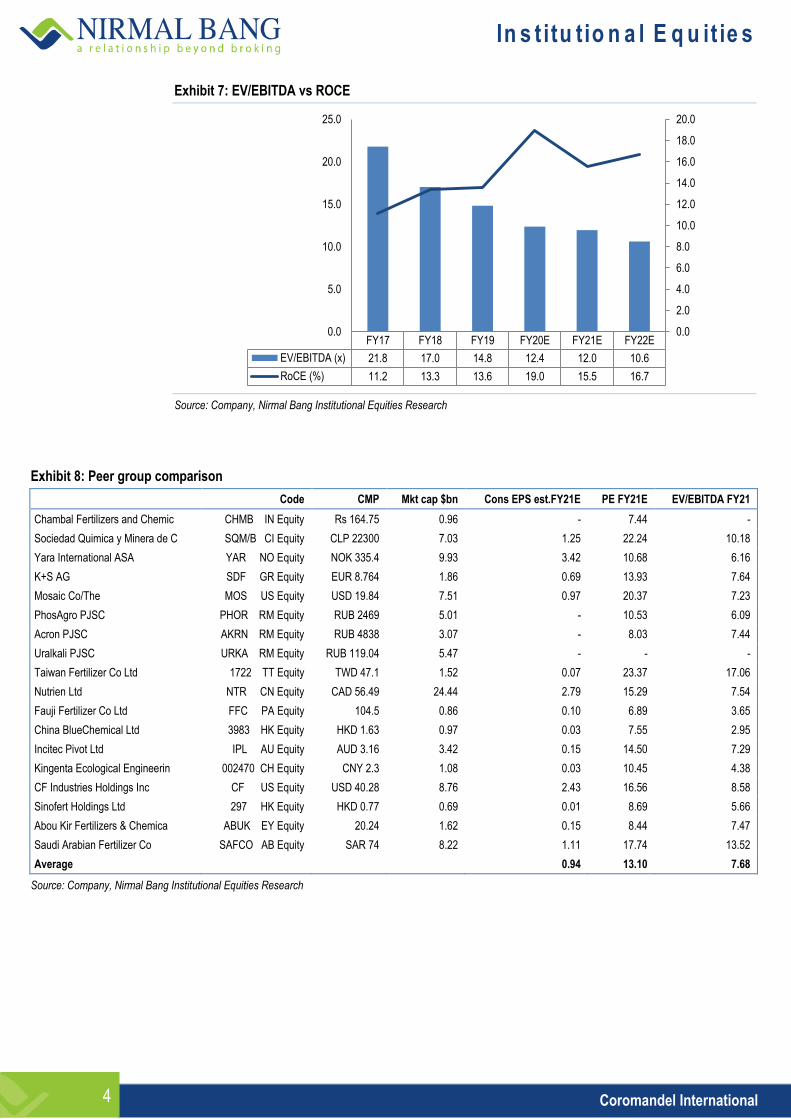
Exhibit 7: EV/EBITDA vs ROCE
Source: Company, Nirmal Bang Institutional Equities Research
Exhibit 8: Peer group comparison
Code CMP Mkt cap $bn Cons EPS est.FY21E PE FY21E EV/EBITDA FY21
Chambal Fertilizers and Chemic CHMB IN Equity Rs 164.75 0.96 - 7.44 -
Sociedad Quimica y Minera de C SQM/B CI Equity CLP 22300 7.03 1.25 22.24 10.18
Yara International ASA YAR NO Equity NOK 335.4 9.93 3.42 10.68 6.16
K+S AG SDF GR Equity EUR 8.764 1.86 0.69 13.93 7.64
Mosaic Co/The MOS US Equity USD 19.84 7.51 0.97 20.37 7.23
PhosAgro PJSC PHOR RM Equity RUB 2469 5.01 - 10.53 6.09
Acron PJSC AKRN RM Equity RUB 4838 3.07 - 8.03 7.44
Uralkali PJSC URKA RM Equity RUB 119.04 5.47 - - -
Taiwan Fertilizer Co Ltd 1722 TT Equity TWD 47.1 1.52 0.07 23.37 17.06
Nutrien Ltd NTR CN Equity CAD 56.49 24.44 2.79 15.29 7.54
Fauji Fertilizer Co Ltd FFC PA Equity 104.5 0.86 0.10 6.89 3.65
China BlueChemical Ltd 3983 HK Equity HKD 1.63 0.97 0.03 7.55 2.95
Incitec Pivot Ltd IPL AU Equity AUD 3.16 3.42 0.15 14.50 7.29
Kingenta Ecological Engineerin 002470 CH Equity CNY 2.3 1.08 0.03 10.45 4.38
CF Industries Holdings Inc CF US Equity USD 40.28 8.76 2.43 16.56 8.58
Sinofert Holdings Ltd 297 HK Equity HKD 0.77 0.69 0.01 8.69 5.66
Abou Kir Fertilizers & Chemica ABUK EY Equity 20.24 1.62 0.15 8.44 7.47
Saudi Arabian Fertilizer Co SAFCO AB Equity SAR 74 8.22 1.11 17.74 13.52
Average
0.94 13.10 7.68
Source: Company, Nirmal Bang Institutional Equities Research
FY17 FY18 FY19 FY20E FY21E FY22E
EV/EBITDA (x) 21.8 17.0 14.8 12.4 12.0 10.6
RoCE (%) 11.2 13.3 13.6 19.0 15.5 16.7
0.0
2.0
4.0
6.0
8.0
10.0
12.0
14.0
16.0
18.0
20.0
0.0
5.0
10.0
15.0
20.0
25.0
In s t itu tio n a l E q u it ie s
5 Coromandel International
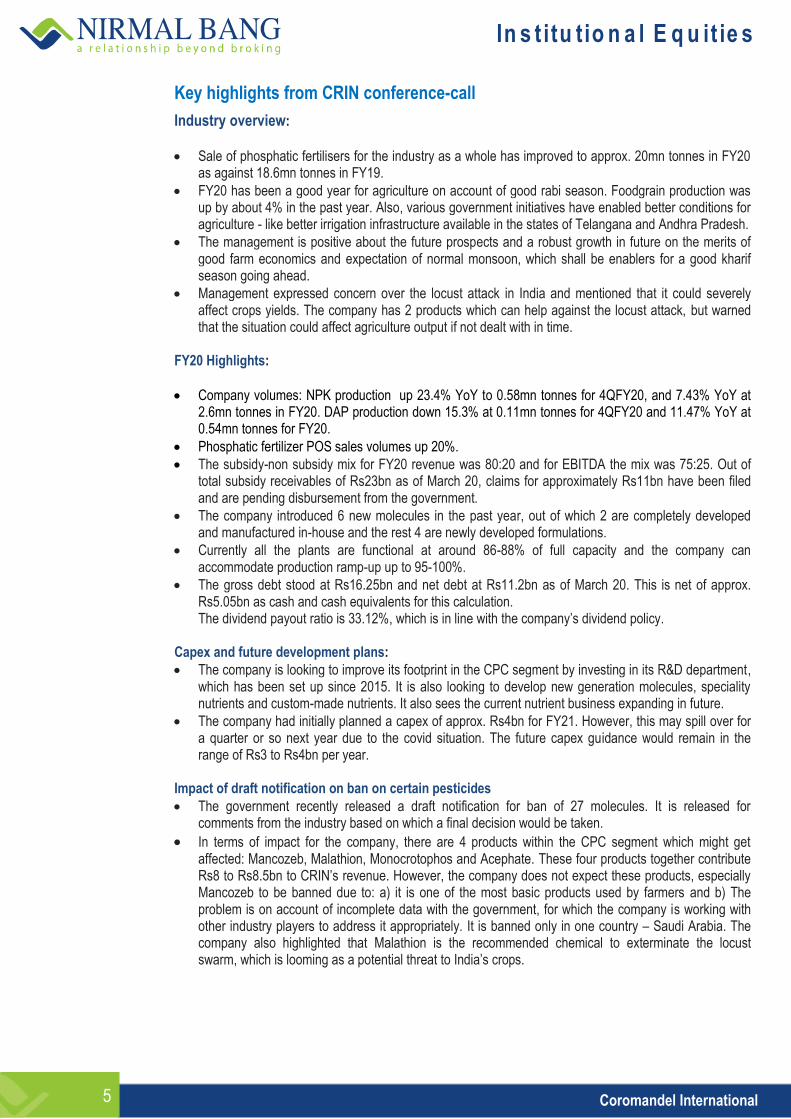
Key highlights from CRIN conference-call
Industry overview:
Sale of phosphatic fertilisers for the industry as a whole has improved to approx. 20mn tonnes in FY20 as against 18.6mn tonnes in FY19.
FY20 has been a good year for agriculture on account of good rabi season. Foodgrain production was up by about 4% in the past year. Also, various government initiatives have enabled better conditions for agriculture - like better irrigation infrastructure available in the states of Telangana and Andhra Pradesh.
The management is positive about the future prospects and a robust growth in future on the merits of good farm economics and expectation of normal monsoon, which shall be enablers for a good kharif season going ahead.
Management expressed concern over the locust attack in India and mentioned that it could severely affect crops yields. The company has 2 products which can help against the locust attack, but warned that the situation could affect agriculture output if not dealt with in time.
FY20 Highlights:
Company volumes: NPK production up 23.4% YoY to 0.58mn tonnes for 4QFY20, and 7.43% YoY at 2.6mn tonnes in FY20. DAP production down 15.3% at 0.11mn tonnes for 4QFY20 and 11.47% YoY at 0.54mn tonnes for FY20.
Phosphatic fertilizer POS sales volumes up 20%.
The subsidy-non subsidy mix for FY20 revenue was 80:20 and for EBITDA the mix was 75:25. Out of total subsidy receivables of Rs23bn as of March 20, claims for approximately Rs11bn have been filed and are pending disbursement from the government.
The company introduced 6 new molecules in the past year, out of which 2 are completely developed and manufactured in-house and the rest 4 are newly developed formulations.
Currently all the plants are functional at around 86-88% of full capacity and the company can accommodate production ramp-up up to 95-100%.
The gross debt stood at Rs16.25bn and net debt at Rs11.2bn as of March 20. This is net of approx. Rs5.05bn as cash and cash equivalents for this calculation. The dividend payout ratio is 33.12%, which is in line with the company’s dividend policy.
Capex and future development plans:
The company is looking to improve its footprint in the CPC segment by investing in its R&D department, which has been set up since 2015. It is also looking to develop new generation molecules, speciality nutrients and custom-made nutrients. It also sees the current nutrient business expanding in future.
The company had initially planned a capex of approx. Rs4bn for FY21. However, this may spill over for a quarter or so next year due to the covid situation. The future capex guidance would remain in the range of Rs3 to Rs4bn per year.
Impact of draft notification on ban on certain pesticides
The government recently released a draft notification for ban of 27 molecules. It is released for comments from the industry based on which a final decision would be taken.
In terms of impact for the company, there are 4 products within the CPC segment which might get affected: Mancozeb, Malathion, Monocrotophos and Acephate. These four products together contribute Rs8 to Rs8.5bn to CRIN’s revenue. However, the company does not expect these products, especially Mancozeb to be banned due to: a) it is one of the most basic products used by farmers and b) The problem is on account of incomplete data with the government, for which the company is working with other industry players to address it appropriately. It is banned only in one country – Saudi Arabia. The company also highlighted that Malathion is the recommended chemical to exterminate the locust swarm, which is looming as a potential threat to India’s crops.
In s t itu tio n a l E q u it ie s
6 Coromandel International
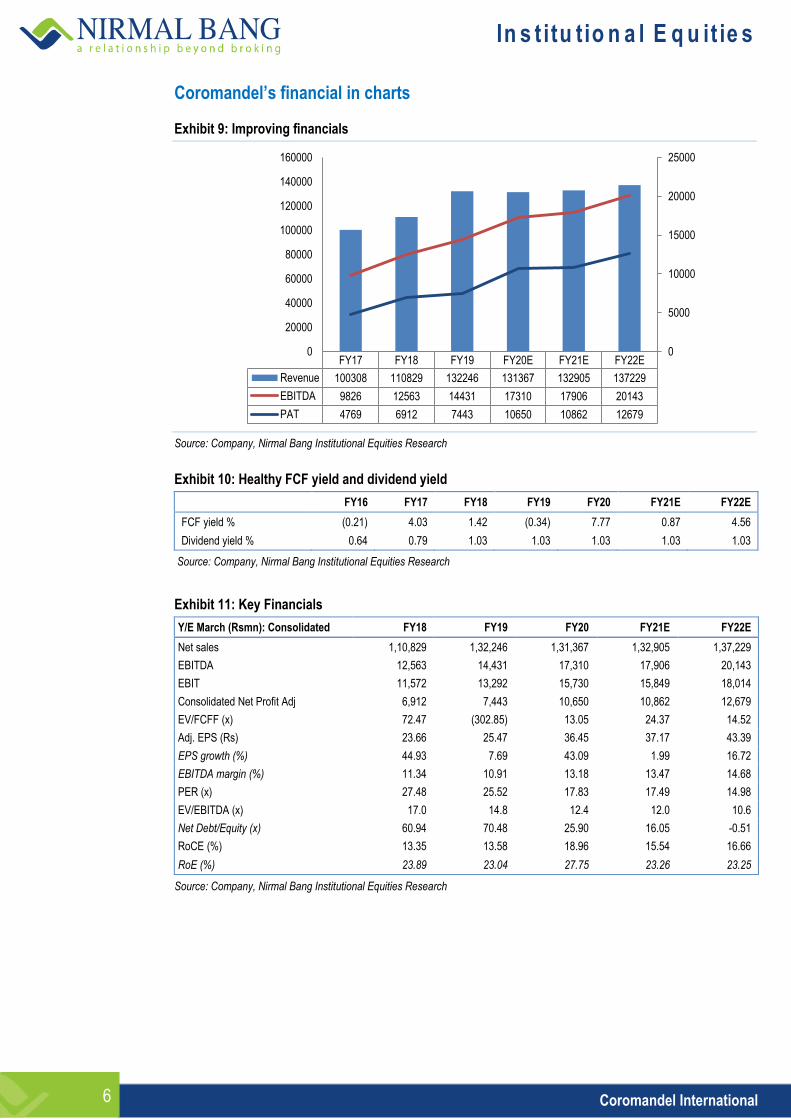
Coromandel’s financial in charts Exhibit 9: Improving financials
Source: Company, Nirmal Bang Institutional Equities Research
Exhibit 10: Healthy FCF yield and dividend yield
FY16 FY17 FY18 FY19 FY20 FY21E FY22E
FCF yield % (0.21) 4.03 1.42 (0.34) 7.77 0.87 4.56
Dividend yield % 0.64 0.79 1.03 1.03 1.03 1.03 1.03
Source: Company, Nirmal Bang Institutional Equities Research
Exhibit 11: Key Financials
Y/E March (Rsmn): Consolidated FY18 FY19 FY20 FY21E FY22E
Net sales 1,10,829 1,32,246 1,31,367 1,32,905 1,37,229
EBITDA 12,563 14,431 17,310 17,906 20,143
EBIT 11,572 13,292 15,730 15,849 18,014
Consolidated Net Profit Adj 6,912 7,443 10,650 10,862 12,679
EV/FCFF (x) 72.47 (302.85) 13.05 24.37 14.52
Adj. EPS (Rs) 23.66 25.47 36.45 37.17 43.39
EPS growth (%) 44.93 7.69 43.09 1.99 16.72
EBITDA margin (%) 11.34 10.91 13.18 13.47 14.68
PER (x) 27.48 25.52 17.83 17.49 14.98
EV/EBITDA (x) 17.0 14.8 12.4 12.0 10.6
Net Debt/Equity (x) 60.94 70.48 25.90 16.05 -0.51
RoCE (%) 13.35 13.58 18.96 15.54 16.66
RoE (%) 23.89 23.04 27.75 23.26 23.25
Source: Company, Nirmal Bang Institutional Equities Research
FY17 FY18 FY19 FY20E FY21E FY22E
Revenue 100308 110829 132246 131367 132905 137229
EBITDA 9826 12563 14431 17310 17906 20143
PAT 4769 6912 7443 10650 10862 12679
0
5000
10000
15000
20000
25000
0
20000
40000
60000
80000
100000
120000
140000
160000
In s t itu tio n a l E q u it ie s
7 Coromandel International
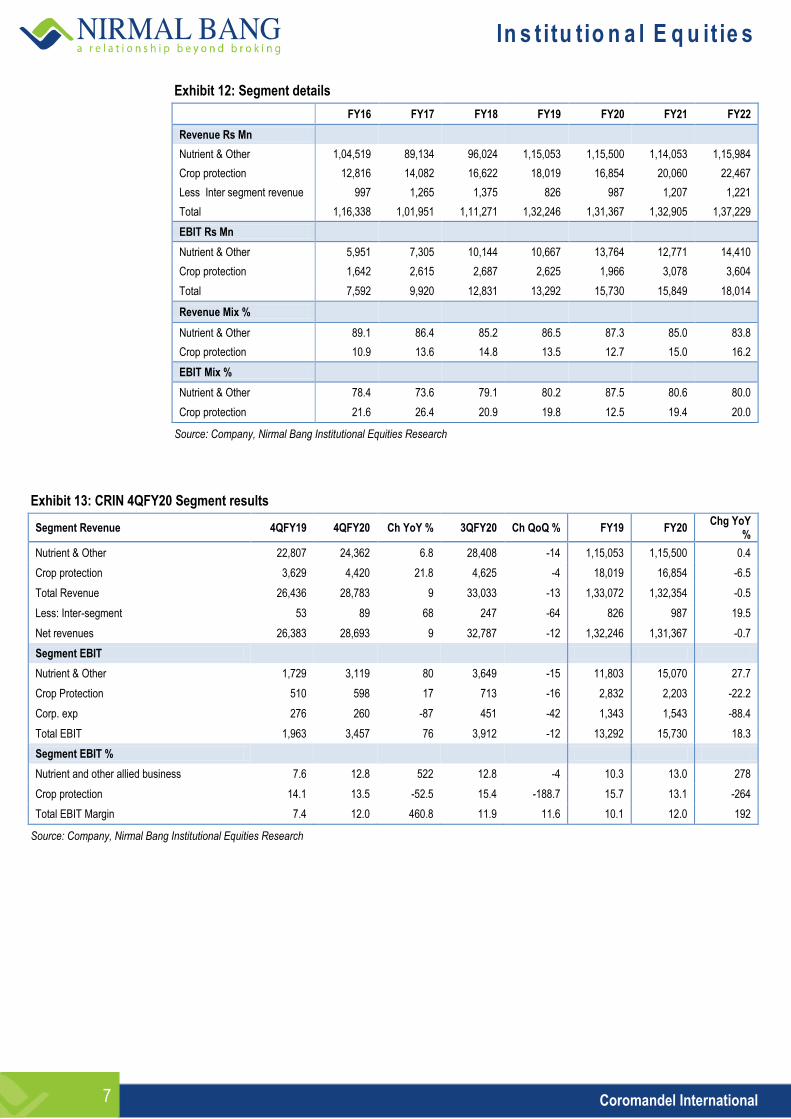
Exhibit 12: Segment details
FY16 FY17 FY18 FY19 FY20 FY21 FY22
Revenue Rs Mn
Nutrient & Other 1,04,519 89,134 96,024 1,15,053 1,15,500 1,14,053 1,15,984
Crop protection 12,816 14,082 16,622 18,019 16,854 20,060 22,467
Less Inter segment revenue 997 1,265 1,375 826 987 1,207 1,221
Total 1,16,338 1,01,951 1,11,271 1,32,246 1,31,367 1,32,905 1,37,229
EBIT Rs Mn
Nutrient & Other 5,951 7,305 10,144 10,667 13,764 12,771 14,410
Crop protection 1,642 2,615 2,687 2,625 1,966 3,078 3,604
Total 7,592 9,920 12,831 13,292 15,730 15,849 18,014
Revenue Mix %
Nutrient & Other 89.1 86.4 85.2 86.5 87.3 85.0 83.8
Crop protection 10.9 13.6 14.8 13.5 12.7 15.0 16.2
EBIT Mix %
Nutrient & Other 78.4 73.6 79.1 80.2 87.5 80.6 80.0
Crop protection 21.6 26.4 20.9 19.8 12.5 19.4 20.0
Source: Company, Nirmal Bang Institutional Equities Research
Exhibit 13: CRIN 4QFY20 Segment results
Segment Revenue 4QFY19 4QFY20 Ch YoY % 3QFY20 Ch QoQ % FY19 FY20 Chg YoY
%
Nutrient & Other 22,807 24,362 6.8 28,408 -14 1,15,053 1,15,500 0.4
Crop protection 3,629 4,420 21.8 4,625 -4 18,019 16,854 -6.5
Total Revenue 26,436 28,783 9 33,033 -13 1,33,072 1,32,354 -0.5
Less: Inter-segment 53 89 68 247 -64 826 987 19.5
Net revenues 26,383 28,693 9 32,787 -12 1,32,246 1,31,367 -0.7
Segment EBIT
Nutrient & Other 1,729 3,119 80 3,649 -15 11,803 15,070 27.7
Crop Protection 510 598 17 713 -16 2,832 2,203 -22.2
Corp. exp 276 260 -87 451 -42 1,343 1,543 -88.4
Total EBIT 1,963 3,457 76 3,912 -12 13,292 15,730 18.3
Segment EBIT %
Nutrient and other allied business 7.6 12.8 522 12.8 -4 10.3 13.0 278
Crop protection 14.1 13.5 -52.5 15.4 -188.7 15.7 13.1 -264
Total EBIT Margin 7.4 12.0 460.8 11.9 11.6 10.1 12.0 192
Source: Company, Nirmal Bang Institutional Equities Research
In s t itu tio n a l E q u it ie s
8 Coromandel International
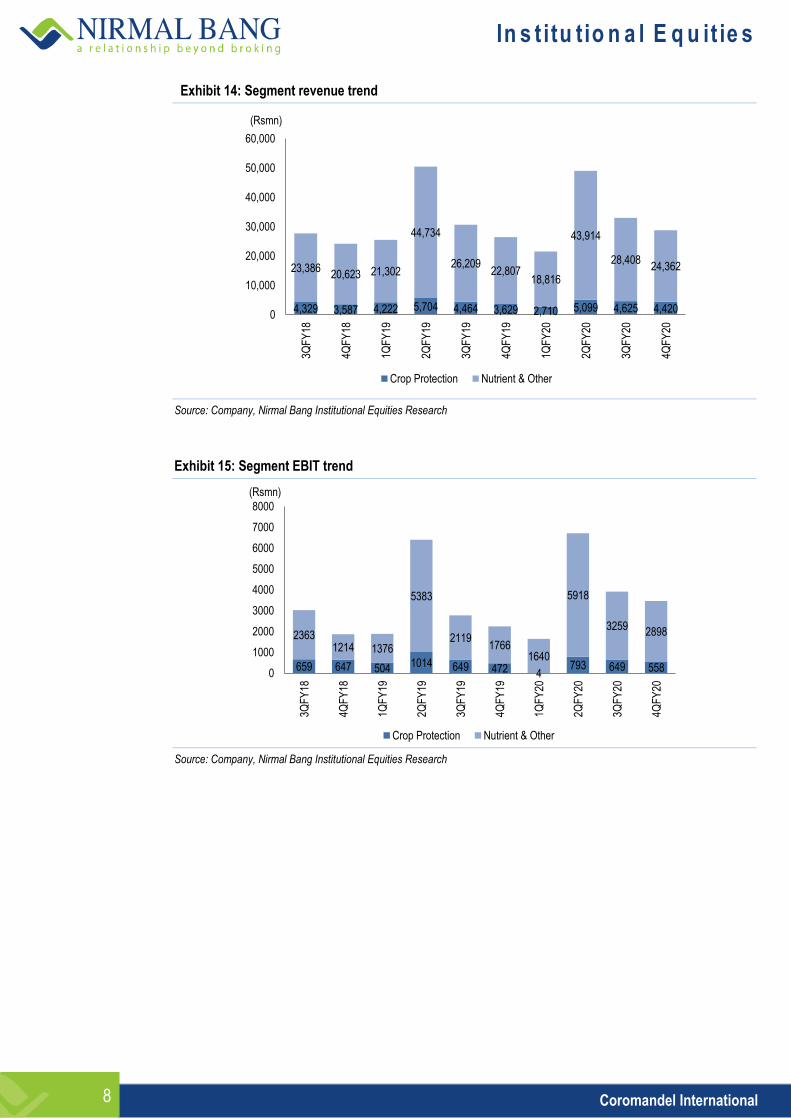
Exhibit 14: Segment revenue trend
Source: Company, Nirmal Bang Institutional Equities Research
Exhibit 15: Segment EBIT trend
Source: Company, Nirmal Bang Institutional Equities Research
4,329 3,587 4,222 5,704 4,464 3,629 2,710 5,099 4,625 4,420
23,386 20,623 21,302
44,734
26,209 22,807
18,816
43,914
28,408 24,362
0
10,000
20,000
30,000
40,000
50,000
60,000
3QF
Y18
4QF
Y18
1QF
Y19
2QF
Y19
3QF
Y19
4QF
Y19
1QF
Y20
2QF
Y20
3QF
Y20
4QF
Y20
Crop Protection Nutrient & Other
(Rsmn)
659 647 504 1014 649 472 4 793 649 558
2363 1214 1376
5383
2119 1766
1640
5918
3259 2898
0
1000
2000
3000
4000
5000
6000
7000
8000
3QF
Y18
4QF
Y18
1QF
Y19
2QF
Y19
3QF
Y19
4QF
Y19
1QF
Y20
2QF
Y20
3QF
Y20
4QF
Y20
Crop Protection Nutrient & Other
(Rsmn)
In s t itu tio n a l E q u it ie s
9 Coromandel International
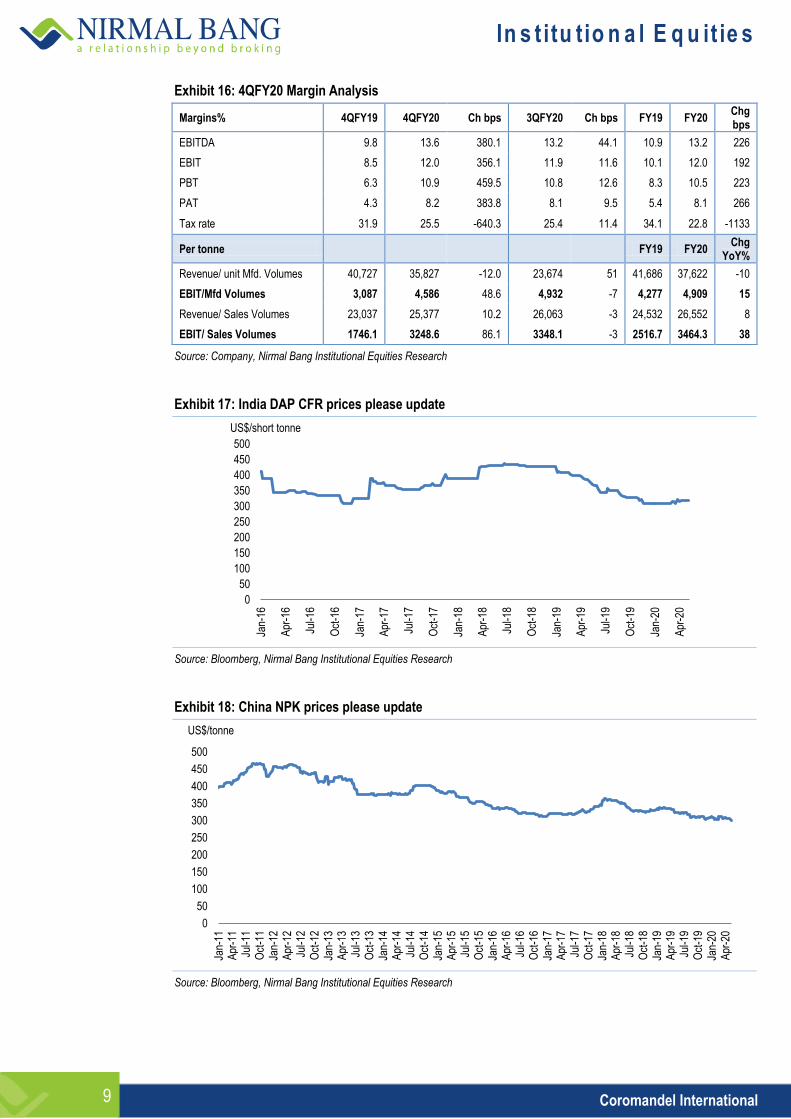
Exhibit 16: 4QFY20 Margin Analysis
Margins% 4QFY19 4QFY20 Ch bps 3QFY20 Ch bps FY19 FY20 Chg bps
EBITDA 9.8 13.6 380.1 13.2 44.1 10.9 13.2 226
EBIT 8.5 12.0 356.1 11.9 11.6 10.1 12.0 192
PBT 6.3 10.9 459.5 10.8 12.6 8.3 10.5 223
PAT 4.3 8.2 383.8 8.1 9.5 5.4 8.1 266
Tax rate 31.9 25.5 -640.3 25.4 11.4 34.1 22.8 -1133
Per tonne
FY19 FY20 Chg
YoY%
Revenue/ unit Mfd. Volumes 40,727 35,827 -12.0 23,674 51 41,686 37,622 -10
EBIT/Mfd Volumes 3,087 4,586 48.6 4,932 -7 4,277 4,909 15
Revenue/ Sales Volumes 23,037 25,377 10.2 26,063 -3 24,532 26,552 8
EBIT/ Sales Volumes 1746.1 3248.6 86.1 3348.1 -3 2516.7 3464.3 38
Source: Company, Nirmal Bang Institutional Equities Research
Exhibit 17: India DAP CFR prices please update
Source: Bloomberg, Nirmal Bang Institutional Equities Research
Exhibit 18: China NPK prices please update
Source: Bloomberg, Nirmal Bang Institutional Equities Research
0
50
100
150
200
250
300
350
400
450
500
Jan-
16
Apr
-16
Jul-1
6
Oct
-16
Jan-
17
Apr
-17
Jul-1
7
Oct
-17
Jan-
18
Apr
-18
Jul-1
8
Oct
-18
Jan-
19
Apr
-19
Jul-1
9
Oct
-19
Jan-
20
Apr
-20
US$/short tonne
0
50
100
150
200
250
300
350
400
450
500
Jan-
11
Apr
-11
Jul-1
1 O
ct-1
1 Ja
n-12
A
pr-1
2 Ju
l-12
Oct
-12
Jan-
13
Apr
-13
Jul-1
3 O
ct-1
3 Ja
n-14
A
pr-1
4 Ju
l-14
Oct
-14
Jan-
15
Apr
-15
Jul-1
5 O
ct-1
5 Ja
n-16
A
pr-1
6 Ju
l-16
Oct
-16
Jan-
17
Apr
-17
Jul-1
7 O
ct-1
7 Ja
n-18
A
pr-1
8 Ju
l-18
Oct
-18
Jan-
19
Apr
-19
Jul-1
9 O
ct-1
9 Ja
n-20
A
pr-2
0 US$/tonne
In s t itu tio n a l E q u it ie s
10 Coromandel International
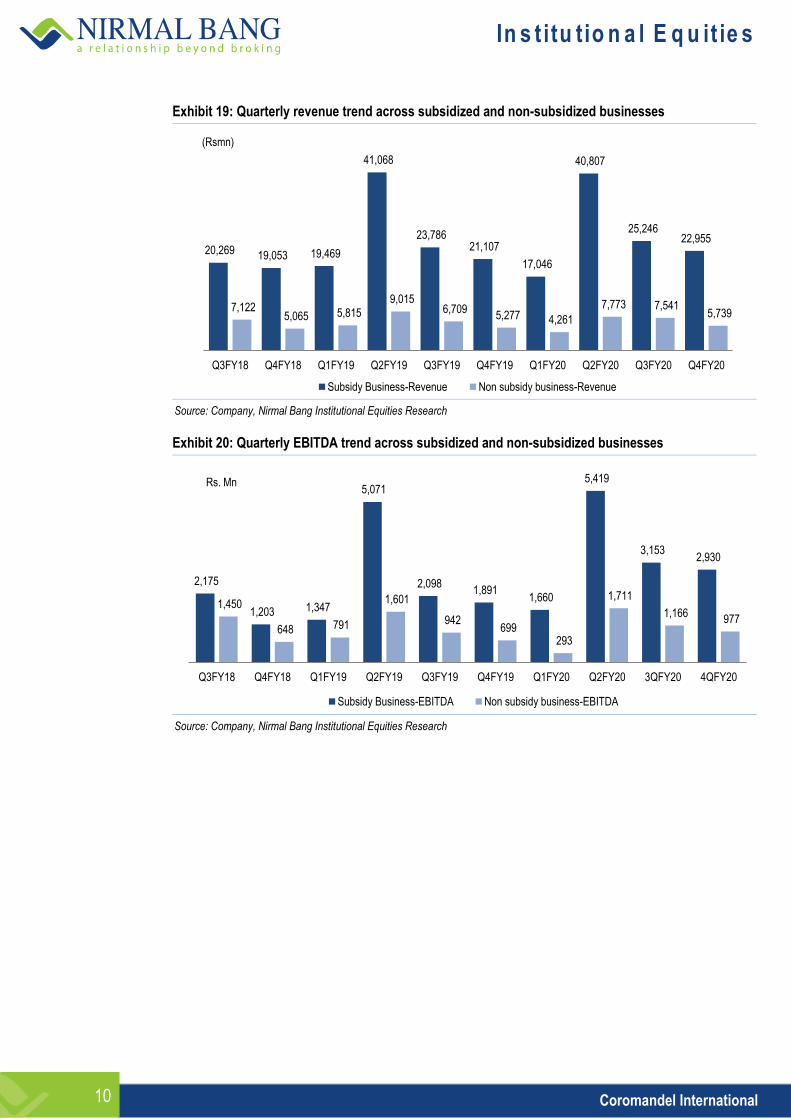
Exhibit 19: Quarterly revenue trend across subsidized and non-subsidized businesses
Source: Company, Nirmal Bang Institutional Equities Research
Exhibit 20: Quarterly EBITDA trend across subsidized and non-subsidized businesses
Source: Company, Nirmal Bang Institutional Equities Research
20,269 19,053 19,469
41,068
23,786 21,107
17,046
40,807
25,246 22,955
7,122 5,065 5,815
9,015 6,709
5,277 4,261
7,773 7,541 5,739
Q3FY18 Q4FY18 Q1FY19 Q2FY19 Q3FY19 Q4FY19 Q1FY20 Q2FY20 Q3FY20 Q4FY20
Subsidy Business-Revenue Non subsidy business-Revenue
(Rsmn)
2,175
1,203 1,347
5,071
2,098 1,891
1,660
5,419
3,153 2,930
1,450
648 791
1,601
942 699
293
1,711
1,166 977
Q3FY18 Q4FY18 Q1FY19 Q2FY19 Q3FY19 Q4FY19 Q1FY20 Q2FY20 3QFY20 4QFY20
Subsidy Business-EBITDA Non subsidy business-EBITDA
Rs. Mn
In s t itu tio n a l E q u it ie s
11 Coromandel International
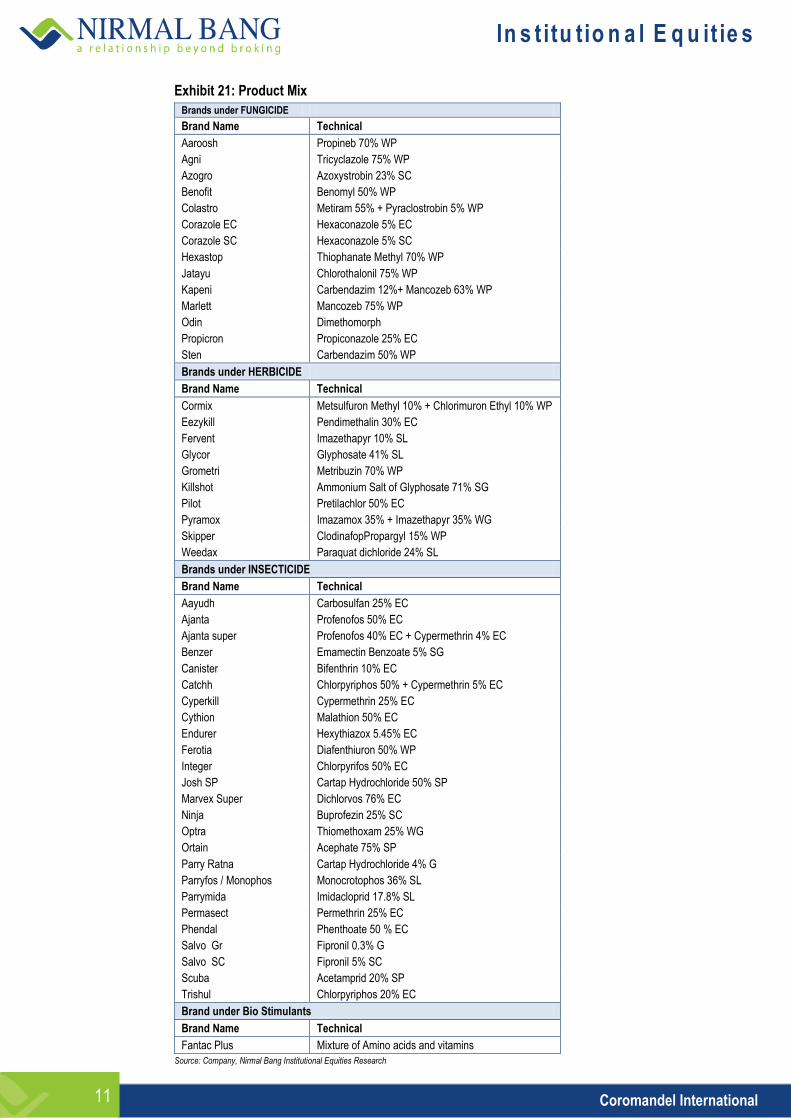
Exhibit 21: Product Mix
Brands under FUNGICIDE
Brand Name Technical
Aaroosh Propineb 70% WP
Agni Tricyclazole 75% WP
Azogro Azoxystrobin 23% SC
Benofit Benomyl 50% WP
Colastro Metiram 55% + Pyraclostrobin 5% WP
Corazole EC Hexaconazole 5% EC
Corazole SC Hexaconazole 5% SC
Hexastop Thiophanate Methyl 70% WP
Jatayu Chlorothalonil 75% WP
Kapeni Carbendazim 12%+ Mancozeb 63% WP
Marlett Mancozeb 75% WP
Odin Dimethomorph
Propicron Propiconazole 25% EC
Sten Carbendazim 50% WP
Brands under HERBICIDE
Brand Name Technical
Cormix Metsulfuron Methyl 10% + Chlorimuron Ethyl 10% WP
Eezykill Pendimethalin 30% EC
Fervent Imazethapyr 10% SL
Glycor Glyphosate 41% SL
Grometri Metribuzin 70% WP
Killshot Ammonium Salt of Glyphosate 71% SG
Pilot Pretilachlor 50% EC
Pyramox Imazamox 35% + Imazethapyr 35% WG
Skipper ClodinafopPropargyl 15% WP
Weedax Paraquat dichloride 24% SL
Brands under INSECTICIDE
Brand Name Technical
Aayudh Carbosulfan 25% EC
Ajanta Profenofos 50% EC
Ajanta super Profenofos 40% EC + Cypermethrin 4% EC
Benzer Emamectin Benzoate 5% SG
Canister Bifenthrin 10% EC
Catchh Chlorpyriphos 50% + Cypermethrin 5% EC
Cyperkill Cypermethrin 25% EC
Cythion Malathion 50% EC
Endurer Hexythiazox 5.45% EC
Ferotia Diafenthiuron 50% WP
Integer Chlorpyrifos 50% EC
Josh SP Cartap Hydrochloride 50% SP
Marvex Super Dichlorvos 76% EC
Ninja Buprofezin 25% SC
Optra Thiomethoxam 25% WG
Ortain Acephate 75% SP
Parry Ratna Cartap Hydrochloride 4% G
Parryfos / Monophos Monocrotophos 36% SL
Parrymida Imidacloprid 17.8% SL
Permasect Permethrin 25% EC
Phendal Phenthoate 50 % EC
Salvo Gr Fipronil 0.3% G
Salvo SC Fipronil 5% SC
Scuba Acetamprid 20% SP
Trishul Chlorpyriphos 20% EC
Brand under Bio Stimulants
Brand Name Technical
Fantac Plus Mixture of Amino acids and vitamins
Source: Company, Nirmal Bang Institutional Equities Research
In s t itu tio n a l E q u it ie s
12 Coromandel International
Consolidated Financials
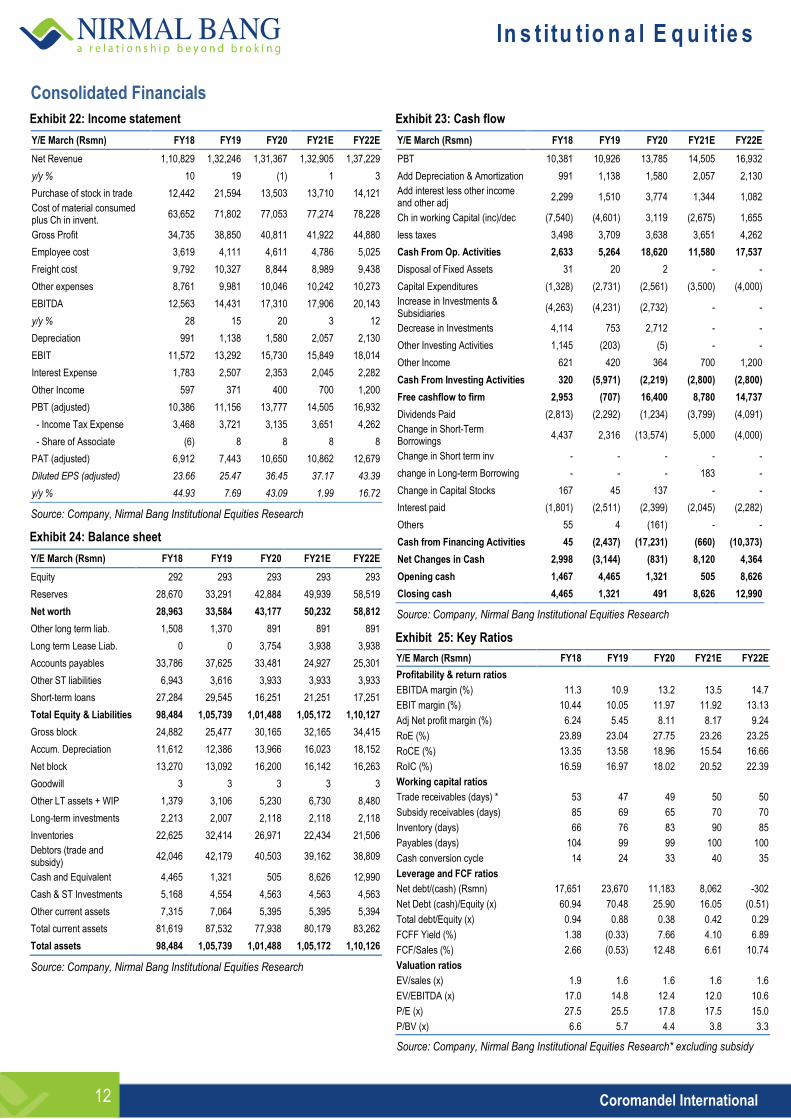
Exhibit 22: Income statement
Y/E March (Rsmn) FY18 FY19 FY20 FY21E FY22E
Net Revenue 1,10,829 1,32,246 1,31,367 1,32,905 1,37,229
y/y % 10 19 (1) 1 3
Purchase of stock in trade 12,442 21,594 13,503 13,710 14,121
Cost of material consumed plus Ch in invent.
63,652 71,802 77,053 77,274 78,228
Gross Profit 34,735 38,850 40,811 41,922 44,880
Employee cost 3,619 4,111 4,611 4,786 5,025
Freight cost 9,792 10,327 8,844 8,989 9,438
Other expenses 8,761 9,981 10,046 10,242 10,273
EBITDA 12,563 14,431 17,310 17,906 20,143
y/y % 28 15 20 3 12
Depreciation 991 1,138 1,580 2,057 2,130
EBIT 11,572 13,292 15,730 15,849 18,014
Interest Expense 1,783 2,507 2,353 2,045 2,282
Other Income 597 371 400 700 1,200
PBT (adjusted) 10,386 11,156 13,777 14,505 16,932
- Income Tax Expense 3,468 3,721 3,135 3,651 4,262
- Share of Associate (6) 8 8 8 8
PAT (adjusted) 6,912 7,443 10,650 10,862 12,679
Diluted EPS (adjusted) 23.66 25.47 36.45 37.17 43.39
y/y % 44.93 7.69 43.09 1.99 16.72
Source: Company, Nirmal Bang Institutional Equities Research
Exhibit 24: Balance sheet
Y/E March (Rsmn) FY18 FY19 FY20 FY21E FY22E
Equity 292 293 293 293 293
Reserves 28,670 33,291 42,884 49,939 58,519
Net worth 28,963 33,584 43,177 50,232 58,812
Other long term liab. 1,508 1,370 891 891 891
Long term Lease Liab. 0 0 3,754 3,938 3,938
Accounts payables 33,786 37,625 33,481 24,927 25,301
Other ST liabilities 6,943 3,616 3,933 3,933 3,933
Short-term loans 27,284 29,545 16,251 21,251 17,251
Total Equity & Liabilities 98,484 1,05,739 1,01,488 1,05,172 1,10,127
Gross block 24,882 25,477 30,165 32,165 34,415
Accum. Depreciation 11,612 12,386 13,966 16,023 18,152
Net block 13,270 13,092 16,200 16,142 16,263
Goodwill 3 3 3 3 3
Other LT assets + WIP 1,379 3,106 5,230 6,730 8,480
Long-term investments 2,213 2,007 2,118 2,118 2,118
Inventories 22,625 32,414 26,971 22,434 21,506
Debtors (trade and subsidy)
42,046 42,179 40,503 39,162 38,809
Cash and Equivalent 4,465 1,321 505 8,626 12,990
Cash & ST Investments 5,168 4,554 4,563 4,563 4,563
Other current assets 7,315 7,064 5,395 5,395 5,394
Total current assets 81,619 87,532 77,938 80,179 83,262
Total assets 98,484 1,05,739 1,01,488 1,05,172 1,10,126
Source: Company, Nirmal Bang Institutional Equities Research
Exhibit 23: Cash flow
Y/E March (Rsmn) FY18 FY19 FY20 FY21E FY22E
PBT 10,381 10,926 13,785 14,505 16,932
Add Depreciation & Amortization 991 1,138 1,580 2,057 2,130
Add interest less other income and other adj
2,299 1,510 3,774 1,344 1,082
Ch in working Capital (inc)/dec (7,540) (4,601) 3,119 (2,675) 1,655
less taxes 3,498 3,709 3,638 3,651 4,262
Cash From Op. Activities 2,633 5,264 18,620 11,580 17,537
Disposal of Fixed Assets 31 20 2 - -
Capital Expenditures (1,328) (2,731) (2,561) (3,500) (4,000)
Increase in Investments & Subsidiaries
(4,263) (4,231) (2,732) - -
Decrease in Investments 4,114 753 2,712 - -
Other Investing Activities 1,145 (203) (5) - -
Other Income 621 420 364 700 1,200
Cash From Investing Activities 320 (5,971) (2,219) (2,800) (2,800)
Free cashflow to firm 2,953 (707) 16,400 8,780 14,737
Dividends Paid (2,813) (2,292) (1,234) (3,799) (4,091)
Change in Short-Term Borrowings
4,437 2,316 (13,574) 5,000 (4,000)
Change in Short term inv - - - - -
change in Long-term Borrowing - - - 183 -
Change in Capital Stocks 167 45 137 - -
Interest paid (1,801) (2,511) (2,399) (2,045) (2,282)
Others 55 4 (161) - -
Cash from Financing Activities 45 (2,437) (17,231) (660) (10,373)
Net Changes in Cash 2,998 (3,144) (831) 8,120 4,364
Opening cash 1,467 4,465 1,321 505 8,626
Closing cash 4,465 1,321 491 8,626 12,990
Source: Company, Nirmal Bang Institutional Equities Research
Exhibit 25: Key Ratios
Y/E March (Rsmn) FY18 FY19 FY20 FY21E FY22E
Profitability & return ratios
EBITDA margin (%) 11.3 10.9 13.2 13.5 14.7
EBIT margin (%) 10.44 10.05 11.97 11.92 13.13
Adj Net profit margin (%) 6.24 5.45 8.11 8.17 9.24
RoE (%) 23.89 23.04 27.75 23.26 23.25
RoCE (%) 13.35 13.58 18.96 15.54 16.66
RoIC (%) 16.59 16.97 18.02 20.52 22.39
Working capital ratios
Trade receivables (days) * 53 47 49 50 50
Subsidy receivables (days) 85 69 65 70 70
Inventory (days) 66 76 83 90 85
Payables (days) 104 99 99 100 100
Cash conversion cycle 14 24 33 40 35
Leverage and FCF ratios
Net debt/(cash) (Rsmn) 17,651 23,670 11,183 8,062 -302
Net Debt (cash)/Equity (x) 60.94 70.48 25.90 16.05 (0.51)
Total debt/Equity (x) 0.94 0.88 0.38 0.42 0.29
FCFF Yield (%) 1.38 (0.33) 7.66 4.10 6.89
FCF/Sales (%) 2.66 (0.53) 12.48 6.61 10.74
Valuation ratios
EV/sales (x) 1.9 1.6 1.6 1.6 1.6
EV/EBITDA (x) 17.0 14.8 12.4 12.0 10.6
P/E (x) 27.5 25.5 17.8 17.5 15.0
P/BV (x) 6.6 5.7 4.4 3.8 3.3
Source: Company, Nirmal Bang Institutional Equities Research* excluding subsidy
In s t itu tio n a l E q u it ie s
13 Coromandel International
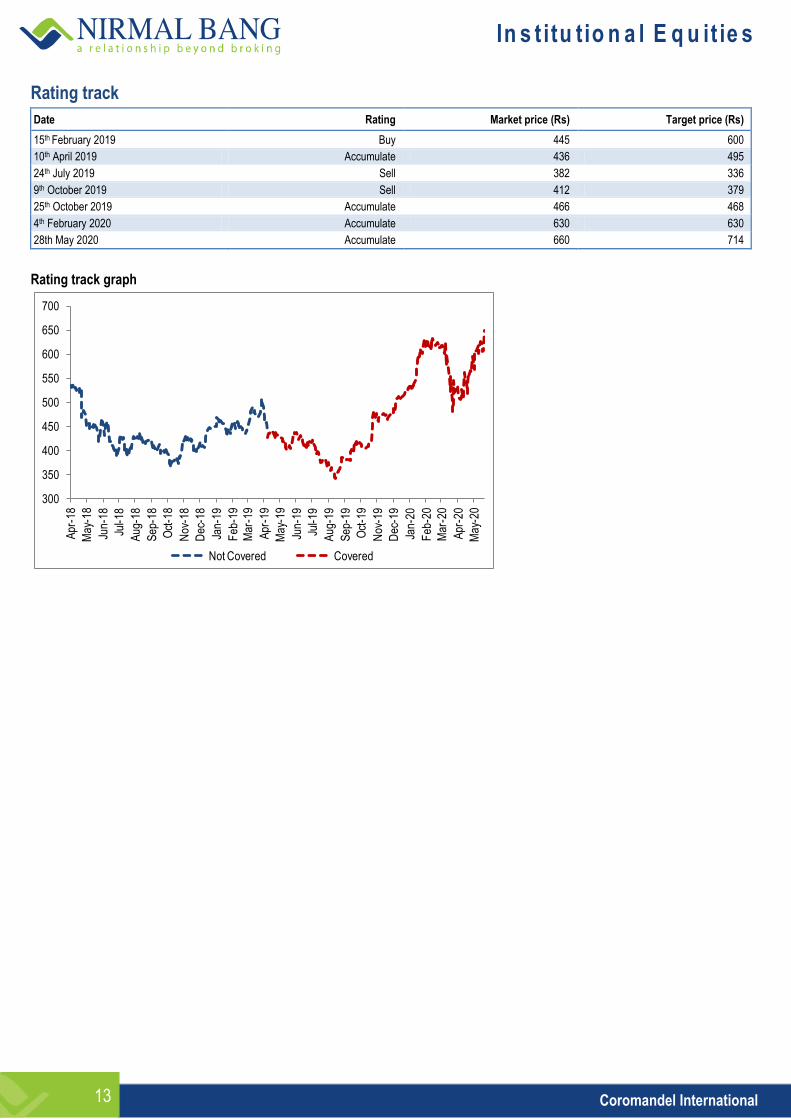
Rating track
Date Rating Market price (Rs) Target price (Rs)
15th February 2019 Buy 445 600
10th April 2019 Accumulate 436 495
24th July 2019 Sell 382 336
9th October 2019 Sell 412 379
25th October 2019 Accumulate 466 468
4th February 2020 Accumulate 630 630
28th May 2020 Accumulate 660 714
Rating track graph
300
350
400
450
500
550
600
650
700
Apr
-18
May
-18
Jun-
18
Jul-1
8
Aug
-18
Sep
-18
Oct
-18
Nov
-18
Dec
-18
Jan-
19
Feb
-19
Mar
-19
Apr
-19
May
-19
Jun-
19
Jul-1
9
Aug
-19
Sep
-19
Oct
-19
Nov
-19
Dec
-19
Jan-
20
Feb
-20
Mar
-20
Apr
-20
May
-20
Not Covered Covered
In s t itu tio n a l E q u it ie s
14 Coromandel International
DISCLOSURES
This Report is published by Nirmal Bang Equities Private Limited (hereinafter referred to as “NBEPL”) for private circulation. NBEPL is a registered Research Analyst under SEBI (Research Analyst) Regulations, 2014 having Registration no. INH000001436. NBEPL is also a registered Stock Broker with National Stock Exchange of India Limited and BSE Limited in cash and derivatives segments. NBEPL has other business divisions with independent research teams separated by Chinese walls, and therefore may, at times, have different or contrary views on stocks and markets. NBEPL or its associates have not been debarred / suspended by SEBI or any other regulatory authority for accessing / dealing in securities Market. NBEPL, its associates or analyst or his relatives do not hold any financial interest in the subject company. NBEPL or its associates or Analyst do not have any conflict or material conflict of interest at the time of publication of the research report with the subject company. NBEPL or its associates or Analyst or his relatives do not hold beneficial ownership of 1% or more in the subject company at the end of the month immediately preceding the date of publication of this research report. NBEPL or its associates / analyst has not received any compensation / managed or co-managed public offering of securities of the company covered by Analyst during the past twelve months. NBEPL or its associates have not received any compensation or other benefits from the company covered by Analyst or third party in connection with the research report. Analyst has not served as an officer, director or employee of Subject Company and NBEPL / analyst has not been engaged in market making activity of the subject company. Analyst Certification: I, Amit Agarwal, research analyst and the author of this report, hereby certify that the views expressed in this research report accurately reflects my personal views about the subject securities, issuers, products, sectors or industries. It is also certified that no part of the compensation of the analyst was, is, or will be directly or indirectly related to the inclusion of specific recommendations or views in this research. The analyst is principally responsible for the preparation of this research report and has taken reasonable care to achieve and maintain independence and objectivity in making any recommendations.
In s t itu tio n a l E q u it ie s
15 Coromandel International
Disclaimer
Stock Ratings Absolute Returns
BUY > 15%
ACCUMULATE -5% to15%
SELL < -5%
This report is for the personal information of the authorized recipient and does not construe to be any investment, legal or taxation advice to you. NBEPL is not soliciting any action based upon it. Nothing in this research shall be construed as a solicitation to buy or sell any security or product, or to engage in or refrain from engaging in any such transaction. In preparing this research, we did not take into account the investment objectives, financial situation and particular needs of the reader.
This research has been prepared for the general use of the clients of NBEPL and must not be copied, either in whole or in part, or distributed or redistributed to any other person in any form. If you are not the intended recipient you must not use or disclose the information in this research in any way. Though disseminated to all the customers simultaneously, not all customers may receive this report at the same time. NBEPL will not treat recipients as customers by virtue of their receiving this report. This report is not directed or intended for distribution to or use by any person or entity resident in a state, country or any jurisdiction, where such distribution, publication, availability or use would be contrary to law, regulation or which would subject NBEPL & its group companies to registration or licensing requirements within such jurisdictions.
The report is based on the information obtained from sources believed to be reliable, but we do not make any representation or warranty that it is accurate, complete or up-to-date and it should not be relied upon as such. We accept no obligation to correct or update the information or opinions in it. NBEPL or any of its affiliates or employees shall not be in any way responsible for any loss or damage that may arise to any person from any inadvertent error in the information contained in this report. NBEPL or any of its affiliates or employees do not provide, at any time, any express or implied warranty of any kind, regarding any matter pertaining to this report, including without limitation the implied warranties of merchantability, fitness for a particular purpose, and non-infringement. The recipients of this report should rely on their own investigations.
This information is subject to change without any prior notice. NBEPL reserves its absolute discretion and right to make or refrain from making modifications and alterations to this statement from time to time. Nevertheless, NBEPL is committed to providing independent and transparent recommendations to its clients, and would be happy to provide information in response to specific client queries.
Before making an investment decision on the basis of this research, the reader needs to consider, with or without the assistance of an adviser, whether the advice is appropriate in light of their particular investment needs, objectives and financial circumstances. There are risks involved in securities trading. The price of securities can and does fluctuate, and an individual security may even become valueless. International investors are reminded of the additional risks inherent in international investments, such as currency fluctuations and international stock market or economic conditions, which may adversely affect the value of the investment. Opinions expressed are subject to change without any notice. Neither the company nor the director or the employees of NBEPL accept any liability whatsoever for any direct, indirect, consequential or other loss arising from any use of this research and/or further communication in relation to this research. Here it may be noted that neither NBEPL, nor its directors, employees, agents or representatives shall be liable for any damages whether direct or indirect, incidental, special or consequential including lost revenue or lost profit that may arise from or in connection with the use of the information contained in this report.
Copyright of this document vests exclusively with NBEPL.
Our reports are also available on our website www.nirmalbang.com
Access all our reports on Bloomberg, Thomson Reuters and Factset.
Team Details:
Name Email Id Direct Line
Rahul Arora CEO [email protected] -
Girish Pai Head of Research [email protected] +91 22 6273 8017 / 18
Dealing
Ravi Jagtiani Dealing Desk [email protected] +91 22 6273 8230, +91 22 6636 8833
Michael Pillai Dealing Desk [email protected] +91 22 6273 8102/8103, +91 22 6636 8830
Nirmal Bang Equities Pvt. Ltd.
Correspondence Address
B-2, 301/302, Marathon Innova,
Nr. Peninsula Corporate Park,
Lower Parel (W), Mumbai-400013.
Board No. : 91 22 6273 8000/1; Fax. : 022 6273 8010


