Embed Size (px)
Citation preview
R. Cont. Fin. – USP, São Paulo, v. 27, n. 71, p. 149-168, mai./jun./jul./ago. 2016 149
Corporate Governance Characteristics as a Stimulus to Tax ManagementAntônio Paulo Machado GomesIbmec, Departamento de Ciências Contábeis, Belo Horizonte, MG, Brazil
Received on 06.27.2014 – Desk Acceptance on 10.28.2014 – 3rd version accepted on 09.25.2015.
ABSTRACTThis article aimed to investigate whether corporate governance uses tax management to increase companies’ performance. The objective was checking whether corporate governance characteristics, such as remuneration paid to the executive board, segregation between Chair-man and CEO, and the independence and composition of the Board of Directors, influence tax management in Brazilian companies. At the same time, it aimed to identify whether the preceding tax management is reflected on the subsequent tax management. To do this, a sample of 355 Brazilian companies listed on the BM&FBOVESPA between 2008 and 2014 was used, in order to find out whether their cor-porate governance characteristics influenced tax management, something identified by calculating ETR, CashETR, and BTD. As a result, it was found (i) that the remuneration paid to executives may be regarded as a characteristic influencing tax management in Brazilian firms, and (ii) that the preceding tax management influences the future tax management. In addition, it was found that Brazilian companies do not rule out tax management benefits, since the average effective rate in the sample under analysis was 25%, and it is statistically lower than the nominal rate of taxes on earnings in Brazil, which is 34%.
Keywords: tax management, corporate governance, ETR, CashETR, BTD.
ISSN 1808-057XDOI: 10.1590/1808-057x201500750
Antônio Paulo Machado Gomes
R. Cont. Fin. – USP, São Paulo, v. 27, n. 71, p. 149-168, mai./jun./jul./ago. 2016150
1 INTRODUCTION
rate structures or invest in tax havens that do not require accounting information. Thus, it gives room for managerial opportunism, i.e. within complex and obscure structures managers have opportunities to pursue interests of their own to the detriment of shareholders’ interests. An exam-ple of this practice was reported by Desai and Dharmapala (2007) regarding the conclusions by the Joint Committee on Taxation (JCT) in the ENRON case. According to this Committee, the fraud at ENRON had as its initial goal tax savings. However, such planning was used to mask losses and thus cheat thousands of investors around the world. The Enron case demonstrates how tax management can provide ideal environments for managerial opportunism. Second, tax management involves significant uncertainties, since it must be executed before the taxable event so that it does not characterize tax avoidance, i.e. tax crime. Thus, the benefits of tax management may fail to occur.
Therefore, knowing how corporate governance will work to (i) mitigate risks for a complex and obscure tax management and (ii) contribute so that the benefits of tax management take place provides some understanding to shape corporate governance practices in order to lead the company to achieve the shareholders’ main goal, i.e. in-creased firm value. Also, Brazil has experienced an actual growth of the stock market, where more and more inves-tors employ their savings in publicly traded corporations. Accordingly, the agency problem risk increases and it must be discussed. Another aspect that deserves attention is tax management in companies, as the Brazilian tax legislation complexity, coupled with the increased expenses on taxes, may encourage companies to manage their taxes, giving room to managerial opportunism.
According to the manuals on good corporate gover-nance practices by the Brazilian Securities and Exchange Commission (CVM) (Comissão de Valores Mobiliários, 2002) and the Brazilian Institute of Corporate Governan-ce (IBGC) (Instituto Brasileiro de Governança Corpora-tiva, 2011), a company can boost its performance, as well as bring benefits to the whole society, by adopting inter-nal and external mechanisms to ensure that corporate de-cisions are made in the best interest of investors, in order to maximize the probability that resource providers have a return on their investment.
To do this, one of the main internal mechanisms that these manuals propose refers to the Board of Directors, which, according to Silveira (2002), plays a key role in companies’ corporate governance, therefore it is the main internal mechanism to reduce agency costs between sha-reholders and managers, as well as between controlling and minority shareholders.
According to Fama and Jensen (1983), the decision--making process of senior management involves four sta-ges, two of which should be the sole responsibility of the Board: ratification of relevant decisions and monitoring of senior management. In this way, according to the manu-
As noticed by Desai and Dharmapala (2007), concer-ning the study by Adolphe Berle and Gardiner Means on the agency problem (The Modern Corporation and Private Property, 1932), the latter arises when shareholders name managers who can pursue interests of their own at the ex-pense of shareholders’ interests. According to Desai and Dharmapala, the authors were inspired by the role of taxes in the diffusion of property in the U.S. economy, and this was due to high tax rates on estate and the need for funding after the First World War, which resulted in property segre-gation among the U.S. companies. The agency problem has emerged along with this separation between owners and managers, according to Shleifer and Vishny (1997) and La Porta and Vishny (2000), and it is solved by adopting good Corporate Governance practices.
According to Silveira (2004), studies involving the theme corporate governance have as their main concern demons-trating the increased companies’ performance by adopting the principles of corporate governance. On the other hand, according to Minnick and Noga (2010), these studies are not concerned in checking how increased performance is obtained. Therefore, in order to verify which are the tools used by corporate governance to boost corporate perfor-mance, this research examines whether companies seek to increase their performance by reducing expenses on taxes on earnings (Brazilian income tax on legal entities – IRPJ and Brazilian social contribution on earnings – CSLL) and whether this is motivated by corporate governance practi-ces adopted by companies.
It is believed that the increased performance of a com-pany can be reached through tax management, understood as a legal way of reducing expenses on taxes, when tax-payers identify opportunities in laws to decrease compa-nies’ tax burden (Goncharov & Zimmermann, 2005; Tang, 2005; Desai & Dharmapala, 2006; Formigoni, Antunes, & Paulo, 2009; Minnick & Noga, 2010; Tang & Firth, 2010).
Many studies (Desai & Dharmapala, 2006; Dyreng, Hanlon, & Maydew, 2008; Robinson, Sikes, & Weaver, 2010; Armstrong, Blouin, & Larcker, 2011) report that tax management may be measured through three proxies: Effective Tax Rate (ETR), Cash Effective Tax Rate (CashE-TR), and Book-Tax Differences (BTD). It is understood as ETR the result of dividing expenses on taxes on earnings by company’s earnings before taxes on earnings; so, ETR is the effective tax rate on company’s profit. In turn, CashETR is the effective tax rate taking only paid taxes into account, without deferred taxes and analyzing in the long term. And, finally, BTD is the difference between book earnings and taxable earnings, considering that, if the latter is smal-ler than the former, there is evidence of tax management.
Given this preliminary context, the link between tax management and corporate governance is discussed for two reasons. First, tax management can be complex and obscure, i.e. in order to obtain an effective tax management the company may be encouraged to adopt complex corpo-
Corporate Governance Characteristics as a Stimulus to Tax Management
R. Cont. Fin. – USP, São Paulo, v. 27, n. 71, p. 149-168, mai./jun./jul./ago. 2016 151
als on corporate governance by the CVM (2002) and the IBGC (2011), the Board of Directors should be indepen-dent and there must be segregation between the president of the Board of Directors (Chairman) and the chief execu-tive officer (CEO), in order to enable the Board to play its role of effectively monitoring the executive board, contri-buting to maximize companies’ performance.
The aforementioned manuals propose that the Board of Directors consists of few members, technically qua-lified, ranging from five to nine participants. This sug-gestion is derived from the organizational behavior the-ory, which reports a productivity decline as the working groups increase. In this way, according to Jensen (2001), Boards with a large number of members are less likely to work effectively, becoming more easily controlled by the executive director. In addition, several studies (Yerma-ck, 1996; Brown & Maloney, 1999; Eisenberg, Sundgren & Wells, 1998; Füerst & Kang, 2000) have demonstrated that smaller Boards are more efficient and they provide companies with better returns.
In addition the Board of Directors, a way to mitigate the agency problem is through incentive contracts, which aim to establish rewards and punishments to managers and thus align managers’ interests to shareholders’ inte-rests. In this way, a partial solution to the issue of exe-cutives’ residual control right is providing managers with an ex-ante long-term incentive, which align executives’ interests to investors’ interests (Jensen & Meckling, 2008).
Fama (1980) shows that incentive contracts can take a variety of forms, including property distribution, options
to purchase stocks, or threat of dismissal if performance is bad. On the other hand, according to Shleifer and Vishny (1997), the main issue of incentive contracts is that they create a huge potential for managers’ extra earnings, e.g. earnings from profits already known or goals already met.
Anyway, several studies (Desai & Dharmapala, 2006; Frank, Lynch & Rego, 2009; Rego & Wilson, 2010; Dyreng, Hanlon & Maydew, 2010; Armstrong et al., 2011) have shown a strong link between the executive board remuneration and tax management, showing a negative relationship between increased executive board remune-ration and the effective tax rates on companies’ earnings.
Thus, it is believed that the composition of the Board of Directors, its members’ independence, segregation be-tween the president (chairman) and the chief executive officer (CEO), and the proper design of executive board remuneration contracts are corporate governance cha-racteristics that can (i) influence the increased corporate performance, by reducing expenses on taxes, (ii) avoid agency problems in situations where tax management enables managerial opportunism, and (iii) avoid the un-certainty of benefits from tax management, minimizing the allocation of resources in dubious tax management.
Given the above, this research problem has been pre-pared: Corporate governance characteristics, such as executive board remuneration, segregation between Chairman and CEO, the independence and composi-tion of the Board of Directors, as well as tax manage-ment in preceding years, influence tax management in Brazilian companies?
2 LITERATURE REVIEW AND DEVELOPMENT OF HYPOTHESES
2.1 Aspects Related to Tax ManagementAccording to the literature reviewed by Graham (2003),
taxes are one of the many factors influencing decision--making in companies, especially with regard to investment and funding policies. Given this fact, Hanlon and Slemrod (2007) report that shareholders are interested to reduce the burden of taxes in order to increase company value.
Tax management, tax administration, tax planning, and tax avoidance are defined as a legal way of reducing expen-ses on taxes, when taxpayers identify opportunities in the laws to decrease companies’ tax burden (Armstrong et al., 2011; Desai & Dharmapala, 2006; Formigoni et al., 2009; Minnick & Noga, 2010; Tang & Firth, 2010; Goncharov & Zimmermann, 2005).
Therefore, tax management seeks, through legal ways and among the opportunities observed in tax legislation, to reduce the current value of companies’ taxes in order to increase their performance and, as a consequence, their market value (Machado, 2011). In this vein, Desai and Dharmapala (2006) report that tax management is a legal transfer of State resources to companies with a view to in-crease their performance, by reducing expenses on taxes. As a result, many researchers have shown that tax mana-
gement is a valuable activity for shareholders (Bankman, 1999; Graham & Tucker, 2006; Desai & Dharmapala, 2007; Frank et al., 2009; Wilson, 2009).
According to Scholes and Wolfson (1992), there is a need to consider all aspects involved in business and not only taxes to make tax management effective. In this way, the conceptual structure developed by the authors revolves around three central themes (known as all parties, all taxes, and all costs):
a) An effective tax planning requires the planner to take into account the tax implications of a transaction proposed for all parties involved in the transaction (all parties).
b) An effective tax planning requires the planner, when making investments and financial decisions, to take into account not only explicit taxes, value paid directly to the authorities, but also implicit taxes, value paid indirectly in the form of lower return rates before taxes on encouraged investments (all taxes).
c) An effective tax planning requires the planner to re-cognize that taxes represent only one among many business costs, and all of them must be considered in the planning process; to be implemented, some proposals require costly restructuring procedures (all costs).
Antônio Paulo Machado Gomes
R. Cont. Fin. – USP, São Paulo, v. 27, n. 71, p. 149-168, mai./jun./jul./ago. 2016152
Therefore, it is clear that the central theme in the struc-ture developed by Scholes and Wolfson (1992) is that the effective tax management must take into account (i) tax im-plications for all parties involved in the transaction, (ii) all taxes, either explicit or implicit, and (iii) all costs involved in the issue.
According to these authors, although taxes represent a significant burden on companies’ cost structure and, the-refore, require due attention, decision-making to reduce companies’ tax burden may not be based only on the legal--fiscal perspective. Checking all variables involved in tax management is important so that the intended goal and gain are achieved, regardless of their nature, fiscal or non--fiscal.
Finally, the authors highlight that increasing companies’ performance is more important than reducing companies’ tax burden, because what really matters is maximizing company value (Scholes & Wolfson, 1992). Therefore, tax management must have as its primary premise increasing company value in the long term.
Studies related to tax management usually seek to con-nect fiscal management to certain company’s attributes, such as profitability, foreign operations level, intangible as-sets, expenses on research and development (R&D), leve-rage, and aggressive financial reporting. Some examples of these studies are Gupta and Newberry (1997), Rego (2003), Graham and Tucker (2006), Frank et al. (2009), and Wilson (2009).
In this paper, the aim is identifying whether corpora-te governance characteristics adopted by companies, such as independence of the Board of Directors, the number of members in this Board, segregation between Chairman and CEO, and variable remuneration influence tax mana-gement. In this line of research, evidence is mixed, accor-ding to results obtained by Phillips (2003), Hanlon (2005), Desai and Dharmapala (2006), and Armstrong et al. (2011).
Several studies (Desai & Dharmapala, 2006; Dyreng et al., 2008; Robinson et al., 2010; Armstrong et al., 2011) re-port that tax management may be measured through three proxies: Effective Tax Rate (ETR) Cash Effective Tax Rate (CashETR), and Book-Tax Differences (BTD). It is unders-tood as ETR the result of dividing expenses on taxes on earnings by company’s earnings before taxes on earnings, thus ETR is the effective tax rate on company’s profit. In turn, CashETR is the effective tax rate taking only paid ta-xes into account, without deferred taxes and analyzing in the long term. To do this, it is highlighted that this variable was obtained by adding the expenses registered in compa-nies’ results over the past 10 years and dividing this value by earnings before taxes on earnings, within the same 10-year period. Expenses registered in the result were taken into account, because they are the counterparts of tax liabi-lities registered in the short term and settled by March 31 of the subsequent year, according to the Brazilian Income Tax Regulations (Decree 3,000/1999). So, these are the va-lues actually paid by companies. And, finally, BTD is the difference between book earnings and taxable earnings, if the latter is smaller than the former, there is evidence of tax
management.Through these proxies, studies sought to determine
whether there was a relationship between variable remu-neration and tax management, and in many of these pa-pers there was a significant negative relationship between remuneration and the proxies to identify tax management - ETR, CashETR, and BTD. This leads to the conclusion that remuneration influences directly tax management, de-monstrating that proper design of variable remuneration contracts is one of the great corporate governance tools to mitigate the agency problem and incentives to increase companies’ performance, by reducing income taxes.
In this way, Phillips (2003) reports that managers seek tax management to achieve their goals and thus increase their remuneration. Providing the same conclusion, Desai and Dharmapala (2006) notice there is a significant nega-tive relationship between increases in the executive board variable remuneration and the proxy BTD to identify tax management. In addition, the authors report that the nega-tive effect observed also stems from corporate governance characteristics adopted by the company. According to the authors, companies having weak corporate governance are more likely to tax management when the executive board variable remuneration increases.
In the same vein, Rego and Wilson (2010) examined variable remuneration as one determinant of tax manage-ment. Based on prior research, they concluded that varia-ble remuneration led administrators to take more risks in investment and funding decisions, provided that risk in-creased their variable remuneration. The authors identified a relationship between variable remuneration and the tax management proxies BTD and CashETR. However, they did not identify the same association with corporate gover-nance characteristics, such as independence of the Board of Directors and segregation between Chairman and CEO.
Dyreng et al. (2010) analyzed 908 business executives between the years 1992 and 2006, in order to verify whe-ther these managers promoted an incremental effect on tax management in their companies, since such manage-ment could not be explained by the company characteris-tics. They noticed that executives play a significant role in determining companies’ tax avoidance level. The authors identified a significant impact between these managers and the two tax management proxies used in the study - ETR and CashETR.
In the paper by Minnick and Noga (2010), addressing the role of corporate governance in tax management, the authors identified that variable remuneration of executive directors and the CEO have a strongly negative relationship with the tax management proxies ETR and CashETR. Every dollar added to the executives’ wealth accounts for 1.94% less in ETR and 4.13% less in CashETR. Therefore, the authors conclude that remuneration is the best cor-porate governance tool to encourage tax management in companies. Besides, they also noticed that small Boards of Directors are more prone to tax management held abroad, while companies with large Boards and independent mem-bers focus on domestic tax management, i.e. within their
Corporate Governance Characteristics as a Stimulus to Tax Management
R. Cont. Fin. – USP, São Paulo, v. 27, n. 71, p. 149-168, mai./jun./jul./ago. 2016 153
own country.Armstrong et al. (2011) analyzed whether executives’
variable remuneration directly related to tax management led them to focus on tax management. As a result, the au-thors identified a strongly negative relationship between the remuneration of these executives and the ETR. Howe-ver, they did not find the same relationship with regard to the CashETR.
2.2 Corporate Governance, Agency Problem, and Player Remuneration
Corporate governance began in the USA as a way to fight the expropriation of shareholders by executive ma-nagers, i.e. it emerged as a response to several records of misuse of shareholder’s wealth by managers. Indeed, the authors classify corporate governance as the set of mechanisms through which outsider investors (sha-reholders or creditors) protect themselves against expro-priation by insider investors (executives or controlling shareholders). Therefore, corporate governance aims to ensure that resources allocated by investors will not be spent by executive managers in activities that do not bring them the best return (Shleifer & Vishny, 1997; La Porta & Vishny, 2000).
On the core of the discussion of corporate governance lies the agency problem that, as claimed by Jensen and Meckling (2008), is characterized by the conflict of inte-rests between investors (the principal) and executive ma-nagers (the players), when the latter work in their own interest at the expense of shareholders’ aspirations. In this vein, given the information asymmetry, the player, aware that his actions are not fully known by the sha-reholder, can use company resources with less zeal than the shareholder. Therefore, the essence of the agency pro-blem is the conflict of interests made possible by separa-tion of ownership and control and it refers to investors’ difficulties to ensure that their funds are not expropriated or lost in unattractive projects.
To fight this opportunism, there emerge costs to align managers’ interests to shareholders’ interests. Such agency costs are classified by Jensen and Meckling (2008) into four types: the costs of generating incentives or ou-tline behavior (bonding), monitoring costs (monitoring), signaling costs (signaling), and residual losses (residual loss). The first type derives from efforts to restrict player’s choices, by encouraging him to behave according to a standard and warning him to expect punishment when deviating from such a standard. The second type is related to monitoring efforts by the principal to break with the information asymmetry, in order to provide the player with a sense of control. Considering the cost-benefit ra-tio of control and return, there is a point where it is not worth expending more effort to control players; so, these losses are acceptable, i.e. residual losses (Cardoso, Mário & Aquino, 2007).
Thus, the concern of Corporate Governance is fi-ghting the agency problem, creating an effective set of mechanisms, both incentives and monitoring, in order
to ensure that executives’ behavior is always aligned to shareholders’ interests. Thus, good governance provides owners (shareholders or unit holders) with strategic ma-nagement of their company and monitoring of executive administration.
To ensure this goal, executives and shareholders sign a contract that specifies what managers should do with company resources. Ideally, managers should sign a full contract specifying exactly what to do every moment and how excess cash flow should be allocated, in every pos-sible contingency. The issue is that players have limited knowledge, so many contingencies are difficult to des-cribe and predict, making it clear that full contracts are technically unfeasible. Due to difficulties in their develo-pment, investors have to delegate residual control rights to managers, i.e. they have the right to make decisions under circumstances not provided for in the contracts. This situation, in line with information asymmetry, gi-ves rise to an incorrect executives’ behavior, considering their personal interest.
However, according to Jensen and Meckling (1976, p. 310), “[...] a partial solution to the issue of executives’ residual control rights is giving them a long-term ex-ante incentive to align their interests to investors’ interests.” Fama (1980) demonstrates that incentive contracts can take a variety of forms, including property distribution, options to purchase stocks, or threat of dismissal if per-formance is bad.
In this line, there is extensive literature linking se-nior executives’ remuneration to company performance (Coughlan & Schmidt, 1985; Jensen & Murphy, 1990), and many of these papers have related the composition and influence of the Board to executives’ remunera-tion (Lambert, Larcker & Verrecchia, 1991; Boyd, 1994; Hallock, 1997). There are also several studies that oppose remuneration to fiscal management, by checking whe-ther remuneration encourages tax management (Desai & Dharmapala, 2006; Dyreng et al., 2008; Robinson et al., 2010; Armstrong et al., 2011).
In this regard, the studies sought to confirm whether there is a relationship between variable remuneration and tax management, and in many of them there was a significant negative relationship between remuneration and proxies identifying tax management, such as ETR, CashETR, and BTD (Armstrong et al., 2011; Desai & Dharmapala, 2006; Dyreng et al., 2010; Minnick & Noga, 2010; Phillips, 2003; Rego & Wilson, 2010).
In addition to remuneration, the studies on corpora-te governance establish that the Board of Directors is a major internal mechanism to solve the agency problem, because it acts as a link in the relations between sharehol-ders and managers and between controlling shareholders and minority shareholders (Jensen, 1993).
Jensen (1993) characterizes the Board of Directors as a major internal monitoring mechanism to protect owners’ interests. According to Silveira (2002), several market players even associate the term “corporate gover-nance” to the active and independent role of the Board of
Antônio Paulo Machado Gomes
R. Cont. Fin. – USP, São Paulo, v. 27, n. 71, p. 149-168, mai./jun./jul./ago. 2016154
Directors. In fact, when analyzing the history of corpora-te governance, it is noticed that the Board of Directors, as well as its independence from the beginning, was highli-ghted as the main internal mechanism to reduce agency costs between shareholders and managers and, as a con-sequence, to improve company performance.
Johnson, Daily and Ellstrand (1996) cite three func-tions of the Board of Directors: control, consultancy, and identification of resources. Regarding control, the Board acts as an internal body of the company responsible for monitoring directors, and it represents, within the com-pany, owners’ aspirations. In this role, the responsibilities of the Board of Directors include hiring and firing the CEO and other executives. Moreover, it is up to the Board establishing executives’ remuneration and punishment and ensuring that shareholders are not expropriated by senior managers (Monks & Minow, 1995). As for consul-tancy, the Board plays an advising role towards directors, recommending and confirming strategies to achieve the organization’s goals. And, finally, according to Pfeffer and Salancik (1978), the Board also plays the role of resource finder aiming at company’s success.
The widespread idea that the main function of the Board is monitoring company management and that only external professional counselors can be effective monitors has led most governance codes to emphasize the need for a Board of Directors made up of a majori-ty of members external to the company (non-executive, independent), in order to improve decision-making and increase company value (Silveira, 2002).
Following this line of thought, Fama and Jensen (1983) argue that the inclusion of professional external directors increases the Board effectiveness and reduces the likelihood of collusion of senior executives to expro-priate shareholders’ wealth. However, there is a conflict of views on how the independence of the Board affects companies’ monitoring and performance.
The literature on corporate governance also shows that the composition of the Board, regarding the num-ber of independent members, is related to mitigation of agency problems (Hermalin & Weisbach, 1991; Byrd & Hickman, 1992; Borokovich, Parrino & Trapani, 1996; Yermack, 1996; Core, Holthausen & Larcker, 1999). In fact, this literature has shown that large Boards with few independent counselors had more agency problems. On the other hand, companies with small Boards and a gre-ater number of external members might be safeguarded, because in this case the Board would be rather concerned about shareholders’ well-being improved company per-formance.
Based on this view, several studies tried to relate the independence of the Board of Directors to company performance. According to Silveira (2002), the question to be answered in these surveys was “[...] does a Board made up of a majority of external members (non-execu-tive) increase company performance?” To answer it, re-searchers examined the correlation between accounting performance measures and the proportion of counselors
external to the Board, and some results were conflicting (Rosenstein & Wyatt, 1990; Weisbach, 1988; Baysinger & Butler, 1985; Bhagat & Black, 2000; Hermalin & Weis-bach, 1991; Byrd & Hickman, 1992; Agrawal & Knoe-ber,1996).
Bhagat and Black (2000) found a significant rela-tionship between the composition of the Board and corporate performance, noticing that the Boards of U.S. companies with a majority of independent members behave differently from the Boards without such a ma-jority, and some of the differences seem to contribute to increase company value, while others seem to contribute to its reduction. However, contrary to what is advocated by most corporate governance codes, these authors state there is convincing evidence that the greater indepen-dence of the Board, represented by a majority of non--executive company counselors, is correlated to increa-sed company profitability or faster growth.
According to Bhagat and Black (2000), there is no empirical support to claim that companies whose Boards have more independent members show a better perfor-mance. On the contrary, the authors state there is eviden-ce that companies whose Board has a majority of inde-pendent members are less profitable, since they showed a worse performance when compared to other companies in the study.
However, by contrast, Hermalin and Weisbach (1991) think there is a tendency for companies that have gone through difficulties to include independent members in the Board in order to improve their performance. Thus, the authors state that the correlation between composi-tion of the Board and corporate performance tends to make companies with a higher proportion of members external to the Board to look worse, given the correlation between the proportion of external counselors and poor historical performance.
Anyway, Bhagat and Black (2000) claim that compa-nies with an independent majority may even perform better in some specific tasks, such as replacing the CEO, but they perform worse in other tasks, leading to a non--significant net advantage in general performance. In conclusion, the study suggests it is interesting to include a moderate number of internal and external members in the Board of Directors.
In this vein, Coles, Daniel and Naveen (2008) notice that the Board of Directors may vary according to com-pany characteristics, since, in their study, complex com-panies have large Boards with more external members, something which contributes to their strategies. On the other hand, simple companies have smaller Boards with few independent members.
Yermack (1996), in turn, found a significant negati-ve correlation between the proportion of independent counselors and Tobin’s Q, the same finding obtained by Agrawal and Knoeber (1996).
Other studies provide clues of a negative curviline-ar relationship between performance and proportion of independent counselors, suggesting that some Boards
Corporate Governance Characteristics as a Stimulus to Tax Management
R. Cont. Fin. – USP, São Paulo, v. 27, n. 71, p. 149-168, mai./jun./jul./ago. 2016 155
may have too many independent members. One of the-se studies is Wagner, Stimpert and Fubara (1998), which shows evidence of a curvilinear relationship with a ne-gative coefficient between the composition of the Board and return on assets (ROA). The study suggests that Bo-ards with a balanced proportion between executives and non-executives perform better. The authors emphasize, however, that this correlation disappears when return on equity (ROE) is used as a performance measurement. Barnhart and Rosenstein (1998) also found a curvilinear relationship with a significant negative coefficient betwe-en Tobin’s Q and the proportion of independent mem-bers in the Board, and they claim that companies with highly independent Boards have lower value, confirming the conclusions by Bhagat and Black (2000).
The studies by MacAvoy, Cantor, Dana and Peck (1983), Baysinger and Butler (1985), and Hermalin and Weisbach (1991) are also noteworthy, which simply did not find any significant relationship between the com-position of the Board of Directors and corporate perfor-mance measurements.
In Brazil, research on companies’ independence and performance were strongly influenced by the U.S. me-thodology. The most detailed research on this theme was conducted by Mônaco (2000), who analyzed 647 compa-nies registered by the CVM, using data for the year 1996.
By relating the literature highlighted to the question to be answered in this research, independent counselors may provide useful knowledge derived from their expe-rience to the CEO and the other executives, in order to advise them to concentrate their efforts on fiscal manage-ment as a way to increase companies’ overall performan-ce. Thus, herein, it is assumed that independent coun-selors may be more willing to employ resources in fiscal management as a way to ensure a good performance.
In addition to the Board, internal mechanisms such as the remuneration system and the ownership of stocks by executives, and external mechanisms, such as the disclo-sure of periodic information on the company, the presen-ce of a market for hostile takeovers, and the existence of a competitive job market, are also important to reduce the agency problem (Silveira, Barros & Famá, 2003).
This research examines corporate governance con-cerning four aspects, namely: composition and indepen-dence of the Board of Directors, size (number of Board members), segregation between Chairman and CEO, and
executives’ remuneration.
2.3 Research Hypotheses Through the research question six hypotheses were
formulated, based on the relationship between corporate governance characteristics and tax management, adop-ted by companies listed on the BM&FBOVESPA. The research hypotheses tested were:
(H1) The companies listed at the various corpora-te governance levels on the BM&FBOVESPA (Level 1, Level 2, and New Market) are those having better fiscal management, as a consequence, they are those having lower ETR and CashETR indexes, as well as positive BTD figures.
(H2) The specific corporate governance levels on the BM&FBOVESPA (Level 1, Level 2, and New Market) have a significant negative relationship with the proxies to identify tax management ETR, CashETR, and BTD.
(H3) The number of members in the Board of Di-rectors in the preceding year contributes to tax ma-nagement in firms, so the number of counselors has a significant relationship with the proxies to identify tax management ETR, CashETR, and BTD.
(H4) Independent Boards of Directors are more effi-cient concerning fiscal management, as they recommend the executive board to invest resources in such activities, so the number of independent counselors in the prece-ding year has a significant negative relationship with the proxies to identify tax management ETR, CashETR, and BTD.
(H5) Companies with segregation between Chair-man and CEO are more efficient concerning fiscal ma-nagement, so this dummy has a significant negative re-lationship with the proxies to identify tax management ETR, CashETR, and BTD.
(H6) Companies that adopt executive board variable remuneration are more efficient concerning fiscal ma-nagement, so executive board remuneration has a signi-ficant negative relationship with the proxies to identify tax management ETR, CashETR, and BTD.
(H7) Tax management in the preceding period is re-flected on tax management within the subsequent pe-riod, so the dependent variables to identify tax manage-ment ETR, CashETR, and BTD lagged one year have a significant relationship with the proxies to identify tax management.
3 METHODOLOGICAL PROCEDURES
3.1 Research Type and MethodAs pointed out by Watts and Zimmermann (1986), the
accounting theory aims to explain and predict accounting practice. In this sense, this research may be characterized as theoretical and empirical, as it seeks to explain tax ma-nagement and predicts such management by identifying characteristics that influence it. Thus, the research is divi-
ded into two major groups, one having an exploratory and another having an explanatory nature.
The first group, exploratory, seeks to better explain tax management, because, according to Salomon (1973), ex-ploratory research aims to better define the problem, i.e. become familiar with the phenomenon under study. Ac-cording to Mattar (1999), exploratory research is useful
Antônio Paulo Machado Gomes
R. Cont. Fin. – USP, São Paulo, v. 27, n. 71, p. 149-168, mai./jun./jul./ago. 2016156
when people are aware of the study theme, promoting gre-ater understanding and establishing priorities.
The second group, explanatory, people try to identify which are the corporate governance characteristics adop-ted by Brazilian companies that influence tax management by increasing their performance. To do this, hypotheses were formulated through existing theories that have been tested by using regression models with panel data.
In addition, research is characterized as quantitative by employing descriptive statistics and statistical analysis. Re-garding research strategy, bibliographic and documentary research were used. Concerning the data collection tech-nique, there was a documentary research of financial state-ments of companies listed on the BM&FBOVESPA, using the Economatica database to identify, (i) companies’ net profit before taxes, (ii) expenses on earnings (current and deferred), and (iii) companies’ leverage degree. Besides, there was a detailed examination of the Reference Forms published by companies listed on the BM&FBOVESPA, according to the CVM Normative Instruction 480/2009. It is noteworthy that these forms have collected information on corporate governance characteristics, such as segrega-
tion between Chairman and CEO, the number of indepen-dent members in the Board of Directors, total number of members in the Board of Directors, and variable remune-ration paid to the executive board.
3.2 Measurements to Identify Tax Management: ETR, CashETR, and BTD
According to the literature on calculation of the effec-tive tax rate (ETR), the ETR is commonly used to mea-sure tax management, since it calculates the effective rate of the tax paid by companies (Stickney & McGee, 1982; Gupta & Newberry, 1997; Callihan, 1994; Mills, Erickson, & Maydew, 1998; Petroni & Shackelford, 1999; Gupta & Mills, 2002; Yin, 2003; Rego, 2003; Phillips, 2003; Minni-ck & Noga, 2010; Armstrong et al., 2011).
According to several researchers (Callihan, 1994; Mills & Newberry, 2001; Shackelford & Shevlin, 2000; Tang, 2005; Formigoni et al., 2009; Comprix, Mills & Schmidt, 2011; Minnick & Noga, 2010; Armstrong et al., 2011), an-nual ETR is defined as the percentage obtained by divi-ding the total expenditure on taxes on earnings by earnin-gs before IRPJ of a given company i in year t:
1
2
where ‘Income Taxes’ is the sum of expenses on IRPJ and CSLL for the current and deferred year, and ‘LAIR’ is company profit before IRPJ.
Therefore, to identify tax management in companies, the ETR of companies listed on the BM&FBOVESPA was calculated between 2001 and 2014. It is noteworthy this re-search regarded as companies practicing tax management those having ETR indexes statistically lower than nominal tax rates on earnings, which amount to 34% in Brazil.
In order to demonstrate that the effective rates identi-fied by calculating the ETR are lower than normal tax ra-tes on earnings, the signal test was applied to one sample in order to estimate the median value for population and compare it to a target value. Such non-parametric test was applied because the population addressed in this research does not have a normal distribution.
One-sample signal test is a non-parametric alternative to one-sample t-test because it does not require that data come from a normally distributed population, as required by t-test. Besides, a 1-sample signal test has no assumptions on population symmetry.
This research also estimated the Cash Effective Tax Rate
(CashETR) as an additional means to identify tax manage-ment in Brazilian companies.
According to Dyreng et al. (2008), the CashETR consi-ders actually paid taxes, since they take into account, along with due tax, extraordinary payments and realized remu-neration, thus becoming a proxy with better disposition to measure long-term tax avoidance in companies.
According to these authors, to calculate the CashETR two modifications are made in the calculation of the ETRS. The first and most important is measuring the effective long-term tax rates, i.e. ten years. The second is that, to do so, a company taxes are added over a 10-year period and then divided by the sum of their total earnings before ta-xes, over the same ten years. This produces an effective tax rate that better follows up the long-term tax burden of a company.
In addition, to calculate the CashETR only realized tax payments are considered, excluding deferred taxes, due to tax differences, because what is sought is identifying the ac-tual tax burden paid on earnings.
Thus, following Dyreng et al. (2008), the CashETR was calculated this way:
Corporate Governance Characteristics as a Stimulus to Tax Management
R. Cont. Fin. – USP, São Paulo, v. 27, n. 71, p. 149-168, mai./jun./jul./ago. 2016 157
where ‘Taxespd’ represent the sum of IRPJ paid and CSLL for the year, and ‘LAIR’ is earnings before IRPJ.
It is noteworthy that, for identifying taxes paid by companies, only the current expenses on taxes were con-sidered, as they represent the counterparts of tax liabi-lities registered in the companies and settled, according to the tax legislation, until the last day of March in the subsequent year.
Also, in order to highlight the difference between the proxy CashETR and the nominal tax rate on earnings, a 1-sample signal test was applied.
Besides the calculation of these two proxies (ETR and CashETR), as an additional way to identify tax manage-ment, the Book Tax Differences (BTD) was calculated, which, according to the literature, is the difference be-tween book earnings and taxable earnings. Therefore, the BTD refers to the difference between book earnings
reported in the financial statements and the taxable ear-nings reported to the tax authorities through ancillary liabilities.
According to the CPC 32, companies are required to make a reconciliation between book earnings and taxable earnings, demonstrating in a note all factors that detach book earnings from taxable earnings.
Therefore, the companies’ BTD was calculated throu-gh the notes, dividing expenses on taxes on earnings by 0.34 (percentage related to tax rates on earnings within the period under analysis) and, out of this value, earnin-gs were decreased before taxes on earnings. It is worth noticing that, between 2008 and 2014, the BTD was cal-culated for financial companies by dividing these compa-nies’ expenses on taxes on earnings by 0.40 (percentage related to tax rates on earnings of financial companies, since April 2008).
3
To demonstrate that taxable earnings were lower than book earnings, 1-sample signal test was also applied, assu-ming as null hypothesis that taxable earnings were equal to book earnings.
3.3 Sample Selection and Processing The target population of this study consisted of 670 com-
panies, according to information available on the website of the BM&FBOVESPA on November 5, 2011. However, tho-
se companies that had no data for any variable under study (LAIR, IRPJ, Deferred Taxes, Assets, Indebtedness) were excluded from this population, i.e. companies which did not allow calculating the proxies under analysis between 2001 and 2014 were excluded. In addition, companies that have adopted internally generated goodwill were excluded, because this is regarded as an abusive tax planning practice. Thus, the study sample consists of 355 companies, whose representativeness based on total assets is 78%.
N Total Assets Percentual
Sample 355 25,490,814,374 78%
Population 670 32,573,002,815 100%
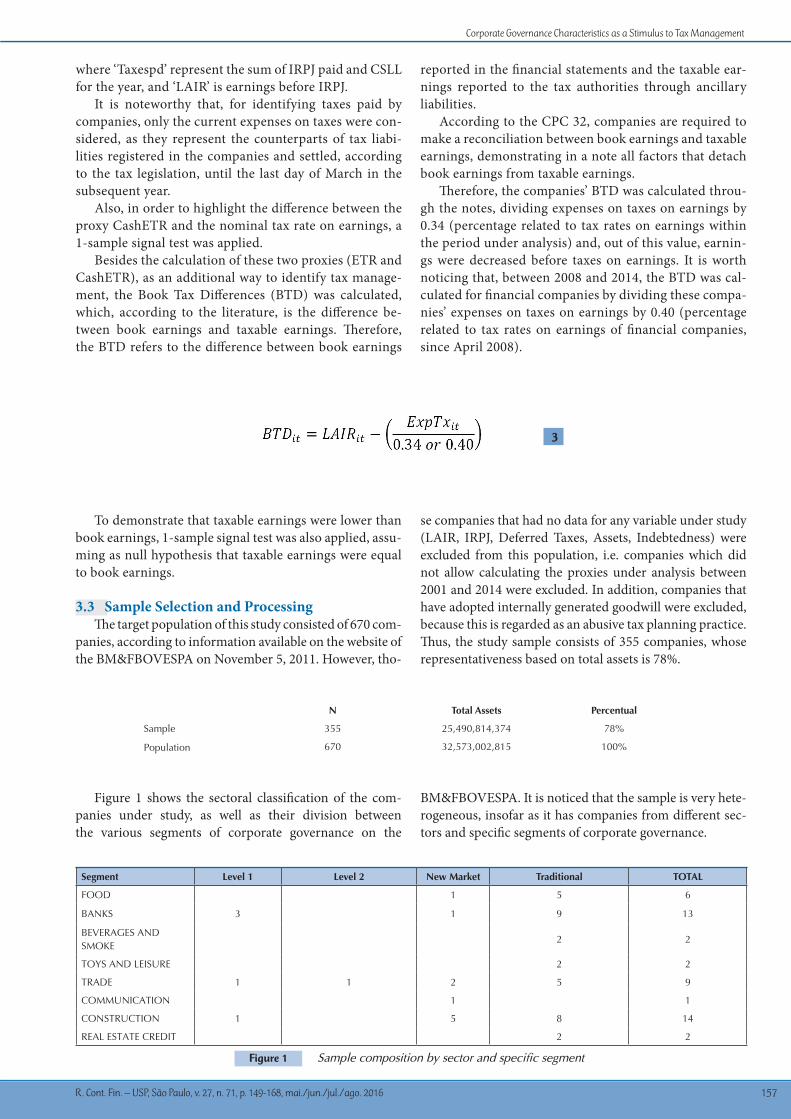
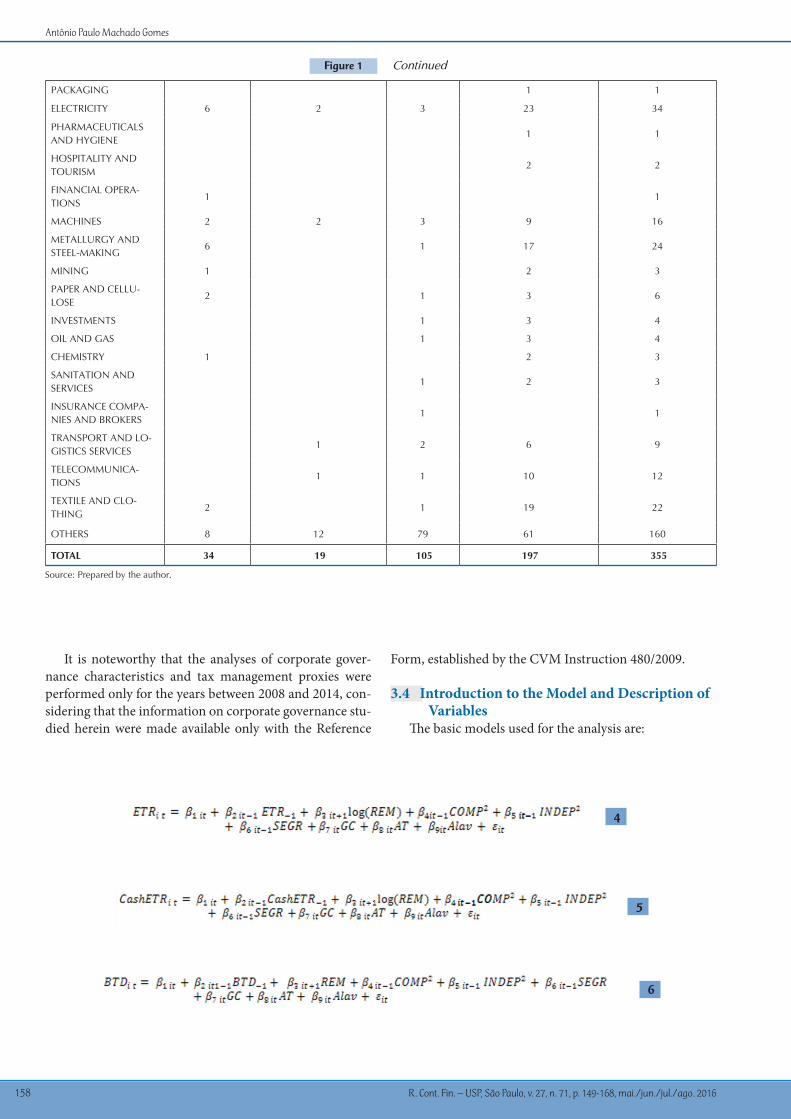
Figure 1 shows the sectoral classification of the com-panies under study, as well as their division between the various segments of corporate governance on the
BM&FBOVESPA. It is noticed that the sample is very hete-rogeneous, insofar as it has companies from different sec-tors and specific segments of corporate governance.
Figure 1 Sample composition by sector and specific segment
Segment Level 1 Level 2 New Market Traditional TOTAL
FOOD 1 5 6
BANKS 3 1 9 13
BEVERAGES AND SMOKE
2 2
TOYS AND LEISURE 2 2
TRADE 1 1 2 5 9
COMMUNICATION 1 1
CONSTRUCTION 1 5 8 14
REAL ESTATE CREDIT 2 2
Antônio Paulo Machado Gomes
R. Cont. Fin. – USP, São Paulo, v. 27, n. 71, p. 149-168, mai./jun./jul./ago. 2016158
It is noteworthy that the analyses of corporate gover-nance characteristics and tax management proxies were performed only for the years between 2008 and 2014, con-sidering that the information on corporate governance stu-died herein were made available only with the Reference
Form, established by the CVM Instruction 480/2009.
3.4 Introduction to the Model and Description of Variables
The basic models used for the analysis are:
Figure 1 Continued
PACKAGING 1 1
ELECTRICITY 6 2 3 23 34
PHARMACEUTICALS AND HYGIENE
1 1
HOSPITALITY AND TOURISM
2 2
FINANCIAL OPERA-TIONS
1 1
MACHINES 2 2 3 9 16
METALLURGY AND STEEL-MAKING
6 1 17 24
MINING 1 2 3
PAPER AND CELLU-LOSE
2 1 3 6
INVESTMENTS 1 3 4
OIL AND GAS 1 3 4
CHEMISTRY 1 2 3
SANITATION AND SERVICES
1 2 3
INSURANCE COMPA-NIES AND BROKERS
1 1
TRANSPORT AND LO-GISTICS SERVICES
1 2 6 9
TELECOMMUNICA-TIONS
1 1 10 12
TEXTILE AND CLO-THING
2 1 19 22
OTHERS 8 12 79 61 160
TOTAL 34 19 105 197 355
Source: Prepared by the author.
4
5
6
Corporate Governance Characteristics as a Stimulus to Tax Management
R. Cont. Fin. – USP, São Paulo, v. 27, n. 71, p. 149-168, mai./jun./jul./ago. 2016 159
Where:ETR = Effective Tax Rate, which is a dependent varia-
ble in the model;CashETR = Cash Effective Tax Rate, which is a depen-
dent variable in the model. It is worth noticing that this variable was obtained by summing expenses registered in the companies’ outcomes within the last 10 years. Expen-ses registered in the outcomes were considered because they are the counterparts of tax liabilities registered in the short term, which were settled by March 31 of the subsequent year, according to the Brazilian Income Tax Regulations (Decree 3,000/1999);
BTD = Difference between book earnings and taxable earnings, which is a dependent variable in the model;
β’s = Angular coefficients estimated for each depen-dent variable;
ETR-1 = Dependent variable lagged one year;CASH-1 = Dependent variable lagged one year;BTD-1 = Dependent variable lagged one year;Log(REM) = Remuneration value paid to the execu-
tive board in the year subsequent to the calculation of dependent variables in the model. The natural logarithm of remuneration value paid was adopted for calculating the ETR and CashETR;
REM = Remuneration value paid to the executive bo-ard in the year subsequent to the calculation of depen-dent variables in the model. The remuneration value paid was adopted for calculating the BTD;
(COMP)2 = Number of members in the company Bo-ard of Directors in the year preceding the calculation of dependent variables in the model, squared;
(INDEP)2 = Number of independent people in the Board of Directors in the year preceding the calculation of dependent variables in the model, squared;
SEGR = Binary variable representing the segregation between the president of the Board of Directors (Chair-man) and the chief executive officer (CEO), where 1 represents segregation and 0 the opposite, in the year preceding the calculation of dependent variables in the model;
GC = Binary variable indicating whether the company is listed on one of the specific segments of corporate go-vernance on the BM&FBOVESPA (Level 1, Level 2, and New Market), where 1 represents presence in a specific segment and 0 for the opposite;
AT = Natural logarithm of the company total assets, representing company size;
Alav = The company leverage level.
4 ANALYSIS OF RESULTS
Below, the results obtained are interpreted according to each hypothesis defined in the research.
(H1) The companies listed at the various corporate governance levels on the BM&FBOVESPA (Level 1, Level 2, and New Market) are those having better fiscal mana-
gement, as a consequence, they are those with lower ETR and CashETR indexes, as well as positive BTD figures.
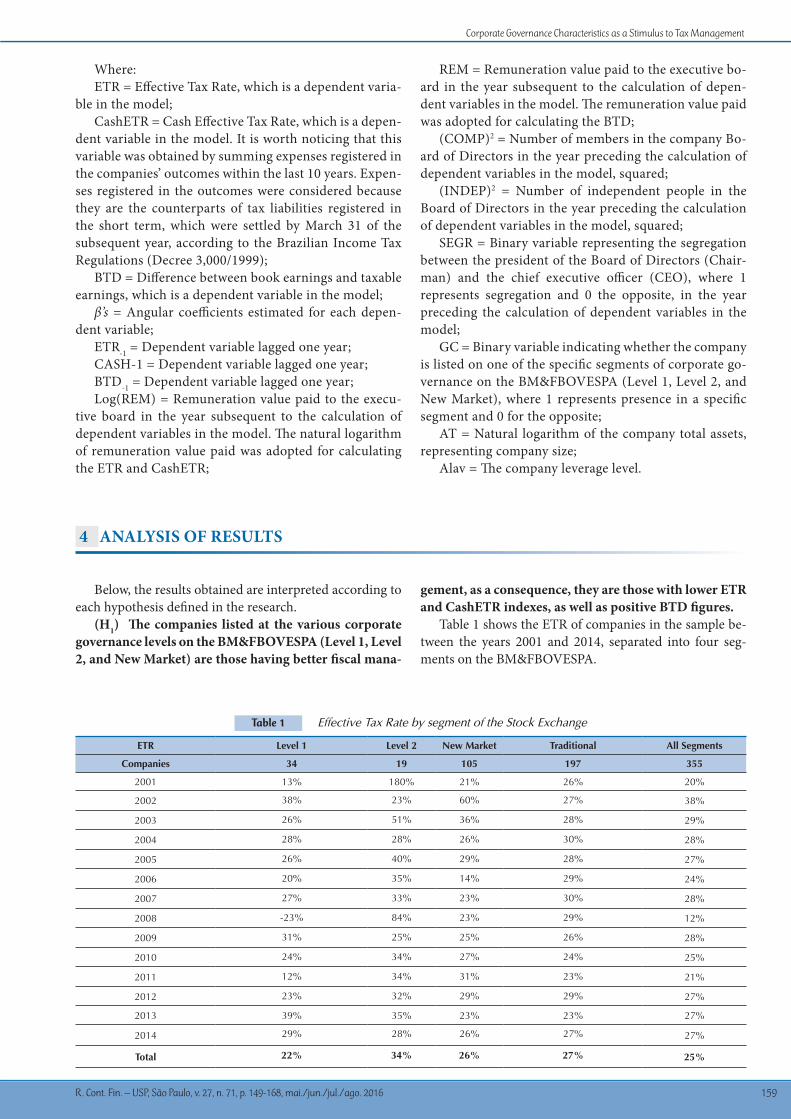
Table 1 shows the ETR of companies in the sample be-tween the years 2001 and 2014, separated into four seg-ments on the BM&FBOVESPA.
Table 1 Effective Tax Rate by segment of the Stock Exchange
ETR Level 1 Level 2 New Market Traditional All Segments
Companies 34 19 105 197 355
2001 13% 180% 21% 26% 20%
2002 38% 23% 60% 27% 38%
2003 26% 51% 36% 28% 29%
2004 28% 28% 26% 30% 28%
2005 26% 40% 29% 28% 27%
2006 20% 35% 14% 29% 24%
2007 27% 33% 23% 30% 28%
2008 -23% 84% 23% 29% 12%
2009 31% 25% 25% 26% 28%
2010 24% 34% 27% 24% 25%
2011 12% 34% 31% 23% 21%
2012 23% 32% 29% 29% 27%
2013 39% 35% 23% 23% 27%
2014 29% 28% 26% 27% 27%
Total 22% 34% 26% 27% 25%
Antônio Paulo Machado Gomes
R. Cont. Fin. – USP, São Paulo, v. 27, n. 71, p. 149-168, mai./jun./jul./ago. 2016160
It may be inferred from Table 1 that the average ETR of companies in the sample between the years 2001 and 2014 was 25%. The segment that had the lowest effec-tive tax rate was Level 1, with an average ETR of 22%, followed by the New Market, with an average ETR of 26%. The segment with the highest average ETR was Level 2, with 34%, accompanied by the segment Tradi-tional, with 27%.
Also, it is noteworthy that the average ETR for the year 2008 was 12%, mainly because of the negative ETR at Level 1 (-23%), something which contributed to reduce the average ETR in this segment (21%). This considerable decrease was due to the merger between ITAÚ and UNIBANCO, which generated tax benefits amounting to R$ 12 million, as highlighted in the notes by ITAÚSA - Investimentos ITAÚ S.A. (Note 15) and ITAÚ UNIBANCO Holding S.A. (Note 14). According to Roberto Egydio Setúbal (2008), president of ITAÚ, the merger between ITAÚ and UNIBANCO has gene-rated significant premium that could be amortized on the calculation basis of IRPJ and CSLL.
Table 1 also shows that three out of the four seg-ments under analysis showed an increased ETR, and Level 1 increased by 16 percentage points, representing a 123% positive variation. On the other hand, Level 2 had a significant negative variation, with 84%, which means a decrease of 152 percentage points. The seg-ment New Market had a 24% positive variation, with an increase of five percentage points. In turn, the seg-ment Traditional had a positive variation of 4%, with an increase of one percentage point in the ETR. Such changes have led to a 35% positive variation in the companies’ total ETR within the period under analysis, making it increase by seven percentage points.
The result obtained in our research is contrary to that found by Yin (2003). In the study carried out by this author, the ETR calculated for a sample of U.S. companies decreased almost constantly between 1995
and 2000, going from 28.85% in 1995 to 24.20% in 2000, representing a 16% decline.
The result shown herein is also opposite to that shown in the study by McIntyre and Nguyen (2000), who analyzed 250 large U.S. companies between 1996 and 1998. The authors identified a decreased num-ber of companies whose effective tax rates were above 30%, as they were 78 in 1996 and became 52 in 1998. In addition, the study showed an increased number of companies with effective rates below 30% within the same period, going from 97 to 104. The survey also showed a reduced effective tax rate in the companies under analysis, dropping from 22.9% in 1996 to 20.1% in 1998.
The ETR is criticized due to some drawbacks, such as: (i) it is calculated annually and, on that basis, its variations may lead the reader to make mistakes and they are also not consistent with tax management; (ii) its calculation takes into account deferred taxes, which may mask tax management, as companies can decrease the current tax, but increase it in the future, and this fact will be masked by adding deferred taxes; and (iii) variation in the ETR may occur due to factors unrela-ted to tax management.
To overcome these drawbacks, Dyreng et al. (2008) proposed the Cash Effective Tax Rates - CashETR as another way to identify tax management, where expen-ses on taxes on earnings are added in the long term and this value is divided by the sum of earnings wi-thin the same period. This measure prevents variation in the effective tax rate due to values unrelated to tax management.
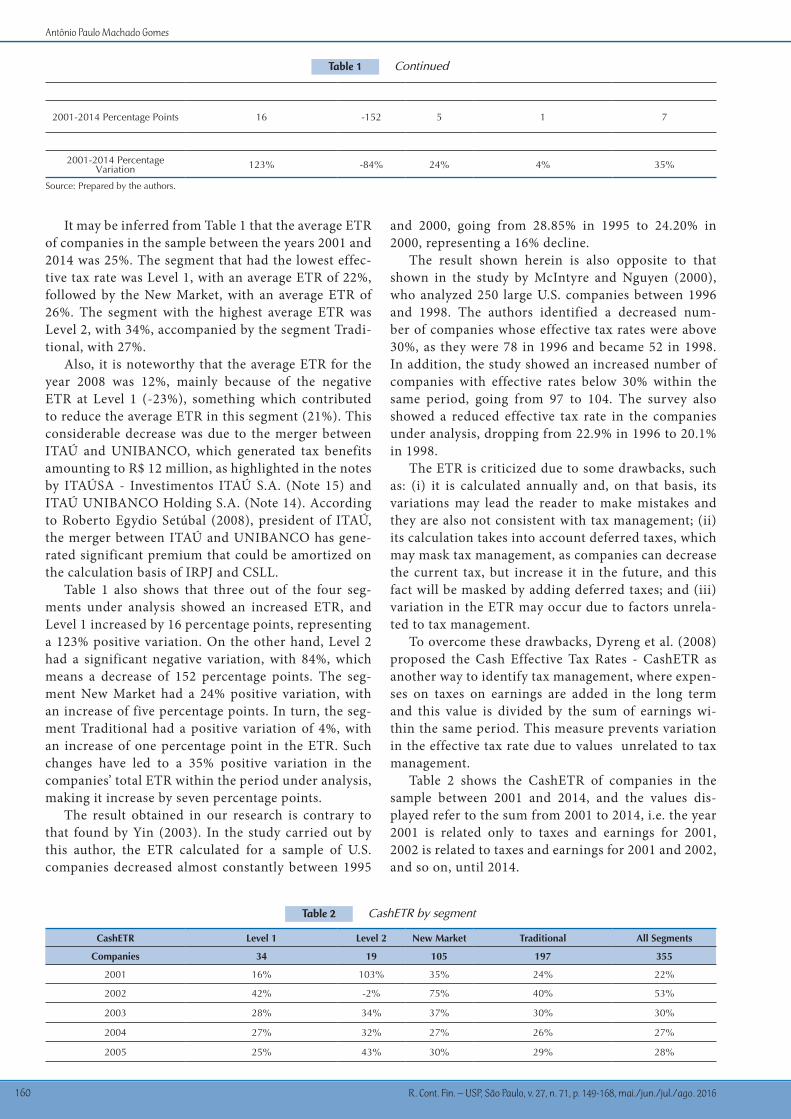
Table 2 shows the CashETR of companies in the sample between 2001 and 2014, and the values dis-played refer to the sum from 2001 to 2014, i.e. the year 2001 is related only to taxes and earnings for 2001, 2002 is related to taxes and earnings for 2001 and 2002, and so on, until 2014.
Source: Prepared by the authors.
2001-2014 Percentage Points 16 -152 5 1 7
2001-2014 Percentage Variation 123% -84% 24% 4% 35%
Table 1 Continued
Table 2 CashETR by segment
CashETR Level 1 Level 2 New Market Traditional All Segments
Companies 34 19 105 197 355
2001 16% 103% 35% 24% 22%
2002 42% -2% 75% 40% 53%
2003 28% 34% 37% 30% 30%
2004 27% 32% 27% 26% 27%
2005 25% 43% 30% 29% 28%
Corporate Governance Characteristics as a Stimulus to Tax Management
R. Cont. Fin. – USP, São Paulo, v. 27, n. 71, p. 149-168, mai./jun./jul./ago. 2016 161
It may be inferred from Table 2 that the segments ha-ving the largest negative variations refer to companies in the sample listed on Level 2 and New Market, with 81% and 40% decreases, respectively. On the other hand, the segment Traditional increased by 108%, followed by Level 1, with 63%. However, the average CashETR in Brazilian companies is 24%. In this estimate, New Market and Tradi-tional were 25% and 24%, respectively.
Comparing this research with that by Dyreng et al. (2008), it is noticed that the CashETR (24%) in Brazilian companies listed on the sample is lower than that showed by the authors, which was 29.6%, i.e. 5.6 percentage points less than the CashETR in U.S. companies included in that sample.
According to Shevlin (2002), Desai and Dharmapala (2006), Plesko (2004), McGill and Outslay (2004), Tang (2005), and Tang and Firth (2010), the BTD estimate is an effective way to identify tax management in companies, because if book earnings are higher than taxable earnings, there is evidence of tax management to reduce the calcula-tion basis of taxes on earnings.
Therefore, if the difference between book earnings and taxable earnings is positive, there is an indication of the presence of tax management, because it demonstrates that book earnings are higher than the calculation basis of taxes on earnings.
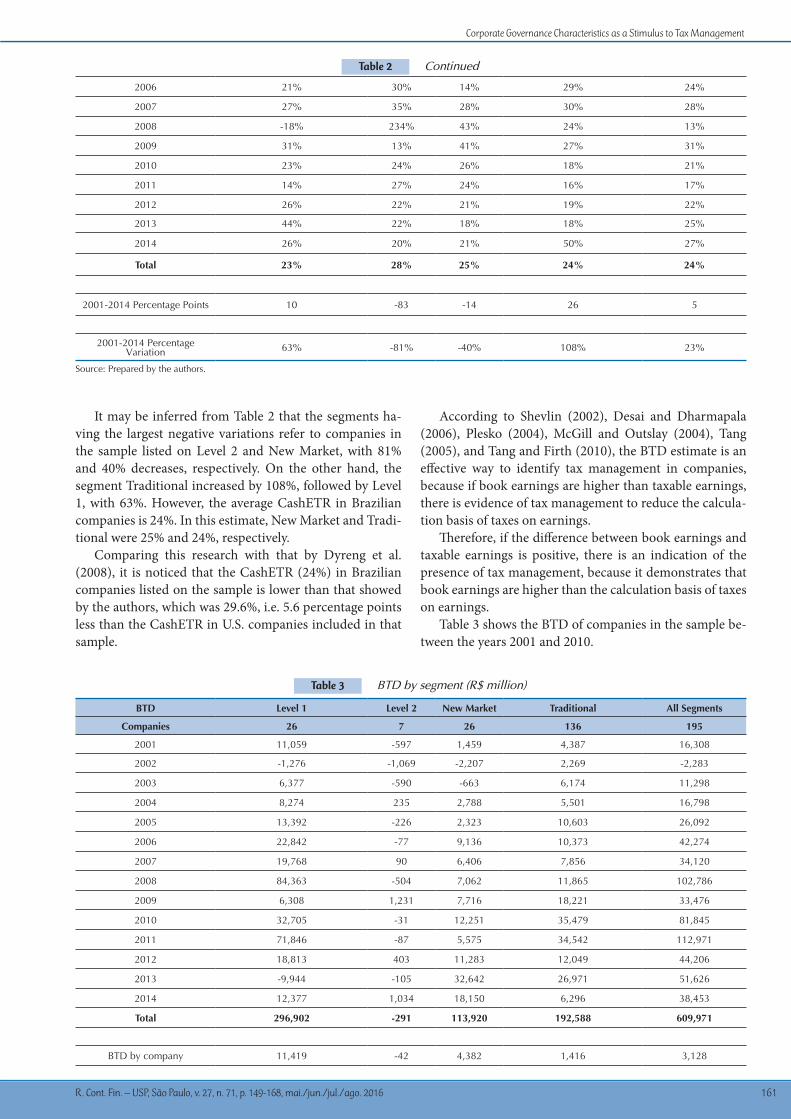
Table 3 shows the BTD of companies in the sample be-tween the years 2001 and 2010.
Source: Prepared by the authors.
Table 2 Continued
2006 21% 30% 14% 29% 24%
2007 27% 35% 28% 30% 28%
2008 -18% 234% 43% 24% 13%
2009 31% 13% 41% 27% 31%
2010 23% 24% 26% 18% 21%
2011 14% 27% 24% 16% 17%
2012 26% 22% 21% 19% 22%
2013 44% 22% 18% 18% 25%
2014 26% 20% 21% 50% 27%
Total 23% 28% 25% 24% 24%
2001-2014 Percentage Points 10 -83 -14 26 5
2001-2014 Percentage Variation 63% -81% -40% 108% 23%
Table 3 BTD by segment (R$ million)
BTD Level 1 Level 2 New Market Traditional All Segments
Companies 26 7 26 136 195
2001 11,059 -597 1,459 4,387 16,308
2002 -1,276 -1,069 -2,207 2,269 -2,283
2003 6,377 -590 -663 6,174 11,298
2004 8,274 235 2,788 5,501 16,798
2005 13,392 -226 2,323 10,603 26,092
2006 22,842 -77 9,136 10,373 42,274
2007 19,768 90 6,406 7,856 34,120
2008 84,363 -504 7,062 11,865 102,786
2009 6,308 1,231 7,716 18,221 33,476
2010 32,705 -31 12,251 35,479 81,845
2011 71,846 -87 5,575 34,542 112,971
2012 18,813 403 11,283 12,049 44,206
2013 -9,944 -105 32,642 26,971 51,626
2014 12,377 1,034 18,150 6,296 38,453
Total 296,902 -291 113,920 192,588 609,971
BTD by company 11,419 -42 4,382 1,416 3,128
Antônio Paulo Machado Gomes
R. Cont. Fin. – USP, São Paulo, v. 27, n. 71, p. 149-168, mai./jun./jul./ago. 2016162
2001-2014 Difference 1,318 1,631 16,691 1,908 22,145
2001-2014 Percentage Variation
12% -273% 1,144% 43% 136%
2001-2014 Percentage Variation by company
3% -93% 200% -68% -81%
Source: Prepared by the author.
Table 3 Continued
According to Table 3, the total difference between book earnings and taxable earnings, between 2001 and 2014, was R$ 610 billion, and Level 1 was the most representative, with R$ 297 billion, followed by Traditional market, with R$ 192 billion, and New Market, with R$ 114 billion. Level 2 showed a negative difference, i.e. taxable earnings were greater than book earnings in 2001, and in 2014 this was reversed, book earnings became greater than taxable ear-nings.
Table 3 also shows a positive BTD evolution, i.e. a posi-tive evolution of the difference between book earnings and taxable earnings, in all segments under analysis, something which means that all companies started having greater book earnings than taxable earnings. This fact may have been motivated by the separation between book earnings and taxable earnings since 2008, when the Brazilian Tran-sition Tax Regime (RTT) was established, which deals with tax adjustments derived from the new accounting methods and criteria introduced by Law 11,638/2007, and by the ar-ticles 36 and 37 of the Brazilian Provisional Act 449/2008,
turned into articles 37 and 38 of Law 11,941/2009 and now repealed by Law 12,973/2014.
So, it is clear that within these 14 years the Brazilian companies in the sample did not ignore tax management, as in all segments there was a decrease in taxable earnin-gs when compared to book earnings, something which demonstrates that the Brazilian companies under analysis have been constantly working to reduce taxable earnings in relation to book earnings.
However, the results reported herein reject (H1), i.e. companies listed on specific levels are more efficient in tax management, since the tests demonstrated, in short, that companies at specific corporate governance levels have a worse fiscal management for the ETR Index, the same ma-nagement as for the CashETR Index, and better manage-ment for the BTD Index.
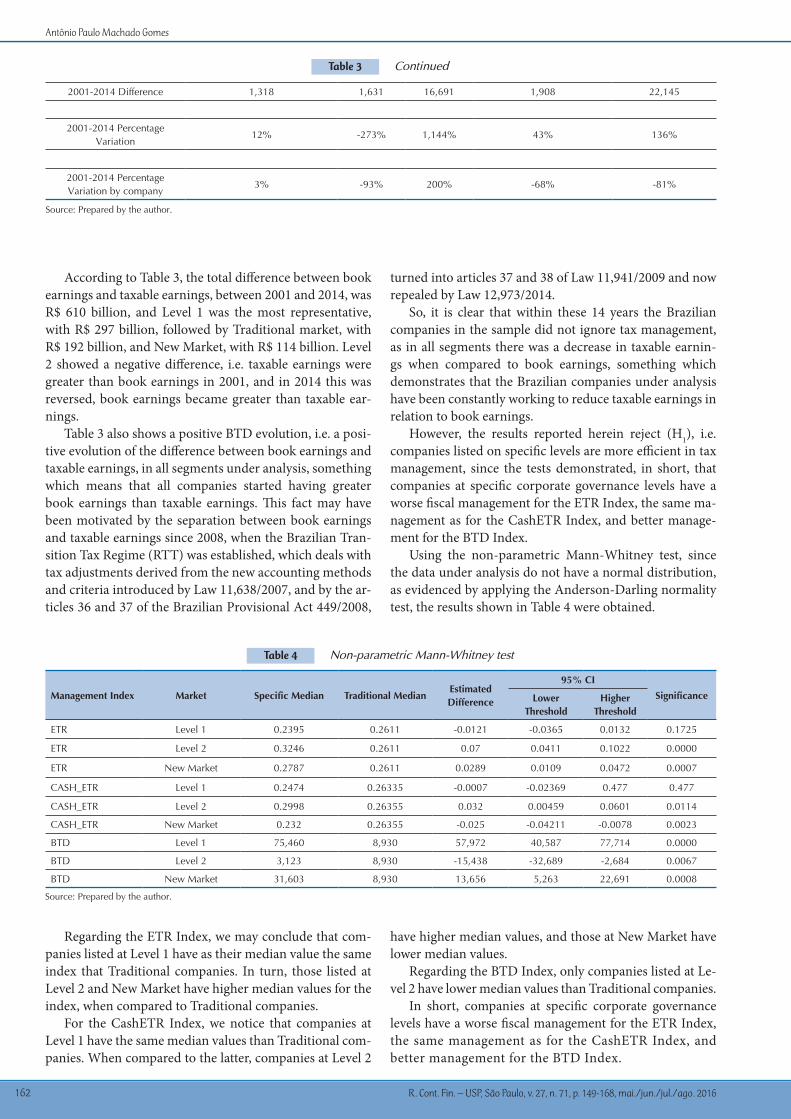
Using the non-parametric Mann-Whitney test, since the data under analysis do not have a normal distribution, as evidenced by applying the Anderson-Darling normality test, the results shown in Table 4 were obtained.
Table 4 Non-parametric Mann-Whitney test
Management Index Market Specific Median Traditional Median Estimated Difference
95% CI
SignificanceLower Threshold
Higher Threshold
ETR Level 1 0.2395 0.2611 -0.0121 -0.0365 0.0132 0.1725
ETR Level 2 0.3246 0.2611 0.07 0.0411 0.1022 0.0000
ETR New Market 0.2787 0.2611 0.0289 0.0109 0.0472 0.0007
CASH_ETR Level 1 0.2474 0.26335 -0.0007 -0.02369 0.477 0.477
CASH_ETR Level 2 0.2998 0.26355 0.032 0.00459 0.0601 0.0114
CASH_ETR New Market 0.232 0.26355 -0.025 -0.04211 -0.0078 0.0023
BTD Level 1 75,460 8,930 57,972 40,587 77,714 0.0000
BTD Level 2 3,123 8,930 -15,438 -32,689 -2,684 0.0067
BTD New Market 31,603 8,930 13,656 5,263 22,691 0.0008
Source: Prepared by the author.
Regarding the ETR Index, we may conclude that com-panies listed at Level 1 have as their median value the same index that Traditional companies. In turn, those listed at Level 2 and New Market have higher median values for the index, when compared to Traditional companies.
For the CashETR Index, we notice that companies at Level 1 have the same median values than Traditional com-panies. When compared to the latter, companies at Level 2
have higher median values, and those at New Market have lower median values.
Regarding the BTD Index, only companies listed at Le-vel 2 have lower median values than Traditional companies.
In short, companies at specific corporate governance levels have a worse fiscal management for the ETR Index, the same management as for the CashETR Index, and better management for the BTD Index.
Corporate Governance Characteristics as a Stimulus to Tax Management
R. Cont. Fin. – USP, São Paulo, v. 27, n. 71, p. 149-168, mai./jun./jul./ago. 2016 163
Anyway, the results shown herein demonstrate that Brazilian companies do not ignore the benefits of tax ma-nagement, since the effective rate in the sample between 2001 and 2014 was 25%, i.e. nine percentage points below the nominal tax rate on earnings (34%).
Besides, 1-sample signal test showed that the median values for the ETR and CashETR indexes are lower than the reference value 0.34, something which statistically shows that Brazilian companies do not ignore the benefits of tax management.
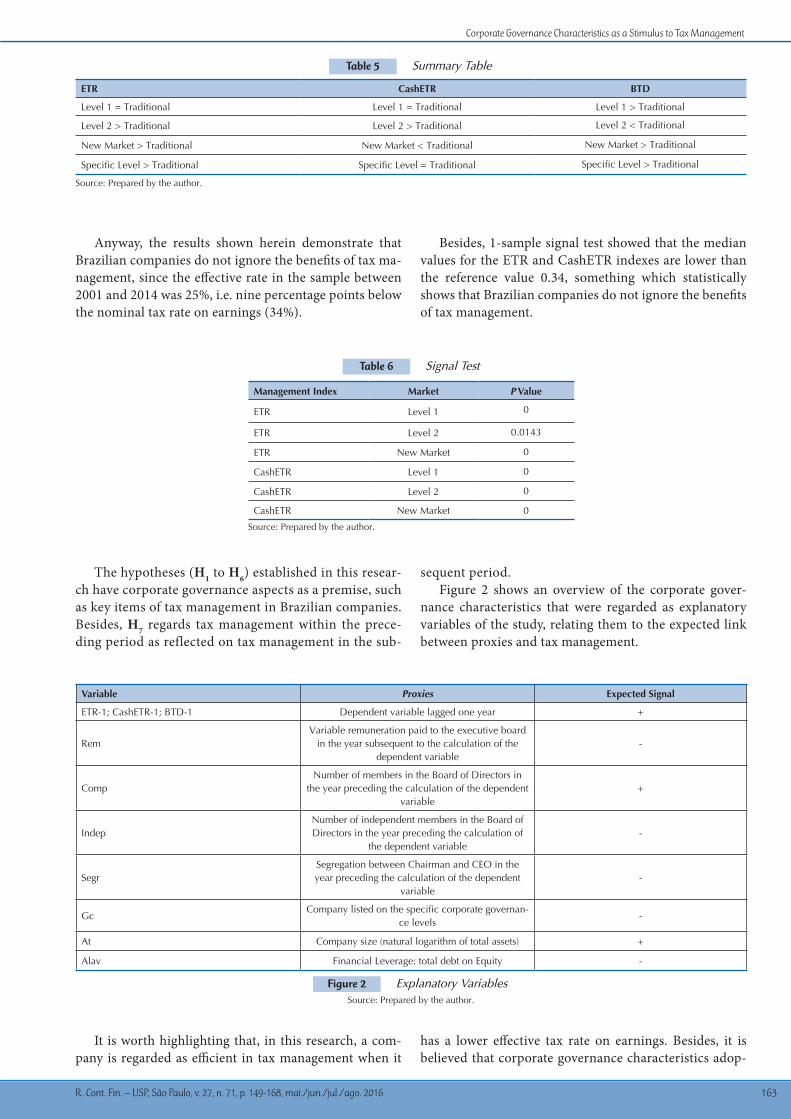
Table 5 Summary Table
Figure 2 Explanatory Variables
Table 6 Signal Test
ETR CashETR BTD
Level 1 = Traditional Level 1 = Traditional Level 1 > Traditional
Level 2 > Traditional Level 2 > Traditional Level 2 < Traditional
New Market > Traditional New Market < Traditional New Market > Traditional
Specific Level > Traditional Specific Level = Traditional Specific Level > Traditional
Variable Proxies Expected Signal
ETR-1; CashETR-1; BTD-1 Dependent variable lagged one year +
RemVariable remuneration paid to the executive board
in the year subsequent to the calculation of the dependent variable
-
CompNumber of members in the Board of Directors in
the year preceding the calculation of the dependent variable
+
IndepNumber of independent members in the Board of Directors in the year preceding the calculation of
the dependent variable-
SegrSegregation between Chairman and CEO in the year preceding the calculation of the dependent
variable-
GcCompany listed on the specific corporate governan-
ce levels-
At Company size (natural logarithm of total assets) +
Alav Financial Leverage: total debt on Equity -
Management Index Market P Value
ETR Level 1 0
ETR Level 2 0.0143
ETR New Market 0
CashETR Level 1 0
CashETR Level 2 0
CashETR New Market 0
Source: Prepared by the author.
Source: Prepared by the author.
Source: Prepared by the author.
The hypotheses (H1 to H6) established in this resear-ch have corporate governance aspects as a premise, such as key items of tax management in Brazilian companies. Besides, H7 regards tax management within the prece-ding period as reflected on tax management in the sub-
sequent period.Figure 2 shows an overview of the corporate gover-
nance characteristics that were regarded as explanatory variables of the study, relating them to the expected link between proxies and tax management.
It is worth highlighting that, in this research, a com-pany is regarded as efficient in tax management when it
has a lower effective tax rate on earnings. Besides, it is believed that corporate governance characteristics adop-
Antônio Paulo Machado Gomes
R. Cont. Fin. – USP, São Paulo, v. 27, n. 71, p. 149-168, mai./jun./jul./ago. 2016164
ted by companies influence tax management. In face of this, the negative signal expected means that variable is likely to decrease the effective tax rate of the company. On the other hand, the positive signal indicates that the hi-gher this variable is, the higher the effective rate is, i.e., the effective rate increases according to the increase in the variable.
(H2) The specific corporate governance levels on the BM&FBOVESPA (Level 1, Level 2, and New Market) have a significant negative relationship with the proxies to identify tax management ETR, CashETR, and BTD.
(H3) The number of members in the Board of Directors in the preceding year contributes to tax management in firms, so the number of counselors has a significant re-lationship with the proxies to identify tax management ETR, CashETR, and BTD.
(H4) Independent Boards of Directors are more effi-cient concerning fiscal management, as they recommend the executive board to invest resources in such activities, so the number of independent counselors in the preceding
year has a significant negative relationship with the pro-xies to identify tax management ETR, CashETR, and BTD.
(H5) Companies with segregation between Chairman and CEO are more efficient concerning fiscal management, so this dummy has a significant negative relationship with the proxies to identify tax management ETR, CashETR, and BTD.
(H6) Companies that adopt executive board variable remuneration are more efficient concerning fiscal mana-gement, so executive board remuneration has a significant negative relationship with the proxies to identify tax ma-nagement ETR, CashETR, and BTD.
(H7) Tax management within the preceding period is reflected on tax management in the subsequent period, so the dependent variables to identify tax management ETR, CashETR, and BTD lagged one year have a significant re-lationship with the proxies to identify tax management.
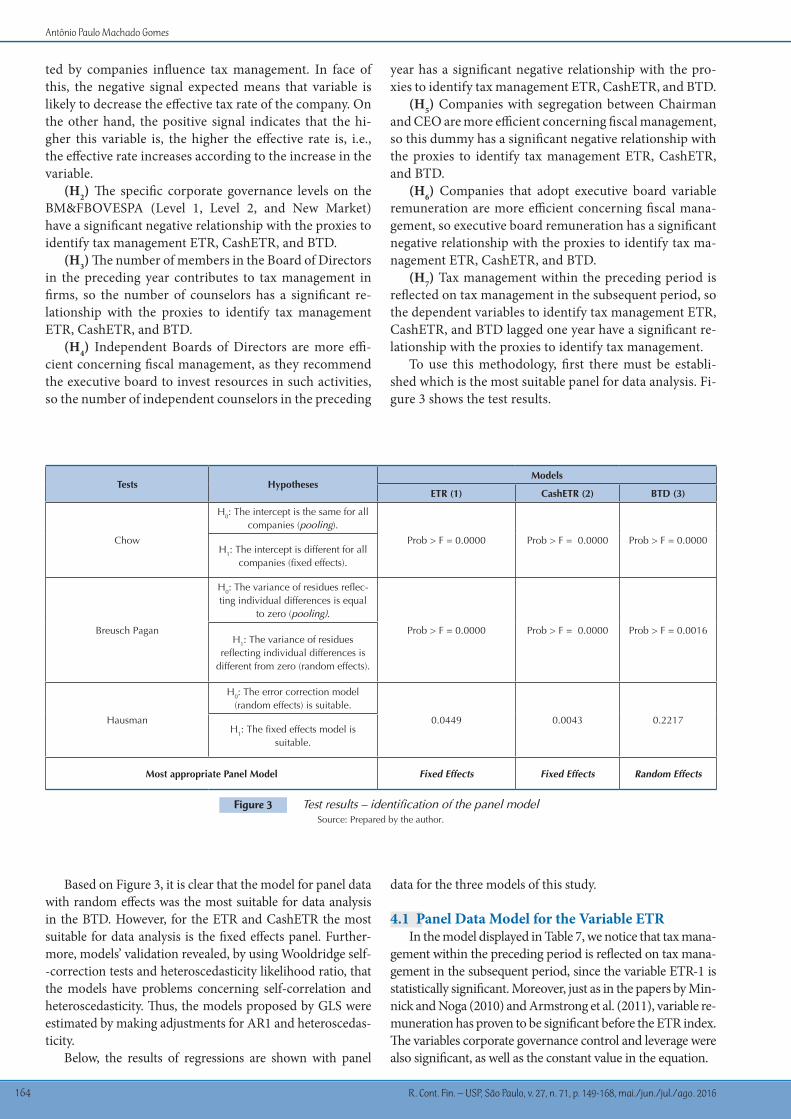
To use this methodology, first there must be establi-shed which is the most suitable panel for data analysis. Fi-gure 3 shows the test results.
Figure 3 Test results – identification of the panel model
Tests HypothesesModels
ETR (1) CashETR (2) BTD (3)
Chow
H0: The intercept is the same for all companies (pooling).
Prob > F = 0.0000 Prob > F = 0.0000 Prob > F = 0.0000H1: The intercept is different for all
companies (fixed effects).
Breusch Pagan
H0: The variance of residues reflec-ting individual differences is equal
to zero (pooling).
Prob > F = 0.0000 Prob > F = 0.0000 Prob > F = 0.0016H1: The variance of residues
reflecting individual differences is different from zero (random effects).
Hausman
H0: The error correction model (random effects) is suitable.
0.0449 0.0043 0.2217H1: The fixed effects model is
suitable.
Most appropriate Panel Model Fixed Effects Fixed Effects Random Effects
Source: Prepared by the author.
Based on Figure 3, it is clear that the model for panel data with random effects was the most suitable for data analysis in the BTD. However, for the ETR and CashETR the most suitable for data analysis is the fixed effects panel. Further-more, models’ validation revealed, by using Wooldridge self--correction tests and heteroscedasticity likelihood ratio, that the models have problems concerning self-correlation and heteroscedasticity. Thus, the models proposed by GLS were estimated by making adjustments for AR1 and heteroscedas-ticity.
Below, the results of regressions are shown with panel
data for the three models of this study.
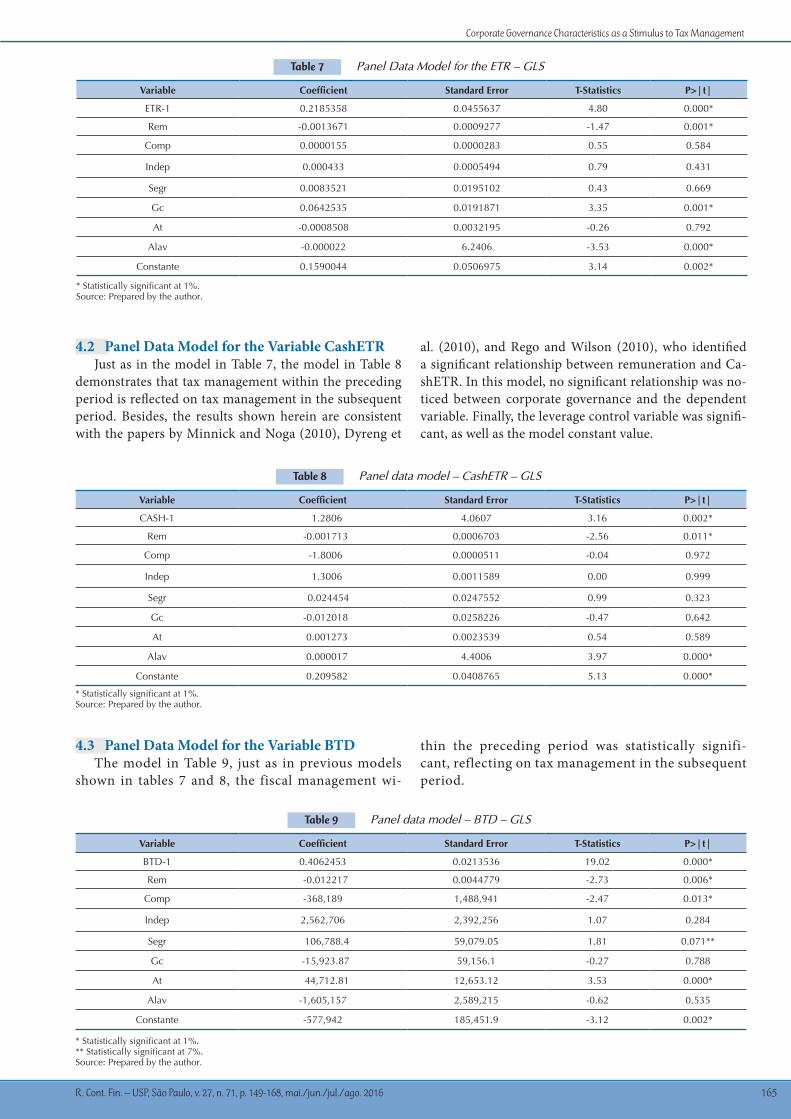
4.1 Panel Data Model for the Variable ETRIn the model displayed in Table 7, we notice that tax mana-
gement within the preceding period is reflected on tax mana-gement in the subsequent period, since the variable ETR-1 is statistically significant. Moreover, just as in the papers by Min-nick and Noga (2010) and Armstrong et al. (2011), variable re-muneration has proven to be significant before the ETR index. The variables corporate governance control and leverage were also significant, as well as the constant value in the equation.
Corporate Governance Characteristics as a Stimulus to Tax Management
R. Cont. Fin. – USP, São Paulo, v. 27, n. 71, p. 149-168, mai./jun./jul./ago. 2016 165
Table 7 Panel Data Model for the ETR – GLS
Variable Coefficient Standard Error T-Statistics P>|t|
ETR-1 0.2185358 0.0455637 4.80 0.000*
Rem -0.0013671 0.0009277 -1.47 0.001*
Comp 0.0000155 0.0000283 0.55 0.584
Indep 0.000433 0.0005494 0.79 0.431
Segr 0.0083521 0.0195102 0.43 0.669
Gc 0.0642535 0.0191871 3.35 0.001*
At -0.0008508 0.0032195 -0.26 0.792
Alav -0.000022 6.2406 -3.53 0.000*
Constante 0.1590044 0.0506975 3.14 0.002*
* Statistically significant at 1%. Source: Prepared by the author.
4.2 Panel Data Model for the Variable CashETRJust as in the model in Table 7, the model in Table 8
demonstrates that tax management within the preceding period is reflected on tax management in the subsequent period. Besides, the results shown herein are consistent with the papers by Minnick and Noga (2010), Dyreng et
al. (2010), and Rego and Wilson (2010), who identified a significant relationship between remuneration and Ca-shETR. In this model, no significant relationship was no-ticed between corporate governance and the dependent variable. Finally, the leverage control variable was signifi-cant, as well as the model constant value.
Table 8 Panel data model – CashETR – GLS
Table 9 Panel data model – BTD – GLS
Variable Coefficient Standard Error T-Statistics P>|t|
CASH-1 1.2806 4.0607 3.16 0.002*
Rem -0.001713 0.0006703 -2.56 0.011*
Comp -1.8006 0.0000511 -0.04 0.972
Indep 1.3006 0.0011589 0.00 0.999
Segr 0.024454 0.0247552 0.99 0.323
Gc -0.012018 0.0258226 -0.47 0.642
At 0.001273 0.0023539 0.54 0.589
Alav 0.000017 4.4006 3.97 0.000*
Constante 0.209582 0.0408765 5.13 0.000*
Variable Coefficient Standard Error T-Statistics P>|t|
BTD-1 0.4062453 0.0213536 19.02 0.000*
Rem -0.012217 0.0044779 -2.73 0.006*
Comp -368,189 1,488,941 -2.47 0.013*
Indep 2,562,706 2,392,256 1.07 0.284
Segr 106,788.4 59,079.05 1.81 0.071**
Gc -15,923.87 59,156.1 -0.27 0.788
At 44,712.81 12,653.12 3.53 0.000*
Alav -1,605,157 2,589,215 -0.62 0.535
Constante -577,942 185,451.9 -3.12 0.002*
* Statistically significant at 1%. Source: Prepared by the author.
* Statistically significant at 1%. ** Statistically significant at 7%. Source: Prepared by the author.
4.3 Panel Data Model for the Variable BTDThe model in Table 9, just as in previous models
shown in tables 7 and 8, the fiscal management wi-
thin the preceding period was statistically signifi-cant, reflecting on tax management in the subsequent period.
Antônio Paulo Machado Gomes
R. Cont. Fin. – USP, São Paulo, v. 27, n. 71, p. 149-168, mai./jun./jul./ago. 2016166
The coefficient of variable remuneration (Rem) was statistically significant at 1%, just as in the other models. Therefore, it may be concluded that remuneration negative-ly influences the tax management detected by means of the variable BTD. This finding is consistent with the papers by Desai and Dharmapala (2006), Minnick and Noga (2010), Dyreng et al. (2010), Rego and Wilson (2010), and Arms-trong et al. (2011), who identified a significant relationship
between remuneration and BTD.Finally, H6 and H7 may be proven by the results, demons-
trating that remuneration and the previous tax manage-ment influence the tax management detected through ETR, CashETR, and BTD, regardless of the fact that the company is classified at specific levels on the BM&FBOVESPA or at the traditional Market, as the control variable (Gc) was sig-nificant only in the model in Table 6.
5 FINAL REMARKS
The main aim of this study was checking whether cor-porate governance characteristics, such as executive board remuneration, segregation between Chairman and CEO, and independence and composition of the Board of Direc-tors influence tax management in Brazilian companies, as well as demonstrating whether previous tax management affects future tax management.
To meet the general objective of this study, first tax management was identified in Brazilian companies by calculating three proxies - ETR, CashETR, and BTD. Two main findings were identified, namely: (i) previous tax management influences tax management in the subse-quent period; and (ii) remuneration may be regarded as a characteristic that influences tax management, just as in the papers by Desai and Dharmapala (2006), Minnick and Noga (2010), Dyreng et al. (2010), Rego and Wilson (2010), and Armstrong et al. (2011).
Also, the variable composition of the Board of Direc-tors was significant only in the model analyzing the BTD. The control variable corporate governance was reflected only on the equation to analyze the ETR, and the control variable total assets was significant only in the equation to the BTD. The control variables leverage and constant value were significant in the models for CashETR and BTD, and for the ETR only constant value was significant.
Thus, this research shows that executive board variable remuneration is related to tax management. In this way, it may be concluded that a proper design of variable remu-neration contracts may lead to an effective tax manage-ment, with a consequent increase in company performan-ce. Through variable remuneration and tax management, we may align managers’ interests to shareholders’ inte-
rests. Besides, tax management is reflected on fiscal mana-gement in the subsequent periods.
However, both this research and the other studies cited on tax management are not conclusive as for the actual executives’ engagement in tax management, and they also do not make clear whether the documented tax effects are a by-product of investment, funding, or operational deci-sions within the company.
Another result shows that Brazilian companies do not disregard the benefits of tax management, given that the median values of tax management proxies (ETR, CashE-TR, and BTD) are statistically different from the nominal tax rate in Brazil, which was 34%. In the tests applied, it was demonstrated that the median value is statistically lo-wer than the nominal rate.
A limitation of this research refers to the population under analysis, since it was an intentional and non-pro-babilistic sample. In this way, the results of analyses are restricted to the companies under study. Of course, ge-neralizations to another set of companies are not directly feasible.
It is recommended, for further research, to provide in-depth analysis of the strategies adopted by Brazilian companies to reduce taxable earnings in relation to book earnings, as well as to replicate the same study in compa-nies not listed on the stock exchange. Other aspects that deserve to be addressed refer to the relationships between tax management and companies’ financial performance proxies, such as ROA, ROE, and EBITDA, as well as an assessment of the way how the stock market reacts to this management by analyzing market proxies, such as P/L, P/B, and MVA®, among others.
Corporate Governance Characteristics as a Stimulus to Tax Management
R. Cont. Fin. – USP, São Paulo, v. 27, n. 71, p. 149-168, mai./jun./jul./ago. 2016 167
Agrawal, A., & Knoeber, C. (1996). Firm performance and mechanisms to control agency problems between managers and shareholders. Journal of Financial and Quantitative Analysis, 31, 377-397.
Armstrong, C. S., Blouin, J. L., & Larcker, D. F. (2011). The Incentives for Tax Planning Journal of Accounting and Economics, 53(1), 391-411.
Bankman, J. (1999). The new market in corporate tax shelters. Tax Notes, 83, 1775-1794.
Barnhart, S., & Rosenstein, S. (1998). Board composition, managerial ownership and firm performance: an empirical analysis. The Financial Review 33, 1-16.
Baysinger, B., & Butler, H. (1985). Corporate governance and the board of directors: performance effects of changes in board composition. Journal of Law, Economics and Organization, 1, 101-124.
Bhagat, S., & Black, B. (2000). The uncertain relationship between board composition and firm performance. Business Lawyer, 54, 921-963.
Borokovich, K., Parrino, R., & Trapani, T. (1996). Outside directors and CEO selection. Journal of Financial and Quantitative Analysis, 31, 337-355.
Boyd, B. K. (1994). Board control and CEO compensation. Strategic Management Journal, 15(5), 335-344.
Brown, W. O., & Maloney, M. T. (1999). Exit, voice, and the role of corporate directors: evidence from acquisition performance. Working paper. Retrieved on March 10, 2012, from http://dx.doi.org/10.2139/ssrn.160308
Byrd, J., & Hickman, K. (1992). Do outside directors monitor managers? Evidence from tender offer bids. Journal of Financial Economics, 32, 195-222.
Callihan, D. (1994). Corporate effective tax rates: a synthesis of the literature. Journal of Accounting Literature, 13, 1–43.
Cardoso, R. L., Mário, P. de C., & Aquino, A. C. B. de (2007). Contabilidade gerencial: mensuração, monitoramento e incentivos. São Paulo: Atlas.
Coles, J. L., Daniel, N. D., & Naveen, L. (2008). Boards: Does One Size Fit All? Journal of Financial Economics, 87(2), 329-356.
Comissão de Valores Mobiliários (2002). Recomendações da CVM sobre governança corporativa. Retrieved on December 11, 2008, from http://www.cvm.org.br
Comprix, J., Mills, L. F., & Schmidt, A. P. (2011). Bias in Quarterly Estimates of Annual Effective Tax Rates and Earnings Management. The Journal of the American Taxation Association, 34(1), 31-53.
Core, J., Holthausen, R., & Larcker, D. (1999). Corporate governance, chief executive officer compensation, and firm performance. Journal of Financial Economics, 51, 371-406.
Coughlan, A., & Schmidt, R. (1985). Executive compensation, management turnover, and firm performance. Journal of Accounting and Economics, 7, 43-66.
Desai, M. A., & Dharmapala, D. (2006). Corporate tax avoidance and high-powered incentives. Journal of Financial Economics, 79(1), 145-179.
Desai, M. A., & Dharmapala, D. (2007). Taxation and Corporate Governance: An Economic Approach. Retrieved on July 26, 2011, from http://dx.doi.org/10.2139/ssrn.983563
Dyreng, S., Hanlon, M., & Maydew, E. (2008). Long-run corporate tax avoidance. The Accounting Review, 83, 61-82.
Dyreng, S., Hanlon, M., & Maydew, E. (2010). The Effects of Executives on Corporate Tax Avoidance. Retrieved on January 16, 2012, from http://ssrn.com/abstract=1158060
Eisenberg, T., Sundgren, S., & Wells, M. (1998). Larger board size and decreasing firm value in small firms. Journal of Financial Economics, 48, 35-54.
Fama, E. (1980). Agency problems and the theory of the firm. Journal of Political Economy, 88(2), 288-307.
Fama, E., & Jensen, M. (1983). Separation of ownership and control. Journal of Law and Economics, 26, 301-327.
Formigoni, H., Antunes, M. T. P., & Paulo, E. (2009). Diferença entre Lucro Contábil e Lucro Tributável: Uma Análise sobre o Gerenciamento de Resultados Contábeis e Gerenciamento Tributário nas Companhias Abertas Brasileiras. Brazilian Business Review, 6(1), 44-61.
Frank, M. M., Lynch, L. & Rego, S. (2009). Tax reporting aggressiveness and its relation to aggressive financial reporting.
The Accounting Review, 84(2), 467-496.Füerst, O., & Kang, S. (2000). Corporate governance, expected
operating performance, and pricing. Work in Progress, v.2.2, Yale School of Management, New Haven, CT. Retrieved on July 22, 2011, from http://ssrn.com/abstract=141357
Goncharov, I., & Zimmermann, J. (2005). Earnings Management when Incentives Compete: The Role of Tax Accounting in Russia. Retrieved on December 29, 2010, from http://ssrn.com/abstract=622640
Graham, J. R. (2003). Taxes and Corporate Finance: A Review. Review of Financial Studies (Forthcoming). Recuperado em 26 julho, 2011, de http://ssrn.com/abstract=358580
Graham, J., & Tucker, A. (2006). Tax shelters and corporate debt policy. Journal of Financial Economics, 81(3), 563-594.
Gupta, S., & Mills, L. F. (2002). Corporate Multistate Tax Planning: Benefits of Multiple Jurisdictions. Journal of Accounting and Economics 33(1), 117-139.
Gupta, S., & Newberry, K. (1997). Determinants of the variability in corporate effective tax rates: Evidence from logitudinal data. Journal of Accounting and Public Policy, 16, 1-34.
Hallock, K. F. (1997). Reciprocally interlocking boards of directors and executive compensation. Journal of Financial and Quantitative Analysis, 32(3), 331-344.
Hanlon, M. (2005). The Persistence and Pricing of Earnings, Accruals and Cash Flows When Firms Have Large Book-Tax Differences. The Accounting Review, 80(1), 137-166.
Hanlon, M., & Slemrod, J. (2007). What does tax aggressiveness signal? Evidence from stock price reactions to news about tax aggressiveness. Working paper, University of Michigan. Retrieved on August 14, 2011, from http://ssrn.com/abstract=975252
Hermalin, B., & Weisbach, M. (1991). The effects of board composition and direct incentives on firm performance. Financial Management, 20, 101-112.
Instituto Brasileiro de Governança Corporativa (2011). Código das melhores práticas de governança corporativa. Retrieved on May 11, 2011, from http://www.ibgc.org.br.
Jensen, M. C. (1993). The modern industrial revolution, exit, and the failure of internal control systems. Journal of Finance, 48(3), 831-880.
Jensen, M. C. (2001). Value Maximisation, Stakeholder Theory and the Corporate Objective Function. European Financial Management, 7(3), 297-317
Jensen, M. C., & Meckling, W. (1976). Theory of the firm: managerial behavior, agency costs and ownership structure. Journal of Financial Economics, 3(4), 305-360.
Jensen, M. C., & Meckling, W. H. (2008). Teoria da Firma: Comportamento dos Administradores, Custos de Agência e Estrutura de Propriedade. RAE - Revista de Administração de Empresas, 48(2).
Jensen, M. C., & Murphy, K. (1990). Performance pay and top management incentives. Journal of Political Economy, 98, 225-264.
Johnson, J., Daily, C., & e Ellstrand, A. (1996). Boards of directors: a review and research agenda. Journal of Management, 22, 409–438.
La Porta, R., & Vishny, R. (2000) Agency problems and dividend policies around the world. Journal of Finance, 55(1), 1-33.
Lambert, R. A., Larcker, D. F., & Verrecchia, R. E. (1991). Portfolio consideration in the valuation of executive compensation. Journal of Accounting Research, 29(1), 129-149.
MacAvoy, P. W., Cantor, S., Dana, J., & Peck, S. (1983). Proposals for increased control of the corporation by the board of directors: An economic analysis. In Business Roundtable (Eds.) Statement of the business roundtable on the American Law Institute’s proposed principles of corporate governance and structure: Restatement and recommendations (pp. C1-C49). New York: Business Roundtable.
Machado, A. P. (2011, setembro). A verdadeira alíquota dos tributos incidentes sobre os lucros das empresas brasileiras. Anais do Encontro Nacional da Associação Nacional de Pós-Graduação e Pesquisa em Administração, Rio de Janeiro, RJ, Brasil, 35.
Mattar, F. N. (1999). Pesquisa de marketing (5a ed.) São Paulo: Atlas.McGill, G. A. & Outslay, E. (2004). Lost in Translation: Detecting Tax
Shelter Activity in Financial Statements. National Tax Journal, 57(3), 739.
McIntyre, R. S. & Nguyen, T. D. C. (2000). Corporate income taxes in the 1990s. Washington, DC: Institute on Taxation and Economic Policy.
Mills, L., Erickson, M. M., & Maydew, E. L. (1998). Investments in Tax
References
Antônio Paulo Machado Gomes
R. Cont. Fin. – USP, São Paulo, v. 27, n. 71, p. 149-168, mai./jun./jul./ago. 2016168
Correspondence Address: Antônio Paulo Machado GomesDepartamento de Ciências Contábeis, IbmecRua Rio Grande do Norte, 300 – CEP: 30130-130Funcionários – Belo Horizonte – MGEmail: [email protected]
Planning. The Journal of the American Taxation Association, 20(1), 1-20.
Mills, L. e Newberry, K. (2001). The Influence of Tax and Non-Tax Costs on Book-Tax Reporting Differences: Public and Private Firms. Journal of the American Taxation Association, 23(1), 1-19.
Minnick, K., & Noga, T. (2010). Do corporate governance characteristics influence tax management? Journal of Corporate Finance, 16(5), 703-718.
Mônaco, D. C. (2000). Estudo da Composição dos Conselhos de Administração e Instrumentos de Controle das Sociedades por Ações no Brasil. Dissertação de mestrado, Faculdade de Economia, Administração e Contabilidade, Universidade de São Paulo, São Paulo, SP, Brasil.
Monks, R.A.G., & Minow, N. (1995). Corporate governance. Cambridge, MA: Blackwell Business.
Petroni, K. R., & Shackelford, D. A. (1999). Managing Annual Accounting Reports to Avoid State Taxes: An Analysis of Property-Casualty Insurers. The Accounting Review, 74(3), 371-393.
Pfeffer, J., & Salancik, G.R. (1978). The external control of organizations: A resource dependence perspective. New York: Harper & Row.
Phillips, J. D. (2003). Corporate Tax-Planning Effectiveness: The Role of Compensation-Based Incentives. The Accounting Review, 78(3), 847-874.
Plesko, G. A. (2004). Corporate Tax Avoidance and the Properties of Corporate Earnings. National Tax Journal, 57(3), 729-737.
Rego, S. O. (2003). Tax-Avoidance Activities of U.S. Multinational Corporations. Contemporary Accounting Research, 20(4): 805- 833
Rego, S. O., & Wilson, R. (2010). Executive compensation, tax reporting aggressiveness, and future firm performance. Working Paper, University of Iowa. Retrieved on August 21, 2011, from https://tippie.uiowa.edu/accounting/mcgladrey/pdf/rego_wilson.pdf
Robinson, J.R., Sikes, S.A., & Weaver, C.D. (2010). The impact of evaluating the tax function as a profit center on effective tax rates. The Accounting Review, 85(3), 1035-1064.
Rosenstein, S., & Wyatt, J. (1990). Outside directors, board independence, and shareholder wealth. Journal of Financial Economics, 26(2), 175-191.
Salomon, D.V. (1973). Como fazer uma monografia. Belo Horizonte: Interlivros.
Scholes, M., & Wolfson, M. (1992). Taxes and business strategy: a planning approach. Englewood Cliffs, NJ: Prentice Hall.
Shackelford, D. A., & Shevlin, T. J. (2000). Empirical Tax Research In Accounting. JAE Rochester Conference, April. Retrieved on January
16, 2012, from http://ssrn.com/abstract=235796. Shevlin, T. J. (2002). Commentary: Corporate Tax Shelters and Book-
Tax Differences. Tax Law Review, 55, 427-443.Shleifer, A., & Vishny, R. (1997). A survey of corporate governance.
Journal of Finance, 52(2), 737-783.Silveira, A. M. (2002). Governança corporativa, desempenho e valor
da empresa no Brasil. Dissertação de Mestrado, Faculdade de Economia, Administração e Contabilidade, Universidade de São Paulo, São Paulo, SP, Brasil.
Silveira, A. M. (2004). Governança Corporativa e Estruturas de Propriedade: Determinantes e Relação com o Desempenho de Empresas no Brasil. Tese de Doutorado, Faculdade de Economia, Administração e Contabilidade, Universidade de São Paulo, São Paulo, SP, Brasil.
Silveira, A. M., Barros, L. A., Famá, R. (2003). Estrutura de governança e desempenho financeiro nas companhias abertas brasileiras - um estudo empírico. Caderno de Pesquisas em Administração da USP, 10(1), 57-71.
Stickney, C., & McGee, V. (1982). Effective corporate tax rates: The effect of size, capital intensity, leverage, and other factors. Journal of Accounting and Public Policy, 1, 125-152.
Tang, T. Y. H. (2005). Book-Tax Differences, a Proxy for Earnings Management and Tax Management - Empirical Evidence from China. Retrieved on July 26, 2011, from http://ssrn.com/abstract=872389
Tang, T., & Firth, M. (2010). Can Book-Tax Differences Capture Earnings Management and Tax Management? Empirical Evidence from China. The International Journal of Accounting, 46(2), 175-204
Wagner, J., Stimpert, L., & Fubara, E. (1998). Board composition and organizational performance: two studies of insider/outsider effects. Journal of Management Studies, 35, 655-677.
Watts, R., & Zimmermann, J. (1986). Positive Accounting Theory. New Jersey: Prentice-Hall.
Weisbach, M. (1988). Outside directors and CEO turnover. Journal of Financial Economics, 20(1-2), 431-460.
Wilson, R. J. (2009). An examination of corporate tax shelter participants. The Accounting Review, 84(3), 969–999.
Yermack, D. (1996). Higher market valuation of companies with a small board of directors. Journal of Financial Economics, 40(2), 185-202.
Yin, G. (2003). How much do large public corporations pay? Estimating the effective tax rates of the S&P 500. Virginia Law Review, 89, 1793-1856.