Embed Size (px)
Citation preview

Correlation Between Petrography, NAA, and ICP Analyses: Application to Early Bronze Egyptian Pottery from Canaan
Naomi Porat*, Joseph Yellin**, Lisa Heller-Kallai" *Institute of Earth Sciences, **Institute of Archaeology, The Hebrew University, Jerusalem, Israel
Ludwik Halicz Geological Survey of Israel, 30 Malkhei Israel St., Jerusalem, Israel
Under favorable circumstances petrographic studies supported by chemical analysis using inductively coupled plasma (ICP) suffice to establish the provenience of pottery. A case in point is Egyptian-style pottery of Early Bronze Age found in Canaan. The pottery was divided into three groups according to four criteria determined by thin section analysis supplemented by X-ray diffraction: sorting and volume of silt-sized quartz, heavy minerals, the amount of carbonates in the matrix, and the firing temperature. Chemical analyses confirmed the classification. The source materials inferred for the three groups are Nile muds, Egyptian marly sediments, and local loess. Although the chemical analy- ses obtained by ICP and neutron activation analysis ( N U ) were compatible, the existing database for NAA cannot be used indiscriminately. However, for provenience studies based on mineralogical and petrographic data, knowledge of the geology of the potential source areas can replace a n extensive database.
INTRODUCTION The provenience of pottery from archaeological sites is one of the most im-
portant problems in archaeological research. The archaeologist classifies pot- tery according to morphology and decorative style and turns to the scientist for assistance in pinpointing the area of origin. The scientific method favored in recent years is multi-element chemical analysis. In this method the concentra- tions of a large number of chemical elements are accurately determined and compared with analyses of material of known provenience accumulated in an ever-increasing database. The analyses are treated as fingerprints and the approach is primarily statistical. The requirements for success are accurate analyses and the availability of a suitable database of reference material for comparison. Most of the multi-element quantitative determinations have been carried out by neutron activation analysis (NAA). This superseded optical emission spectroscopy, which was only semiquantitative. An alternative spec- troscopic method capable of accurate multi-element analysis uses an induc-
Geoarchaeology: An International Journal, Vol. 6, No. 2, 133-149 (1991) 0 1991 by John Wiley & Sons, Inc. CCC 0883-6353/91/020133-17$04.00
PETROGRAPHIC, NAA, AND ICP ANALYSES: EARLY BRONZE POTTERY
tively coupled plasma (ICP) source. This method was applied to the solution of an archaeological problem by Hart and Adams (1983) and Hart et al. (1987). The advantage of ICP analysis, compared with NAA, is that it is much more commonly available and that reasonably small samples (500 mg or less) can be rapidly analyzed at relatively low cost. A possible objection to the use of ICP instead of, or in addition to, NAA is that the available database, with an estimated 40-50,000 entries in 1982 and a yearly production running into the thousands (Harbottle, 1982) rests entirely on NAA. The sensitivity of ICP and NAA for different elements is not identical; the existing database is biased in favor of those elements which are most accurately determined by NAA. Before the results of ICP analyses can be used interchangeably with those obtained by NAA, the methods must be standardized relative to each other.
In the past, before instruments for accurate methods of multi-element chemi- cal analysis were developed, provenience studies were often based on the miner- alogy and petrology of sherds, used in conjunction with the archaeological data (Shepard, 1965). Recently, petrographic studies of thin sections have found limited application in correlation with NAA (Goldberg et al., 1986; Hughes and Vince, 1986), but it seems that the potential of this cheap, old-fashioned method has been largely neglected. Schubert (1986) advocates the use of quantitative petrographic (“modal”) analysis as a complement to chemical analysis in the study of ceramic coarse ware. However, modal analysis is laborious and is therefore not likely to curry much favor. Unlike NAA, petrographic analysis cannot aspire to pinpointing the exact site from which the raw material was taken, but in favorable instances it can establish the geological area of origin. The method is rapid and does not require an elaborate database. It is particu- larly suitable if the archaeological problem poses well-defined alternatives and if the sherds have not been fired at very high temperatures, which obliterate the primary mineralogical features.
En Besor and Tel Erani A case in point is presented by various items of Egyptian-style pottery of
Early Bronze age from an Egyptian house in En Besor and from excavations in Tel Erani.
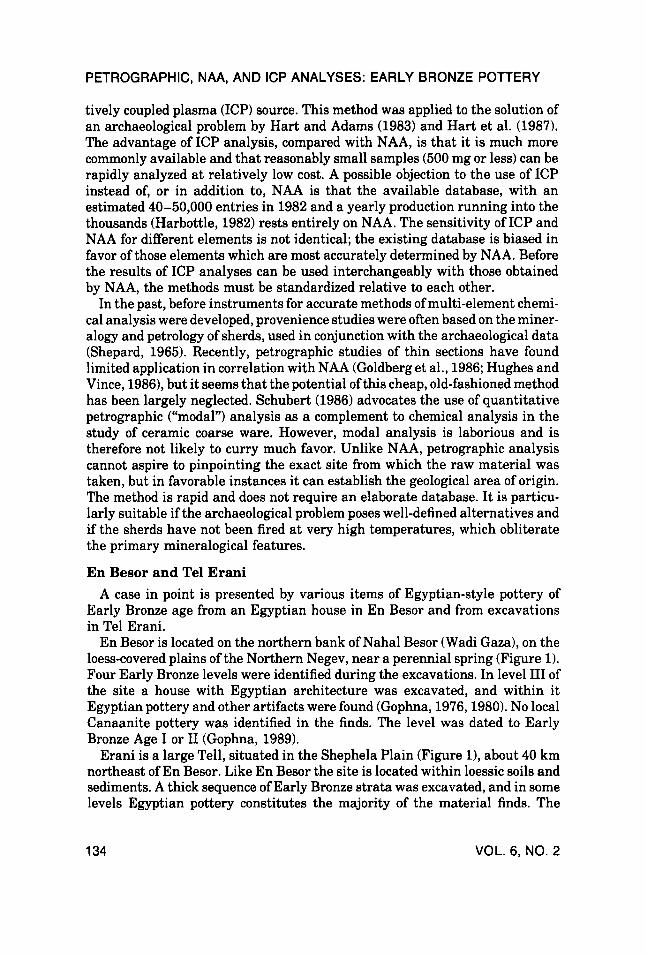
En Besor is located on the northern bank of Nahal Besor (Wadi Gaza), on the loess-covered plains of the Northern Negev, near a perennial spring (Figure 1). Four Early Bronze levels were identified during the excavations. In level I11 of the site a house with Egyptian architecture was excavated, and within it Egyptian pottery and other artifacts were found (Gophna, 1976,1980). No local Canaanite pottery was identified in the finds. The level was dated to Early Bronze Age I or I1 (Gaphna, 1989).
Erani is a large Tell, situated in the Shephela Plain (Figure l), about 40 km northeast of En Besor. Like En Besor the site is located within loessic soils and sediments. A thick sequence of Early Bronze strata was excavated, and in some levels Egyptian pottery constitutes the majority of the material finds. The
134 VOL. 6, NO. 2

PETROGRAPHIC, NAA, AND ICP ANALYSES: EARLY BRONZE POTTERY
3 4 O 35O I I
- 0 10 20 30 - KM
JEUSALEMO MEDITERRANEAN
ATEL ERANI
.BEER SHEVA
I I I
Figure 1. Location map of Canaanite sites sampled.
32"
31'
strata with Egyptian artifacts were dated to Early Bronze Age I and I1 (Brandl, 1989).
The question arises whether the pottery was produced in Egypt and imported, or whether it was made locally with Canaanite or Egyptian know-how. In other terms the question reads: were these artifacts made of Nile alluvium or other raw material of Egyptian origin that was used in antiquity, or were they produced from local material? The exact locality from which the raw material was taken is of secondary importance, although it is of interest to establish whether material from the same site was used in En Besor and in Erani.
In this study petrography, ICP, and NAA were used. It will be shown that petrographic analysis alone distinguishes between the possible source areas. Chemical analysis served to validate the results, and may ultimately pinpoint the actual place where the ceramics were made.
Samples of pottery from Erani were analyzed by both ICP and NAA for direct comparison of the results obtained by these methods. The literature contains many NA analyses of Nile ware and sediments, carried out in different labora- tories. To establish whether the data obtained by ICP analysis are compatible with them, Egyptian jars from Erani and En Besor, that were petrographically identified as Egyptian Nile ware, were analyzed by ICP.
SAMPLING AND METHODS Forty-one Egyptian vessels and one brick from level I11 at En Besor were
chosen for thin sectioning. Drawings of representative vessels can be found in Gophna (1980). As no typical Canaanite pottery was available for comparison from this level, samples were taken from the levels above and below level 111.
GEOARCHAEOLOGY: AN INTERNATIONAL JOURNAL 135

PETROGRAPHIC, NAA, AND ICP ANALYSES: EARLY BRONZE POTTERY
Sixty-eight Egyptian vessels and one brick were chosen from various levels a t Erani. Thirty-three Canaanite vessels were sampled for reference from the same levels. Representative drawings are found in Brand1 (1989). Sediment samples were collected from Nahal Besor, near or at En Besor, and from the Netivot loess type section (Bruins, 1976). The types of vessels from each site and descriptions of the sediments are given in Porat (1989).
After examination of the thin sections a small, representative number of sherds from each site was chosen for chemical analyses. Thirteen samples from Erani were submitted to both NAA and ICP, while the remaining pottery samples, the sediments, and the bricks were analyzed by ICP only.
Thin Section Analysis Thin sections were examined under the polarizing microscope, using stan-
dard petrographic techniques. The major nonplastic sand- and silt-size particles were identified, the size of the mineral grains was measured, and their volume in the matrix, their shape, and sorting were determined with the aid of charts (Bullock, 1985).
The firing temperature was estimated from the mineralogical changes that took place during firing. The most important change is the decomposition of calcite and the reaction of the products with the clay minerals, which occurs between 750 and 850°C, and causes vitrification of the matrix. Another visible change is the oxidation of green hornblende to deep red oxyhornblende, which occurs a t 800-850°C.
Chemical Analyses A small chip from each sample, weighing 1000 mg or more, was thoroughly
cleansed by removing = 1 mm from all surfaces and sonicated in distilled water. The chip was crushed to powder in an agate mortar. Five hundred mg were weighed for analysis by ICP, and 90 mg of the same batch for NAA. The procedures used are given by Beith et al. (1988) and Perlman and Asaro (19691, respectively.
X-Ray Diffraction Analysis (XRD)
and supplement the mineralogical data obtained by petrographic analyses. XRD traces of powdered specimens of selected samples were recorded to verify
PETROGRAPHIC ANALYSES
Results The following petrographic criteria were found to be the most effective for
classifying the Egyptian pottery: a) The sorting and volume of the silt-size quartz; b) the heavy minerals associated with the quartz; c) the amount of
136 VOL. 6, NO. 2

PETROGRAPHIC, NAA, AND ICP ANALYSES: EARLY BRONZE POTTERY
carbonate matter in the matrix; and d) the firing temperature. Using these criteria the samples can be divided into three groups (Table I):
Group I. The first group comprises storage jars of various shapes. This pottery is petrographically typified by poorly sorted, rounded, sand-size quartz grains that often grade into the quartz of the matrix. Abundant feldspars and heavy minerals, most commonly clinopyroxene, hornblende, mica, and epidote are associated with the quartz. Straw molds are often present. The matrix is rich in mica laths and poorly sorted silt-size quartz; phytoliths are common. The volume of the quartz in the sherds varies from 5 to 7%, with most of it in the silt fraction. The firing temperature of this group was higher than 800"C, as indicated by the presence of oxyhornblende.
Group 11. The second group includes both cylindrical and drop-shaped jars. The sherds contain rounded, sand-size quartz, accompanied by decomposed limestone temper. The matrix is very calcareous, with silty quartz, rare mica laths, and iron-filled foraminifers. The prominent feature of this group is the high firing temperature, in the range of 85O-95O0C, as indicated by the com- pletely decomposed limestone and the highly vitrified, milky matrix. The sand- and silt-size quartz grains and the mica laths are texturally similar to compo- nents of Group I.
Group 111. The third group includes all the open vessels used for preparing and serving food, and a few jars. Because some differences were found between sherds from En Besor and Erani, these will be described separately.
En Besor: The samples are typically rich (7-10% volume) in angular, well sorted, coarse silt- to fine sand-size (0.08-0.05 mm) quartz grains (Figure 2). The quartz is often coated with clay. The accessories are feldspars and heavy minerals such as hornblende, epidote, zircon, and muscovite. Some silt-size rounded carbonate fragments occur, which are perhaps poorly preserved fora- minifers. The carbonate also appears as finely dispersed particles that can be detected only on high magnification. In some samples the fine carbonate parti- cles had reacted with the surrounding clay and the matrix was vitrified, indicat- ing that the firing temperature exceeded 800-850°C. Most samples contain occasional sand-size quartz, limestone, grains of calcite or land-snail fragments, none of which were probably added intentionally, but formed a n integral part of the sediment. Straw molds are frequently visible.
The most conspicuous feature in thin section are rounded, sand-size mud balls (Figure 3). They are made of a relatively pure clay; no silt-size quartz or carbonate grains can be seen. The mud is loosely packed, often lacking the preferred optical orientation of clay minerals. These components may have originated during the preparatory processes of the sediments, when thin crusts of the fine clayey fraction formed, dried, and cracked, reminiscent of crusts in dried rain puddles in loessy sediments.
Eruni: The matrix of the pottery is similar to that of the samples from En Besor. It is densely filled (10-15%) with well sorted, silt to fine sand-size (0.06-0.04 mm) quartz, with heavy mineral assemblages dominated by horn-
GEOARCHAEOLOGY: AN INTERNATIONAL JOURNAL 137

Table
I. Pe
trog
raph
ic c
rite
ria,
num
ber o
f ves
sels
, ves
sel t
ypes
, and
source m
ater
ials
of p
otte
ry g
roup
s. C
PX =
clin
opyr
oxen
e, H
BD
= h
ornb
lend
e,
BIO
T =
bio
tite,
EPD
= e
pido
te, Z
RC =
zirc
on, M
USC
= m
usco
vite
. So
rtin
g V
olum
e H
eavy
C
arbo
nate
Fi
ring
N
o. o
f Ves
sels
V
esse
l Typ
e source o
f of
Sil
ty
I
Min
eral
s in
Mat
rix
Tem
p., "
C En
Bes
or
Era
ni
Raw
Mat
eria
ls
Q-
Gro
up I
Poor
5-7
CPX
,HB
D,
Abs
ent
>a50
6 15
Sto
rage
jars
N
ile m
uds
Gro
up 11
-
<5
CPX
,HB
D,
Abu
ndan
t >900
6 7
Cyl
indr
ical
and
E
gypt
ian
mar
ls
Gro
upII
I G
ood
10-15
HB
D,E
PD,
Com
mon
80
0-90
0 27
46
C
ooki
ngan
d Lo
essy
sed
imen
ts
BIO
T, E
PD
BIOT, E
PD
glob
ular
jars
ZRC
, MU
SC
eati
ng v
esse
ls
D
Z 0 F 2 P
< 0
r
Q) z P
m
R 0
Z
N
m
-0 + z < s m

PETROGRAPHIC, NAA, AND ICP ANALYSES: EARLY BRONZE POTTERY
Figure 2. Microphotograph of well-sorted silty quartz in Group I11 pottery from Erani (width of field = 3.5 mm).
Figure 3. Microphotograph of mudballs in Group 111 pottery from En Besor (width of field = 3.5 mm).
GEOARCHAEOLOGY: AN INTERNATIONAL JOURNAL 139

PETROGRAPHIC, NAA, AND ICP ANALYSES: EARLY BRONZE POTTERY
blende, epidote, zircon, and mica. Unlike En Besor, silt-size micritic carbonate nodules are abundant and phytoliths occur. The sand-size components are mostly rounded grains of micritic limestone, with occasional quartz and straw remains. No mud balls were found.
The firing temperature of most samples of group I11 from both sites was above 80O-85O0C, as demonstrated by the presence of oxyhornblende in thin sections. XRD analyses showed that some samples contain gehlenite, diopside, and anorthite, indicative of firing temperatures in the range of 900-950°C.
The bricks: The fabric of the bricks from both sites is very coarse. They contain abundant quartz of fine sand- to silt-size and carbonate grains which are present in smaller amounts; no mud balls occur. The apparent porosity is high and straw molds can be seen. Coarser material was used than that em- ployed in the manufacture of the pottery, which was probably levigated in the course of preparation.
INTERPRETATION The petrographic criteria adopted for classifying the pottery distinguish
unequivocally between artifacts made of Nile muds and of loessy sediments (Table I).
Sorting and Abundance of Silt-Size Quartz Because loess is eolian the silty quartz in these sediments is well sorted and
tends to fall in the coarse silt to very fine sand range (0.08-0.05 mm). It constitutes up to 30% of the volume of the sediment. The silty quartz in the Nile sediments is less abundant, poorly sorted, and finer grain sizes are encountered.
Heavy Minerals Content The dominant non-opaque heavy minerals in loess are hornblende, epidote,
and zircon, with minor amounts of muscovite mica (Ginzburg, 1967). Pyroxene is a common component of the heavy mineral assemblage in the Nile silts (Shukri, 19561, but it is rare in loess. Biotite mica, in addition, is much more abundant in the Nile silts than in loess.
Carbonate Abundance in the Matrix Loess contains a carbonate fraction that can be identified in thin sections at
high magnification. This fraction is either in the same size range as the quartz or is finely dispersed between the clay particles. At high firing temperatures (>850"C) this fraction reacts with the matrix and causes a milky appearance due to vitrification. The silty Nile alluvium does not contain a substantial carbonate component and does not vitrify in this temperature range.
The same petrographic criteria distinguish between Nile and Marly wares. Nile ware is noncalcareous and contains more silt- and sand-size quartz and
140 VOL. 6. NO. 2

PETROGRAPHIC, NAA, AND ICP ANALYSES: EARLY BRONZE POTTERY
mica laths than the Marly ware. The distinction between Marly ware and artifacts made of loess is more problematic, because both raw materials are calcareous. As a result, after firing, when the texture of the carbonate fraction can no longer be discerned, the fabrics may appear similar. Nevertheless, these groups can generally be distinguished because loess contains abundant silt- size quartz and no sand-size heavy minerals, whereas marly clays contain sand- size quartz, but only sparse silty quartz. In addition, sand-size heavy minerals such as epidote, pyroxene, and hornblende are frequently associated with the sand-size quartz.
On the basis of their petrography the following source materials are inferred for the three groups:
Group I jars are made of Nile muds and sands, mixed in different proportions. The petrography resembles the general description in Nordstrom (1972) and the heavy mineral assemblage is like that described by Shukri (1956) for Nile sediments.
Group I1 jars are made of marly clays. The fabric is similar to that described in Nordstrom (1972) for Marly ware imported into Nubia. The texture of the sand and silt-size quartz and the heavy mineral assemblage indicate that this fabric contains a Nile mud component, mixed with marls. It appears that these vessels were made from different weathered marls that crop out on both sides of the Nile valley.
Group I11 and the bricks are made of loessy sediments. The size and sorting of the silty minerals and the angularity of the quartz indicate that the sediment is of eolian origin. The heavy mineral assemblage is typical of loessy sediments in Israel (Ginzburg, 1967). There is little doubt that the artifacts in this group were locally produced from loess. This conclusion is supported by the similarity between the fabric of the pottery and that of the bricks, which were definitely made a t the site.
The small differences in the petrography of samples from En Besor and Erani point to two different source areas for the raw materials within the region of loessy sediments.
The technology used in the manufacture of the vessels of Group I11 resembles that of Egyptian Nile clay pottery rather than that used in the production of the Early Bronze Canaanite pottery (Porat, 1986/87), a silty clay was chosen and not much mineral temper was used. Instead vegetable matter was added to the paste. The firing temperature often exceeded 850"C, which is about 100°C higher than the firing temperature of common Canaanite vessels.
CHEMICAL ANALYSES
Results The results of the chemical analyses obtained by ICP and NA are presented
in Table 11, grouped according to sites and the petrographic properties of the samples. The analytical results were subjected to multivariate cluster and
GEOARCHAEOLOGY: AN INTERNATIONAL JOURNAL 141

D
rn
-I
I)
0
D
I)
D
D
0 z
D z -D
A
Table
11.
Ave
rage
che
mic
al c
ompo
sitio
n of
Egy
ptia
n po
tter
y (N
A a
nd I
CP
anal
yses
) gr
oupe
d ac
cord
ing
to s
ites
and
petr
ogra
phic
gro
ups.
C
once
ntra
tion
s in
ppm
, unl
ess
indi
cate
d w
ith
a %
sig
n. N
= n
umbe
r of
sam
ples
ana
lyze
d in
eac
h gr
oup.
Site
E
rani
E
n B
esor
E
rani
h~
Gro
up I
(N
ile W
are)
G
roup
II (
Mar
ly W
are)
E
n B
esor
M
etho
d N
AA
IC
P IC
P N
AA
IC
P IC
P N
=l
N
=3
N
=5
N
=4
N
=5
N
=3
av
erag
e tU
aver
age
fU
aver
age
2U
aver
age
fU
aver
age
fU
As
6.13
4.
00
0.00
4.
25
1.09
7.
99
0.95
7.
75
2.49
5.
75
1.64
Be
1.90
0.
08
1.98
0.
11
1.74
0.
24
1.70
0.
12
Al%
8.41
0.
16
8.27
0.
22
6.90
0.
42
7.87
0.
39
Ba
357
463
24
604
223
287
86
312
71
368
143
Ca%
4.
40
4.70
0.
98
4.20
0.
65
6.41
1.
33
11.1
2 2.
86
8.29
2.
64
Ce
75.9
72
.3
3.8
71.3
2.
2 74
.27
5.35
75
.0
11.3
78
.8
6.5
Co
29.5
35
.0
10.8
33
.8
4.1
17.6
5 2.
10
16.4
2.
3 28
.8
8.9
D z
U
_-
Cr
CS
cu
Eu
FeJ
Hf
K%
La Lu
Mg4
b M
n N
a%
Nd
_. .
154 1.
75
1.92
6.
49
7.75
125
42.3
1.
100
6.80
4 13
1 14
3.4
0.04
3 0.
09
134.
9 2.
18
1.57
4.
96
10.9
6 1.
34
35.6
5 0.
41
6.3
0.37
0.03
0.
26
0.85
0.
24
1.64
0.
01
98
29.8
4.72
3 3.0
0.33
101
21
29.8
9.
3 1.
050
0.11
2 5.
49
0.90
-
0
D
2.1
43.0
0.
082
1.02
5 D
Z
4
cn
cn F rn
..
0.03
6.
85
1.53
0.39
8 31
.3
43.8
3.
3
0.69
3 0.
228
600
216
40.7
1.14
6 14
30
2.1
39.5
1.04
0 99
13
74
1.8
0.06
6 29
37.7
0.91
1 68
8
3.7
0.37
2 15
7 rn
D
I)
r
<
0.60
37
.65
99.9
0.05
1.
81
24.3
0.89
9 37
.4
128
49.6
26.4
0.
222
6.4
0.08
5 5.
1
68.8
14
.8
35.0
6.
1 0.
174
0.06
0 N
i P%
Pb
Sb
81.7
31.7
0.
262
6.9
90.0
0.
058
0.39
4 8.
5 33
.8
28.9
0.
095
2.2
0.47
5 21
.9
6.51
1.54
8.
38
1.98
0.61
16
.31
6.36
1.62
10
.49
2.47
0.10
0.88
0.28
0.18
1.
11
0.26
sc Si%
0.5
18
23.7
418
2.2
64
25.5
1 .o
466
72
26.9
298
1.0
26.4
19
370
Sm
<
Sr
!- Ti%
0%
Q,
U 1.
048
177 56.7
3.
00
117
0.01
3 1.
056
6.2
181
6.2
52.5
0.
00
3.00
6.
2 12
3
0.04
9
6.5
2.5
0.00
5.
6
0.67
3 0.
051
14.5
5.
4 0.
40
7.8
0.87
6 0.
118
133
26.6
53
.8
2.2
95.0
11
.7
3.00
0.
00
105 29.3
V
zY
o
n
lu
Zn
0.04
3.
29
3.06
2.
80
98.9

D
rn ? % 6 I]
0 I
0
c)
5 D z z
-I
I]
z
0
Z -
rn 5 ? si ? c a z
A
P 0
Tab
le 1
1. C
ontin
ued
Gro
up I1
1 (L
oess
y W
are)
B
rick
L
wss
y Se
dim
ents
Si
te
Era
ni
En
Bes
or
Era
ni
En
Bes
or
Met
hod
NA
A
ICP
ICP
NA
A
ICP
ICP
ICP
N=
8
N =
10
N=
7
N=
l
N=
l
N=
l
N=
7
aver
aae
*U
aver
aee
-CU
aver
aee
*U
aver
ane
5U
Al%
As
Ba
Be
Ca%
C
e co
C
r CS
c
u
Eu
Fe%
H
f K%
La
Lu %?
Na%
N
d N
i P%
Pb
Sb
se
Si%
Sm
Sr
Ta
Th
Ti%
U V Y Yb zn
6.51
61
4 5.04
55
.12
15.7
2 12
3.14
1.
31
1.20
3.
86
14.4
6 2.
38
28.8
5 0.
38
0.78
30
.11
80.0
5
0.52
12
.22
5.07
1.11
9.
05
1.94
2.78
2.47
32
5 1.43
5.
58
2.43
9.
93
0.30
0.11
0.
58
1.57
0.
77
2.20
0.
04
0.15
2.
29
20.5
9
0.12
1.
77
0.42
0.10
0.
61
0.15
0.27
5.16
7.
50
1.37
8.
03
558 55.9
14
.6
79
25.6
3.45
28.9
0.89
8 72
2 37.0
17.9
0.
278
27.4
387 0.
543
85.1
19
.9
96.6
2.
40
0.40
2.
25
0.17
2.
39
7.5
1.8
7 2.9
0.32
346 2.
4
0.23
7 80
4.4
0.13
4 4.
9
3.0
107 0.
048
7.8
2.1
0.49
17
.7
6.93
3.
86
2.32
7.
35
435 67
.3
17.5
11
6 38.2
0.
65
4.89
39.6
1.49
5 79
2 70.8
30.7
0.
288
26.5
486 0.
580
111 33.6
2.
79
103
0.49
1.
09
0.33
1.
29
5.6
1.8
82
18
10.1
0.
20
0.52
3.7
0.20
4 88
15.3
0.
096
3.2
1 .o
38 0.04
2
11.6
7.
3 0.
36
15.3
6.01
44
6 4.24
52
.2
17.6
13
2 1.88
1.17
4.
13
1.81
0.45
9
15.2
30.5
0.79
1 33
.6
80.1
0.59
9 12
.8
5.50
1.04
9.
45
1.77
2.83
5.34
6.
00
1.40
5.
47
378 48.0
14
.5
83
22.5
3.56
29.0
0.78
4 71
3 39.0
0.
1 18
.0
27.8
211 0.
554
90.5
22
.0
76.5
3.
00
3.68
4.
75
2.50
4.
93
0.95
0 1.
20
7.58
9.
96
388
325
45.0
43
.1
12.5
22
.4
88
101
22.5
19
.1
0.05
0.
23
2.38
2.
93
22.0
27
.0
0.81
4 1.
172
498
529
55.0
50
.3
25.0
22
.9
0.1
0.14
4
26.4
25
.0
310
386
0.42
5 0.
477
70.0
92
.1
22.5
26
.9
57.5
69
.3
1.50
1.
86
0.96
2.78
0.33
5.
16
8.0
19.2
44
128 9.
0 0.
22
0.94
5.5
0.24
5 22
0 13.0
0.
124
8.0
7.4
253 0.
120
22.5
8.
1 0.
35
22.3
W
rn
-I
I] 0
c)
I] z % 0 z
D
D z
U
0
W
p - 4 ? F 2 -c v)
v) rn
..
I]
m
I] 0
Z
N
rn B 3 rn
I]
4

PETROGRAPHIC, NAA, AND ICP ANALYSES: EARLY BRONZE POTTERY
2.5
2.0
I .5
I .o 0.5
L O
-0.5
-I .o - I .5
-2.0
M
X
-2.5 1 I I I I I I I -2.5 -I .5 -0.5 0 0.5 15
F1 Figure 4. Principal components F1 vs. F3. Symbols: (0) Group I, (A) Group 11, ( + ) Erani Group 111, (V) En Besor Group 111, ( x sediments, (0) bricks.
factor analyses, performed with NCSS software. Cluster analysis failed to distinguish between Marly ware (Group 11) and En Besor loess ware (Group IIIa). However, Nile ware (Group I) is well defined, and so is most of the Erani loess ware (Group IIIb). The sediment samples vary and cluster either with Erani or En Besor loessy ware.
Factor analysis showed that the principal component (Fl) is dominated by Fe and other transition metals. F2 is determined entirely by Ca and Sr. As these elements vary with the amount of carbonates present, they are not discriminant in very calcareous sediments such as the ones used in the pottery under investigation. F3 is dominated by Mg and Be. Plotting the 1st and 3rd factor (Figure 4) shows the distinct character of the Nile wares. Except for one sample, Erani loess ware is well separated from Marly ware, but partially overlaps En Besor loess ware. The composition of Marly ware from both sites varies more than that of the other groups. Not enough is known about the range of Marly ware composition, and this study only demonstrates their vari- ability. The sediments also vary. This manifests the difficulty in locating exact sources of raw materials used in manufacturing diverse pottery groups.
Comparison of ICP and NAA Sixteen samples of pottery were analyzed by both methods. Thirteen are from
Erani, four are petrographically defined as Marly ware, and nine as loess ware
144 VOL. 6, NO. 2

PETROGRAPHIC, NAA, AND ICP ANALYSES: EARLY BRONZE POTTERY
(Table 111). The other three samples are unrelated to the archaeological question under investigation, but were chosen because NAA showed them to have either very high or low concentrations of some of the elements analyzed, which in- creases the range of the data compared. The elements can be divided into those that correlate well, and those that do not:
La, Ce, Fe, Ba, and As are very well correlated (R2 = 0.98-0.81), and the regression line does not deviate appreciably from the origin. Cr and Co correlate reasonably well (R2 = 0.76-0.701, but the regression line deviates substantially from the origin.
A very poor correlation was found for Ca, Yb, and Ni. These elements are not measured accurately by one or the other of the two methods-Ca and Ni by NAA, and Yb by ICP. Using NAA we are able to measure Ca very accurately from Sc 47 (Yellin et al., 1980). In the present case, however, Ca was determined by direct measurement of Ca 47 and this measurement is not accurate.
Another question that was addressed in this study was whether the results of the ICP analyses are directly comparable with the database found in the literature, which was acquired by NAA. ICP analyses of Nile ware vessels from Erani and En Besor were compared with NAA of Nile ware and Nile sediments published in the literature (Table 111). The concentration ofmost ofthe elements measured by ICP fall within the range of the data from the literature. The elements best matched are the transition metals Fe, Mn, V, and the rare earth elements La and Ce.
The conclusions based on the limited number of analyses in this study are that the results obtained by ICP are compatible with those obtained by NAA, although the number of elements reliably determined to the required degree of accuracy by both methods is relatively small and accurate determination of some elements (e.g., Ca, Ni, Cr, Co, Yb) is problematic by one or the other of the two methods at this range of concentrations.
COMPARISON OF PETROGRAPHIC AND CHEMICAL ANALYSES Rigorous petrographic analysis can distinguish between artifacts produced
from Nile alluvium, Marly Egyptian sediments, and those made from loess. Study of thin sections also shows that different varieties of loess were used for locally made pottery in En Besor and Erani, indicating that each site probably produced its own Egyptian pottery.
The chemical analyses fully support the division proposed on the basis of the petrographic studies. Figure 5 is a ternary plot of Fe, Ca, and Mg which shows both petrographic groups and chemical clusters. The samples of En Besor loess pottery, selected for chemical analysis according to their petrography, form a coherent compositional group that differs somewhat from an equally coherent group of loess pottery samples from Erani. Both groups have a very different composition from the Nile ware.
GEOARCHAEOLOGY: AN INTERNATIONAL JOURNAL 145

A
P
Q)
73
rn
-I
13 0
G)
13
Table III. C
ompa
riso
n be
twee
n re
sult
s ob
tain
ed b
y N
AA
and
ICP.
Con
cent
ratio
ns in
ppm
, unl
ess
indi
cate
d w
ith a
8 si
gn. N
= n
umbe
r of
sam
ples
ana
lyze
d in
eac
h gr
oup.
%
Site
E
rani
Gro
up II
E
rani
Gro
up II
I G
roup
1
Nile
War
e z
(Mar
ly W
are)
(L
oess
y W
are)
(N
ile W
are)
fr
omE
gypt
9
-E Fr
om E
rani
an
d E
n B
esor
D
Met
hod
z 0
N=4
N=9
N=
8
ICP
NA
A
ICP
NA
A
ICP
Ran
ge o
f -
aver
age
+u
Ave
rage
s % F
Cr
97.0
2.
62
135
6.30
79
.5
7.02
12
3 9.
93
129
11
132-
181
!? 7
aver
age
+u
aver
age
?u
aver
age
?u
aver
age
?u
D z
<
As
9.00
1.
41
8.00
0.
959
7.00
2.
11
6.45
2.
33
4 0.
87
0.88
-3.2
B
a 29
9 75
.1
287
85.5
6 61
1 36
8 61
4 32
5 54
1 17
1 49
3-57
0 C
a8
11.9
2.
63
6.41
1.
33
7.78
2.
48
5.04
1.
43
4.4
0.79
2.
5-3.
7 C
e 80
.0
5.96
74
.3
5.35
56
.9
7.98
55
.1
5.58
72
.1
3.02
71
-76
cn c
o
15.5
1.
54
17.6
2.
10
14.9
1.
76
15.7
2.
43
34.4
7.
26
27.5
-35
rn
rn
La
39.1
2.
56
35.7
1.
64
28.8
2.
38
28.9
2.
20
40
1.87
29
-37
13 D
Fe%
4.
67
0.36
0 4.
96
0.26
3 3.
47
0.30
5 3.
86
0.57
7 6.
84
0.07
4.
5-7.
2
Ni
46.8
3.
25
100
24.3
36
.9
4.31
80
.1
20.6
85
.9
21.3
76
-78
CD
Yb
3.00
0.
00
3.06
0.
036
2.38
0.
484
2.78
0.
269
3 0
2.9-
3.6
A18
8.
35
0.18
7.
6-7.
7 Eu
1.08
0.
08
1.6-
2.16
z
N
Me0
1.
08
0.07
1.
5-1.
6 Mn
13
40
166
1100
-129
0 rn
T
i%
1.05
0.
04
0.96
-1.7
0
V 17
9 6.
5 18
0-18
4 -I rn 3
< 2
6 r Q, z P h
3

PETROGRAPHIC, NAA, AND ICP ANALYSES: EARLY BRONZE POTTERY
Fe
Ca
Mg X I 0
Figure 5. Ternary composition diagram. Symbols as in Fig. 3.
CONCLUSIONS The study of Early Bronze Age pottery from En Besor and Tel Erani shows
that some jars were imported from Egypt, but other artifacts, particularly household utensils, were produced locally. En Besor and Tel Erani belong to a series of sites where locally made Egyptian pottery was identified. The sug- gested interpretation is that Egyptian potters produced these vessels for use by Egyptians, implying a permanent Egyptian population living at those sites.
These conclusions were reached by the study of thin sections, supported by ICP analysis of selected samples. In favorable cases the combination of these two procedures offers a rapid and inexpensive method of determining the area of provenience of archaeological artifacts, without recourse to an extensive database. However, the potential of the method is limited: groups of artifacts that were produced from the same raw materials can be identified, but only the general geological whereabouts from which the raw material was derived can be established. It is unlikely that petrographic studies of any number of samples can pinpoint a particular quarry within a given region, e.g., the exact area in the Shephela from which loess was taken. Frequently the information that petrography can provide may satisfy the need of the archaeologist. If not, multi- element chemical analyses and an appropriate database are required, though these too, do not necessarily furnish unequivocal assignments. Tobia and Sayre (1974) found that Nile mud was virtually indistinguishable in composition no matter where along the course of the Nile in Egypt a sample was taken.
GEOARCHAEOLOGY: AN INTERNATIONAL JOURNAL 147

PETROGRAPHIC, NAA, AND ICP ANALYSES: EARLY BRONZE POTTERY
Our data suggests that the results of ICP analyses are compatible with those obtained by NAA, but many more analyses are essential before these methods can be used interchangeably.
Pottery samples were kindly made available by B. Brandl and R. Gophna. This research was supported by the Fund for Basic Research administered by the Israeli Academy of Science and Humanities and by the National Council for Research and Development.
REFERENCES Beith, M., Shirav, M., Halicz, L. and Bogosh, R. (1988). The procedure: Geochemical orientation
survey. Geological Survey of Israel Report GSI/15/88. Brandl, B. (1989). Observations on the Early Bronze Age Strata of Tel Erani, in P. Miroschedji,
ed., L’urbanisation de la Palestine a rage du Bronze Ancien: Bilan etPerspectives des Recherches Actuelles, Actes du Colloque #Emmuus (20-24 Octobre, 1986), pp. 357-387. Oxford: BAR (British Archaelogical Reports).
Bruins, H.J. (1976). The Origin, Nature and Stratigraphy of Paleosols in the Loessial Deposits of the North West Negev (Netivot, Israel). Master’s Thesis, The Hebrew University, Jerusalem.
Bullock, P.N., Federoff, N., Jongerius, A., Stoops, G.J., and Tursina, T., (1985). Handbook for Soil Thin Section Description. Wolverhampton: Waine Research Publishers, 152 pp.
Ginzburg, D. (1967). The Petrography of Loess in Biq’at Be’er Sheva. Master’s Thesis, The Hebrew University, Jerusalem (in Hebrew).
Goldberg, P., Gould, B., Killbrew, A., and Yellin, J. (1986). Comparison of Neutron Activation Analysis and Thin-Section Analysis on Late Bronze Age Ceramics from Deir el-Balah, in J.S. Olin and M.J. Blackman, Eds., Proceedings of the24th International Archaeometry Symposium, pp. 341-351. Washington: Smithsonian Institution Press.
Gophna, R. (1976). Excavations at En Besor. Atiqot (English series) 11, 1-9. Gophna, R. (1980). Excavations at En Besor. Atiqot (English Series) 14, 9-16. Gophna, R. (1989). The Early Bronze I site at En Besor Oasis (in Hebrew), in Eretz Israel, forth-
coming. Harbottle, G. (1982). Provenience Studies Using Neutron Activation Analysis: The Role of Stan-
dardization, in J.S. Olin and M.J. Blackman, Eds., Proceedings of the 24th International Archaeometry Symposium, pp. 67-78. Washington: Smithsonian Institution Press.
Hart, F.A., and Adams, S.J. (1983). The chemical analysis of Romano-British pottery from the Alice Holt forest, Hampshire, by means of I.C.P. Emission Spectroscopy. Archaeornetry 25, 179-185.
Xart, F.A., Storely, J.M.V., Adams, S.J., Symonds, R.P., and Walsh, J.N. (1987). An analytical study, using inductively coupled plasma (ICP) spectrometry, of Samian and colour-coated wares from the Roman town at Colchester together with related Continental Samian wares. Journal of Archaeological Science 14, 577-598.
Hughes, M.J., and Vince, A.G. (1986). Neutron Activation Analysis and Petrology of Hispano- Moresque Pottery, in J.S. Olin and M.J. Blackman, Eds., Proceedings of the 24th International Archaeometry Symposium, pp. 353-367. Washington: Smithsonian Institution Press.
Nordstrom, H.A. (1972). Neolithic and A-Group Sites. Uppsala: Almoqvist & Wiksell, pp. 48-93. Perlman, I., and Asaro, F. (1969). Pottery analysis by neutron activation. Archometry 11,23-52. Porat, N. (1986437). Local industry of Egyptian pottery in Southern Palestine during the Early
Bronze I Period. Bulletin of the Egyptological Seminar, 8, 109-129. Porat, N. (1989). Composition of Pottery-Application to the Study of the Interrelations Between
Canaan and Egypt During the 3rd Millennium B.C. Ph.D. Thesis, The Hebrew University, Jerusalem.
Schubert, P. (1986). Petrographic modal analysis-A necessary complement to chemical analysis of ceramic coarse ware. Archometry 28, 163-178.
148 VOL. 6. NO. 2

PETROGRAPHIC, NAA, AND ICP ANALYSES: EARLY BRONZE POTTERY
Shepard, A. (1965). Ceramics for the Archaeologist. Washington: Carnegy Institute, 413 pp. Shukri, N.M. (1956). Mineral analysis tables of some Nile sediments. Bulletin de L’Znstitut Fuad
I du Desert, 39-67. Tobia, S.K., and Sayre, E.V. (1974). An Analytical Comparison of Various Egyptian Soils, Clays,
Shales, and Some Ancient Pottery by Neutron Activation Analysis, in A. Bishay, Ed., Recent Advances in Science and Technology of Materials, pp. 99-128. New York. Plenum Press.
Yellin, J., Perlman, I., and Taudly, S. (1980). Measurement ofcalcium and titanium from scandium- 47 instrumental neutron activation analysis. Analytica Chimica Acta 121, 327-330.
Received November 8, 1989 Accepted for publication December 10, 1990
GEOARCHAEOLOGY: AN INTERNATIONAL JOURNAL 149


