Embed Size (px)
Citation preview
IIIIIIIIIIIil
IIIIT
n
CORRIDOR STUDYCTTY OF CHARLOTTESVTLLE AND ALBET{ARIE COUNTY
TECHNICAL MEMORANDUMFOR ENVIRONMENTAL IMPACT STATEMENT
TRAFFIC ANDTRANSPORTATION ANALYSIS
6029-0A2-122, PE 1OO
U.S. Depaltment of TransportationFederal Highway Administration
andVirginia Department of Transportation
l
I
I
j
IJ
March 1990
FINAL REPORT
ROUTE 29 CORRIDOR STUDY
TASK 2: TRAFFIC AND TRANSPOBTATION ANALYSIS
tll1
tIIItIIIII,l
IIIIII
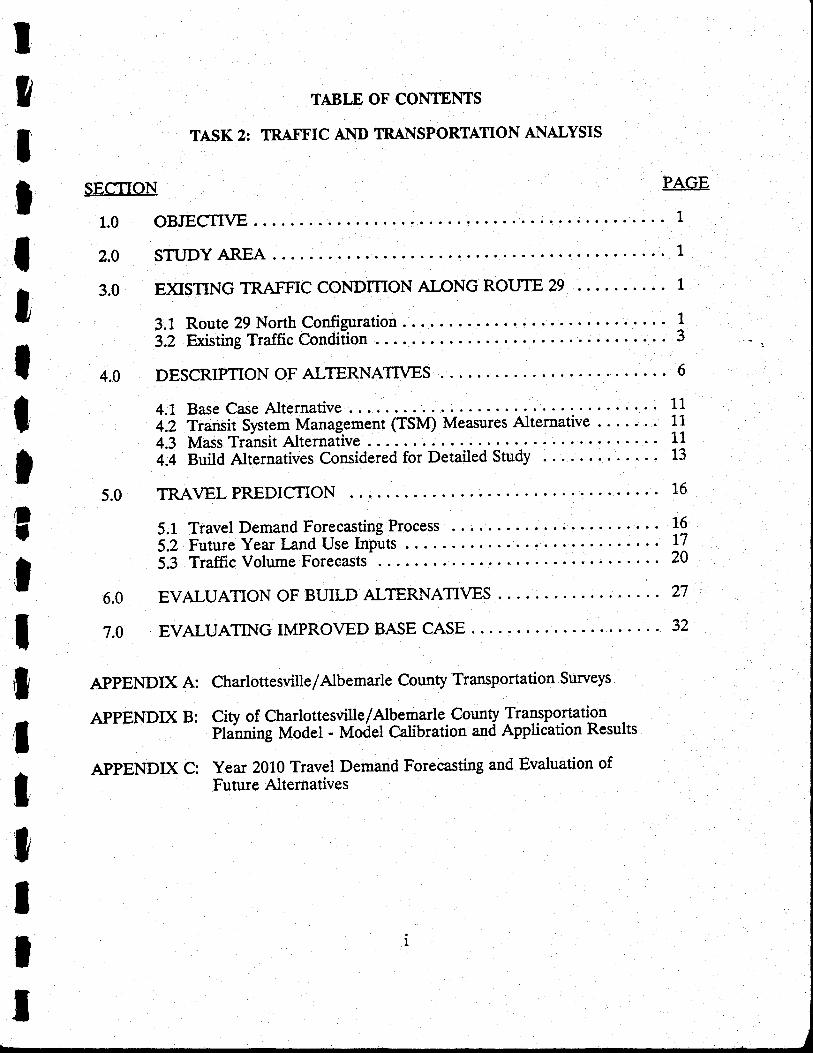
TABLE OF CONTENTS
TASK 2: TRaFFIC Al{D TRAI"ISPORTATION AI{'ALYSIS
SECTION
1.0 OBJECTT\IE
2.0 STUDY AREA
3.0 E)qSTING TRAFFIC CONDMON AI-ONG ROUTE 29
3.1 Route 29 North Configuration .
3.2 Existing Traffic Condition . . .
DESCRIPTION OF ALMRNATTVES
4.1 Base Case Alternative . . .4.2 Transit System Management (TSM) Measures Alternative . . . . . . .
4.3 Mass Transit Alternative . . .
4.4 Build Alternatives Considered for Detailed Study
5.0 TRAVEL PREDICTION
5.1 Travel Demand Forecasting Process : " " " '5.2 Future Year l-and Use Inputs . . .
5.3 Traffrc Volume Forecasts
EVALUATION OF BUILD ALTERNATIVES .
EVALUATING IMPROVED BASE CASE
PAGE
1
1
1
1
J
6
11L11113
16
16172A
27
32
4.0
6.0
7.0
APPENDIX A:
APPENDIX B:
APPENDIX C:
Charlottesvilte/Albemarle County ft ansportstion Sunreys
City of Ch arlottesville/Albemarle. County tra5noStationplanning Model - Model Calibration and Application Results
Year 2010 Travel Demand Forecasting and Evaluation ofFuture Alternatives
T
t1
tItIIIItttlIt,
III
TABI.-E
1
2
3
4
5
6
7
8
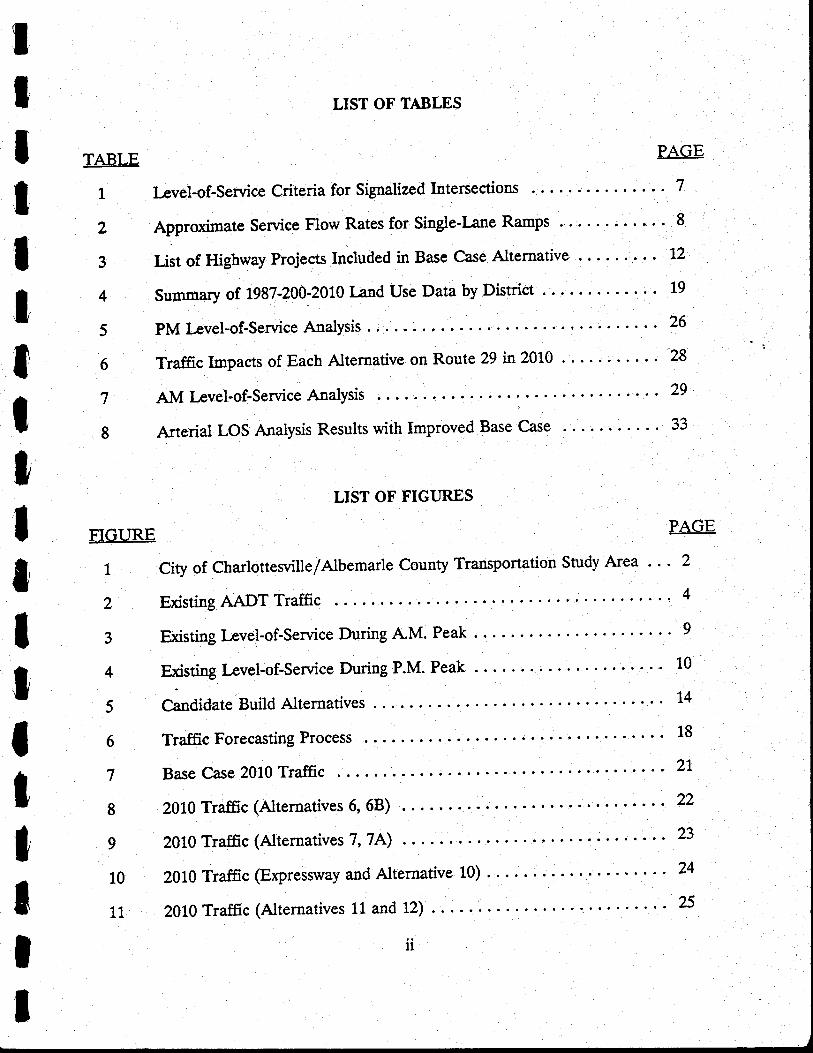
LIST OF TABLES
PAGE
I-evel-of-service criteria for Signalized Intersections
Approximate ServiceFlowRatesfor Single-I-aneRamps ' ' ' ' ' ' ' 8
rojects Included in Base Case Altertrative Lz
Summary of 1987-200-2010 Land Use Data by District 19
PMl-evel-of-ServiceAaalysis..... 26
Traffic Impacts of Each Alternative on Route 29 in 2010 .
AM I-evel-of-Service AnalYsis
Arterial LoS Analysis Results with Improved Base case . . . . . . 33
LIST OF FIGURES
PAGE
CiW of Charlottesville/Albemarle County Transportation Study Alea ' ' ' 2
Existing AADT Traffic 4
Bristing l-evel-of-Service During AM. Peak . : . . '
Existing I-evel-of'Service During P.M. Peak
Candidate Build Alternatives . .
TrafHc Forecasting Process
Base Case 2010 Traffic
2010 Traffic (Alternatives 6' 68)
2010 Traffic (Alternatives 7, 7A)
2010 Traffic (Expressway and Alternative 10)
2010 TrafEc (Alternatives 11 and 12)
ii
28
29
FIGURE
1
2
3
4
5
6
7
8
9
10
11
9
10
14
18
2l
22
23
24
25
T
1
ttItII0
t0
ItIttIIt
ROUTE 29 CORRIDOR STUDY
TASK2:TRAFFICANDTRANSPoRTATIONANALYSIS
1.0 OBJECTTVE
The principal objectives of this task are 1) to establish a clear picture of current
travel conditions witbin the study area, particularly the Route 29 corridor; and 2) to examine
the effect of various build alternatives and one no-build alternative on the movement of
future (2010) uaffic through the Route 29 corridor. In addition, this task provides input to
the air quality, noise assessment and community participation tasks of the project'
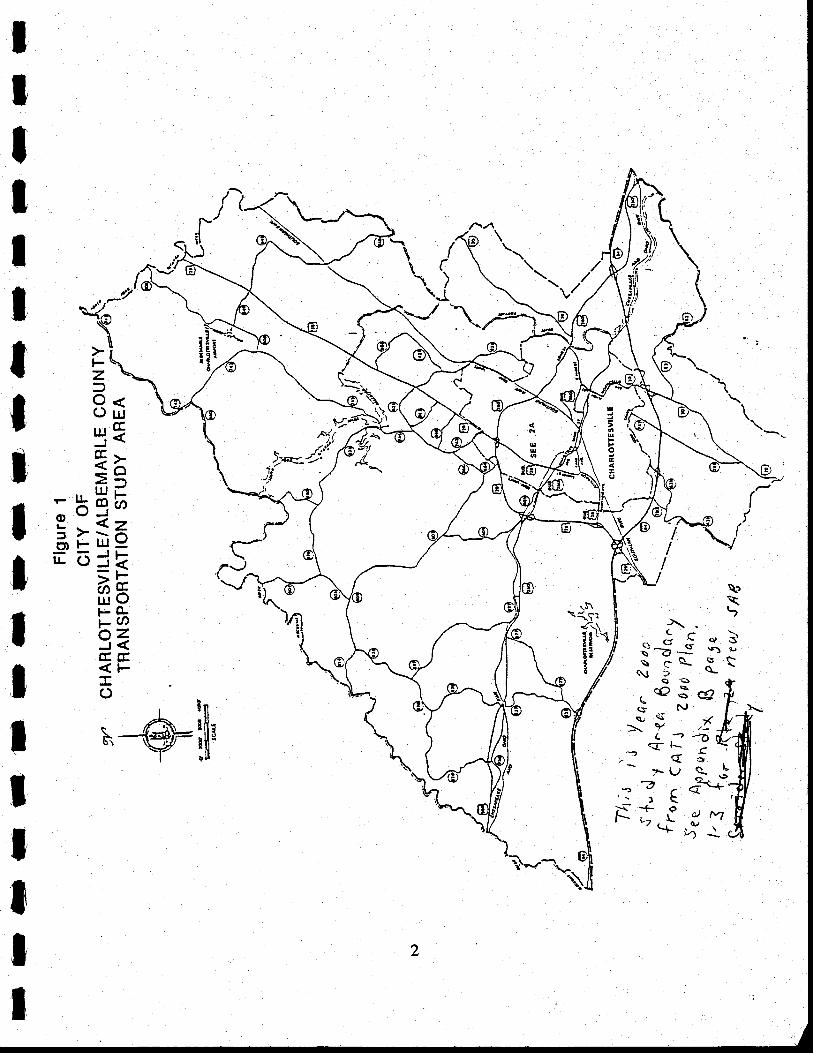
2,0 STUDY AREA
The study area defined for the Route 29 corrido: t*ol llvelors 1. :1o.*
charlottewille and a rarge portion of Arbemarle county as shown in Figure 1. considering
the recent growth trends within the area, the boundary of the 1985 Charlottesville Area
flansportation Srudy (CATS) area was extended to include areas farther south of I-64 and
east of Route 20. The study area is situated at the cross-road of two regional corridors:
u.s. 29, running north-south, and I-64, traversing east-west. The existing (198?) population
and employment of the area arc 83,245 and 43,978, respectivety. A significant share of local
workers live outside the study area in Albemarle county and the neighboring counties.
Almost g5 percent of the area's jobs are concentrated within the City of Charlottesville
(roughly 64Vo) and the area along the Route 29 north (nearly 2lVo)' The University of
Virginia remains the largest employer of the area. Most of the large retail commercial
centers are situated along the Route 29 northlEnmet street corridor. This particular
corridor accommodates nearly 60 percent (g,513 jobs) of the existing retail employment in
the area.
3.0E)ilSTINGTRAFFICcoNDITIoNALoNGRoUTE'293.1 Route 29 North Configuration
Route 29 is the principal north-south facility providing direct access to all major
activity centers in the Charlottesville area including the University of Virginia (UVA)'
downtown, and large regional shopprng centers (Fashion square Mall, Albemarle Square,
and Barracks Road). Currently, it is the only direct route from the north leading to the city'
Even though it is a regional highway facility, due to the concentration of development along
\a\t?
//I
((\6\-?-\ ,-Q\) Q<
, CQ':cshs, (i\Y L-<ir F_
q>v
.-71
t\.+oL.L
2
l{'
UJcc
o
CN
zoFl-oo-azF
>izo()trj
=UJco
l!J
U)IrJFFoJ
C)
r[Loo5>CDFlLo
IIIIItIItItIIIItI'tt
il'xE: ]1/
T
ItIljIItttIIItIIII
this corridor it functions as an urban arterial between the U.S. 250 Bypass and the North
Fork Rivanna Bridge. It maintains a roadway width of four lanes all along the northern
segment except at the approaches Of major intersections where it flares to accommodate one
to three turning lanes in each direction.
Three major streets facilitate east-west movement across Route 29 north: Rio Road,
Hydraulic Road and Route 250 Bypass. The continuation of Route 29 fartber south of
Route 250 Bypass, known as Emmet Street, intersects with several local streets including
Barracks Road and Ivy Road/University Avenue before joining with the U.S. 29 /zs}Bypass.
population residing along this corridor in the trorth and in the northwestern part of both the
city and Albemarle County use Route 29 and Hydraulic Road to access the central city.
From the north and northwest the three available routes to the eastern portion of the City
and downtown are Rio Road, Route 29-Route 250 Bypass-Mclntire Road, and U.S. 29-
Barracks Road-preston Avenue. Traffic from the north and destined to UVA continues
south on Emmet Street. Some take Rout e 250 Bypass and either Barracks Road or
Fontaine Avenue. The regional traffic passing through the Charlottewille area have no
alternative but to stay on Route 29 north before diverting either east or west along Route
250 Bypass.
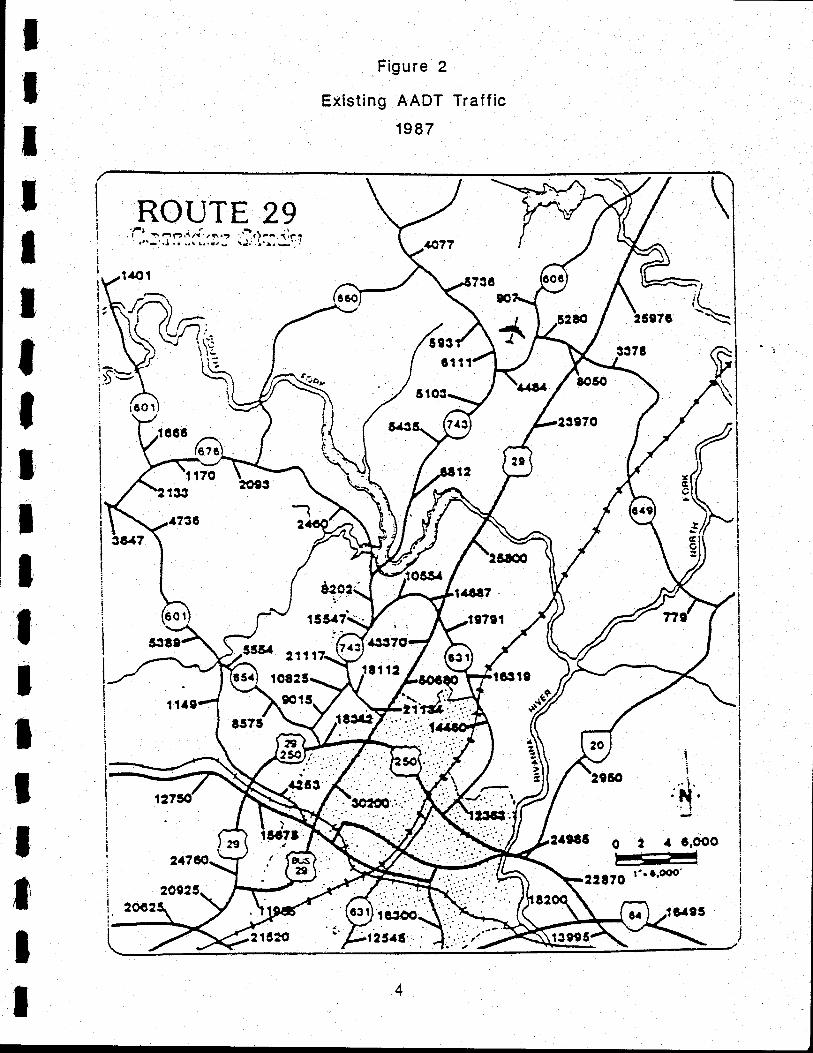
Existing Tlaffic Condition
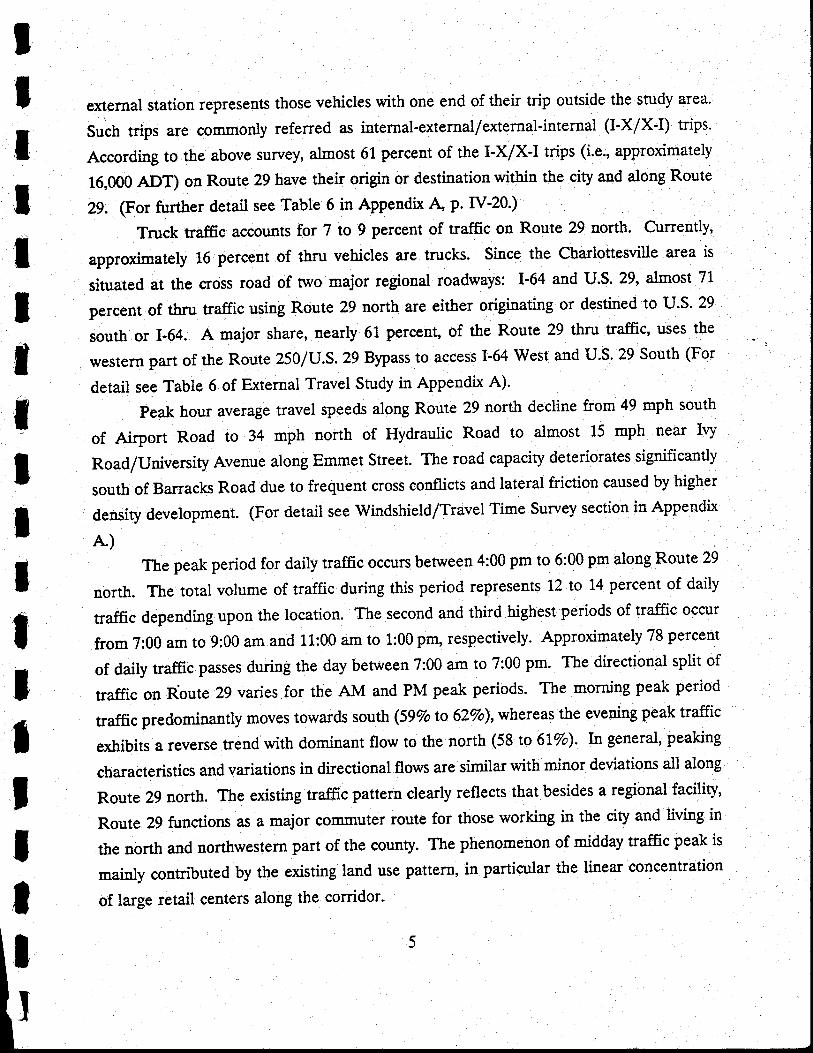
Route 29 north is the most heavily travelled facility of the Charlottesville Area. The
current (1937) average daily traffic (ADT) on this facility varies from 25,800 vehicles per
day (vpd) south of Airport Road to 50,700 vpd beween Rio Road and Hydraulic Road as
shown in Figure 2. The ADT drops to 48,200 just south of Hydraulic Road. Route 250
Bypass represents the second most travelled road of the area.
As per the findings of an External Roadside Survey conducted in 1987 (for detail see
Appendix A), near the Airport Road along Route 29 the share of thru traffrc (traffic with
origin and destination outside the area) is almost 19 percent. This percentage of thru uaffic
gradually decreases, however, as total uaffic volume toward the city increases. Within the
most critical segment of Route 29 north (i.e., benveen Rio Road and Hydraulic Road)' thru
traffic to total traffic is observed to be 10 percent. It is illustrative of the fact that the
southern segment of the corridor functions more as an urban arterial with the increasing
share of local traffic. The remaining traffic (excluding thru vehicles) at the Airport Road
a)
IIlT
lI
Figure 2
Existing AADT Traffic
1987
ROUTE 29il.: i r::ii:.:'j,'l,ill :. r
\+
IIIIIIItT
ttI
II
.. i..'H.
.' I
o 2 4 c,oool#lt
i601
22r7o r" f'ooo'
tT
IIItItIIItltItII
external station represents those vehicles with one end of their trip outside the study area.
Such trips *. .ogl*only referred as internal-external/external-internal (I-X/X-I) trips.
According to the above survey, almost 61 percent of the I-X/X-I trips (i.e., approximately
16,000 enl on Route 29 bave their origin or destination within the city and along Route
Ze. 6o, further detail see Table 6 in Appendix A p' IV-20')
Truck traffic accounts for 7 to 9 percent of traffic on Route_29 north. ..3*""U1,
approximately 16 percent of thru vehicles are trucks. Since the Charlottesvt[: area_i]
situated at the cross road of wo major regional roadways: I-64 and U.S. 29, almost 71
percent of thru traffic using Route 29 north are either originating or destined to U.S. 29
,ootl or I-64. A major share, nearly 61 percenq of the Route 29 thru traffic, uses the
western part of the Route 250/U.S. 29 Bypass to access I-64 West and U.S. 29 South (For
detail see Table 6 of External Travel Study in Appendix A).
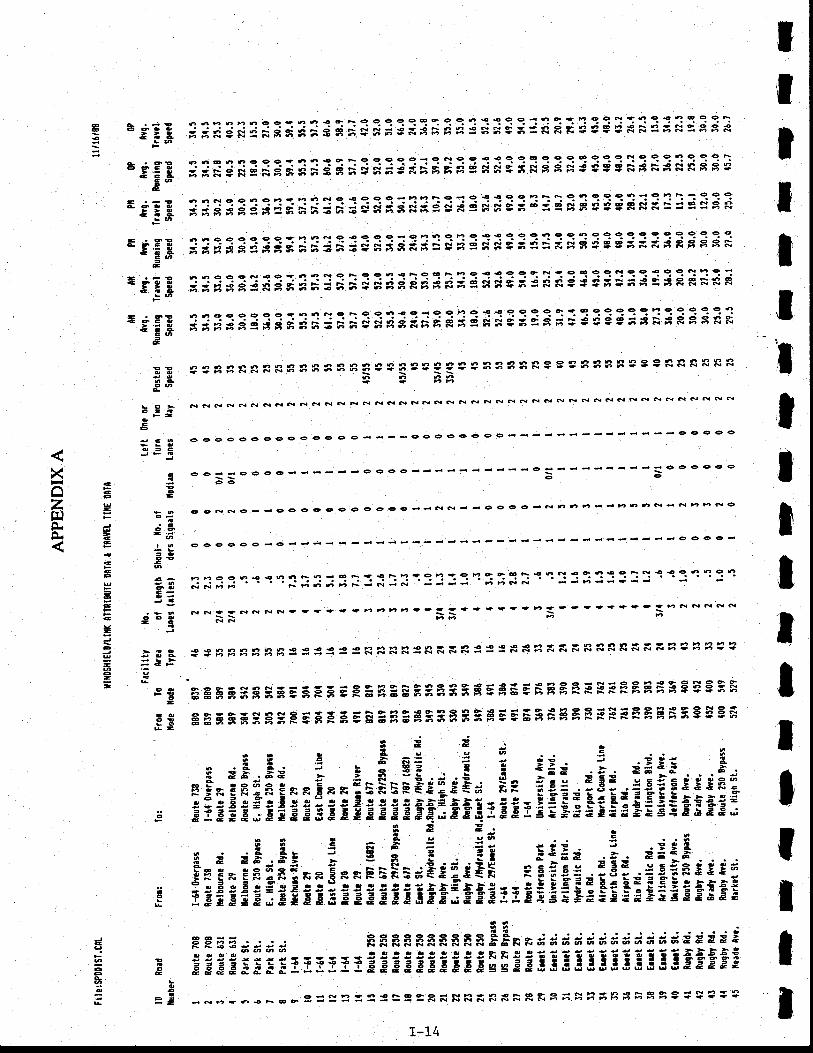
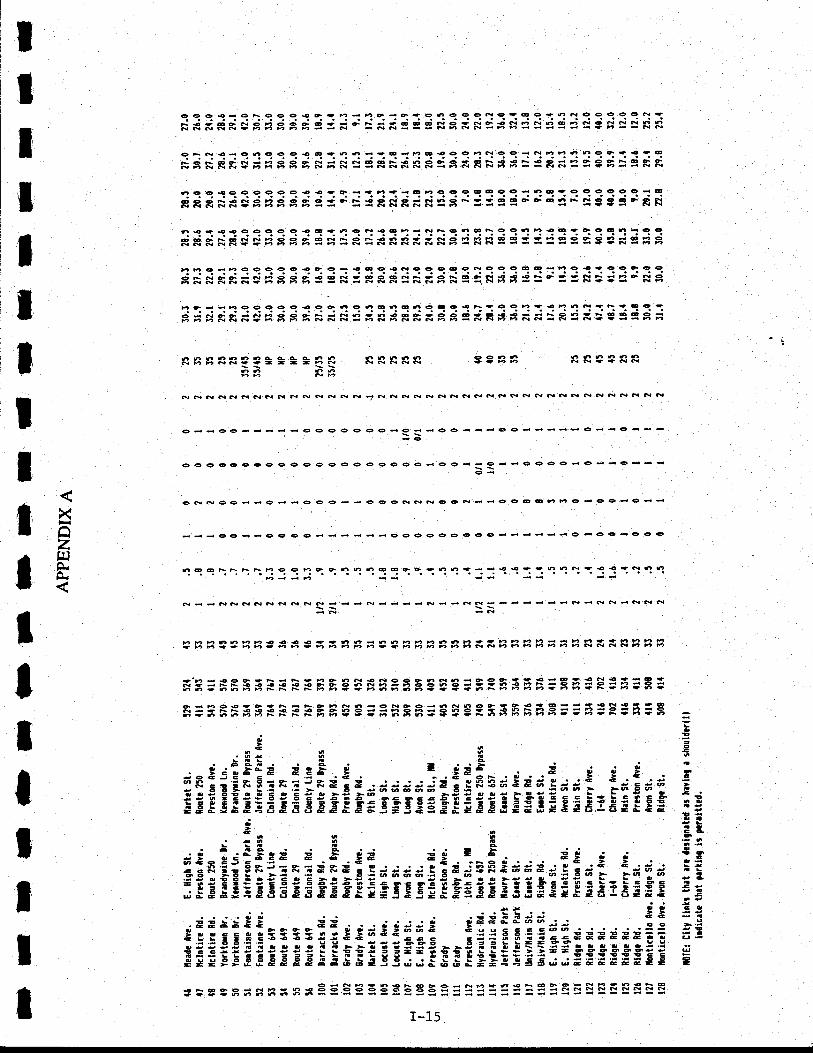
peak hour average travel speeds along Route 29 north decline from 49 mph south
of Airport Road to 34 mph north of Hydraulic Road to almost 15 mph near Ivy
Road/Universiry Avenue along Emmet Street. The road capacity deteriorates significantly
south of Barracks Road due to frequent cross conflicts and lateral friction caused by higher
density development. (For detail see Windshield/Travel Time Suwey section in Appendix
A)The peak period for daily traffic occurs between 4:00 pm to 6:00 pm along *":r:
:nnorth. The total volume of traffic during this period represents 12 to 1'4 percent of daily
traffic depending upon the location. The second and third highest periods of traffic occur
from 7:00 am to 9:00 am and 11:00 am to 1:00 pm, respectively. Approximately 78 percent
of daily traffic passes during the day between 7:00 am to 7:00 pm. Tbe directional split of
traffic on Route 29 varies for the AM and PM peak periods. The morning peak period
traffic predominantly moves towards south (59Vo to 62Vo),whereas the evening peak traffic
exhibits a reverse trend with dominant flow to the north (58 to 61'Vo)' In general, peaking
characteristics and variations in directional flows are similar with minor deviations all along
Route 29 north. The existing traffic pattern clearly reflects that besides a regional facility,
Route 29 functions as a major commuter route for those working in the city and living in
the north and northwestern part of the county. The phenomenon of midday traffic peak is
mainly contributed by the existing land use pattern, in particular the linear concentration
of large retail centers along the corridor.
I]
ItlIT
IttIItttItII
To evaluate traffic operating conditions in the Charlottesville area" 25 existing
intersections were identified by VDOT for the levels of service analysis. Tt ::tt:ttt]::
were analy zed for the AlvI and PM peak hours using the procedures prescribed in the 1985
Highway Capacity Manual. A microcomputer based capacity analysis package, NCAP,
written by professional Solutions, Inc. was used to perfor4 the analysis. (For detail see
Section 3.3 in APPendix C.)
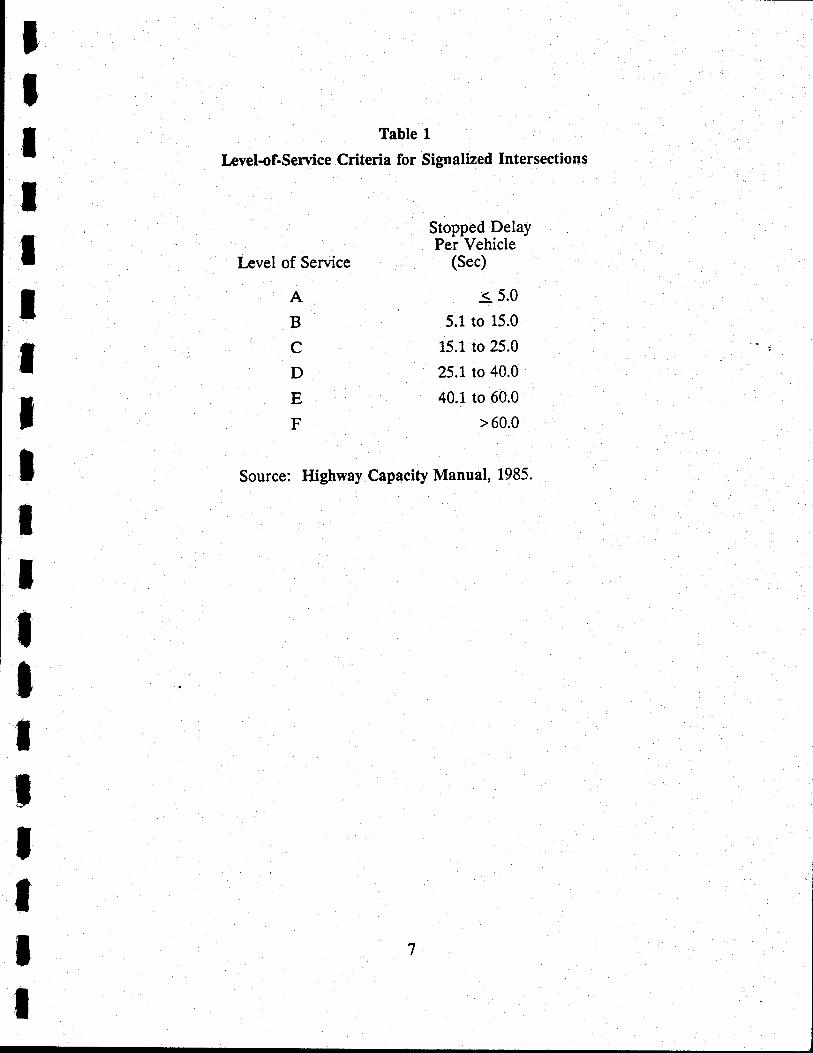
Table 1 lists the stopped delay (in seconds) criteria used to assign tbe levels of
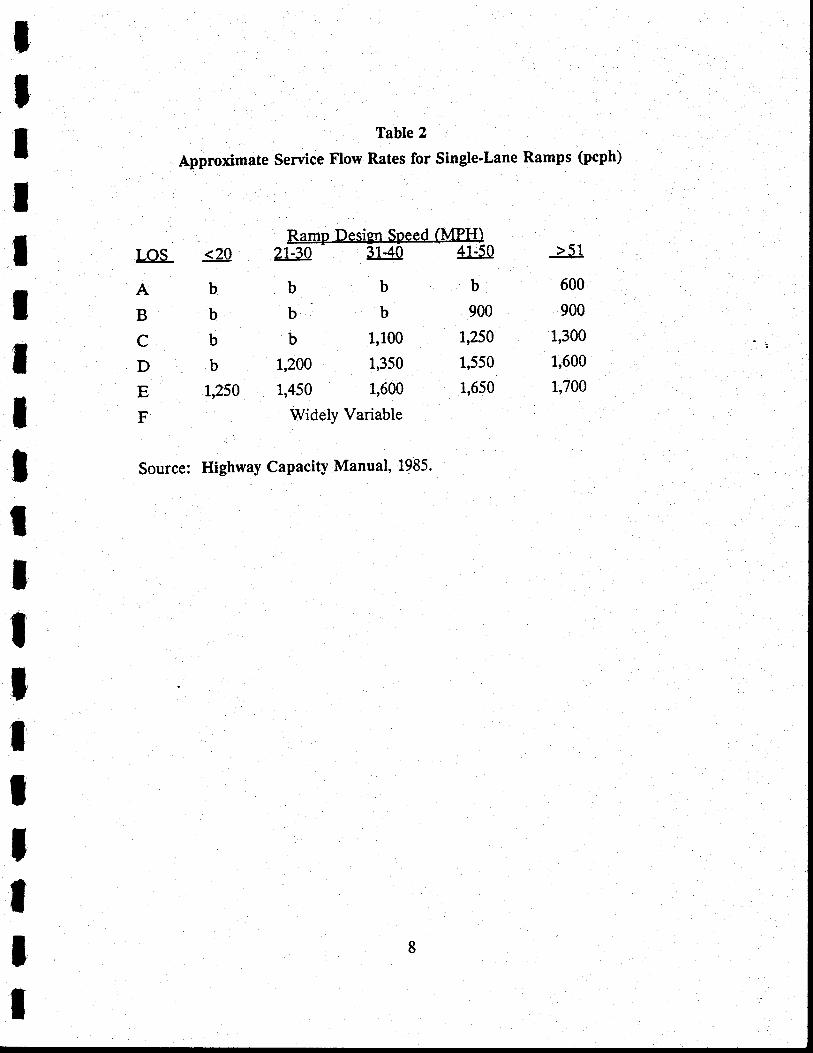
service (LOS) for signalized intersections. For intersections that were actuauy grade
separated, levels of service was determined based on the flo-w rate (passenger cars Per hour)
on ramps as shown in Table 2. Pimarily, LoS varies with volume. In an urban setting LoS
A B, C, and D represent acceptable service levels. LOS E or F are considered unstable
and failed oPerating conditions.
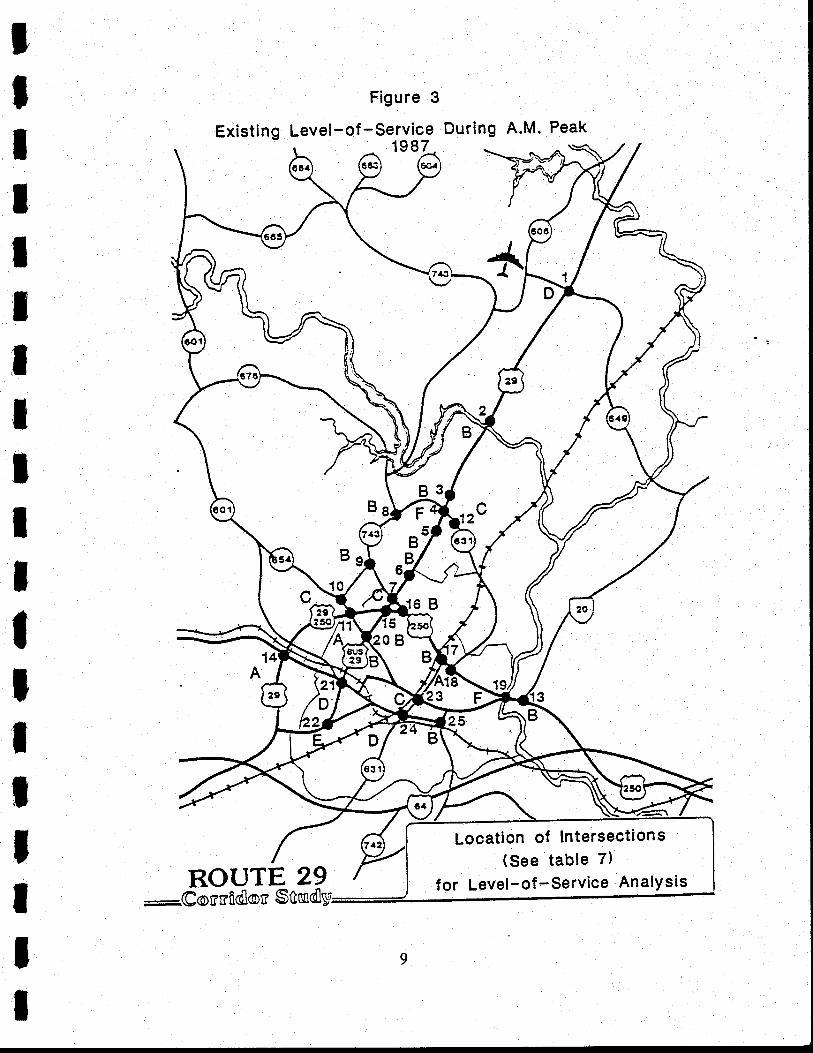
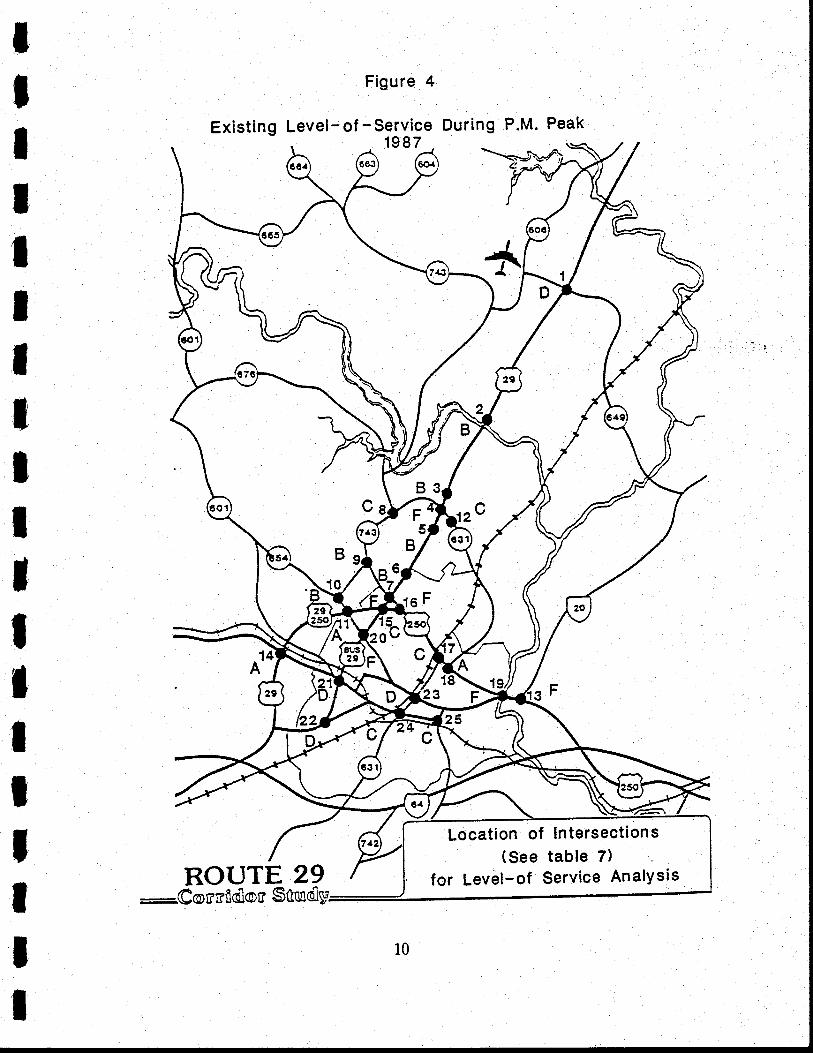
The results of the intersection LOS evaluation for AM and PM peak hours are
summarized in Figures 3 and 4. Currently, 6 out of.25 intersections operate at LOS F.
Along Route 29 norrh, Rio Road and Hydraulic Road intersections experience LOS F
mainly due to heavy north-south movements along Route 29 during peak hourr The main
through movements are imposing significant delays to the east-west traffic at these
intersections. Among the remaining intersections, Barracks Road/Emmet Street and Route
25o/Hydraulic Road are two critical intersections situated in the proximity of the Route 29
corridor. The movements to and from Hydraulic Road to Route 250 east are observed to
be critical at the latter intersection. At the Barracks Road intersection, left turning traffic
from the north leg of Emmet Street to Barracla Road (toward downtown) in the morning
imposes delaY on other movements.
DESCRIPTION OF AL1ERNATIVES
The range of alternatives considered for evaluation include:
Base Case,
Traffic System Management (TSM) Measures,
Mass Transit, and
Several Build Alternatives.
o
o
o
o
6
AB
C
D
E
F
ItIT
lItIIIt,|
II;
IttI
Table 1
Levelof- Service Criteria for Si gnalized I ntersect ions
l,evel of Service
Stopped DelayPer Vehicle
(Sec)
< 5.0
5.1 to 15.0
15.1 to 25.0
25.1 to 40.0
40.1 to 60.0
>60.0
Source: Highway Capacity Manual, 1985.
J
tI Table 2
^Approximate Service Flow Rates for Single'Lane Ramps (pcph)
LOS <20
AbBbcbDbE t,250
F
bbbbb 1,100
1,200 1,350
1,450 1,600
Widely Variable
Source: Highway Capacity Manual, 1985.
41-50
b
900
7,250
1,550
1,650
>51
600
900
1,300
1,600
1.,700
8
9
ItItIlIIIItItIIlIII
Figure 3
Existing Level-of-Service During A.M. Peak
+
ROUTE 29
Location of Intersections(See table 7)
for Level-of-service AnalYsis
-e@rridor
IIIIIIItIlIIIIIlItI
Figure 4
Existing Level-of -Service During P.M. Peak
ROUTE 29
Location of Intersections(See table 7)
for Level-of Service AnalYsis
=:Corrrfl elclg Stnnoly
IIItIIIIIlIIT
I;
;
III
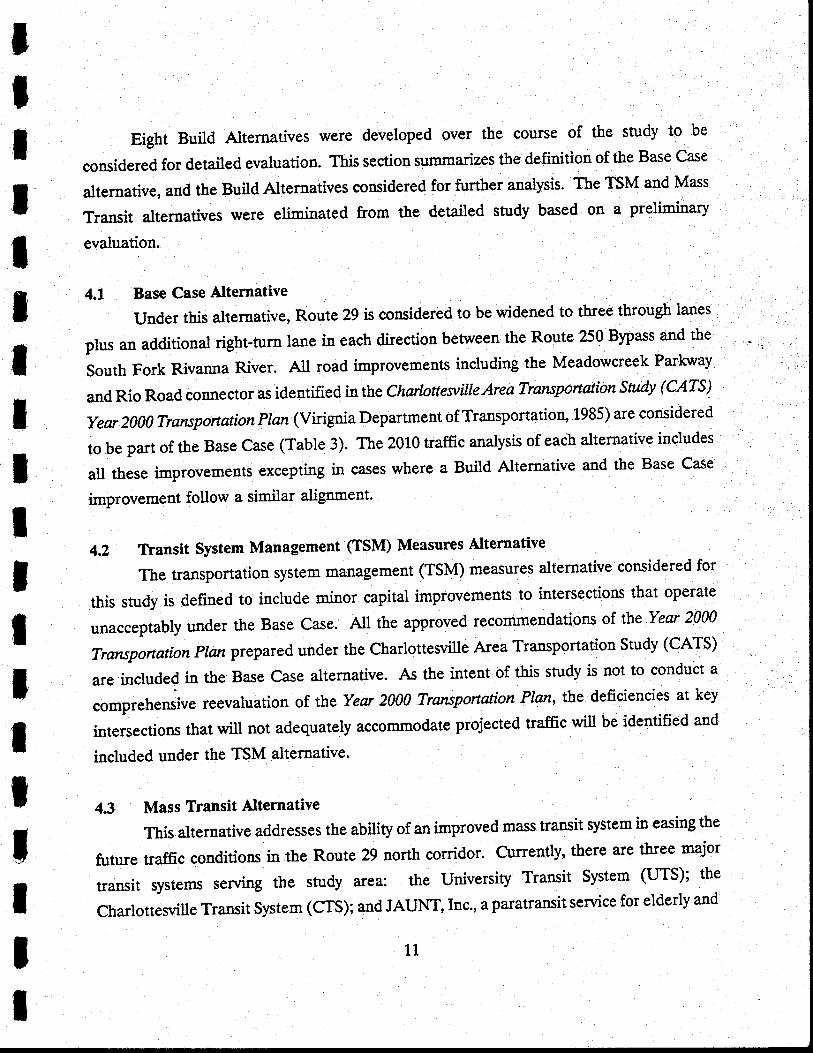
Eight Build Alternatives were developed over the course of the study to be
considered for detailed evaluation. This section summarizes the defilition of the Base Case
alternative, and the Build Alternatives considered for further analysis. The TSM a10 lv.tass
Transit alternatives were sliminslsd from the detailed study based on a preliminary
evaluation.
4.1 Base Case Alternative
Under this alternative, Route 29 is considered to be widened to three through lanes
plus an additional right-turn lane in each direction benpeen t}re Route 250'Bypass and the
South Fork Rivanna River. All road improvements including the Meadorvcreek Parlnray
and Rio Road connector as identified in the Charlottesville Area Transportation Stud.y GATS) -
year 2000 Traruportation plan (virignia Department of Transportatioq 1985) are considered
to be part of the Base Case (Table 3). The 2010 traffic analysis of each alternative includes
all these improvements excePting in cases where a Build Alternative and the Base Case
improvement follow a similar alignment
4.2 Tbansit system Management (TSII) Measures Alternativ
The uansportation system management (TSM) measures alternative considered for
this study is defined to include minor capital improvements to intersections that "pt]1:
unacceptably under the Base Case. All the approved recommendations of the "y-'!!
Transportation planprepared under the charlottesville Area Transportation study (cATs)
are includ.g in the Base Case alternative. As the intent of this study t: Tjto
conduct a
comprehensive reevaluation of the Year 2000 Trarcportation Plan, the deficiencies at key
intersections that will not adequately accommodate projected traffic will be identified and
included under the TSM alternative'
4.3 Mass Ttansit Alternative
This alternative addresses the ability of an improved mass transit system in easing tbe
future traffrc conditions in the Route 29 north corridor' Currently' there *t t:t-:"':ttransit systems serving the study area: the University Transit system (uTS); the
charlottesville Transit System (cTS); and JAUNT, Inc., a paratransit service for elderly and
11
tIIIIIIT
IIIItIIttIl
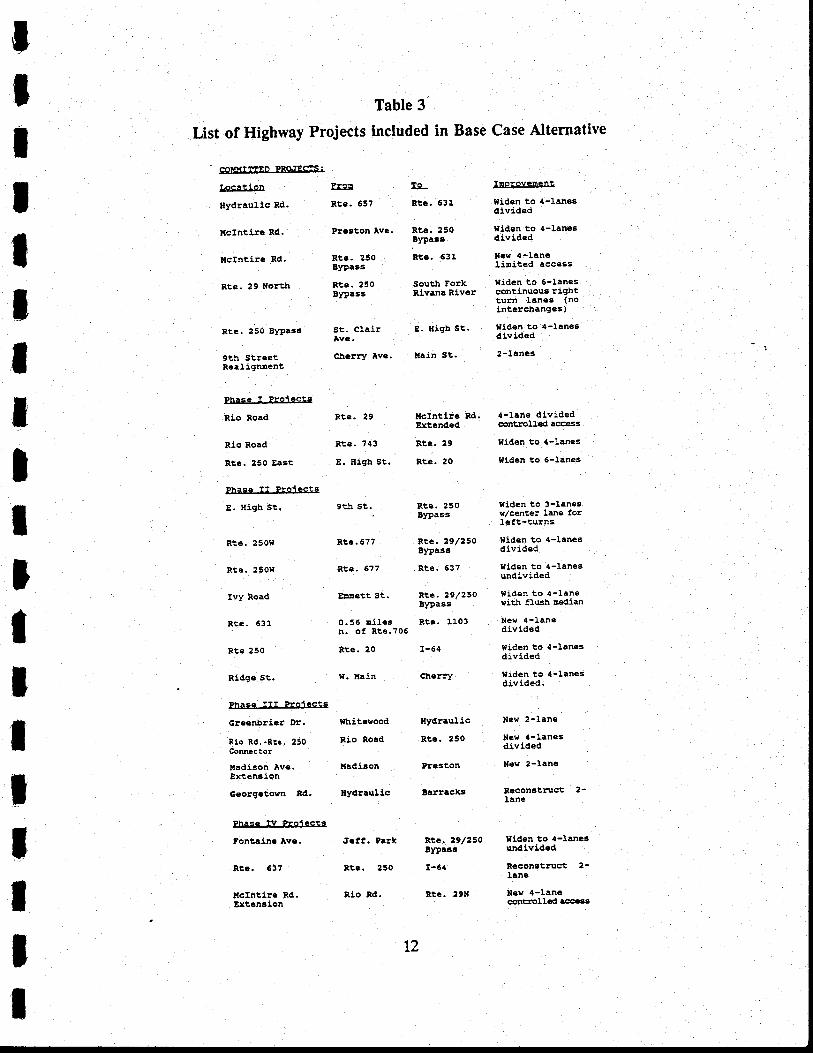
Table 3
ItiveList of Highway Projects included in Base Case Alternt
eawrgEp--PBgtElrs.l
Idser.lg!Itydraulic Rd.
xchtirs Rd.
xcfntirc Rd.
Rte. 29 North
Rte, 250 B!rP.3s
9th StreetReaIign'ulent
PhrEe-rPrel.esl!Rio Road
Rio Roaal
Rte. 250 East
Phase I" Proiects
E. ltigh St.
Rte.25On
Rte.25Ow
Ivy Road
Rte.63l,
Rte 250
Ridgc st.
crcenbrier Dr.
Rlo Rd.-Rre. 250Co@clor
l,ladison Av€.Extension
GeorEctom Rd.
Phase iV Proiects
Ponlain. lv..
Rt.. 537
ttclntlr€ Rd.Extension
Rte. 657
Prcstot! Ava.
Rt.. 250B)?a3s
Rte. 250B!t)ass
sr. clairlvc.
Cberry Ave.
Rte. 29
Rte. 743
E. Eiglr 9t.
9rb st..
ntc. 677
Rte.577
EEEett St.
0.95 lilasn. o! Rte'706
Rte. 20
w. Xain
$bi,tesood
Rio Road
l{aalisoa
Byalraullc
Jcl!. Part<
Rte. 23o
R10 nd.
Rt6.631
Rte.2508)?aaE
Rt€. 631
South ForkRivana River
E. ttigb St.
l{ain st.
t{crntir. tld.Extended
RtG. 29
Rtc. 20
Rte.250Blrpass
Rte.29l25O8lT)ass
Rte.637
Rte. 29/Z5OBIT)ass
Rte.:,103
I-64
Cherry
ttyalraul,ie
Rte. 250
Preston
Barraclcs
Isgreve&eetliden to 4-Ianesativided
t{lden to 4-lanesdivlded
Ncs {-lanelini,ted access
tliden to 5-1anescontinuous rightturn lanes (nolnterchanges)
Ilden to 4-lanesdivi.ded
2-1anes
4-lane dividedcontJollcd access
niden to {-tanes
fliden to 5-lanes
illden to 3-Ianesv/center lae forleft-turns
tliden to 4-Irnesdivided
ttlalen to tl-Ianesundivi,ded
tfiden to 4-lanenitlt llush nedian
Nes 4-lanedivided
t{iden to 4-lanesdi.vided
9iden to 4-lanesdlvided.
Nes 2-1ane
Ncs 4-1anegdivided
Nev 2-!,an€
B€constrqct 2-lanc
Flt.e. 29/250 $iden to {-laneslltrags undivided
t-6{ R€construct 2'Iane
Bte. 29}| ]feu 4-lanecontroll'cd accass
12
,t
IIIItIIIIIItItIItI
handicapped persons. The UTS and CTS principally serve the city portion of the study area
with several fixed bus routes. A snrdy was initiated recently to examine the potential for
consolidating the IjVA operated service, IJTS, with the CTS.
The existing bus services are generally oriented towards UVA and downtown,
principally used by the residents of the city and UVA students. . **-t*U to tbe 1980
Census, only 5.7 percent of commuter trips within the Charlottewille *O*^I:_llttO ::t
mode. Available operating statistics suggest that the systemwide ridership of CTS is stable
and not growing. Although there is a need to extend bus service along **:: -29'
it- wiu
have timited impact on auto users. Most of the future populatiol growth will be of low
density type and out of the city. Generally, transit is considered an uneconomical and
ineffective mode to senrice the travel needs of suburban and rural residents.
In view of the above factors and the travel characteristics of peak period Route 29
users (e.g., predominance of trips from suburbs and outside the study area), it was
determined that the Mass Transit alternative will not be a viable solution to the traffic needs
of Rorrt" 29 users.
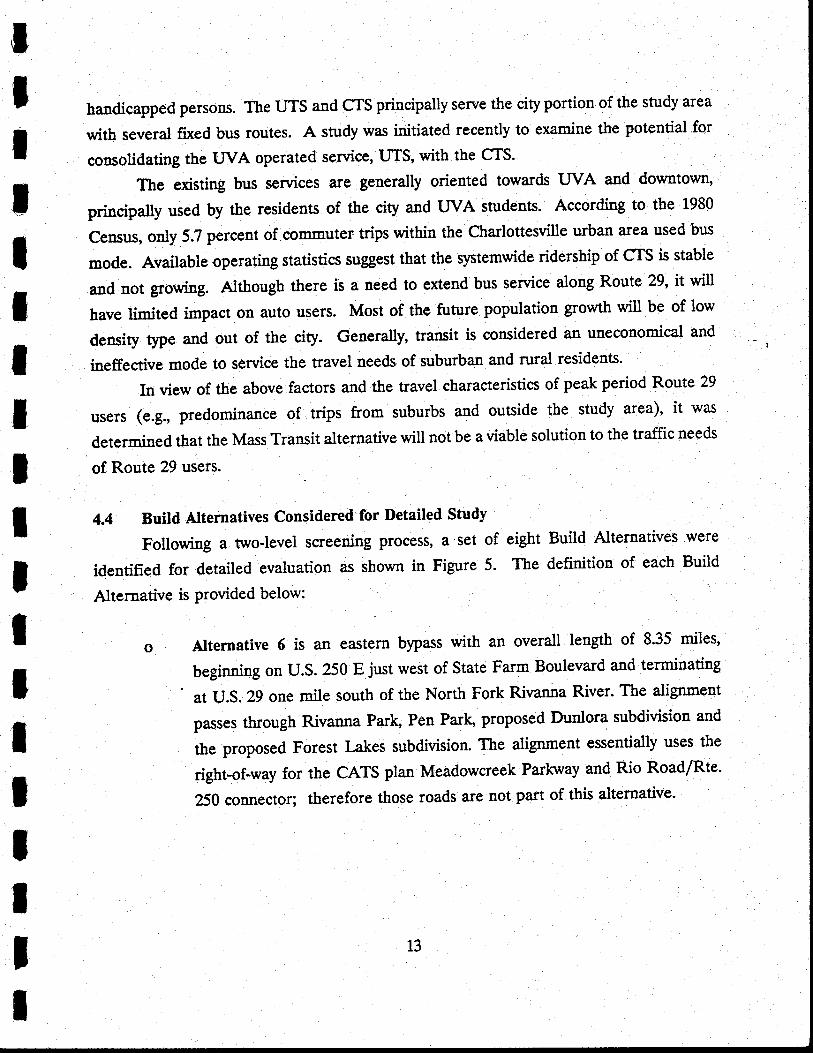
4.4 Build A,lternatives Considered for Detailed Study
Following a two-level screening process, a set of eight Build Alternatives were
identified for detailed evaluation as shown in Figure 5. The definition of each Build
Alternative is Provided below:
Alternative 6 is an eastern bypass with an overall length of 8'35 miles,
beginning on u.S. 250 E just west of State Farm Boulevard and terminating
at U.S. 29 one mile south of the North Fork Rivanna River. The alignment
passes through Rivanna Parlq Pen Park, proposed DunlOra subdivision and
the proposed Forest l:.kes subdivision. The alignment essentially uses the
right-of-way for the CATS plan Meadowcreek Parhvay and Rio Road/Rte'
250 connector; therefore those roads are not part of this alternative-
13
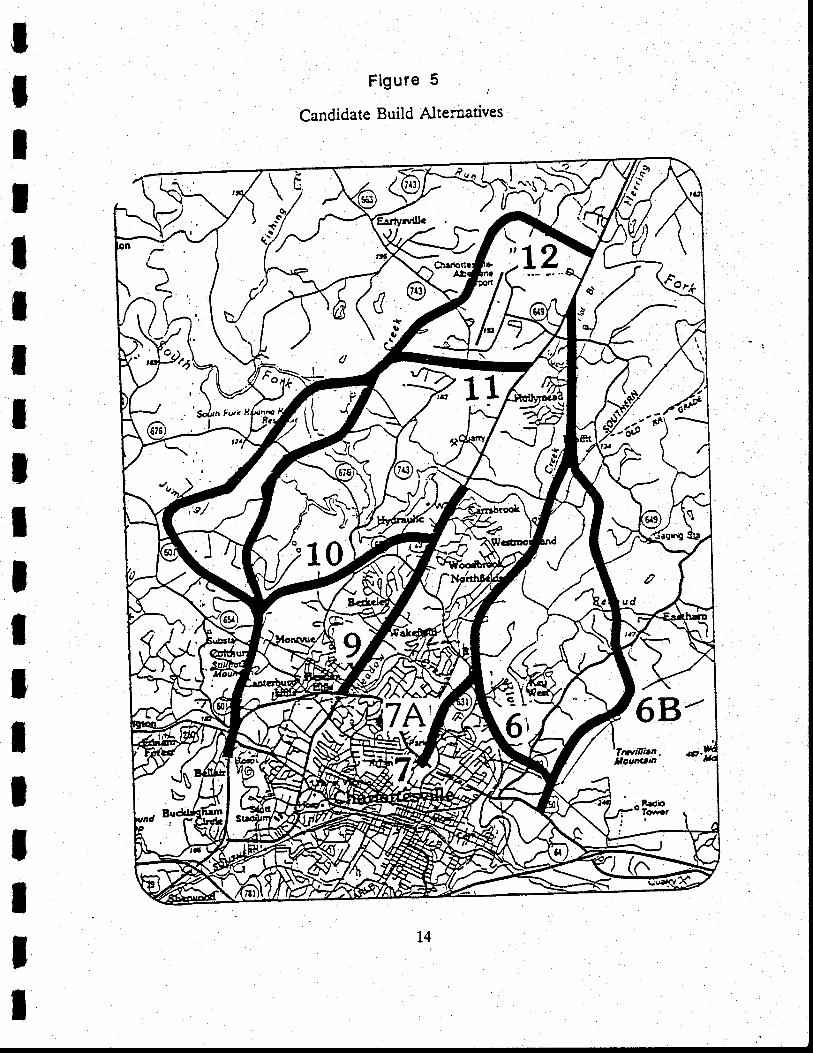
Figure 5
Candidate Build Alternatives
IIIIIIIT
IIIItIItIII
U'\s-7
/#{J,
.;uu^)-
'tnvi[lc'a. .o.lloaun
^ R.db
('totlt )i =-l-
15
IIIIlIItIIIIIIIIItt
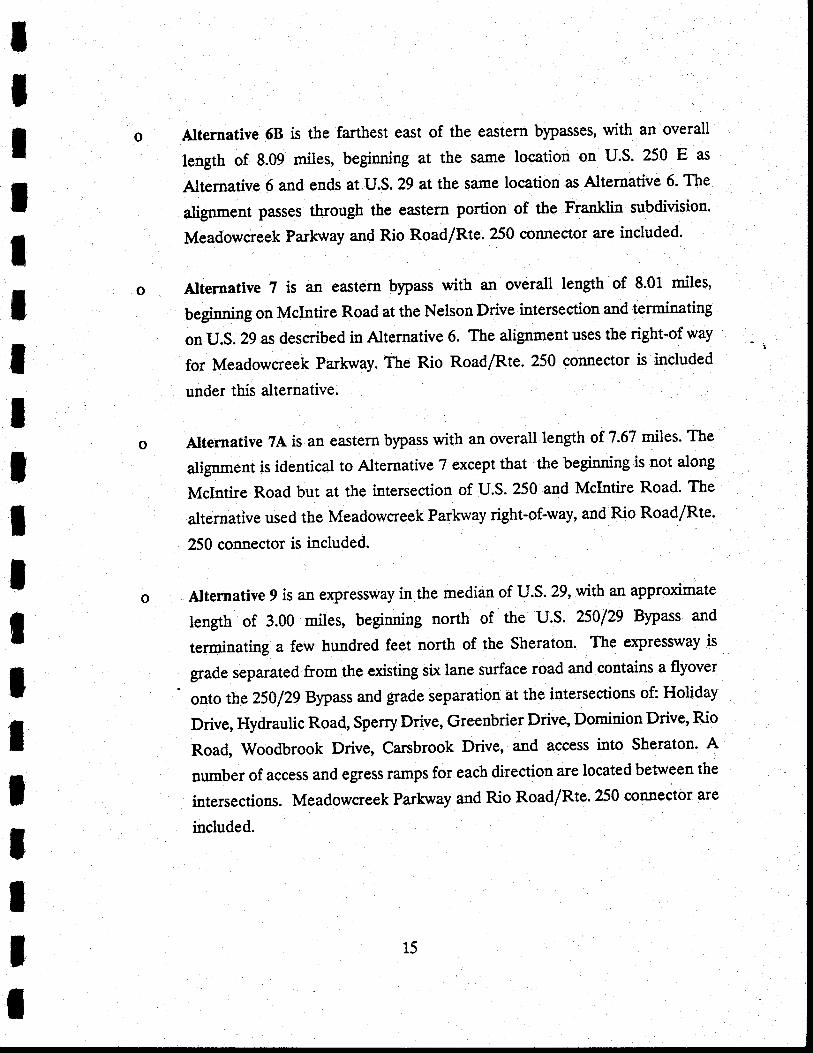
Alternative 68 is the farthest east of the eastern bypasses, with an overall
length of 8.09 mils5, beginning at the same location on U.S. 250 E as
Alternative 6 and ends at U.S. 29 at the same location as Alternative 6. The
alignment passes througb the eastern portion of the Franklin subdivision.
Meadowcreek Parlovay and Rio Road/Rte. 250 connector are included'
Alternative ? is an eastern blpass with an overall length of 8.01 miles,
beFnning on Mclntire Road at the Nelson Drive intersection and terminating
on U.S. 29 asdescribed in Alternative 6. The alignment uses the right-of way
for Meadowcreek Parhray. The Rio Road/Rte. 250 connector is included
under this alternative.
Atternative 7A is an eastern blpass with an overall length of.7.67 miles. Tbe
alignment is identical to Alternative 7 except that the begianing is not along
Mclntire Road but at tbe intersection of U.S. 250 and Mclntire Road- The
alternative used tle Meadowcreek Parkrvay right-of-way, and Rio Road/Rte.
250 connector is included.
Alternative 9 is an expressway in the median of U.S. 29, with an approximate
length of 3.00 mile5, beginning north of the U.S. 250,29 Bpass and
terminating a few hundred feet north of the Sheraton. The expressway is
gfade separated from the existing six lane surface road and contains a flyover
onto the ZS0/2g Bypass and grade separatioa at the intersections of: Holiday
Drive, Hydraulic Road, SPerry Drive, Greenbrier Drive, Dominion Drive, Rio
Road, Woodbrook Drive, Carsbrook Drive, and access into Sheraton. A
number of access and egress ramps for each direction are located between the
intersections. Meadowcreek Parkrvay and Rio Road/Rte.250 connector are
included.
IIIT
lIIT
IIIIIIIIIlI
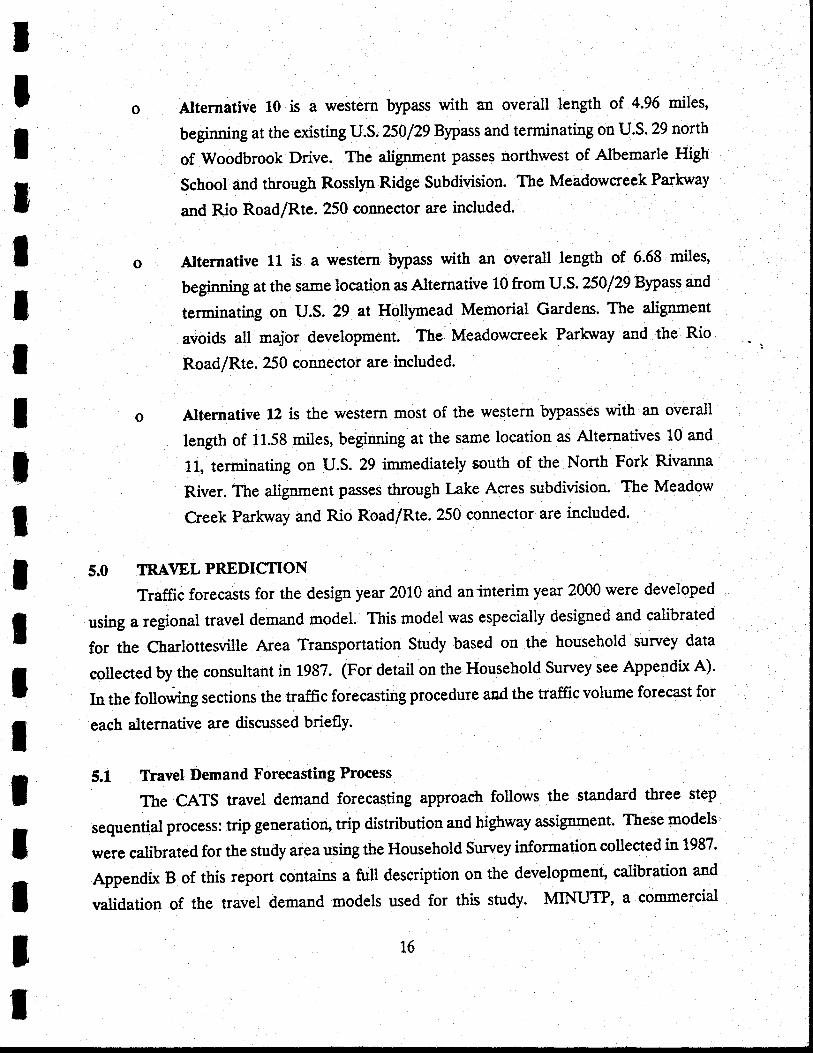
Alternative 10 is a western blpass with an overall length of 4.96 miles,
beginning at the existing V.S.25O/29 Bypass and terminating on U.S.29 north
of Woodbrook Drive. The alignment passes northwest of Albemarle High
School and througb Rosslp Ridge Subdivision. The Meadowcreek Parlnvay
and Rio Road/Rte. 250 connector are included.
Alternative 11 is a western blpass with an overall length of 6.68 miles,
beginning at the same location as Alternative 10 from U.S. 250/29 Bypass and
terminating on U.S. 29 at Hollymead Memorial Gardens. The alignment
avoids all major development. The Meadowc-reek Parhray and the Rio
Road/Rte. 250 connector are included.
Alternative 12 is the western most of the western bypasses with an overall
length of 11.58 miles, beginning at the same location as Alternatives 10 and
11, terminating on U.S. 29 immediately south of the North Fork Rivanna
River. The alignment passes through I-ake Acres subdivision. The Meadow
Creek Parhvay and Rio Road/Rte. 250 connector are included.
5.0 TR,A\IEL PREDICTION
Traffrc forecasts for the design year 2010 and aninterim year 2000 were developed
using a regional travel demand model. This model was especially designed and calibrated
for the Cbarlottewille Area flensportation Study based on the household suwey data
collected by the consultant in 1987. (For detail on the Household Survey see Appendix A).
In the folowing sections the trafEc forecasting procedure aod the traffic volume forecast for
each alternative are discussed briefly.
5.1 Tlavel Demand Forecasting Process
The CATS travel demand forecasting approac'tr follows tbe standard three step
sequential process: trip generation, trip distribution and highway assigrmsat. These models
were calibrated for the study area using the Household Survey information collected in 1987.
Appendix B of this report soafains a full description on the development, calibration and
validation of tbe travel demand models used for this study. MINLITP, a commercial
16
IIIT
tIIIIlIIIIIIIII
software package developed by COMSIS Corporation for urban transportat;ffi;t;;-used to implement the travel demand forecasting system. (For detail se
The zone specific values of land use (employment by category and dwelling units by
qpe) and socioeconomicvariables (households, auto ownership, school enrollment" etc.), and
transpor-tation network information are basic inplts of the travel demand forecasting
process. Future year external trips are estimated by factoring the External Survey
inforsration. The factoring process takes into account the demographic changes within thef.
st'dy area and the historical trend of traffic at each extersal station (i.e., at each entry/exit
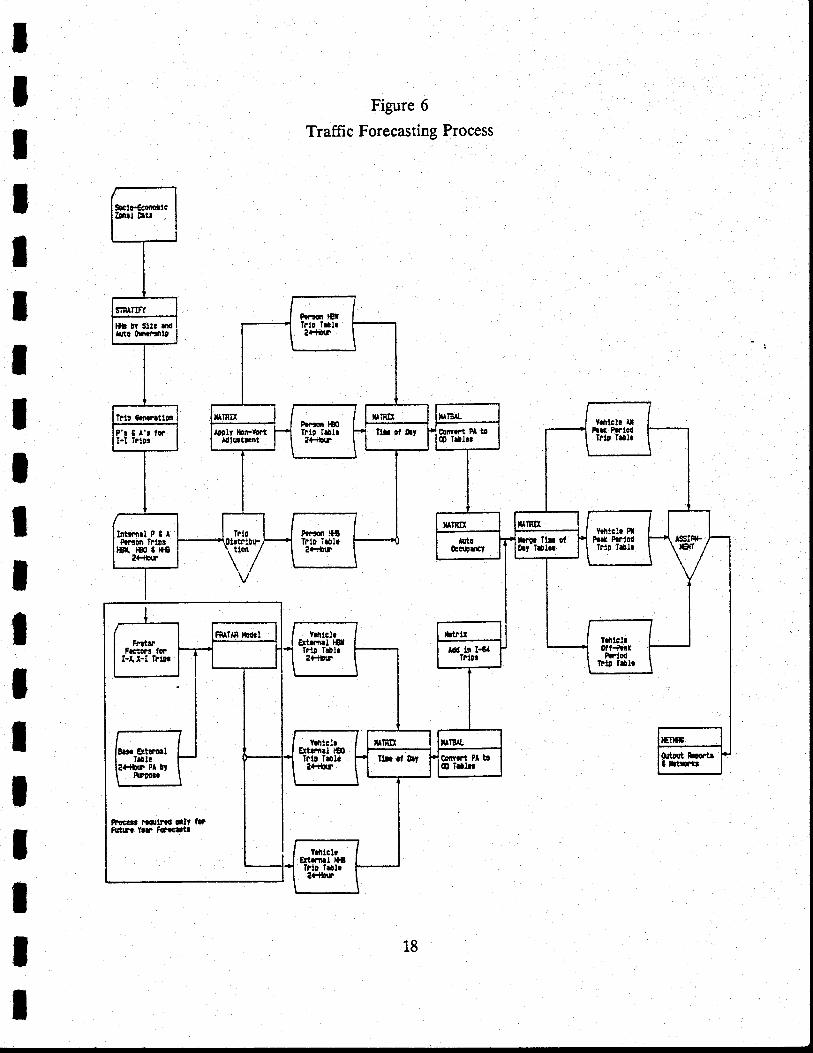
point of the study area). Figure 6 presents a schematic description of the eatire traffic
forecasting system.
The travel demand model system was validated to check its ability in replicating the
existing travel pattern. At all selected locations (i.e., ortlines and screen lines) within the
study area the difference benveen the observed and estimated traffic volumes fall within
the acceptable level of 15 percent. Validation tests showed that the model performed
extremely well in simulating travel patterns at the regional scale. Along Route 29 the
segment between Hydraulic Road and Rio Road displayed nearly *. O::tto:
underestimation of traffic. Due to the intense retail development in this atea a significant
4mount of short trips seems to be under reported causing tbe above discrepancy. No
adjustments were made in the traffic assignment results to reflect this discrepancy.
52 Future Year Land Use InPuts
knd use and socioeconomic data for tbe years 2000 and 20L0 were provided by the
planning offices of the City of Charlottesville and Albemarle County. A post processing
pro..dup was later applied by the consultant to develop additional inputs (e.g., households
by auto ownership and size) from the data provided by the local planning offices (See
Household Stratification Procedure described in Appendix B).
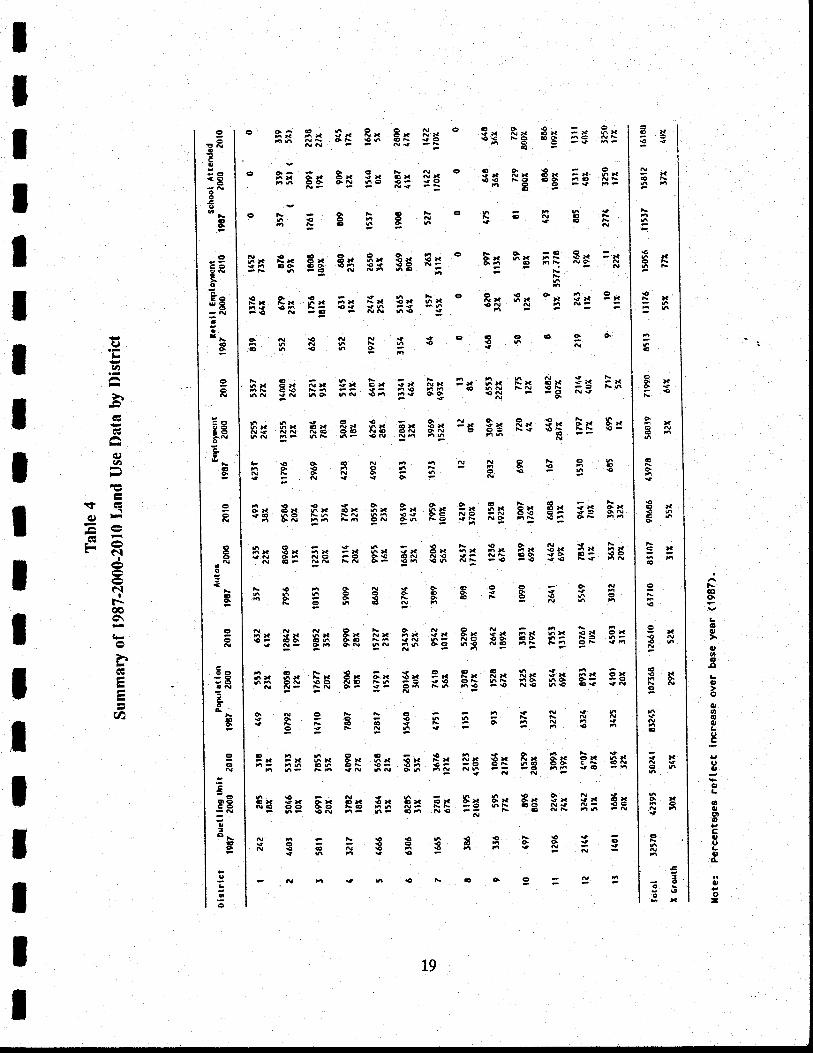
The 2000 and 2010 population projections for the area are 107,368 and 126,6t0, a29
and 52 percent increase over 1987 population, respectively. over this period, the
employment is projected to grow to 71,990 by 2010, a 64 percent growth over 1987' A
sunmary of the land use data by district is presented in Table 4'
t7
tItIIIIIIIIIIIIIIII
Figure 6
TrafEc Forecasting Process
9clo{cd!|ttZltrt Dtr
frocrtr raCdtrd gllt trfunn nt FoGrttl
18
Faoo.
oo
ooallLc,
o(l,,t,6oLac
|JC'
e,
atoC'toco(,boc
o,
o-
Ex-c€{
-x€x
f{CE
€
€
oxo<
9xCN
O
3xo
€x€
€
=x€N
6€x
€
rXcn
ox
o
ato
€L
9x
R* 3x !p 3*FO O6 6eO e -so-
Fs Ex i= Fro c -{ F-€-
,66{€stF
A* F* 3r 3x Bx SE oNN N{
-=
gi Er. Fx 9x ir $g o-6 R9 oN 6c p;;-
LaLelonEBlEil
$r 8; Eg ar 3t $C Fi' EI cE u! RI =ilh
EE 8f E= El 5n Pg E5' Eil f!'i Fi':--
EfrFfiHiS-EOG:Oo6€69-
!x Bx
SE
s* 6}{€c oN
fx *x6- €e
ONilE
€)a ox
h* o*
o99
o{X$€
PT C5
Ex9€
=E 6il Fi 3g
3x Hg F* 35
!st5o€
ig Ft Hr €t
Ff Eu Ee $c
EsEi8* $x Fx fx*3 3S EC F;
h-
ES fir *u ile-{ry9E5F
F
Ip Ei Es Ex{NNF
8x 8x 8* 3*=?
6T €8 N:
HHEE
Lrh-x o* {ra N}as- 69 hD6N.On !o qo
R* 3- Ex $*OO N€ CN ONh- 9N N-
"=
6Nn6ne6FNo-6{9O-
Fx $x $u $si6 0N 66 Fe
jx 3x !x 8x-C Og 6N N9EN q- Oh €6
oNs(}ooo€a€No6ONF
8* Ix 9* $xeR ii ifr 8E
8* Ex €x 9xNo F6 -O 99oF :- R- F6
tsNC-C-€6€a{FFN6*
t* B* Gx PxoE 9- €n 9'{N 6N O6 Fd
L6hX eX NXFN 6€ E'6d {N 60
66€6* 6X €XN{ NN N€GN NF 6F
,€9rno9NtsO€-.N
3* 8x 3*s€ 60 L6
N ON F'
Hx 8* ix{N 6- NO
N O- NN
F€6666ao io
NNA6* ex 6x9- OO €6
{ N- 66
n€N6* 6x Fx66 0N €ON N- NN
oNo90{NtsOg
€n6-X -X hXn- 66 C6
- 6- tsA
6€€x sx oxa€ oo 60. NF €N
NN€ON€€
96
$x
e
$* $x Sx ExF€ 66 N-n- 6- o- N9
E€€6-9C9N9F9h{€-
o
L9
oriioE
-O<oo
t
c
-o
9os9a
t
oo
EIB'N
Go
oc
o
oo
€G
cc
x
6q
oI
99
!:axt
o
IItII
Il-u,
c)lD
fc|g€,) r
- aE v
E-RI
FIaF
aoc\
h
(n
tIlIlIIIIIIIII
IIIIttItIIIIIIIIIII
53 Ttafric Volume Forecasts
Traffic forecasts for the Base Case and eight Build Alternatives were developed for
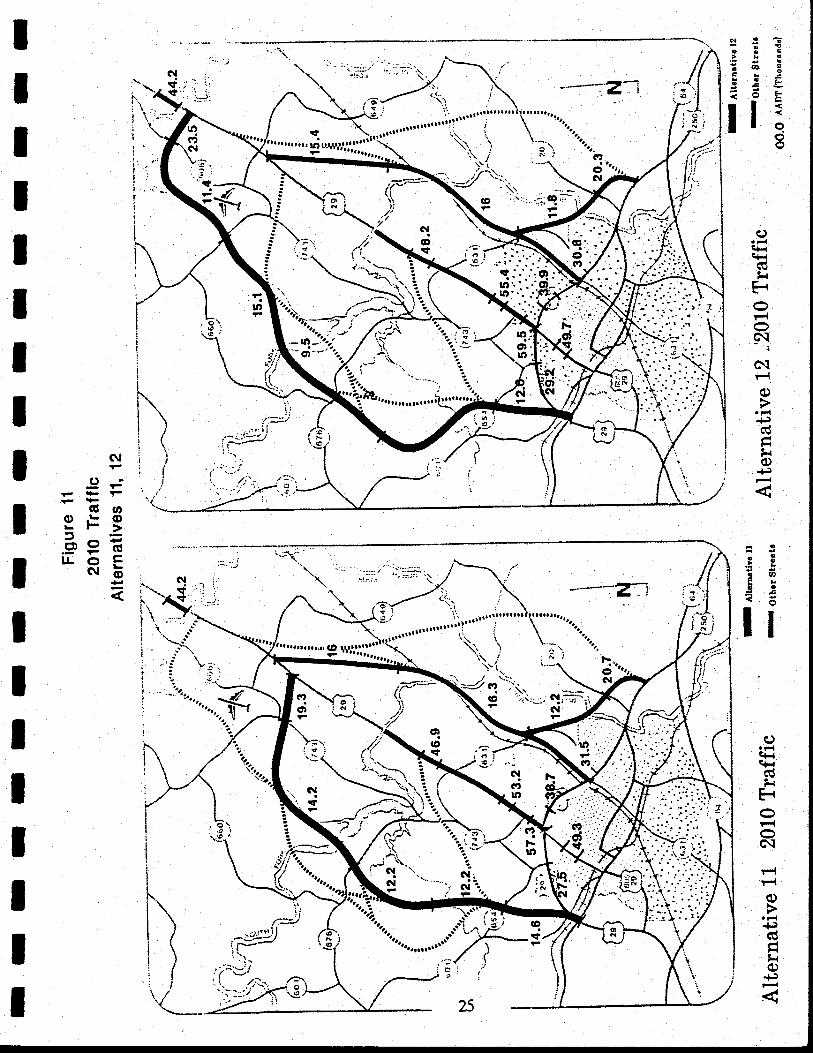
the design year (2010) and the interim year 2000. Figures 7 to 11. display the year 2010
average daily traffic volumes for each alternative and major facilities in the vicinity oltl"Route 29 corridor. Information on &e design year traffic volumes for otber facilities of the
study area are provided in the Appendix C.
At a systemwide level traffic in the Charlottesville area is projected to grow by 40
percent and the vehicle miles travelled by almost 68 percent between 1987 and 2010. Due
to the concentration of future developments in the suburbs (Albemarle County) the average
trip lengths of comrnuters will increase from 9,8 minutes to rough$ 13 minutesfr ]0t0,
an
increase of almost 31 percent. Trip lengths for otber purposes of travel will also increase
above its current level though to a lesser degree, 24 percent for non-home based trips and
17.3 percent for home-based other trips. These increase:: tiP lenefs directly contribute
to the overall increase in total vehicle miles of travel within the study area.
The roads serving the north, northwest and northeast suburbs of the study area such
as Routes 748,676,601, and 649 will experience higher than 60 percent growth in daily
traffic by 2010. This increase in treffic is the result of the projected gowth in population
for areas served by these roads and the proposed University Research Park in tn: :ttT:
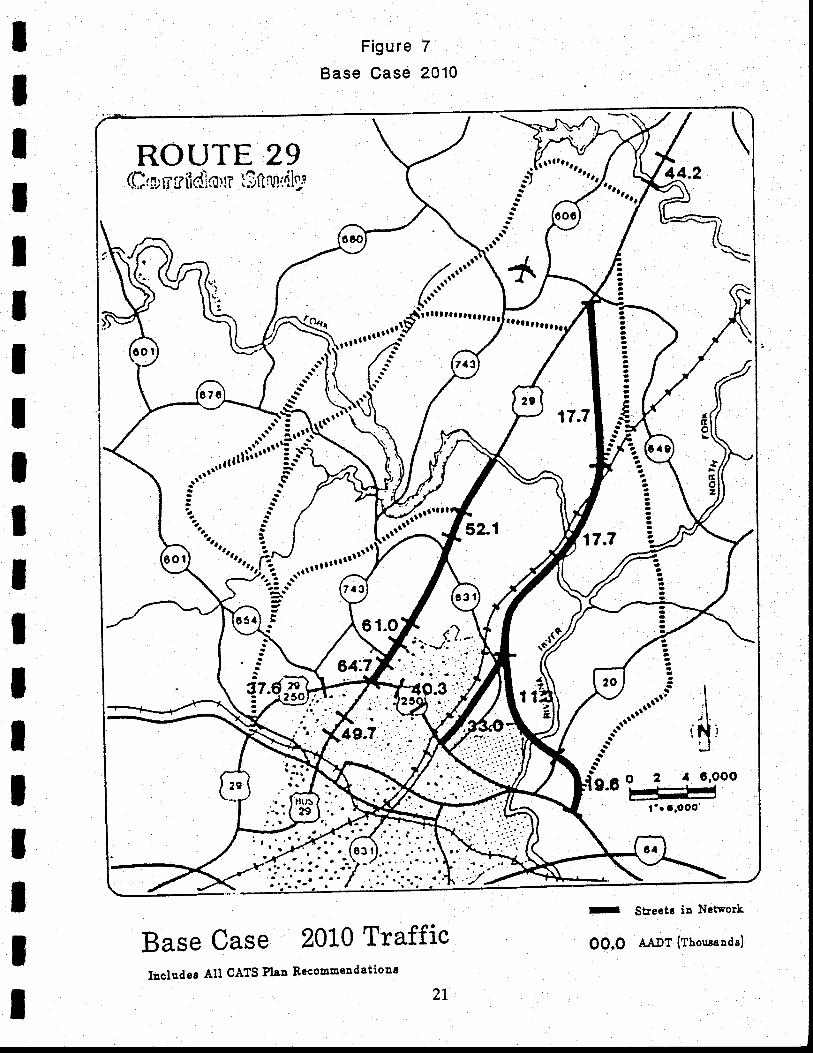
of the airport. Under the Base Case, traffic on the segment of Route 29 north of the 250
Bypass, will increase to 64,?00 vehicles per day. The increase represents almost 36 percent
traffic gowth between 1987 and 20i0. The Base Case considers Meadow Creek Parhray
and the Rio Road/Rte. 250 Bypass Connector in operation. Tbe northern section of
Meadow Creek parhray and the proposed extension of Rio Road to the Rte. 250 Bypass
will carry ndar$ 17,700 and l'9,600 ryd, respectively'
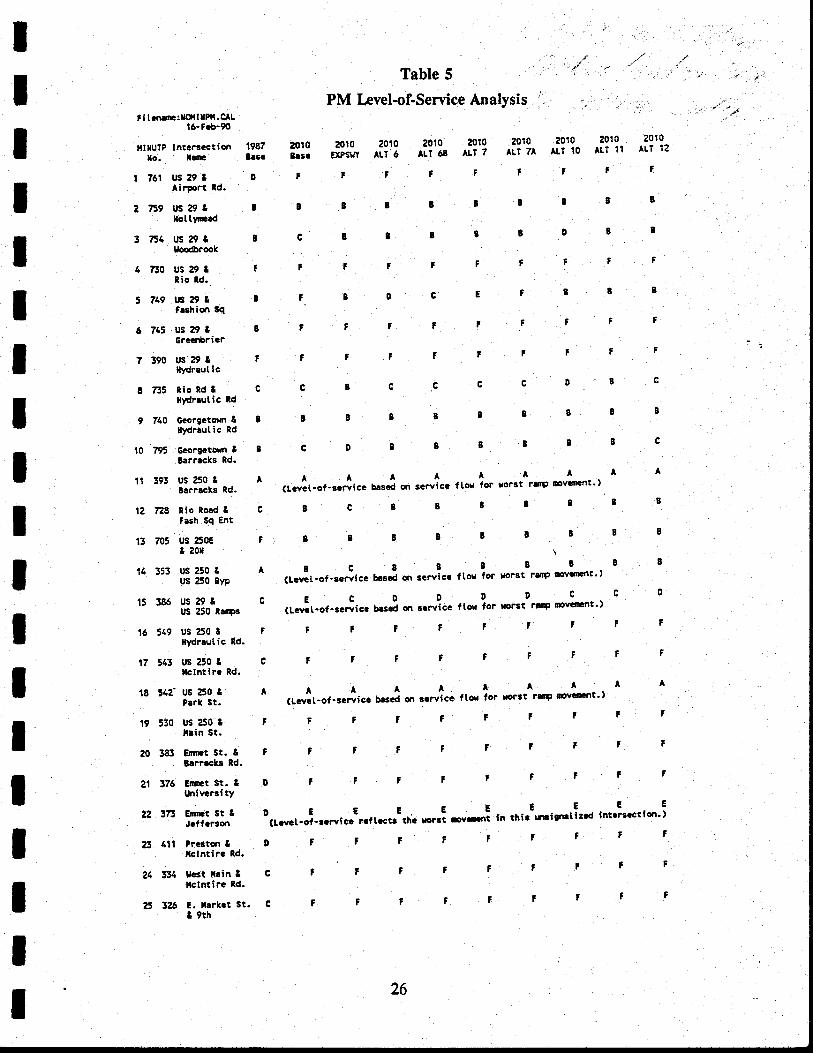
Under the Base Case, 16 out of 25 selected intersections within the study area will
operate below l-os D during the evening peak (Table 5). It clearly suggests that the traffic
congestion in 2010 will be severe in the central city and the northern parts of the study area.
Along Route 29 north of Hydraulic Road intersection, during the PM peak five out of seven
intersections analped wiil experience severe delays at LOS F. SimilartV-r the 1mP ":1""::
250 Blpass connecting Route 29, andthe intersection of Hydraulic Road and Route 250 wiu
be operating at I,l}S E and F, respectively. Farther south along Emmet Street, levels of
service at Barracks Road, University Avenue and Jefferson Street intersectiors will
20
IIIIIIIIIlIIIIItItI
Figure 7
Base Case 2010
ROUTE 29(e,p n ir ilci:o)r $ft $idl}e
Base Case 2010 TrafficIncludes All CATS Elsu Recoumeudetions
21.
,rrttr0trra0a
1:t:iJ'tr- ,$,
n'o LJ=iJoo
I Sbeetg ia NetworL
0O.O la-DT {Tbor'raanaa}
B:3:! 5JOD'ii€!3=ol.il;
o
'\ i,\
.\:=..__--2,..;..:_-::s.r\ E;r ".r',:', \''.; i::i i'
(\.+:.s!
co(o
€d?EE: F->-iHgEo=*E
IIIIIIIlIlIttIItItI
c)cF{eFacdti
E{OF{:oc.l
Fq(0q)
+l(dFI${q).l-)
7\l!
I
!t
-t'-
=z=
\
ii!j
1':./,..:rirl
'" :i>'' 'ii. r"-
),
:IE!sill;
ev?
R ''.,:'g:;ff*'
q)c'+-{cHcSFl
F-tOF,|Oc.l
(l)(l)
-pcd
t{(l)
+.)
o!3;$ eE.Ee16Fir;o
r(\t*.;),.
>\*ir7$
/ l..Y
c).F
o*(gtrLo=
? !t €5 :; E
,i si:r i!
=rlE
)\aaaa.ttllttttt
tt'
Lf-i
€0
ro
t?', \on*"\
i)\.**.*+,
ii. I,\ ",il ;'
i\i.--.,it\.,' i
(g
=oooLo.xIU
g)
o:aJ(Egbo=
ir.\9:
z'c
IT
ttIIler* ct-
l* oL',I ;F:
I Fg Eo.
l:ti
El*IIIT
I
o!z; & iE!€.E6Fir;()
(lil
I.
liIIttI
olsF6
I eEo=F(6I s: E
r '?F glgEls
ItIIItI
(.)c,{-{
t{E:1
O
c!'
(l)
{JcEtrt{q)
*J
J II-, ^.1 \.'^, 7='4rr.......r"J
', .*
'r'/ (
e !€:E JE
s !i;r !!'I lr
r..:\.. il\\l
\ t--t*' ;';*\
\,...\\\\. I
i:. . i"^\
Ki "\.**o;i
a)e{-{c,F{cgt{
E{OOC\l
hcd
FU)u)c)l.ig.Xr-']
I
''..i;). roro
rcr6lt
\.-. c!,Lt?', rt?\ i.<.i
a
{'iiiirJ,*rt_.. {.iiJL.^, >3".)i\(l
!iT!-a.')7
I:;ll;o
""-* rZ-1
----?-|-"I
t(t\l\!\I
ItIIIIIII ,:
.Fs-fI !Ec.F=;I r,.Rg
IIIIIItt
q)t+.ac+r(gt{F
olc\q)
-lJcd
t{q).lJ
=::iamE::a
ll/(tl
! o!..-ai'r'rfr
q)rH(+'acSt{
F.toOc\F{F{(l)
.f)c6HLq)+)
i'r ".,
:-T,'2
IIIIIIIIIIIIIIIIIIt
Table 5
PM level-of-Service.Analysis ". ..,, ., :,t i tc.ratlrltlol t IPL. CAL
15'Fcb-tO
tltrulP tnlcrs€ctidr 19E7 2Or0 2010 2o1O 20'lo 2OlO -2010 aO10 mlO 20t0
io. lte 8.s€ Ersc Expsln ^ii'i rii'ie [i-i rlr zr
^Lr 10 ALt 1l
^LT 12
| ?61 Us29t D t t ? ' ? t ? F I
Airport ld.
2 ?19 US29& I 3 t 3 B 3 8 | 3 B
[ott]tEd80883 ?!a us?9& B c 3 3 B g
' Uoo6rook
4 lfo US29t ; t r ; F t F t F F
Rio ld.
5 769 USAI I F- r o c E t s 3
F|shidr sq
rt 745 US29& 3 F r t f I r t F F
arccrorier
7 390 Us29 2 F I F f F t F f ? F
lydraul ic
8 735 RioRdt c c B C c C c o 8 c
llydrrutic Rd
9 740 Caorgatom& 8 I I I B I g I B B
[]dr!utic nd
l0 ??5 Gaocaeto$r& B C D 8 I ! B 3 I C
3.ffacks Rd.
11 393 US25o& A A A- A A I A A A a
iarircks Rd' ^ t"tlt'ot-"tiit" uasJ on "t"ti"t fton for r'orst rsrF Dv6rcnt')
12 ??8 tioRoad& c B C 8 I t 3 3 B Ifash Sq Ent
t3 705 Us250€ F I 3 3 B r I 3 I B
t20x \
14 353 US250t A B c. I I 3 I 3 3 Its 250 8)tr <teit-or-r.rti". ucsca on scrvica ftor for *trst radP FvgrErit.)
15 386 Us29& C E c- D D q o c c o
us e5o n!flF (tavit-or.r.""ic. uasJ cr 3crvicc fton lor lor3t rr4 mv.mnt.)
16 549 US25o& F f r f F f t ? | 7
. Hldrrutic Rd.
t7 543 US250& c F t F ? t t F F F
|tctntirG Rd.
1E t42- US$o& A A A- l l A a A A A
P.rk st. <t'evcf 'of'scniec besJ on rcrvicc f tov for rorut lrtP Fvganrt')
19 530 US25o& F F F t F J ? F ? ?
t.in St.
tFiFttF20 383 Eflttt st. t t F Ilsrr.cks nd.
21 376 an:!st.! D F t ? ? | t t ? ?
txritrcri tY
22 373 E@tst& D E E -. E E E E E E E
.JeffGr.o.r(Lcvct.of.rcrwiccrcftccts-thr,.o""i-'.-'.iinthilrruigrllizcdint.r6.ctio.r.)
23 6tl Prstmt D t ? | t t t t t J
tlclntlr. Rd.
"*ff:.!::".:. c t ? F t ' ' t t F
E 325 E.I!rk.tst. c F F t t f f f ? '
t 9th
26
ItttIIIIIIIIIIIIIII
deteriorate and reach Los F. Near downtown, three major intersections - Mclntire/
preston Road, West Main Street/Mclntire Road and E. Market Street/9th Street -- will
experience PM congestion at LOS F.
The traffrc impacts of each alternative on the Route 29 traffic and at major
intersections are disctlssed separately in the following section-
6.0 EVALUATION OF BI]ILD ALIERNATWES
Acknowledgng that the principal objective of each candidate Build Alternative is to
ease traffic congestion along Route 29 north, a comparisonbetween the Base Case and each
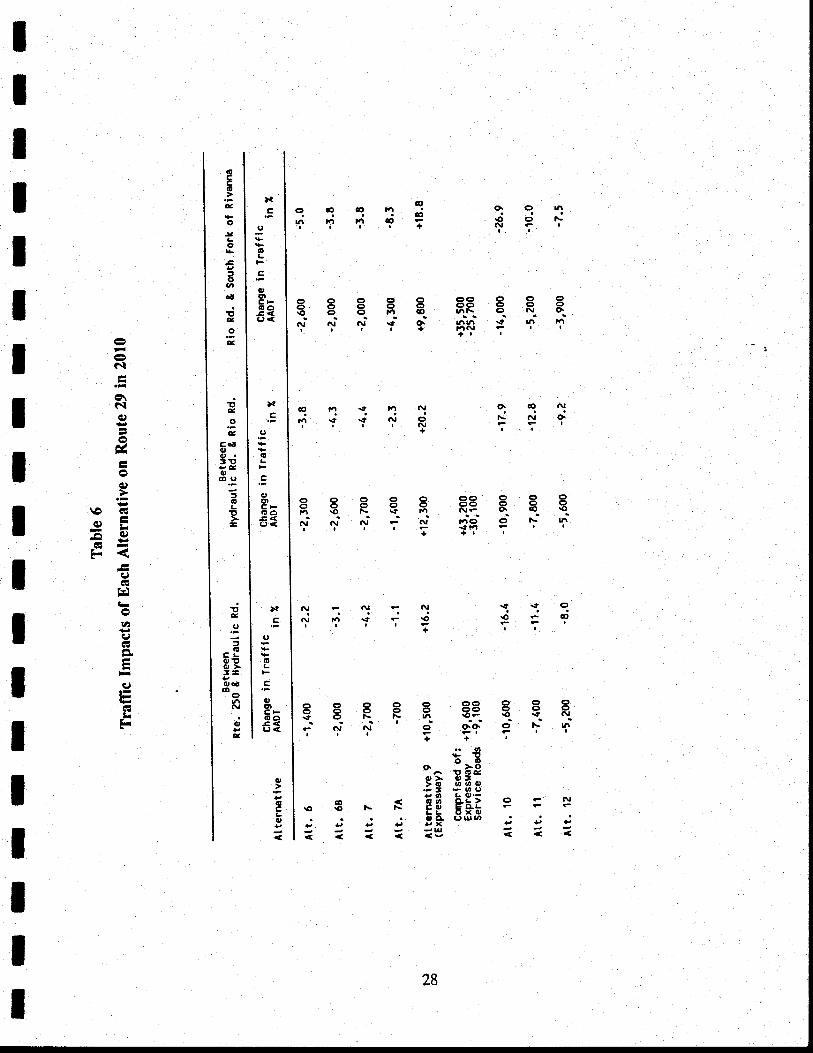
alternative was undertaken. Table 6 summarizes the anticipated changes in traffic volumes
at three locations along Rte.29 that might result under each Build Alternative. In addition,
Tables 5 and 7 display the morning and evening peak hours LOS at each of the 25 selected
intersections for each of the alternatives. The findings of this comparison are discussed
below.
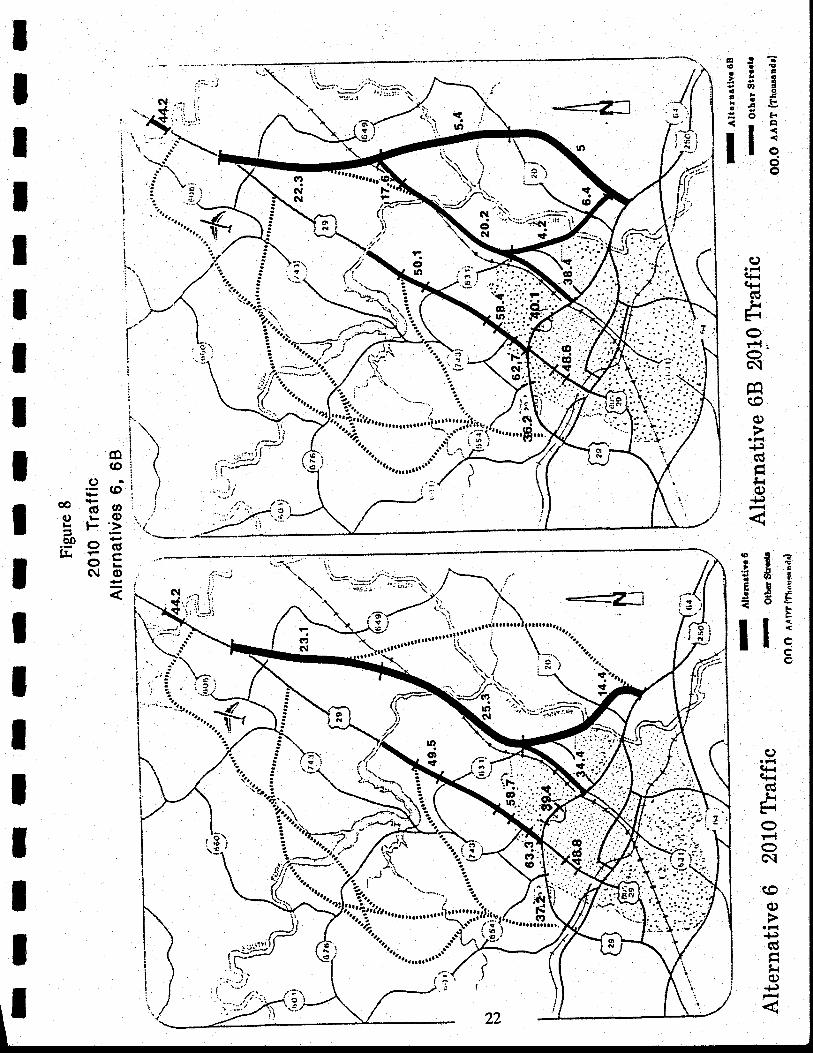
Alternative 6
This alternative functions as an eastern bypass for Route 29 andcoincided with the
CATS proposed alignment of Meadow Creek Parlnvay. It will carry between l'4,400 to
25,300 vehicles per day (Wd) in 2010 (Figure 8). The construction of this alternative will
have minimal impact on Rte. 29 trlffrc. Within the most critical segment, Hydraulic Road
aqd Route 250 Bypass, it would reduce daily traffrc by 2,300 vehicles (3.8Vo) in comparison
with the Base Case (Table 6). Due to the small reduction in traffic, all five critical
intersections -- Airport Road, Woodbrook Drive, Rio Road, Greenbrier Road, and
Hydraulic Rbad - along Rte.29 will operate at an unacceptable LOS during the peak hours
(Tables 5 and 7).
Alternative 68
This alternative functions as an outer eastern bypass along with Meadow Creek
parlcrvay. It is estimated to carry between 5,000 to 22,300 Ypd in 2010 (Figure 8). The
middle segment of this alternative, which runs parallel to Meadow Creek Parhray, carries
the minimum traffic (around 5,000 vpd). Compared to the Base Case traffic on Rte. 29 in
2010, Alternative 68 would reduce nearly 2,000 vpd from the segment north of Rte. 250
27
O.otn€olt|\lF.
EEEEq FFERE€- o- o- tl E_
T T T f ? NN i ? ?+r I
O. aO |rI1\NO.
I
ggFeH Fseg€-".i' ;' N' -' ^r' n'e: d f' a;-;.rrFrtl'l
+ +r I
.tt .t O\O(o
?qet'.!3?T??;
coFt\rnNr|rt.C(\Iq
N'+
NNt\I
":;.;J.drltle +
e E F F A sF-€.e.R.i ''- -t-
t E' T ' '
E€o^ ohEO>. A,'>o o6sEa T\3
o\o 5 F ts Eg Fgbo o cruJut -: -:ttv!t---!rz:=ise=z
28
)ac
u
oFcoo)CF€63<,tr<
6Eo
eo:o
stv,.a
!4o4
It&oe
Coaocr.'E9eq,ro(,
oI!-
!4(,
ECL{, ttcr>3-e, Gato o
o4
xc
o
GL
c(,otCF.!o&<(J<
xc
()
oLFcrUt'lCF6at<u<
o
6cL(,
IIIIII
(\I
o\GIg)
o4
o)>\0 €!
.JE L'- €):3FE-
q,
tE
t2q)6
q)
cttru
IIIIIIIIItIII
IIItIIIIIIIItItIIII
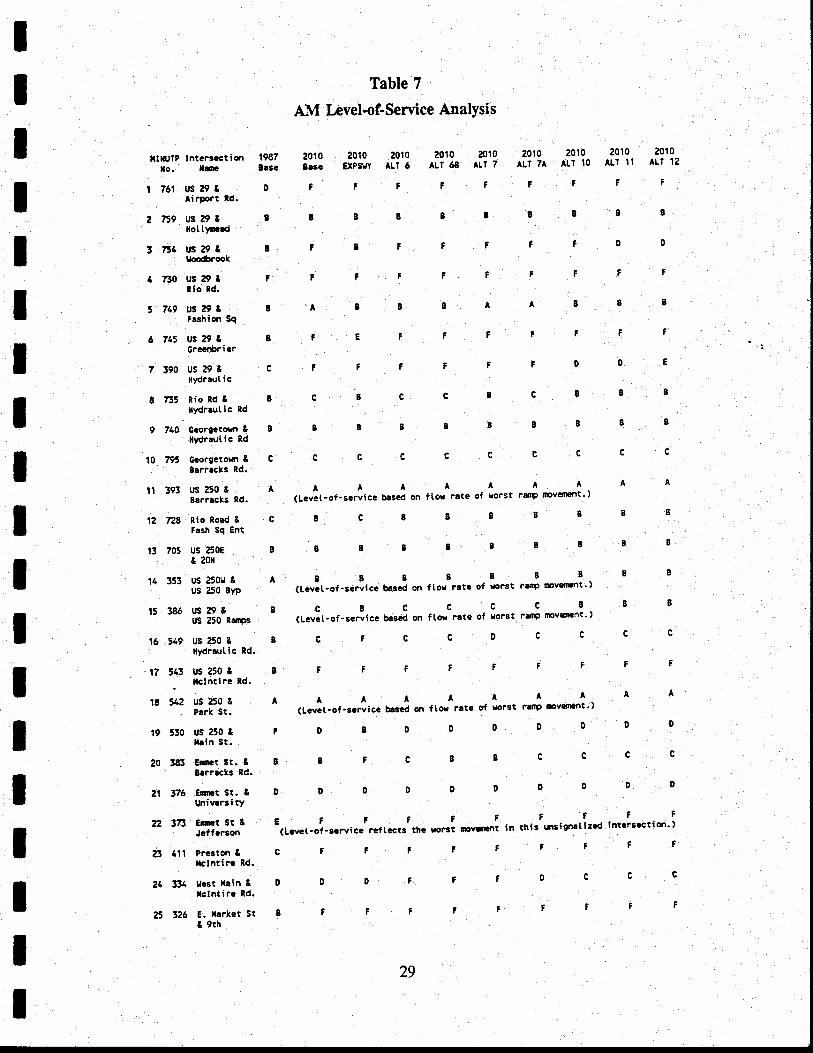
Table 79t
AM Levelof'service AnalYsis
llo 2010 2010 2010tfttfulP tntcrs.ctior'r !n7 2O1O 2OlO 2010 2010 2010 21.-'l;:' "";;--'= gas. ;;; E$srry rli i rlr ee ArT 7
^Lr 7A
^tt l0 ^Lll1
ALr 12
1 761 Usegt D t t F ? t F r ? ?
tirport td.B B '8 82 759 Usagt 3 I B 3 I I
llott)'E!d
3 ?54 USat I F I r t ? F ? 0 D
tloo&root
a 73o us29s F F f f ? | t ? f ?
tio Rd.
5 749 US29t r -A I 3 B l A 3 B B
tashicr sq
3Btlf6 745 uS?9& I F E r r 'Grac(bricr
7 390 US29& C F ? F F F F D O E
ltdrrut i c
! 735 nioRd& B C B C C I C B 8 s
lydt'eutic Rd
9 740 Georgctosl& I B I I B 8 B B 3 B
10 795 GcorEetorn& c c c c c c c c c c
Barr.cks Rd.
AAAAAAAAA(Larat-ot-"aatica based on ftov ratc of rorst rsnp novcnlent')
8c8888838
B!3883888
A 8 I B I -s B 3 I 8
(Lcvct'of'scrvicc bascd on flor ratQ of eorst Panp novetnent')
t5 386 US29& B c B C c -c c B B B
usz5oRat|ps(Lcvet.of.servicebrsedonfto|rlteo|rorst|atpnovenent')
16 549 US25o& I c F C c D c c c c
iydrautic ld.FFfFl7 543 Us250& ! F F f F F
. Iclntirc Rd.
lt 562 US25o& t A A A A t A A A A
Park St. (t'cvet'ot'scrvicc bssed on ftor rate of uorst lelp tpveiFnt')
t9 530 US250& I D B D D 0 D D o D
l|.in St.cccc20 383 €mrtst.& B I F C I 3
Earrlcks Rd.
21 t?6 EtrtrEtst.& D o D D D D D D D 0
-' -'- Univirsity
22 377 Etrt:tstt E F F t F F I ? F
. Jrffcruon (Lcwt-of-scrvicc ratt.cts th. ,orai -t*tt in this rsignttir'd intlrscction')
23 411 Pr.stdr& C ? F F F ? ? t F F
tclntire Rd-
24 334 r|€stlain& O D D F ? f D C C c
l|ctnti re Rd.
25 326 E.tlfft.tst I t F F F F F I F F
t 9th
11 393 uS 250 & AEarrrcks Rd.
12 ??E Rio roed & C
Fash Sq Ent
'B 705 uS 250E B
& 20x
14 353 US 2501J &Us 250 B),p
29
IIIIIIIIIIIIIIIIIII
Bypass. This small reduction in Route 29 traffic will produce an insignificant impact on the
operating conditions of the five intersections identified as c,ritical (LOS F) under the Base
Case (Tables 5 and 7).
Alternative 7
This alternative is an eastern bypass that overlaps the CATS alignrnent for Meadow Creek
parhvay and terminates at Nelson Drive on Mclntire Road. The traffrc forecasts along this
facility will vary between 23,200 to 36,400 vpd in 2010. The most travelled na.rt 1l
tuis
alternative is the southern segurent which runs parallel to Rio Road and diverts significant
traffic from it. In general, the impact of Altern ative 7 on Route 29 tefficwitl be minor and
of slightly higher magnitude than other eastern alignments (Alternatives 6, 68, and 7A)'
Most of the critical intersections north of the Route 250 Bypass will continue to be at LOS
F during peak hours (except woodbrook Drive in the PM peak).
Alternative 7A
This alternative is identical to Alt.7 but carries stightly lesl trafc.due to its
termination at the intersection of U.S 250 and Mclntire Road. Traffic destined to the
central city finds Alt. 7 slightly more attractive compared to this alternative. Again, the
construction of Alt. 7A will have only a minor impact on Route 29 traffic as shown in Table
6. The intersection LOS analysis indicates that the five critical intersections will still operate
at LOS F, except for the PM peak period at Woodbrook Drive.
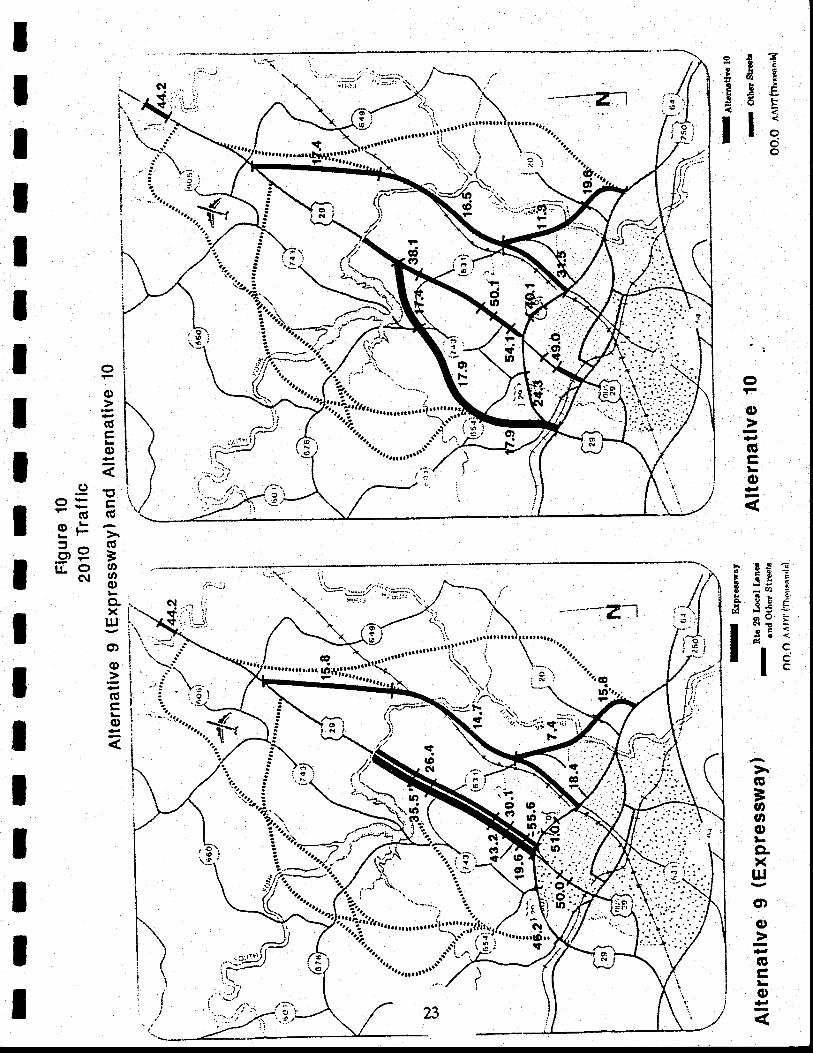
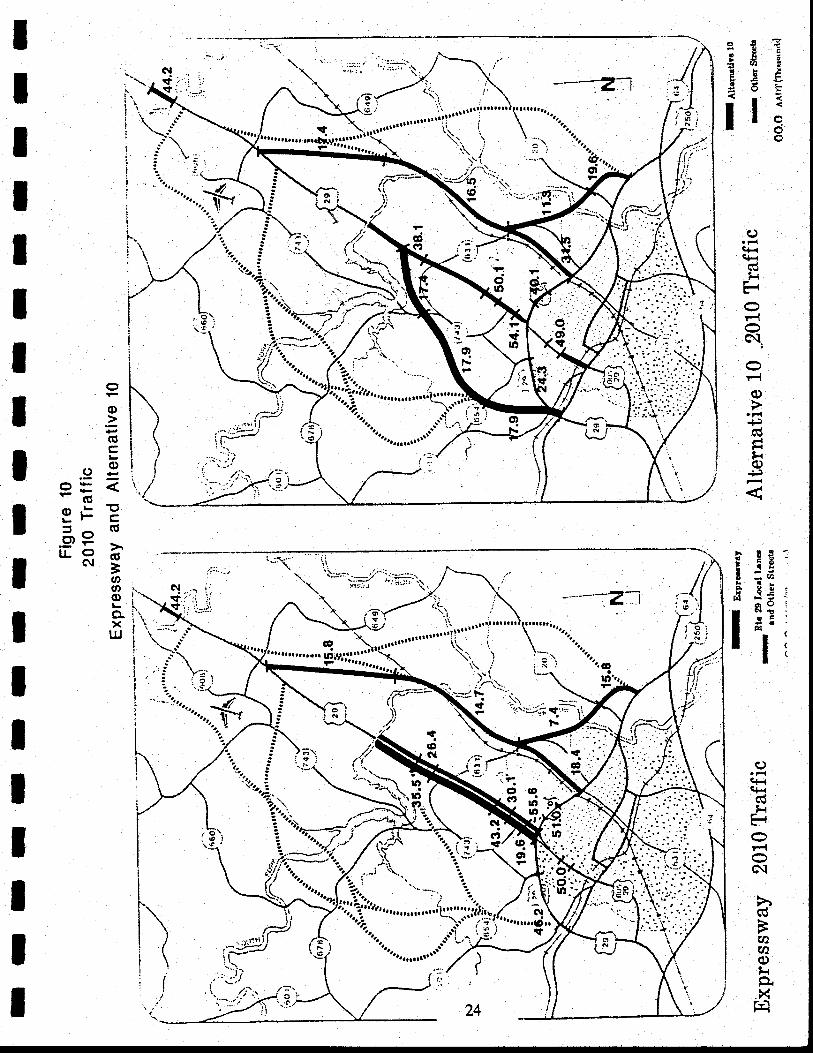
Alternative 9 (Expressryay)
This is an urban erpressway with four "express" lanes and six parallel service lanes
running along the existing alignment of Route 29. Beinga high quality service (60 miles per
hour), this alternative attracts even those who would use Meadow Creek Parlnvay under
other Build Alternatives. The end result is that it carries the ma:rimum traffic compared to
other alternativer. ftaffic forecasts along the express lanes vary between 19,600 to 35,500
qpd (Figure 10). gimilryty, traffic in service lanes is predicted to be in a range of 26,400 to
55,600.
The intersection LoS analysis suggests tbat the express lanes will operate at
acceptable levels of service but severe traffic congestion is anticipated at several
30
IIIIIIItIItIIIIItII
intersections of the service roads and cross streets. The three at-grade intersections, Rio
Road, Greenbrier Drive and Hydraulic Road, will operate at LOS F or below during peak
bours (See Tables 5 and 7). With the addition of through lanes on the service Roads,
Greenbrier Drive intersection is found to attain LOS B during peala but the intersections
of Rio Road and Hydraulic Road maintain I-OS F in the evening peak.
Alternative 10
This will be tbe inner western bypass of Route 29 thatwill service between L7,400
to 12,900 vpd in ZOl0. With Meadow Creek Parhvay in the east, this alternative will
produce the greatest impact on Route 29 in terms of the magnitude of traffic reduced. For
instance, tle construction of Alternative 10 will decrease almost 10,900 vpd between tbe Rio
Road and Hydraulic Road segment of Route 29. This reduction in traffic volume represents
nearly 18 percent of the Base Case traffic (Table 6)'
In spite of the significant reduction in trips along Route 29, the critical intersections
continue to opetate at unacceptable levels of service'
Alternative 11
This alternative will function as a western bpass and carry between L2200to 19,300
vpd in 2010. It would have somewhat less impact than Alternative 10 on Route 29, as
shown in Table 6. The reduction in traffic does not improve operations of the critical
intersections (Tables 5 and 7).
Alternative 12
This will be the longest and outermost western alignment. It is expected to service
between 9,500 to 15,100 ypd. Compared to eastern alternatives, it would be more effective
in decreasing Route 29 traific. It is reflective of the fact that the availability of both eastern
and western (Meadow Creek Parhvay) blpass routes emerge most effective in satisfying
Route 29 users. However, Alternative 12 will produce less impact on Route 29 than
Alternative 10. As with other alternatives, the critical intersections do not exhibit LOS
better than F except in the case of Woobrook Drive.
31
IIIIIItIIIIIIIIIIII
7,0 EVALUATING IMPRO\M,D BASE CASE
Further analysis was undertaken to determine how the intersections along Route 29
would perform if they were made grade-separated interchanges by year 2010. Instead of
intersection LOS, the arterial LOS was calculated for Route 29 betxeen the Route 250
Blpass and Woodbrook Drive both with and without grade-separated intersections- Ttprocedure of tle Urban and Suburban Arterial analysis technique as prescribed by the
High*ay Capacity Manual (1985) was applied. Several technical assumptions were made
including the exclusion of Berkmar Drive, Dominion Drive and Seminole Drive from the
analysis. The analysis was done for the direction carrying the ma,''cimum traffic during P1t<'
Table g shows the arterial I-oS estimated for each alternative under consideration.
The addition of grade-separated intersections along Route 29 improves the northbound
sysning peak period I-OS from F to A or B, depending upon the alternative considered.
32
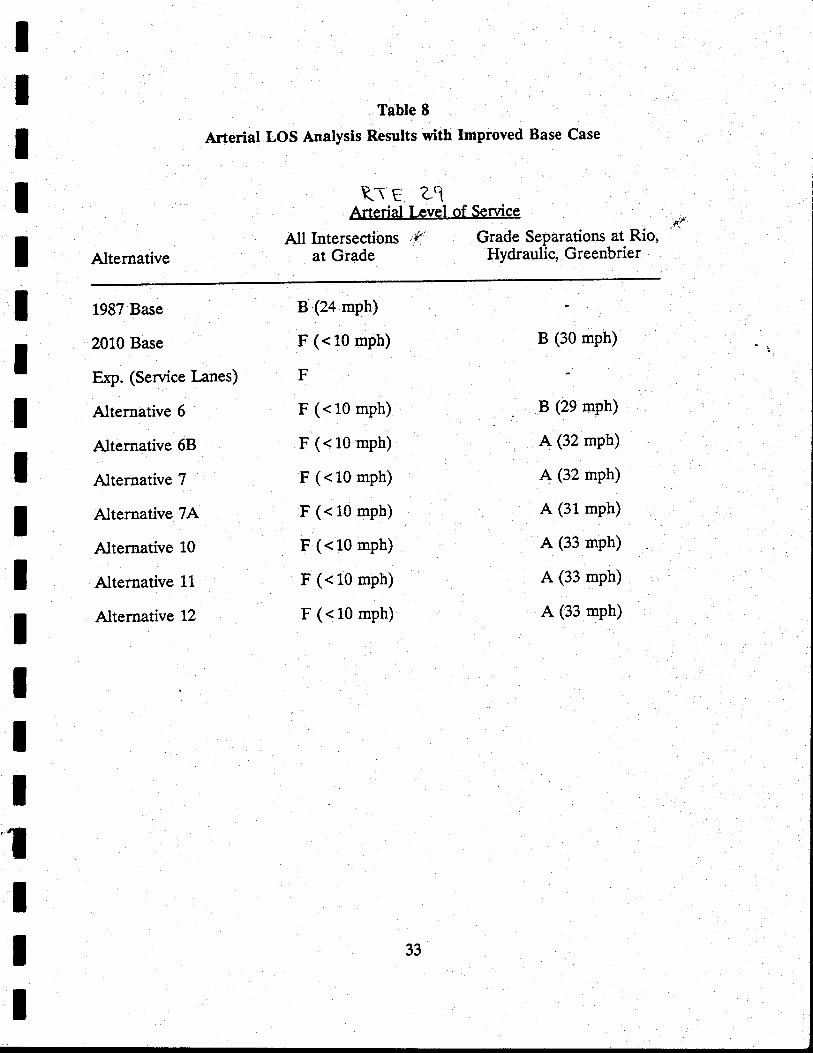
Table 8
Arterial LOS Analysis Results with Improved Base Case
Alternative
RrE aqArterial l*vel of Service
All Intersections -'{' Grade Separations at Rio,at Grade HYdraulig Green-brier
1987 Base
2010 Base
Exp. (Service l-anes)
Alternative 6
Alternative 68
Alternative 7
Alternative 7A
Alternative 10
Alternative 11
Alternative 12
B Q4 mph)
F (<10 mph)
F
F (<10 mph)
F (<10 mph)
F (<10 mph)
F (<10 mph)
F (<10 mph)
F (< 10 mph)
F (<10 mph)
B (30 mph)
B (29 mph)
A (32 mph)
A (32 mph)
A. (31 mph)
A (33 mph)
A (33 mph)
A (33 mph)
'ltII
33

lrIIIIIIItIIIIIIIlII
chs rlotterville/f, I lems rl e (ounty :
poftotion SurveYs
IIT
IIIrIIIIIIII
tIT
APPENDIX A
Appendix A is a compilation of four traffic suweys conducted for the Charlottesville Area
flansportation Study. Each survey comprises a separate section, some having appendices
of their own:
I. Windshield/Travel Time Survey
II. Shopping Center Trip Generation Suney
m. Household Survey
fV. External Roadside Survey
II
APPENDIX A
SECTION I
WIND SHIELD /TRAVEL TIME SURVEY
\
It @ APPENDIX A
(}(}mststtIIIItIItttIrIII
; i 5A| CE a F3 iA ; .'E tr w t SU'IE 'C:
""'r a;:ci,
"4AP ! :At: : ?CgC:
t3C1 , 933.9: i'
February 17, 19Eg
Mr. Ir-ike lJalepaSt.:ee-- Traf f ic S-'udies, L--d.l7t7 P.eis'-ersto'"in Roai, Su:-te 2955ai;:nore, f,arf ianC 2i2Ae
srrriec+-: E>recu--ion cf T'asi: 2 unoerrv>)
Da--a Collec:ion Se:a'ices,
I-3
Coie: 1!63 -3 -2
STS Subccn*-ract fc= T'=affict. n^--.i
^^- C-!r.i.,'
.t".s. Z> UU--Igv! seuyr '
feel free '-o ccn:ac-- rile a-'
Dea: Il:ke:
Pe:SUan-- tO OU= +-eiephCne Conve=Sa'-i-cn toiay, enCiCsei ,preasef inc --he worl: Cesc:iftic::s f cr the !f insshieid anC. :=avel :!ne-ii""i't to be acccnplishee unier T'asi: 2z Travel- Tine Rur's' liewculd appreciat,e retElving su:i/ey resul:s by --he r.iqcre ci Y'arch19St.
If you have any ques:lcns, PleaseF-l l(JUrj >iJ->zLL.
q j nne-o] t'- j ,
\\.)qA-1,'*v -. \
.jl-- li. BajPaia42t = Ee?..8..s: v-
T=anspc=--a-'i on S --ud ie s
JN9: es
Enciosure
l',asnrnci:-. D.3 Se^;te.Crsc:
IIIT
tT
tttIIttIItII
APPENDIX A
zu:Pose:
Furpose:
Route 29 Nortb Etudy - I{indsbield survey'
A ttwincshielc,'su::vey wllI be conduc*-ed tO CCfleC*-infot.ma*-i.on On -rhe area t)'pe, f acility '-)'Pe, s:gnal-ensity and traf fic controls on street segments *.o
-bei".i"ala in the highway ne--work rised in :h. stucl'.iiri." nencranCun aescriUes the inf ormation to be
collected as pars- of tha" su5/e)t'
Methooologl':A driversegrtnentsfollouing
and passenger will Crive over tl: lini:siaentiiied on tne a--:ached maP anC col'iec-- -':reinf c:r,alion:
facil:tY tYPe,area --YFe,nunbe= tf *'hru t=avel lanes,nunbe: and i1'pe of --urning lanes, - -l"t't p:chibiii."= a:d, --:-Tne applicable lnc1ud-
ing P.TORAS Prchibitions),one-ir'ay or two-way cpe:a:J'cn.Fr?h6 n3 ?recsir- r^nn::'Ol.gtgE b-u--4v vt"r-v-l
rr-ci--ea -'ravel sPeees, andiaen'-i:j-cation cf significant acjacen'* lanc
uses c! o'.her cha:acte=isiics -*-hich r'ayajjec: rcu--e selec--io:: c= --=aif:cc:rera--ion.
All roadways shown on the attacheq' nap are:-? lei""f"a"a i; --his data collection effo:i' Thcse
="Eo,""t= highJ-ig.it--€d in yellow. on the attached nap areio be the subjjc: of trivel time runs oescribed l-a--e:itt this m"torincun' Roadi"'alzs incluoed j'n the su::veysiioufe le subi.iviceC rn'henevel
"here j.s a cnange trn the
characte:istics cf the roac-*ai'.
Route 29 No=tb St'udy - Tlave1 Tine Sur/ey
This memo=anourn describes tne ne--bodologf io be- useC-:ntne traveL -,-ine'su:1ey for '-ne Route 29N Stuey' ?re:iavel ti::re su:rt.y is intencred' i'o provide inpu*-s ;-c- :hecoding of network- speecs f o: use 1n HinIJ?P. as -well .
as
io-pil,v:.a" info-ration po'.en:1a11y useful in acjus:lngthe'speed / delay fun?t.ion used in the assignnen--Drocess. A thi=i, 'poten:i-al use of tnis oa-.a vcuid be
i"- ""i:.dating :h"- delay est,lnat,es produced' by a:r]'
a=te=iat evalla--ion software seLec-'eC for use i-n thestudv.
r-5
APPENDIX A
METHODOI,OGY:The traveL tine su:f/ey wiil be ccllec'-ed by .st:eetTraf f ic S-,udies, Inc. ind r^'iI1 ga'-her inf orrna'-ion cnpeak and of f -peak travef. times ove: selected rou+'-es.i.a*.her than ccnduct tirned t:arns over the entire ne--wc:):,runs wiLl be rirade over se1ect.eC segment.s of the ne--uc:):and used to de=:ve relationships between off-pea):speed, posted speed, area i]'pe, - f acility type ald=ign"i density Inumber of lignaIs per nrile). Theaeveiopment of-this relationship is preferred ove=-:h'direct' cod,ing cf obsenred sff-pea)" speecs t'o ailc;unUiased sel6ction of speeds f or new f ac:-I j'"ies a::C
provioe a more sys*,eia-tic neans of develcp ingiharacteristics f or new and upgradeC f ac:-li--ies.
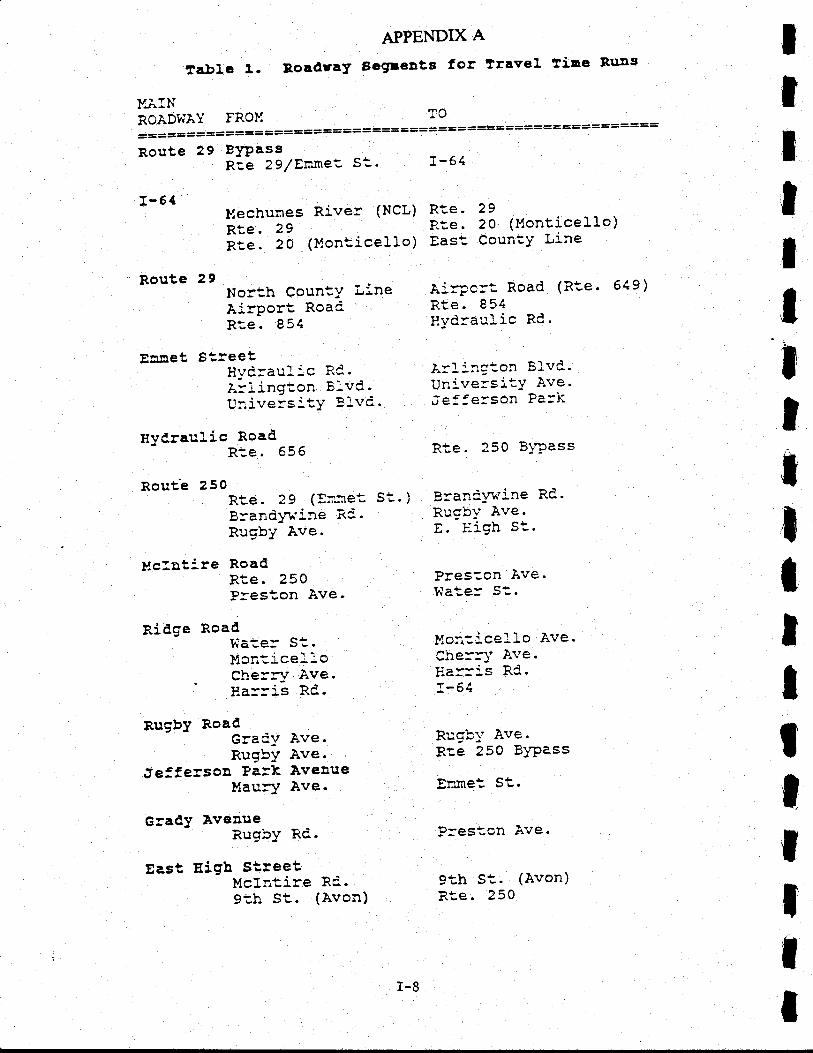
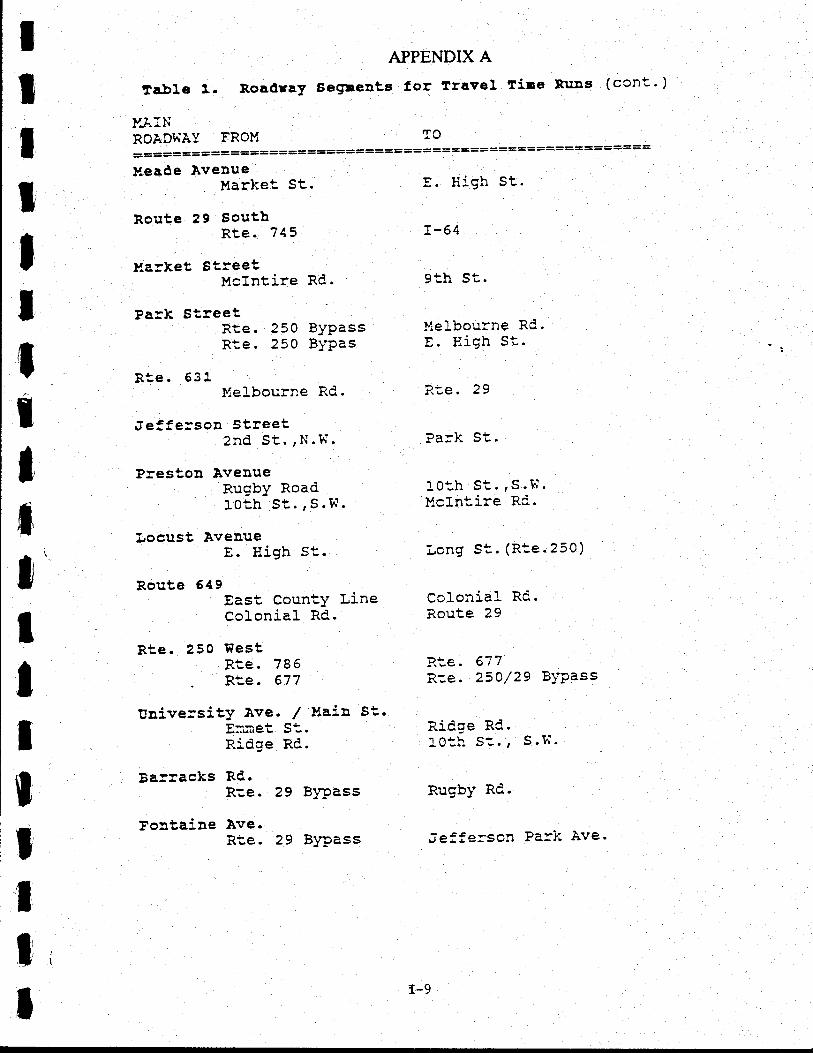
The route segi:nen--s --o be incl"udec i:: the speec_ "i:-Y.i'were cbosen to p=ovide a rnix of area t}'pes, fac:1i:}'types, and signai, oensrty. The roaoway' segment's a:e -'cbe included in t,::is sufley are highll.ghted :-n ye11o'* cnthe a--tached r,ap and a=e f ur-'her ide:':::'iiei in Ta:le 1.As with the r-.incshield su:a/ey, road;ay s€9ii€ll'-s s::cufobe subdivioed whenever --he cha:ac'-e::s--ics change.
For each segmen--, inf crr,a--icn f ron *-h€ wincs:::eiosurvey shoul-d be used -'o charact'erize tne =cac-";a1'
""gltr"ri:. A rnininun of two runs shoulc be conduc:ed fcr
each c.:.rect,ion of. each seginent du=:ng --he oif-pear:.For peak period =uns, a nininun of tvo runs shoulc becondic:ed'in each direc*-ion. The peak runs i^':11 beccncruced in the peak flow ci=eciion. For each run,the start time, 6lapsed tinres and i,is'-ances t'c va=iouslandmarks, docunentat.ion of unexpec',-ed oelays c=eii-i;"f ti"= w:;h the run. A--y:ri-ca1 delays r':,11reguire that, the :r:,n be repeatei. The =un suring u:lchtne iltpicaL d.elay is e>pe!5,enced snouli nonetheieEs bereccrced anC sc ncted.
the "f10at:.ng ca= technicnte[ r':]1 be used in regula--tr::gthe speed o-t ihe test. -vehicie. The c=ive: sncuidaitenpr- to pass as ll'rany .venicles as Pass t'he --es:vehicie. Wbere this t,eci.niqrie is jucgeC by t'he C=lve=to be inprac-.ical (ext,renely to-* volune, t'raffic signalf a:_lu:e,- tra:f ic accioent, a p=ocession cf scnesort, . . . ) I -,he cr=ive: should ope=ate the vehicle a'-posred. lilrit.s uniess inpeoed bi' t,rafiic. Xinimu:r saieiollowing Cls--BncBS, palsing ilst,ances, and reascnabieacceleraiion and. cecele=a'*ion snouid be crse:rree by :;:'ei-.i rra-U-:re-.
Data Fo-rat,s: The d?--E cOlfect'ed as Pa=! oj --he --rave1::ne ancwini.shield su:rrel's should be -,tdrlsfe: :o cOuSlS in bc--::eiec--rcnic and plper fc-r.. Tne elec:ronic ve:'S:'cn r'a)'
IT
I0
IItt0
IIIlIItIII
r-5
IIttItIltil
ItIIItIII
APPENDIX A
be in either 1-2-3 sPreadsheet or dBASE III Cat'aformat. One column (of field) should be used for eachdat,a item coLlected including the major street nane andthe inte:sect:ng s*-reet denoting the segirnent. I: thedata contains any coded info:nation (e.9- A:ea Type =1) , a coding gui-de should be provided :? a] lowinterpretat.ion of the codes used. s?s shoulc veri-iythe accuracy of any calculateC values prior totransferring the files to COIiSIS.
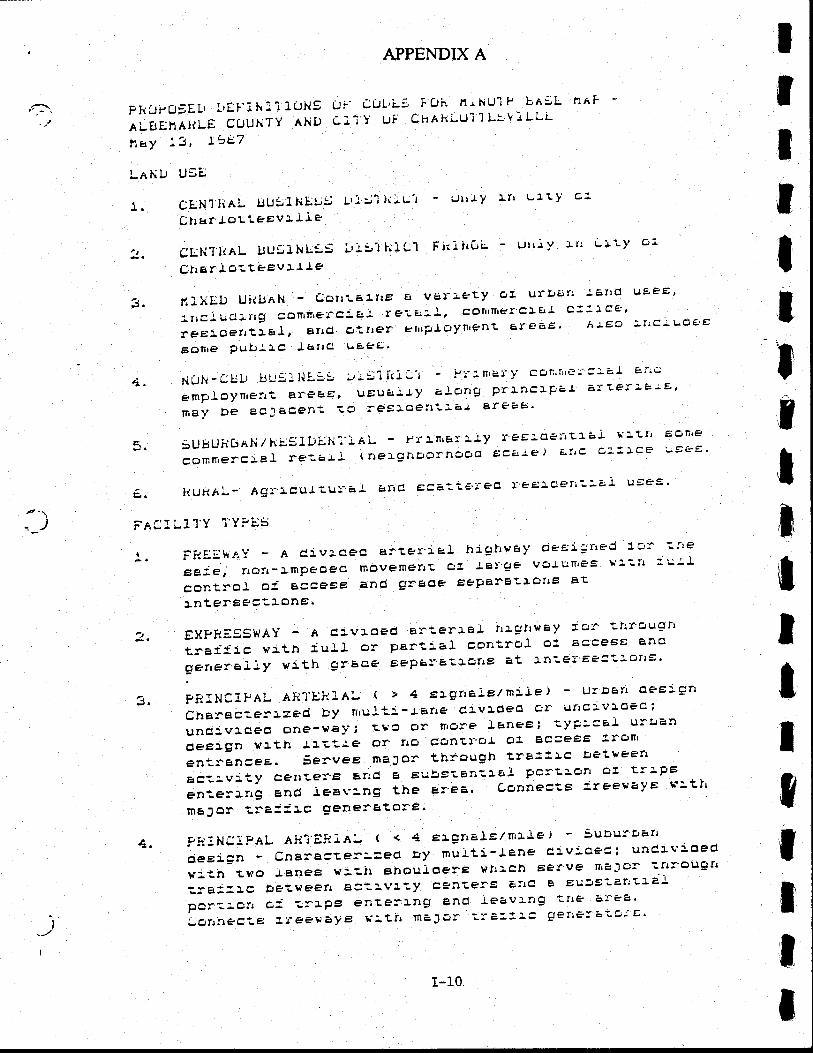
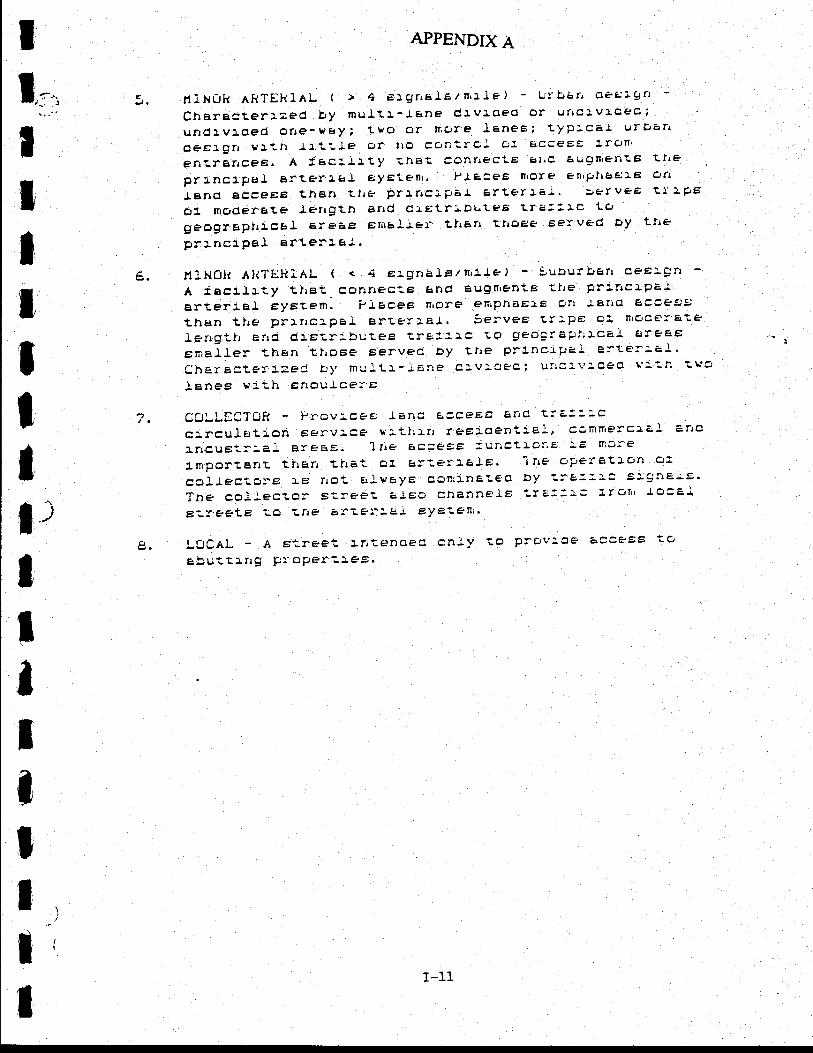
TabIe 2 docu::rents the area t1'pes and f acili*.y +-ypes
which should be used in charact,erizing roadway seg:nenisfor the windshield and travel tirne su=veys
r-7
APPENDIX A
?a.bIc 1, Boadvay BagleDts for ?ravel Tine RuDs
YlAINROADWAY FROU TO
===================-=========== ====:=====:==:== ===:= ::Route 29 BlPass
Rce 29lErune: S:' I-61
It,I
II-6{Mechunes River (NCL)R--e. 29Rte. 20 (Hont'ice11o)
Route 29Nor--h Coun:Y LineAirPort, RoacRte- e31
Ennet 8--reet,HYc:aullc Rd.A=iington E:vd'Unive:s:+-Y Blvc '
HyCrauJ,ic Road,Rte. 655
Rout-e 25oRte- 29 (Enne'- St-')Brandlrn'ine R'c' 'RugbY Ave.
Y-clntire RoaCRie. 25OP=eston Ave'
Ridge Road,rr*ate: S'-.HoniiceLloChe==v Ave.I{a==li na.
RugbY RoacGraolzRugbY
Jefferson Pa=k!1aury
Ave.Ave.AvenueAve.
G=adY AvenueRugbY RC.
East gigb SlreetMcf.ntire Ri.9ch S-.. (Avon)
Rte. 29
East, CountY Line
Airpc=t Road (Rte. 619)Rte. 854Hyd=aulic Rd.
l -'l i na- nn R] atd.A-:-.aq -vir
Unive:siiY Ave-.jeife=son Pari:
Rt.e. 250 BlPass
BrancYn'ine R'C.
RugrY Ave.E. lli.gh S'..
Pres--on Ave.lJate= St.
Moi:ice1lo Ave.Che==1' Ave.!ia==:s Rc.:-oe
Rugbl' Ave.Rt,e 250 BlPass
Er:r:ne-- S-.-.
Pres:on Ave.
9'.h Si. (Avon)Rte. 250
ItIItItT
tII
r-8
IT
T
tItttIiltItI!
?a51s 1.
Y-AiN
APPENDIX A
Roadray Esgnents for ?ravel Tila Ru.as (ccnt' )
Heade lvenueMarket' St-
Route 29 SoutbRie - 743
llarlcet Etreet!'lcIntire RC.
Pa:k Slreet :
Rt'e. 250 BYPassRte. 250 B1'Pas
R--e. 631Melbourne Rc.
ieffe:son Street2nd St.,N.W.
Preston AveuueRugbY RoadlO-.h St. rS'W'
iocust evenueE. High st'-
Route 549East CountY LineColonial RC.
Rte. 250 FesfRie. 786
. Rte. 677
Enive=sitY ave. / llaiD 8--.E:une-. S--.Ridge RC.
Ba=racks
Foataine
Rd.Rte.
Avg.R;e.
Bllpass
Blpass
E. Iiigh st.
i-64
9*'h S-..
Y.elbourne Rc'.E. Itigh St.
R--€. 29
Pa:k St.
Lo:h s-..1s.H.Mclncire Ra.
Long St. (Rte.250)
Colonial RC.Route 29
P.ie.6'i7R-,e. 25O/29 BYPass
Ricge Rc.Lo:h s--. , s.h'.
RugbY Ri..
Jefferson Pa=k Ave.
29
29
!tiI 1-9
.)
ItttlT
titn
ItII0
ItT
I
)
I
PhUPO5EL' LrEl'ilili luNgALEJEIIAi(LE CgUNTY
^}iI)nE y i3, LzaT
LaliLr U5ii
1. cENl'IiAL lJu5l l'iE!',5Ctrar -LotteevitJ'e
APPENDIX A
ui' CuL,L: F Oi'. rl .r irUi P br,il- n'.Fc1': Y Ui' chAhLU] '1 LIV l LLL
Lr.l,:,lli.lu'l - utr-tY arr LltY ca
Urti Y l-li: LitY aa:,. cL:l{'lhAL UU5lhiti5 L'i:"t hicl Firihi'ri:
CfrerlotteEvr'LIe
g. f. lXEIJ UitlraN - llorr"ealrE E vii]-aety o1 urber: iEIrd uc-eE '
arrc.l;ucllrtg corrm€r'caEJ re'iig:l' cornrrrer'cfBJ C::lce'fgEAo€fr-.aBlp Brrd c,+''lef elrrpJc'VnBDt 6IeaE ' f.LEC LrrCilf,O€'E
EOllre Pu!:ac Jarro u5eE;'
4. r.tuli-cLh tjuEil'lLi5 !''L5i ItiLi - P':':r'ary coEifrrE'r'-=t:1--:t'"
employnrert" Br'eag, uEuar'LJy alorrg prrncaPal ar"erLb,:'E'
mey be BcJaceni tc reEfoentaa'l aresEj'
5.>UBUit6n}i/huglL,Llti.:AL-J.raIIrB:-al}r-.tElo€):rt13J$IttrEcfit€COmtrrercf a] re:aii ( neaghl'O:'hocro ac-'eJ e ) LIrC C1! lce ugeE '
E.}iUHAL.A-g:.1cuJi'u:.E:.tanc,ecaat€.J-.ecr-'eE}oeri..].Z.iuges.
FaCI L11'Y '1'YFES
1. FHEi:'kaY - A clv:cec erter'ie] h:'ghwey oesigrred 1or trre
f'jeaerrlorr-Impeoe6InoVSfiErrSeSJBt"geVOJllllrEg!1-gfi:u:'Lcontrol- oj ac,c'eaz and grBoe eeparatf'orrs B-g
intersec*-aont'
2.EXPRS5SWAY-Aclvastderterrairl].ghwayicl:.t|tr.ouQrrtraJJic l'ith rul-I or partial coniro] o: accesE anc
gl""t"iry with grec e seFii:'a-'atrrra tst lrraar'sPci'aorr5'
'J. PRINCIPAL Ali'i'EF'::'AL ( > 4 r,tg:neLl-/mrie) - t1::::-::"=S"Character:=,ed by rnult!-'!arre "t"1::o ""- :::::1":"tundavlcredorte-va}itU.]orIrtC.Y€-J.Bleti-s}pl,C3.Lur!andeelgn r':,tn Ja-'t"'Le Or' rro COnil-'O'L Oa ACC9EE SfcJnt
en--rances.ServesmaSorthroughtr'a!3acE'etveerrBc-.av]iycerrter'gBr:degu!rg:.an-.ra]pcr.trortolt:aPa;;;;;;;; end reav:ng the er.ea. CorrneciE :reeirayE s:t'
mBJOr l:'e:j:-c generst'or'e'
1. PHiNrjiPeL Ali'l'Ei{rAL ( { 4 e)'grralE/ma'Le) - 5ulur'r,arr
cieeign-Cnaracleri=edbynuiti-]enedavio€diuncivioed}f]--htt'o..r-aneeY,::lrBhouioereYiltcngerveTlrtsJoltlrr.oUGrt-s6-+tF betveerr ac:ava--y cgnterE artd e Eu:lgtar:!l3Jb; E---- /arrg *-!re ar-.ea.pOrtlOrr A= i'r'apE ElitalAh$ Bnd J.ea\
cortrtec'-lar-eeHaleiiltirmeJc'r:Ia:34c3€rrEra:ao:-E'
r-l-0
t APPENDIX A
> q E1!rr[rl'gzn,r],e) - Ul-b€'r, ctef':igrrg NlNOK ARTEKlAL (
l)
IT
IT
ItI
ttII1
tT
I
.,
8.
characterazed by muJtr-1tsne dlvaoeo Or ufrclvlceoiundrvt oed orre-tJBy; tvO or rnore Janes; tyPrcaf urDsrr6er1Qrr bft|).!l.t'-Ie or r)o cont'rc'! cl gcceEE :.ronterr'-fBfrCeg. A :!aC:l,ity inA'. COfiIr€C'sE al.C 6\.!Itre'll*sE tIrEPrlnclpt|iar.terra.Leyeteni.Placee||rorPenrplr6E}EotlJ-BIrCl AcCeEB than tlrt prlrrclpal Erterl6J. SetveE tI IFJ6
oa mocter'Bte Ierrgth arrd dastrj'tll,ttia tr'a:1fc togeogr'BFlrlcB] ar:Eae ErnEJiet' ttrBrr thoE€ Eerved Dy tfreprlrrc1'PB] ar'teria.L.
niNolr AITTEHlAL ( < 4 elgrralB /ntaJ-e) - :uSurbarr oes:grlA tacalaty thet- col:Ir€ctE encl Buglr'entE -sftE Frrarrcapa.tAfteraal tyEtem. 'f LBCeE IITO1^El enpfiatl€ Orr .LAIid ACCeggthan tlre prrrrc:.PaI artetfel. Servee trlPE ol-. nroce:a-.eie.ngtli Erro dte-.r:.butee trellac -uo 9eo$rApfiaca.L Ereatrnalfer then tlosP 6erved by the prlnc'Paj' erter:al'characte:-a=ec !y mu.Ita-iarre c1v:ciec; uri::vloeo \':--n t'*3Janeg tta--h Enou.Lce:'E
C!:-LtrCTtlR - Prov:cee -Land a=ceEE Errd t'ra:::cctrcu.IErtlon esrvice vltlrarr ret:'oentiaf , conmersaal trro.arrculrle.t ere6E. 'l lre ac=e9E iUric'iLor' a 2'E mSre
lrlporttsrrt tlrBrr tirei' oI ter*:€raaiE' 'lfre operBtroncsJlecto:re ae rro+u alw6yE donrinEleo by --:\e:::c 9:-gner9.Tne co:trector E-sre€+s a'Lto channelt ira::!c irorrr .!oca'iE^'-:'eelE- tcr tnP a:'te:'lai E!€ltnr.
LgcAL - A s--reet lrrt€rnoed on.Ly to prov:ce acc€itE --s
abuttarr$ Fr.. oPeI --:.es.
Ir-11
APPENDIX A
WINDSHIELD/TRAVEL TIME SURVEY
RESULTS
r-13
ttItII
E s rEE=
o !-oF
4.e!a 6c o>.-occe' eaac
- .-!aaoo>>ao !.F
-.o!40cJ>.-3Geeeo-e-
.-!o 9g E< !o-
-.o€G 6C O>.doGCec@e
€!'!osg6ea6e
LO>otc>,e.c
-e6>!g,o=c
F
=s€IJ=3A = -6lrl oaF d s'i
-q1!:16\-! aoo!gacc E-g e$=
gi
= 3aGL'+uGooo
-cY!-J
A sgs_ _4ts'6
6g
=ct boF9 0-'oot'LO
g-
.': "': y: !?'? n q c : "'?
: q - : : I :e : I : C ? "': : : : : -: : : : ? I ?': : ": ? * ? q e q tjiRsR=FSsiB3tsDltS;iFcbdsisHE;j*s*=3E3FF=;s=se*
6 - q'! |? e q g : ? ? r? a t ? ? a ? ? -: o ft e a € + o o E e o e q c q c I ? 3 :=',': : C "
:;:;;I;;;*fr lesFss;sFDccsdis$issssiiEEdis**nsg=6 n N o o 6 o E e E 6 d o € q I a- - r?.a-t ? - ?'?'? ? C'? t t e 6 € o c t - e' E - o a o
: : ; ; ; ; ; ; ; ;." ; ; ; ; ; ; ; I; I E x = s i $ i d i d d B e i 3 F s i = i = = s R
n n o o e e e q - ?': I e * ? q ? -: ?n "': I i : : : c = : : : : 1? : : ? "
: e : e : " " ";JAJ; - J e d s; i i i i c i i d Fi = $ s = s * s s :: = x s B I: a E ; F F ; R s s e F
6 6 o o o d € 0 - 6 6 H o F o o 6 € !-- I @ F F O "
o e 6 R ? O 6 O O d I e € e € d 6 o -
: ;; ; ;] ; ; ; ; * : ; ; ; ;;;:;; a; ; ; * a ; ! *: * i - iii i * = * R R FR R
6 a e o € o € a - 6 6 c! q t: q o- t! { 9 -: C C t e t a ? I ? e a : =
: : 9 : : 3 : 9 q q ? |?
J;AJ; ; J ; * H * ; i B s s i s Fb c F i d H s $ ; = d s = 3 e a E ;; * F ; R 3 e R R
tiItt
IttIII
SsggRRRFggagaBggeEesgtegg*BnR33ggn*aSesRRRRRF6 n 6nnn
{EFdNNdNNNNNNdddNilddNtsilNdNNNNNdEddddffNfdNNNffNC
eeooeog€o€e€eo<d--eoQoeooe-d 1<t- oo€eo
{OOeOOeee€d-ooe€ <-eaeod< €oo
eedNe-dooeeeoeeece-<Ndddoe0o-NGA6a46D6NdeFER6
€eooeo-a<a-- o€6€d
s * g g Fi g g g : 3 = * = = F R R F 3R F F R = : : * * B fi F F R 3R F F F E g 3'| g c g
EEgH;gHEE;FgEg333Bgf;Eg3HEgEE*EgEFF=FgE€ggSg;SF s H F * H s H F s H F ; 5 E
: r s
-:3
3 A ; s * E E E s * s E E =F
F F E s * s e s s;IEE;.
E H .z "* Fi ! 2 {{ E .:i: A
u s.E;l;:*=-E=.i=S*ii,eeE, *= ;eE.:E:"Eaiiii€Fg! ; 3 ; g :! € : E ; i E E E E E ! ge:aii
= s 3
= E : iE F; F= s! s i a; gE 5
E E Ej
? .: *g i, : g 5 ? Fi E:iE -i- d=iFr=E.:i=ii*=E=*Er*;;FE:-ci; =?Aal.;E:.tE-?Eslii; i ; ! € : :3 E E E ; E E E E s ! gi3=si:
= i E i E i gE F; FE iiE : 3E F!
asF s a E .: -:,i -: a qEE E€EERF BFr sd aa *i*itiititiJdddd:F X{tUd--AA NNNNNNR
i 3 g 3 i ; l i = !! I r I E gE ! E
g ! g ! E ; ; i 3 3 3 3 3 E ;; 3 3 3 i 3 3g3cl, €|<N--6{FQFe-siRFRFF RR g g gB;plg5g g3
=S3=3-NF-n€tseo--< -<-NR
o
ao
!oe
!
a
do
EG
oeo€ieFeo € €G eEdao<6+o6o€eR€!OO-6NOOOeO*?
d d i de s E i s s c = i i r d i F E d :: s s t i = s s s d d d d = 3 d I a ri ri
6AR€rO6OO O € @ - 6G --Odt@€OOENO€iNhFo
FO6!9!P: d d d !i "i i d d i d ": -: ci d d d .-: .; ; d d S j F F f; g
= j R n d = e g : E F Rfu -NNfu 'EFDF'N'N
<dNNNNN
6 o € {e o o I O o { { - e d - E + < E E o O o o e C 9 -!.!.? + o O o € € O d a
dd t d* i i d s s s s i d d i Fi d dFd d s r j i = di d ddr I e dd d p tr
n-c€{oocc 9€o-noH€6t<dFg6OhqeaE€@+}e6Gaoe
R d si F Fi d E i s s d d s : R d ri ri ri j i Fi d d ri ri e d i : =
d i = d d i * s d
F E € <€ O e o € Q - G O - € € O € d O € e O O e O e e € (D d t € € e o o G o e-i i -r .s F s s s t s B g s c = = si = R R R c F F g F E C Si C * = =
e = = s! E
= = G Si g
a o - dh o € e € € € e e 6 I 6 6 6 O 6 € 6 O € F.t 9 Q r'! ! € F 6 N + F - E € !''' ;;iJGid;id-:g ; g F F F g B g 3 C F t N 3 ; R g F R F g 3 = F F! I A F ;a = R -. .i. - i- - - .- h
E.? = EF E E F i 5 F E E € E E g : E E g E g =
g : g 3 g * ; g g * H 3 ; : g :h6'6hEFFE tstsEF+- D6FNh'
&=EEfEssssEEEEst:EsEtgEgSfrgs*;g:=E*P*;;H _F+6O6FFFFFFFF'+-mnEnC e +e
=i;3:.8. U E €
s-\iei.6ia-i €-3 .; = jj5 E j i E ;-io&53--* -.=-.&.rT;;riEiiE;T=_!E; aiiiJt;if?i:*i;;':; :;3;t E .
! ! E E E ! i E =
E E =
FE F= sgs: € gI ! g ! ; E sE ; : ; i : E ! E E E ! *. -adL: 6 Eg.. +3 E ! s.:. : *e aii*!stFgl*I*5.9: *i*=,*5*",o.*i,g i,j, tg€E:3E Il.+!:.i::= E.:a;an.= E=;:::i::a.iE;r- rax; : !; I ! E E
= ! E i
= € g! eE ; eg: et ! sc ! ! E E ; s: E 3 I *
= *
.; I € ?z:r 3g 3Z. ..i.: d;;Ei.i cc -4riE:i*i====TTcs,*! jdi;.: :!I:ZZZai . . . . .:: .r!
EccrE!!=933-*:= 4=c ;==gFi'iq-_EEEEEEEE 6€o|553 5 i i o r r - H H >>i;;"3.9.3 o ' ! L s-- r!r o o r o o.!'i .::E55SiiZ:=ZZi - FEbr r --i aEii!!gi>i5:r Foo666rr usscss.:€€e eeEn g gM;;SSSIFFi=EE;;=E=E==58
=csEcB;sR;c;3=== gg€ggg:==:::::==EEIgEEiEE
r_l_5
666-O664eG466 O666DdEDRN?E----FR NdNNd
h6 FOnn N9
666666NRE'dR
NNRdNNNNN NN N NNd -NNdRENNFEdNNNNNff
N NNNNNNg
€-<oe--rd<oeeooo--3:deo<<de6 da-do<d-
9€OOOOC€OOOe OOe OOOOO<e€de<
€Re€oirei d€ €orro€odNNoodd<€€EotFo-oode-i
d<-O€-<e0Aed -oecoOO€OOdd e-O€-eOO
E B 3s g B 3 C g * g ; g g ; c g s B 322nF F l3 B B B 5 s g K F E RB B g
F@@tsFtstsF€ OFG 666646G6+D6C<d€€+i66N-€€+N6O!a:.
Aa<A
d<dNFNRNNdNe-<-N N<-Nt<-- N-NNdNNN
dA dN
Xozlrl
ttItIttIIIItI1
IItI
APPENDIX A
SECfiON II
SHOPPING CENTER TRIP GENERATION SURVEY
APPENDIX A
@G0tn$lsI
t:
IIttT
I
11501 GEORGIA AVENUE, SUITE 102
WHEATAN, MARYLAND 20902(301) 933'921 1
TO:
EROI.{3
DATE:
PROJFECTI
SI]BIECI :
}TEI.fORAT{DUU
Project S+.aff , \g
Vic siaunrsaitiJ/Augrust ].2, 1988
Charlottesvillle - Route 29
Results of ShoPPing Center
Corridor StudY
Trip Generation SunreY
T
ItIttT
The shopping center surrrey.. in charlottesville establishedshopping porpor.--iiip .ilr.ltion rates specific to the shoppingactivities rli"itta-itong U.s. 2s. rn iaaitigt, a9!o occupancyrates vere calculated ioi - vehicles accessing t!. shopEingcenters. The survey was conaucled f or the Fashion Square Y."+1and ghe Barracks Roah Sfropping Center. Rates.develop"g by thisIiifo"" "itl-l;a"i u" incorlbrai,ed j,n the traffic model for a more
;;;i'="-"=lit"i"-"i srroppi-ng trip encs'
Data collection for the two sites was perfonned during May 1988'i'ior-"tio" "."a"a-toi
tnt-purpose of beveloping rates include:qross leasable floor area', eirp}oyees, and ngmber of vehiclesllM=iil--6" sires. usualiy siropiing trip attraction rates are;6;;;;;a G terns of vehi-cle tiLp-end-s^per--:1P1:Y"" or 1000gross sqfuare teei-iesfi -of leased arLa. iloieover, sj.nce the tripattraction rates are obse:rred to vary bY tirne of -day, -vehicleaccess data -;;; e"irr.il"g by tine- ol day. Data for the
""rp"i"ti"" of auio occupin"y w?s t*91, frorn- manual counts of
p"iEJ"t per vehicLe at each shopping center'
Data was gathered for vehicle access and-auto occupaTy fof t}lIlJ"""---poii!s to the two selected sites. Fashion- SErargconsisted of 5 access pointi-ldrivewaysl
^ ?nd -Barracks Road
coniiltea "i g. Data coliection'efforts-cdntinued-for a two to
tSree clay period to oUtiin an average for a tlpical weekday' ;
fiq1rt" f- sh-owl the layout of the two inopping centers as well astfrE-fo"ation of drivewlYs.
cSF information was obtained for the two sites by contactinq llemanageuent oiii.." 95 -ea-qr sfropping. center. Ilowever, for theA;r6F" tidiii;;;- air tuiineli-Eiliurisruoents at the select'edsites were 'i"i"i"i!wea. The obserrred vehicl'e counts at tberft"ppi"g'centers for a tlpical day are as follows:
II-3PittsburghWashington, D.C.
San Francrsco
APPENDIX A
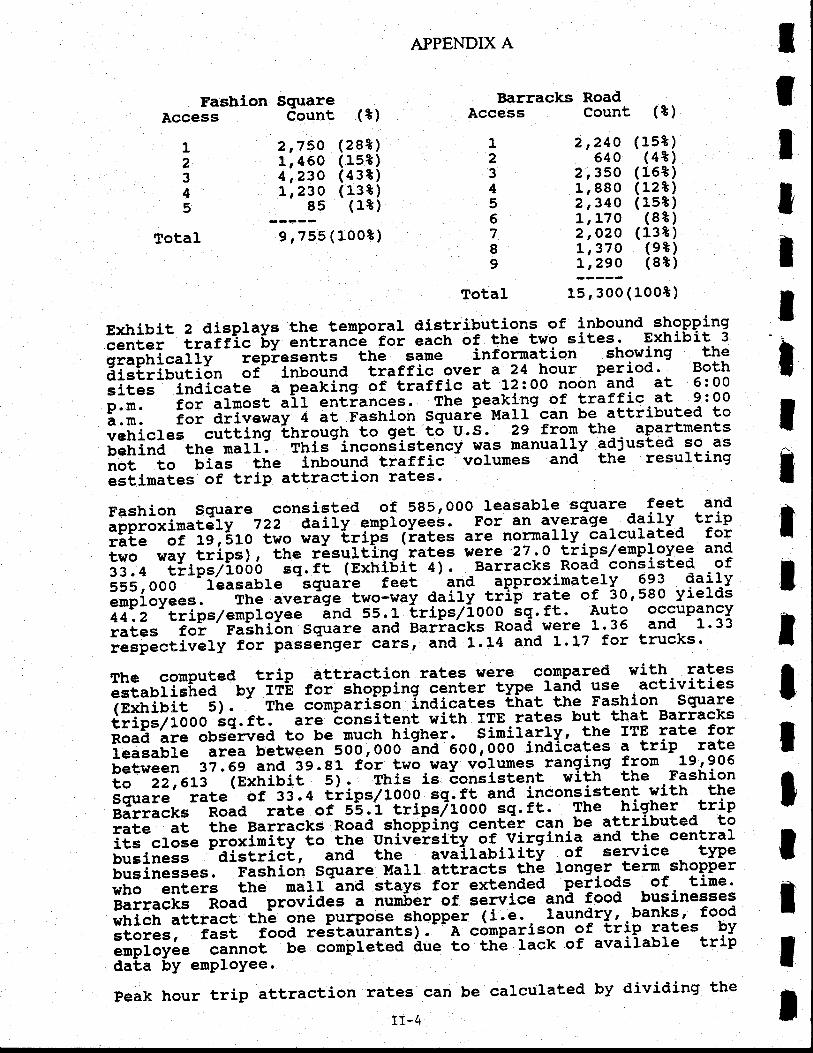
Barracks RoadAceess Count (t)Fashion
Access
12345
TotaI
SquareCount
2 17541, 4604,23OL r23O
85
9 ,755 ( 10ot)
(*)
(28*)( 15*)(4 3*)(13t)
( lt)
123456789
TotaI
2,24O (15t)640 (4*)
2,35O (16*)1,880 (12*)2,34O (ls*)1,170 (88)2,O2O (13?)1,370 (9t)L,29O (8t)
15,30O (1oo*)
ItIIttIIIIIIIIII
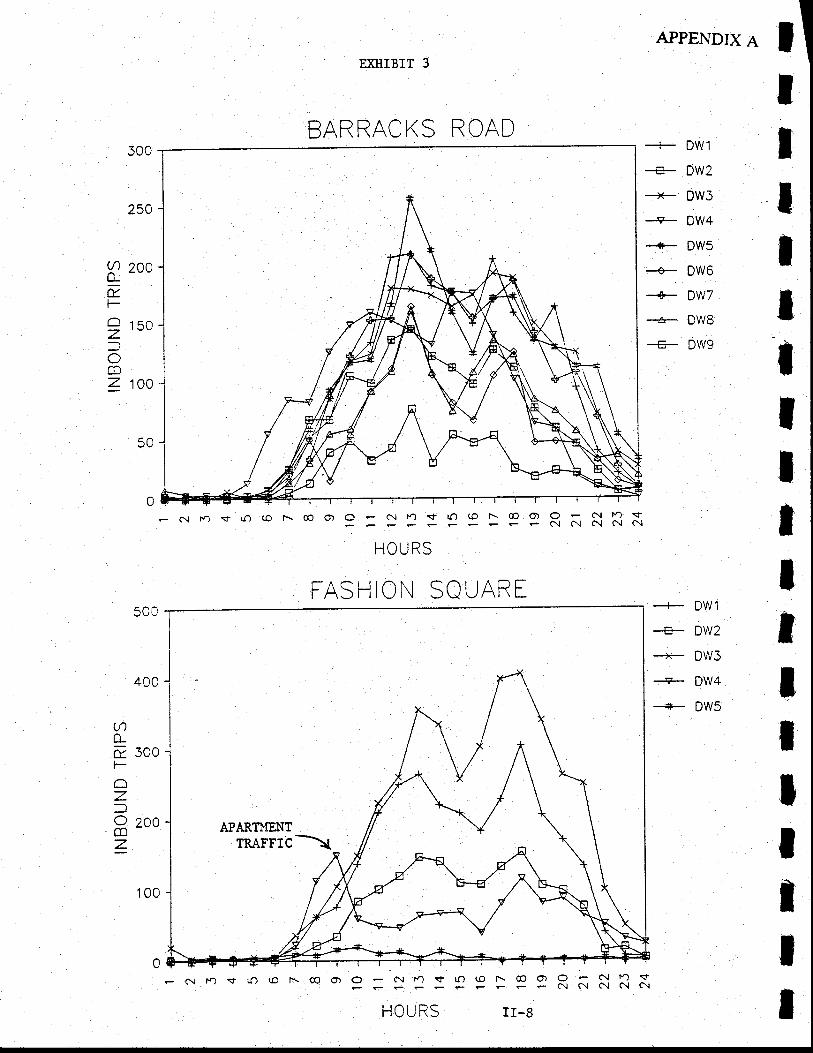
Exhibit 2 displays the tenporal distrilutions of inbound shgppingcenter trafriE-Ly entrancl ior each of the two sites- Exhibit 3
;il;fi.airy -i"pi.i"nts
- the sane inforrnation showing thedistribution or' inbound traffic over a 24 hour period. Both;iffi--inaicate- a-peaiing of traffic at 12:00 noon and at 5:00;:;:- ior afnost ait entiances. The peakllg ot traffic at 9:00;:;: ;;; &inerai-a at Fashion ssugL t'latl can be attributed tovenicfes cutling-tnrougfr to get.to- U.S. 29 from the. apartmentsiliiila- th; nirrl This-incon6istency was manuallY adjusted ?9.as
""I---io -rio"--trr" -inuouna traffic -volurnes and the resulting
liriit.tes' of trip attraction rates'
Fashion Square consisted of 585rOQQ-Ieasab}e square feet and
approximately -72r- -a"lfy gnpLoyeei. For an average- daily- tlip
Hi;--#-igl6ro iwo way trip's (lates are norn9lly. calculated fori;;- .'"y tlipii, -itr*
!6sr1ltilg.lu!g" nere 27.o trips/enPlovee and5i.a
--tiipr7io66 -Ee.tt trxrrif1i al. ,_Barracks Road consisted of555, OOO ]easable -Equar? - ieet '?ld
. approxirnately 693 dailyemployees. rnE-i""idte_twolr"y daily^trib r1!" "! ?o'580 yieldsii'.t'tripslerpioy*" lnd 55.1 Lrips/1ooO sg.ft. 1":" occupancyrates for faltri6n Square and Bariattcs Road were 1.36 and 1'33ilJp".ti"Efy-for passenger cars, and 1.14 and L'L7 for trucks'
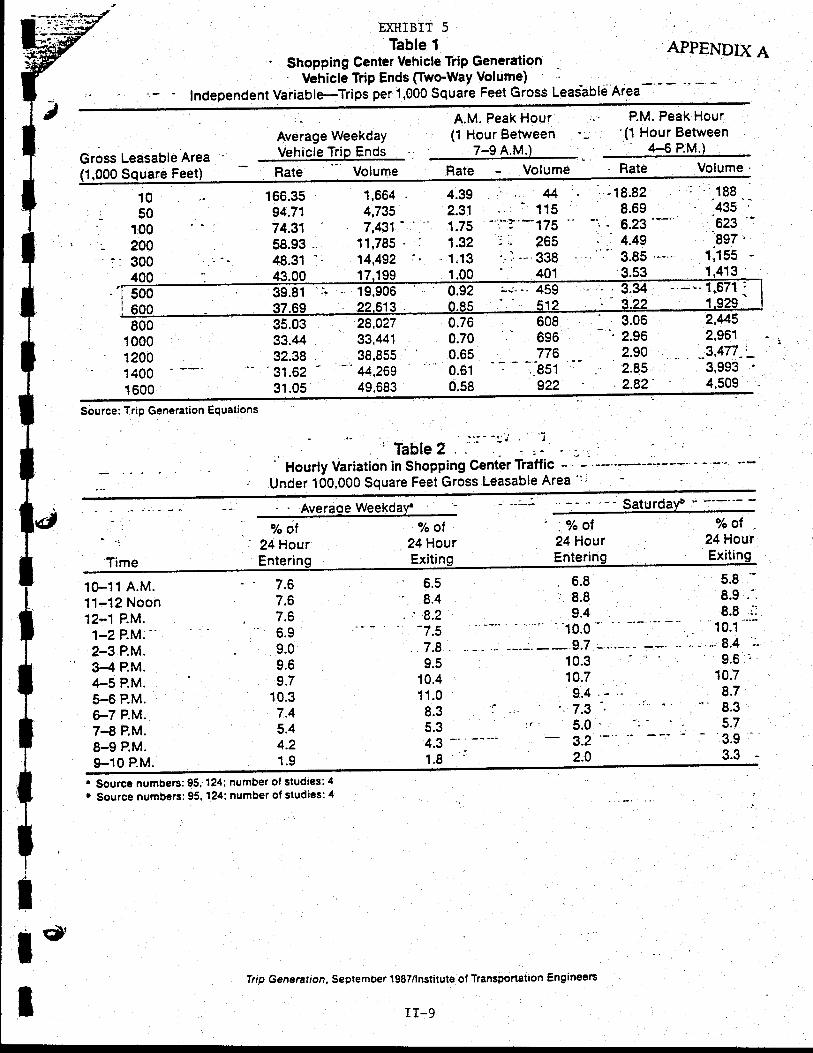
The computed trip attraction rates were compared with ratesesrablished ry-ii-e f;;-;n;pping-center t1pe. r35ra 9s9 activitiesG*hibia 5) . - The courpariibn inaicqtgg that the Fashion Squaretripsr/1000 sq.ft. ar^e consitlni with ITB rates but that BarracksRoad are obsenrea to be much higher. simil?rlY, the ITE rate forleasable arei between 5OO;OOO ina 600'000 ind-icates a trip- -r?!9between 37.69 ana gg.er f6r two-way volumes rangiSrg frorn 19'905to 22,6L3 tgxhitil s): -ini=-is lonsistent witn- the FashionSquare rare -6i-5I.+ ii'ips/rooo tg:{!-atd j.nconsistent with theBarracks Road rate of Ss.i-iriplirOoo :q.ft. Ih._-hig.le-r -triprate at the Barracks Road sfropiihg cent6r can be attributed toits clos" pto*itlli-€o trre UnivEisf€V-of.Virginia and the centrali.i"i".r"- -ai;t;i;i, --""a tte availabirilt -of serrrice - tvpebusinesses.
'r;;[i;ir sguare ualr attracts the longer.tern-shopperwho enters l[" -rifl'and stays for extended Periods of tine'Barraclcs noud---proviaes a nun6er of senrice and food
^ businesses
which attract the one porpo-e shopper (i.e. laundrY, banks, foodstores, fast food restauranls)-."1 edmparison of ttiP rates. !Vemployee ".rr1o[--b"-"otplaa;d
&,t" Co thl lack of available tripdata by ernPloyee.
peak hour trip attraction rates can be calculated by dividing the
r1-4 I
IT
ttIT
ttIIltIIItttt
APPENDIX A
Ieasable area into the desired hourly total. Indivduat hourlytrip totals are listed on Exhibit 2.
The shopping center attraction rates determined from thisparticulii tunrey wilt be considered for inclusion in thebharlottesville-Aibenarle County travel demand model. Theextremely high rate at Bariacks Road sarrants specialconsideration.
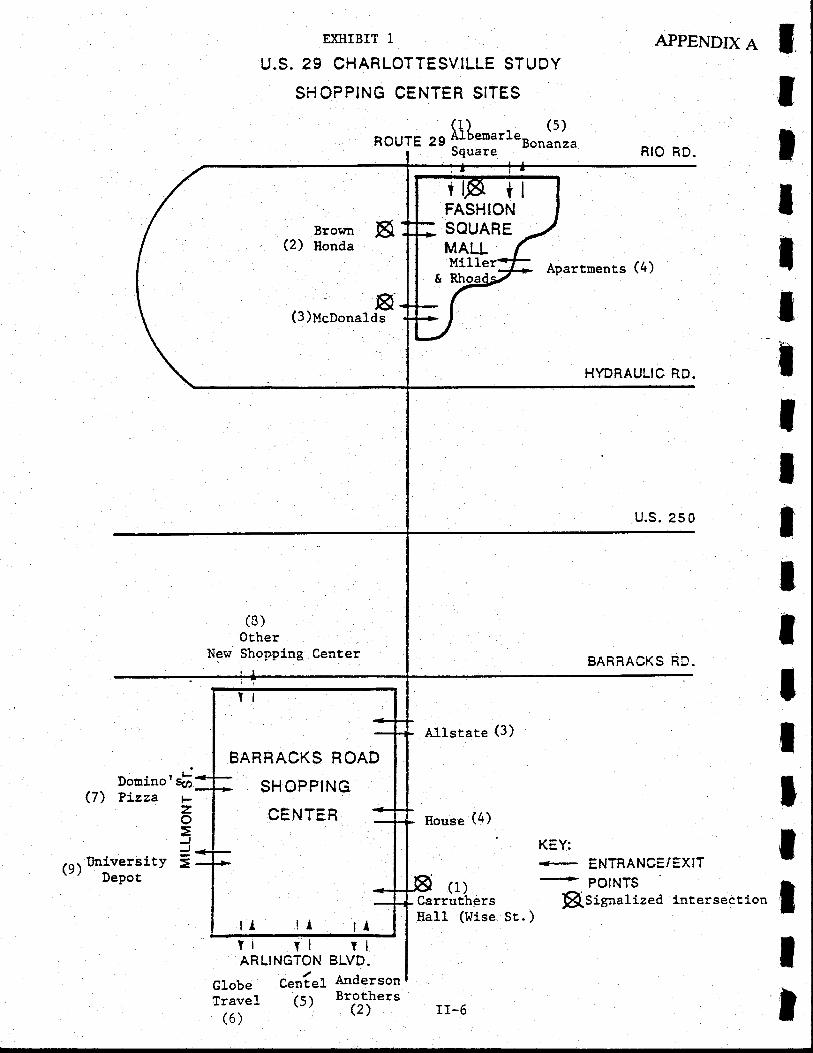
EXFIIBIT iU.S. 29 CHARLOTTESVILLE STUDY
SH OPPING CENTER SITES
APPENDIX A l
R ourE r, [l].r"rt.r""ltJ",I DQUaT€ I
tItItIIIIIItI
Douino'$(7) PLzza F
1o=J I
,,o.,, University =\' ) Depot
vr tlARLINGTON
Globe Cen{e1Travel (5)
(6)
Center
tlBLVD.AndersonBrothers
(2)
Allstate (3)
House (4)
6. (1)CarruthersHaLL (Wise
RIO RD.
Apartnents (4)
HYDRAULIC RD.
u.s. 2s 0
BARRACKS RD.
KEY:<- ENTRANC=/EXIT
New
(B)OtherShopplng
+ POINTS
R;#;iized intersection Isr. )
It
Brown 6(2) Honda
a(3 )ueoonalds
rtnl ilFASHIONSOUARE
BARRACKS ROAD
SH OPPING
CENTER
II-6
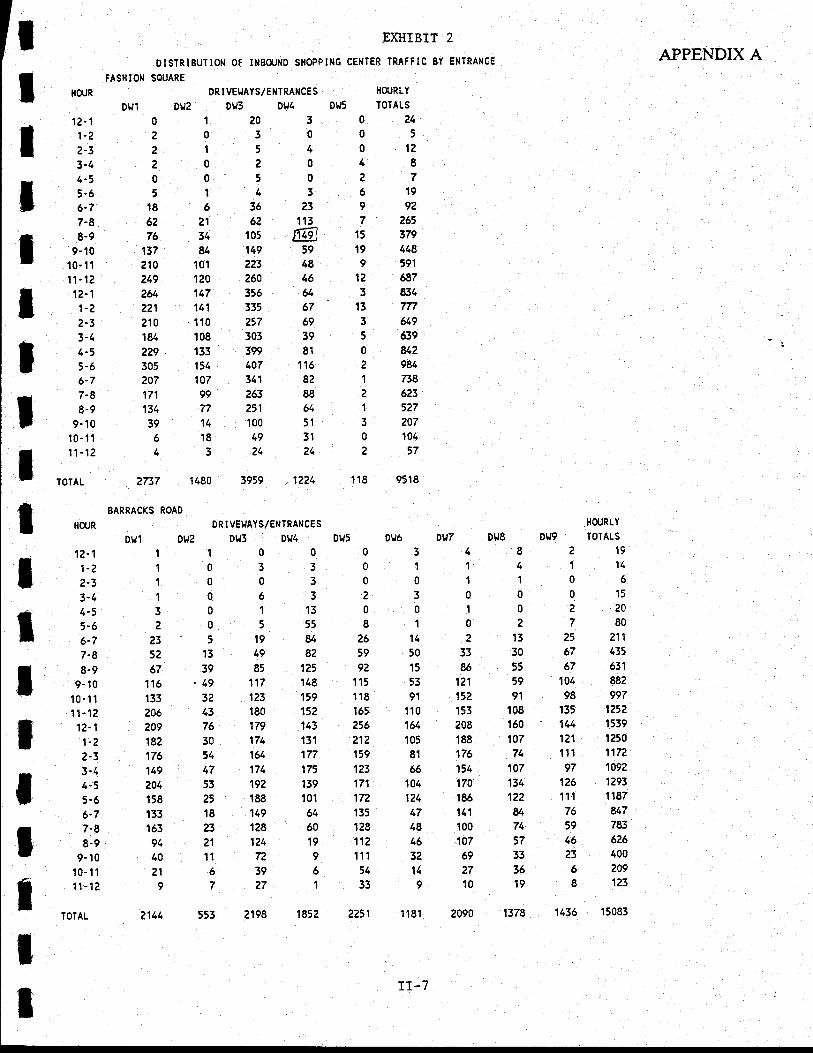
EXHIBIT 2
DISTRIBUTION OF INEOIJND SHOPPING CENTER TRATFIC BY ENTRANCE
FASHION SOUARE
DRIVEI.'AYS/ENTRA}ICES HCIJRLY
DIJs IOTALS
APPENDIX A
Dr,r'l
I 'i,i3'4t i.i7-8| #il
11- 12I 'i'i
t ;,i6-7
| ,l;;10-'11
| ,.:::"
f' HouR BARRA.K' R.AD
12-11-22-33-44-55-66-77-88-9
9- 10
10-1111- 12
12-11-22-33-14-55-66-77-88-9
9- 10
't0- t 1
11-12
TOTAL
0
2
2
?
0
5
18
6276
137?10249264221210181
229305
207171
134
39A
4
220780
481411001002?13
33 30
86 55
121 59
15? 91
153 108
208 160
188 107
176 74
151 t07170 134
186 122
141 E4
100 74.107 57
69 33
27 36
10 19
1100031033011003001063233011300205558'l
?351984261152 13 19 82 59 50
67 39 85 125 92 15
116 - 49 117 148 115 53
133 32 123 159 118 91
206 43 180 152 165 110
209 76 179 113 256 164
182 30 171 131 212 105
176 ,4 161 177 159 81
149 47 171 175 123 66
?04 53 192 139 171 104
158 25 188 101 172 121
133 18 149 64 135 17
163 23 128 60 128 48
91 21 124 19 112 46
40 11 72 9 111 32
2163965111e7271339
I
01
0
0
1
6
21
31u
101
120
147141
110
108
133
151
107
9977
14
18
3
2033o542A5043
00
0
4
z697
15
19
91?
3
t33
5
0
2
I
2.'t
3
0
2
24
5
12
87
19
92
265379418
591
878317n&9639
u298/.
738
623527
207104
57
36 23
62 r131os @149 59
223 48260 16
356 &335 67
257 69
303 39
399 81
407 116
341 82
263 88251 64
100 51
49 31
21 24
ItItIIIII
?737 1480 3959 1221 118 9518
DR I VEIJAYS/ENTRANCES
DLI3 D!J4
HOIJRTY
DhJ9 IOIALS219111060 15
25 211
67 435
67 631
104 882
98 997
135 1?52
111 1559
121 1250
111 117?
97 109?
126 1293
1r1 1187
76 847
59 783
16 626
23 400
6 209
8 123
't181 2090 1378 1436 150832144 553 2198 1852 Z?51
r1-7
IT
III
APPENDIX AE]CTIBIT 3
-+ DW1
--+- Dw2
+e DW3
-+ DW4
+_ DWs
-+- DW6
-F DW7
--E- DWE
-s- DWg
Q zoou_uF
z|vvfocoz 1oo
IIIII
IItII
- N rf) !i' (-, (o t- oo o' I : : : : ! I : P 3 R I N R X
HOURS
II
I n\tr a
-
uvvl
u rt L
-e(- DW3
-+- DW4
-+- DW5
ASARTI.fENTTRAFFIC -\I
us SOo
z=v zvvg_l
z
100
II- N re tf, tJ) (o f'- co o' 9 : I : : I I : P 3 R il N R X
HOURS rr-8
BARRACKS RCAD
FAS'rllC N SQ UAR t
| - ;i'; s:*: EXI{IBIT 5
Table 1
' Shopping Center Vehicle Trip Generation' Vehicle Trip Ends (Two'Way Volume)
tndependent Variable-Tripsper t,060 Squaie Feet Gross Leasable Aiea
APPENDIX A
Gross Leasable Area
Average WeekdayVehicle Trip Ends
A.M. Peak Hour(1 Hour Between
7-9 A.M.)
Rate - Volume
P.M. Peak Hour'(1 Hour Between
4-6 P.M.)
. Rate Volume',000 Square
166.3s94.7174.3158.9348.31
Volume
1,6644J35
. 7,431'11,785 .
14,492
1050
100200300400500
17.19939.81 19.906
4.392.311.751.321.131
0.760.700.650.610.58
188'€5 -:'623 ''
' 897'
1:1551.413,671'
8001000120014001600
35.0333.4432.38 .
28,02733,44138,855
3.06. 2.96
2.902.852.82
2,4452.9613,477 -._3,993 !
4,509
- 31.62 44,26931.05 49.683
6086967:76
' ,851922
Sosrce: Trip Generation Equations
t
' Averaqe Weekdav'n -
o/o ot24 Hour
-' Saturdaybo/o ot
24 Houro/" ot
24HourEntering Exiti
10.3fi-79'4
a .;. ..7.3',(' 5.0
3-2' ': 2.A
'.%ot24 HourEntering
6.8 5.8 *
i 8.8 8.9 .-'9.4 8.8 ':-- ''10.0 10.1--'-
' 9.610.78.78.35.7
10-114.M.11-12 Noon12-1 P.M.1-2 P.M. -'
2-3 P.M.3-4 P.M.4-5 P.M.5-6 P.M.6-7 P.M.7-8 P.M.8-9 P.M.9-10 P.M.
7.67.67.66.99.09.6a'7
10.37.45.44.21.9
D.3
8.4' 8.2-7.5
7.89.5
10.411.08.35.34.31.8
3.9 -
3.3
' Source numbers:95, 124: number of studies:4r Source numbers: 95, 124; number of studies: 4
loI Trip Generation, September 1987/lnstitute of Transportation Engineers
rr-9
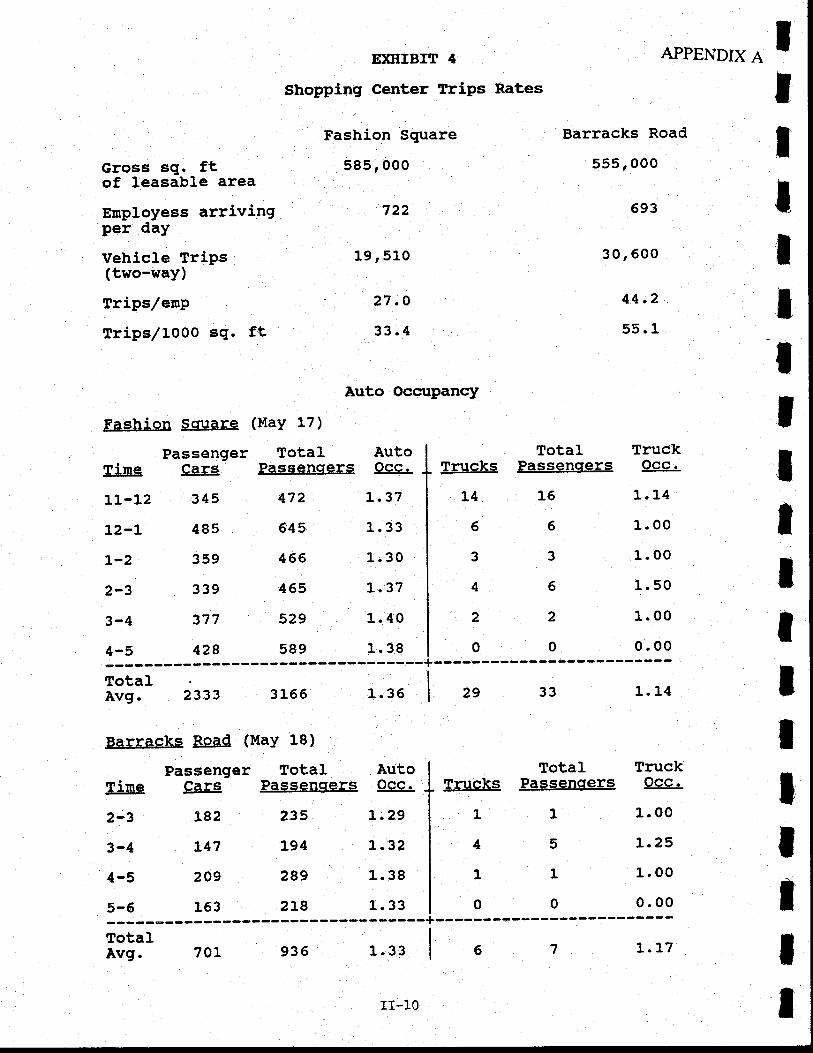
Gross sg. ftof leasible area
Ernployess arrivingper day
Vehicle Trips(tuo-way)
Trips/enp
TriPsr/1O00 sq- ft
Fashion Square (MaY L7)
Passenger Total AutoTime Cars Pasgencters Occ.
11-12 345 472 L-37
L2-L 485 645 1.33
L-2 359 466 1.30
2-3 339 455 1.37
3-4 377 52g 1.40
4-5 42s 589 1.38
HIIHIBIT 4 APPENDIXA I
Shopping Center Trips Rates I
Fashion Square acks Road t
585, OOO 555, ooo
le,slo 30,600 |
44'2 I- 27.O
33.4 55.1
Auto OccupancYItII
Total TruckTrucks Passencrers Occ.
14 16 1.14
6 6 1.00
3 3 1.O0
4 5 1.50
2 2 1.OO
0 o 0.00
totalAvg. 2333 3166 1. 35
Ba-rraeEe Road (!{aY 18 }
Passenger TotaITime Cars ry2-3 L82 235
3-4 L47 LgA
4-5 209 289
5-6 163 2r8
AutoOcc.
L.29
L.32
1.38
1. 33
Trucks
1
4
1
0
TotalPassenoers
1
5
1
0
1. 14
TruckOcc.
1. 00
1.25
1. OO
0.00
IIIIIIIII
3329
TotaIAvg. 1.337Ar 935
r1-10
1. 17
APPENDIX A
SECTION M
HOUSEHOLD SURVEY
IIItIIItIT
IIItlItil
I
APPENDIX A
FINAL REPORT
ROUTE 29 CORRIDOR STUDY
HOUSEHOLD SURVEY
Prepared for the
Virginia Department of Transportation
State Project No. 6029-002-122
October L988
COMSIS Corporation
8737 Colesville Road
Silver Spring, MD 20910
'(301) s88-0800
3.0
4.0
ItItIttIIlIIIIlIIII
APPENDIX A
TABLE OF CONTENTS
CETTT^N PAGF,
1.0 suR\IEY OVERVIEW..............
SURVEY METHODOLOGY .......m-1
2.1 Sampling Approach ............... ..m-1
2.2 Survey Implementation.....2.3 Quality Control....
2.3.1 Monitoring Surveying Procedure .............m-2
2.3.2 Monrtoring Quality of Data.... ...........-.....m-2
2.3.3 Screening for State II Survey ..m-3
GEOCODING AI{D EDITING m,3
E)GANSION AI{D WEIGHTING OF SURVEY R8CORDS...................M.6
4.1 Expansion Factors for Survey Records...
4.2ExpansionFactorforMissingInformation............
5.0 FINDINGS...............5.1 Description of Data5.2 Household Characteristics. m-11
5.2.1 Number of Persons in Household........ ..m'115.2.2 AutoAvailability ..I[-125.2.3 Household Income .................m-U
5.2.4 Income and Automobile Availability.. III.125.3 Travel Characteristics...........
5.3.1 Trip Rates by Household Size and AutomobileAvailabilityMode Use by Trip.......... ........m-17
Automobile Occupanry by Purpose........... .............m-17
Trip l*ngth by Purpose.............. ......-.-....m-17
Trips by Time Period and Purpose..... ...........m-17
APPENDIX A TO SECTION III: HOUSEHOLD SUR\IEY DESIGNAI{D IMPI.E,MENTATION PI-AI{
APPEI{DIX B TO SECTION III: PHASE I. HOUSEHOLD SUR\/EY FORM
APPENDIX C TO SECTION III: PHASE II - SURVEY MAILING PACKAGE
5.3.2' 5.3.353.45.3.5
m-i
APPENDIX A
LIST OF DCIIBITS
1 OBSERVED HOUSEHOID TRIP RATES DURING THEPHASE I SURVEY ..,...:...........
2 OBSERVED DISTRIBUTION OF HOUSEHOI.DS UNDER PHASE IOF CATS AREA SURVEY .............m-5
OBSERVE DISTRIBUTION OF' HOUSEHOLDS DURING FIRSTCONTACT .m-8
J
T
IIIltIIIIIIIIIItI
4 DISTRIBUTION OF HOUSEHOLDS BY SIZE AI{D AIJTOMOBILEAVAII.ABILITY......
E)(PAI{SION FACTORS FOR HOUSEHOLD SURVEY RECORDS.M.IO
DISTRIBUTION OF HOUSEHOLD BY SIZE, 1988.......... ....M.13
DISTRIBUTION OF HOUSEHOLDS BY INCOME ...........
REI-ATIONSHIP BETWEEN INCOME AND AUTOAVAII-ABILITY, 1988 ......... ...............m-$
HOUSEHOLD TRIP PRODUCTION RATES............... .....:....m-16
DISTRIBUTION OF TRIPS (INTERNAL) BY MODE OF TRAVELAND PURPOSE
AVERAGE AUTOMOBII.E OCCUPANCY BY PURPOSE, 1988 ........M- 1 9
OBSERVED TRIP LENGTH FREQUENCY FOR HOME.BASEDWORK
OBSER\TED TRIP LENGTH FREQUENCY FOR HOME.BASED
5
6
7
8
11
.t2
13
9
10
OTHER m-21
L4 OBSER\IED TRIP LENGTI{ FREQUENCY FORNON-HOME-BASED....
15 DISTRIBUTION OF TRIPS BY TIME PERIOD AND PURPOSE.....M.23
nr-ii
IIIIIItItIIIItlIIII
APPENDIX A
ROUTE 29 CORRIDOR STUDYHOUSEHOLD SURVEY
1.0 SURVEY O\MRVIEWTo collect information on travel characteristics of residents living within the
Charlottesville/Albemarle County transportation study area, ahousehold telephone survey
was undertaken from March to June, 1988. The survey information has been subsequently
utilized both to describe existing travel patterns and to calibrate travel demand models.
Approximately 1,350 households were initially contacted; of these, 1,193 provided
household characteristics and a 24-hour trip diary for each member and guest of the
household.
This technical memorandum describes the survey methodology, data analysis
procedure and the key findings of the survey.
2.0 SURVEY METHODOLOGY
2.1 Samnling Approqch
The primary consideration in determining the sample size was to attain a desirable
degree of accuracy in the forecasting ability of the calibrated travel demand models. Based
upon available information and resources, a sample size of L,200 households was originally
recommended. The three factors considered in the determination of sample size were:
Accurate measure of trips per household for the entire study area stratified
by household size and auto avaiiability.
Reasonable estimate of mean work trip length.
Constraints on the data collection budget.
For details on the initial sample plan, refer to the technical memorandum dated
February 23, Lg88 entitled "Household Survey Design and Implementation Plan" (see
Appendix A).
o
uI-1
APPENDIX A
22 Suney Implementation
The survey was conducted by a series of telephone contacts. In the initial call
(phase I), randomly selected households were asked a series of questions pertaining to
household characteristics such as household size, nature of affiiiation to the University of
Virginia (uvA), number and type of motorized lodel available to the holsehold'
lnoavailability of transit near home (see Appetj*
"): Respondents were then asked to
participate in tbe next phase of the sulvey' i'e', Phase II'participating households were assigned a day for the following week on which all
members and guests of the household were to fill out trip diaries. Following 1n.*O:t'
telephone calt trip diaries along with a household characteristics form were mailed. Prior
to the household,s trip diary day, once again these households were contacted by phone.
The purpose of the second call was to remind the household members to complete their
trip iiaiies and to clarify any misunderstanding concerning the recording of trip
information in the diary. The household characteristics form consisted of questions
pertaining to the housebold income, number of workers' occupation, type of hogsehold's
dwelling units, value of the dwelling unit, and the amount of rent paid in case of rentecl
units. Appendix C illustrates the entire package mailed to a household including the two
letters, one from coMsls and the other from the virginia Department of Transportation
(vDor).Following diary day, the household was called again. At this time the results of their
trip diaries were transcribed directly into a computer data base using the Computer
Assisted Survey Execution System (CASES)'
2.3 Oualiqv Control
2.3.1 Monitoring Surveying Procedure
The University of Magyland Sunrey Research Center (SRC) monitored the random
sampling and data retrieval on a daily basis. SRC_as a subcontractor to CO]v{SIS, was
responsible for actuaily implementing the survey. In addition, a coMSIS staff member
regularly monitored the quality of the data collected, sampling procedure, and was
available to solve problems that arose during the course of the survey' The intent of the
supervision was to check the accuracy and completeness of the work accomplished by the
SRC staff while at the same time ensuring a high response rate.
232 Monitoring QualitY of Data
A microcomputer based system was set up to periodically generate freciuency and
cross classification tables using the data collected under Phases I and II. Summary statistics
were developed nrice: after 500 interviews and after 1,010 interviews. The distribution of
tIIIIltIIIIIIIIIIT
ITII-2
IttIIItIIIIIIIlIIII
APPENDIX A
sample households was compared with the 1980 census distribution for household size and
auto availability. As the population distribution for various combinations of the above
variables was not available from the census, the bias of the sample for each cell could not
be evaluated.
However, observed average household trip rate (including walk and bike) and
coefficient of variation (CV) for each cell (or category) were estimated to check the
accuracy level of the trip rate estimates. According to our initial sampling plan, a CV of 1
is desired for an accuracy level of +5 Vo at a ninety percent confidence level, Af,ter t,99t
household interviews, we found that the survey had produced statistically desirable
estimates of trip rates for all high frequency cells considering the observed values of the
CV's (see Exhibit 1).
2.3.3 Screening for Stage II Sur:vey
Upon completion of 1,007 household interviews, we compared the observed
distribution of households separately in terms of household size and automobile availability
with that of the 1980 Census reported distribution for the Charlottesville Urbanized Area.
This comparison suggested that our sample had underrepresented large size ancl no
automobile households (see Exhibit 2). Considering the declining trend nations'ide in
household size, the predominance of educated white collar workers in the area, and a
higher than average proportion of retirees within the study area, the share of larger
households could have been expected to decline during the last eight years. Hort'ever. it
was decided to compensate for this deficiency by screening the stage II sampling target of
200 households for size and automobile availabiiity. Furthermore, an increase in the
number of observations for large size and no automobile household categories was
desirable to improve the statistical reliability of the trip rate estimates for these categories.
In consultation with COMSIS, SRC developed a new list of randomly selected
households and started interviewing those bouseholds which had more than three or more
members 5 years of age or older or no auto. Very few households with no vehicles were
found; therefore, the majority of the additional sample consists of larger households.
3.0 GEOCODING AT.{D EDITING
Geocoding of the Charlottesville/Albemarle County household survey was
conducted in a series of passes. First, the original two unedited fiies: the household
screener file (SCREEN DATA) and the household diary file (HHDIARY DATA), were
merged into HHTRIP SASDATA. The SCREEN DATA file contained demographic
information for all households responding to the screener survey. Data for those
households which participated in the diary phase was stored in the HHDIARY DATA file.
III-3
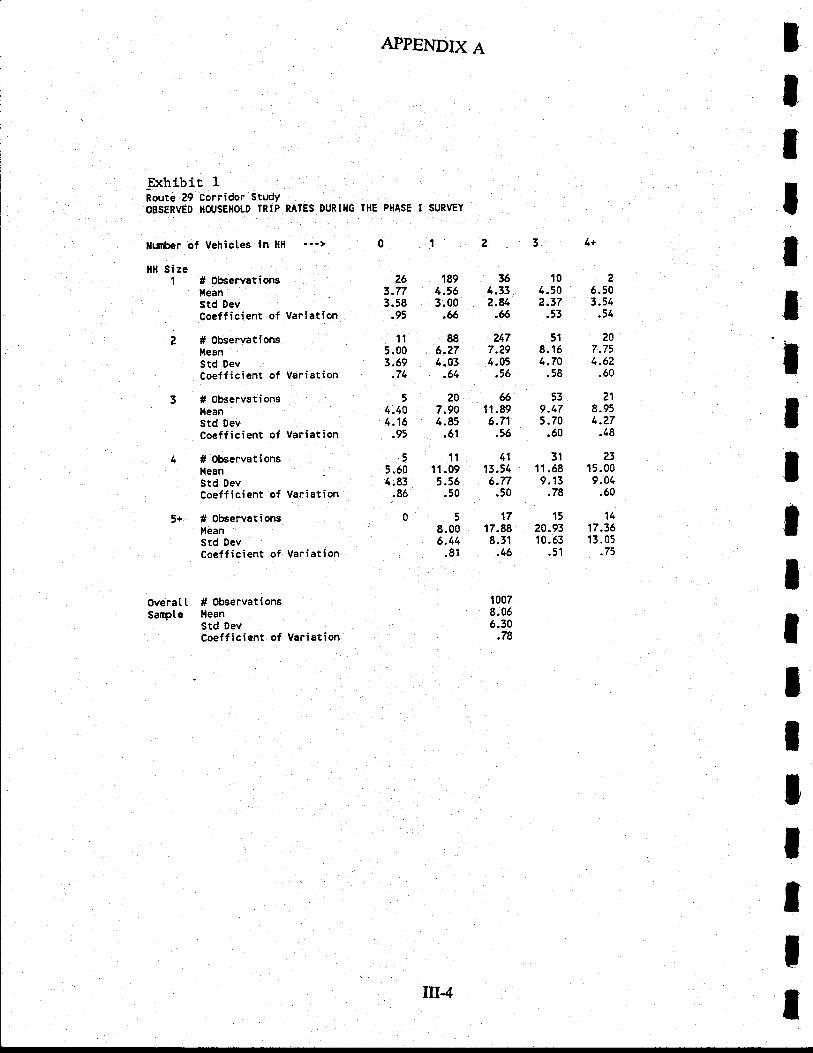
APPENDIX A
_Exhibit IRoute 29 Corridor StudyoBsERvED IIOIJSEHOLO TRIP RATES DURTIIG IHE PIIASE I SURVEY
IItIIltIlIIIJ
IttttI
886.?74.03
.64
207.904.85
.51
ilufber of Vehictes in HH
HH Size1 # Observations
l{eanStd DevCoeff icient of Variation
?. # ObservationslleanStd DevCoeff icient of Variation
3 # Observationsl,leanStd DevCoeff icient of Variation
4 # Observationsl,leanStd DevCoeff icient of Variation
5+ # observationsl,lean' Std DevCoeff icient of variation
Overal.t # ObservationsSarpte l,lean
std DevCoeff icient of Variation
361024.33 4.50 6.502.U 2.37 3.54.6 .53 .51
247 51 207.29 8.16 7 .754.05 4.70 4.6?.56 .58 .60
6653?111.89 9.47 8.956.71 5.70 4.27.56 .50 .48
41 31 2313.54 11.68 15.006.77 9.13 9.04.50 .78 .50
17 15 14
17.88 20.93 17.368.31 10.63 13.05.46 .51 .75
10078.065.30
.78
26 1893.77 4.563.58 3.00.95 .61l
5.003.69
.74
54.494.16
.95
5 11
5.60 11.094.83 5.56.86 .50
058.006.44
-81
m4
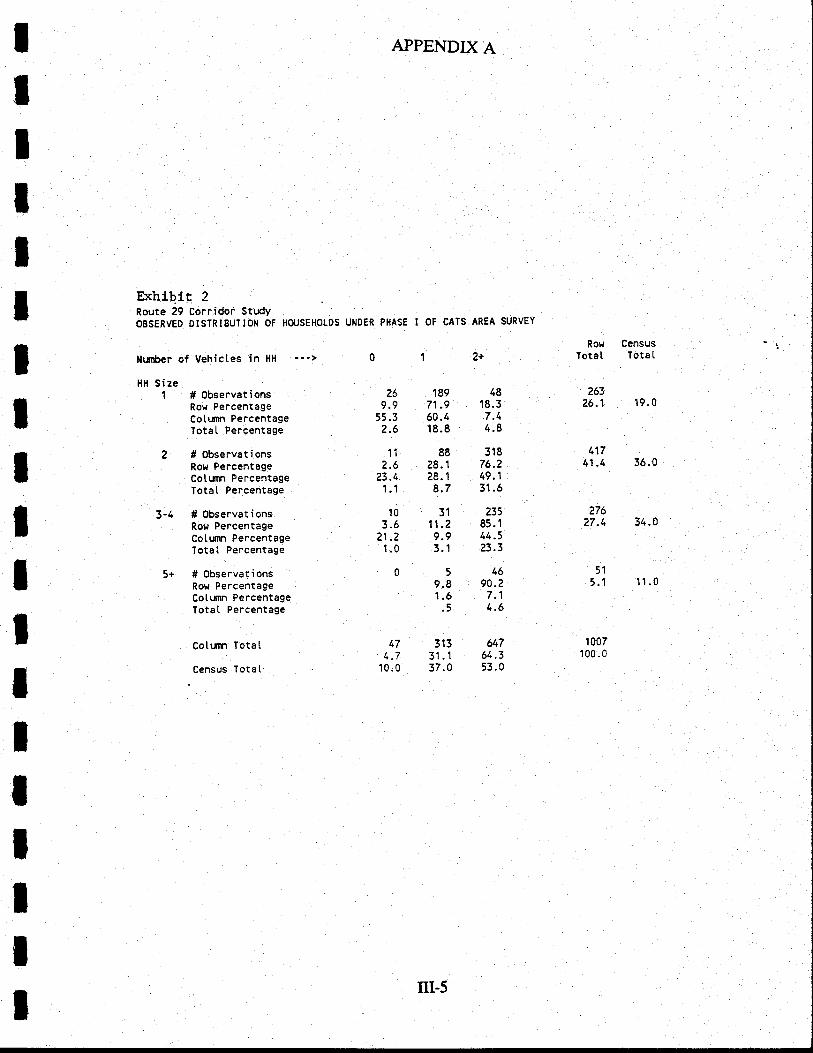
tIIIItIIIIIIlIlIIII
APPEI{DIX A
Exhibit 2Route 29 Corridor studyOBSERVED DISTRIEUTION OF HOUSEHOLDS UNDER PHASE I OF CATS AREA SURVEY
Nrnber of Vehictes in HH
HH Size1 # Observations
Row PercentageCotumn PercentageTotaI Percentage
2 # 0bservationsRor PercentageColumn PercentageTotaI Percentage
3-L # ObservationsRo}t PercentageCotunn PercentageTotal Percentage
5+ # observationsRoH PercentageColurnr PercentageTotat Percentage
CotLrnn Totat
Census Totat
1
26 1899.9 71 .9
55.3 60.42.6 18.8
11 882.6 28.1
23.4 28. 1
'f .1 8.7
10 313.6 11.2
?1.2 9.91.0 3.1
059.81.5\
17 3131.7 31 .110.0 37 .0
4818.37.44.8
31876.249.131.6
z5)85.144.5?3.3
?6326.1 19.0
Rox CensusTotaI TotaI
11741.4 36.0
27627.1 34.0
51q I 11 n
1690.27.14.6
64764.353.0
1007100.0
m-5
APPENDIX A
Editing of the newly created file began with mistyped and missing ciry names. Text
variables were set to upper case for standardization. Incorrect ciry names were recoded.
Subsequenrty, u destinatiou trip list sorted by city and destination as reported by the
name of the nearest road intersectior, was produced. Since the destination of one trip was
the origin of the next, only destinations were coded. Only for the first trip were origins
coded separately. A set of computer assigned geocodes developed earlier were assigned to
intersections which fell into clearly identifiable zones.
zo'es not already coded were looked up in the generated list and/or the list of addresses to
which diaries were mailed. From this lookup list of home zones, all "return home" trips
were assigned geocodes. Following the abovementioned_procedure, almost 51 percent of
the origiual sample trips were geocoded. The procedure was repeated later for the
srrb.a*pt, of 183 households. All remaining uncoded trip ends were manually coded.
After the automatic and manual coding was completed, a consistency check was
undertaken for geocodes. A list of origin locations was printed out as reference so that if
the destination location was utueadable the folloving trip origin could be coded. Another
list of all trips by household was produced to locate missing codes which might have
occurred within an individual's trip diary. As a final consistency check, a printout of all
trips by Traffic Analysis Zone (TAZ) was produced to nssure that all equivalent locations
were assigned the same geocode.
In cases where respondents did not clearly specify the location of their trip ends,
allocation rules assigned these trips among the zones adjacent to the indicated road
intersection. For the "return home" trip purpose, all trips destined to an area were
allocated among adjacent TAZ's based upon the share of population within each zone. A
similar allocation rule was applied for non-home trip ends but this time, the allocation
variable used was total employment. All uvA:elated trips were allocated among zones on
the basis of ivailable parking spaces in each UVA zone'
4.0 ExPAl.lsIoN Al.{D WEIGHTING OF SI'R\rEY RECORDS
A wo-step procedure was followed for expansion of the survey records. First, a set
of factors were developed to expaud each household survey record to rePresent the study
area distribution of total population in the base year (1986). A second set of factors were
used to compensate for specific type of missing information from the trip records (e-g., trip
purpose arld f or geocode).
IIIIIIIIIItIIIIItItm-6
IItIIIIIIIIIIItIttI
APPENDIX A
4.1 Expansion Factors for Survey Records
A stratified set of weights were developed to adjust for over or under sampling of
various cells of cross-classified household categories. Such an adjustment leads to
approximating the distribution of the sample to the actual distribution of tle population.
Since no information was available on the distribution of households within the study area,
the observed allocation during the initial phone contact of the randomly selected
households was assumed to be the best available estimate of distribution in the base year.
Though the telephone household survey was conducted in 1988, weights were determined
for the base year of 1986.
The estimate of total number of households within the Charlottesville / Albemarle
County Transportation Study Area was first made using dwelling unit data provided.y i:county, city, and UVA Since the County estimate of the number of dwelling units (DU's)
represents the number of occupied DU's, it served as a surrogate for the number of
households in the county. However, for the city, dwelling unit estimates were converted to
the number of occupied units (or households) using the City Planning Office specified
vacancy rate of 2.80 percent. The estimated number of households within the study area in
1986 was 32,558.
Exhibits 3 and 4 illustrate the household distribution as observed during the first
contact and in the final survey sample respectively. The weight for each ceil of cross-
classified household categories was calculated using the following expression:
E)(PANWT(I,J) = PHHSVY(I,J)*TOTHH / HHSAMP(I'J)
Where:
pfUf'SW = Proportion of households observed during the initial random contact
TOTHH = Total number of households in the study area
HHSAMP = Number of households participating in the survey
IJ = Subscripts representing a cell of the cross-classification matrix
All households residing outside of the study area were excluded from the sample
prior to estimating the expansion weights. Exhibit 5 displays the estimated values of the
weights used for expanding the telephone household suwey data.
m-7
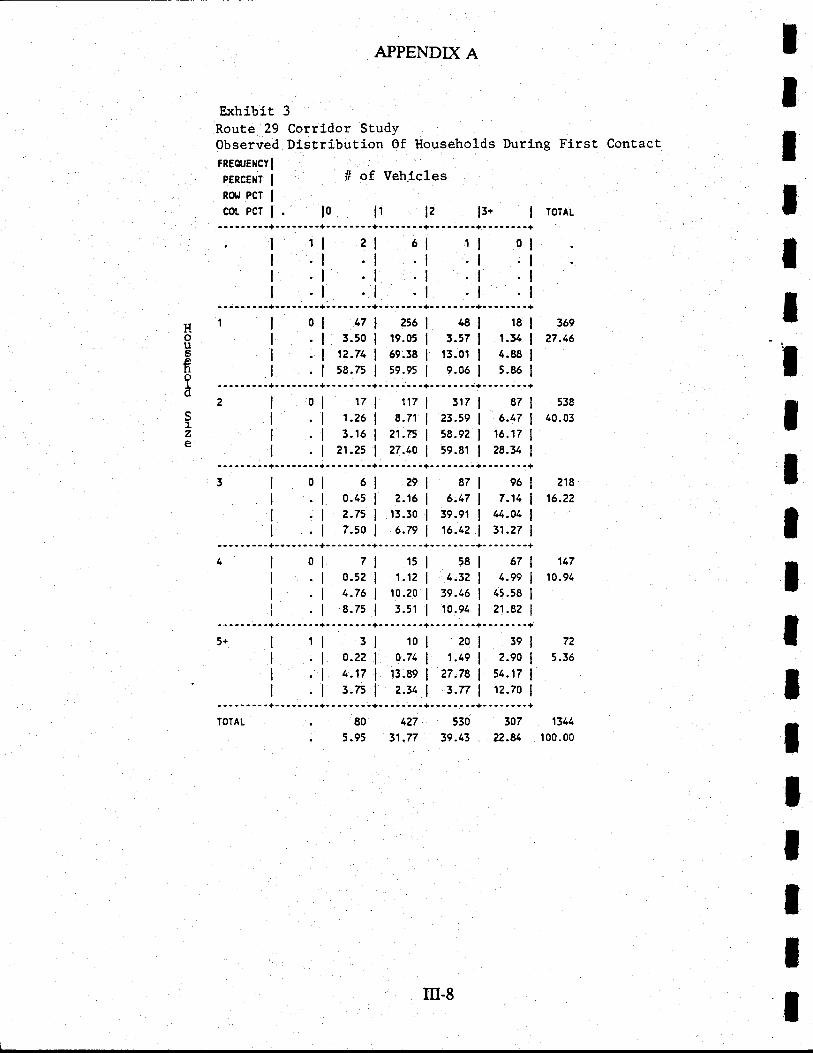
tT
ItIttIlII58
29
0
Housf;?o
qLze
APPENDIX A
Exhibit 3
Route 29 Corridor StudyObserved Distrlbution Of Households During First ContactFREouEilcY I
PEncErT I ll of Vehicl-esRO!' PCT IcoL PcT I lo ll 12 13* | roTAL
- - -- - - -- -+- - - -- -- -+- - - - - r - -+-. ! - - - - -+-- - - - - r -+-- -- - - - -+
1l zl 61 1l 0
.l .l .l .l
0 17
3.501 19.051 3.571 r.3412.71 l6e.38 113.01 I 4.8858.751 5e.e5l 9.051 5.85
. - - - - - - - -+- - ---- - -+-, - - - - - -+. -. -. - - -+- - -. - - - -+- - - - - -, -+1',t7 317
8.71 I ?3.59 1 6.1721.75 158.92 1 16.17
21.25 1 27.10 1 59.81 | 28.31--- -..--.+---.----+-r------+--.-.-.-+--t-----+------ --+
0 6
0.452.75
?.15 1 6.47 1 7.1113.30 139.91 144.01
7.50f 6.79 116.12 131.?7-- - - - -- - -+--t - --- -+- - - -- - - -+- - - - - - - -+- -, - - - - -+- - -- - - - -+
0 7
0.521.76
t5 67
1.12f 1.32 1 1.9910.20f 39.161 15.58
8.751 3.511 ro.94l 21.82.--,----.+-.----.-+-.-.---r+--------+--,-----+------i-+
I 10
0.71 | 1.49 I 2.9013.89 I 27.78 151.17
3.75 1 2.31 | 3.77 112.70
80 127 530 307 1341
5.95 31.n 39.43 ?2.A 100.00
17
1.?6
3.16
3
0.224.17
369
27.16
538
40.03
218
15.22
117
10.91
72 I5.36
ITOTAL I
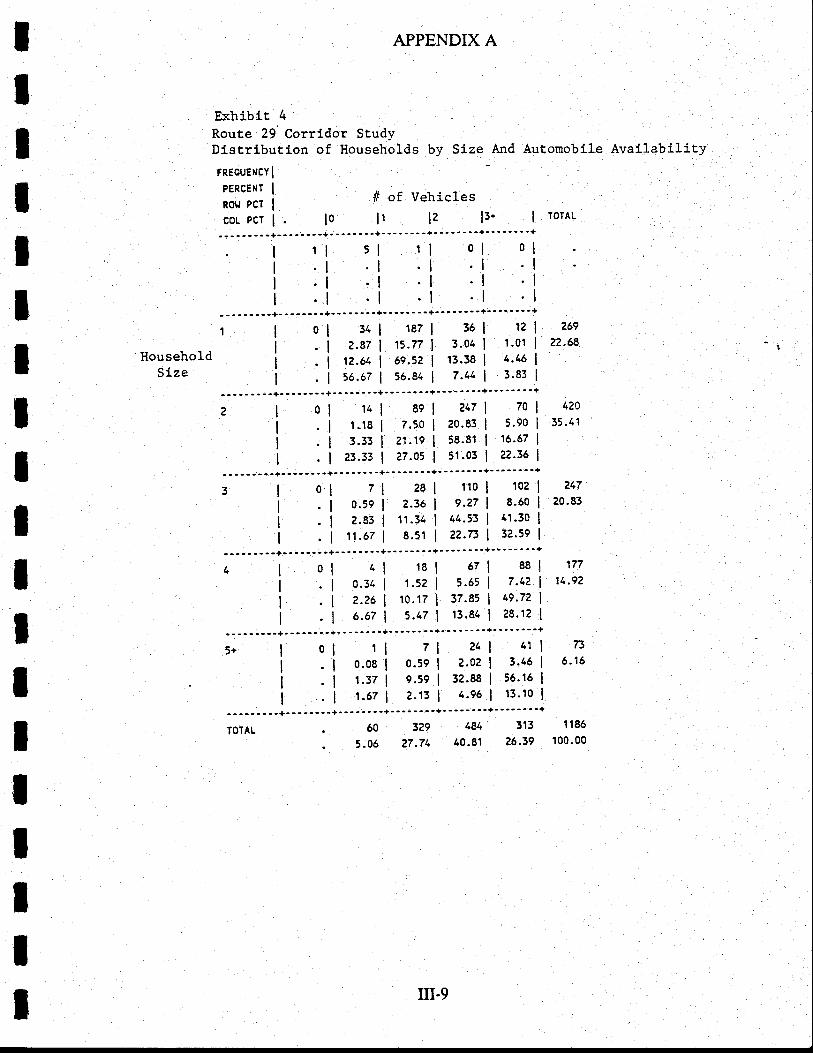
89
31
tIIIItIIIIIIIIIIIII
FREOUEUCY I
PERCE}IT /l of Vehicles. lo l1 l2 13* | rouu
- - - - -, - - -+- o - - - - - -t- - - - _ "'+_ " " _ -'+_' _ .. " -+" _ - - "'+
11 5 0 0
.l
.ll..l.l.l'l'l
- - - - - - - - -+- - -- - -- -+- - - - - "'+' - "' - -'+"" -- "+" "' -..+
APPENDIX A
Exhibit 4
Route 29 Corridor StudyDistribution of Households by Size
2.?6 1 10.17 I 37.85
. | 6.67 1 5.47 1 13.84
.l 1.67 1 2.13 1 1.e6
_And Automobile Availability
ROII PCT
COL PCT
187 12
1.01
4.153.83
.l 2.87 1$.nl 3.01
.l 12.61 | 6e.52 1 13.38
.l 56.671 56.811 7.11
- - ! - - - - - -+-r - - - -- -+" .. " -'+" - -.. "+' - " " "+- " " .!'+
0 14 217
1.18 I 7.50 20.83 I 5.90
3.33 | 21.19 58.81 | 16.67
.l 23.331 27.0s 51.03 | Z?.s6
- - - - - - - - -+-- - -- - - -+- " .. " -+" " _ __'+' -' __ "'+_ ..'- " -+
0 110 102
E.60
41.3032.59
o.5el 2.36 1 e.27
2.E31 11.341 11.53
.111.67 1 8.s1 l22.Ts---------+--------t! -"-"-+-"-"'-+'-""-'+"'--"'+
0 18 67 ee
t .1c,
49.72
28.12
0.341 1.sel 5.65
---------+--------+"-"'-'+"".j-'+.r-""'+.!".."+
0
o.o8 l o.5el z.o?
41
3.4656.1513. 1o
1.371 9.591 32.88
-- - - - - - - -+- - - - - -- -t- - " - "'+" " - .. -+' - - .t "'+- ..-..' -+
Househol-dSize
269
22.68
120
35.41
217
20.83
177
11.92
73
6.16
. 60 3Zs 184 313 1185
. 5.06 27.71 40.81 e6.39 100'00TOTAT
III-9
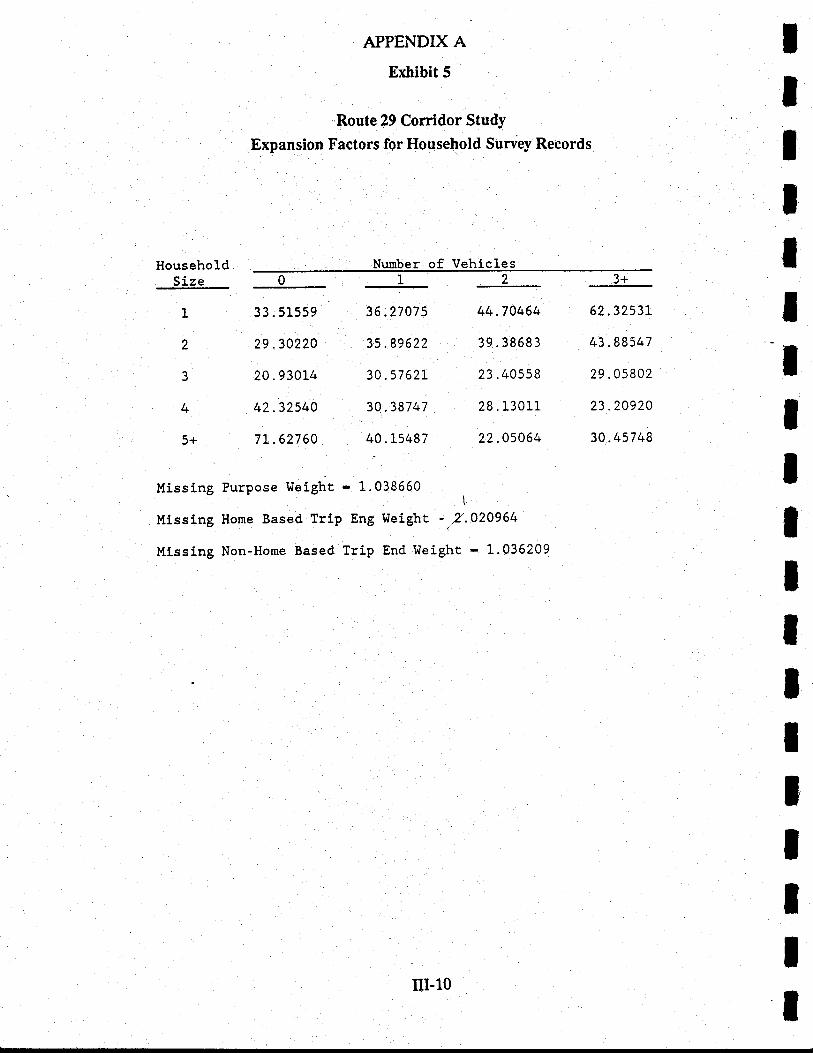
APPENDIX A
Exhibit 5
Route 29 Corridor Study
Expansion Factors for Household Survey Records
Nrrmber of Vehicles
IIIT
IIIIIIIIIIIT
III
HousehoLdSize
1
2
3
4
5+
0
33.51559
29.30220
20.%aL4
42.32540
7t .627 60
36.27075
3s.89622
30.5762L
30.38747
40.L5487
2,44.70454
39.38583
23 .40558
28.13011
22.0s064
3+
62.3253L
43.88547
29.05802
23.20920
3A.45748
Missing Purpose Weight - 1.038650 .l
Missing Home Based Trip Eng WeighE '1.020964
l.tissing Non-Home Based Trip End Weight - 1.035209
m-10
IItIIIlIItItIIIlI
APPENDIX A
4.2 Enpansion Factor for Missins Information
Due to errors in reporting and coding of trip purpose and trip origin/destination
information, some records had to be removed from the survey data set. To compensate for
the reduced sample size, two additional expansion factors were developed. These factors
were used in conjunction with E)(PANWT.
The first expansion factor compensates for records which have missing trip purpose
information. This factor was calculated by taking the ratio of total trips (expanded)
including those with missing purpose and total trips excluding missing purpose records'
The estimated value for the factor (MSPURT) is 1.0385.
The second set of expansion factors were calcuiated to compensate for missing trip
end(s). Two factors, one for home-based and one for non-home based trips, were
developed. In each case, the previous two weights were applied to a crosstab of
coded/uncoded origins by coded/uncoded destinations. For home-based trips (GXHB)
and non-home based trips (G)Oft{B), the factors were 1.0209 and l,.0362respectively.
Overall weights for home-based (work and other) and non-home based trips can be
expressed as follows:
'-ffiffi:,'#ff#:ffi;ff;Sffi"5.0 FINDINGS
5.1 Description of Data
A random sample of 1.,193 households contacted and interviewed are the
information base for all internal travel analyses. UVA affiliated households represent
almost 36 percent of the sample consisting of 196 student household s, 1'44 UVA employees,
and 91 faculty members.
On a tlpical week day 260,471. internal trips are performed within the study area- A
purpose-wise classification indicates that home-based work, home-based other, and non-
home based trips constirute 17.04, 50.60, and32.36 percent of total trips respectiveiy.
5.2 Household Characteristics
5.2.1 Number of Persons in Household
Average household size (number of persons five years of age or older) i1 3U-serv-eO
to be Z.ZB. According to the 1980 Census, number of persons per household for the
Charlottesville urbanized area was 2.7. The Census figure is higher due to the inclusion of
persons below five years old in the definition of household size. Moreover' considering the
nationwide decline in household size for urbanized areas from 3.1 to 2.8 during 1970-80'
m-l1
IIAPPENDIX A
one would expect similar trend within the study area. Exhibit 6 illustrates the distribution
of householdsby size as observed in the household survey.
5.22 LutoAvailabilitY
A comparison of vehicle avaitability characteristics between the 1980 Census and
1988 household survey indicate that there has been an increase of almost 28 percent in the
average number of automobiles available per household over the past eight years.
According to the survey data, on an average 1.92 automobiles (including cars and pick-up
vans/trucks) are currently available to each household residing within the study area. A
significant difference in average automobile availability rate exists between city and the
county residents. City households have 1.84 vehicles on average while county households
have 2.18.
5.2.3 Household Income
Exhibit 7 presents the distribution of households by income within the study area. A
comparison of the household survey with the 1980 Census indicates that the proportion of
households below $20,000 annual income has decreased from 50.7 to 31.5 percent.
Moreover, according to the 1980 Census, households with more than $35,000 yearly income
represent 15.4 percent of urbanized area households. The share of similar high income
households has increased substantially, with 31.4 percent of surveyed households earning
$40,000 or more. However, since twenty percent of all households contacted during the
survey did not report their income, the observed distribution should not be considered to
represent the true distribution of the population.
5.2.4 Income and Automobile Avaitability
Vehicle ownership is directly related to household income. Exhibit 8 clearly" show's
that as income rises, number of automobiles per household increases. Number of vehicles
(including pick up van/truck) per household increases steadily from 1.36 for those rvith
income below $20,000 to2.46vehicles for those with income of $40,000.
53 Ttavel Characteristics
5.3.L Trip Rates by Househotd Size and Automobile Avaitability
On average, 8.3 motorized trips (including internal-external/external-internal trips)
are made daily by a household. Anong households with a vehicle at their disposal, there is
significant variation in trip rates within each automobile availability group as household
size increases (see Exhibit 9).
IIIIltIIIItIIIItI
III-12
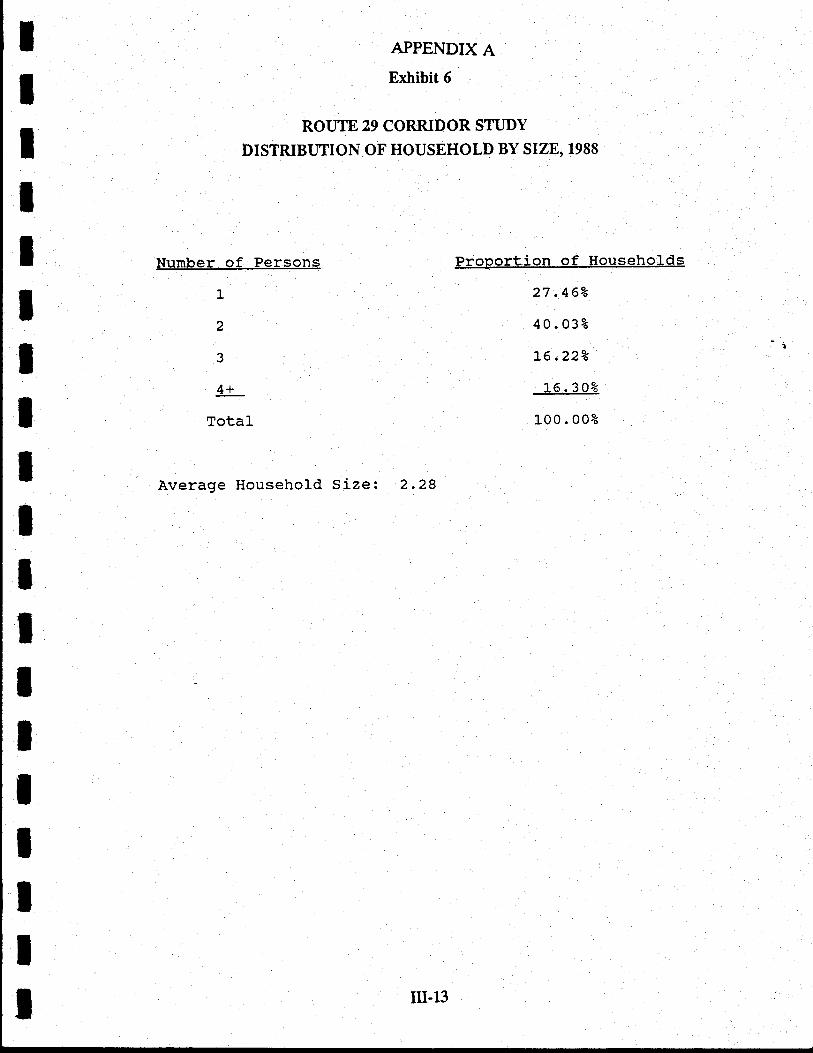
IIIIIIIIIIIIIIIIIII
APPENDIX A
Exhibit 6
ROUTE 29 CORRIDOR STUDY
DISTRIBUTION OF HOUSEHOLD BY SIZE, 1988
Number of Persons
L
2
3
4+
TotaI
Average Household Sizez 2.28
27.452
40.03u
t6.222
16.302
L00.00?
III.13
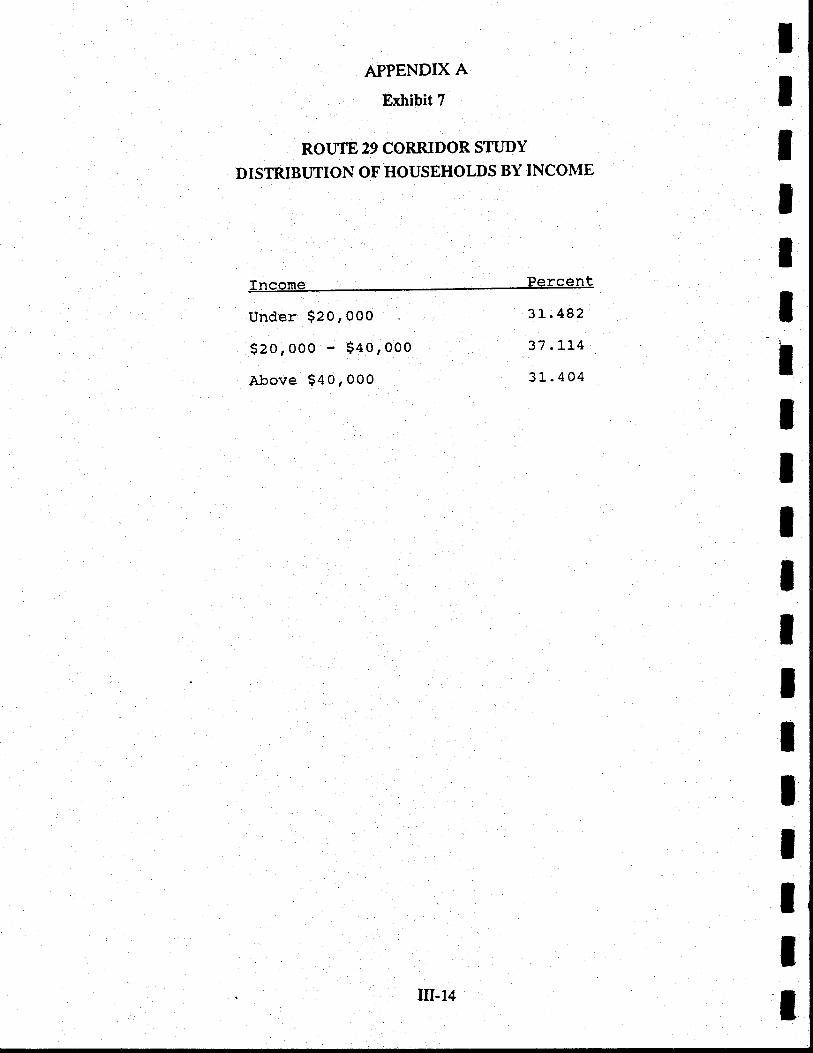
APPENDIX A
Exhibit 7
ROUIE 29 CORRIDOR STUDY
DISTRIBUTION OF HOUSEHOLDS BY INCOME
r-^^*^ Pcrcent-
IIIIIIIIT
IIIT
tIIItt
Under $20,000
$20, OO0 - $40, 000
Above $40'000
3L.4e2
37 .It4
31.404
III.14
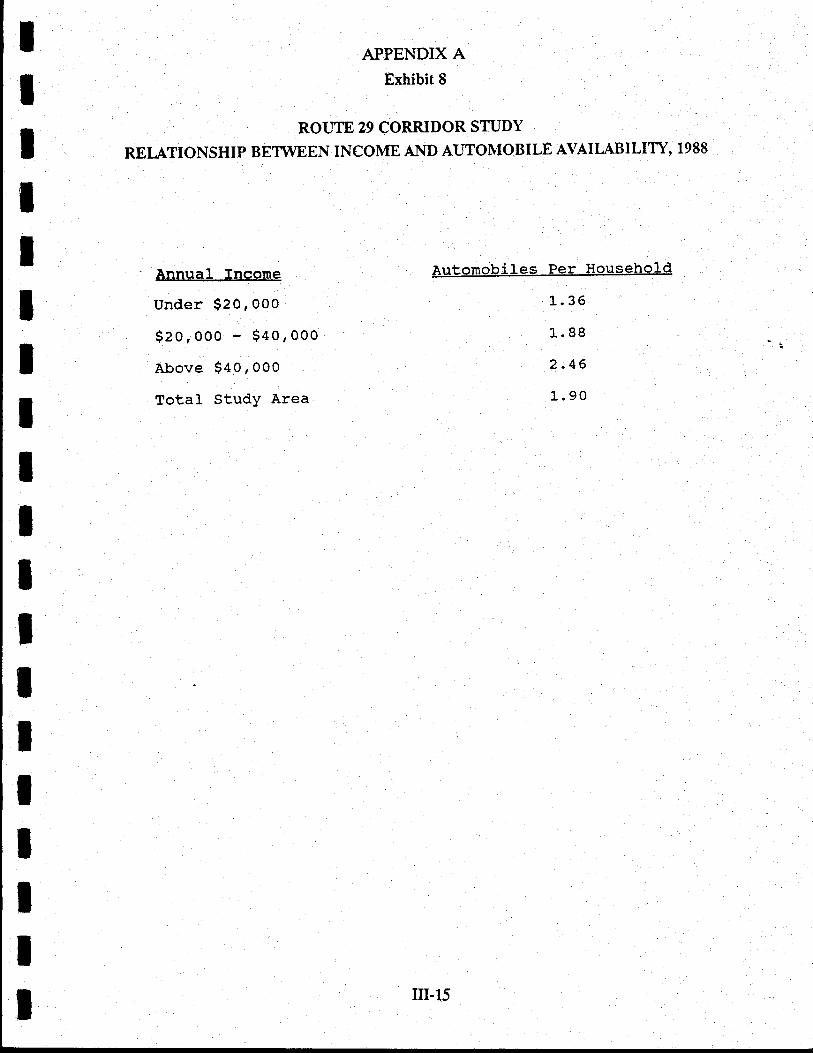
IIIIIIIIIIIIIIIIIII
APPENDIX AExhibit 8
ROUlE 29 CORRIDOR STUDY
RET,ATIONSHIP BETWEEN INCOME .A}'[D AUTOMOB ILE AVAI LABI LITY, 1 9 88
Annual Income
Under $20,000
$2o,oo0 $4o, ooo
Above $40, ooo
Total StudY Area
Automobiles Per Household
1. 36
L.88
2.46
L.90
m-$
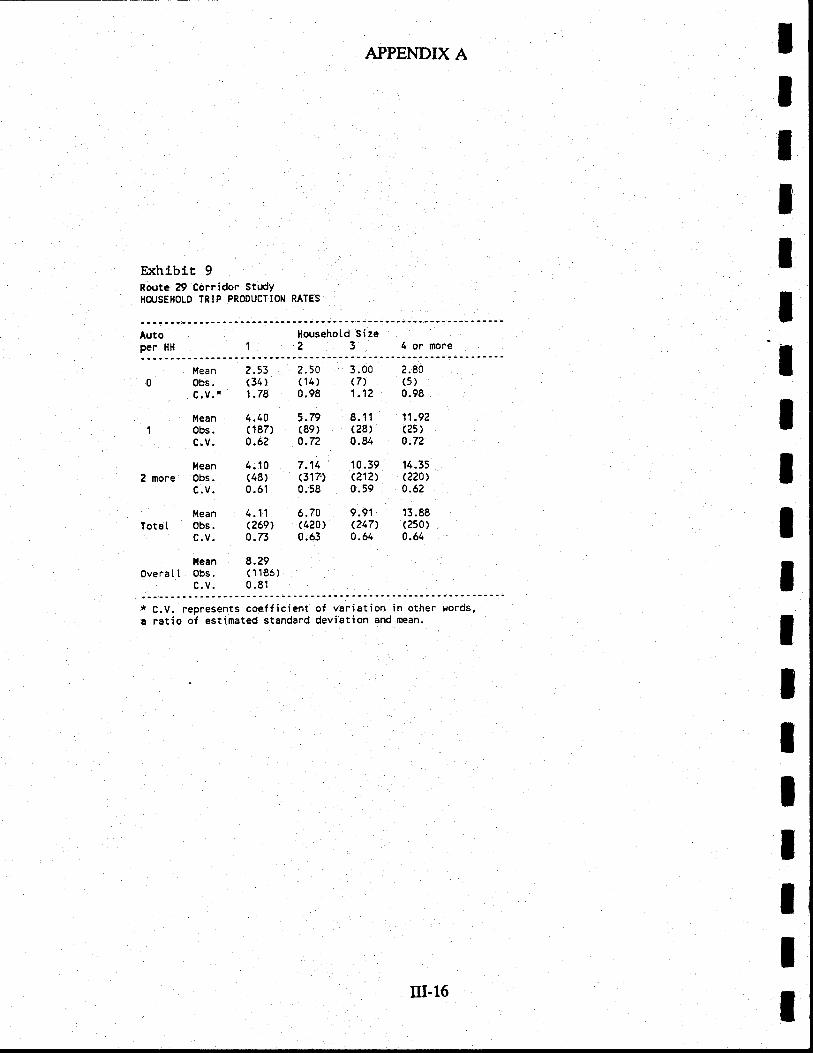
APPENDIX A IIItIIIIIIIIT
IIT
III
14.35(220)0.6?
'13.88(250)0.64
Exhibtt 9Route 29 Corridor StudYHCI,JSEHOLD TRtP PRODUCTION RATES
AUtoper HH
Househotd Size2 3 4ormore
l''lean0 obs.
c.v. *
llean1 obs.
c.v.
l,lean2 more Obs.
c.v.
trleanTota[ obs.
c.v.
l.leanovera[ [ obs.
c'v.
? .53 2.50(34) (14)1.78 0.98
4.40 5.79(187) (89)0.62 0.72
/r. 10 7 .14(48) G17'>0.51 0.58
1.11 6.70(269) (420)0.73 0.63
8.29( 1 186)n et
3.00 2.80(7) (5)1.12 0.98
8.11 11.92(28) (25)0.84 0.72
10.39(?12)0.59
9.91(247)0.61
* c.v. represents coefficient of variation in other rords,a ratio of estimated standard devietion and mean.
trI-16
l:
llItItItIrllI
APPENDIX A
Household trip rates more than double as household size (number of persons older
than 5 years) increases from one to three persons. $imilally, households with automobiles
show a doubling of trip rates from one to three and npo to four or more person households.
As expected, the greater the number of automobiles available, the greater the impact that
additional persons in the household will have ou trip rates. Since only 60 households with
no automobile were part of the random sample, trip rates for households in this groupgqalainiag more than one person are statistically unreliable.
5.32 Mode Use by Trip Purpose
Automobile remains the dominant mode of travel within the study area, serving
almost 90 percent of daily trips. Exhibit 10 illustrates the shares of trips using various
modes of travel for each of the three purposes. Almost 76.5 percent of work trips were
made by auto, truck, or van as per the 1980 Census within the Charlottesville urbanized
area. However, according to the household survey, the share of auto/van/pickup trucktrips for work purpose travei is 90.6 percent.
5.3.3 Automobile Occupancy by Purpose
Average automobile occupancy rates by purpose of travel are displayed in Exhibit
11. For non-work purposes (i.e., home-based other and non-home based), automobile
occupancy rates are higher than for work. The survey suggested occupancy rate of 1.18
persons/vehicle for work purposes is slightly higher than the 1980 Census figure of 1.16
reported for the urbanized area.
53.a ftip Length by Purpose
Using the base year network skim information and the origin-destination trip table
obtained from the expanded survey records, trip lengh frequenry curves by purpose were
produced using the MATRIX module of MINUTP. Exhibits 12 through 14 display these
curves. Average trip lengths in miles for motorized internal home-based work, home-based
other, and non-home based pu{pose trips are 3.86,3.27, and2.S2respectively.
5.3.5 Tlips by Time Period and Purpose
Morning peak (7:00 to 9:00 am) trips account for 15.8 percent of all daily trips while
evening (4:30 to 6:30 pm) peak trips represent 18.2 percent of the total. The composition
of trips by purpose for peak and off-peak periods vary significantly as shown in Exhibit 15.
Work trips constitute 36.5 percent of AM. peak and 22.5 percent of P.M. peak period trips.
IIIIIIII III-17
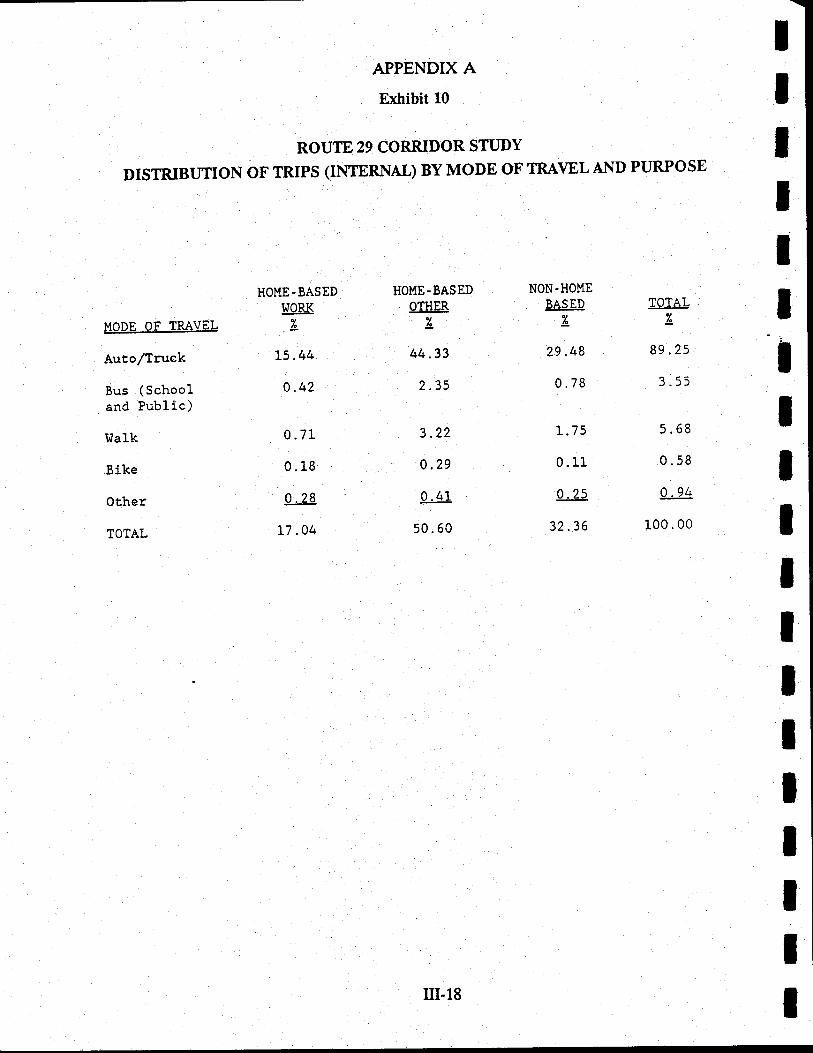
APPENDIX A
Exhibit 10
ROUTE 29 CORRIDOR STUDY
DISTRIBUTION OF TRIPS (INTERNAL) BY MODE OF TRAVEL AND PURPOSE
IIIII
UODE OF TRAVEL
Auto/Truck
Bus (Schooland Publ-ic)
Inalk
Bike
Other
TOTAL
HOME-BASEDWORK
L5.44
0.42
0.71
0.18
0.28
L7.04
HOME-BASEDOTHER
44.33
2.35
3.22
0.29
+50. 50
NON-HOMEBASED
"/.
29.48
0.78
1.7s
0.11
a.25
32.36
TOTAL
89.25
3.55
5.68
0. 58
0.94
100.00
tIII
ItIIIII
rTr lour-ic I
II
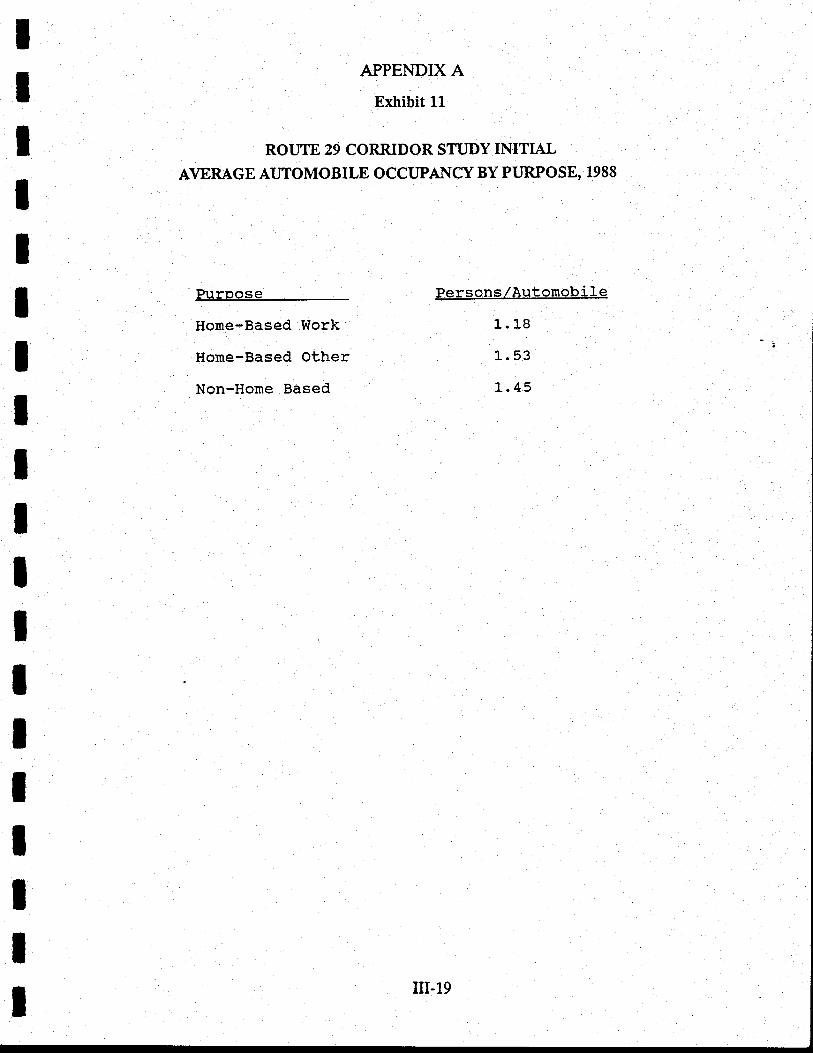
APPENDIX A
Exhibit 11
ROUTE 29 CORRIDOR STUDY INITIAL
^AVERAGE AUTOMOBILE OCCI]PAT..{CY BY PURPOSE, 1988
PurDose
Home-Based Work
Home-Based Other
Non-Home Based
Persons/Autgmobile
1-. L8
r.. 53
L.45
In-19
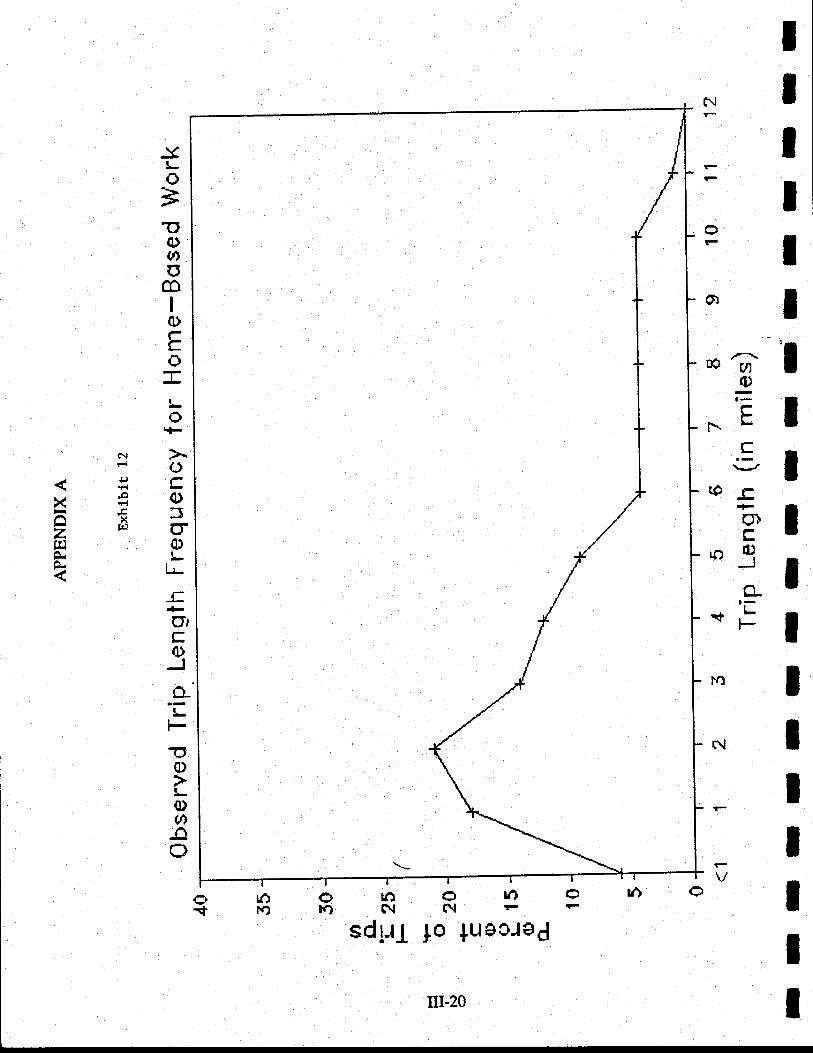
tIIIIt
5ltor
Frroi I
,rE ItIIIIII
()
c{
ot-
J!-o3!q)thom
I0)
Eo
!-o\F
(J
q):]C'q)L
tJ-
-E(ItE0)Jo-fFTq)
!-0)ano
mfi-'lo
r\E I6l
.rl
xtd
Xaztrl
s H ff*urTrlJ+rri* rr) O
trI-20
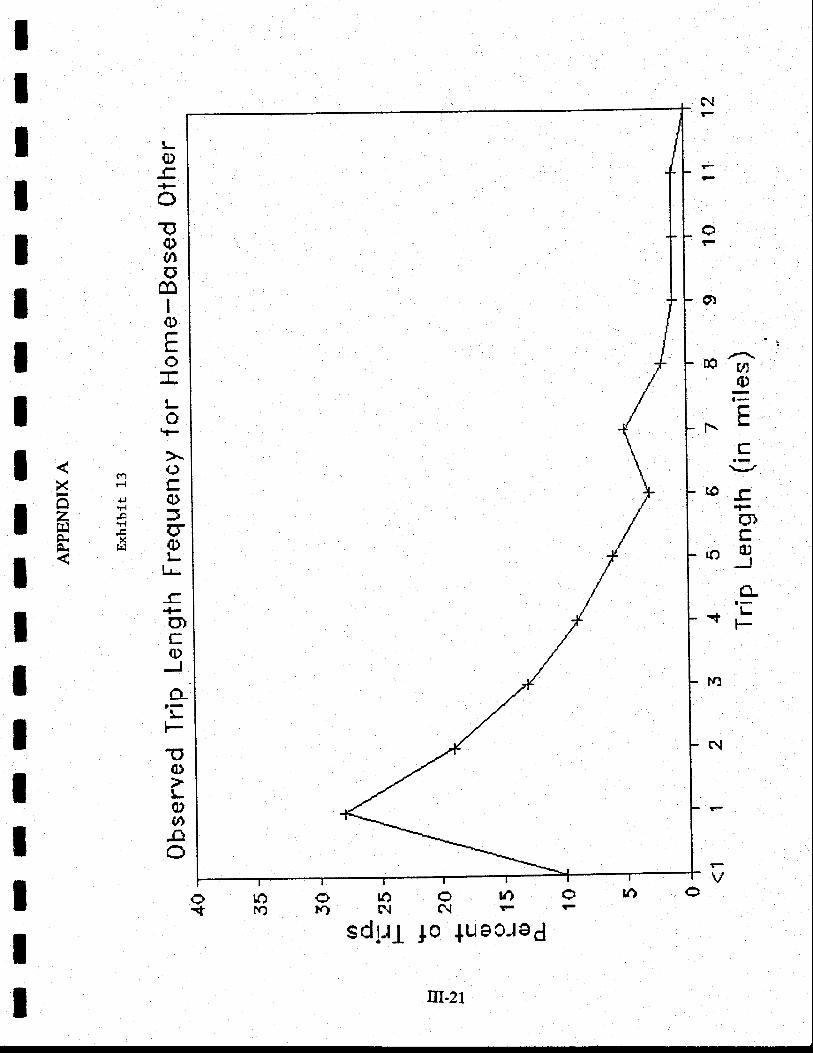
f'l
oF
o
!-q)roTq)(osIoEo
Lo*->l(Jl(-la)-(t()t-L-E.Fo,Eq)Jo_'fFroo,
!-o,th.{]()
tIIlIItI
(ftt-t
l.trlFl
XEI
lrla
O'
IIIIII
r.l.r W
*F
FLtr
rof-.olr
.o0l_J
c-t,L
tfJ
N
Vov}
Fo(\O
lq}u.)r{)
otIII
u?t\sd1-t1 lo +uecrad
on
m-21,
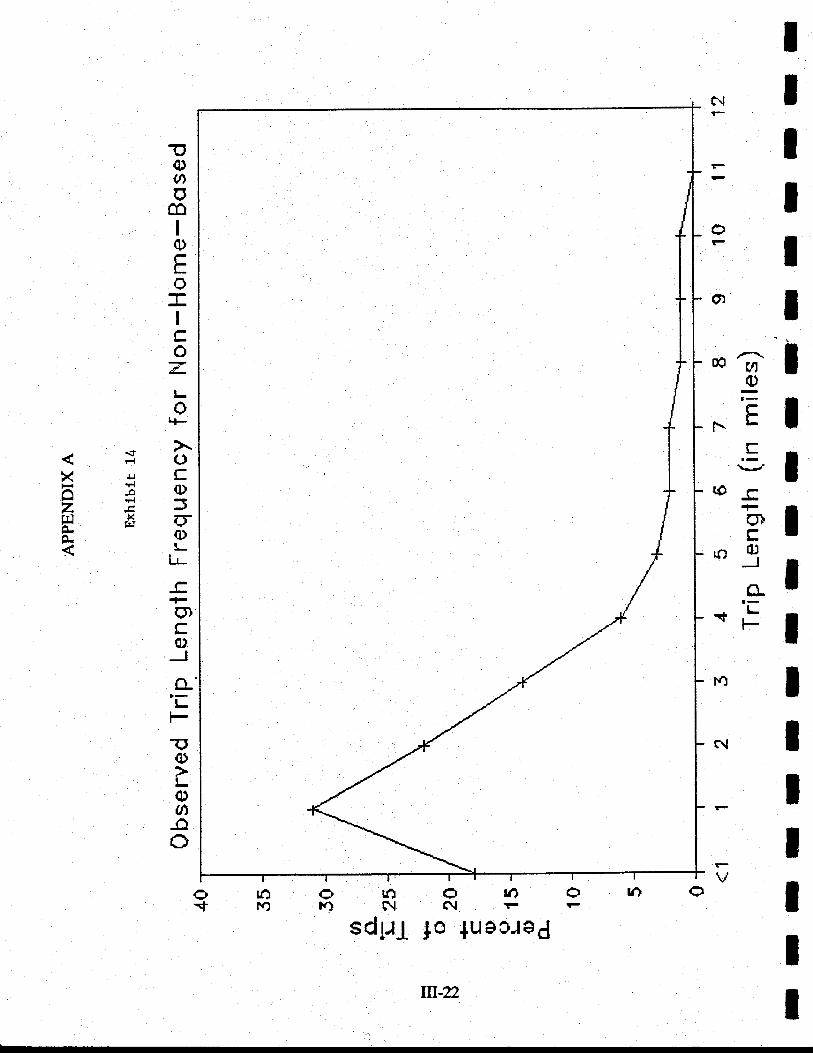
ooGlo
r.'E I
IIIIII
€lrOr
FInol;l
"+F IIIItIII
Eq)6om
I0)rcoT
Ifb
oz.t-o
t{-
>r:c).L, c3CId-iJrE tT
q)!-
t-L
ro)--0)Jo-
l-!-F_lJ
{)Lqt(f,no
Xozrr\o.A.
rJ) O v)g\ (\l F
sd1.r1 lo +uecrsd
ilr-22
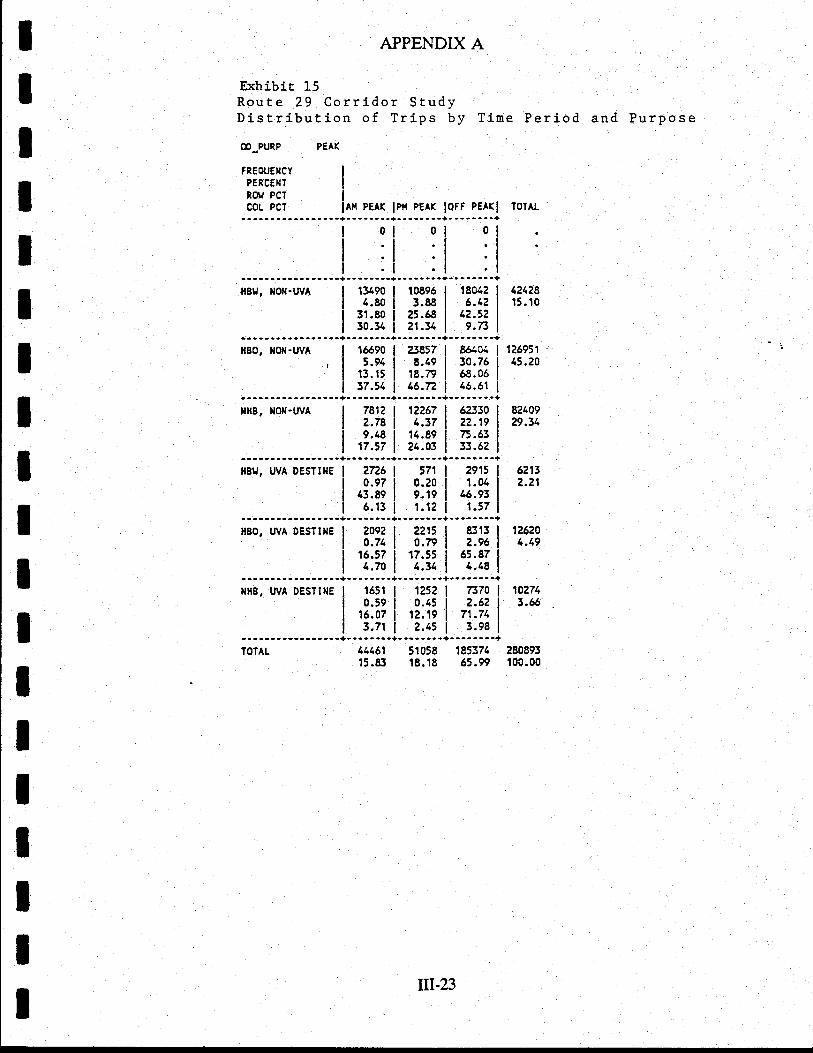
IIItIIIIIIIIIIIIIII
APPENDIX A
Exhibit 15Rout e 29 Corridor StudyDistribution of Trips by Tine Period and Purpose
OO-PURP PEAK
tnEouExcy IPERcEUT I
ROl PCT I
coL PcT lAr{ PEAK lPr{ PEAK loFF PEAKI---t-+--------+---r----+- -------+
0l 0
'l'l:154904.E0
31.E030.11
156905.91
13. 15
37.51
IOTAL
42128t5. t0
12695145.20
8210929.34
126204.19
ltBo, xolt-uv^
HBU, IOlt-UV
TOTAL
t(}896 | 180423.86 | 6.tZ
25.6s I t2.5221.34 | 9.73
23857 | gto4E.19 | 30.76
18.79 | 68.0616.72 | 46.61
4.31 | 1.48
ltH8, IOil-UVA 12?67 | 623301.37 | ?2.1e
14.89 | 75.6321.03 I 33.62
HBo, WA DESTTIE | 2092 | 2215 | E3130.71
r6.574.70
o.7e I z.e617.55 | 63.87
;;;,';;-;;;;;;;'i-';;i"";;;'l-'-;;;;'i 6213
| 0.e7 I 0.20 I 1.01 I 2.21| 13.8e I e.1e I 16.e3 I
| 6.13 I r.12 I 1.57 I
78122.789.48
17.57
--- - -+- -- - ----+------ - -+-- -----.+lfH8, wA DESTTNE I 1651 | 1252 | 7370 | 1A271
I o.5e I 0.15 | 2.62 | 3.56I 16.07 | 12.1e | 71.71 |
I 3.71 I a.15 | 3.e8 |-----+--------+--------+--------+
14461 51058 ft5371 28089315.E3 1E.r6 65.99 100.00
tfi-23
APPENDIX A
Almost 14.5 percent of AM. peak trips are destined to the University of Virginia (UVA)'
Trips destined to UVA for HBO and NHB pulposes ,ue generalty made during off-peak
periods and composed of students and staff.
m-24
IIIIIIII
APPENDIX A
I AppENDIx A To sEcrIoN III: HousEHoLD sLJRvEy DESIGNI AND IMPLEMENTATION PI.AN
IIIIIIIIII III-A
II @ APPENDIX A
comstsIIIIIIIIIIIIIIIII
MEMORANDUI{
TO: Vincent Valenti, vDoTRoute 29 Corridor Study, Charlottesville
iis?i GEitrGtA avENtE SUiTf rC;ys a j :TOt;. M / F Y lA N C 209t:
t3C1 t 933-921i
FRou: Jit N. BajPai )..'4DATE: February 23, 198; Project # 4L63.6.1.1
SUBJECT: Household Survey Sanple Design and lrnplementation PIan
This technical memo out.l-ines a suggested approach f orirnplementing a household suwey within the Charlottesvilletrinsportation study area whicL is cornprised of the city ofCharlbtteEville and- surrounding Albemarle County. I'n thefollowing sections, the propoted sarnpling- approach incLudingrecornrnended sample sizes and the sura/ey irnplernentatj.on plan arediscussed.
The principal object,ive of the household sunrey is- to coLlectintori,ation' on trivel characterj-stics of resideirts living wit'hinthe study area. This info:=ration will be utiLizeC both , todescribe -existing travel and to calibrate travel demand models.Since the Univertity of Virginia (IIVA) , S.ocated withil the cilYbounCary, provioes aimost one-fourth of total area employment, it'emerges as a rnajor generator of trips. Moreover, it is expectedthat- the WA-l]-nked households intluCing both employees andstudents may exhibit dif f erent trip rnaking -behavior. than . o*,.herarea resideirts. In J-ight of these f act's and assurnptions, i-' isdesirable to treat lfVA-associated households as a separate market'for the denrand rnodeling analysis. For sula/ey pu=Poses, however,no dist,j,nction wil"] be-maoe -initially between the tfVA-associatedttousehold.s' and the rest of the respo-nding households as they aree>ryected to be represented proportionalfy il the random sample.Stirdents that live in dorrnitories, though, naY bave to beaccounted for as a special subgroup for a ,, sired level of
Irepresen--ation.
SAI'{PLING APPROACHvobla
The prirnary consideration that underlies household . suryey
sampJ.ing piocedures is the deter-nination of sample size toachieve-a besirable degree of accuracy in the forecasting.abilit{of calibrated travel-dernand mooels.- Since trip generat'ion andtrip distribut,ion models are two basic components of the Propos:drnodlling system, the size and tlpe of sanple needed for thesutx/ey -wj;li be determined by the- desired accuracy level of theabove- tws models and the c-onsirain-'s on the data collectionbudget. In other words, the s:-ze of the target sarnple wil"l beoet6:xrined bY the foiLowing:
Ptnsburgh
IlI-A.1
Wasnngton. D.C. San Francisco
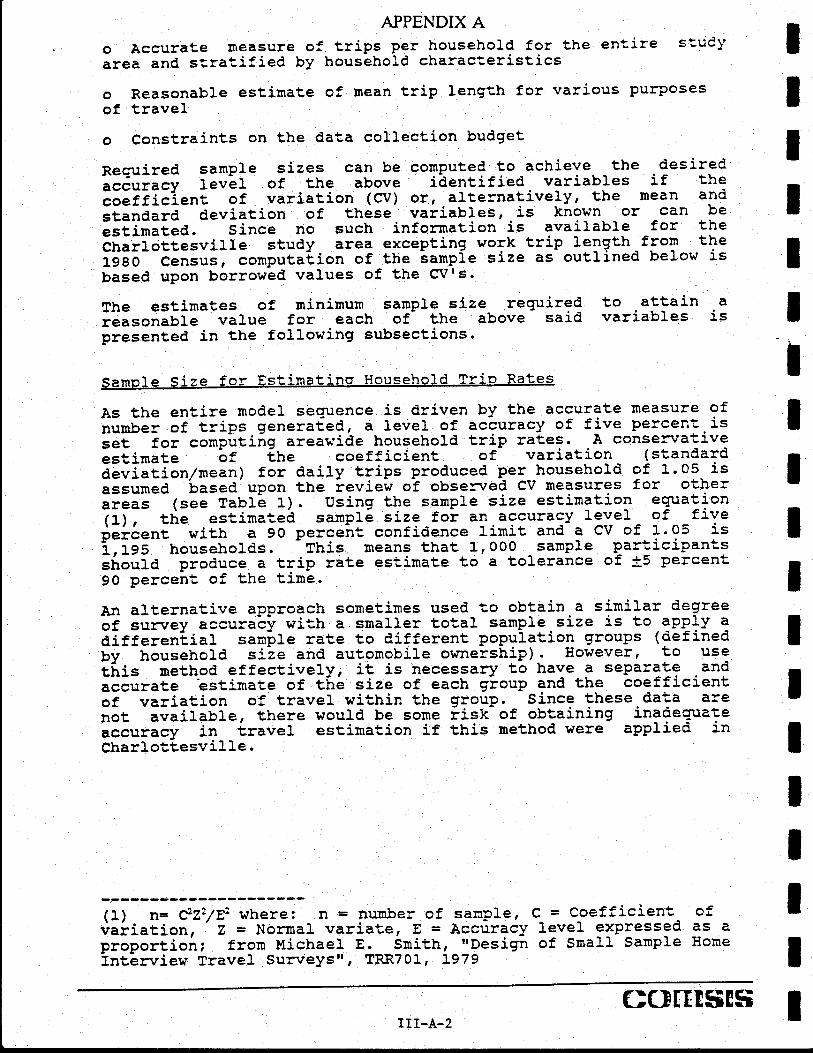
APPENDIX Ao Accurate measure of trj.ps per household for the entire studyarea and strat.ified by household charac--eristics
o Reasonable estimate of mean trip length for various purposesof travelo Constraints on the dat'a collection budget
Rec-uired sanple sizes can be conputed to achieve the desireC;;;;;;t tevlt of the above identif ied variables if thgcoeiti.cient of variation (CV) or' alternatively, the nean andstanaard deviation of thdse variables,.is known- or can beliiinatea. Since no such information is available for the6;;Gaiesvifle study area excepting work trip leng*-h from the19gO censusr--onputalion of the ianpie size as outlined below isItraa upon uirrowla values of the CV-rs.
The estimates of minimurn sarnple size reguired to attainieasonable value for each of- the above said variablespresented in the following subsections.
IIIIIII
a1<
Samp1e Size for EF,tiJnatins Household Trip Rates
As the entire model sequence is d,riven by the accurate measure ofilrb;; oi trips genera€ed, a leve1 of ac-uracy of five percent.isset f or cornputing areawide household trip rates. .
A consel:vatrveestinate -ot i,tre coef f icient of variation - ( standarddeviation/nrean) for daily tri.ps produced per household of 1.05 isassumea 'based'upon the Leview of obse:rred CV measures for otherii""= (see Tabll t-) . Using tl'e sarnple size estirnation equation(L) , the es-'imated sarnplE size foi an accuracy level of fivei"ll""i---with a 90 perceirt confidence linit and a CV of 1.05 isi;i;5 househol-ds. - This Deans that 1' OO0 sanple qart j-cipantssfroufa produce a trip rate estimate to a tolerance of +5 percent90 percen-. of the time.
An al-ternative approach some-'imes used t.o obtain a sinriLar oegree.f ;nryey accuraly with a smal]er total sample. size i.s to ?p!}y ?aitiJi"nliat santile rate to different population groups (definedby household siZe and autourobiLe ownership). However, to useLiti= method effectivelY, it is necessary to have 3 separate .angiJ."t.€e-'estimate of tli size of each gioup and the coefficientof variation of travel within the group. Since these data are
"ot i*riitaute, there wouLd be some iisx- of obtaining inaoequatei"ro"ity j,n iraveL estimation if this me*,-hod were applied inCharlotlesville.
IIIIItIIIII
(1) n= *22/82 where: n = number of sanple,vaiiation, 7, = Normal variate, E = Accuracyproportion; from l{ichael E. Snrith, trDesignInte:rriew TraveL Su:rreYStt, TRR701, 1979
C = Coefficient ofLevel expressed as aof Snrall SamPle Home
IIII-A-2(;(}EIESIS;
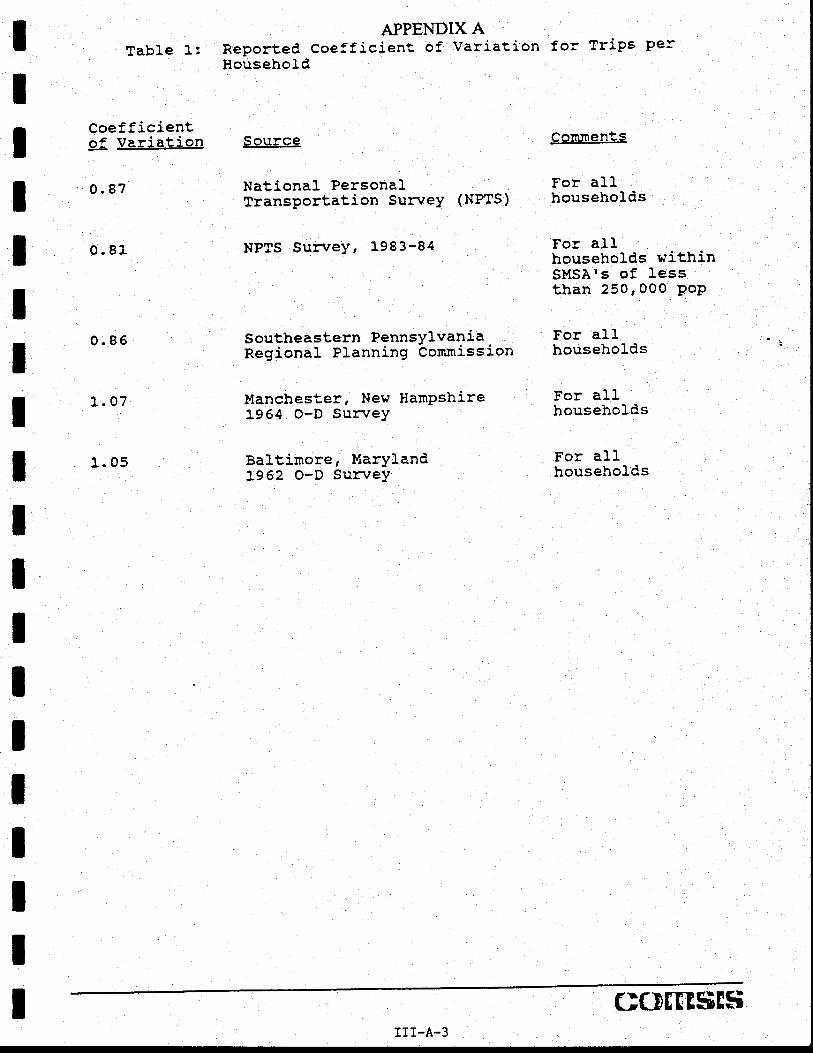
IIIIIIIIIIIIIIIIIII
Tab1e 1:
Coefficientg[ Variation
o.87
0.81
0.86
1. 07
1.05
APPENDIX AReported Coefficient of Variation for TriPs PerHousehold
Source
National PersonaiTransportatj,on SunreY (NPTS)
NPTS SurrreY, 1983-84
Southeastern PennsYlvaniaRegional Planning Comrnission
Manchester, New HamPshire1954 O-D SunreY
Baliirnore, lIaryland3962 O-D SunreY
9omments
For allhouseholds
For allhouseholds withinSHSAIs of lessthan 250r000 PoP
For allhouseholcs
For allhouseholds
For allhouseholds
III-A.3r;(}ffT$Tgi
APPENDIX ASannle Size for Est:.mat-inc Mean ?rip Lenqth
As calibration of the gravity nodel depends up?n the trip ]eng'-ll;;"qn;;;y--ai"triuutioni reas6nable estbnates of mean trip leng-'hfor each purpose are essential to accurately sj"mulate traveloatterns. actording to the 1980 Census, tha mean rrork tripi!rgth'--."a stanoarC-devj.a-.-ion in the Charlottesville urban areaare 16.15 and ig.lZ rninutes respectively. A rSndon sample ofhouseholds r"=.,lt= in collecting-a cluster sarnple of trips, tl'appropriate sa:tpfing element foi mean lrip rate estimation' -To;;;;;;;t;- f;; 'ah;- clusterine of trips-nade bv the. sanpledfrouiefrotas, ;- ae-ign effect iactor is- incorporated into the;il;i; siie estina€ing f ormula. The design ef f ect f actor;;;;;;""G--tn.--;;ii; 6t tn. variance of the rnean of a variable(trip Length in our case) computed under cluster sarnplingiil"f,ptio"E---t"-!rt"-variance'of thl mean based on a randorn sarnple
"t tiips. As no previous sunteys have been conducted for theEiuriSilesvif it .rlu, a design e-f f ect factor of 2.4 obserrred inin" ".t"
of the Kentucky Stat6wide travel sunrey (1) is utilized.fi- ieeping with the previousLy eslablished five percent accuracyrate at so pei-ent coitfid"nce ievel and assumed average- work. tflpr"te of t.iS for a housebold, a sarnple size of 1,384 householaswilL be ,,""e-sary for attaining the desired accuracy. in. the
"=lir"l. oi n"an-wlrf trip leng--h (for detail see Appendix 1) '
Deterrnination of Xinirnum Sample Size
The sample size in the sun/ey should be selected to satisfy :ft'i"+tit"rlnts Ji trrat componenl of the analysis yli."h I:g"iI?:.:l:crr6atest sample size. - In this case, that would be the mlnlmumE;;i;- -
=:,i"' to obtain the desiied leve] of accuracy ina"lE*,:-"ation of mean trip length control. However, theresultant required sample of 1,384 households exceeds the s!5/9Itrudset of tiZOo houseiold,s. In order to evaluate the traaeoff;;;;;" -i".i6u=inf tfre sampJ.e size budget and. accep-.ing a lessere;;;;; "i accuracy, ue dL*,-erningp that reguiring a sample ofirib0 obse:rrations- rather than the originally -budgeted. 1'200o6iewations would decrease the error in estinated rnean trip ratebv only O.O7 minutes. we believe tha-' this snall increSse .inI'"""i1'Ei a""" not :ustify the cost of j.ncreasilg the sam?Ie size;a;--ti:erefore, we reconmend that t!r9 griginally.ProPosed sanplesii6 of L,7OO be used for the Route 29 Corridor study.
SI]RVEY IUPUEMENTATION PI,AN
The proposed. househoLd sutivey design corrbines el'ements ofi.i"pt"nE--int.t-riewing I'ith usl of houiehold diaries to obiain a
ii"fr' description of -travel in the Charlottesville area at a
ri"ir"r posiiUle cost. - P!ra9e. f is used to recruit sgry?yFiliripa-nii ana to obtain initial info:mration about householdsin ttre- Charlottesville area inclUding bousehoLd.s which do or don-dt pittGip;i;-in Frrise Ir. phase Ii obtains detailed householdcfr.tiJt.ii=Licr and travel data f or parf icipaiing householcs.
(1) FIII{A, Guidelines.for Designing Travel Sunreys for StatewideTrinsportation Planning' llay, :,-976.
IIIIIIIIIIIIIIIIIIIIII-A-4
(;(}[rtsrs
IIIIIIIIIIIIIIIIII
APPENDIX Aphase I of the household survey will consist- of na):ing telephoneContact using a randorn telephone nurnber list, asking a serles o:qpestions coicerning househbfd characteristics such as household;;hi;1;
--avail.abiliti, household size, anci af f ilia--ion riith --le
University. Respond'ents -*-i11 then be asked to participate in t.hePhase II triP diarY.
If the household agrees to participate, tle intenrier; sil1
"o""i"d" with the issignrnent of a diy on which to record all
i;i;;-iincfuaing walking ind _biking) eth 3.prornise-that materialsfor'this task w6u1d be iailed to tii dwelling. Information aboutfro"="nolds which refuse to participate in the gul:vey will be usedt;--iaeniify additional houleholds- to be recruited to assure thatthe -final su!-vey has apProTinatel.y eqy?l su:a/ey rates for. ":qlsample group (hbuseholh- size, aulomobile ownership, ?lC IrVA
attitiation). iIso, this data wi]]. provide a basis for- ad]-ust,rngphase II larnple data to account f-or households which do notcomplete Phase II-phase f results wi}l be continuously monitored in oroer to seiec--the phase II sample. It is particuiarly essential to produce t'hedesired statistics within the desired confidence and accuracyLirnits. The reasonableness of mean triP length for each PurPosecannot be monitored during the conduct of the suryey. Hence, tlefocus of suuvey monitoring uilI be on attaining accurate triprat-es .for tbe -critical celts of household category. - As thginitial sample design is based upon either assumed or borrowedlioss-ctassi-fication -of householbs by fanily size and vehiclei.riifatllity, these assurnptions will b6 verif-ied after completingthe phase I- screening for- 80 percent of tl,re target overall samplesize. Xf necessary] at this-stage a revi,sed quota of trousehol'dswill be established'ior each straia (or ceI1) prior to proceedingwitt the Phase II suryey. Additionally, resPonse rates will al-sobe monitored at both phases.
On the evening prior to the household's trip _{i"ty -oayr .&teJ.ephone call- witt be made renind.ing household rnernbers toco:npie-,e their trip diary and to det,e:=Tine if anymisirnderstandings exiit or aaaitional infonnation is needeC toreport the travel- log info:::natj-on.
On the ev.ening following the trip diary {uy, the lousehold willbe calLed agiin and tfre resulti of their-trip dialY wilL .betranscribed iV phone direc--1y into a computer data b3-s9 usingCASES (Cornputer Assisted Sunrey Execution Systen) . Thls datawill then -be edited. and geocoied in terms of trip origin anddestination Jocations. A- oetailed discussion of the suryeymethodology is presented on the following Pages. + floy cbartF#hi;;iii -epilling the sunrey irnpleureirtation methodology isshown in Figrure 1.
Each household agreeing to participate in Phase II will receive ahousehold characieristics fbr-n for- the person j,nj-tially contactedand a trip diary for each household- mernber and gug:t. Inaddition, e lettei of introduction will be attached, written onVDOT letterhead. This letter will state the Purpose of thesun/ey, the pre-assigned Phase If trip diala !ate, .that - af olloi-up tellphone citt would be made o-n tne- aly following tl:trip diiry d"l, and thac a "help 1ine" telephone numbe= isavailabLe, f or ' iny gr:estions. A iopy of all su!1tey f orms andi"=ti"cilons -are ' inituaea in appe-niix'2. Trip diaries and
I IlI-A-5(}(}ffE$ES
APPENDIX Ainst,rrrctions will be sen+- five days in advance of the survey day
so that respondents have a:rp]e tine to read and understand thefonrs and procedures
rerr rre c,a.l ecr-ed phase rr isUsing the sanple_ of ttouseholds selected j'n Phase I, 'designed t" ---"oif""t a"ify irip info::mation fron each household
member. Each-household rrlrn5er'vil1 record t5e point and tinre of;;i;;; p;i;i ar'ra tine of iriival, mode taken, and the vehicleoccupancy ot-"".fr-tfip:- Respondents are requested to complete a
ti""-"f f"g for each fairify member over the aqe of five'
IIIIIIIIIIIIIIIIIIIIII-A-6
(;(}TIXSESi
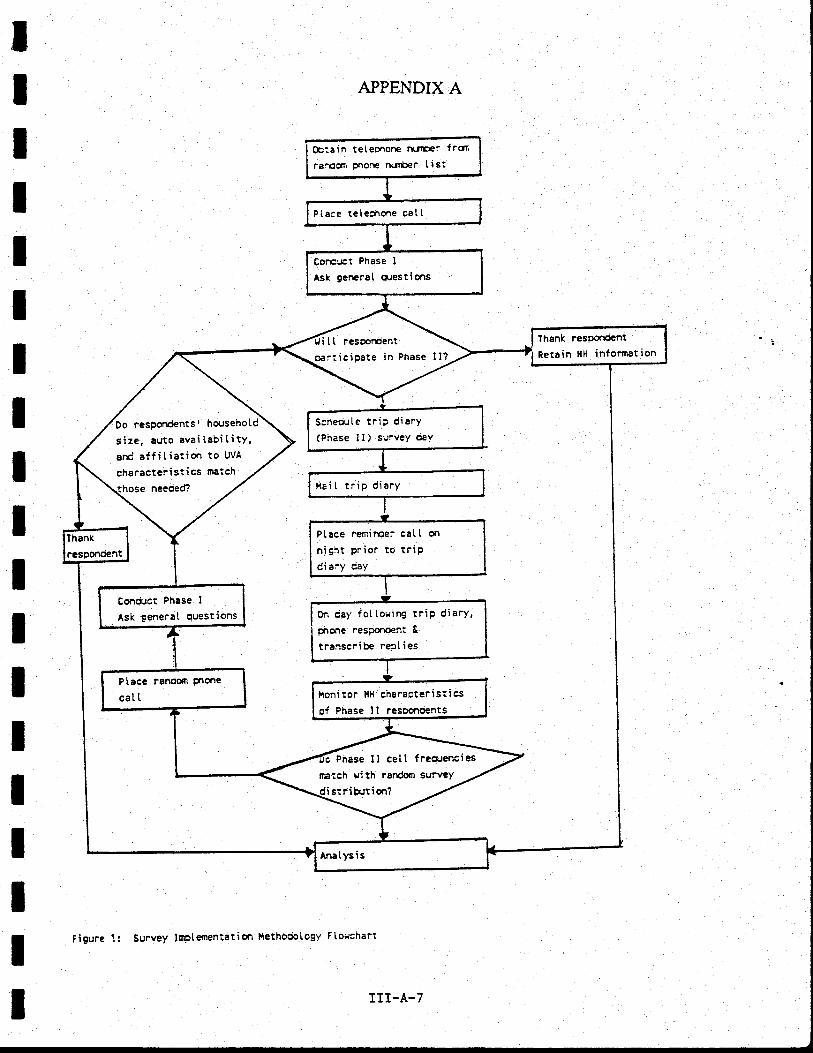
IIIIIIIII
APPENDIX A
IIIIIIIIII
Figure 1: Survey lrnolementatim i'tethodotogy Ftorchart
G:ain teteDhohe nutrrrarccJn pnone nurnber tist
f rrr',
Ptace teleohorre ca[ [
CorEUct Phase I
Ask ger€rat qJestitrls
ili [ [ respordent
oariiciDate in Phase ll?
Do resporrdenlst househotd
size, auto avai labi litY,arri aff i t iation to WA
characteristics maich
Schedute trip diary(Phase ll) survey oaY
l,,tai L trip diany
Ptace remitrer cat I ort
night prior to tripdi ary day
Conduct Phase I
Ask ganerat ouesiions
f'toni tor HH cilaracteristi cs
of Phase tl responoents
Phase tt cell freq.rencies
natch rrith random survey
i stri bJti on?
Ana Iysis
III-A-7
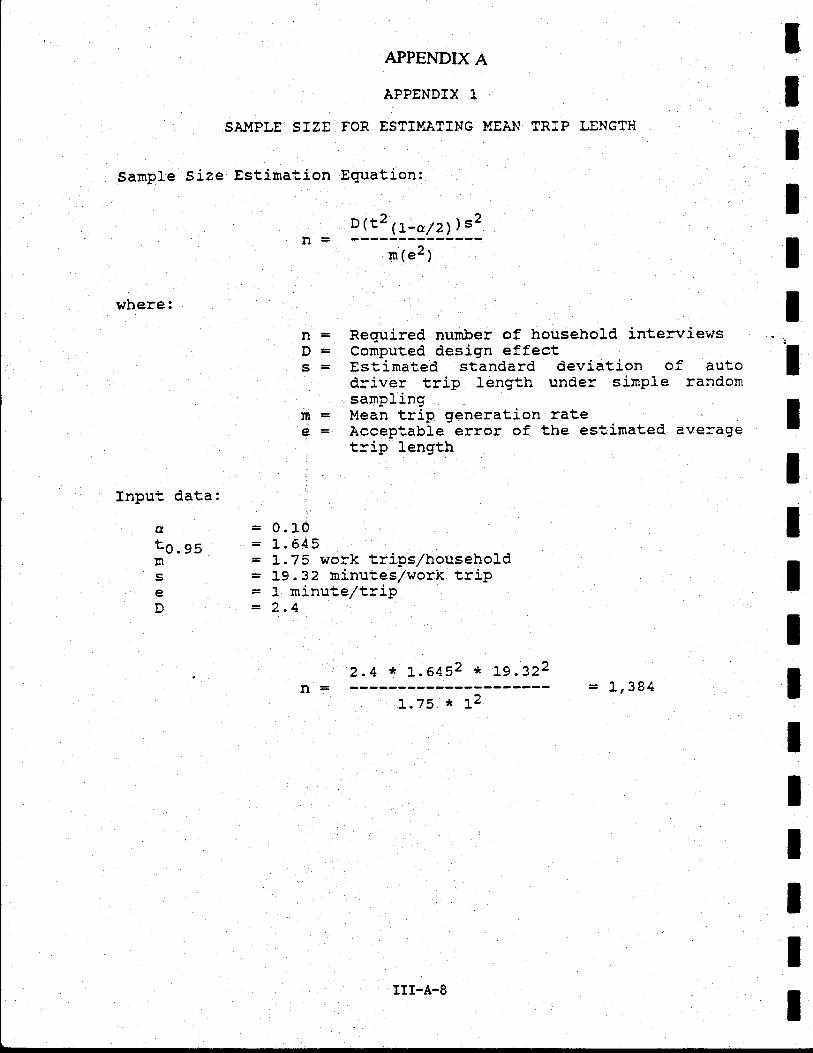
APPENDIX A
APPENDIX 1
SA}{PLE STZE FOR ES?IMATING UEAN TRTP LENGTH
Sanple Size Estirnat,ion Eguation:
D(t2 1-a/4 )"2n=m(e2)
where:
IIIIIIII
n=p=-
Reguired number of household inter:rriewsComputed design effectEs*'irnated standard deviation of autodriver trip length under sinple randomsanplingMean trip generation rateAcceptable error of the estimated averagetrip length
Ju-a=
Input data:IIIIIIIIIII
ato. gs
sen
0.101.5453,.75 work trips/household19.32 minuies/work tripl- minute/t-rip2.4
2.4 * r.6452 * rg.322n=
1.75 * L2= 1,384
III-A-8
tIIIIIIIItIIIItIIII
APPENDIX A
APPENDIX 2
Telephone Household SunreyRoute 29 Corridor Study
- Phase I:
- Phase II:
Selection and Recruitnent ofTrave1 Diary Responoen-,s
Trave1 Diary
cover le'.ter from VDOThousehold characteris'.ics f o:rrtrip diaries for each householdmernber
III-A-9
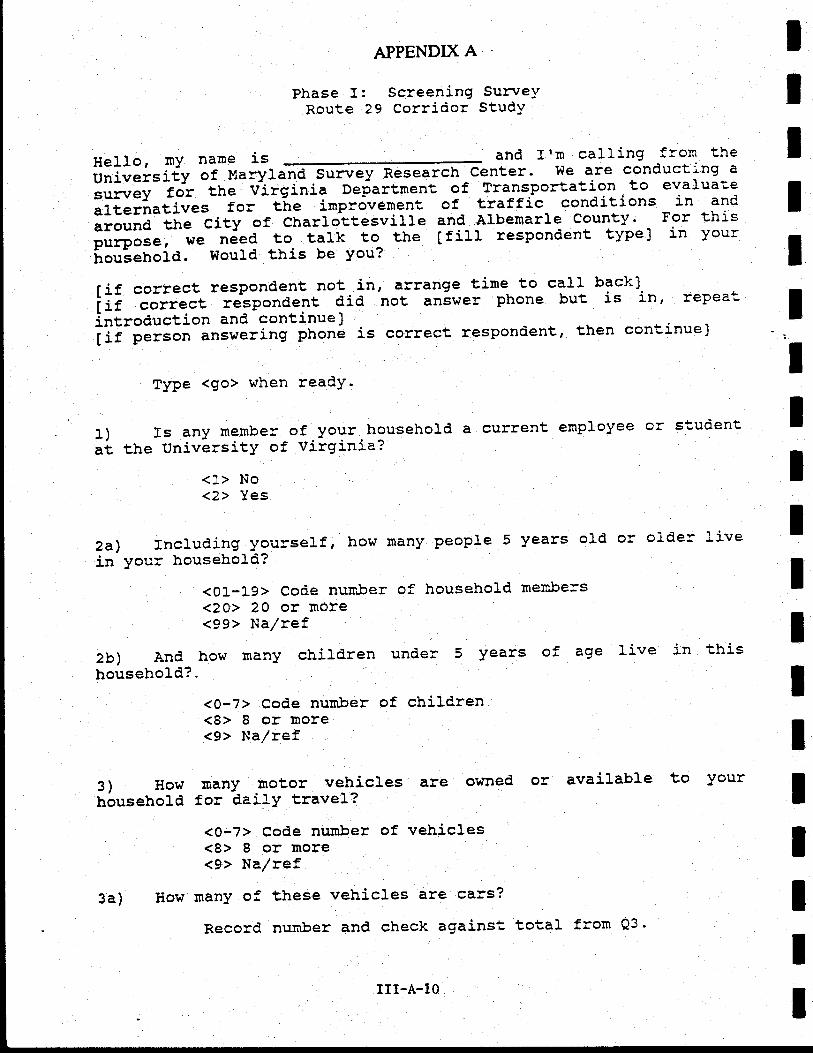
APPENDIX A
Phase I: Screening SunreYRoute 29 Corridor StudY
He1lo, ry name is and lrn calling fronr theii"l""i=i€yoruary][email protected]:.nga;;;;t-;;t th;-v[gi"i" Deiartnent of Tra,ns.portati-on to evaluatealternati.ves
-io, -l-n" irnpr6venent of traffic_ conditions in anc
;;;;A-6e- ciiy of Charloltesville and Albemar1e county' For thisDurpose, u€ n6ea to talk to the tfill respondent typel in yourhouiehold. WouIC this be You?
tif correct respondent not. in, arrange tirne to call backlrif, correct i-i=pona"nt did not answer phone but is in, repeat'inlroauction and continuelIif persor, "r,rr.ri-ng
phonl is correct respondent, then continue]
Type <go> when readY.
Is any member of your household a current ernployee or stuoentthe UniversitY of Virginia?
<2> Yes
2a) Including yourself, how rnany people 5 years old or older livein your household'?
<01-19> Coqe nunber of household meiiJcers<20> 20 or more<99> Na/ref
2b) And how nany children under 5 years of age live in thishousehold?.
IIIItIT
ttIIIIIIItII
1)at
3) Howhousehol,d
<O-7> Code nurnber of chiloren<8> 8 or more<9> Na/ref
many motor vehicles are ownedfor daiLy traveL?
<O-7> Code nunber of vehicles<8> 8 or more<9> Na/ref
many of these vehicles are cars?
Record nurnber and check against
or available to Your
3a) How
III-A-10
total fron Q3.
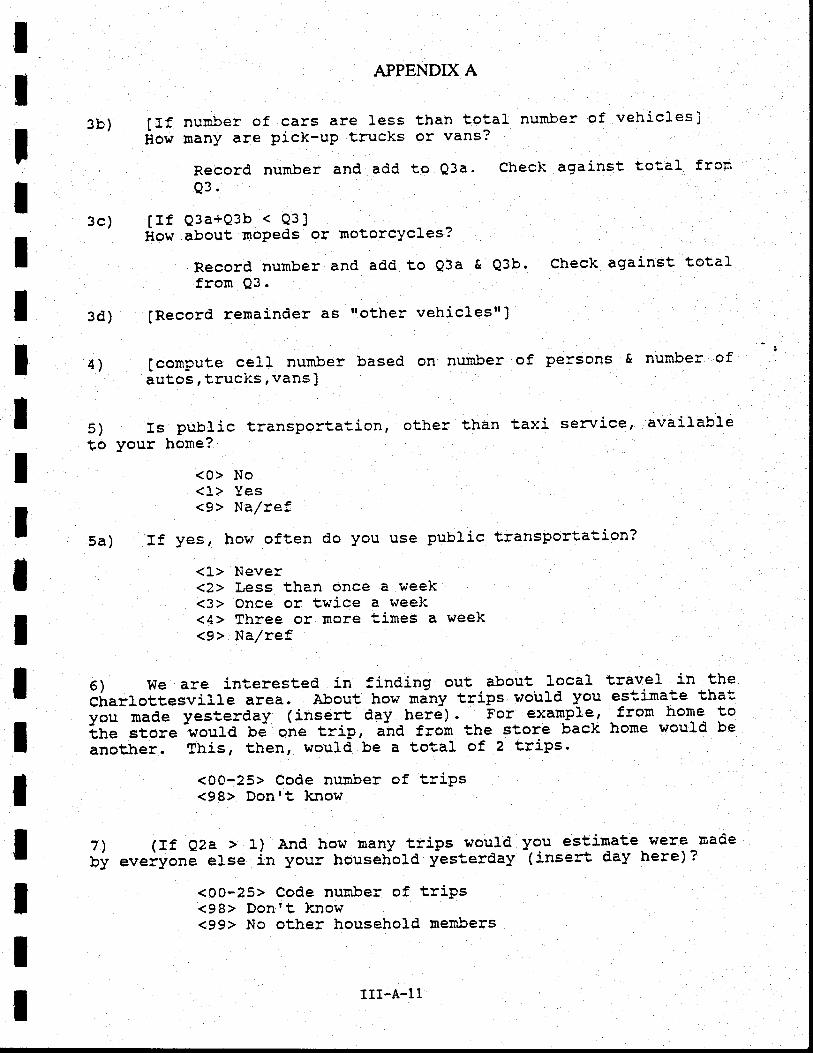
ItIIIIIIIIIIIIIIIII
APPENDIX A
3b) [If nurnber of cars are less than total nurnber of vehicles]iot nutY are Pick-uP trucks or vans?
Record nurnber and add to Q3a. Check against total fronn?YJ'
3c) lrf Q3a+Q3b < Q3]How about moPeds or notorcYcles?
Record number and add to Q3a & Q3b.from Q3.
Check against total
3d) [Record remainder as rrother vehiclesrrJ
rs & number of4) [compute cell number based on number of persotautos, trucP's, vans ]
S) Is_ public transportation, other than taxi se:rrice, availableto your home?
<O> No<1> Yes<9> Na/ref
5a) If yes, how often do you use public transpor"a-'ion?
<L> Never<2> Less than once a week<3> Once or twice a week<4> Three or more tirnes a week<9> Na/ref
6) We are interested, in finding out about local travel in theiirarfottesvill,e area. About how nJny trips woul-d you es'.imate thaty;" naae yesterday (insert day here). For exarnple, from horye tottre store would be one trip, and frorn the store back home would beanother. This, then, would be a total of 2 trips'
<OO-25> Code number of triPs<98> Donrt know
7) (If QZaby everyone else in your houseiiold yest'erday (insert day here)?
<oo-25> Code nurnber of triPs<98> Donrt know<99> No other household nembers
III-A-1 1
APPENDIX A
8) We would also ]ike you to participate in a second part oftiris study which will be rnailed to you. we would send you 3 sinpleiii""f diary form so that you could !._""p track of the tr:-ps yourtrousehold rnikes in one day. !9e']1 call you to get the results theiollowing day. This is a very irnportant part, of. the survey and
oto"ia"t- th; tyPe of infonnation that is critical to planLiutr=portation improvements f or your area. No matt'er how much or;;; ii.ttt" your househoLd travels' your participation in thissecond part of the sun/ey is needed to accurately re-present -yg3rarea. 6an we count on you to participate in the second part cf thesunrey?
<o> No, will not participate (try to talk then into it)(1> Yes, will participate
If no:That completes our suli/ey. Than): you for your time.
If yes: -Would tfill in next weekrs datel be convenient for you to
record your triPs?<0> No IsPecifY a]ternative oatel<L> Yes
,3S€ crive me vour name and add.ress so we can rnail theCould you P1ease give me Itravel- diaries to You tomorrow?
IRecord name and aod,ressiRecord age and sex of, resPondentl
(If Q6ail d,iaries for the other members of yout: household. Could I havetf,e f j-rst iname of each of these Persons.
[Reicrd name t ?ge' sex of each person receiving diary]
That t s alL the quest,ions we have f,or now. We will be making a
reminder call to you the evening before your su5/ey day.to answerany questions thal you may have. Thank you for participating inthe sunrey.
IJ
IIIIIIIIIItIIIIIIIII-A-12
theover
IIItT
IIIItIIIIIIIII
APPENDIX A
RCUTE 29 CORRIDOR STUDY
HOUSEHOLD CHARACTERISTICS TORM
Q1.
Q2.
Q3.
Q4.
How rnany PeoPlehours Per week?
Q1a. Please list--hat worl:'s
in your household are ernployed over 2a
occupation of each household menber20 hours Per veek
describes the tYPe ofWhich of the f ollowing bes-ubuilding that' You live in:
(1) SrngJ-e famj.3.Y detached(2) DuPlex(3) Condominium or townhouse(1) Apar*'ment( 5 ) Donnitoryie I ctne: grouP guarters (ex:itt Mob-i't e home or trai-Ier\,1
Nursing horne)
(8) oiher
Nurnber of beCroonrs in home
Do you ol,,'n or rent Your home?
(1) O'*'n [Go to Q5a](2) Rent [Go to Q5b]( 3) o--her
Q5a.
Q5b. (For renter-occuPied housing) is your rnonthlY rent'?
Q6. pLease name --he three most importan-' criteria you useiwhen choosing your housing location'
(For oLTIervalue of the
occupied housing) liha!honr! that you l-ive in?
is the aPProxinate
Was you= householC incorne last year:
(1) Unde= $20,000(2) s20 40,000(3) A,rove 940,000
Q7.
III-A-13
APPENDIX AItIItl
I:
IItlJ
IItJ
IIII
Daa= Su-'e1' Pa=ticiPan--:
Thanl: you f or help:ng us the othe= day L':'--h :he f !=s'- pa:--.c:the C:,-,y of Charlot--esv:11e/AlbenarLe County T:anspor--a--icn S:u:1'.lou: ag:eemen-- io pa=ticipate in :he second half cj 05 su:rye)' b)'
ieepin6' personal r-ravel Cia:ies rill provide e>::rer,re1y ir'po=-'a::;In:t:=ition to help us plan better transpo=--a:ion f o: theEii=ic:-,esvi11e/A1ber.i=le Cou::t'y area. On).y a .snall nu;':re= cf-i=e:ully chosen housel:clds ve=L seLec--ed for this su:i'e-v- Tnat
""""i -,-hit i-. is irnpor-an: for €v€Flon€ -uo do their pa=i no.l:,a--:er
nc.; ::uch o= nol^' .1i:tle --*:er'. tr.av-eL. Of course, ai1 i"-ioT'1:.i::=-"?tp=c$;-E-oniioen::a1 and u111 be anal1'zed o:t11' r.'hen :.nclucea :n!--u:1' area tot,als-
, i= your t'T'ravel Su-re1' Da\'rr' As ileel:1cseana--effiiu:-,W€-neelacc;.pie-'e:e!]C=:=^c=ea:.-.--=]F;i;;=1--!-="ot (age 5 6r olde_=) in.you=. hcusehol-c nakes on --ha-- cai'nc =?--i": hcu'nlny c= ic'* fe'*:=5'ps --hey ma):e cu=:-ng t'hat 21 hci:=
;;=1;J.---fie --raviJ d,i-a:ies in the envelop-e $e=e oesigned ic nelpiro= ):eep i=ach of_ ycl= traveL on I'T=aveI Su-re1' Da]"" TravelCia=1es a=e enclo!ed fo: each individual ycu nen--icnes.aai1=1ona1ly, a hcusencid cha=acle=is:ics fo:= is enclosec' io bej:llei ou: L1' 3n aCul: ::a=be= of ;he householC'
lie r.'rfl call ]'ou ::extbejc=e ttT=ave1 Su-reY Da:"t-i r'-- hawe - OnL;uJe trbve'
we greatlY aPP=ecia--e thet' o i:e 1p us PLan be:--erCaa=lc:-.esvj.lie a=ea. :: You
evering -*h€ nig:--anl' gaes--ions --:ia: ]'c'.1cal-f Jtcu agrain --c 9e-- ayou and o;hers in )tcurIf you ?r€ io-- ?i hcne,
:C ansi{;e:we r^'11L
teiep:one repcr-- on --r:e inf o:na-'ion tha-'ho::sLrcid reco=oed. in 1-ou: t=aveJ diaries.ie r-:11 call again a-- a later ij-ne. Please keep eve=yoners;=ave-lcla:ies nea= the ieiep:rone so they a=e handy when L-e calf 'Re=a=:er, you dc no-- hav€ --o raail anytning'
--ine and effo=t t'na: Itou a=e t'a):lngtranspo=:ation f or t'he g=o'*i-nghave any ques--ions, u€ l'j-lL ansiA'e:
-Jr€, i'i:en lte cal-L on . ALso, you reay call ihefoiicn'ing nunbe= llonaaYinic-at,ion abou-- -*iris
:Lru Fricay becween 8:30 ar and 4:00 pl io=s:udy: 1-800-63F:E29.
Again, w€ apprecia:e your help ln --his special projec--'
lrr-A-14
S!ncerel1',
IItIIItIlIItIIt3
i Daie 'i
Dea= Su:r'e1' Particip?r-' 3
Thank you for hel,pj-ng us the o!he: day r"'ith'*he-fl=st pa=.ofthe c:.ty of charlo:;esv:J.l"e/ALbena:le
- coun:y T:anspo:--a::onS--uc1,. -your agreement !o participate in the second. hal'f cf ours*rriy by Xeeping Pe:sonal iravel dia=ies r^':fl' p=ovj-oe e>::rene1-virpo.i."t infi:-nition to help us plan betie: t^ranspcr:'a::.on forti:e Cha:1o:t,esv:11e/?.Lbe:na=id Couniy a:ea. Only a s.n1L1 nu:pe:of caref u11y cnosen householc's lrere seleci.ed f or this su5/e)'.Tha: neans tnat, it is il:rpo!--Bn" fo= everyone_to co;he:r pa:-- *natte: hou :nuch e: hor^J 1l--tl e thev t:a,vel:.- - -
o: ccu:se , allae is confioen:iai and r^':'iI be a;aI}'zel c::11'
when incLuoed in s:ucy area io--als.
[Day, date] is ]'cur lT=avel Suney Da]"'.- As t'he enclcsednateiiais exp).iin, wE need a conplete report for eac:: --:ip eve=]'pe=Son lage 3 o= oloe=) in yo9: housenold rnakes on --hE-' qa-t ncia:te: ho* liany o= ho'* few t=ips thel' ma]:e du:ing :na-- ?1 hou=
;;;i;a. Tbe :JaveL i:.a=ies in ine enfelope we=e oes_rgrec :c helpjr"r i:eep t=ac): of ]tcutr --=avef on I'T':ave1. 9"ry.y Da)"" T-:aveiiia=ies are encl6sed f c= each :ni'ivisual . you r're:::ic:rei'aea:-:ionai-1y, a houserclC ciara3:e=is:ics t9? j-s encjcsed :c beilfLed ou-- by an acuf: lnette: of -'ne hcusehol'a.
i,9e -*-il-L calL you nei- lday before su.:i\tey day] eve:lanE -- iit*niglh-- beiore I'T=avel SU-rev Da!"t -- --C- ansi{e= any qires;lo:s' :'na--ycu aignt have. On [cay aite= su:irtey cay]. ve -*':11 call you aEainio ge-. d ie!.epnone repc--,- on -,he info:='ation .-.hat you and o--he=sin !ou: household recoroei j.n you: t=aveL dia=ies. :f ycu. a:enc: a: hemer u€ wl11 call again ?-- a la:e= i:me' Piease i:eepeve-roners travel dia=ies netr --he
"elephone .:o iney. a=e hanal'u'lren we CalL. Re:nenoe=, you do no'- have to :::ail an1=':'i::E.
We g=eatLy apprecfa--e tne tine and eifo- tba-- you are :a}:inglio irei-p us plan be--:e: -e:anspo=--a--ion f c= :re- 5:o-'.'1ngCha=io--iesvil-le-area. if you have an-y ques--ions, u€ 1f:11 ans'sre;the:l r*'nen ve caLL on [day before strveJt dayj' ]=Lso' Yot aay ca1lthe iolior"'ing;unbe= llcneay thnr f:icay be--ween E:30 a'r anC 4:00pn f o= inf c=i,a:ion abou-- th.ls s--uc1': i-800-€3?g=29.
Agaln, u€ appreciaie ]tou: help in :ris special p=ojec--'
APPENDIX A
lII III-A.15
Since=elY,
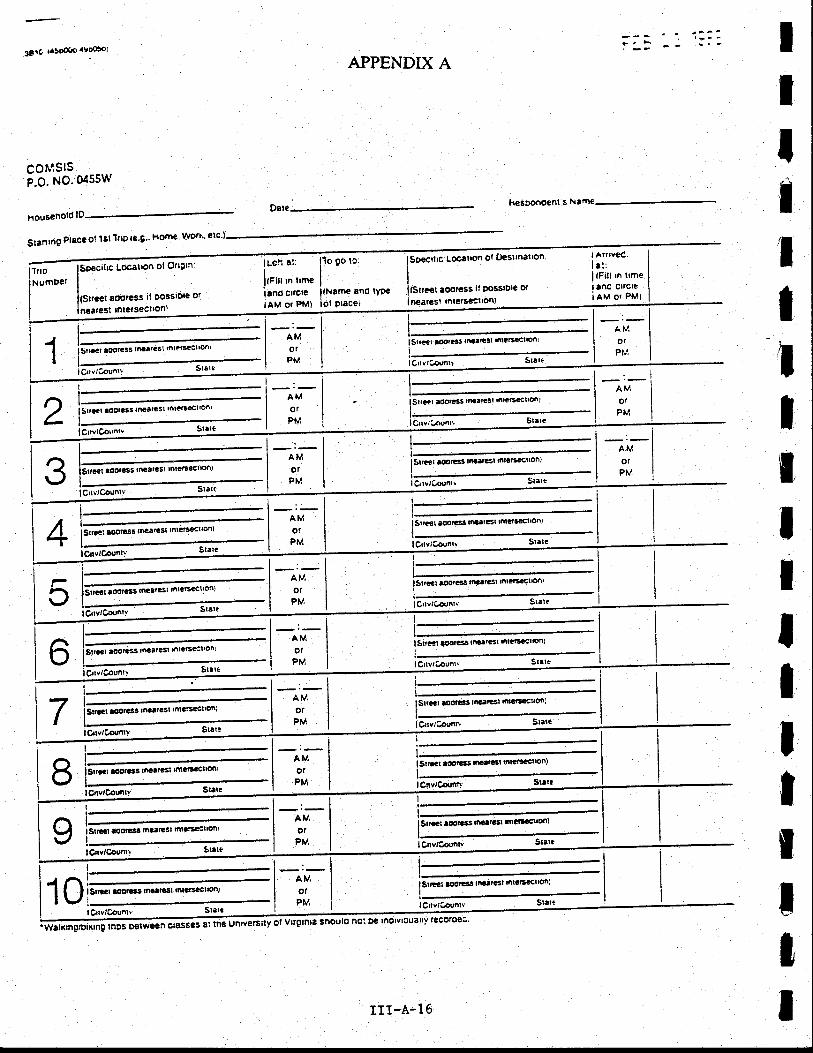
3Ei0 d5oooo'9ootoi It
APPENDIX A
COti'iSlSP.o. No.0455W
kesDonoent s
housenold
Sranttig Place ol 'lsl Tflg le'g" lrom€
ISD€ciltc Localpn ol Otlgrn:
II
l€rr*t "oot"at il gossible or
lneare3l ntersecttonl
iLen 8t:I
l{Fill In |tme
isnd crrcteilu or Pt*1
llo eo ro:
I
lfName 8n0 ly9€
lol Dlacei
I Atf rveo.
I at:i{Fitt rn trme| 8nc cltclei au or Put
IIIIIIl
AMotP||1
AMor
P}i,r
AMorPM
AMofPM
AMotPM
_,_lAMIorlPMI
lSrrEr loorass ll!|ttsl fitB€cltoniStact aoot""t,*"r?Et rnl?rPclro^r
S[cet rootgss,n"rr?st Inl?6eclonl lStrc€t roo.6s maercgl ntctt'clron)
I Crrvl(annlr
lIII
Srrce I eoot63 ttLal?st ld?rtccl|on/AMotPM
lCrtv/Countv
I
S,ra", "ootast,t*atasl
tntrts€clton)
lCrtvrCounlrAwlGounlv
AMotPM
l-clsttlil tootcss l*rt6l ilctLcl|on)
Slraat toorc3s frcatcst mliEaclton)
i stt*t aoota"",*airst rnta*e'lroni
i< lCtt"l'.aunt*
AMotPM
Strlcr atotcas martcgt Intcrsccl'on)lsrcct roorrss rr:Gsl t$Gr$euonl
I
iorrtcoun-- st.t.---..-
AMotPM
I Srrc€r a@tras |'l.trs3l ilcnlccr|on]
IlCrrvl&rnr Slelt
IIT
AMotPM
Srrcat lootg3a ltlaltcat |nl3lt*cllon)Srtt€r aoottgs flltttst fiarsac||on)
gnvrCounly
lAwr@unlv
10 I Stflct aoottsS tnaltest ml?tstctlonlAMotPM
lSrcel rootc3s tttart€3l ntasccl|on'
I
Stal€I Orvrc.ounlvI CrlviCounl! I
l,
I
lyo'v|'9lnEsnou|ono.ioetno|vloually'eco'oe3''walKrngrDirtng rngs D?tween
III.A.16
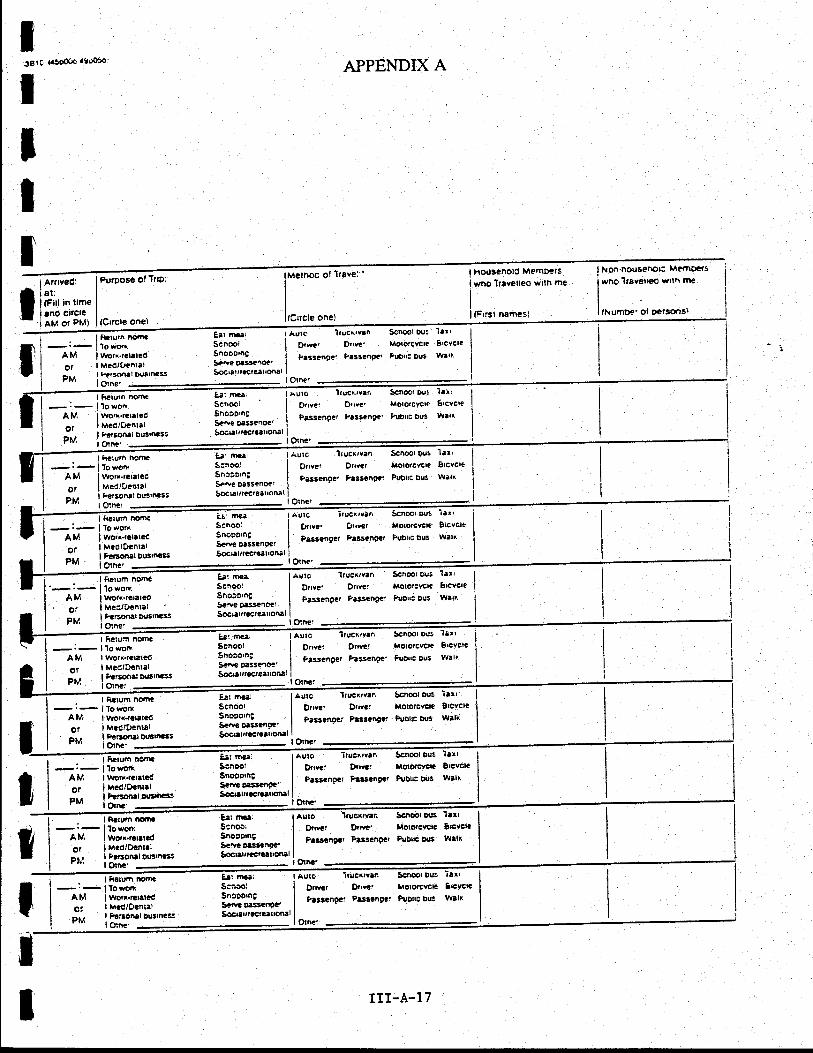
t3610 ..5o00o 'l.f6o;
IAPPENDIX A
tII
lMerhoc ol lrave::' lhousenolo MemD?ts
lwno ltavelleo wilh me
iI
l{Frrst names}
lton.nousenoi: Meffio+tsrrno Traveleo :llh trl€.
lNumDe . of D€tsoal3r
I Ratur^ |rOmC;i- j1e61
AM i lrvo.x.rGlslGd
ot i mcdtt*ntatpM I h_rsoml DrBrmss
lgrrcle one)
lrslci,van Sanoot Du! lal
ia: rncar I AutC lrucrrvan Scnmr ous iarr
dEi tAuto--'ituc*,"1n Scnoor Dus 'l3rt
I Fretuto nornc
-i- 119s66.
AM lwotr-rrt.lcdof I Mcdro€nlal
I h?tonal Dusntss
I Orne'
PM id;;;i lreru?n holt€
I tt€lurn nom€_:- lTowori
AM lworr.rclrlecOl I Meo'D?ntaliu iftr'"*'*"
I F€tun nome
-:- l'io*odr
AM IwoG.r"€tcdot I MediD.ntalpu 1ffff'.'"*. I Fclutn hom!
-,- lloworl
AM ltwo?(rcltrcdot i M?dlD?ntal
E:r rnGal I aulc lrucxrvan Sanoot Dus lril
Frt maai lAulo llucx'vrn xnwr ecr r'rlSgnool I pr,rsr prrvt: lrolo?ctrcE BrcycE
::_*"I:r."*. I rrr""ng.' F.$"ne"' FuDrc ous vrrti
Soaluracrearona: iI ns-'
Eat mGal I aulc llucxttln !'nFr w5 'trlSgnoot I prrwr D.,vct lloto?crrcl€ BtcYclc
gn"r:l-*. I et"t"ne"t Prs3?ng!! PuDkc Dus w'rk
SoqetftccrGatronal I
I Felum nom€
-i- l'lorrcrt
AM I ttvori{ctltad
PM iffi::
P!." i#;:
or I MedtD"nt.l
PM lffi*"''*Itraun io.Tra
-:- 11o*o'*
AM lwoq*cntcdor i MrorDcntri
I pl'ronat DU6rn6S
E:r ttlei I auro lrce{rYlnSgnoor I Dt,rar Drrvtr
il*"J:*.*' I ett""ne"' Prsscnecr
Socratrfcctalonal I
Senool qJs lariMototqYcte 3rcvclrFubtrc Dsg ltrlk
I trelun nomc
-: - | TowoR
AM I won{!|rrcdOr I t^c6rDcntal
I Fc'sottal DuEmcas
gar "r"'
I Autc lrucrrvan Scnoor ous 1:r'Sinool I Dt,"ct Dflcr MOrOrcvCE EtCvCl€
snoDDrni I Passenger Ptsscnpcr PuDlc Du3 wal(:Ptue oe3s?ner | -
Socrarriccr?atronal I
I Otnef :
Scnoo: I g.rcr gtwcr Ltorotcvcte Srgvgk
*noJl:*^"., I rttt"nott Pr3srnccr PgDtrc Dus wrtr
saE|.lrrcct€lronal I
I autg lrggxr:n s€noot ars ialE t tlraal
PM id;::
III-A.17
ItI
APPENDIX A
APPENDIX B TO SECTION III: PHASE I . HOUSEHOLD SI.]RVEY FORM
IIIIlIIIttIIIIttItI
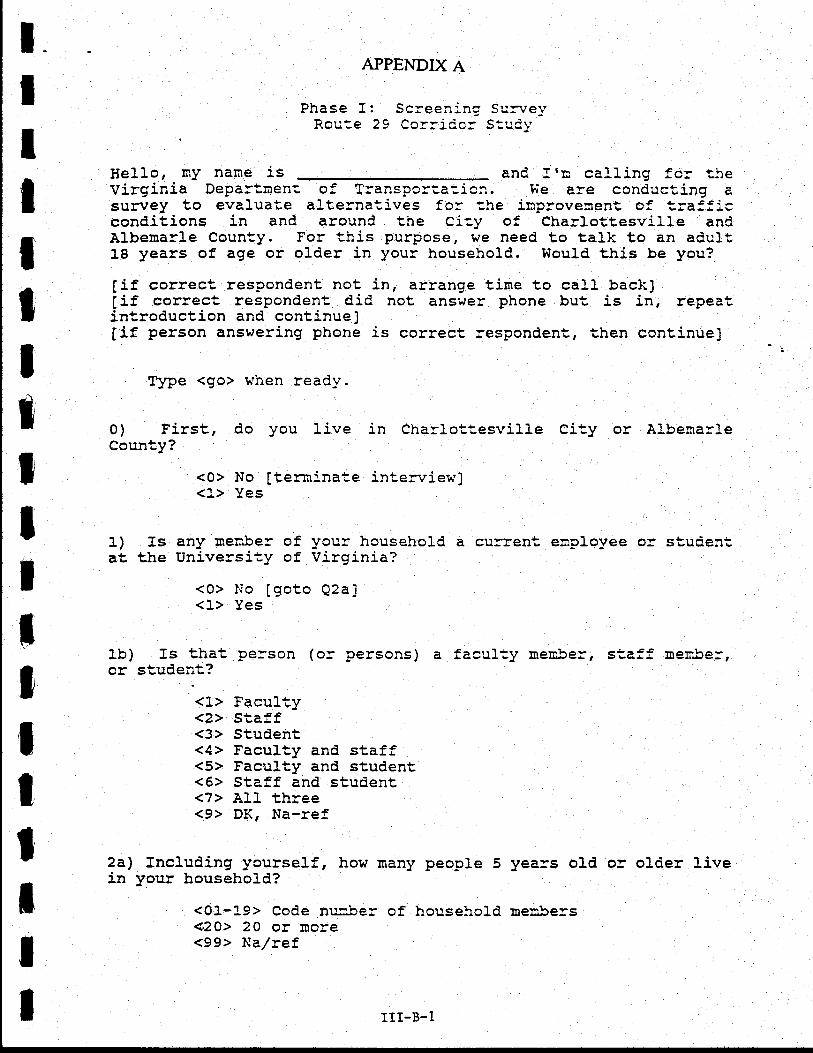
II
APPENDIX A
Phase I: Screening Su:rreyEar!t-6 )A |^nr-i Anr q-r!^lt
45v-
He1lo, trY nane is and Irn ca1).ing fc: t::eVirginia Depar'emen-- of Transpor-.?--icn. We are conouc--ingi esura/ey to evaluate alternatives fo: --he inprovenent of t.rafficconditions in and arounC the City of Charlottesville anCAlbenarle County. For this purpose, vp need to talk to an adult18 years of age or older in your household. WouLd this be you?
[if correct respondent not in, arrange tinre to cail back][if c_orrect res_pondent, did not answer phone but j.s in, repeatintroduction and continuelIif person answering phone is correct responden-., -.hen continue]
T'ype <go> when reaoy.
0) First, do you live in Charlo'-t'esville City or AlbemarLeCounty?
<0> No [terraina-,e interview]<L> Yes
Is any :nenber of your hcusehold a curren-- enplo)ree or stud,en:the Unj-versiiy of Virginia?
<0> No [goto Q2a]<1> Yes
1)at
IlttIiT
IItIItIttI
lb) Is tha"or student?
<1><2><3><1><5><5><7><9>
pe=son (or persons) a
Facul-'yStaffStudentFaculty and staffFaculty and studentStaff and studentAl1 threeDK, Na-ref
<01-19> Code nr::rber of household<20> 20 or more<99> Na/ref
faculty nenber, si,aff nenbe:,
yea=s oLd
meribers
2al Including ycurself, how many people 5in your household?
III-B-1
or older live
IIlIIIIftlIIlIItIII
1)
APPENDIX A
2b) AnC hcr"' nany chilaren unce: 5 yea=s of age live in thishousehol.c?
<.0-7> Code nurbe: ci chilc:en<8> 8 or nore<9> lla /refItq/ -Ei
3 ) IIow llany mo&eor vehicles are o;*ned or available to yourhousehol.d for dailY travel?
<O-7> Code nunse= of vehicles<8> I or nore<9> l{arlref
3a) How nany of these vehicles are cars?
R,ecord nunber anC check agtainst t,otaL f ron Q3.
3b) [If nurber of cars are Jess than to',al nunber of vehicles]How nany are pick-up trucks or vans?
Record nurloe= and acd -,o Q3a. Check against, -r-oial fronQ3.
3c) [If Q3a+Q3b < Q3]ilow a:rcu-, nopecs c= Eo--c=ci/cLes?
R.ecord nunber and add t,o Q3a & Q3b.3-a* a1't--vs \<|J.
3d) [Reccrd renainder as tto"her vehiclestt]
Check agains-, tot.aL
[co!apu'-e cel1 nunbe= baseC on nunber of persons & nurber ofiut.olr::rucksrvansl -
5) Is pu-clic transpotration, other t'han iaxi se:rrice, avaiLable5uo lottl hcne?
<0> No.1t y"=<9> Na/ref
5a) If yes, how often do ycu use pr:blic transpotaiion?<l-> Never<2> Less than once a week<3) Once or twice a weei<<4> Three or llore times a week<9> Na/ref
III-B-2
tT
II,t
IIIIIItIIIIIII
7)by
APPENDIX A
6) We are interest,eC in finding out, about. loca1 travel in theCha:lottesvi1le area. About how nany irips would you estinat.ethat you made yesterday (insert day here). For exanple, fronhone to the s--ore would be one trip, and fron the store back hor,rewould be anotirer. This, then, would be a totaL of 2 trips.
<00-25> Code number of trips<98> Donrt know
(rf Q2aeveryone else in your household yesterday (insert day here) ?
<OO-25> Cooe nurnber of trips<98> Don't know<99> No other household members
8) We woul-d also Like you to participate in a second part ofthis study v.'hich wil1 be nrailed to you. we would send you asirnple travel diary f orrn so that you could keep track of thetrips your household makes in one day. We|lI cal} you to get tberesuLts the following day. This is a very i.rnportant part, of thesutrrey and provides the type of infor:nation that is criticaL toplan transportation irnprovenents for your area. No ma-'ter howmuch or how little your household travels, your participation inthis second part of the sur:vey is neeced Eo accurately represen-eyour area. Can we count on you to pa=iicipate in the second pariof the su:rrey?
<0> No, wj-l1 not participate (try t.o talk tben into it)<1> Yes, will participare
IfThat completes our survey. Thank you for your tine.
If yes:WouLd tfilL in nex'. week's datel be convenient for you to
record your trips?<0> No Ispecify alrernative oat,e1<1> Yes
Cou1d you please give me your name and address so we can nail thetraveL diaries to you tornorrow?
[Record name and. aoq.ressj[Record age and sex of respondent]
(If Q5a > X) In addi'uion to your diary, w€ shouLd al-so rnail [Qea-1l diaries for -,he other menbe=s of ycur househcld. Cou1d I havethe f irst nfime of each of *'hese persons.
[Record na]Tre age j;_;t each person recej.vj.ng diaryl
APPENDX A
That's all the guestions Lre have icr now. we will be rnaking a
ieninaer call to you the evening befcre your suryey day to answer
""V-+t"ttions thai you nay have. Thanl: you for participating in
the sula/ey.
ItlIIIIIIIIItIIIIIIIII-B-4
APPENDIX A
APPENDIX C TO SECTION III: PHASE II . SURVEY MAILING PACKAGE
IIttIIIttlItItttIIt
APPENDIX A
C O Vit M O rr''lVEA LTFI of VIR GI h-'IADEPARTMENT OF TRANSPORTATION
I4O1 E,AST EFOAO STREETRTCHMONO. 23219RAY D. PETHTEL
coMMtssloN€n
RICHARD C. LOCKWOODIRANSPORTATION PI.ANNING EIIGINEEi
The Virginio Deportment of Tronsportotion, in cooperotion with tlu County. ofAlbemorle ond the City of Chorlottesville, is sponsoring this trovel survey in on e-ffort to
.Ultter determine the demond for ond type of tronsportotion-facilities needed to improvethe flow of currenl ond future troffic within the Chorlottesville oreo.
The dota thot you will provide is of extreme importcnce to our troffic forecostingpro."5. This informotion' will be utilized in determining the oreos tronsportotion-neecis.
Therefore, lhope thot you will loke the time to fully ond occurotely complete the
enclosed forms.
Your cooperotion in this study will be greotly opprecioted'
Chorlottesville Arec1988 Trovel Survey
Sincerelyt/
7Z (,/*Ld(Richord C. LockwoodTronsportotion P lonning Engineer
Enclosures
III-C-1
TRANSPORTATION FOR THE 21ST CENTTJRY
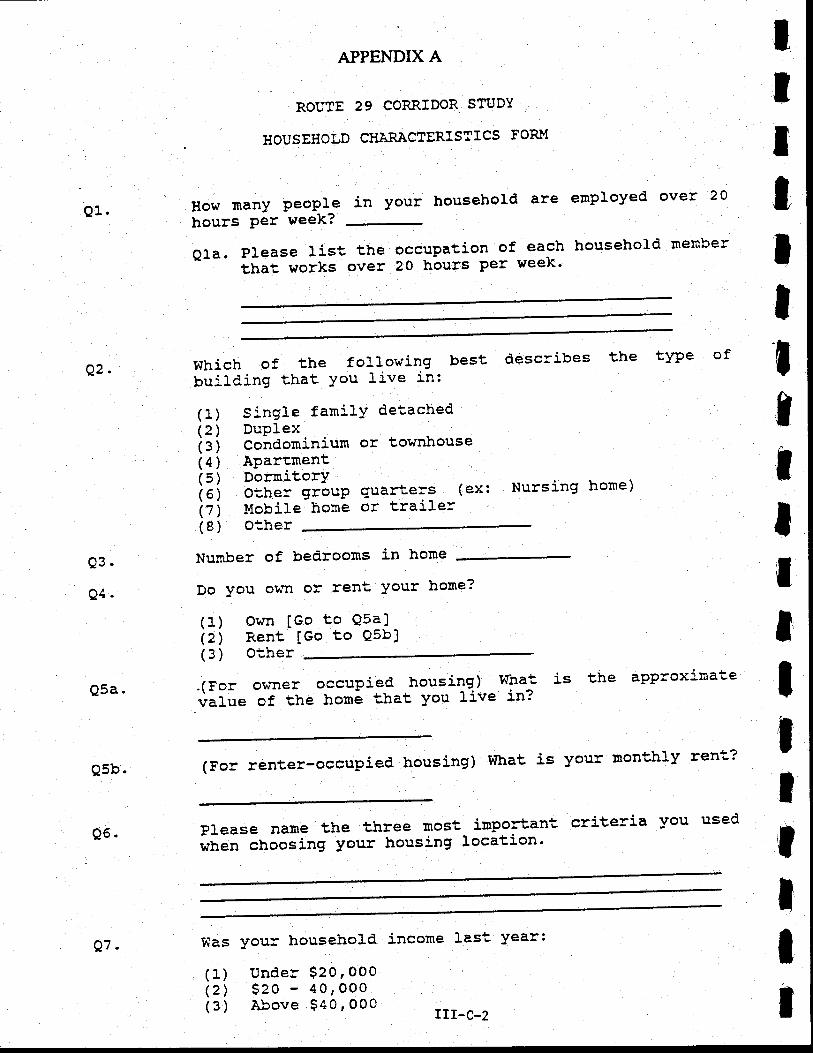
Q1.
APPENDIX A
ROUTE 29 CORRIDOR STUDY
HOUSEHOLD C}TARACTERISTICS FORM
How many people in your household are employed over 20
hours Per week?
-
. l-^.'-^L'a1 A ran'
Q1a.P]easelisttheoccuPationofeachhouseho}dmembertttat woris over 20 hburs Per Iteek'
Whichofthefollowingbestdescribesthetlpeofbu:lCing tha*' You live in:
(1) S:,ngle fanilY det'ached(2) DuPlexf I i condorninium or townhouse(4) APartment( 5 ) DorrnitorY( 5) O-uh.er grouP(7) !{obj-}e home(8) other
Number of bedrooms i-n home
Do you ohrt or rent Your horne?
(1) Own [Go to asa.](2) Rent [Go to Q5b](3) Other
tItII
Q2.
Q3.
Q4.
Q5a.
Qsb.
Q6.
quarters (ex:or trailer
Nursing horne)
IttI
occupied bousing) Wlra^t
horri ihat You live in?is the aPProximate
ItIIIIIII
.(For o'r'tnervalue of the
(For renter-occuPied housing) Wha! is Your monthlY rent'?
Please name the three most irnportant, criteria you used
ii;;- choosing Your housing location'
I,ias your household income las*' year:
(1) Unoer $2O,OO0(2) $zo 4o, ooo(3) Above $40, O0O ,II_c_2
Q7.
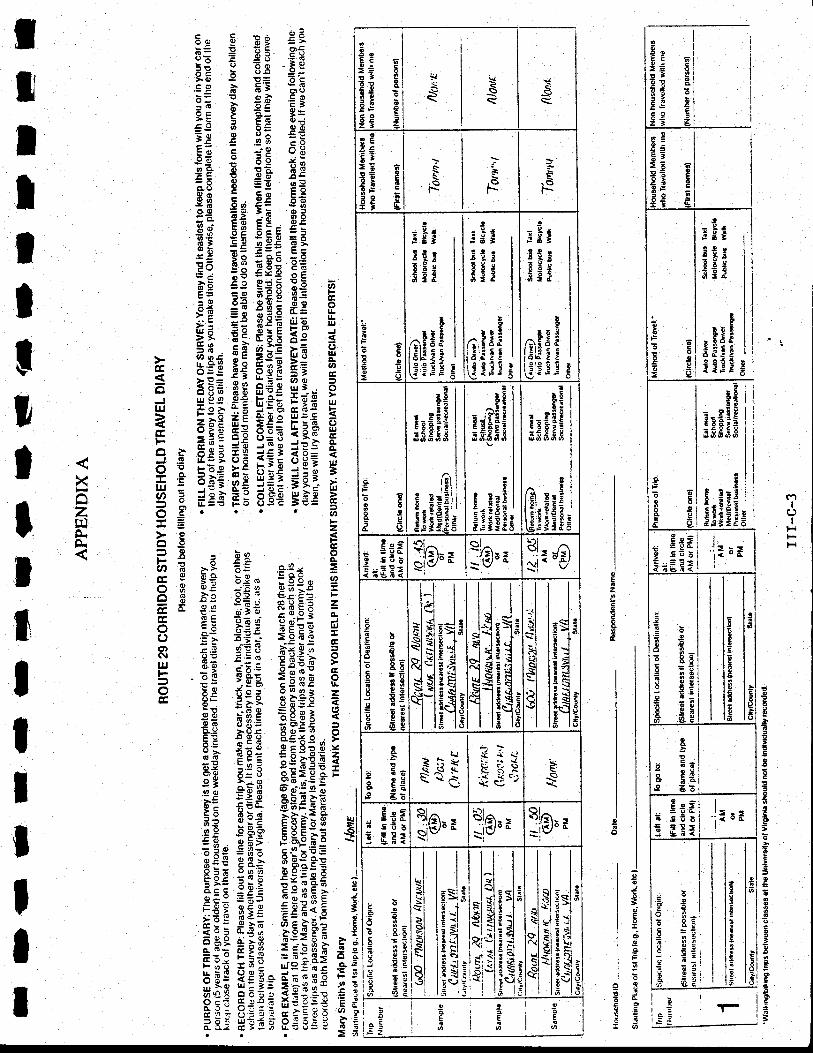
-
t
t
z
o
iis
i:EE g
.i= ==lt -'
l='=
!t ri tig:E
:Fi
E
:6OE
I.e;e;g
.Y)I
IH
*gadr ei IE!-i iiENE E d
t=tE6!]
I,F
3
Ec-
EI
a
I
,
g
o
a
b
6
=
c
J
E
-is>ital?>l.<'
q
cx
o
o
!l
c
3
E*Fa EiEg
=!-: gFt
I6l
b: 2l>= 6lE; eiEE :IEr: 9l
3.Y
Ys
-<s
o3Eo-Et>E 6PE IEA E3F :eE sr' b
s
f\
F
,or--
tF
1O|-
ocgQ9!;o 2
Dcaag
crF! !Et i:
!- gri8r!!o: tt.Q ie
d:d
I
-!.!;:l! rt,g2?Xg;iE
t--t
tBEIi:i::,: i:3
.3:!31{tri ii':E
EEEaFE IlE
APPENDIX A
SECTION IV
EXTERNAL ROADSIDE TRAVEL SURVEY
ItIiIItT
IIIn
lItttII
APPENDIX A
DRAFTTECANICAL UEI.TORJA}IDUI{
ROUTE 29 CORRIDOR 8TUDYEXTERNAL TRAVEIJ sTI'DY
PrePared for:
Virginia Departrnent of TransportationRichmond, Virginia
Decernber, 1988
Prepared bY:
COMSIS CorPoration8737 Co1esville Road
Suite 1100Silver SPring, MarY1and 2091-0
ItttItIItIIIT
IlItlI
1.0
2.O
3.O
4.0
5.0
APPENDIX A
APPENDIX B
APPENDIX C
APPENDIX A
TABLE OF CONTENTS
SutrreyOvelrriew .. ..
Surrrey Methodology
Geocoding
Sunrey Weighting and Expansion
Survey Results
IV-1
IV-1
rv-6
IV-11
rv-1?
IV-A-1
IV-B-1
IV-C-L
TO
TO
SECTION IV: External Counties andStations
SECTION IV: Trip End Population andE:nplolnnent Distributions
SECTION IV: WA Distribution . .

11
Table 1
Figrure Itable 2
Figure 2
Figrure 3
Table 3
Table 4
Tab1e 5
Table 5
Figure 4
Tab1e 7
Table 8
Tab1e 9
Table 10
Table 11
APPENDIX A
TABLES AND FIGT'RES
ExternalSurrreyFor:m .. .. ....
TravelsurnreYSites.. .... 'Sunrey Location, Date & Duration
Set-Up For Two-WaY Traffic . .
Set-UpforDividedHighwaY .. .. 'Post Card Sunrey Results at Site 1 . . . '
Traffic Volume by Vehicular TyPe . .
External Surrrey Sanpling Rate o . . 'External Sunrey 24 Hour Total Trips
Traffic District Boundaries
Ext,ernal Sunrey 24 Hour Home-Based Work
ExternaL Sunrey 24 Hour Home-Based Other
External Sunrey 24 Hour Non-Home Based ' '
External Surrtey 24 Hour Truck . .
Internal-External and External-External Trip
Distribution....o.
IV-2rv-4rv-5rv-7rv-8
rv-16IV-18
rv-19rv-20
rv-21
TV-22
IV-23
lv-24IV-z5
. rv-26
ttIItIIIIItIIT
IIIII
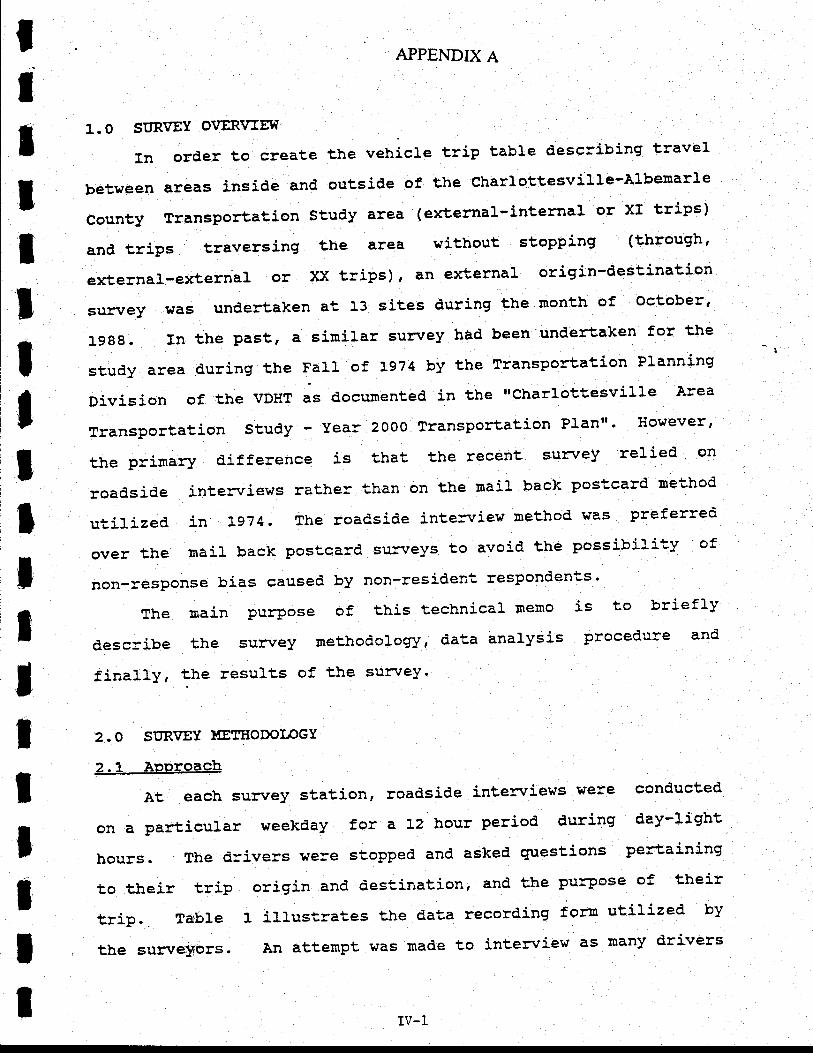
ItIIII
APPENDIX A
1.0 sItR\rEY O\IERWEI{ !____--t
rn order to create the vehicle trip table describing travel
between areas inside and outside of the charlottesville-Albern:tt:
county Transportation study area (external-internal or xI trips)
and trips traversing the area without stopping (through,
external--external or )O( trips), an externaL origin-destinationof october'sur:vey was undertaken at 13 sites during the month
1988. In the past, a similar surrrey had been undertaken for the
study area during the FaI} of 3;974 by the Transportatj'on Planning
Division of the VDHT as docurnented in the ttcharl0ttesvilLe Area
Transportation Study - Year 2OOO Transportation Planrr' Ilowever'
the pri:nary difference is tha-,- the recent sulivey relied on
road,side intenriews rather than on the rnail' back postcard nethod
util j.zed j-n Lg7 4. The roacside intenriew net'hod was pref erred
'rd sul:veys to avoid the possibil'i--y ofover the mail back Pos--card suSteys Eo
non-responsebiascausedbynon-residentrespondents.Themainpurposeofthistechnicalmemoistobriefly
describe the sutt/ey nethodology, data analysis procedure and
fina11y, the results of the sulr/ey'
2. O SURIIEY I{ETIIODOIPGY
2.1 APProach
At each sutx/ey station, roadside intenriews were conducted
on a particula= weekcay for a 12 hour period during day-ligh"
hours. The drj.vers were stopped. and asked questions pertaining
to their trip origin and destination, and the purpose of their
trin. Table 1 ilrustrates the data recording f or-rn utilized by
the sulnretrir,brs. An atternpt was made to intenriew as many drivers
t
tItIIIIII IV-1
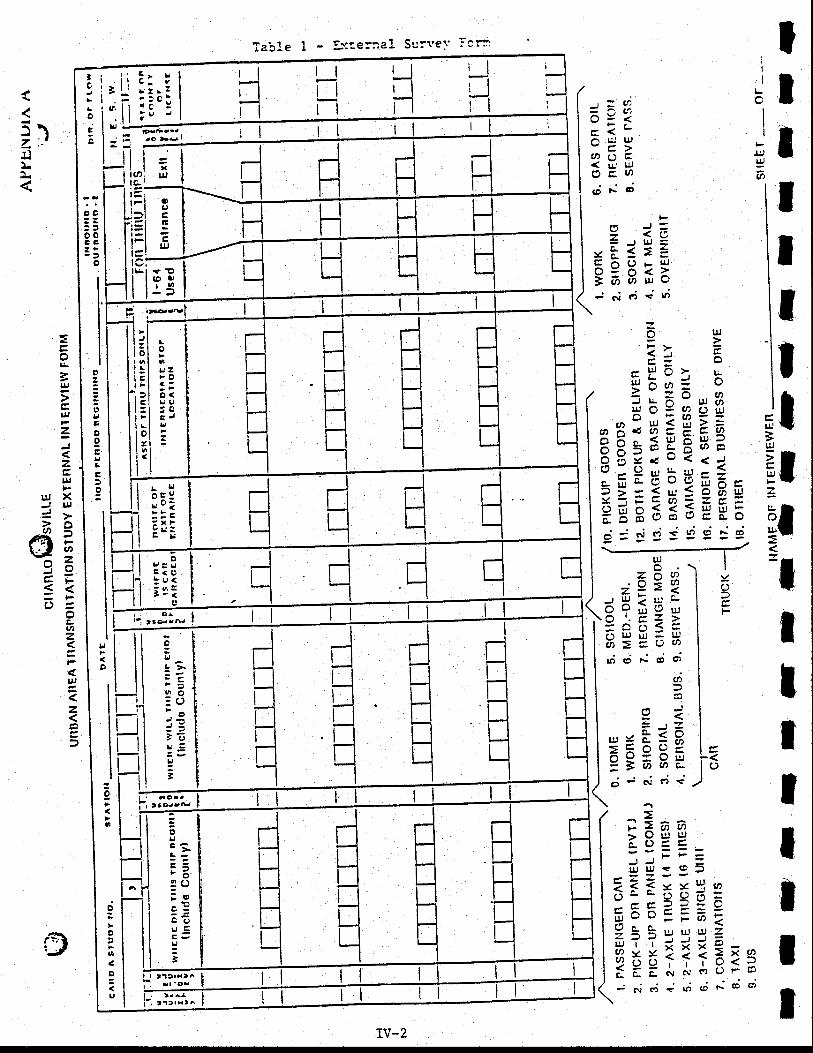
iI
dlI
dl=an
II
j =..3o=<c(-a\ l,L,i uJ-E>|,|oE( P'ulocoaDFc;
Table I - Lt:te:::al Su:veT icr=r
vo9i.=2 ?-B?Egv
sgE;sdrcr..do;
.A
JY
,=E<EEF;HFd*6:cii
g="*e=9== -rl'dE*rc5
3==ru:":5
-" 5 ==;,7O c- c- ... .., ,,, )Ese-
s!t=:i:A=s
i.<I()
ITI
IrJI3
rrIt=l
tIIttIII
9 i7:-Je_v?3=2
F3H3:-dcit,r;
OE2a Ec= s
=HoI h\9v'-
3 nz., o ur 3ulO=oD()UJ
- P: a=gZ;oX^ <OEUJ=;Y=cf-F@e6H !ao7<-to;9shit=Eqr:?;zHefi=,4=-41=z=H-HB5" EHH;djsdjei:d
O
I
I
rl:-irl,l
I
rln
!-lrli--1
i-T
Fl
tli.ln1-T
JItn
-Jtl-ii-l
tti-t
ltl_lITJltnnIItn-tTI
i-t
IV-2
r.tLt'YlL
Eo
=u,
UJ
=zu,
xlll
3at)
zo
ou)z
UJ
z
=
u,
I0t
ti*o
=
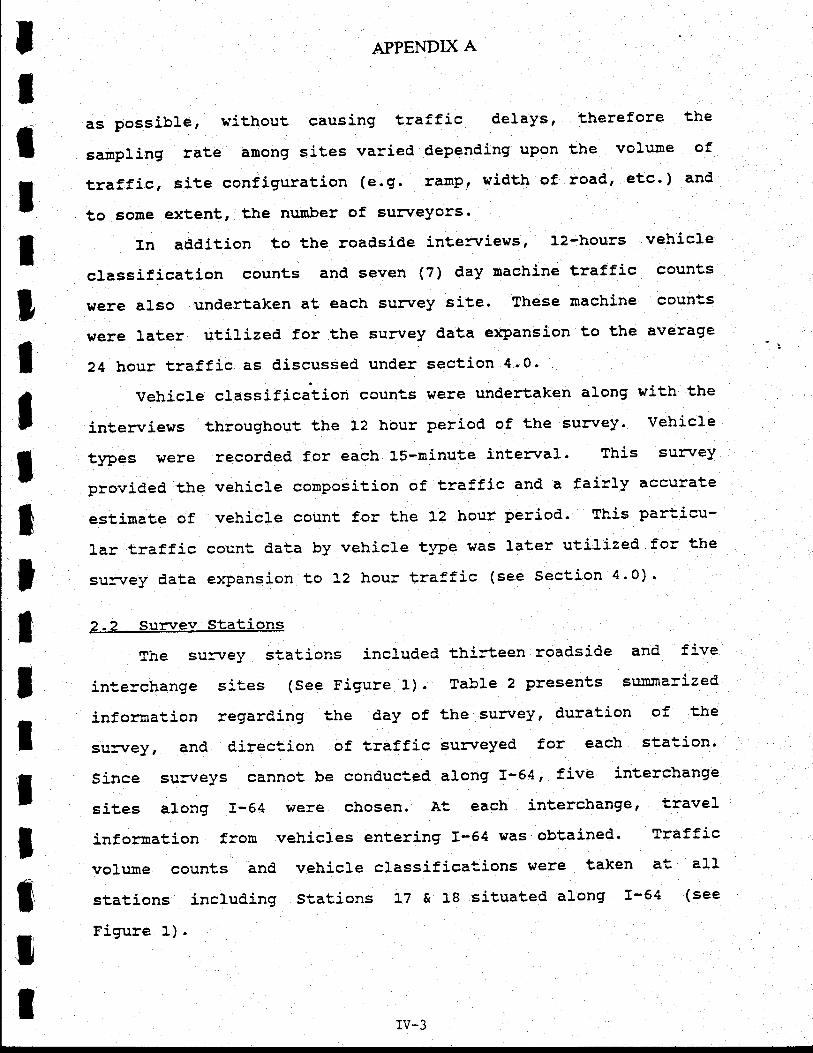
tIJ
IItItIIIl
APPENDIX A
as possible, rrithout causing traffic delays, therefore the
sarnpJ.ing rate among sites varied depending uPon volume of
traffic, site configuration (e.g. ramP, width of road, etc. ) and
to some extent, the number of surveyors'
In addition to tbe roadside inte:rrievs, 12-hours vehicle
classification counts and seven (7) day nachine traffic counts
hrere also undertaken at each sun/ey site. These machine coun+-s
were later utilized for the su::vey data expansion to the average
24 hour traffic as discussed under section 4.0'
Vehicle classification counts were undertaken along vith the
interrriews throughout the 12 hour period of the sulivey- vehicle
tlT)es ttere record.ed f or each 1S-minute inte:rraI. This sulsey
provj.ded the vehicle composition of traffic and a fairly accurate
estimat,e of vehicle count for the L2 hour period. This particu-
1ar traffic count data by vehicle type was later utiLized for the
su:x/ey data expansion to 12 hour traffic (see Section 4'O)'
2.2 Sut-rew Stations
Tne su:ivey stations included thirteen roadside and' five
interchange si-'es (See Figure 1). Table 2 presents su:nmarized
info::lra'.ion regard,ing the day of the sunrey, duration of the
suuvey, and d.irection of traffic sunreyed for each stat'ion.
Since sut11/eys cannot be conducted along I-64, five interchange
sites along I-64 were chosen. At eacb interchaDg€r traveL
info::mation fron vehicles entering I-54 was obtained. Traffic
voLtlrre counts and vehicle classifications were taken a-g all
stations incLud,ing Stations 17 & 18 sj-tuated along 1-64 (see
Figrure 1) .
ItrI rv-3
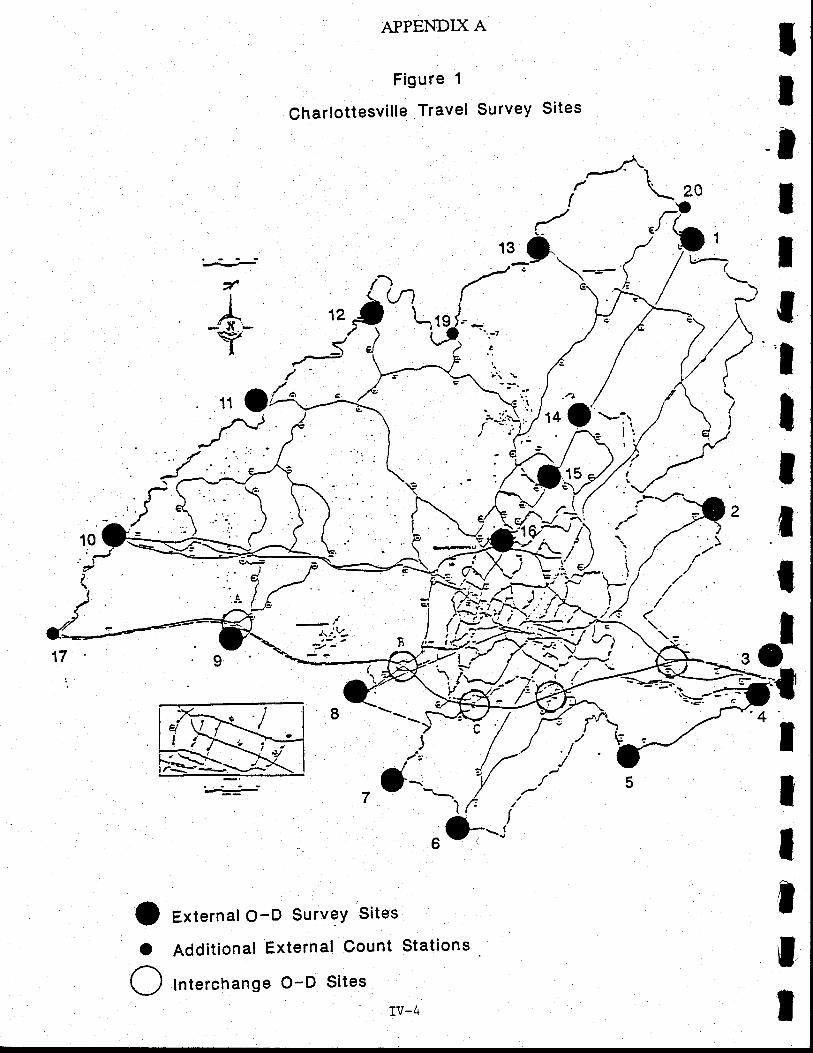
€/
L.J'l( '
Y12.-
APPENDIX A
Figure 1
Charlottesville Travel Survey Sites
14
l.:.V-?z --
.v)}L.l)(
\t-
ttIIII''IlIII
IIIIII
?5:(lrll
1
a}i /'si \ it=".iEl.
:raf,
it ,J
oo
oExternal O-D SurveY Sites
Additional External Count Stations ,
Interchange O-D Sites
rv-4
)
\.'r# I e
ff/'.rl'4. i.*i\ 1t- /,--n i')
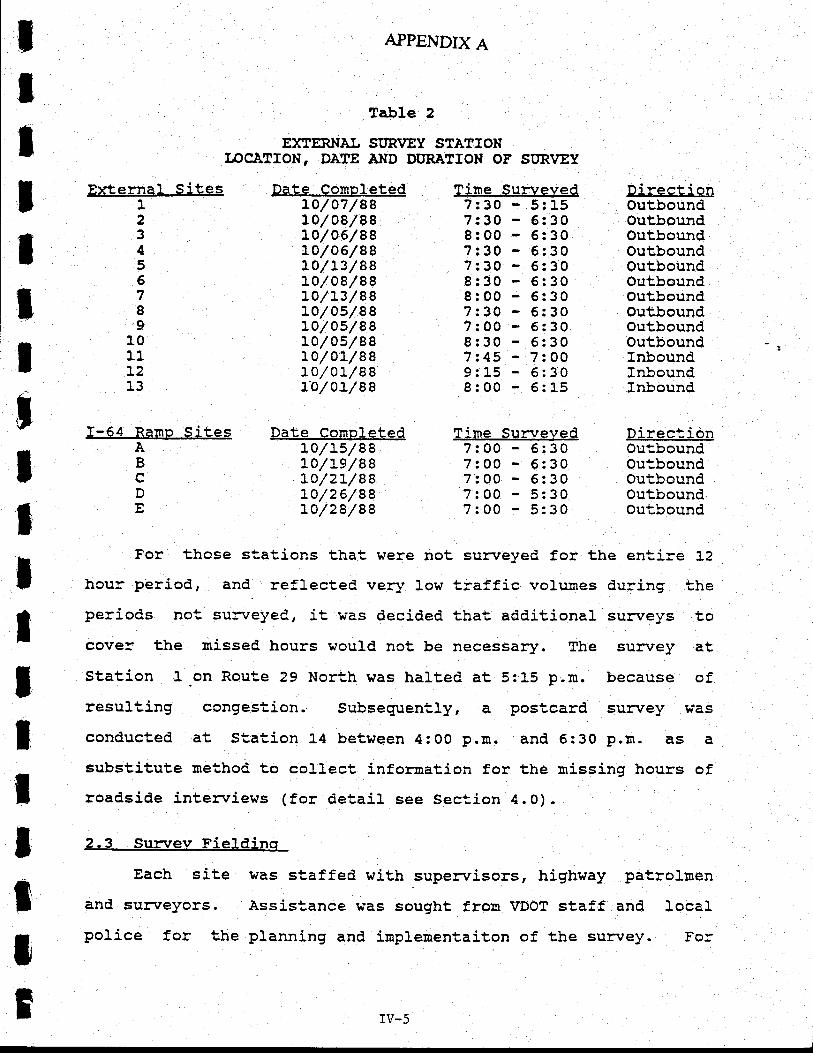
IT
ltttI;
tIIIIIlItI3
APPENDIX A
Table 2
E)ffERNAI, SI]R\IEY STATIONIrcaTIoN, DATE AND DITRATIOX Or SIrRlrEy
Extefn+l Sites123456789
1011t213
f-64 Ramp SitesABcD
Date CornpletedLo/a7 /88to/ 08/88ta/06/88Lo/ 06/88to/t3/88ro/ aB/88LO/t3/88Lo/ as/ 88Lo/ 05/88La/05/88Lo/oL/8eLo/aL/8et-o/ oL/ 88
Date Cornpletedto/rs/88to/Le/88Lo/2L/88to/26/88t0/28/88
Tirne Surrreved7:30 - 5:157:30 - 6:3O8:00 - 6:307:30 - 6:307:30 - 6:308:30 - 6:308:00 - 6:307:30 - 6:307:00 - 6:308:30 - 5:307'.45 - 7:009:15 6:308:00 6: 15
Tirne Surrreved7:00 6:307:00 - 5:307:00 5:307:00 5:307: 00 5:3 0
Direc!ionOutboundOutboundOutbound.OutboundOutboundOutboundOutboundOutboundOutboundoutboundInboundInboundInbound
DirectionOutboundOutboundOutboundOutboundOutbound
For thcse st,ations that were not su:nreyed for the en'.ire 12
hcur period, and. reflec',eC very low traffic volumes during theperiod,s not sunreyed, it was decided tha-, add.itional sutr/eys tocover the rnissed. hours would not be necessar)r. The sulr/ey atStation 1 on Rou:e 29 North was halted at 5:15 p.m. because ofresul-.-5.ng congestion. Subsequently, a postcard sut:vey was
cond.ucted at Station 14 between 4:00 p.u. and 6:30 p.m. as a
substitute method to collect infonnation for the missing hours ofroadside intenriews (for detail see Sect.ion 4.0).
2-3 Su:rrev Fieldino
Each site was staffed with supenrisors, highvay patrolmen
and su:rreyors. Assistance was sought from VDOT staff and Localpolice for the pJ.anning and implementaiton of the sularey. For
IV-5
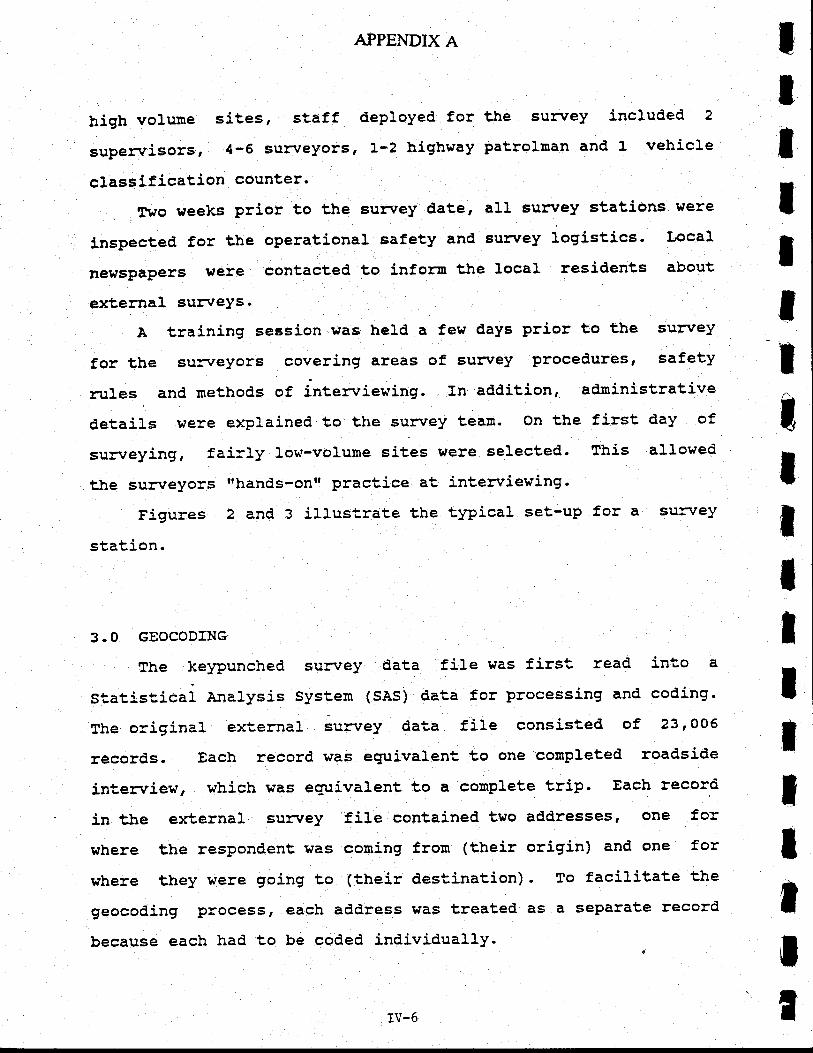
APPENDIX A
high volt:.me sites, staf f deployed for tbe sur:vey included 2
superrisors, 4-6 surveyors, 1-2 highway patrolman and 1 vehicle
classification counter.
Two weeks prior to the survey date, all survey stations were
inspected for the operational safety and su!:vey logistics. Local
ere contacted to info:m the 10cal residents about
external su::veys.
A training session was treld a few days prior to tbe survey
for the su:i/eyors covering areas of sunrey procedures, safety
rrrles and methoCs of interyiewing. In addition, arrministrative
details ltere explained to the surrrey team. On the first day of
sunreying, faj-=ly Low-voLume sites were selected. This alloved
the su:nreyors rrhands-onrr practice at j-ntenriewing.
Figures 2 and 3 iLLustrate the tlpical set-up for a suF/ey
s+,-ation.
3.0 GEOCODING
The kelpunched su:1ey data file was first read in-.o a
Statist,i".i er,"lysis System (SAS) data for process5'ng and coding.
The o=igj.naI external sulivey data f iIe consisted of 23 r 006
records. Each record was eguivalent to one comPleted roadside
intervi.ew, vhich was equivalent to a complete trip. Each record
in the external sur:vey file contained two add'resses, one for
where the respondent was couring from (their origin) and one for
vhere they were going to (their des-'j-nation) . To faciLitate the
geocod,ing process, each address rras treated as a seParate record
because each had to be coded individually.
IlIT
ItIIIIItIIT
IIIV-6
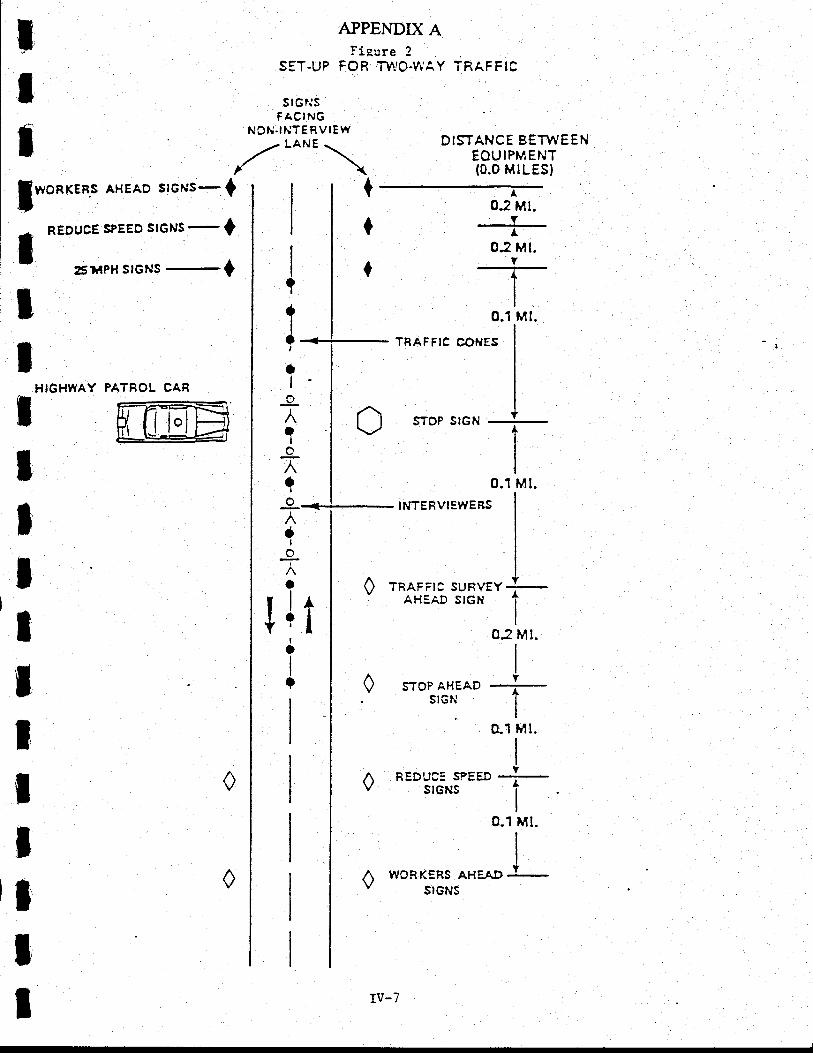
AHEAD SIGNS- O
REDUCE SPEED slcNs
- 0
2SXPH Sf GNS
-
0
HIGHWAY PATROL CAR
0
0
TTORKERS
tttT
ItIIIIIIIItIttt
I tl:l
APPENDIX AFigure 2
SET.UP FOR TV1'O.WAY TRAFFTC
SIGNSFACING
NOTi.INTE RVIEIY-, LANE \ DISTANCE BETWEEN
./ \ EOUIPMENT,. \ (0.o MTLES)
A0: Mt.
---J-A
0: Mt.
t0
llo +1t I
1 | '.1'Mr.? #- TRAFFIC couEs I+ *j- rRAFFtc co'rEs
I
; l^ Ii I O sroPstGN--+l\/ 1
t I o-1 Mt.d ,! rhIrEBvrErYERs I
^r I?i r*t I
? | 0 rRAFFrc suRvEY +-
jlrtl* | O sroP AHe^o -+-
liI " aisr'-on'o^,i
0: Mt.
I | ." -'-sGx- i
| | o-' hr.
I lo*=o'!i;*:.'-fV ' -- ilerut -- L
I
0-1r{t.
I
O wcRKERs AHEAD i' slcNs
rv-7
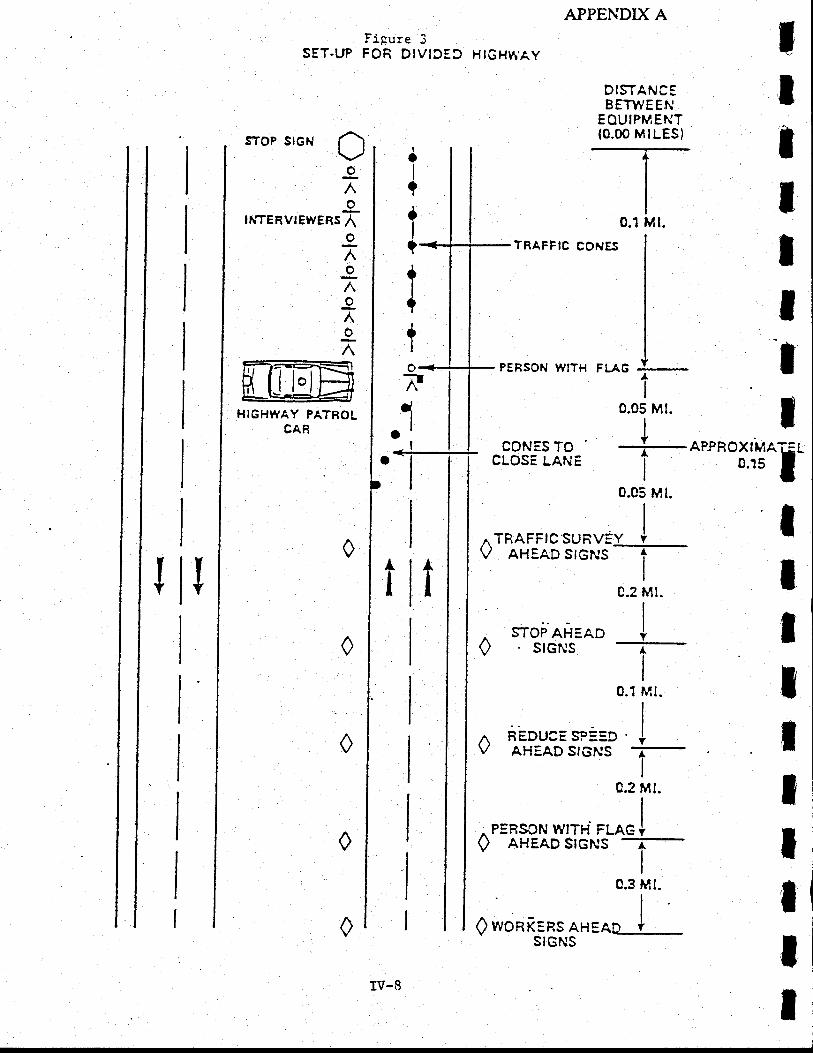
I
STOP SIGN N\,/ono
TNTERVtEvJEBS AongAoAoX
HIGI-IWAY PATROLCAR
0
0
0
0
0
L( {l'l
oI
?
aI
?-
tI
?
+I
o-F.{
I
-f
APPENDIX AFigure 3
SET.UP FOR DIVIDED HtGHh'AY tIItIIII
oilT^I'
ItItiltIIII
APPR
DISTANCEBETWEE.n'
EOUIPMENT(0.00 MrLEs)
0.05 Mt.
I
-coN_=s ro ' -i-cLosE LANE T
I
0.05 Ml.I
I
N. TRAFFTC SURVEY iI AHEAD stcNs
I
c-2 Mt..t
^ sroP.a.H=AD I() stcNs .FII
0.1 Mt.
TRAFFIC CONES
WITH FI-AG
SIGNS
nboucesP==D. JAHEAD SIGNS 7
I
0.2 Mt.I
^ P=RSON WITH FLAG }
0 AHEAD StcNS -i--II
0.3 Ml.
I
QwonR=nsAHEAp +
0.1 Mt.
IV.B
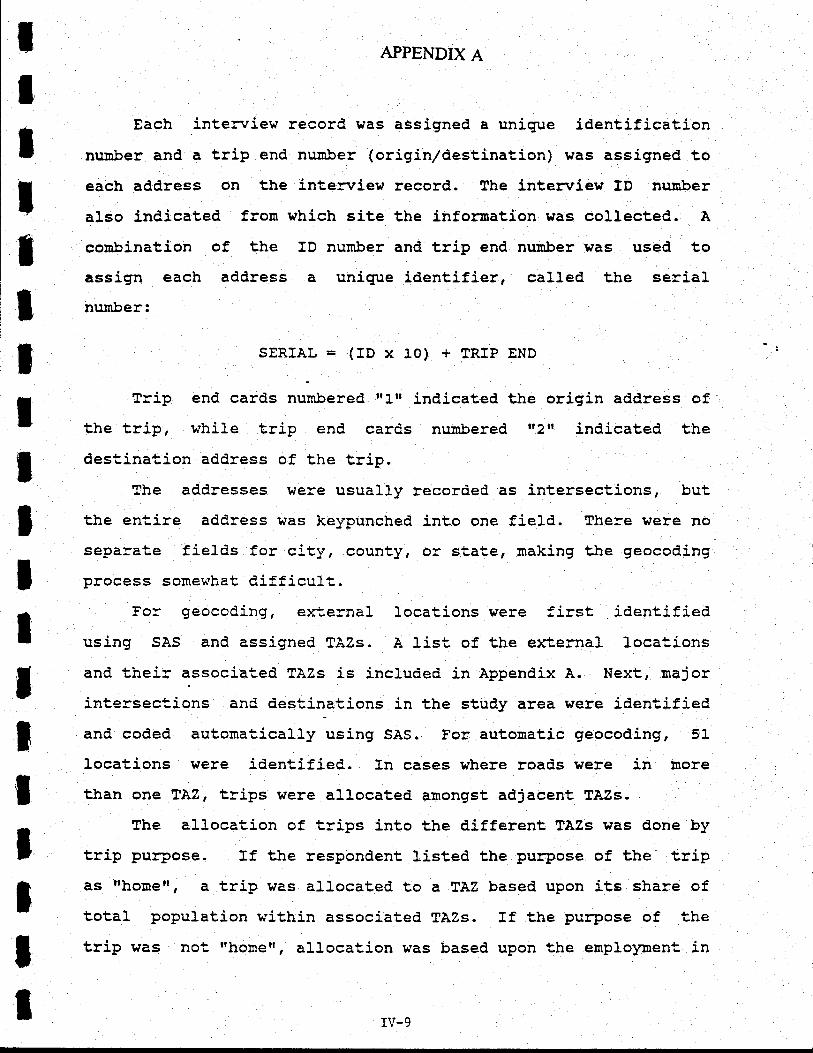
It
APPENDIX A
Each interrriew record was assigned a uniqr,re identificationnunber and a trip end number (origin/destination) was assigned toeach address on the intenriew record. The intenriew ID number
also i,nCicated frorn which site the inforrnation was eollected. A
conbination of the ID nunber and trip end nunber vas used, toassign each address a unique identifier, called the serialnurnber:
SERIAL = (ID x 10) + IRIP END
Trip end cards nurnbered illtr indicated the origin add.ress ofthe trip, while trip end card.s numbered rr2rr indicated the
oescj,nation adq.ress of tire trip.The addresses hrere usually recorded as intersections, but
the entire address was keypunched into one field. There vere no
separate f,ields for ci-'y, countyr o! state, naking the geocoding
process somewhat difficult.For geocod,ing, external locations were first identified
using SAS and assigned TAZs. A list of the external locationsand. their associated, TAZs is included in Appendix A. Next, major
intersections and destinations in the study area Lrere identifiedand coded automat,ically using SAS. For autouratic Aeocod,ing, 51
Locations ltere identified. In cases where roads were in Dore
than one TAZ, tri.ps lrere aLLocated aurongst adjacent TAZs.
The allocation of trips into the d.ifferent TAZs was d,one by
trip puryose. If the respondent listed the purpose of the tripas rrhonert, a trip was aLlocated to a TAZ based upon its share oftotal population witbin associated TAZs. If the purpose of -'he
trip was not ilhomett, allocation vas based upon the ernplolnnent in
ItItIItIIIT
;
lIIII IV-9
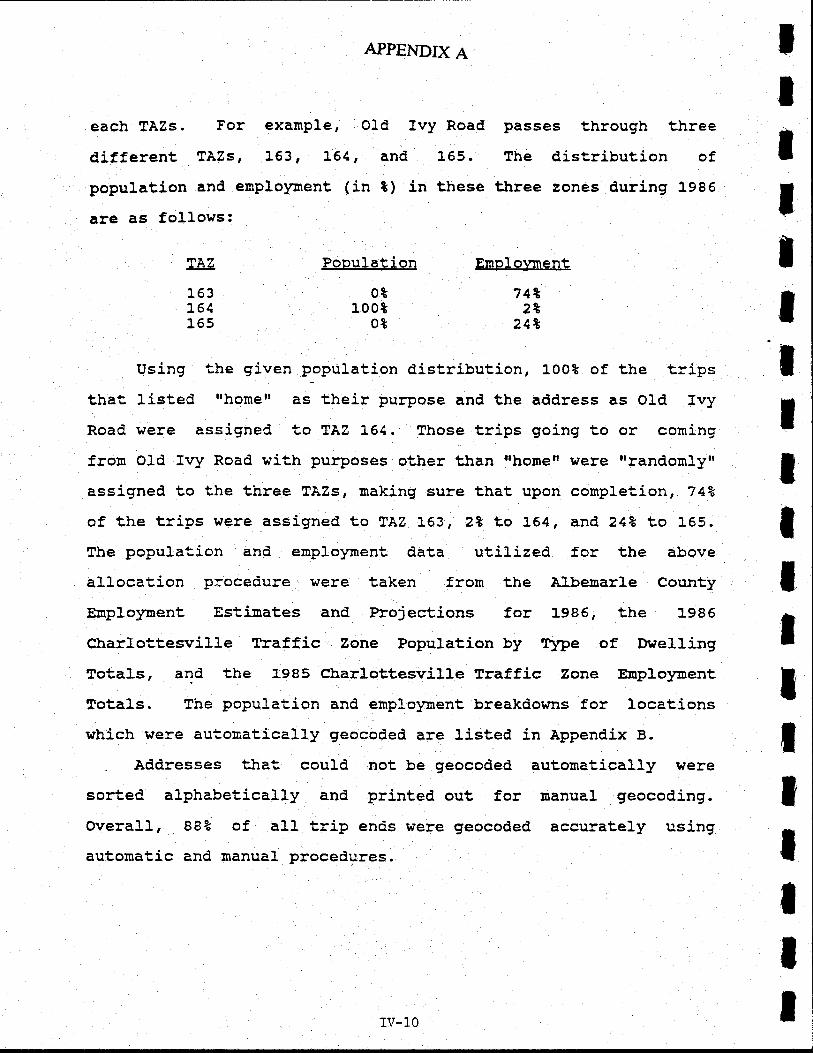
APPENDIX A
each TAZs. For example, Old lvy Road passes through three
different TAZs, 163 | L61, and 165. The distribution of
population and enploynent (in *) in these three zones during 1986
s:are as folIow
.l^7.
163l.61165
Pogulation
0*100*
0*
Ernolovment
74*2*
24+
IIIIIIIItItItttIIII
Using the given population distribution, lOOt of the tripsthat listed rrbomef' as their purpose and the address as Ol,d lvyRoad were assigned to TAZ l-61. Those trips going to or coming
from OId fvy Road with purposes other than ilhomen were frrandonJ-yrl
assigned to the three TAZs, makJ.ng sure that upon conpletion, 742
of the trips vrere assigned to TAZ 163, 2* to 3-64, and 248 to 165.
The population and ernployment data utilized for the above
allocation procedure were taken from the ALbemarle County
Enploynent Estiuates and Projections for 1986, the 1986
Charlottesville Traffic Zone Population by I)pe of DnellingTota1s, ald the 1985 Charlottesville Traffic Zane hplolaentTotals. Tne population and enpJ.olnrent breakdowns for locationswhich were automatically geocoded are listed in Append,ix B.
Add,resses that could not be geocoded automatica3.ly lrere
sorted alphabeticall"y and printed out for uanual geocoding.
Overall, 882 of all trip enas were geocoded accurately using
automatic and manual procedures.
rv-10
tIIIIItI
lIlIIII
IIII
APPENDIX A
4 . O SITR\EY WETGI TING AND E:ICPAITSION
A two-step procedure lras followed for the expansion of the
suri\rey records. First, the intenriews vere expanded to obtain
the L2 hour manual vehicle count taken at each site. Next,, the
e4panded L2 hour counts were further expanded to the estimated
average 21 hour vehicle count for each site. The average 24 hour
l was derived fron the four day (Monday
through Tbursday) autornatic tube count data collected at that
particular station.
4.1 E:roansion Factor for 12 Hour
For the data expansion to 12 hours, the suntey records Ltere
divided into two grouPs i car and truck. The rrsastt group
consis-,ed cf passenger cars, priva*'e pickup trucks and vans,
conmercial pickup trucks and vans, and taxis. The I'truckrr group
comprised of 2-axLe trucks with 4 and 6 tires, 3-axLe single unit
trucks, conbinations (truck and trailer), and buses. AI1 sul:vey
records representing a particular vehicle grouP were expanded to
the hourly tota] of that vehicle group at each suta/ey loca*-ion.
The L2 hour expansion factor oeveioped for the external roaosioe
survey was calculated as folLows:
WTHRxrz
Where:
hlfHRxp =
= MANCNTxz"/INTxrz
class tlpe for one
t==
Weighted hourly vehicles forhour sur:vey period.class type of vehicle.one hour su:ivey period.survey station
nu:nber of cornplete interrriewstlr;>e cLass of vehicle duringpe=iod.
manual count of tbe tlpe classthe one hour sur/ey period.
obtained for thethe one hour su::vey
of vehicle during
INT;s
}IANCNT;p =
rv-11
APPENDIX A
For exarnple, if L23 corcpJ-eted rrcartt intenrieus Ltere obt,ained
at sUnrey Jocation 7 from 1:00 PM to 2:00 PM and 178 rrcarsfr L'ere
counted passing the site during that tiure period, the hourly
oryansion f,actor woul-d be:
wrlr&o,cxr-2x? = MANcNrgryWlX,r r**
4,2 Expansion Factors for llissing Inforrnation
Due to errors in reporting and coding of trip PurPose
information and trip origin/destination (O-D) info:mration, some
records had t,o be removed from the su:rrey datasei. To coropensate
fo:: the reduced sample size, three expansion factors htere
developed. These factors are used. witlr the 12 hour factor to
expand the requced su::vey oataset, to the L2 hour tot,aL forvehicle trips.
The reason for calcula--ing three expansion factors instead
of two was che preselr/aiion of good. geocode info:=ta--ion even
though trip purpose j.nf orrnation was rnissi,ng. In order to
prese::ve the O-D distribut,ion obsenred in the su!:\tey, correctlygeocoded trips that were factored differently than those that
rrere no-- geocodeC. Therefore, two faccors were calcula*.ed to
account for missing trip purpose information, while only one was
needed for missing geocode infotmation.
IIil
lII-'l
ItIlItI
4.2.1 llissing Trip hrr;rose and'llissing/Inco:rect Geocode
The first expansion factor compensated for those
which had incorrect geocode (o-D zone) j.nfor:nation and
trip puryose info:-na--ion. They represented 2.9? of the
recorqs
IalSStng
sul:vey
IIIII
IV-12
tIIIT
IIIIIII
IIIIII
APPENDIX A
records. The expansion factors nere developed by vehicre typeation as follows:
MSPURPlxz
Where:
USPURPlxz
= I{ANCNT12 / (MANCNTxz - LOSTxz)
= Uissing trip purpose and nissing/incorrectgeocode factor.
IIANCNTp = Manual count of vehicles for the L2 hourperiod
IPSTxz = Nuraber of veighted trips vith rnissing trJ.ppurpose and missing/incorrect geocode.
X = Class type of vehicle.Z = Sunrelz sta*-ion.
4.2.2 Missing frip pur;rose and Accurate Geocode
The second expansion factor calculated compensated for thoserecorCs which were nissing trip purpose but had correct geocode
infor:nation. This factor was derived in such a way as to ensurethe same O-D distribution as obse:rred before the rrbadtr sut:vey
record.s were removed f rora ti:e oataseE. Tirese recorcs represented4 - 1* of the suln-ey records. The expansion fact,ors lrere deveJ.oped
by sunrey 's--ation, vehicle type and r-J traffic anaIys5.s zone
pair:
USPItRP2xzrr, = MANCNTx4T/ (MANCNTxzro - LOSTx4a)
Ifrrere:
l'lsPltRP2xzrr) = Missingj*p puryose and accurate geocode
I'IANcN?xzD = Manual count of vehicles for the 12 hourperioC.
roS?pa1e = Nurnber of weighted trips with rnissing trippuryose but with accurate geocode.
X = CLass t1'pe of vehicle.
rv-13
APPENDIX A
Z = Sullrey station.(I,J) - o-D traffic analysis zone pair.
Pinally, one conposS.te missing trip purPose factor vas
derived from the two:
MSPURPTXZITT, = MSPURPIxz * MSPURPZxu.rt
This factor is applied to WTIIRxyT to expand the suli\tey data
to the 12 hour control total after records with missing trippurpose are removed.
4 ;2.3 ltissing/Tnco*ect Geocode
The finaL expansi'on factor compensated for those records
removed froar the surrrey dataset because of missing or incorrect
geocode infotfira-.ion. These records represented nearly 21* of the
conplete da'-d file. To ensure that the oistribution of trips by
puryose would not change after the nbadil geocode trips li'ere
rernoved, this expansion factor was calculated by sunrey station,
vehicle type, and trip Purpose:
IlSGXxz, = l*IANCNTxn / (I'{ANCNTxzr - ISSTxz,)
I{here:
MSGX;2e = Missing/lncorrect geocode expansi.on factor-
t{ANCNTxz, = Manual count of vehicles for the t2 hour period.
LoSTxzr = Nr:rnber -of veighted trips with uissing/incorrectgeocooe.
X = Class type of vehicLe.
Z = Survey station.P = Trip purpose.
tIItIItlIIltItIIIlIrv-14
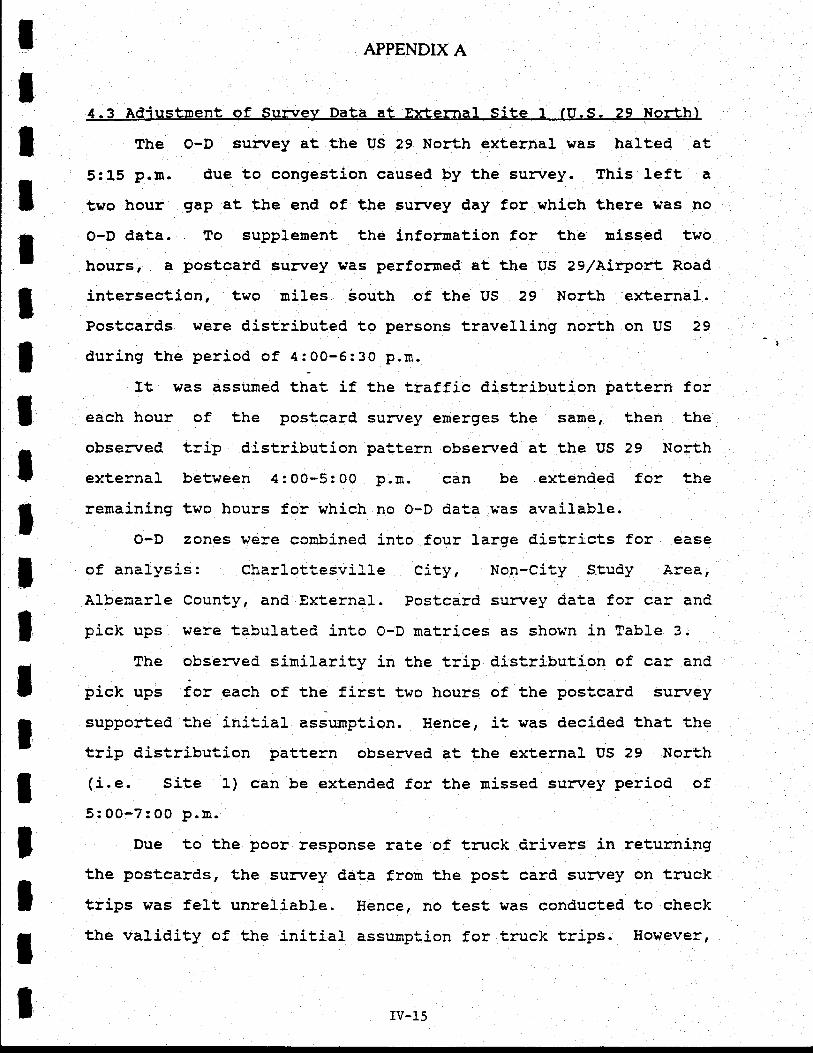
IIt
APPENDIX A
4.3 Adiustpent of Sulrreylata at hcternal Site 1 (It,S, 29 North)
The O-D su::vey at the Us 29 North external $as halted at
5:L5 p.m. due to congestion caused by the sutrrey. This left a
two hour gap at the end of, the survey day for which there was no
o-D data. To supplement the inforration for the uissed two
hours, a postcard su:nrey was perforned at the US z9/AirVo:rt Road
intersection, two miles south of the US 29 North external.Postcards rrtere dist,ribu--ed to persons travelling north on US 29
during the period of 4:00-6:30 p.rn.
: d.istribution pattern foreach hour of the postcard. suta/ey ernerges ihe same, then the
obse:rred trip distribution pattern obsenred at the US 29 North
exte=nal between 4:00-5:00 p.!R. can be extended for the
remaining two hours for which no O-D dat.a was available.O-D zones vere conrbined, into four large districts for ease
of analysis: CharLottesvj.lle City, Non-Ciiy Study Area,
Albemarle County, and External. Postcard su:rrey data for car and
pick ups were tabul,ated into O-D rnatrices as shown in Table 3.
The obse:rred sinilarity in the trip distribut,ion of car and
pick ups for each of the first two hours of the postcard sun/ey
supported the iniiial assurnp-,ion. Hence, it was decided that the
trip distribution pattern obsenred at the external US 29 North
(i.e. Site 1) can be extended for the mi.ssed sur:vey period of5:00-7:00 p.m.
Due to the poor response rate of truck drj-vers in returningthe postcards, the surrley data frorn the post card sur:vey on tnrcktrips was felt unreliable. Hence, Do test was conducted to check
the vaLidity of the initial assunption for truck trips. However,
IIIIIttttIIIIIIt rv-15
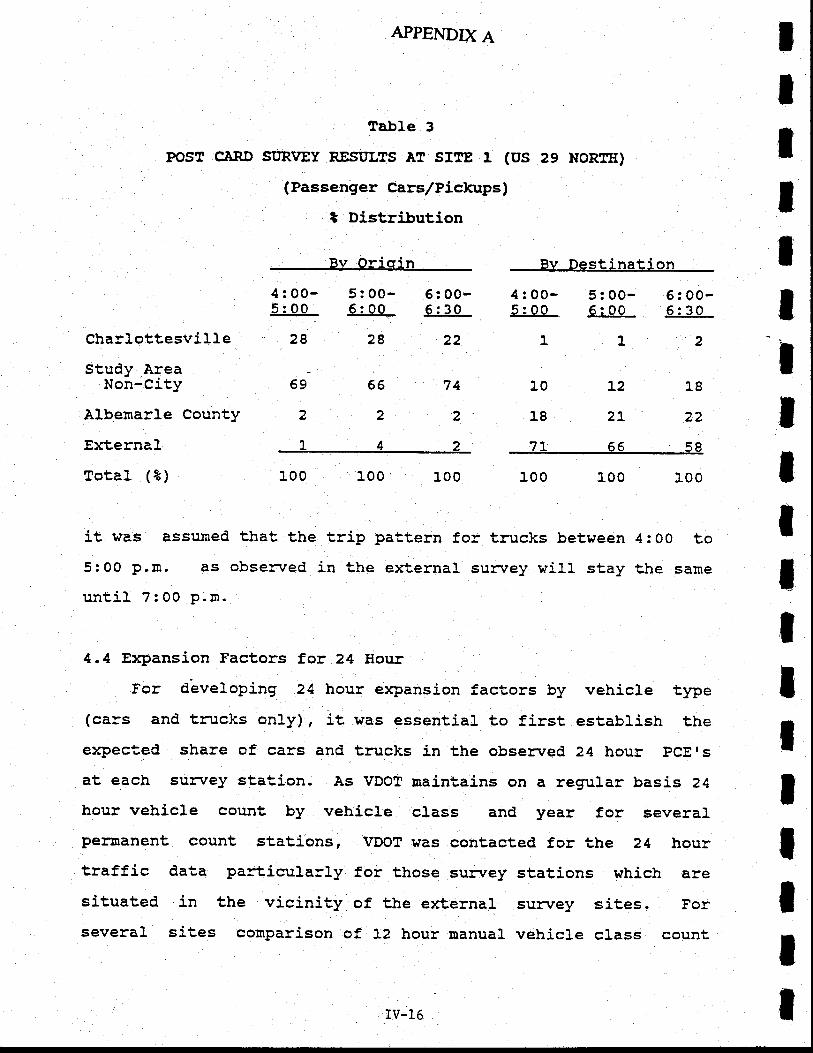
APPENDIX A
Tnhle 3
srlR\rEy REsItLTs AT SIrE 1 (nS 29 NORIE)
(Passenger Cars/Piclups )
t Distribution
Bv Orioin Bv Destination
10
18
7t
L2
2L
66
18
zz
58
IIIlI
IIItlIIIIII
POST C3RD
CharlottesvilleStudy Area
Non-City
AlbemarLe County
External
Total (8)
4:00-5: 00
28
69
2
1
5: O0-6: 00
28
66
2
4
6:00-6:30
22
74
2
2
4:00- 5:00- 6:00-5: 00 6:00 6:30
112lII
100 100 100 100 100 100
it vas assumed that the trip pattern for trucks between 4:00 to5:00 p.m. as obse:rred in the external sut:'vey will stay the same
until 7:00 p.!1.
4.4 E:qlansion Factors for 24 Hour
For dbveloping 24 hour expansion factors by vehicle type(cars and tnrcks only), it was essential to first establish theexpected share of cars and trucks in the obsenred 24 hour PCEts
at eaeh sulirtey station. As VDOT maintains on a regrular basis 21
bour vehicle count by vehicl-e class and year for severalpermanent count stations, vDor was contacted for the 24 hourtraffic daia particularly for those su!:vey stations which are
situa-ued, in the vicinity of the external- sur:vey siies. For
severaL sites comparison of, 12 hour manual vehicle class count
rv-16
IIT
lIIIII:
IIIItItII
APPENDIX A
and vDoT supPlied 24 hour vehicle class count ind.icated that thecoroposition of cars and trucks (in teras of percentage of totaltraffic) more or less renains the saure during the 12 hour day and
night periods.
Recognizing the above fact the obse:rred LZ hour Manual
vehicle couni for each station vas directly expanded to 21 hou=
count, using the following expression:
vEH24IIRxz #VEH12!iRxz + g@4-tt&PCEL2HRz
where:
#vglil2lrRxz = Nurnber of VehicLe of type x obse:rredduring 12 hour period,-it station Z
PCE24IIRZ = obse:rred pcE value during 24 hours atstation Z
PcEl2IiR = obse:rred pcE during 12 hours at station z
Table 4 illustrates for each external su:afey station thecomputed 24 hour traffic by vehicle type.
5.0 SUR\IEY RESULTS
5. 1 SA}IPLE. SIZE
The su:3ey resuLts ini.icated that at aLI sites, the target,minimum sarnpling rate of abcve 20 perceni was achieved. Aciuallythe obse:rrec sanpling rate varied in a range of 24.1 to g9.6
percent as shown in Table 5. Traffic volurne seems to be one ofthe uajor factors influencing such a wide variation. The
saurpling raies lrere obse:rred to vary significantly among twogroups of vehicLe classes: cars/pickups and trucks. The
sarnpling rate for trucks was lower than cars particularly at higrh
traffic volume sia-uions due to the lirnitat,ion on the nunber of
rv-l7
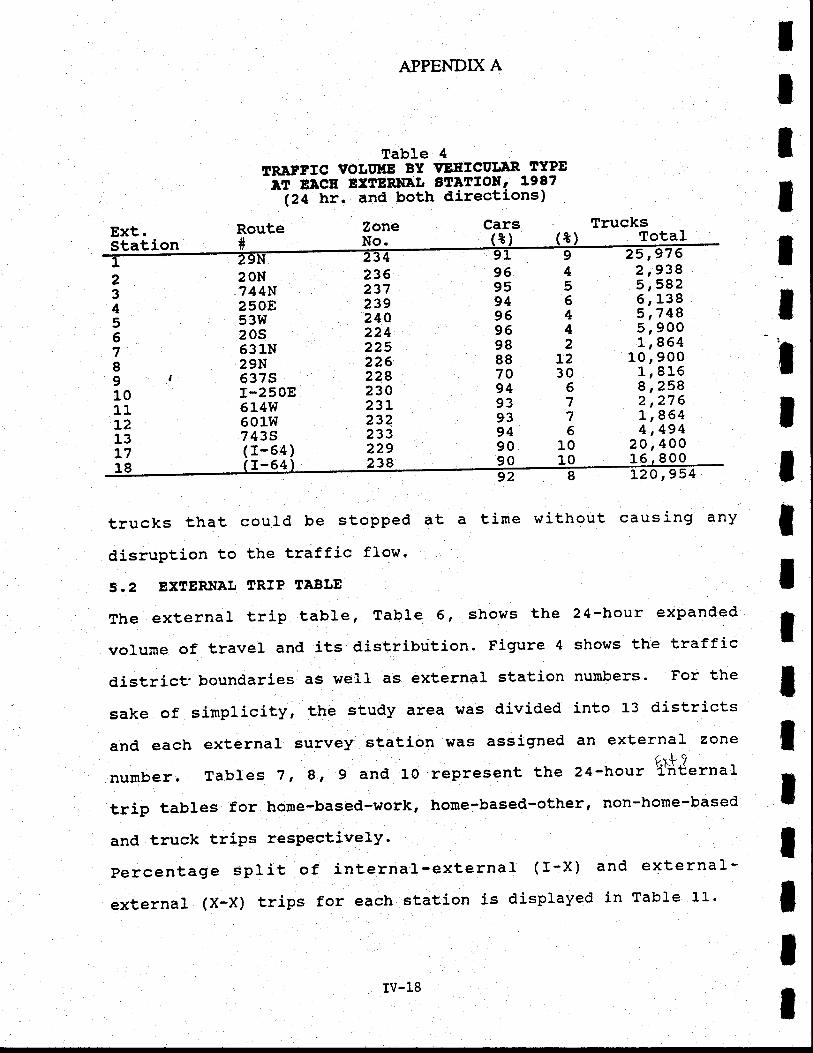
APPEI{DIX AtIIII
Table 4TRITFIC VOLSI,IE BY V:EEICSIAR TYPE-AT EACE EXTERIIAIT STITION, L987--lze hr. and both directions)
Cars TrucksExt.Station
234567891011L213L718
Route#
t-64
ZoneNo.
20N7 44N250853W20s53lN29N637Sr-2508514W50lW7 435( r-64 )
Tot,a125 ,97 6
16,800
2,9385,5826, 1385,7485r9O01, 864
10, 9001,8L68,2582,276L ,8644 ,494
20 ,4OO
lIt
23623723924022422522622823023L232233229238
z
9695949696988870949393949090
94564422o677500E
13
11
2 ]-2o,954
trucks that could be stopped at a tine without causing any
disruption to the traffic flow.
5.2 EXTERI{AL TRIP TABLE
The external trip table, Table 6, shows the 24-hour expanded
vel and its distribution. Figure 4 shows the traffic
district- boundaries as well as external station nurnbers. For the
sake of sirnplicity, the study area was divided into L3 districts
and each external survey station ttas assigned an external zonef'x! 9
number. Tables 7, 8, 9 and 10 represent the 24-hour tirternal
trip tables for horne-based-work, home-based-other, non-home-based
and truck triPs resPective1Y.
Percentage split of internal-externaL (I-X) and external-
external (X-X) trips for each station is displayed in Table li"
lItItItIItIIV-18
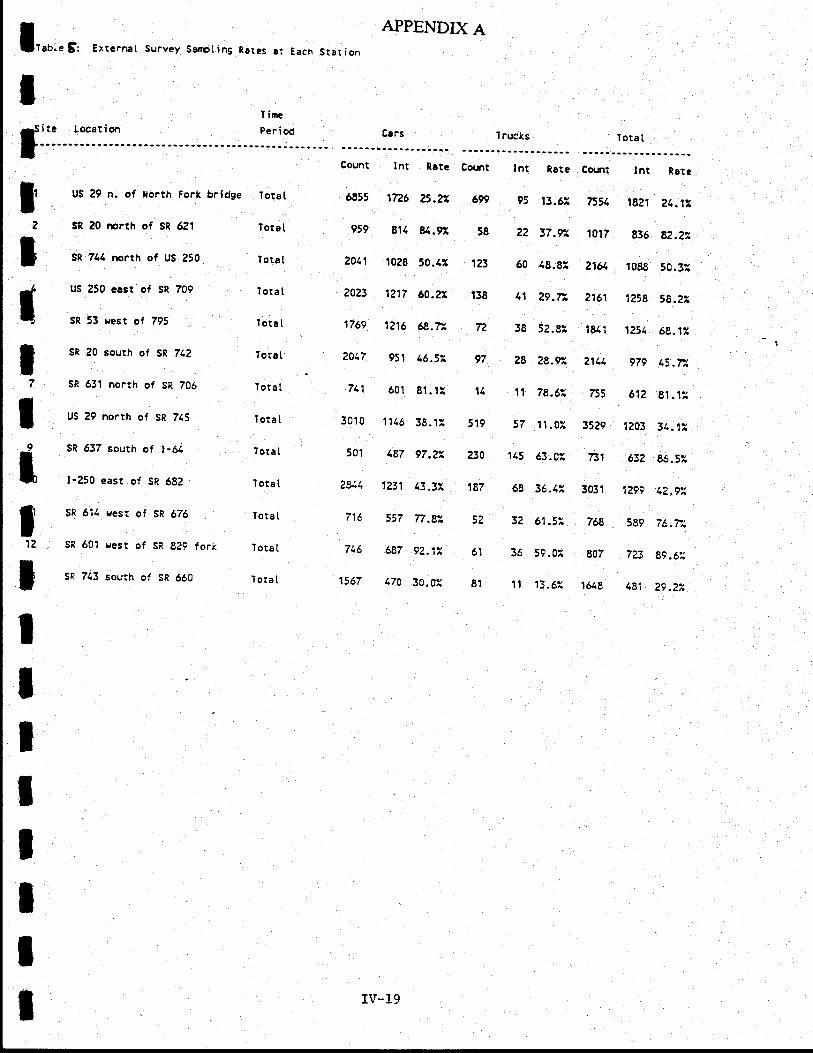
ite Location
Survey Sarpting Rates rt Each gs3g1e6
T iiEPer i od
APPENDIX A
Cars I rucks lora I
IJI
z
tT
I7
ItT
12
ItIIlIIII
US 29 n. of rorth tork bridge
Sn 20 north of SR 6?1
SR 744 north of US 250
US 250 cast of SR 709
SR 53 rest ot 795
SR 20 south of SR 742
SR 631 north of SR 706
US 29 north of SR 715
SR 637 south of t-64
t-?50 east of SR 682
SR 514 rest of SR 676
SR 601 Hest of SR 829 fork
SR 743 south of SR 660
Count lnt Ratc Co('.lt
5855 1725 ?5.4 6W
959 81{ &1.1 2 58
2411 t02E 50.4x t23
?023 1217 60.2t 13E
1769 1215 8.72 72
zOaI 951 15.5-; 97
711 601 E1.lX 14
3010 1115 38.1: 519
501 &87 97.22 z3o
2e*1 1231 13.3X 187
716 557 n.8X 52
7t 6 687 92.1X 61
1567 170 30.0x 81
lnt Rate Co|'|t
95 13.62 E 1
22 37.fi 1017
60 48.8X 2161
11 29.72 2161
38 52.8x 1841
28 28.* 2111
11 78.67 755
57 11.0X 3529
115 63.0x 731
68 36.12 3031
32 61 .5". 78
36 59.0i 807
11 13.62 1648
Iota I
Tota I
Tola I
Tora I
lorE t
Tora I
Tota I
Tota I
Toral
TotaI
lota I
lotaI
lota I
lnt Rate
t8?1 21.12
835 82.?t
1088 50.3i
1?58 58.22
1251 68.12
979 15.7x
612 81.li
1203 31.12!,
632 86.5i
1?99 12-*
589 76.7,
723 89.5X
481 29.Ua
IV-l9
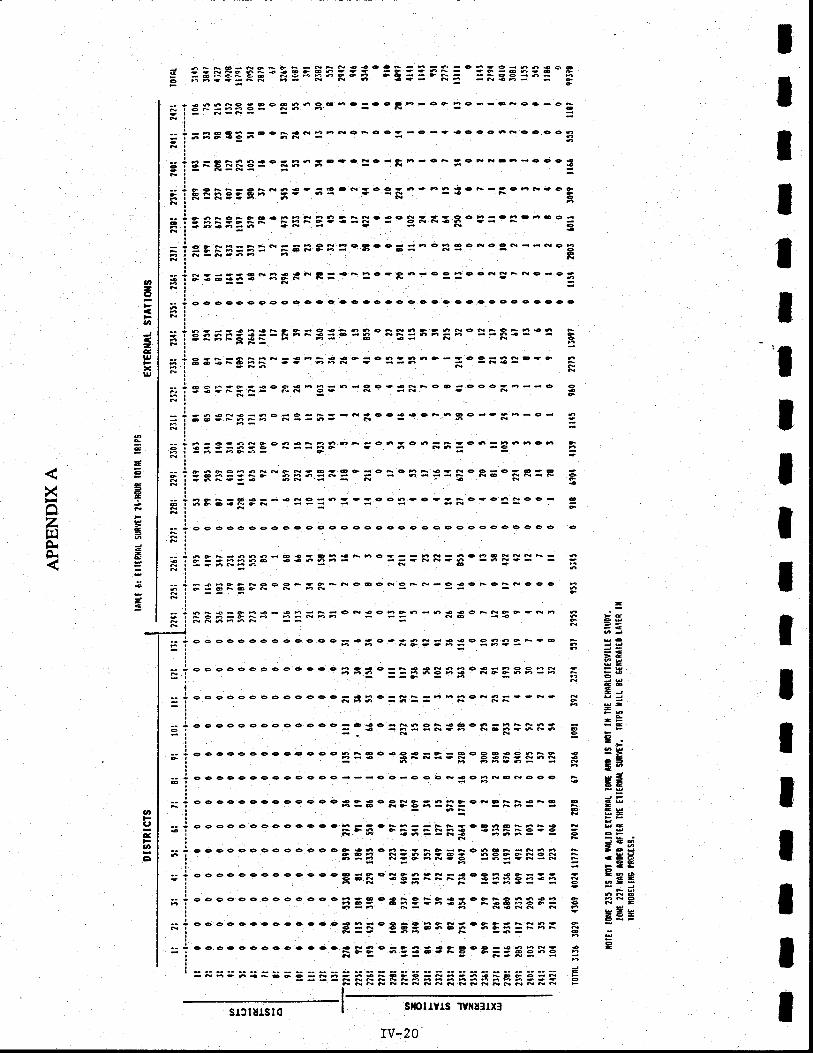
o
o
6xa@-F6tsOF-ooE{-@}
- 6 'r c.i e -.ah-?-aN
6-OO6665r--h-o- d6
--oo--6cts{R6F'-e6 AN
F--FGA-C-AA6FOFFe--
fi-R-
octsF-caft6--6RhO-QFRqR-?- A
o6tscat6-EER
-6-h-6 -R
gCSB===-=ERR-R-6-
.ORF€'F-€o€6€ "R-
oc6€oeeoccc
FF F-€CCF 4 - =cr -O
6- O-66€ Oohoeeh e@ <-Fr-
-Fco<--R --- -R-F- - C
eoao=ceRb-oo F€---Roe-cE
6rdeFcc--€ -- €e€o6-€c€cB6
=---=ca&n-cF ecFR---c-c-
=;EoF=osE6?-6 :€F--caF-oo
a
-a >ER6-OFe e- OOt-C----O-
- oAR-R ^ E
€F FC-OC- -
6 C6OOf C9R--nCF>a- o- aF
R:-^=c-R6-o€'ecRFFne-e+
e9-QOCCOO60eCCCCOAeC€O€
IIII
tt,v
g,
-eUxt!
-G-€-EA66FFtlO- RCRFOE---^466
tuFF--O-n ftts-a--h --n-E --A6Ao-F 6 a- o €- F6F-
€-o-ca-66---oc-6-o-a--F t -F--
c-{oo----n-60--RAoo-ooo----o---F-R- cYd c- ft -N
€-no-c-tsr-F-o6-€eFcEo--rh-o< 6@@-F6E- R--6- F
6€Fa66tsdo6-c6-tseO6-h6606 Gb--;6-6 + - 6 F6- -o 6-ra-aFra- F
F66On6-(FF-E-OG-o-a-Fe--A---
6fi66-O-O-E€-FOO!O-O-E r@ oF'-S
@ €--€RCd6 - -+.€e6+C-? FO-CnNo€ i-OO€NeR -N
ee6eoceceoeooeoooo€ecQoocoocecoo
l'l
XozruF.or
e
€
=
-
tIIItIIItIII
-=F
e
e-.c=e---EG
-ts-
*s>83tso*-oo
NE
e
U'q,eU'CI
@
6€-66€aAO?-- €A@Fc---6-E €-tnn---aNts6 n o -
r?
6FoOOF-FEft OEgtsOAR-O -OFChRCCC
|?F;6Foed N 6n
GF€- -O-€CEG6-6€€eFNqotRt
Oi.-Nht R@
3NR6F6fi
ooocec€cc6e€c;-;o-iEs=g3c9ggots-o E
e o e o € e e € e o o c - 3 g E - =
: E f =
g 3 - F ; e s s : s ;c € ee o e c c a e e € c F;B c
= S
= = E - R o - R
= - - n - S6
oocoeooooceoo-c{c-FFoF€Ee?-4\84! ={ -rd-ts-h N6F?t.r- cftd3
e o eoo o o€ c c e c € * =€ o -3=
=== R c 3 g:3R; R
=6 -Fln-
oeecc€OoCO€O€---o6-6 CBd€Foee 5
e o oe c o c c e c € o o * =;
€ R sE; g R =
c- ==
F =
- = =-= F
€ c ee c € ee € o o c c =;;
o 3 = = =F
g =
c 3 BR =
3 =
3 s- {n--R€
'3eeeCooOooOeeCD9QCFF-tsF-FeQEF-A?i -a=g *=BcEea 33=$F3S =-F=
€ooooooo -=-F-!g:=s=;-3?Eg=== *e o ecc o oc c o o o o 3 EE e3 D g
=g 3; cR 53 RE ;3 = 3a-6 ft€RR
oCooo€cooO€Ce€h-e9-oFqft-eFG-FF4- IR=5 3B;E'ER Hooccooeeecccc-rFo=e4q€qEo9-{4?q!= 9
F;
---R--6-a€;c-Fa-
6-i9FC-ryE!O9EQq9-q! =RRFRNFhh
F-NNRRFNdRNFNF-NFRR
I
ffil s,FIlYtslvtuslxr:
IV-20-
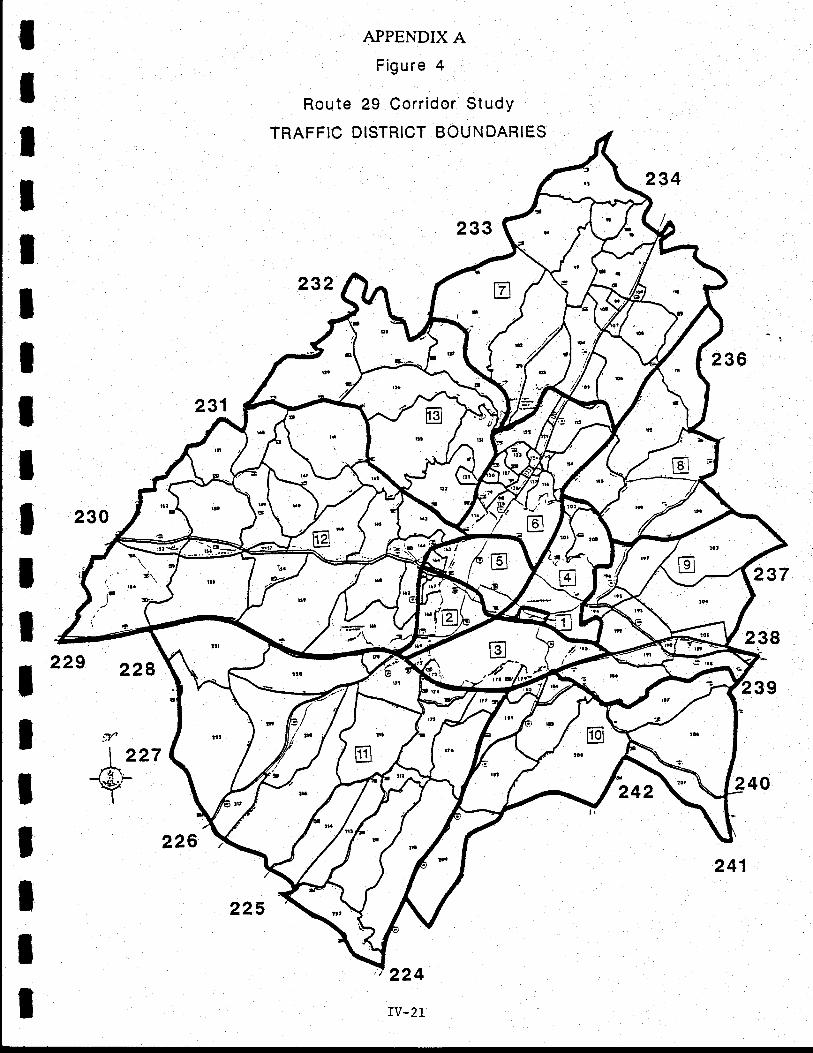
IIIIIIIIIIIItIItIII
Route
TRAFFIC
APPENDIX AFigure 4
29 Corridor Study
DISTRICT BOUNDARIES
234
233
232
236
231
230
237
229 228
242
238
39
249
-v
| 227/4,-4f
I
226
224
IV.21
tr/f
225
241
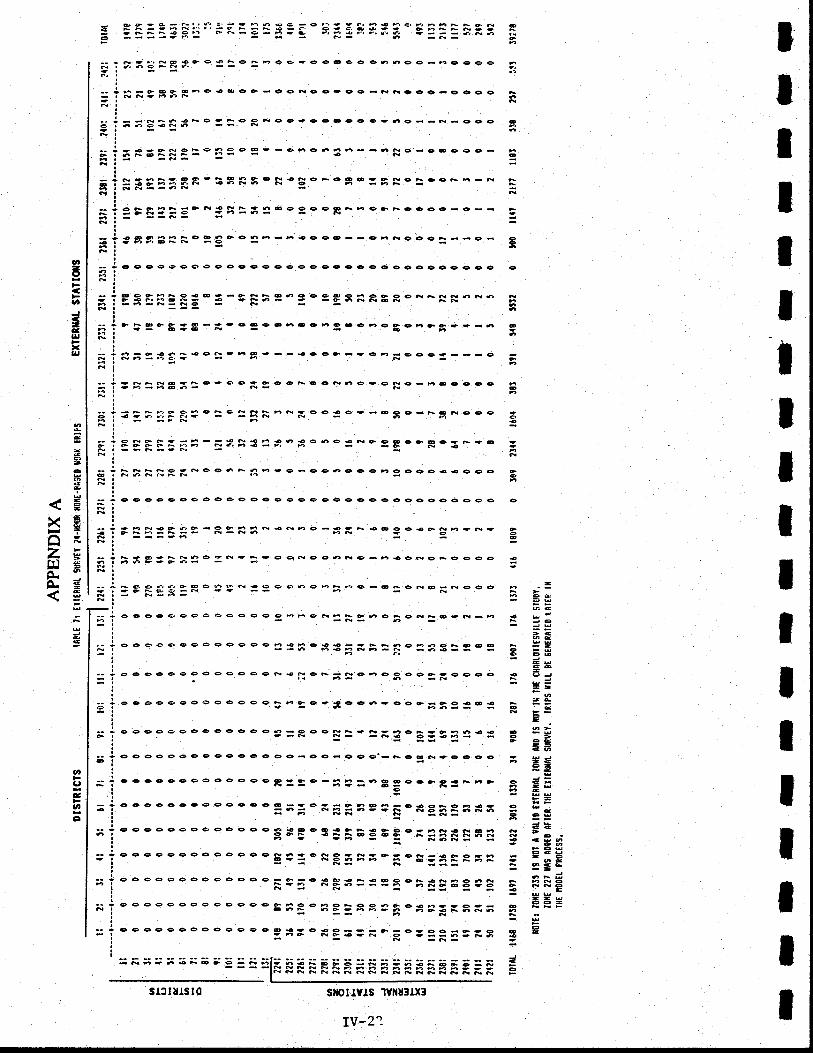
v,6
ttt
-etlJxgJ
-
1E\/t g
I
|-'NZE?"'l i;
/\ZZ4S
G
aD
C'eoo
: g'qEsF;9lo:!=o FneG-oooeo cooeo-Fceco|.-iF 1e!9q FhQ - o€. - o6Fe c-ee -ff ngcc-cce 9. NR-it-F
: ---tsF-tse-F€ gAeeeeCOCe O-6C--R-COgr 6no-RG
i;=;RR==o;?=oE--oaoG6 Fo-oEcce--R-
I
i:=liEER-EERe-R-ft oFes- : gso=coF6-Fi
i :ll::g'-:g=;=6eSecRFFeoFoooo-o--
? =
gS?3f Rc =3 - o - e o o - - c- Re c €
j c eceei eos o oc co e 9 ee eee e o d ceooco coo
ioeoFEo-o--F ooe@ o6oGo6iFRR6R6r e€FttEtu? - -oaFR6nh_FOr ---,l-^-oe -E-+e€o€eFEg6o6€6_O N acEcF-G?-{6
* El ; g'qg =-oft
c F g - - - €o eG -- c F -oace ---o
il-RFR@etsc-6(6Er- "i=ooa€ente?ct:o-Foccoc
i - ^ ^.-.. c c,, € ts e N N F F e - o o € e +.4-t11F.r- :gF-!t:ic€€e+-@Ec-FoRoeo-t F
-{f-FelcFAr'rF NftF€-otuFts--6--elcFAt'rF=J:"Ee6o<*FgBcF6o?Feo
i F D: FRRi-ee&F 6h - c-€oaoeoF6ceo€-oeo
I cee€ooeo€eecoecoecoecccoecococeo
a
.l - a-€G r,e -qr Fts - €R- g-€-x €Eo€{GRE-R-. tF-
? 5S E=F *3o' d - =-
o eR e o6Ne-,E -oReFo o6e:
i - c. o e, t. t @e Fr N € o o Gr. e FA.., eI re.A@q'-N qoaef @-RoQo
FdF-
i
- eooca oa e e e o oo6nhoN=F=-oEc-=o-e-t
:e6oeooe€eeoeoh€F€€{ Goh6 6-o66r --O h€rF--fr -h--;
I oeceoog6oooe€N€FcF--o -cac00F€cco
- ee€oeco€€ocooSi=e-3€c6-6cgEsg=o*
I ece6ee6oogaeo6-G66FA- --.r R- =E3o5:533'=I o c oe e o o c o o 9c o 9 c-c c-ec c'-h c o -+€ 6eo
; cacceeoccc e-oR:=c-93:-BocclR€F-.rc
- CeOeooeCOCCooG =-€?-FOEF-6-otsO-€?i =-;
Feaa6-6t-
- CeeOeoOe OoOCe {t 9@O9-FF€ }OC-6a-tsGEI gCA *hFEOEG F--NR-R- -a - R6R-
- c€ceceeaeoe€9NFeeRo-a E-- F66
- ooooeoooeoooo-e=o90€a-GocF€RronRiR.=*cs---h-!=F=-9
- eO oOo oee e o OCo e ?O o6oEOo 6oo€.,i --= "=:-- OCOOe€eeOeOC9O€eO€6--r -Eo Rc€-E-5o=99;gi3
N -A-
I-F;:; ;:;-:; ; 5 - il ;le AE - ;;; = -;i ; -; =-e; E -i:
- - - -lN NF FNN- F- i a - ---; - ;-
NftRRftNERNffNRFRFN
silolrvls 'lvllr3lx3
IV-22
o
6
-
* "j--=e
e--=o-
o i=b-
<cF€ awo- 6O
FAdF<O
--o @eF O€d
JDRO
O FF€.G
E=4oo-
6
oE
e
I
=ss-E-8=ig
lIIIlIIIIIIIIItIIIst3 Irls I 0
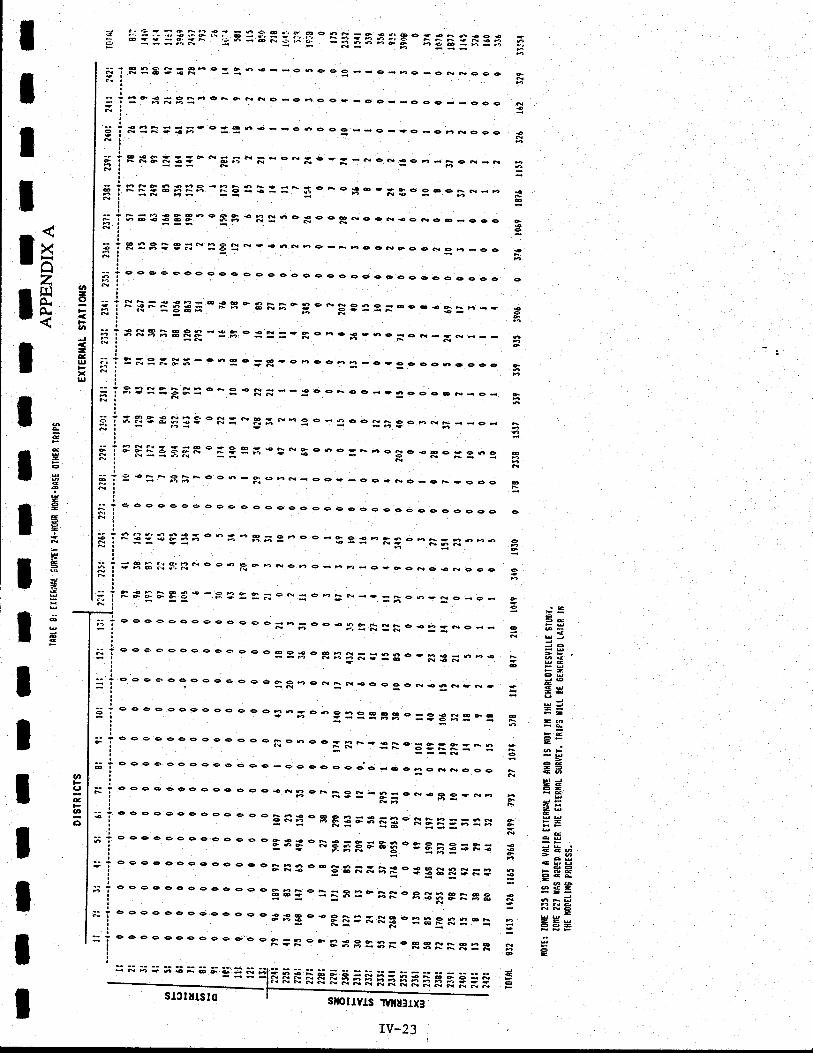
XazrD9c9qEa6
=e,gFxUJ
IIIIIIIlIIIIIIIIIII
e
o
=a
5
-
=
I " I g 3 fi 3S c* = - s ; *- 3 o - =
oo:l;ooENF <<c-
s :: IggE *iE : E= :t r- EE E aar;'z-;€E :r3t: 9*€.--q-o- en {--o 6o oo -rlN---<- -:: _ .c-ho-e*R€Co
T="i3=g="cA FRR6-o6oc-
-cc-dcco--ooot:
?F=S==;- o==6€-<eoo co --e-?e-o6Ace€I
;RFEE ii--E;---oFEa -= -NcR=eF-Eon-F! --- N - E
!
i Ri:BHis -I g =t : =^ Io-o;:- -F5o 9-6ts N-6I
?eE3=Eg"'Eg -RI-oSooRNoed{oRe6-oee
i--oEo<RF6&I R--- -a.__;6- R e€ nN6O-ts 6OONCOONO6<OC
- co€eoococe oceoeeooccocccgOC6ooec
I =R=n gg=-* g - gRso;--F ::33=o€ o-gAa--i
i I Fg =
EEE -: g,c :==- R o Fc €, 6c FcR-Fft -- -;
? =;3*FX-€66
o=F-cheo6h<o?6€6c-eooc
i S3:=59=oFc €Fi--=coaoe<-6ocoets-o-
i rligsER'I==g-=Ne cool--cH- -Ro=9-9
T = -=-B*-oo6 -GeEd<co--oo-No-ets-ooc
- e oe oeoe g9e QOOOOOooe€oo9o_ooooccg
i = =
g g gi; o a- ;' g; g-o e -G = =-Rgo-F! n---
= gs :: s?R- oe 6 e c E Nc F o _FF_oro6Fc€ N o o 6
R 8I A E€- -9 3 =
3 e o R < oaa c<-- =F
o6- R o -e -
e oo6o9ceoc e o o_-; oo{6=F:Ro-=:Ae__
cee 6oooooo oo e=3g-RRE===3o_F3_6a{
ooes oeceoe o oo=R-eNFN-€cocN€6N_Ne
eooo0990000 ooE6;o-:":=gg€=33g:F:
e€o o oc€eeo ooeFenoo:R_-:Fceg:R:^3
o Oo 6 eeo cco o ooreO€€ o€ o.o _-€6oNNo oc
coe c eooco€ 6eo-a6 o_ Fg:_*;c_€€e-Rh
ocoeeocooc oe'gRi-g EgF;EA-sEE=;=g
e eoo eeecoc o o'g*f 'F;EFFEE-3g33=&=oe€ o eo€cce o e oFRg o_ gBFF:;-SgCFgtgeeec ecococ co -EB= -==;=-p;stssF g= gae ceo aoe ceo o c -;;?g -- F I:liSR -=gER: -:oceo ecooco eo cR=R o-E*g=B=oRgSRR=R
e
e
@
o
U'C'eU'o
e
.-=e
F-
EI-at
--5
e-
F-
Eo*
-*dt
-=uoo-
o-= r: ; - ;;-xe; s
= = 1* FF FF F F iFFiFFEF E F =5sl3tulsro
=_-sl€uvls 1vilu3lx3
IV-23
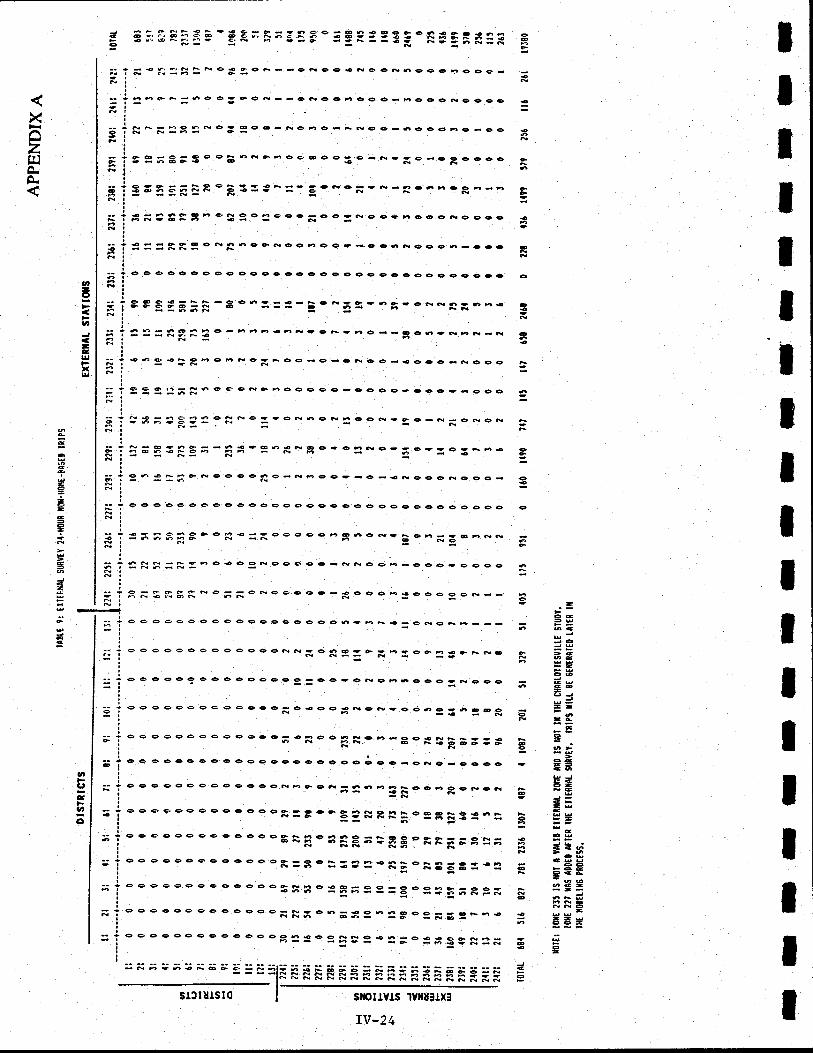
XozlrlAA
te
-e-o-
-
IIIT
IlIIlIIItIIIIII
6
-ae9g6<
JAG >€S EE
F-
o@ev-EJ J-t
or -ee
eIEo o>-d6eaaG6UJ=co2tsG@J-GT-s
ts S-e F-
casJg .>-Scsu60@ >aeEo-q@oc-h -t-c --ddNo
€ --!oo-
€€ -o
o2I
o
-Bl!xa
0L'ealCI
B = P. Bsf, e'3 r; R;3P; e =A23 33:-F3E; E=F€r1 ehzF- e --F--
rsxo;a:-;;;;l;;:'* = ===lF FEFF F=F F EF Ai R FF
==tsl3lurslo I srctrvrs lvltdillxt
-,Fts N O € o C F- -O ft O C- nO CF69e€ ?c oe_reo_
i ="-F-6e
o- oeA--€noerc€o-FO€eFoo€oI
R F - r.O r,F O! oO o-eC hO -tsRC a-6eCO aC -OOG-
g =
; 3F go eF 6noFoe € o c- c d.R- -o.-o R€ occ
3;E EF!g'=3=3^=-=e-o-- i-Rc6-cc--E
- -F6ceF eft ooaecc=ce+de ee6€eoft oeocAft-OFF €-
€--oP eona6cCFOO-6e--9 €6FCCC 6-CCC---AF-
oeooeceeeeooecccoece€cocococeoeo
t g g EE:F-t o-===-Eo-=g-6oe cnR6?6'€
a r. -
6G.-.h o -
6 a n -6F? C E? h e -___ftr;F€ _F?<_go6e R'R_R
€Ge€hoheFtsG ,-FCe_e_aFco_{o€c__9eo
G e o't-R o o e c Ro 6ec e e c-cc e o- ceoe-c c9----6R
g I ; 3 g 3 =o
3: - e : -or6o etoe -' e o--t c FeRC'-
s6E =FA;-g*-=-**geeoaRo--o+?e-ts6€
9 6 = =tq
F e o e e:?e -Np e c - -€.;€ NoeoRe cc-
oocoeeee€ g00ao60eccoeeocccoeoooo
= ; t F,?g " o R -=Fce e e Q to6o N- A o-F E e 6Re
= -_=
6 a. B -E + F e - O OROOe O O -Fft O eE-9OO - C O O€
o - G F o F Ne --eaGeeOe -:9OeOF €oC€ e Cn__._!N-ft&-nAR
e e e eeeeceeeoeeooec6?EF€-ONCF
eoe€-oe e ocG€oNN-€R==-x-:e-=glFRo
e€ 9OO€eCOOeOeCO-€eoeFa
eeoeeooe€eceoqo€ocgd€ero€6e=-=ER
€ e o oce€ e e o Qco;€R-ogsgF_o€EsFB g=S
e e o o ee e eaecccc6cooe€!oo-ero -oceo
ec e eoe o ooeecoNEeo-;=--SFeOEocNeR
a o o e ca e ee e ooe$? eolF 6N O !'iF eo@E o€atsR-> g=--ts;-=-i.i5=--=
occ cooe@ooco'sFEtnFR;=EE-RRE;g=;
e€ e eeo 60 0coooR=3€==3=-*FoFgSg=€:
ee ceoo oe oocoogEBo==;= g=gco?q=9o+___,_--= _e 66F_N
e o e o e c- e o e o co oFN; o - a': =- =F
cStE oF 6-
oeoceo ee oeeeog==ogig=-=;o=gggS=E
-- ; .' ;- -;; ; =
-rnF FFiiF FFi F Efr 5;iF FE :=:
-
-o
o
o
o
e
TV-24
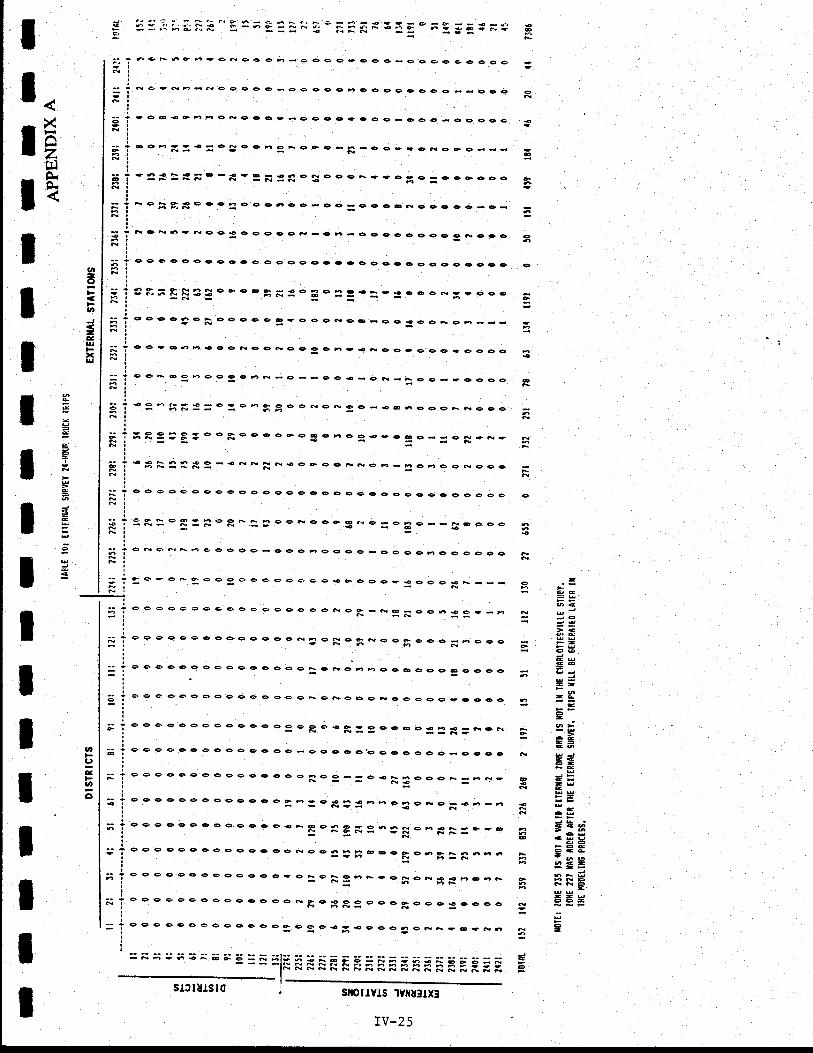
IIItI
X
ztllnrA
* I L.;il;l;k '' i =;3: !r E " E E F:; I E';: g e f =:;;;i i -, eF 6e6- ea e e o6-e oe o - oo e -eo eo e€ eoe
-?-" -ooo€croocceF€occceoo__cco
I
5 ? -€@€6FrCF€COe-ooeoe€oe_QOO_CeCee
-r - Eaa e - - -o.1 oo aeFc -c - F -C e- c eRo G c ___o | _ i{_
H T -=*=:Fo -*- =
;i=R€G oe cF e ? c ;-=o c Fcoe
ts i ^-=g*occEoe o6co-oc-cec-Ncoeoo-o<
= ? -oR6-Nce€eeeOOR-oF-occ€ecoccFCCc
; ? oooooG6eogcooeocece€eocc€cooeece
i
= i 3E;RFSRele-gF=eBe==€=--oeoN'?cooF i -F
GC6OAO6COOO-C CeReo-co€ooEoE__-7i r N -
{ i -ore6F€ooRoc.Rc€ ocE?€ROC_ o6,e i €cco6lr.i
; I --a@or6o:o-R-c--oc-qcR<Foed?coec
s T -3-Si==o:e' ?,Aoe NoR 9c--a6oceFNo cc
i j ;R9=F=oeG oe c oFo EeE eo€-o Ec--e r{-R+Er =
F i t*F:=*o-€RRRR{o}eoFReF-hepecN6co
l- i oo I oe6oeoo o o ooo cec eeecoc6doecooe
-- I =-
h e6- Foots ==
cof eoo g.,o -o Eo-- REocoE I --- € E €
; ? o-eRF-eeocc<ooo-cooo-ooooEoceooc
- i =
o- oF Aeeo oo ooo c, e e -Fooo- €eo o {E _F_
; ? oe eeo ooeoooooeoooFee_ao-eo6€o__Fn ;-
;i ? e e o e o e o oa€ ec o eF!? ci. c*-c€q. 6eG _ E o eehN
- ? gogOooOe oOOOOoOaeReFEOOOOCOEOeeg
i
; * -:eo€eooee6ooeeFeRccoReeoeeioo€c
; ? c o € oooee oooo Ooe l> O€G- OoO6o€F€ _RcRR-- --ai?_'
;; ; ee o oee I A o O 9 o oe - e € Ooe.c eo OoO€<e€ ee
; ? co o eeccoeeeo ec.o 4oo__e-A6eOOF_Fk- e-
i ; ec€e9eoc9ce€Q6E-9{?1-he6eFe--E_ER-- € -
; ? ecee96€e9cece{F9'e49_ g6Qrea€F_F'E- i g -9-- -i..-'-F;.=- -
3 ? ec e o e€ eo ocoe Qc N oo6 llr!? E c oe €6Gts 66ha- - - -a-ia- '
; ? ecee9Oeo0€o€oec'te!\96F-oNci€€FoFFN_ n __ ._
;; ? G ooe oe oeoo co co ft a c.9 9g e oe!Feeo€OOcoN
- ? eeeooeGoo0ooo6e6O€=€eoo-oRts?@-d-F
o
o
IIt
v,6
u,
-gUxu,
o
=
9
o .=@e9C
N --- Ja
>cgrdUU>-o6CUco
; -jPF
-t6
6 == Ee-a>F -gee--G6
F tsJ-<e-NG
E d=I -sg9F-
eAUJE 'GG4>a 6sGBOaoe<c
o964----6EUFNEFF€gu--soo-
o
e
IIIIIII
e
o
IIII
--t-- r- --6- ^ 6G o €R El- 6 - xo I E - - -- --_
- _ _r.r r E N R e Fr > i"i
=: 23,; g g g
= g
lN N F F N e R R R d d da ir ari iri :_, - - -
slSlurslo ; 5iouyls tyltuttxt
IV.25
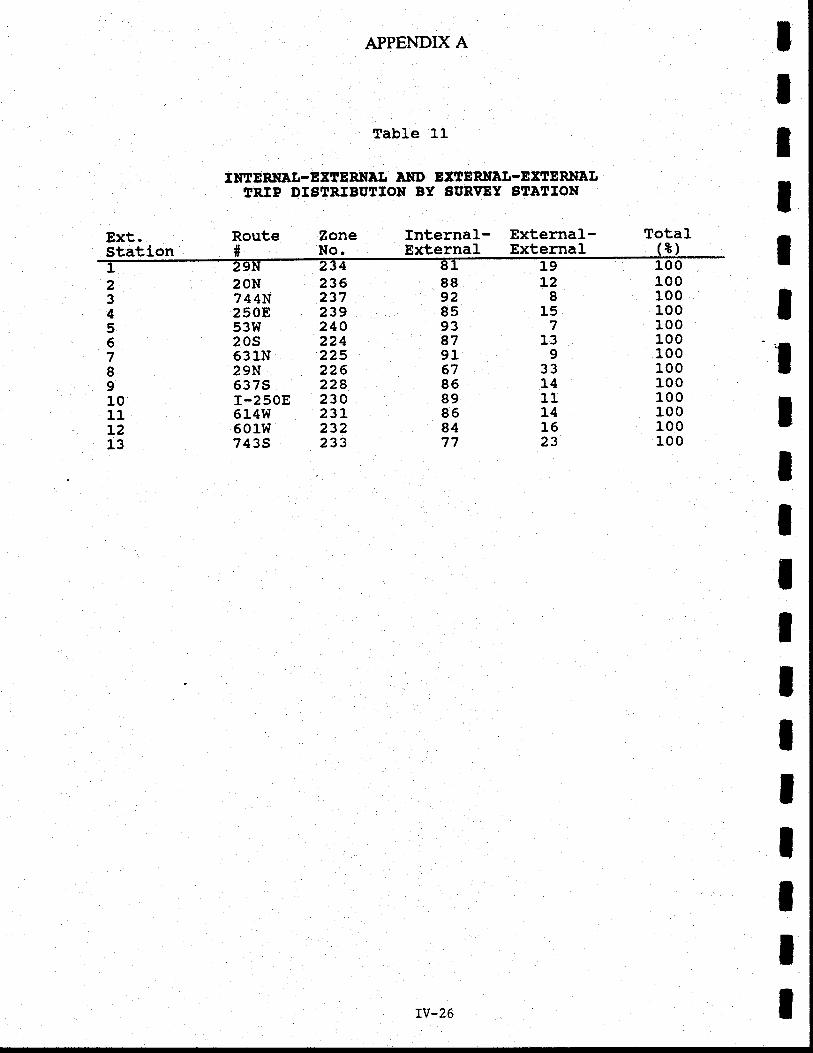
APPENDIX A,
Table 11
MEnNI'L-EXTEnNAL IIID EXIERNaIT-EXAERNAL,IRIP DISTRIBUTION 8Y SUNVEY 8TAITION
ZoneNo.
Internal- External-External External
TotaI
IIItII'l
tlIlIIItIIII
L28
157
139
331411L41523
Route#
234567I91011L213
z100100100100100100100100100100100100100
Ext.Station
8892859387916785g9858477
23623723924022422522622823023L232233
20N744N250853W20s631N29N537Sr-250E514W601W7 435
TV-26
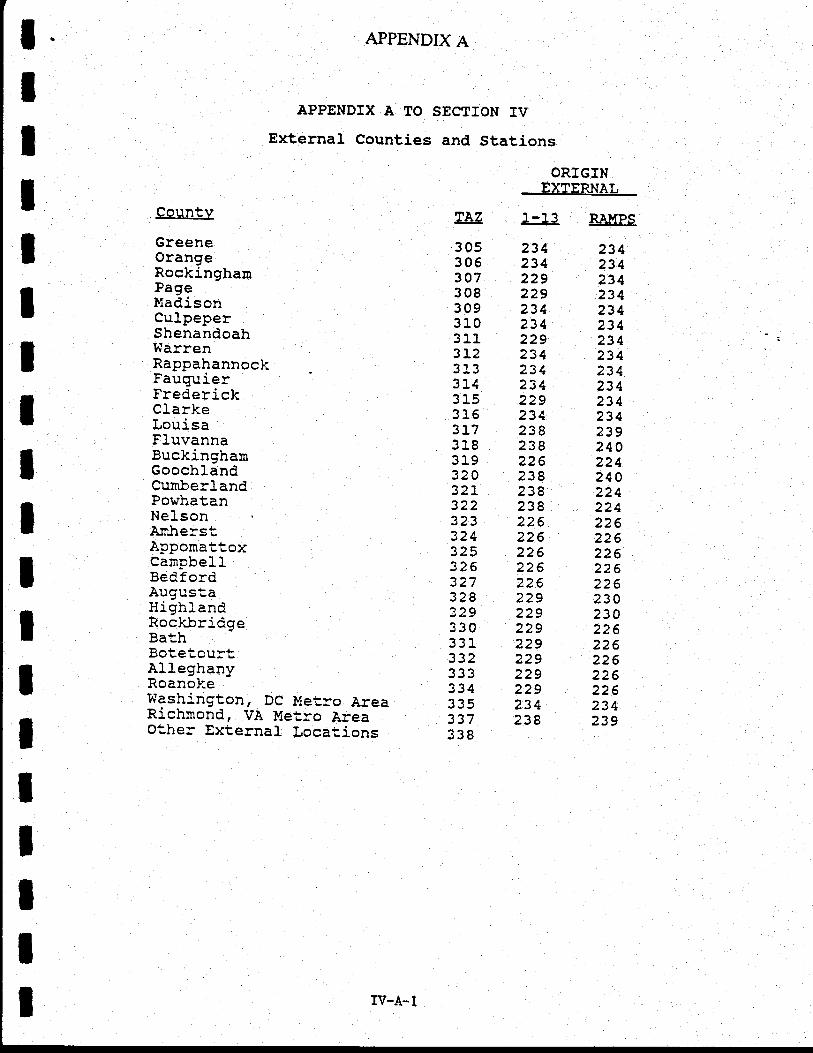
liI
APPENDIX A
APPENDIX A TO SECTION TV
External Counties and StationsIIIIItIIIIIIlIItI
Countv
GreeneOrangeRockinghanPageMadisonCulpeperShenandoahWarrenRappahannockFauguierFrederickCIarkeLouisaFluvannaBuckinghamGoochlandCurnberLandPowhatanNelsonAni:e=siAppoma-,toxCanpbellBed,f ordAugustaHighlandRock-bridgeR:tlrBotetourtAlleghanyRoanoke?Iashing+-orr 7 DC Metro AreaRichnrond, VA Metro AreaOther External locat,ions
L lll)
3053063073083093103113L2?1?314315316JLI318319320JZ,L322323324325326JZ, T
328329330??1332333334??q337338
ORIGINEXTERNAL .
1-13 RAMPS
234 234234 234229 234229 234234 234234 231229 234234 234231 234234 234229 234234 234238 239238 240226 224238 210238 224238 224226 226226 226226 226226 226226 226229 230229 230229 226229 226229 226229 226229 226234 234238 239
rv-A-1
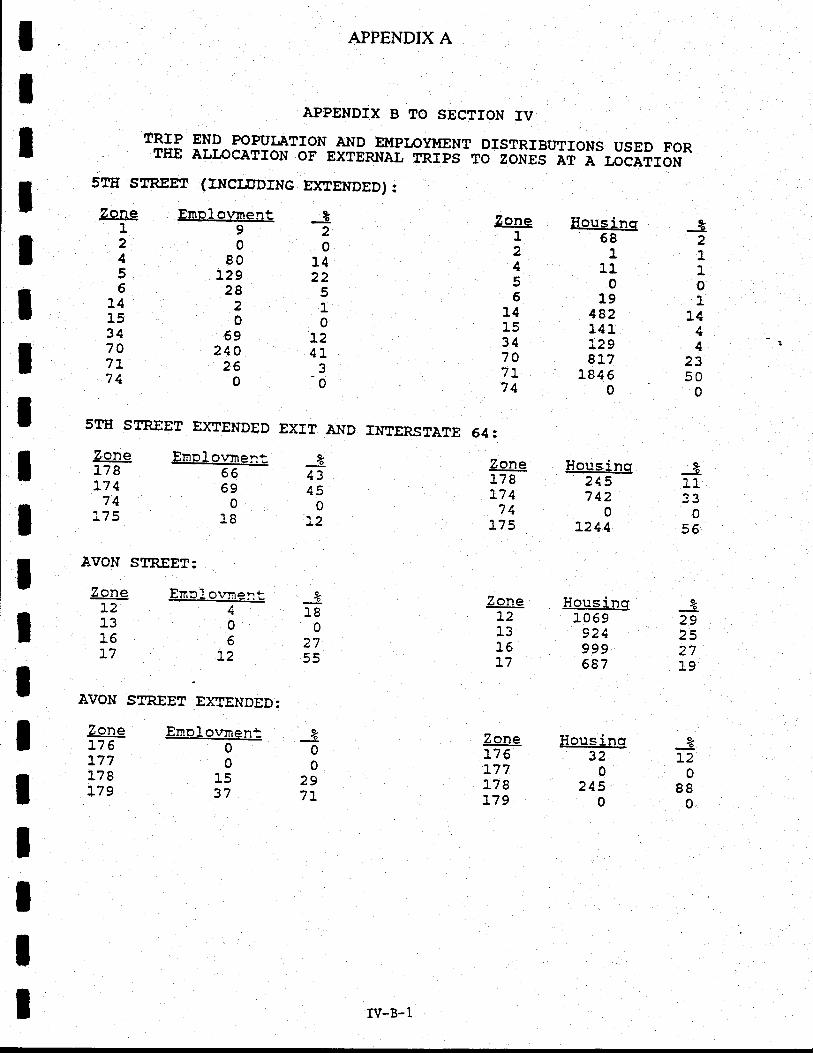
IIIIIII
APPENDIX B TO SECTTON TV
tRrP END PoPur,ATroN AND EI.{proyMENT DrsrRrBUTroNs usED FoRTHE ALIPCATTON Or EXTERNAI INiFS_rO_ZOiirS AT A I,OCATTON
APPENDIX A
Housinq58
111
019
482141i29817
184 60
_321
1
o1
141A.t
23R'1
0
-311
0s5
3t2
088
0
_300
29lt
IIIIItIIIII
515 STREET (INCLUDTNG DCTENDED) 3
Zolte Ernplovnent _A1922004 80 14s tzs iz5285
!42115oo34 69 1270 210 417L26374 0 -o
Zone12456
l4153470IL
74
I sr' 'TREET
EI*ENDED Exrr AND TNTERSTATE 642
?gl" Emplovment _aLtu 65 43L74 69 4374 o oLtJ 1g Lz
AVON STREET:
Zp!,a Ernnlorrrnen-_ JLZrre13oo1662tLt 12 55
AVON STREET EXTENDED:
ZoneL7Il?4
74LIJ
Zone),213t517
Housino215742
03.244
Housinq32
0245
0
Housincr e^
l_059 29921 25OOO .-JzJ Z I687 19
Zonet76J.77178].79
?onet76r.77J.78].79
EmDlovmen-.00
I)37
rv-B-1
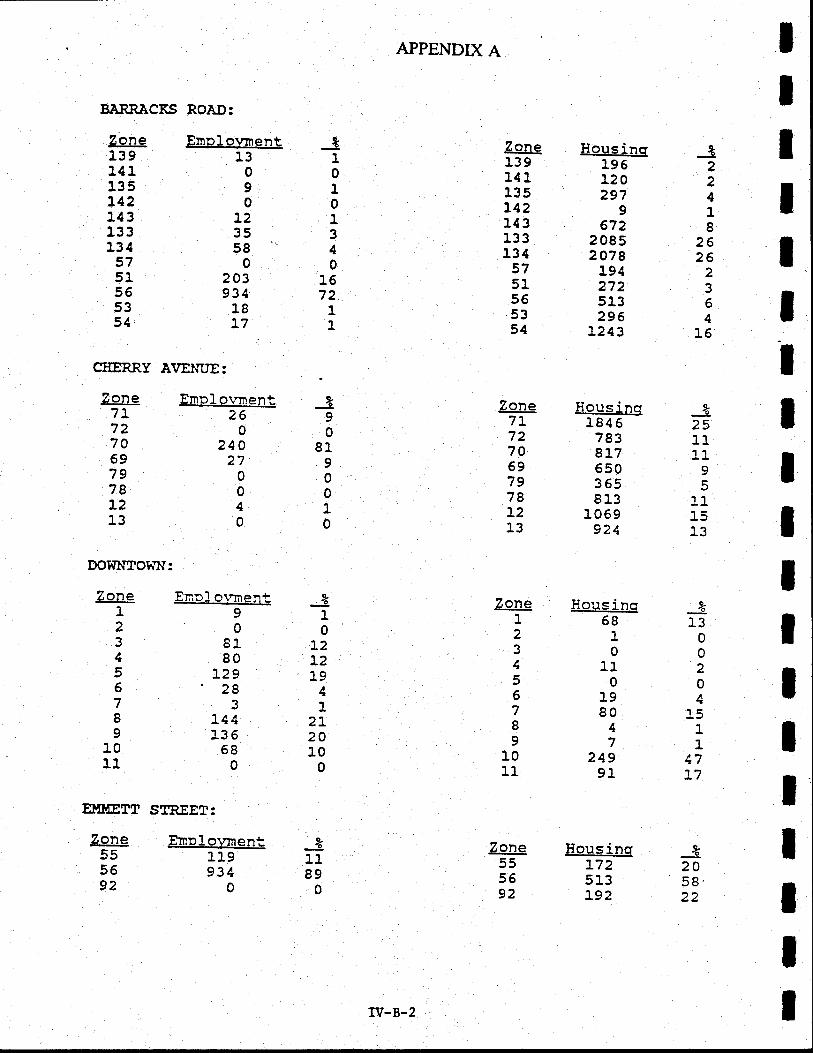
IIItIIIIIIIIIIIIIII
_-t2241
r82626
2364
15
*25't111
q
l_1L3
2+J.J
0o204
1q1
1+tT7
I1
0101340
1672
11
_390
819001
0
_-3.1
0t2t210
41
23-20i.0
0
3L189
0
APPENDIX A
BARRACKS ROAD:
CTIERRY AVENUE:
Zone139141135L42143133134
575155ri?54
Zone717270697978t213
DOI{IflTOWN:
Zone1
z3456789
1011
Ernplownent13
090
L2?R
580
203934
18L7
Emplovment26
0240
270o40
Hous incr196120297
9672
2 0852078
194272513296
1243
HousingL84 6
783817650?<R813
1069924
Housino58
10
l_t0
t980
47
249o1
Zone139141.1351421{3133134
575L555354
ZoneIL7270697978L213
Enpl- olnnen+-90
8180
L29'28?J
t44136
680
Tone1
23456789
1011
EUMETT STREET:
Zone
5592
Emplovmen-,110934
0
Zone555692
Housinqt'72513t92
_32A'5822
w-B-2
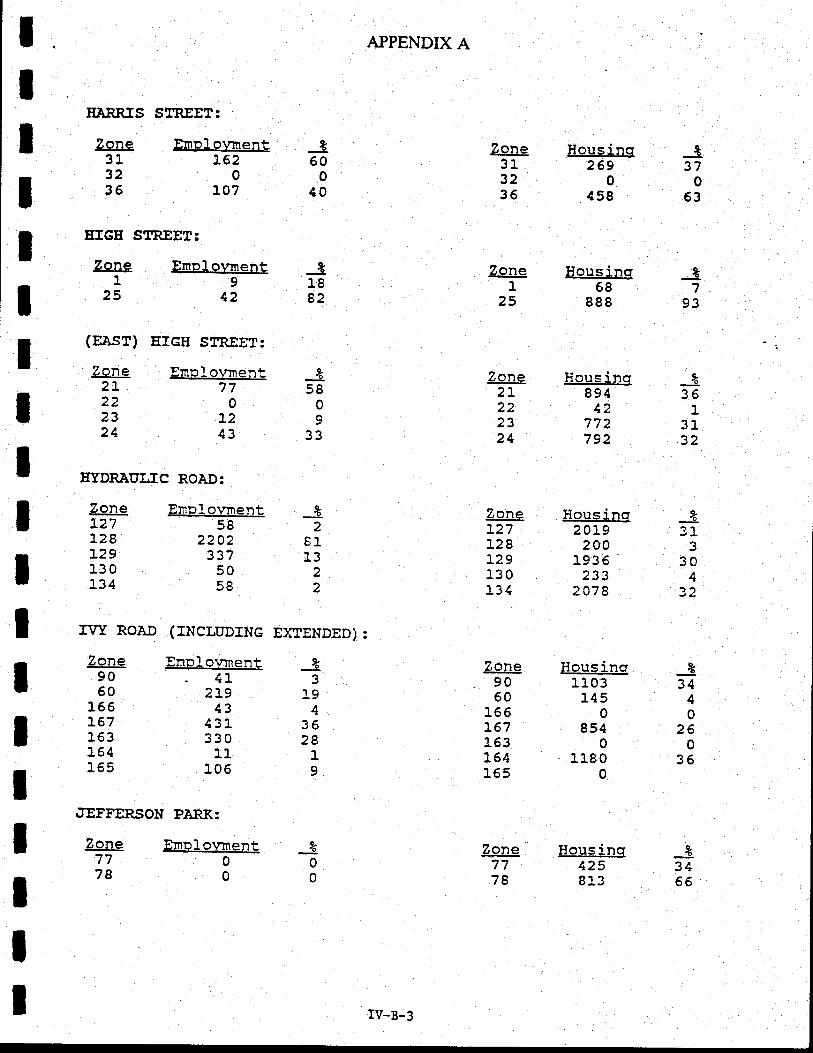
tIItIIIIIIIIIIIIIII
Zone2t222324
Zone]'27L28L291.3 0134
Zone9060
166167163164165
I36
1
JJ.32
z?1
J30
4JZ
EARRIS STRXET:
Zone Ernpl ovment31 t6232035 107
EIGE STREET:
Zone Emplovment19
25 12
(EAsr)
Zone2tzz2324
TGH STREET:
EmPLofrment77
0t213
ETDRAI]IJC ROAD:
APPENDIX A
.J60
040
Zone313236
Sonet.
25
_337
063
Housino269
0458
Housino68
888
Housino894
12772792
Hogs incr2 019
2AO1936'
233207 8
Housincr1103
1450
8540
11800
Housincr425813
I7
a?
__a34
40
260
35
_z3466
Zone7778
I1.882
--a5809
33
_32
8l_13
z2
*?
L9A!.
3628
1
9
_zo0
Zone7778
ZoneL27128L29130134
rVT ROAD
Zone9060
165r67153L64155
Ernplovment58
2202JJ T
5o58
(INCLUDING E)CENDED) :
Enplowment.41
2]-913
431330
11105
JEFFERSON PARK:
Ernplovment00
rv-B-3
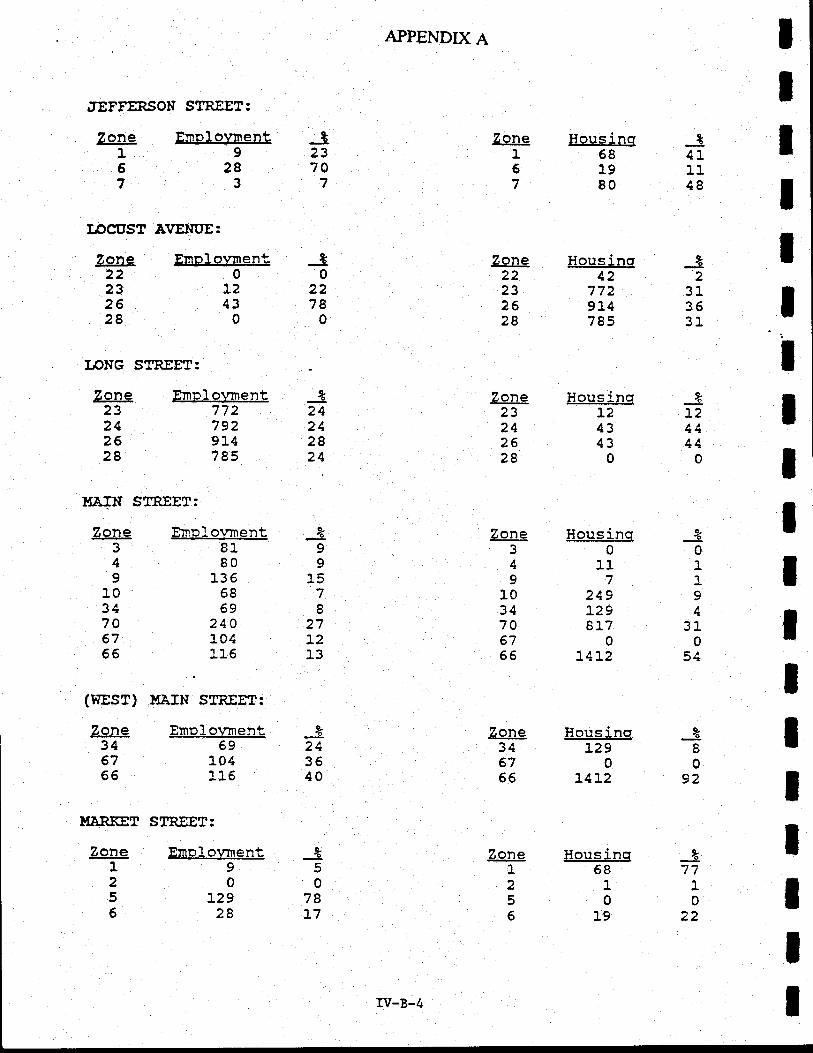
;TAFTERSON STREET:
Zone Ernplovment -!923
IOCI'ST AI'IENTIE:
Zone22232628
23242628
uarN SEREET:
Ernol-ovment I00L2 22
APPENDIX A
Zone Housincr158619780
Zone Housins
IIIIIIIItIIIIIIIIII
32
3136
_-tT21441
0
-L01L9
?10
51
_zI0
92
>o
77
0zz
167
283
707
J411148
I-NG STREET: -
Zone Emnlovnent t
430
7727929t4785
8180
lJo6869
210104116
69104115
780
24242824
99
l-37I
27t213
243540
22232628
232426
103470
42772914785
t24343
249129oLt
Zone Housino
Emplowment 90
280
Zone Housinq3041197
Zone349
1031706766
(wEsT) l.laIN STREET:
67066 t4:-2
Sone Housinq34 32967055 t1].,2
Zone Housinq168
Zone346765
I,TARKET STREET:
Ernpl-ovment. _Z
1
019
256
07817
0t29
28
Zone.1
255
Empl-ovrnent _Z95
rv-B-4
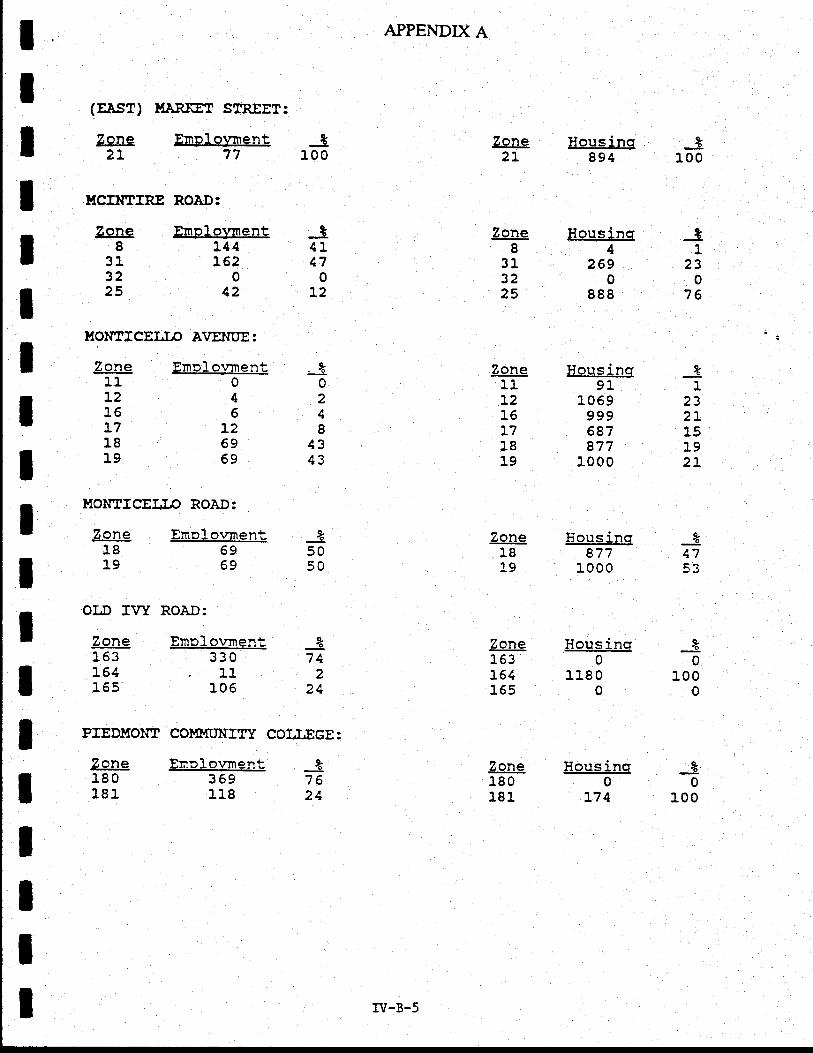
IIIIIIItIIIIIIIIIII
(EAST) r.{ARKET STREET:
Zone Ernplovnen! ;l2L 77 100
HCIICTTRE ROAD:
APPENDIX A
Housinq894
Hous incr4
2690
888
Housinq91
1069999687877
1000
Hous*qq877
l-000
Hous inct0
118 o0
Housi-ncr0
].74
Zone2L
Zone8
313225
_3100
Zone8
313225
UONTICELT' AIIENIIE:
EnplovnentL44162
042
Emolovment046
L26959
Emplovment330
11106
Ennlo,vment Z369 7611,8 24
_31
ZJ0
76
__a
232L15192L
z1753
_-e0
t000
Zone181Q
-34117
0T2
.z0248
1343
_z50EA
_z74
224
Zone1.11216L71819
Zone11L215T71819
UOMTICEIJ.0 ROAD:
Zone Employmen'-18 6919 69
OLD T\ry ROAD:
Zone163j.64Jb9
Zone180181
PIEDUO}TT COI{I.II]NITY COT.T.NGE:
ZoneIbJ154155
Zone180181
*0
100
w-B-5
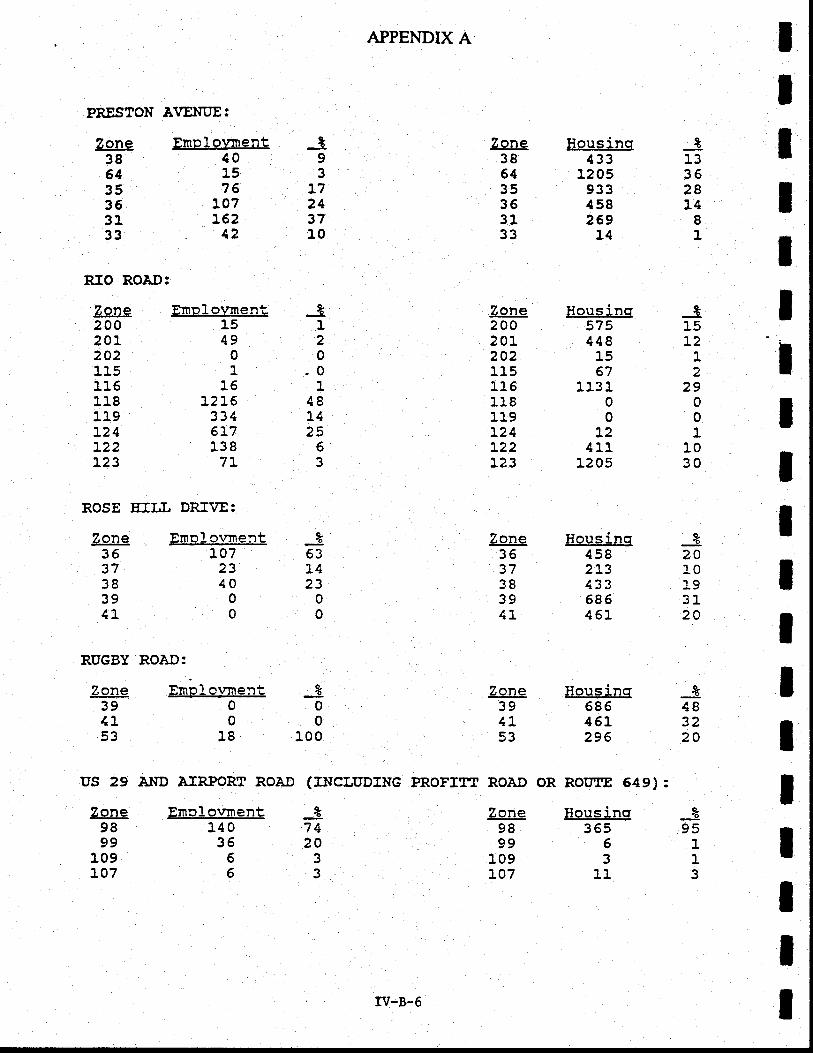
PRES?ON AVENI]E:
Ennlovnent401576
107L62
12
APPENDIX A
Housincr433
1205933458269
14
Housincr575448
1567
113 100
L2411
12 05
tIIIItIIt
_&13362814
81
_315t2
12
29o01
103o
_393
L724371.0
Zsre386435363133
RTO ROAD:
Zone20020120211q115118119L4qL22L23
-E120
-01
4814z)
63
Zone386435363133
Zone20020120211511611811qL24L22123
Zone353738?a4L
ROSE EILL DRT\IE:
S:npLovment1549
01
1612 16
3316l.7138
7L
Ernolcvment107
2340
00
ROAD:
Emplovneni00
18
Emplovment140
3566
Zone353738?o1t
RI'GBY
Zone?o1Ltra
us 29
Zone9899
109107
_z53t423
0o
zoq
11?
_37420
33
300
100
Zone?a1LE?
Zone9899
109to7
Housino458a1'r433685461
Housincr68546L296
Housincr365
63
11
320
19?1
20
_3.183220
IIIIItIIII
A}{D LTRPORT ROAD (INCLITDING PROTIIT ROAD OR ROIIIE 549):
rv-B-6
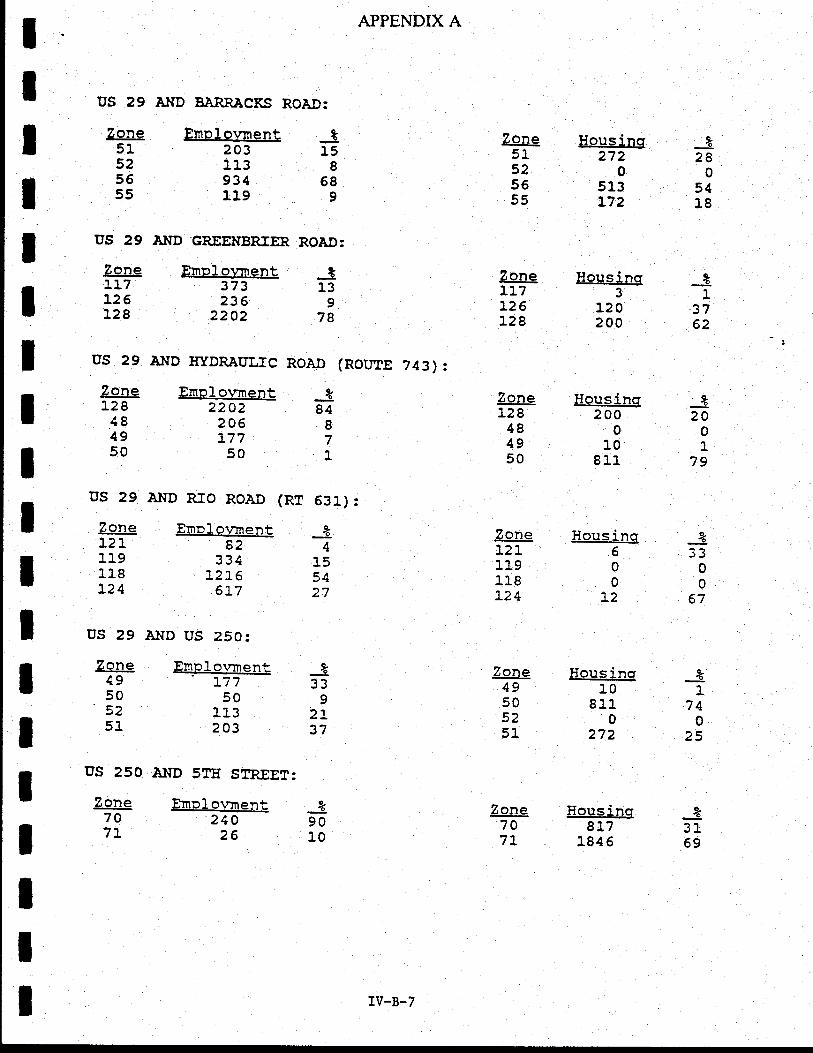
IIIIIIIIIIIIIIIIIII
us 29
Zone51525655
us 29
Zcinel-17L26128
Zone51525655
Housing272
0513L72
Housino3
].20200
HouFino200
010
811
Housino'600,
t2
Housino10
8110
272
Housinq8L7
184 5
AND BARRACKS ROAD:
Ernpl ovnent ;l203 15113 I934 68119 9
AI.ID GREEI'IBRIER ROAD:
631) :
APPENDIX A
_328
05418
Emnlovnent373236
2202
us 29 Al{D RIO ROAD (RT
Zgne Ennlovrnent121 82119 334118 L2L6L24 6:-7
US 29 AI'ID US 250:
Zone EmpLovment49 L7750 50' 52 1j.35l_ 2A3
US 250 AND sTtI STREET:
Emplovtnen+,210
26
_31
3762
I20
01
79
2??
00
ol
21
740
z>
-3?169
. one707t
-3139
78
_34
J-5<A
27
_a??
92t37
39010
Zone7A7L
Zone117].26128
US 29 AND ITYDRAIILfC ROAD (RoIIrE 7431 2
?9!,. Emplovment I128 2202 8418 206 849 177 750s01
ZoneL28484950
ZoneLZL119118124
Zone49505251
rv-B-7
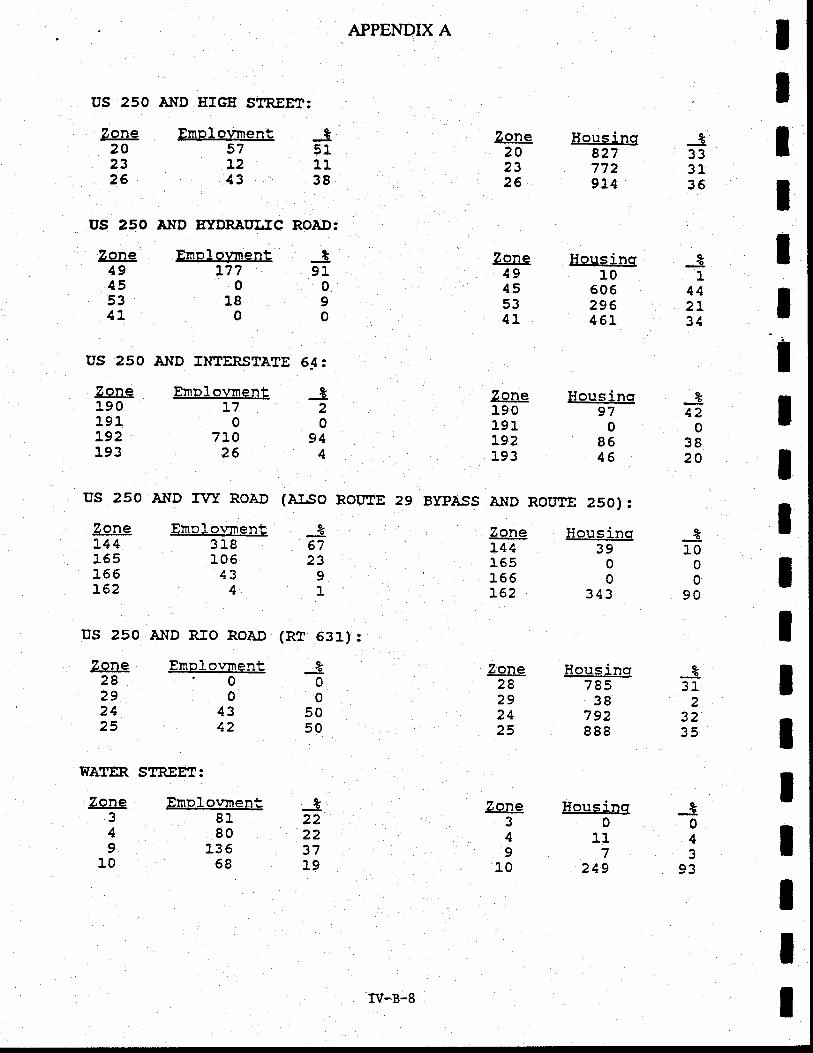
US 250 A}ID HIGE STREET:
WATER STREET:
Zone349
10
ErnpLovmen.t57t243
ErnplovrnentL77
o18
0
ErnplovnentL7
07IO
26
Ernplovment318l_05
134
Ernplovment'00
4342
Emplovment8180
13658
APPENDIX A
Houqinq8277729J.4
Housing10
506296451
Housi.nq97
o8646
Housino39
00
313
Housino785
38792888
Housincr0
117
249
tIIIIIIIIIIItIIIIII
_a1
442134
3t0
00
90
_3043
o?
_39t
090
_320
944
36723
91
_z00
5050
Zone2A2326
Zone4945531L
-3511138
Zone202326
Zone49455341
_3333135
US 25O Al{D EYDRAI'LJC ROAD:
US 250 A}ID IN:TERSTATE 64..
Zone1,9 0191]-92193
Zqne144165155L62
Zone28292125
Zone190191L9210"
Zone!44165l_65t62
Zoneao292425
_e42
03820
I]S 250 AI'ID TUT ROAD (AISO ROUTE 29 BYPASS A}{D ROT':[E 250):
us 250 Ar{D RrO ROAD (RT 631}:
_3.?1
232
-_t222237L9
Zone349
10
IV-B-8
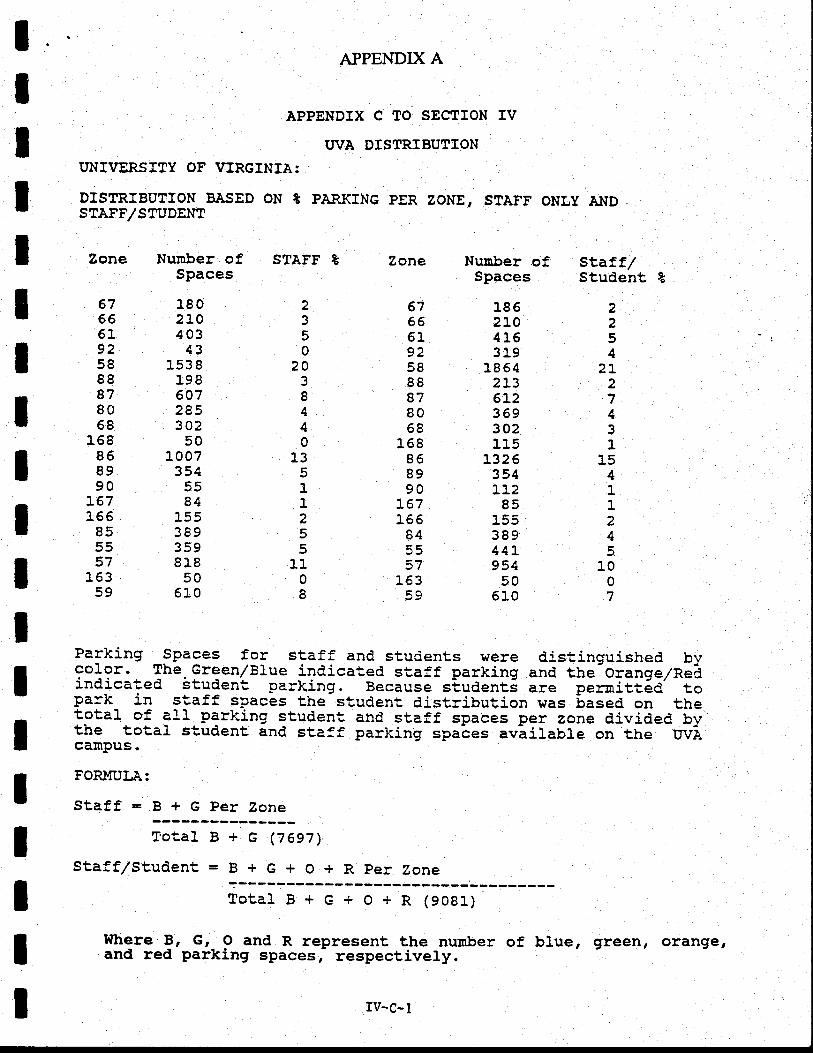
2254
2t27431
'tt411
245
1007
2350
20?
8440
1351
1255
1108
IIIIIIIIIIIIIIIIIII
APPENDIX A
APPENDIX C TO SE TION IV
I'VA DISTRIBUTIONI'NTVERSITY OF VIRGINIA:
DISTRfBUTfoN BASED oN t PARKfNG PER ZoNE, STAFF oNLY A}{DsTAFF/STUDENT
Zone
676661925888878058
168868990
l.67166
85
JIIOJ
Nurnber ofSpaces
180210403
43153 I
1986072e530250
1007354
84l qq
389?qoIL8
506L0
STAFF I Zone
676661925888878058
158868990
].67155
84
>t
Staf frrStudent
Nunber ofSpaces
185210416319
18 642L36L2369302115
132 5354tL2
85
38944L954
50610
Parking _fpaces for staff and students vere d.istinguished bycolor. The Green/Blue ildicd-ued s-,?ff parking and the-orange/Reiindicated student parki.ng. Because siudenti are feraitt6e' t9park in siaff spaces the-student dj.stribution vas Lased on thetotal of all parking studeni and staff spaces per zone divided bythe to-ual student and staff parking spales aviilaULe on the qrv!camPus.
FORMUI.A:
St.aff =B+GPer Zone
Tot,al B+G (7697)
Staff/Student = B + G + O + R per Zone
TotalB+c+o+R(9081)
Where !, Gr- 9 and R represent the nunber of blue, glreen, orangte,and red parking spacesf respectively.
ff-c-t
(hqrlottewllle/filbeinarle (osntf .
portotian Plqnning l'lodel
]'lodel Gotlbrqtlon and f,PPllcotlon Resoltr
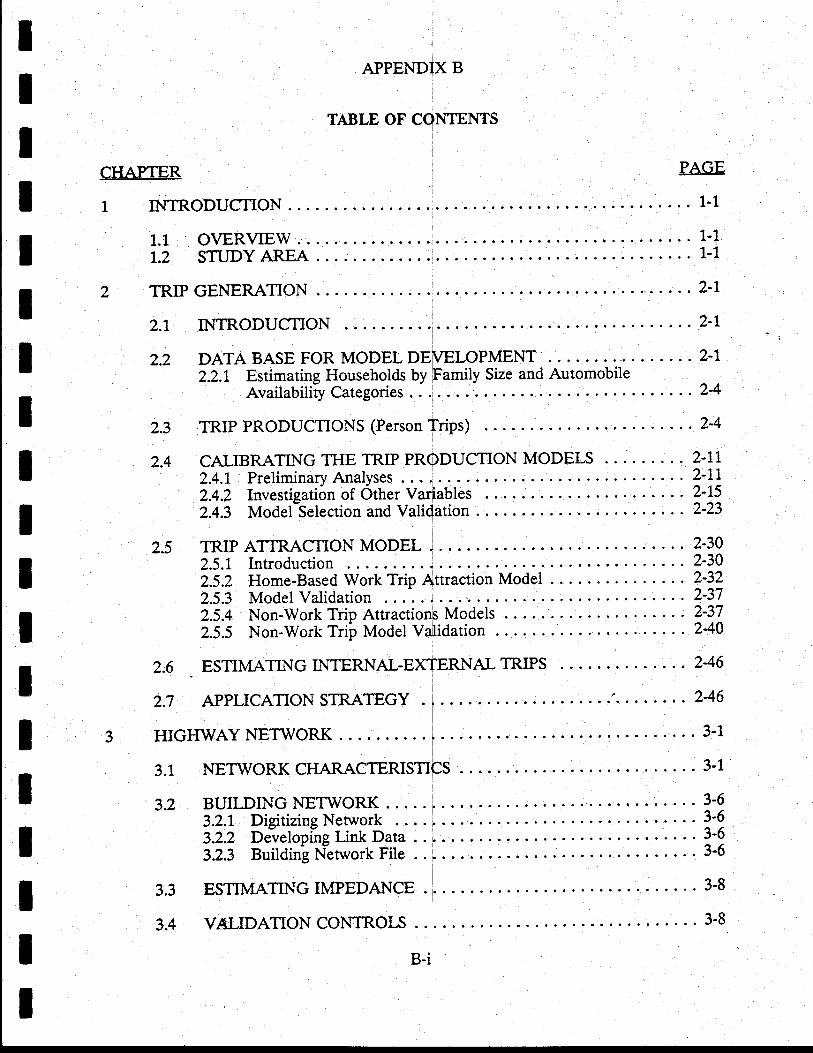
IIII
APPENDIX B
TABLE OF CONTENTS
CHAPTER PAGE
IIIIIIIIII
INTRODUCTION l-1
1.2 STUDY AREA ' 1-1
TRIPGEI.{ERATION...
2.1 INTRODUCTION ...2.1I
2.2 DATA BASE FOR MODEL DEIVELOPMENT2.2.L Estimating Households by Famiiy Size and Automobile
Availability Categories
2.3 TRIP PRODUCTIONS (Person Trips)
2.4 CALIBRATING THE TRIP PRoDUCTION MODEI-S2.4.I Preliminary Analyses2.4.2 Investigation of Other Varlables2.4.3 Model Selection and Validation .
2.5 TRIP ATTRACTION MODEL , .
2.5.L Introduction .....i
2-l
2-4
2-4
2-tl.2.112-L52-23
2442-30
2.5.2 Home-Based Work Trip Attraction Model . . . . . 2'322.5.3 ModelVatidation .i .... ...2'372.5.4 Non-WorkTripAttractionsModels .....2'372.5.5 Non-WorkTriiModelValidation... ...240
3.3
3.4
IIIII
3.1
3.2
2.6 . ESTIMATINGINTERNAL-EXTERNALTRIPS ....246
2.7 APPLICATION STRATEGY 2-46
HIGHWAY NETWORK
NETWORK CHARACTERISTICS
BUILDING NETWORK . . . . . i3.2.1 Digitizing Nenvork . . . .,3.2.2 Developing Link Data .
3.2.3 Building Network File .
ESTIMATING IMPEDANCE
V.ALIDATION CONTROTS .
3-1
3-1
3-63-63-63-6
3-8
3-8
B-i
tI
TABLE OF CONTENTS (continued)
cHAPTER PAGE
4 TRIP DISTRIBUTION MODEL . .
4,1 INTRODUCTION
4.2 TRIP DISTRIBUTION MODEIJ FOR INTERNAL TRIPS . . 4-1,
4.2.1 Base Data
4.3 CALIBRATIONMETHODOLOGY... ..4-3
4.4 CALIBRATION RESULTS4.4.1, Non-WorkPurposes .......4-54.4.2 Home-Based Work PurPose
5 MODEL VALIDATION .
5.1 DESCRIPTIONOFVALIDATIONRUN ......5-1s 1 1 Assignment Procedure . . .-.^.1 AssisnmentProcedure... ..-5-1< 12 Validation RunsJ't"
5.2 VALIDATIONASSIGNMENTRESULTS .....5-55.2.1 Screen and Cutlines Checks . , 5.5<',2 VN4T Ratiosu.-.2 VN4TRatios ...5-95.2.3 Percent Root Mean Square Error (ToRMSE) . . . . 5-9<) 4 Adjustment Factor-.-.+ Adiustment Factor
5.3 VALIDATIONCONIROI.S. ....5-13
ANNEX A:. HOUSEHOLD STRATIFICATION PROCEDURE
A.1 DEVELOPMENT OF THE STRATIFICATION MODEL
A.2 APPLICATION OF STRATIFICATION MODEL
A-1
A-1
A-5
IIIIIIIIIIIIIItII
B-ii
IIIIIIIIIIIIIIIIIII
2.15
2.76
TABI.E
2.1
2.2
2.3
2.4
2.5
2.6
2.7
2.8
2.9
2.10
2.tt
2.12
2.73
2.r4
APPENDIX B
LIST OF TABLES
PAGE
DWELLING UNTT OCCUPANCY LOOK.UP TABLb . . 2.7
AIJTO OWNERSHIP LOOK.UP TABLE
I{BW ANALYSIS OF VARTANCE
HBO A}IALYSIS OF VARIANCE . . .
NHBANALYSISOFVAITL{NCE... .,..2-74
HBWMULTIPLECLASSIFICATIONANALYSIS ....2-16
HBO MULTIPLE CI-ASSIFICATION ANALYSIS . . . . . . . . . . 2.17
NHBMULTIPLECI-ASSIFICATIONAI.{ALYSIS... ..2.L8
HOUSEHOLD TRIP PRODUCTION RATES (Person Trips) . 2'19
EVALUATION SUMMARY OF TRIP PRODUCTION MODEIS . . 2.22
TRIP PRODUCTION RATES FOR HBW PURPOSE(rrternal & Internal-External Person Trips Only) . 2'27
TRIP PRODUCTION RATES FOR HBO PURPOSE(Internal & Internal-External Person Trips Only) . 2'28
NHB TRIP PRODUCTION RATES FOR NHB PURPOSE(Internal & Internal-External Person Trips Onty) . 2'29
DISTRICT LEVEL VALIDATION TEST OF TRIPPRODUCTIONMODEI-S. ..2-31
MEASURING UNTTS FOR TRIP END I-AND USE . . . 2.33
TRIPATTRACTIONRATESEQUATION. ....2-36
B-iii
TABLE
2.t7
2.r8
2.r9
2.20
2.2r
2.22
2.23
2.24
3.1
?",
APPENDIX B
'.IST OF TABLES (continued)LIJI r'rr llllrrErrJ
PAGE
HBW TRIP ATTRACTION MODEL l
}IBW TRIP ATTRACTION MODEL? . . . 2.39
HBO TRIP ATTRASnON MODEL I
HBO TRIP ATTRACTION MODEL? . . . 242
TIBO:TRIP ATTRACTION MODF,L3 . . . 243
NHBTRIPATTRACTIONMODELl :.... ...244
NHB TRIP ATTRACTION MODEL? . . . 2.45
RATrO OF I-XIX-I TRIPS TO TOTAL PRODUCTIONS BYPURPOSE&DISTA}ICEFROMCBD ...2-47
WINDSHIELD/LINK ATTRIBUTE DATA & TRAVELTIMEDATA ....3-3
EFFECT OF AREA TYPE AND FACILITY TYPEON AVERAGE TRAVEL SPEED
IMTIAL LOOK.UP SPEED & SERVICE VOLUMES TABLE
SUMMARY OF GRAWry MODEL CALIBRATION RESULTS . . . .
FINAL F.FACTORS FOR HOME.BASED OTHER . . . . 4.9
FINALF.FACTORS FOR NON.HOME-BASED TRIPS . . . . . 4-10
FINAL F.FACTORS FOR HOME.BASED WORK TRIPS . . . 4.12
PROPORTION OF TRIPS MADE DURING PEAK PERIODS . . 5-2
AUTO OCCUPAI'{CY RATE BY TIME OF DAY AND PURPOSE . . 5.4
II
T
tIII
IIIIIIIIIIII
3.3
4.1
3-5
3-7
4-6
4.2
4.3
4.4
5.1
5.2
B-iv
IIIIIIIIIIIIIIIIIII
TABLE
5.3
5.4
).)
5.6
5.7
A1
L2
APPENDIX B
LIST OF TABLES (continued)
PAGE-
LOOK-UP SPEED & SERVICE VOLUMES TABLES (Final) . . 5-6
SCREENLINE/CUTUNEANALYSIS... ..5'7
VEHICLE MILES OF TRA\IEL BY FACILITY & AREA TYPE . . . 5-10
PERCENT ROOT MEA}I SQUARE ERROR . . . 5-11
COMPARISON OF PERCENT ROOT MEAN SQUARE ERROR . . 5.12
RESULTS FROM STRATIFICATION PROCESS A4
STRATIFYPROGRAMCODE ....A-12
B-v
FIGURE
1.1
7.2A
1.28
1.3
2.7
'))
2.3
2.4
2.5
2.6
2.7
APPENDIX B
LIST OF FIGURES
PAGE
STUDY AREA LOCATION . . 1.2
ALBEMARLECOT'NTYTRAFFICZONES .......... 1.3
CITY OF CHARLOTTESVILLE TRAFFIC ZONES
TRAFFICDISTRICTBOUNDARIES... ..1-5
TRIP MODELING CHAIN
DWELIINGUNITOCCUPAI'{CYMODEL . ..... .... 2.5
AUTO OWNERSHIP MODEL
TRTPDEFIMTIONS. .2-10
PERSON TRIP PRODUCTION RATES FOR HOMEBASED WORK PURPOSE . . 2-24
HOUSEHOLD PERSON TRIP PRODUCTION RATES FORHOMEBASEDOTHERPURPOSE .,...2.25
HOUSEHOLD PERSON TRIP PRODUCTION RATES FORNON.HOMEBASEDPURPOSE.. .2-26
DISTRICT DEFINTNONS FOR ]RIP ATTRACTION MODEIJ . . . 2.35
LOCATION OFCONTROLLINES & EXTERNALSTATIONS ..... 3-9
HBO GRAVITY MODEL CAIJBRATION RESULTS . . 4.7
ryHB GRAWTY MODEL CALIBRATION RESULTS . . 4-8
HBW GRAVITY MODEL CALTBRATION RESULTS . . .
IIIIIIIIIIIIIIIIIII
2.8
3.1
4.1
4.2
4.3
VI
IIIIIIIIIIIIIItIIII
APPENDIX B
LIST OF FIGI]RES (continued)
FIGURE PAGE
A1 C}IARLOTTESVILLEAUTOOWNERSHIPDISTRIBUTION
L2 CHARLOTTESVIIIE HOUSEHOLD SrzE DISTRIBUTION A-3
A3 HOUSEHOLD SIZE DISTRIBUTION A.9
L4 AUTO OWNERSHIP DISTRIBUTION . . . A.1O
A5 PROCEDURE FOR TFM APPLICATION OF THESTRATIFICATION MODEL . A.11
vrl
IIIItIIIItIIIIIIIIt
APPENDIX B
CHAPTER 1
INTRODUCTION
1.1 oVERVIEW
The development, calibration, ild validation of the travel demand models for the
Charlottesrill" ar"" Transportation Study (CATS) area are described in this report. The
model development effort was part of the Route 29 Corridor Study. Discussion on the
application of the travel demand models is presented in a separate report. The MINUTP
package, a commercial software developed by COMSIS Corporation for urban
transportation analysis, was used to develop an overall travel demand estimation system.
A few special purpose programs used to prepare and analyze data during calibration are
also discussed in the rePort.
12 STIr'DY AREA
The CATS area consists of the City of Charlottesville and part of Albemarle County.
Figure 1.1 shows the location of the study area and its environs. For the travel demand
analyses purpose, the study area was divided irno 2?3 geographical units termed as "Traffic
Analysis Zones" or "TAZs". These zones along with their respective numbers are displayed
in Figures l.2Aand 1.2B. The zonal structure was developed by the Virginia Department
of Transpoftation in consultation with the local agencies, and provided to the consultant.
At several stages of the analyses, geographical units larger than zones were used.
These units are termed as "district" in this report. The study area was split into 13 districts
as shown in Figure 1.3.
1-1
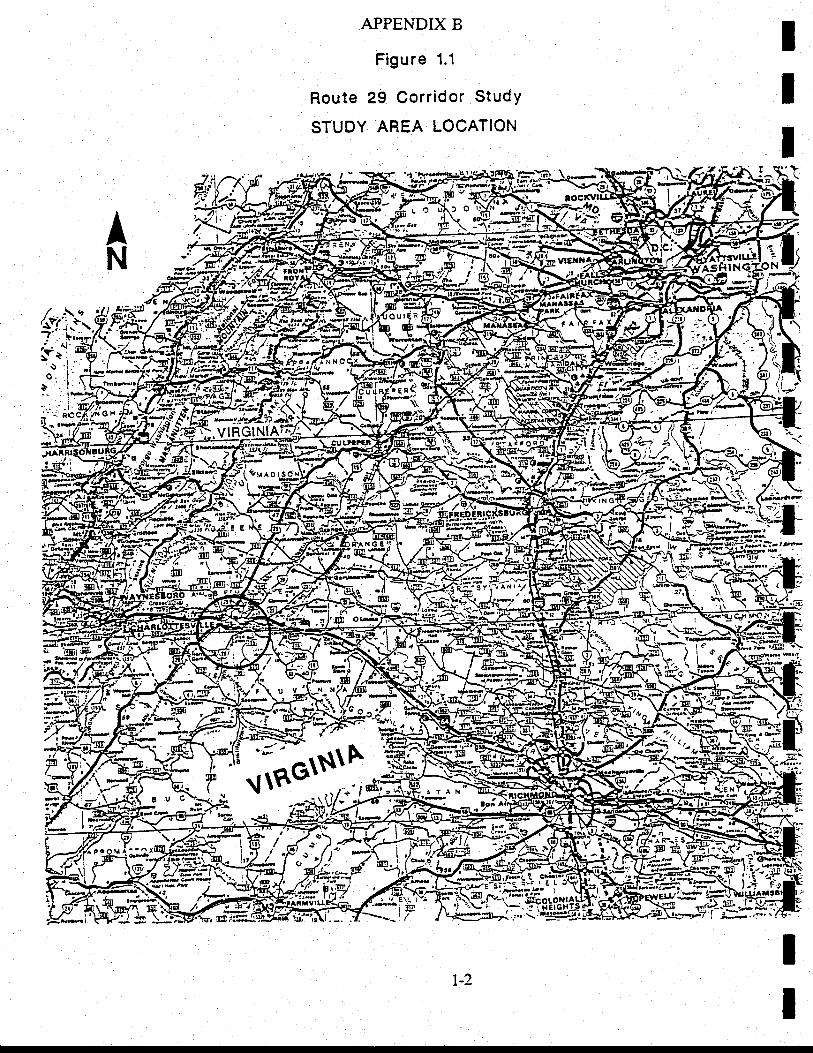
APPENDIX B
Figure 1.1
Route 29 Corridor StudY
STUDY AREA LOCATION
III
AN
rl IIl 4
Ki-q,i:*4fr)r-=^vtRGtNtA
P{l
.r Eq.:
ri&'.tl
:fi-l\.L
ti-?,
II
!iI g.Hl
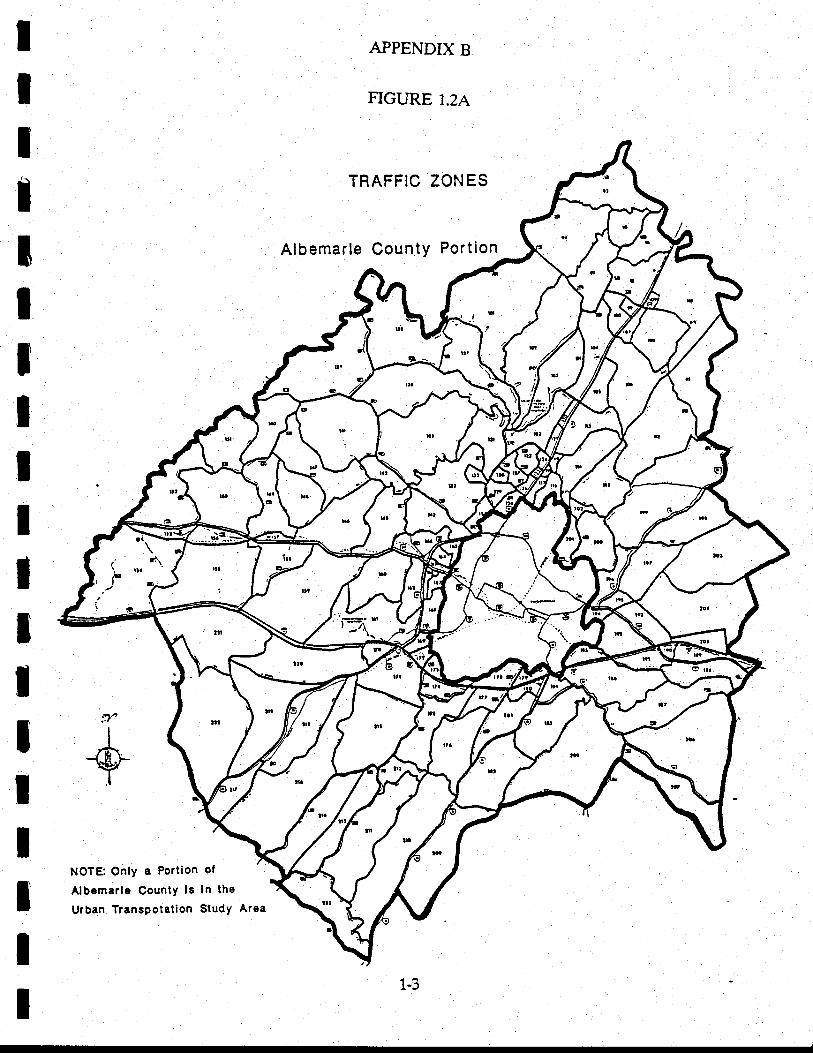
APPENDIX B
FIGURE 1.2A
TRAFFIC ZON ES
Albemarle County Portion
IItIIItIIIIIIIIIIII
:YI
@I
NOTE: Only a Portion of
Atbemarle CountY ls In the
1-3
Urban Transpotation StudY Area
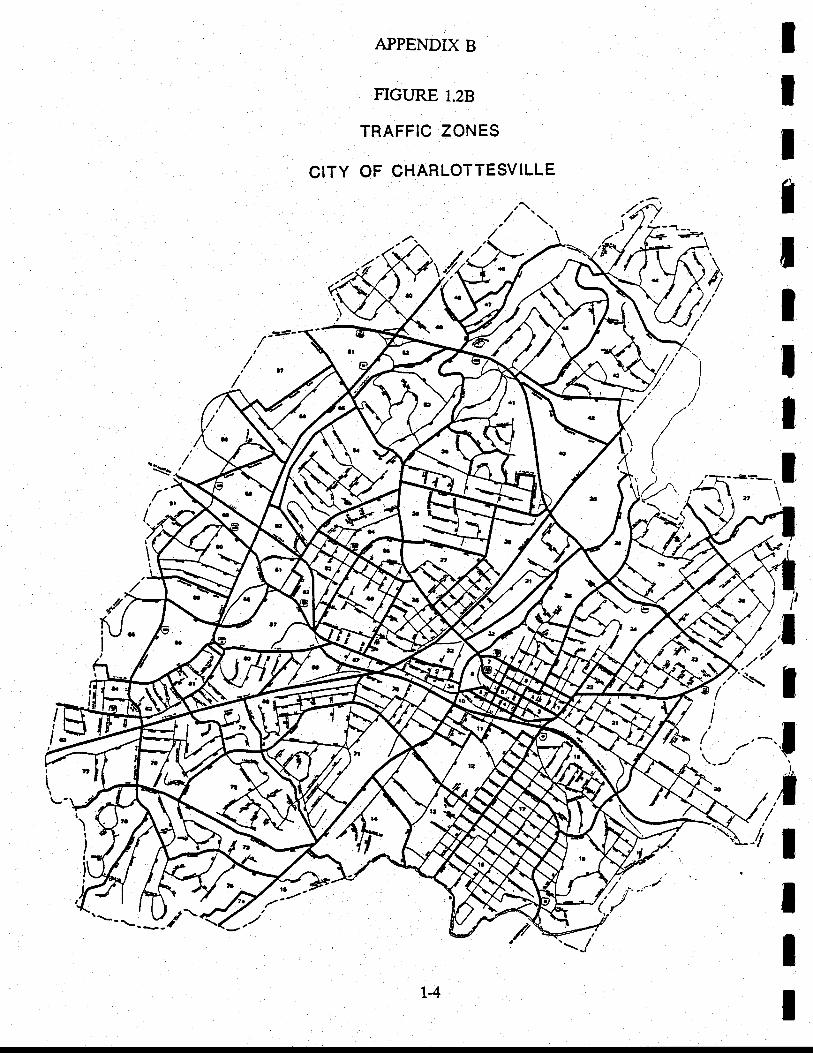
APPENDIX B
FIGURE 1.28
TRAFFIC ZONES
CITY OF CHARLOTTESVILLE
,./ 'r.
IItIIIIJ
,T\
',/i
7r'l'-(. I-,*.f
,,1,,1 ,/u-1, .l
III
,/o'
'\o*,/
,ll
a/tI
I,
I
\rA
'-----J/- t*'/
14
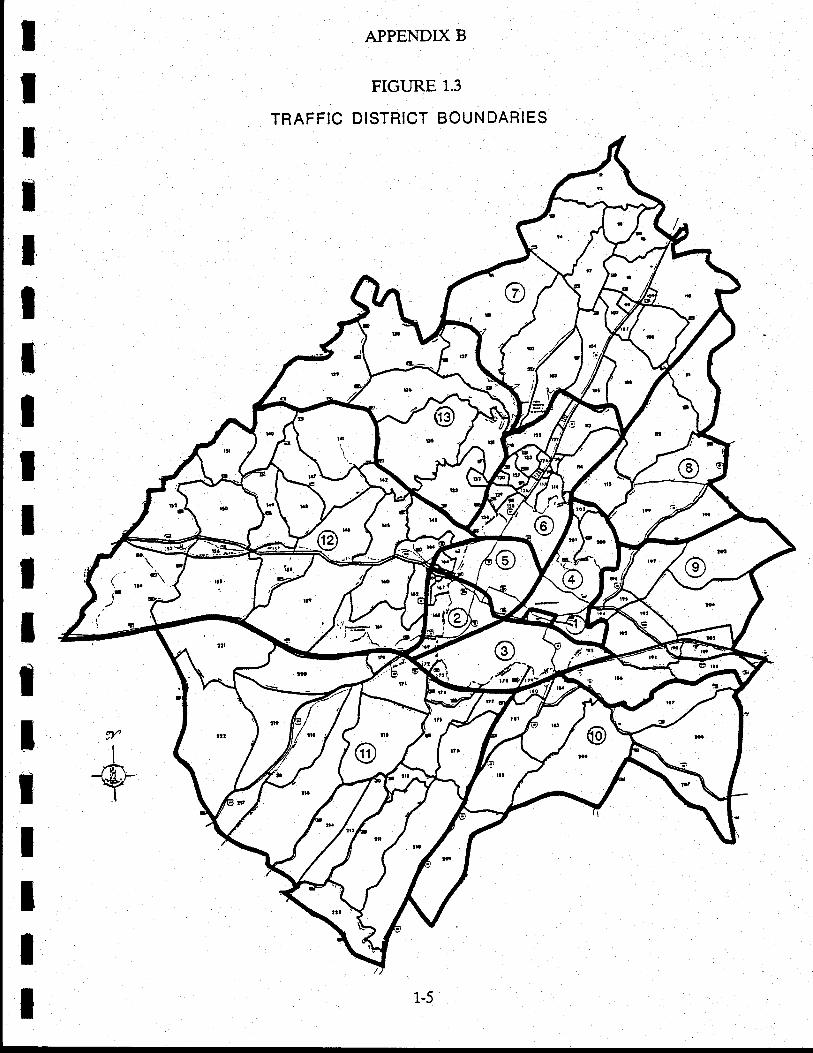
IIIIIIl'
ItIIItIIIIII
APPENDIX B
FIGURE 1.3
TRAFFIC DISTRICT BOUNDARIES
o,f
rA-Y-
1-5
T
IItIIIIIIIIIIttIII
APPENDIX B
**'ffiiron2.I INTR.ODUCTION
The trip generation model is the fust model of a travel demand modeling chain (see
Figure 2.1). This model establishes relationships benreen tle trip origins and destinations
and land use and socio-economic characteristics of the region. The intent of generation
models is to estimate the number of trips coming from or going to a spatial area. The
model developed for the Charlottesville AreaTransportation Study (CATS), estimates travel
generated by the CATS area residents only. It does not estimate travel by non-residents of
the area nor does it estimate truck travel.
Trip generation models developed for the CATS area consist of a set of tripproduction and trip attraction models. The home ends of trips are always defined as trip
productions, whereas non-home ends are considered as attractions. For instance, a trip from
home to work and another from work to returD home, amounts to two productions at the
home end and two attractions at the work end. A non-home based trip is an exception to
this definition. Such trips neither begin nor end at a traveler's home, and hence, their trip
ends are termed as origins and destinations.
A set of cross-classification procedures were developed for estimating trip productions
and attractions. As a cross-classification procedure is not tied to a specific zonal structure,
it was preferred over the regression based approach. Moreover, regression methods tnsume
that all variables have linear relationship with trip generation. Cross-classification
techniques are easy to incorporate non-linear relationships. In addition, these techniques
are extremely flexible in application and efficient in developing logical model structures.
22 DATA BASE FOR MODEL DEVELOPMENT
To develop tbe trip generation models, a telephone home interview survey was
conducred within the study area from April through July 1988. A total of 1,193 households
participated in the survey. Information provided by each household included a record of
all trips made by individual household members during a specified 24-hour weekday period.
In addition these households furnished pertinent data on the socio-economic characteristic
2-1
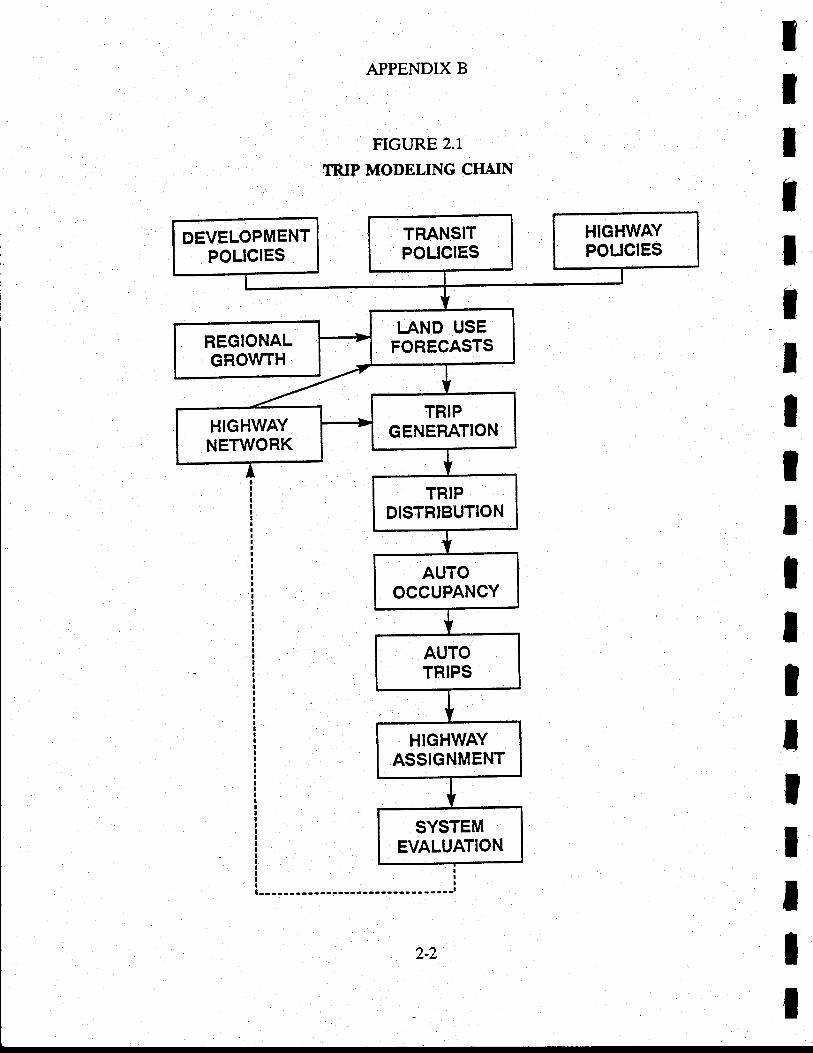
tII1
IItIIIIIIItttII
APPENDIX B
FIGURE 2.1
TR.IP MODELING CHAIN
TAND USEFORECASTS
HIGHWAYNETWORK
I
2
3
T
ItItIIltIIIIIIIII1
APPEI\TDIX B
and destination'of their households.l Tbe trip records covered information on origin
purpose of travel, time of day trip stafted, primary mode of travel, number "-":1.^:
occupants for automobile trips, ild tlpe of land use at the destination. A total of 10'805
trips were recorded.
To analyze trip productions, the survey data was not expanded. The primary intent
of the trip production model was to estimate statistically reliable mean household trip rates
for each household/automobile availability category. Since weighting each cell (i.e., a
particular combination of household size and automobile availability category) individually
would have no effect on the cell meons, expansion of survey records was not necessary. For
the development of trip-attraction models, however, the survey records were expanded to
the base year regional population.
Most of the base year (1986) land use and socio-economic data for each traffic
analysis zone (TAZ) were provided by the planning offices of City of Charlottesville and
Albemarle County.2 The key input variables utilized for the trip generation analyses
included:
Population,
Number of occupied dwelling units,
Number of autos available per occupied dwelling,
Retail and non-retail employment,
Dwelling occupancy rate, and
School enrollment (by zone of attendance).
Number of autos per occupied dwelling unit values for each TAZ was developed by
the consultant based upon automobile registration data provided by the city, 1980 Census
datq and the 1988 household survey.3
Refer to Appendix A, Section III - "Household Survey"
Refer to Appendix c, Table 2.1, "sumnary of 1986-2O00-2010 Land'use Data by Disricf p.2-4.
finle,. ARefer to Ser:tirur6,'Household Stratilication Procedurc'
o
o
o
o
o
o
2-3
APPENDIX B
22.L Estimating Households by Family Size and Automobile AvailabilitJ Categories
To determine total productions of a zone, it was necessary to estimate the number
of households residing in that zone by a given category of socio-economic characteristics.
A method was devised to first estimate the number of households by each discrete category
of a variable (e.g., family size or automobile availability) given the average value for that
variable. The method permitted to estimate number of households by automobile
availability categories (e.g., 0, 1, 2+ autos) given the average number of autos per occupied
dwelting unit (or household) for a TAZ, Similarly, grven the average family size for azone,
the number of households by size categories (e.g., 1, 2, 3, 4+ person househoids) was
estimated. rThe 1980 Census data for the CATA area was utilized in developing the above said
disaggregation rpethod. For each census tract, the percentage of dwelling units falling into
each discrete dwelling unit occupancy level and auto ownership level was plotted against its
respective average values. Following this, smooth curves were fitted to the data as shown
in Figures 2.2 and 2.3. The curves have the property tbat for each point on the abscissa (X-
axis), the sum of the values of the ordinates (Y-a,'ris) for all curves totals 100 percent. Aprolram was written to apply this method.4 Tables 2.1, and2.2 represent the final look-up
tables utilized by this program. Using a matrix balancing technique, this program then
estimated the number of households for each combination of family size and automobile
availability categories using the estimated distribution;of thtflo variables. The procedure
was applied successively for each traffic zorre. $eetioir6, "Household Stratification
Procedure," discusses in detail the above procedure
23 TRrP PRODUCTIONS (PERSON TRrPS)
The estimation of trip productions for the CATS area utilized a set of cross-
classification models which forecasts trip production rates for the following trip purposes:
Atrneq 6Refer to-Seetierr6, Household Stratilicatlon hocedure.
ttIIItItItIItIIIIII
24
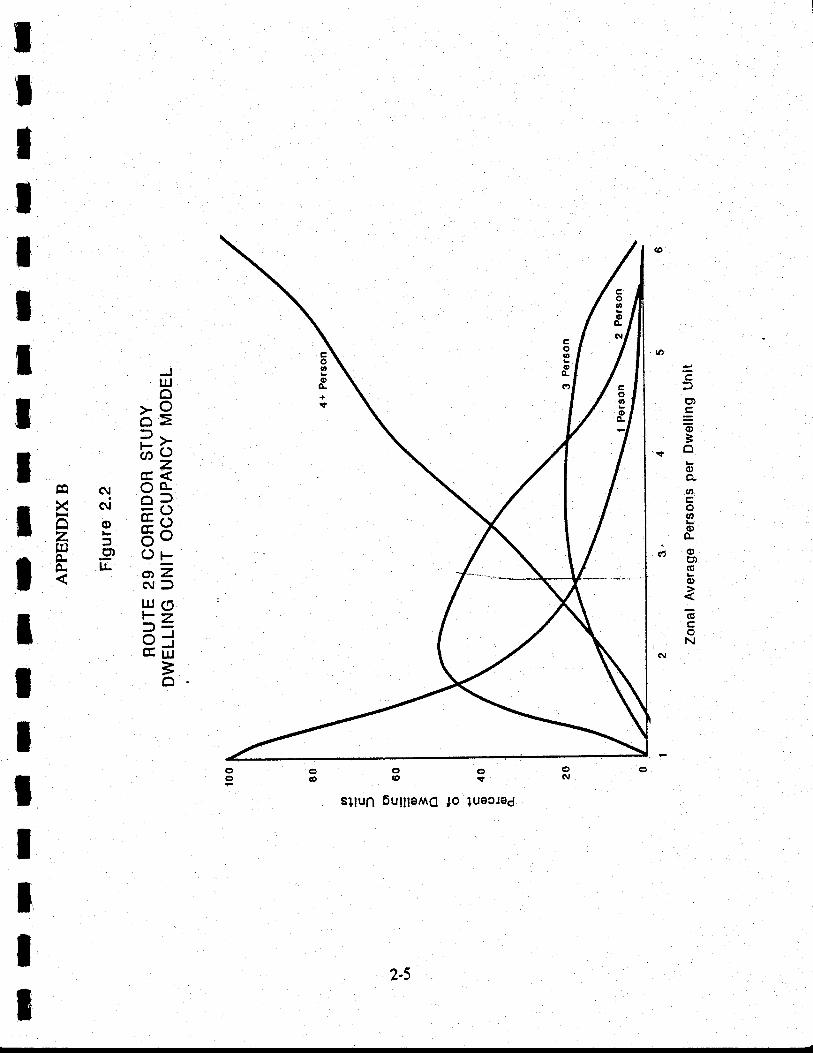
1.)
=C"
=(D3
oe6oQ
oLdi(D' ct)
(g
o
(6
oN
T
IIIItldr agirI 'a2Ir ca N 5{r x c'i 3dI z = E;- x' ct' .,FI = = r=
FJOt== ?illaIItII!
crolgrt
sllun 6ulle,lrt6 lo luecrad
2-5
eoooG
t
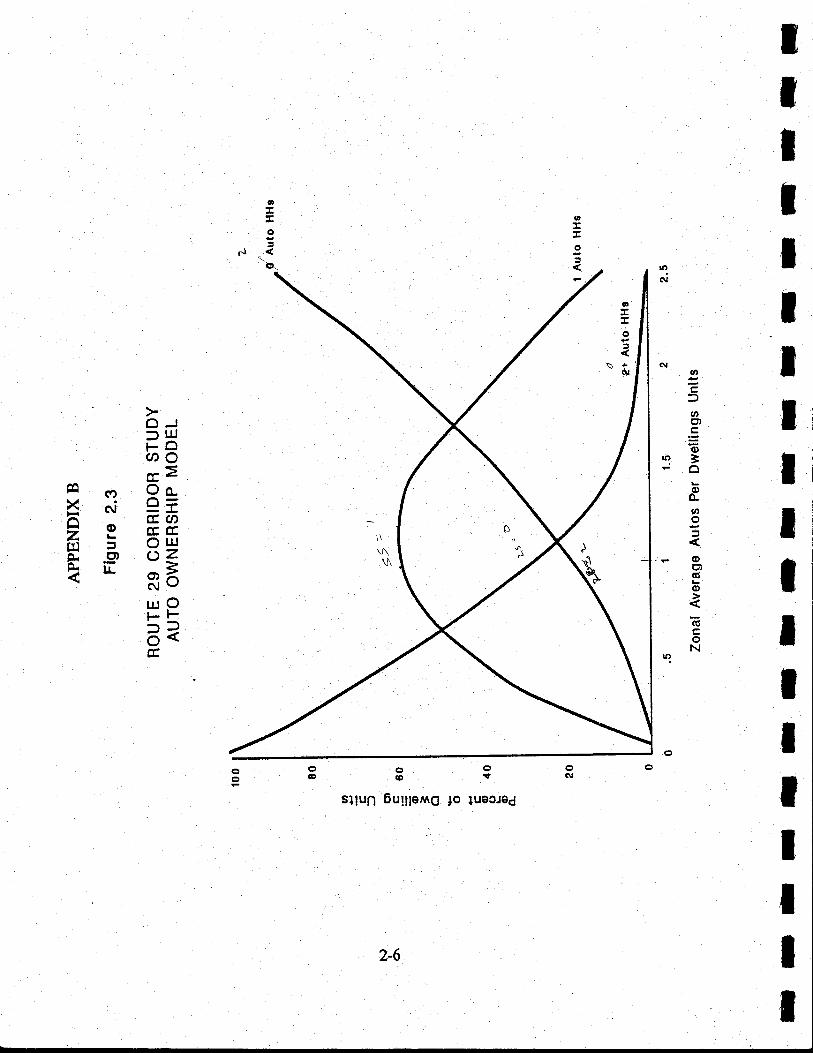
T
tIItIIT
lItIIlttIII
(\lo
ahc')g=ou?3oc)o-cno
F(Do)G'(D
EoN
g:t
6
o
al
o
o
\^.\N
OJ:) t!FOaocc =3 a? Po
FN =64 I cEE
F B, 3Ht E ReutOpl-
e?FE
cte(Dq
sllun 6u11p,rng lo luacJed
2-6
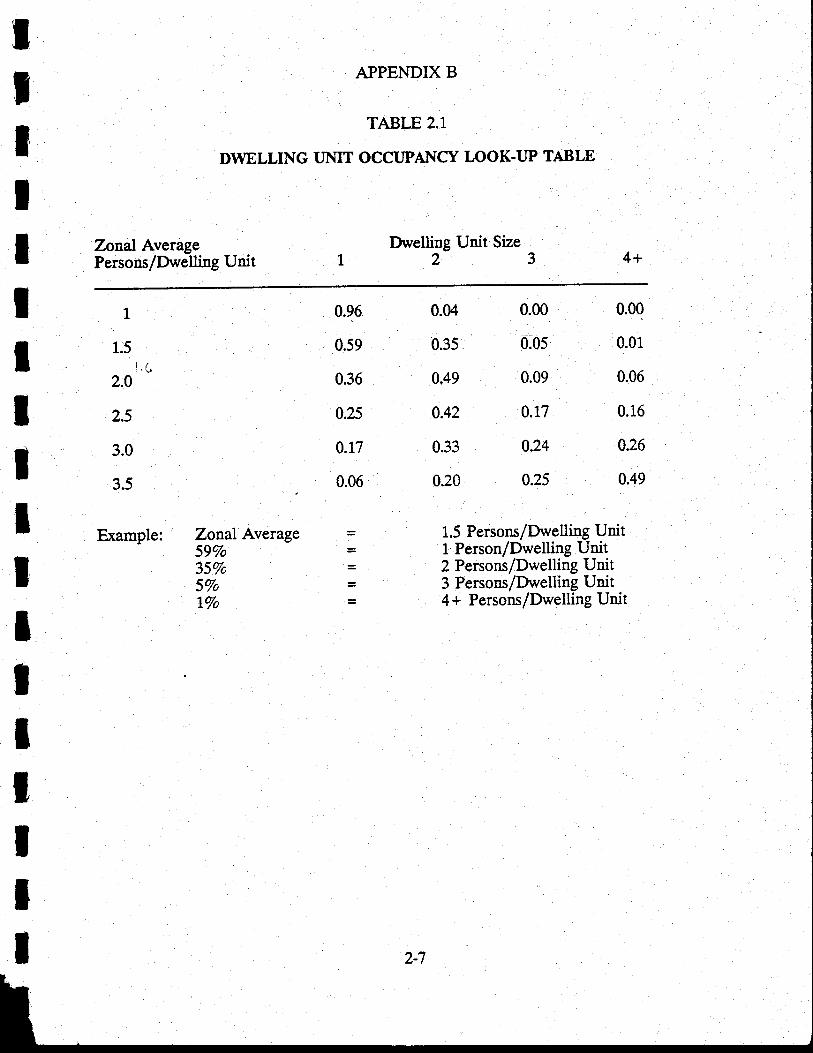
7-onal AveragePersons/Drrelling Unit
APPENDIX B
TABLE 2.1
DWELLING UNIT OCCI]PAT.ICY LOOK.UP TABLE
Drvelling Unit Size23 4+
0.?6
0.59
0.36
0.25
0.t7
0.06
=
=
1
1.q
2.4
2.5
3.0
3.5
T
IItT
IIIIIIIIIttII
0.04 0.00
o.gs 0.0s
0.49 0.09
0.42 0.17
0.33 0.24
0.20 0.25
0.00
0.01
0.06
0.16
0.26
0.49
Example: Zonal Average59Vo35To5VotVo
1.5 Persons/Dwelling Unitl Person/Dwelling Unit2 Persons/Dwelling Unit3 Persons/Dwelling Unit4+ Persons/Dwelling Unit
2-7
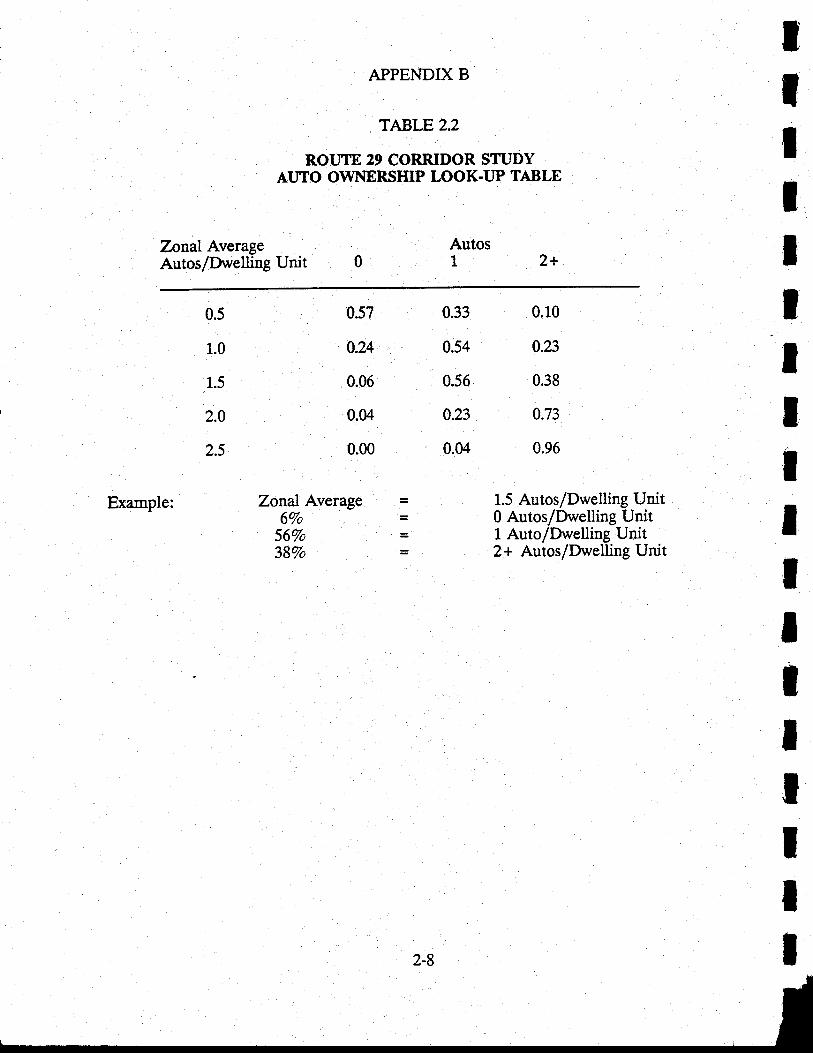
Zonal AverageAutos/Dvslling Unit
APPENDIX B
TABLE 2.2
ROI.IIE 29 CORRIDOR STUDYAIJTO OTilNERSHIP LOOK-UP TABLE
Autos1
ttItIT
tttItIIIttII
2+
0.5
1.0
1.5
2.0
2.5
0.57
0.24
.0.06
0.04
0.00
Zonal Average6Vo
56Vo3\Vo
0.10
0.23
0.38
0.73
0.96
1.5 Autos/Dwelling Unit0 Autos/Dwelling Unit1 Auto/Dwelling Unit2+ Autos/Dwelling Unit
0.33
0.54
0.56
0.23
0.04
Example:
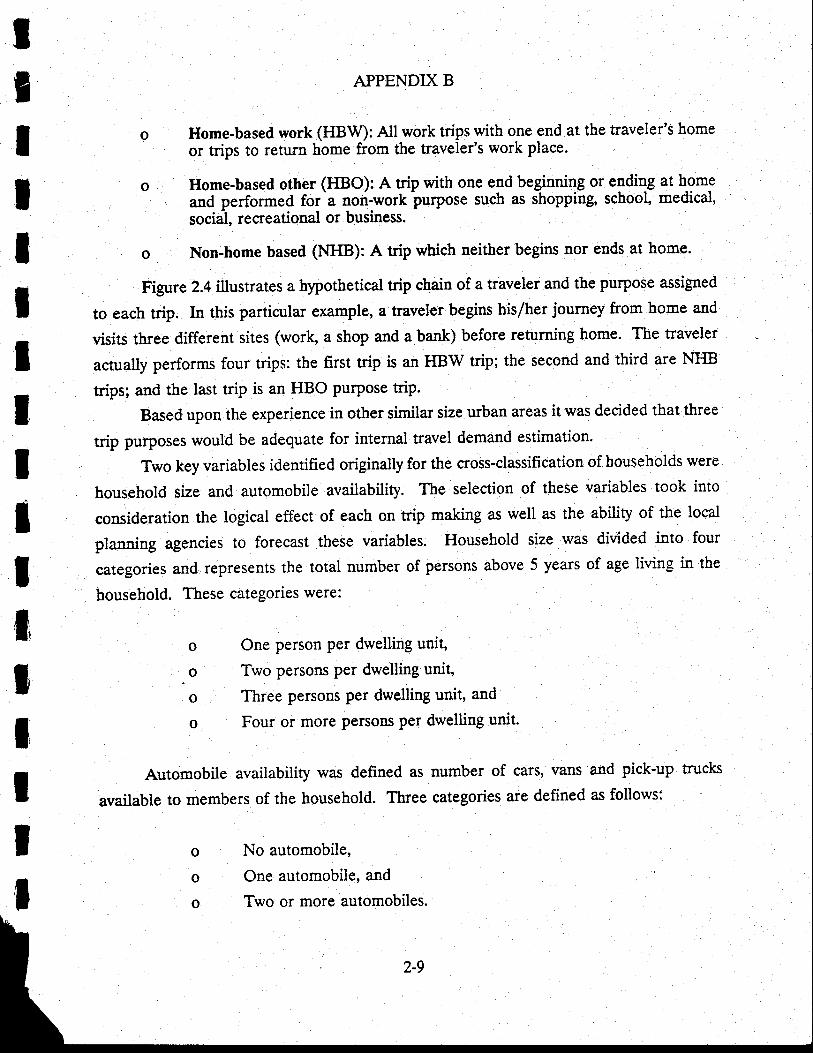
T
T
T
ItIIIIIItT
tIII
APPENDIX B
o Home-based work (HBW): Allrvork trips with one end at the traveler's home
or trips to return home from the traveler's work place.
o Home-based other (I{BO): A trip with one end beginnin€ or egdile at h-gm.e
and performed for'a notr-work purpose such as shopping, school, medical,
social, recreational or business.
o Non-home based (NIIB): A trip which neither begins nor ends at home.
Figure 2.4 illustrates a hypothetical trip chain of a traveler and the purpose assigned
to each trip, In this particular example, a traveler begins his/her journey from home and
visits three different sites (work, a shop and a bank) before returning home. The uaveler
actually performs four trips: the first trip is an HBW trip; the second and third are NIIB
t ipr; and tle last trip is an HBO purpose trip.
Based upon the experience in other similar size urban areas it was decided that three
trip purposes would be adequate for internal travel demand estimation.
Two key variables identified originally for the cross-classification of households were
household size and automobile availability. The selection of these variables took into
consideration the logical effect of each on trip making as well as the ability of the local
planning agencies to forecast these variables. Household size was divided into four
categories and represents the total number of persons above 5 years of age livin-e in the
household. These categories were:
One person per dwelling unit,
Two persons per dwelling unit,
Three persons per dwelling unit, and
Four or more persons per dwelling unit.
Automobile availability was defined as number of cars, vans and pick-up trucls
available to members of the household. Three categories are defined as follows:
o No automobile,
o One automobile, and
o Two or more automobiles.
o
o
o
2-9
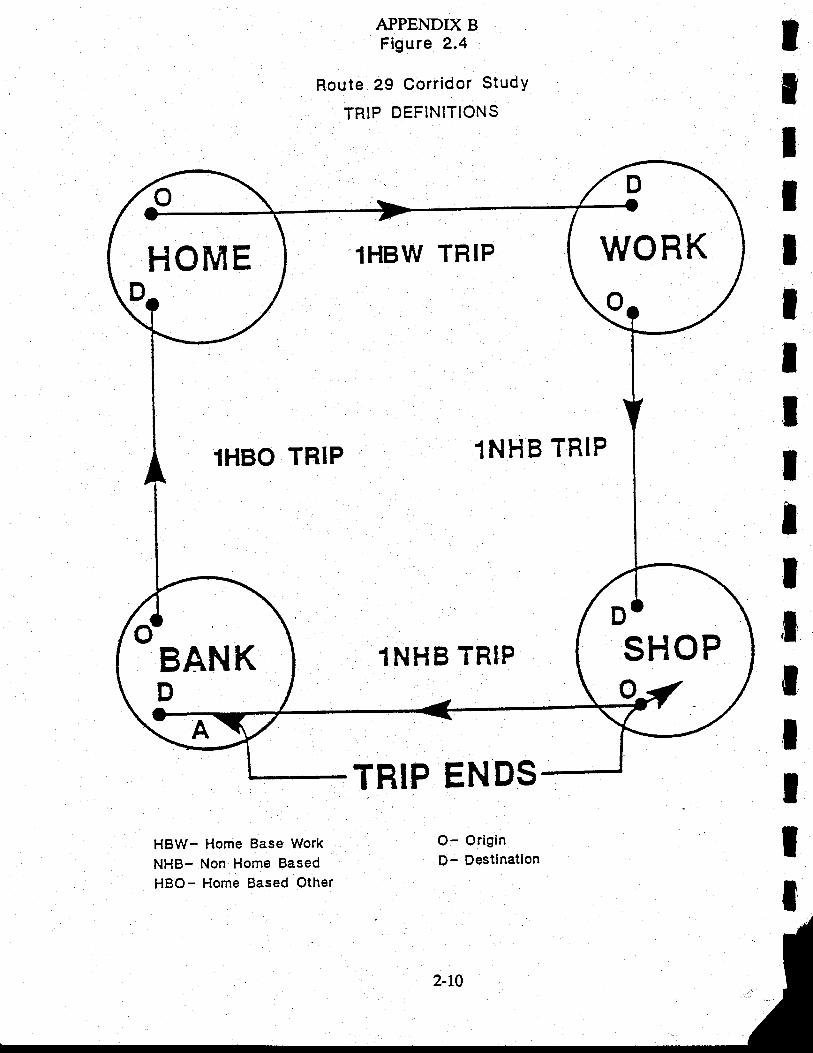
HBW- Home Base Work
NHB- Non Home Based
HBO- Home Based Other
APPENDX BFigure 2.4
Route 29 Corridor StudY
TRIP DEFINITIONS
TRIP ENDS
O- OriginD- Destination
WORKHOME 1HBW TRIP
1HBO TRIP 1NHB TRIP
1NH B TRIP SHOPBANKD
I
T
tIttIIIIItIIttII
APPENDIX B
2.4 CALIBRATING THE TRIP PRODUCTION MODELS
The calibration of trip production models was followed in two steps. tt_ttt
preliminary analyses were undertaken to investigate the two variables initially identified as
siguificantly influsncing household trip rates: household size and number of automobiles
available to a household. Subsequently, analyses were performed to further investigate the
influences of variables associated with household location, nature of affiliation to the
University of Virginia (UVA), aad type of dwelling unit'
2.4:,1 Preliminar.v Analvses
To examine whether the household size and automobile availability do actually cause
variation in the trip production rates of households within the CATS area, analyses of
variance (ANOVA) tests were conducted. These analyses also examined the significance
of interaction effects of these two variables on the trip production rates. An attempt was
made to answer the question: Does the trip production rate vary for every strata of
bousehold size and automobile availability, or is it possible to combine certain strata? It
was imperative to investigate the selection of stratification variables since they shape the
basic form of the trip production models.
ANOVA tesrs were performed using household trip production rate as the dependent
variable for each of the three trip purposes. The intent of the analyses was to test three
hypotheses: Does household size relate to household trip rates? Does automobile
availability affect household trip rates? Is there an interaction benreen the effects of
household size and automobile availability?
Tables 2.3 through 2.5 present the results of the ANOVA runs. The total observed
variation in the trip rate is subdivided into four components: the sum of squares due to
household size (AGGHH), automobile availability (AGGVEH), their interaction, and the
residual. The sums of squares attributable to each of the components are displayed in the
second column. The DF represents the degrees of freedonr' and the mean squares are
obtained by dividing each sum of squares by its degrees of freedom. The F'values are ratios
of the mean squares of each source of variation to the mean square for the residual. The
observed significance level is the probability of obtaining F-statistics at least as large as the
one calculated when mean household trip rates for each household category are equal.
2-11
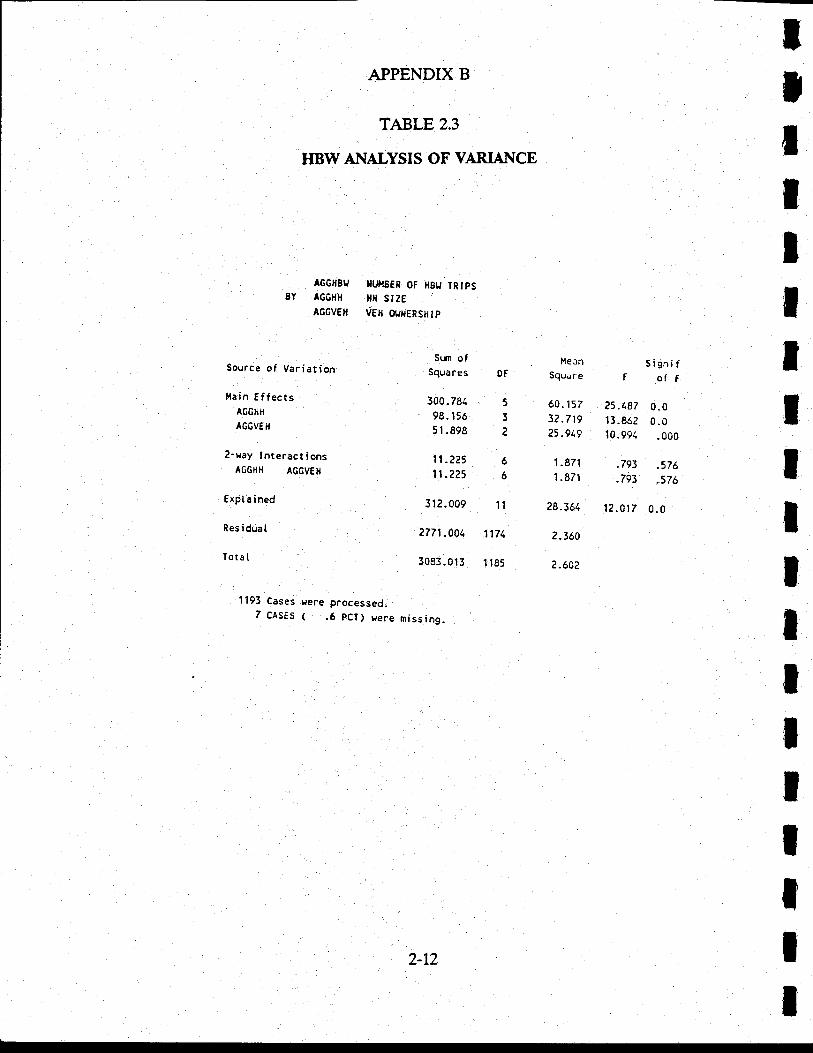
APPENDIX B
TABLE 2.3
TIBW ANALYSIS OF VARIANCE
AGGIIEU
8Y AGG}IH
AGGVE}I
IIU}I8ER OF }t8tJ TRIPSIIH SIZE
VEH OIJ}IERSHIP
ItIIItIIIIIIt
Source of Variation
l{ain EffectsAGGhH
AG6VEH
2-ray tnteractionsA66HH AGGVEH
Expt a i ned
Res i dua I
Totat
Sun ofSquares
300. 781
98.1565 I .898
11.2?S
1 1 .225
312.009
2771.001
3083 . 01 3
Hean
Square F
60.157 ?5.1873?.719 13.86225.94,9 t0.991
1.871 .793'1.871 .793
28.36.1 12.017
2.360
?.602
0f
q
3
a
6
6
t1
1171
1 185
Signifolt
0.00.0
.000
.576(71
0.0
tl93 Cases rere processed.7 CASES ( .6 pCT) rere missing.
IIII
2-12
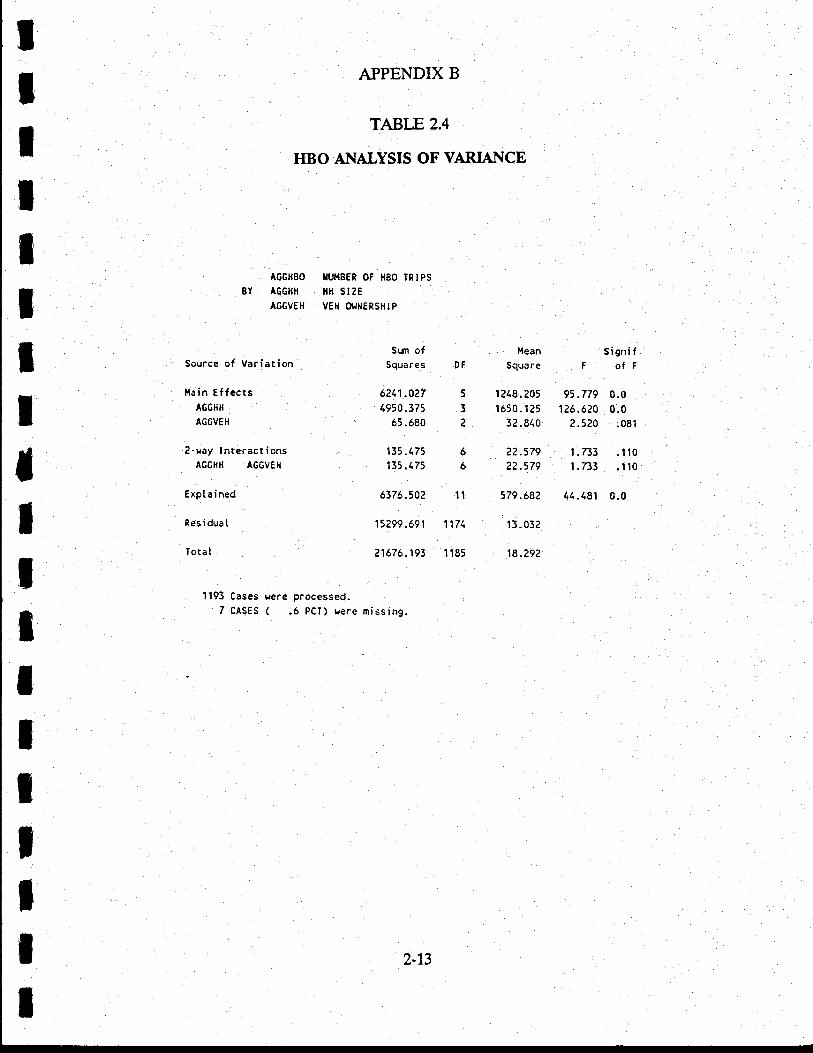
IIIIIt
I;
It
AGCHEO
8Y AGCHh
A6GVEH
APPENDIX B
TABT-8,2.4
HBO AT.IALYSIS OF VARIANCE
}TIJHEER OF H8O TRIPS
HH SIZE
VEH OUIIERSHIP
Source of Variation
f{ain EffectsA6GHH
A6GVEH
2-ray lnteractionsAGGII}I AGGVE}I
Expt a i ned
Res idua I
Tota t
Sun ofSquares
6211.0?71950.375
65.680
135.175135.475
6376.502
1 5299.69 t
21676.193
ileanSqua r e
1 218.2051650.125
32 .810
22.57922.579
579.682
13.032
18.292
Signi fF oTF
95.77s 0.0't 26. 620 0.0
2.520 .08,|
1.733 .110t.rJ3 .110
11.181 0.0
DF
5
3
2
66
1l
1171
1 185
1193 Cases rere processed.7 CASES ( .6 PCI) rere missing.
IItIIt
2-13
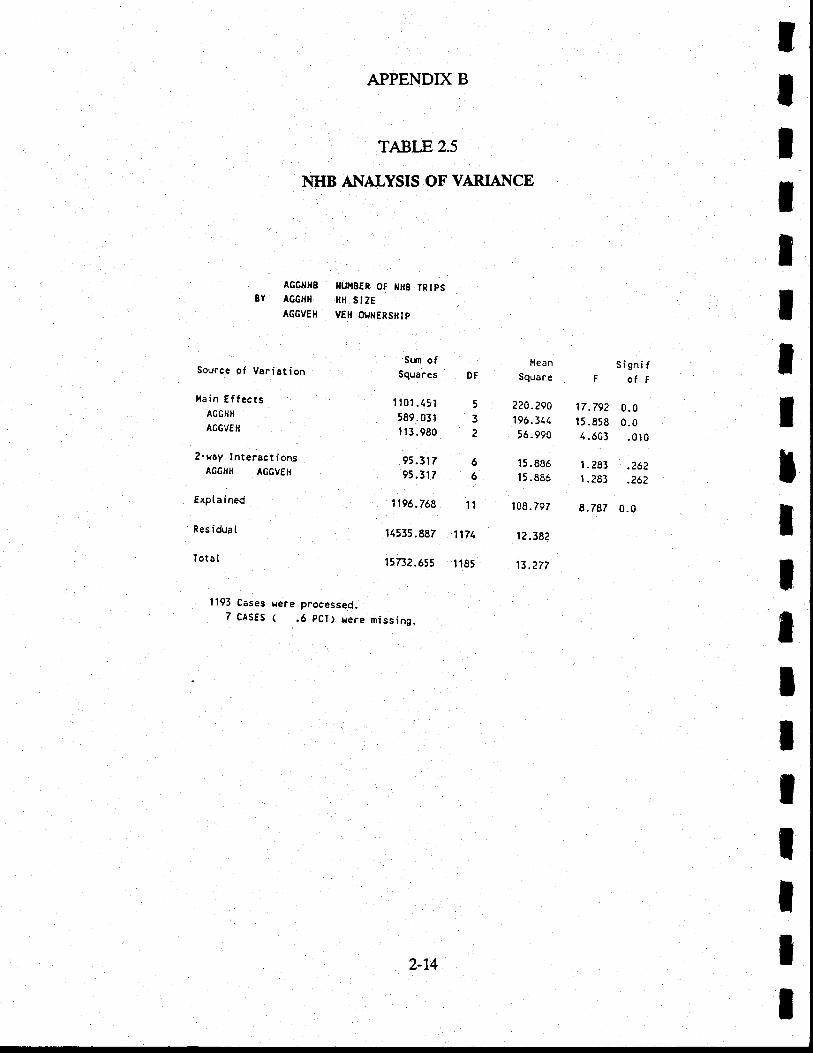
APPENDIX B
TABLE 2.5
NHB AI.iA,LYSIS OF VARIANCE
Signifof f
0.00.0
.010
.26?
.262
0.0
IIIII
IIIIII
Source of Variation
Itain €ffectsA6GHH
AGGVEII
2-ray lnteractionsAG6HH AGGVEH
Expt a i ned
Res idua t
Iota I
llu{BER Ot xfl8 TRTPS
Hfi SIZE
VEN OIJNERSHIP
Sun ofSquares DF
1 101.151 5
589.031 3Ir3.980 2
95.317 695.317 6
1196.768 11
11535.887 1171
15732.655 t185
Hean
Square F
220.290 17.792196.311 15.85856.990 1.603
15.885 1.28315.886 1.?83
108.797 E.787
12.38?
13.277
AGGIIHS
8Y AGGHI{
AGGVE}I
1193 Cases rere processed.7 CASES ( .6 pCT) rere missing.
It
ttII
2-74
IIIIIIT
IIIIIIIIIIIt
APPENDIX B
For exarnple, looking at the observed significance level of 0.0 for household size variable
in Table 2.3, the hypothesis that all household size groups have same mean trip rate is
rejected.
The results clearly indicated that the household size and automobile availability
sufficiently erplain the variation in the trip production rates (including non-motorized trips)
as seen from the large F-values and low significance levels. For home-based other (I{BO)
and non-home based (l.fHB) pu{pose trips, the effect of household size was much stronger
than the automobile availability.
The interaction effect was found to be low compared to the main effects for all three
purposes, and statistically insignificant particularly in the case of HBW trips. However,
recognizing that some interrelationship does exist between the number of automobiles
available and the size of the household, it was decided to account for some interaction while
developing the model structure.
Multiple Classification Analyses (MCA) output displaying the grand mean trip rate
and deviations from the grand meatr for each variable (household size and automobile
availability) are shown in Table 2.6 through 2.8. As expected, for each purpose trip rates
per household increased with the size of the household and the availability of number of
automobiles. Since the deviations in trip rates for each strata of size and automobile
availability from the grand mean trip production rate were distinct and displayed a
consistent behavior, the need for combining strata was not necessary.
Table 2.9 presents a summary of regional average trip production rates for each
combinatiol of sample households classified by size and automobile availabiiity. The
number of household records in each category is indicated in bracket below the average trip
rate figures.
2,42 Investigation of Other Variables
To investigate the influence of other variables which might explain further the
variation in the trip production rates among households of similar size and automobile
availability, the following variables were identified:
2-15
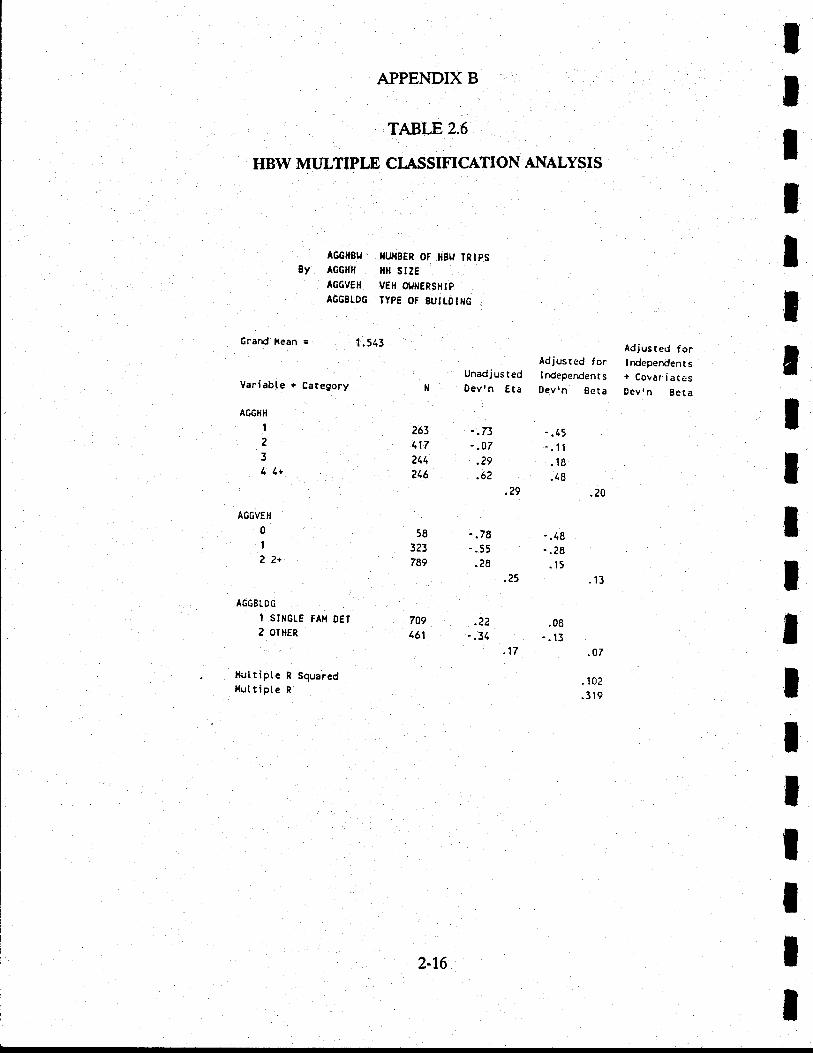
APPENDIX B . .
TABLE 2.6
HBW MTJLTIPLE CI"ASSIFICATION ANALYSIS
tlIIlIa
IIIIIIIItI
.17
?63
117
211
216
5E
123
789
709 .22161 -.31
AGGHBU
8y lGGHll
AGGVEH
AG6BLDG
Iuf{8€R 0F lt8u IRtPsHH SIZE
VEII OJIIERSHIP
IYPE OF 8UI[DIIIG
Grard I,tean 1.513
Variabte + Category
AC6HH
t2
3
11+
AGGVEH
0
t
22+
AGGELDG
t SI}I6tE FAI.I DET
2 OTHER
l{uttiple R Squaredlluttipte R
Unadj us t ed
Dev'n €ta
-.73-.07
.at
.ot.29
- .7E- .55
.28.25
Adjusted fort ndependent s
Devrn Eeta
_ .15-.tl. to.18
.?0
-.18' .28.15
.13
.08-. t3
.07
. 102
.3 r9
Adjusted fortrdependents+ Covafiatesoevrn Eeta
II
2-16
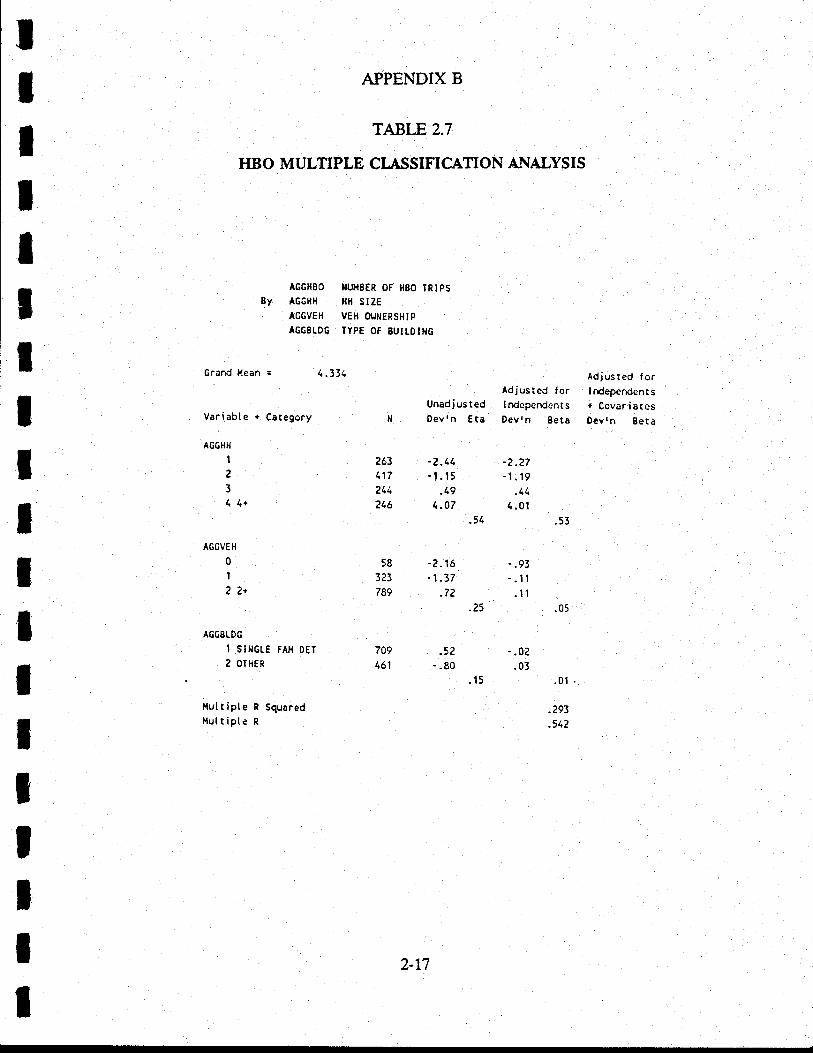
IItIIIIIttItI
APPENDIX B
TABLE 2.7
HBO MULTIPLE CIASSIFICATION ANALYSIS
AGGHBO IIUI{8ER OF H8O IRTPS8y AccHH HH SIZE
AGGVEH VEH OUNERSHIP
AGGSLDG TYPE OF EUILOtI{G
Grarrj Hean = 4.331Adjusred fo.I ndepcndent s
Devrn Seta
-2.27-1.19
.111.01
.53
-.93-.ll
.tl
.05
Adjusted forlndeperdents+ CovariatesDevrn getaVariabte + Category
ACGHH
1
2
5
11+
AGGV€H
0
Il1+
A6GETDG
1 SIIGLE fAH DET
2 OTHER
ltuttipte R SquaredHuttipte R
N
263117
211216
UnadjustedDevrn Eta
-2.1t,-t.15
.191.07
.51
-2.16-1.37
.7?.25
58
323
789
.02
.03
709 .52461 -.80
.15 .01 .
.293
.512
IIIIl
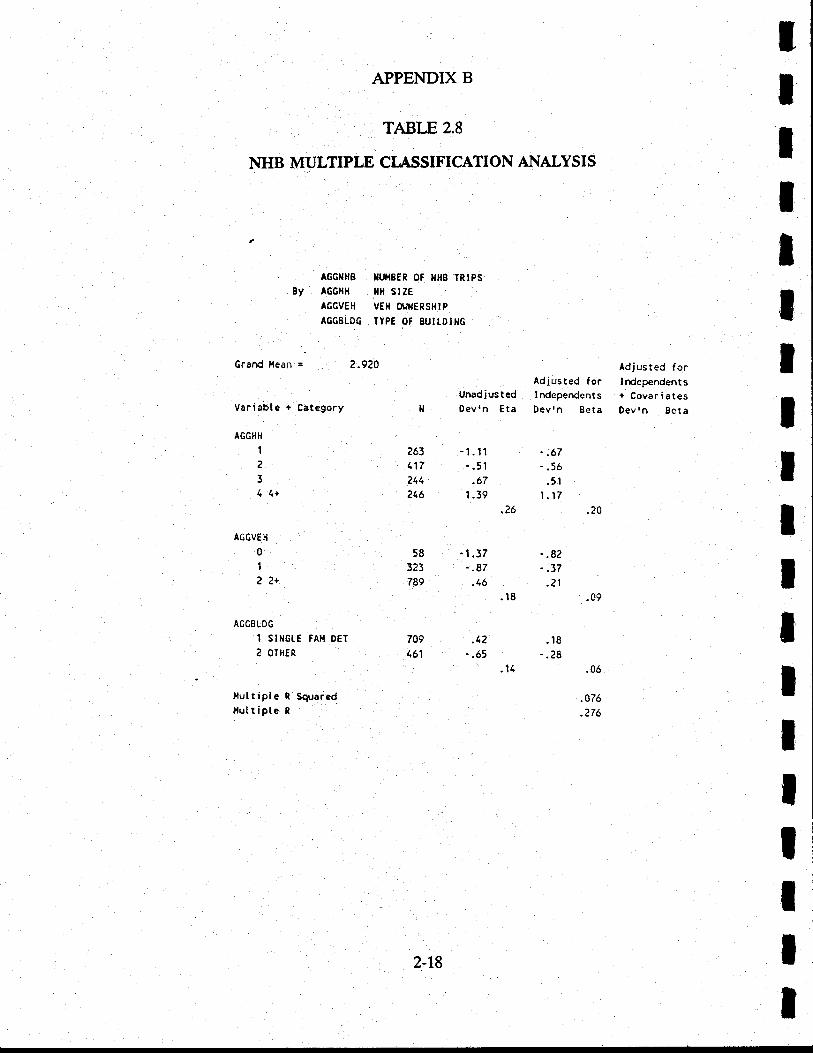
APPENDIX B
TABLE 2.8
NHB MULTIPLE CI"ASSTFICATION ANALYSIS
lItI
ttIIII
AGG}IHB
8y TGGHH
A6GVEH
AGGELDG
}IUTIEER OF IIHE TRIPSlllt s t ze
VEH OIINERSHtP
IIPE OF EUILDI116 T
IIIIIII
.t8
.28
crand Hean = 2.920
Variable + Category
AGGHH
1
z
3
11+
AGGVE H
n
1
22+
AGGBLDG
I SINGtf FA'.I DET
2 OTHER
Hultipte R Squaredlluttipte R
N
263
117
211216
UnadjustedDevrn Cta
-1.11- .51.67
1.39.26
-1.37'.97
.16.18
Adjusted forIndcpendentsDevrn Eeta
- .67- (1
.511.17
.zv
-.82- .37
.21.09
.06
.476
.276
Adjusted forI ndependent s+ CovariatesDevrn Beta
58
323
789
709 ,12161 -.65
.11
2-r8
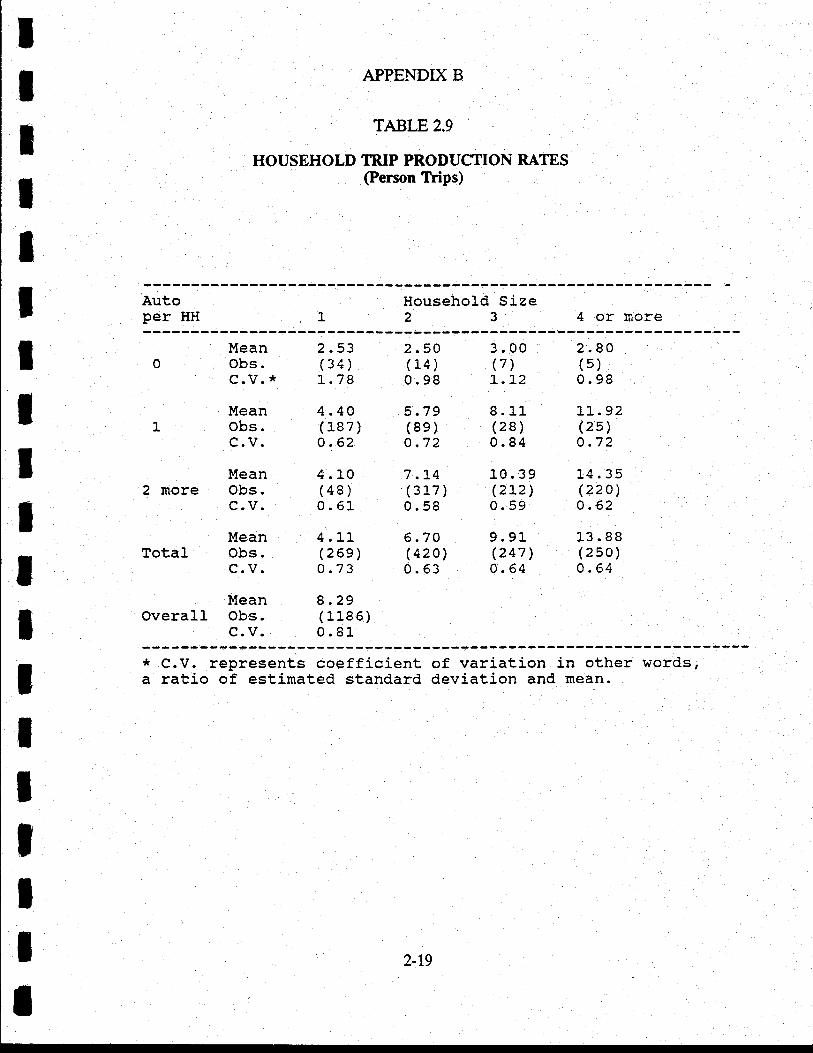
IIIII
APPENDIX B
TABLE 2.9
HOUSEHOLD TRIP PRODUCTION RATES(Person Trips)
l Autoper HH
Household Size23 4 or more
L
tIIItI
2 more
TotaI
Overall
MeanObs.c.v. *
MeanObs.c.v.
MeanObs./.r t7
MeanObs.c. v.
UeanObs.c. v.
2 .53(34)t.7 8
4 .4A( r.87 )o .62
4. L0(48)0.6L
4. Lt(26e)0.73
8.29( r.r_8 6 )0.81
2.50(14)0.98
5.79(8e)o.72
7 .t4(3r.7)0. 58
6.7A(420)0.63
3.00(7)L.L2
8.1,1(28 )0.84
1_0. 39(212)0. 59
9.91(247 )0.64
2.80(s)0.98
Ll",92(25)o.72
14.35(22o)o.62
L3.88(250)o .64
T
IIIII
*a
C.V. represents coefficientratio of estimated standard
of variation in other words,deviation and mean.
2-19
APPENDIX B
Residential location (city and county);
Type of dwelling unit (single family and other); and
NatUre of UVA effiliation (student, staff, faculty, and non-UVA affiliatedhouseholds).
The residential locationvariables were expected to incorporate the effects of tbe close
proximity of socio-economic activities in the city, the differences in life styles of city and
rural/suburban residents, and to some extent income differences between city and county
households on the household trip production rates. Similarly, some type of dwelling unit
distinction was expected to reflect income and densiry related effects.
The University of Virginia (UVA), located within the city boundary, is considered a
major trip generator. Moreover, it was originally assumed that the UvA-linked households
including faculty, staff, and students, might exhibit different trip making behavior compared
with the rest of the study area residents. To test this assumption, overall data were spiit into
subgroups representing each of the above categories, and subsequently tested to determine
the extent to which such a disaggregation improves the overall performance of the trip
production models. It was well recognized in advance that the implementation of any model
structure with the UVA linked household categories will be difficult for the purpose of
forecasting if the future distribution of such households is unknown'
To attain a reliable estimate of average trip rates for each cell of a particular cross-
classification scheme, it was necessary to have a minimum number of observations in each
cell. Experience suggests that a minimum of fifty entries is most desirable. In view of tttis,
the stratification of selected variables was kept to a minimum. However, it was noticed tlat
under each cross-classification scheme a few cells were always found either emptv or baving
fewer than fifty entries. Since such cells did not represent those household categories which
are predominant within the study are4 their trip rate estimates were treated as less reliable
for application.
In order to determine which of the above variables could best explain trip production
rates for each trip pulpose, after the effects of household size and automobile availability
had been removed, seven different cross-classification schemes were developed and
individually evaluated. The trip production models were applied to household survey
o
o
ItIIIIIIT
IIItItIII2-20
IIIIIIIIIIIItIIItII
APPENDIX B
records and the regression statistics were run benveen the estimated and observ'ed trip rates
for each household record.
Seven models considered for the statistical test were as follows:
Model 1: Cross-classification scheme representing the three categories ofautomobile availability (0, 1, and 2+), and four categories of household size(7,2,3, and 4+ person households).
Model 2: Cross-classification in terms of automobile availability, householdsize, and household location (city and county).
Model3: Cross-classification of households by size, automobile availability, andtype of dwelling unit (single family and other).
Model 4: Cross-classification of non-UVA affiliated households by size, and
automobile availability, and the remaining households by the nature ofaffiliation (faculty, staff, and student) and household size.
Model 5: Cross-classification of households having fewer than two automobilesby size and nunrber of automobiles (i.e.,0 and 1), and those with two and moreautomobi1esbysizeandlocation(cityandcounty).
Model 6: Cross-classification of households with less than two automobiles bysize and number of automobiles (0 and 1), and those having two ol more.automobiles by size and type of dwelling unit (single family and other).
Model 7: Cross-classification of households without UVA student(s) and having
less than two automobiles available to them by size and the number ofavailable automobiles, and of similar households with more than twoautomobiles by size and residential location; UVA student householdsclassified by size only.
Table 2.10 dispiays the results of the regression statistics for each of the seven cross-
classification model structures. The values of the correlation coefficient (R) shown
represent the summary index describing the strength of association between the observed
and estimated trip rates for the household survey records. Due to the higher value of the
,'R" for each model compared to Model 1, it was clear that with the addition of variables
other than household size and automobile availability the variation in trip production rates
is better explained.
2-21
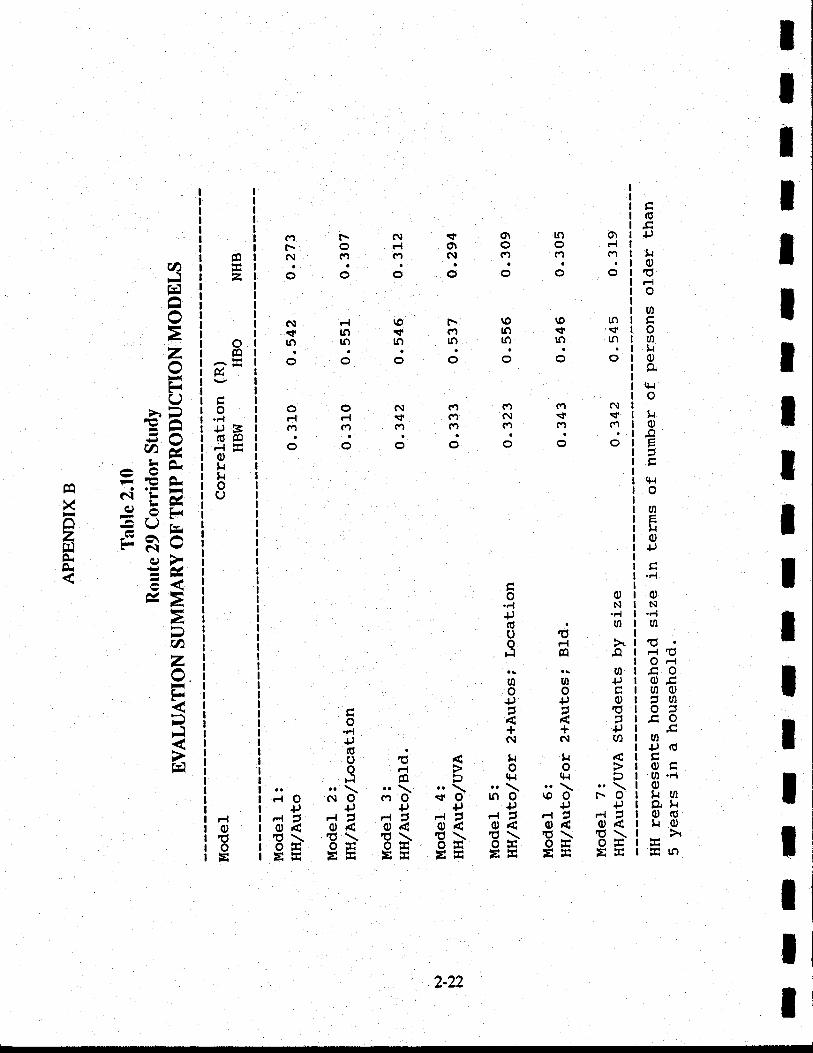
IIIIIIIIT
IIIIItIItI
tro4J
!oooU)
oo!o
q'4
ot{o,aFtr
outF!o+J
c
oN
ul
E.ri 'lCO-{too.culo,a.coto+J(dcoc'U'-lokug.ltO.dho
rit\N{Q\IOo1i{bdo\ooF{a\mcec{rtmcn
aaa'ooooooo
oilF{19f-9lt9n<. tn <f f'l A -f sfloton|r)lo|nlO
aaaa'ooooooo
ooN('|cartN; d \t' c/t cil -f st'a.) c/) c) (n c') (vl c/)
aaaa"ooooooo
troo.r{ N+J ''{(d.oOEOFIFl lo .a
.Ul888+'+J(l)cr,1.g6d.,{+++J+)NNq,IU0o6;FIOb$.rq{P.. ..\ ..\ ..\ "\ "\ "\JO Nd c.rd t$O- rnq \oO l-O"n '-1J {l a4 2 +, +r
db Ai Ai AA 42 '1 , dz'oiE .oa oA oa al4 od al<'6\ 6\ 1ri 6{ 9> e\ !\5r:- 6;tr 6!q 0!E aF o;q aFEE EE =E =E
Er t!q EE
2-n.
ra
z
oF&
o+JBt6CO
otttloU
orl,oE
U)F:frllFIAv
zv-ElU>.D'c;
-F-A'=vv)eE,LA
Fic.: ?.i'FtYL-H ;,qFl-l
- Y r-,*--ft E:RCF o>- ;at
A/F=aE-azv.ts(E-
'F
rv'l-
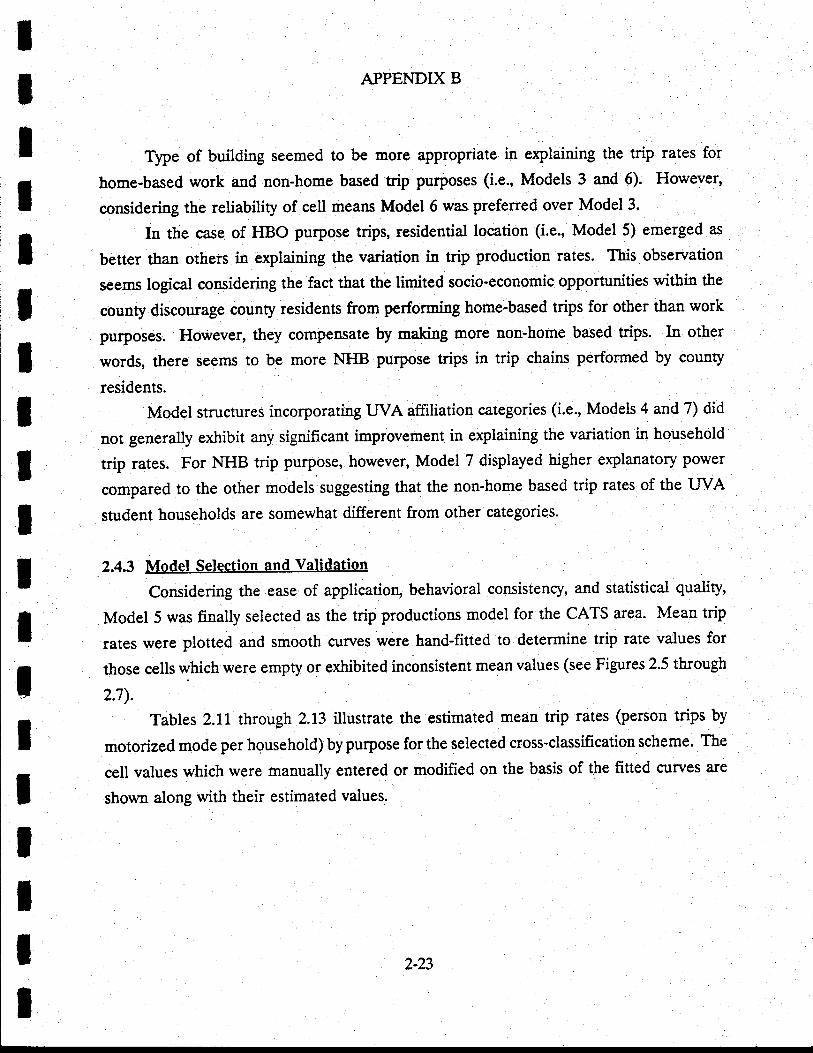
IIItItIItItItItIItI
APPENDIX B
Ty?e of building seemed to be more appropriate in explaining the trip rates for
home-based work and non-home based trip purposes (i.e., Models 3 and 6). However,
corsidering the reliability of cell means Model 6 was preferred over Model 3.
In the case of HBO purpose trips, residentiat location (i.e., Model 5) emerged as
better than others in explaining the variation in trip production rates. This observation
seems logical considering the fact that the limited socio-economic opportunities within the
county discourage county residents from performing home-based trips for other than work
puqposes. However, they compensate by making more uon-home based trips. In other
words, there seems to be more NHB purpose trips in trip chains performed by county
residents.
Model structures incorporating UVA affiliation categories (i.e., Models 4 and 7) did
nor generally exhibit any significant improvement in explaining the variation in household
trip rates. For NHB trip purpose, however, Model 7 displayed higher explanatory power
compared to the other models suggesting that the non-home based trip rates of the UVA
student households are somewhat different from other categorigs.
2.4.3 Model Selection and Validation
Considering the ease of application, behavioral consistenry, and statistical quality,
Model 5 was finally selected as the trip productions model for the CATS area. Mean trip
rates were plotted and smooth curves were hand-fitted to determine trip rate values for
those cells which were empty or exhibited inconsistent mean values (see Figures 2.5 through
2.7).
Tables 2.1L through2.73 illustrate the estimated mean trip rates (person trips by
motorized mode per household) by pu{pose for the selected cross-classification scheme. The
cell values which were manually entered or modified on the basis of the fitted cunes are
shown along with their estimated values.
2-23
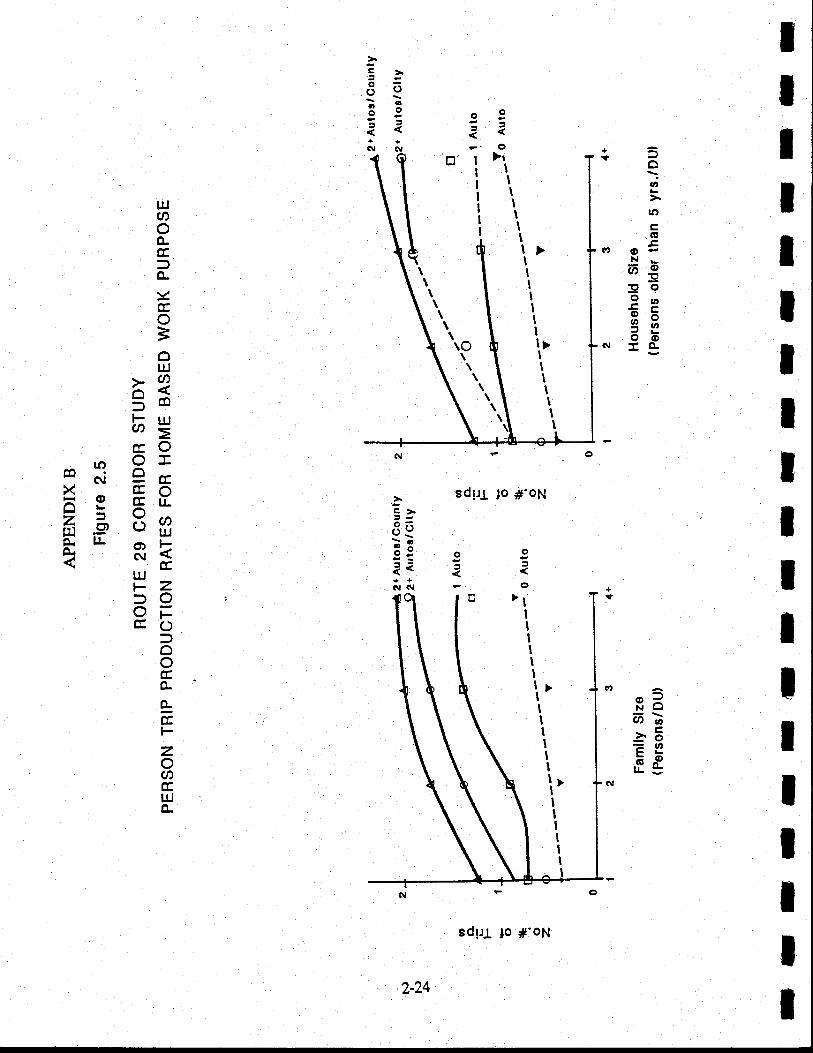
IIIItIIIT
tIIIIIIItI
o
Ei3eiB(\lG,
aJ o{,B
toca5
(.'o-Nb6€9o93a-o=9666
Gl -O-
Io
)rIIIIItI
trJao0-
fo-
sd1r1 1o ;'o1'.g
IIIIl>tIIItII
o
c
\\
\\\
c>=-.\t=oi<.\l (\|.
)<(Eo=oUJ
5cohurwr=EoT
rr.\ u? X -N=8.X e EPFI=-)
a ^d'6ffiO. lJ-at-ryKaEllJFZ:)ootrcEo
-too(Eo-o-cfFzooE,tlJo-
c'
R36;->57.hFbF^@
lrb
IIIIItItpItIIIIItII
\l
2-24
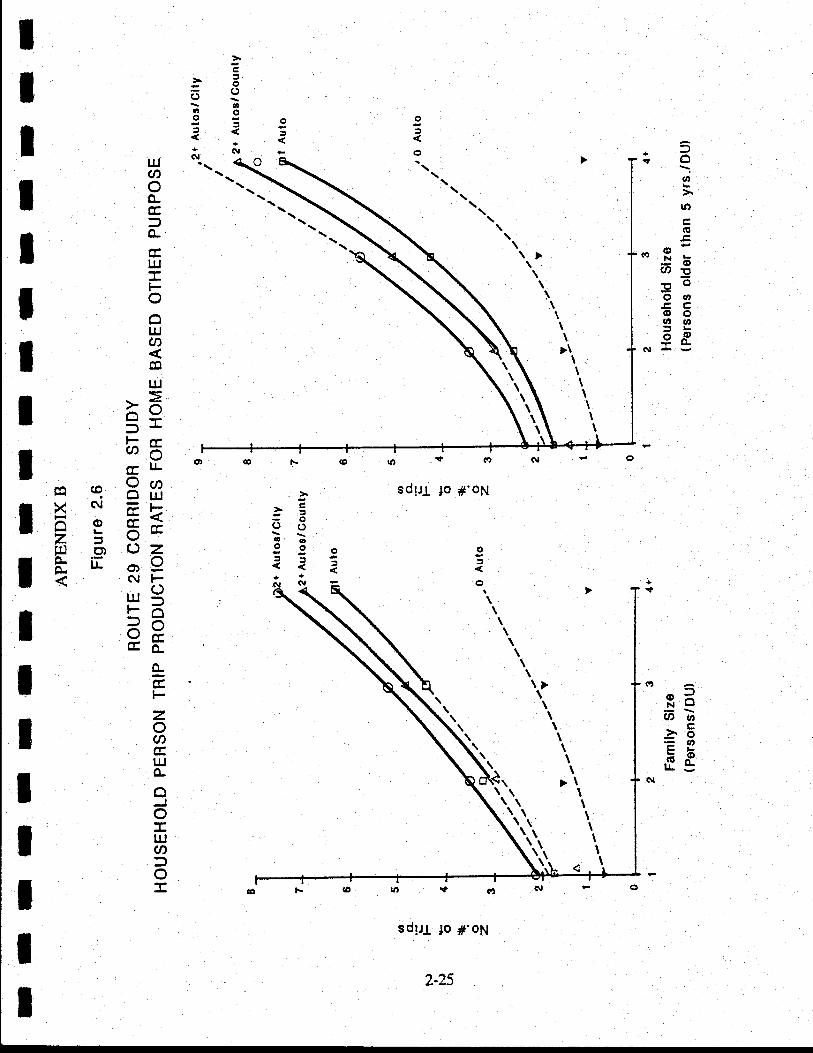
6
rttr(o
(D'-' J: b(IlElJoO,nooah .n:b
o
o
coo6o
+GI
oo.o
+
coooo
(\l
=(Joo
ol
I
I
ruJ
I8r*=lo-Iffi
-FIo!oUJ.2
IM-ulI >6I $-
F ?r'r ".) =I E-FO q EffiI E : stI = = ==fr 3 3=I fr ir -PI tuq
I ==I 9ctrG,d
-grFr6-AI
illo-r3lfirgrfrIT
l\\\\>\
\\\\\
\l\rtt\\\\
"?Ut .tt
->E=u,6^o
N
\\\\\\\\
>\I\\\
ta\rt
t.,\ \
scl1r1 3o ;l'o1.1
2-25
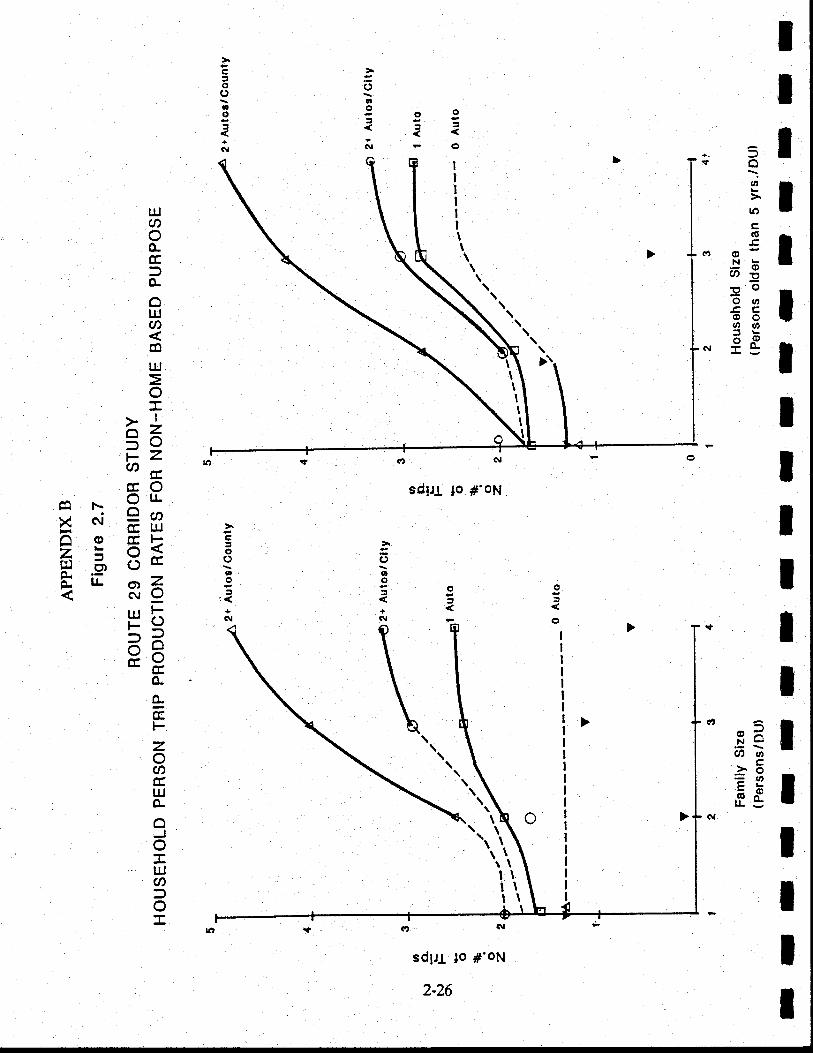
tt
+ 3l<ro \.;te
' $i IeE Iott:bN is I
o|'o^ ova-=
+NO
cooao
(\|
\\
t!aoo-
o-
otrjU)
dl
tIIIII
#* tse t
ItII
\\\,II.l
\\\\rQ
l-. I\.\'lltlt\
o?
o6o
(\a
co
6o
1<
6|
tl.l
o.r>1z.
=oFzaccccOl-\ llFa N X-.uaA
X N EilJo o cchet--1 <F.E,ii aE r! aZ
ruhl- \''.--t -rJ A
96EEo-o-?ab
FzoocclrJ0-
ooula:lo
sdl.r lo #'oN
2-26
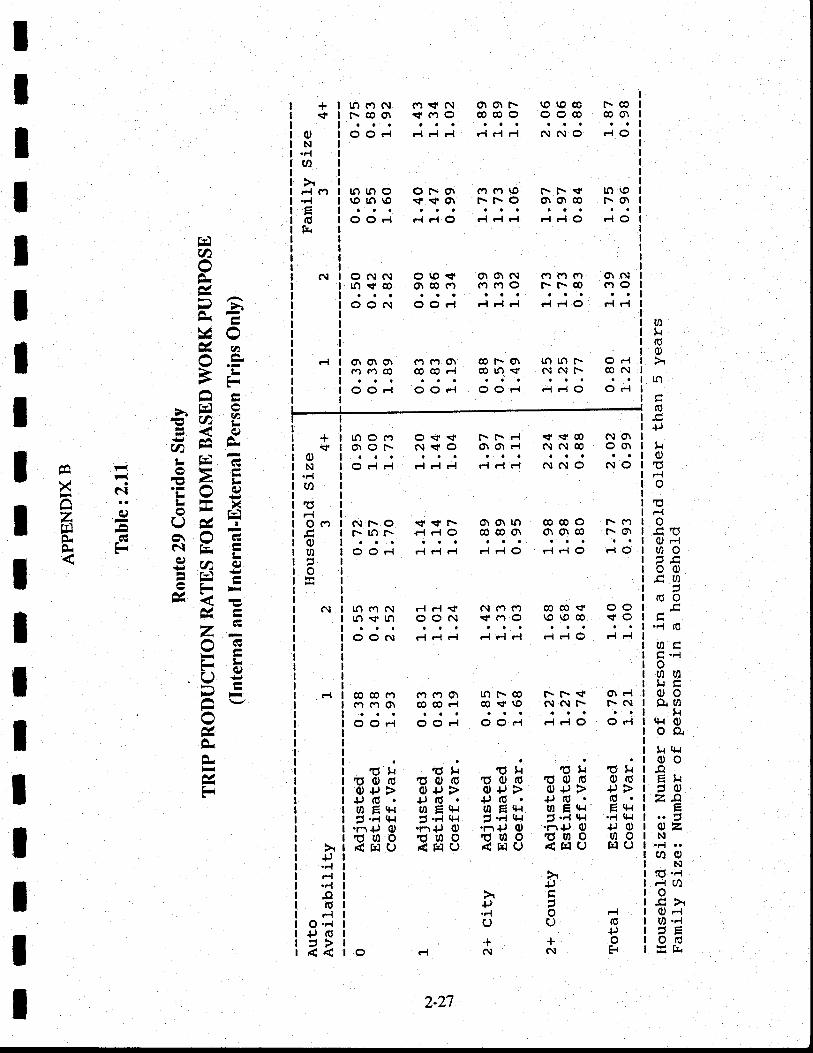
alr(60)
lrotrF{o15FloOFIuooo,cu
.rl (O
ocou t/lt{Coog{U
!q-{ ooo.lrsloonEll5c)z9
E.. 5azN
(/joNg'F{
duo.c>O-{Ul'"1JEo(d
tl1t6iT t.cI I l+J
1-)1
u.}(')N c.f<rN o\o\f- |orOCO r.@r-coo rrcno @coo ooco c0o
aaaaaataeaaaaaOC)F{ FtF{Fl Fldt-'l C\lC!O rlO
ltltf)O c)f-o\ f'lc/)'o l.l.S n\o\olftro sf srqr r-r-o oo\co l.01aaaaaaaa
C)OFt FIF{O FIFIF{ F{FlO FIO
oc\lN o\osl. oo\oil (v)c.r(v| 01 oillO-lco o\@(n fnrtO F. l-@ fnO
iaaaaaaaOON ()Oc'l FIF{ii F{Fl() .{F{
Oto\o\ m(no\ cOf-6\ llltOt' et{(Yrmco @@r{ cotnrf nlNf- @f\
OC)Ft O()r.| OOt{ F{e{O OF{
n()c,) ()<fsl f-f-r{ sf sf Q No\(t\OC- C{<f O o\€hFI NNO Oot
laaaaaaaaaOF{F{ F{F{e{ dFlF{ c\loitO NO
(\tF-O st $t\ ooto coc0o t\c/)f*lnF FtF{O €O0oo\ o\Cllc0 r\Or
aaaaaa
OOF{ F{Flr{ r{F{O rlFlO F{O
nmN r{d<f Ncnfl C0@<r OOrosf tn ooo(l sf cno \0\oco sf O
aaaaOOf! Fl F{F{ F{F{ri FiF{O FtFi
COCO0t (vlc)g\ tnl-@ Ff-sf OFI(nc/)Ot @COFI 0osf \O N(\F t\N
aaaaaaoaaaOOr{ OOF{ OOF{ r{FlO OF+
rrd 'di od lrd t{o0(! 1'oG dod o0l^(6 od0+r> O+.t> o+t> o+r> *r>+J(d. +Jt!. *Jd' $q' |s 'in E.+{ in E${ o Eq-r Ul E(|{ Eq-{5 .t ,+r
=' .ii +l 5.-l tH 5'-l r+{ '-l (f{
.h+rO .h{JO .r-\9O 'r'1 +rE POco6 oi/rO 6uo qq-q ooiHO irqcl <HU <Flo Elu
F{IU+JoF
+JtroO
+(\
+J.do-t-oit
+sr
oN
.Fla
r{ c'l
E|Ulr
+if
oN
(n
O r-t
o
+J
Fi
!IUFl
O'.r+J rUa>44
frl(a
P==-)i-=gc*v)Ag
=FAtra, .cr)
?,
=-=c-a,-rhFEsi
= ss: trx "i E6 ii- i Ex2 g ,q ^. ErI € Y=+o. _c€ c\E = FiE E..)AP
F7-\-
=-tr--&k'ox=z:AG=trbE
i
=eFIF-CI'iF
IIIIIIIIIIIIIIIIIII
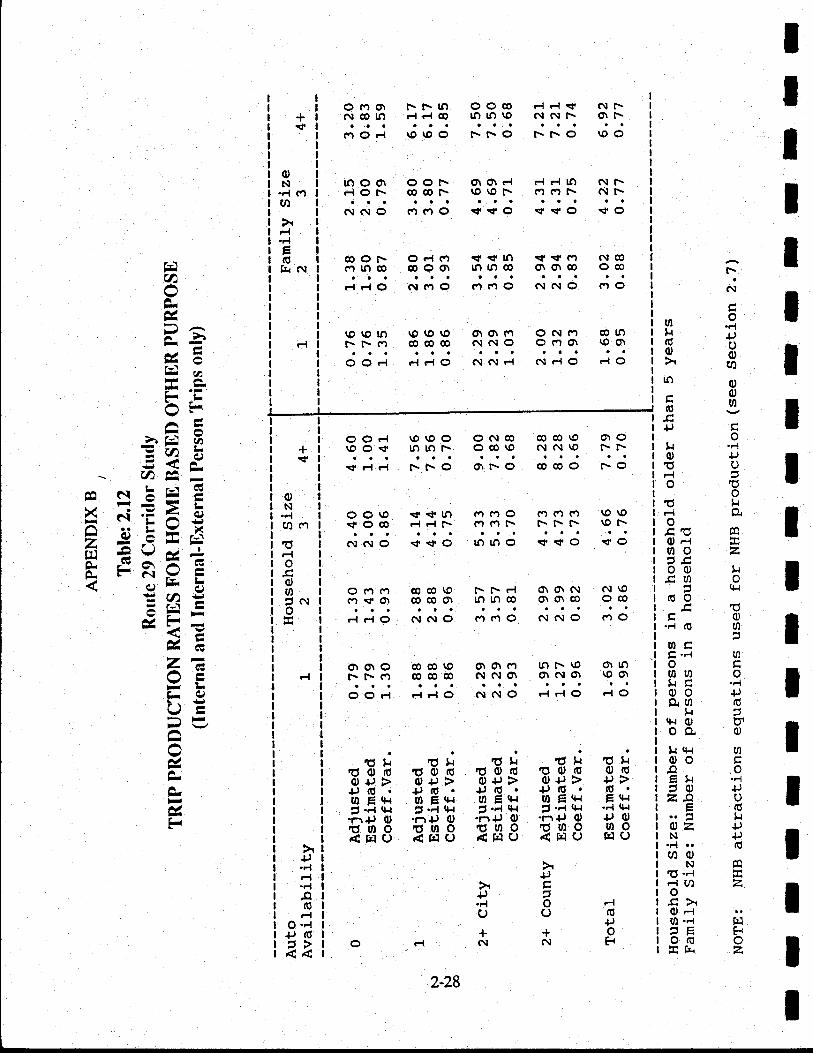
IItIIIIIIIT
IIIIIItI
t-N
tro+)oo(')
ooo
tro
ootrA.
zl|
(+,{
m
oco
.F.{
+J
xo
co+Jot{+J+J
z
f.1
oz
ut{(0o
ro
tr(o
"c+J
t{olJoooO-loo
(60c.r{ (O
oqtr'.{oUI UIhCoo9iU!${oOO.L$roo!E l.l5o)z9
E..=ozN
t.r:oN
E'FlF{ Cno"c>O-lul .-lAEo(!
()cnCi\ Ff-n. OOc0 FlFl-f Nf\N@lf) Flr-1 00 U)to€ c{Nt\ o\f'
aaaaaa(')oFt to\oo l.t-o F-t o \oo
nOo\ OOF. Oro\d F{F{lO Nf'FlOf- (D@F rO\gF. c'l(nt\ Nt\
aaaaaaaaaaN$l() (ft(r}O tfq() <rsrO gO
COOf- OFl(n sf<fn sf<fm [email protected]@ ooot loto@ o\o\o oco
aaaaaaaaaaF{;{O (\|mO mCrO Ct|oilO cnO
\o\olrr \o\O\O 01o\f'r oN(n @lf)Ff.c.r cOc0O c{c{O O(no\ \oo\
ataaaaaaaaaaOOF{ F{;{O Oil (rlF{ C{F{O F{O
OOFI \O\OO OAl@ @co\O o\O\00<r |o[nF ()co\o NN\0 Fr'
aaaastF{F{ r.r-() o\f-o ocoo r'o
()Otro <l\f |rr (n(nO c)(n(Y) \O\gsl.()CO FIF{f- mc)t\ F-f'F rOf'
raaaaac\lc\lO sfsfO lft!OO sfsfO <fO
Oe')(.) @cO\o f'F Fl Oro\oil N\o(nsfo cocoo\ nlnco oo.tco o@F{F{() NN() (')c')O oilNO c)O
ooo coo\o o.|o1c.t lnn g oltol-r-{') co@6 Nnlo\ otc{o too\
aaa'
O()d l:.lFlO C\lf\tO F{r{O F{O
oN.d (.tut
E16fqN
+sf
oN
(nm15F{ooa5 Crto
r-\-av'r-.lH
)-A*1E?&5r-\F(h
-A*.=F -t-A trrv.,A=HAeH I
=2 ^a);;r-.vt__
T:f =E2 giEA
l1'l Jrl \-/ * :
E gRF F
E 3Ec|-1-sl:&a-r-AFv:'--'-
C)
UEF\ f--\J-vH-A-AFltd*FF
od td od ql Eltdoiu 66o ood 6q-(U oG61f5 d1.'> 0+r> o+.r> +'>*1.t iU-. .1r.U-. $ Q . +t q.. 1g
inE,n inEs hEtt.t oE!.l Ey'li -l ${ i .li q{ 5 ..1 r{ 5'-l (r{ "{ q'{.F-+l O -n+l O .h+J E 'nli E +r q)
'b-ir6 'bin6 ouo oQ-Q u-oifi6 irriO '{r'lo <Ho Flu
(d+)o-H
+Jtr2oU
+c!
+J
U
+GI
*J.r{
.Fl.q(6
O'-l+)(6a>t{,{
2-28
o
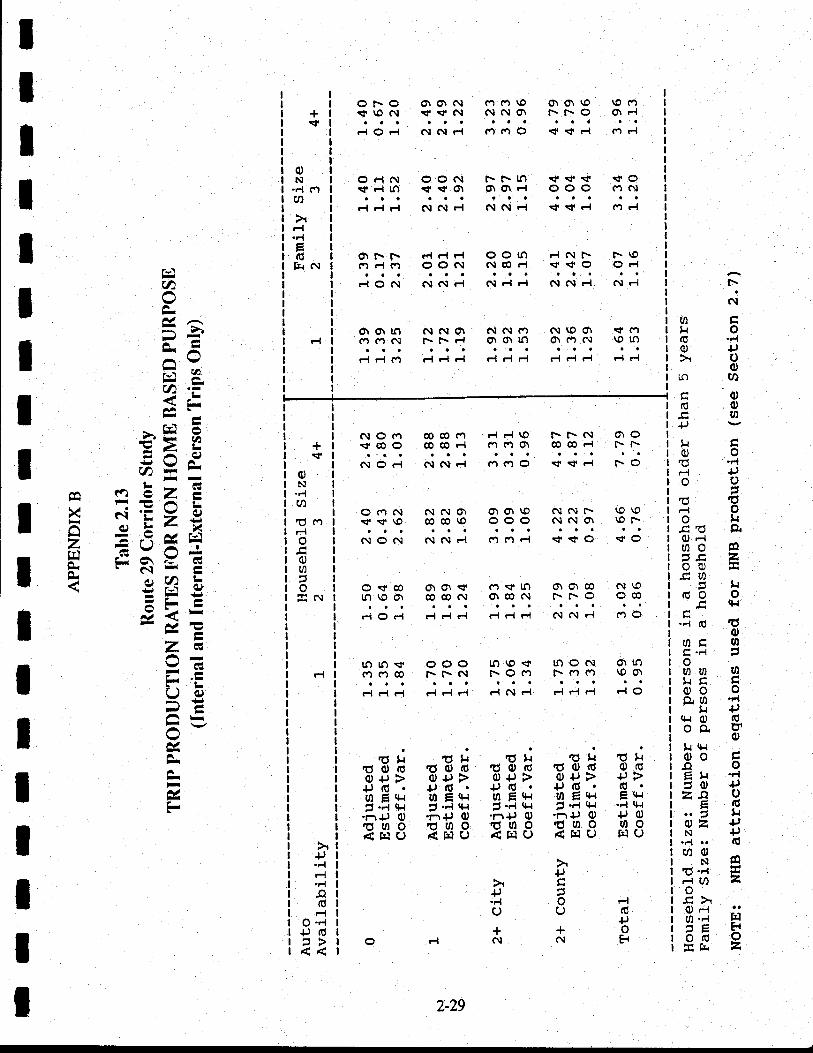
\c\
rntrt{O(6 'Flo+J
orot,:ltro(do"c ul+Jvl{trooC 'F{Fl +)o() )dcF{Oot{EE 9.OF{U)0 trlr7Jt/A^rvvEEA
Jt{.60 0Eq{
."{ td tttortc o
C.Fl 5oort ul!c troo o9iO '4tr +J
Eg. $l{ r+roo tr-qoE,1 "l2B tE!u..= t{@z +lN+J.rt .. a!o]o €5'# E.c>$i F'
gE E
Ot-O O\O\N m(n\O cl\o\\O \O(-)sf\OC{ sf<rC{ NN(h f'F-O orF{
aaaaF{OF{ oilcild (n(vlO sf$Ft c/)r{
OFIC\l OO(\l f.Fln rf rf sf <f Osf Flto $<f o\ d\o\FI C)OO f')C{
aaoaaaaaFl r{ Fl C(l Cit F{ C{ N Fl tf <I Ft c'l F{
ort-F- dF.{d oon r{c\ll- t-\orrlFl('r OO(\I (\lCOFl ststO Ot{
aaa.F{Ooil OiINF{ C\lFlFl OilNd (\F{
Oro\lfl oilNq\ N(\a'l C\l\gor rf c/r(v)(nN FFFI o\o|Jl o\C'lN \otO
aaaaaar{F{(n .{F{F{ Fli{F{ F{r{F{ Ftrl
NO(n cOcOci F{F{\o f'f'c{ 01O$o0O cOCOFI ce(nO\ c0cOd f-f'
aa
C\l()Fl Nc(lF{ (nc)O \fsf d f'O
o('roil Noilo oo.|\o Glc!r\ \o\0sr$\O COCOTO OOO $lCr{O\ \gf'
.aNc)C{ NOiIF{ femF{ $sf O sl'O
(>sICO o\01<r ('1<f !n o\OrC0 ol\o!O\Ocl\ cOcoc\l ot@c! r-f\O c)c0
aaFiC)F{ r{FtF{ F{rtF{ NC\-l (nO
!Otnst' OOO !O\o<r nON cnIO(')(v)@ Ff-c! f-Ofn f-c1m \oo\
aaFlFlrl FlFl F{ .{oitF{ F{F{r{ Fl O
EE! E3! 53! t3! 3!Fid-. 9rd-. .lJe. lJq-. qin E,+r in E,+{ U Et+.t O E$l E${i.t ,+r t il tH 5'-l *t 5'"'! t'! "l $l;l+l O .h+r O .n+J O .n+J E +J E.rJin6 ooO 't3o-o q-q-g moir'5O <FtO <r'lc.l drriu Flo
+JoE-t
*J
o
+oil
+J
U
+oil
2-29
+\r
oN.Fl Cn(/J
rl
E.U
'I{N
+sf
oN
.Fl
'lc clF{ooaot C.l
+,
.F{
.q(6Fl
O"{+) (g5>
r-lFaAvArU.-H-r h-=a---A6 \r/-r-l 4-aa.-1r .-,!^ II
f:d =5= i'
=A'-=A^1)aE=t-
co (ri -Z E
X ci'i>go g e =.5- - -ft -r:. v-J= ricr;Gr-(\r-tr? sf b
-=- =n
-eF-z;Av-=ii'iuoh rlJJtrahr=v,A\\r/eE.A-AHF(avrF
IIIIIIIIIIIIIIIIIt
IIAPPENDIX B
To test the district level performance of the model, estimated trip production rates were applied to 1the survey records, and the estimated total trip productions for each of the fourteen districts were Icompared with the observed trip productions for the same district in the survey. Globatly, the model ,performed satisfactorily for each trip purpose at the disrict level as shown by the high "R-square" values Iobserved between estimated and observed trips (see Table 2.14). A glance over the ratio of the estimated
and observed trips for each district, ho*"u"r, ,nggests that trips for the outer districts were slightty unOe, Iestimated while tbe inner districts were slightly over estimated. Most of the districts with high
concentration of sampled households (3, 5, 6, lz,and 14) showed less than a 15 percent differeo..f
between the estimated and observed trip production. Although no clear cut explanation can be provided _for the above phenomenon, one of the reasons could be the exclusion of walk and bike trips from
tt lanalyses. Since these trips are mostly made within the city environment, exclusion of such trips usually
leads to slight under estimation of overall mean trip rates for certain categories of households. I
The selected trip productions model is a theoretically sound model which is sensitive to demographic -and socio-economic variables, and to some degree captures the effect of land use and location. Moreover, Ithe variables included in this model can easily be forecasted for the study area by the local planningl
agencies.
2.s TRrP ATTRACTION MODEL I2.5.1 Introduction
The estimation of trip attractions was based upon a set of trip attraction rates developed lot
tl.lGATS area. To estimate trip rates for'each purpose, the number of person trips by motorized model
(internal t ips) attracted per unit measure of a specific land use at the trip end were calculated. The foura
variables used to measure the intensiry of socio-economic activity were retail employment, non-retaill
employment, school enrollment, and dwelling units. It was recognized that further splitting of non-retail
employment variable (e.g., commercial, industrial, and government) would improve overall p"rfo*un..l
of the trip attraction models. However, due to the nonavailability of stratified employment data by TAZ,
it was not feasible to develop models with sensitivity. to various non-retail employment related land uses. I
I
IIII
2-30
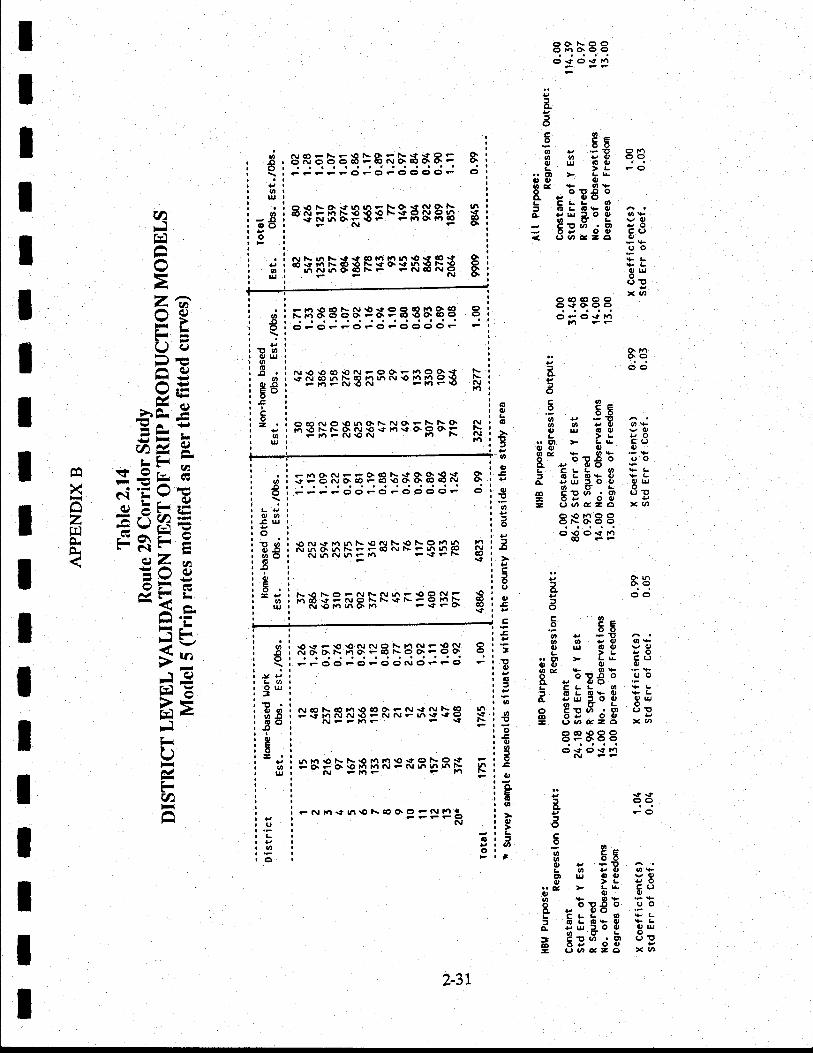
C)O.t\OOOhO.eoO \t O.t lt|
aao5 Pe6 Y .-! Oft)6 6 P Q) OOg - 9g Jci.. Ot
a, o, t,8n trSEg E. Po,t o L oE (,d ;-eog gt= 5E'dE E3
oo9L9LOU8.c
vxv,o.o co <t c)o€o.c>oOeO\tnr.l
qo
gRsbESFgKF$tt:?eFeeatFOFOOOO-
8$FfiXPSFFSHNSF F
sF&XSEF!8sn$E* a
O. t4O.ooo
oo
?st\.\J
EBSBbSPEegSEgEOe(9eFO?C)FCt(3OCtF
$R3nBS;f;&5ngg€-F6-N\ON --rtF\O
3SSR8S$5S$;**" N";;'i;dtoN- BoE H
?eoov ..!6 v It OsUJ 3E ;I
o'o9 Ov re9olt-o o o oe rUO
CLL O 9Lo L (o9 (u I Leu:O0, qru8o8.t' 3ooP 0 0, vtJUre=a -v,('\O14OOONO.eoo€o\tr4
c) eF
u Ohr qq; ooo
E €e6 v .-1to o PO o?,u u gE ;t
.. Otoo ql ql
'he to-Bt '6Eg E.1o, E.i ;6*Eg Eicr e!6.o' s!g 8;-€3 *d
eqqqqO rt C).t i4
Gj EF
v rt\tr qqn eo)o.9 d's tEo v .-!L .t, e O oso u Oe, vq'
6&6 I 69 ._9.i ot-O O s gg E,-to, E.i *n3tg E';E E;:Jg:;
atooott(,L..o,
Q'OoeL:cc'2
6{,g6
3q,E
o!6
o
-e
coo(,scst!tU
a
o6
o3e,q
o3a,
coa
oL:U',
6o.o
sdEpSslE[8s=8$ IeeO€FOFOC)mOeFo
5PBNEE98bT8S3NeFFFC)OFOFOOOOF
\o N rt t/| rn ls \o N t\ 9 F o t! !4rVi di t\FF.ONNFItiur!onllnnlrnFf.| FsFr
I\\Ot\OFNt\NhF\OONiirrds-N6I\t\s]seottF"-6!4rn6!4 e\tFo\
\'I\
oo
Gl @ t\ €O r| € aO O\ F N rt N ts €; G i.r r! N 6 e 6i N F lir rc \c c?- irieene \t
h r.1 <t t\ F € l.t I.t \O \l O t\ O :C; i'.;.>€|ia.iNF..thl^l^!>N Frq'
e a! t t\t |/'r € t\ € O\ O e N !4 {1'. " - - - -- - ieee(J
2-31
oooglu,
tt
oooF
ou
olto
!oO'Uan
-O'og*
co=.anU
th
o
g6suoE-8('oG
6)
o.-€ou
a,
o-vJaoOU3tt.@o63ooa
9ld-.
,tU
aL
oc!
ahIr-'!FIi^FrvEZGL{)EPt--u5-YAc)El-)/tl rl)
YTE-rr^bc.;yt .p
EE rv)9, x?-l-F,-Ca t Cr- 7i\/ -:==JL- N .v x
fr exlEl\J..l5AI-;7F i:-{,-c.F
E,-\-- i-,S,n/-'1 3r-'l ITA>t?-\ --FfF(Jl-^t,-Fcr)FlFI
IIIIIIIIIIIIIIIIIII
APPENDIX B
Table 2.15 displays different trip end land uses reported in the CATS household
survey (1938) and their corresponrting units of measurement utilized in the development of
trip attraction rates. To estimate home based work attractions, total employment (retail +
non-retail) was used. Aside from location related effects (e.g., more walk trips made in
certain areas), trip rates per employee (motorized) generally do not differ geatly by type
of emplolmrent.
However, for home based other and non-home based uip purposes, the selected
variables included employment by retail and non-retail categories, school enrollment, and
dwelling units. Since school trips are part of the HBO and NHB pulpose categories, school
enrollment variable (high, middle and elementary schools only) was included to estimate the
school related trip attraction rate. Dwelting units are a typical variable to calculate
attraction rates for social and household linked service trips.
Considering the sample size instead of a zonal level analysis, trip rates were
developed at a regional or large area level and finally tested for their performance at the
district level. Prior to estimating trip rates, the survey records were expanded to represent
all of the trips that occur within the study area on a typical working week day. All trips with
one end outside the study area were removed in order to develop trip rates for internal trips
only.
It was recognized that due to the higher sampling rate the estimate of external-
internal (XJ) and internal-external (I-X) trips would be more accurate and reliable from
the external survey data. Therefore, household survey data was only used for the estimation
of motorized internal trip attraction rates.
2.52 Home-Based Wbrk Trip Attraction Model
Two model structures considered for evaluation were the regionwide work trip
attraction rate model (Model 1), and the location specific attraction rate model (Model2).
Under Model 1, the estimated number of motorized work trips attracted per employee
within the study area was 0.96. At first glance, this rate was found significantly lower than
the rates observed elsewhere. However, after the inclusion of external survey information
pertaining to work trips originating outside the study area but attracted within it, the
IIIIIIIItIIIIIIIItI
2-32
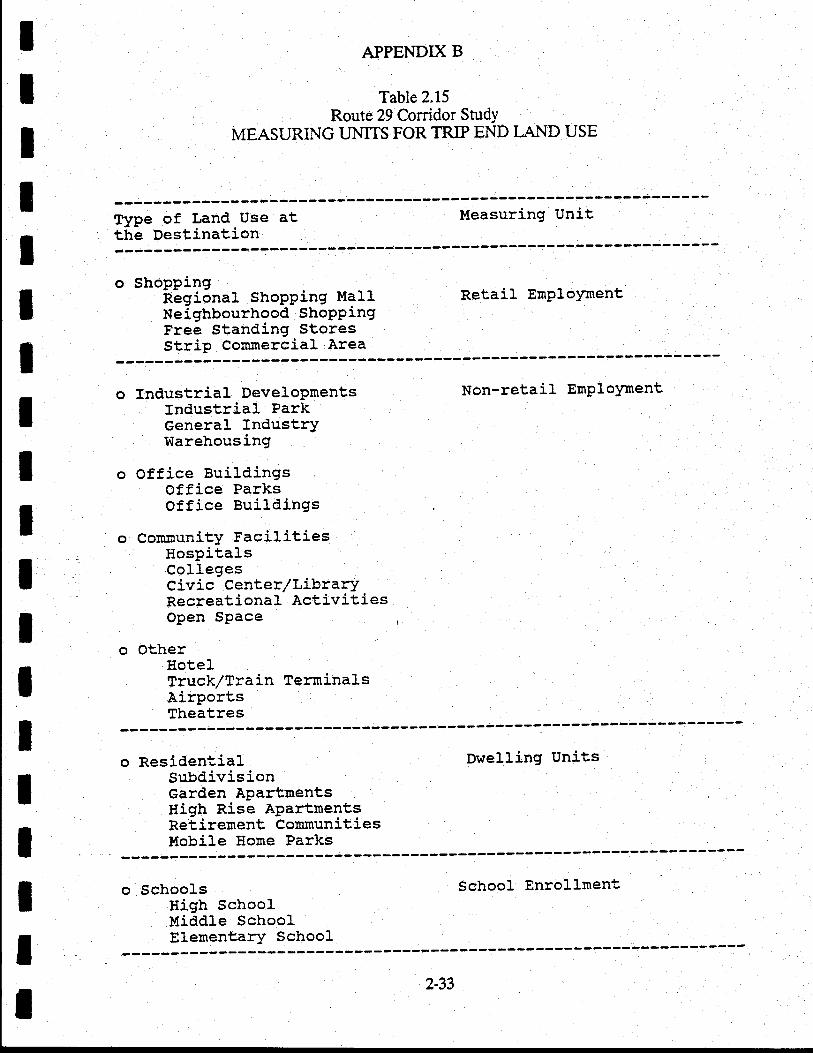
APPENDIX B
Table 2.15Route 29 Corridor StudY
MEASURING UNITS FOR TRIP END I.AND USE
Elpe of Land Use atthe Destination
Measuring Unit
o ShoppingRegional ShoPPing MallNeighbourhood ShoPPingFree Standing StoresStrip Commercial Area
Retail Ernploynent
IIIIIIIIIIIIIIIIIII
Industrial DeveloPrnentsIndustrial ParkGeneral IndustrYWarehousing
office BuildingsOffice Parksoffice Buildings
Cornnunity FacilitiesHospitalsCoIlegesCivic Center/LibrarYRecreational ActivitiesOpen SPace
OtherHotelTruck/Tra j.n TerminalsAirportsTheatres
Non-retail EmPloynent
o ResidentialSubd.ivisionGarden ApartmentsHigh Rise ApartmentsRetirement CommunitiesMobile Hone Parks
Dwelling Units
o Schoolslligh SchoolMiddle SchoolEle:nentary Schoo1
School Enrollment
2-33
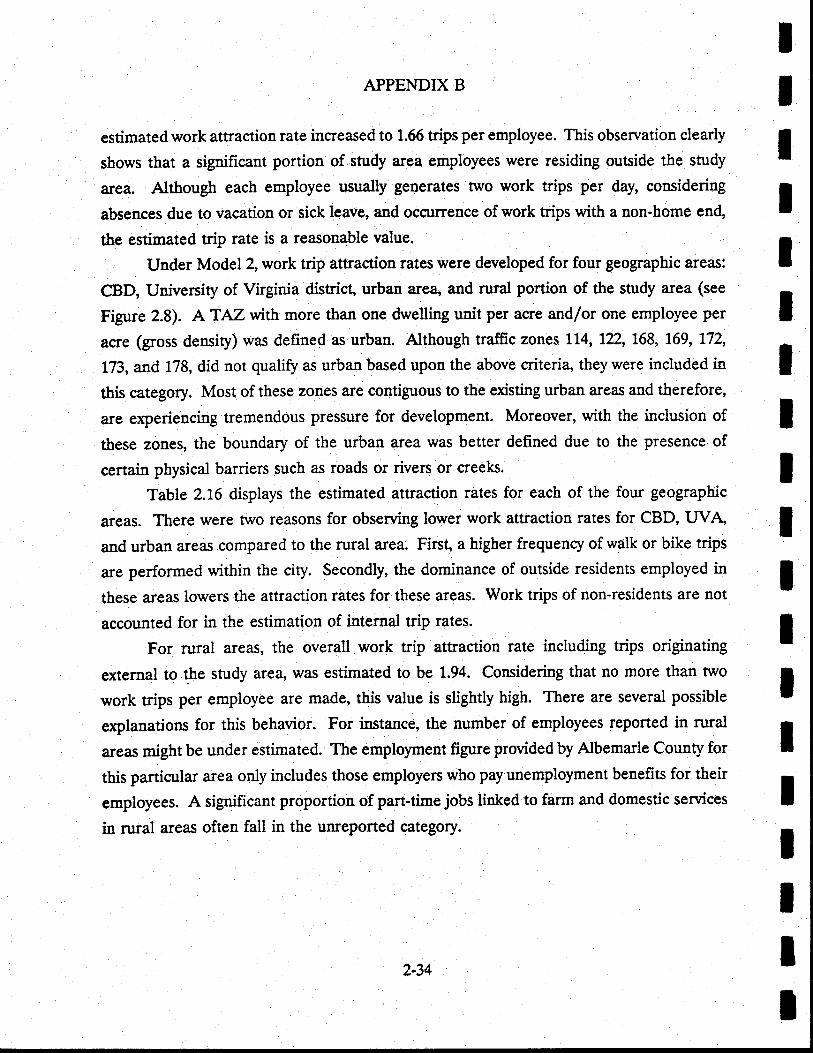
APPENDIX B
estimated work attraction rate increased to 1.66 trips per employee. This observation clearly
shows that a significant portion of study area employees were residing outside the study
area. Althougb each employee rsually generates two work trips per day, considering
absences due to vacation or sick leave, and occurrence of work trips with a non-home end,
the estimated trip rate is a reasonable value.
Under Model 2, work trip attraction rates were developed for four geographic areas:
CBD, University of Virginia district, urban area" and rural portion of the study area (see
Figure 2.8). ATAZwith more than one dwelling unit per acre and/or one employee per
acre (gross density) was defined as urban. Although traffic zones '1.L4,122,168, 169, 172,
173, and 178, did not qualify as urban based upon the above criteria, they were included in
this category. Most of these zones are contiguous to the existing urban areas and therefore,
are experieucing tremendous pressure for development. Moreover, with the inclusion of
these zones, the boundary of the urban area was better defined due to the presence of
certain physical barriers such as roads or rivers or creeks.
Table 2.16 displays the estimated attraction rates for each of the four geographic
areas. There were two reasons for observing lower work attraction rates for CBD, IIVAand urban areas compared to the rural area. First, a higher frequency of walk or bike trips
are performed within the city. Secondly, the dominance of outside residents employed in
these areas lowers the attraction rates for these areas. Work trips of non-residents are not
accounted for in the estimation of internal trip rates.
For rural areas, the overall work trip attraction rate including trips originating
external to the study area, was estimated to be 1.94. Considering that no more than two
work trips per employee are made, this value is slightly high. There are several possible
explanations for this behavior. For instance, tle number of employees reported in rural
areas might be under estimated. The employment figure provided by Albemarle County for
this particular area only includes those employers who pay unemployment benefits for their
employees. A significant proportion of part-time jobs linked to farm and domestic services
in rural areas often fall in the unreported category.
IIIIItIIIIIIIIIIIII
2-34
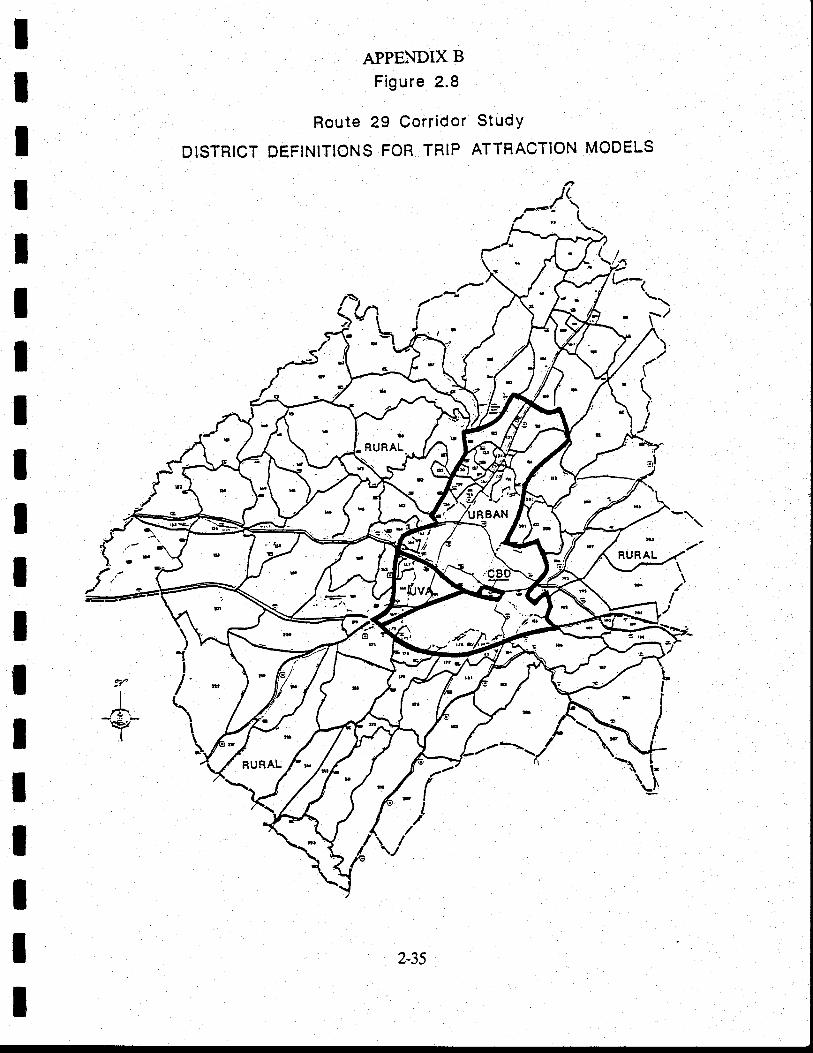
APPENDIX B
Figure 2.8
Route 29 Corridor
DISTRICT DEFINITIONS FOR TRIP
Study
ATTRACTION MODELS
2-35
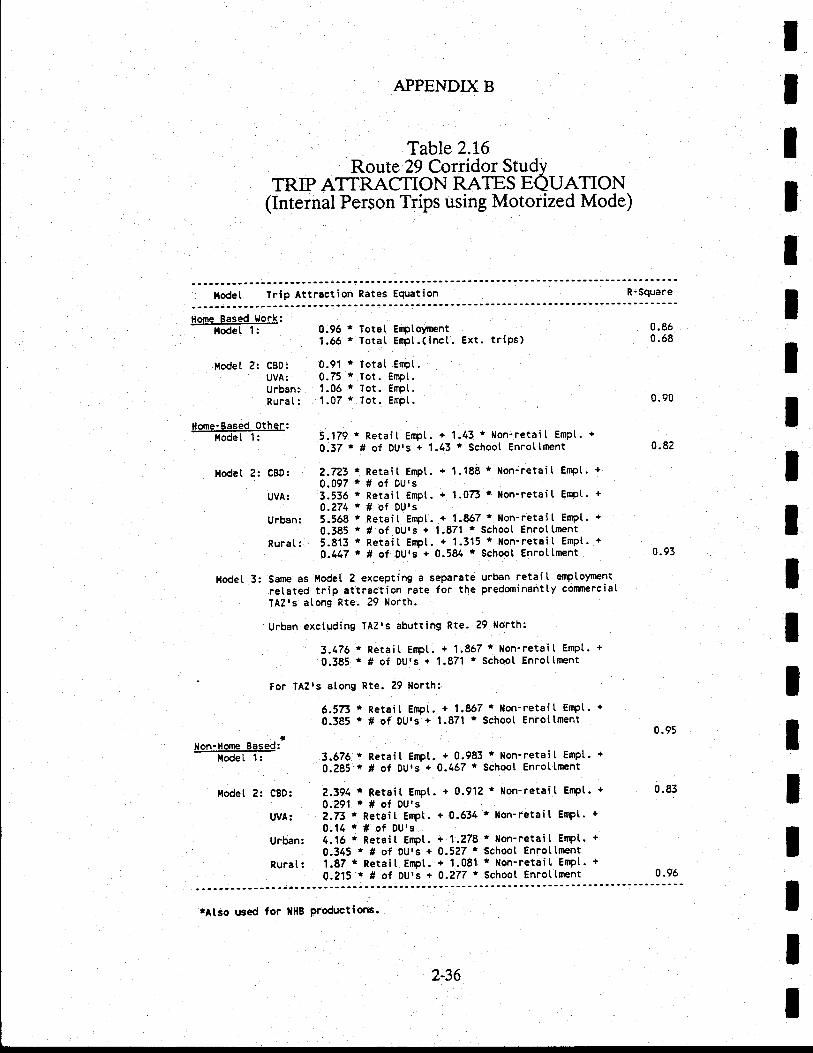
APPENDIX B
T
IIIIIIIT
IIIIIIIIII
Table 2.16Route 29 Corridor Study
TRIP ATTRACTION RATES EQUATION(Internal Person Trips using Motorized Mode)
ltodet Trip Attraction Rates Equation R-Square
0.96 * Totat Erptoynent1.66 * IotaI Ernpt.(inct. Ext. trips)
l,lodel. ?: CBD: 0.91 * Totat EmPt.UVA: 0.75 * Tot. EmPt.Urbsn: 1.05 * Tot. EmPt.Rural: 1.07 * Tot. EmPt.
5.179 * Retait En|pl,. + 1./.3 * fion'retail Emp[. +
0.37 * # of DU's + 1.13 * Schoot Enrottnent
lfodet 2: CBD: 2.723 * Retait Empt- + 1.1E8 * Non'retait Empt' +
0.097*#ofDUtsUvA: 3.536 * Retait Empt. + 1.07J * llon-retait Enpt. +
0.274'#ofDU'sUrban: 5.568 r Retait Emp[- + 1-%7 r Non-retai t Empl,. +
0.385 * # of DU's + 1.871 ' School EnrottrmntRurat: 5.813 r Retait Enpt. + 1-315 * l{on-retait Empt' +
0.117 * # of DU's + 0.5& r Schoot Enrottrpnt
l|todet 3: Same as ModeL 2 excepting a separate urban retait eflptoymentretated trip attraction rate for the predominant[y cormerciaITAZ's atong Rte. 29 North.
Urban exctuding TAZ's abutting Rte. 29 ilorth:
0.860.68
0.90
llodet 2: CBD:
WA:
Urban:
Rura[:
3.476 * Retait Empt. + 1.867 r llon-retail Empt. +
0.385 * # of DU's + 1.871 r School Enrotlment
For TAZ'S atong Rte. 29 North:
6.573 * Retait Empt. + 1.%7 * llon-retait Erpl'. +
0.385 * # of DU's + 1.871 * Schoot Enrottinent
3.676 * Retait Erpl. + 0.983 t Non-retail Empl'. +
0.285 r # of DU's + 0.467 * School Enrottment
2.394 ' Retait Erpt. + 0.912 r llon-retait Elpt. +
0.291 *#ofDU's2.73 r Retait Erpt. + 0.634 r Non-retait Ettpl'. +
0.14*#ofDUrs4.16 * Retail Erpt . + 1.?78 * llon-retait EtttpL- +
0.345 * # of DUrs + 0.127 t Schoot Enrottnent1.87 r Retait Ernpt. + 1.081 * llon'retait Ettpl'. +
0.215 * # of DUts + 0.277 * Schoot Enrottment
0.82
0.93
0.83
rAtso used for llHB Prodrrctions.
2-36
0.96
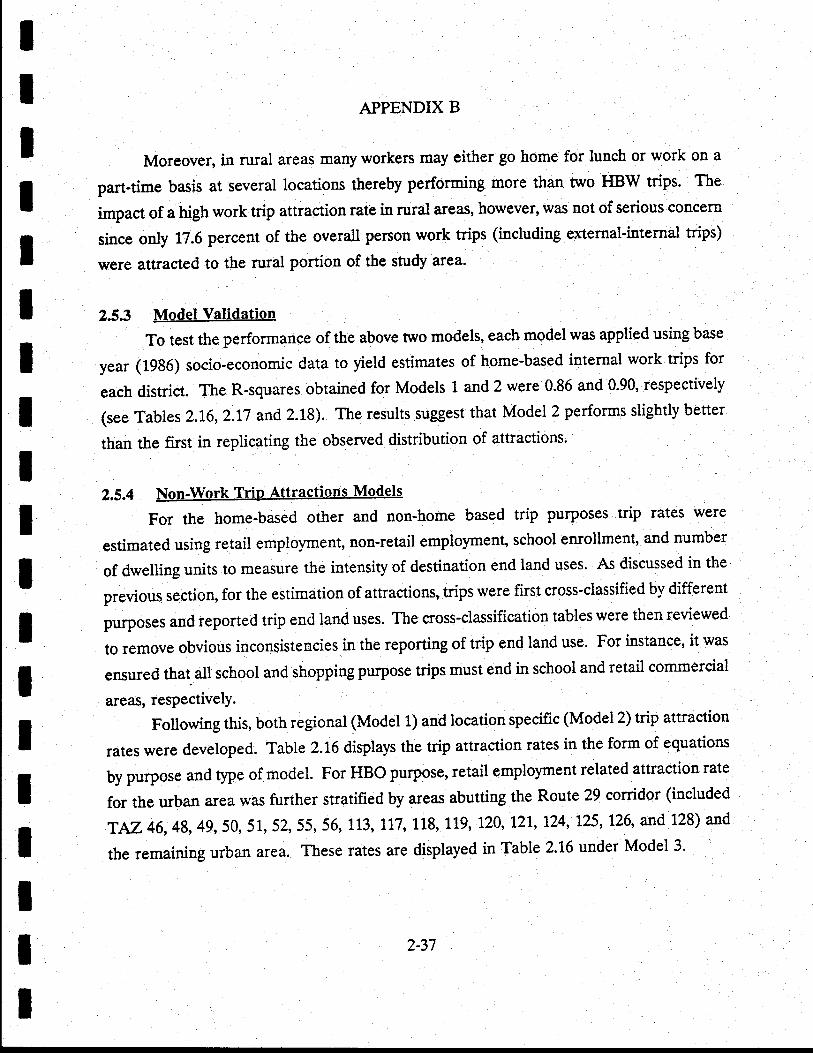
IIIIIIIIIIIIIItIIII
APPENDIX B
Moreover, in rural areas many workers may either go home for lunch or work on a
part-time basis at several locations thereby performing more than two I{BW trips. The
impact of a high work trip attraction rate in rural areas, however, was not of serious concern
since only 17.6 percent of the overall person work trips (including external-internal trips)
were attracted to the rural portion of the study area'
2.53 Model Validation
To test the performance of the above two models, each model was applied using base
year (19g6) socio-economic data to yield estimates of home-based internal work trips for
each district. The R-squares obtained for Models 1 and 2 were 0.86 and 0.90, respectively
(see Table s 2.16,2.L7 and 2.19). The results suggest that Model 2 performs slightly better
than the first in replicating the observed distribution of attractions.
2.5.4 Non-Work Trip Attractions Models
For the home-based other and non-home based trip purposes trip rates were
estimated using retail employment, non-retail employment, school enrollment, and number
of dwelting units to measure the intensity of destination end land uses' ^ lO:lttt:-t:
tn'
previous section, for the estimation of attractions, trips were first cross-classified by different
purposes and reported trip end land uses. The cross-classification tables were then reviewed
to remove obvjous inconsistencies in the reporting of trip end land use. For instance, it was
ensured that all school and shopping purpose trips must end in school and retail commercial
areas, respectively.
Following this, both regional (Model 1) and location specific (Model2) trip attraction
rates were developed. Table 2.16 displays the trip attraction rates in the form of equations
by purpose and type of model. For HBO purpose, retail employment related attraction rate
for the urban area was further stratified by areas abuttiag the Route 29 corridor (included
TAZ 46, 48,49, 50, 5I, 52,55, 56, 1t3, 177,118, 119, !20, L21', 124, L25,126, and 128) and
the remaining urban area. These rates are displayed in Table 2.16 under Model 3'
2-37
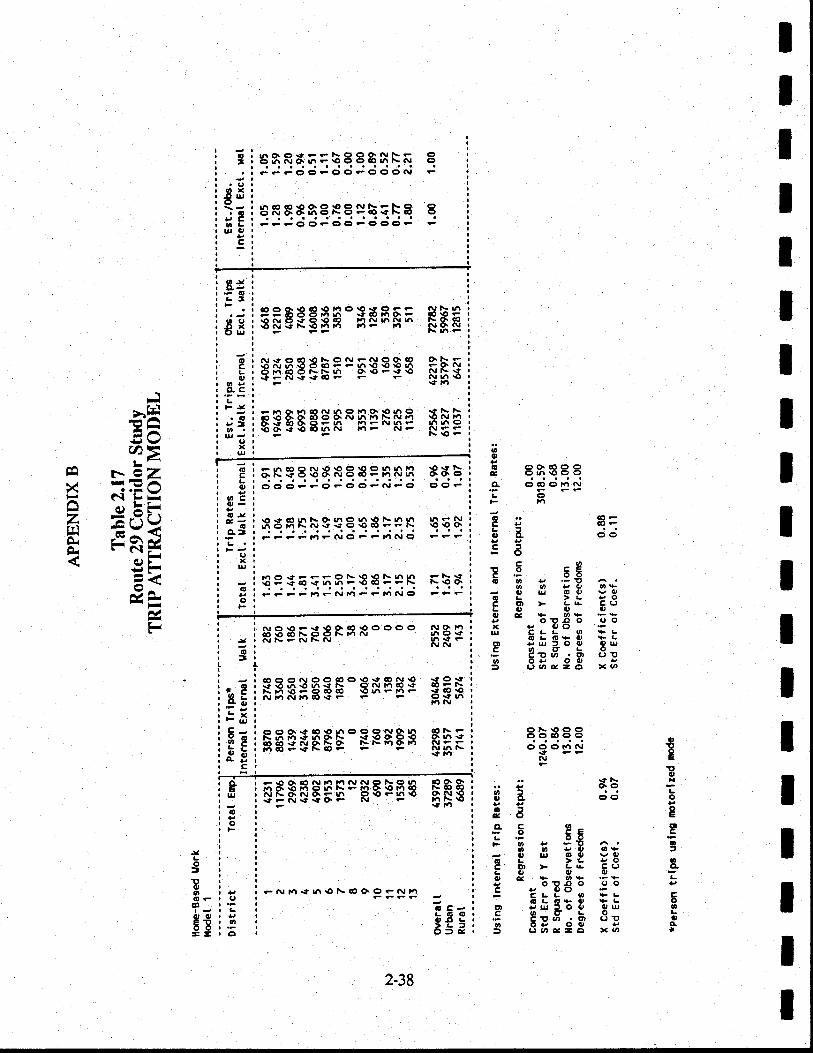
ttIIIIIIIIIIIIIIIII
6(,6 oO.€(3Oe (3l^\OOOe oaoer!NL<tF tl
o .. €FC e cOFb a doct o
? .E 5H6 O Y .'E A 'o6eal)os
o u o lu v(,@L>LPQcqtLoluog 4 toSt ttx v {rou cLL O 9g
6 L 6+ O I Lor eu f O 0, Ou.= 8r8.b' 3to oP o c, ry
= ct'he=6 x3t'
ol\\Ooocrococ>o .ooootrN !{yNE
T'.. .tt\ S.. y g.O
I a c;d bY9-6:t9eOE
-AteeEL .F OOb O e .'ll A. O- @ 6 ry O os t
0, UJ O{, vq)o L >L .aO l!eoLqrq,oY e Er-8t E; !E t.Poo E. Eo L os qt t s oo 9u t o lu ou ao
.S 8o,F.b' 3o bo O9 o o y 43 |Ja/|e26 Xlt I
BsRt;=bttgfrFE tFF?ooe(tct.eoooN F
BR88S8BBsb5F8 t?FeCle'-OOF€)CtOF F
ot
oxll ulo.6
vCo9ure,
c
E:E€EEA'SEfiE; pFg3S3f,3HB FIS'n $rq^l
ggFgeEE*F$39$ EHS
I = t.oeeryeqpogXg$S $pf i
i a; i xnR;H$F €nEB: HFH i
i.ii: :rFul
iES i EEe$EsE-FPHES $Hr irC1
i I i $FR$eFEPH€!E€ $gg irot'ryr'rOrF r !
ur!o,-Lt
c9llXct ur
FSSHEgHFNEEilE HFE66.'€-nRJ r|F NF OJqet\\OF
oLrl,6t
CLC
.o!:la.|JxU
rO.tNOrO\o(tOe
;n38S8R883nSnOO(teFOFOOe.\rFCt
6co
anC
o)a&,-IEo-=
gxU
6o
4eqe\qqqqqqqe qqqee?Fa.tFNc' FFr.l(\lCl F?F
€3$85fi8F88!PF FbtF e F F f.l F a\tt t F F 14{\l O ee F
Alo.n6O\tl^\teN(\I
I
JT
@rtl
t
NO\OF.c€O6\OOOOO€\OaOt\eoNaoNN'SF(\INN
q c<LGO9€ 5olc
eiJtl\t6€a\OOOeNr|(,
ae
2-38
F:
-"HYIH
=A{.) v?>co F- 62
!i *'ll AE TFFZ ?rIUH F5F
:<&,1FI
^tt-F
JLIEo@Ftooq,E8--
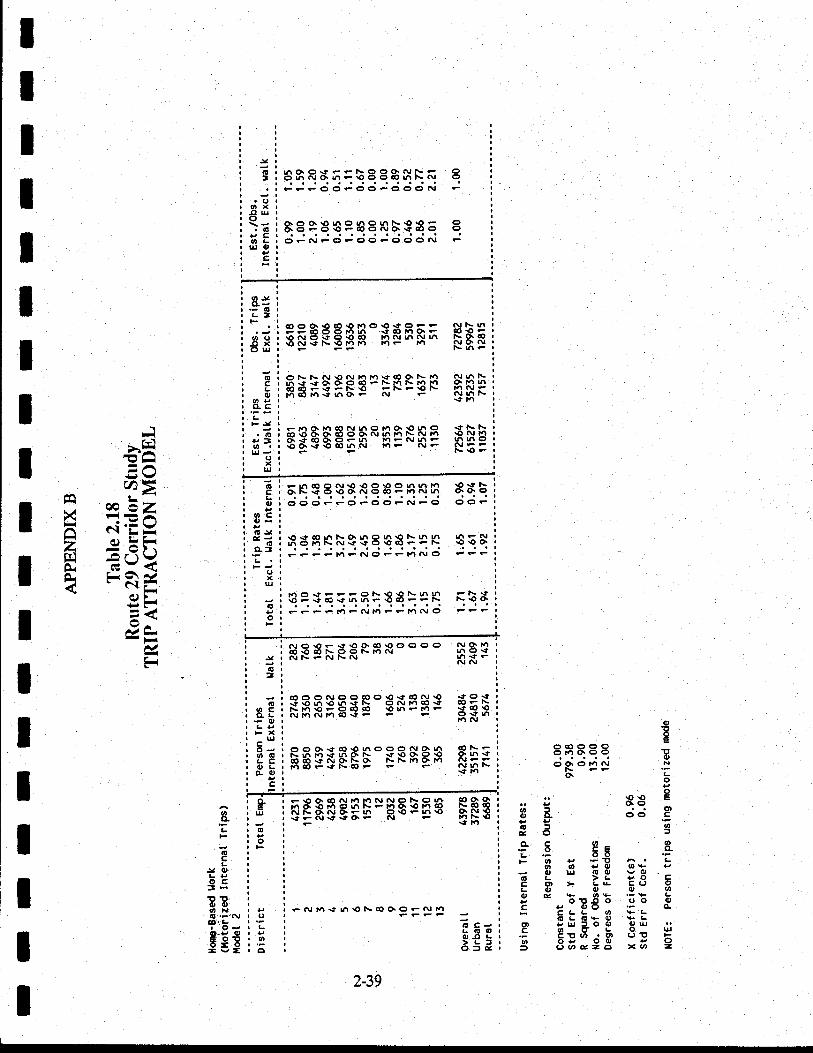
o3ec)coooo66606 !.tu
(>Or(tlAN NNo.b
.. \o{t g.. e OrOI a dd P9yo:qri6:t.3 t ee 8-s .F OOa P 'F! L
6 O v o oe vC, u OO vO
d i' - t- v6 Ced,crlrotuf/)g e bo-Bb '6E bC e Arc, c
CLL O 9L@ s Ge lu s L
o PrfOq, qruc.cJcrLou.= Cl(/) . ('r crE Fo 6v O q, P O=
(JVrezA -o =
6O\c)\teeNOC)o\NlseohmGh?\OOO€rnt\.\lFFFOOFO()eOOO^I
stsS€es8nhs35()F(\jFOF()OFOO(>AI
oo
oo
|\tr\l^cO\OFN6CONO\(!tsrrF
o ts N N.O N m r.t.t cO O\ t\ rO Ol 6I\6ssO.6e cOFr\t.4t\t1)tl qnndi€6;+et\.at elsqrOF Fl^Jrr4€r4-$r'ro.- N $n-
Ea3ts8Ft33nsn 8tEOOOeFOe(5(tFa\rF O <DOe
33Sshgs8E8>Pp g5see?FtOFNOeFltlNO
s9sE5;3:€3:sn F5ttne(\r,.tFetlnlo
; No.oF.t\o6.o€oooo NqnI in6€6t\ootsr.tN no\cy r ruFeNl\N h.itF.\In|GI
=l
- ; aooo^loo.oo\o.ccoa\r\o :to:'O I \l\Or..l\Oh.tI\ OmLCO\C €-r-\
o € r Fra'OFOOaO €nFrtF 't.(troA- i i\tiri.ira6.t- ; - o\tn: o . tla\l
6-, ooor.r@rO!^oo<>^lq|/^ €\-E 8: ES$N8Rh NBSES &PTor - r tncoe\tlscO- Nnrd o i "-- - \tltl
Ct.
i q i cER$eHE:HsFE€ 6B$ i
cO o O\ € cO € r.l o \O.tt o F F-F6ooro|'! sOri6F\o r! o..' o \o @ 1.1 (\l rtl(\l ln€GtsN\OtJlr.) liF l.l
E€S8888EASBSB $NEd+666Fn ro-avsaF ultno6O.\tO.OurN t.\F AtF !v-Ft\\OF
eNttrfl^\oNcOO\()Fa!rt
d CaLOGrtIlL>LtO3a
2-39
JG3
.ott*!uo
.GeCOLul lu
c
o&CLT.,oLI
o()ltxOu
;cLo6vcLc
LFX
.(!y=o.UJ axu
ocga,
ocOJEJ
aoof?e q
xu
(o
oF
.-oL!FXuOa(a(0
6o
g
Lq
o
oCL
L
.ocJOLYog
=Htt!0ro0)[email protected]'N!O. sI gJO\9 OE O!o-o-v-
jr-'lF=VT
=A.-, !/
?>,;
=€=A e.i'r E
F =-?E ETRd' gi|-
E'<ixEFttV-Er
IIIIIIIItIIIIIIIIII

APPENDIX B
Looking at the HBO attraction rates, both retail and non-retail employment related
rates for CBD and UVA districts were found lower than the urban and rural areas (Model
2). As seen earlier in the case of work 8ips, a higher propensity for walk trips in the CBD
and UVA districts seemed to lower the motorized non-work trip attraction rates for these
axeas.
Interestingly, within the urban area the retail employment attraction rate for the
Route 29 north corridor district was 6.57 compared to 3.47 for the remaining urban area
(Model 3). The observation clearly srrggests that the intensity and nature of commercial
land uses along the Route 29 corridor necessitates speclal treatment for the zones adjoining
this corridor. High intensity of retail activities in these zones indicate that they should be
considered as special generators in the demand analysis. The attraction rate for the
remaining urban area was similar to the CBD and UVA district rates as seen under Model
2.
School enrollment related HBO trip attraction rate for the rural area was 0.584,
which is coosiderably lower than the estimated rate of 1.87 for the urban area. Since several
school districts in the county e;tend far beyond the study area limits, a significant proportion
of trips attracted to these schools originate outside of the study area. As a result, the scbool
linked internal trip attraction rate for rural area is lower than that of the urban area.
2.5.5 Non-Work Trip Model Validation
The non-work attraction models were applied to produce estimates of trips by districts
using the base year (1986) socio-econornic data. The R-squares between the estimated and
tle survey observed fiips attracted to districts were satisfactory as shown in Table 2.16.
Tables 2.19 throu gh2.23 show the results of the district level analyses. In the case of both
HBO and NF{B purposes the location specific attraction models (i.e., Model2) performed
better than tle regional level attraction rate models (Model 1) in replicating the observed
distribution of attractions. The district level R-squares for Model 2wete 0.93 and 0.96 for
the IIBO and NHB purposes, respectively.
Based upon the model performance results discussed above, Model 2 under each of
the HBO and NHB purposes was recommended. The principal reason for testing Model
3 under }IBO pu{pose was to illustrate t}at some of the Route 29 corridor associated zones
extribit different trip generation characteristics compared to other zones. Since these zones
T
IIIIIIIIIIIIIIIIII
240
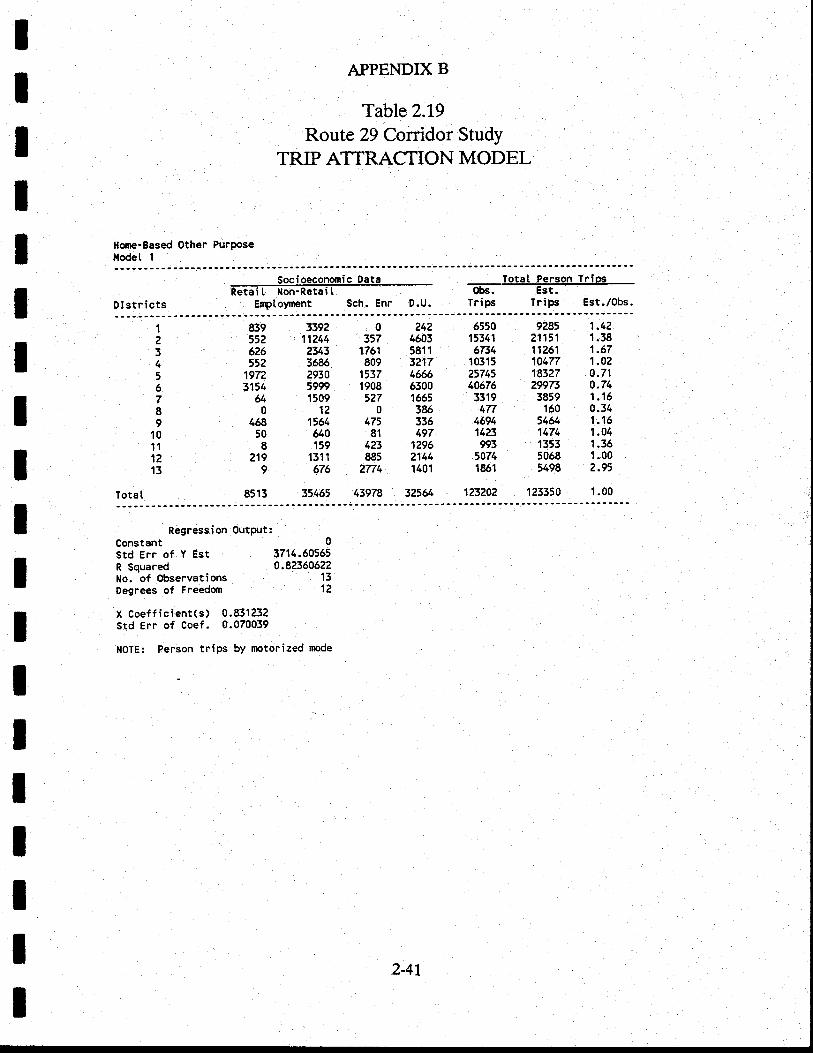
IIIIII
APPENDIX B
Table 2.19
Route 29 Corridor Study
TRIP ATTRACTION MODEL
Home-Based other PurPosellodet 1
0 I stricts Sch. Enr
Totat Person Tripsobs. Est.
Tripa Trips Est./Obs.
9285 1.4221151 1.3811?61 1.671A477 1.OZ18327 0.712W73 0.743859 1.16160 0.34
5464 1.151474 1.041353 1.s65068 1.005498 2.95
123350 1.00
839 3392 0 ?42 6550552 11244 357 4603 153416?6 ?343 1761 5811 6r54t52 3685 809 3217 10315
1972 2930 1537 4666 257453154 5999 1908 6300 t 0676
& 1509 527 16r,5 33190 12 0 386 477
168 15& 475 335 469450 &0 81 497 14238 159 423 1296 993
219 1311 885 2144 50749 676 2n4 1401 1861
8513 35465 43978 3256/' 123202
1
23456789
1011
1213
III
Tota I
Regression outPut:Constant 0std Err of Y Est 3714.60555R Squaced 8.82350622No. of Observations 13
Degrees of Freedom 12
x coefficient(s) 0.831232std Err of Coef. 0.070039
N0TE: Person trips by motorized mode
IIIIIII
241
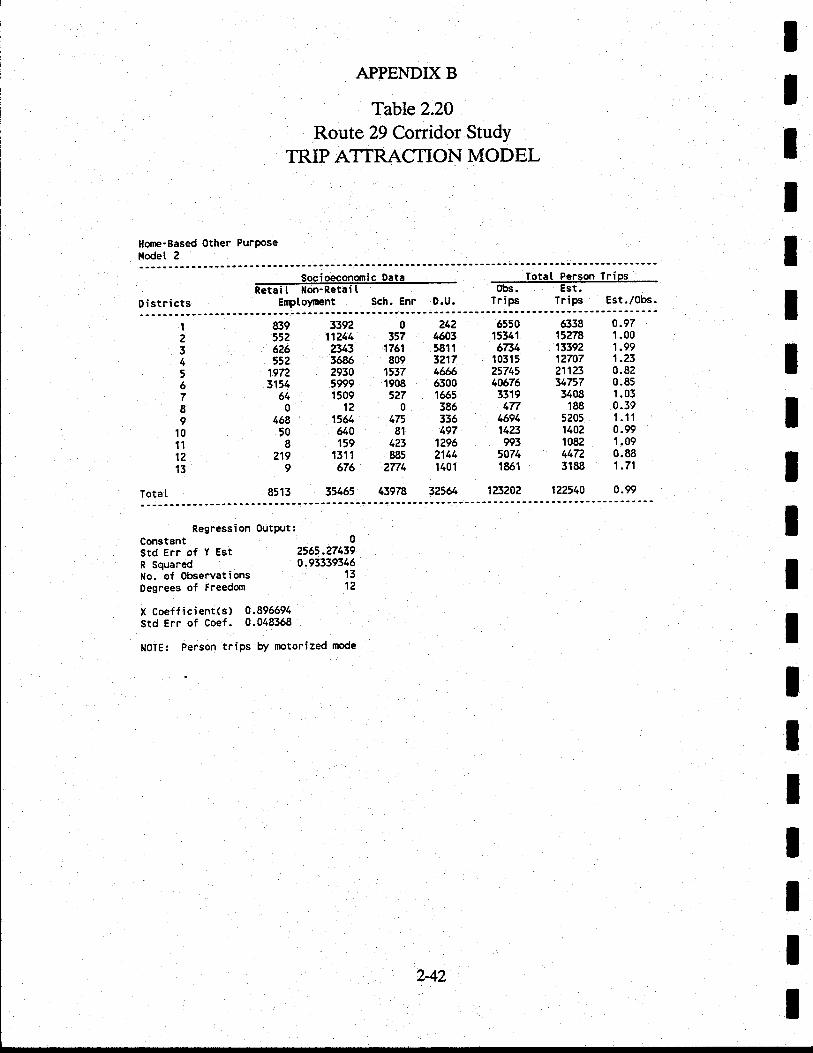
APPENDIX B
Table 2.20
ItItI
Route 29 Corridor StudyTRIP ATTRACTION MODEL
Horne-Based Other Purposel,lodet 2
Socioecononic Data
Districts E[ptoynent Sch. Enr
Total Person Tripsobs. Est.
Trips Trips Est./obs. I
Tota I 8513
339211?4423t33686293059991509
121564&o159
1311676
35465
?1246035811321746666300166,5386336497
129621441401
32564
655015341
6734t0315257454067633194n
46941423993
50741851
123202
I23456789
1011
1?13
0357
't761809
1537I908527
0175
81
123885
2n4
43978
839552626552
19723'.154
540
468508
2199
6338 4.9715278 1.001339? 1.9912707 1.?3211?3 0.8234757 0.83408 1.03188 0.39
5205 1 .1 1
1402 0.991082 1.094472 0.883188 1.71
122540 0.99
IIIIRegression outplJt:
Constant 0std Err of Y Est 2565.27439R Squared 0.93339346No. of Observations '13
Degrees of Freedom 12
x coefficient(s) 0.896691Std Err of Coef. 0.048368
NOTE: Person trips by motorized mode
IIIIIIIII
242
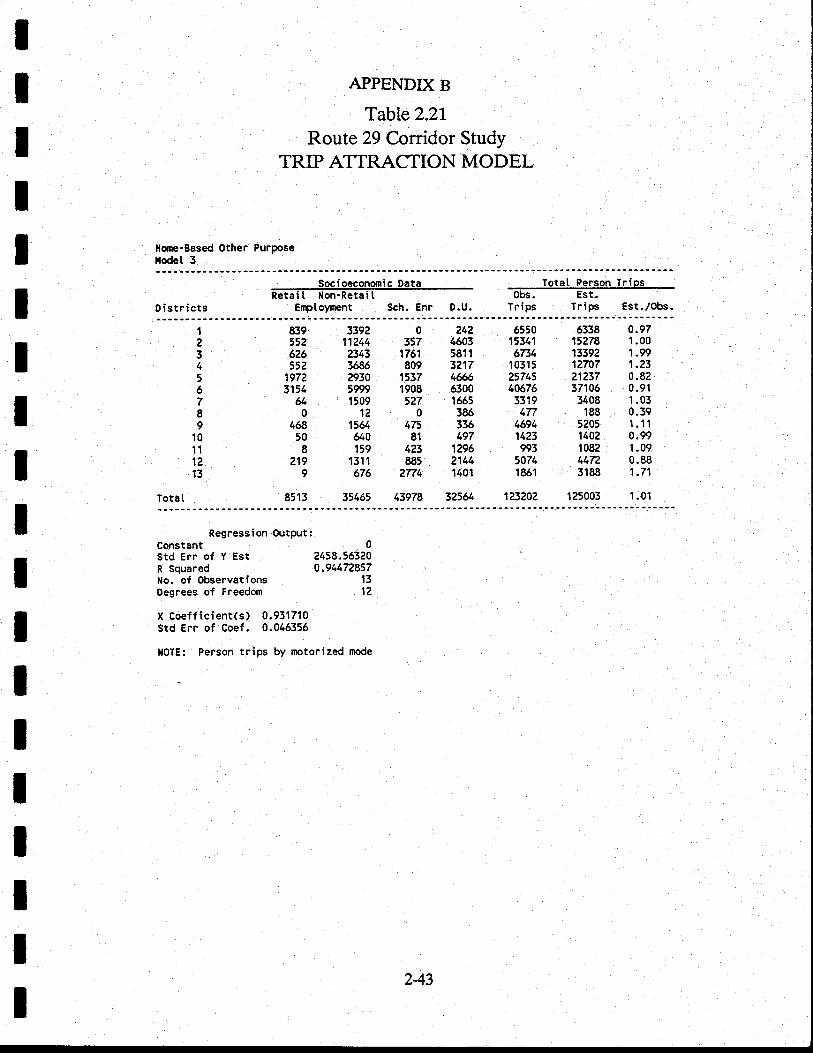
IIIII
APPENDIX B
Table 2.2L
Route 29 Conidor StudyTRIP ATTRACTION MODEL
Hqne-Based other Purposellodet 3
Districts ErqrtoFEnt Sch. Enr D.U.
Totat Person Tripsobs. 'Est.
Trips Trips Est../0bs.
123202
0.971 .001.991.?30.820.911.030.391.'ll0.991.090.881.71
1.01
633815?7813392127072123737105
3408188
52051107108211723188
125003
655015341
67341031 5
?574'406753319
47715941423993
50741861
839 3392 0 242552 11214 357 4603626 2343 1761 5811552 3686 809 3217197? 2930 1537 46663154 5999 1908 6300
64 1509 527 16650120386
468 1164 475 33650 640 81 4978 159 423 1296
219 1311 885 21449 576 2n4 1401
8513 35465 43978 32564
1
?5456789
t011
1Z13
II
TotaI
Regression outptJt:Constant 0Std Err of Y Est 2458.56320R Squared 0.94172857No. of Observations 13
Degrees of Freedom 12
x Coefficient(s) 0.951710Std Err of Coef. 0.046356
NoTE: Person trips by motorized npdeIIItIIII
243
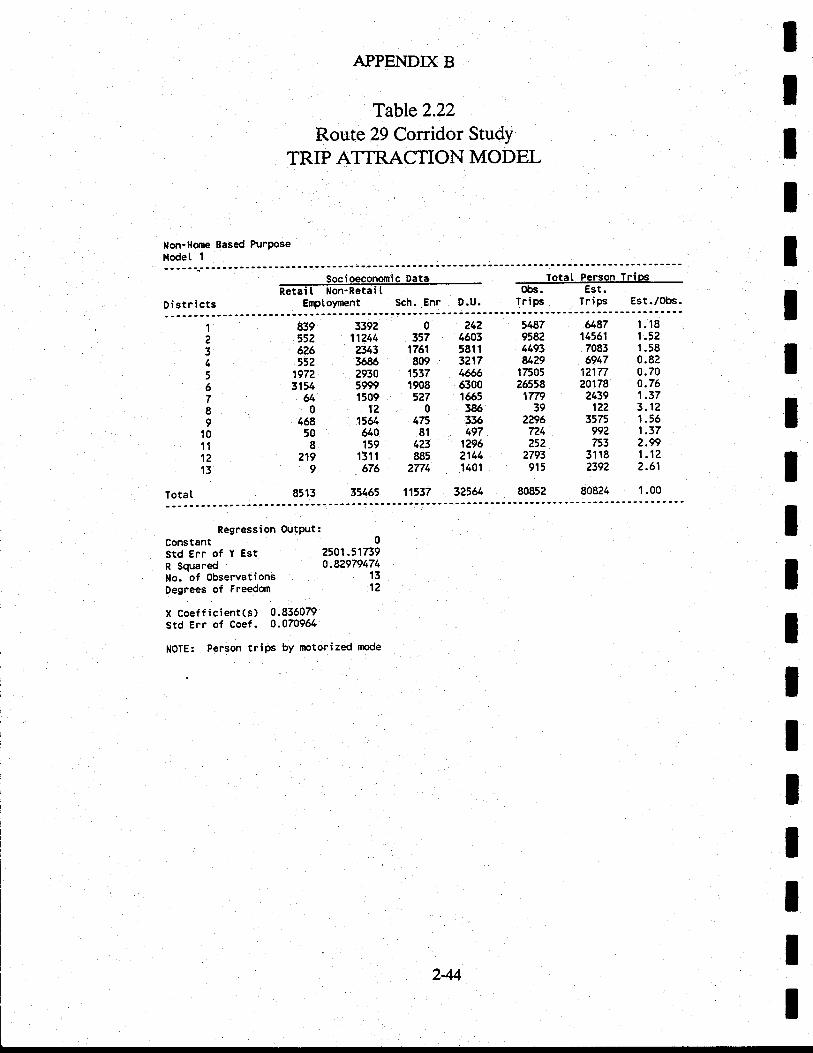
APPENDIX B
Table 2.22
IIIIII
Route 29 Corridor Study
TRIP ATTRACTION MODEL
llon-Home Sased Purposeilodet 1
Totat Person TriosObs. Est.
Distnicts Enptow€nt Sch. Enr D.u. Trips Trips Est-/obs.
1
234
56789
1011
1213
III
839552626552
19723154
&0
4&50
8219
9
33921124423433686293059991509
12156/&o159
1311676
0357
1761809
15371908527
047581
4?3885
2771
2421603581 1
3217466,6630016r.5385336497
1?9621441401
32564
548795824493u29
17505e655817n
392296724252
2793915
80852
&871456'l70836947
1Un20178
2439122
3575992753
31 182392
1 .181.521.580.820.700.761.373.121 .561.372.991.1?2.61
Tota I 8513 35465 11537 80824 1.00
Regression OutPtlt:Constant 0
Std Err of Y Est 2501-51739R Squared 0-82979474No. of Observations 13
Degrees of Freedom 12
x Coefficient(s) 0.855079Std Err of Coef. 0.074964
NoTE: Person trips by motorized rnode
IIIIIIIIII
244
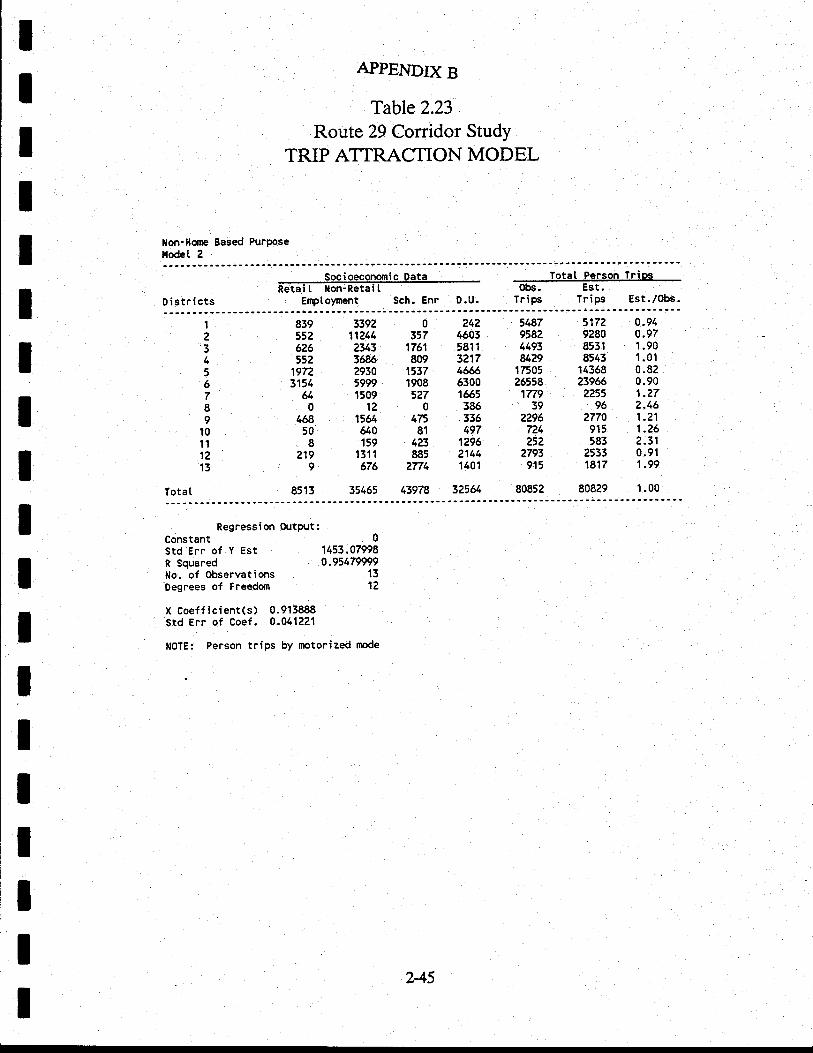
IIIII
APPENDIX B
Table 2.23
Route 29 Conidor Study
TRIP ATTRACTION MODEL
llon-Home Based PurPosellodet 2
D i stri cts Erptoyment Sch. Enr D.U.
TotaI Person Triosobs. Est.
Irips Trips Est.lObs.
0.940.971.901.010.820.901.272.461.211.?6?.310.911.99
1 .00
839 3392 0 ?42 5487 5172552 11244 357 4603 958? 9280626 2343 1761 5811 4493 8531
552 3685 809 3217 8/.29 85431972 2930 1557 4& 17505 143683154 5999 1908 6300 26558 23966
64 1509 5?7 1cr,5 1779 ?25501203863996
468 15& 1.75 336 2296 277050 640 81 497 724 9158 159 423 1296 252 583
219 '1311 885 2144 2793 25339 676 ?774 1401 915 1817
85',t3 35165 13978 3?5& 80852 80829
1
23456789
10111213
III
Tota I
IIIIIIIIII
Regression output:Constant 0Std Err of Y Est 1453.07998R squared 0.95479999tlo.
'of Observations 13
Degrees of Freedom 12
X Coefficient(s) 0.913888Std Err of Coef. 0.011221
NoTE: Person trips by motorized rnode
245
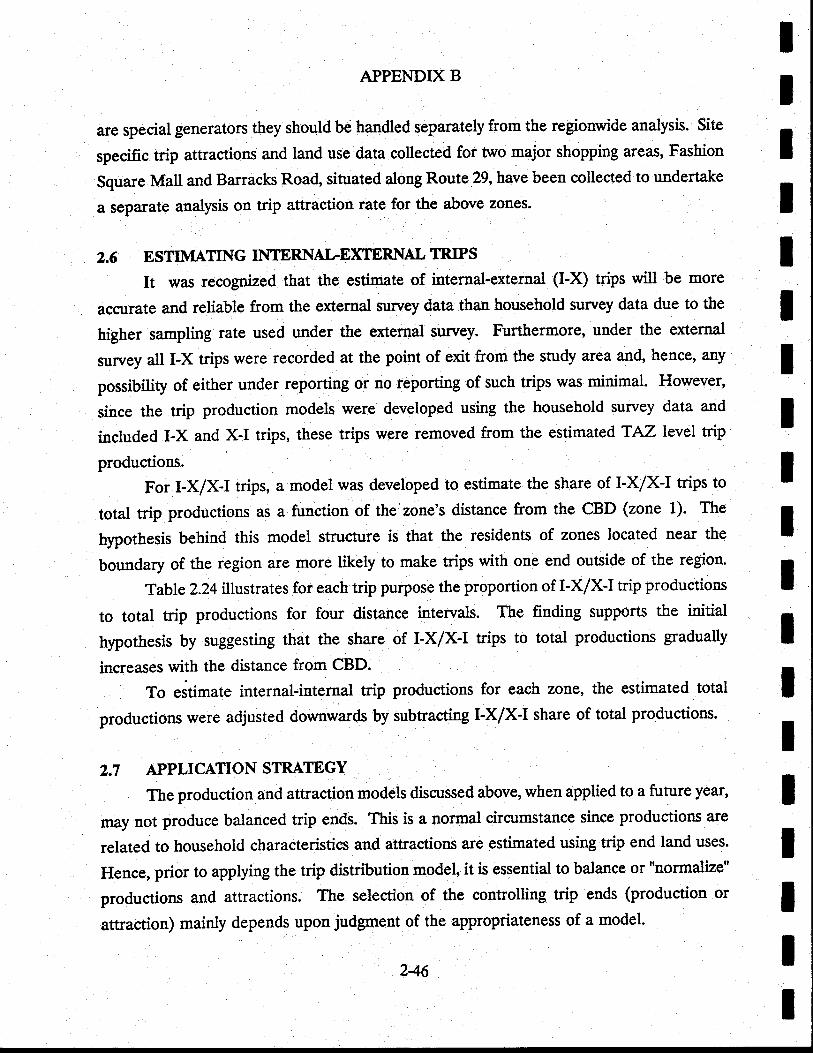
APPENDIX B
are special generators they should be handled separately from the regionwide analysis. Site
specific trip attractions and land use data collected for two major shopping areas, Fashion
Square Mall and Barracks Road, situated along Route 29, have been collected to undertake
a separate analysis on trip attraction rate for tle above zones.
2.6 ESTIMATING INTERNALEXIERNALTRIPS
It was recognized that the estimate of internal-external (I-X) trips witl be more
accurate and reliable from the external survey data than household survey data due to the
higher sampling rate used under the external survey. Furthermore, under the external
survey all I-X trips were recorded at the point of exit from the study area and, hence, any
possibitity of either under reporting or no reporting of such trips was minimal. However,
since the trip production models were developed using the household survey data and
included I-X and X-I trips, these trips were removed from the estimated TAZ level trip
productions.
For I-X/X-I trips, a model was developed to estimate the share of I-X/X-I trips to
total trip productions as a function of the zone's distance from the CBD (zone 1). The
hlpothesis behind this model structure is that the residents of zones located near the
boundary of the region are more likely to make trips with one end outside of the region.
Table 2.24 il\ustrates for each trip purpose the proportion of I-X/X-I trip productions
to total trip productions for four distance intervals. The finding supports the initial
hypothesis by suggesting that the share of I-X/X-I trips to total productions gradually
increases with the distance from CBD.
To eitimate internal-internal trip productions for each zone, the estimated total
productions were adjusted downwards by subtracting I-X/X-I share of total productions.
2.7 APPLICATION STRATEGY
The production and attraction models discussed above, when applied to a future year,
may not produce balanced trip ends. This is a normal circumstance since productions are
retateA to household characteristics and attractions are estimated using trip end land uses.
Hence, prior to applying the trip distribution model, it is essential to balance or "normalize"
productions and attractions. The selection of the controlling trip ends (production or
attraction) mainly depends upon judgment of the appropriateness of a model.
IIIIIIIIIIIIIIIIIII
246
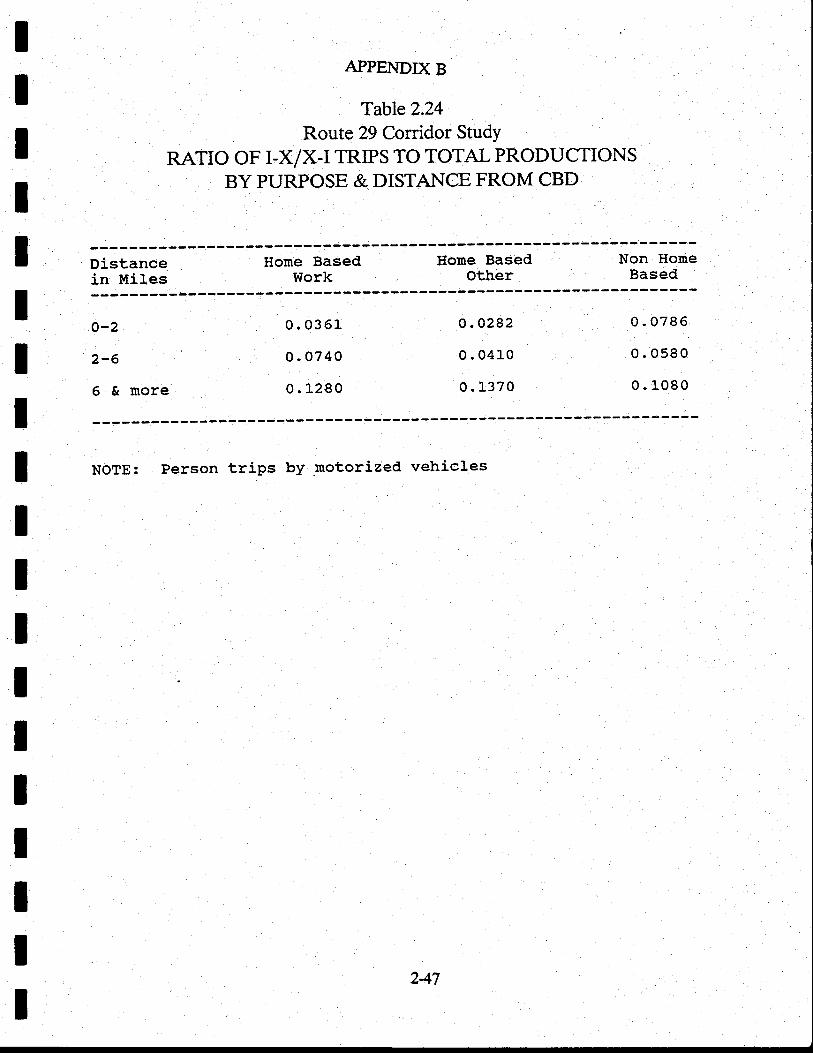
APPEI{DIX B
Table 2.24. r ar t
Route 29 Conidor StudY
RATIO OF I-X/X-I TRIPS TO TOTAL PRODUCTIONSBY PURPOSE & DISTANCE FROM CBD
Distancein Miles
Hone BasedWork
Home BasedOther
Non HomeBased
a-2
2-6
6 & nore
0.0361-
o.0740
0. 1280
o . 0282
0. 04L0
o. l_370
0.0786
0.0580
0.l_080
IIIIIIIIIIIIIIIIIII
NOTE: Person trips by motorized vehicles
247
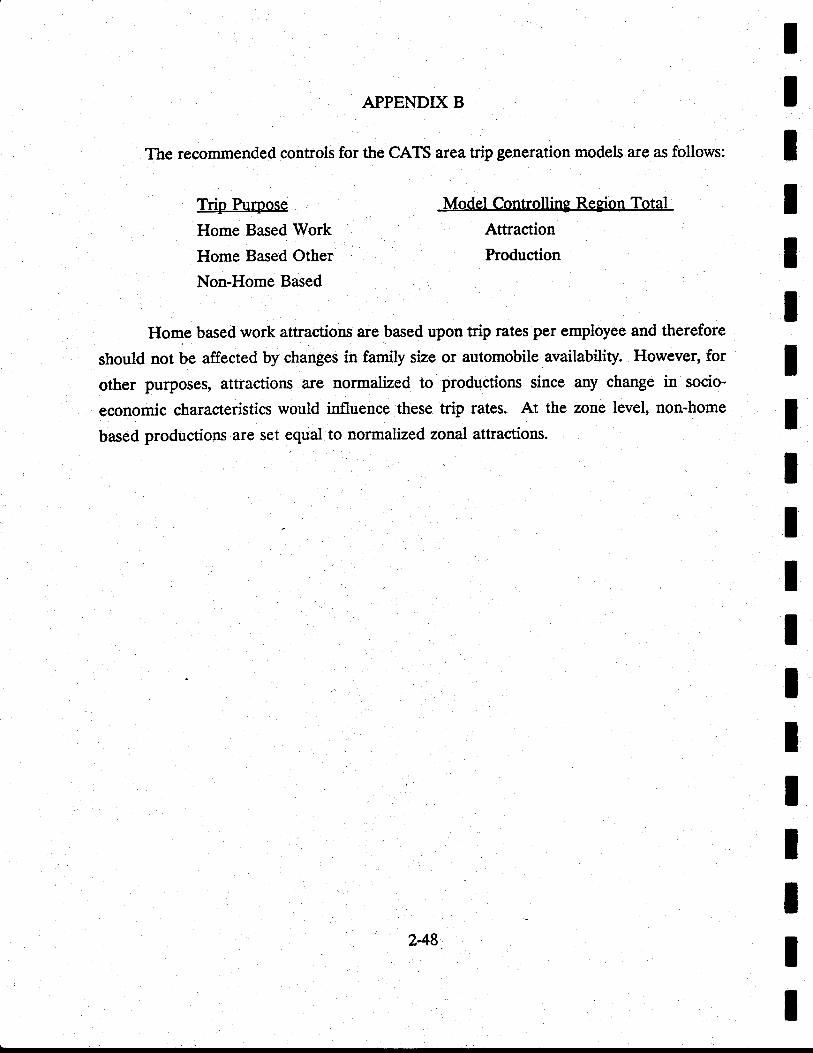
APPENDIX B
The recommended controls for the CATS area trip generation models are as follows:
IIIIIIIIIIIIIItItII
Trip Purpose
Home Based Work
Home Based Other
Non-Home Based
Model Coqtrolling Region Total
Attraction
Production
HoTe based work attractions are based upon fiip rates per employee and therefore
should not be affected by changes in fanily size or automobile availability. However, for
other purposes, attractions are nonnalized to productions since any change in socio-
economic characteristics would influence these trip rates. At the zone level, non-home
based productions are set equal to normalized zonal attractions
248
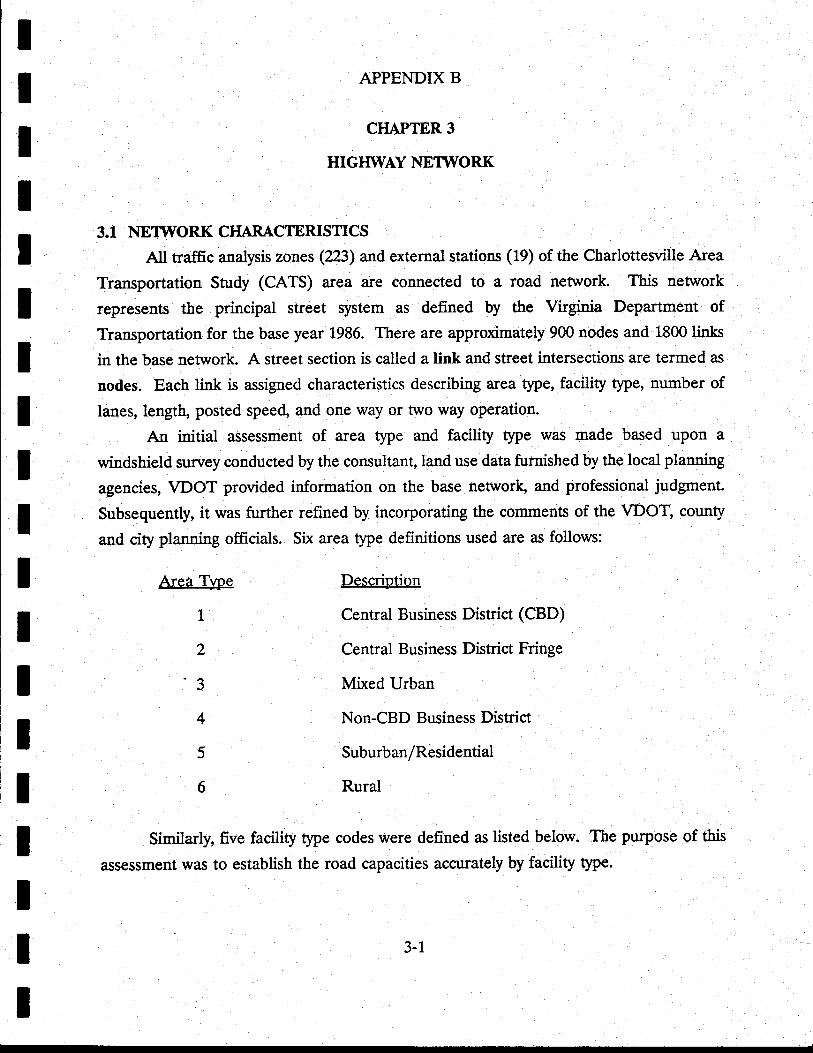
IIIIIIIIIIIIIIIItII
APPENDIX B
CHAPTER 3
HIGHWAY NETWORK
3.1 NETWORK CHAR^A.CTERISTICS
All traffic analysis zones (223)and external stations (19) of the Charlottesville Area
flansportation Study (CATS) area are connected to a road network. This network
represents the principal street system as defined by the Virginia Department of
Transportation for the base year 1986. There are approximately 900 nodes and 1800links
in the base network. A street section is called a link and street intersections are termed as
nodes. Each link is assigned characteristics describing area t1pe, facility type, number of
lanes, length, posted speed, and one way or two way operation.
An initial assessment of area type and facility type was made based upon a
windshield survey conducted by the consultant, land use data furnished by the local planning
agencies, VDOT provided information on the base network, and professional judgment.
Subsequently, it was further refined by incorporating the comments of the VDOT, county
and city planning officials. Six area type definitions used are as follows:
Area Tvpe
1.
2
J
4
)
6
Descriotion
Central Business District (CBD)
Central Business District Fringe
Mixed Urban
Non-CBD Business District
Suburban/Residential
Rural
Similarly, five facility type codes were defined as listed below. The purpose of this
assessment was to establish the road capacities accurately by facility type.
3-1
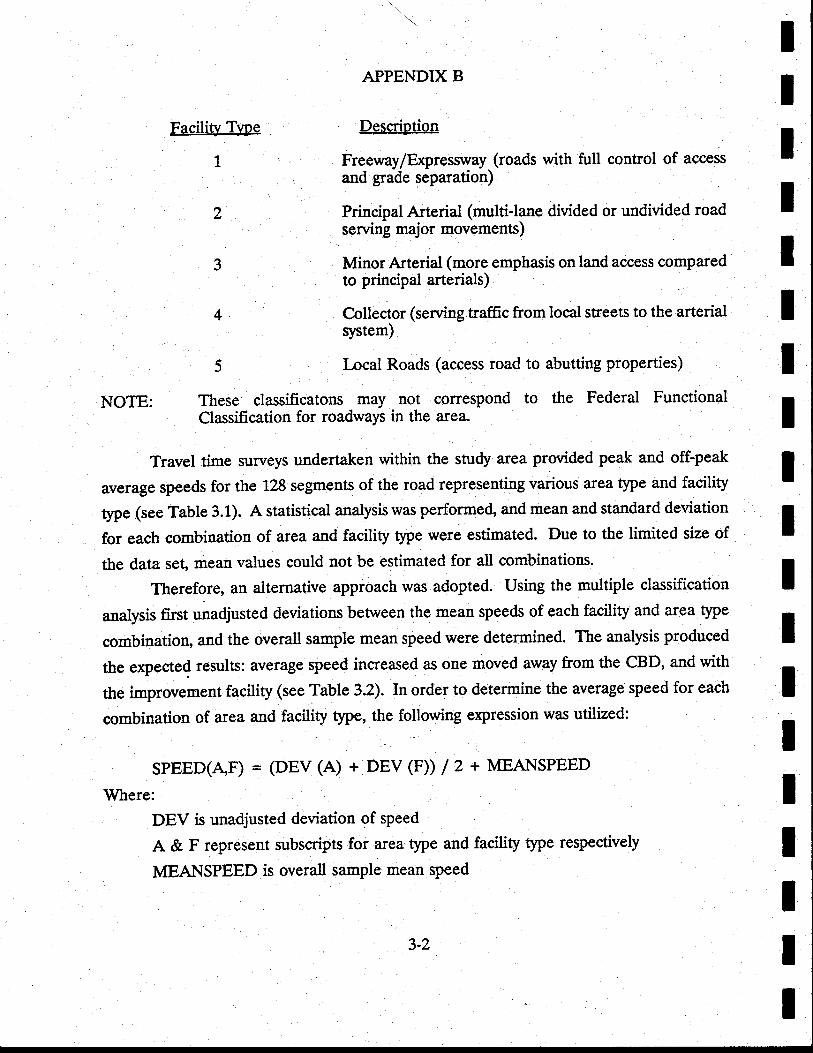
APPENDIX B
Description
Freeway/Expressq/ay (roads with fulI control of access
and grade separation)
Principal Arterial (multi-lane divided or undivided roadserving major movements)
Minor Arterial (more emphasis on land access comparedto principal arterials)
Collector (serving traffrc from local streets to the arterialsystem)
lncal Roads (access road to abutting properties)
NOTE: These classfficatons may not correspond to the Federal FunctionalClassification for roadways in the area.
Travel time suweys undertaken within the study area provided peak and off-peak
average speeds for the 128 segments of the road representing various area type and facility
type (see Table 3.1). A statistical analysis was performed, and mean and standard deviation
for each combination of area and facility qpe were estimated. Due to the limited size of
the data set, mean values could not be estimated for all combinations.
Therefore, an alternative approach was adopted. Usrng the multiple classification
analysis first unadjusted deviations between the mean speeds of each facility and area type
combinatio& and the overall sample mean speed were determined. The analysis produced
tle expected results: average speed increased as one moved away from the CBD, and with
the improvement facility (see Table 3.2). In order to determine the average speed for each
combination of area and facility type, the foflowing expression was utilized:
SPEED(A"F) = (DEV(A) + DEV(F))/2 + MEAIT{SPEED
Where:
DEV is unadjusted deviation of speed
A & F represent subscripts for area type and facility tlpe respectively
MEANSPEED is overall sample mean speed
Facility Type
1
2
3
4
5
IIIIIIIIIIIIT
IIIIII
3-2
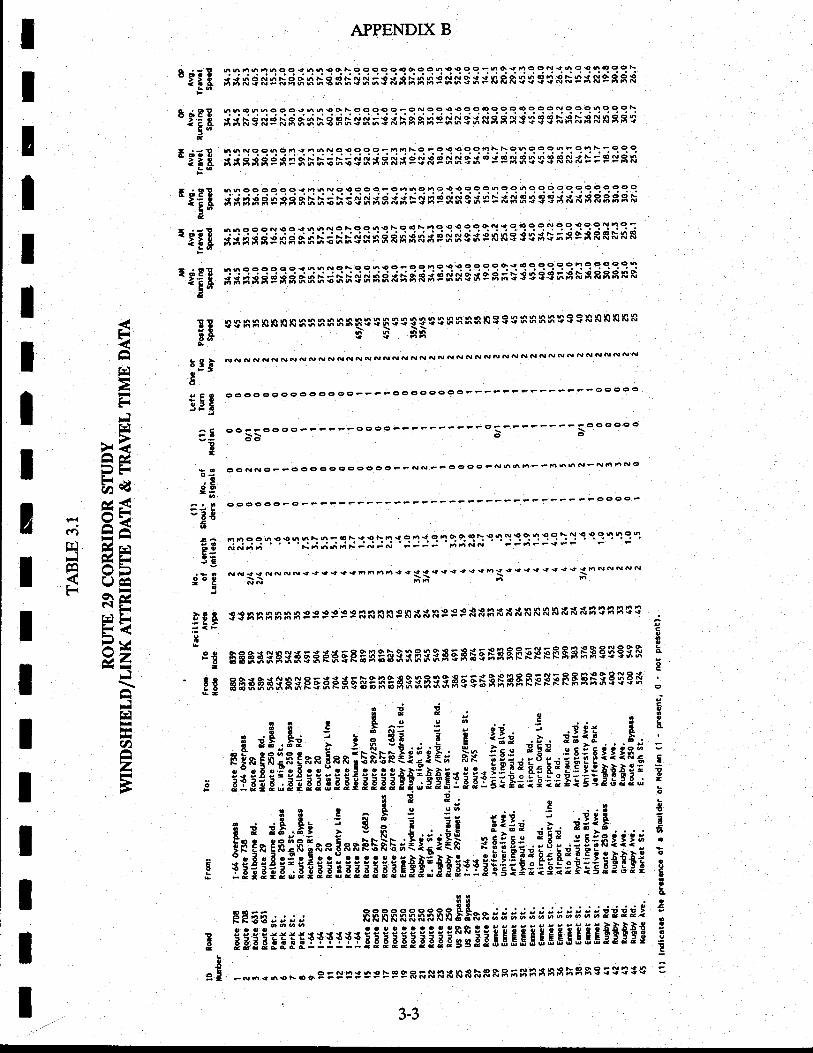
h6n6n6oee66€oNoo9?9qq9q"!9999--oimooNe6o€6oooN.; .;;;.!; I; U;; J;*;t;<i * <i r:qi n <i Nn es sp S$ SS g$ p N iS N9 gB Srnnfu aNFNn666€h6{66{dnhnnFhhsn
"! u: I v:
"': q q q 1 q ": a q \ c c c ? 9 : q
^t I 9 9 9 9 9 I ? 9 C 1 9 ? -1 ^t ? I : i ? c I \
s s x o ruo r e o6 ts e or nini -.d w r o o 6 o NN o e N gBS 3$ 3 3 FS tsn NSB g Sr- ri iw -.ri- N6 tr 6 6 O 6h { 6 69 Nn nn 6F66 { h
66NOenOn{66Ng9ooO-nmtsOFOagqOntsFO6OOO6? OhNFAOO
J; H;;!nI *x ilI*i **;d di dd$iss sil d: psns $s RN *::dlsi66eoooooi66N9999q-qqqcqq9qq9qU:?qqc99q?9?9C99qji in Bplis I h h i h i$s iE *$F$nd*d gx d> *s 3s 33 x ssH RBss F
nv: cq 9n: c'q n'rn q\q9":1\91\ "t-c:: ^q ?qn 1c 1c c6t I ?:::q'l9ai* ns sp iB s n hiih$siI Fii Ip jixx $ x pn ne:ie st;s g * RRhsR
n q q q q ? C ?.q q ": ^l ? : o o 6 e o F o o 6 c € e o o o o G { o o o o o o n o o o o o 6
s*nn Bp nB an; " **II iliI*I*
'*i fr*$ils ts;i5 3i 3s;H hsdsHs t
E iiT<ae
F
I ;83.EBd
E itn'!-'
E dER:E.e
e
T iiT<!-o
:T dPR
'!#x8t&8.-
go>
":lIItuc6o5cJba
^g
I-OJ
da2'-
-3€I
ooC-.3E.*;9"9
i6 &
oo
ooFB-' !tGZ
Ssnnngna:9P::*nRRsPnsxKgsgspnsiisnnF&Niln9n83s €,-- $
sEf; *HHH*SHpHsF$fr AFSSfrSf; HSH*5*fi gFFppFgHHSg$gsfi ;
t$*Hxf; H$F5HHH5!gAgH$snS9il5583*AFFFSpFFHSSgSe* ;
a,$ i, :, 5 gi, E t :=d .se* diii.,.i, i:i:Eg:tti: g::!:!!!;;,:;;E'::'EftuciE;E*i ;i;!: iog B B.
Epn$$ug.g$i,:E *i{ 3 tii i
it E:li:fi:: :::i:!: l;;*il": cggfu EIlligilrui itE[ ...: IFEEE.:.:.:; nnRFFRFRnn$$**iiiiiiiiiijtdjtd: :
:Biii;iirrrrn!i iili !!!!il ii xi cc scss ssEEsssst iFNFs6oFoogsgr9PPlP 9RFNRSRpNRRgfiSgXBnhnhSSgS$s :
APPENDIX B
ssnsRasn nRnnnntssQss QQS s nn nnn 3 3s nn nn s 3 3 s nsRsp
dNdNNNNNdANNNNNNNNNNNNNNNNNNNNNNNNNNNNNNNNNNN
O o o o o O o o o e O o o o F F F F O o o c o O o o F ? F ? F e _ _ o o o o o
eO-FOO90F-e-FF0OOOFF__Fr?-FeOF\\6co
-OOoOoOo
e€NNOF-OgOOgocoOgOeFNdeFOgOeFN66n??nnhNFqnnNo
eFOOOOF
nnqcu:l.q":n\q:1\'i9\'l19n1c':1:::9":6',t11',:9C\"1:99'l:n9'l^i^;dr;
Nn66nrJ"i':oi ';JJJ 'ririoo FFnFF{FF
Nds .9 NNNN 9 + { f { 9n6 6n I 9 {q9 I € { { I n {{ { I 9 { { { I -{
h NN NN N
nhnn
FAH
frJ
HFrFJF:
F<AcdPFE"dxj.1 e=(q =O3Eeq obS (JFaF REFTJ r,/AEYZFIE
F:\,-tIjt.ttslraxoHzFI
F
tIT
IIIIIId
IIII
o
g
?oc
EeE
ItIII 3-3
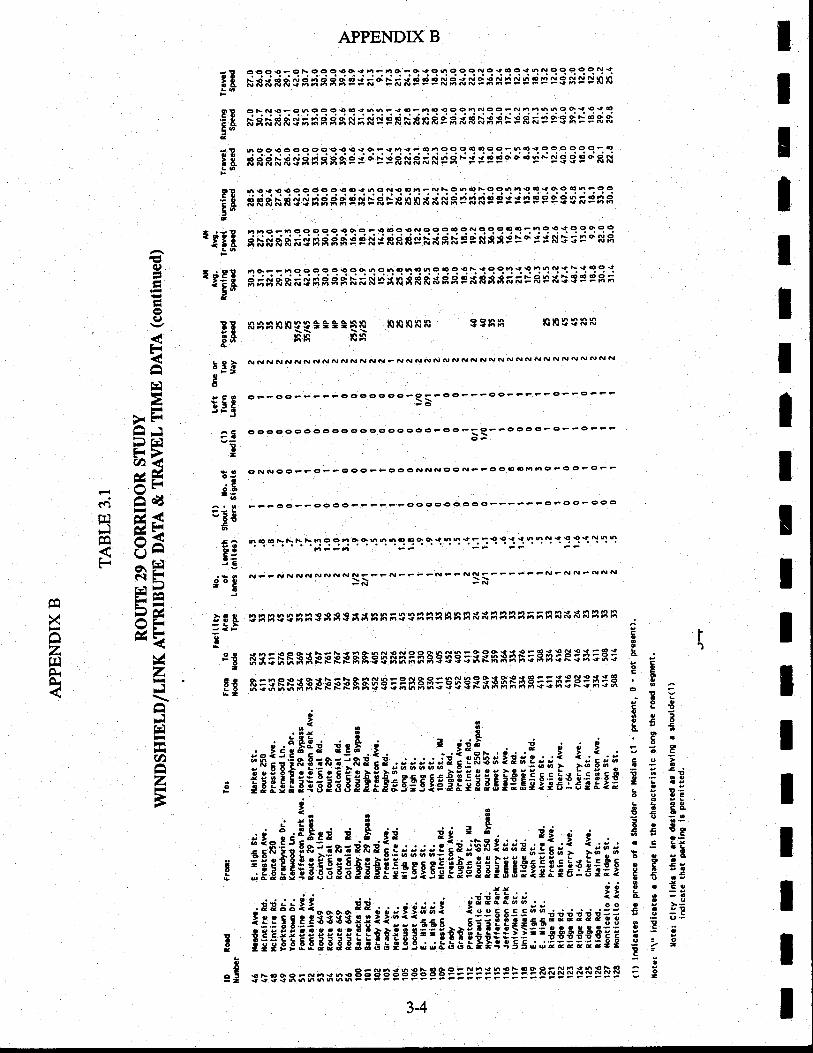
tIT
IIIII
APPENDIX B
ssnnnsQce**88 nsnnnsn Fnggnn KisSSSn
N NN NNdflNN NN NNdN FNNNNNNN NN NNNN NNN N NN NN NN N
OF-OqeF?PFOOOOOO0eOF_O9__?O0eFF_Fo_F9?F?FO
oooooeooooooocoooooo-ooF53--.eoo-oF-oFFF
ONOOO?pO--OOeF-OOONNNOONFFOOO6nn0FOOFO_-
FF-ooF-eooc*--e-Fooooo6oooP_FFFFoFooFooc
60€tshFtsnoonoq66nooo69n6{eF€€{ {66N{9 €9rynU!. . . ;-;-; -' i-' '_ n--n
N. F NN NN NNNN NE FP NF F f?dP- NN E. FF PF FN F N NF NN N
-_.\, ? N
$nn sg sn38n3 ssBnfi$ snn$ nnns*n nnnfi;n x!x s& nn$
qqqg:9\?991q11-n6Foeo6ooodo{oo€i"13::::1:N $*Fsitssg Bc d: FdlF ed d: Ns ils ecstr rP 3tr19 ds:nn
OFN9Fo69oO0€f 66F{OFnO€oOnNooFNn666oOgQ{O
* dt dd *;iBds ^iririd
dR NRnR e siRNss: ! R ee e c c: P &R
g.! qq 99 qc gq q1 9 1 q- s n {- on c o q e 9e 9- s:q'q q q9 cc 9: q*** **sE*s Bsp j dF PR sRFse s r::id'dd d": d d dd oR *
n f .i99 q? qq ?111":? "t: q1:"t\ ? ":1\ -: -9v:n9 i: ?:1"::::s8&FF $$rjggs Pg>R>* nn *p sg pnReP::PPPeSsFPnB
n 6 o F n o o o o o e o o F €.q o 9.! c c e'q q n c c I q I : n q : : ? I q I "s$riRiRix;$ nE 8s pP di iR sPF*8F Pa NggP>':: Ns 5 P o l!9
4 q : : n q q c ? ? 1 q q u.. o ^ @ 6 o 6 e o o € N { o o n e o i: "'! I : :
-1 : -9'1s;s RiRin s nBssNF NFxn sF e*ss PsdssE i: R= x5 s= ps;
** =
*f;ssFFFpHS €S*ff 3fiHe t€ 5s3n sil*i H* € H i il=H ifi is f;f *g pF FFgn$s 53ftgfi:et g R $* $**H i= S: p€ Hi H
9-
!! i iiii:*ii;r;: !i?iiE! iii;is;l i i s, tu i i g
.ie 8.. ,esieii li:iu;riri!,,, *!i:j:ii,,*'li u: irrr; i g E! i 3 ; g i : 3E
g! ; !is! s! ! gE E E F$ $
g! ; E ; s t e ; c:,!., ' .ii;; !:
:;i i iiir: r:ir fifi ii= s,,siiliii::gEEEEi! iE!!!!E5EEE!5EI
s! s s a nnnx** FF HEEp 9E Fg:=:::::::3 F!S! FSSFE
34
ig
to4I
o5t2
nXt&
EIE-*c
J!oo-&
TT
E'*c
"iEr d8l.E#4
t3;&t'LO>oto>t26Pc6ftcJh {J
AC-tO-
;B--:i!-t{c
P:9.E..;g"H
rt&oa
e{a
GOe3g:
IIIIIIIIIII
?rn;\;.q'9C8go!9roE e€3oE6COg9=c-'.8.eaC
E::? 3:s-
g ae:ttEo !Loo
o o ceS € 9.E e €;
!-a g !t- agt . -a; F E;
c33I I aeI o toh t :ti . e!e u 'g! O-8Eo!o
!..e
v-
o
€€)-aFtt
3-Fo9\J-FI
trlEH
>ErFr\EHprdF>o<eEXFvc.i A€El E*d t!S (JFTlrr r-'!' €\F6lF
t-t DE-Lt-:>e5 0F'/^ 4-eaLlqlxAZO--4Fl \.
-F'Fl
.FFHoa\EzF
t?
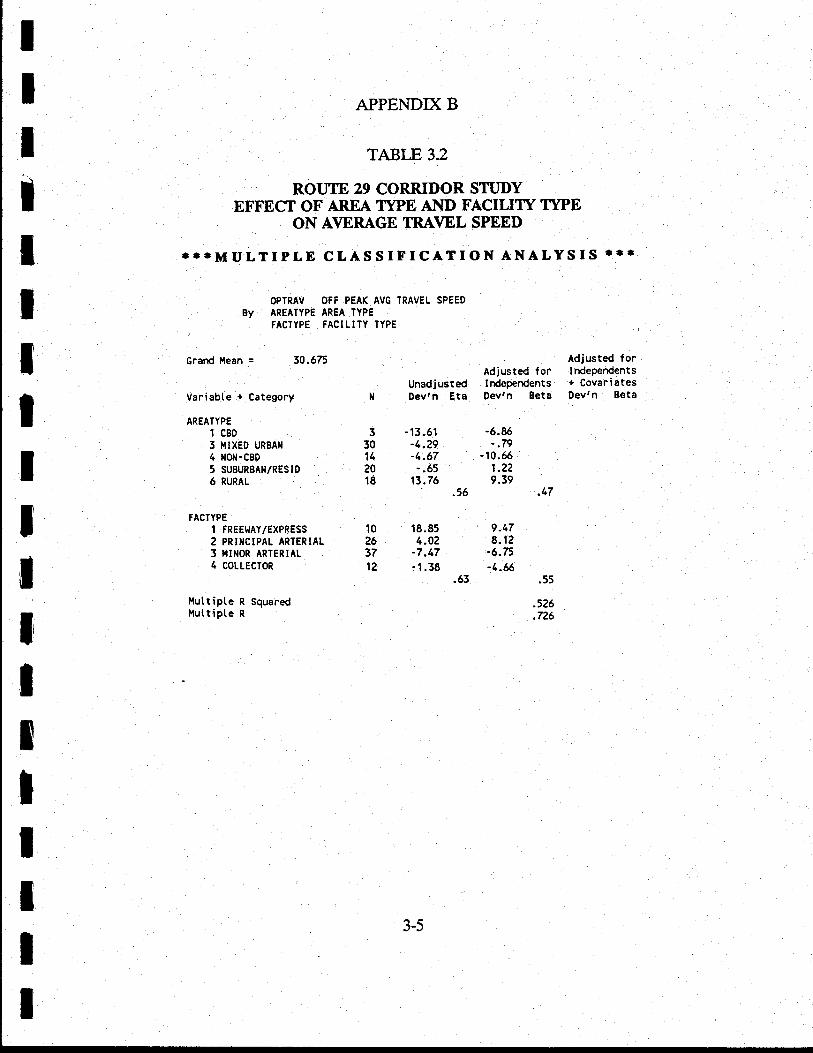
.55
.5?6
.726
330142018
10263712
IItIIIIIIttI'
tlIItII
APPENDIX B
TABI-E 3.2
ROUIE 29 CORRIDOR STUDYEFFECT OF AREA TYPE AI\D FACILITY TYPE
ON A\IERAGE TRAVEL SPEED
'!..MULTIPLE CLASSIFICATION ANALYSIS ..'
OPIRAV OFF PEAK AVG TRAVEL SPEED
BY AREATYPE AREA IYPEFACTYPE FACILITY TYPE
Grand i'lean = 50.675Adjusted forIrdeperdentsDev'n Beta
-6.86-.79
- 10.651.229.39
.17
9 -178.12
-6.75
-4.6
Adjusted forI ndeperdents+ CovariatesDev,n EetaVariable + Category
AREATYPE
1 CBD
3 MIXED URBAN4 [o]t-cBD5 SUBURBAN/RESID6 RURAL
fACTYPEI fREEITAYIEXPRESS2 PRINCIPAL ARTERIAL3 ilINOR ARTERIAL4 COLLECTOR
l.tuttipl.e R Squarediluttipte R
UnadjustedDevtn Eta
-13.61-1.29-1.67-.65
13.76.56
18.854.02
-7.47-1.38
.63
3-5
APPENDIX B
Table 3.3 illustrates the speed/service volume table developed for the initial
development of the travel demand models. Service volumes were originally taken from the
HNET module of the UTPS package, but slightly modified later in consultation with VDOT
officials. For local roads within the CBD frrnge area (i.e., area qrpe 2 and facility qpe 5)
the service volume was set arbitrarily high, 10,000 vehicles per hour per lane. It was
essential to avoid the effect of congestion on centroid connectors.
32 BUILDING NETWORK
32.1 DigitizingNerwork
For the display of the network on the computer screen, the nenvork map provided
by VDOT to the consultant was digitized. Each node of the network (nodes usually
represent road intersections) was assigned X and Y coordinates. A data file of coordinates
(RT29XY.DAT) was created for the NETBLD module of MINUTP. This particular task
was essential to display the network as well as otler relevant information related to
indivtdual links on the screen. The NETVUE module of MINUTP permitted an interactive
visual manipulation (e.g., debugging and editing) of nenvork files.
322 Develoning Link Data
VDOT furnished to the consultant a computer file consisting of distance, number of
lanes, and one or two-way operation for each link of the network. Information from the
above file along with the speed/capacity table developed by the consultant formed a new
link data file.
323 Building Nerwork File
Using the node coordinate file and the link data file as input, the NETBLD module
of MINUTP formed an internal network. The network file (RT2920.dat) was later utilized
to develop interzonal impedance matrix as well as assignment.
IIIlIIT
IIlT
IIrIttII
3-6
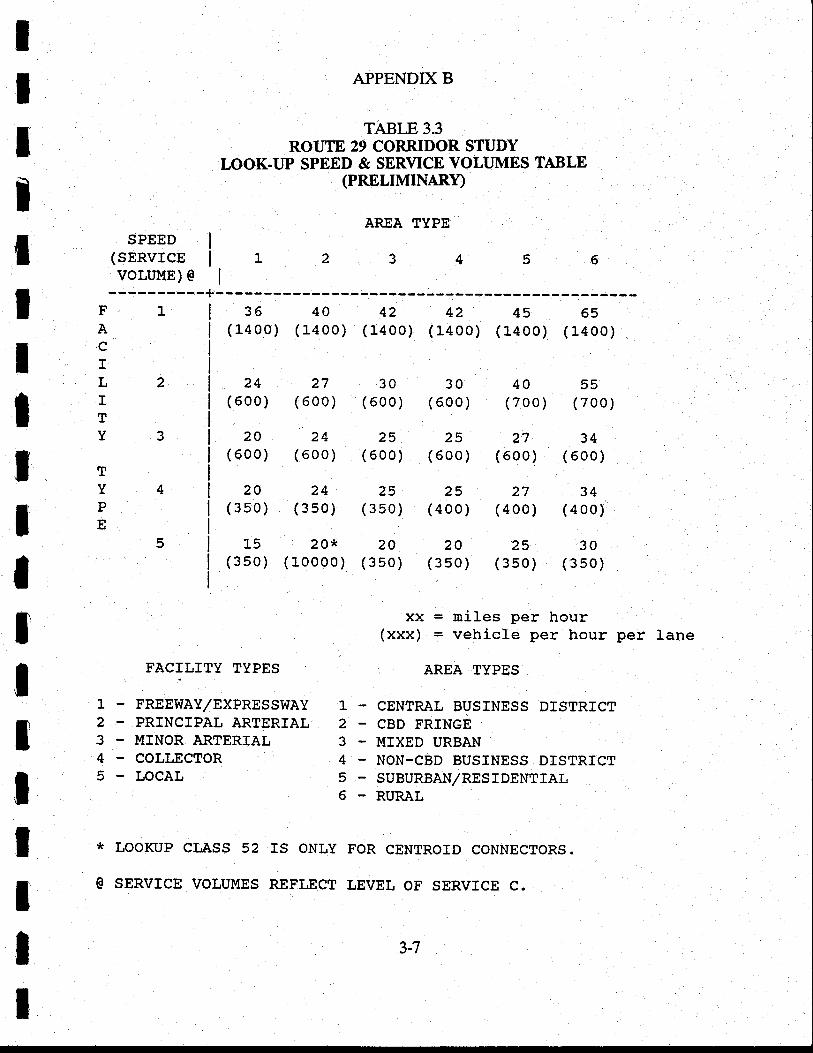
tIIIIIIIIIIIIIItIlT
SPEED I
(sERVrcE I L 2voLnME) e I
APPENDIX B
TABLE 3.3ROUTE 29 CORRIDOR STUDY
LOOK-IJP SPEED & SERVICE VOLT'MES TABLE(PRBLIMINARY)
AREA TYPE
3456
FAcILITY
TYPE
36 40 42 42 45 65(r.40o) (l_400) (1,400) (L400) (L400) (1400)
FACTLITY TYPES
FREEWAY/EXPRESSWAY- PRINCIPAL ARTERIAL- MINOR ARTERTAL
COLTECTORLOCAL
LOOKUP CI,ASS 52 IS ONLY
SERVICE VOLUMES REFLECT
30 30 40 55(6oo) (5oo) (7oo) (7oo)
25 25 27 34(600) (6oo) (6oo) (6oo)
25 25 27 34(350) (4oo) (4oo) (400)
20 20 25 30(3so) (350) (350) (350)
xx = miles per hour(xxx) = vehicle per hour per lane
AREA TYPES
CENTRAL BUSTNESS DISTRICTCBD FRINGEMTXED URBANNON-CBD BUSINESS DISTRICTSUBURBAN/RESTDENTIALRURAL
FOR CENTROID CONNECTORS.
LEVEL OF SERVICE C.
5
24 27(600) (600)
20 24(600) (600)
2A 24(3s0) (350)
15 2}rt(350) (10000)
L
2
3
4
3
L23-456
3-7
APPENDX B
33 ESTIIVIATING IMPEDAI{CE
The impedance is a measure of spatial separation between traffic analysis zones.
Usually it is expressed in terrns of travel time or generalized cost (a combination of travel
cost and monetized value of travel time). For the CATS area the impedance represented
total highway travel time only. The total highway travel time betrveen zones consisted of
"over the road" travel times and terminal times.
The intrazonal travel times were set to 50 percent of the over the road travel time
to the nearest zone. Terminal time for the origin and destination zones is the time
necessary to walk to the car and leave the parking lot/driveway to actually enter the street
system. A terminal time of 2 minutes was assigned to CBD (zone L through 10) and IrVA
zones (57-59,61, 85-89, 92, t63,166, 168). For the remaining city zones (11-56, 60,62-84,
90-91) and US 29 corridor zones (Il7-LIg, L24-t26,128) one minute terminal time was
applied. No terminal time was assigned to the zones in the rural areas.
To obtain the impedance between all interchanges and for the intrazonal movements,
the PTIIBLD module of the MINUTP program was used. This module reads the network
file (RT2920.DAT) to build the minimum travel time paths over the road from each origin
zone to all other zones and then adds terminal t'mes and intrazonal values. The final
output of the program is an impedance matrix file (RT2911.DAT).
III3
IIIIlIIlIT
IIIII
3-8
IItIT
IItIIIIIttIIII
APPENDIX B
CHAPTER 4
TRIP DISTRJBUTION MODEL
4.1 INTRODUCTION
The trip distribution model is the second model of the travel demand modeling chain.
This model estimates travel between traffic analysis zones (TAZs) using the productions and
attractions of each TAZ,as well as highway travel times between each zonal pair. For the
study area" the trip distribution process was applied separately for each of the two categories
of travel markets: internal trips, and trips with one end outside of the study area (i.e., I-X
and X-I trips).
For internal-internal trips, a standard gravity model formulation was selected. Three
models were calibrated to replicate the observed travel patterns for each of the three trip
purposes. The 1988 household survey data and travel times estimated from a t987 highway
network (Chapter 3) were used to calibrate the model. The calibration technique used
commonly applied statistical methods as discussed in the following section.
To develop future internal-external (I-X) and external-internal (XJ) trip patterns,
fratar type distribution models were used. The fratar process factored the observed travel
pattern using the growth factors to reflect the predicted changes in trip productions and
This chapter presents the methodologlr and calibration results of the three gravity
models developed for distributing the internal person trips by motorized mode for each of
the three trip purposes. Since the fratar process factors the observed trip pattern, there was
no need to calibrate distribution models for I-X/X-I trips.
42 TRIP DISTRJBUTION MODELS FOR INTERNAL TRIPS
42.1 Base Data
The distribution models for all three trip purposes were calibrated using tbe origin-
destination data from the 1988 home intewiew survey. The observed number of trips in
each interchange was obtained from the survey. However, to obtain the highway uavel time
for each interchange, the PTHBLD program module of MINUTP was used. This program
read the existing highway nenrork information and produced minimum travel times
4-t
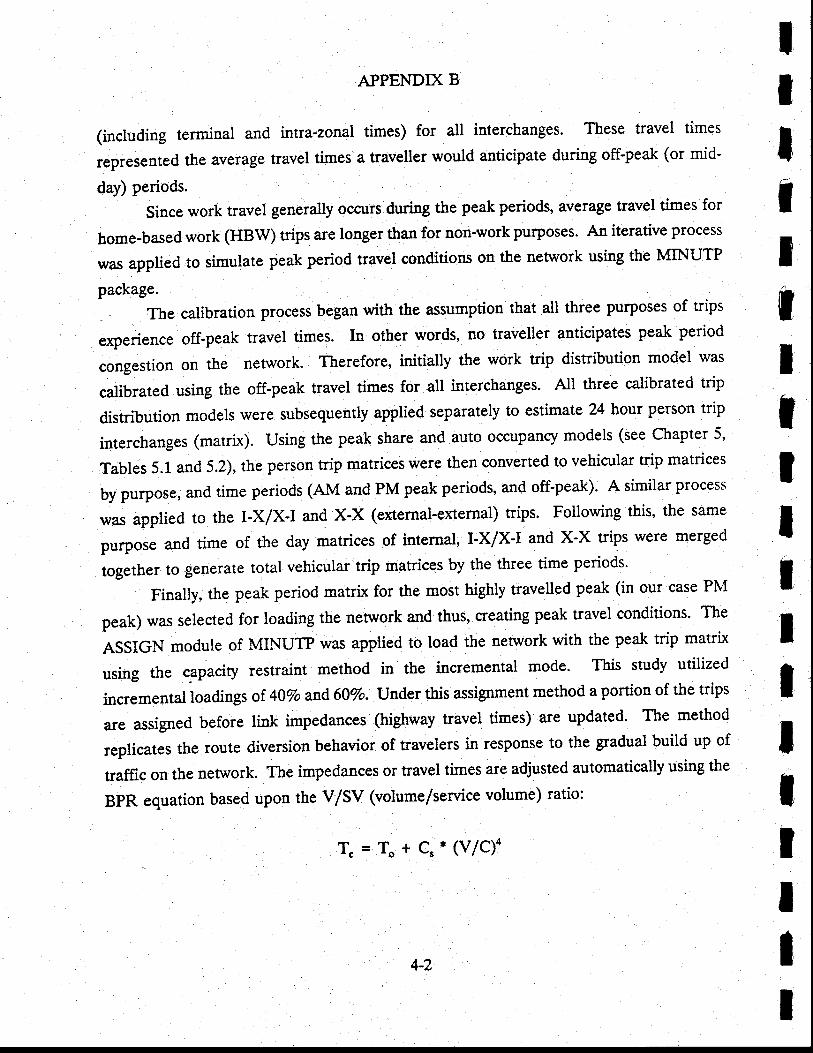
APPENDIX B
(including terminal and intra-zonal times) for all interchanges. These travel times
represented the average travel times a traveller would anticipate during off-peak (or mid-
day) periods.
Since work travel generally occlus during the peak periods, average travel times for
home-based work GIBW) trips are longer than for non-work purposes. An iterative Process
was applied to simulate peak period travel conditions on the network using the MINUTP
package.
The calibration process began with the assumptiot *il all three Purposes of uinl
experience off-peak travel times. In other words, no travell".t u:rt.llates peak period
congestion on the network. Therefore, initially the work trip distribution model was
calibrated using the off-peak travel times for all interchanges. All three calibrated trip
distribution models were subsequently applied separately to estimate 24 hour person trip
interchanges (matrix). Using the peak share and auto occupancy models (see chapter 5,
Tables 5.1 and 5.2), the person trip matrices were then converted to vehicular trip matrices
by purpose, and time periods (AM and PM peak periods, and off-peak)' A simiiar process
was applied to the I-X/XJ and X-X (external-external) trips. Following this, the same
purpose and time of the day matrices of internal, I-x/x-I and X-X trips were merged
together to generate total vehicular trip matrices by the three time periods.
Finally, the peak period matrix for the most highly travelled peak (in our case PM
peak) was selected for loading the nenvork and thus, creating peak travel conditions. The
ASSIGN module of MINUTp was applied to load the network with the peak trip matrix
using the capacity restraint method in the incremental mode. This study utiiized
incremental loadings of 40Vo and 60Vo. Under this assignment method a portion of the trips
are assigned before link impedances (highway favel times) are updated' The method
replicates the route diversion behavior of travelers in response to the gradual build up of
traffic on the network. The impedances or travel times are adjusted automatically using the
BpR equation based upon the v/sv (volume/service volume) ratio:
T"=To*Cr'(V/Cf
ItIIIIItIIItIIIIIII
4-2
T
tT
IIt,
lIIIIIIIT
ItIT
APPENDIX B
Where:
T.
T,qvlc
Congested time
Original time
Coefficient by speed class (a value of .15 is used)
Volume/capacity ratio
The congested speeds are one of the final oulputs of the above process. At this stage,
PTFIBLD module is used to develop the peak impedance matrix using congested network
speeds.
The estimated peak travel times were finally used for the calibration of the FIBW trip
distribution model. The iterative process was stopped after one run.
43 CALIBRATION METHODOLOGY
The trip distribution model developed for the study area was the standard gravity
model. The gravity model postulates that the number of trips between a given zone and all
other zones is directly proportional to the relative attractiveness (measured by number of
attractions) of the zones and inversely proportional to the travel impedance beMeen zones.
Tbe model can be expressed empirically as follows:
TRIP(I,J) = PROD(I) . ATTR(J) 'FRIC(IMP(I.D) . K(I'J)
suM oF (ATTR(J) . FRIC(IMP(I,J)) ' K(I,J))
Where:
TRIP(I,J) is the number of trips produced by zone I and attracted to zone J.
PROD(I) is the productions for zone I.
ATTR(J) is the attractions for zone J.
FRIC(IMP(I,J)) is the friction factor associated with the impedance (IlufP) from zone
I to zone J.
K(I,J) is the socio-economic factor (K) associated with the movement between zone
I and zone J.
The usual procedure for calibrating a trip distributioo model is to first estimate the
FRIC factors,rmhich best replicate the observed trip length distribution and then explore the
4-3
APPENDIX B
K factors. The use for K factors was not necessary in this particular case. In general its use
should be avoided and [mited only to compensate for distributional error caused by any
physical barrier and / or measurable socio-economic characteristics.
Development of FRIC factors for each purpose was based upon a mathematical
relationship between the highway times and FRIC. This relationship was assumed to follow
the gamma distribution as expressed:
FRIC (I) = A'I(B) * EXP (C'DlVhere;
A B, and C are the calibrated coefficients.
I is the impedance value, in this case highway times.
EXP is the exPonential function.
To estimate coefficients, the above equation was linearized prior to applying a
regtession Procedure:
LN [FRIC(I)] = A + B t tN(I) + C * I
Where:
LN represents natural logarithm.
The initial set of FRIC factors provided by VDOT were first applied to distribute the
productions.and attractions as calculated by the trip generation models (TRPGEN module
of the MINUTP package). The trip length frequency distributions of the 1988 household
survey and gravity model produced trips for each purpose were then compared. In addition
to a visual inspection of nryo trip length distribution curves, the difference between the
averagetrip lenghs were computed for each trip purpose. This difference was kept within
+ /- S percent. Wben the comparison was not found satisfactory, a new set of FRIC factors
for each one minute increment of travel time was calculated using the following e4pression:
FRIC(ADJ) = FRIC(USED) * (Vo OD / Vo GM)
J
tIII'lItIIIIIIttIIt
44
IIT
II
APPENDIX B
Where:
FzuC(ADJ) is the adjusted friction factor to be used in the next run of the model
(TRPDST module).
FRIC(USED) is the friction factor used in the model run being analyzed.
Vo OD represents survey triPs.
Vo GM represents the estimated trips from the gravity model run being analyzed.
The FRIC(ADJ) were then regressed using the aforementioned gamma distribution
formulation. In order to give each minute of travel time its proper weight, observations
were weighted by the number of observed trips.
Using SPSS, a least squares fit was obtained along with the estimated values of the
coefficients. Subsequently, a new set of FRIC factors for each one minute increments were
estimated for the next calibration run of the model using the calibrated gamma distribution
equation.
The above process was repeated several times until it was ascertained that : (1) the
average travel time for the obsemed and estimated trips were within 5 percent; (2) the new
set of FRIC factors did not show a marked improvement in matching the estimated and
observed trips.
4.4 CALIBRATION RESULTS
4.4.1 Non-llbrk Purooses
The bome-based other and non-home based trip distribution models were able to
match the estimated and observed average travel times within less than 2.6 percent. A
sunmary of iteration results is shown in Table 4.1. The total number of iteration runs made
for the final calibration of HBO and NHB purposes were four and three respectively.
Figures 4.1 and 4.2 display observed and calibrated model estimated trip length
frequency curves for HBO and NHB purposes. A review of these curves show that the
models were estimating trips for each impedance unit reasonably close to the obsened trips
without exhibiting any major bias with respect to specific sets of impedance units.
A summary of final F-factors and a complete listing of observed and estimated trips
by each unit of travel time are displayed in Tables 4.2 and 4-3.
tIIItItIIIIIII
4-5
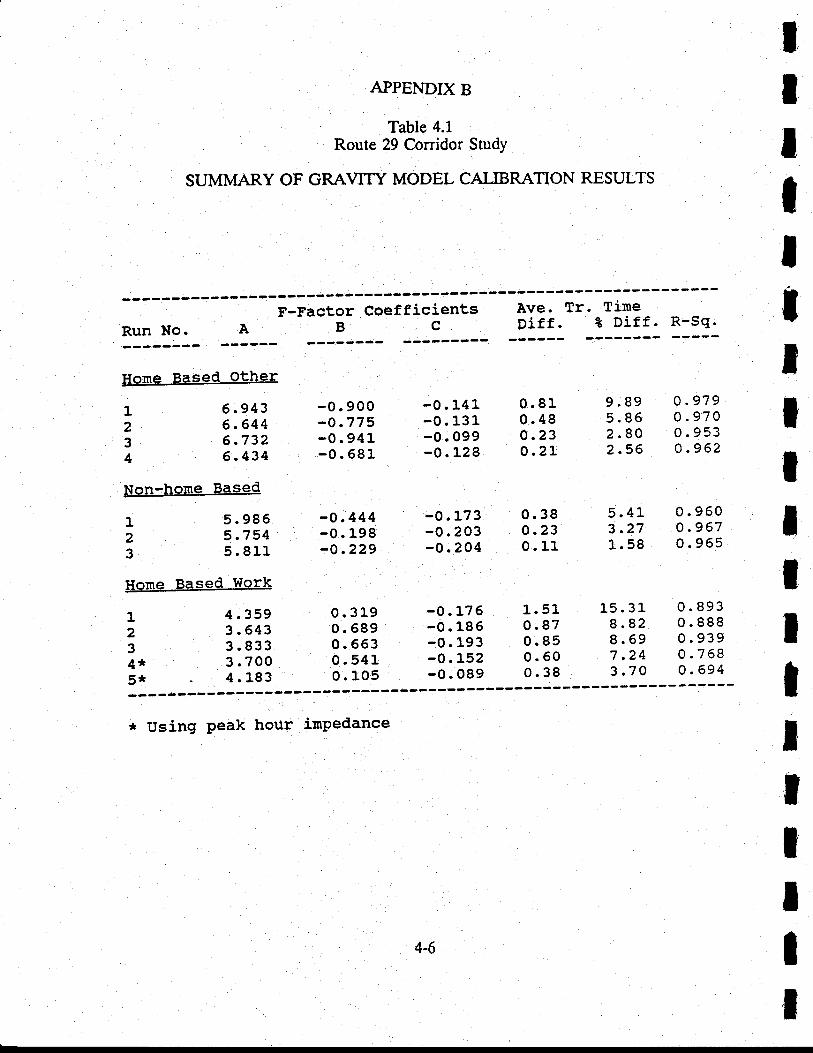
APPENDIX B
Table 4-1Route 29 Conidor Srudy
SUMMARY OF GRAWTY MODEL CALIBRATION RESULTS
tIItIItIIlIIIItIIII
F-Factor Coefficients Ave' Tr' TineRunNo. A B C Diff' ?Diff'RSq'
Home Based other
1 6.9432 6.644g 5.7324 6.434
Non:horne Based
1 5.9862 5.7543 5.811
-0.900-o.775-0.941-0.681
-o .444-0. 198-0.229
-0.141 0.81,-0.131 0.48-0.099 0.23-o.L28 0.2L
-o.L73 0.38-0.203 0.23-o.204 0. Ll
9.89 0.9795.86 0 .97 A
2.80 0.9532.56 0 .962
5.41 0.9603.27 0.9671.58 0.965
Home Based Work
1 4.359 0.319 -0'179 1'51 15'31 O' 893
2 3.643 0.689 -0'186 o'87 8'82 0'888; 3.8ia 0.563 -0'193 o'85 8'6e o'e3e4* 3.700 0.541 -0.152 0'60 7 '24 0'768
::--------::::i------3:T:------3:133----3:11-----119---9:331-* Using peak hour imPedance
4-6
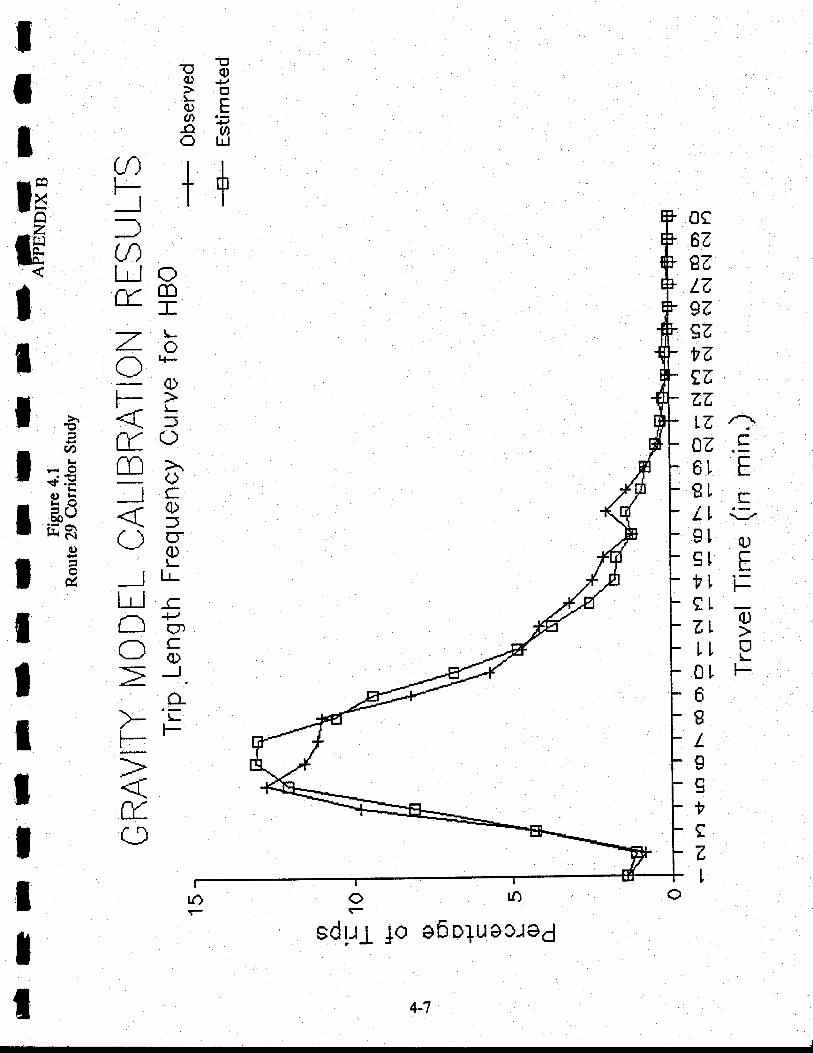
EE(l)trgfrttll
OC
67,87lz97ge,afezzLT ,:}oz .g6r E8t ctlL l' \-/gt q)
st, Ert trfLl-Lgrr g0t F6g
/gg
ne7,
t
omIL.oq)
l-:)()
>\OCq)
CT{)t-
t-r-
(7)cq)
o-'r
Il€
/€
ls€l$*
Q)IE,|
IIIIlI
3 rfi
sd r-r1 ]o eb o1u aored
4-7I
aF_J:)aLr-lrc.
ZoFtr_f,o
-lO
-J[JOC
F
u(:
IItlH
zqt
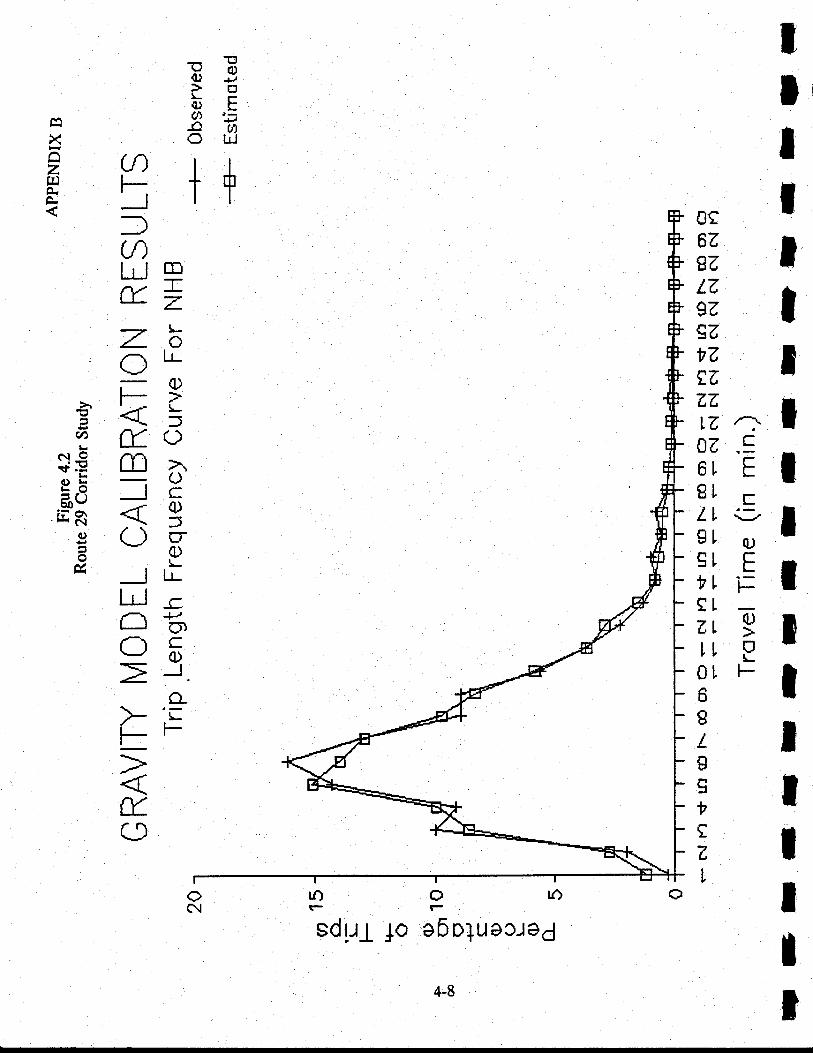
EEPo(l)tgfiArlF ++_Jrr:)aIJPE*
X
zn
tIt
ortE1-It2 l97trittlll:iF IgL r6t ;l;t € rqL
Ii f; I:' F Iilg
;tzr'l
I
LZ.oL-
\-/CI\s k=6 ()
r- l--l- \r
$€ co >\rr r>9b I!'r) -J
r-
iflRq () rTE \-/bv4t-FrJh
L! -cnEC0)
o-
>tr-()
trO C) lO
I
sd r"r1 ]o a 6 o1u e or ed
t
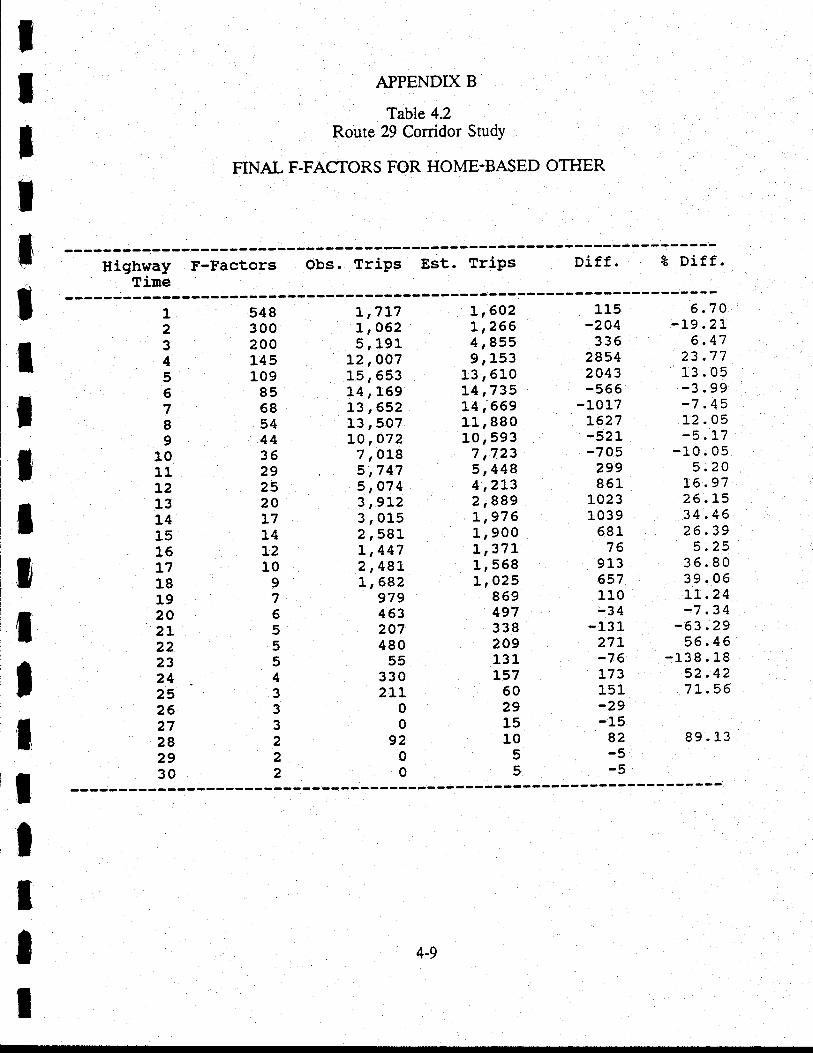
IItI't
II
APPENDIX B
Table 4.2Route 29 Corridor StudY
FINAL F.FACTORS FOR HOME-BASED OTFTER
Highway F-FactorsTine
Obs. Trips Est. TriPs Diff. z Diff.
IIJ
IIt
123456789
1011T213141515L71819202L222324252627282930
548300200145109
8568544435292520L714L210
9765554333222
I t7L7l, 0625, 191
L2 , OO715, 65314, 169t3 ,65213,507LO , O727r0185,7475,0743,9L23r0152,58LL,4472 ,48]-1,682
979463207480
553302LT
00
9200
L t602Lr2664,8559r153
13,610t4,735t4 ,66911,88010,593
7 ,7235,4484,2r32,8891,9761r9ooL,37L1, 558L,O25
85949733820913LL57
60291510
55
115-204
33628542043-566
-1017L627-52t-705
299861
10231039
58176
913657110-34
-13 1271-76173151-29-15
82-5-5
6.74-L9.2t
6 .4723.7713 .05-3.99-7.451"2 .05
-L0. o55.20
16.9726.1534.4626,39
3. Z235.8039.05TL.24-7.34
-63,2956,46
-L38.1-852.427I.56
89. L3
4-9
IItIt
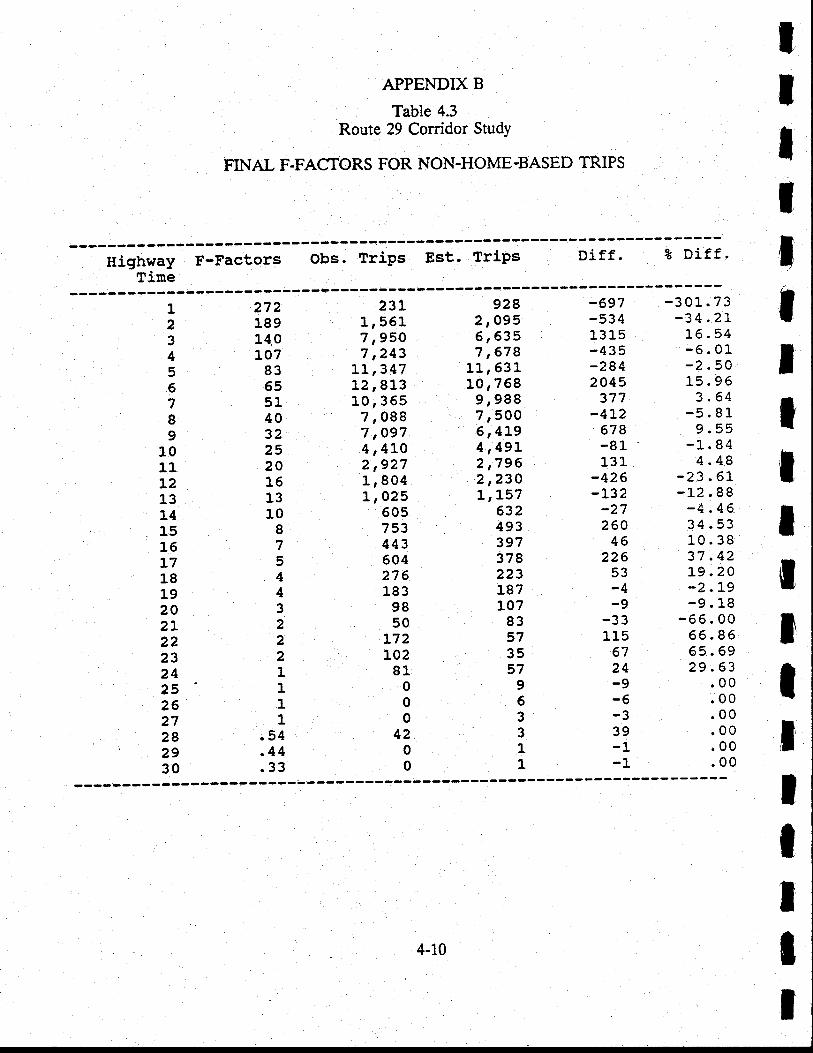
APPENDIX B
Table 4.3Route 29 Corridor StudY
FINAL F.FACTORS FOR NON-HOME.BASED TRIPS
--- ttign*.y F-Factors Obs. Trips Est. Trips Diff ' Z Diff'Tirne
tIItIII
IIIIIt
1234567I9
1011L213141516T71819202L22232425262728'2930
23r1r5617 ,95O7 ,243
LL,347
9282,O956r6357,678
11,63LLO ,7 689,9887r5006,4j.94 ,49L2,7962,23OL,L57
632493397378223187LO7
83573557
963311
-697-53413 L5-435-2842045
377-4r2
678-81131
-426-:J32-27260
46226
53-4-9
-33115
6724-9-6-339-1-1
-301.73-34.2rL6.54-6.0L-2.50L5.96
3 .64-5.8L9.55
-L. 844 .48
-23 .6L-12.88-4 .4634.531,0.3837.42:j9.20-2.49-9. 1.8
-65. 0066.8665.6929 .63
.00
.00
.00
.00
.00
.00
27218914.0LO7
8365 L2,8135140322520161310
8754432221111
.54
.44
.33
10,3657r0887 ,O974 ,ALO2,9271r8041r025
605753443504276183
9850
L72L02
810'o0
4200
IIT
II
4-10
ttIltIItIIIIIItIII
APPENDIX B
4.42 Home-Based Work Puroose
The home-based work model was calibrated using the sasre methodologies as used
under non-work models. Five iterations of the F-factor calibration procedures were
performed. Table 4.l illustrates the coeffrcients of Gamma function equation developed for
each iteration. The highway travel times used for the last two iterations were the simulated
peak ravel times.
The difference between ttre estimated travel time (9.78 minutes) and the observed
travel time (10.16 nin.) was only 3.7 percent. Table 4.4 displays the final F-factors and a
list of estimated differences between the obsewed and estimated trips for each unit of tiavel
time. Similarly Figure 4.3 shows the obsemed and model generated trip lengh frequency
curves. A visual inspection of these curves suggests that the calibrated model performs well
in replicating the observed trip lenglh distribution of internal trips.
4-11
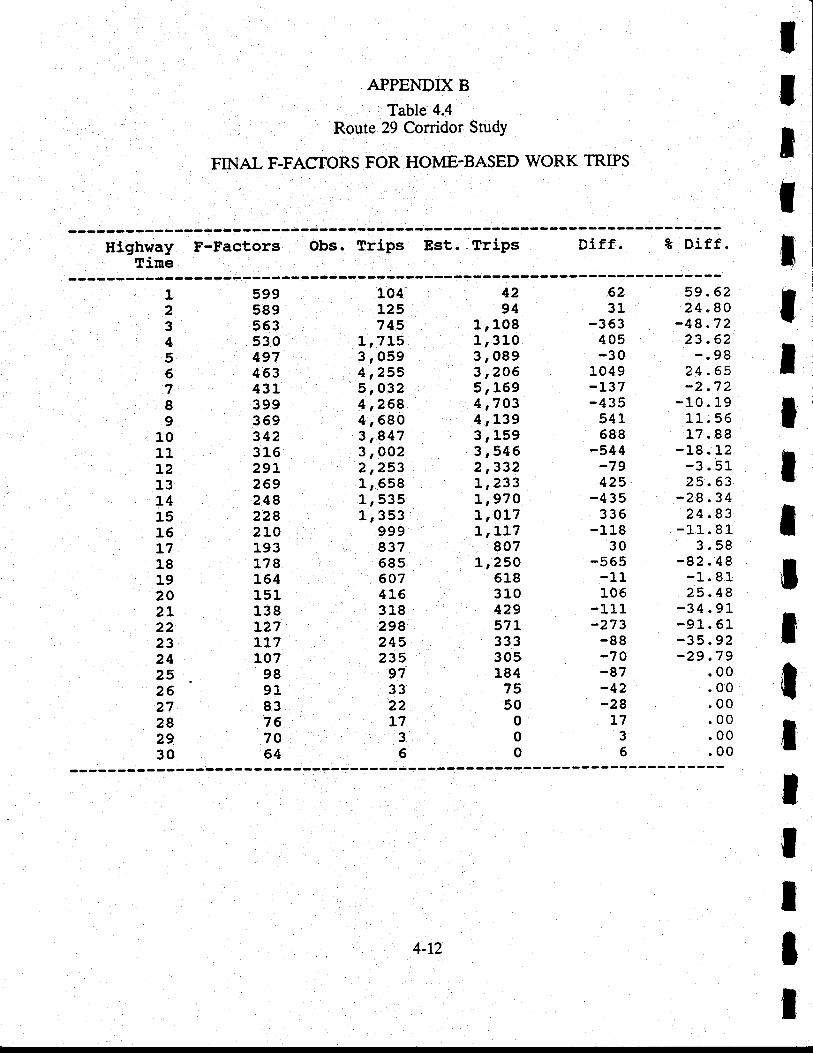
APPENDIX B
Table 4.4Route 29 Corridor StudY
FINAL F.FACTORS FOR HOME.BASED WORK TRIPS
tIII
Highway F-FactorsTime
Obs. Trips EEt. Trips Diff. z Diff. I123456789
1011L213t41516L71819202L222324252627282930
59958956353049746343139936934231629L26924e2282ro193178154151138127tL7107
989183767A64
104L25745
L,7L53r0594,2555 r4324 12684r6803,8473r0022,2531r5581, 5351r353
9998376856A74L6318298245235
973322L7
35
4294
1r1081r 3103r0893,2065, 1594,7434 rL393r1593r5462,332L,233L,97 O
1r017L,Lr7
847L,25O
61831042957L333305184
7550
00o
6231
-363405-30
1049-1J-37-435
541688
-544-79425
-4 35336
-L1,830
-565-1L106
-Ll.1-273-88-74-87-42-28I7
35
59 .6224.80
-48.7223 .62-. 98
24 .65-2.72
-L0. L91"1. 56L7.88
-18. L2-3.5125.63
-28.3424.83
-Lr-. 8L3.58
-82.48-1.8125.48
-34.9L-91.5L-35.92-29.79
.00
.00
.00
.00
.00
.00
tIIII
IttttIIt
4-t2
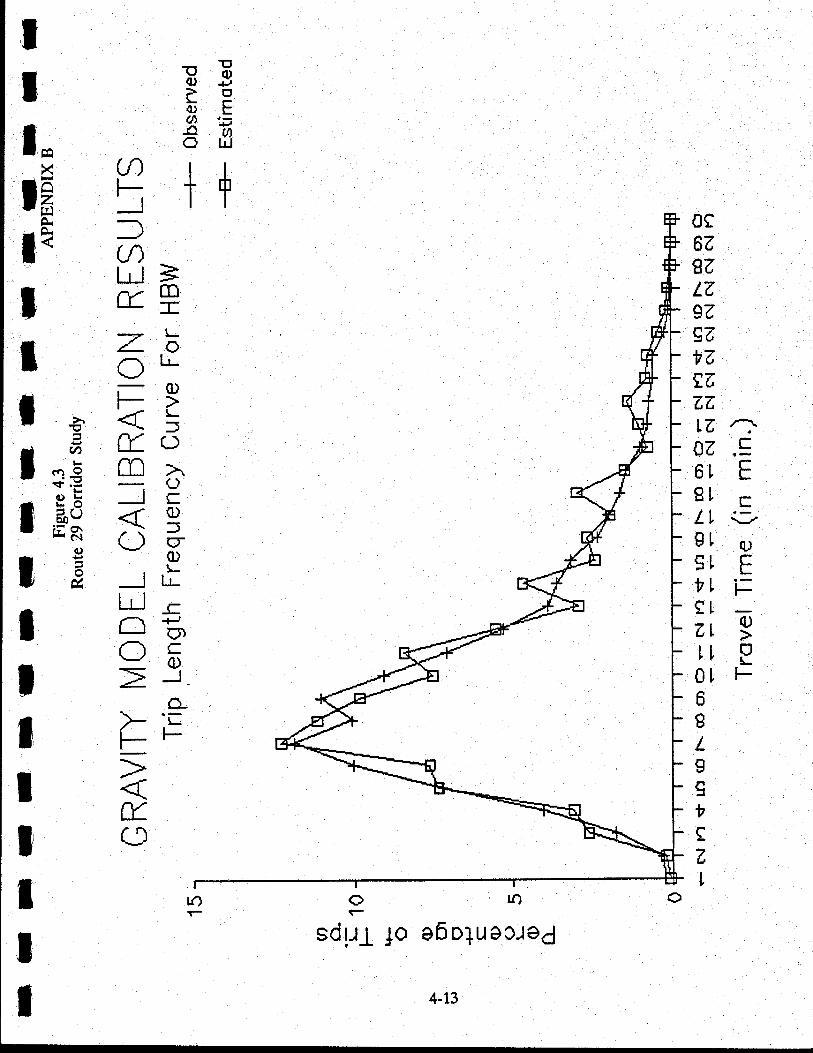
EEPE(t)tgfr
IT
I,.X
IH
1t
t
U)FfU)LJJ3
CD
=t-Z-oC LL
0)t-tr_(Jm>\
C)rc
O+0)
JtilJ-=r_r U)NC
=_3
OC
6ZgzIZ97g7n7fe7,T,tznoz .f6r f8L clI i]gL q'lsr Etl trfrzL9rr g0t F6g
tgg
n
tle
Jl*!rf .=L'
- gbr-F3EN
c)IEII o-
F
ezI
otosd u1 Jo ab o1u acrad
++
F
tr_(}
T
IItT
t 4-13
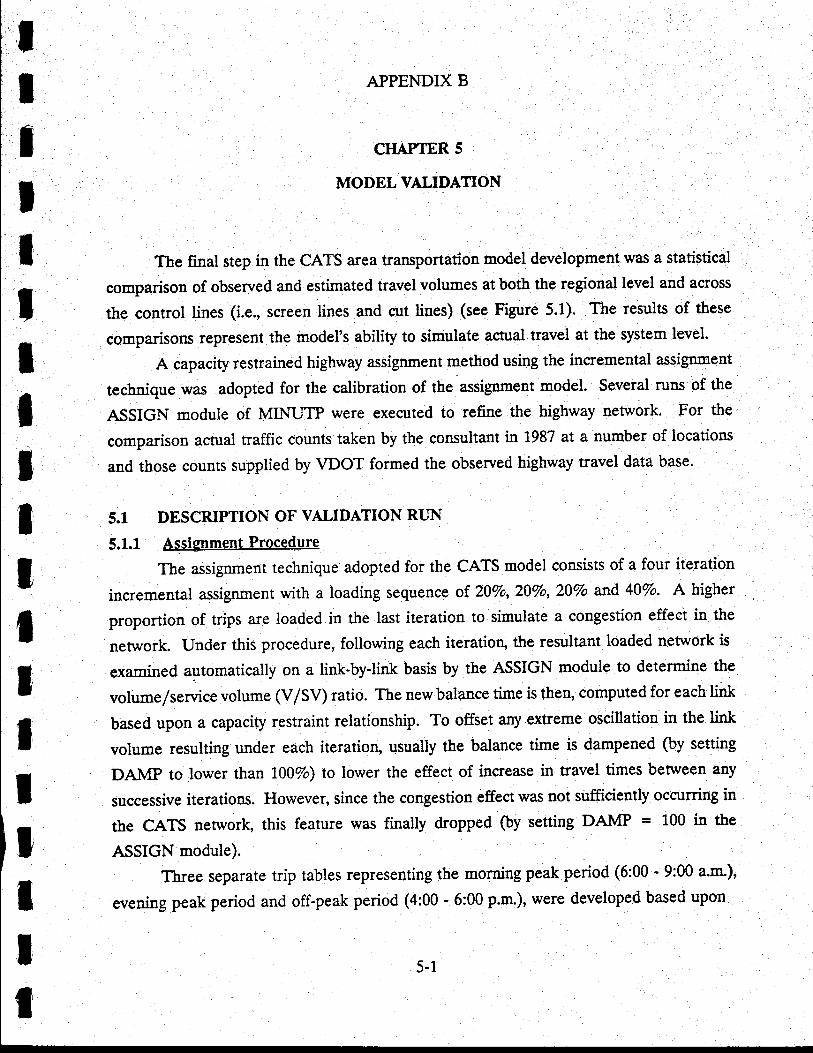
,lIII,l
IIIIItIItItItil
APPENDIX B
CHAPTER 5
MODEL VALIDATION
The final step in the CATS area transportation model development was a statistical
comparison of observed and estimated travel volumes at both the regional level and actoss
the control lines (i.e., screen lines and cut lines) (see Figure 5.1). The results of these
comparisons represent the model's ability to simulate actual travel at the system level.
A capacity restrained highway assignment method using the incremental assignment
lsshnique was adopted for the calibration of the assignment model. Several runs of the
ASSIGN module of MINUTP were executed to refine the highway network. For the
comparison actual traffic counts taken by the consultant in 1987 at a number of locations
and those counts supplied by VDOT formed the observed highway travel data base.
5.1 DESCRIPTION OF VALIDATION RLn\i
5.1.1 Assignment Procedure
The assignment technique adopted for the CATS model consists of a four iteration
incremental assignment with a loading sequence of.20Vo,20Vo,20Vo and 40%o. A higher
proportion of trips are loaded in the last iteration to simulate a congestion effect in the
network. Under this procedure, following each iteration, the resultant loaded nenvork is
examined automatically on a link-by-link basis by the ASSIGN module to determine the
volume/servicevolume (V/SV) ratio. The newbalance time is then, computed for each link
based upon a capacity restraint relationship. To offset any extreme oscillatiou in the link
volume resulting under each iteration, usually the balance time is dampened (by setting
DAMP to lower than lA}Vo) to lower the effect of increase in travel times benveen any
successive iterations. However, since the congestion effect was not sufficiently ocorrring in
the CATS network, this feature was finally dropped (by setting DAMP = 100 in t.he
ASSIGN module).
Three separate trip tables representing the morning peak period (6:00 - 9:00 ".*.),
sysning peak period and off-peak period (4:00 - 6:00 p.m.), were developed based upon
5-1
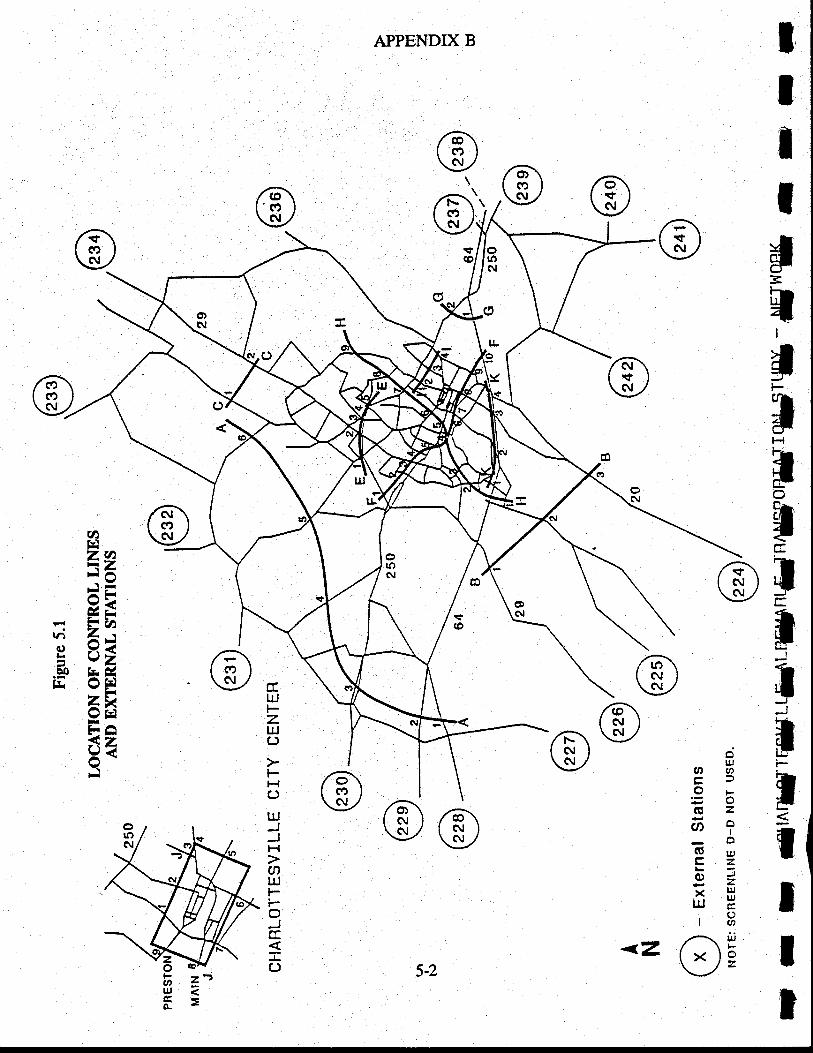
IItIil3t
I
iltH
ilN
ilililJ
ilF
T
ilItr
APPENDIX B
fP)\y
arczcn1Ztsi /arF/AFYJFF;22/TI E!) Y<E vz
iH bF6EFIFAizX<F
trJ
zttJCJ
FHCJ
LrJJH
aLt't-Fc)Jr
(J
fN
o
lr
<z
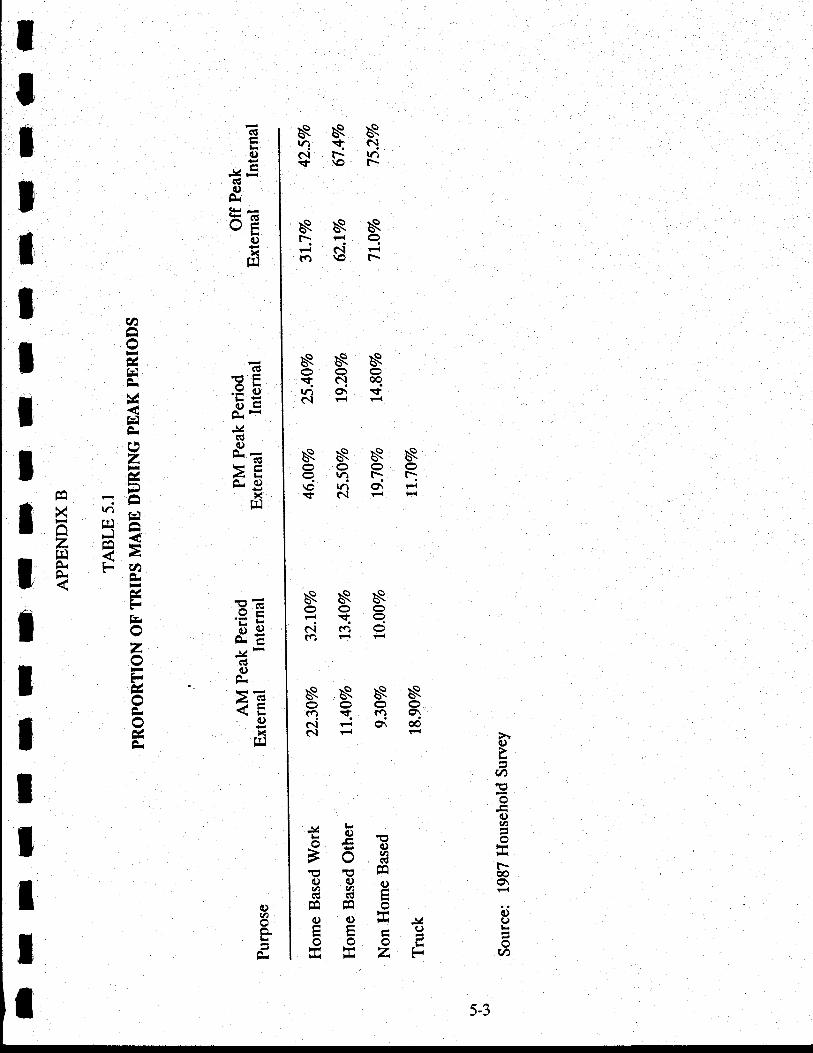
sssn.qci(\f-\t\or-
sss\-1 qFrNFa(fi \O C-
sss-f. c.l aqrn O\ '+t\I F'{
ssssoc)ooqt,?qt:\c tn o\ F{$(\F{F(
sss338c.ic.iota Fr
ssssvvv(")RF)qt\F{O\€N F{ F{
(l)
ea
c)vt
r-ooch
(.)I
(t)
J1h_b€57 0 Fe"ora99,9fifi E(f)oEJltrtra(JHH A-vvvL!T E Z F
5-3
ag
q)
J'EcloFr
oEq)
xtI]
!F.= q)
bE&(u6--
Or q)
Xrrl
EE'FbF}rC
*-o
>E<Eox
rT\
ItI1o
HrEtEl2
Fa F{:I H Hafi?t t F2FlE zIt6FTE
ltlT
I
(ut)
APPENDIX B
their respective shares of average daily travel for each purpose. These shares were derived
from the household survey data as shown in Table 5.1. Person trip tables were converted
into vehicle trip tables using the auto occupancy rstes pertaining to the time of the day and
area q;pe of trip destination considered (see Table 5.2). For the network assignrnent each
trip table was assigned separately. Finally, the results of all three assignments were
combined together to produce an all day assignment. The peak hour factors used for the
A-M., P.M., and off-peak were 60Vo,60Vo, and lSVo, respectively. This factor represents
the percentage of travel occurring during the maximum tr:ffic volume hour of a particular
time period.
5.12 Validation Runs
Several assignment runs were made with the results of each run being used to adjust
the speed/service volume table to be used for the next assignment. In the initial runs, a
check across the control lines suggested that the model simulated vehicular trips cutting the
outer screen and cut lines (A" B, C, E, G, and K) were reasonably close to the observed
maguitude of traffic intercepted along them. However, across the CBD cordon (J) and the
screen lines cutting the city (i.e., H and F) the estimated traffic was consistently lorver than
the observed ground counts. There were two key factors contributing to this phenomenon
zN enumerated below:
1. All non-home based trips performed within the study area by those residing
outside and coming into the area for work or non-work purposes remain
unaccounted. It is because the external survey provides information about
only those trips leaving the study area limits and no information about any
other trips undertaken within the area by the trip makers intercepted at the
external station. Since non-home based trips are predominantly performed
within areas having major activity centers of the city (e.g., WA and CBD),
an underestimation of trips across inner screen lines and cordon is expected.
The magnitude of I-X/X-I trips performed for combined HBW and HBO
purposes by outside residents is significant (aknost 50,000) as per the external
survey. Similarly a very high propo*ion (42Va) of the area enployees are
found residing outside of the study area. One additional visit made by each
tIlT
IIIT
IIIT
ItIItI
5-4
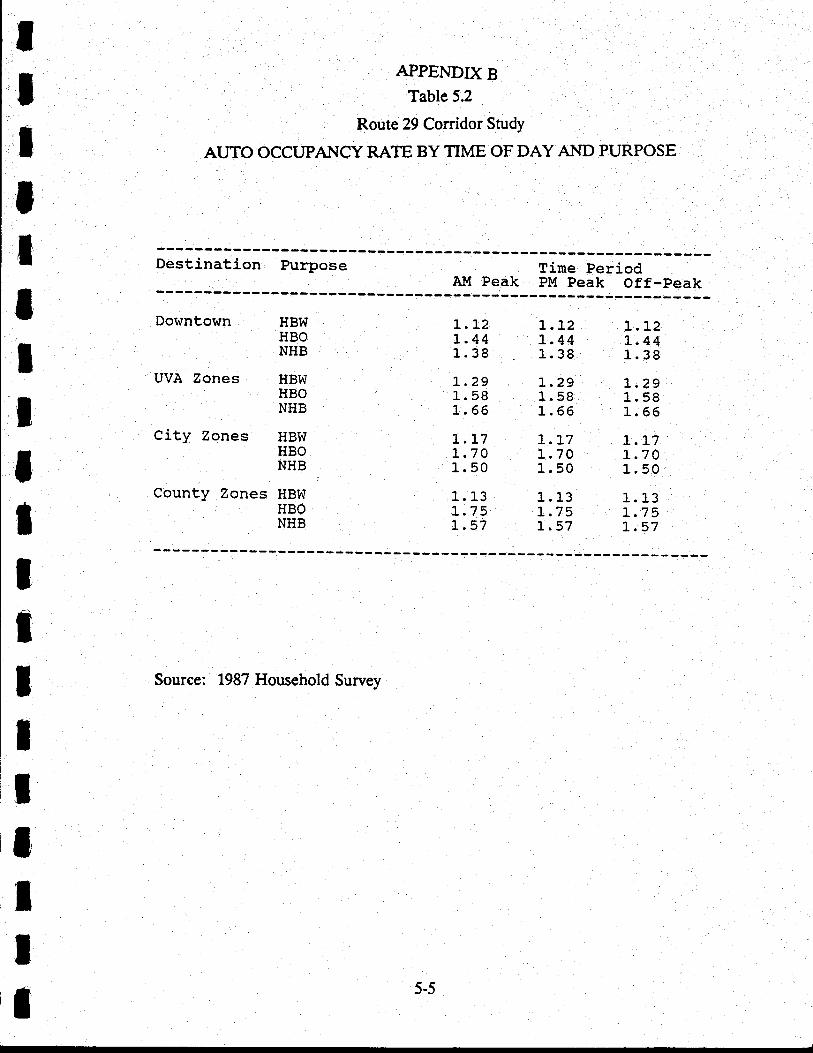
APPEI{DIX B,Tr^l^t^ tTable 5.2
Route 29 Corridor StudY
AUTO OCCUPA}ICY RA]E BY TIME OF DAY AND PURPOSE
Destination purpose Tine periodAIvI Peak PM Peak Off-peak
T
tIIIIIIItIIIItIItI
Downtown HBWHBONHB
UVA Zones HBWHBONHB
City Zones HBWHBONHB
County Zones HBWHBONHB
L.L2L.44L.38
t.29r.. 58L. 66
l. t71".7 01.501 11
r.7 5L.57
t.L2L.44l_.38
I.29L. s8L. 66
T.L7L.70l-.50
L. 131.7 5r.57
1. L2L.44L. 38
t.29L. 58L. 66
1.t7L. 701-.50
l-.t3L.7 5L.57
Source: 1987 Household Survev
5-5
l
l
APPENDIX B
of these tripmakers while inside the area can add almost 100,000 NHB trips
within the area.I
Z. In general survey respondents tend to under report non-home based trips.
particularly trips made for social-recreatioo and personal business are least
well reported in household surveys. Such a reporting bias leads to overall
lower estimation of non-work trips made by study area residents. Studies in
the past (Chicago, Pittsburgh, and New Orleans) have indicated that
underestimation of non-home based trips can range beween 50 to 60 Percent.
To compensate for the above two phenomenon an expansion factor of 1.72 was
applied to internal non-work purpose trips. Subsequent assignment runs indicated a
,ri*.*, improvement in screen and cut lines checks'
Documentation of all the adjustments made to the speed/sewice volume table would
be too extensive to report here. The final speed/capacity table which generated the best
assignment results is shown in Table 5.3. Since the capacities initially provided by VDOT
for each combination of area We/facility t)?e were for level of service E, they were
modified to reflect level of sewice C.
52 VALIDATION CONTROLS
For checking the network validity it is essential to compare the observed traffic
co'nts at certain locations (screenlines or cutlines) with the model generated traffic figures.
This is considered to be the most reliable way to evaluate the network performance.
For the CATS area}screenlines, 6 cutlines and one downtown cordon were defined
in consultation with the VDOT staff. Figure 5.1 disptays the location of these control lines.
AII traffic counts related information on linls that cross screenlines or cutlines were coded
in the link data file for quick access while checking the network. To accurately estimate the
base year average weekday traffic on all links crossing the desigRated control lines a seven-
day 24 hour traffic count was undertaken at each of these locations'
ItIIIIIIIIlT
IIIIIT
i5-6
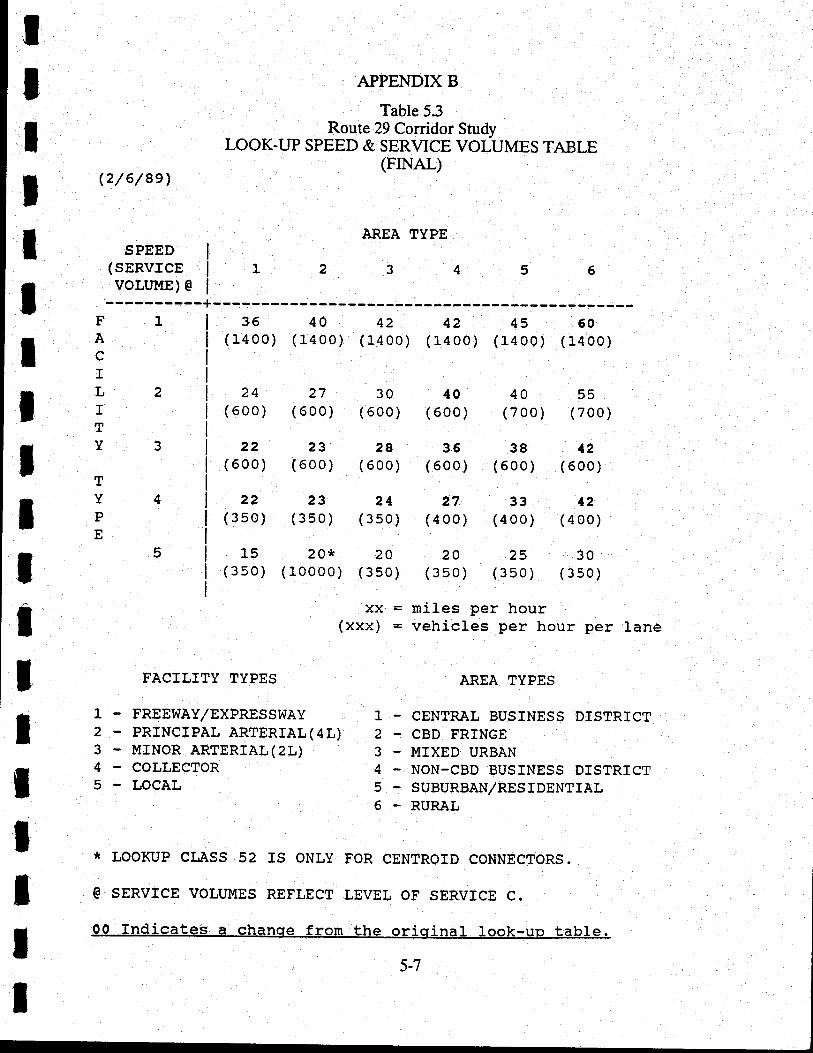
T
IIIIltIIIltI
APPENDIX B
Table 5.3Route 29 Corridor Study
LOOK-UP SPEED & SE-RVICE VOLUMES TABLE(FTNAL)
(2/ 6/ 8e]-
SPEED(SERVTCEvoLUr{E) €
35 40 42 42 45 50(r.400) (1400) (1400) (1400) (L400) (L4oo)
AREA TYPE
23456
FAcrLrTY
TYPE
24 27 30(600) (600) (6oo)
22 23 28(600) (500) (600)
22 23 24(350) (350) (3so)
15 20* 20(350) (l_0000) (3s0)
Xx=(xxx) =
40 4A 55(60o) (7oo) (700)
36 38 42(5oo) (5oo) (6oo)
27 33 42(400) (400) (400)
20 25 30(3s0) (3s0) (3s0)
niles per hourvehicles per hour per lane
AREA TYPES
CENTRAL BUSTNESS DISTRICTCBD FRTNGEMIXED URBANNON-CBD BUSTNESS DISTRTCTSUBURBAN/RESTDENTIALRURAL
12
34
5
F'ACTLITY TYPES
FREEWAY/EXPRESSWAYPRINCIPAL ARTERIAL ( 4 L)urNoR ARTERTAL(2L)COLLECTORLOCAL
1_
2
3
4
56
ItT
I
* LOOKUP CI,ASS 52 IS ONLY FOR CENTROID CONNECTORS.
E SERVICE VOLUMES REFLECT LEVEL OF SERVICE C.
00 Indicates a chanqe fron the orioinal took-un tabte.
5-7
APPENDIX B
5.3 VALIDATION ASSIGNMEM REST'LTS
rf the model inSeveral criteria provided the basig on -which.lt
Otno:nanc: (
simulating obsened conditions were judged to be satisfactory. These include screen line
checks, VMT (vehicle miles traveled) ratio and Percent root mean square eror.
53.1 Screen and Cutlines Checks
Table 5.4 summarizes the results of the final assignment ln t"T of a lnnn*,t::t
of the assigned volume and ground count across each control line' The location 1f
tn1
control lines are depicted in Figure 5.1. The maximum differeace between the assigned
volumes and ground counts was - t4Vo tor an entire screenline or cutlin€. Individual
locations may have higher variations'
5.32 \IIVIT Ratios
The VMT ratios were calculated from assigned volumes and ground counts for those
links where ground counts were recorded. For the comparisons these ratios were calculated
by areaffacility type. The results of the final validation nrn is summarized in Table 5'5' A
ratio of 1.0 indicates perfect agreement between VMT developed from ground counts and
assignment develoPed VMT-
The statistical measure used for comparison of actual ground counts against model
volumes is the Percent Root Mean Square Error, which is defined as:
ToRMSE = sslgllcu lllyD- rlaarj-l!\-\,uut/ it rrsl
SUM (Traffic Count) / Number of Links
*Total Squared Difference" is the assigned directional link volume minus the actual
directional link count, quantity squared, then summed for all linl$ having a count. "Number
of Links,, is the total number of links fror which actual counts are availablE. "Average count"
is the sum of all actual counts divided by the number of linla for which cou:ts a:e *t:lt::A Root Mean Square Error of less than 30Va generally indicates that the model is
calibrated within acceptable limits'
rlrlflIJ
tIt
5-8
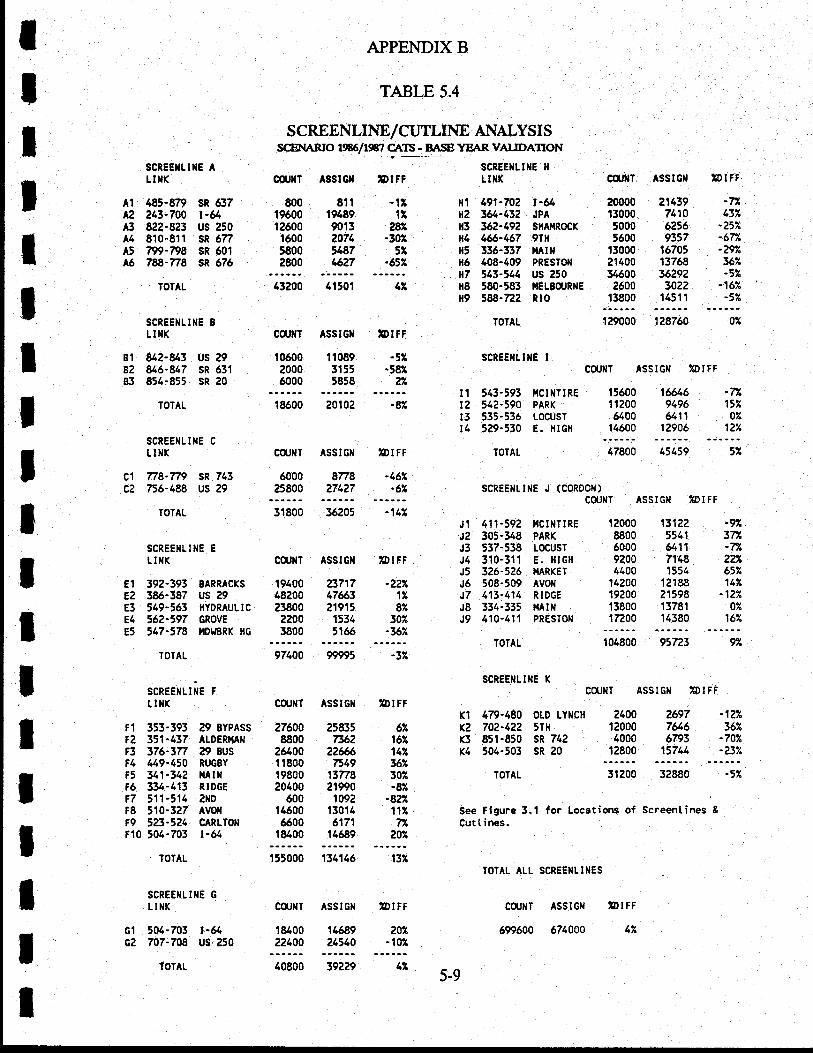
APPENDIX B
TABLE 5.4
SCREENLINE/CUTLINE AI''{ALYS r Sscg{AFJo 1s6ns, cers -_nas vnan VALTDATToN
sR 637t-&us 250sR 677sR 601sR 676
us 29sR 631sR 20
c1c2
E1
e2E3E4E5
IIIIIIIIIIIItIItI
A'f t$r-gwA? 213-704A3 822-823A4 810-81rA5 799-798A6 788-778
TOTIL
81 8/.2-8l.382 U6-U783 854-855
TOTAL
SCREEIILI}IE B
tlilK
scSEEltIt|E ALIIIK
SCREE}ILI}IE H
Llllx
Hl 491-m2 b&)12 3e-432 JPAH3 t62-492 SI{AI|ROCK
il4 466-467 gTH
H5 336-337 ilAruH6 408-409 PRESTOII
x7 513-541 us 250H8 580-581 lrELBo[rR[EH9 58-722 Rro
TOTAL
scREEilLtllE I
r 1 543- 593 r,rc r lrT r RE
t2 542-590 PAR|(
t3 535-536 LOCUST
t1 529-530 E. HIGH
TOTAL
c(ultT AssIGll
8oo E1t19600 1948912600 90131600 20715800 54a72800 4627
c(UilT Asslclt lDIf t
20000 21439 -7r13000 7110 137,
5000 6216 -?5t5600 9357 -6TA
13000 16705 -?w,21400 13768 36734600 36292 -siL2600 3022 -167.
13800 't4511 -5v.
IDIFF
-171t
aCZ-3sa
5t-654
SCREENL I }IE C
LINK
778-Tn sR 743756-48 US 29
TOTAL
SCREEXLII{E E
LI}IK
43200 41501
cqrlrT Asstcil TDIFF
to6oo fi089 -5x2000 3155 -5816000 5858 2l
18600 20102
cojltT AsstGlr zDtFt
31800 36?05 -142
SCREENLINE J (CORDON)
129000 128764
coultT Assl G[ Wl?F
fte69196&11
12906
47800
corj[T ASS I Gil ?DIFF
12000 't31228800 55416000 64119200 71484400 155414200 1218819200 2159813800 1378117200 14380
-77.15'l
o%
12j/
15600t1?006400
t4600
6000 8778 -46225800 27427 -62
C0',}IT ASSI GX UD I FF
392-393 BARRACKS 19400 23717386-387 uS 29 48200 476r'3549-363 flYDRAULTC 23800 2191556?-597 cROvE 2200 1534547-578 itDr,rBRK H6 3800 51f6
-zu1Z87,
302-367,
Jl 411-592 ircrNTrREJ2 305-348 PARK
J3 537-538 rocusTJ4 310-311 E. HlGllJ5 3?6-526 I{ARKET
J6 508-509 AvollJ7 413-414 RTDGE
J8 334-335 r,rArIJ9 410-111 PRESTON
TOTAL
SCREE}ILIHE K
-9?,37r-7Azu657,117,
-127,0z
16X
TOTAL
SCREE}IL I }'IE F
LI ilK
Fl 353-393 29 BYPASS
tz 351-437 ALDERT'|AN
F3 376-3n ?9 8US?4 449-450 RUGEY
F5 341-342 lrArllF6 334-413 RIDGEt7 511-514 ?XDF8 510-327 AvollF9
'23.'24 CARLTON
110 504-703 r-&TOTAL
SCREEIILI}IE G
LIIIK
G1 504-703 t-&G2 707-708 US,250
TOTAL
-32
ZDI FF
6Z162141362302-EA
-8221127Z
297
95723 97
CqJNT ASS I G}I ZO I FF
Kl 479-480 oLD LYITCH 2400 2697K2 702-422 5TH 12000 7616K3 851-850 SR 742 4000 6793K4 504-503 SR 20 12800 15741
-1273611
-70'a-z:3%
ccljr{T AsstGN
27600 2583t8800 7362
2&00 226r/11800 751919800 1377820400 21990
600 109214600 130146500 617',1
18400 14689
155000 134146 132
CCIJ}IT ASS I Gil ?D I FF
14689 20721510 -107
't8400?2100
IoTAL 31200 32880 -5X
See Figure 3.1 for Locations of Screentines &
Cuttines.
TOIAL ALL SCREENLINES
CCUNT ASSIGII IDI FF
699500 671000 4Z
5-939229
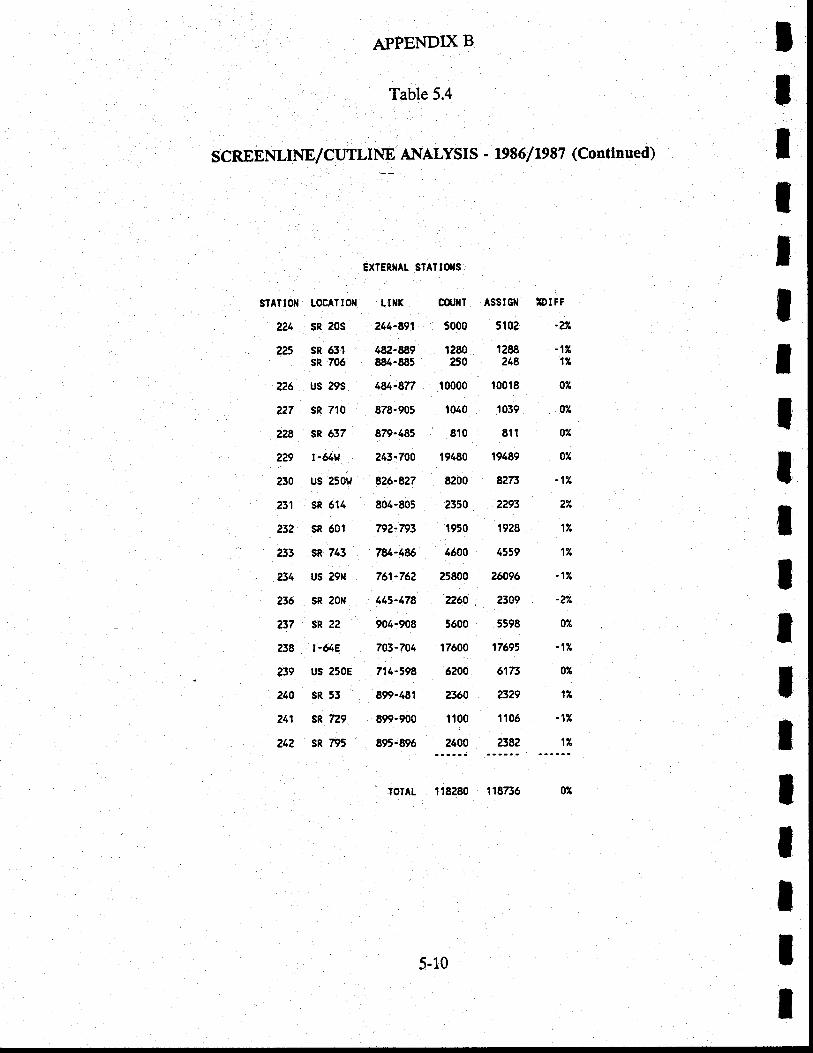
APPENDIX B
Table 5.4
SCREENLINE/CUTtIY AI''{ALYSIS' 1986/1987 (Continued)
EXIERIAL STArl0]rS
stATtor{ LocATlo$l llllK cdjxT ASSlGtl IDIFF
?24 SR 20S 244-891 5000 5102 -24
225 SR 631 482-889 1280 1288 -17sR 706 884-885 250 248 1Z
226 US 29S 4*-877 10000 10018 0Z
?27 sR 710 878-905 t04o 1039 011
228 SR 637 879-485 810 Ell 07.
?29 r-6/iu 243-700 19480 19489 0i(
230 us 250u 826-827 8200 8273 -17,
231 SR 614 804-805 2350 ?A3 27.
23? SR 601 792-n3 1950 1928 1r
233 SR 743 78,-486 4600 4559 1Z
?31 US 29|r 761-762 25800 2@96 -17,
236 SR 20u 44t-4?8 2260 , 2309 -2%
237 SR 22 904-908 5600 5598 07.
23E r-&E 703-704 17600 176% -17,
239 uS 2508 714-598 6200 6173 AZ
240 SR 53 899-481 2360 2329 1Z
241 SR 729 899-900 1t0o 1106 -11
?4? SR 795 895-896 2400 ?382 1X
TOTAL 118e80 1187J5 0x
IlIIIIIIIIIIIIItI
5-10
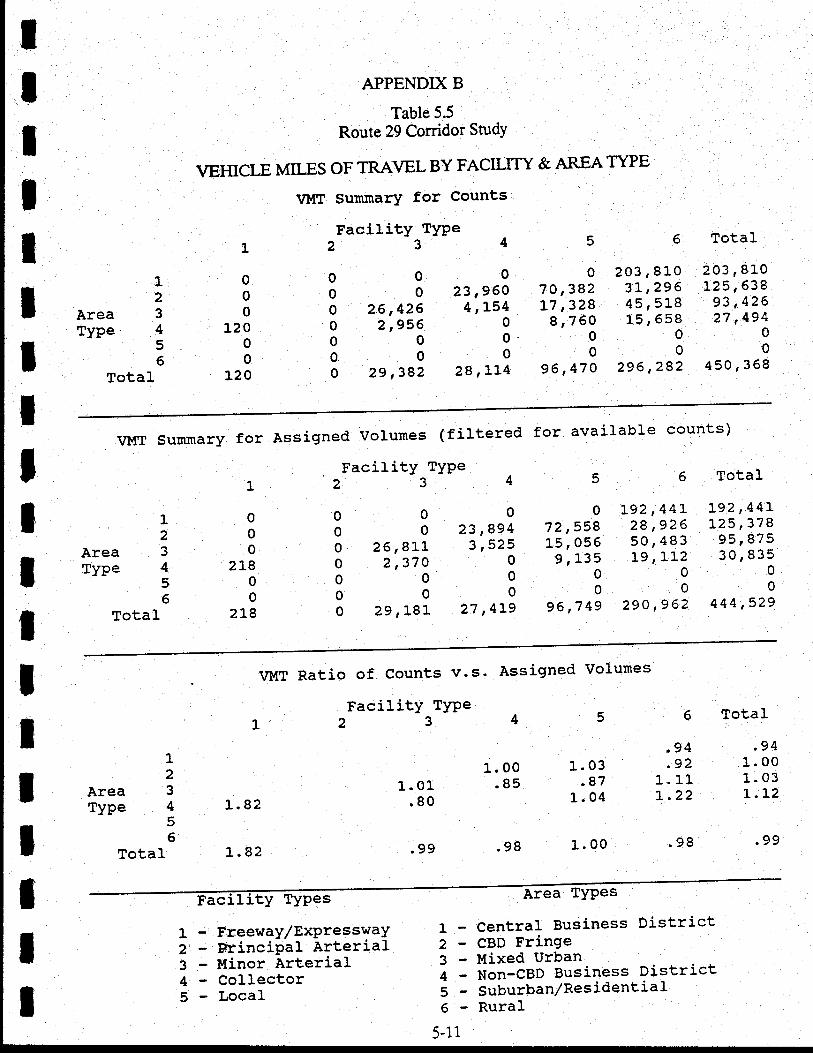
Areatype
TotaI
123456
APPENDIX B
Table 5'5Route 29 Corridor StudY
VEHICLEMILESoFTRAVELBYFACILITY&AREATYPE
VlltT Surnmary for Counts
FacilitY TYPe234560 0 0 0 2o3,8Loo o 23,960 70 '382 3\'??9o 26 t426 4',L54 L7 ,328 1?,?190 2'1956 o I ,7 6A 15
' 658
o o o' 0 90ooooo 29,382 28'rLA 96,47O 296'282
1
000
12000
L20
Total
203,8L0125,538
93 ,42627 r494
0o
450,358
IIIIIIIItItItIIII
VMT Summary for Assigned Volurnes (filtered for
FacilitY TYPe
available counts)
AreaType
Total
123456
1
o00
21800
2r.8
2
0oo0000
4
0
5
0
J
0o
26,gLL2,3'7O
00
29,]-8r
23 ,894 72,5583 ,525 15,056
0 9,1350000
6 Total
Lgz ,44L 1-92 ,44L28 ,926 r25,37850,483 95,875Lg ,:-Lz 30r 835
00
0o
27 ,4!g 96,749 290 '962 444 '529
AreaType
Total
123455
1.82
t.82
VI-IT Ratio of Counts v's'
FacilitY TYPeL23
Assigned Volumes
5
1.03.87
1.04
1. 00
1. 001.01 .85
.80
.99 .98
6
.94
.921. 1LL.22
.98
Total
'941. OO
1. 03r.. 12
.99
123-4-56
5-11
L2-3-4-5-
FacilitY TYPes
FreewaY/ExPresswaYFrincipal ArterialMinor ArterialCollectorLocaI
Area TYPes
Central Business Distri'ctCBD FringeMixed UrbanNon-CBD Business DistrictSuburban/ResidentialRuraI
APPENDIX B
The orrerall ToRMSE was 21.69 though, it varies among each combination of
arca/fac:ltty tYPe (Table 5.6).
It is generally acknowledged in transportation planning studies that travel forecast
should be accurate within plus or minus one-half lane for each travel direction. A relatively
higber perceoiage of error is therefore, acceptable for low volume r1lds while as the volume
increases the acceptable percentage or error decreases. Table 5.7 compares tle CATS
VoF.MSE with similar statistics for several other models developed in the United States
(Figure 5.2).
53.4 Adiustment Factor
At all screenline and cutline locations, the margin of difference always falls within
tle acceptable level of 15 percent. During validation, it was observed that screenlines C and
E matched ground counts fairly well, but that the volumes in the Route 29 north corridor
(benveen Hydraulic Road and Rio Road) were low by approximately ?3 percent. This is
a result of the under estimation of local trips within the Route 29 north area. The intense
development in that area results in short trips, those that do not cross screenlines c or E.
T\e 23 percent under estimation is identified for explanatory pu{poses. No modifications
were made in the assignment results to reflect this discrepancy.
IIIIttIIIItIIIItIII
5-r2
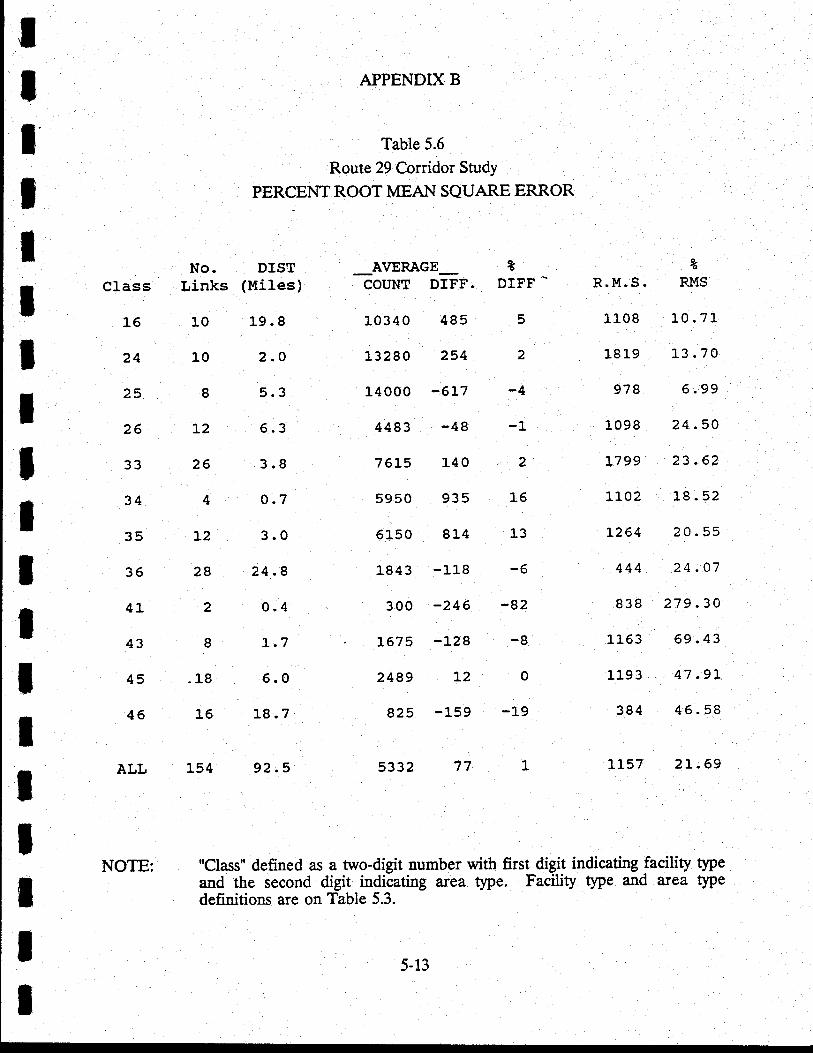
t)?eqPe
tIIIIIIIIIIIIIIIII
APPENDIX B
Table 5.6
Route 29 Corridor Study
PERCENT ROOT MEAN SQUARE ERROR
Class
16
24
25
26
33
34
35
Jt)
41,
43
45
46
ALL
No.Links
Lo
10
I
L2
26
4
L2
28
2
I
.18
16
L54
DIST(Mi1es)
19.8
2.O
5.3
6.3
3.9
o.7
3.0
24.8
0.4
1.7
6.0
L8.7
92.5
tDIFF
5
2
-4
-L
2
16
13
-6
-82
-8
0
-19
1
R:M. S.
1108
18 L9
978
l_098
L799
l-102
t264
444
838
LL63
119 3
384
zRMS
l_0.7L
l-3.70
6.99
24.50
23 .62
18.52
20.55
24 .07
279.30
69 .43
47 .91
46.58
-AVERAGE-COI'NT DIFF.
L0340 485
13280 254
14000 -6L7
4483 -48
76L5 L40
5950 935
6r.50 814
184 3 -1,L8
300 -246
. 1575 -L28
2489 L2
825 -159
5332 77 1157 2]-.69
"Class" defined as a two-digit number with first digit indicating facilityand the second digit indicaling area type. Facility type and areadefinitions are on Table 5.3.
NOTE:
5-13
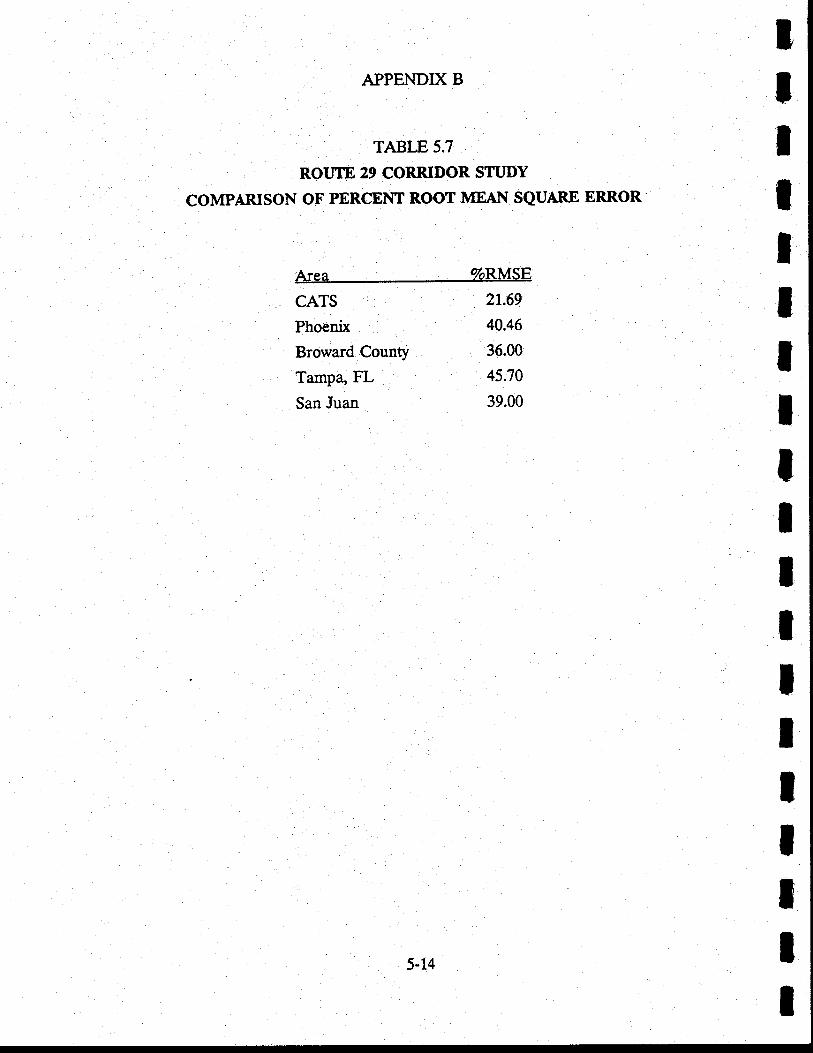
APPENDIX B
TABLE 5.7
ROUI|E 29 CORRIDOR STUDY
CoMPARTSON OF PERCENT ROOT MEAI{ SQUARE ERROR
Area ToRMSE
CATS 21.69
40.46
Broward County 36.00
IIIIIIII
Tamp4 FL
San Juan
45.70
39.00
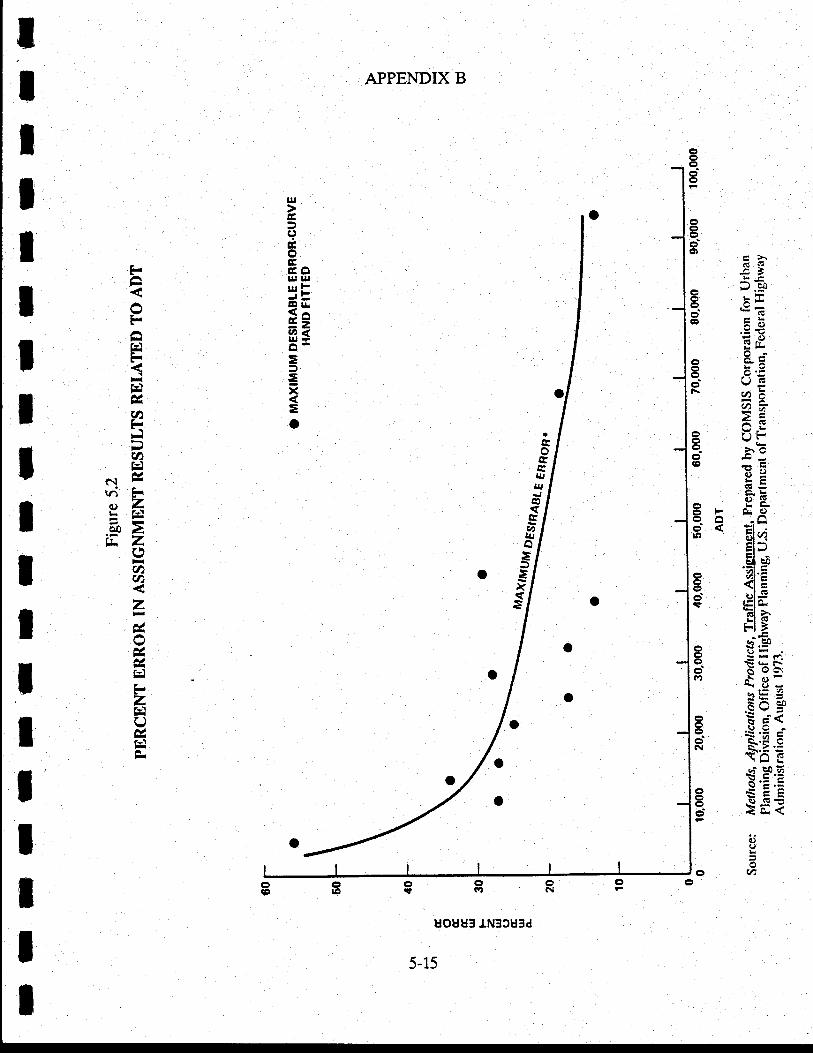
g>5FLAh?a
- e.!f<.F< F*;- d?,o E6
8,9LF
o giAL95 P,'=o \,i i:N 3Ea*
>Eo 9i6 v-r:. FE(9 atr
LF
x-b'FI F &d60-O
Btrl 'JE[
"ao '41'7
B <I E
E €liiEt >FI :,iEos.-
o :-.dO -isiio' d oa!\a') 5 o:-\o-)-AiF 3'.:v tE E 51
R R:T€\O Eli 00'i;x.= tr
o s=c3 Srt?
c)q)L
AC)a
APPENDIX B
UJ
tE3ItroEtcO||J UJuFtB tr{rr=zfito-=
=x
=a
Fts
F
F-<IlE:F(aL--)v)E*
GIEdF-6,Z=trldo>iiz(,
x(nv)
z
FzEQ
x
IIIIIIIIIIT
IIIlIIII
5-15
ZOIO Tlavel Demqndvqlsqtion of Futsre
Forccsstingf,lternqtives
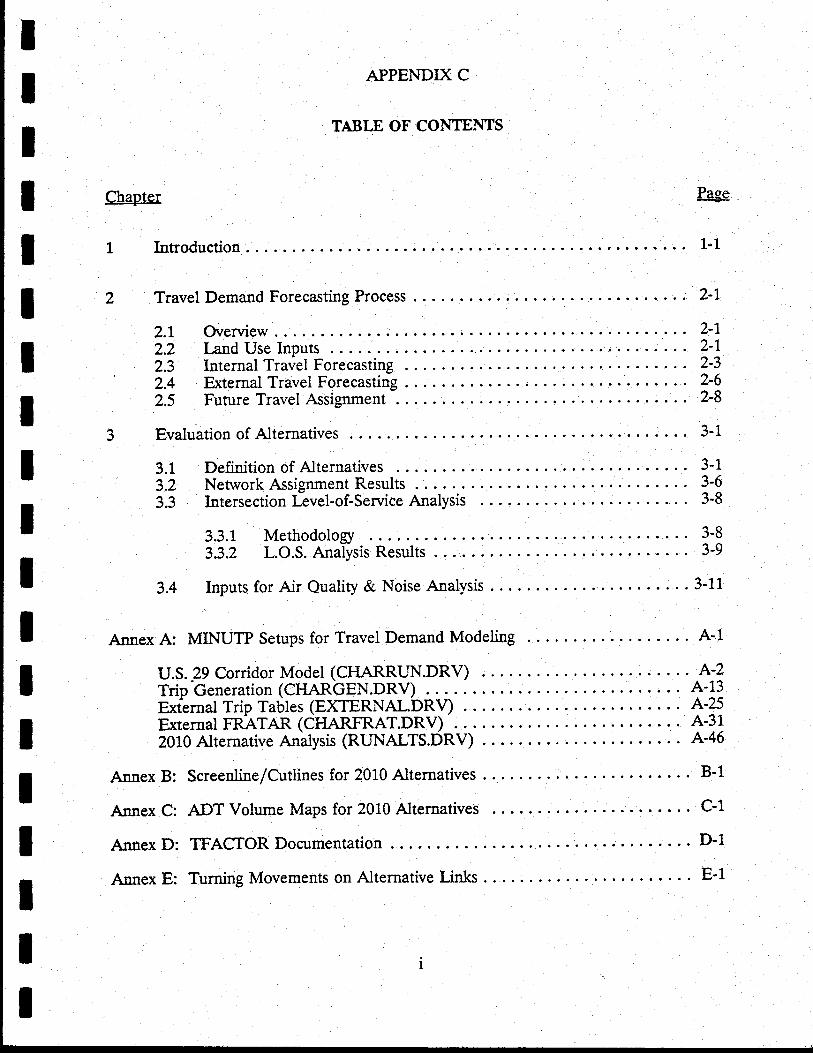
tItIIIIT
IIIIIIII
APPENDIX C
TABLE OF CONTENTS
Chagter
1 Introduction
Pase
2 Travel Demand Forecasting Process 2-1
2.1 Overview...2.2 kndUselnputs... ..-..:2.3 Internal Travel Forecasting 2'32.4 External Travel Forecasting 2'62,5 Future Travel Assignment . . . 2'8
3-13 Evaluation of Alternatives
3.1 Definition of Alternatives 3-1
3.2 Nenvork Assignment Results 3-6
3.3 Intersection Gvel-of-Service Analysis 3'8
3.3.1 MethodologY3.3.2 L.O.S.AnalysisResults ..... 3-9
3.4 Inputs for Air Quality & Noise Analysis . . 3-11
1-1
Annex A: MINUTP Setups for Travel Demand Modeling
U.s.2e Corridor !r{9!e!(!nanS!lN.DRV) . . .
Trip Generation (CHARGEN.DRVI . r:.. .
Exfernal Trip Tables (EXTERNAL.DRV) . . .
External FRATAII (CHARFRAT.DRV)2010 Alternative Analysis (RUNALTS.DRV)
Annex B: Screenline/Cutlines for 2010 Alternatives . . .
Annex C: ADT Volume Maps for 2010 Alternatives
Annex D: TFACTOR Documentation
A-1
A-2A-13A-25A-31A-46
B-1
c-1
D-1
III
Annex E: Turning Movements on Alternative Lint<s E-1
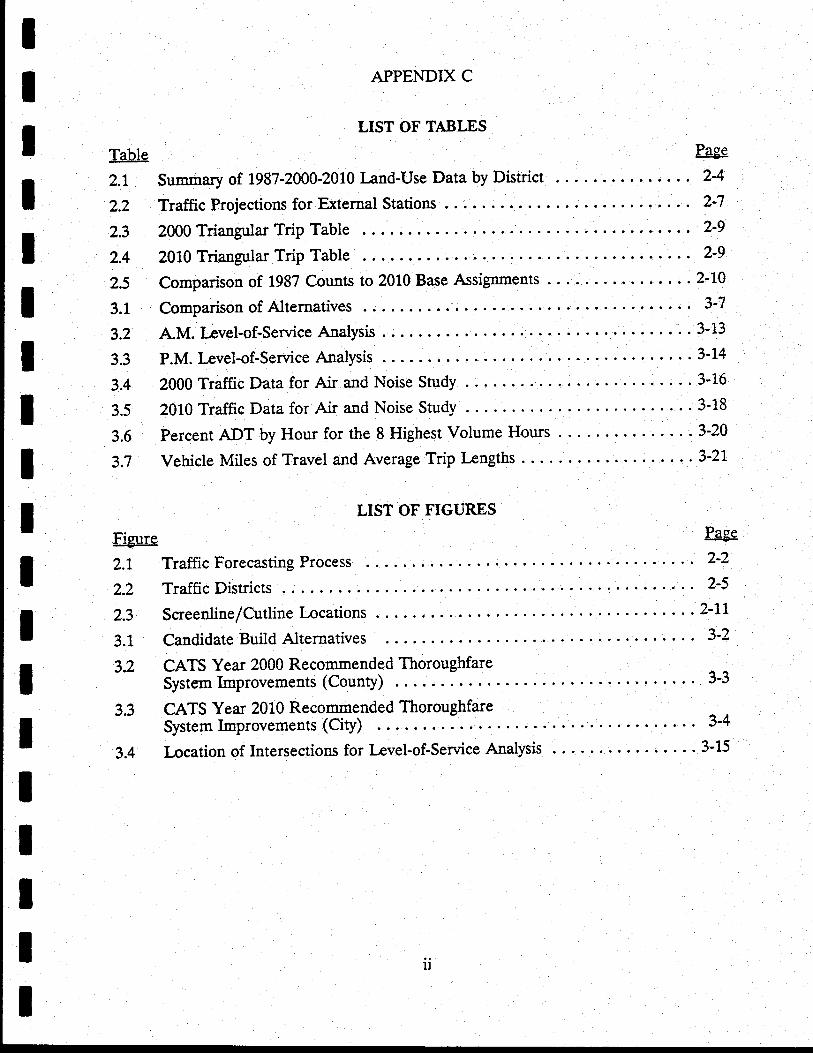
IIIIIIIIIItIIIIIIII
APPENDIX C
LIST OF TABLES
Table Page
2.1Sumrraryo,f1987.2000.2010I-and-UseDatabyDistrict
2.2 Traffic Projections for External Stations 2-7
2.3 2000 Triangular TriP Table
2.4 2010 Triangular Trip Table . . . 2-9
2.5 Comparison of 198? Counts to 2010 Base Assignments . . . . . . 2-10
3.1 Comparison of Alternatives 3'7
3.2 AM. I-evel-of-Service Analysis
3.3 P.M.I-evel-of-ServiceAnalysis
3.4 2000 Traffic Data for Air and Noise Study ' ' ' ' ' 3-16
3.5 2010 Traffic Data for Air and Noise Study ' ' ' ' ' 3-18
reHours .....3-203.6 Percent ADT by Hour for the 8 Highest Volum
3.7 Vehicle Miles of Travel and Average Trip I-engths . . . .3'21
Fizure
2.1
'))2.3
3.1
3.2
J.J
3.4
LIST OF FIGURES
Traffic Forecasting Process
Traffic Districts
Screenline /Cutline l-ocations
Candidate Build Alternatives
Paee
2-2
2-5
CATS Year 2000 Recommended ThoroughfareSystem Improvements (County) . . . . .
CATS Year 2010 Recommended ThoroughfareSystem Improvements (City)
3-2
3-3
34
I-ocation of Intersections for Irvel-of-Service Analysis . . 3-15
IIIItIIIItIIIIIIIII
APPENDIX C
ChaPter 1
INTR.ODUCTIONI
This report discusses the travel demand forecasting process adopted for the U.S. 29
Corridor Study and the results of each alternative evaluation. In addition to the traffic
forecast for 2010, which is considered the design year for this study, an intermed"iate year
(2000) forecast was developed. This report presents the major outputs of the 2000 and 2010
traffic forecasts.
This is the third report on the traffic and transportation analysis task of the Route
29 Corridor Study. The earlier report covered details on travel surveys and the travel
demand model calibration process for the Charlottesville-Albemarle County area. Travel
demand forecasting for the study was performed by tbe MINUTP package, a commercial
software developed by COMSIS Corporation. A few special pu{pose progan$ were also
used to prepare and analyze data. Information on the MINUTP setups and special purpose
programs are presented in the appendices of this report.
1-1
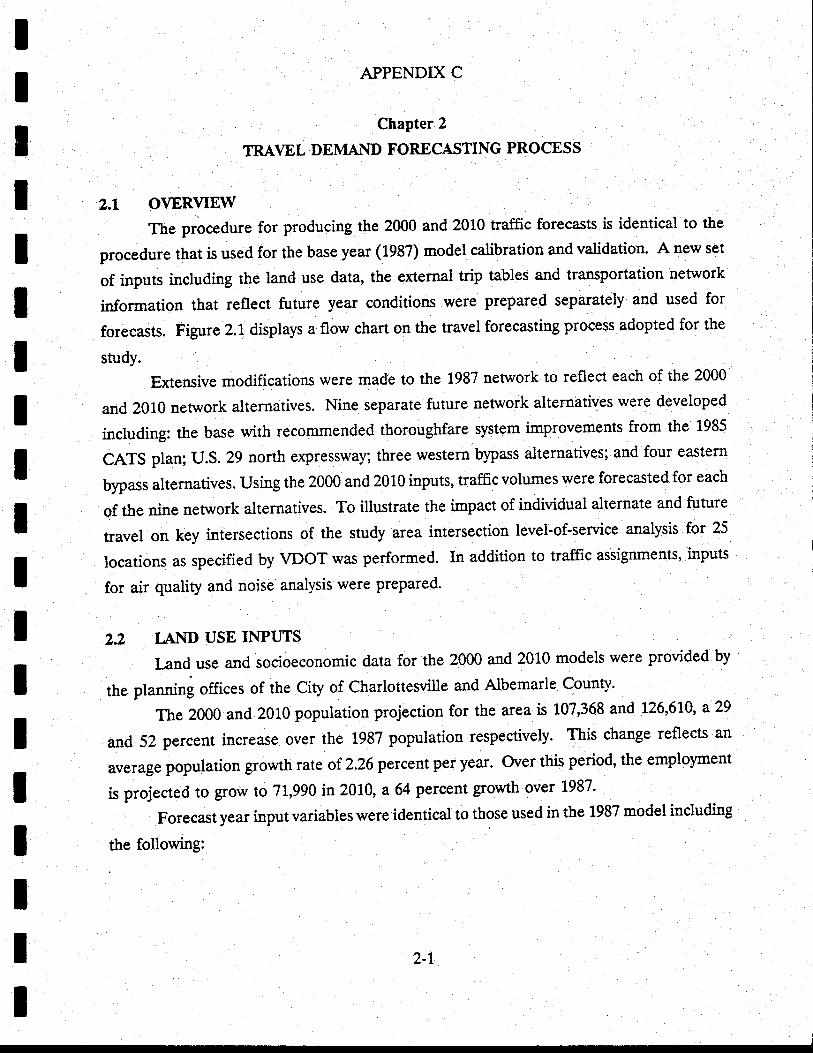
IIttIIIIIIIIIIT
IIII
APPENDIX C
ChaPter 2
TRAVEL DEMAND FORECASTING PROCESS
2.r ovERvIEWThe procedure for producing the 2000 and 2010 traffic forecasts is identical to the
procedure that is used for the base year (1987) model calibration and validation. A new set
of inputs including the land use data, the external trip tables and transportation network
information that reflect future year conditions were prepared separately and used for
forecasts. Figure 2.1 displays a flow chart on the travel forecasting process adopted for the
study.
Extensive modifications were made to the 1987 nerwork to reflect each of the 2000
and 2010 network alternatives. Nine separate future network alternatives were developed
including: the base with recommended thoroughfare system improvements from the 1985
CATS plan; u.s. 29 north expressway; three western bypass alternatives; and four eastern
bypass alternatives. using the 2000 and 2010 inputs, trafficvolumes were forecasted for each
of the nine nenpork alternatives. To illustrate the impact of individual alternate and future
travel on key intersections of the study area intersection level-of-service analysis for 25
locations as specified by VDOT was performed. In addition to traffic assignments, inputs
for air quality and noise analysis were prepared'
22 I"AND USE INPUTS
I-and use and socioeconomic data for the 2000 and 2010 models were provided by
the plannin! offices of the City of Charlottesville and Aibemarle County.
The 2000 and 2010 population projection for the area is 107,368 and 1'26,610, a29
and 52 percent increase over the 1987 population respectively. This change reflects an
average population growth rate of 2.26 percent per year. Over this period, the employment
is projected to grow to 71,990 in 2010, a 64 percent gowth over 1987'
Forecast year input variables were identical to those used in the 1987 model including
the following:
2-1
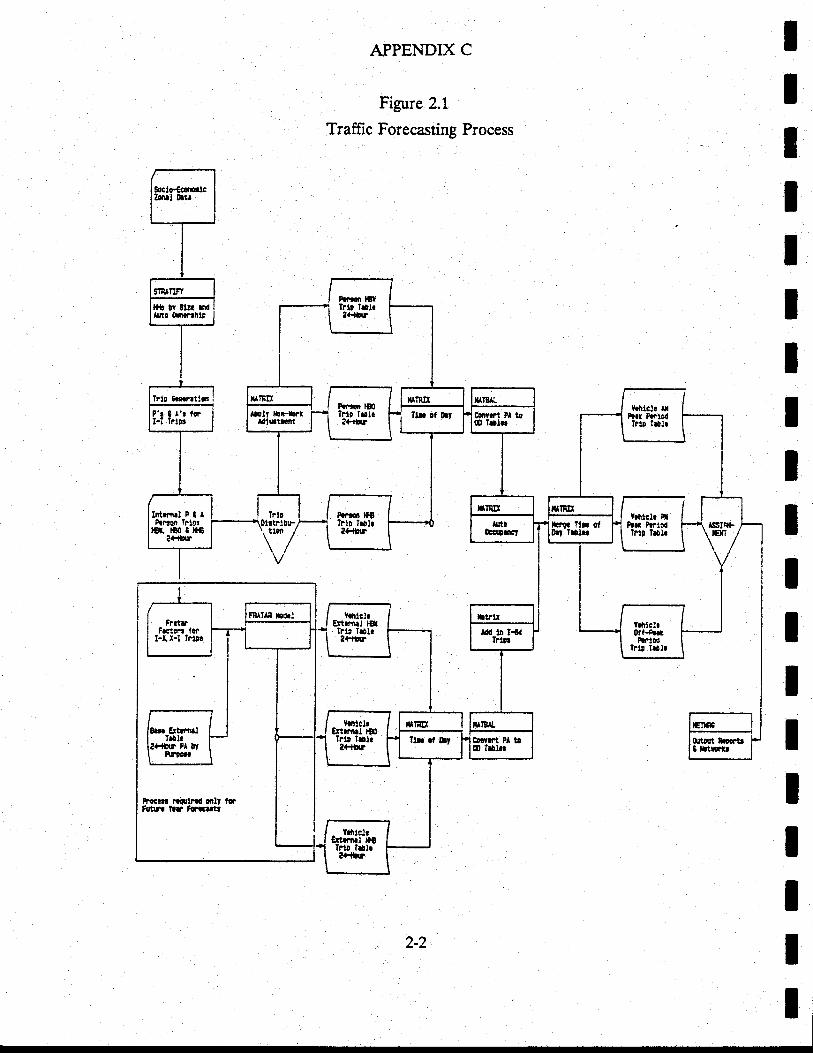
APPENDIX C
Figure 2.1
Traffrc Forecasting Process
IIT
IIIIIIIIIIIII
PF oi l3rIrtr lahe.*l'
Y.lilsl! rtFrd PftcIrte l$1.
Iflo
tlaolDIF
q,tnrt l|oorttt lfirftr
Froglt! |.qrltrd iltt '!?Fuurr lar fraarrtr
III
Intrmrl P I IPrrloa lrlo!ttt lto e }tt
e{.l!|r
2-2
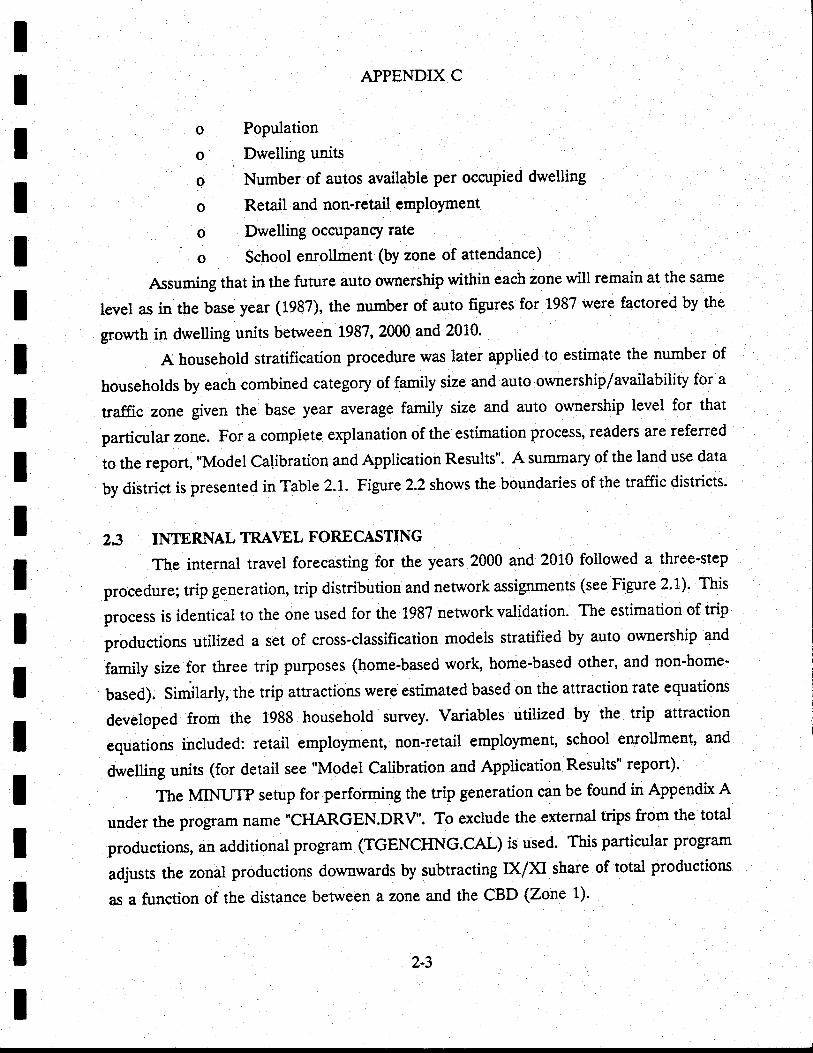
IIIIIIIIIttItIIIIII
APPENDIX C
o PoPulation
o Dwelling units
o Number of autos available per occupied dwelling
o Retail and non-retail employment
Dwelling occuPancy rateo
o School enrollment (by zone of attendance)
[55uming that in the future auto ownership within each zone will remain at the same
number of auto figures for 1987 were factored by thelevel as in the base year (1987), the -Irres tor 1v6/ wer(
$owth in dwelling units between 1987,2000 and 2010'
A household stratification procedure was later applied to estimate the number of
households by each combined category of family size and auto ownership/availability for a
traffic zone given the base year average family size and auto ownership level for that
particulap oo". For a complete explanation of the estimation process, readers are referred
to the repoft, "Model Catibration and Application Results". A summary of the land use data
by district is presented in Table 2.1. Figure 2.2 shows the boundaries of the traffic districts-
2.3 INTERNAL TRAVEL FORECASTING
The internal travel forecasting for the years 2000 and 201.0 fotlowed a three-step
procedure; trip generation, trip distribution and network assignments (see Figure 2.1). This
process is identical to the one used for the 1987 nenvork validation. The estimation of trip
productions utilized a set of cross-classification models stratified by auto ownership and
family size for three trip purposes (home-based work, home-based other, and non-home-
U*riy. Similarly, the trip attractions were estimated based on the attraction rate equations
developed from the 1988 household survey. Variables utilized by the trip attraction
equations included: retail employment, non-retail employment, scbool enrollment, and
dwelling units (for detail see "Model Calibration and Application Results" report).
The MINUTP setup for performing the trip generation can be found in Appendix A
under the program name'CI{ARGEN.DRV'. To exclude t}e external trips from the total
productions, an additional program (TGENCHNG.CAL) is used. This particular program
adjusts the zonal productions downwards by subtractinglxlKl share of total productions
as a function of the distance between a zone and the CBD (Zone 1)'
2-3
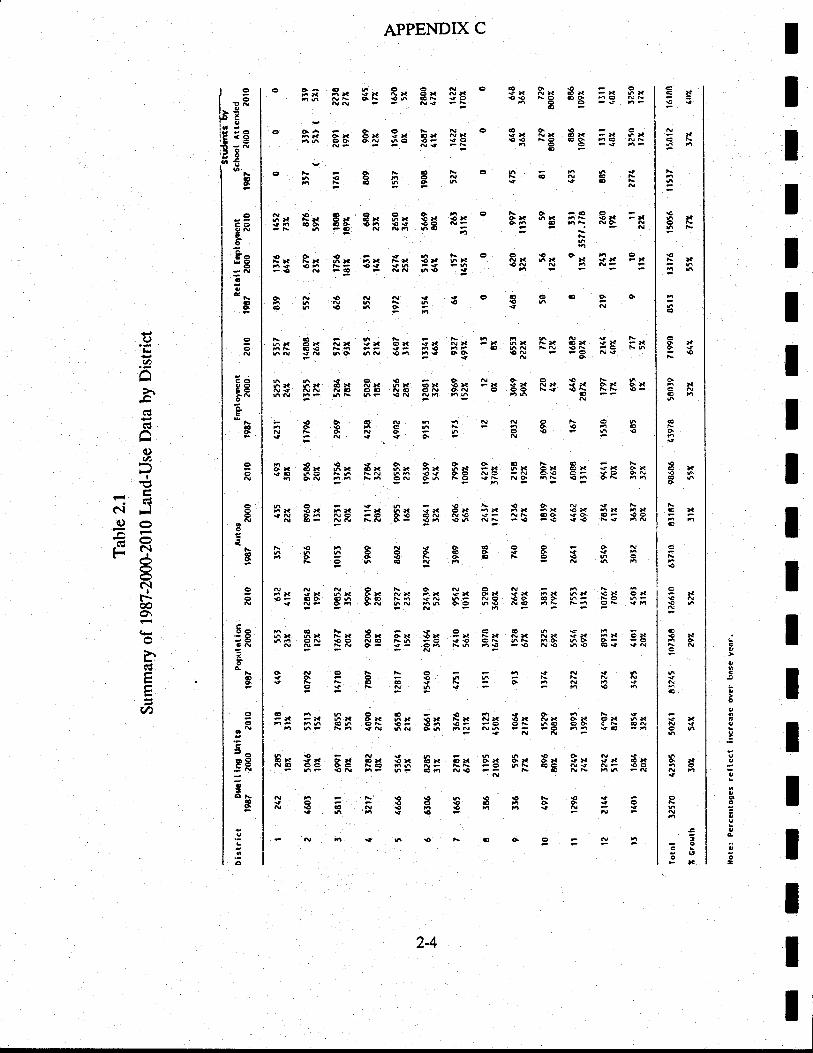
II
c
I
c
oc
c
4
o
-
IIIIIIItIIItT
IIII
xj
)a
fa
ta
€
e
€o
s
6*O\'
BxCN
o
8xc6o
€llc
€
-x
E€*
6
s|.c6
ox{
t-cCL3x
-o
-O
€NEN
60€eX NX 6X€€ NO OO60c€F
6-6ts€N{{
9* $* Rx t* Nx oNL Ots €6 6N €ONN N9
ix B'. 3* E* Nx o66 alN 6af €- 9oN? N{
-6ts€FOP8ntfrF o -O O -o* 6* -E €X FXO6 Q 6N NO N
ftE6n
Rx 3* Ox 3x 9*€N N N N'n
i-EFF6rystsNX sX eX {)( NX -X 6X FX €X !-x 'X-- -- -- i6 a6 € 6N NN €F -c N66q 6N €6 Fi 0.6 €N - -B Ns
3x Rx f* Ex $* *x $x R* Sx F* 8*ai- oaa ^ra!
oN o.N o oo F{ €\ NN 9_6L 6F €N Nn n6 Fn e --N
sfrHEFsgg!fi9Ng€OFN
APPENDIX C
SxoeEO
€o€€x Nx o*9€ N9 00noo €-
$x 3x e6€
=
€r *x onro :
NN€€C'6C€6ts6€966OF€ .F
o€€
3* 3x
fx Rx *xn+ €n F-F€ N .O
Sx Fx tx{6 66 oo-ts 6 -€
o6
*ta oxf o otu
6cx6€
9x
€o
8x60ON
-
ox€o
6' €O
qN6c
€x ox
-x cxo- -c-9 SN
a* 6x< L QN
$x ExN- .€C
s0
9x Fx Ex 8xNO FN O9 C-€N NO hL €6n-
I* 8x 9x $xg. NN €O sGNN ?€ 'O s€
600Fo€o96Fe€
-N
ONFF6* sX FX 6XNO S6 60 6F6€ d€ hN ts-
n-
€66SLX N* NX sXON hN FG 6qn€ -€ N€ h€
FngN6-!L-OnN -6
a€oFNX €X NX O*FO eN 6€ OqN6 FO n6fNNF
66906* 6X OX s'X-O 6E 6O Ns
ts 6 Nx
€€F€€FOqEh*N
oGo-
8*
o€6
sXoo
9x9€
Sx
€*
€
f* 3x S* $xN6 NN 66 €qrn ts6 0N o6
-*6-Fx Fx 6* exNO ,O 6€ ONNN NN S- €n
noNs6006-q€No60N
NOts66x ox Nx h*€6 G€ N4 SN06 0N 6N h6
-ft
E€F*FX CX OX €X€O N6 bh ?OLN O- €- OhN
OFFO OFoa€Es€tsNh
6OO-6X OX 6{ 6{C6 OL €F €-tsn {N 6N q6
6x Sx $x E*6C F6 6A d-€N 6F 6- 6n
-L€€ €o€N€N6n9€
n{610
.AL-a
6C
N\OnR
Fx s*9- eO
90c
-X -*
6X €XNO OO
90
oriiEc-a<o
-o
6
Eo
9ose o
Cl
€q
ee
EO
6o
c
e
6o
o
oo
@o
o
ctopt:d
otONt
o
tt6tc'o3a
()
an
>\
()aI
(\Jg<>
r: eI
NIf-
aoo\
htrtr
u)
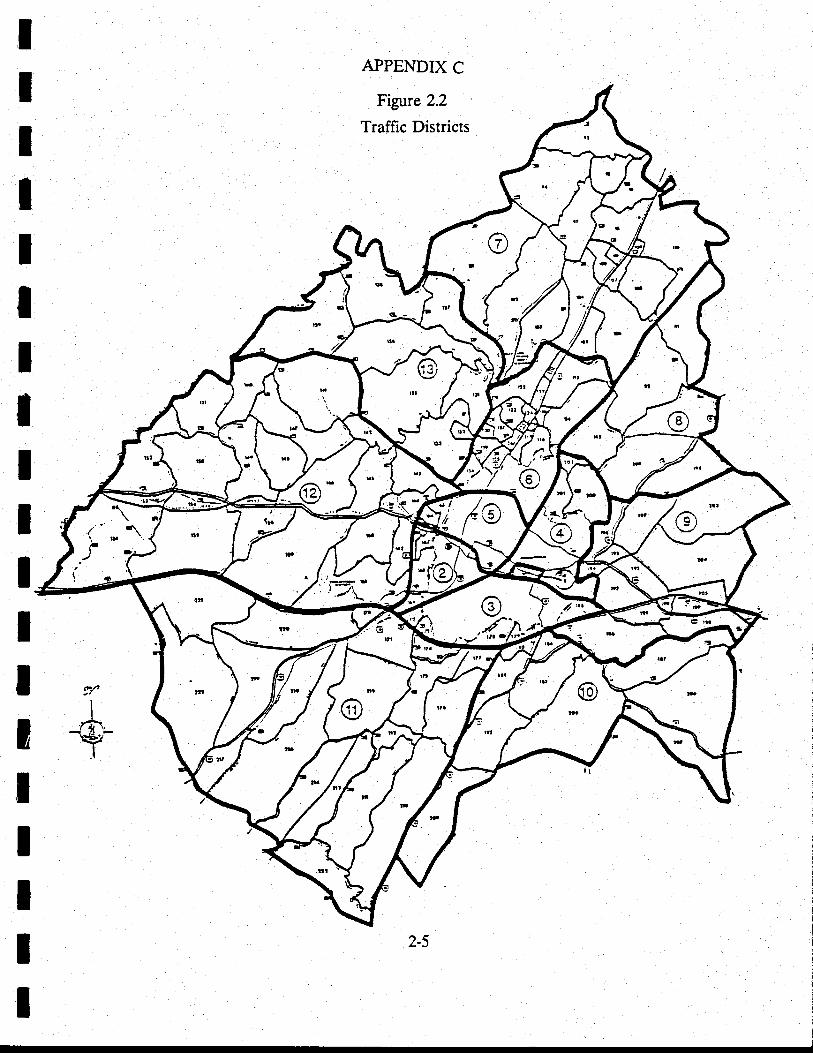
tIIIIIIIIIIItttIIII
APPENDIX C
Figure 2.2
Traffic Districts
@
rf \-
/'\ll
)% p
@/f
vI.4.
-\€t-I
APPENDIX C
To generare 2000 and 2010 trip tables by purpose, the calibrated trip distribution
models were applied using future highway travel times. The estimated average trip length
(in minutes) for 2000 and 2010 by purpose are as follows:
Average Trip l-engths
tIIIIIIIIIIItil
IIItI
Home-Based Work
Home-Base Other
Non-Home-Based
L987
9.78
7.91
6.95
2000
11.44
9.r2
8.35
2010
12.85
9.28
8.40
Each purpose-specific trip table was then split into three time-of-day tables (AM.
pealq P.M. peak and off-peak) using a set of factors representing the shares of travel for
each purpose occurring during these time periods. It was assumed that these factors remain
the same in the future as observed in the base year.
Subsequently, person trip tables were converted into vehicle trip tables using the auto
occupancy rates by time of the day and area tlpe of trip destination.
The MINUTP setup to run the internal travel forecast is presented in Appendix A
under the program title "CHARRUN.DRV'. This setup includes the travel assignment
procedures discussed in section 2.5. The setup procedure is the same as the base model
except the land use input and the output file naming convention.
2,4 EXTERNAL TRAVEL FORECASTING
To develop the future year external trip table, the base year trip table derived from
the external survey was expanded using the "FRATAR" method. The FRATAR method
assumes that the change in each trip interchange volume is directly proportional to the
changes in total productions and attractions of its respective origin and destination zones.
Growth factors for each zone and a trip table (the 1987 external survey) are key impacts of
the method. Growth factors for each zone inside the study area were developed by taking
the ratio of the 1987 and 2000 or 2010 internally generated trips ends. For external stations
a historical traffic trend analysis was undertaken. Future year traffic was then extrapolated
for each station separately, fr" ratio of future and base year traffic represented the growth
factors for external stations are shown inTable 2.2.
2-6
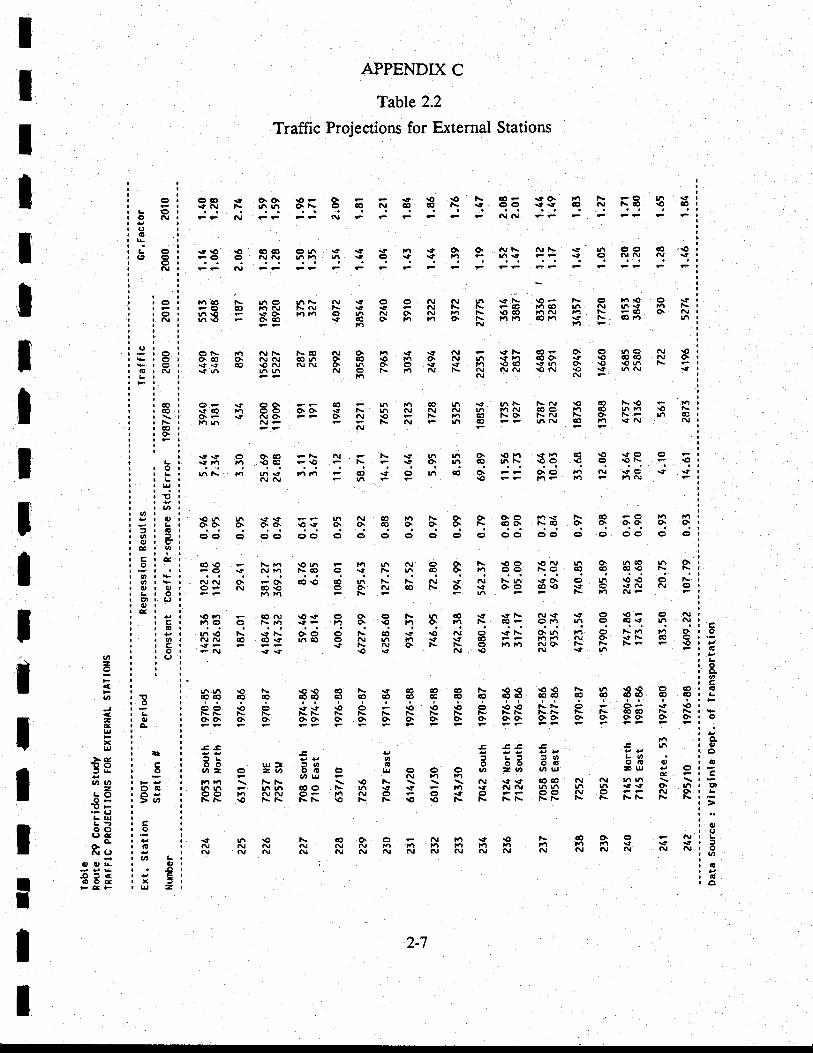
o(E
qo@g
o
CLitt6ocgt
o(,
oUI
oG6
CG(t € O.Or iOF O. - .tl 9 I N !9= €O. t! t\ FC lJi \:;- ai rh;a 6ts 6.o N € 6 F s oo a+.c N tsco \o lcF? N ?? FF t\l e e ? ? F |\|N e? eF
ss c) O.cO els N q fs € rn |/i O\ \On .tt::t e .O .{F C --n F 66 4-b ; N ; + 6 h cc tnN roo \o o \oN <lr'rt\ 16 n\? r}rt ao \t o r'r ro q qo n (\ :f9 s tt
Nfil n - .O l.tF ri t4N
.c\o ro .oco o6 rt .t 9 tt .t e o...-v\ NN { lf' 99 !9 €-6 5 -c! r/r- h + 6 .t € ir F rtrrt e€ s O .\,N ^l
\!FE N F? E F FE E F
F(rl |\ 6o 6E N s c' O N (\t r^ €\ 9= \ o r^\O O :t:Ei b ;.iKt ilru ia + - - N F: L -q lnco t4 N |frs || l-nE = Uit irn b tll or o. ry rr F 'o.o r?N F) F -€ o' NtriS 6A - a it i4 ii o. t\ taFt 6t4 s t\ lor4 ui
e* - 6 - |\, ltl
ON r.) Nt\ t\ao N O\ tt rf !t N rtN CO- O. O t,]Q f-v I5co it i!i\J br^ 6 - .ci - d N r^ +r4 .oo' :r \o .o€ !./ o'+;6 <ii\i frir 6 n d b +:t ra roco s6 q \o 9n r\ -.fn h6 N - F - N t\ Ar NN \Ot\J I I hN s-16NN
oF s oo. ao r h r. 6 n s rll\ \tr .q .o N\o q t4;o 'i 66 60. - L 6 i\i & ^i
h fr$, €9 !,r € 6n 'o \d; s ^rd
;: d i\t 6 - ia i.- 6 No. t\N E o\ I\- n €hh - a{e -; F l\,.- i 6 Pe ItrN .o t'l sN NN
\06 tn \rrc h N GO lir F O. O. O.O ftt.t f aC -c) n LYId6 6 do. \os d it 6 it ba 6 F ad N6 o' o' o'o. o' o'dct € cid oo o o c e o c o oo o(t <t e oo c <t
aO\O i\n roh li rn N Q O. t\ rOO 9t! !4 O' l'rcQ !^ O;d € alii |:b b.r il i 6 6 il 66 Fo.o o €€ t\ r\NN O. FO\ €€.O rn N N N \t N Fur'gq O rn €€ (3 Lei; ir .06 6 g. i\t b ia d s 0,6 co.o :t c) €N N eierarn-F;?hFttlNF
APPENDIX C
Table 2.2
Traffic Projections for External Stations
.OO.OAr'6rt\ON N n l.l t{ tt m '.|NNN(\JNN|\IT\I
<ti^ coN to€ o o\ o N r'\ co :t €t\ t!'t rt c \o- c $lrio o F;,i *;; - 6 5 i4 d - F.o- ora tri o 'o€ h r\;; n oj od d r.j E J .d ^j d -;i d!{, d q, \n tl' sNf! cO cis r^6 6 N h t4 :t .a 6 ;F rt{i N O' :tl\ 6C q{F - + ti
^i o\ ?- li 6 rttsl Org\ F N t\- ro
;N {s - rO \t f\I \O N \t 6
s8 3 5 38 3 b s 3 s 3 5 83 3S 5 s €8 F Fii i * *i P i s s B * i s$ FF F i FF x F'6o i> o. do. o. o c 6 o\ d o. it o. o\o' o' o' o'o' g I-- - - -i-
F F
as E EE E 1.- Rt- E ! Y 1Y .lYab u,= =ri B e bA aB i3 i _ut- o =6 5 6 o rI o o o 6 -o 0u =u e o;;
=, ;; .hu
i iri -- i^i^ ccto t\ h .r €6d F Rjij 6; h il 6; o.t o -e OP N C -- $I IFt.o iiii FF- U ii F \o 5 ri F r\N FF N t\ rst\ I\ F
aOO.ONnn99€NI\JNNAI
ln \o(vN
2-7
oLC)O r\l.J|!
L()cte o
C'e
(J
L
ao@Naoo.
oLU!v,{,Eg6e
tu
t,
@
ocoq)
x
e,4
l!co
o@6e>6
o
€ant o.€;5g=
o
6q,eoooo,LElq,e
v,z
It
=&Uxl!
>sEEv, u,LOOE:oFLgooC'C
A6NL'
o 0rr.or<60CFCF
tIIIIIIItIIIItIIIIII
APPENDIX C
Furure gowth in internal - external (I.X) and external - internal (XJ) trips will
principally be influenced by the projected population for production and employment
(attraction) changes respectively within the study area.
The MINUTP setup for the above procedure, CHARFKA-T.DRV, is included in
Appendix A Growth factors by district are presented in the file RT29FRATDST.
A procedure similar to the one applied for developing internal trip tables
(CHARR1JN.DRV) by purpose and time-of-day was applied. Peak period share factors and
directional sptits were u$sumed to stay the same as those used in the 1987 model. The time-
of-day MINUTP setup is part of the APPENDIX A under the ProFam name
"EXTERNAL.DRV'"
2.5 FUTI.]RE TRAVEL ASSIGNMENT
Assignment methodolog.v for the futureyear models are identical to those used in the
base year model. The assignment technique consisted of a four iteration incremental
assignment with a loading sequence of.20Vo,,20Vo, 20Vo, and 40Va. Usually the incremental
loading requires higher increment loading in initial iterations with smaller increments in the
later iterations so as to trigger or "sneak-up" on the congestion effects. However, the 1987
base model validation, displayed the best assignment results by following the above loading
sequence. The initial incremena provided a spreading effect of assigned trips and then, at
the 60 percent loading restraint of road capacity began showing its effect on this assignment.
Trip tables used in the 2000 and 2010 assignments are shown in Tabies 23 and 2.4.
Turning movement volumes were generated as part of the assignment for use in
intersection level-of-service analysis. Results of the furure year base network assignment are
shown in Table 2.5. The table compares base year counts with tbe future base nework
assignment. The control lines are the same as those used in the base year model validation
(see FigureZ.S)with the exceprion of nvo additional control lines: one for Meadowcreek
Parhvay and the second for Rio Road Extension.
T
IIttJ
IIIIIIIIIII'l
II
2-8
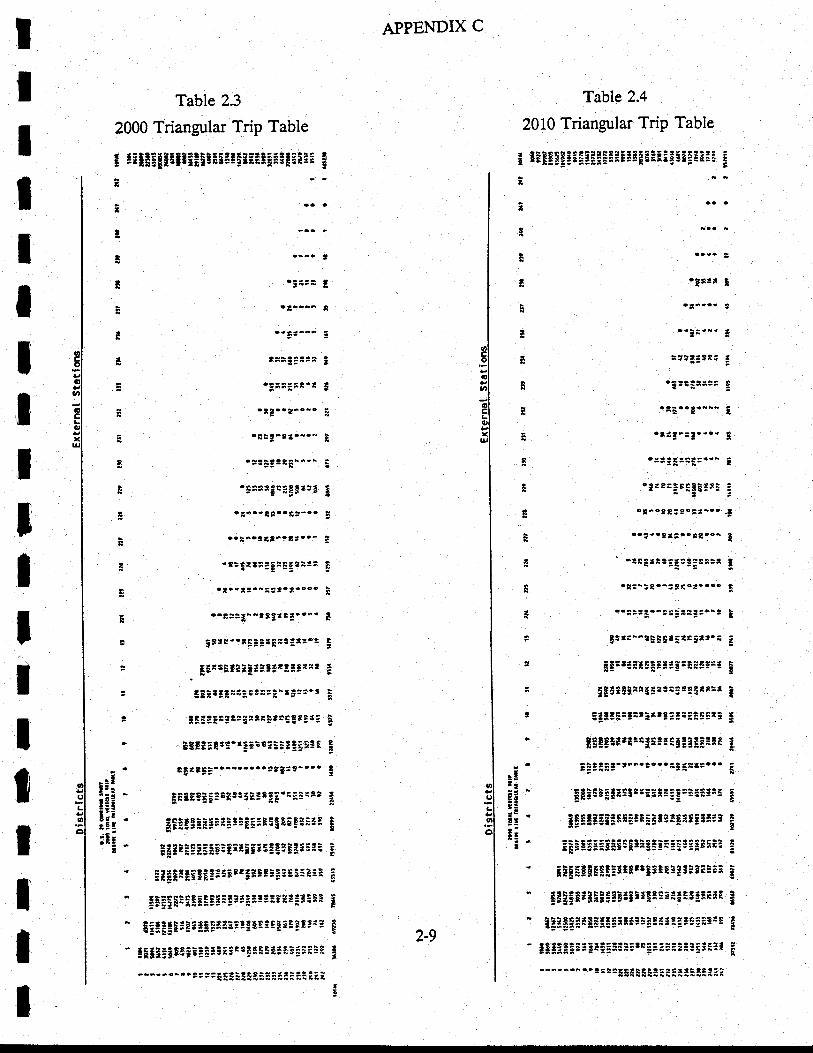
tIIIIIItIT
IIiIIItII
Table 2.3
2000 Triangular Trip Table
: srllgSgElri:!.E5:rEiE:li*!88:r !t
i ...
I .!i=. !
l'
"ng--i:
I ts!3?E3= 3
F o;;3i3t'* !
t9"3"-o -
!:i898A-"-:
E.rtl.iE333g 3
I'i"3rt"t3"- g
i -::!:34:ErE8!:!; I
F.p.-t3.t;9..t."'i
t .-r!!*-i!t3=s
, i3!sr"!!!3F€a:tt's .
r li:58!iii::!*:!89rsE I
r EEir:3:r;.e.=i-:t!3-: tr
! lF!!E*!Bs:tt:!te83t:{3 !. G5ll3i3E.3t3:sE::3!E!ES :
z'^tt!.
igi - in3E?3!3'i3s!i!teg'=i!:rr E
!!1
l!!' EEil:iiiiiS!ii!:;:!EE!::!: g
"3t'-i ' EiitiE:iiE:i:riEi5:E3E!3til i' g:!FFtEEE!::Ftr;srs!;!e!:iir
3
- !!!!F:i:g!33iE3t3:r!383p:*3es I
- !:t:i!:!3:3!rriie!lr:!i3:gFtr! !- !iit3i!:iE:it3i?'3iiE!rii3i:i!E !
'--...-..9=':i!!iil:::*i:::ii:i;
APPENDIX C
Table 2.4
2010 Triangular TriP Table
i liB:gg:ii3i3is:il3::i;:3ii!3Eie ;t
- aa at
! -"-
| '-"g
lnrt I,--.-,
I !!5::?r5 I
E:3:::!a 3
t:.c8.ii- a
E'
!!tl:a:=..- i
a .:r:=:sr85r:i 3i_i.--i*-c9:33.tti.. -!
x ' ':ilrrcgl:3gtelt I
F .!=-i3.-:tFc!
t...i-.:--:-
. Etr;-.a.!!t:!E!t!.i i
" FE:riit!3:t:g:ii!91! :
= !g!93;:sai:3i=!38:t!t ir :it!i;!.!i;r!!:r:i!3r3 i' li!E8*tl3E9i::!1338r:91 i:
3a:!3t-r.-.:...i3tt:t... !.- i
;: - Et:!Ei::cr!r!rg!=r=:r:ta! 3,sg ;F!-'-3i-' -'-- - S!:
Ei ' iEElglEgsFEeiEiri:Firest:3 !:: z-En: .r 3::ti*3t=e::tt3:t=:s;:*8iFa :- '!-- a
' iiE:!3iEt:ltgtsi$E€i33iti;it ::' rti:Eti::!3F:5i!EiEi::!3t;ElEi
5
' ii3!EirEEliSillsig::t::rEi:r'r :- !;lililrir:ir::isrEii:=i:38;*it :
.-....-..!=-::FEiiF::::::i::3:i
2-9
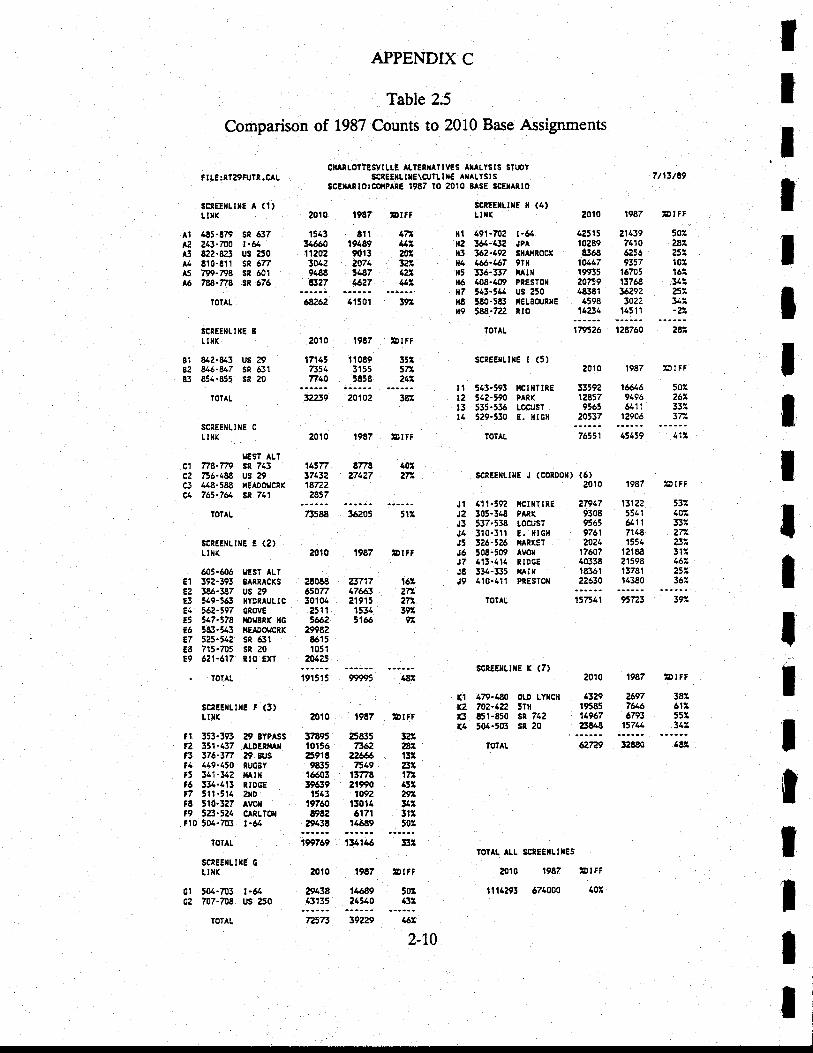
Comparison of 1987 Counts to 2010 Base Assignments
ciARLotT€w[tE ALlERxAtlvES AXA|'YSIS SIUDYSCREEXLtXE\CUILlil€ ATALYSIS
SCExARIO:COIPARE 1967 IO 2010 SASE SCEIAiIO
2010 1987
1543 trltu6 1948911202 90133042 ZO719{88 3rA7lg27 4627
APPENDIX C
Table 2.5
tIIItIIIIIIIItIIIII
tDttf
177t*/2gll2:azat*z
A1 485-879 Sr 637A2 243-700 r-64
^3 t?2-88 uS 250
A4 810-E11 SR 67-fA5 799-?98 SR 601
^6 788-28 Sn 676
t IlE3l?29R Tl.CAL
scRrExLtr€ A (1)Ilrx
lolAL .
scrEElrtxE 3ttxK
81 842-843 US ?982 846-647 Sr 63183 851-895 SR 20
TotAt
scrtElltxE cLtx(
IGST ALTc1 z8-29 SR 743c2 756-488 US 29c3 448-588 xEADOUCRK
c4 765-?& se 711
, IOTAL
scnEElttt!|E E (2)LDr(
66262 41501
SSREETLTIE II (4)Lt XK
fll 491-m2 t-6412 364-43? JPAn3 362-492 Sr{Ar{ROCr
n4 t&-t47 91tlF5 335-337 n txfl6 408-4{'9 PtESroxH7 543.544 US 250Ir8 580-583 t€LEdrRr€lt9 588-n2 tto
'OTAL
scREExtntE I (5)
tl 543-593 xct[ilREt2 542-590 PrR(13 535-536 Loersrt4 529-530 E. ilcH
7t13t89
e010 1987 lDlFt
42515 2',t139 502102Ee 7410 287E368 6256 25?10117 9357 10X19935 16705 16:20759 13768 31;'tn381 36292 2574598 3022 3tZ14231 14511 -A
179526 128750 zaz
:5IFF
2010
1711573517740
1987 brFF
11089 35X3155 t?Z5838 244
201 02
1987
382
?DIFF
3:t592 ft{/6 50U12857 9196 26Z9565 &11 33i
20537 '12906 3Ti
11577 8774 4033713? 27427 2771872??s37
tol^L 76551
SCREEXUXE J (COIDo[) (5)2010
4rz
l!IIF
1987 IDI'F
J1 111-59? rrctl{TtREJ2 305-348 PARK
J3 537-538 roq,|s?J4 310-311 E. HIGN
J5 325.526 MRKETJ5 508-509 A\€xJ7 4t3-414 RTDGE
J8 334-35 tAillJ9 410-411 PRESToTI
tol^L
279.17 1:1229308 55419565 &119761 71182021 1554
17507 1e18840338 e15981E361 137812?530 14380?5717
476E3el915
1534t166
53r1Al33;7n23231;462?5236U
5l:
16rzia27439297
117511
605-606 lr€sr ALrE1 392-391 EARRTCXS 28088E2 386-387 uS 29 65077E3 549-563 ITDTAULIC 30104E4 562-597 cROvE 2511E5 517-578 tOuSRr HG 566,2€5 583-543 rEAooircRK 2n82E7 525-542 SR 631 6615E8 715-705 sR 20 1051E9 621-617 nto EXT 20r2S
IOTAL
scREErLtxE F (3)LI T(
11 353-393 e9 SYPASSF2 351-137 lLoERil rlf3 376-32 29 EIJS
t4 449-450 ruCaYt5 341-342 r ttlt6 334-413 tt06EF7 511-514 exDt8 510-327 Avorlf9 523-521 cARtTorlf10 504.701 t-64
TOTAI
SCNEETLTITE C
!lxx
cl 504-7!3 t-64G2 707-708 US 50
IOTAL
191515
2010
{8;I
'oIFF
SCREEXUXE r (7)
11 479-480 oLD LYlCrl12 702-122 5Tng 651-850 Sr 74214 t04-503 sR 20
TOTAI
20't0
lOrAL ALt S,CREEXLIXES
2010 1987 :DIFF
111a293 674000 40x
;DIFF
t9E7
L3?9 ?597 381195E5 7&5 61A14967 6793 55;?3u8 $74 14:
37496 458:5t01t6 7352?59'.t8 A,&9835 7549
15603 1377119639 21990!543 1092
t9760 13014E982 617r
29436 14689
348rt3:23117745raryzl1:502
34880
lDITF
'(,743:
2010
2943843135
131116
1987
1t 689?4510
t$7
2-r07?573
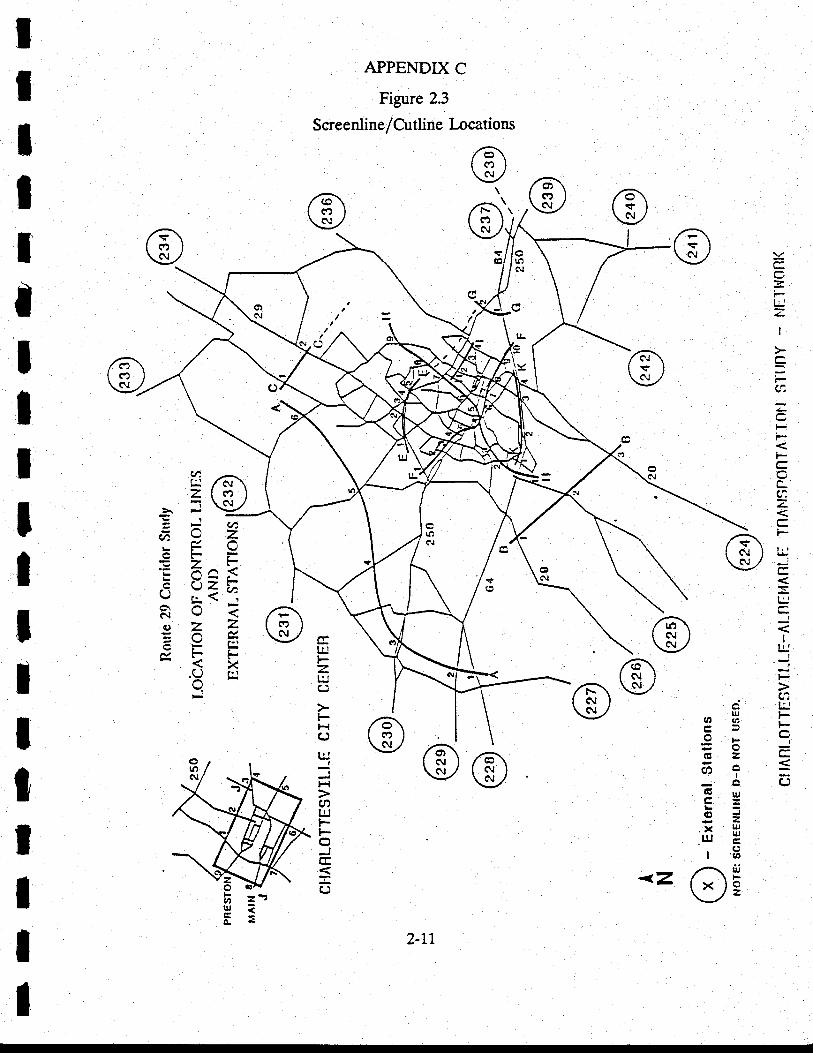
ian q)g=OF-vGZ?AO
Ic(g?=L-
,x !*i.uJ Er'8<z alE\-/ -
lr!
zUJc)
FH(.)
UJ
H
tnIrlFFC]
=C)
cnzcFn(
1- ia< ',.
zFX
anl.rz
= t^,?n
CFE7:X€\^oZer
.Q!
T
IIIIIIIIIIIIIt,
IIII
APPENDIX C
Figure 2.3
ScreenlinelCutline Locations
fca\t(.)tu,//s,\te)ls./,
sl )4
cItl
I
F
Fi-
L
F
i
l,!I
ItrII
t.|]
t
CJ
2-11
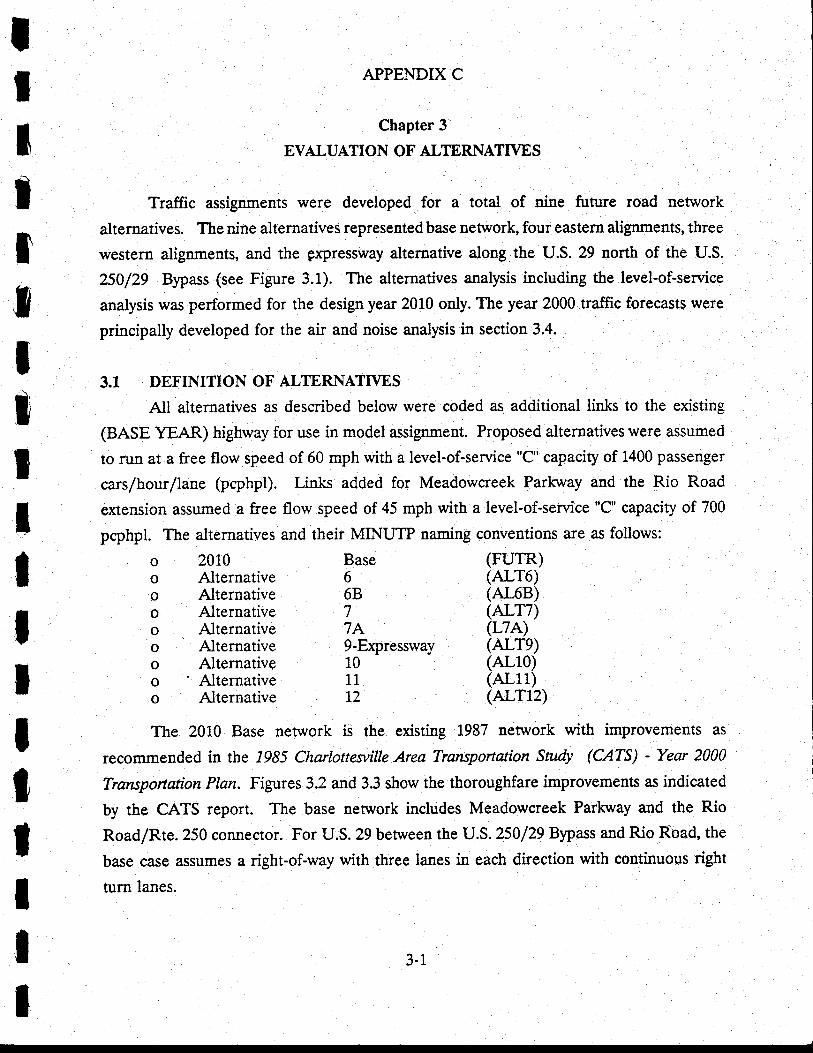
IIItI
APPENDIX C
ChaPter 3
EVALUATION OF ALTERN,{TIVES
Traffic assiguments were developed for a totat of nine future road network
alternatives. The nine alternatives representedbase network, four eastern alignments, three
western alignments, and the gxpressway alternative along the U.S. 29 north of the U.S.
250/29 Bypass (see Figure 3.1). The alternatives analysis including the level-of-service
analysis was performed for the design year 2010 only. The year 2000 traffic forecasts were
principally developed for the air and noise analysis in section 3.4.
3.I. DEFINITION OF ALTERNATTVES
Att alternatives as described below were coded as additional links to the existing
(BASE YEAR) highway for use in model assignment. Proposed alternatives were assumed
to run at a free flow speed of 60 mph with a level-of-service 'C" capacity of 1400 Passenger
cars/hour /lane (pcphpl). Linls added for Meadowcreek Parlovay and the Rio Road
extension assumed a free flow speed of 45 mph with a level-of-service "C" capacity of 700
pcphpl. The alternatives and their MINUTP naming conventions are .rs follows:
2010 BaseAlternative 6Alternative 68
ItIIIItItIIIT
ooooooooo
AlternativeAlternativeAlternativeAlternative' Alternative 11
Alternative 12
77A9-Expressway10
(FUrR)(ALT6)(.4I-68)(ALfi)(L7A)(ALre)(AL10)(AL11)(ALT12)
The 2010 Base nerwork is the existing 1987 nenpork with improvements as
reconrmended in the /985 Chartouesville Area Tratuportation Srudy GATS - Year 2000
Transportation Plan. Figures 3.2 and3.3 show the thoroughfare improvements as indicated
by the CATS report. The base netrvork includes Meadowcreek Parlovay and the Rio
Road/Rte. 250 connector. For U.S. 29 between the U.S. 250/29 Bypass and Rio Road, the
base case assumes a right-of-way with three lanes in each direction with continuous right
turn lanes.
3-1
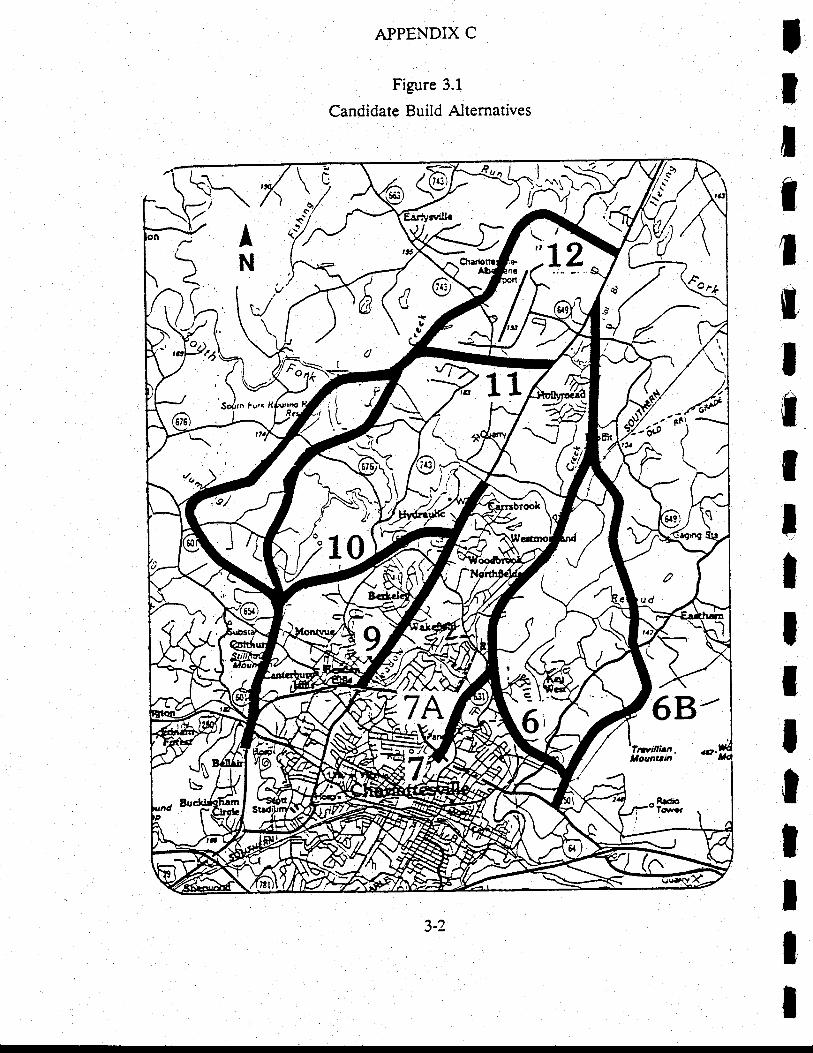
ttI3
IIIfi
lIIIT
I,l
tIII
APPENDIX C
Figure 3.1
Candidate Build Alternatives
//?
hD
,/,#p/%-dz
nu^) -
lNurru.. ag.Houn4u,
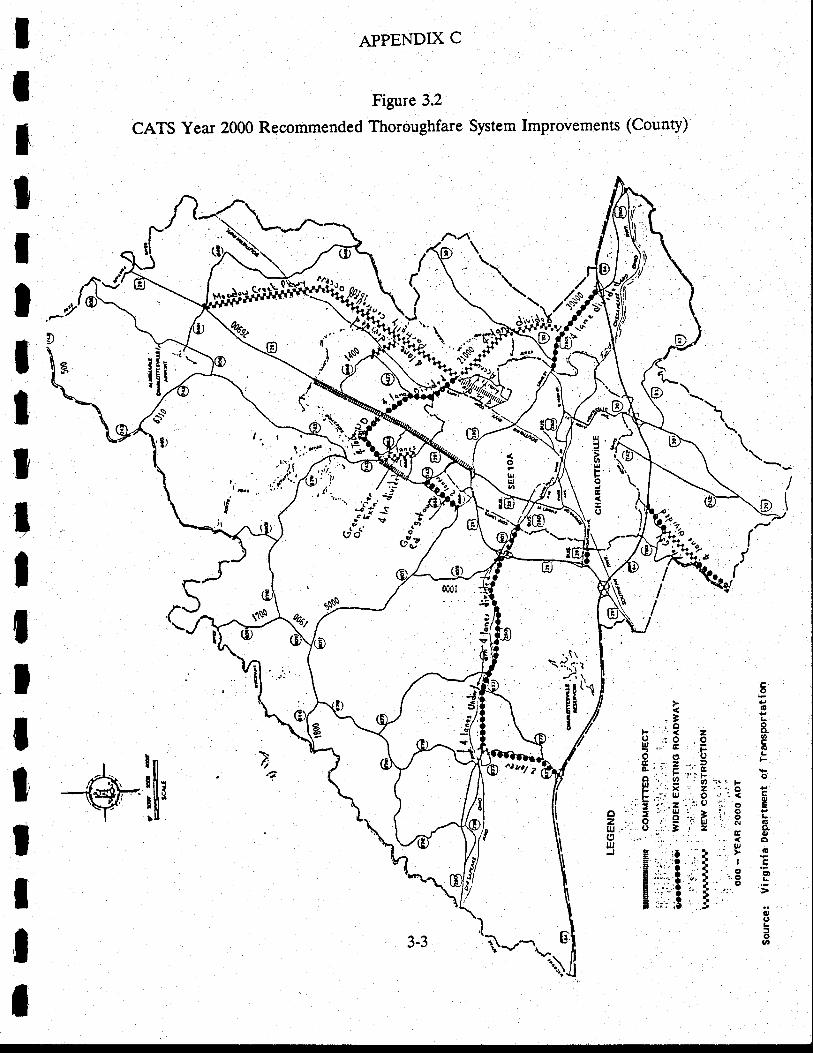
APPENDIX C
Figure 3.2
CATS Year 2000 Recommended Thoroughfare System Improvements (County)
()
ta. \
t\
il'
h
IIT
T
ItIt!IIIIItItIt
E
is-3 L
"'.'? r &$l .=q ,0 ?q'- a F 6Ct <c .o .L
E't E",? :R:'a:i[.,.,r otr ,,x | 2.1-d 2
':!';1.!-i,8,:,'l E
9,3',-H:i.t.iE ;ur-.o.,IIz'i $il :" " :f 6J c ,r _'1...1 .I
E.,:,''i,l 't .:E:l':::l';'f ' 'g 5E "-;.i ,'' I ,'"'E r'. rr ..r
EL
Ev,J.J
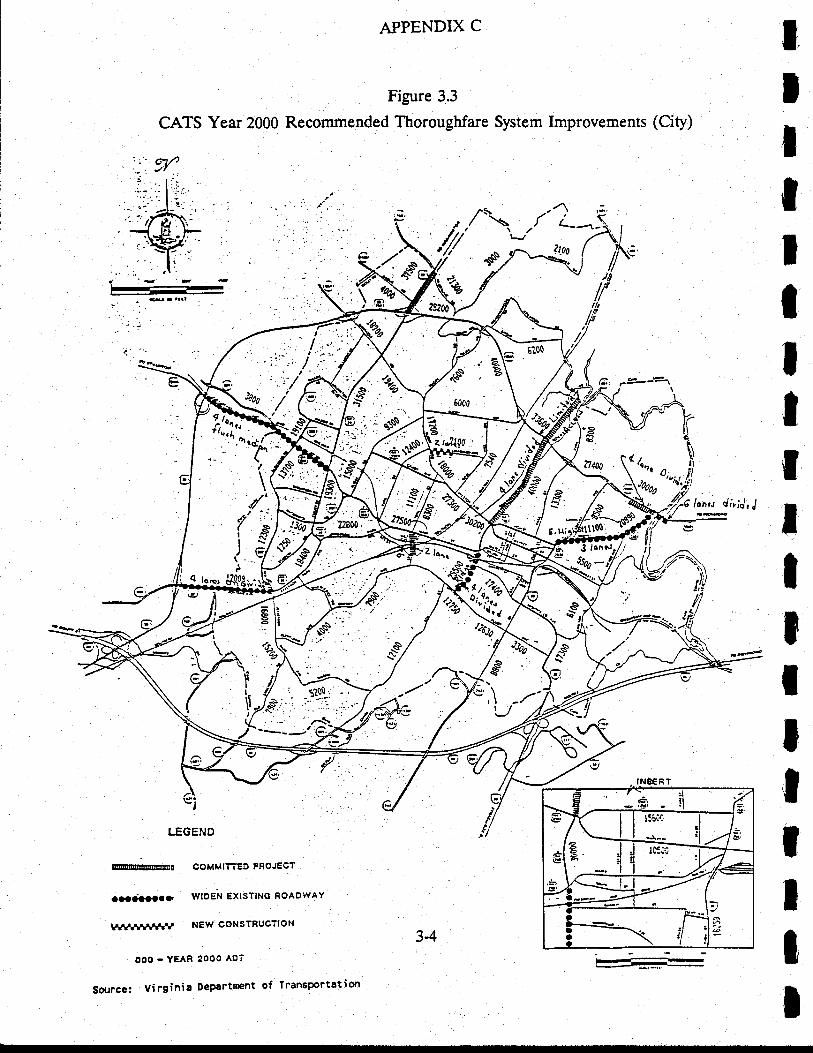
APPENDIX C
Figure 3.3
CATS Year 2000 Recommended Thoroughfare System Improvements (City)
G, ?*-7
s
s\r
.sl-
4 ,;,,' lfq--1-\
|
,,4\/Pf /N€\/a/f
IIItIIIIIIIllIIIIII
33. Y "o. o,
i'oao/onr.r diriJr J
tEmi'@{q!! COMMTTTEDPROJECT
aaa.h'oo..r wtoeh sxtsttxc RoAowAY
NEV/ CONSTRUCTION
O0O - YEAR 2o0o ADT
Source: Virginia DeP€rttnent of lransportation
IIIt,
In
ItT
tIIIIt!IIt
o
APPENDIX C
Alternative 6 is an eastern bypass with an overall tength of 8.35 miles,
beginning on U.S. 250 E just west of State Farm Boulevard and terminating
at U.S. 29 one mile south of the North Fork Rivanna River. The alignment
passes through Rivanna Parlq Pen Park, proposed Dunlora zubdivision and
the proposed Forest I-akes subdivision. The alignment essentially uses the
right-of-way for Meadowcreek Parlonay and Rio Road/Rte. 250 connector;
therefore those roads are not part of this alternative.
Alternative 68 is the farthest east of the eastern blpasses, with an overall
length of 8.09 miles, beginning at the same location on U.S. 250 E as
AJternative 6 and ends at U.S.29 at the same location as Alternative 6. The
alignment passes through the eastern portion of the Franklin subdivision.
Meadowcreek Parkway and Rio Road/Rte.250 connector are included.
Alternative 7 is an eastern bypass with an overall length of 8.01 miles,
beginning on Mclntire Road at the Nelson Drive intersection and terminating
on U.S. 29 as described in Alternative 6. The alignment uses the right-of way
for Meadowcreek Parlnray. The Rio Road/Rte. 250 connector is included
under this alternative.
Alternative 7A is an eastern bypass with an overall length of.7.67 miles. The
alignment is identical to AlternativeT except that the beginning is not along
Mclntire Road but at the intersection of U.S. 250 and Mclntire Road. The
alternative used the Meadowcreek Parkway right-of-way, and Rio Road/Rte.
250 connector is included.
Alternative 9 is the expressway on U.S. 29,\nthan approximate length of 3.00
miles, beginning north of the U.S. 250/29 Bypass and terminating a few
hundred feet north of the Sheraton. The expressway is grade separated from
the existing six lane surface road and contains a flyover onto the 250/29
Bypass and grade separation at the intersections of: Holiday Drive, Hydraulic
Road, Sperry Drive, Greenbrier Drive, Dominion Drive, Rio Road,
3-5
APPENDIX C
Woodbrook Drive, Carsbrook Drive, and access into Sheraton. A number of
access and egress ramps for each direction are located between the
intersections. Meadowcreek Parlcr*'ay and Rio Road/Rte. 250 connector are
included.
Alternative 10 is a western blpass with an overall length of. 4.96 miles,
beginning at the existing U.5.250/29 Bypass and terminating on U.S.29 i:"0of Woodbrook Drive. The alignment passes nofthwest of Albenarle High
School and through Rosslyn Ridge Subdivision. The Meadowcreek Parlnray
and Rio Road/Rte. 250 connector are included.
Alternative 11 is a western bypass with an overall length of 6.68 miles,
beginning at the same location as Alternative 10 from U.S. 250/29 Bypass and
terminating on U.S. 29 at Hollymead Memorial Gardens. The alignment
avoids all major development. The Meadowcreek Parhvay and the Rio
Road/Rte. 250 connector are included.
Alternative 12 is the western most of the western bpasses with an overall
length of 11.58 miles, beginning at the same location as Alternatives 10 and
11, terminating on U.S. 29 immediately south of the North Fork Rivanna
River. The alignment pzlsses through l"ake Acres subdivision. The Meadow
Creek Parkway and Rio Road/Rte. 250 connector are included.
NETWORK ASSIGNMENT RESULTS
The detailed assignment including information on traffic volumes, volume-to-capacity
ratios, vehicle-miles-of-travel, and intersection turning movements were produced for all
nine alternatives. Appendix B contains screenline/cutline comparisons with 1987 counts for
each of the alternatives. Appendix C contains couoty and city maps with average daily
traffic volumes posted on major roadway tinks of the network. A clmnanson of :11
t.^1
IinI$ in the network (alternative, Meadowcreek Parlnray, Rio Road Extension) and U.S.29
north of the existing 29/250 Bypass is given in Table 3.1.
IIItIf,
II,l
IIIrt
ItIIII
o
o
o
32
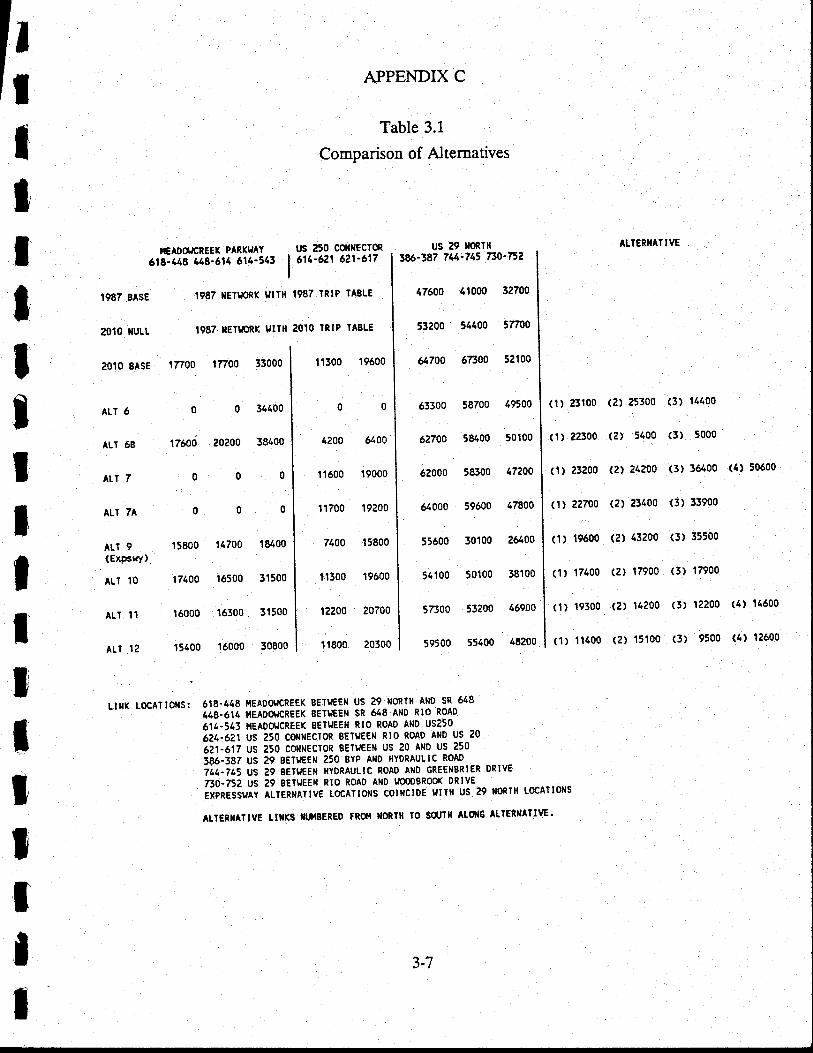
1tI/fIilIIIIT
tIIIttItII
APPENDIX C
Table 3.1
Comparison of Alternatives
1987 BASE 1987 ||ETrbRK lrlrH
2010 ruLL 1987 XETiJoRK Ulrll
20'f0 EASE lnoo 17700 33000
us 29 fioRTlt386-387 744-745 7l,0'n2
47600 41000 32700
53200 54400 5n00
64700 67300 52100
63300 58700 49500
62700 58/.00 50100
62000 58300 4720A
64000 59600 47800
55600 50100 26400
5/,100 50100 38100
57300 53200 46900
59500 55400 48200
ALTERNATTIG|GAOCHCREEK PARK9AY
ers-ara 448-614 611'313 |
rrs 250 CofillEcroR614-621 621-617
1987 TRIP TABLE
2O1O IRIP TABLE
11300 19600
00
6200 6400
11600 19000
11700 19200
7100 15800
11300 19600
12200 20700
il800 20300
ALT 6
ALT 68
ALT 7
ATT 7A
ALl 9(Expst y)
ALT 10
ALI 11
Atr 12
00
17600 20200
00
00
15800 14700
r74oo ,|6500
16000 16300
t54oo 16000
(1) 23100
(1) 2?300
('l ) 23200
(1) 2?700
(1) 19600
( 1 ) '17400
(1) 19300
(1) 11400
(2) 25300
(2) 5400
Q, 24200
(2) 23400
(2) 43200
(2) 17900
(2) 11.200
(2) 15'100
(3) 14400
(3) 5000
(3) 36400
(3) 13900
(3) 35500
(3) 17900
(3) 12200
(3) 9500
(4) 50600
(4) 14600
(6) 12600
34100
38400
0
0
18400
31500
31500
30800
LI}IK LOCATTONS: 618.4{t8 I'IEADOTICR€EK 9ETUEEN US 29 ilORTH ANO SR 648
448.614 I'IEADOIJCREEK EETUEEN SR 648 AI'ID RIO ROAD
6'lt,'513 i{EAOCIJCREEK EETuEEll RIO ROAD AND US250
Lu,-tzt us 250 coNt{EcroR EEruEEfi Rto RoAD AND us 20
6?1.617 US 250 CONNECTOR BETI'EEN US 20 AND US 250
386.387 US 29 BETIJEEN 2'O BYP ANO HYDRAULIC ROAD
?t1'7LS US 29 8ET!JEE}| HYDRAULTC ROAD AND GREEilgRIER DRIVE
730-752 US 29 BETUEEN Rlo RoAD AtlD l'OoosRoo( DRIVE
€XPRESSUAY ALI€RXAIIVE LOCATIOT.IS COINCIDE 9ITH US 29 IIORTH LOCATTOXS
ITEnTATIVE ttxrs IuIBERED FRO{ llORTll lo sctlH Atol6 ltTERtlATlvE'
3-7
ilAPPENDIX C
33 IIYTERSECTION LEVELOF.SERVICE AhIALYSIS
The intersection analysis was performed for the AM. and P.M. peak hours for 25
intersections as designated by VDOT within the Charlottesville Study area (see Figure 3.4).
Techniques in the 1985 Highway Cagacity Manual - Special Report 209 GICM) were used
for the analysis.
The calculations for measuring L.O.S. were not performed by the MINUTP
forecasting sofnvare. Outputs from MINUTP were downloaded into tbe intersection
capacity analysis package 'NCAP':written by Professional Solutions, Inc. NCAP replicates
HCM techniques and outputs reports identical to those used in the HCM. NCAP performs
all the different analysis techniques found in the HCM, but for this study, only the signalized
and unsign alized techniques were utilized.
33.f Methodology
To prepare the MINUTP turning movement data for use in the NCAP package, the
data had to be aggregated, translated into a different format, and weighted to reflect $owth
as well as shifts in the turning movements. For that purpose, a utility Progam TFACTOR
written by COMSIS for this study was used to prepare the data for NCAP. Documentation
on the use of this sofnryare is found in APPENDIX D.
The.travel assignment portion of the model produces three time-of-day turning
movement tables that must be aggregated to perform the L.O.S. analysis. Weighting factors
for the analysis were based on daily volumes since it was felt that the individual time-of-day
tables did not accurately reflect growth. TFACTOR aggregated the three time-of-day
turning movement files into one total daily table (up to five can be aggregated at one
time). MINUTP turning movement data is output in ASCII in the format ANODE-
BNODE-CNODE-VOLUME where ANODE is the node approaching the intersection,
BNODE is the intersection node, CNODE is the node leaving the intersection and
VOLUME is the turning movement count through the three node movement. The NCAP
sofnvare accepts manual input of data or it can import turning movement files in ASCTI
arrays. The array differs from the MINUTP fornat in that the array format resembies an
origin-destination matrix with the origin nodes on the vertical a:ris, the destination nodes on
the horizontal axis, and the intersection node in the upper left hand corner of the matrix.
ItIII3
T
IIT
tItIIJ
I3-8
IIItIT
ttT
tT
tItIT
It
APPENDIX C
TFACTOR acceprs MINUTP format and automatically translates the data into the NCAP
array format or leaves it in the original MINUTP format.
The weighting and traffic growth adjustments are performed automatically by the
TFACTOR utility pro$am. TFACTOR requires three frles to perform the adjustment:
(1) An existing L987 AM. or P.M. peak hour turning movement file in the
MINUTP format. This file is manually created by the user for input to
TFACTOR.
(2) Turning movements oulput from MIITIUTP for the 1987 Base.
(3) Turning movements ouput form MINUTP for the selected 2010 Alternative.
TFACTOR uses these three inputs to perform the following calculation:
(2010 Alternative/1987 Base) X 1987 A.M. or P.M.
Using the three files, the calculation is performed for each row and column total in the
intersection. The existing interchanges between nodes are then adjusted using the Fratar
technique to try to match the row and colurnn totals. TFACTOR requests the number of
iterations to perform which witl deterrnine whether the row or column totals match exactly.
This is a constraint of the Fratar method. Either the row or column totals will have to
fluctuate slightly to perform the growth procedure.
TFACTOR performs the calculations and outputs the adjusted arrays ready for input
to the NCAp capacity analysis software. NCAP is menu driven and identical to procedures
used in the 1985 HCM. It is recommended that the user read the HCM before using NCAP
since a theoretical understanding of the technique is important to perform the calculations
correctiy.
332 LO.S' AnalXsis Results
The L.O.S. analysis process is not a compietely automated system but rather an
interactive system which requires the user to make the final decision on the accuracy of the
results. In this study it was found that intersections that had exceedingly high differences
between the 1987 Base and 2010 Alternative had to be adjusted since the growth was
unrealistic. In addition" intersections that added an approach (3Jeg to 4-leg) benveen the
Base and the Alternative required adjustment. The final step to the L.O.S. analysis is the
comparison of the peak hour projections to the daily projections. The peak/daily
percentage will grve a good indication if the calculations are working correctly.
3-9
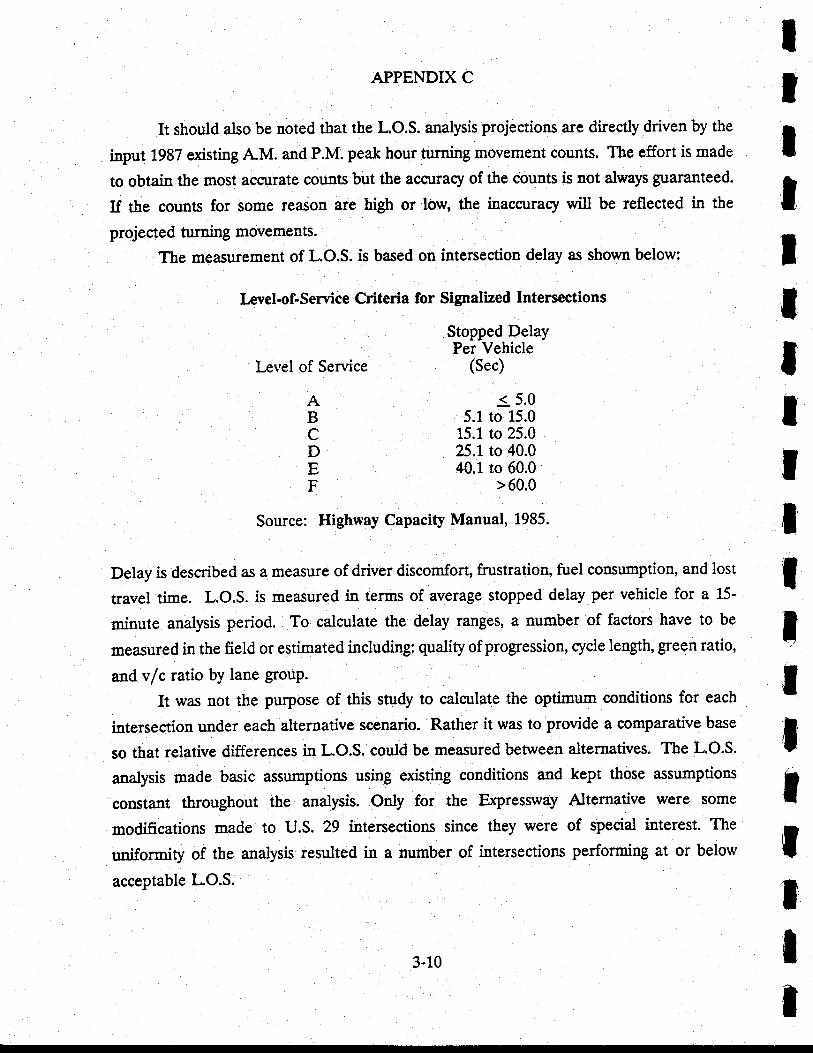
ttAPPENDIX C
It should also be noted that the L.O.S. analysis projections are directly driven by the
input 1987 existing AM. and P.M. peak hour turning movement counts. The effort is made
1s ehain the most accurate counts but the accuracy of the counts is not always guaranteed.
If the counts for some reason are high or low, the inaccuracy will be reflected in the
projected turning movements.
The measurement of L.O.S. is based on intersection delay as shown below:
Level-ofi Service Criteria for Signalized Intersections
II
Ixvel of Service
ABcDEF
Stopped DelayPer Vehicle
(Sec)
< 5.05.1 to 15.0
15.1 to 25.025.1 to 40.040.1 to 60.0
>60.0
IT
IIT
IIIlIttIII
Source: Highway Capacify Manual, 1985.
Delay is described as a measure of driver discomfort, frustration, fuel corsumption, and lost
travel time. L.O.S. is measured in terms of average stopped delay per vehicle for a 15-
minute analysis period. To calculate the delay ranges, a number of factors have to be
measured in the field or estimated including: quality of progression, cycle lengh, green ratio,
ard vf c ratio by lane grouP
It was not the purpose of this study to calculate the optimum conditions for each
intersection under each alternative scenario. Rather it was to provide a comparative base
so that relative differences in LO.S. could be measured between alternatives. The L.O.S.
analysis made basic assumptions using existing conditions and kept those assumptions
constant throughout the analysis. Only for the Expressway Alternative were some
modifications made to U.S. 29 intersections since they were of special interest. The
uniformity of the analysis resulted in a number of intersections performing at or below
acceptable L.O.S.
3-10
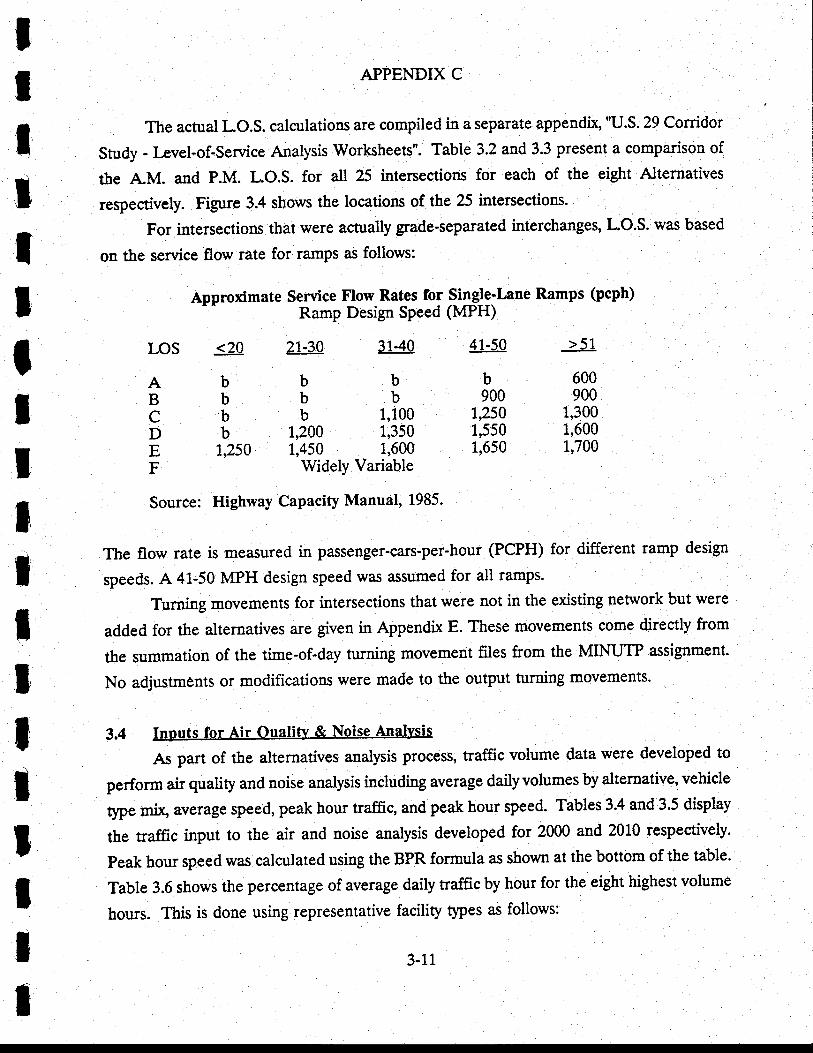
LOS
ABcDEF
IT
ItttIIttIlT
tttIII
APPENDIX C
The actual L.O.S. calculations are compiled in a seParate appendix, "U.S.29 Corridor
Study - Igel-of-Service Analysis Worksheets". Table 3.2 and 3.3 present a comparison of
the AM. and P.M. L.O.S. for all 25 intersections for each of the eight Alternatives
respectively. Figure 3.4 shows the locations of the 25 intersections.
For intersections that were actually grade-separated interchanges, L.O.S. was based
on the service flow rate for ramps as follows:
Approximate Service Flow Rates for Sing]e-Lane Ramps (pcph)RamP Design SPeed (lr{PH)
>51
600900
1,3001,6001.,700
Widely Variable
Highway Capacify Manual, 1985.
<24
bbbb
1,250
2144
bbb
1,2001.,450
3140
bb
1,1001,3501,600
41-50
b900
\2sa1,5501,650
Source:
The flow rate is measured in passenger-cars-per-hour (PCPH) for different ramp design
speeds. A 41-50 MPH design speed was assumed for all ramps.
Turning movements for intersections that were not in the existing netrvork but were
added for the alternatives are given in Appendix E. These movements come directly from
the slmmation of the time-of-day turning movement files from the MINUTP assignment.
No adjustments or modifications were made to the outPut turning movements.
3.4 Inputs for Air Oualit!'& Noise Analysis
As part of the alternatives analysis process, traffic volume data were developed to
perform air quality and noise analysis including average dailyvolumes by alternative, vehicle
type mix, average speed, peak hour traffic, and peak bour speed. Tables 3.4 and 3.5 display
the traffic input to tbe air and noise analysis developed for 2000 and 2010 respectively.
peak hour speed was calculated using the BPR formula as shown at the bottom of the table.
Table 3.6 shows the percentage of average daily traffic by hour for the eight highest volume
hours. This is done using representative facility types as follows:
3-11
APPENDIX C
Freeway/Expressway - l-64
Principal Arterial - U.S.29 North
Minor Arterial - Hydraulic Road & SR 20 North
The volumes were taken from counts collected for the study. Table 3.7 shows counry-
wide vehicle miles traveled and average trip lengths as calculated by MINUTP.
3-r2
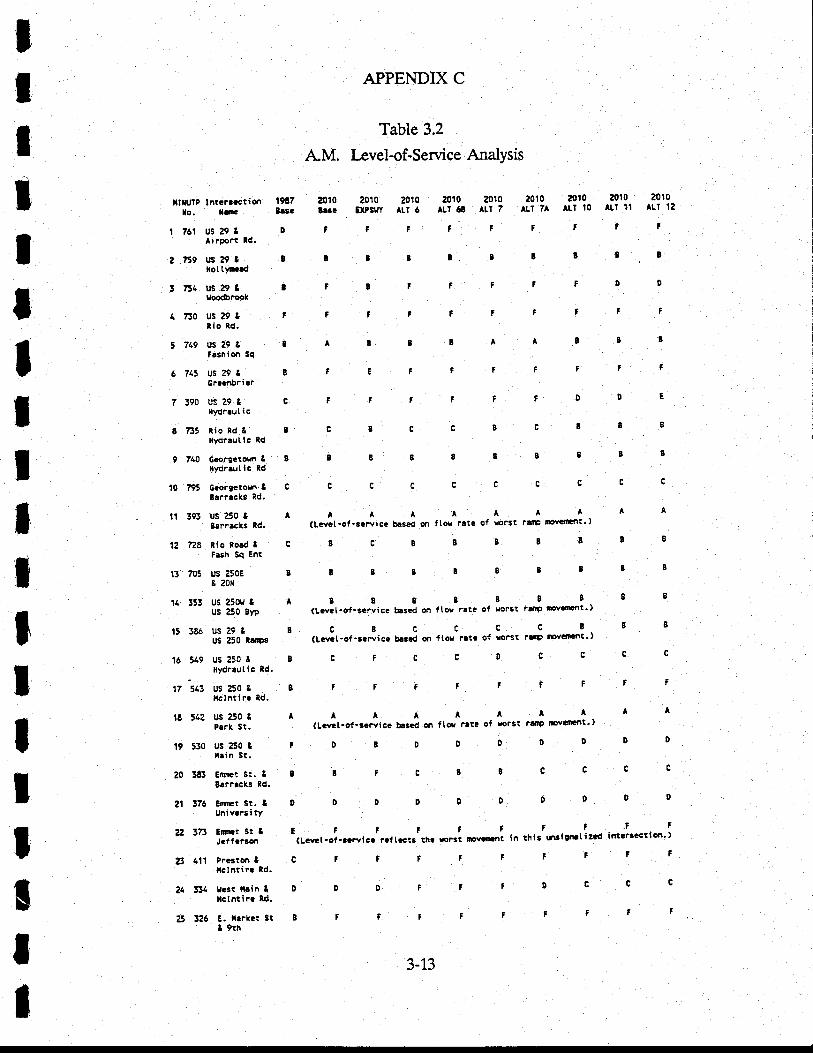
tlIT
It
APPENDIX C
Table 3.2
AM. I"evel-of-Service Analysis
2010 2010 2010 2010 2010 2010 aolo 2O1O agtg^r.$ atpsvr rir c atl 68 ALr 7 ALT 7A
^tr l0 Alr tl ALr le
?IFTF?FfF
AAATAAAAA(Lavet'ot'sarvicc based on ftor rat! of Yolst r!|lp tDv.'ltnt')
8cBB88BrB
g33B8BBB9
ABBBB88888(Llvct'of-3crvice brscd m flor ratc of rolst fgtP lFvct|Fn!')
cBsccc883(Lcvct'of'3aFvice bascd on ftor ratc of rot'st F!'rP tFv'trrnt')
cFccDcgcc
TFF?T??FF
aAAAAAAAA(lavcl'of'3afvica baScd qr f tor ilte of rol3t ra.lP lFvrmtrt')
DDDDSDODD
SFcBBcgcc
DDDooDoDD
IllIItt
tfnJlP lnteP3cctlsr $A7Io. Irtt 3aac
I ?61 use9l D
AiPPort ld.
a ni9 us?9 I Itlolt),EtC
3 754 US29t 3tloo&Fook
4 730 US29t F
tio td.
5 749 US29t It.3hion Sq
6 745 US29t B
Gractrbri cr
7 390 Us29& E
ll)dr!ut i c
E ?35 tio nd.! B
. iydrautic ld
9 740 Gcofgctos t 8ilydrruiic ld
10 .795
Gcorgctom t C
3!rf!cks Rd.
11 393 US250 I ABsfrlcks ld.
12 728 8io Rold t C
Fash 5q Ent
13 705 US 25oE B
& 20x
IItT
II
14 !53 Us 250u tus 250 8!D
15 385 us29& 8Us 250 Rad9s
16 549 US2503 B
fiydr.utic ld.
rz!c uszsor B
t.ilntirr Rd.
lE 542 US50t A
Psrl, St.
19 530 us 250 & rIrin St.
20 l8:t Ettct st. & B
Bsrt.c|3 ld.
21 !76 Ett|rr st. t D
Utti vc.3i tl/
22 !73 ErtEtstl E I t I I t .f f f F
J.it.?icr (Lctst-oi.rcryicc rallccts thc roF3t lDvGttr.at in thls t,r3lgn tisad intlBcction')
23 4ll Pr6to.rt C t F F t t t F f F
tclntir? ld.
24 3:t4 u.stltrinl D D D I I t D c g c
rclntiPa Ral.
25 326 E.x.rkotst B r I t f t F F F tt 9tn
3-13
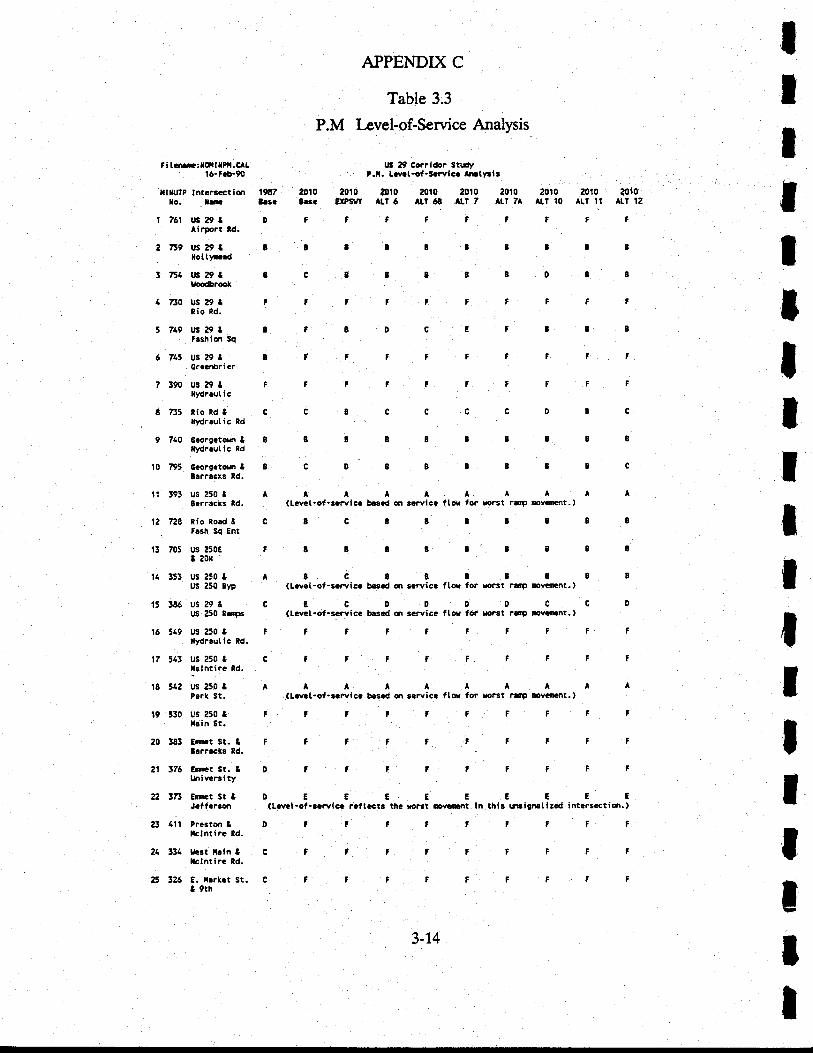
ti t.ne:tldalIPil.CAL16-.1.b"90
tUltUtP lntlf'cctiql 1987to. LrE 3ata
t 761 U3?9t D
Airport ad.
2 759 uS?91 !llotttcld
! 756 Us?9t 3lloodbrok
4 7t0 rrs29& F
lio td.
5 769 US29l 3fsshim Sq
6 745 Us29t IGrcar$ri!r
7 390 u3??& ?
lhdr.ut ic
8 735 RioRd& cItdraulic td
9 760 06f9ctora t Blydr.u( ic Rd
10 795 Gmrgctom I B
Barr!6ts ld.
11 !93 US 250 I ABlrrrcks ld.
1? 7?8 Rio road & C
. F.sh Sq Ent
13 705 us e50E F
t 20rl
t4 353 us 250 & AUs ?5q BIP
lt 3E6 uS29t C
US 250 R!4s
16 549 r.rs e50 t ftlydmutic Rd.
t7 543 US 250 & C
tlslntir! ld.
18 542 Us 250 t APerk St.
t9 530 us ?50 3 |tisin St.
z0 383 Emt St. I I3.rr!6ks 8d.
2t 376 EDFI St. 3 0t niv.rii ty
APPENDIX C
Table 3.3
P.M l-evel-of-Service Analysis
lrs 29 Co?ridor 3trd/P.f . l3r,rt-of'ScrYicc Ana{}rlit
ar|0 2o1o e01o 2o1o 2o1o 2010 2010 2010 a01ol|3c gPstat ALI 5 ALt 6N ltr 7 AII 7A Att l0 Alr li Alt lZ
FIfFTFtF'
AAAAAAAAA(Lcvcl-of.3cryica brs.d on scrvicc ttor fot rorst rlnP mmt.)
8C83B!BBB
8g3BlBB89
tc8838888(Lavet-of -3cfvica b.ecd an g"ryica f lo|. fot rotst rll? tEvffit. )
ECDDDDCCO(Lcvct-of-scfrlca bascd cr rcrvica ftor to. rorst rg|p lEvcitnt.)
,;tFtF;ft
fTFFfF?FT
IAAAAAA^A(lryct-of.raflica bosed sr sarvica flor fot rofst riP fFvrnrnt.)
rrFllF?tF
IT
IIItIItItItfI22 375 EtmtStT D E E E E E E E E E
J.ffor3on (L.vcl-ot-3.?vlca r.lt.ct! th! rorst mvi:nt in thir t'llgnatlsld intcr3ctiotl.)
23 411 Praitm & D
lclntirc ld.
24 334 g.sr l|!in t C
Itclnti.o Rd.
U 326 e. r.rl.t st. C
t 9rh
Ittt
3-74
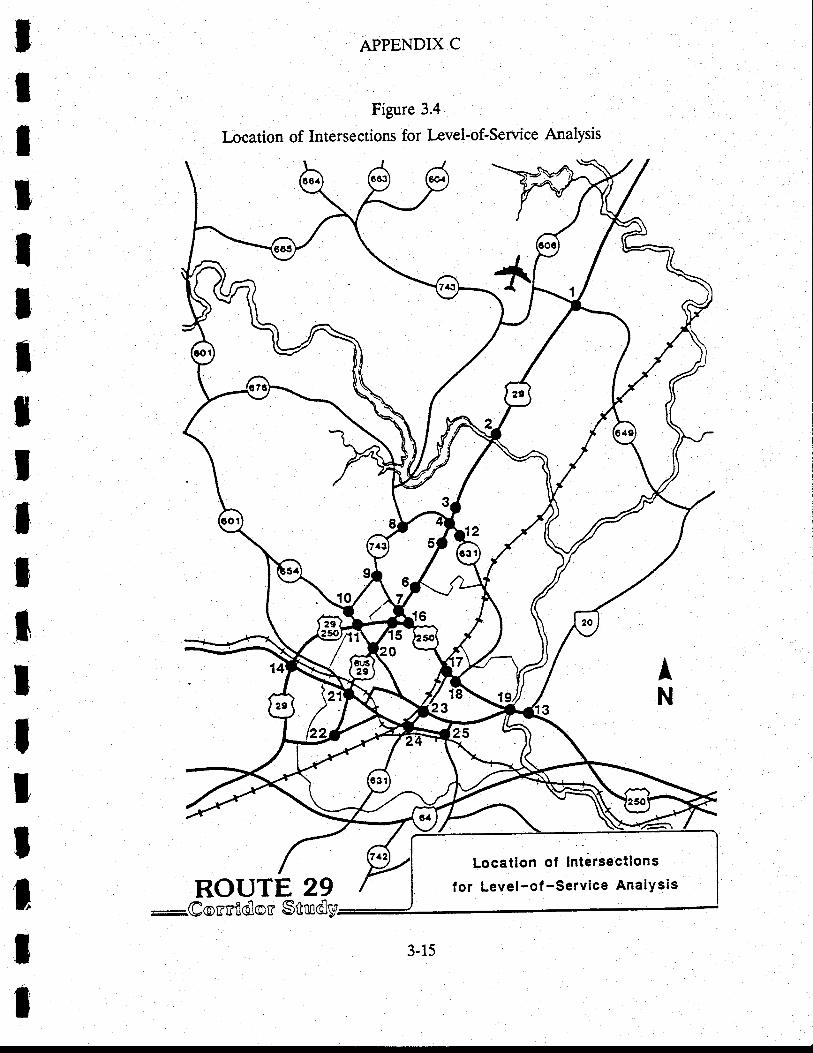
T
IItIIttttIt'
T
IT
tIIt
APPENDIX C
Figure 3.4
Location of Intersections for Level-of-Service Analysis
Locatlon of tntirsections
for Level-of -Service AnalYsisROUTE 29
-eonrfloJor Stnnolgt
3-15
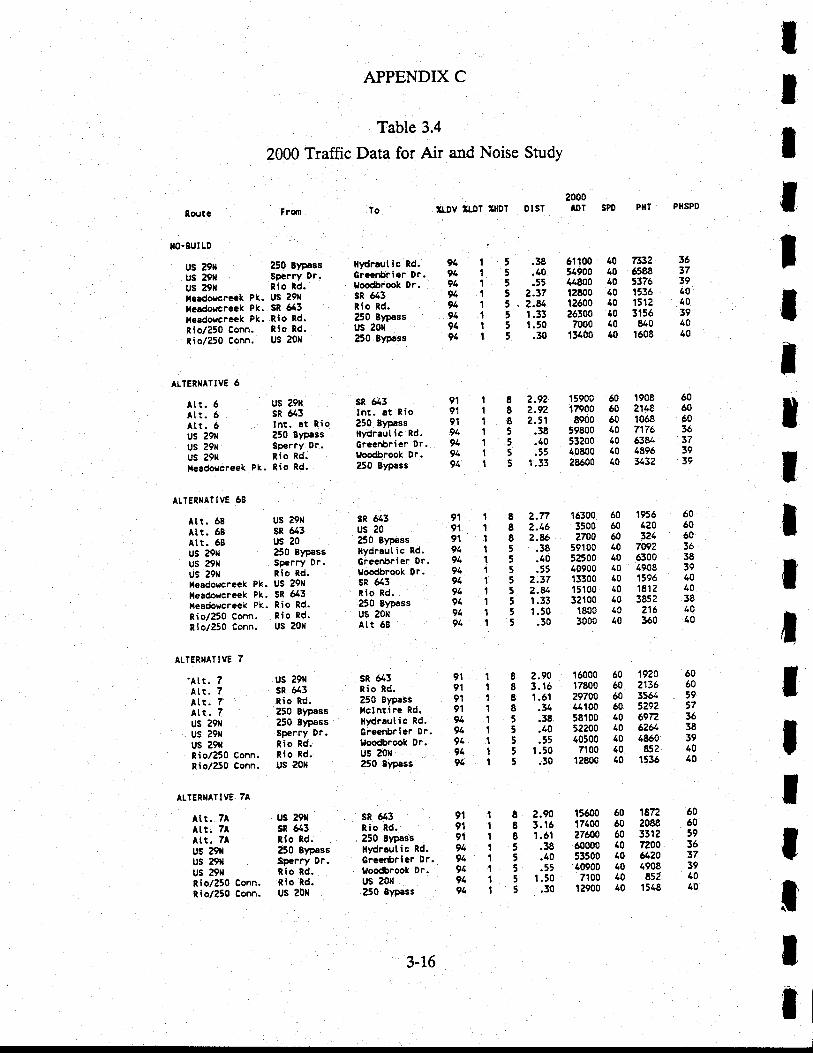
APPENDIX C
Table 3.4
2000 Traffic Data for Air and Noise Study
lo
Hydrautic Rd.Greartrier Dr.t oo(brook Dr.sR 643Rio Rd.250 Etpessus 20rl250 Sypass
;LDV SLDT :IIDT DIST2000IDT SM PHT- PHSPO
tI
IRoute
x0-Bul LD
us 29Xus 29rlus 29x
250 BFasssperry 0r.Rio Rd.
tnt..at Rio250 BypassSpcrry Dr.Ris Rd.
us e9xsR 613
250 BlpassSperry Dr.Rio Rd.
i.adorcrc.k Pk. Us 29)lflcadorcra€k Pk. Sn 643l{esdorcrcck Pk. Rio Rd.Rio/250 Conn. Rio Rd.
Rio/250 Conn. US 20ll
3637394040394040
40404040a0a04040
50606040104040
949t,949494919491
919j9191919[91
us ?9r{sR 643
55555555
.38 61100
.a0 54900
.55 148002.37 12800z.u 126001.33 263001.50 [email protected] 11400
7332658E3376153615123r56
640r608
ALTER}IATIVE 6
Att. 6Atr. 6Att.6us 29llus 29llus 29rl
sR 643tnt. at Rio?50 BypassHydrautic Rd.Grcenbricr Dr.tloodbrook Dr.250 Eypass
sR 643us 20250 ByrassHydrautic Rd.Greenbrief Dr.Uoodbrook Dr.sR 643Rio nd.250 Sypassus 20NAIt 68
sR 643Rio nd.250 Eypassltctntir! Rd.Hydrautic Rd.Greenbrier DF.Uoodbrook Dr.us 20rl?50 Stpass
sR 643Rio Rd.250 EypassHydrautic Rd.G.ccrSricr Dr.goodbrook 0r.us uorl250 81pass
8 2.92 15900E 2.92 179008 2.51 89005 .38 596005 .40 532005 .55 408005 1.33 28600
IIIIIlI
50606036373939
6060603638391040384040
606059573538394040
6060593637396040
606060606040404040
6060604040404040
1908211810687176538448963132
|teadoecrcek Pk. Rio Rd-
ALTERNA?IVE 68
Att. 68Att.68
us ?9llus 29nUS 29N
Att. 68 us 20
919t9191919191949t,9191
E z.7l 16300 60 1956
8 2.46 3500 60 1208 2.& 2?O0 60 3?15 .38 59100 40 7a925 .40 52500 40 63005 .55 a0900 40 49085 2.37 13300 40 1596
5 2.U 15100 40 1812
5 1.33 32100 40 38525 't.50 1800 40 2165 .30 3000 40 360
tlesdorcr.ek Pk. US 291{
lleadorcrack Pk. SR 643lleadorrcreek Pk. Rio Rd.Rio/250 Conn. Rio Rd.Rio/250 Conn. Us ?0x
ATTERNATIVE 7
'Att.7Att.7Att.7Att. 7US 29NUs 29Nus 29rlRio/250 Conn.Rio/250 Conn.
ALTERNATIVE 7A
Atr. 7AAtt.7AAtr. 7Aus 29xus ?9llus 29xRio/250 Conn.Ri0/250 Corn.
us 29tlsR 643Rio nd.?50 Bypass250 BlpassSperry Dr.Rio Rd.Rio Rd.us 20ll
us 29rlsR 643Rio Rd.250 SrDassSpcrry Dr.Rio nd.Rio td.us 20x
2.90 160003.16 178001.61 29700.t1 44100.38 58100.40 52200.55 40500
1.50 7'100.30 12E00
919191919a9t,919491
9191919494949491
88E855555
19202136356{3292697262&,.860
8521536
18n20883312??00&204908
8521548
8 2.90 156008 3.16 174008 1.61 ?76005 .38 600005 .40 535005 .55 409005 L50 71005 .30 12900
3-16
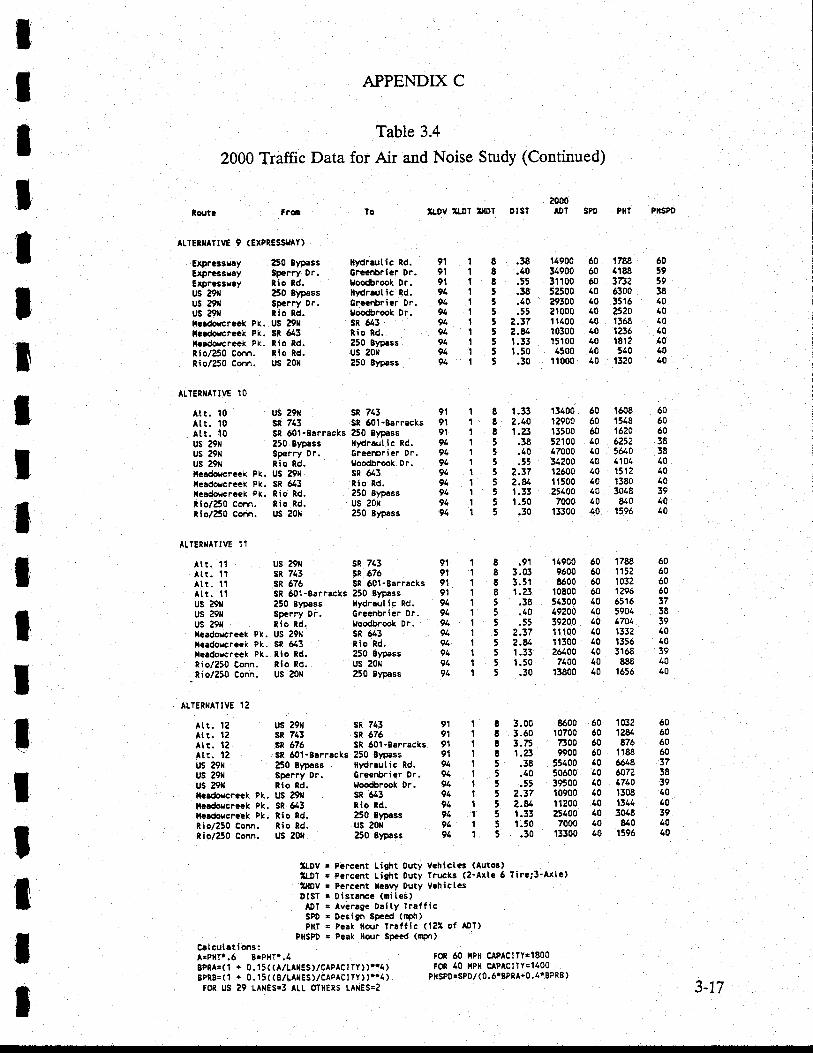
tlltIIIIIIItT
IIItII
APPENDIX C
Table 3.4
2000 Traffic Data for Air and Noise Study (Continued)
2000ADT SPD PNT PIISPD
ATIENTATIVE 9 (EXPRESSIIAY)
Exprlssuly 250 BlPassExprassray SPerrY Dr.Exprcssray Rio td.us 29xus 29tlus a9|lItc!(brcr..k Pk. US 29llfl.dor,creek Pk. SR 643leadorcicck Pk. lio td.Rio/250 conn. Rio Rd.Rio/250 Conn. uS 20f
ATTERIIATTVE 1O
E .38 t4900 506 .40 34900 60E .55 31100 605 .38 52500 405 .40 29300 405 .55 21000 403 2.37 11400 405 Z.U 10300 605 1.33 15100 405 1.50 4500 405 .30 '11000 40
1788 604188 593752 596300 383516 40a20 401368 40t2f5 401E1? 40540 48
1320 40
8 1.33 13400 60 t60E 608 2.{O 12900 60 1548 60E r.23 13500 60 16e0 605 .38 52100 40 6252 385 ,40 47000 40 5640 385 .55 31200 40 4104 405 2.37 12600 40 t512 405 2.& 11500 10 t380 405 1.33 29400 40 3048 395 1.50 7000 40 &0 605 .30 13300 40 1596 60
8 .91 14900 60 1788 608 1.03 9600 60 1152 60E 3.5 | 8500 60 '1032 60E 1.23 10800 60 1296 509 .38 54300 40 6516 375 .40 49200 40 5904 385 .55 39200 40 17s1 395 2.37 11100 40 1332 40t 2.u 11300 40 1356 405 1.33 2&OO 40 3168 395 1.50 7400 40 888 40
5 .30 13800 10 1556 40
3.00 8600 50 1032 603-60 10700 60 128/. 503.75 7300 60 876 501.?3 9900 50 1188 60
.38 5j400 40 &s 3z
.40 50600 10 &72 38
.55 39500 40 4710 392.37 10900 40 1308 402.* 11200 40 1311 401.33 ?5400 40 3048 391.50 7000 40 640 40.30 13300 10 1596 60
250 B;pessSparry Dr.Rio td.
To
lrdrsutic Rd.Grlcibrier 0r.goodbrook 0r.Hldrrut ic nd.C.C.nbri.r Dr.goo.brook Df.sR 543nio nd.250 Bt?assus 20x250 Enass
:LDV ltol :[0T Dlsr
919r9194949a9191919491
919191919191919191949191
Att. 10 us 29x SR 743 91
Att. 10 SR 743 SR 601'88rrecks 91Alt. 10 Sn 601'Btrracks 250 3lpass 91
Us 29x 250 31pass fiydrsutic Rd. 91US 29[ Sperry Dr. Greenbrier Dr' 94Us 29r Rio Rd. goodbrook Dr' 91lle.dorcreek Pk, US 29N sR 613 94f,lcadorcrcek Pk. sR 643 Rio Rd. 94tlcadorcrcek Pk. Rio Rd. 250 StDgss 94
tio1250 Conn. Rio Rd. uS 20lt 91tio/250 Conn. US 20x 250 Bleass 91
ALTERXATTVE 1 1
sR 743Att. llAtt. l1Att.11us a9xus ?9rlus 29N
.nio/250 Conn. US 20tl
ALTERIIATIVE 12
Att. 12 US 29llAtt. t2 sR 743Att. 12 SR 676Att,12us 29xus 29[us 297teadorciaek Pk. uS 29ttllcldoucrGek Pk. SR 643ltcrdoecrcek Pk. Rio Rd,ti0/250 Conn. Rio Rd.Rio/250 Conn, Us 20x
us 29xsR 743 SR 676SR 676 SR 60'l-BarracksSR 601-B8rracks 250 Snass250 Bypass Nydrlutic Rd.Sp.rry Dr. Grcenbrier Dr.Rio Rd. Yoodbnook Df,
lt.adorcreek Pk. US 29lt SR 643tlcadoHcr.€k Pk, sR 543 Rio td.It"adovcrcek Pk. Rio Rd. ?50 BypassRio/250 Conn. Rio Rd. uS 20N
250 9ypass
sR 743sR 676SR 601-B8rrEcks
SR 601.Barracks 250 Sroass250 Srnass Hldrlutic Rd.Sp€rry Dr. Cracnbficr Dr.lio Rd. Hoodbrook Dr.
sR 643Rio Rd.250 8)Dassus 20H250 Stcass
9191919194919191.91919494
EEEE
5
555(53
ILDV . Prfccnt Light Duty Vchiclcs (Autos):LDT - Perceflt light Duty Trucks (Z'AxlG 6 Tirc;3'Axlc)tlllov r percent Hc.rry outy vchictcsDIST : 0istsncc (mites)ADI = Average Daily lrafficSPD : Design SFCd (nph)PltT r Peak ltour lraffic (122 of ADT)
PHSPD - Peak Bour Speed (l|ph)C.tcut.tions:A:PllTt.6 8:PHTr.4SPRA!(l + 0.'15( (A/LAXES)/CAPACIIY))fi4)EPRB=('l + 0. 15( (B/IAIES)/CAPACtTY) )fi4)
fOR US 29 LAXES33 ALL OTHERS LA[ES'2
foR 60 rlP]t CtPAClTYtlE0orOR 40 llPx CIPACITY=1400
PHSPDESPD/ (O.5iBPRA+O.4TBPR8 )
3-17
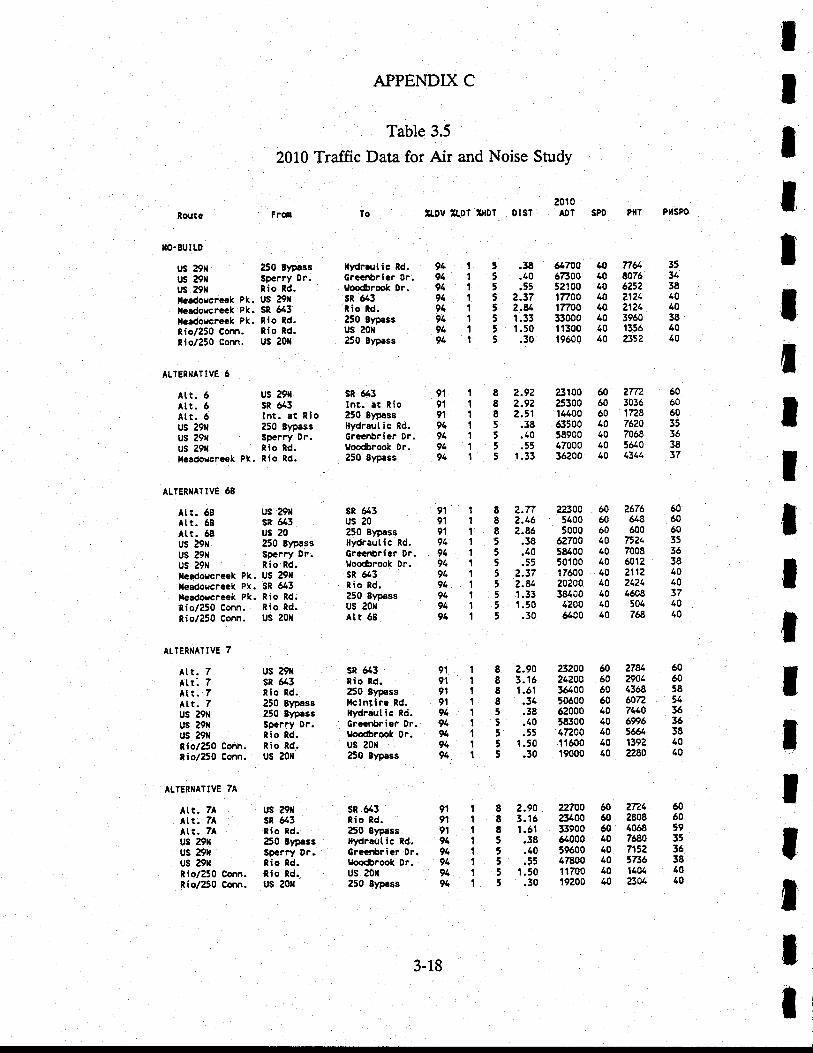
APPENDIX C
Table 3.5
2010 Traffic Data for Air and Noise Study
2010ILDV ILDT ZITDT DIST AOT
ItIlIII
tII
tIIIItt
Route
xo- 8u I LD
us 29xus 29ilus 29rl
AITER}IATIVE 6
Att.6Att.6Att. 6us 29llus 29rus 29rl
Att.58Al.r.68us 29rlus 29rlus 29rl
F1(Irl
250 t1gassSpcrry 0r.nio nd.
t s 29r{sR 643lnt. st Rio250 StpsssSperf/ Dr.Rio Rd.
sR 643us 20250 ErptssSpcrry Dr.Rio Rd.
lo
ilfdrrutic Rd.Grcanbricr 0r.ltooorook Dr.sn 643nio td.250 8t€assus 20r250 81pass
sR 643lnt. at Rio250 8)tr€s8Hydraulic Rd.Greer,bfief Dr.Uoocrbrook 0r.250 Blpass
sR 643us 20250 8)DassH)draut ic Rd,Graenbrief Dr.lfoo&rook Dr.sR 643Rio Rd.250 SFassus 20rAtr 68
sn 643nio Rd.250 81passilclntirr Rd.llydraut ic Rd.6rccnbrier Dr.$oo(brook 0r.us aox250 8)Dass
sR 643nio nd.250 81passHydr.utic Rd.Cr"rr$ricr 0r.lroodbrook Dr.us a0[250 Syoass
5 .38 &7005 .60 673005 .55 521003 2.37 177005 2.9 177005 1.33 330005 1.50 113@5 .30 19600
8 2.92 23100I 2.9? 253008 2.51 144005 .38 635005 .40 589005 .55 470005 1.33 36200
llrldovcrcek Pk. Us 29lll| ldo|cr.ck Pk. SR 643fcedoecrcck Pk. Rio ld.Rio/250 Conn. Rio nd.Rio/?50 Conn. US 20X
94949494949491.9l'
91919194949194
3531384040384040
taa0604040604040
60 2772 6060 3036 6060 1728 5040 7620 3510 7058 3640 5&0 3840 4X11 37
n&&76625221212121396013562352
lleadorcraek Pk. Rio Rd.
ALTERIIATIVE 68
Atr. 6s us 29rl 8 2.77 22300I 2.t 6 5400I a.86 50005 .38 627005 .40 584005 .55 50100, 2.37 17600, ?.8t 202005 1.33 3E 005 1.50 42005 .30 6400
I 2.90 232008 3.16 242008 1.61 36400I .34 506005 .38 620005 .40 543005 .55 472005 1.50 116005 .30 19000
60 7576 6060 648 6060 600 6010 7124 3540 7008 36to 601? 3840 ?'t12 4040 2421 1060 6608 3740 504 4040 768 40
fesdorcreek Pk. US 29xfleadoHcrGek Pk. SR 643leadorcreek Pk. Rio Rd.Rio/250 Conn. nio Rd.Rio/250 Conn. US Z0ll
91919191.
94919t,94949194
ALTERI{ATIVE 7
Att.7Att: 7Att. 7Att.7us 29t{us 29rus 29xRio/250 Corn.lio/250 Conn.
ALTERIIATTVE 7A
Att. 7lAtt. 7AAtr.7Aus 29nus 29rlus 29ttni0/250 Conn.Rio/250 Conn.
us 29xsR 643Rio Rd.250 Erpass250 EypassSp.ffy Dr.Rio Rd.Rio ld.us 2orl
us 29rlsR 643Rio Rd.250 Bl€assSpefy 0r.Rio Rd.tio td..us 20x
8 2.908 3.158 1.515 .385 .405 .555 1.505 .30
919191919L94919494
50 278L 6060 ?901 6050 4368 5850 5072 5140 74t0 3640 6996 3640 5e 3840 1392 40(0 2280 (0
919l919494919494
IIIIIII
22mO23400l:'9006400059600678001170019200
272(2E0860687&A7152373614062301
60605935363E4040
6060dtLO
40401018
3-18
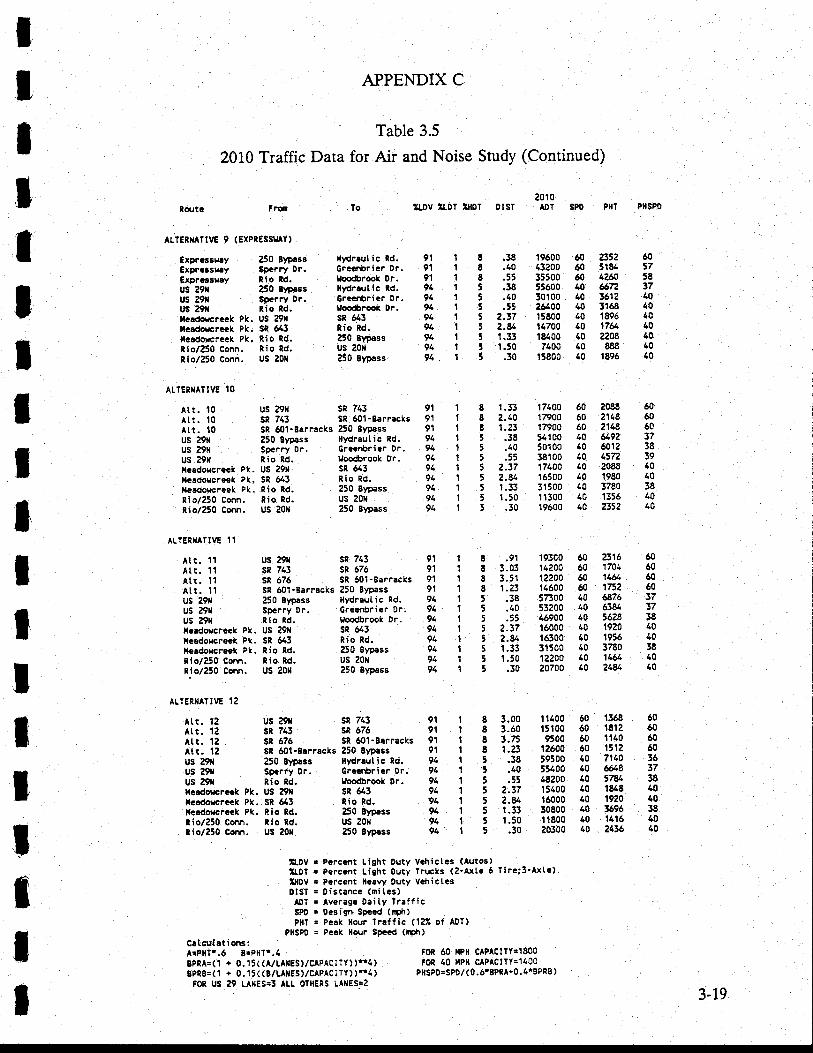
ttIttItIIIItT
ltItII
APPENDIX C
Table 3.5
2010 Traffic Data for Air and Noise Study (Continued)
lost! FF6
Arl:RxAilVE 9 (EXPRESSII Y)
trprcssr.ay ?50 llpessExpFGssu.y SP.Fry 0f.Exprcgsrey lio ld.
250 81psesSp.rry Dr.Rio 8d.
llcado,cra.k Pk. uS 29Nllca&rcrack Pk. Sl 6alllcadoucreek Pk. Rio nd.Rio/250 conn. Rio td.Rio/250 Conn. uS Z0ll
ALTER}IAItVE 1O
20101LDV :LDT IITOT OIST ADT sP0 P{t PilSP0
.38 19500 60 852 60
.40 43200 60 5184 57
.55 35500 60 425€ 5E
.38 55600 40 &n a7
.40 30100 a0 361e 40
.55 il6/,AO 40 3168 402.37 15800 40 1896 402.U 14700 40 1764 401.33 18400 40 22A8 401.50 7400 40 E86 40.30 l58oo 40 1E96 40
^tt.10Att.10Att.10us 29[US Z9Nus 29rlLaadorcr.ck Pk. US 29xlleadoucr.et Pk. sR 543l{eadolcr.ek Pk. Rio Rd'Rio/250 Conn, Rio Rd.Rio/250 Cmn. Us aox
ATTER'{AT:VE I1
Us 29x SR 7.3sR 743 sR 601-BarrackssR 60'l.Barracks 250 B1Dass250 StDass flydraulic ld.Spcrry Dr. Grccnbricr Dr.Rio Rcl. lJoodbrook Dr.
sR 643Rio Rd.250 Sypassus 20rl250 Eypass
sR 743
To
tlldr.ul ic Rd.Greanbricr Dr,lloodrrook 0r.Hldr.ut i c Rd.GrcrrbFiGr 0r.loo(brook DF.sR 543tio Rd.250 3)Dassus ?0[250 Blpass
250 BFossus z0rl250 Blpass
sR 743sR 676SR 601-B!ff8cks
us 29xus 29rlrrs ?9rl
9191919191949191.91.9491
6E
6t555(5
5
9191919494919191919194
8 1.33 17400 60 2088 608 2.40 'l?9oo 60 2118 60E t.23 17900 60 Z1t8 605 .38 54100 40 6{92 375 .40 50100 40 6012 385 .55 38100 40 1s72 395 2.37 17400 40 2088 405 Z.e 16500 10 1980 405 r.33 !1500 40 3780 385 1.50 11300 (0 1355 405 .30 19600 40 z3s2 40
At t. 1lAtr. 11At!. l1Att. l1us 29ltus 29tlus 29x
us 29{sR 743 SR 676sR 676 SR 601-BsrractssR 601.8arf8cks 250 Eypass250 Bypaes Hydraulic Rd.Spcrry Dr. Greeflbri.r Dr.Rio Rd. goodbrook Dr.
91vl9191949491919194
91
919191919494919194949194
Rio Rd.us 20ll
E
8E85
55
555t
88E
E555555t5
.91 193003.03 142003.51 122001.e3 14600.38 57300.40 53200.55 46900
2.37 160002.* 163001.33 115001.50 12200.30 20700
60 2316 6060 1704 6060 1114 6060 1752 5060 &?6 3740 6384 3740 5628 3840 1920 4040 1956 4010 3780 3840 116/ 4040 2t81 40
taesdoscrcck Pk. US ?9x SR 6{3llcadoicreck Pk. SR 643 nio Rd.fle.dorcrcek Pk. nio Rd.Rio/250 Com.R-io/250 Conn.
ALTERXATIVE 'I2
Att. 12Ar.t. 12ltt.12Att. l2us 29llus 29xus 29x
us 29xsR 743sR 676
3.00 11400 60 1368 603.50 15.|00 60 1El2 603.n 9500 60 '1140 601.23 12600 60 1512 60
.3E 59500 40 7140 36
.40 55400 40 664E 37
.55 48200 40 578l, 382.37 15400 40 1648 602.U 16000 40 19?0 401.33 30800 40 3696 381.50 11800 40 l4l5 40.30 20300 40 2436 40
fac.dor.cr6k Pk. US 29flilcldorcrcck Pk. Sn 643tlsldoecrcek Pk. Rio Rd,tio/?50 Corvr. Rio td.Rio/?50 Conn. US 20fl
Sn 60'l-B.rracks 250 Brpess250 8)Dass l)drrulic Rd.SFcrry 0r. GrGcrtrier 0r.nio td. 9oocbrook Dr.
sR 643Rio Rd.250 819assus ?0r250 81pess
:tDv = Pcfcmt Light Duty VchictQs (Autos)llol : Pefccnt Light Outy trucks (z'lxt. 6 lirct3'Axte)Il{Ov 3 Prrclnt Hc.vy Duty VehictasDlsl s 0ist8nce (niles)
ADT : Average Daity lrafficSPo ' ocsign SFccd (ttph)Pl{l = Peak rour lraffic (121 of A0l)
P113Pg : Peak Hour Sp.cd (nph)C!t.ldstions:A:PflTr.6 B=Plllt.4BPRA=(1 + 0.15((A/LAxES)/CAPACITY))ft4)SPRB=(1 + 0.15((8/LAXES)/CAPACITY))'r4)
FOR US 29 LAIES=3 ALL OltlERS LANES:2
FOt 60 llPX CAPAC!IY318o0fOR 40 HPtl CAPACIlY31400
PtISPDiSPD/ ( 0.6'BPRA+0.4'BPR8 )
3-19
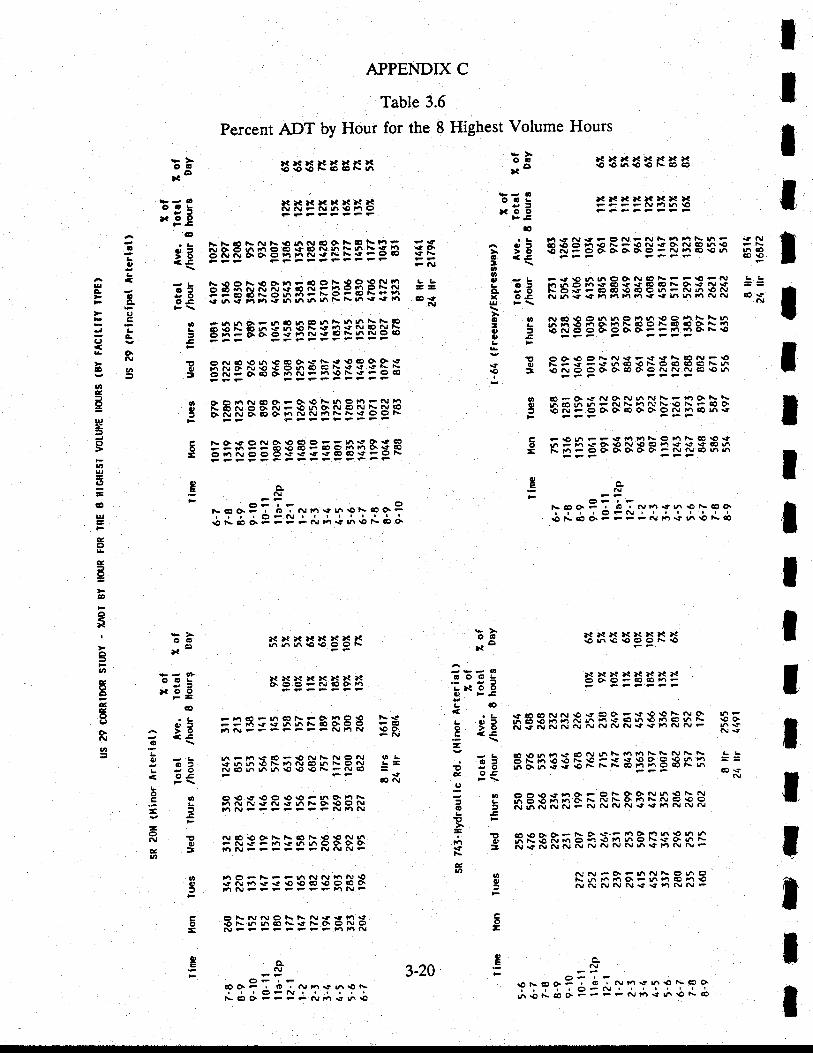
IIIl
IttIIIIJ
IItI
APPENDIX C
Table 3.6
Percent apf by Hour for the 8 Highest
x'a>a'ax)axxrO\OrOl\€cgtsn
rC 9r
aO .tN
}tlc>ax..llcxx666to\OOots
N>!L*}c}qxx6OOFN€O'ttl
FFTaFhGC?\FO.nO\OFF6ss66t\aOO.C>O6NF. ENNN
6-t6stO-!O6JNNON€66roN14a\JacrANoNNCCnri6rO\O\0EFNo
OtOsrOOrOrOFhOrnL6NN€Nsh]\g.iOONt/lNFFFFFeFATFIN
N€tOC>LL6ts.OrONnetu:-ins-66OO.orO.tllv-F Nhr.\,F
tnOFl:-Fr,rNa\jr!N\OsNta€rt\OrOaO\OOaOO.i4Ne+ ?nNF
oLNNC)Lh.\S€FlSOFtnlAaONrtI\O\ONOfvF-P enrQnl
>a!axltxx'.cxrO\O|'r!O€t\cOlO
'axltlc)axxltNrtr6<,FFF F
N CE rO O 6 6 e /t h.o o rrl F L6iA-.6no.nt\6oN@caGLn6.! C' O O. C 6 O.F e 14 n Or t\ \O
R9Se5S35X35B3=F!O N O O g. O cO O. O N N N ca \On
E ;:NSESR€833538X=
t\ra- O €|. O\O.O. gl F N ^J€
66
r.exxxN|.!xxiOn.O\OOONtO
x:.qxx}€r.eNxoooFq=!=
N€PHHEiFSF$$HFSE
6 6 6 6 \' CC (\, In N ttr n N N N s LE X fi lo € F \O -., \: \O O e !e !^ n6oxi -<.oNr\*oB=otoNh
FHPilNgIRFR$!il€FH
PpgR;Egs;ntsRre8Rniisr!NNAJNNNNh€FINNF
NAJ-O-riNhOneN6/lt'rg\Fhh€nrg(VNl\rNNrtSttiNNF
Volume Hours
00tao
€EgEFFiFg:EiE€F E= |F€TON6OO.N.CNPF\O.N L L66On€CO€glOeNO.S (!€ = =N c) s - cC 6 \O c() e 6 ?
^r 6 rO (!
nrns s n '.'4rarr
rr 6 6r| NN ao X
o GO-O.€hrO.N6NLenO\\g sReE;s5385RhEngF
9^.Eru-OF i ?
l-aOO.t I C ' Nr}\t6\Ot\cOOrI eFNrO fs € O. r. e e e N Ft.t tlrr \O ls (O
OGLy)xoo>tao
A Oto <gt\ooL atg eox 0.9
GOILartats
1'soio=
?z g NNF*rssd*38 ?F?F
sE- FEFhsFEEEgFFgEgE
Ei iPgH*CfiF*;F:Fe:f;
E E;EFFEgEFSEEEEES
E BNER€€€nEH$p33gEt 9S=(>.ooL-
g 8R*HgF;$NHEE!EgP- FF EFFFF?FFF
5 : : i E : B g E 3 E E E $ E E F
or!c:x
co9!Ll.t O oG' F5Llt
L ofo >oc <,8-. of.D vo
e o3IJ
e5LST'F
T!€=eg,
ot,
\C O.n\-NS
gL
(os
FIO\O O..
g)L
= sco (\J
CO
c,t>o<,8J\3 -.5
oao-2-REc:'a
o(,
e^5ru-,- -. Pi T : *t4 € rn ro r- - o 3.bi.*aP=P:&;-!;$i$d
ooxo
o@:*EE
G
.,
u,
FO-
bc
5O.
B6v=(t,zEUJ-=o
,t,ul(t
€tr,
oox
eoE6
!!
6s
3u,eooe5(Jo.
o
Pq;N
o? ' ?.PT??:;JNTTYT?!f?n.bXOcrF--F.vFl€6rOLaC
9^,5rtC>F ' -aOo\F , @ r
^Jtsts|'rroN. | | OFN r I|!tcoFeFFavnSrn€
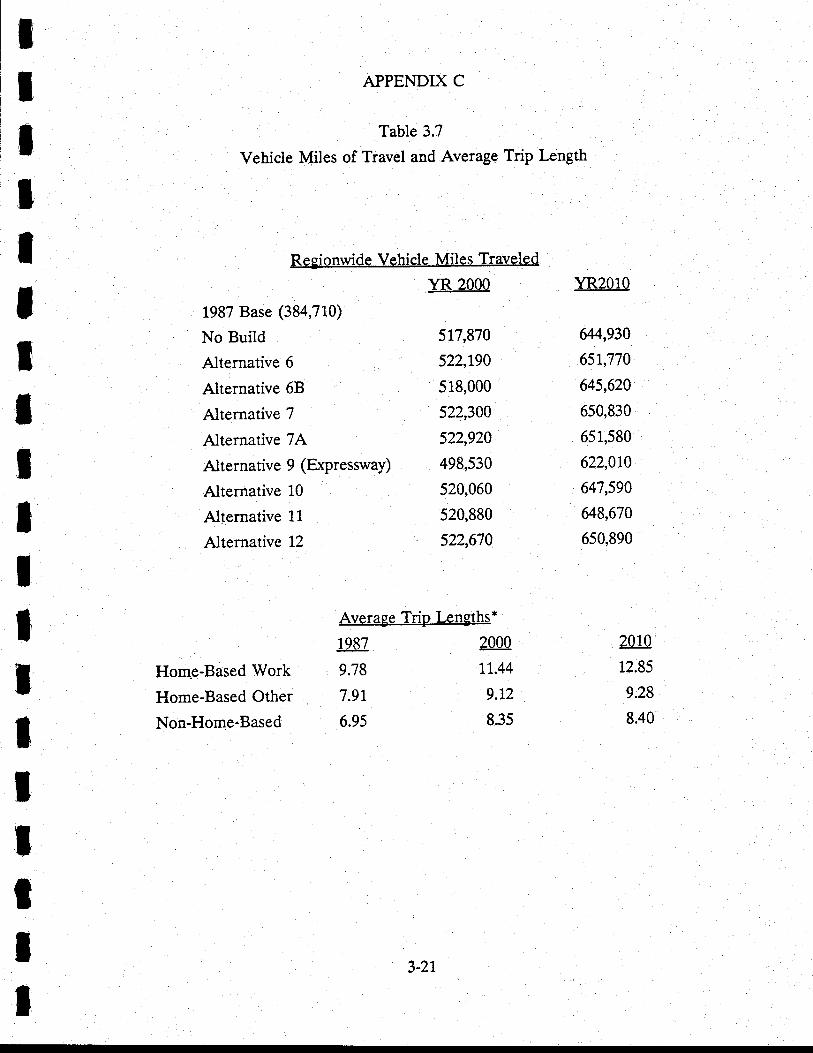
tIttIIIIIItIT
IIT
tIt
APPENDIX C
Table 3.7
Vehicle Miles of Travel and Average Trip Length
Regionwide Vehicle Miles Travqled
YR 2000
1987 Base (384,710)
No Build
Alternative 6
Alternative 68
Alternative 7
Alternative 7A
Alternative 9 (Expressway)
Alternative L0
Alternative Ll.
Alternative L2
517,870
522,790
518,000
522,300
522,920
498,530
520,060
520,880
522,670
Average Trip Lengths*
YR2010
644,930
651,770
645,620
650,830
651,580
622,010
647,590
648,670
650,890
Homg-Based Work
Home-Based Other
Non-Home-Based
1987
9.78
7.9L
6.95
2000
1,1.44
9.12
8.35
2010
12.85
9.28
8.40
3-27
APPENDIX C. ANNEX A
Annex A to Appendix C
MINUTP Setups for Tlavel Demand Modeling
tII
APPENDIX C. ANNEX A
The modeling process for the U.S. 29 Corridor Study was performedusing COMSIS' MINUTP travel demand forecasting software. The followingis a compilation of senrps used for the modeling process in Charlottesville,,The seiups perform a number of tasks within each modeling step and areexplained within the body of tbe setup. A brief explanation appears at thebeginning of each setup. Setup naming and numbering conventions are tboseused in the actual modeling effort. Setups in this appendix include:
o US 29 CORRIDOR MODEL (CHARRUN.DRV) - The entiremodeling chain excluding trip generation for performing the demandforecasting. The setup is applicable to either the base year or future yearforecasting.
o TRIP GENERATION (CHARGEN.DRV) - The trip generation stepof the model which is performed prior to the entire model. A Supercalcsubroutine (TGENCHNG.CAL) is also performed with the output from thissetup.
o EXTERNAL TRIP TABLES (EXTERNAL.DRV) - The preparationof the external roadside survey for use in the model. Tables contain theinternal-external, external-internal, and external-external trips for the model.The Setup prepares time-of-day tables for the model.
o EXTERNAL FRATAR (CHARFRAT.DRV) - The Fratar procedurefor the external trip tables for input to the future year models.
o ALTERNATIVE ANALYSIS (RUNALTS.DRV) - The assignmentsetup to run the selected future year alternative for the U.S. 29 CorridorStudy.
tttItIIIItI
II e-1
APPENDIX C. ANNEX A
U.S.29 CORRIDOR MODEL
(CHARRUN.DRV)
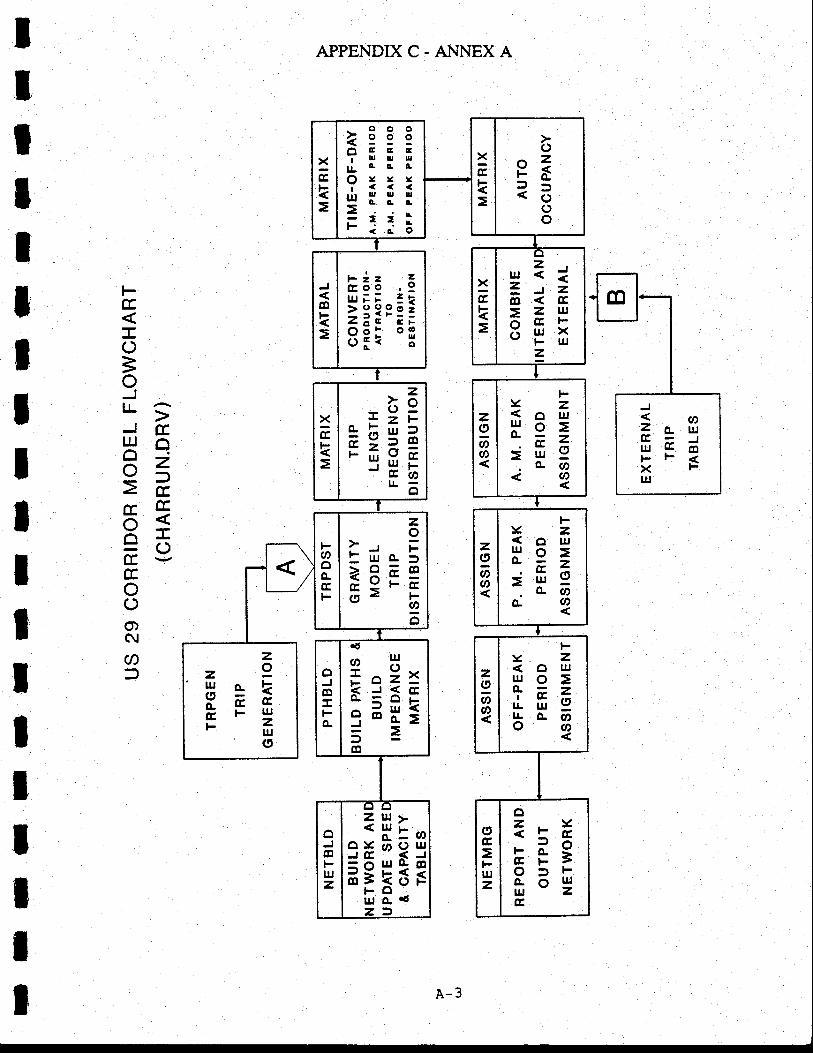
10-]uffEdl-FxFUJ
xGk
onzFf
oo
xck
_oooeeee,-\EEGTuru,ull!a_o.G?:::sliiF::;
xEk
zlg=Jzc0
=zuJ/,\fl,}-xuJxFUI2
t0
k
Eee ,AuJ;; =niiSs:=
8Fi "!
FYzHo -at-jilg.o-o
z(,6a
x(ft
z-de:zt-rllur=
r:DcD*-qflg-tr'otL6
zo(to
FYZ
Ho=E- -jilg.o.o
O- g,
oo0-tr
zo
l-r FItuo.3?R"9E=FEa= 6
E
FyZ1|lO
iFArr.o.f/l-Os,
2oCD
U)
.oltIoiI'fi6gedH==co
oI
oFo-
zzg'lH o-kXGGE FgFfi
(9
oZY
Et3o3Ffto2cc
(tct-UJz
oc0FlrJz
zul>
"JHinJE <J
=:H33ut&ng
APPENDIX C. ANNEX A
F(r
O3oJrrtJEuJno=o=(T tr,x=Otr.oOO)C\l
a
ttItIIIIIIIT
tIIIIII A-3
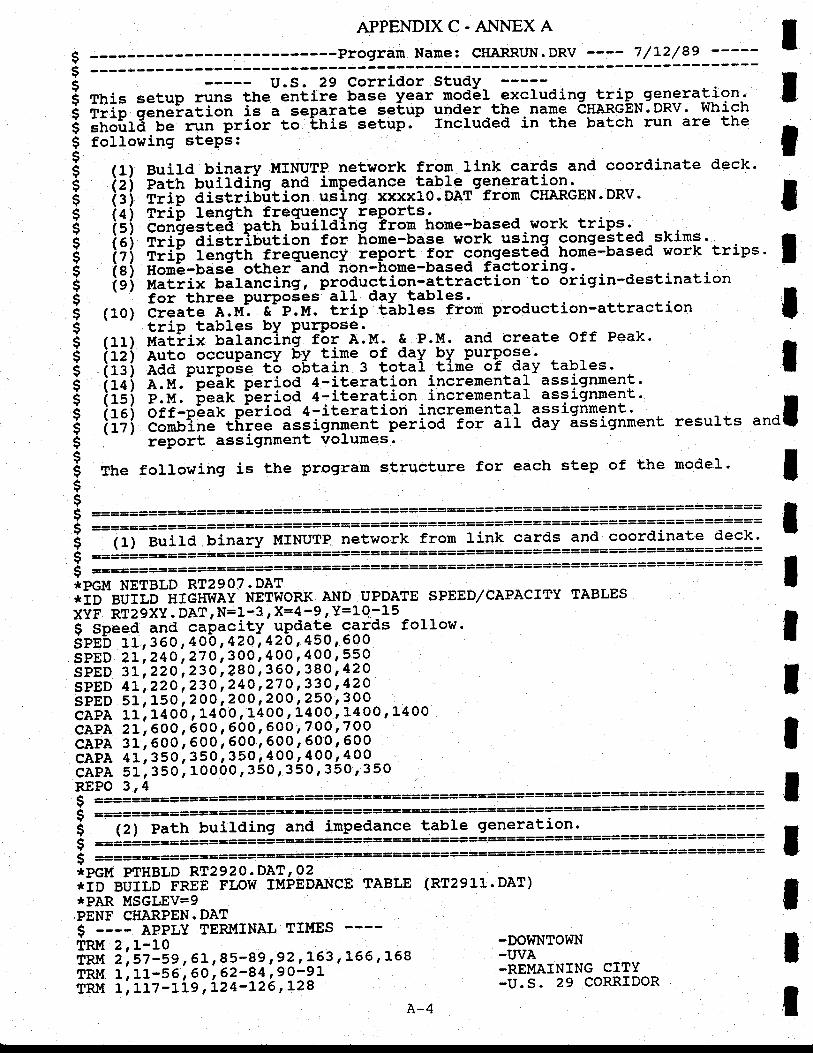
APPENDIXC-ANNEXA
$ :------- --Prograrn Name: CHARRUN.DRV 7/l-2/89$S U.S. 2s Corridor stuqY- ---:--.5 rfri= setup runs the entiie base year rnoa61. excluding__lflP--g:lgralign's Trip qeneration ia-a -eparate selup under the name eHancgN.DRV. Wbich5 ifr3ilfd-t"-nr"-prior to Ltrls setup.- rncluded in the batch run are the$ following stePs:
Build binary MINUTP network from link cards and coordinate deck.F;t[ uuiraiirq and impedance table generation.iiip distribrition using xxxxlg.DAT from CHARGEN.DRv.i;ip i-ngth frequglqy reports- i !- J--conlested path b-uilding trour home-based work trips'
-T;i;-eiItriU"{ion for iome-base work using congeFted-skirns.A;ifi i;;fh--requency report for congested home-based work trips.H;;;-b;s6 otner-and iron-hone-based factoring. .
i,iiliii Uafancing, proauction-attraction to origin-destinationtor three Purpoies- aII day tables.Cieate A.M: g-p.l't. trip tiUles from production-attraction
I$IIs$$$$$
$$$$$$$
II (10)$
tIIlII
(1)(21(3)(4)(s)(5)(7)(8)(e)
( 11)(12)(13)(14)(15)(15)(17)
trip tables bY PurPose.l,fltiix balancinb fbr A.M. & P.l,t. and create Off Peak.Auto occupancy by tirne of day by Purqose.aaa purpo-se t-o obtain 3 total tine of day tables 'A.M.' peif period 4-iteration incremental assignment'n:M: iealc beriod 4-iteration incremental assignment.oii-pEai pLriod 4-iteration incremental assignment.;;;bfi;--$ia;-issignnent period for all day assignrnent resultsreport assignment volumes.
Iar'r.l
$$S The$
following is the program structure for each sEep of the modei I$$ ===============================================================:=::===c ==========================:==:===:::=====:=:===:===:::=====::=::=:::::i --ffl Build binary I'{INUTP network from link cards and coordinate deck.$ ===========:===============:======================================:==:$ ============:=========================:=====-====================:====ipcl,t NETBLD RT29o7. DAT*fp -gUiLD
HIGI{wAY NETwoRK AND UPDATE SPEED/cAPACITY TABLES
XYF RT29XY.DATTN=1-3,X=4-9 'Y=1Q-15 - - -S Speed and capacity update cards follor'r'sPEb 11, 3 60, 400, 42A, 420' 450, 500SPED 2L',24O ,27 0,300,499'1q9, ??9SPED 3r;22O,23O,28O' 360, 380, 7?O_sigp 4L',22o't23o,24o '27o, ?19 ,!?9SPED 5L;150 t2OO,2OO,2OO q219,199CAPA 11; 1400, 1400, 1400' 11OO' 1190, 1400CAPA 2L', 600, 600, 600, 600, 7 99,709cape 31; 6OO, eOo, 600, 6oo, 599, q9qCAPA 41; 350, 350, 350, 4oO rA09r{09- -aAPt sr, rso, roooo, 350, 350, 350, 350REPO 3r4$ ======================== =======================:===----
inpedance table generation.====================== ===========================:::==
( =============-================:===============================-===-*---IIPGM PTHBLD RT292O. DAT' 02
'tfO-AUII,D FREE FLOW $'IPEDAIICE TABLE (RT2911'DAT)
tIIIII============-==============:====
lII
$ ============i Q) Path building and
IIPAR MSGLEV=9PENF CHARPEN.DAT$ APPLY TERMINAL TII'IES
$# 3;l;13r, 51, 8s-B s,s2,\g3,L6G, l.gTRM 1, rr-Se, 60, 62'84,9O-9tTRM 1, rrZ-rrg, L24-I26, L28
A-4
-DOWNTOWN-IryA-REMAINING CITY-U.S. 29 CORRIDOR
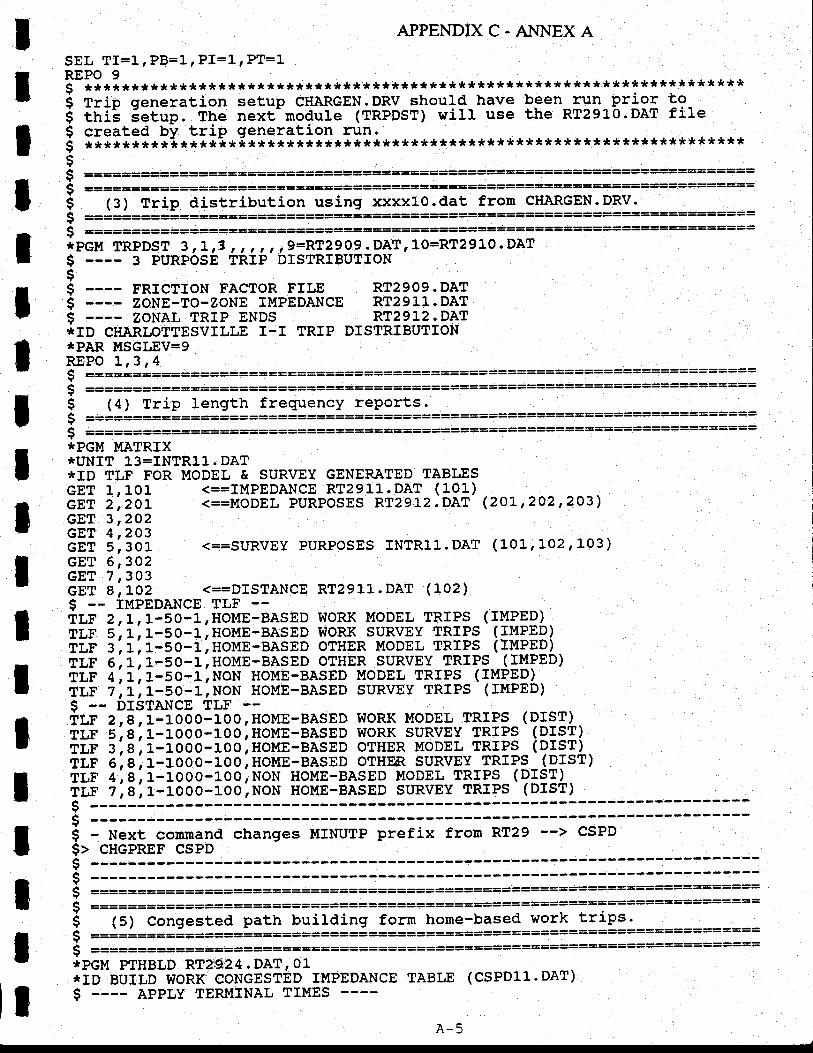
I
APPENDIX C. ANNEX A
SEL TI=1r PB=1, PI:J-, PT=1REPO 9c * * * * * * * * * * * * * * * * * * * * * * * * * * * * * * * * * * * * * * * * * * * * * * * * * * * * * * * * * * * * * * * * * * * * *$ Trip generation setup CHARGEN.DRV should have been 5un pr_i9l !?-I thi; ietup. The next module (TRPDST) will use the RT29LO.DAT file$ created Uy trip generation rdn.i *********i****i*i****************************************************I$ss$
IIIIIIIIIIIIIII
====-====:-=============-=====
a --------+ -------- =================:=========::=====*PGM TRPDST 3,L,1,,,,,,9=W2909.DATI10=RT2910.DATS 3 PURPOSE TRIP DISTRIBUTIONss FRTCTTON FACTOR FrtE RT2909.DATs zoNE-To-zoNE IMPEDANCE RT2911.DAT$ ---- zoNAL TRrP ENDS RT2912.DAT*ID CHARI,OTTESVTLTE I-I TRIP DISTRIBUTION*PAR MSGLEV=9REPO !,3 ,4$ ============================================C ===============:::===:::===:=====:::==:=:====::===::==::==::=====:==::Y
$ (4) Trip length frequency reports.======================:=======
*PGM I,IATRTX:IUNIT 13=INTR11. DAT*ID TLF FOR MODEL & SURVEY GENERATED TABLESGET 1,101GET 2 ,2AlGET 3 ,2O2GET 4 ,203GET 5,30LGET 6 ,3O2GET 7,303GET I ,LA2
(==IMPEDANCE RT2gLL.DAT (10L)<==MODEL PURPOSES RT29]-2.DAT (2O]-,2O2,2O3)
<==SURVEY PURPOSES INTRLI-.DAT (101'LO2,1O3)
(==DISTANCE RT291L.DAT (102)9 IMPEDANCE TLF --tr,r 2,1,r--50-1,HoME-BASED woRK MoDEL TRIPS (I{IEPITLF 5, 1, l--50-1, HoME-BASED woRK sURvEY TRIPS ' (ryfqP)iiF i, i, r-so-i,noMe-Besro oirinn-r'looei inipq iryqqPi.TLF 6,r,r-sO-1,HOME-BASED OTHER SURVEY TRrgq lIyfED)TLF 4,r,r-SO-1,NON HoME-BASED MoDEL TRrPS (I{lE9l.ir,r z,r,r-so-r,row HoME-BASED suRvEY TRrPS (TMPED)
, TRrPS (DIST)TLF 2,8, 1-1OOO-100,HOME-BASED WORK MODELiir s,e,r-rooo-10o,ttour-easED woRK suRvEY TBIIq (PIqI)TLF 3, e, r-rOo0-100, HoME-BASED OTHER MODEL TRrlq (gIlT.)iir e,a; r-rooo-loo,ttoun-easrD orHER suRvEY TBrqg_(glstlTLF 4, e, r-rooo-1oo,}{oH HoME-BASED MoDEL Tl_r!!_ (9M)^.TLF 7,e,r-rOO0-10o,wou HoME-BASED SURVEY TRIPS (DrST)$;S - Next command changes MfNUTP prefix fron RT29$> CHGPREF CSPD*$C ---:-::::::========-=:::============================:E===========:====? ------e --:-:::::-:======:==:::-===========:=============================:====? ------$ (5) Congested path building form home-based work trips.C ---------::============:=========:====:=:=:=:====:=:=:==========:::==:? ------c -------::::=iq*===============================-==================::-===P ------:IPGM PTHBLD RT2924. DAT, 01*ID BUILD WORK CONGESTED IMPEDANCE TABLE (CSPD]-]..DAT)g-:-::-aipr,v TERMTNAL TrMEs
A-5
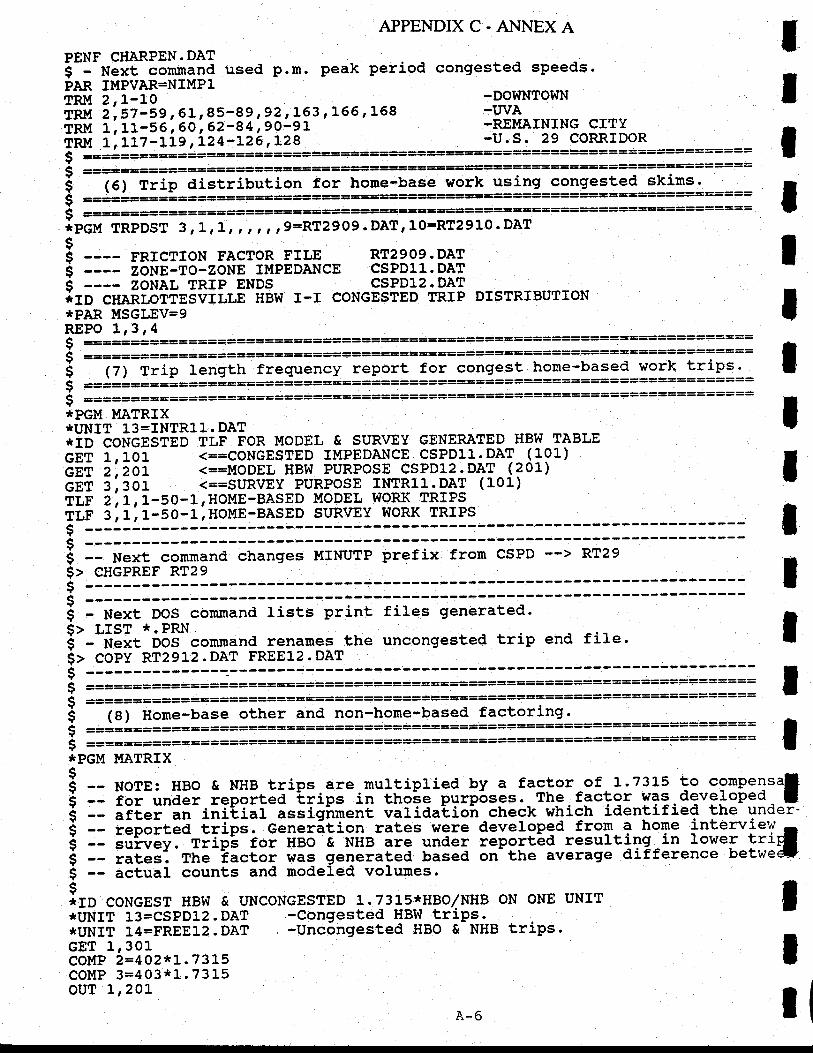
PENT CHARPEN.DATI - Next command used P.n.PAR IMPVAR=NIMPI
$ ===========
$ (6) Trip distribution$ =======================$ =======================
APPENDIXC-ANNEXA
peak period congeste<i sPeeds.
-DOWNTOWN-IryA.REMAINING CI?Y-U.S. 29 CORRIDOR
=========-===:=============:====================:===
TRM 2r1-10TRI.! 2'r57'59, 61' 85-89 ,9? ,)93 ,155 '
158TRM 1, 11-56, 60, 62-84, 90-91-TRM 1, 117-119, L24-L26,L28
for home-base work using congested skims.=========tr===E============================-= ==
ipgil rRpDsr 3,L,L, , ,, r,9=RT2909.DAT,10=RT2910.DAT$i ---- FRrcrroN FAcroR Frr,E RT2909.DATi ---- zoun-to-zoNn r!{PEDANcE qqlPll.DAr$ ---- zoNAL TRrP ENDS csPDl2.DATirp cHanLoTTEsvILLE HBw I-I coNGESTED TRIP DISTRTBUTIoN*PAR MSGLEV=9REPO t,3,4
IIIIttII
$ =============$ =============
:IPGM MATRIX
t -- NoTE: HBo & NHB trips.are.rnultiplied by a factor.of L.73.15 to 9?iP:l=il5 -- ioi-unaer reported Lrips in tho3e pSnosgs..Thg-factcr was develope3- |$ -- iiler an-inii,iii-isJigimend viriaalio-n check which identified the uncier'$ -- ieportea iiip=. c"nerition rates were developgd from a horne i"-!::"i:Yf$ -- lukly. Tiip;-tor nso & NHB are under reportbd resultiTg-in l"Y"I^!-Ilila -- iatel". The iactor was generaled based on- the averagle difference betwe*$ -- actual counts and modeled volumes.
'ED }.?3H:HPo1N!B oN oNE uNrr I*UNIT 13=CSPD12.DAT -Congested HBW trips*UNIT 14=FREEL2.DAT -Uncongested HBO & NHB trips. IGET 1,301COMP 2=4A2*1.731-5COMP 3=403*1".7315ouT 1,zOL
A-6 I
I
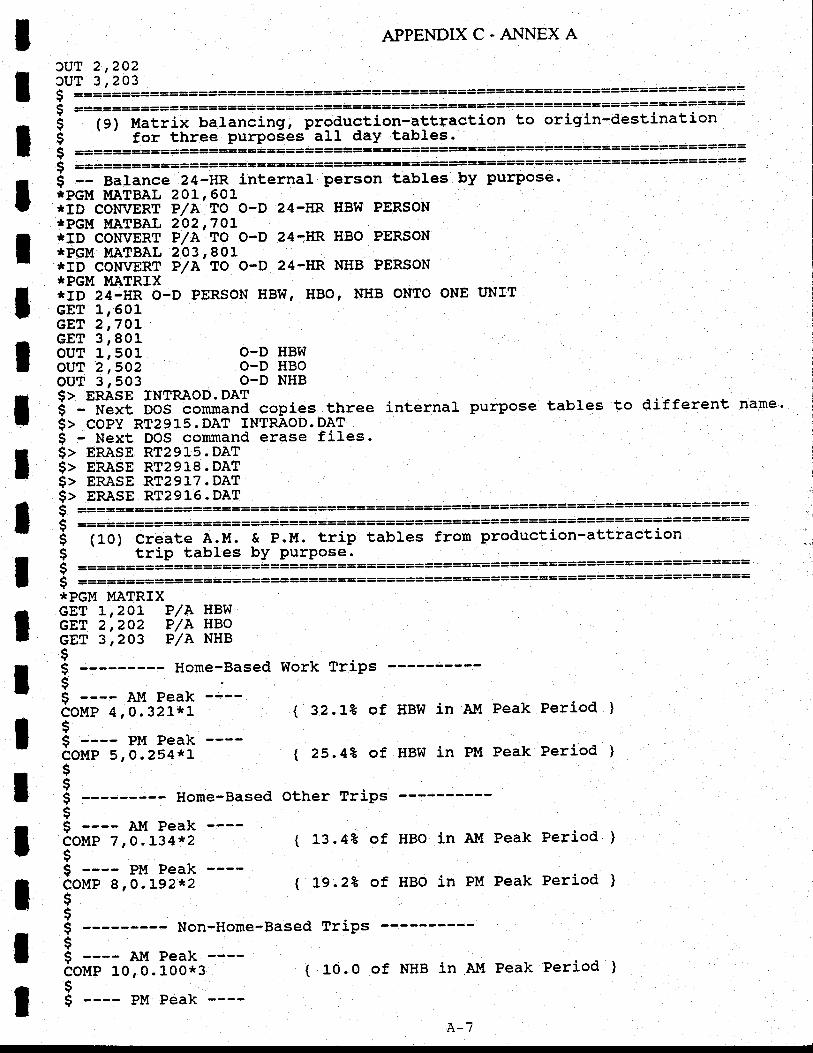
I
I
APPENDIXC-A}.INEXA
)vT 2,2023UT 3,203. ============================:================::==:::=========:==:=:=:=$ ============================:===========-=============:===============S (9) Matrix balancing, production-attraction to origin-destinationS ' for three purpoies all day tables.$ ===========================================================:=====:====5 ========:=====:====::====:=::-::===================::==:=====:::=::==I -- Balance 24-HR internal person tables by purpose'*PGM MATBAL 201,601*ID COIWqRT I/A TO O-D 24-TIR HBW PERSON*PGII! MATBAL 2O2,7OL*TD CONVERT P/A'TO O-D 24-ttR HBO PERSON*PGM MATBAL 203,801IIID CONVERT P/A-TO O-D 24.HR $I{B PERSON*PGM MATRIX*I,D 24-HR O-D PERSON HBW, HBO, NHB ONTO ONE I'NITGET 1r601GET 2 ,7OLGET 3,801
IIIIIII
IIIIIII
$> ERASE TNTRAOD.DAT$ - Next DOS conmand copies three internal$> coPY RT29L5.DAT INTRAOD.DAT$ - Next DoS command erase files.$> ERASE RT29L5.DAT$> ERASE RT29L8.DAT$> ERASE RT29L7.DAT$> ERASE RT2915.DAT
ouT 1,501ouT 2 ,5O2ouT 3,503
$ AI"1 PeakCOMP 4,O.32L't1sI PM PeakcoMP 5,0.254*l$$$ - Home-Based$s A!1 PeakcoMP 7 ,O.L34rc2$$ PM PeakcoMP 8,0.192*2
purpose tables to different name.
O-D HBWO-D HBOO-D NHB
=======:===== ======:::===:===::====::= ==============-=================$ =======:==$ ======:=== ====================:======--Jg (10) Create A.M. & P.M. trip tables frorn production-attraction5 \--' *ip-iaures by purpose.i =====:==:=::=:===:===========::===::==:=::=:=:==::=::=:=::======:====:v -..'_.._-
----:::::::::=:==:==::==:=:====C =======:=::==::==::===::::==:=::=:::=::=:=::::=:::=:IPGM I,IATRIX
r GET 1 '2Ol P/A HBwI GET 2 ,2o2 P/A HBor cET 3 ,2o3 P/A NI{B
si --------- Home-Based work TriPs$
$ AltI PeakCOMP 10, 0. L00't3$$ PM Peak
( 32.t2 of HBw in AM Peak Period )
| 25.42 of HBw in PM Peak Period )
Other Trips
( 13.4? of HBO in AIl Peak Period )
t 1:g.2Z of HBO in PM Peak Period )
( 10. O of NHB in Al'I Peak Period )
$$$ - Non-Horne-Based TriPss
n?n-t
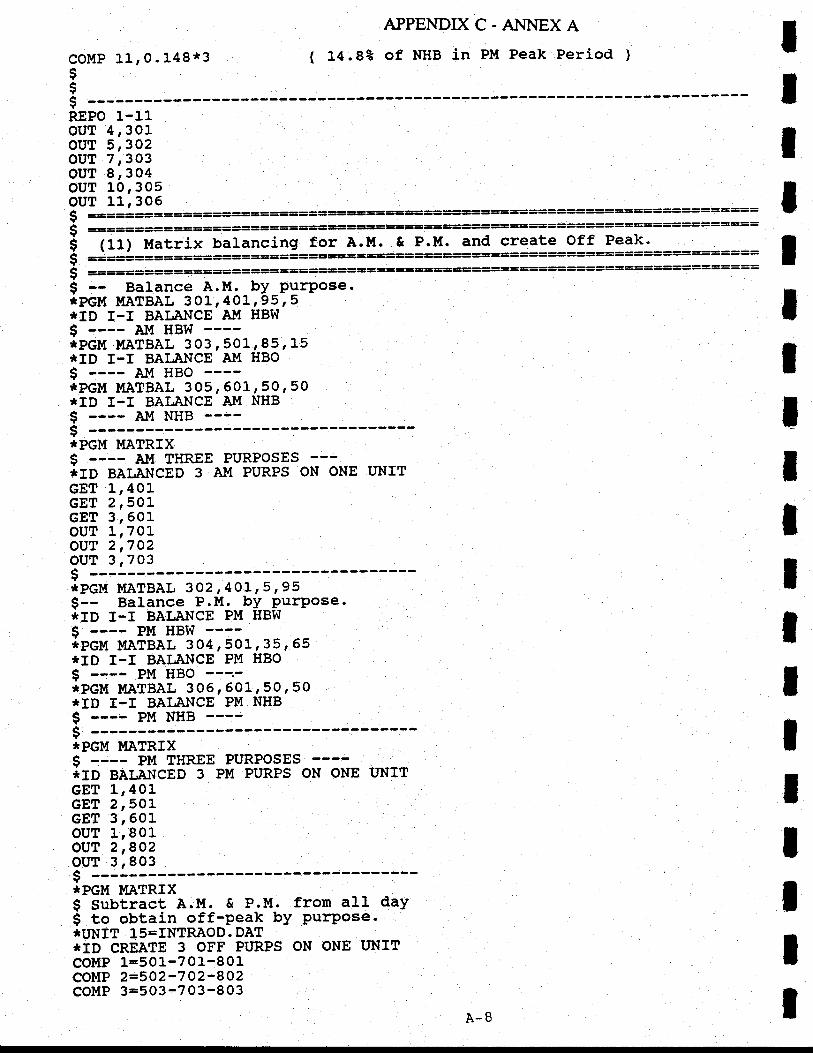
coMP 1Lr0.148*3Is
APPENDIX C. AI{NEX A
t 14.88 of NHB in PM Peak Period )
$ ------REPO 1-11ouT 4,301ouT 5,3O2ouT 7r303oui a',3o4oui ro,305ouT 11r306C ===============:=============-========:E==:=========:==========(
========:=::=============*t=g==glB====!t===========================::::=
5 -d1t iatrix balancing for A.M. & P.t{. and create 9ff Peak.$ =J======================s*tt===:rcq=====!g==========================:=====$ ==========:=================-===G==================:==================5 Balance A.M:
- bY-PgrPose.
*PGM MATBAL 3O]., 401, 95,5*ID T-I BAI,ANCE AIi[ HBW
$ ---- AM HBw*PGM MATBAL 303,50L,85, L5ltID I-I BALANCE' A!{ ttBO$ Al.1 Htsoipeu MATBAL 305,601,50,50*ID I-I BAI,ANCE AM NHBI ---- AI',I NHBs ------*PGM MATRTXg- ---- Al,l THREE PURPOSESrtID BALANCED 3 AM PURPS ON ONE UNfTGET L ,4O1-
GET 3,601ouT 1,7OLouT 2 ,7O2ouT 3 ,7O3$ipct'r MATBAL 3o2 ,40L, 5 ,95$-- Balance P.M. bY PurPose.:tID I-I BALANCE PM HBw$ PM HBWipeu ueigal 3o4,s01, 3s,65*ID I-I BALANCE PM HBO$ PM HBO*PGlt !{ATBAL 305, 501r50, 50*ID T-I BAI,ANCE PM NHB$ PM NHB$ ------IIPGM MATRfX$*to ger,ANceo 3 PM PURPs oN oNE nNrrGET 1,401cE,T 2rSOrGET 3,5OLouT 1,801our 2,8o2ouT 3r803s:IPGM II{ATRIX$-iuUtract A.M. & P.M. from all day$ to obtain off-Peak bY PurPose-'*UHff IS=INTRAOD-. DAT*ID CREATE 3 OFF PURPS ON ONE UNITcor'lP 1=5ol--7oi-bor--
- -COMP 2=5O2-7O2-8O2COMP 3=503-703-803
IT
IItlIIIIIttIIIIIIA-8
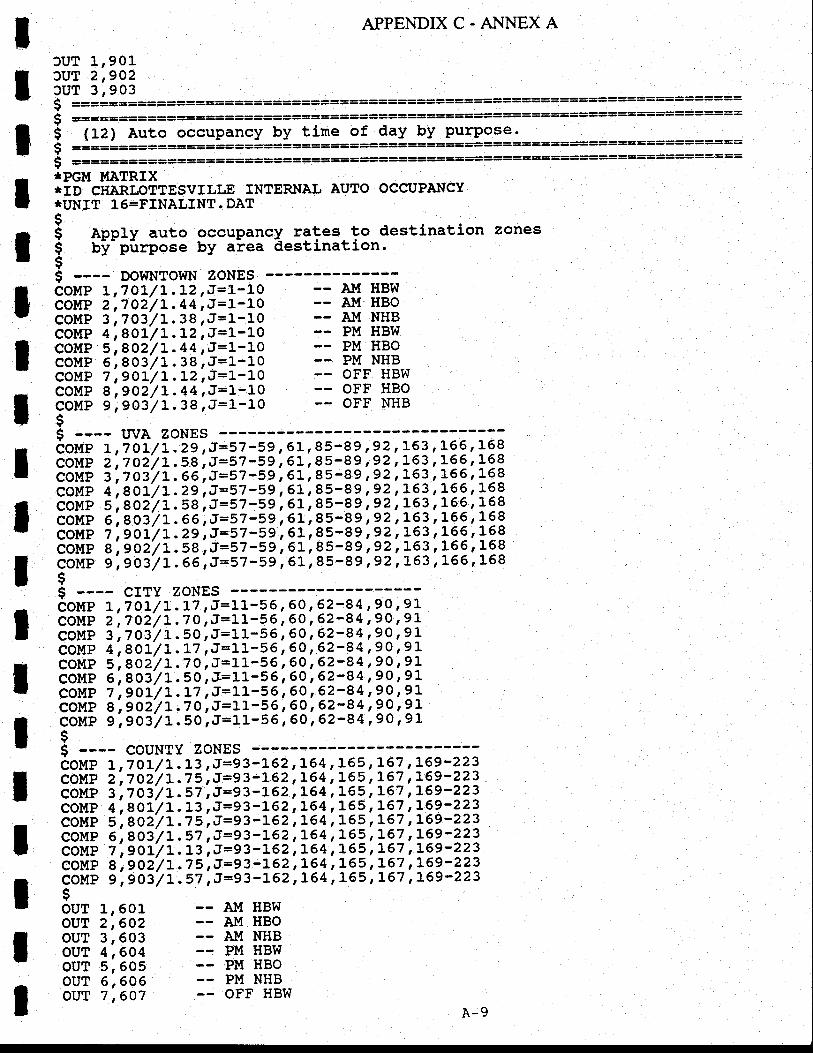
I
I
APPENDIXC.ANI{EXA
3UT 1", 901)uT 2,9O23UT 3,903( =============================================$ ====================:================-===$ (L2l Auto occupancy bY-€ ====== ==::=:=::====:::=$ =======================
tirne of day by PurPose.
I :l3""ffiSilt"rur"L' TNTERNAL AUro occupA^IcYr *uNrr 16=FTNALTNT.DAT
$I i App1y auto occuPancy rates to destination zones
I I by purpose by area clestinatron'
===========:=====
==================:=====:==:::====
ItIIIIIIIIIIII
s DowNTowN zoNEsCOMP L,7Ol/1.12,J=1-10 -- AM HBWCOMP 2,7O2/L.44,J=L-10 -- Al{ HBOCOMP 3 ,703/1.38,J=1-L0 -- AI'{ NqBCOMP 4,8OI/I.12rJ=1-10 -- PM HBW
aoMP s',goi'/L.aa,,r=r-ro -- PM HBoCO!'IP 6-,8CI3'/1.38,J=1-L0 -- PM NHBCOMP 7 '9OL/L.12,J=L-1'0 -- OFF HBW
coMP 8,9O2/I.44,J=1-10 -- oFF HBOCOUP 9',903'/ L . 38 , J=L-10 -- OFF NHB
I9 uvA ZONESiot'lp t,ioz7t.29,J=s7-59, GL, 85-89,9-?,\6-?, \99, 199COMP 2'' 7 O2'/ L . 58] J=57 -59, 5 L' 8 5-8 9, ??, )6-1, \99, \6-9COI.{P 3',7 o3'/ I. 66|J=57:59, 51' 85-89,??, \6,1' L66' 168COMP 4', 8 OL'/ L . 29', J=57 -59, 6 L, 8 !-9 ?, 9,?, \6-3-, t6 6, l'qqCOMP 5't8O2'/L.58',J=57-59 ,61' 85-89 ,?? ,\9? 'L66 '
168COMP 6',8O3'/L. 66-,J=57 -59,51' 85-89,??,\91, 165, lqqCOMP ?',gTl'/ 1.29',J=57-59, 61, 85-89,9-?' \6?'L66, 1qqCOMP 8',902'/L. 58 rJ=SZ'59,61' 85-89,92,7: -63- tL66, L58COMP g',903'/!. 66,J=57-59,61, 85-89,92,L63,166, 168I$ CITY zoNEs -------::-::COMP L,7Ol/L. 1.7,J=lL-55, 6A, 62-?4'?9,?\COMP 2',702/ 1.70rJ=11-56 ,60 '62-84,9O,?):COMP 3,703/ 1.50,J=1L-56 ,60,62-94,9-O '9^+COMP 4,8O1/t. 17 rJ=11-56, 6A' 62'84,?9,9-\COMP 5 t8O2/I. 70, J=11'-56, 6A, 62-94,9O-,?\COMP 6|8O3'/L. 50,J-=11-56, 60' 62-84,?9'9-l-COMP 7'9O1,/L. 17 rJ=11-56, 6A, 6?-97, ?9, ?1COI{P 8-,9a2-/I.70,J:1,1--56, 6a
' 62-q4 ,lo ,e-y
COMP g]9O3'/L. 50,J=11-56, 60' 62-84, 90, 9L$$ ---- couNTY zoNgsCOMP I ,7 OL/L. 13 , J=93 -L62 ,!64 ,16? , \97, L69-223COMP 2|7 O2'/ L.7 5, J=93-L62, 164,15?, \67, L6,9-223COMP 3-,7 O3-1L.57,J=93-L62,I.64'1-65,167' L69-223COMP 4-,|OL'/L. 13 , J=93 -162 'L64,
16q '\97 'L69-223COMP 5',802'/t.75 ,J=93-162 ,t64 ,165, L67 'L69-223coMP 6',8a3'/L.57 ,J=e3-\9? ,\64 ,lq?, \6-7,L6e-223
cotlP 7',9O1j/L. 13 ; J=93 -L62, L64,L6?, L6?, L69-223COMP 8', 9O2'/ L.7 5, J=93-L62, t64, lq!, \97, L6^9-223COMP 9',903/1.57 ,J=93-L62 ,J^64 | 165, L6'l
'L69-223$ouT 1,601ouT 2,642ouT 3,603ouT 4r504ouT 5r605ouT 6,606ouT 7,607
-- AI{ HBW-- Al{ HBO.- AI'{ NHB-- PM HBW
PM HBO-- PM NHB-- OFF HBW
A-9
APPENDIXC-ANNEXA IouT 8,608ouT 9,609$ =========
-- OFF HBO-- OFF NHB
$ ===:===:===:=======:====::::==I (13) Add purPose to obtaj.n 3 total tine of day tables.( ====================$ =========*PGM MATRIX*ID COI{BINE TABLES TO OBTAIN TII'{8 OF DAY*{INIT 11=A}lPKl-4. DAT OUT FINAL A}{*ttNIT 12=PMPK]-4. DAT OIII FINAL Pl'I*ItNfT 13=OFFP14 . DAT OUT FINAL OFF*IINIT 14=NIiEXT.DAT EXTERNA-L AI'{*ttNIT I5=PMEXT.DAT EXTERNAL PM*IINIT 16=OFFEXT.DAT EXTERNAL OFF*UNIT 1?=FINALTNT.DAT TNTERNAT BY PT'RPOSE BY TIME OF DAY$$ External Alt, PM E OFF were created outside of this setuP ftgtg the externai roadside survey: The_ setup- fo5-the external ttlP.table$ development is narned EXTERNAL.DRV and should be run before this setup$ to obtain desired inPuts.$S AI{ -----COMP 2L=7 OL+7 O2+7 03+401+4 02+4 03+4 04$ PM -----COMP 22=7 O 4+705+7 06+501+502+503+504$ oFF ----COMP 23=7 07 +7 08+7 09+60 1+602+603+6049 The next two lines add through trips to I-64-REP 23 ,2850,T=229 'J=238REP 23,2850 ,I=238 'J=229ouT 21, 1Ol-ovE 22,2O:J-ouT 23,301s$ ==========$ (14) A.u. peak period 4-iteration incrernental assignment.
IlIlItIIIIT
IttIII
$ =======:==$ ====================*PGM ASSIGN RT292O.DATPENF CHARPEN. DAT*ID ASSIGN A}I:tUNIf 14=AI'1PK14 . DATPAR PCTADT=5O , DAI1P=100 , BASETIME=IIi produce binary turn movement file for following lodes.sgl, r=gz 6 ,334, 353 ,373 ,37 6 ,383 r 386,390 ,393 ,4LL 1530 ,542 ,543SEL T=549,606,705'728,730'735,7 40 t7 45'7 49,754'759,76L,795I tlew alternatives.Strl t=aa I,543, 583, 500, 50L t 602, 603' 604, 605, 6OG, 607' 609,610, 6LLSEL T=512, 6L3' 6L4'615, 6]-6, 6L7, 618, 62L,785'8L4$ Expressway alternative.SEL T=390, 698 ,699 ,728 ,73O ,7 44
'7 45 ,7 48
'7 49
{EL T=755,756,794,9O9, 916, 918,923$ ------!!ATI=40LPERC 20,2O,2O ,40THET 0ro,or0REPO 5( ======================::==========v
$ ==================================4-iteration incrementaL assignment.
*PGM ASSTGN 21*ID ASSIGN PM TO BE APPENDED TO AI'{ ASSTGNMENT
=============:===================
A- 10
ttIIIIIIIIIT
IIIIItI
APPENDIXC-A}TNEXA
PENF PMPEN.DAT'IUNIT 14=PMPKL4. DATPAR PCTADT=60 , paUp=fOO , BASETIME=I$ ----:---i produee binary turn novenent fi.le for fo119w1l9 lgqes.Strl, t=lZ 6 ,334, t-5: ,373 '37
6,383 ,386 r 199 r 193 , !\I, 919 ,21? ,?!1sEL T=549',606,705,728,730,735,740,7 45,749,754,759,7 6t'795I New alternatives.SgL, t=a+ 8, 543' 583, 600' 601, 602, 603' 604,q0?, 99q, 607, 609'610, 51LsEL T=612',6L3',6!4, erS;6L6 ,6L7, 618 ,62L ,785 ,8L4I Expressvtay alternative.ssr, t=rgo, Gb8.ats;iie ,zzo ,7 44 ,7 ,a? ,7 48 ,7 4sSEL T=755,756 ,794 r 909 ,9L6,918 ,923I ------ --------!1ATI=401PERC 20,2O ,2O ,40THET o,o,o,OREPO 6
Q =============================*PGM ASSIGN 22*ID ASSIGN OFF PEAK TO BE APPENDED TO AI,1 & PM ASSIGNMENTPENF CHARPEN.DAT:IUNIT 14=OFFP14. DATPAR DAII{P=100, BASETIME=I, PCTADT=I-SI ------::--:-----$ Produce binary turn movernent file for followllg lgqesigl r=lz 6 t334,i'sg,373,376, 393, 386, 390, 393, !\1, 119,?t?'211sEL T=54 g', 606', 7 O5', 7 28-, 7 30, 7 35, 7 40,'7 45, 7 49, 7 54, 7 59' 7 6I, 7 95$ Hew alternativesSgl f=aa8, 543, 583, 600, 601' 602'603' 604, 605, g9q, 607 r 609, 610, 6L1SEL T=612'' 6L3', 6L4, efS' 6!6,617, 6L8' 62L,785,8t4$ Expressway alternatj.vesul t=ggo, ob8 ,5gg ,728 ,73o ,7 44 ,7 45 ,7 48 ,7 49SEL T=755 t756 '794 r 909 ,9]-6,9r.8 ,923$ --------ll[ATI=4 0LPERC 20,2O ,2A ,40THET 0,o,oroREPO 5-<-::=:-======:===:====::::::==::======:=::=:=::==::=:====:==::==:==:=:::C ==================::::::===::======:==::=:=:==:::=====:==:========::==5 (17) Combine three assignment period for all day assignrnent results and$ report assignment volumes.$ ========l=====================:::============:=====================:==$ ==============================:===================*PGM NET}IRG P(I2924. DAT ,P.I2923. DAT*ID COMPARE ASSIGNED TO COUNTS-in"-iilfowing=iwo lines compute one-way and two-way volumes for aLl$ links in the network.COMP ONEWAY=VOL+VOLI-+VOL2COMP TOTAIFTOTV+TOTVI-+TOTV2COMP COUNT=CNT*IOO.0COMP DIFF=COUNT-ONEWAYCOMP Df FF2= (2'ICOUNT) -TOTALrF cNT=1-99999
?o -vor=31-4o.volL=41-s0LIST A=1-5, 8=6-10, COUNT=] I-2Or ONEWAY=21--30'VOL=31-40, \LfST TOTAIFSI"-5OTITL 4
-9.,
COUPARISON OF ASSIGNMENT TO COI'NTSvoLInlES
ALL DAYANODE BNODE COUNT ONE-WAY AM
A-11
PM TWO-WAY
APPENDIXC-A}INEXA
ENDIFt ------5 gach module in this setup generates a report with the extension5 n.pin" which can be revibwed ggllg a_DOS-command. Otherwise,$ NETVIIE can be used to review RT2921.DAT-RT2924.DAT.$ ------*
tIIlIltIttItIII
TRIP GENERATION
(CHARGEN.DRV)
IIIIIIIIIIIIIIItIII
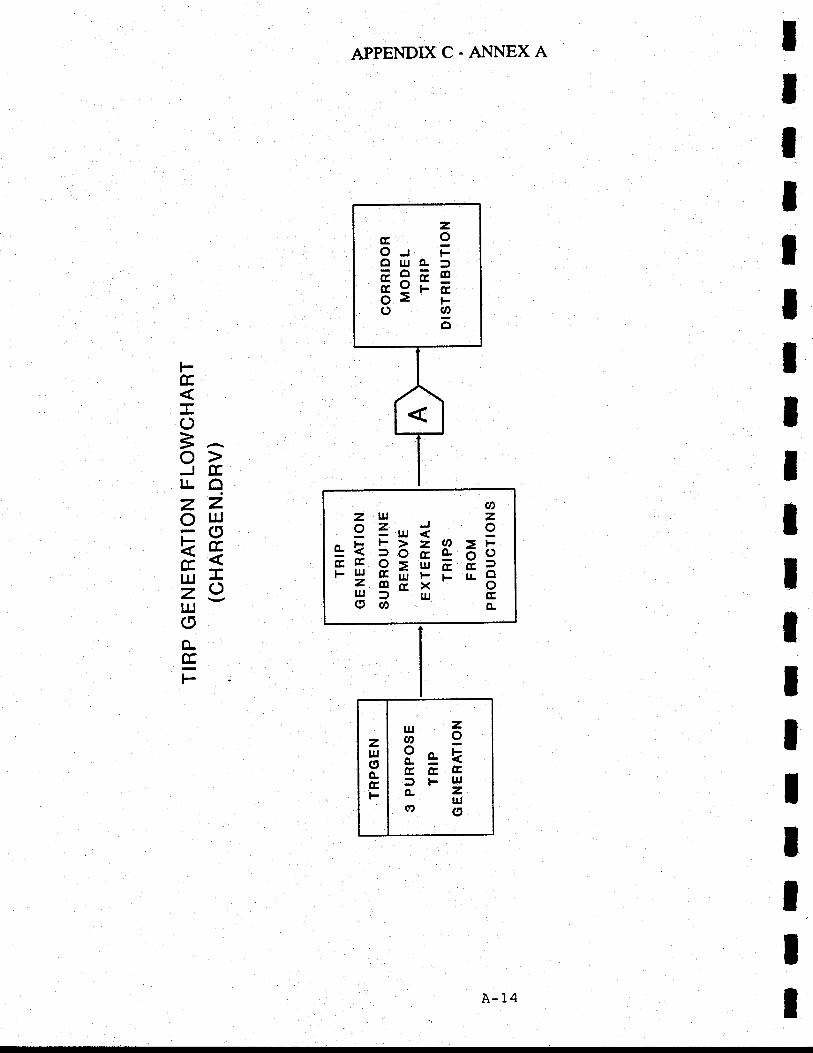
APPENDIXC-AI"INEXA
t-
(J
=.AoJTEr!qzz9lH,8,;ilt I,ouoo-E_
l-
HA3o-kE&EDFIIJo-Z
ut(Eo
zIJI(,o.GF
zG9O-r Fo rJJ o- :);o;oSSFEo9
o
ozuJz9 Z-- i 9
sk5e=9.=bES9*HFEa-
=E g H il F -
F
A- 1.4
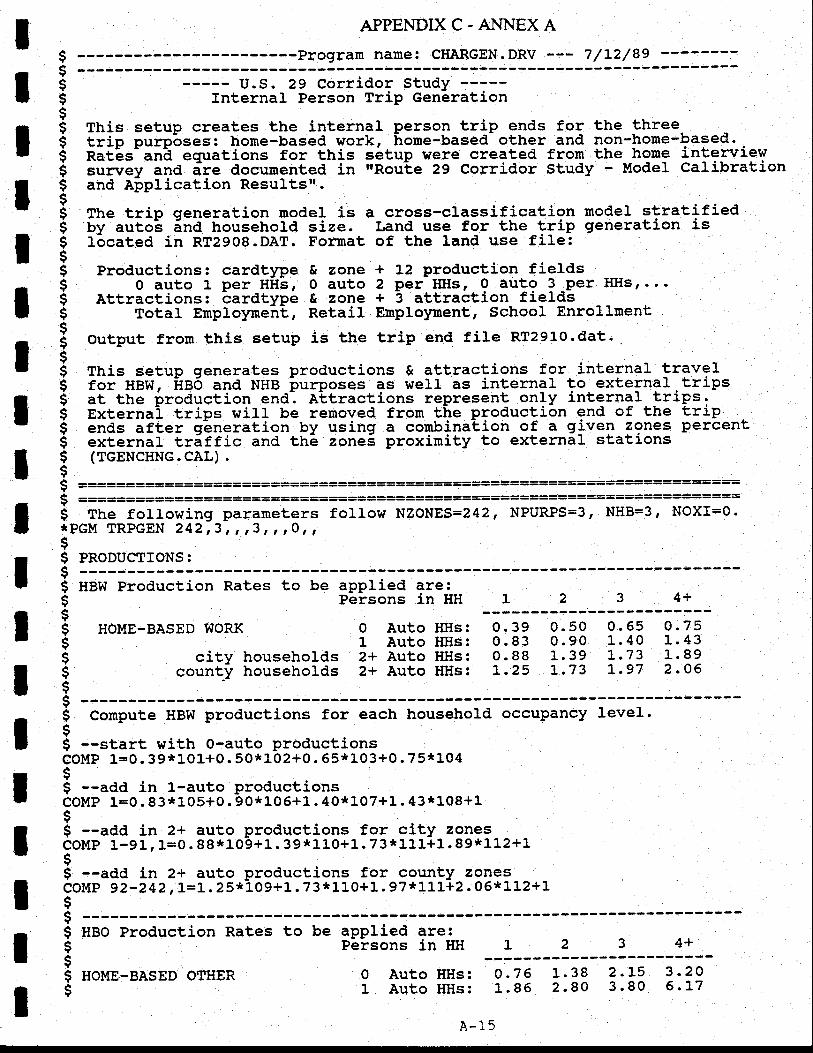
0I2+2+
IIIIIIIIIIIII
APPENDIX C. A}.INEX A
S -------Program name: CIIARGEN.DRV --- 7/L2/8g$$ U.S. 29 Corridor StudY --:--$ Internal Person TriP Gen6rationsi This setup creates the internal person trip ends for the threeS trip purp-oses: horne-based work, home-based other and non-home-based.$ nl[E=-in-a-eeuati;na io;-tnis s6tup rrere created fron the hone intenriewi luntey ina dre documented in trRoute 29 Corridor Study - Model Calibration$ and Application Resultsrt.
t The trip generation model is a cross-cLassificatign model stratified$ by auto-s ina frouietrofa size. Land use for the trip generation isS l6cated in RT2908.DAT. For:urat of the land use filel$i Productions: cardtlpe & zone + 12 production fields$ O auto 1 per HHs, 0 auto 2 per IIIIs, I au!9 ?_per HHsr...$ Attractions: bardtype & zone + 3 attraction fields$ Total Emplolment, Retail Emplolment, School Enrollments5 Output from this setup is the trip end file RT2910.dat.,
$ This setup generates productions & attractions for. internal traveli for HBW, ire5 and NHB burposes as well as internal to external trips$ it tne froduction end-. attractions represent only internal. trips.$ Externai trips will be removed frour the production end of the trip$ ends after g-eneration by using a cornbination of a given zones percent$ external tr;ffic and thb zones proximity to external stations$ (TGENCHNG.CAL).
! ----------:::-::::::::::::::::============================:====::====P ------$ The following parameters follow NZONES=242r NPURPS:3r NHB=3r NOXI=O.*PGM TRPGEN 242,3 , , ,3 , , ,O, ,$S PRODUCTIONS:s :-:::-:-$ HBW Production Rates to be applied are:* Pblsons in t{H 1 2 3 4+$$$s$$s$
HOME-BASED WORK Auto HHs: 0.39Auto IIHs: 0.83Auto HHs: 0.88Auto IIHs: L.25
0. 50 0. 6s o.750.90 1.40 1.431.39 L.73 1.89L.73 7.97 2.06
city householdscounty households
4+
I{Hs:HHs:
01
ItIIII
Cornpute HBW productions for each household occupancy 1evel.$$ --start with 0-auto productionscouP 1=0. 39*L01+0. 50*1b2+0. 65't103+0. 75*104$$ --add in l-auto productionsCOUP 1=0. 83:t105+0. gO*tOe+1. 40*107+1. 43*108+1$$ --add in Z+ auto productions for city zonescoMP 1-91, 1=0. 88*LO9+1. 39*110+1. 73't111+1.89*112+1
t --add in 2+ auto productions for county zonesCOUP 92-242, 1=1. 25:t109+1. 73*110+L . 97*111+2 . 06*1Lz+ls-$ ------$ HBo Production Rates to be applied are:$ Persons in HII L$$ HOME-BASED OTHER$
AutoAuto
o.7 61.86
1.38 2.L5 3.202.80 3.80 6.L7
A-15
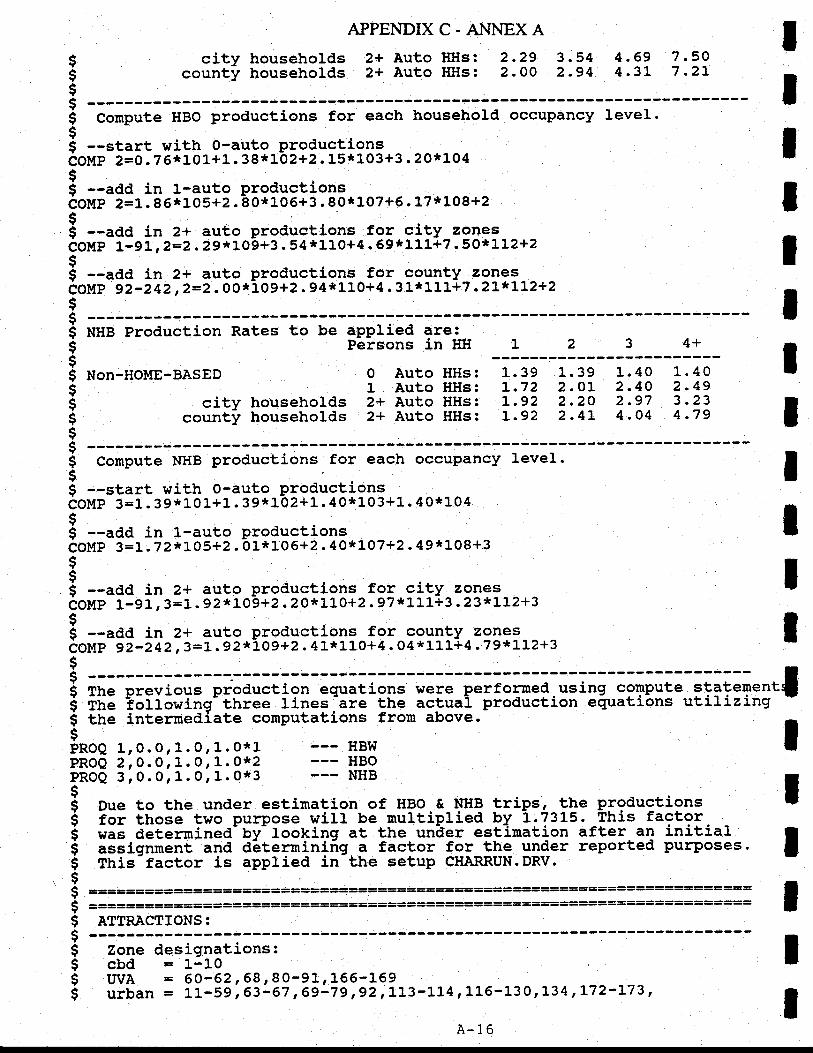
APPENDIXC-A}.INEXA
$ city households 2+ Auto HHs: 2-2g 3.54 4.69 7.5Oi county households 2+ Auto HHs: 2-OO 2-94 4-31' 7 -2I$s ------* Conpute HBO productions for each household occupancy ]eveI.Ii --start with O-auto ProductionsCOMP 2=O .76*101+1. 38*102+2 . 15*103+3 . 20*104I5 --add in 1-auto productionsCOl,tP 2=L.86*105+2 . 80*106+3 . 80't107+6 . 17*108+25-i --add in 2+ auto productions for city zonesCOMP l.-91,2:2. 29*109+3. 54*110+4. 69*111+7 -5OtcLL2+2$5 --add in 2+ auto productions for county 291e9-
-COMP 92-242,2=2. 00*109+2 . 94*110+4. 31*111+7 .2L{CLL2+2sSS NHB Production Rates to be applied are:S Persons in HII 1 2 3 4+$
IIIlIIIt
$ Non-11OME-BASED 0 Auto HHs: 1.39 L.39 1.40 L.40* 1 Auto HHs: 1.72 2-oL 2-4o 2.49$ city households 2+ Auto HHs: L.92 2-2o 2.97 3.23* county households 2+ Auto HHs: t.92 2-4L 4-O4 4.79$Ii
Compute NHB productions. for each occupancy level I
5 --start with O-auto ProductionsCOMP 3=1. 39*101+1. 39*L02+1. 40't103+1. 40't104
i":-;-;- ;:"".o produc.i";'CoUp J=l. 7 ZT.LAS+2. bt*tOe+2. 4OttlOT+2 . 49:t108+3$5$ --add in 2+ auto productions to5 ci!v-zg!gi-- ICOMP 1-9L, 3=1.92*109+2 .20'tL10+2.97rc1.1.l+3 - 23*L3-2+3
i --adq 1n-21 ?u!9.Plgqtclions for countY.zgl::r^r^ ICOIqP 92-242, 3=1. 92*L09+2. 41*110+4. 04*111+4 .79*LL2+3$+5 ffr. previous production equations srere performed. using compute statenrentfg The -following three lines-are the actual production equatlons utLlLzl-ng$ the interznediate computations from above.
i;;=,;;;;;;:;.;-*--l-- ""* IPROQ 2,Q.0,1.0r1.0*2 --- HBOPROQ 3 r 0. 0, 1. 0, 1.0:t3 --- NHB I$ .rrra- ^^+ i *-{ Ii Due to the under: estimation of HBo.& ryHq tri.ps, tle p5gductions$ for those two purpose will be urultiplied bY 1.7315. This factori was detemined- by- looking at the under est-ination after an initial I$ assignnent and d6tenrinirg . factor for the under reported PurPoses. fI This-factor is appl.ied in the setup CHARRIJN.DRV.$g ===========================:-========::======================::===== IC ==========:======::::====================:=========:::=========:==::= fS ATTRACTIONS:$ ------i Zo4e desiglltions: I$ cbd = 1-10
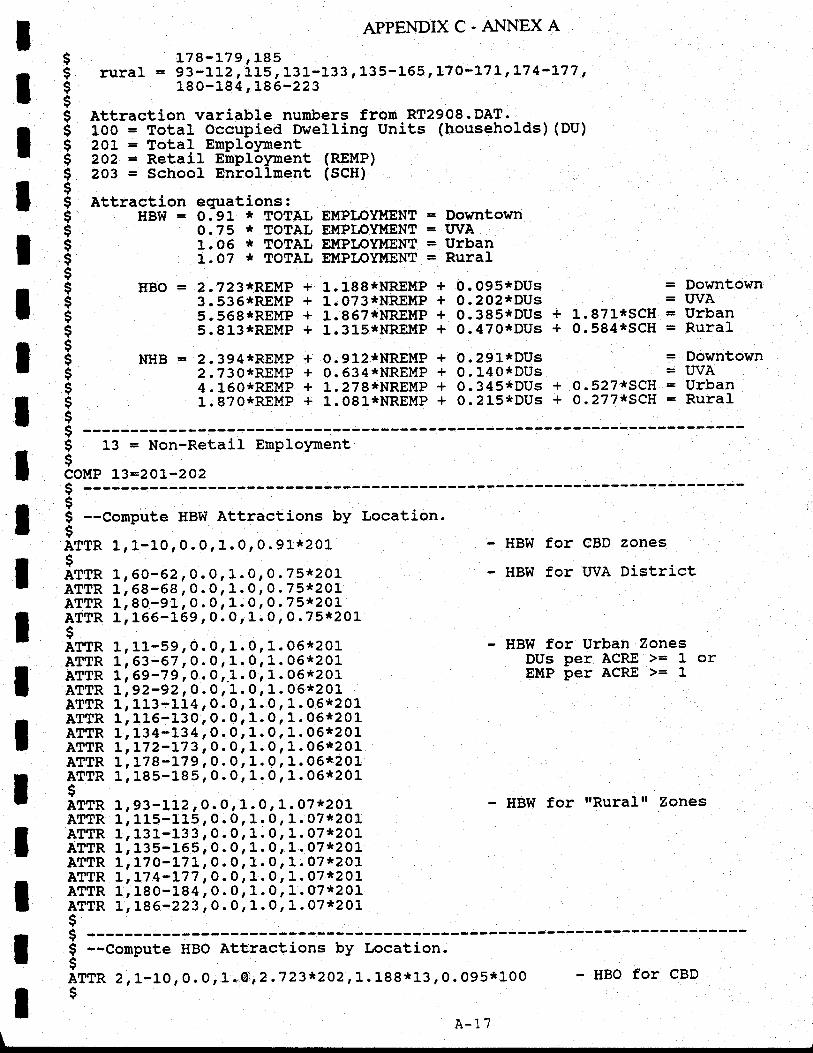
IIIIIIIIIIIIIItIItI
APPEI.TDIXC.A}.INEXA
$ L78-L7g,185i rural = 93-LL2, its, 131-133, 135-165,L7o-L7t,L74-177,$ L80-184,L86-223Ii Attraction variable nunbers from.RT29o8.DAT$ 100 = Total Occupied Dwelling Units (households) (DU)9 2OL = Total Eutploynent$ 2Q2 = Retail Emplolment (REMP)
9 2O3 = School Enrollment (SCH)$
t Attractit: 3:Bit*"i3,io" Er{p,,oyu'Nr = Dosnrown$ 0.75 * TOTAL EI{PI,oYMENT = IJVA$ 1.06 * TorAL EMPT,oYMENT = urban$ 1. 07 * TorAL EMPToYMENT = RurarI$ HBO = 2.723*REMP + 1.188*NREUP + 0.095*DUs = Diwntown$ 3.536*REMP + 1.O73*NREMP + 0.202*DUs = UVA$ 5.569'tREMp + 1.967*NREMP + 0.385*DUs + 1.871*scH = urban$ 5.9L3*REMp + l.3ls*NREltlp + 0.420*DUs + 0.584itscH = Rural$S NHB = 2.394'IREMP + O.912IINREUP + 0.29L*DUs = Downtown$ 2.730*REMP + 0.634*NREI'{P + 0.140*DUs = uvA9 4.160'tREMp + L.zz8*NREMp + 0.345*DUs + 0.527*scH = Urban$ 1.9?0'tREMp + 1.091*NREMP + 0.215*DUs + o.z77tcseH = Rural$s ------S 13 = Non-Retail EnploymentsCOI{P I3=2OL-2O2$ ------sS --Compute HBW Attractions by Location.$Arrn 1,1-1010.011.010.91*201 HBW for CBD zones$iftn L,6O-62r0.0r1.0r0.75!t2oL - HBW for UVA DistrictATTR r, ee-gg, o. o, r. o , o.75tc2o1.ATTR r, eO-g1; O. O; 1. o, o. ?5*2OLATTR 1' 166-169, 0. 0, 1.0, 0.75tcz0L
irr* 1,11-59,0.0,1.0,1.05*2ol- - HBw for urban zonesaffn L',63-67rO,Orf .O,f .Oe*ZOf P9i p"t ACRE >= 1 orCrin L',6g-7g,o.o,.r.orr.oe'tzor EMP per ACRE >= 1ATTR L,92-92, O. 0, l. 0, 1. 06'b20LATTR r, rr:-ri4,o.o, 1. o, 1.05*201ATTR 1, 116-130, 0. O, 1.0, 1. 06*201ArrR r, rga-rr 4,9.9; 1. 9; 1. 06*201ATTR L rL72-L7 3 , 0 . O
' 1. 0
' 1. 06!t201
ATTR L,178-L79, O. 0, 1. 0, 1. 06*201ATTR 1, 185-185, 0. 0, 1. 0, 1. 06*201Iiffn L rg3-LL2, 0. O, 1. 0, 1. 07*201 - HBW for rtRuralrr ZonesATTR 1; 115-115, o. o, 1. o, 1. O?*201ATTR 1, 131-133, 0. O' 1. 0,L.07t 2CILATTR 1, 135-155' O. O, 1. 0, 1. OTtc2ALATTR L,1-7A-L71, O. O, 1. 0, 1. 07:t201ATTR I,L7 4-L77, O.0, 1. 0, 1. 07*201ATTR 1, 180-184,O.0, 1. 0, l. 07*201ATTR 1,L86-223, 0. 0, 1. 0, 1. 07*2Al$s ------$ --Courpute HBO Attractions by Location.$imn 2,1-10, 0. 0, 1*S, 2.723t 2O2, 1. 188rtL3 ,0. 095*1OO HBO for CBD
s
A-1. /
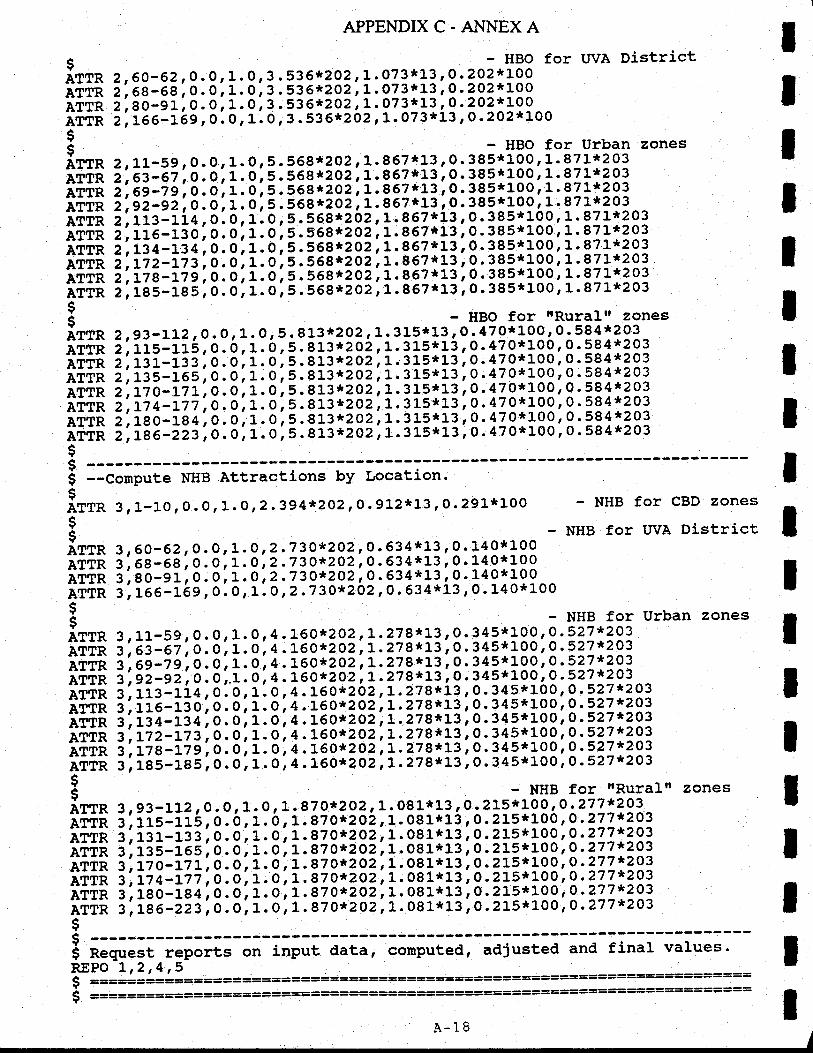
APPENDIXC.ANNEXA
I - HBo for UVA Districtarrn 2,60-62, O. O, 1. 0, 3. 536rc2o?,\. 9Zlill,o'242*L00AiiR i', aa-ee, o. o, 1. 0, 3. 93 61202, 1. 9?1i11' o.202*10oIiiR i',so-gl; o. 0, 1. 0; 3 . 536*?0?r 1 - 97111?r 0. 202't100etin 2',166-L69, o. 0, 1. 0, 3. 536*202, 1. 073*13, 0. 202*Lo05c - HBO for Urban zonesittn 2, LL-ss, 0 . 0, 1. 0, 5 . ?q9*2 02, ).qqzlll' 0. 385'tL00' 1. 871-*2 03AiiR z',ai-et, o, o, r. o, !. !qq*?92,\. q91iu, 9. 1qql19q, 1 .87L'a2o3AiiR i', 6e-7 e, o. o, r. o,s . s6l*?g?, !. qqzl11, 9 - 199i199, I . 87 L*2o3Aiir{ z',gz-gz, o . o, t. o, s. sea*z o?'-\- 96?i1?, 0. 385't10o r 1. 871*203AiiR z', ttz-:''tl, a'.o, 1 : 0, 5. ?99:?o?, l. qqzf 11, g - 19:i199, 1. 871*203AiiR i',ite -tzo, o. o; 1. o; q. 3,6e*?sz- ,\- qqzf 11 , 9. 199i199, 1' 871*203AiiR i',tia-ttl', o .0, t. o ; ? . s68*2 a2 ,L.9q?111 , 9'1!9i199' 1' 871't203Aiiri i',iz z-itr, o . o ; 1 . 0 ; I . 968*2 9?' \ - 96-7:\?, g . 1 q:i 19q' L' 87 L'c2o3IiiR z',ize-n e;0. o, r. o;5. s58rt2 a2 ,L.85?*13,9.1q:i19q, I '87Ltc2o3IiiR e, igs-feS, o. O, r. O ; 5. 568*2 02, L. 867*13' o. 385*100, 1. 87L*203I --r..S .-^- HBO for trRuralrr zonesimn 2,s3-Lt2, 0. 0, 1. 0, 5. 813't2o? r 1: 31?i1? t o:a?91199r0's84*203AiiR z, rrs-rrs, o. b, 1. 0 , 5. +1*?9?, 1- 119:11 ' 9. 129:199, o ' s84 "243AiiR z',iit-ti3', o .0, r. o ; ! . 8t3'c2o2; 1 - ? 19i1?' 9. 1zqi199' o' ss4*203AiiR i',iti-tss, o. 0 ; 1. o ; s. 813't2 sz, \. 111:11, 9. {29:}99, 9' 584*203;iiR z',it o-izr, o. o, r. o ; 5. 91?i?9?' 1 - 111111, 9. {2qi199, 0' 584'it203IiiR z"it a-ni
"
o.0, r. o', 5.8L3*20?,\. IM13, g. 1?91199, q -584*203AiiR z, reo-re 4', o .0, t. o ; q. ql--3*2 02, !. 31!i1?, 9. 1Zqilq9, 9' s84 "2o3AiiR i', tgA-223', O. O, f . O ; 5 . 813't2 02, L. 3 15't13, 0. 470!t100' O. 584!t203$$* --compute NHB Attractions by Location.$.itfn 3r1-10, 0. 0, 1.0,2.3g4tc2}2,O.g]-?r,j-3rO.291!t1OO - NHB for CBD zones$$ NHB for WA Districtimn 3,60-62, o. o, 1. 0,2,73otc2o2, 0. q?1111' o. 140:tL00aiin r, e e-e e, o. o, 1. 0 ,2 .73oi?9?,9. q1{l}1,0.140:t100AiiR g, eo-gr, o. o, r. 0,2.739*zozr 0. 93111?r o. 140rtL00Aiii r, res-r69, 0.0, 1. o ,2.73ot'2o2, 0. 634*L3, 0 - 140:t100$+irtn 3, 11-59, o. 0, 1. 0, 4.L6o*2o2,t.27q\1, 0. 345*100, 0 .527 {c2o3
AiiR l', dZ-eZ, O . O, f . O', 4 . L6Otc2O2, L.278*L?, 0 . 345*100, 0 . 527 tc203
AiiR 3', 69-7 s, o. o, r, o, 4 . L6o*29?, \. - ?79i\1, 0. 345*100, 0 . 527 tc243
AiiR 1',ez-sz; o : o ,.r. o', 4 .L6otcza2'r) -?7?l\7, o. gas'troo, 0 .s27t'2o3AiiR i, rrg-ri 4, ol0, 1 : Q, 4 . :-60r'202' r. ?7?!)?, 9. 1t?i199' o . 527 *2o3;iiii i i rie-ia o, o. o, r. o', 4 -1q01?9?, 1. ?Zqil?, q. ?1?i199' g'527'c243;iiii g', L3 i-it 4:, o .o ; 1 . o', 4 . L99* ?9?, \ - ?79:\1, 9 . I 1 :i 199' o . 527 t' 2o3AiiR z', tt z-tzg, o . o ; 1 . o', 4 . t6o* 29?, ) - ?7?:\?, 9. 11 ?i 199, o . 527 tt2o3
Aiiri i',iz a-it e', o .0 ; 1 - o', 4 -1q0*? 9?, \ - ?78-*.\3, 0 . 3t qi1II' o' 527 * 2o3AiiR i, ies-faS, o. o, r . o,-, 4 .160'r202, L. 27 8*L3, 0. 345'tL00, o . 527 {c2o3
$$ NHB for trRuralil zonesirtn 3,s3-LLz, o . o, 1 . 0 | L t87,9129? t-L :0q li 1? r 0 : 2 191199 r 0 :277!?91 ^AiiR i, rrs-rr5, 0 . 0, 1. 6, 1. 87 o*2o2, l. 991113, 0. ?1qi199, o-. 277 *2o3AiiR i, rrr-r:: , o. o, r. o; 1. 8-791?9?,1. qqlll?,9. ?1?i199 'o '277'c2o3AiiR i, rss-res, o. o, r. o, r. 870*?9?'l- qqlll?'g- ?1?i199 'o '277"2o3AiiR t',12 o-ttr, o . o, r. o ; 1. qToi?9?, t. qqllll, g - ?1:1199, o' 277 tc2o3
AiiR 1',iz a-iti', o .0, r. 0 ; 1. at o*29?, 1. 9q1i1?, 9. ?111]99' o' 277'c2o3Aiiri i, ieo-ie 4', o .0, r. o ; 1 . 87 ot'2o2, 1. os1't1l, o_. z1:i199, o . 277 t'2o3aifn a, fe 6-221, O. O, f . O ; 1. 87 O*2A2, 1. 081!t13, O. 215't100, 0 .277 rczCI3
$$i neguest reports on input data, computed, adjusted and final values'
tIIlIIIIIIIItIIT
III
REPO L,2,4,5$ ==================:========:=:========================$ ====================
A-18
==========================:=
t$ri
ril*
APPENDIX C. ANNEX A
This setup produces the production & attraction trip.ends for threepurposes in-RT291O.DAT. because the production egualions includeLstination of external trips, some o-f the trips have to be rernovedbefore qoinq in to trip ai-stiiUution in ClIARGnx.Onv. This removal isfacilitited-by a Superlalc program called TGENCHNG.CAL. A detailed:*1T*i::-:i-:!:-i:::::1-!::!:::-::i-::-::::3- i:-I::I:II9:!tl:
II
I
APPENDIX C. ANNEX A
TRIP GENERATION SUBROUTINE
(TGENCHNG.CAL)
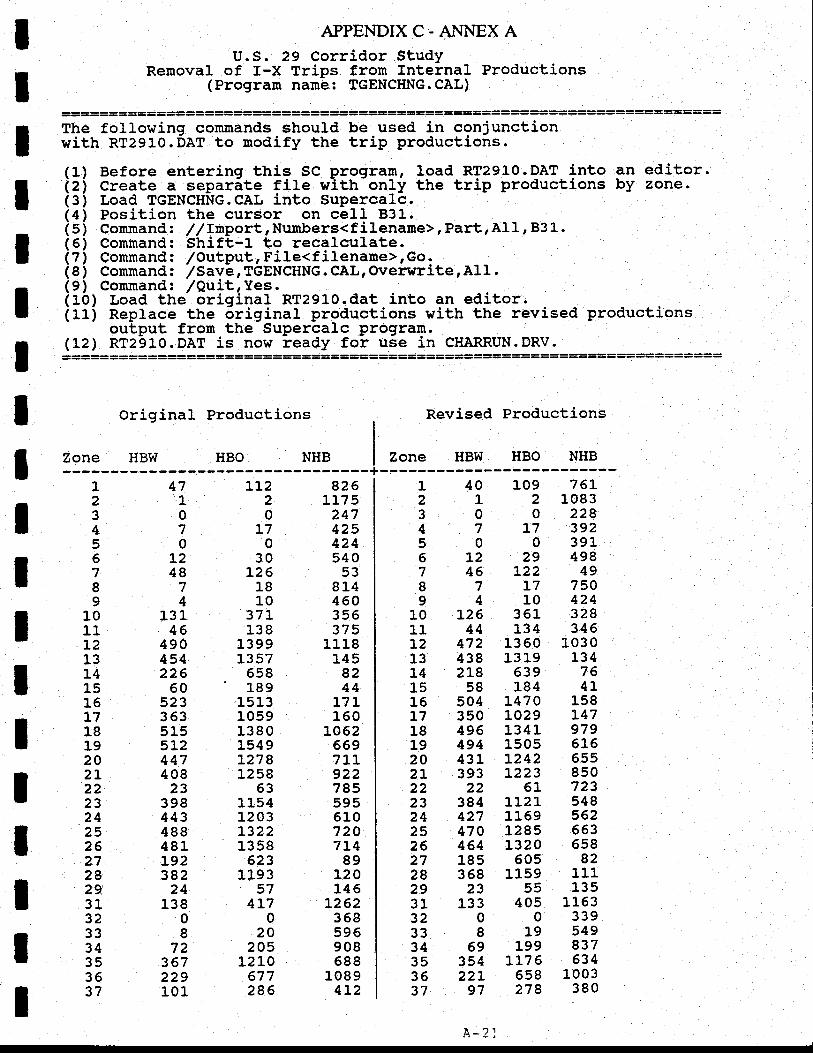
IIIIIIIII
APPENDIX C. ANNEX AU.S. 29 Corridor StudY
Removal of I-X Trips from Inteinal Productions(Program name: TGENCHNG.CAL)
The following commands should be used in conjunctionwith RT29L0.Def to nodify the trip productions.
(1) Before entering thig SC progranr, Ioad RT291O.DAT into an editor.iz\ Create a separite file with-on1y the trip productions by zone.(3) Load TGENCHNG.CAL into Supercalc.(4) Position the cursor on ceII B3L.iSi Comrnand z / /lmportrNumbers<filename>,PartrAl1' 831.(5) Command: Shift-l to recalculate.tzi Conrnand: /output, Filecf ilenane>rGo.(Ci commandt Zq"yF,TGENcHNG.cAL,oveiwrite,All.'[?ll"iH3"ti"/3}i}#3iRT291o.datintoaneditor.iffi Replace the 5riginal productions with the revised productions
output from the Supercalc program.(L2') RT2910.DAT'is now ready for use in CHARRITN.DRV
Zane HBW
original Productions Revised Productions
Zone HBW HBO NHBHBO NHB
IIIIIIIIII
123456789
1011L213141515L7181.9202L2223242526272&2931323334353637
47L070
L248
74
13L46
490454226
605233635155L2447408
2339844348848LL92382
24138
08
72367229101
8261175
247425424540
53814460356375
1118145
8244
L7L160
LO625697IL9227855956107207t4
891201,46
L262358596908688
1089412
I23456789
1.0LLL213I41515L71819202t222324252627282931323334353537
401070
L246
74
L2644
4724382L8
5850435049649443L393
22384427470464185368
23133
0I
6935422L
97
1L220
L70
30L26
l-8Lo
37l.138
13991357
6s8- 1891513105913801549L2781258
63115412 031-3221358
6231193
574]-7
020
20512 10
677286
l_o9 7 6L2 10830 228
L7 3920 391
29 498t22 4917 75010 424
36L 328L34 346
1360 L030L319 L34639 76184 41
L470 158LO29 1-471341 9791505 616L242 655L223 850
61 7231121 5481169 5621285 6631320 658605 82
r,1s9 11"155 135
405 11530 339
19 549199 837
tl76 634658 1003278 380
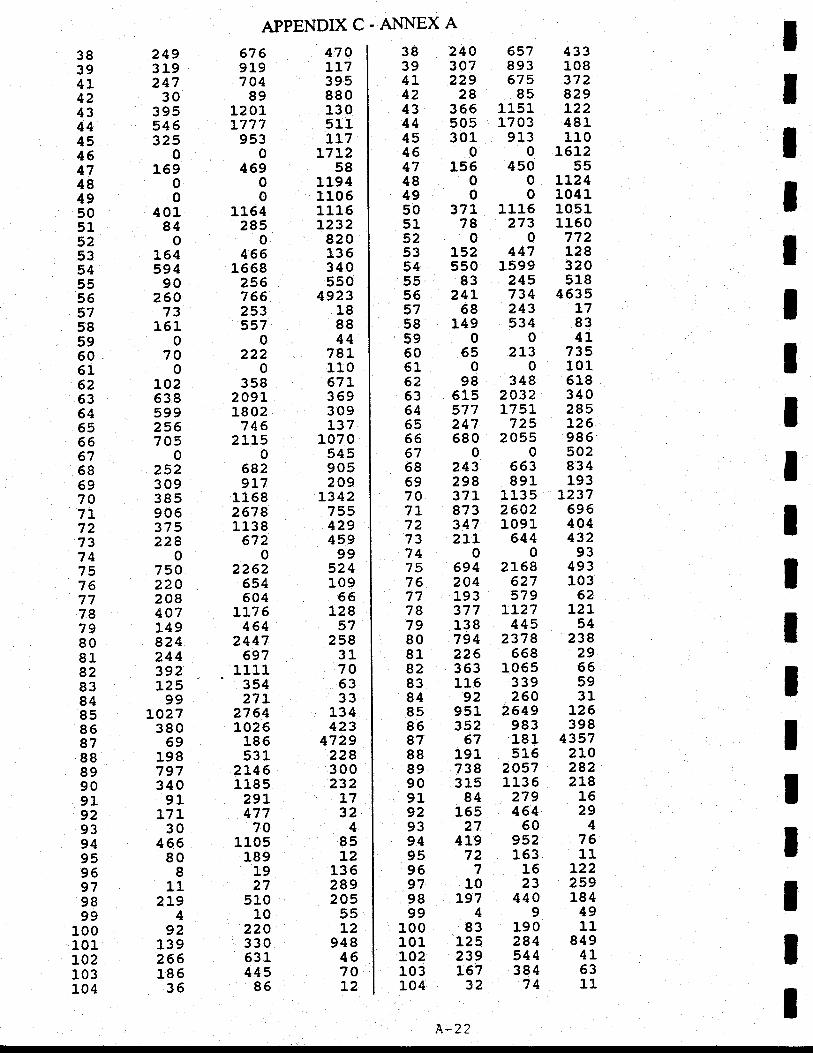
3839414243444546474849505152535455555758596061,6263646566676869707T7273747576777879808L8283848586878889909L9293949596979899
100101to2103ra4
2493L9247
30395546325
0L69
0o
40184
oL64594
90254
73161
070
0LO2638599256705
0252309385906375228
0750220208407L49824244392L25
99LO27
38069
198797340
91L7T
304668o
811
2L94
92139266185
36
676919704
8912 01t777
9530
46900
1164285
o466
1668256766253557
0222
0358
2091,1802
7462Ll.s
0682917
116826781138
6720
2262654504
LL7 6464
2447697
111135427L
27 64LOz5
186531
2l.461185
291,477
7A1105
1891927
51010
22033063144586
APPENDIX C.470LL739-5880130511].L7
L7L258
1.19411061116L232
820136340550
4923188844
78L1.1067L369309L37
1070545905249
L34275542945999
324109
661,28
57258
31706333
134423
4729228300232
L732
485L2
135289205
55L2
9484670L2
ANNEX A
38 24039 30741 22942 2843 36644 50s45 30146047 15648049050 37L51 7852053 L5254 55055 8356 24L57 6858 14959060 5561 062 9863 61s64 57765 24766 68067068 24359 29870 37L7L 87372 34773 2LL74 075 69476 24477 19378 37779 13880 79481 22682 35383 11584 928s 95186 35287 6788 1.9189 73890 31591 8492 16593 2794 4L995 7296797 1098 t97994
100, 83101 L25102 239103 L67104 32
657 433893 108675 37285 829
1151 L221703 48r_913 110
O L6L2450 55
O LL240 1041
1116 1051273 1160
0 772447 L28
1599 320245 518734 4535243 L7534 83
0412t3 735
0 101348 518
2,CI32 340175L 285725 ].26
2055 9850 502
663 834891, 193
113s L2372602 696L091 404644 432
0932L68 493627 103579 62
LL27 L2L445 54
2378 238668 29
1065 66339 59260 31
2649 L26983 398181 4357516 zLO
2A57 2821L36 2L8279 16464 29504
952 76163 1116 1,2223 259
440 184949
190 11,284 849544 41.384 6374 1L
IIItIIIIIIIIIIIIIII
A-22
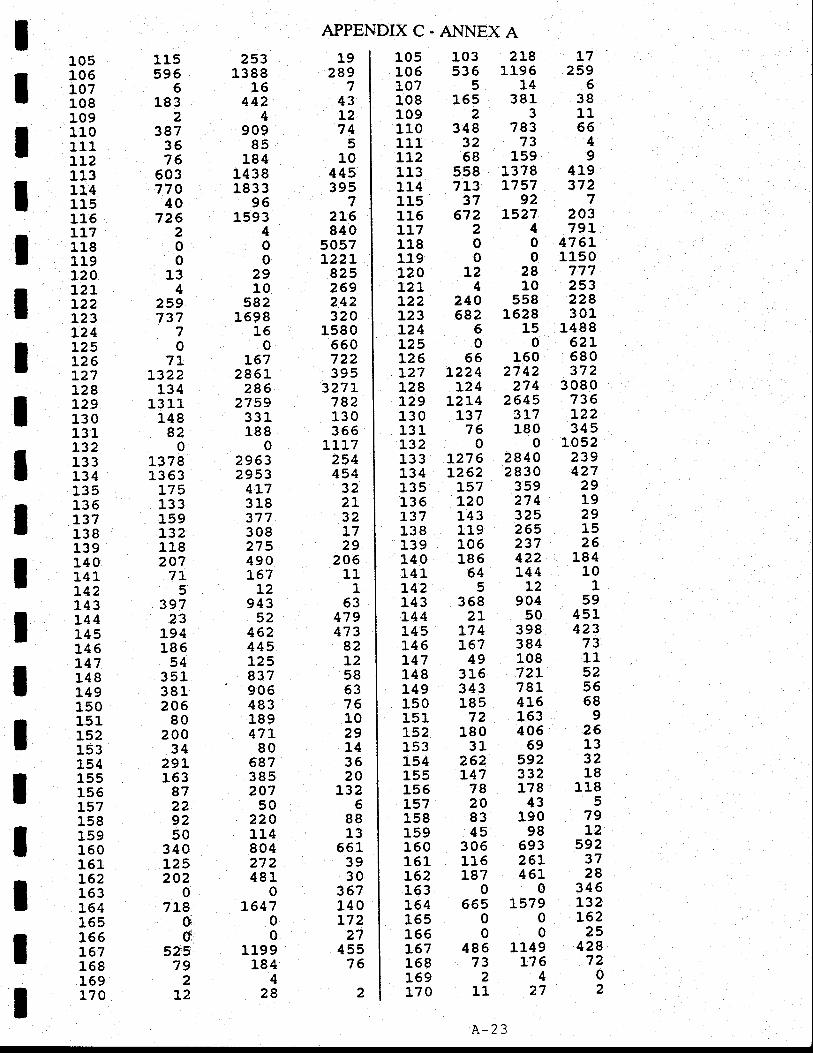
IIIIIIIIIIIIIIIIItI
105106107108109110111tL2113114115116LL7118119120t2LL22L23L24L25t26L27L28129130131].32133L34135136137138139140141L42143L44145t46L47148L49150151:l52153154155156157158159160161L62163L64165165L67168169L70
115596
6183
2387
3676
503770
40726
200
134
2s9737
70
7t1322
1341,3 1_t
L4882
0L3781,363
L75133159L32118207
7L5
39723
L94L86
5435L381-206
80200
3429L163
87229250
340L25202
07Le
od
52579
2L2
2531388
16442
4909
85184
14381833
961593
4oo
2910
5821698
16o
L67286L
2862759
331188
029632953
4L7318377308275490167
T2943
52462445L2593790648318947480
687385207
5022011,480427248L
01,647
0o
1199L84
428
19289
743L274
510
445395
72L6840
5057L22L
825269242320
1580660722395
327L782130365
1117254454
322L32t729
20611
153
479473
82L25863761029143520
L326
88L3
6513930
367140L72
27455
76
2
APPENDIXC-ANNEXA105 103 218 17106 536 1195 2591075146108 165 381 38109231L110 348 783 66111 32 73 4rLz 58 159 9113 558 1378 4L9114 7L3 L757 372115 31 92 7115 672 L527 203tL7 2 4 79L118 0 0 476L119 0 0 1150L20 L2 28 777L21 4 10 253L22 240 558 228L23 682 L628 301L24 6 15 1488L25 0 0 62LL26 66 160 680t27 L224 2742 372L28 L24 274 3080129 L2L4 2645 736130 137 3t7 L2213L 76 1-80 3451"32 0 0 Io52133 L276 2840 239134 L262 2830 427135 L57 359 29135 1,20 274 19137 143 325 29138 119 265 t5139 106 237 26140 186 422 184141 64 L44 10L425L21143 368 904 59r44 21 50 45LL45 L74 398 423146 t67 384 73L47 49 108 11148 316 721 52t49 343 781 55150 185 4L6 6815L 72 163 9L52 180 406 26153 3L 69 13154 262 592 32155 L47 332 18155 78 L78 118L57 20 43 5158 83 190 79159 45 98 L2160 306 693 592151 116 26L 37L62 L87 451 28163 0 0 346164 665 1579 r32L65 0 0 L621660025L67 486 1149 428168 73 L76 72169240L70 11 27 2
A-23
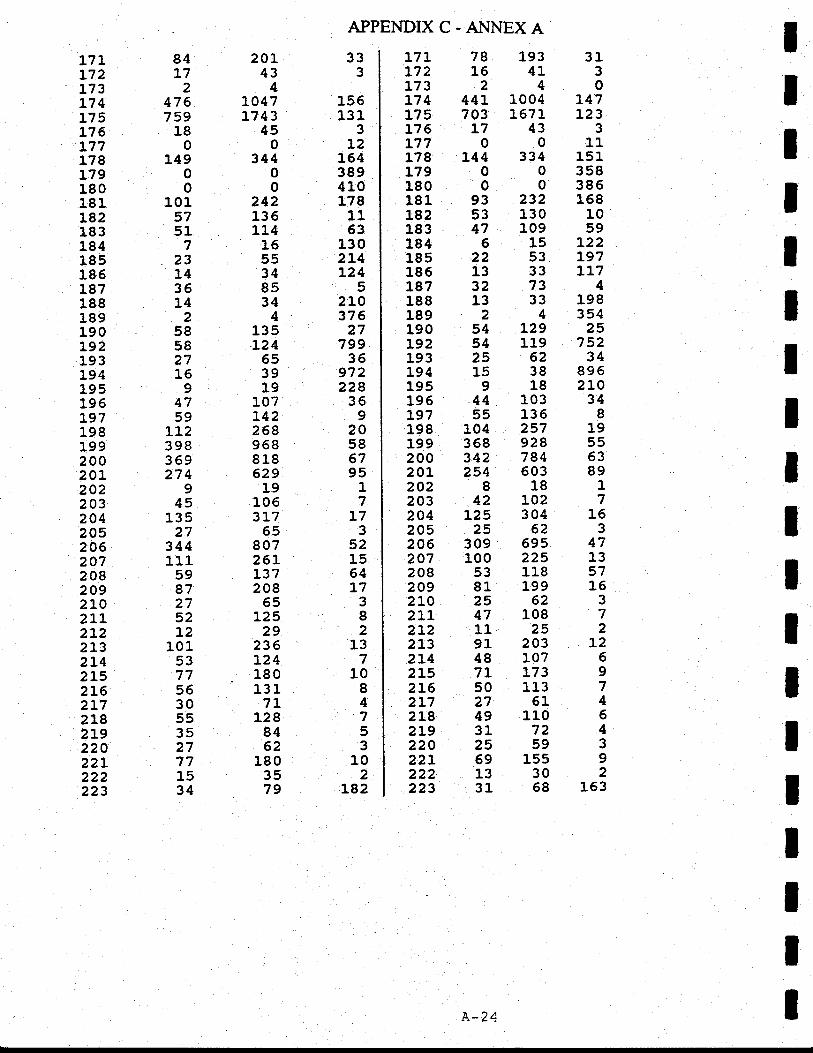
APPENDIXC-A}INEXA III
t7LL72173L74L75L76t77L78L79180181L82183184185185187188189190192193194195196L9719819920020t2022032042052062072082092tCI2]-L2L22L32L42L52I.62172L82t922022L222223
84L7
2476759
180
L4900
1015751
723L436L4
258582716I
4759
LL2398369274
945
13527
34411r.
59872752T2
1-0153775630553527771534
20r43
41 047L7 43
450
344o0
242136114
1655348534
4135L24
653919
107J.42268968818629
L91053L7
5580726LL37208
55L25
29236L241801317t
t288462
1803579
333
156131
3L2
154389410L78
1163
130214L24
52LO376
27799
36972228
369
20586795
17
L73
521564L7
382
137
1084753
102
L82
L7LL72L73L74L75L76L77L78L79180181L82183184185186187188189190L92193194195195L9719819920020L2422032042052062072082092LO2LI2t22t32L42L52L52L72L82L922022t222223
78 193 3116413240
44L 1004 L47703 L67l L23L74330011
L44 334 L5Lo035800386
93 232 16853 130 1047 109 596 15 L22
22 53 L9713 33 LL13273413 33 19824354
54 L29 2554 L19 73225 62 3415 38 8969 18 zLO
44 103 3455 136 I
104 257 19368 928 55342 784 63254 603 89
818 142 102 7
125 304 1525623
309 695 47100 225 1353 1-18 5781 L99 162562347 108 71125291- 203 L248 ]-O7 67L L73 950 113 72761449 110 6317242559369 155 91330231 58 163
IIIIIIIIIIIIIIIIA-24

APPENDIX C. A}INEX A
EX]ERNAL TRIP TABLES
(EXTERNAL.DRV)
A-25

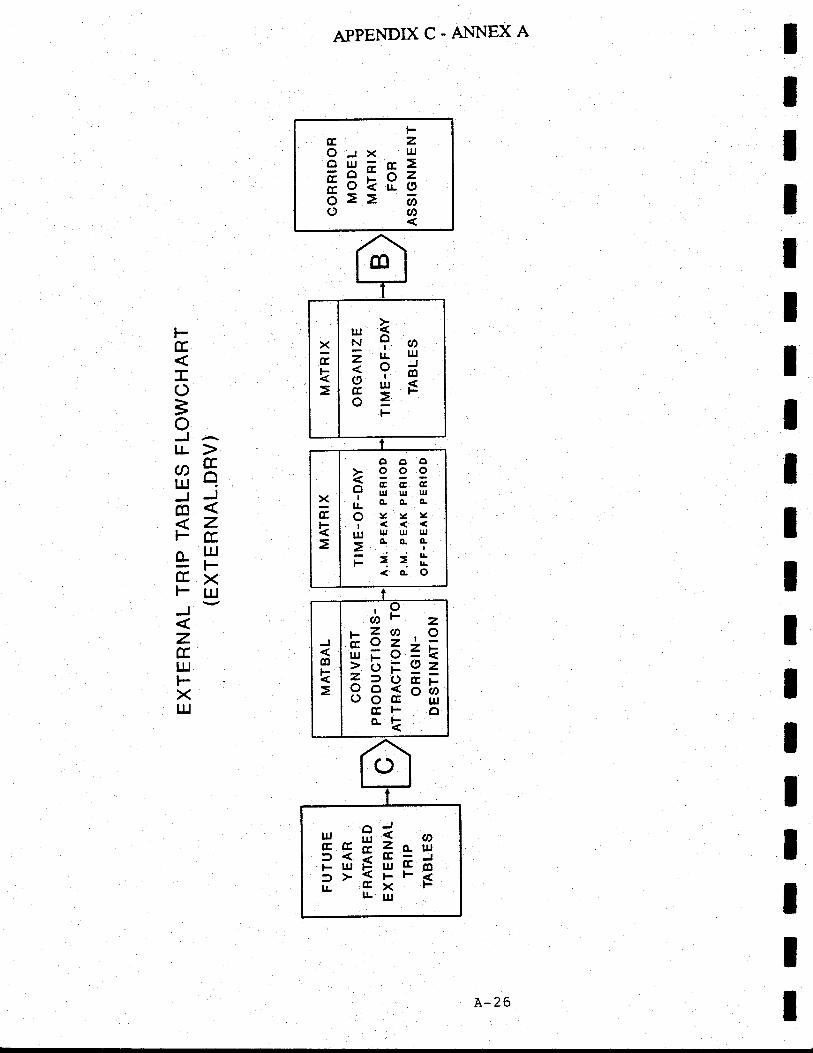
tIIIIIIIIIIIIIItIII
FtEzo-rx tllou.r;6EFBk966>> 6ou)
Ftr
O
=otL,AEY,1 0t4JJJol-En tlJ
trXF111
ztr.Lr.lt-XLIJ
APPENDIXC-AI.{NEXA
m
x&k
HF A
= rL llJ
ggEl-
xEk
ooo
YuutLllri- o.o-a?:::rrr lf,l UJ lll
= Go'?
F iil
co
k
,Pg)- z
Ei?" *??gEH=33;os
EF Oek
rr**t
A-?6
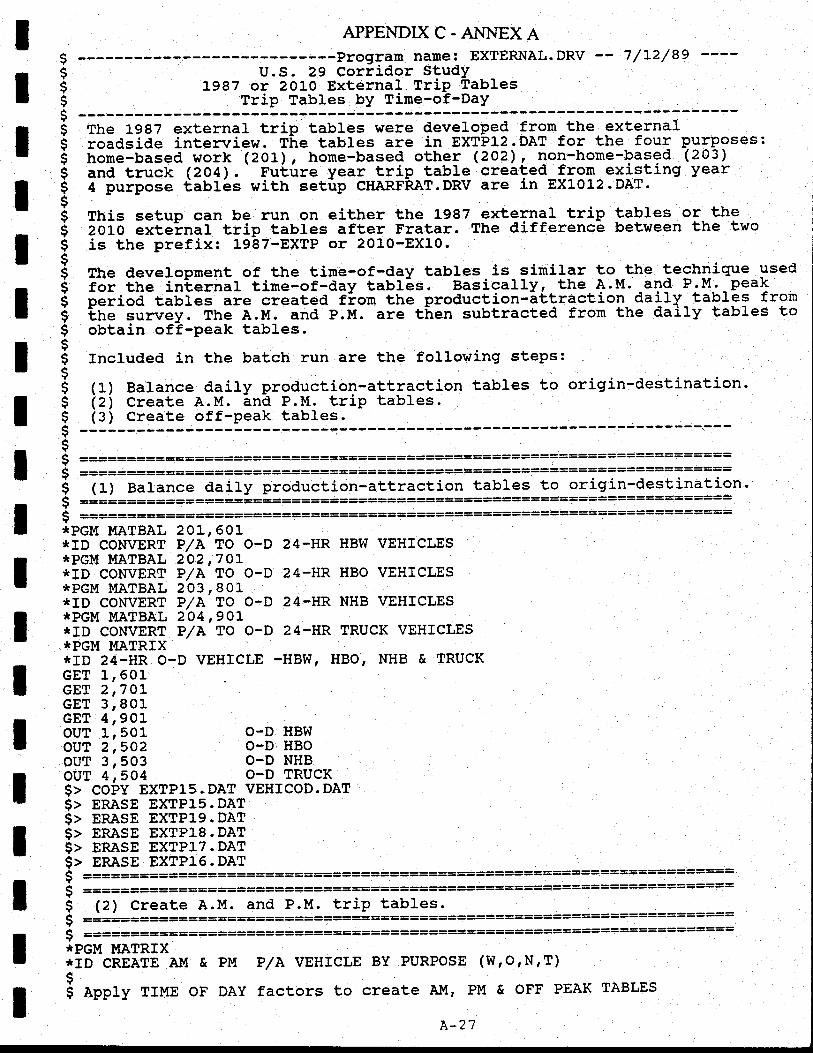
)$s)$$$$$$$$$$$$$$$$$$$$$$$c$$I$$
IIIIIIIIIIIIIItIIII
APPENDIXC-ANNEXA
U.s. 29 Corridor StudYlg87 or 2010 External TriP tables
The L987 external trip tabi;;-;"i"-a"""1oped from the externalroadside intenriew. The tables are in EXTPL2.DAT for the- four purPoses:hone-based work (2OL), home-based other (2O2), non-home-based (203)ina tiucg (204).' fuiure year trip table created from_existing year4 purpose t,ablis vith setlrp CHARFhAT.DRV are in EXL012.DAT
This setup can be run on either the Lg87 external trip tables or. theiOfO exte'rnal trip tables after Fratar. The difference between the twois the prefix: 1987-EXTP or 201-O-8X10.
The developrnent of the tirne-of-day tables is similar to the technigue usedior itre internal time-of-day tabl-es. Basically, the A.M. and P'M.-pea{peiioa tiUfes are created fiour the production-attraction- daily_tables fromihe sunrey. The A.M. and P.M. are then subtracted from the daily tables toobtain of-f -peak tables.Included in the batch run are the following steps:
(1) Balance daily production-attraction tables to origin-destination.izi create A.M. init p.t'1. trip tabres.
-!:i-:::1!r-3II:t:iI-:::::::----======:============================================================:(1) Balance daily production-attraction tables to origin-destination.=======:===::====:===:===:===:::::==:=: =:--=:==::==::==:====::::==::=
=========::::==============:=::======:==::===
=============================:IPGM MATBAL 2OL,6Al:tID CONVERT P/A TO O-D 24-HR HBW VEHICLES*PGM MATBAL 2O2I7A!*ID CONVSRT P/A TO O.D 24-HR HBO VEHICLES*PGM MATBAL 203,801*ID CONVERT P/A TO O-D 24-HR NHB VEHICLES*PG}{ I'IATBAL 2O4,9OL*ID CO}n/ERT P/A TO O-D 24-HR TRUCK VEHICLES'IPGM MATRIX*ID 24-HR O-D VEHICLE -HBW, HBO, NHB & TRUCKGET 1,60LGET 2 ,7O1"GET 3 r 80LGET 4,901ouT 1,501 O-D HBWouT 2,502 O-D HBOouT 3,503 o-D NHBouT 4,504 O-D TRUCK$> coFY EXTP1S.DAT VEHTCOD.DAT$> ERASE EXTP15.DAT$> ERASE EXTPL9.DAr$> ERASE EXTP1E.DAT$> ERASE EXTPI-7. DAT$> ERASE EXTP1s.DAT$ =============$$$$
==================.==:==============================:=:==============================:==
(2) Create A.M. and P.M. triP tables.=================:
=============g==========
*PGM MATRIX*ID CREATE AT,I &
s$ App1y TIME oF
PM P/A VEHTCLE BY PURPOSE
DAY factors to create Al{,
(w, o, N, T)
PM & OFF PEAK TABLES
A-27
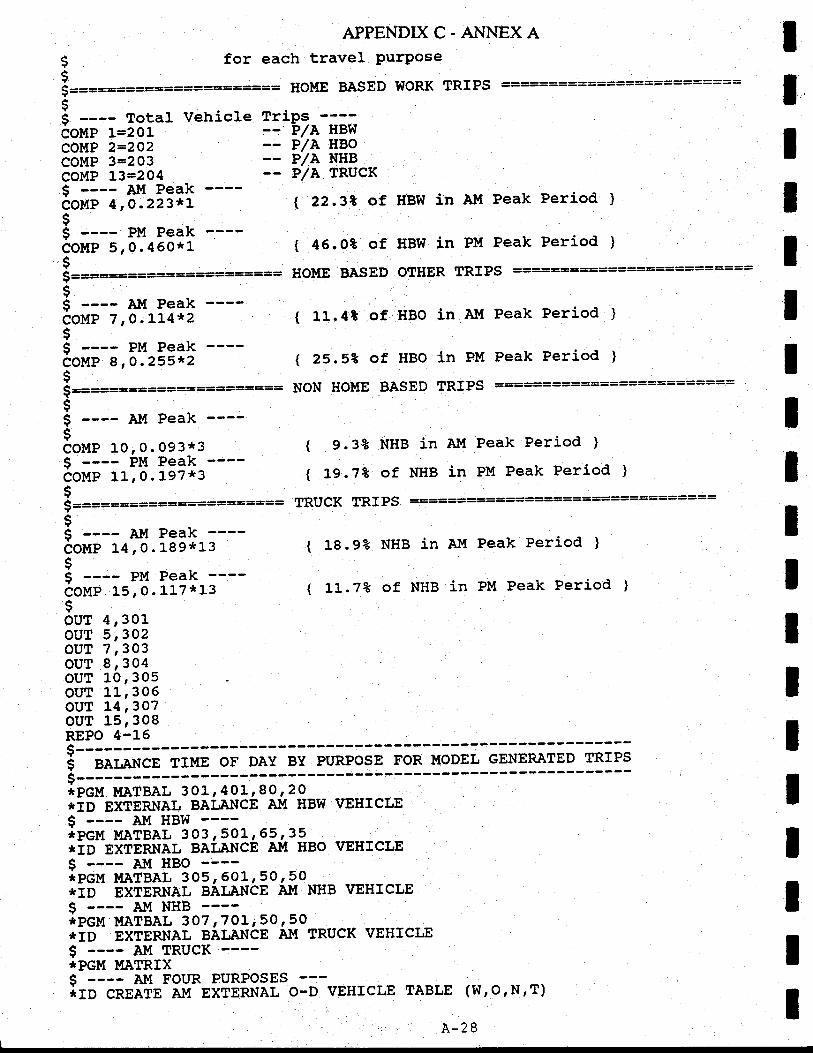
-- P/A HBo-- P/A NHB-- P/A IRUCK
t 22.32 of HBw
COMP 2=202COMP 3=2O3COMP L3=2O4$ AtI PeakCOMP 4 , O.223tcL$$ PM PeakcoMP 5r0.460*1$$===========I$ Al{ PeakcoMP 7 ,O.].t4*2$I -;-- PM PeakcoMP 8, 0. 255{,2$$=============:===-=lo==$$ All Peak ir--$coMP 1.0, 0.093*3$ PM PeakcoMP 11, 0 .].97j 3
s$ ==========:==:==-====:I$ AM PeakCOMP L4,O. L89'h1,3$$ PM PeakcoMP'15,0.1L7*13
APPENDIX C. A}.INEX A
for each travel PurPose
in Al{ Peak Period' }
IIIIII
{ 46,0t of HBW in PM Peak
HOUE BASED OTHER TRfPS ==
Period )
( 11.4t of HBO in Al{ Peak Period }
| 25.52 of HBo in PM Peak Period )
NON HOUE -BASED fRfPS ======:==================
t 9.34 NgB in Alt Peak Period )
{ tg.1Z of NHB in PM Peak Period }
TRUCK TRIPS =-======:=:==:===============::=
( 18.93 NHB in Alt Peak Period )
t 11,.7? of NHB in PM Peak Period )
IIIIIIIIIIIII
IouT 4r301ouT 5 ,3O2ouT 7,gOgouT 8',3O4ouT 10,305ouT 11,306ouT 14 ,1O7ouT 15r308FJEPO 4-16$-------$ BALANCE TI}IE OF DAY BY PURPOSE FoR !'!ODEL GENERATED TRIPSe------- -+------t---*peu MATBAL 301, 4ol,80,20*lp nxtsRNAL eai,ANcil atl Hew vEHrcLE$ ---- Au HBw*PGlt II{ATBAL 3O3
' 501r 65
'35*ID EXTERNAL BAI,ANCE AI{ HBO VEHICLEI ArTt HBO*PGM MATBAL 305, 601,50' 50
'tID EXTERNAL BAI,ANCE A}{ NHB \IEHICLE$ At{ NHBrrPGU UATBAL 3O7,7OL,50' 50
'tID EXTERNAL BALANCE Al'I TRUCK VEHICLES----- AI.{ TRUCKI'PGM I-IATRIX$ ---- AI"I FOUR PURPOSES -:-irn cngerE AI{ EXTERNAL o-D vEHrcLE TABLE (w,o,N,T)
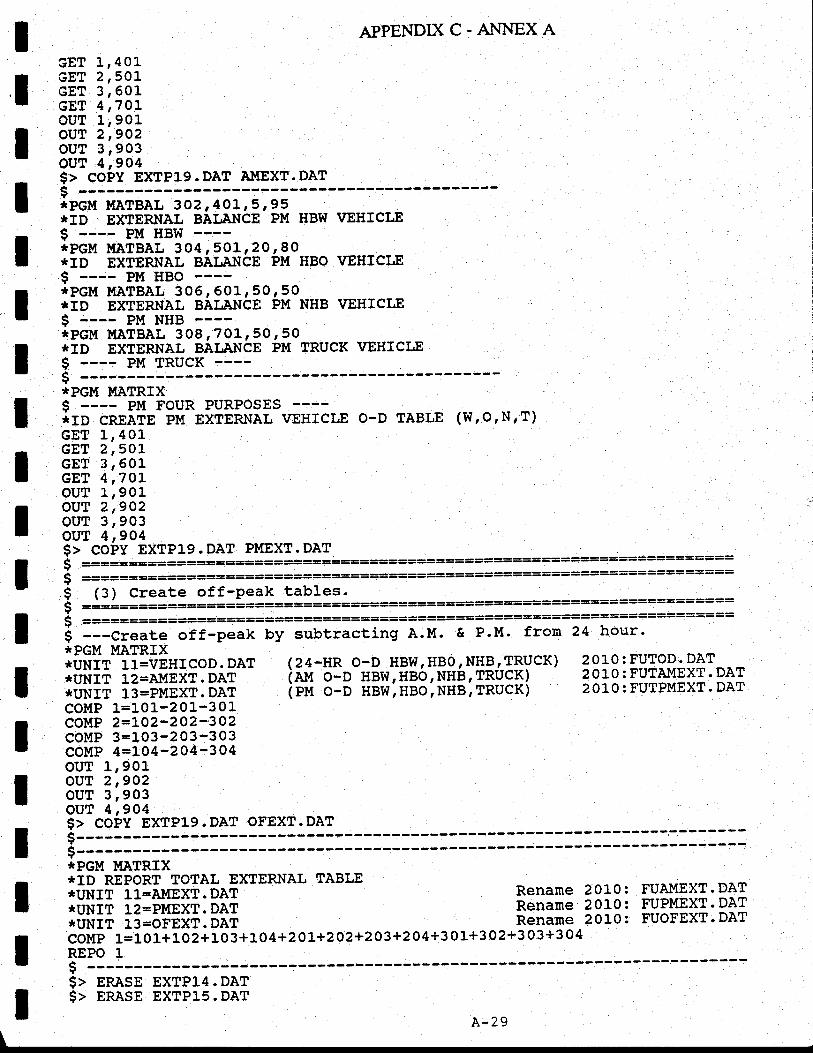
III
APPENDXC-A}INEXA
GET 1,40i,GET 2,501-GET 3,60LGET 4 ,7O]-ouT 1,901our 2;eo2
3H$ i;33i$> coPY EXTPLg.DAT AMEXT.DATa -:----*PGM MATBAL 3O2,AOL,5,95*io ExTERNAL gAr,ANCe PM HBw vEHrcLE$ ---- PM HBw*PGM I,IATBAL 304 ,501r 20 r 80'tID BXTERNAL BAIJINCE PM HBO VEHICLES PI.{ HBO*PGM I{ATBAL 306, 601r 50, 50*ID EXTERNAL BAI,ANCE PM NHB VEHICI,E
*PGM IIATBAL 308 , 7 OL ,5O , 50*ID EXTERNAL BAI,ANCE PM TRUCK \rEHICLEI PI.{ TRUCKs*PGM MATRIX$ ---- PM FOUR PURPOSESiro cngarg pM ExTERNAL vEHrcr,E o-D TABLE (w,o,N'T)GET L,4OlGET 2,501-cET 3,50LGET 4 ,'7Or.our r,gorouT 2',go2ouT 3r903ouT 4',go4$> coPY EXTP19.DAT PMEXT.DAT$ =========:=====:=========================:======:===========-====:=:$ ==========:====================*=============================-==:=::$ (3) Create off-Peak tables.c ==:=======:==========::==:====:====:: =:=====:===:==:======:=::==:=::$ =========:==========================================================$ ---Create off-peak by subtracting A.M. & P.M. from 24 hour.*PGM MATRIX*UNrT 11=VEHICOD. DAT (24-HR O-D HBW,HBO,NHB,-TRUCK) ?9}9'IIiI9.9:PAT,tuuir iz=aunxi.oai - fal'r o-o HBw,HBo,NHb,TFqqI) 2010:FUTAMEXT.DATlruNrr l3=pMExr. DAT (pr.r o-o HBw;HBo;NHB;TRucK) 201-0: FUTPMEXT- DAT
COMP 1=L0L-20L-301-COMP 2=LO2-2O2-3OTCOMP 3=103-203-303COMP 4=LO4-204-304
33$ I
""3'ouT 3,903ouT 4,904$> coPY EXTP19.DAT OFEXT.DAT$-------s-------*PGM MATRIX*ID REPORT TOTAL EXTERNAL TABLE*UNIT II=AIIEXT.DAT*UNIT 12=PMEXT.DAT'IUNIT ]3=OFEXT. DAT
Rename 20L0: FUAMEXT-DATRENAMC 2O].0: FUPMEXT.DATRenarne 2010: FUOFEXT-DAT
COMP 1=101+102+103+10 4+2OL+2O2+2O3+204+3 01+3 02+3 03+3 04REPO 1s ------$> ERASE EXTP1 .DAT$> ERASE EXTP15. DAT
IIIIIIIIIIIIIIII A-29
$>$>I$$$I$I$$$*
APPENDIXC-AI.INEXA
ERASE EXTP16.DAT
_:1::_3111113iI------This output fron this setup is three units with four tables oneach unit:
AI{EXT.DAT - A.M. Peak period, HBw, HBo, NHB, & TRUCKPMEXT.DAT - P.M. Peak period, HBW, HBO, NHB, & TRUcKOFEXT.DAT'- Off-Peak period, HBw, HBO, NHB, & TRUCK
These tables are used in CIIARRIIN.DRV as inputs to the assignment.They are cornbined the internal-internaL tine-of-day tables.
A-30
APPENDIXC.ANNEXA
EXTERNAL FRATAR
(cHARFRAT.DRV)
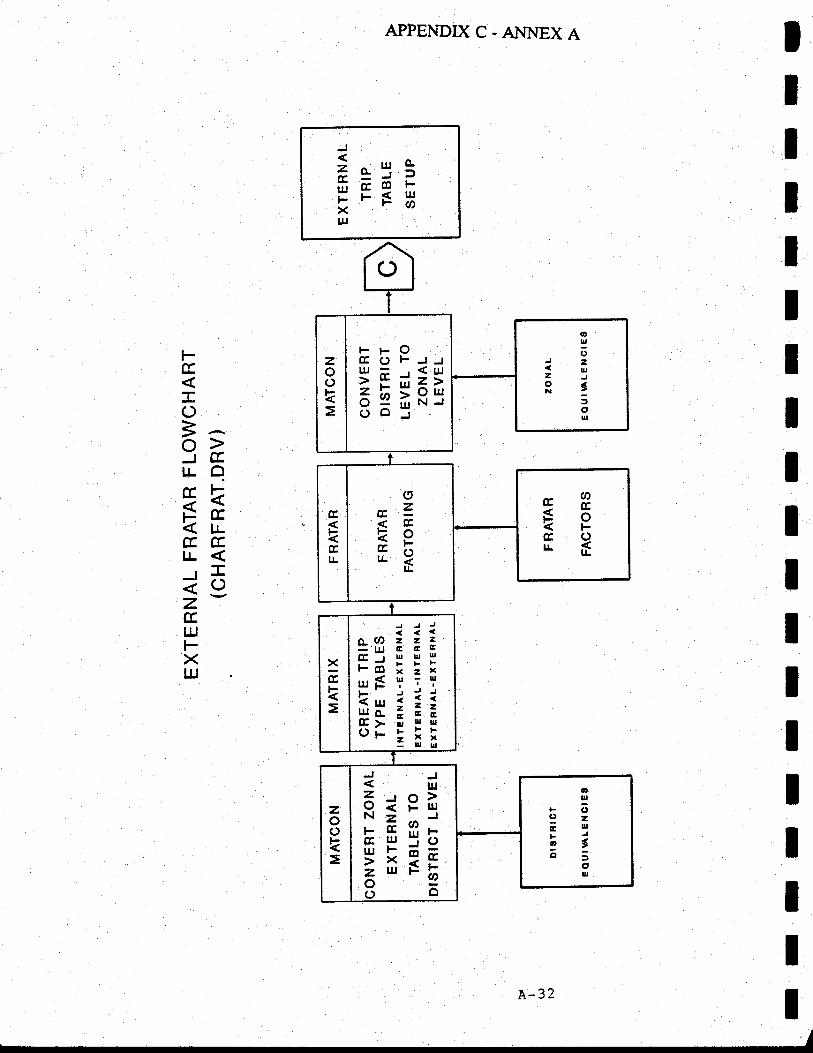
llAPPENDIX C. ANNEX A
A-32
I
IIIIIIIIIIIIIIIItI
J
; au{ *trE6Fi rf: Htrl
t-
C)
=Aa)Jc',r.LqektrcEcc E,l!
1.5
=Oz-(rIIJFXUJ
zook
FrO(r(.)rFJJL!
= ,{l!\l!-r\
6EHREool
d,lt
5Jz(UZ1R: :q
UJ
oE=k9rH
EFg, c)r!fi
xa,
k
J
2Eul
xUJ
J
zEl|tFx
o,l:-llj
G llE -,r Ir ltFcB , Zurf; ? 1k'"
==H} fr Fop i ilrJ
iPi=,
jF 56il 3fr
E
zoN
Eul
zo
zoot
oll'
FO()Zlu'o t6;
glll
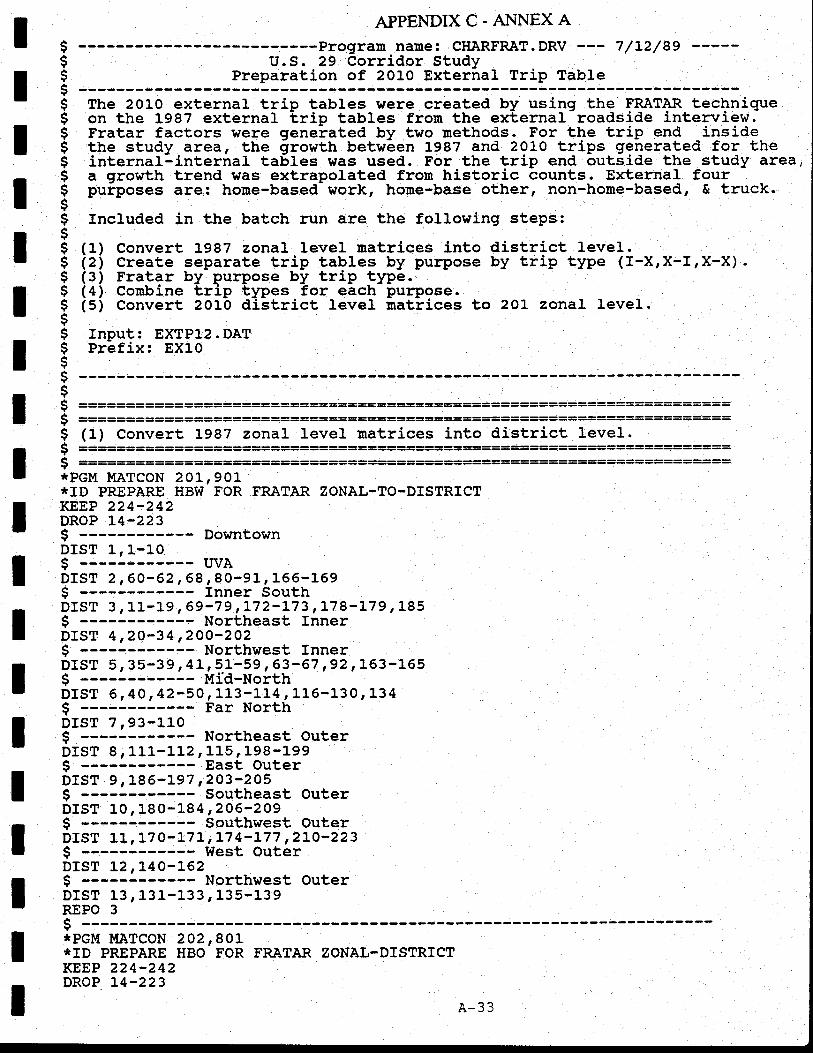
$$$$$$$sI$I$$$$sI$$$$I$$$$$$$
APPENDIX C. ANNEX A-Progran name: CIIARFRAT.DRV --- 7/L2/89
U.S. 29 Corridor Study:::r=1:i::-::-39T-:::::i:1-l:i!-1::=-
The 2010 external trip tables were created by using the FRATAR technigueon the L987 external t,rip tables from the external roadside interview.Fratar factors were generated by two methods. For the trip end insidethe study area, the growth between L987 and 2OL0 trips generated for theinternal-internal tables eras used. For the trip end outside the study area,a growth trend was extrapolated from historic bounts. External fourpuiposes are: hone-based-work, home-base other, non-home-based, & truck.Included in the batch run are the following steps:
(1) Convert L987 zonal level matrices into dist,rict level.(z\ Create separate trip tables by purpose by trip type (r-X,X-I,x-X).(3) Fratar by purpose by trip type.(4) Cornbine trip tlpes for each purpose.(5) convert 2010 aistrict level natlices to 2o1 zonal level.rnput: EXTPL2.DATprbtix: EXLo
IIIIIIIIIIItIIIIIII
(1) Convert L987 zonal Level matrices into district Ievel.e ------*PGM MATCON 201,90]-*ID PREPARE HBW FOR FRATAR ZONAL-TO-DISTRICTKEEP 224-242DROP t4-223$ DovrntownDIST 1,1-10$-::-:::------ waDrsT 2 ,60-62, 58,80-9L, l-66-l-69S ------ Inner SouthDIST 3 , 11-L9 ,69-79 ,L72-L73 tl..78-L79 r 185I Northeast InnerDrsT 4,20-34,2OO-2O2S ------------ Northwest fnnerorsr 5, 35-39, 41r51-5g,63-67,g2,L63-L65$ ----:------- tilia-UoittrDIST 6 ,40 ,42-50, 113-11,4-, 115-L30, 134$ Far NorthDrsr 7,93-lLO$--:--:-DrsT 8, 111-112,Lrs, 198-l-99$ ----:--- 'east, outerDrsT 9, 186-197,2O3-2O5g-::--::------' Southeast outerDrsT 10, 180-L84,206-209$ ------ Southwest OuterDrsr 11, 170-17 L,L7 4:177 r2LO-223$ West OuterDrsT L2,L4O-].62S ------ Northwest OuterDIST 13, 131-133, 135-139REPO 3s-------*PGM MATCON 2O2,goj.*ID PREPARE HBO TOR FRATAR ZONAL-DISTRTCTKEEP 224-242DROP r4-22t
o_r,
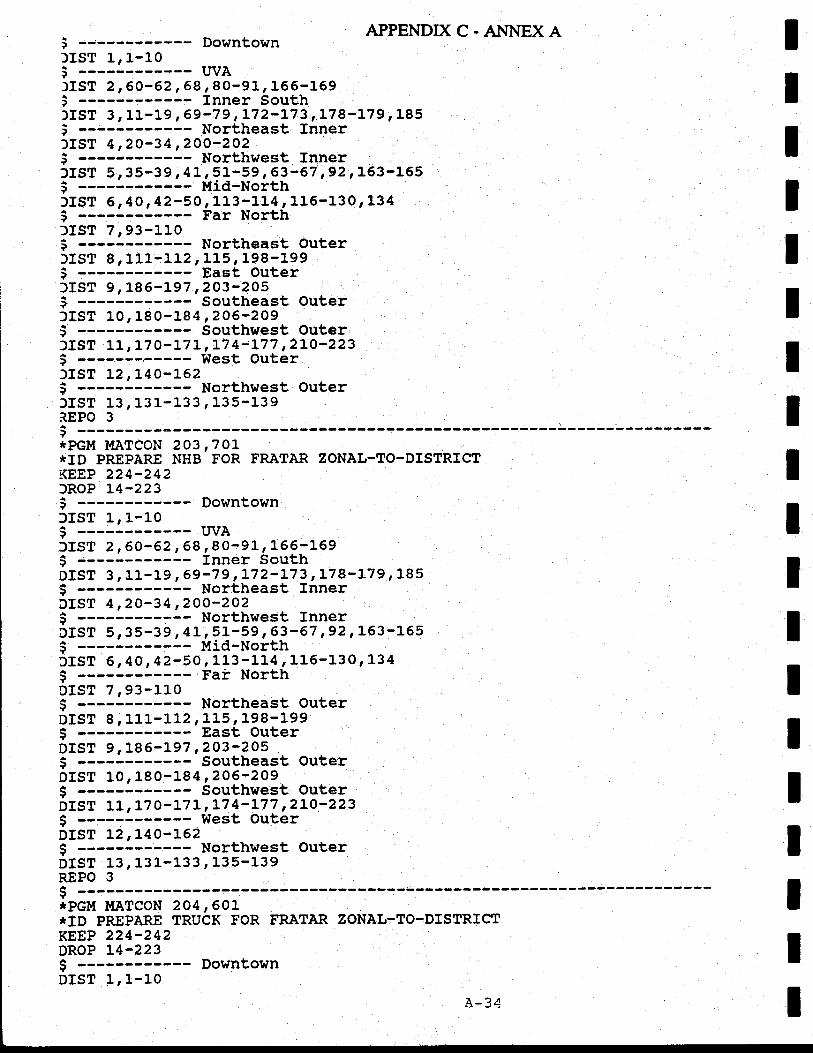
APPENDIX C. AI.INEX A; ------ Downtown)IST L, l.-103 ------------ uVA)rsT 2,60-62, 58, 80-91, 165-159; ------ Inner South)rsT 3 r 11-19 ,69-79 tL72-L73 ,L78-179,185; ------ Northeast Inner)rsr 4,20-34,2OO-2O2; ------ Northwest InnerfrsT 5, 35-39,4L,5L-59, 63-67 t92,L63-L65i ------------ Mid-Northjrsr 6, 40, 42-so, 113-114, 116-130, 134S ------ Far liorth)IST 7,93-110i ------ Northeast Outer)IST 8 r 111-11-2 ,LL5, 198-199; ------ East Outer)rsT 9, 186-197,2O3-2O5; ------ Southeast Outer)rsT 10,180-184,206-209; ------ Southwest outerjrst LL,L7o-17L, L'7 4-L77, 2Lo-2235--:-::::----- west out6r)IST L2,L4O-L62$ ------ Northwest Outerlrsr 13, 131-133, 135-139R,EPO 3; ------ ----r----*PGM I.{ATCON 2O3,7OL'tID PREPARE NHB FOR FRATAR ZONAL-TO-DISTRICTKEEP 224-242fRoP L4-223; ------ DowntownlrsT L, L-10; ------------ IIVAlrsT 2,60-62, 58, 80-91, 156-159S ------ Inner SouthDIST 3, 11-19 ,69-79 ,L72-L73 ,L'18-t79 r 185s ------DrsT 4,20-34 ,2OO-2O2I ------ Northwest InnerDIST 5, 35-39, 4L,5L-59, 63-67,92,L63-L65$ ------ Mid-NorthDIST 6, 40, 42-50, 113-114, 116-130,L34s ------DrsT 7,93-11"0$ ------ Northeast OuterDIST 8, 1.11-l-12,L15, 198-199$ ------ East OuterDrsT 9, 186-197,2O3-2O5$ ------ Southeast OuterDIST 10, 180-1,84 ,206'209I ------;----- Southwest OuterDrsT 11, 170-17 L, L7 4-L77,2LO-223$ ------ West Out6rDrsT L2,L4O-L62g -----:DIST 13, 131-133, 135-139R,EPO 3
IIIIIIIIIIIIIIIItI
$*PGM MATCON 2O4,60I*ID PREPARE TRUCK FOR FRATAR ZONAL-TO-DTSTRICTKEEP 224-242DROP T4-223$ ------ DowntownDrsT 1,1-Lo
IA- 34
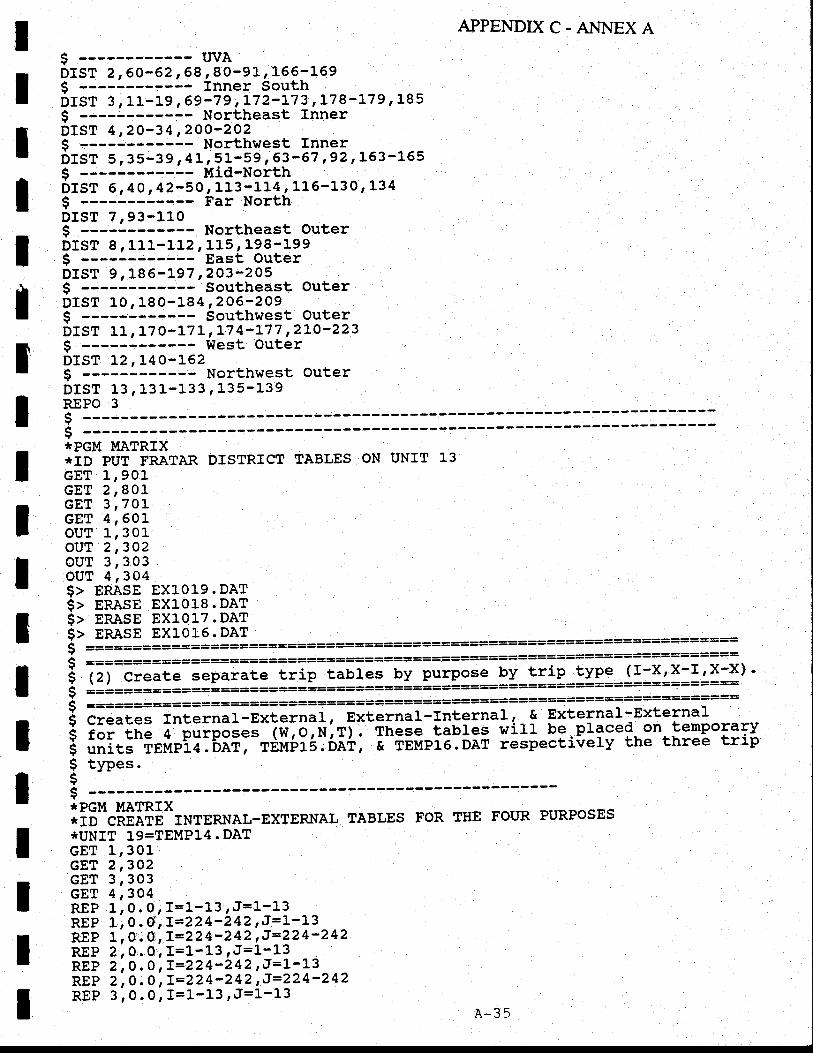
tIIIIII
APPENDIXC-ANNEXA
$ ------------ lrvADIST 2,60-62, 58, 8O-9L, 165-159$ ------ Inner SouthDIST 3, L1-19, 69-79,172'173,178-L79, L85$DIST 4,20-34 ,2OO-2O2$DrsT 5r 35-39, 4rr 51-59, 63'67,92 rL63-L65$DrsT 6, 40, 42-50, 113-114, 116-130r 134$DrsT 7,93-110IDIST 8, 111-112,LLs, 198-199I East OuterDIST 9, 186-197,2O3-2O5$ ------------ Southeast OuterDIST LO, 180-184,206-209$DIST LL,L7 0-171 ,L74-L77 ,2LO'223$ West outerDIST t2,L4O-152$DIST 13, 131-1,33, 135-139REPO 3I
tIIIIIIItII
$$*PGM MATRIX*ID PUT FRATAR DISTRICT TABLES ON UNIT 13GET 1,901GET 2,801-GET 3,7OLGET 4, eOrouT l-,301-ouT 2 ,3O2ouT 3,303ouT 4 ,3O4$> ERASE EXI-0L9. DAT$> ERASE EXl"ol"8.DAT$> ERASE EX1oL7.DAT$> ERASE EX1o15.DAT ====$ ==========================================:=====================:e ====== ==:===:==:=========:==:=:==::========:===:=:=:==:==:=:=:=::l_*1 ,-
i Ql Create separate trip tables bv purpose bv trip !If:-g:LI:I,'x-x) '$ J=!======:==================================:======s===========::::$ =========================-=========================================:$ Creates Internal-External , -pxte5nal-Internal r - ! Fxt"rnal-ExternalS for the 4 puiposes (W,o."rft. Thg*__!?bles will be placed on ternporaryg units TEMp14.DAT, TEMPL5.6Aft, I fggpre .Dai respectilely the three trip$ types.
3
ll3""Xtffil*r*r"*AL-ExTERNAL TABLES FoR rHE FoItR PURPosEs*ir.lri-'r g=ieM-Pra . DATGET 1,301eBt 2,3O2GET 3,303GET 4r304REP 1, 0. 0, I=1-13 rJ=1-13REP 1, 0. d:, I=224-242, J=1-13REP L, O.O, T=224-242, J=224'242nnF a, o.,o, r=1-13 ,J=i-rrREP 2 r 0.0 ,I=224-242 ,J=r.-L3irp z, o. o',r=224-242 ,J=224-242REP 3, 0. 0, I=1-13 rJ=J'-13
A-35
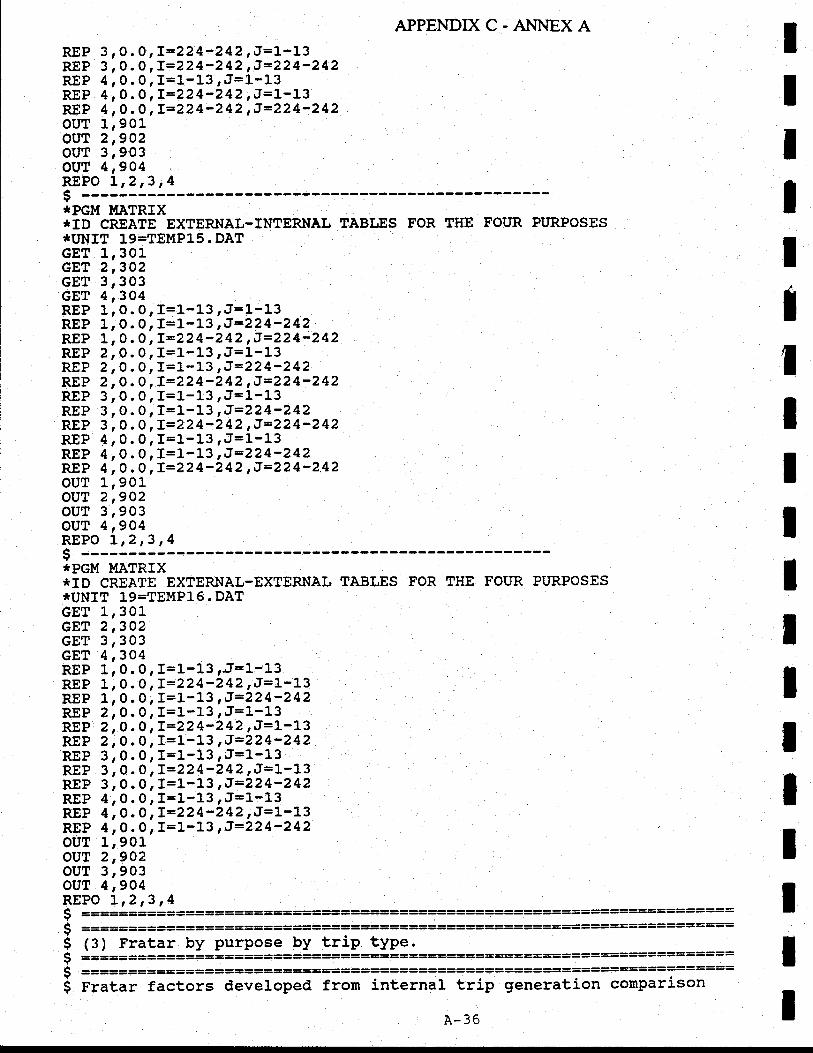
APPENDIXC.A}.INEXAREP 3, O. O ,I=224-242 ,J=l' -L3REP 3 r 0.0 ,I=224'242 ,J=224-242REP 4, 0. 0, I=1-13 rJ=1-13REP 4, 0.0,I=224-242rJ=1-13REP 4 r 0.0 ,I=224-242 ,J=224-242ouT 1r901ov! 2,902our 3;eo3ouT 4 o9O4REPO r,2 ,3 ,4$ ------*PGM !'!ATRIX*ID CREATE EXTERNAL-INTERNAL TABLES FOR THE FOIJR PURPOSES*UNIT 19=TEMP15.DATGET 1r301GET 2 ,3O2GET 3,303cET 4,304REP 1, O. O, I=1-13 rJ=1-13REP 1, O. O, t=t-f f
-,J-224-242
REP 1, 0. 0,T=224-242,J=224-242REP 2, O. O, l=f-tf rJ=i-13REP 2 r 0. 0, I=1-1-3 ,J-224-242REP 2, 0. 0,I=224-242,J=224-242REP 3, 0. 0, I=L-13 rJ=1-13REP 3, O. 0, f=1-13,J=224-242REP 3 r 0.0 ,L=224-242 'J-224-242REP 4, 0. 0, I=1-L3 rJ=L-13REP 4r0.0rI=1-13'J=224-242REP 4 r 0.0 ,I=224-242 'J=224-2.42ouT 1,9019v_\ ?,29?ouT 3,903ouT 4,904REPO L,2,3 ,4$*PGM MATRTX
'tTD CREATE EXTERNAL-EXTERNAL TABLES FOR THE TOUR PURPOSES*UNIT 19=TEMP16.DATGET 1,301cET 2',3O2GET 3,303GET 4 ,3O4nEp r, o. o, r=1-13 ,J=L-1-3REP l-, 0. 0 ,I=224-242 ,J=L'L3REP 1, O. O, t=t-t:,J=224-242REP 2, 0. 0, I=1-J-3,J=1-J.3REP 2 r 0.0 ,T=224-242 ,J=L-L3REP 2, O.0 r I=3--1,3 ,J=224-242REP 3, 0. 0, I=1-13 rJ=3.-13REP 3, 0. 0,I=224-242'J=L-13REP 3, 0. 0, f=1-13,J=224-242REP 4,0.0, f=1-13 rJ=3--13REP 4,0.0 ,I=224-242 rJ=1-13REP 4, 0. 0, I=1-13,J=224-242ouT 1,901ovT 2,9O2ouT 3r903ouT 4,904REPO 1,2,3 ,4
==:===========:-::=:::::::============g========
$ ===
T
ItIIItIT
IItIIIIItI
$$$$
(3) Fratar by purpose by trip type.===:=========:==:=
======:===============:internal trip generation conparisonFratar factors develoPed from
A-36
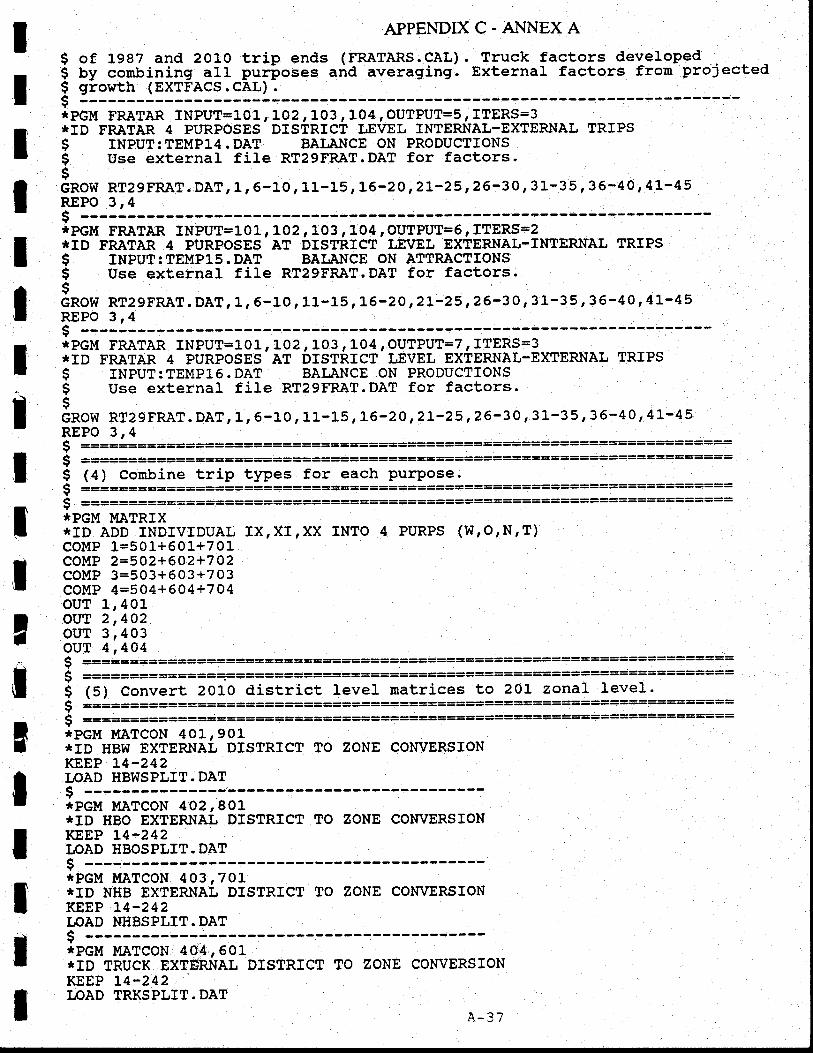
IIIIIIT
IttIItIl'IIIII
APPENDTXC.ANNEXA.
$ of LgeT and 2O1O trip ends (FRATARS.qAL). Truck factors developed$ by combining all purloses aria averaging. External factors front projected$ growth (EXTFACS.CAL)IrtPGM FRATAR INPUT=101 , 102 , 103
' 104 , OUTPUT=5 , ITERS=3
*ID FRATAR 4 PI'RPOSES DISTRTCT LEVEL INTERNAL-EXTERNAL TRIPS$ INPUT: TEMP14 . DAT BAI,ANCE ON PRODUCTIONSi Use external fil-e RT29FRAT.DAT for factors.IcRow RTzgFRAT. DAT, 1, 6-10, 11-15, L6-2O, 2L-25, 26-30, 3 L-3 5, 36-40, 4l-45F€PO 3r4s*PGM FRATAR INPUT=I0 L ,IO2, 103
' 104 , OUTPUT=6 r ITERS=2
*ID FRATAR 4 PURPOSES AT DISTRTCT IJVEL EXTERNAL-INTERNAL TRTPS$ INPUT:TEMPIS.DAT BAI.ANCE ON ATTRACTIONSi u;;-exieinir iire RTteTRAT.DAT for factors.GROW RT2gFRAT. DAT, 1, 5-10, 11-15, 16-20, 2l-25, 26-30, 3 1-3 5, 3 6-4 0, 4L- 45REPO 3,4$*PGM FRATAR INPUT=I-O I , LOz, 103 , 104 , OUTPUT=7 , ITERS=I*ID FRATAR 4 PURPOSES-AT DTSTRICT LEVEL EXTERNAL-EXTERNAL TRIPS$ TNPUT:TEMP16.DAT BAI.ANCE ON PRODUCTIONS$ Use external file RT29FRAT.DAT for factors.$GROW RT2 9FRAT. DAT, 1, 6-10, 11--1,5, L6-2O, 2I-25, 26-30, 3 1-3 5, 3 6- 40' 4 1-4 5REPO 3,4
==:======:====:==:==:::==:::==::=::::===:::
( ==============:=====:=:=:===::==========-=:IPGM MATRIX,tID ADD INDMDUAL IX,XI,XX INtO 4 PURPS (W,O,N,T)COMP 1=501+601+70LCOI{P 2=502*602+702COMP 3=503+603+703COMP 4=504+604+704ouT 1,401ovT 2,4O2oui i,ao:our 4,404G =========:===:-=====::=::====::$ ================:================================================---$ (5) Convert 2O1O district level matrj.ces to 201 zonal leve1.Q ===-===============================g================================( ================================*PGM MATCON 401,901*ID HBW EXTERNAL DISTRICT TO ZONE CONVERSIONKEEP L4-242IPAD HBWSPLIT. DAT$*PGM MATCON 402,801*ID HBO EXTERNAL DISTRICT TO ZONE CONVERSIONKEEP L4-242I,OAD HBOSPLIT. DAT$*PGM MATCON 4O3,741*ID NHB EXTERNAL DISTRICT TO ZONE CONVERSIONKEEP L4-242IPAD NHBSPLIT. DATI ------*PGM MATCON 404,601*ID TRUCK EXTSRNAL DISTRICT TO ZONE CONVERSIONKEEP 14-242LOAD TRKSPLIT.DAT
A-37
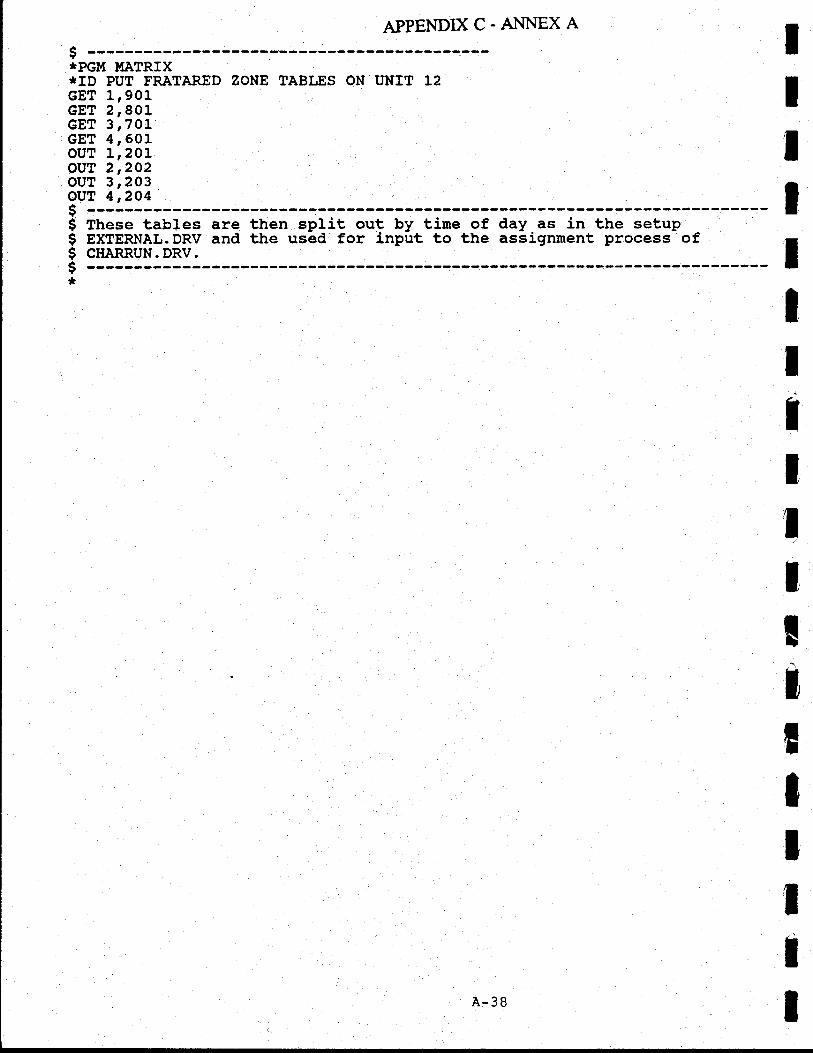
APPENDIX C. AI.{NEX A
$ ------*PGM MATRIX*ID PUT FRATARED ZONE TABLES ON T'NIT L2GET 1,901-GET 2r801GET 3 ,7OLGET 4rSOrouT 1,zOLouT 2,2O2ouT 3',203o.uT 4,2O4$ ------$ These tables are then split out by tine of day as in the setupI EXTERNAL.DRV and the used for input to the assigrnment process of$ CHARRUN. DRV.I ------*
tIIIIIIIIIJ
IIIIIIIIA-38
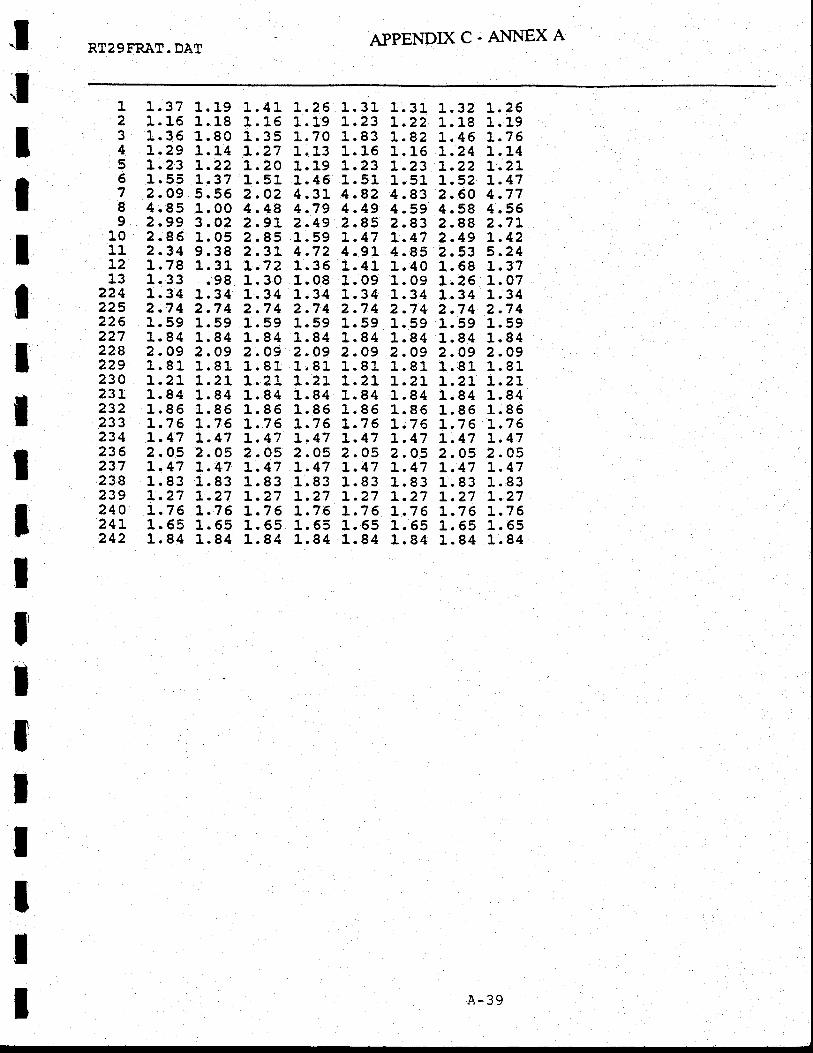
APPENDX C. AI'{NEX ART2gFRAT. DAT
tIItIIttI1
IIIIIII
1 L.372 1.163 1.364 t.295 t.236 1.557 2.098 4.959 2.gg
10 2.8611 2.3412 1.7813 1.33
224 1.34225 2.7 4226 1.59227 t.84228 2.O9229 1.81230 1.21231 1.84232 1.86233 L.7 6234 1.47236 2.05237 L.47238 1.83239 t.27240 L.7 624L 1.65242 1.84
1.19 1.411.18 1.161.80 1.351.14 t.27L.22 1.20L.37 1.515.56 2.O21.00 4.483.02 2.9L1.05 2.859.38 2.3L1.31, t.72.98 1.30
1.34 t.342.74 2.741.59 1.591.84 1.842.O9 2.491.81 1.811.21 L.2L1,84 1.841.86 1.86I.76 L.76I.47 L.472.O5 2.O5\.47 t.471.83 1.83L.27 L.27t.76 t.761.65 1. 651.84 1.84
I.26 1. 311 . 19 L.231.70 1.831.13 1.161.19 L.231.45 1.514.31 4.824 .79 4 .492.49 2.851.59 L.474.72 4.911.36 1.411.08 1.091.34 1.342.74 2.741.59 1.591.84 1.842.O9 2.O91.81 1.911.21 L.2t1.84 1.841.86 1.85L.76 L.76L.47 L.472.O5 2.O5t.47 L.471.83 1.83t.27 L.27L.76 t.761.65 L.551.84 1.84
1. 31 L.32 L.zbL.22 1. 18 1. 191.82 1.46 1.761.15 t.24 1.14L.23 L.22 1.211.51 L.52 1.474.83 2.60 4.774.59 4.58 4.562.83 2.88 2.7LL.47 2.49 1.424.85 2.53 5.241.40 1.68 r.371. 09 L.26 1. 071.34 1.34 L.342.74 2.74 2.741.59 1.59 1.591.84 1.84 1.842.O9 2.09 2.O91.81 1.81 1.811.21 L.zL t.z\1.84 1.84 1.841.86 1.86 1.85t.76 L.76 L.76L.47 L.47 L.472.05 2.05 2.051.47 L.47 L.471.83 1.83 1.831.27 L.27 L.27L.76 t.76 1.761.65 1.65 1.651.84 1.84 1.84
A-39
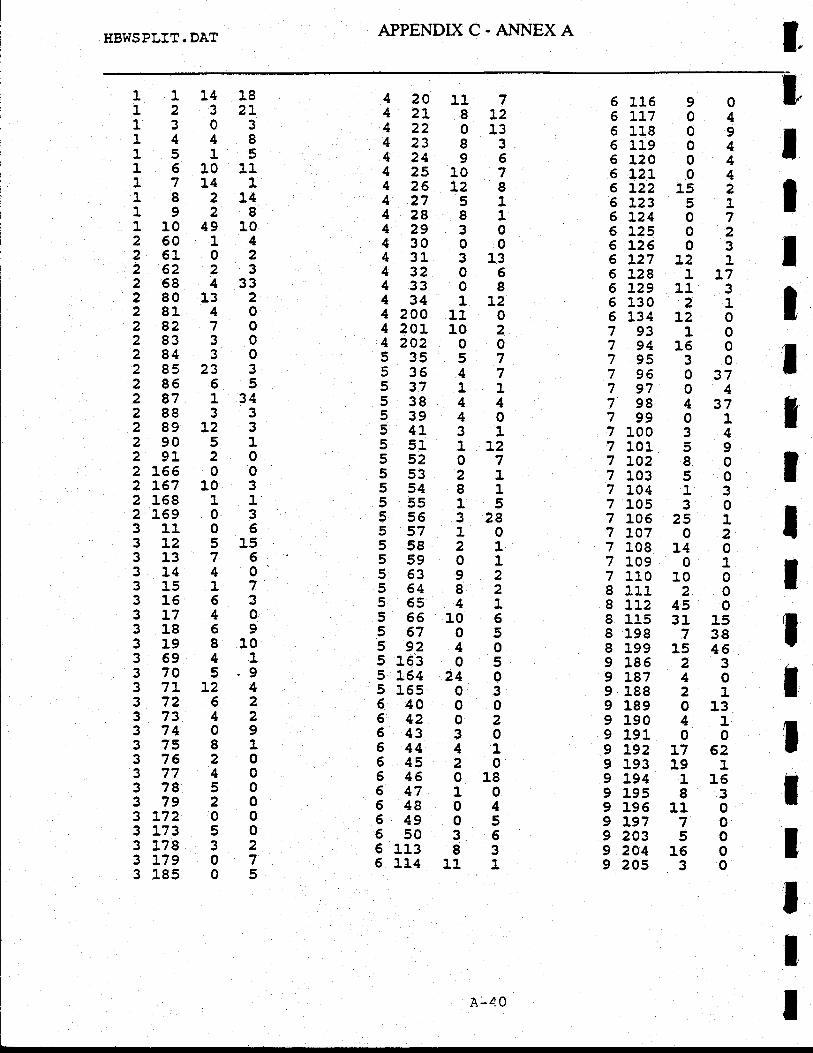
APPENDIX C. ANNEX A IHBWSPLIT. DAT
IItII3,
tIIIIIIIIII
11 78120138396
107].,285181300031306o81L2
11. 0102005747114440311L207218115328102t,01928241
105o54005
2400300023041200181004o53683
11 1
5116 9 06LL7 0 46118 0 96 119 0 46L20 0 46t2L 0 46L22 1s 26]',23 5 16]24 0 76L25 0 25L26 0 35t27 L2 16:,,28 1 176129 11 35130 2 16t34 L2 0793 1o7941607953079603779704798437799017 100 3 47 101 5 97t02 8 07 103 5 07 104 1 37 105 3 07 106 25 17to7 0 27 t08 14 07 109 0 17 110 10 08 111 2 .O8112 45 08 115 31 158198 7 388 199 15 469185 2 39187 4 09 188 2 19 189 0 139190 4 19191 0 09 L92 L7 629193 19 19 194 1 t69 195 8 39196 1t O9L97 7 09203 5 09204 16 09205 3 0
42042L4224234244254264274284294 3043L4324 334344 20A4 2014 2025355 365375385 39541551552553554555556s57558559563564565565567s925 1635 1545 1656406426436446455466475486495506 1135 114
I1
3I5114I042332o000J5.*
331003136560'7309o1942291oooo00275
11l.41231301441511610L71418219211049260 1261 0262226842 80 13281 4282728332843285232855287 12883289L22905291 22 166 02 J.67 1.02 158 12 159 0311 03L2531373144315 131563L743186319836943 70 537Lt2372637343 74 037583 76 23774378537923l.72 03173 53178 33t79 03185 0
t
2
1
1
1
3
3
1
1
A-4 0
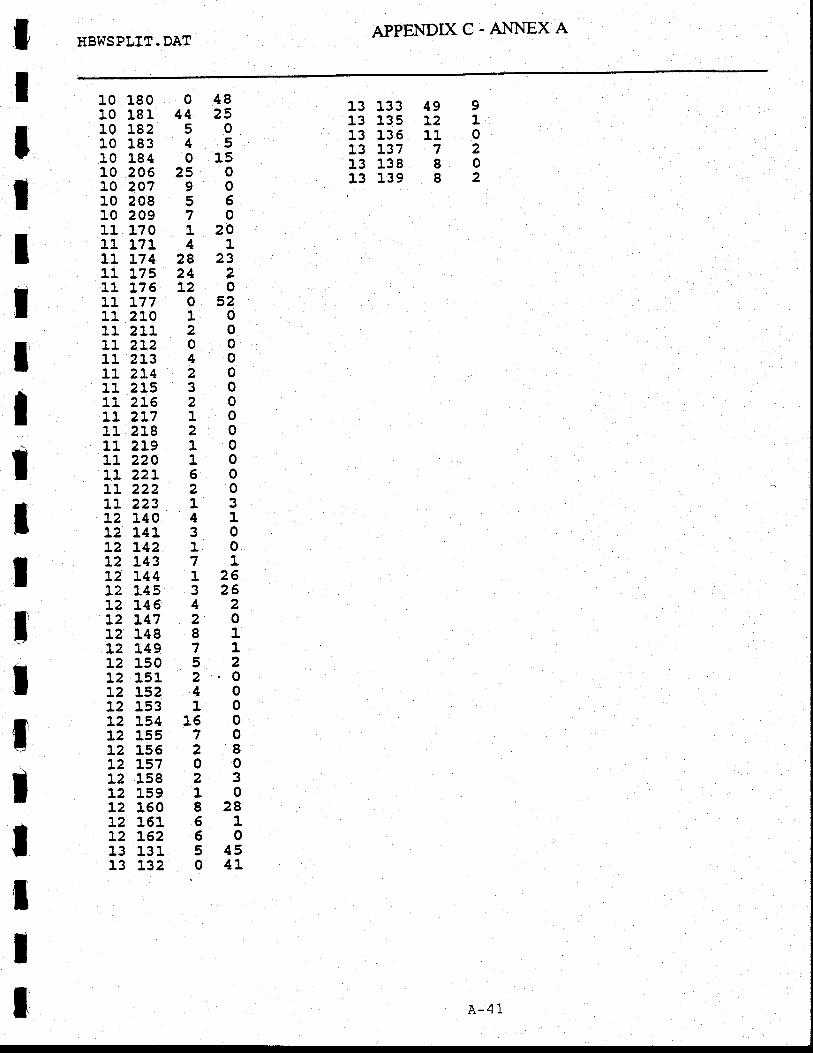
T APPENDIXC-AI{NEXAHBWSPLIT. DAT
499L2 111 0728082
0 4844 2550450 1,5
25090557012041
28 23242],'2005210200040203020102010105020134130Lo7L1263264220817152204010
15070280023108286160545041
IIIIIT
ItT
ttttIIIIt
13 13313 13513 13613 13713 13813 1,39
10 18010 18110 18210 18310 18410 20610 2A7t0 208t0 209t1 17011 17111 t7411 17511 t7611 t7711 21011 21111 2L211 2L311 21411 21511 215Ll 2].711 21811 21911 22011 22].tt 222ll 223t2 140t2 141t2 t42t2 143t2 t44t2 145t2 14612 147t2 148L2 149t2 150t2 151L2 t52L2 153L2 154L2 155t2 15612 157L2 158t2 159L2 160L2 151L2 L6213 13113 L32
a-41
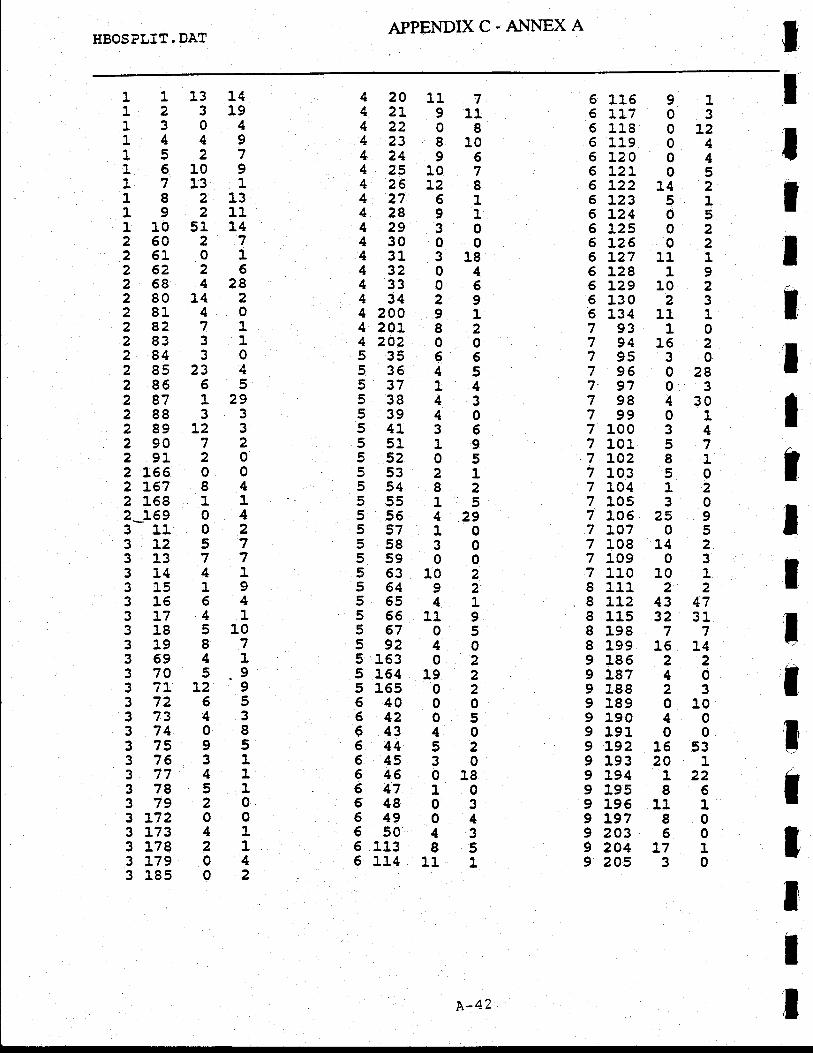
APPENDIX C. A}.iNEX AT{BOSPLIT. DAT
IItIIIIJIIltT
IIIIl
42011742L9114220842381042496425107426].'28427614289142930430004 3t 3 18432044 33 0 5434294 200 9 14 201 8 242A2 0 0s 35 6 65 35 4 5537t45384353940541 35551 19552055532155482555 15555429557 1055830559005631025649255541s5611956705592405L63 0 25L64 19 25L65 0 26400064205643406445254530646018647 106480354904650436113 I 55 1t,4 11 1
11131412319130414491527161091713 1182131921111051]-426027251 0126226268428280142281 402827128331284302852342866528712928833289].,232907229L202 156 0 02L67 I 42 t68 1 12_169 0 4311 02312573137731441315 19316643]-74131851031987369413 70 5 .937].L2937265373'433 74 0 8375953 76 3 13774137851379203L72 0 03173 4 1317q 2 13L79 0 43185 0 2
5116 9 16117 0 35118 0 t25119 0 46L20 0 45L21 0 56L22 14 26t23 5 151-24 0 56t25 0 26L26 0 26L27 1t 16L28 1 96L29 10 26130 2 36 134 11 17 93 1 07941627953079602879703798430799017 100 3 47 101 5 7.7 102 I 17 103 5 07 104 1 27 105 3 07 106 25 97ta1 0 57 108 14 27 109 0 37110 10 18111 2 2
,8L].2 43 478 115 32 318198 7 78 199 15 149186 2 29 187 4 09 188 2 39 189 0 109 190 4 09 191 0 09 L92 16 539 193 20 19 194 1 229 195 I 69 196 11 19197 8 09203 6 09204 L7 19245 3 0
A-42
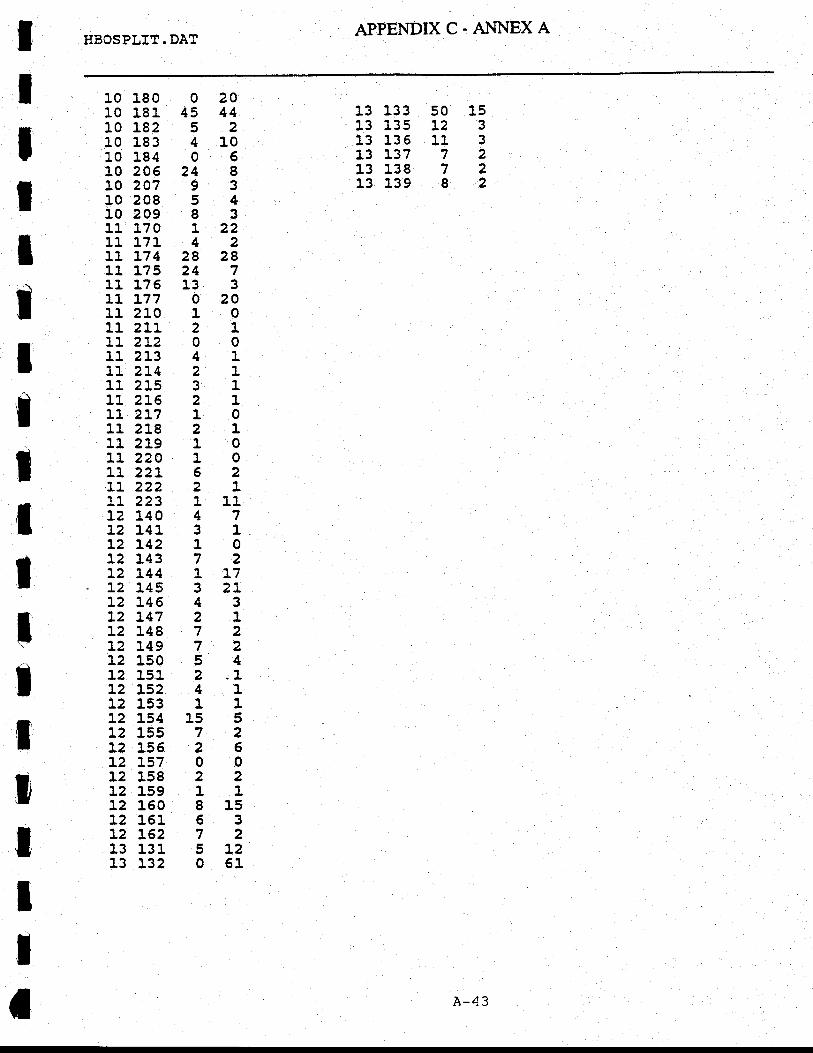
t APFENDIX C. A}.INEX AHBOSPLIT. DAT
50 15L2311 3727282
02445 445241006
24893548312242
28 28247133o201021004121312l1021101062211 t1473110721:l_7J ZL43217272542 .t,41L1
155722600221181553725L2061
IIIIIIIItttttIj
III
13 13313 1.3 s13 13513 13713 13813 139
10 18010 18110 18210 18310 18410 20610 20710 20810 20911 l.7011 L7L11 L7411 1.7511 L7611 L77t1 21011 21111 2L211 21311 21411 21511 2t611 2L711 21811 219Lt 220LL 22:].'rr z4z11 22312 140t2 141L2 L42t2 L43t2 L44t2 145L2 145L2 L47t2 148L2 149L2 150t2 151L2 15212 153t2 154L2 155L2 155L2 L57L2 158J-2 159t2 160L2 161L2 t6213 t 3113 132
A-43
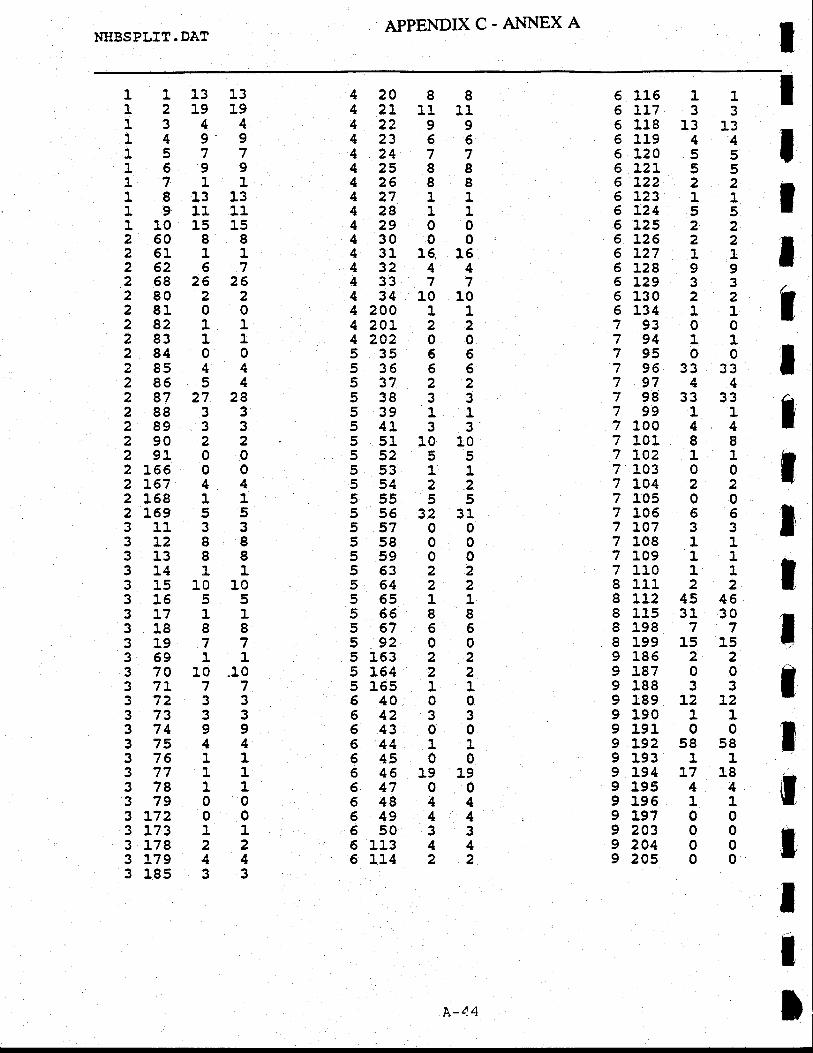
APPENDIXC-AI{NEXA IMIBSPLIT. DAT
IIIt3
IIt
tIttrt
4208842]-11114229942366424774258842688427 11428 11429004 30 0 04 31 15, 16432444 33 7 743410104 200 1 14 201 2 24202 0 0535665 35 6 65372253s33539 115 41 3 3551101055255553 11554225555555632315570055800559005632256422565 115668856766592005153 2 25164 2 25:.65 1 1540006423354300644 1t645006461919547005484464944650336113 4 46 114 2 2
1113131219L9134414991577169917111813131911L].110151526088251 1126267268262628022281 00282 11283 112840028544285542872728288332893329022291 002 155 0 02].67 4 42 t58 1 12t69 5 5311 333L28831388314 113151010316553t7 113188831977369 113 70 10.1037].7737233373333 74 9 9375443 76 1 L377 11378 11379003]-72 0 03173 1 13L78 2 23L79 4 43185 3 3
6 115 1 16117 3 35 118 13 136 119 4 46 120 5 56LzL 5 s6L22 2 26L23 1 16L24 5 55125 2 261'26 2 25L27 1 16 128 9 96L29 3 36130 2 26 134 1 179300794 11795007 96 33 33797447983333799 117 100 4 47 101 8 87 102 1 17 103 0 07 104 2 27 105 0 07 106 6 67 107 3 37 108 1 17 109 1 17 110 1 18111 2 28 112 45 46I 115 31 308198 7 78 199 15 159 186 2 29 187 0 09 188 3 39 189 A2 L29 190 1 19191 0 09 L92 58 589193 1 19 194 17 189 195 4 49196 1 19L97 0 09203 0 09204 0 09 205 0 0
tI
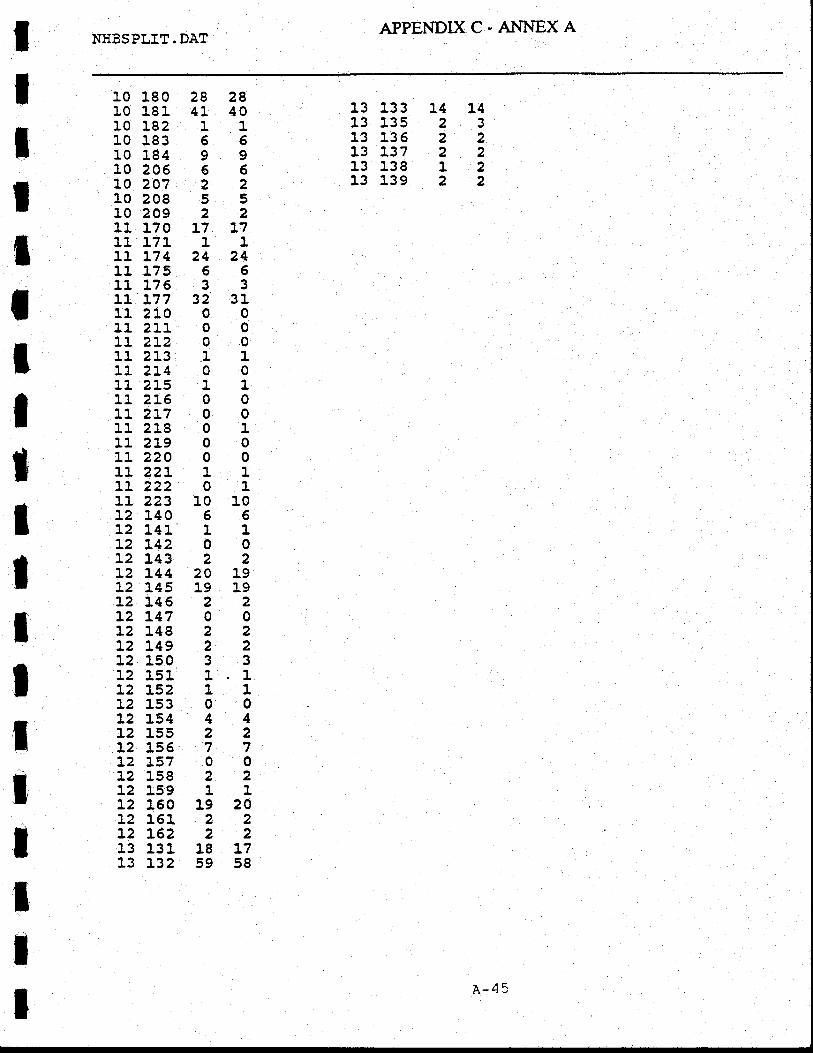
TAPPENDIX C. AI{NEX A
NHBSPLIT. DAT
14 L42322221222
13 133L3 13513 13613 L3713 13813 139
28 2841 401166oo56225522
t7 t711
24 246533
32 3100000011001100000100001101
10 1056110022
20 191A 1q2200222233L11100442277002211
19 202222
L8 t759 58
IIIt
IItIIIIttlIII
10 18010 18110 18210 18310 18410 20610 20710 20810 20911 17011 17111 L7411 L751L L76LI L7711 21011 21111 2L211 21311 2L411 z]-s11 2L611 2L711 21811 2L911 220tt 22l.11 22211 223t2 140t2 141t2 L42L2 143L2 1-44L2 145L2 146t2 147L2 14812 x49t2 150t2 151L2 152L2 153t2 154L2 15512 15512 157t2 15812 159t2 160t2 16112 L6213 13113 L32
A-4 5
APPENDIX C. ANNEX A
ALTERNATI\E ANALYSIS
(RUNALTSJDRV)
A-46
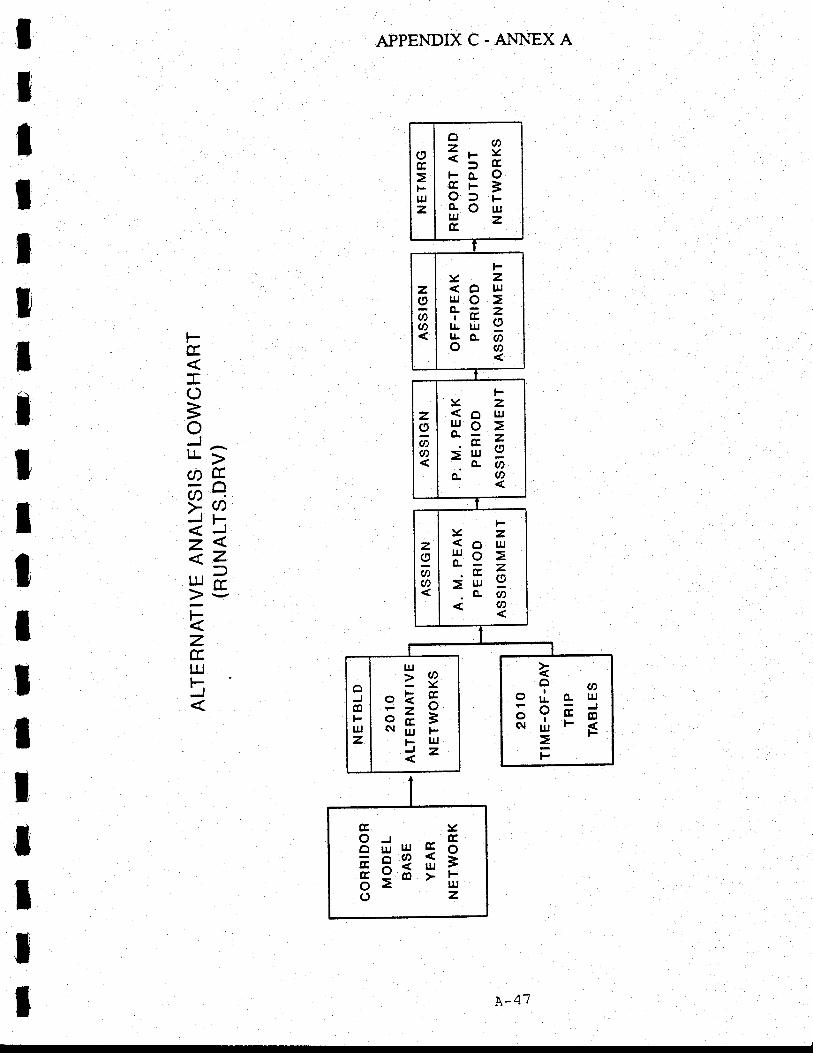
APPENDIXC.A}INEXA
l-
()
=oJ^rJ- >atr.tn-.>aJF.<Jz<<zw1>3EzllJl-
IIIItItItIIIT
ltIIT
t
9o:: E55:aO ur
Hz
o
IIJz
FYZ<o uJuJoo-= zrr.lu Yrro- aOa
zg@o
Fvz<o uJ
Pojil g.r @o.O
z(9
aU)
:<z<o uJl^u oE-=
FItB>uJ:.o- u)
zo6a
e?oono.urseFdNdFg
tr
:eok xHE
=huJiz
oc0
ltlz
E:<
ExufrgH=,'
l-47

$ ------$ U.S. 29 Corridor StudY.g 2oLo Alternative AssignmentsS ------ ------:-$ tf,is setups runs 4 iteration, incremental assignments- by tine of day$ for tne firture year blpass alternatives as well as.the expresswayS ifiernative. Tha alteinatives and their prq€]I-designation.are-as$ iottows: Expressway (8XPS), ALternative e (Atrg), Alternallvg_6P ALSB),$ aft.rnative-7 (AtT?); Alternative 7A (At?A).,_Alternative 10 (ALL0),$ Alternative 11'(ALL1), and Alternative 12 (AL12).$i nacfr alternative assignment is actuallV th{ee_separate assignuents of$ [fr. a.m. peak period, p:ln. peak- periodl . and off-peak period. The threei assignmenl per-iods are-then-eonbi.ned into a daily assignment.$I f1 addition to the assignments, a nunber of turning- movements areg requests. Turning movemSnt rep6rts will qpp?gf in tne output print filei i",i-there will b5 an ASCII file generated-with turning-movements- The* aSCff file name is xxxx2lt.dat in tne forrnat Anode-Bnode-Cnode-Volume.$$ ffr. rninutp utility comnand tfCHcPREFrr is used extensively in this qul-.$ inis- Eom,Lnd chanies the prefix on _the MINUTP driver screen during theg batch run. This fresenreS the prefix convention rnentioned above.$$ =================-==================================:=:=========:===:===
iiiernative. ThE alteliratives and their prefix designation are asioiiows: Expressway (8XPS), ALternative 6 .(ALT!) , Alternative 68 ALSB),aiiernative'7 (ALT?) ; Altbinative 7A (AL7A), Alternative 10 (ALL0) ,Al-ternative 11 (ALLl), and Alternative 12 (AL12).
Each alternative assignment is actually three separate assignuents. of II[e--alm. peaf period, p.h. peak- periodl . and off-peak period. The three
::=::ffI""::'::: :::J:::"::::"::i::"": ::::l;=::il""1" "," Irequests. Turning movern6nt rep6rts will qpp?g-r in tne output print filesln,i-tnere will b5 an ASCII file generated-with turning movements._ The 1JaSCff file name is xxxx2lt.dat ln tne forrnat Anode-Bnode-Cnode-Volume. f
APPENDIX C. A}.INEX A- J|-\-\E.t A I
-------:Program name: RUNALTS-DRV---- 7 /L3/8g -- JU.S. 29 Corridor StudY
2oLo alternaiive-aisignnents rlThis setups runs 4 iteration_ incremental assiglrnents- by tine 9f_9.y
rfor the firture year blpass alternatlvgs as well-as.the. expressway r
I$ ====-=====:-========= EXPRESSWAY ALTERNATM ===================:=======Q ==============-========E-=======================================:=::====$ -- CHANGE MINUTP PREFIX TO EXPS$> CHGPREF EXPS
'IPGM ASSIGN EXPS20. DAT$ ------ ASSTGN AM PEAK HOUR TRIPS$ 4-ITERATION INCREMENTAL ASSIGNI4ENTPENF EXPPEN.DAT*ID ASSIGN A}'I EXPRESSWAY
'IUNIT l4=AlrtFt]14 . DATPAR PCTADT=50 , DAMP=L0O , BASETIME=IMATI=401( =========================-=========================:========i ;;;il"- litt.ty turn movement file for follow1lg 1o{es'sgl, r=lz 6,334,3t3 ,373 ,376,383,386,390 ,393 ,411, !19'21?,543sEL T=549', 606,705,728,73O,735,'7 40 t745,7 49 1754,759,7 6l.,795$ New alternatives.snl t=aa8, 543, 583, 6oO, 5oL, 602, 603, 604,99!, 99q, 607, 509,610' 611'SEL T=51-2| 6J,3' 614.' 6l-5' 6L6' 6L7, 6l-8, 62l..,785,8L4$ Expressway alternative.igt, i=t87,3bO, 695, 698, 699,728,730,7 44,74?,7-!9,7 49,753SEL T=755',756,794'9A9,9L6,9L8,92O,921,922,923'960$ ===================:===============PERC 20 ,2O ,2O ,40THET OrOrO,0REPO 5$-------$-------*PGM ASSIGN 21$- ------ ASSIGN pM PEAK HoUR TRIPq ONTo AI.{ PEAK ASSIGNMENT
$ 4-rrERATroN TNcREMENTAL ASSTcNMENTi:p asslcN PM EXPRESSwAYPENF EXPPMPEN.DAT*UNIT L4=PMFU14.DATPAR PCTADT=6 0, DAI"IP=100, BASETIME=I-I1ATI=40L$ ==========================::================:===============$ Produce binary turn movement file for fo119w1!9 l99es.sgl r=gz 6,334,353 ,373,3761 383 r 386,390 ,393,111, ?19 ,1!? '543sEL T=54 g't 606',705,728 t73A,735,7 40,7 45,7 49,754,759 t761,795$ New alt6rnatives.
tIItIt
T
IA-4 B
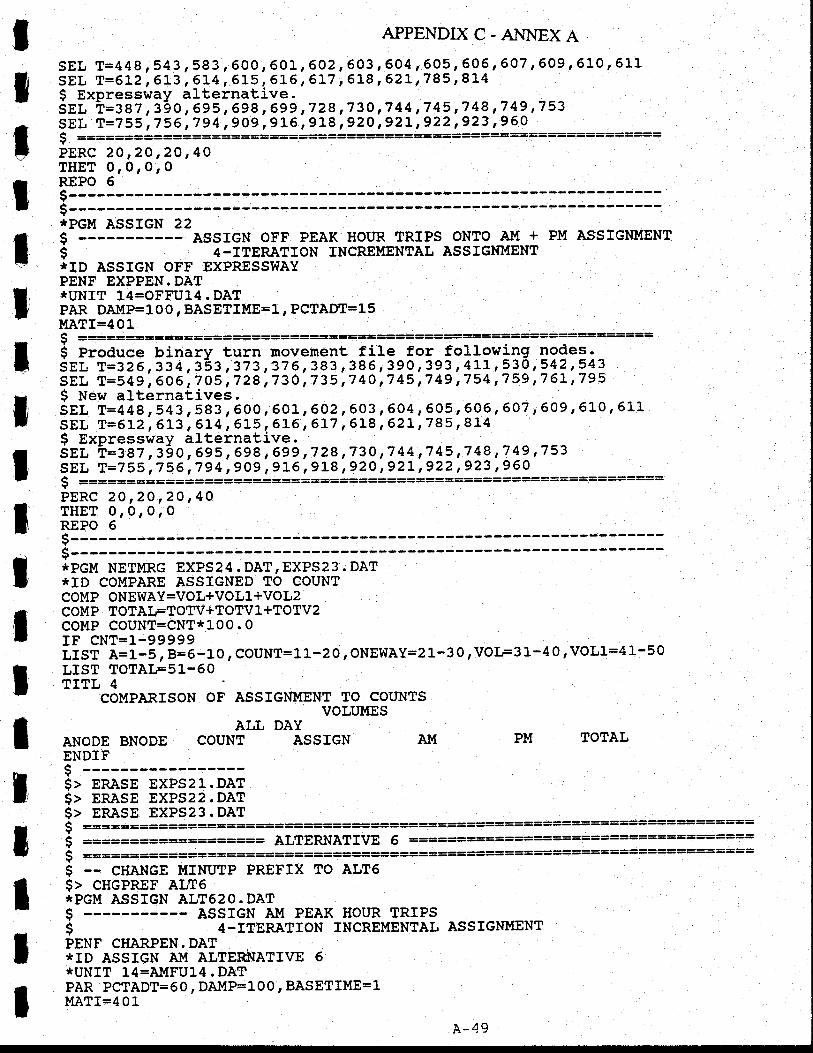
IlT
IIttttIttT
IIItII
APPENDIXC-ANNEXA
SEL T=4 48,5431 583,6OOr 5O1 ,602,603,604 | 605r 605 '6A7 '609,610' 6Ll
SEL T=6L2 ,6L3 ' 6L4, 5L5, 6l-6 ' 617 r 6l-8 ' 62]-'785 ,8I4$ Expressway alternative.SEL t=387 ,390,695 '698 '599,728 '73O,744,745 '749,749 '753SEL T=755't756-'794 ,9o9 '9L6r
918 ,92O '92L '922,923 r 960
PERC 2A ,20,2A ,40THET OrOrOrOREPO 69-------$-------ipeu ASsrcN 22$ ------ ASSIGN OFF PEAK HOLR TRIPS ONTO AM + PM ASSTGNMENT
9 A-ITERATION INCREMENTAL ASSIGNMENT
'tID ASSIGN OFF EXPRESSWAYPENF EXPPEN.DAT;unrr-ie=oFrura. DATPAR DAUP=1O0 , eaSUflI'{E=l, PCTADT=ISl1lATI=401C ------ ---::::- -============::==::===:$ produce binary turn movement file for fo119w1!g lodes.sEL T=326,334, 353,373,3'76,383r386,390,393,411,!19,11?,MsEL T=549 ; 606,705,728,730,735 t7 4CI,7 45,749,754,759,7 6J-'795$ llew alternatives.SEL T=44 8, 543, 583, 5OO, 601, 6A2, 603' 604'505, 606, 6A7, 6Q9, 6i.0, 6LLSEL T=5L2 ,673 ,6L4, 6L5 ,6L6 ,6L7, 618, 62L
''785 r 814$ Expressway alternative.sgL t=ra 7 ,3'go-, egs ,69g '
699 t728 ,73o '7 44
'7 45
'7 48 ,7 49
'753SEL T=75 5',756 ,794, 909 '91-6 r 918
'92O ,92]-'922 ,923 ,960
i ============:==::======:==========::=======PERC 20 ,2O t2O ,40THET 0r0r0r0REPO 69---------------$_______ ----jr-o?IPGM NETIIRG EXPS24 . DAT,EXPS23 . DAT
'hID COMPARE ASSIGNED TO COUNTCOMP ONEWAY=VOL+VOL1+VOL2COMP TOTAIFTOTV+TOTVI+TOTV2COUP COUNT=CNT*L0O.OIF CNT=1.-99999irsr A=1-S , 8=6-L0 , couNT=] L-zo r oNEWAY=2L-30 , volF3 L-4 0, voll=4 1-50LIST TOTAIFSI-60TITL 4
COMPARISON OF ASSTGN}4ENT TO COUNTSvoLIntEs
ALL DAYANODE BNODE COUNT ASSIGN AMENDIF; ------$> ERASE EXPS21.DAT$> ERASE EXPS22.DAT$> gnAsg ExPs23.DAT
PM TOTAL
$ =========:==:========== ==========================aALTERNATIVE $ ====*=-==================:=:-=-:====
$ ========:==========$ -- CHANGE I'{INUTP PREFIX TO ALTS$> CHGPREF ALT6'IPGM ASSIGN ALT52O. DAT$ --- ASSTGN AI'{ PEAK HOUR TRIPS$ 4-ITERATION TNCREMENTALPENF CHARPEN.DAT*ID ASSIGN AI{ ALTER$IATIVE 5
'IUNIT 14=A}IFU14. DAfPAR PCTADT=60 , DAI!P=LOO , BASETIME=IIUIATI=4 0l-
ASSIGNMENT
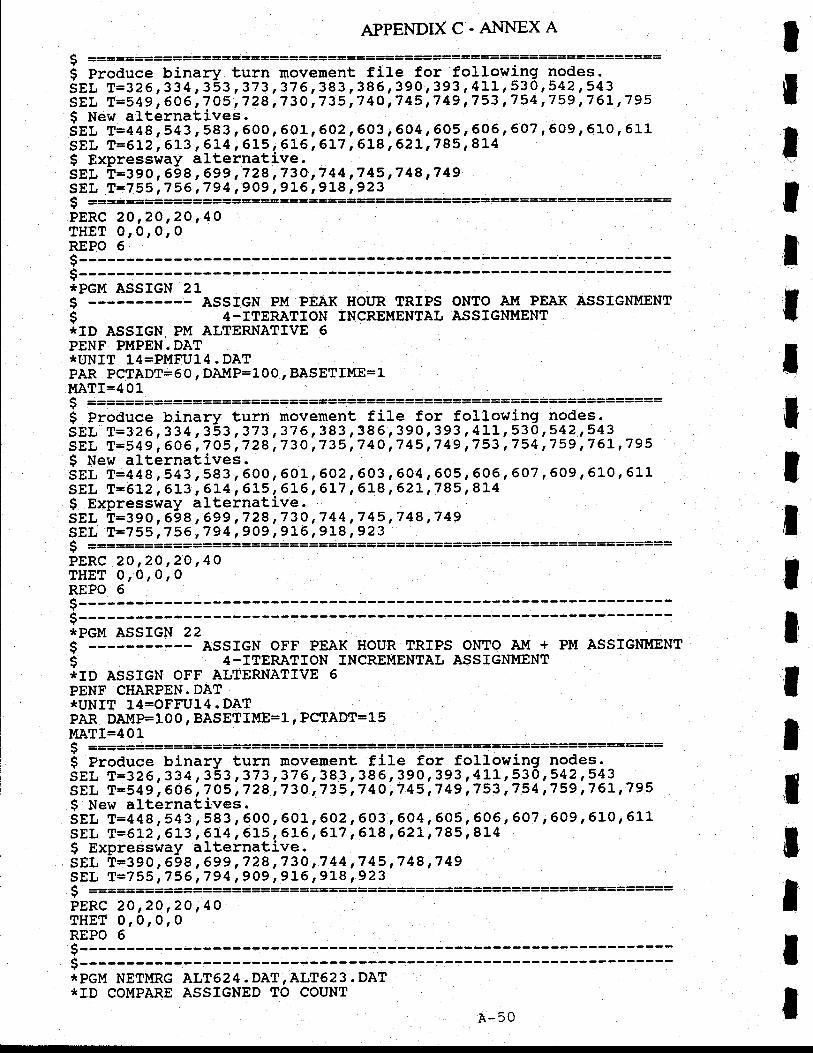
APPENDIXC.ANNEXA
$ ===============-==========================:::===========::==$ proauce binary turn movement file for following nodes'.SEL T=32 6,334
'353 ,373 ,37 6 ' 383
' 385 r 390 r 393 r 411, 530
'542 ,543SEL T=54 9, 606 ! 7. 05''I 28,7 30'7 35, 7 40 t7 45,7 49'7 53' 7 54' 7 59''7 6]-,7 95I New alternatives.SEL T=44 8, 543, 583, 600, 50L' 602' 603' 604' 605 | 506 | 607, 609' 610' 6l-1SEL T=612, 6]-3,614, 515' 6L6,6L7, 618,62L t785'8L4$ Expresshtay alternative.SEL T=39o,698
'699 t728,73o '744 1745,748 1749SEL T=755,756 '794 '9O9
,9L6 r 91,8 ,923
PERC 20,2O,20 ,40THET 0roror0REPO 6$-------$-------*PGM ASSIGN 21g_ ---.-.---;- ASSIGN P!,I PEAK HOUR TRIPS ONTO A}{ PEAK ASSIGNMENT$ 4-ITERATION INCREMENTAL ASSIGI{I'{8NT*ID ASSIGN PM ALTERNATIVE 6PENF PMPEN.DAT*UNfT 14=PMFU14.DATPAR PCTADT=60 , DAMP=100, BASETIME=LI1ATI=401a ------ ---:::::::::::---::::::::::::---) ==::--::::::--$ Produce binary turn movement file for following nodes.SEL T=326,334r353,373,3'76,383'386'390'393'ALL'530r5!2,?4? _ -SEL T=54 9, 606,7 05, 7 28'7 3A t7 35,7 40, 7 45'7 49,7 53, 7 54,7 59'7 61'7 95$ New alternatives.SEL T=44 8, 543, 583, 600, 6Ol-, 602'603' 604' 605' 606, 607, 609,610, 6LLSEL T=612, 6L3' 6J.4' 615' 6l.6,6L7, 618' 62I'785' 814$ Expressway alternative.SEL T=39O,698,699 '728,730,744 '745 t748,749SEL T=755,756 ,794 ,9O9 '916,918 ,923$ =============================:======PERC 20,20,20,40THET 0,0rOroREPO 6$-------$-------:IPGM ASSIGN 22$ ------ ASSIGN OFF PEAK HOUR TRIPS ONTO AM + PM ASSTGNIT{ENT
s 4-TTERATTON TNCREMENTAL ASSIGNMENT
'tID ASSIGN OFF ALTERNATM 6PENF CHARPEN.DAT,TUNIT l4=oFFUia. parPAR DAMP=100 , BASETIME=I, PCTADT=IS!IATI=401-$= ===============::=::-:=======::===-:==========$ Produce binary turn movement file for following nodes.SEL T=32 6,334, 353 i373 ,37 6 r 383
' 386, 390 ,393 , !I,\, !10'2t? ,17?
SEL T=54 9, 606,7 05,7 28,7 30,7 35'7 40'7 43,7 49 17 53,7 54,759'7 61,795I New alternatives.SEL T=44 8, 543' 583, 500, 601' 602' 603, 604, 505, 606' 607, 609, 610, 511SEL T=612 ,6L3 , 6]4, 61.5 ' 6L6 ,6L7 '
618 ,62L,785, 814$ Expressway alternative.SEL t=390 , 698 ,699 ,728 ,'73O '7
44 ,7 45 ,7 48 ,7 49SEL T=755,756,794 r9O9 ,916 r 9L8 ,923a
------) ======:::::-:-:::-----PERC 20 ,2O tzo ,40THET 0,0r0r 0REPO 6.$-------9-------*PGM NETMRG ALT624. DAT ,ALT623. DAT*I.D COMPARE ASSIGNED TO COUNT
II|.
tItItIIlIIIT
IIIIA-50
IIT
tIt
APPEI.TDIX C. ANNEX A
COMP ONEWAY=VOL+VOL1+VOL2COMP TOTALFTOTV+TOTV1+TOTV2COI.{P COUNT=CNT*IOO . O
IF CNT=I-99999LIST A=1-5, B=5- 1 0, COUNT=11-2 O r ONEWAY= 2I-30' VOIF3 L-4 0 r VOL1=4 1-50
rrilr:T:1_':_COI1IPARISON OF ASSIGNUENT TO COI'NTS
ALL DAY VOLUMES
AI{ODE BNODE COUNT ASSIGN AI'{ENDIFc ------s> ERASE ALT621.DAT$> ERASE Atf622.DAT$> ANRSE ALT623.DAT
=:=:===:==========================================================
Q =========:===:=:=::=:= ===================================
S -- CHANGE MINUTP PREFIX TO AL6B$> CHGPREF ALsB*PG}I ASSIGN AL6B2O.DAT$ --- ASSIGN AM PEAK HOUR TRIPS$ -ITERATION INCREUENTAL ASSIGNI{ENTPENF CHARPEN.DAT*ID ASSIGN AM ALTERNATIVE 68*ur.lrr l4=AltIFULa lpetPAR PCTADT=60, DAI{P=1-00
' BASETIME=1
lllATI=40L$ =====================::=====================:=======:=======$ Produce binary turn movement file fo5-followllg lgqes'snl r=:z 6 ,334, t-S: ,373 ,37 6, 383 , 386, 390 ,193 , !\\,:19' 27? '543SEL T=54g, eO g', 7 O5', 7 28', 7 3 0''735''7 40,7 45 | 7 49 t7 53, 7 54 | 7 59,7 6l t7 95
3"I'$=il::513:i;3iaoo, 601 ,602 ,oo3 , q91, q99, ggq ,6-97,6os, 610 ' 611
SEL T=61-2'' 6L3' 6L4, 615, 616' 6L7, 6L8' 62]-'785,814, 630$ Expressway alternative-SEL t=390, 698 ,699 t728 ,73O ,7 44 ,145 '7
48 ,'l49SEL T=755,756,794, 909'9]-6'9I8,923
t
$ New alternatives.Sgl t=a48r543r583, 600, 601,602,603, 604r605,6a6 |SEt T=612 '6L3,6!4 r 615
'6L6 t6L'l ,6L8,62Lr785 ,8L4 ', v4= , v-r t v*r
alternative.$ Expresshray alternative.SEL T=390, 698 t699 t728,73A,744,'745'748,749SEL T=390r 6SEL T=755 ,756 t,794 ,9O9 ,916,9L9 '923
PM TOTAL
===========================:==
607 ,609 r 610,611630
==========================
IIII
tt
3 ====:=:=============PERC 20,2O,2O ,40THET 0r0r0r0REPO 5s-------$-------*PGM ASSIGN 2Lg_;----- ASSIGN PM PEAK HOUR TRIPS ONTO AM PEAK ASSIGNMENT
$ 4-rrERATroN TNcREMENTAL ASSrcNI{ENTlbtrD ASSIGN PM ALTERNATM 68PENF PMPEN.DAT'IUNIT 14=PMFU14. DATPAR PCTADT=60, DAI{P=100 , BASETIME=I
$ ============================================================i proauce binary turn movement file for follgwlltg l99es'snr,-t=i26, 33 4,3b3 t373,37 6,383,386, 390,193, 1\\,:19, 2!?,543SEL T=54g',606',ZOS',728',73O',735''74O',745'''149,753 '754 '759 '76L'795
I$ ==========:=jib=======::==PERC 20 ,20 ,2'g ,40THET 0r 0,0r 0
A-51
APPENDIX C. A}INEX A
REPO 6s-------$-------ipct'l AssrGN 22$ --- ASSIGN OFF PEAK HOIIR TRIPS ONTO Al'l + PM ASSIGNMENT$ -rrERATroN TNcREMnNTAL AssrGNIllENTiro assrcN oFF ALTERNATTVE 68PENF C}TARPEN. DAT*UNfT 14=OFFU14.DATpan Oaf.lp=l0 O, BASETIME=I r PCTADT=15IILATI=4 01C =============:====::=::=====::==:=-==-=:======:=:-===:=5 proauce binary turn movement file for followllg !9qes.igt, t=le 6,334, 353,373,376, 383, 386, 199r19?,111,:19,2!?'543Snf, f=Sa g', 606', 7 O5l 7 28' 7 30, 7 35 r7 40' 7 45'7 49' 7 53' 7 54, 7 59, 7 6L, 7 95$ New alternatives.igl r=aa s,s43, s83, 6oo, 6o1, 602,Q0?, q91, q9!, 999, 6-97^, 609, 610' 611SEL T=612; 6L3-' 6L4' 615, 6L6,6L7'618, 62L t785'8L4, 630S Expresswav alternative.Sni- t=rgo, 5-98, 699,728'73o,744,7 45,7 48,7 49SEL T=755,756 ,794 ,9O9 ,9]-6 t9L8,923
IIttII
t
ItIt
tII
I
PERC 20 tzo ,20 | 40THET 0,0r0,0REPO 6s------- L-----or$-------*PGM NETMRG AL6B24, DAT,AL6B23. DAT*ID COMPARE ASSIGNED TO COUNTCOMP ONEWAY=VOL+VOL1+VOL2COMP TOTAIFTOTV+TOTVI-+TOTV2COMP COUNT=CNT*L0O.0IF CNT=1-99999irst A=1-5, B=G- 1 0 r couNT=lL-z 0 r oNEWAY=2 1-3 0, vorF3 l--4 0, VoLl-=4 1-5 0LIST TOTAIFSL-60TITL 4
COMPARISON OF ASSIGNI'{ENT TO COUNTSvoLUl,rEs
ALL DAYANODE BNODE COUNT ASSIGN AIIT
ENDIFS*> eRAsE AL6B21.DAT9> ERASE AL6B22.Di'T$> ERASE AL6B23.DATA ==============:=================================================:=====s ================== ALTERNATM I ================:================:===Y ---- -
PM TOTAL
$ =======================$ -- CHANGE MINUTP PREFIXS> CIIGPREF ALTT
TO ALTT
*PGM ASSIGN ALTT?O.DAT$ --- ASSIGN Al,I PEAK HOITR TRrPS$ 4-ITERATTON TNCREMENTAL ASSTGNUENTPENF CIARPEN. DAT
'tID ASSIGN A}rt ALTERNATM 7*UNIT 14=A!1FU14. DATPAR PCTADT=60 , DA!1P=100 , BASETfME=1!IATI=4015
-;==========================::=====-=======:===========:====
$ Produce binary turn movement file for fol-l9w1lg lgqesSgt t=gZ 6,334 r 3-Sl
'373 '376' 383 r 386' 390' 393 ,!\Lr 910 ,?!?,543
SEL T=54 g', 606'! 7, Os't 7 28] 7 30, 7 35' 7 4 O r7 45, 7 49, 7 53' 7 54' 7 59, 7 6L' 7 95I New alternatives.SgL t=aa 8,543, 583, 6OO, 601, 602,603, 604, 605' !05, 607' 609' 610, 61LSEL T=512, 6L3, 614, 6L5, 6L6'6L7, 518, 62)'785,8L4$ Expressway alternative.
A-52
T
IIIIt'ItIItItIT
ttT
T
APPENDIXC.A].{NEXA
SEL T=390,698, 699,728,73O'744 t745,749,7493EL T=755'756 t794,9O9,9L6r918,923$ ==========:==============================PERC 20 ,20 ,20 | 40IHET O,OrOr0REPO 69-------$-------ipcu ASsrcN 2LE-------:---- AssIGN PM PEAK HoI'R TRIPS ONTO AI{ PEAK ASSIGNMENT
$ 4-ITERATION INCREIIfENTAL ASSIGNI{ENTirn assrcN Plit ALTERNATTvE 7PENF PMPEN.DAT*ttNIT I =PMFU14. DATPAR PCTADT=60, DNIP=100 , BASETIME=IllLATI=401I ======:==:============:=====================-=======:==:====5 proauce binary turn movement file for followllg lgqes.ini-i;iia,,ai. i3g,373, 37 6, 381, 1s9, 1?9,?e.1, !\\, :19'2!?,?1?iel, r=sa g', 60 6', I os', 7 zg', 7 3 o', 7 35l 7 40, 7 45', 7 49, 7 53, 7 54, 7 59' 7 6L' 7 95
9 New alternatives3ni-i=aae , 5a s , 5es , 600 , 601, 60?, .693_ ,99!, 99q ,999 '
607, 60e , 6L0 ,6LLSEL T=5L2'' 6]..3',6!4 ,61-5 ' 6]-6 | 617, 618
' 62L t785 ,8r.4
8"i"8:ffi:eg'::5;:?35:;; o ,t +4 ,7 4s ,7 4s ,7 4sSEL T=755 '756 '794 '9O9 t9L6 '
9Lg ,923===*==-======:======$ ========:=====:=========:===
PERC 20,20,20,40THET O, il, O, O
REPO 6$-------s-------ipcu ASsrcN 22$ --- ASSIGN OFF PEAK HOUR TRIPS ONTO AM + PM ASSIGNI'{ENT
i A-rrERATroN TNcRIMENTAL ASSTGNMENT:tID ASSIGN OFF ALTERNATIVE 7PENF CHARPEN.DAT'IUNIT 14=OFFU14. DATPAR DN'IP=100, BASETIME=1, PCTADT=ISI[ATI=40L( =====================:======================================5 Produce binary turn movement file fof f"lll*ilg 199"::-igr r=126, 33 a ,lbt ,373 ,37 6 ,383 ,189,199,193 , !\\,219,2!?,?7?5iL i=-4g',aoe',1oe',728',73o't735',74o',745',749,753'754,759,'76t,'795$ New alternatives.igl t=aa B,s4l, 5ei, eoo, 6ol-, 602,603, 604,q9?, 60.6.' 5o7' 609' 5L0' 6rLSgL t=et2'' 673-' 6L4, 6L5, 6J-6' 6L7, 518, 62L,785, 814S Expressway alternative.inr,
-i=ig o , ebe ,699 ,729 ,730 ,7 41 ,7 45
'7 48 ,7 49
Sei i=zS 5',756',7g4',gog''gL6, gf e',923$ ======:=========:====:=============================== ======--=PERC 20 ,2O ,2O ,40THET 0,0r0r0REPO 5$-------$-------'IPGM NETMRG ALTT 24. DAT' AI'f,7 23. DAT*ID COI.IPARE ASSIGNED TO COIJNTCOMP ONEWAY=VOL+VOL1+VOL2COMP TOTAL=TOTV+TOWL+TOTV2COMP COLNT=CNT*LOO.OIF CNT=I-99999irsr A=1-5, 8=6-10, coUNT=1 1-2 o r oNEWAY= 2L-30, vorF3 L-4 0, vol,l=4 L-5 0LIST TOTAIF51-5Ottt"aS"rARrsoN
oF AssrcNMENr To couNrs
A-53
voLUI{EsALL DAY
COUNT ASSIGN
APPENDIX C. ANNEX A
PM TOTAL
ItIIIIIIII
AI'!A}IODE BNODEENDIFI$> ERASE ALTT21.DAT$> ERASE ALT722.DAT9> ERASE ALT723.DAT$ ================:====:::=$ ========:====:==== ALTERNATM 7A$ =======-===================S -- CH.LNGE MINUTP PREFIX TO$> CHGPREF ALTA
SEL T=612,6]-3 '6L4,615 ,6L6'6L7 '618 ,62I,785r814$ Expressway alternative.SEL t=390, 698 ,699 ,728 '73O ,7 44 ,7 45 ,7 48 ,7 49SEL T=755,756
'794 '9A9 ,9L6 r 918 t923
ALTA
*PGM ASSIGN ALTA2O.DAT$ ;---r-- ASSTGN At'{ PEAI( IIOUR TRrPS$ 4-TTERATION INCREMENTAL ASSTGNMENTPENF CHARPEN.DAT*ip aSSTGN AIII ALTERNATTVE 7A*UNIT 14-A}1FU14. DATPAR PCTADT=6 0, DAMP=IO 0, BASETII'IE=IIIATI=401.i :==:===:-=-===::=============:=:===================:=======:
$ Produce'binary turn movement file for following nodes.SELT=326,334,353'373,376,383,386'390,393,4\L'??9,?!?,9t3SEL T=54 9, 606,7 05, 7 28,7 30,735,7 40, 7 45,7 49,7 53,7 54,7 59,7 6]-, 7 95$ New alternatives.SEL T=448 r 543, 583' 600' 601, 602'603' 504, q05' 6oq, 607, 6A9, 61o r 5LLSEL T=612,6L3,6L4
' 615 '6L6,6L7 r 618 ,62I,785 '8L4$ Expressway alternative.
SEL T=390, 698 , 699 ,728 ,73O t7 44 ,7 45 ,7 48 ,7 49SEL T=755 t756 '794 '9O9 r 915,918 ,923$ ==========PERC 20,20 ,20 ,40THET 0,O,o, oREPO 6$------- --::::-:::::::::::::::--:::::::::::::-:$-------:tPGl! ASSIGN 2L$$ 4-ITERATTON INCREMENTAL ASSIGNI'{ENT*ID ASSIGN PM ALTERNATIVE 7APENF PMPEN.DAT*UNIT 14=PMFU14.DATPAR PCTADT=60 , OaUp=fOO
' BASETIME=I
lltATI=401j ====:===:============:===::=::===================:==:==$ Produce binary turn movement file for followllg 1o{es-5gl r=gz 6,334, 353,373,37 6, 383, 386, 390, 393 r411, ?10,?1?,543SEL T=54 9', 606, 7 05,7 28' 7 30, 7 35'7 4A | 7 45, 7 49 17 53 r7 54,7 59, 7 6L, 7 95I New alternatives.iEL r=aa g,s43, sg3, 600, 60L, 602, 603, 6a4, 605, 606, 607, 609, 5L0, 61L
IIItI$ ====== ===========-==============================
PERC 20,20,20 ,40THET O,O,Or0REPO 6$-------$-------*PGM ASSIGN 22g- ---I--::--- ASSTGN OrF PEAK HoUR TRIPS ONTo AM + PM ASSTGNI'{ENTs 4-rrERATroN TNcREMENTAL ASSTcNMENT*TD ASSIGN OFF ALTERNATIVE 7APENF CHARPEN.DAT
tt
A-54
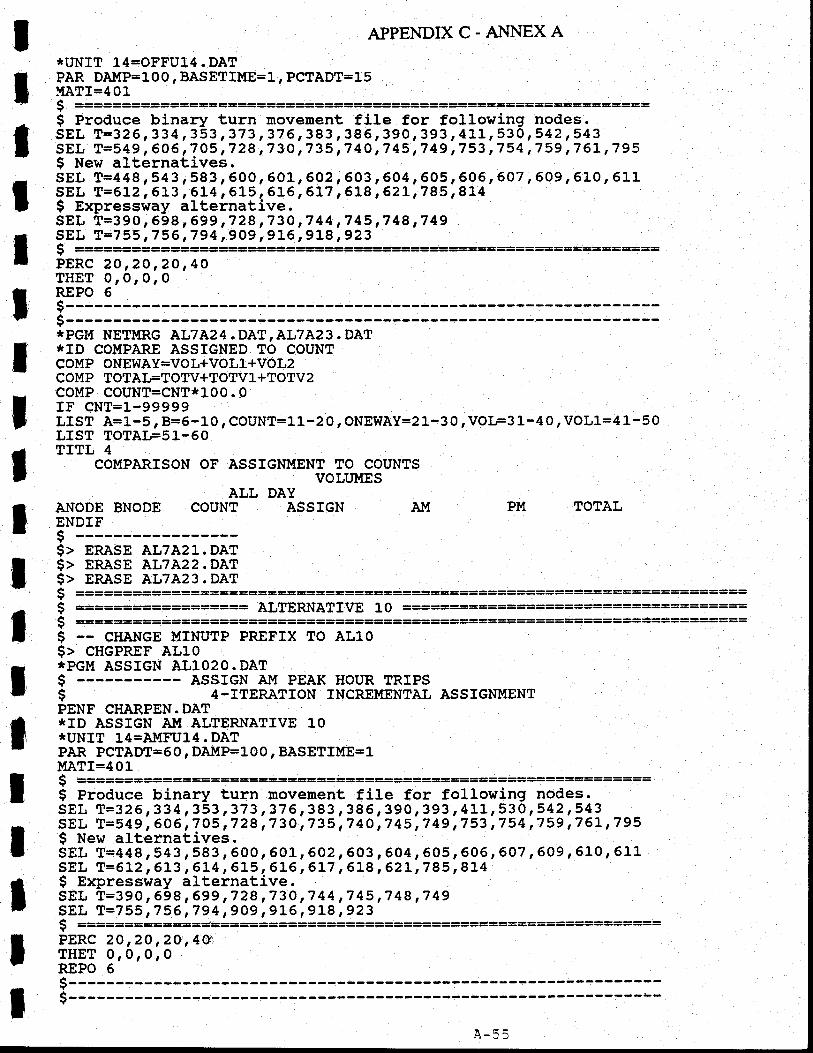
IIIII
tIIIIT
I
APPENDIX C. ANNEX A
'IUNIT 14=OFFU14. DATPAR DAI.!P=100, BASETIIIIE=1, PCTADT=15!{ATI=401
$ Produce binary turn movement file for following nodes.SEL T=32 6,334, 353,373,376, 383, 386, 390,393,411, 53O,542,543SEL T=54 9, 606,7 05,7 28,7 3a,7 35,7 40,'7 45,7 49,753,7 54'7 59,7 6L,7 95$ New alternatives.igi-i=aaa ;54t, sei, eoo, 601, 602, 603, 604,605, Go6, 5o7, 609, 610, 611SEL T=512,6L3 ,6L4,615r 6L6 ,6L7 r 518 t62]-,785,8L4$ Expressway alternative.sEL t=390 , 698 ,699 ,7 28 ,'7 30 ,7 44 ,7 45 ,7 48 ,7 49SEL T=755,756,794 t9A9 ,9L6 r 918 ,923c ------I ------PERC 20 ,20 ,20 ,40
lH35 0,0,0,0
-s::--:--s-------*PGI{ NETIIRG AL7A24. DAT ,AL7A23. DAT*ID COMPARE ASSTGNED TO COUNTCOI{P ONEWAY=VOL+VOL1+VOL2COMP TOTAIFTOW+TOTVI-+TOTV2COMP COUNT=CNT'I1,00 . 0IF CNT=I-gggggLIST A=1-5, 8=5-10, COUNT=11-2 0 r ONEWAY=2 1-3 O, VOIF3 1-4 0, VOL1=4 1-5 0LIST TOTAIFS].-60TITL 4
COMPARISON OF ASSIGNMENT TO COT'NTSVOLUI'{ES
DAYASSIGN AI{ P},I TOTAL
ALLANODE BNODE COUNTENDIF$ --------$> ERASE AL7A2r..DATS> ERASE AL7A22.DAT$> ERASE AL7A23.DAT$$ ALTERNATIVE !Q ====
9 -- CHANGE MINUTP PREFIX TO$> CHGPREF AL1O*PGM ASSTGN AL].O2O.DAT$ --- ASSTGN Ar{ PEAK$ 4-ITERATTONPENF CHARPEN. DATttID ASSfGN AI.{ ALTERNATM 10'TUNIT 14=AltFU14. DATPAR PCTADT=5O, DAI{P=L00, BASETIME=1!1ATI=40L
$ Produce binary turn movement file for follohring nodes.SEL T=32 6,334,353 ,373 ,376 r 383 r 385,390 ,393 ,411r 530 ,542,543SEL T=549, 606,7 05,728,73O,735,7 40,7 45 t1 49,753
"754,759,7 6l t795
$ New alternatives.SEL T=448, 543, 583, 600, 60L, 602, 603, 604,605, 505, 607, 6A9, 610, 511SE$SEDti$PERC 20,2O ,2O,44'THET or0r0roREPO 5
c-------
ALlO
HOT'R TRIPSINCREMENTAL ASSTGNMENT
tIIII
L T=612r613,6r.4r515, 516,6L7 r618,62L,785r814Expressway alternative.L t=390, 698,699,728,730,744,7 45,748,749L T=755 ,756 ,794 r 909 r 915, 918 ,923
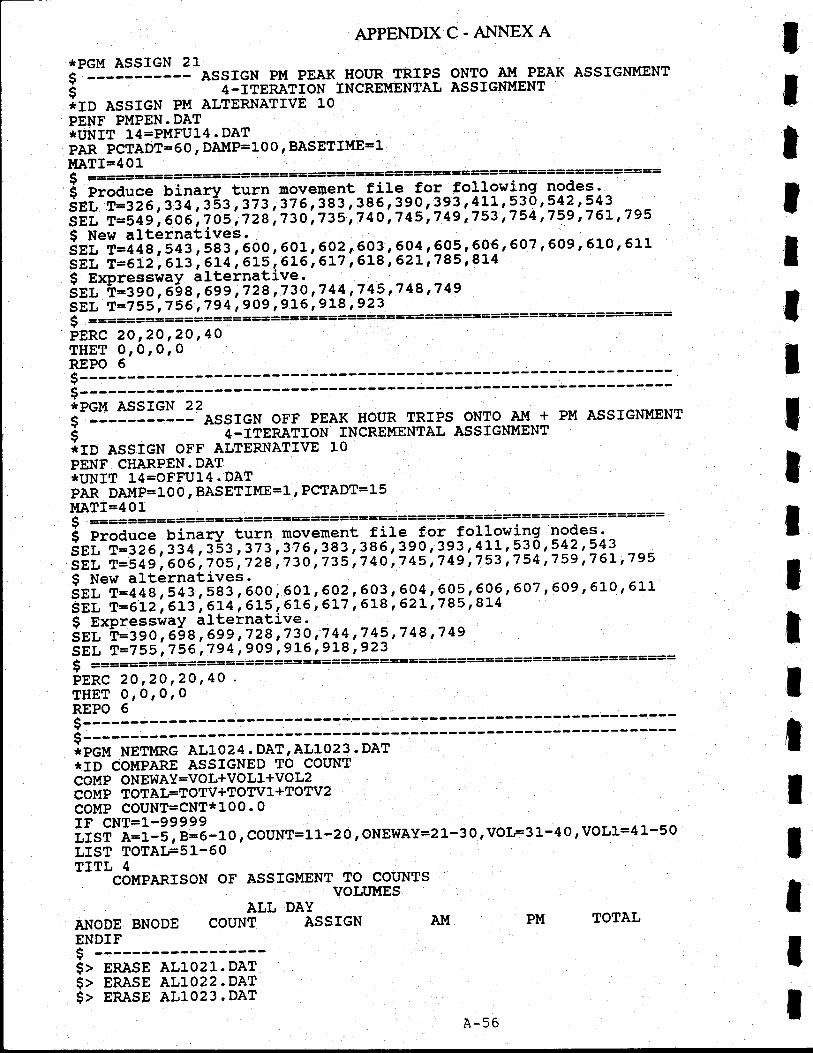
APPENDIX
'TPGM ASSIGN 2I$ --- ASSTGN PM PEAK HOUR IRrPS$ 4-rrERATroN TNcREMENTALito assrcN PM ALTERNATTVE 10psNr--F!.{FiH. bar*UNIT 14=PMFUL4.DATPAR PCTADT=5O , DAIIP=100
' BASETIME=I
}[,ATI=4013 ===-= ======:===============:==============::=======:==:====$ pr"a""e binary turn movement file for fol19w1!9 lgqes'Esi:Gii e,iia,tbz,373,17 9' 383, 1q9, 1?9,??3, 111, 119,242,543sti i=-a g', 6oG', 1 os', 7 2B','I 3o', 7 35l 7 40, 7 45, 7 49,7 53,7 54, 7 59' 7 6L' 7 95
I New alternativesini-i=ae 8, 54g, see, 600, 601, 6-9?' q91, 99!, 99!, 99q, 607, 6oe, 610' 5l-1S5i i=ef 2', 6L3', 6L4', 61-5, 6L6, 6L7, 518' 62L,785, 814$ Expressway alternative.sri--h=rgo, 648 ,6ss ,728 ,-!?9,7!!,7!2,7 4s ,7 4eSgl f=ZS5-,'756
'794 ,9O9 '9]-6 '
918 '923$ =======J========E=-==3===-=======-===:================:======Frnc 20,2o,2o,40THET 0r0,0r0REPO 6$:------$----------;----*PGM ASSIGN 229----AssIGNoFFPEAS_{9gl_TlTgsoNToAl4+PMASSIGNMENT$ A-ITERATION INCREMENTAL ASSIGNUENTirp assrcN oFF ALTERNATTvE 10PENF CHARPEN.DATluurr 14=oFFUt4.DATPAR DAMP=LOO
' BASETIME=L, PCTADT=15
I"IATI=401
C - AhINEX A
ONTO AII{ PEAK ASSTGNMENTASSIGNMENT
=-========================:=:-
ttItIItIIIIIItIIItI
( :=====-========g:====a========-=======
5 proauce binary turn movement file for follgwllg lgqes'inl-i=rz 6,334, e's3,373,37 6,383, 189, 199,)9.3,111, :19,?!?,543sEt i=-4 g', 606', I os', 7 28', 7 3 o', 7 35-, 7 4o', 7 45, 7 49, 7 53, 7 54 | 7 59' 7 6L | 7 95
$ New alternativesigi-i=aa 8 ,543, see , 500
' 601 ,60?, q91 ,69!,9q? ,999'607 '
609, 610 ' 5l-L
Sni i=g L2',513',6L4 ,6Ls ,6L6 ,6L7 ' 6LB ,621-'785 '8L4$ Expresshtay alternative.
iri h=rgo,6-98 ,699 ,728 ,73o ,7 4! ,7!? ,7 48 ,7 49SEl t=ZS5-,756'794,9o9,9L6'918,923$ =========:========= ===========================:===PERC 20 ,2O ,2O ,4O -
THET O,0r0roREPO 6
-cI------e-------vipcu NETMRG AL1024 . DAT,ALIo23. DAT
'rio cot'tpARE AsSTGNED To couNTCOMP ONEWAY=VOL+VOL1+VOL2COMP TOTAIFTOTV+TOTVI+TOTV2COMP COUNT=CNTIIIOO.0ii cnr=r-sg99eLIST A=1-5 , 8=5-10 , COUNT=I L-zO I ONEWAY= 2L'30 , VOIF3 1-4 O
' VOL1=4 1-50
LIST TOTAIFSl-60TITL 4
coMPARrsoN or Assrc*""tu33ufi3gNrs
ALL DAYAI{ODE BNODE COUNT ASSTGN AM
ENDIF$s>$>$>
ERASEERASEERASE
AL1O2].. DATALLO?2. DATAL1O23. DAT
A- 56
PM TOTAL
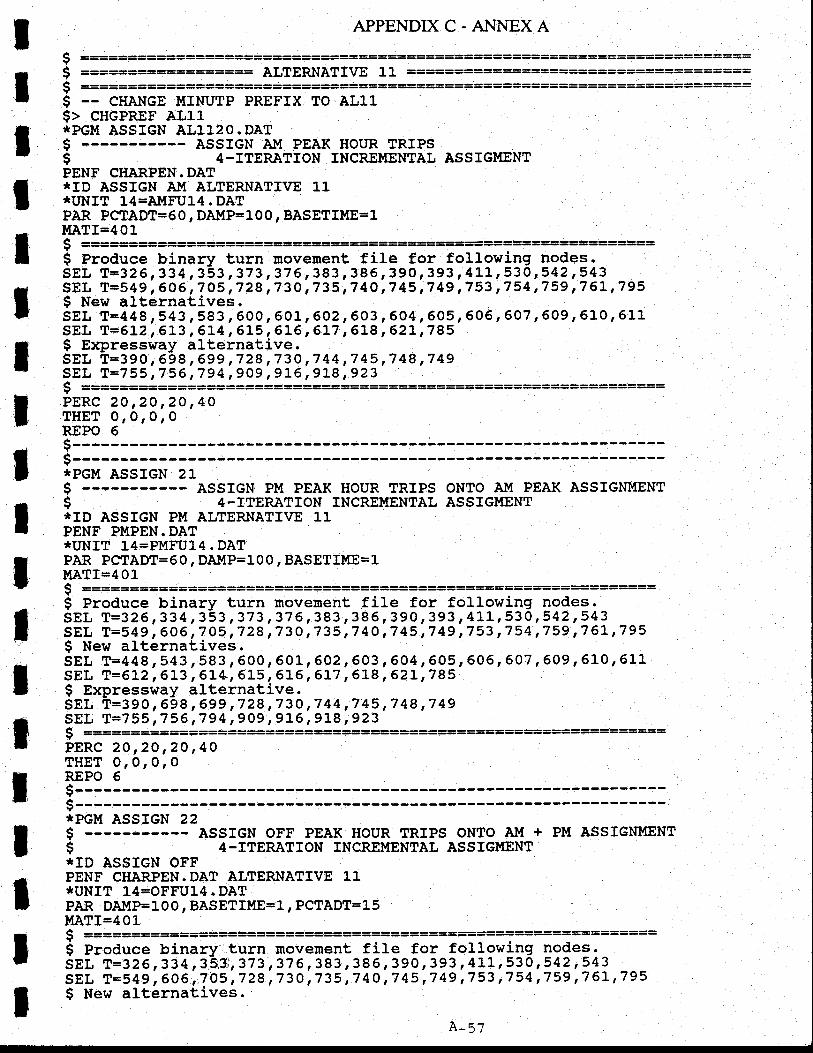
11
T
IIlI
IIIII
ItIt
$$I$
$I
APPENDIXC-ANNEXA
ALTERNATIVE 11
-- CHANGE MINUTP PREFIX TO ALll$> CHGPREF ALl1*PG}[ ASSIGN AL11.20. DAT
-.- ASSIGN AIq PEAK HOT'R TRIPS4 -ITERATION INCREII{ENTAL ASSTGIITENT
PENF CHARPEN.DAT*ID ASSIGN Al{ ALTERNATIVE*ItNfT 14=AltFUl-4 . DATPAR PCTADT=6 0, DAI[P=L00, BASETIME=1!!ATI=401I$ Produce binary turn movement file for following nodesSEL T=32 6,334, 353 ,373 ,37 6 ,383,386 r 390 t393 ,4LL r53o ,542 ,543SEL T=549, 606,7 05,728,7 30,735,7 40,7 45,7 49'7 53,7 54,7 59 t7 6]-,795$ Nev alternativesigt t=aaB, 543, seg, 600, Go1, 602,603, 604,605, 606, 607, 609,610, GL1SEL T=612, 6]-3, 6L4, 515, 615 r6L7, 618,62L,785$ Extrlressuay alternative.SEL T=390r 698,699,728,73O,744,745,748,749SEL T=755,756,794,9O9,9]-6,9L8,923c ------PERC 20 ,20 ,20 , 40THET O,OrO,OREPO 5S:------s-------*PGM ASSIGN 2I$ --- ASSIGN pM PEAK HOUR TRrpS ONrO AI'1 PEAK ASSTGNI,IENT$ 4-TTERATION INCREMENTAI, ASSIGITENT:tID ASSIGN PM ALTERNATIVE 11PENF PMPEN.DAT'IUNIT 14=PMFU14. DATPAR PCTADT=60, DAI{P=IO0, BASETIME=L!i[ATI=401
II
$ Produce binary turn movement file for following nodes.SEL T=32 6,334, 353,3-13,37 6 r383' 386' 390,393, Al.L,53o,542,543SEL T=54 9, 6a6,7 05,7 28'7 30'7 35,7 40,7 45'7 49,'I 53, 7 54,7 59'7 6L,7 95$ New alternatives.SEL T=448,543r583r600r501 ,6A2,503'504'605 ,606'607 ,609 '
610,511SELT=612'6L3,6L4,515'516,6t7,618'62l,785$ Expressway alternative.SEL T=390,698 ,699 '728 t730 '744 '745 '748,749!"L5132:!22:!21333:31!:313:333============-=================-:------PERC 20,2O r2O ,40THET 0r0r0r0REPO 6$-------$-------ipcl,t ASsrcN 22$ --- ASSTGN OFF PEAK HOUR TRIPS ONTO Alf + PI{ ASSTGNMENT$ 4-ITERATION INCREMENTAL ASSIGMENTltID ASSIGN OFFPENF CHARPEN.DAT ALTERNATIVE 11*UNIT 14=OFFUL4.DATPAR DA},IP=]-OO, gASEiiI,TE=1, PCTADT=ISIIATI= 01-a ------? ------ ---:::-=::::--:=======================$ produce binary turn movement file for following nodes.SEL T=32 6,334' 353., 373,376, 383' 385, 390,393,411' 530,542,543SEL T=549 ,506,7A5,728 ,730,735,740 t745 t'749 ,753 '754 '759 ,76]. ''795$ New alternatives.
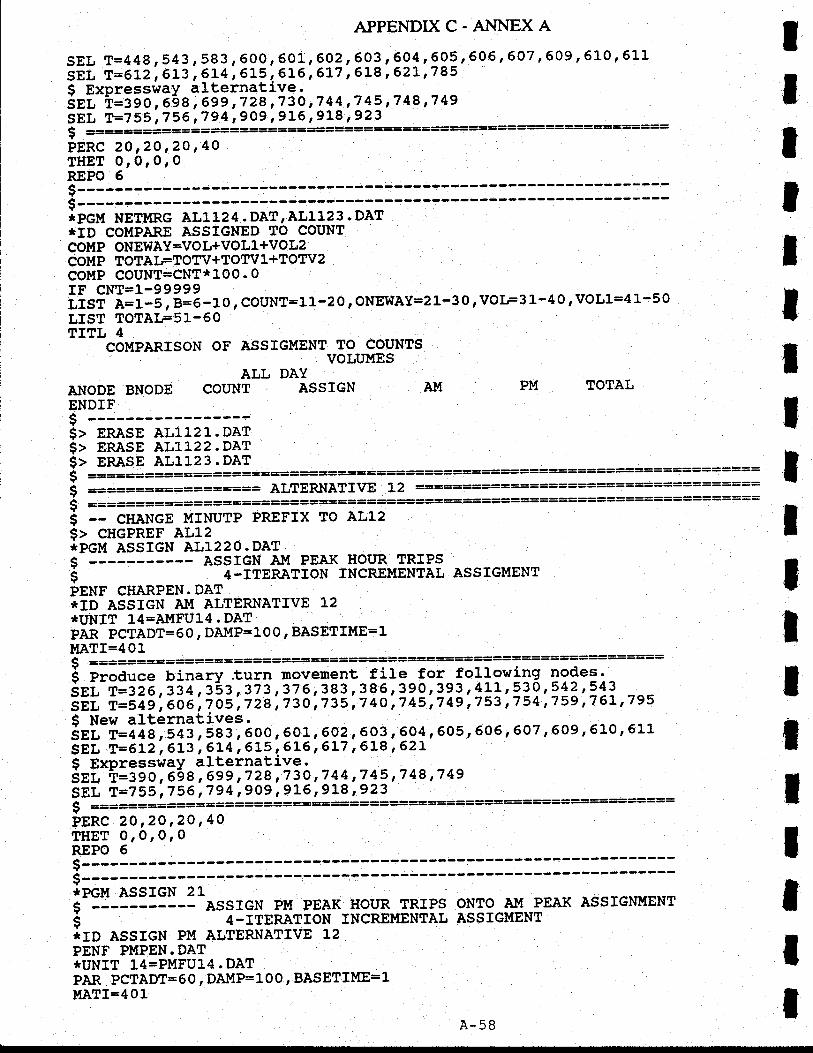
APPENDXC-A}.INEXA
SEL T=44 8, 543, 583, 600, 50I, 602,603' 601, q9?' 605' 607, 609,610, 511sni r=er2', 6L3, 6L4, 515, 6!6,617,618' 62L,785S Expressway alternative.igr, t=:go, 698, 699,728,73o'744,745,748,749inl r=zs g',756 ,794 t9a9 ,9L6,918 ,923$ ===============:==========================-=:================PERC 20 ,2O ,2O ,40TIET 0, 0,0, 0REPO 59-------ror-rrjr$-----r- ------::*PGM NETMRG AL11.24 . DAT, AL1123 . DAT*rD colr{PARE eSSicllrt io couNTCOMP ONEWAY=VOL+VOLI+VOL2COl,tP TOTAIFTOW+TOWI+TOTV2COMP COUNT=CNT*IOO.0fF CNT=I-99999iisf i=1-5, 8=6 - 1 0, COUNT=I 1-2 O r ONEWAY=2 1-3 0, VOIF3 l--4 0, VOL1=4 L-5 O
LIST TOTAIFSI--5OTITL 4
couPARrsoN OF ASSTGIiIENTVTO COUNTS
ALL DAYANODE BNODE COUNT ASS]GN AI'1
ENDIF$$> ERASE ALll,2L.DAT
PM TOTAL
tT
ItIIlT
IT
IIIIIIItI
S ========:========= ALTERNATM L2 -===:====:=$ ===============================:======$ -- CHANGE MINUTP PRET'IX TO AL12$> CHGPREF AL12ipct'l ASsrcN ALLaao. DAT$ --- ASSTGN AM PEAK HOITR TRIPSs
---+-rsrnerroN TNcREMENTAL ASSTGMENT
PENF CHARPEN.DAT*ID ASSIGN AI'{ ALTERNATIVE L2ltttNIT 14=AltFU14 . DATpeii-pciaDi=6 0, paup=ro 0' BASETTME=I}!ATI=401,
SEL T=612 |613 |6L4,615 ;6L6,6L7 '618 ,62L
s> ERASE ALL122.DAT$> ERASE AL1123.DAT$ =i=======:=======
DJiIJ I-EtJ'1 , c,J.J t va= , v'J, v^v
$ Expressritay alternative.SEL T=390, 698 ' 699 ,728 ,73CS Expressritay arternaErve.SgL t=ggo, 698 ' 699 ,728 '73A ,7 44
'7 45 ,7 48
'7 49
SEL T=755 '756 ,794 ,9O9 '9L6 '
918 ,923$ ==========PERC 2A,2O,2O,40THET 0,0r0r0REPO 6
5 produce binary.turn movement file for followllg l9qes.inl-i=iz a,tt+, l-ss,17?, ?79,?s1,1q9, l?9, 1??, 111, 119, 2!?,14-?Sgt i=Sa g',606',7 O5',728','73Ol735l7 4O-,'145 t7 49 ,753 ,754 '759 '7
6L '795I New alternatives
sEL T=44 g,s43 r Ee3, e oo, e ot ,Go|,qg1r 604 ' 605 ,6a6 '60'1,509 '
610 ,6Lr
======================
s
?tPG!{ ASSIGN 21$ ------ AssrGN PM_IEIK HOUR TRrPsi 4-rrERATroN TNcREMENTAL*TD ASSIGN PM ALTERNATIVE T2PENF PMPEN.DAT*ITNIT 14=PMFU].4 . DATPAR PCTADT=60 , DAI'IP=100, BASETIME=Itl[ATI=4 01
ONTO AI{ PEAK ASSTGNI,TENTASSIGMENT
A-58
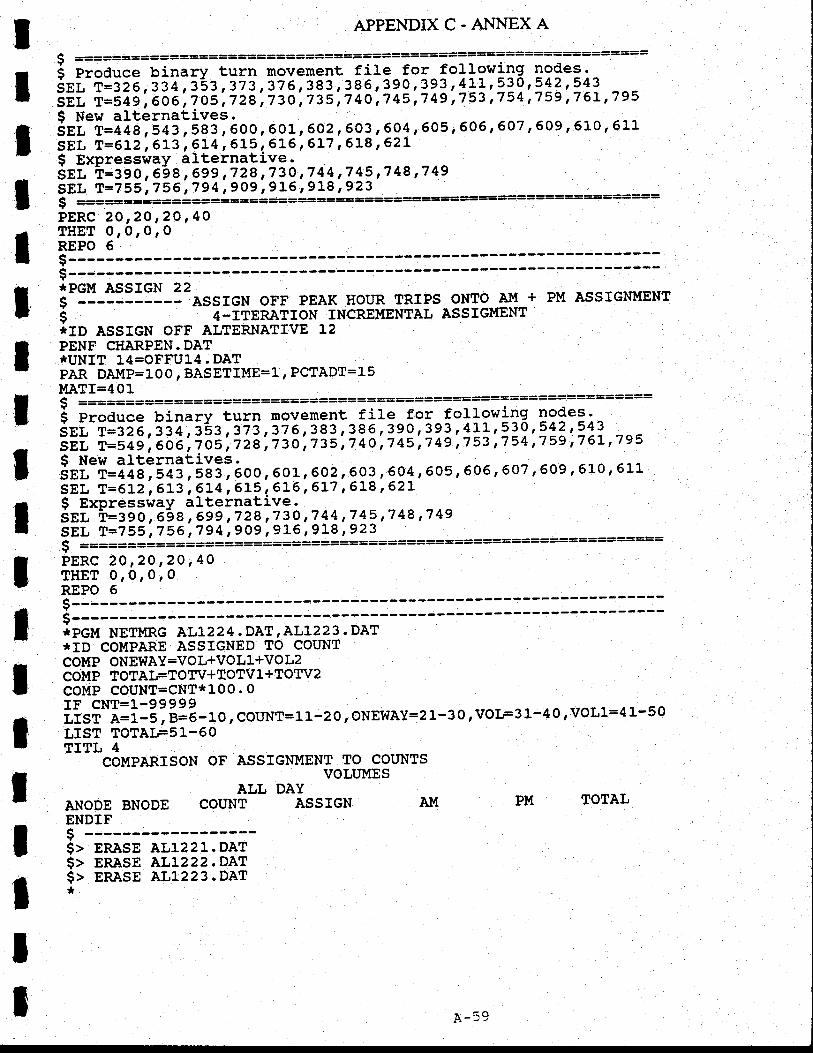
IIIIItIlItIIIIlltIt
APPENDIX C. ANNEX A
( ===================================================:=::=====i ;il;;"-uit,.ty turn movement f ile for for19w1!9 lgqes'inl-i=gz 6 ,334, :bl ,373 ,37 6, 38?, 1qq,1?9 ,29.1 , !!\,210.,2!? '543iff, i=Sag',606',7O5',728',73A-,735',740|745'"149 '753 '754 '759 '76L,795$ New alternativesSgi-i=AaB, 543, 583, 600, 601 | 602,503, 604' 505' 606, 607, 609 r 510' 6LLSEL T=512 '6]-3 '614
r 615 '616 '6L7 ' 618 ,62L
$ gxpressway alternative.sEi h=390, 698 | 699 ,728 ,73o ,7 44 ,7 45 t7 48
'7 49
SEL T=?55 '756 '794 r 909 '9L6 '
918 '923$ ===-===========PERC 20,2O ,2O ,40THET o,ororoREPO 59-------i-------ipei{ AssrGN 22g------------ AssIGN OFF PEAK HOLR TRrPS ONTO All + PM ASSIGNUENT
* 4-rrERATroN TNcREMENTAL ASSTGMENT*ID ASSIGN OTF ALTERNATIVE L2PENF CHARPEN.DATTIUNIT 14=OFFU14. DATPAR DAI,IP=I-o 0, BASETIME=I, PCTADT=1Sl!.ATf=401( ========================================:===================5 proauce binary turn rnovement file for followllg l9qes.sri-i;gz 6 ,'334 ,1iz ,373 ,37 6 ,383 , ?8q, 199,1?3'111,:19 ,2!?,543sii i=seg',Ga6',7o4',zza't73o',735',74o;745,'749'753'754''759,761'795I New alternati-vessgl, t=+a g,s4:, Sei, q99, q91, 602,qo?, 604, 605, 606, 607,609' 5L0, 6LLSEL T=6L2
'6]-3,6]-4 ' 6l-5' 5l'6 ,6]-7 ,6L8,62L
I Expressway alternative.ini h=rgo, 6-98' 699,728 t730,144,71?,'I 48'749SEL T=755,756 '794,909 '9L6 r
918 ,923$ ============-===============================================:PERC 20 ,2O ,20 ,40THET or0roro
E:::_:__$------- ------:-:-------!tPGl'{ NEIMRG ALL224. DAT ,ALL223. DAT
'tID CO}4PARE ASSIGNED TO COIJNTCOMP ONEWAY=VOL+VOLL+VOL2COMP TOTAIFTOTV+IOTVI+TOTV2COMP COUNT=CNT*LOO.OIF CNT=1-99999 VOL1=41_50ifsf a=f-S, B=G-10, COUNT=!l-20, ONEWAY=2I-3O' VOIF3l-40,LIST TOTAIFS1-5OTITL 4
COMPARISON OF ASSIGNMENT TO COUNTSVOLUMES
ALL DAYA}TODE BNODE COUNT ASSIGN AT'1
ENDIF
$> ERASE AL1221.DAT$> ERASE AL1222.DAT$> ERASE ALL2?3.DAT*
PM TOTAL
A-59
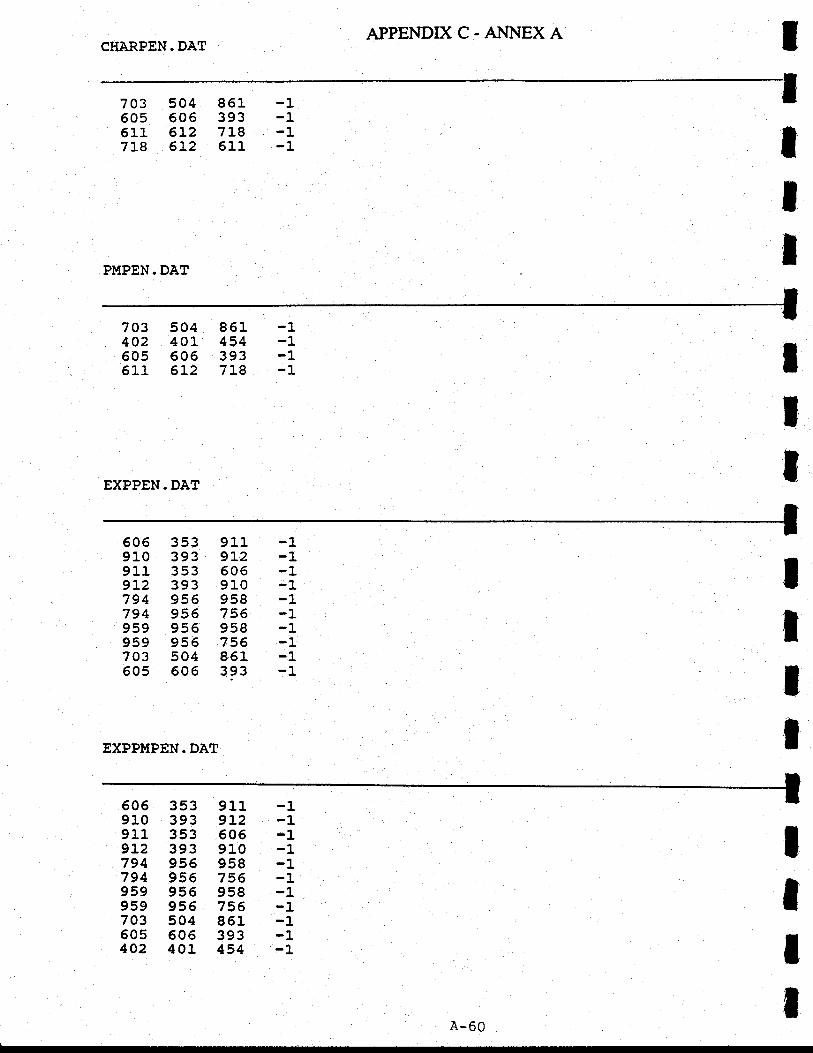
APPEI{DIX C. ANNEX ACHARPEN. DAT
70350s6Ll_718
5046056L26l.2
861393718611
-1-1-1-1
P!{PEN. DAT
tI
703 504 861 -1402 401 454 -1605 606 393 -16l,L 6L2 7L8 -1
EXPPEN. DAT
IT
t605 353910 393911 3539L2 393794 956794 956959 955959 955703 504605 605
EXPPMPEN. DAT
911 -19L2 -1606 -19l_o -1958 -1756 -1958 -1756 -1851 -1393 -1
tIII
5059109119L2794794959959703505402
353393353393955955956955504606401
9119L2605910958756958756851393454
-1-1-1-1-1-1-1-1-1-1-1
I
lI
A-60
lII!IIIIIIIIIIIIItI
APPENDIXB.A}INEXA
ANNEX A
HOUSEHOLD STRATIFIC.ATION PROCEDURE
A household stratification procedure was developed to aPPlyjl,lrrip gengation molelscalibrated for tbe Charlotteiville Area Transportation Study (CATS) area. This -procedure
""r*iti the estimation of number of househ6lds by each combined category of farnily size'-O
"uto ownership/availability for a traffic zone-given the average family size and^auto
ownership level foi'that particular zone. Pgt"S pertaining !o the development of .thispto."Oorf and an application program especially devbloped for the purpose are summarized
below.
A-1 DEVELOPMENT OF THE STATIFICATION MODEL
Using 1980 Census data for the twenty tracts located within the study area, two sets ofcurves were devetoped. Figure A-1 illuitrates a set-of curves representing the variation inG p.r.l"t of tutniti.r o"irilg 0, 1, and 2+- autos by. the average-auto ownership level ofthe Census tracts. Similarly, Figure A2 displays the ihare of.L,2,3,4-+ person lamilies by
u:""r"g" t"*ily size. T!qr. 9uJ.: were harid-fitted keeping i1 mir.r!^that for each point on
the Xlaxis, thl sum of Y-axis values for all curves must total to 100 percent.
For any given value of the average_family size and auto ownership estimates of households
ior famil'|es) separately by size and auto-ownership categories can now be computed,using
)h;;b";; uienfioned t*o"s.tt of curves. The nextitep then, was to develop-a methodology
io-"rtl-ut" ttt. joint distribution of households foi each combination of size and auto
o*n.trrrip class." In other words, -a
methodology was required.to fill the iTt:t celis of a
-uiti* tii this case a matrix of family size and auio ownership) given the totals for each row
and column.
An iterative procedure, similar to the FRATAR method.was developed-to accomplish this
i*t. foi its'application, a program called 'STRATIFY" was written. However, to begin
it" itetutiue pio."ss of baldnciig row and column totals,.the procedure rqqu|.e{ a rtser'
rfi.AliiO ittiti'"r joini distribution.-Ttre initial matrix termed here as the "seed table" utilized
i;i 1119 above iuryos" represented- t!e- observed regionwide distribution of households
Ortirg tt" first'coritact in ihe household survey (see Table A.1).
To check the consistency of the overall model, the stratification :urvgs (Frgures A.1 and
A"ti;;J il" SfnafffY ptogru* were applied to all zones ulPq th" pqg year.-socio--gg;il"-ia data. The resultsiveie aggregated tb produce a regionwide household distribution
and then compared with the ouseriEo iistributibn in the household lyrvey. Specifically, the
otooottio* 6f. ,"to auto households and two person households were found to bell
overestlmateo. At this stage an adjustment to the stratification cuwes was necessary to
overcome this discrePancy.
A-1
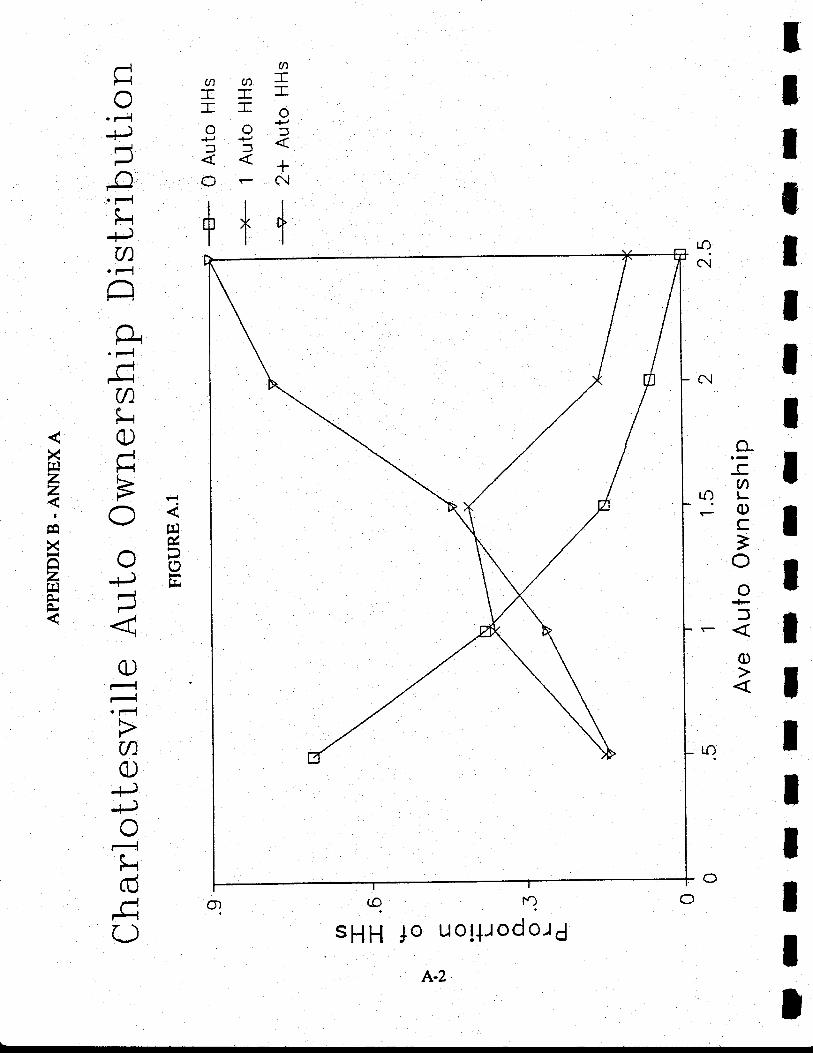
T
IIIIttI
aaa=
FIll
]frouoofZET-
OFN
ttlfix*,lll
o-,ETLNL-i I:r
ri ICIat
IttII
qnsHH jo uo!+rodo,16
t1H-\\./
' t-{#'-\
-c'o Fl
S{-rJU)
. t-l
-ra\*d#aI-.{
XTIrl Fr4hPFr),Yr \"/ rrl\rr g,ADa\./o4r=EA-
- ' IF"-
Or-lr-{' 1-{t\-nn\\Ll
J-)
{Jo
'-l|.H(dLLJn#r\\-./
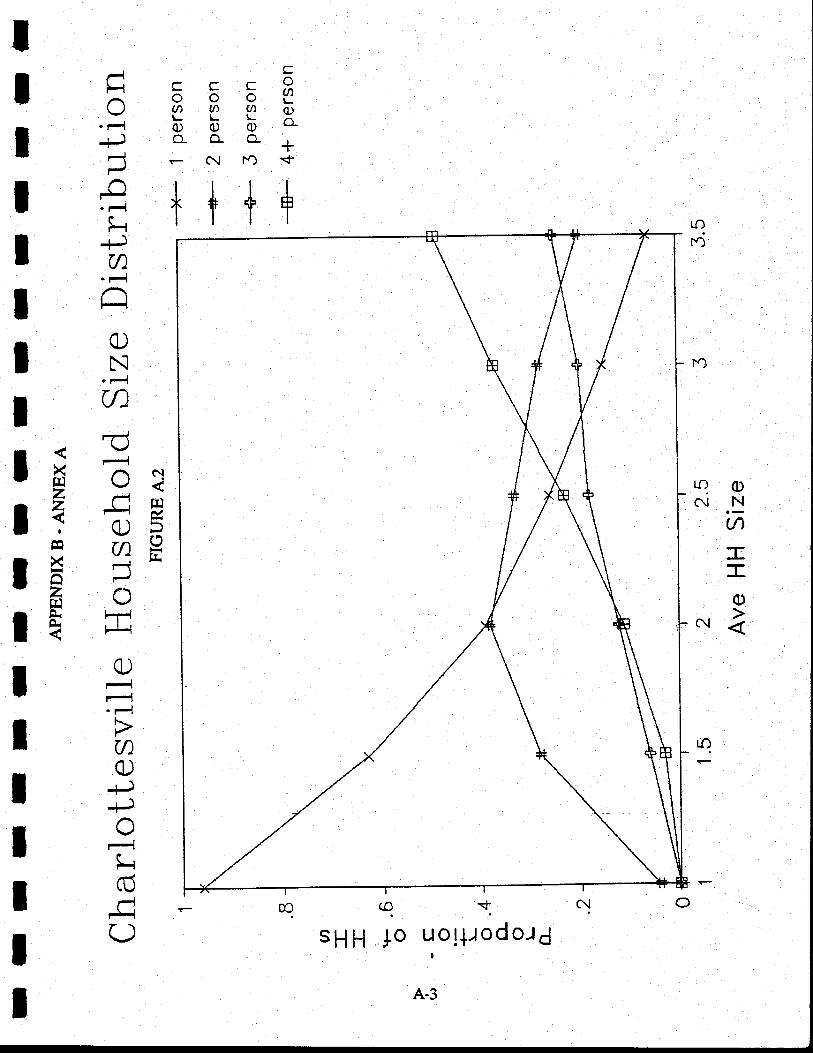
q0)c{N
lJ1
T-o
N
ccccPoooi.:gCTP0)OOgo-o-o-l -t:FNFO-+
ltllx#+Ellll
ll==lF_ ,_1
l= Ll=--J
Ili
' 1-{
l(n-rJ
lE E:3dti 6sca a II E 3=
It E
lg.|-'tth
l-r€lgIUI
qasHH lo uot+Jodo"t;.l
A_3
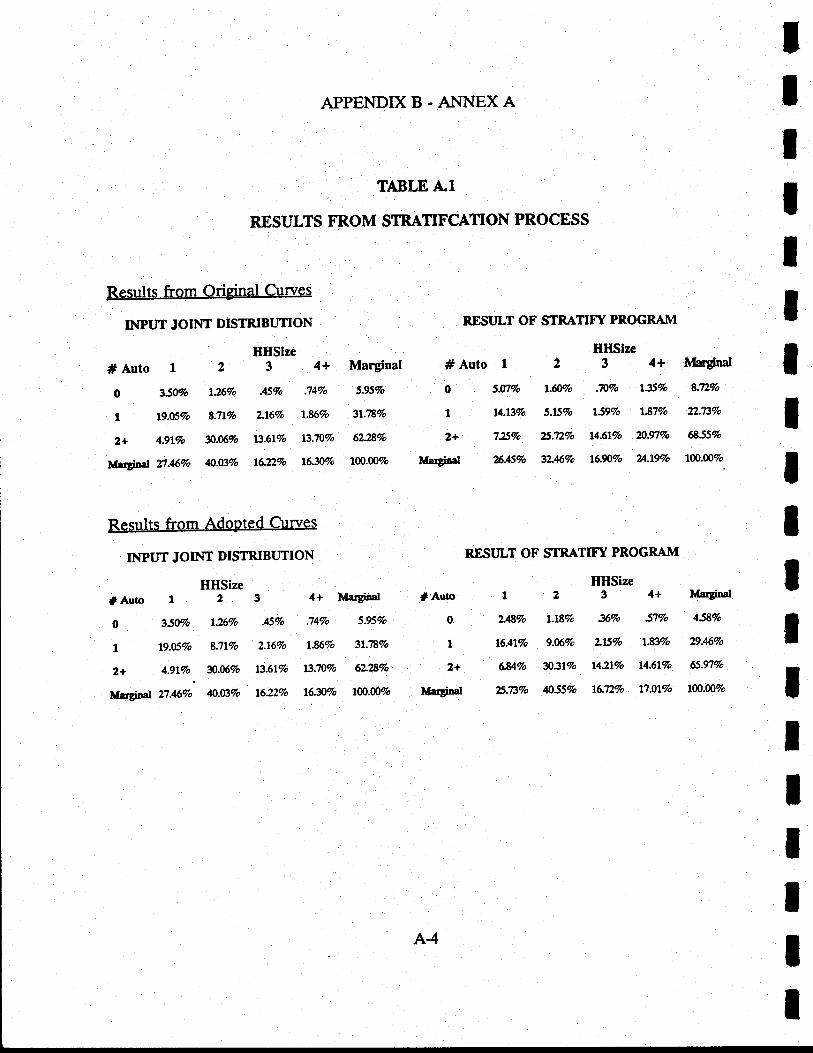
APPENDTXB-A}.INEXA
TABI,E A"1
RESULTS IIROM STRATIFCATION PROCESS
RESI'LT OF STRATNilT PROCRAM
II
INPUT JOINT DISTRIBUTION
ItIIIlIIItItIItI
# Auto IHHSize
2 3 4+ Marginal # Auto IHHSize
2 3 4+ I\'ta{dnal
Results from Adoprc.d-euves
INPUT JOINT DISTRIBUTION
O 3SO% l26vo .459o .74Vo S'95Vo
19.05?o 8;ftVo 2.16% l.86Vo 31.787o
2+ 4.91% 30.06/o 1.;3.6lVo l3'70Vo 6228Eo
M.dnat tl.46Vo 4O'A3Vo l6'2Vo l63AVa 1.O&009o
# Auto 1
HHSize2 3 4+ lraryitat
O 35AVo l26Vo .45Vo 34Vo 5'93Vo
t t9.05Vo 8.71Vo 2.76Vo l'86Vo 3l'?EVo
2+ 4.9lVo fi.06Vo l3.6LVo l3'j$Vo 62'8Vo
M.dnal 27.46Vo 40.03r'o 16.22Vo 16'30/o l00-0lJ9o
S.OVo t-6Wo .tuVo l.35Vo 8il2%o
l4.l3Vo 5.l5Vo l59Vo l.tl%o 22.734/o
1$Vo 8.72Vo t4.6lVo fr.91Vo 6855Vo
%ASVo 32.46y'o l6.9Wo 24.L9Vo lAO.\}Vo
REST]LT OF STRATITry PROGRAM
IIHSize1231+M8tgioal
L48Vo t.l8Vo 36Vo STVo 4S8Vo
16.47%o 9.A6Vo 2.15Vo l.9Vo D.46Vo
684Vo 303l%o l42lVo t4.61Vo 6.97Vo
8.73Vo 4055Vo l6.T2Vo l7.0LVo lO0.NVo
o
I2+
Metgital
* Asto
o
1
2+
Margin l
A-4
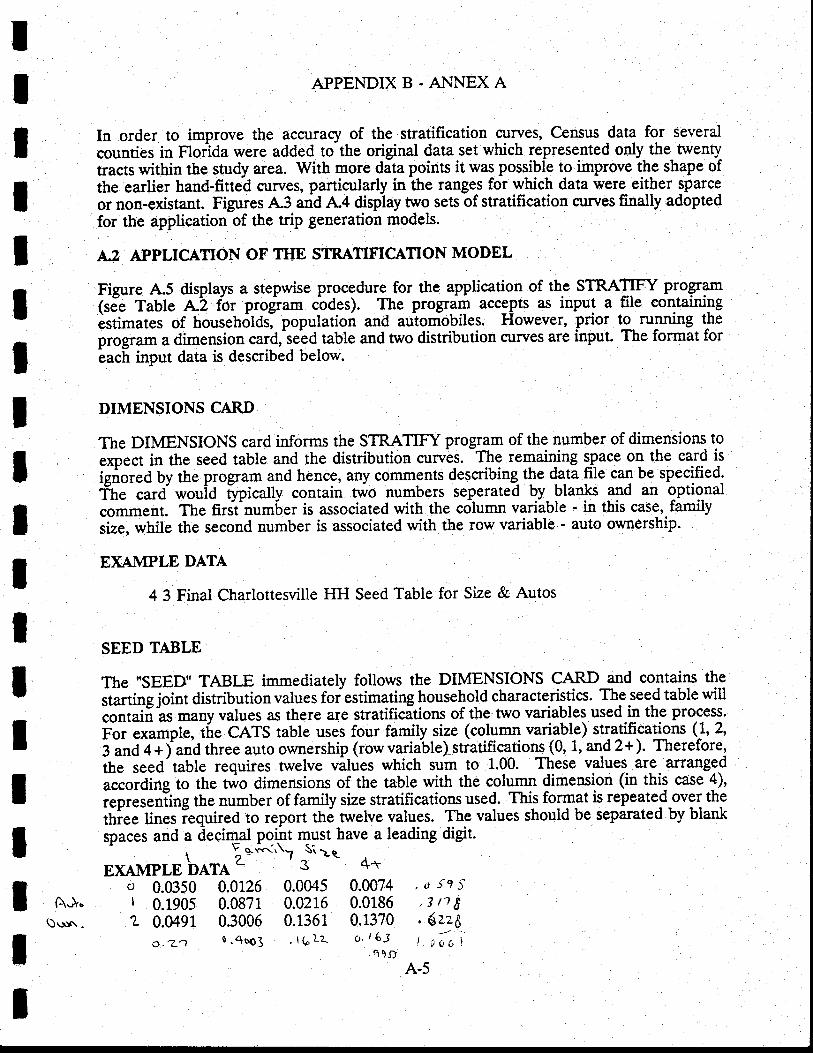
tIIItIIIIIIIIIIIIII
A.\,\),.r:n .
APPENDIXB.ANNEXA
In order to improve the accuracy of the stralification curves, Census data for several
counties in Florida were added to-the original data set which represented only the Wenty^
tracts within the study area. With more data poina it was possible to improve the shape ofthe earlier hand-fitted curves, particularly in the range-s for which data were either lParceor non-existant. Figures A3 and A4 display two sets of stratification curves finally adoptedfor the application of tle trip generation models.
A2 APPLICATION OF TT{E STR.ATTFICATION MODE,L
Figure A5 displays a stepwise procedure for the application of the STRATIFY Prog,r}n(sie Tabl e L2 for program iodes). The program accepts as input a file containingistimates of househ6tOsl population and automobiles. However, prior tg running t^he
Drosram a dimension cardfsebd table and two distribution surves are input. The format for'eac[ input data is described below.
DIMENSIONS CARD
The DIMENSIONS card informs the STRATIFY program of the number of dimensions to
""p..t in the seed table and the distribution curvLs.
-TIg ttrytryng space on the cald isi-giored by the program and hence, any corrments describing- the data file can be specified.
fh" ."rd *ouid ['picatly contain nvo numbers seperated by- Ptuo]q -qld an optio.nal
.o**"ot. The firsi^num6er is associated with the column variable - in tbis case, familyiize, while the second number is associated with t}re row variable - auto ownership.
EXAMPLE DATA
4 3 Final Chariottesville HH Seed Table for Size & Autos
SEED TABLE
The ,'SEED' TABLE immediately follows the DIMENSIONS CARD and contains the
rtutting joint distribution values foiestimaqing household characteristics. The seed table willcontaii ar -uoy values as there are stratifications of the two variables used.in the procery.
ioi "**ple,
tire CATS table uses four familysize (column variable) stratificalgns (L,2,i ana + + j
"nO three auto ownership (row variable) stratificatiolr (0, 1, and 2 + ). Therefore,
ine seeO'table requires twelve vildes which sum to 1.00. These values. ar9. arrangg$
according to the trvo dimensions of the table with the column dimension (in this case 4),
represeoiing the number of family size stratifications used. This format is repeate-d-ovg1th.e-l
three [nes requued to report th6 wetve values. The values should be separated by blankspaces and a decimal pgst must have a leading digit.
r ! s'$'\\\Y j'lc-EXAMPLEDATAZ '3 4..
o 0.0350 O.OLZO 0.0045 0.0074 ' o si J'I 0.1905 0.0871 0.0216 0.0186 .3 t1 EL 0.0491 0.3006 0.1361 0.1370 ' 6zzy
o.z1 o.4so3 . rgrz- , ,.f,{r, t. t{,,iA-5
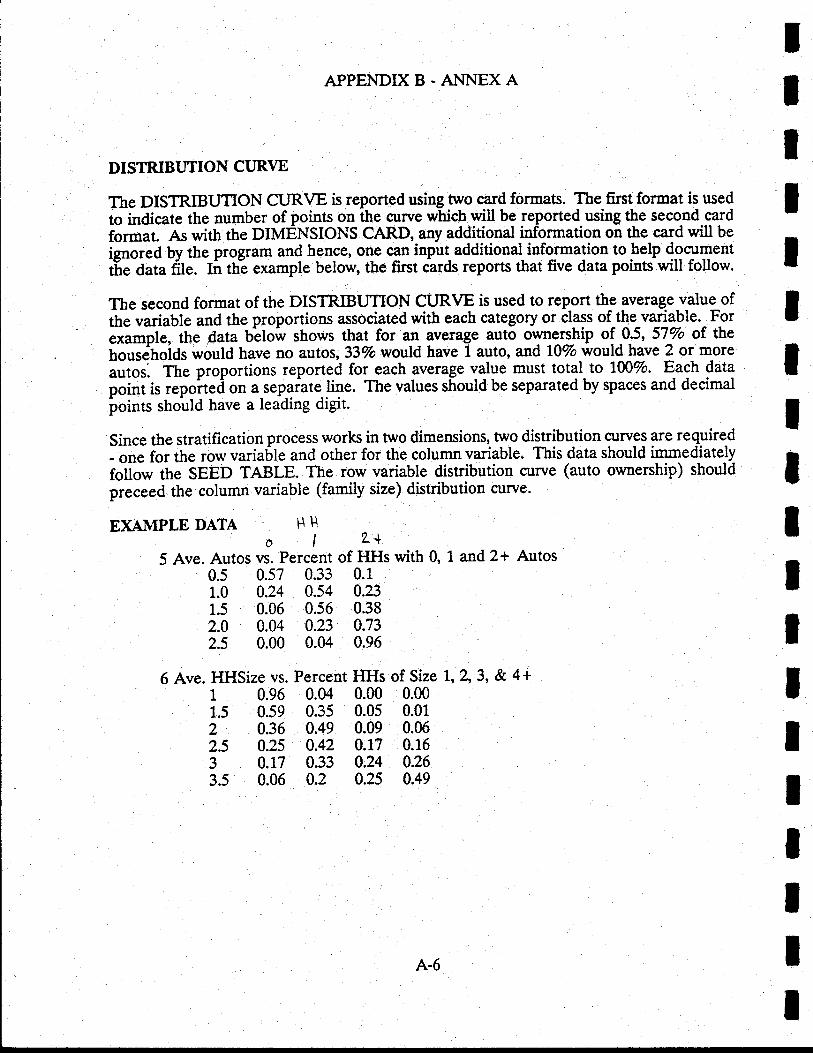
APPENDIXB-ANNEXA
DISTRIBUTION CIJRVE
The DISTRIBUTION CURVE is reported using two qrd formats. The frrst format is used
to indicate the number of points on tbe curye which will be reported using the secoad _cardformat. As with the DIMENSIONS CARD, any additional information on tbe card will be
ienored by the program and hence, one can input additional information to help doormenttfle data tite. tit th? example below, tbe first cards reports tlat five data points will follow.
Tbe second format of the DISTRIBUTION CURVE is used to report th-e gveragS-value ofthe variable and the proportions associated with each category or class of the variable.^ Foriiu*pt", the lata Ubtow shows that.for ql- ryerage auto owners_hip of 0.5, 57Vo of. thehousetroiOs would have no autos, 33Vo woudrd have 1 auto, and 107o would have 2 or more
antos. The proportions reported for each average l1lue must total to lNVo. Each datapoft is repohed on a sepafate line. The values should be separated by spaces and decimal
ioints should have a leading digit.
Since the stratification process works in two dimensions, nvo distribution curvgl are required- on. for the row variable and other for tbe-column variable. This data should immediatelyfottJw the SEED TABLE. The row variable distribution curve (auto ownership) should
preceed.the column variable (family size) distribution curve.
EXAMPLE DATA H }iol2^+
5 Ave. Autos vs. Percent of HHs with 0, 1 and 2+ Autos^ 0.5 0.57 0.33 0.1
1.0 0.24 0.54 0.231.5 0.06 0.56 0.382.0 0.04 0.23 0.732.5 0.00 0.04 0.96
6 Ave. HHSize vs. Percent HHs of Size 1', 2,3, & 4+1 0.96 0.04 0.00 0.001.5 0.59 0.35 0.05 0.012 0.36 0.49 0.09 0.062.5 0.25 0.42 0.17 0.163 0.17 0.33 A.24 0.263.5 0.06 a.2 4.25 0.49
IIIIIIIIlIIItIIIIII
A-6
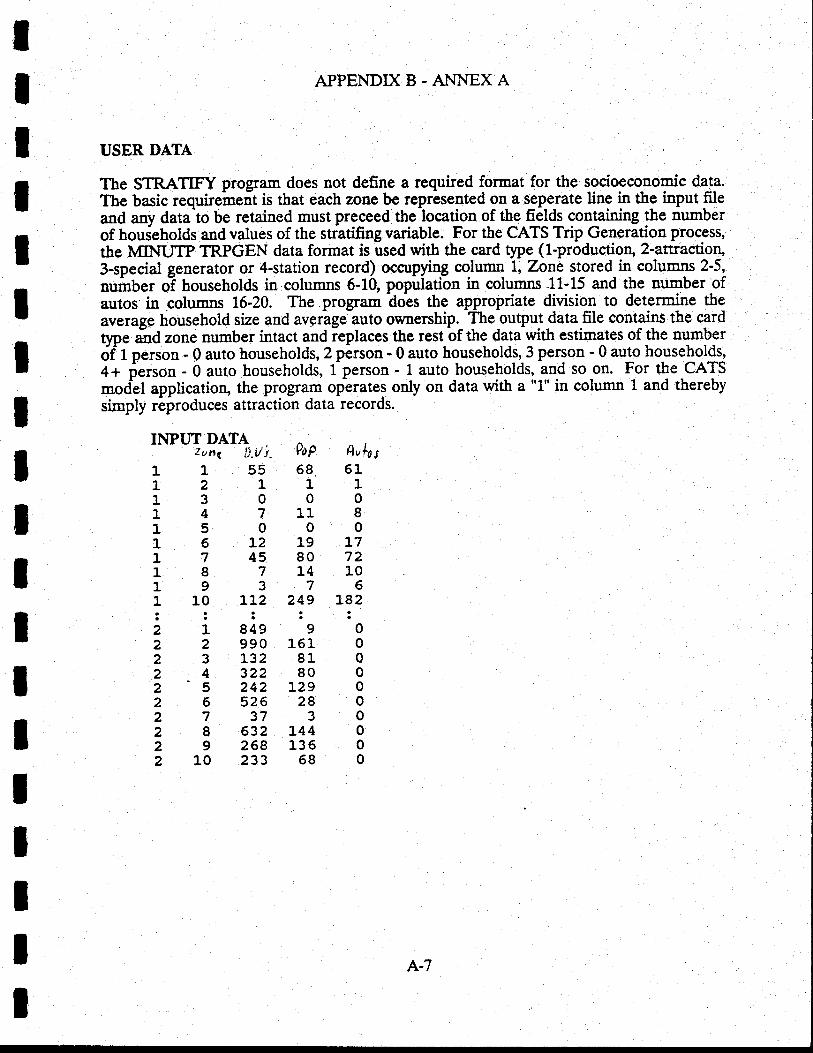
tIIIIIIIIIIIIIIIIII
APPENDIXB.AI{NEXA
USER DATA
The STRATIFY pro$am does not define a required format for the socioeconomic d1t-a.
The basic requireirent is that each zone be repr-segted 9n a seperate ling p the input fileand any dataio be retained must preceed the lgcatlon of the fiClds containing tbe numberof houieholds and values of the stratifirg variable. For the CATS Trip Generation process,
the MINUTP TRPGEN data format is used with the card qpe (1-productior\ 2-attraction,3-special generator or 4-station record) ocarpying column 7, Zone stored in columns 2-5,
number oT households in columns 6-1Q population in columns -11-15 and the number ofautos in columns 16-20. The program does the appropriate divisiojl to determirrt thqaverage household size and avgrage auto ownership.- lhegutpuldata.file sentainc the cardqnre fra zone number intact and ieplaces the rest bf the data with estimates of the numberoftpetson-0autohouseholds,2pirson-0autohouseholds,-3person-0autohouseholds,4+ ferson - 0 auto households, Lperson - 1auto householdt:._1Ld soon. lor t{e.CATSmodel application, the progam operates only on data with a "1" in column 1 and therebysirnply reproduces attraction data records.
INPIIT DATAzutrr(. fi.U i. PoP AuJ.os
68. 61L100
11 I00
19 L780 7214 1076
249 182
90161 081, 080 0
L29 028030
L44 0136 0680
115512r13014715016L21745187L931 10 l.t2ao.a
218492299023L32243222524226526273728632292682 10 233
A-7
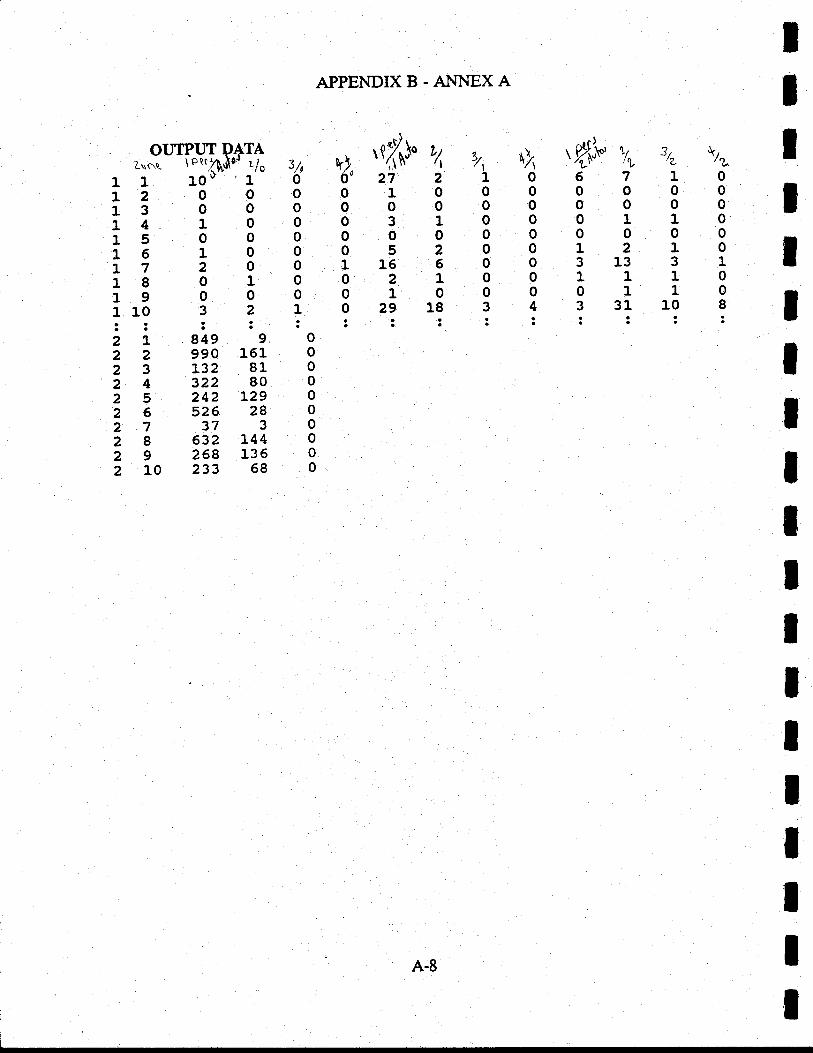
.-SuP,ffiR+Tf 3/o v) ttfhl' t'/,
1 1 1oo 1 o o' 27 2
12o9o1300014 1001500016 100172001801019000110 3 2 1!:!::2 1 .849 9 022990151023L328102432280025242L2902652628027373028632L440292681360210233680
APPENDIXB.A}INEXA
o00052116602101002918aaaa
IIIIttIIlIIIT
ItI
^nc),, ry', t fiN' VL t," Vz106710000000000000000110000000001210O :0 3 13 3 100111000011034331108:::!::
o10o00031
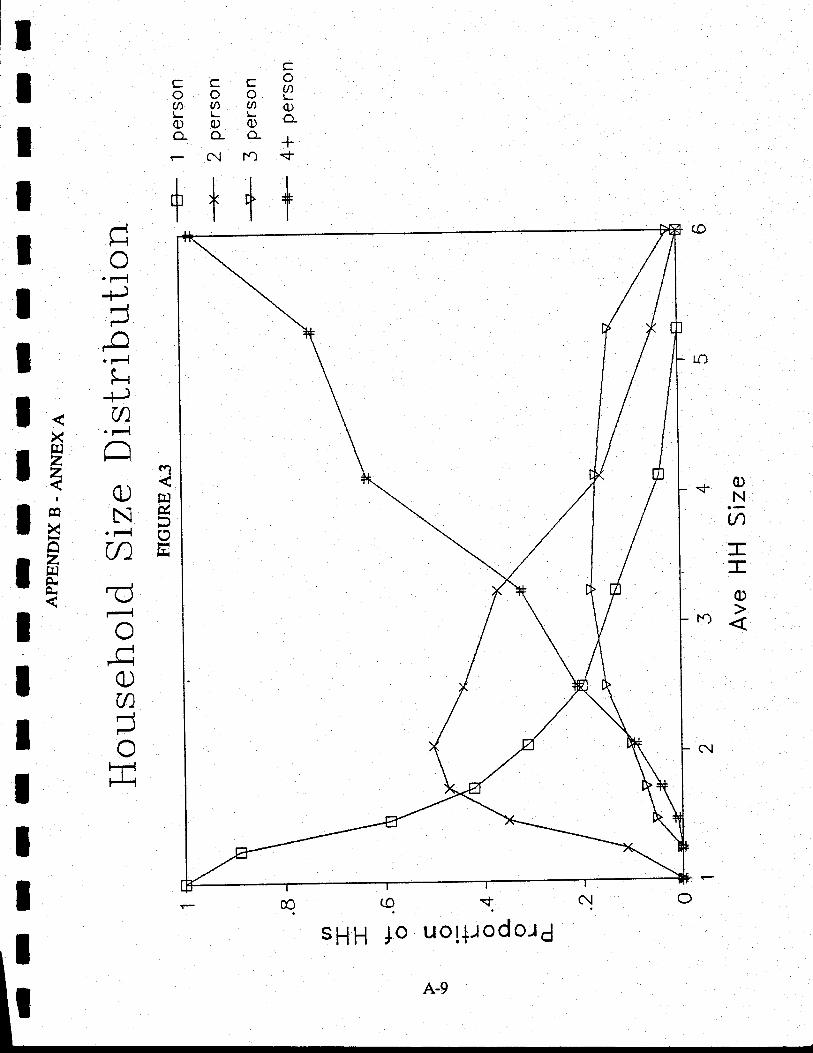
cccc9ooor? C T Rq)OOgo-o-o-l-NfO-+
+CI-NU1
'r:rq)
r)
-Hc
. ;-l#-
. r-lEr{+m
. t-{
CA
n\u./ HNq. r-it (9(nE
+t++
-rl
o#()n-
F
T
IItIIII
X
relfl
n
tFIIIt
sHH ]o uo!+rodord
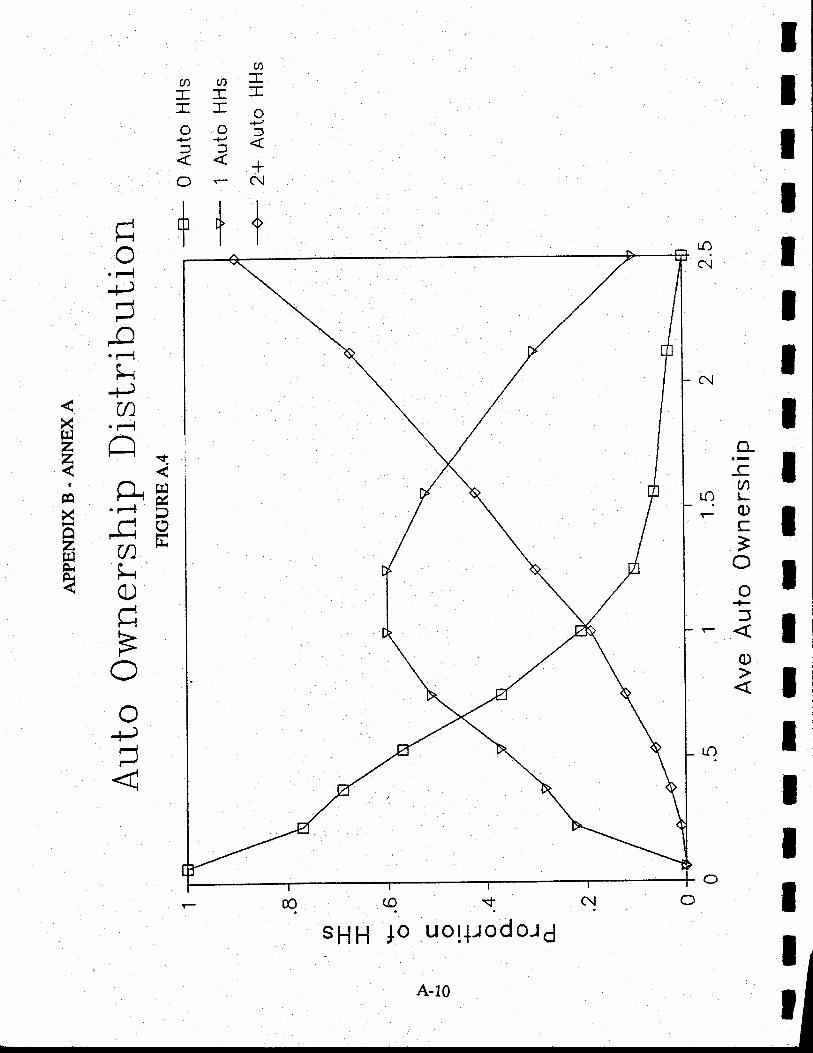
IIIIIT
II
aaa*
TI'rL4O
+)oofPPrt x,
TOFN
,rrLo r--i I:T
ri ICIat
t1Ho
' t-{+J-
-c' t-lIi#
XFl ,lz(JZ'r-t
tArYlFa +ax ''-] pi-a r Ft
t'vFi FZrnuifU vrA't-{ tA-
d
-\./
o+,_i=a
-4
IT
IIII
qasHH lo uo!+rodord
+t+
A-10
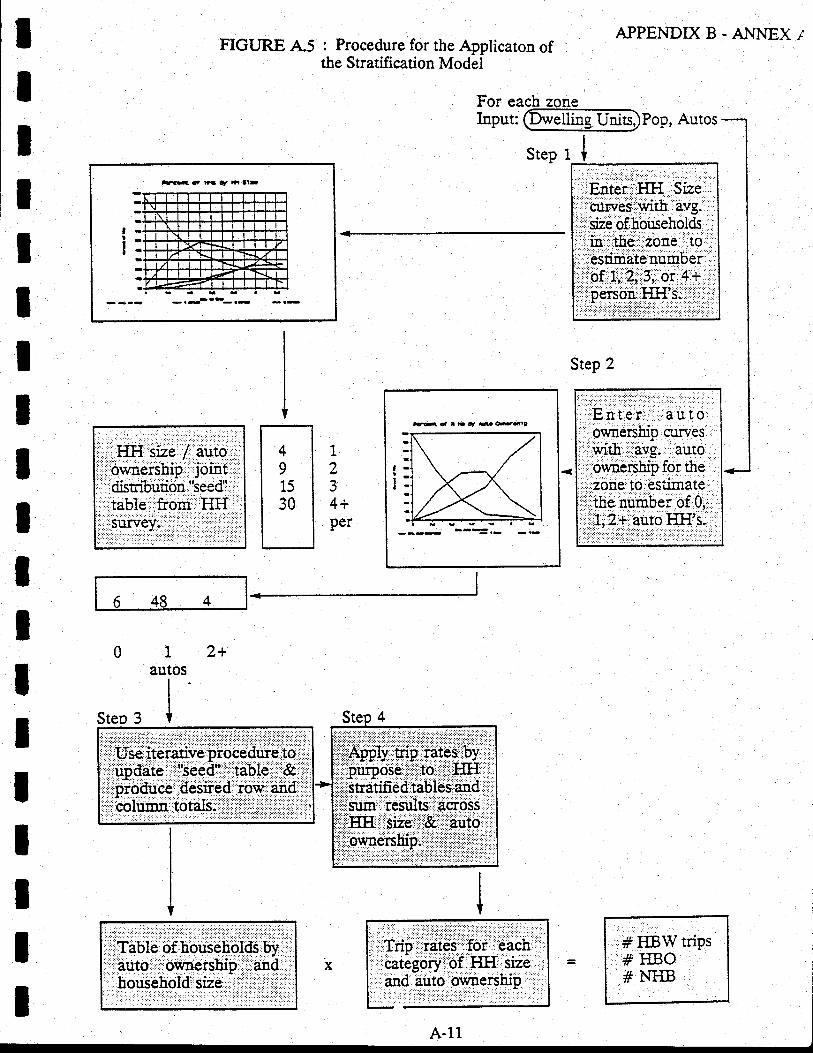
APPENDIXB.ANNEX/FIGURE A"5 : Procedure for the Applicaton of
the Stratificarion Model
I
II
IY
HI'olll
For each zoneInput@Pop,Autos
step 1 I
1
2
4+per
484
2+01autos
II
ro3 +
',,# HBW triPs',s ffiQ ',
# NHB
I
I
+
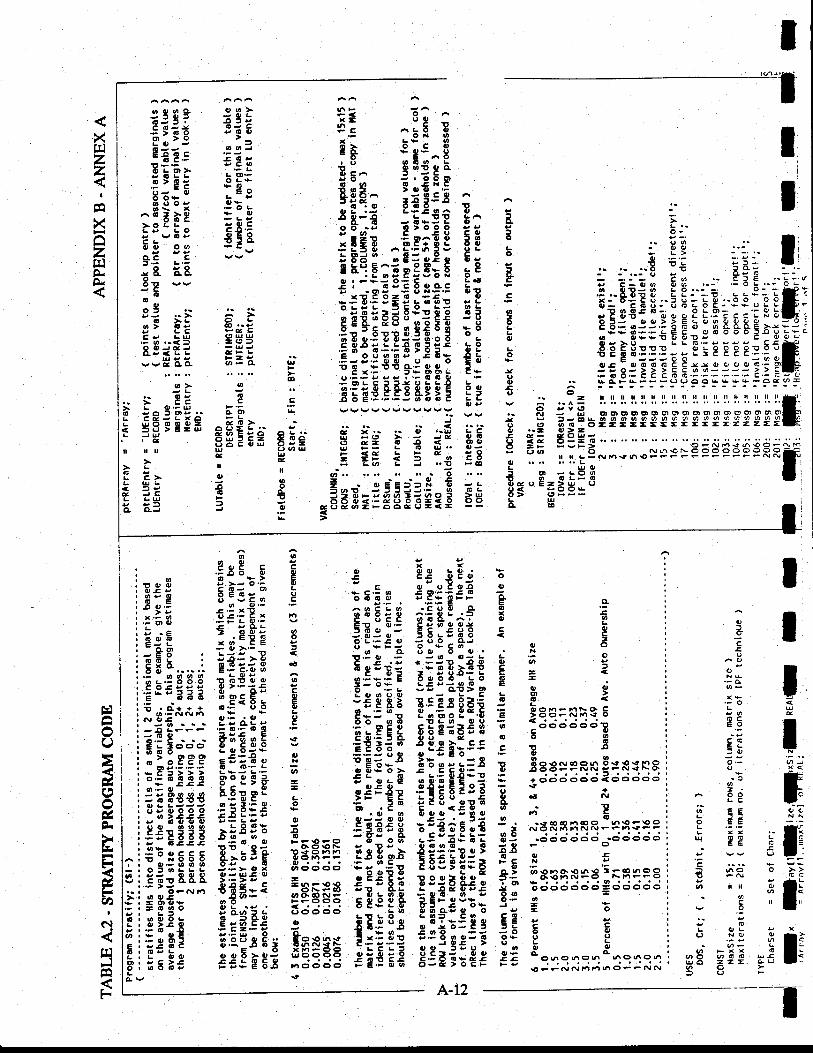
I
Ii
li
l.
i$ooL'
EX
;I-T
AA
?= E;:g; ^.5 8oN ox L5 AeF €g'5^Bgo ?t' L
E E^ 3:€t 3q' ., @ ENtrEBt^ >oorrro e8353; A
3 b:E :E:g? $^ i ae1,r: E;:€g EI E !::ig=T^?ge3s!P r ;,8! ,-,,,.E iq E;i;Eg; E ;E e ,-..,-t :€ iil:i;sg;t!*g::i z 4,-t!€g.ie::it.il5l;Es!;3s;;E;:E E ;E:fiiilEEifi;;Ei.9v I5ps qgg:3 t: E ,*t BEc€ H E; o E b-o= 6 !-d:s:E;;E'E;; ig ; E;eii';;;E!EEEET:E :=;;::;ls$; E; ; :;::EE:EE;;:iiil,
: .;:e!Eei*t[fr{;I ! sdrg-i-;aLi6orLbLF6: E'5Eis.E3*:*E ;; : =...?= iri*-*irirl'ii'l ,,t.l'.l',.:'i,.E vvvvvvvvvvv l] - R :vE sroororo,qtooo6oqo@qrqq--
J + ; f,-oe6oooo66646aaaa'too
eEa g' fg ; i ''E bF E a3 *tri::::::=-=-=E=====6ou u E- : ! E- g; g i; ?;:E:;_;;;;;;EEitiig$pFi? = EZ i =
T.e Eg ; :... .'.'n",6€ 5*r-:;;=,=*"! EE 13 "
*=€H;3: OOO<'-cooo-<q oo h u: eEdq=Fo6-o-<- -s cL E
IIIt
?,6:tu
r-sP
.:a;Ix
---.=:GC
-tr<r"
o>tlir Lav4cGO
=6Jo9coOD!-
€oOLq,
{rCERE-
L
cULcL
Go?sE*o E * E*rE;€t i*;; E i':' i;;€!F
.2E t'l:E - ^'z'7 "i -E'i E o
12 t:E$; ; :Ei:t s;3;tiEF .iiaii E ;;;*ia!fl}!81,..,"."Effr.ifl i Ee;t;::Elit::iii E;:E; E :i!ff;;;fti;g::: :E="s! ! g:?et ;!E*;;{ f;;;; F:EgE s €t:: ? 3 F;;:;;eEss ;:!f: # :Eiil i;::;=!$iii ffiii E ii:i; iii!:;ffi i3!l? i=u== liii; Ecltii
O O QJ OJUs g
st oul -iaEl i res:B €;tr EE IiiE $#g'€;*" ;€i:: *iii: E Es Fs- ?gi+;;
IiE €ifrit, !"""" i;ii; ;iii€rir+ s#!a*i F:::g:ril;;ffi:!
€
G
a^cGLooLA
o.o@
63
Lo
L{,
ce,!
XrQzz
I
Xozf"ltr.cr
96c={,U
e(O .--4gtu
=.JCFtsz
oG
agl
= eQU EEE
8H eU4tr
o,
.oF)
oL
il
6LL4g
o
ooo,JOf)3.6-J>Go>oa)r€ e.:L Or>OLL>6e
oo$ooet >tt,ooc
LO
Ooc
vOACL
>Le.z.LW.-{ lJgJ<LL
HAA
o>-qv
O.- u:oe6GO>A=
o6cC'lLg
8o
t6o
>oCLooCLCJ,--&o3Eo6 oot
66>ceoc,gf
L
EEUO=(JJU.entr
g
c>UL3-cgua3
Eo,0G-oxL6E
GcoqceEN
oEoo
oo
oo
ocq
tto
.t-6o
6L l:
L
I
ocG
aa
oa
AOc)NT.-&OFxb.FoLPqGCEOr9
EL
0.Fq
l.ooLC6 EEO EEL .-.-g xxu !9!vvc .-..?!Rti xx-o
-GL Cr!(J No
- q-o Fxx
@o o 6 0UO =E=@O
.9 nOSNO.(3Cte
F\O o
oc)e
hoo-FCtooo
Fo6
€o
\ono
6
e
e
o3oLq,ctoo
G'
co
o6!aO\tt.<o
o
.eoEtr
o
coo!(,a
rnC
NOrtq€oo
ernoo
.lteoo
6\oeO
c)o
o6
(oe
oo
n.ltoo
\On
oc)
60
()o
N(O
cto
aon
c)o
O. \O
<to
o
o
o?o()
€NO-(t ct
oneoc) ct
(r€€teoe
*co(t 6J
cte
€riC't \O
oo
e6
+9
€
N(t.o
o(t
F6xa,
LLoo:EoEE
tttCL 6tt.6 '=66o o.rsEt!3.-OU6&o('l
€'-j 60L I9J9=3r 9ccr 0,e Cl>
" ?'E'=!v Oa/|o.-o9e EFo oe>(, 0{, er.-t3s
FIo(J
=&eo&n
H,&?it)
nslFA
f,
o
6
E'0tG-tuo>o
c)co!o6(l('
!€t+e
o
an
oo--cooLoA
\o
A.L2
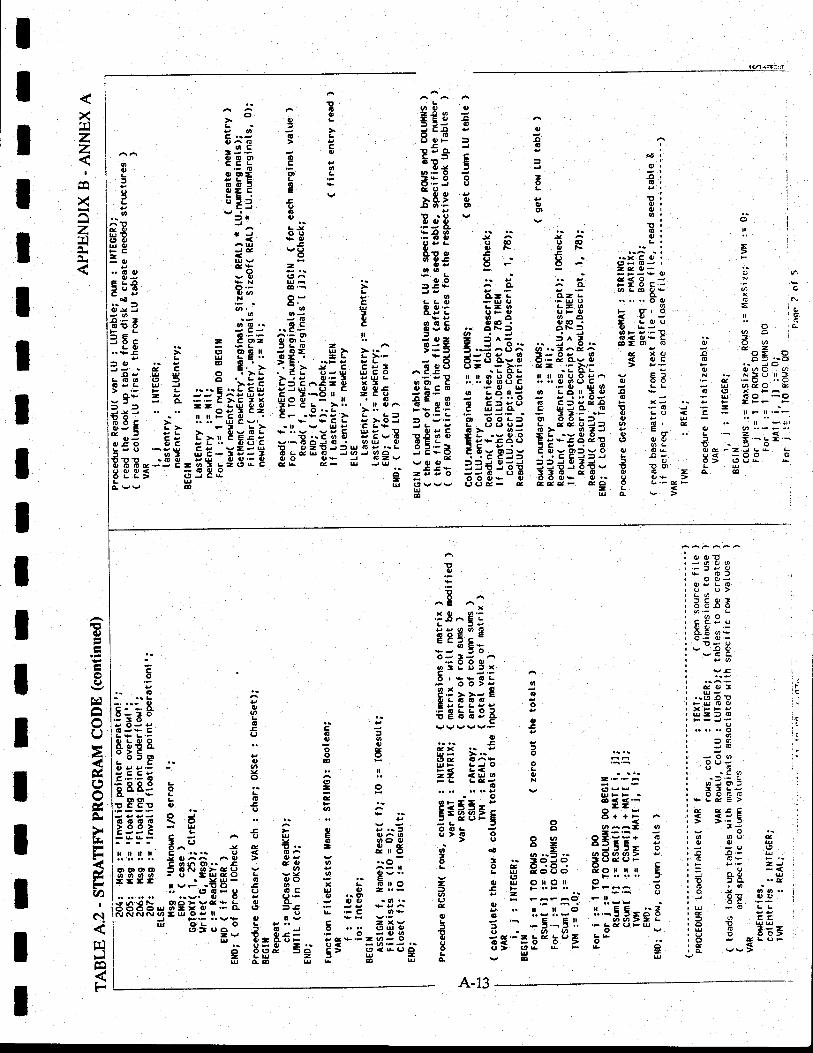
olsl
l
=l>:
lq.slrJ
oa
o!6
ooo!GoL
xctue ar,-<o-ocr-
8..... oEr.o
<oe-(ncx<,o>e
tL
o.oG
JtoL
oot
q,
€
5oIJ
q,.'t
!t P_eaeCL- L CLZ LFUO '-Ugg-O !-@aF a, oF c,oaa6O(O . OO .ctN: 6N32 i^j j^i
T .-i ^3: a.-d ^&:=:8a-8
t= P-r-9a- .:- >.- e= .:- -':-Mnooo! ilnoqc)&A:'.;'. €, ot, C .... O oo C.;O U .FOr Aoo LArI- o LOll JO-.e Ei'*i E Eiie.tgt ooLt gr ooL=_kr-oHj h.*"3d3iL.vctO -L -voOE:-fe' EE*5e*TqqEP=; q.tEP35-33=d.9E€ 33€-3 6d--J 6 O O I t 6 q GOOOb lU OOrus O..OOg- e eeg- eA
u
ttI
3A
'i3^E!9Uaoog9E.E- - 6 E*br f OO- t-.Fooq,olLotxC-'-AO . e9 O Lo o >v aP.r >. >.- g ;g!g3g- 6.-6LLo: uttEooeo-
C,VVVVV.- AI
f=' ;:..€ E ...-E-'33E o R'?b< L<
=E tA! o -'-''-'l'....! v A--'-,-i- I g!!'-'EiEEEE ^ aTT;A6h. Z 3 ./'--S o:'s i EE eEEE:Ec d
-.-3.. QQoq> ve E E E:d: E3T?i e
= e F PrLell 9:--" :A E =
F"F'.- ;';i oF_-F(f F Ie 9 .. u'- u -o :1.-EE-; ecl 6 ..:.':
; i ': -; -;1'' '- -P3-6'E ;z.-=E-b"= b* :.6 Ot Eo s F s 2
JJoaorJooFots=Et
A
:- A E li^b ; 3 r f dEa..i o L 8"jcraP ) -.t=.= b 9f-o-PEP E - hp-.- o . _,2tOgt- gr L;5E L '' t:3Fiq g ; -E"--ti"e= € -b*.:v.O93r O ! -!9r oolP
LJ ..=Bri eE ;€p^U .c {r!Lia -E &qesr v " ttfr':H E- .e i;H; E= ; 3#€;; ii E rlg
-O O 99
= i 3; d;E' ; i::= ;' :hS 6> >,.^ g;5t E qgl -6.. -.: r>,- :.en E : 1',t jE'r -,"'IE Eli ^E"eiE ? .,.,: ,.'iE g Ej E:$? E E E; g g;;= a ;;e;;H; *eEl=,:t ,a;E^ €E'le
?TelH ei e: -.€:9. 'r:'1. it.E'ii, :'.:ip,ie;,> --u*_*E! Ele: .-*1.i_
-gE ;i:ig:E i;le;:;"Et: 3ti;-.-'iE-o,E-93l:t g€ &: d .58* vo{r-=
-E': Ee a -r5b- g-- ; E---Uro
oq,L
afg6
ooo
o6(,O-L-OAG!a I.-tlto
Lc6cLQ'95olleoo
O-e:)
og-34., r!o
Eit60qroLL
eUt5uF
=
e
cG,
-ooF=
t-tctolet.- o
lc- -.ClO-.3Ol,-34ivA-vlcJbC
| 8.b€ 8.lo > cI ott'lIL CleCEe
l: E.e3ICL 9t60l!cc!tooGolu33elil tr il n
looosrto660l----I
ls60t\IOOOOUINNNN oIE
x'Ylzz
I
X
za
IIIIIIIIII
I
q)
oU:&o
,FFcn
I
c!
rri
F
ItIIIIII
N
:c
o.-b-
rrJ
'so
ell
3oQn 4Z! o=h .i Jo {rooN tr N=9
E '-Ou aeooexFs OOt * -tsF=E - 1lFil.. x rll
O O.rr-F !r!.-=<: €,_sE._1fr:oOg-ZJLG !9< -OO Oo> g9Ga6
!-O JLQ
Fr eE.'00GL-Duo1roo=aJ*L.'gF
v
0r {J!-6AO.-:te(J
6:O O+Os L 6o o>
ooCCreooCE c*O.- O.-!:9vcA
o
aoq
o
o
(:t
=EFo
F
106ae
t,!o
ooooeoL
'ttoIoLc
Lo
rc,oq,eo
T'q,IoLc
3
I
4
G
.Fa
E>sc3-O.-os 4OU3.- UCs ts tr
=Jo -<O.o u: Q- ..d
: OO..oro o E,oc-o Ll.t' UUo t--o oo>
GLUF
q0Ju-..9 _O
FU GX.F Fu25
-o
Q'Itoo*Lge e
oo
J'
o
qq,ec,
tr
o
s.itoeoogclo.-o
6loz..F
voqLO .rsc:.8
oooaD-o YoL(9O:.-thaorSF oV,Rd
tE;ac-AeuE:^L, ! - {.. =E ...- I < G^.ioaa Aa, > oe vE6not.- a co o5aNo>co O v=o -pfr9 h ;E .ZxvF.t,O E o x L;- s6io tJ 6c u q,
.-v.- ct O v (J|.' q, .roge=E::e3 9t n:2-u9.:Lr* o tv-os o a P.. ec5ioo- € E=j .9 ..6u 6= O'> ec5!F-
oF 0, Z'- 0< -o O€E >o E> !?- tr = J ur d6 g B E
U4
UIg
zxvgs q,
6-O<btro
=u
A-13
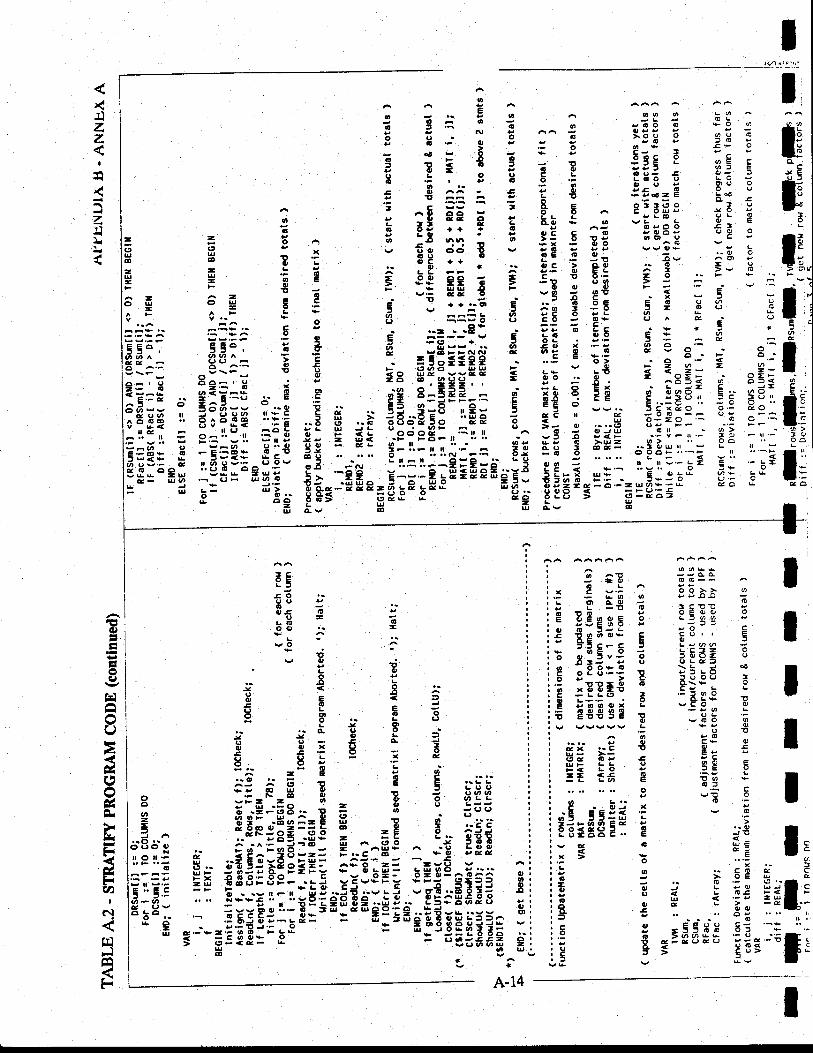
rl
!^8" :;iE :!i i''.;9e-*
E E i:i=; Ei i $l;; f E3 *;! l: : li I
i: E g; f s" -.i3 ! ..!3d;;t€; ;E E; Eli
!i 3fi, i,i'li ?,
=li !,1
;i t *dE .ff:i;: E! i;: TE I3H E ::: 5E3i
$:aE.iE t-;;lli;= Ei ;;= i= |
EE8 S E=H;5 ,l
I
?^ ^^A-A Ii s-€E iit= llix E -.: A ;;>> , ' Iro e yea!
; I
iEtg-;lE iEEE ; - |
i;ttE;; : iil; lliE ffii : cii; ; rli5ff:Sr -=rE: rliuu=€ E
-;!; lii EE T; ! EE ;i;::i: 3;; II c r 0J X '
iii=EEi:E v:
-. d; I'i.: g t v;! , ; SE tr Fit ? E E;iEAfflg $ ..o; ur
i.g fi =5.5FF E; ::-"-i! 9 ==p'&b E:="J'
a6o
otI€Etgao
F
5a(,e
u,e
F
-o
oI
6vloOJLO
.---Bi f vu6
cc:-u
oE
Noo
FA-o
o6 =44e++ +,r:,t: 1'cto !a++
Icr ct-- qUUl)d40+ + .-ltt
o9
+
<r(ao!--- UU'uC,
-=t I
teerClI ll:EU..U6tEe
'qll ll
oear-F-uOs<gaz
'G-ECU
=6v-EaAtgdLOo93!
E<?6_J
FE8aJo-i.'c E P jo-EB
9; :-u6; e li;;,Hfr t o oLL--ou:66
..t'ar-F E ? i ?-ea-E.F: =F i.-6;;-'Hl E ^^E.E A -.r iEE--- F..C C! 5o Pce
=E= ^Ci'--J '---€ .uitrE *_otH= bHgg^tti
;li EE-;-E FF= s-??lEi;i€s-ti -FE:^EEE=T: L=1Ir Ori .-u e.. L=]$ArOC g
3-ttr*"-e9!3-?tEbi55e- -*t-E -.13!e€38IJOJE Svaqq
L
{,o3{,gt
o-6g-O g
Jo!,suI
ao0,.t o9.- z.- o, (,ee aO g
FEE ;-6 -lo{, -_FCt6
= oob u? o t .roo= aooo-=
= A :-*;89a8ag ;;^;I3rs:ri E.- ut E3xE3
=-=; Hi ;g!.iRo-ytrs.- =U
OtOaJF()FFE"t.= b.--n-"6'-6 Nes.c " -. "*.H- =--E,"ll.-- 6- .- a c c a-n 9 - 'r.9d3.:'-ttr Z.--=.?,8 E** b*
Uo
IIo.tILoet!cG,tto9L3
Eoa,oooc(,LLoc,
E
q
6o
o
gaatLoo
r'l
zza
7r'l)r:r
..-aa9
U:.!5o6A4 0t-
-5o;o50atatoFxl
oEbcr
l!:.!5o6A4 0t-
-5o;o50atatoFxl
oEb,cr
-ct(o s:o 6
.v, oDZ Ct:-:3 0rd..ts) oct c'oo otI
-llFll
!otLeu)o o
-
5I(J
5v,eF
-oE5og
6to
5-oa9euo
3G
=543ruUXoE'i-tuEG
=ge !,--Gog E .:
AFL9".1'^
b oc'-;,r E -g
55', 6 gvr6 'aHU ^.= t' Ev\Fo- -6e='t i,.g.E=t c P
; !?Eps i,:: .E si .b.rub= ^EE yt tr 1F.3 9=:i,:l ;" g .9- = fi:E iFt€: E;3 :t ; .::on llgH'Eo-.1 - o.6 iryEq.--5:-a1f :)':38.E bt -4.- 8&t'-dcE; 69 go>
El o'v
z(9Uaa
zU--OU -
5 50 ,
deo ^.-
-., q
^3'- "OO'v4AO
A Ct 6loIG
E.F6sfv<(eco ct
e-
,EYEEOoooo3
Ig6oo
a
E(u7trt:cI
E
oL)
x(,o&E
trF&F(A
a
e!
glJca
F
l1A-14
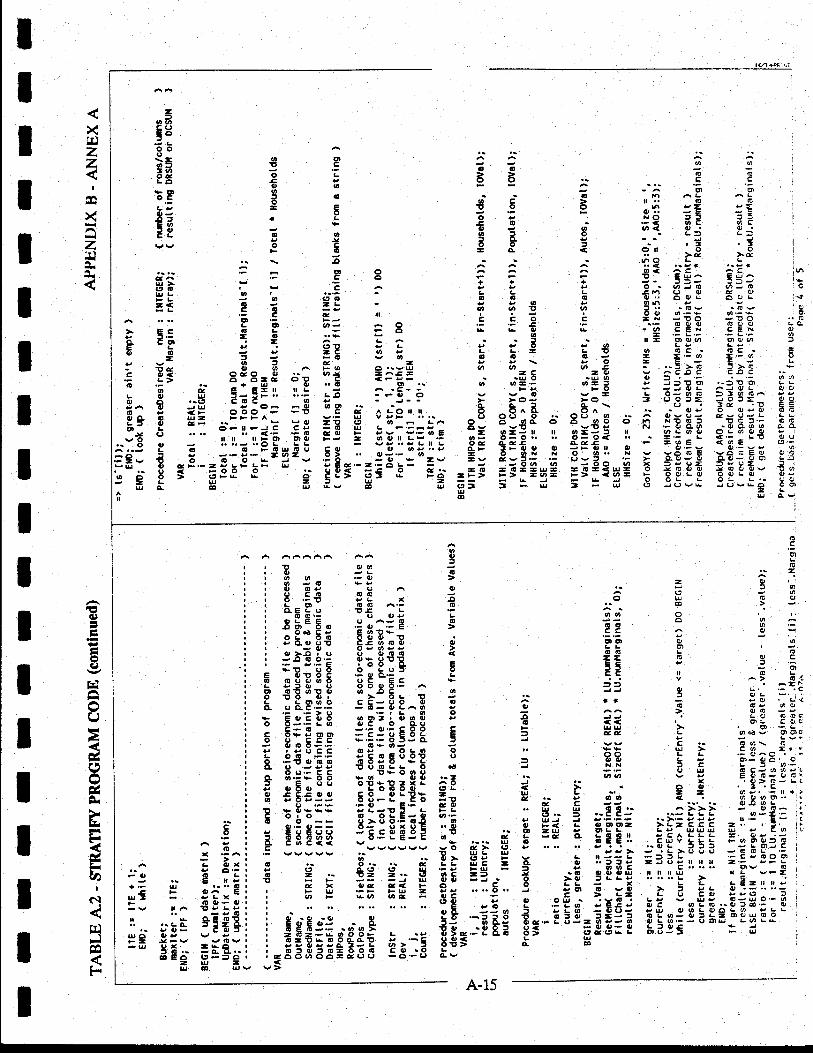
Xrrlzz
I
X
z'r\
€q,
;oe)
ftl
oUEI()o&E
ExF&-it)
I
6l
rq
lasF
IIIIIIIIIIIIIIIIIII
Aqg,3.5A;33e!eaEEo6>€--isrEsIeE€ln:E:E.-PiE;96=E=t9 A O . .t< u-tg tltci " t E 8 -1 gj tj6i-t&3t-Fdtcl .. >-c >e\ A - 6C! L !
o' o ^ ^ ^
"< "sr 'rercoi + + , ll C€: Es:c ^ v t v o - @J6 0r@
- L L L 4n O - O 4 C]6 E O G O 6 0 " O O q O 9 Lr =b
- t, A g A gy: -;_ .;_.= r- u i i E i gs :!E {;EP u'- s I l! :: n E :'A Egg egsG ..b O - '_ L'- '- t'-- L
^ 5 . tr- OO@ OQo. s! v L - z g t € " bE . ;: -Z =E
I -,- E s \ e E # t:g E:{o A -a 5..'U 0 o o I - "!>q !>A8; X 6'i :.i ?:t E .- o- ".8.E ;E g I 3: i ; .-:; ;E=tr n. - a-E-- Fri Fo .- -Jc,L ^JoLlF:'. ;..; Lr! : -g- 9 ; ;:o_9 yo- i 8; gE I E gE-o- aO 6ch . o' d : d \ .. -uoJ 6-crJ9;'- '-E -.: fr 0!9'11 .- I o8^& .. o8^o !-:== E*
=E E '::==;i:
8; ?lg*:; ;lg€,? a il*a ;!B;llEE PE -- = gg:t-':,,'i 8a 8;€" :' 8E-30.-:*qEo 69 .. "*.,'i::. =-
g-ES g E*ar E - E€3E E€iE$=-'-; lEs"=E8!= i; =;i 7i4r4 I!s:*3 i 3;gfr ?Ett-
= I-- g-
= a= t: d ;: d 3.35-'::5-.!r6
cU> egGgL 6tsL-< I-L C
Af
i5.59c cglELlQr6-
-59vq.i Eg Bs@ '- a e"L G' U
=JO 6 ..gl CG94 O' JU P6 t <F Ooo o, 6 uz FFL f O EFo L eefl
J Ovo tr ro{,A.-, a 6 O.:9- € 6 ;'-;eu a, sF.--.4rrO < -goo o o > ctFu=LUra@
tr
^'=29-toe46ou.l{.J E>
06 0 .6OOO o '-CC o !v-gr(' q q
!L o! .oo L oE- € G' CEE-) oE- tr o L
v A> o(=t
. -=l=J G, L' '- 'c
t Q L e, i ,
tt tO . stOf o qt hutl JJ . LO ccs6F uuf 8e .L oqt g)('|s
t -
Lv.vv C .- 69\ C
.. 9s UOO L L .-Cr^O r ?
= OO L ! o-oo' o
= rN t c s 5 6,-
Q U RC_qAeluro u e q,o-qr6.i s . o 5 .'3?E-:'r' L !. = 2 oe.'-ll+,)A e 6 6 <( . !) qoct.' r- e C -4 OtoOL" 8.. g .-EE: ..:ilt -,3E: ;:u uJ J !'=.=! .r>t-sve u'- so -- L a, oo- >L- c c c 2 '. . :. r|O 28 9 CDLL L'? gUU U Y EO'(! :: : F5:l -qFt::i i*ip,:E ,ev> d.L>9gU -GGLL ltJ-b .-=rL -CeOOOo o ..Jt.i -J9enufl -- v>g=- , ooc c...... grv G
= -@ Q O aru tr [ n u I L ve-
6 >o JLL! ......L6 La J x L L LE-rrxeJ Pttt 6 vo- C- t !- L I CO p€e fe, OU. .v6. a.4 u2 1a=ryo'-o 'i .;Eo ,eEv OC oLo..Of o- o€ ;53 =E9: ;t,38599bS!,!;b'gg'-'u-=8t=3 g 5 E':J e es56> grr(JBs ItoJ:l F aLg0,6i
^AA^A 8
t, QJO =O Js Oa o .-o
q dO 5Yo, ov o a oo co 6r!O .-E eL x .oL O 66 A'' OCIELo 'Oc L .'
G O'- 0 O! g
SbEEo ':"^iE Eod ce E otboL o6 0oo !eo.oat caq6 (, !,JO- O9OYY >O>.-Orq9OG@rlI 6 O.- Ob ettt;o-tE 5"!;9 E,3E36 tEo'Ec .!!fo I ooilro.- Ac.(J 6tt o o -o c oEO O.! oo O C C- q O O Ooclc.-.- r-o-oL^o y.F>o.-.LOOE.9.5Eg 3g'6"93 vc.-6 -.,qr'?coo
gO$.Jo-!oD ,'C-9EO^ Ea CCC 5'-.-OJ-e JO O O.F'F 65 O-6;"'S': 3E'e8b€ E.-ltGroG OOIO sLO-ryy ttO€LL O .tO o.- C C Es O o o6'FbOO eq g g .rI
E qo Otl*tttxL ^0aroo Lo60(| crL3c3(,(t co arLtte -yOe-- OOFL EC, iE
o .-,- .-o E., Eo$ {rsss s Lrtt t L F LO. o 6 OLE-O o'-O -- 9>9O.-6.0 6g'6gEE 3;cEdt5 "€ :r60(00|, O.- LE-C 6 eCoC<.<( v 5 u- vvvvvv vO c> (j'vvvvv 1t gl f4 .. O> Cte F
O.- e LL gg -g .. sg :.. u '6?- =5Exoss<FoE
F U '-F FU - 9.! ....9..q F Lo ol gE .i.. E f 6
o -o -o r 9& '-=EBEcrECrJ - CL 3r ocLYEFE;r"'BBI L .r. Tg..-'g&e3=Er!3tgE fi,'-5 t€SotOtc-ooG Cqr.o t6O{rO6-dLrL, _O.-.J O.v
-oqc(JE6
ooo\-9AoeL6bEtoc
.oteo=ogL
I
!
!
I
I
i6tcj$
..eLAo
E6L
q)0g9
L LLG€@ a-Ot,tE gag.F
o cr6v EoAe.a o c,It oo3L
I
E€LotLCL
ocoLI$etaPo
acoGT'
e
ClOl
Ol>rOxlcl.- |
n9r..OlEIXl
!OlGtt '-Q-to2 t
=o I
=
xLo
6totteEE
-B(rr -uaa
eO+r' u3Fs3FFV il Atis.. ..LC
I O-uo o!>= J-v-u C)X
e si'u
A-15
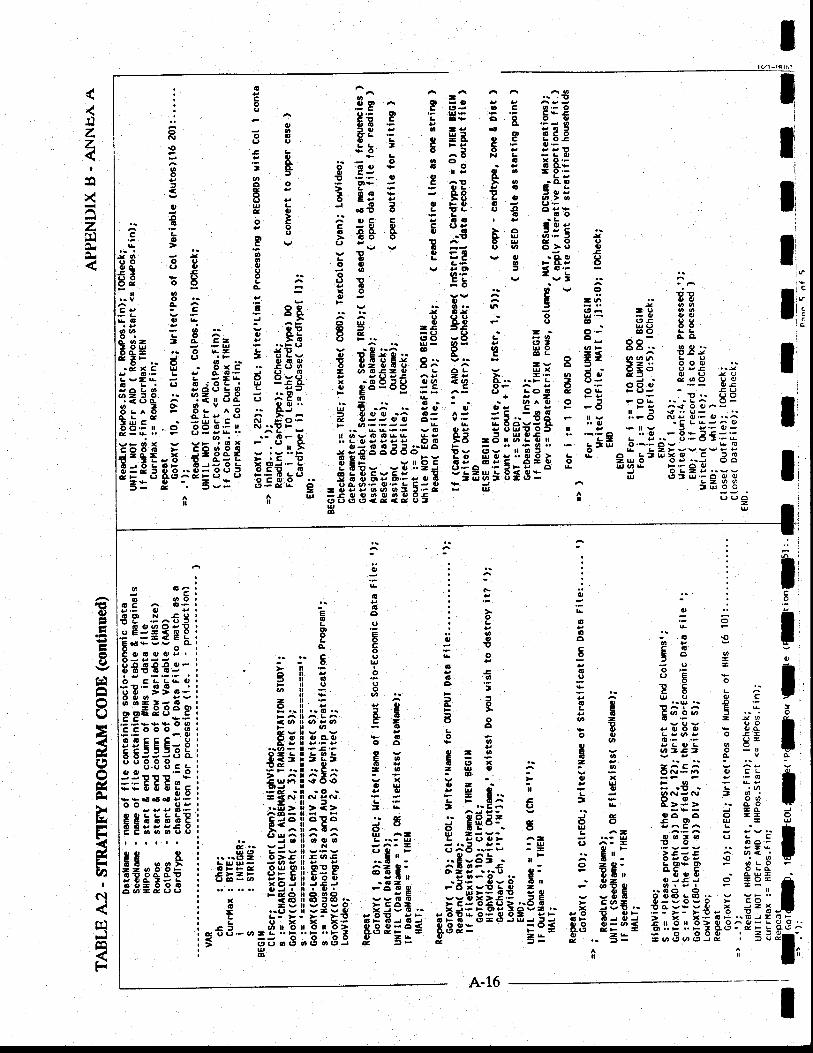
I.el r;:
II
-i
i
lrII
IiIIII
lir:II
I
rill
r'lzz
I
xz!d
: 3 ^^ A A A A Ao
: E 3ei E3:;E ^-3.: - i ilq f EE f i.E:€! 2 i $: ::ei€Eti3 1F $E:: ;I: EI iF;Z A e 'ig:i .s6? b8 i;gE ; -6 gg E : 9E E e, 6>'6t E ! :-;€ 3 3EE 8E tir3 o C ; e,E F r -'o ' Y -'L5 s3 5i33i;:FBE:;i$ '6 E!-- gFE -, -.&g t8 E f; o E ;E€ - g;€ F r E; vEi 3 *-:'i
" i^;: : : E! ;; i ev-? ,. irse E sE. :i s.- n t ;l =i 6n'!i 5;F aG -
APPENDIXC.A}INEXB
Annex B to Appendix C
Screenline/Cutlines for 2010 Alternatives
t-
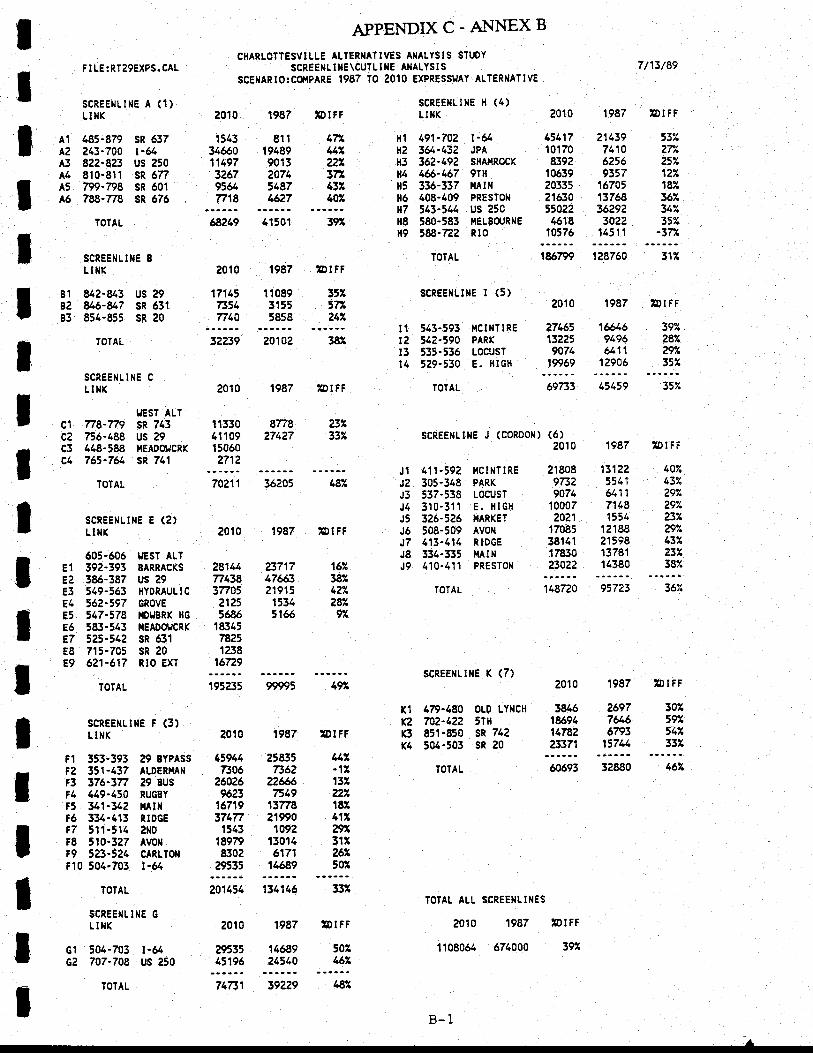
C?'
znaz5z124182362347,357,4n
47L447,zzt37'|43r,4U
A1
A2A3A4A5A6
lItIT
FI LE:RTZ9EXPS. CAL
SCREE}ILINE A (1)LI}IK
485-879 SR 637243-700 r-&822-823 us 250810-811 SR 6777W-n8 SR 60178a-778 sR 676
TOTAL
SCREEIILINE B
LIIIK
u2-u3&6-847854-855
TOTAL
SCREENLINE C
LITIK
I,IEST ALT778-n9 SR 743756-188 US 2944E-588 UEA0oSCRK765-761 SR 741
TOTAL
SCREE}ILINE E (2)LINK
605-606 yEST ALr392-393 EARR cKS
386-387 us 29549.563 HYDRAULIC562-197 cRovE,47.578 I,IDIJBRK HG
583-543 T,TEADOJCRK
525-512 SR 631715-705 SR 20621-617 Rro EXT
IOTAL
SCREENLINE F (3)LI}IK
APPENDIXC.AI.{I.{EXBCHARLOTTESVILLE ALTERNATTVES AIIALYSIS STUDY
SCREEIILTIIE\CUTL I }IE AIIALYS I S
SCENARt0:CO,IPARE 1987 T0 e010 EXPRESSIJAY ALTERIIATIvE
'OIFF
SCRgEilLINE X (4)LI}IK
7/13/89
?010 1987 tDrFFe010
15433466,011497326795647718
1987
811194899013207454874627
t-&JPAsxAr,rR0cK9THtlAl llPRESTO}I
us 250I,IELBCTJRIIE
Rt0
Hl 491-702r{2 3&-432H3 352-t9284 166-467H5 336-337il6 408-109H7 543-544H8 580-583ffg
'88-722TOTAL
45417 2113910170 74108392 625610639 935720335 1570521630 ',13768
55022 3629?1618 30?2
10576 1451 1
us 29sR 631sR 20tii
6E,249 41501 t97
z0l0 1987 ,orf F
17145 11089 35U7354 3155 37rn40 5858 24?,
20102 381
scREE|rLtlrE I (5)
1867?9 1?8760 317,
2010 1987 ZDIFF
K1
K2K314
uz337
$a38X42?28A
YL:
c1c2c3c4
E1
EZE3E4E5E5e7EN
E9
tIII
tIItI
3??39
2010
1 13304't109150602712
877827427
1987 ZDrFr
t1 543-59512
'42-590t3 535-535t4 529-530
TOTAL
HCINTIRE 27165 1&6PARK 13225 9196LocusT 9074 &11E. HtcH 19p,59 12906
69733 45159 352
SCREENLINE J (CORDON) (6)2010
?180897329074
100072021
17085381411783023022
't18720 95723 367.
39z287.297.35?,
70211
2010
36205
1987
482
,DIFF
J1 t+11'59?J? 305-3/t8J5 537-538J/i 310-31 1
J5 326-526J5 508-509J7 413-414J8 334-335J9 110-411
TOTAL
I,ICINTIREPARK
LOCUST
E. HIGHI,IARKET
AVON
R IDGE}IAI N
PRESTON
SCREENLI}IE K (7)
479-480 oLD tYltCH702-L?2 5rH85t-850 SR 74e504-503 SR 20
TOTAL
TOTAL ALL SCREEIILINES
1987 ZDr FF
13122 407.5541 432&11 ZvA7118 ?f/.1551 237't2188 297.
21598 43713781 8/14380 387.28144 23717
77138 4766337705 219152125 15345685 5166
'18345
78251238
16729
195235
2010
99995
1987
49z
'DIFFtAt-1r132227IET41129/31Xz6z502
2010 1987 ZDIFF
w6 269718594 764614782 679323371 15711
302,9251233u
F1 353-193F2 351-437F3 376-377t4 449-450F5 341-312F6 334-413t7 511-514F8 t10-327F9 5?3-521F10 504-703
29 EYPASS
ALDERITAII
29 BUS
RUGBY
HtIr{IIOGE2lrDAV0tlCARLTON
t -64
45941 25E357306 7362
26A26 22ffi9623 7549
16719 $T7A37477 219901143 1092
18979 130148302 6171
a$5 14689
60693 32E80 46?
l3lI
TOTAL
SCREENLINE G
LI}IK
504-703 t-54707-708 us a50
TOTAL
z0't454 134146 332
2010 1987 'OIFF
28535 14689 50215196 24510 462
2010
1 1 08064
1987 ZDIFF
674000 392
74751 39229 I+87
B-l

F I LE : RT29ALT6. CAL
SCREEHLINE A (1)LIIIK
485-879 SR 637243-700 r-618?2-823 US 250810-811 sR 677799-798 sR 601788-77E SR 676
TOTAL
SCREEHLI}IE 8LT}IK
uz-u3u6-84785/.'855
IOTAL
SCRESXLINE C
LINK
IJEST ALT778-779 sR 743756:488 US 29448-588 !{EADoUCRK
765-764 SR 741
TOTAL
scREEl[t]rE E (2)LIIIK
Hl 491-702frz 3&-432lf3 362-192H4 4&-467H5 336-337H6 408-409n7 343-544H8 580-583H9 5U-722
TOTAL
t-&JPASHAXROCK9THltAtllPRESTO}I
us 250XELBC[JRIIERt0
ilCI}ITIREPARK
LOCUST
E. HIGHIIARKETAVOII
R IDGEilAtrlPRESTO}I
APPENDIXC-ANNEXBCHARLOTTESVILLE ALTERIIATIVES AIIALYSIS STIJDY
SCREEXT IXE\CUTLIIIE ANALYSI S
SCEIIARI0:C0f{PARE 1987 IO 2010 IITERNATIvE 6
SCNEE}ILIilE H (4)LI}IK
'DI FF 201 0
7/',t3/89
70IFF
IIItItIIIIlIIIIIIII
53'6437,327,?5%217.?9v.157.277.3T/.
A1
A2
43A4A5A5
c?c3c4
2010
1543346601 120830449134E:t67
41501
2010 1987 tDrFF
17145 11089 35A7339 3155 57A7n5 5858 21/
20102
201 0
112193344725307
1424
1987 IDIFF
35205 ' '1r
1987 ZDTFF
scnEEuLtlrE I (5)
543-593 r,rct xT I RE
542-590 PARK
535-536 LOCUST
5?9-530 €. HrcH
IOIAL
42671 21139 5071024? 7110 287"8:t78 6?56 257.10117 9357 11I20534 rc715 EZ20813 1376€ 31/47908 3629? 2424733 3022 3625613 14511 -302/.
28011 131229657
'5119377 61119527 71181966 1551
17152 1218839?71 2159818951 13781226a1 14380
169349 128760 247,
2010
3368513t929377
19846
19E7 ZDITF
76101 45459 40v.
1987 XDIFF
1987
El119t+8990132074Jtr871627
47A417202tzz42445?
us 29sR 531sR 20
81B2B3
t1r2t3t4
1&16 517.9496 287.&11 3?v.
12906 35:[
8778 38227427 fia SCREENLINE J (CORDON) (6)
2010
605-606Er 392-393ez 386-387€3 549-563E4 562-597E5 547-578E6 583-543E7 525-512E8 715-705E9 621-517
TOTAL
27786 23717&694 4766328218 219152534 15345122
'1663176791719519
14365
iJEST ALTEARRACKS
rjs 29HYDRAUL I C
GROVE
}IDI,'BRK HG
I{EADOIJCRK
sR 631sR 20NIO EXT
29 BYPASS
A[DER'4AII29 BUS
RUGBY
ilAItlRIDGE2HD
AVoN
CARLTO}I
t-6/
Jl 111-592J2 305-348J3 537-538Jl 310-311J5 326-126J6 508-509J7 413-414J8 334-335J9 410-411
TOIAL 156596 91723
15u26z?zz3%
'T
TOTAL
SCREENL I }IE G
LTIIK
504-703 r-&707-708 us 250
TOTAL
'f 98540 134146 " 34
2010 1987 ZDTFF
scREElLmE K (7)
479-480 oLD LYITCH
702-422 5TH851-850 SR 742501-503 SR e0
TOTAL
2010
61027
1OIAL ALL SCREE}ILINES
2010 1987 rDltF
1100783 674000 39z
193476
2010
48U
IDIFF
387.597,517.322
1987
26977&66793
1574t
4338185961478523308
r1K2x3K4
ZDT FF
scREE[Lr]lE t (3)LI}IK 1987
F1 353-393F2 35r-437F3 376-377tl 119-450F5 341-342t6 334-413F7 5t1-514F8 510-327F9 523-524Fl0 504-703
57380 2583510426 736225079 226$983',t 75191.6?5 1377838654 21990't334 109?
19515 1301485E7 6171
30909 14689
31/?9/t0z8Z17r4312913322825A
61G2
30909 14689 5410293 24510 tgr71202 39229
B-2
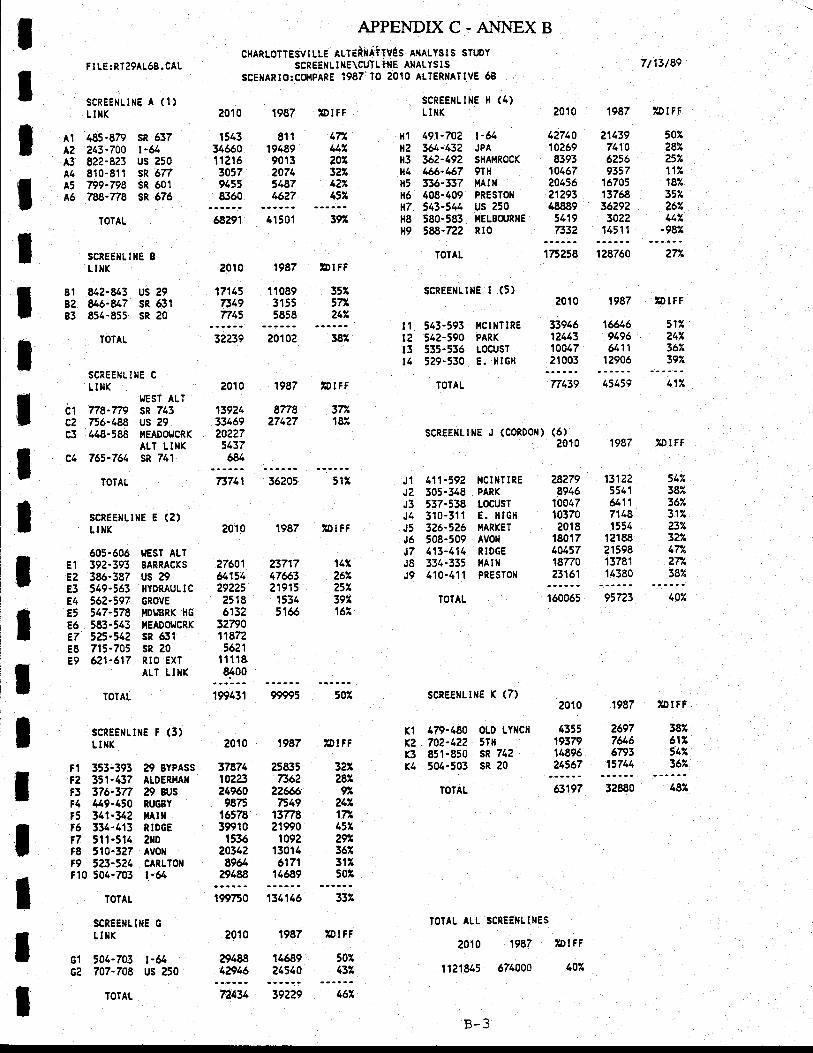
512242367.397.
54'438X36:z31223iL32XlTA27't38%
38U617542362
431519379't489621567
K1
K2K3K4
sTt181
142?6225239/162
342829/
24A17245/29A36U311502
e9488 14689 50142946 24540 432
'|.71457349774'
A1
A2A3A4A5A6
c1c2c3
c4
-c1ce
IIIT
IIttIIIIIItIl
I
FtLE:RT29AL69.CAL
SCREENLINE A (1)LI}IK
t+85'879 SR 637243-700 r-&822-823 US 250810-811 sR'677799-798 SR 60178a-778 SR 576
IOTAL
SCREE}ILINE B
LINK
81 u2-E/3 US ?982 *6-U7 SR 63183 854-855 SR 20
TOTAL
SCREE}ILINE C
LIXKIIEST ALT
778-Tn sR 743756-488 uS 29448-588 ilEADoIJCRK
ALT LI}IK765-761 sR 741
TOTAL
SCREE},ILtNE E (2)LINK
605-605 UEST ALTE1 392.393 BARRACKS
E2 386-387 US 29E3 549.563 HYDRAULIC
E4 562-597 GRoVE
E5 t17-578 IDLJ9RK HG
E6 583-545 I|EADOJCRKe7
'25-512 SR 631
E8 715-705 SR 20E9 621-617 RrO ExT
ALT LINK
TOTAL
SCREE}ILIilE T (3)LIIIK
F1 353-393 29 BYPASS
F2 351-437 ALDERT{AIF3 376-377 29 BUS
F4 449-450 RUGEY
F5 311-342 il tlrt6 334-413 RTDGE
t7 5t1-514 zxDF8 510-3e7 AVOH
F9 523-t24 CAirTollF10 504-703 r-6/
TOTAL
SCREE}ILINE G
LIIIK
504-703 r-&707-7A8 US 250
TOIAL
APPENDIXC-ANNEXBCHARLOTTESVTLLE ALTEiHAiIVES. AXALYSTS STUDY
SCREEXL I IIE\CUTL.TIIE A}IALYS ISSCENARIO:Cq,IPARE i987' TO 2010 ALTERIIATIvE 68
1987 DIFF
811 47X19489 4449013 ZOr2071 3225t87 LZZts?z 452
SCREENLINE H (4)LI}IK
rf1 491-702 t-& 12740H2 3&-t32 JPA 10269H3 362-492 SHAT,|RoCK 8393H4 466-467 g't)t 10467H5 336-337 r{Aril 2A456H6 408-409 PREsTol 21293H7 543-541 US 250 48889H8 580-583 !{ELBCUR}IE 5119H9 58a-722 Rro 7332
7/13/89
2010 1987 ZDIFF?01 0
15433456011215305791558360
21439 5027410 287.5?56 2529357 112ft7a5 187"13768 3r7.36292 267.3022 t1Z
14511 -98241501 392
1987 'DI
FF
11089 3523155 5725858 242
68291
2010
201 02
2010 1987
't3921 877833459 274277tO2?75437&
38X
ZDIFF
tl 543-593 I|CI|TIRE 33946 1&612 542-590 PARK 12443 949613 535-536 rocusT 10a47 &1114 529-530 E. HlGil 21003 12906
TOTAL N139
SCREENLIilE J (CoRDol,l) (5)10
TOTAL
SCREENLTNE I (5)
175258 12E760 27/.
e010 1987 UDIFF
15159 417.:
1987 ZD I FF
73741
2010
27601&15129225
2518613?
32790118725621
11118
..i::199431
2010
50t
ZDI FF
26977&66793
15714
23717476€3219',t'
',5315166
3787t, 2583510223 736224960 22fr69875 7549
16178 1377839910 219901536 1092
20342 13014896/. 6171
29188 146€9
36205 512
1987 ZDTFF
J1 411-592J2 305-348J3 537-538J4 310-311J5 326-526J6 508-509J7 113-414J8 334-335J9 410-411
TOTAL
I,ICI }IT IREPARX
LOCUSTE. HTGH
}tARKET
AV0ltNIDGE,,tAltrPRESTON
SCREEilLINE K (7)
479-480 OLD LYITCH
70?-422 5TH
851-850 SR 742504-503 SR 20
TOTAL
28279 131228916 5541
$047 &1110370 71482018 1554
18017 1?18840157 2159818770 1378123161 14380
2010 1987 'DIFF
f99750 134115 332
2010 19E7 'DIFF
63197
IOTAL ALL SCREEIILI}IES
2010 19E7 lDl FF
1121845 674000 407
B-3
481
74431 39229
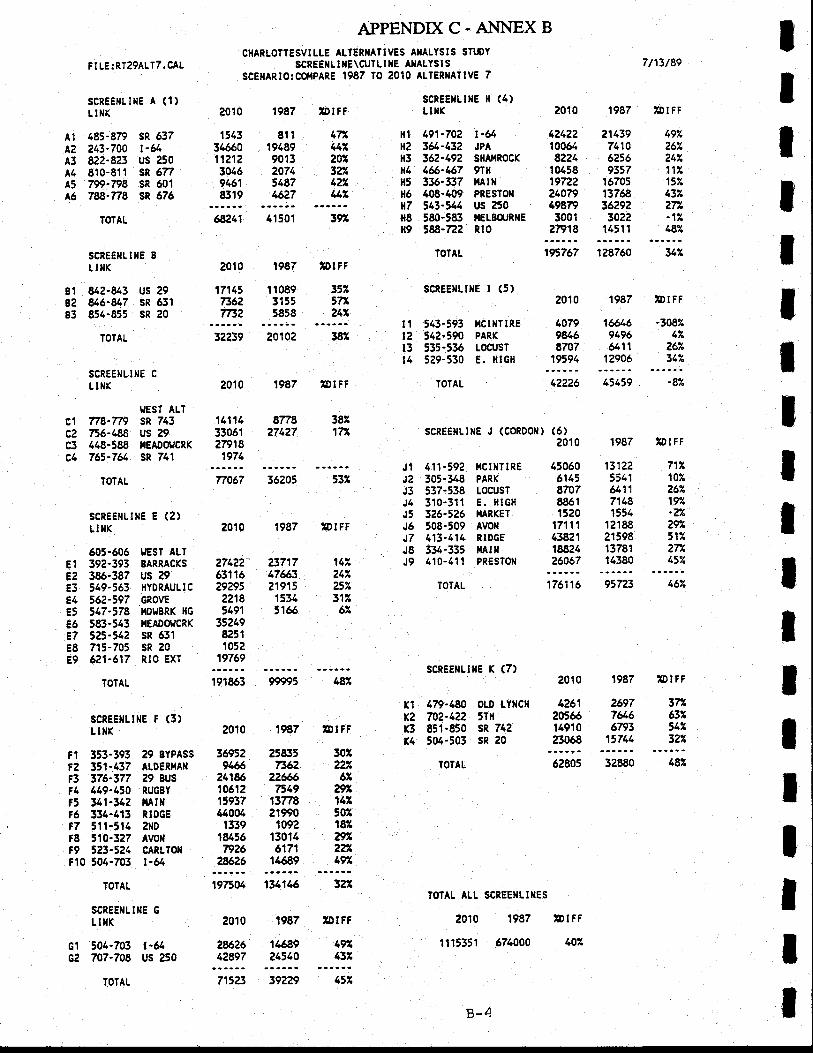
Ft LE:RT29ALT7.CAL
scREE|rLrlrE A (1)LINK
485-879213-7008Z?-823810-81 1
79'-79878-n8
TOTAL
SCNEENLIIIE 8LI}IK
842-843u6-8r7854-855
TOTAL
SCREENLINE C
LI}IK
UEST ALT778-n9 sR 743756-488 us 29448-588 r,rEADot CRK
765-761 SR 741
TOTAL
SCREE}ILINE E (2)LTNK
605.606 UEST ALT392.393 BARRACKS
386-387 US ?9549.563 HYDRAULIC
562-597 GRoVE
517-578 r,rDr,,8RK HG
583-513 IIEADOIJCRK
325-512 SR 631715-705 SR 20621-617 Rro EXT
IOTAL
SCREEIILTNE F (3)LIIIK
Hl 191-702H2 361-432H3 362-492fl4 4&-467H5 336-337H6 {08-409n7 513-541H8 580-583H9 588-722
TOTAL
J1 411-592J2 305-348J3 537-538J4 310-3tlJ5 326-526J5 508-509J7 113-414J8 334-335J9 410-411
TOTAL
42122 ?113910064 74108224 6256
10458 935719722 1670524079 1376a49E79 362923001 3022
27918 14511
APPENDD( C. A}iNEX B
CHARLOTTESVTLLE ALTERNATIVES AITALYSIS STI,,OY
SCREEXL I IIE\CUTLI XE AIIALYST S
SCE}|AR!O:COf{PARE 1987 T0 2010 ALTER}IATIVE 7
lD IFFscREExLmE H (4)LITT ?010
7t13/89
?DIFF
IlIIItIIIIIIIIIIIII
49i125iL247.l1z157.137'27l,'17.18rl
47r44?'?02327.42?,tAz
sR 637t-&us 250sR 677sR 601sR 676
A:A2A3A1A5A6
2010
't5433465011212304694618319
1987
81119489901320745487t6z7
68,241 41501 39/
2010 1987 ;DIFF
32239
t-64JPASHAI,IROCK
91HilAtxPRESr0llus 250IIELEOJRNERt0
SCREE}ILTXE I (5)
t'l 543-593 llcl]*TIREtz 542-590 PARK
13 535-536 LoC1'ST11 529-530 E. fiIGH
TOTAL
SCREENL'IIE J (CORDO}T)
195767 12E760 317,
2010 1987 IDIFF
1&69196&1',|
12906
(6)2010 1987 lDl FF
B1g?B3
c1c2c3Ct
17145 11089 3547362 3155 57r7?32 5858 24r
us 29sR 631sR 20
877E 382274?7 17X
20102
19E7
381
IDI FF
407998/,66707
1%94
-30824Z
267,317.
2010
141143305127918
1971
n067
2010
36205 531
1987 ZDTFF
r,rctltTIREPARK
LOCUST
E. HIGHI,IARKET
AVOIIRIDGEfiAnlPRESTO}I
45050 131??6115 55118707 &118861 71181520 '1554
17111 1218843821 2159818824 1378126067 14380
71210v.26/.197.-22z9z512?771S1L147
2&EZ312
6Z
E1
e2E3E4E5E6E7E8E9
3012U6l
8/14',5g,,181z9r,22?,4%
27422" 2371763'f 16 4766329295 2191522',18 15345191
'1663521982511052
19769
176116
2010 1987 IDIFFSCREE}ILIIIE K (7)
1'g-4€,O OLD LYllCH
702-4?2 5TH
851-850 SR 742504-503 SR 20
TOTAL
191853
2010
482
prf t
37763751?32?
K1
K213x4
4261 ?59720546 7&614910 679323068 15711
Fl 353-39312 351-437F3 376-37774 119-150F5 y1-312t6 334-413?7 511-514F8 t10-327F9 523-524r10 504-703
29 BYPASS
ALDERI,IA}I
29 8USRUGEY
ilAttlRTDGE
2lr0AVoltCARLTOIIt-6/
36952 258359466 7362
241% 2266610612 7'4915937 13778tA004 219901339 1092
18456 130147926 6171
2*26 14689
1975c4 134146 32'.
2010 1987 IDIFF
62805
TOIAL ALL SCREEITLIilES
2010 1987 ?DIFF
1115351 674000 102zu26 14689 49/12E97 24510 437
t -64us 250
G1
c2
TOTAL
SCREENLI}IE G
LIilK
504-703707-708
IOTAL 71s23 39229
B-4

A1
A2A3A4A5A6
lIT
II
APPENDIX C. AI.{NEX B
CHARLOTTESVILLE ATTERilATIVES A}IALYSIS STUOY
scREEllt I ilE\CUTL I l{E ANALYST S
SCENARIO:COIIPARE 1987 To 2010 ALTERIIATIvE 7AF ILE:RT29AL7A. CAL
SCREENLINE A (1)LI}IK
485-879243-700822-823810-81 1
799-79878-n6
TOTAL
SCREEXLIIIE 8LIIIK
uz-&3&6-U7854-855
TOTAL
SCREENLINE C
LI}IK
I'EST ALT778-779 sR 743756-488 us 29448-588 ilEAooJCRK765-7& sR 741
TOTAL
SCREENLII{E E (2)LINK
SCREENLIIIE H (4)LI}IK
191-702 r-6436/-{32 JPA362-192 sHAllRoCK4&-467 gTH
336-337 xAllt40E-409 PREST0II543-544 US e50580-583 nELECIJRNE
58-722 nlo
TOTAL
SCREENLIIIE I (5)
7t13/89
2010 1987 ?D!FF2010 1987
1543 81134660 1948911207 901330/.5 20749489 5$78317 t+6?7
sR 537l-5/us e50sR 677sR 601sR 676
bIFF
47144720234427,(*z
50u287.2621121%36227',t
57.47t
52/28%31237A
1987
14/69196&11
12906
35Xt7x247
,17.4?%31:/2n23231246227:|38%
,9261z,57.34?'
1987
26977&66793
15714
K1
xzBK4
H1
H2H3
H4H5
H6H7H8fi9
12723 2143910282 71108450 525510463 935720319 1570521500 1376E498?3 36?92t19? 3022
?7422 1451168261
201 0
4150'l 39A
lDI FF
194444 1287601987
't 108931555858
312
UDI FF1711573527742
us 29sR 651sR 20t:i
c1c2c3c4
IlIT
IItItlI
3223e
e01 0
111993339824150
2020
20't02
1987
381
,bIFF
201 0
tl 543-593 ICIITIRE 34376t2 542-590 PARK 13103t3 535:536 LocuST 9776t4 5?9-530 E. HlGx 20514
TOTAL 7N69
SCREEHLINE J (CORDOII) (6)10
45459
8r/8 3EZ27127 181
UDIFF
73767
2010
512
UDIFF
J1 111-592J2 305-348J3 537-538JI 310-311J5 326-526J6 508-509J7 413-414J8 334-335J9 410-411
TOTAL
}ICIHTIREPARK
tocusTE. HIGHIIARKETAVON
RIDGEt{AlrlPRESTOil
28742 131229550 35419n6 &119766 71182020 1554176f6 1218840191 21598'f 8853 1378123363 14380
505-606El 392-393e? 386-387E3 549-563E4 562-597E5 547-578E6 583-543E7 525-512E8 715-705E9 621-617
IOTAL
F1 353-393FZ 351-437F3 376-377t4 449-450t5 3t1'342F6 334-413F7 511-514F8 510-327F9 523-521F10 504-703
TOTAL
UEST ALTEARRACKS
us 29HYDRAUL I C
GROVE
ilOgBNK HG
IIEADOT.ICRK
sR 631sR z0RTO EXT
29 EYPASS
ALDERI,IAX
29 BUS
NUGEY
ilAmRIDGE?lrDAVoXCARLTOIT
t-&
27859 23717&793 47c6329751 e19152360 15345568 5166
332447n1101 1
19736
1599s0 95723
4010
4395195431497123782
152'26'?6235z,
7A
lgzbt o 1.87
'DI FF
SCREEILI}IE K (7)
479-480 oLD LYITCH
702-422 5TH851-850 SR 742504-503 SR 20
IOTAL
ZDI FF
SCREE}ILINE F (3)L IIIK
SCREENLI}IE C
LIXK
504-703 l-&707-708 us 250
TOTAL
199100 134146 332
2010 1987 ZDIFF
;9/431 14689 5olt2586 21510 424
62691
TOTAL ALL SCREE}ILINES
2010 1987 DIFF
1132241 674000 407.
37739 2583510128 736224998 2264610037 754916d40 1377839615 219901549 1092
19987 13014E976 6171
?9.431 14689
32zz7a97
25A17rt&730235231z,50r
t::I 72017
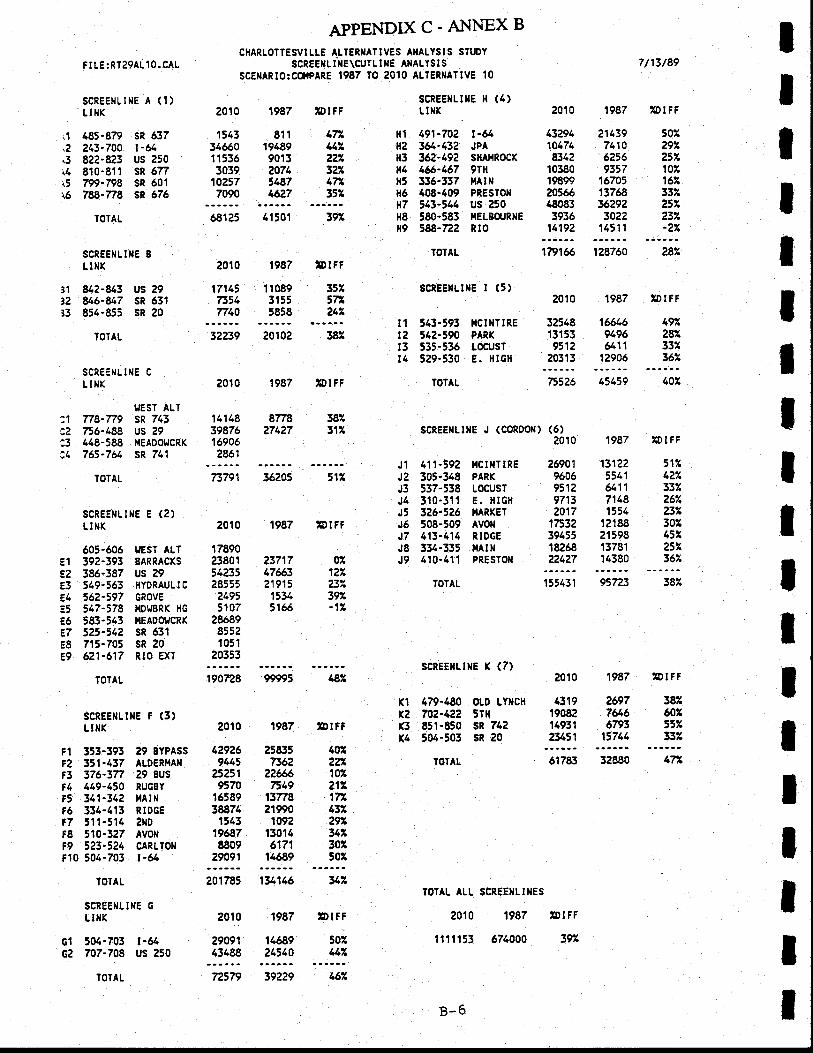
11089 t'z3155
'7/5858 ?42
us 29sR 531sR 20
\|,2i5i4\5\5
.):3
313?33
Ft LE: RT29AL 1 0, CAL
SCREEIILINE A (1)LI}IK
485-879 sR 637243-740 r-6/822-823 Us 250810-811 SR 6r|799-798 sR 6017E8-n8 sR 676
TOTAL
SCNEENLIIIE B
LINK
&2-8/.3&6-U7854-855
IOTAL
SCREENLINE C
LINK
I,'EST ALT778-779 SR 743756-t 88 US 29448-588 ITEADoUCRK
76t-761 SR 741
TOTAL
SCREETLIil€ E (2)LI}IK
H1 491-m2H2 3&-132H3 36?-192n4 4&-467H5 336-337H6 40E-409H7 543-541H8 580-583H9 588-722
TOTAL
J1 41',t-592J? 305-348J3 537-538J1 310-311J5 326-526J6 508-509J7 413-414J8 334-335J9 410-411
TOTAL
t-&JPASHAI.IROCKgTlll,l t llPRESTOilus 250IIELBCJR}IERt0
201 0
1543346601 15363039
1A2577090
1987
811194899013zo7454874627
APPENDIX C. AI.{I.{EX B
CHARLOTTESVILLE AITERI{ATIVES A}IALYSIS STTJDY
SCREEIIL t}IE\CUTL I HE AXALYSI S
SCEIIARIO:C04PARE 1987 TO 2010 ALTERIATIvE 10
IDI FF
4714422?7322471357
SCREE'ILIIIE H (4)ulK
6a125 41501 39t
2010
't714573547740
1987 IDIFF
scnEEultlrE I (5)
179166 128760 282
7/13/89
2010 1987 ?DIFF
13291 21439 S0Z10471 7110 2928342 6216 ?5r10380 9357 10?19899 16705 167295d6 13768 33748083 36292 25z3936 3022 ?3r14192 14511 -?Z
2010
269019606951297132017
175323945518268224?7
1987 ZDIFF
1312? 517.5511 4226411 337.7118 267.1554 Z3Z
't2188 30221598 45713781 ?5214380 362
4319 259719082 7&614931 67934451 15711
IIIIItttIIIIIIIIIIt
32239 e0102 381
2010 1987 IDrFr
14148 877839876 27427169062861
36205
2010 1987 ZDIFF
tl 543-593 ilCtltTrRE 32548 1&6t2 54e-590 PARK 13153 019613 535-536 LocrJsT 9512 &11t4 529-530 E. HIGH 20313 12906
TOTAL 75526
SCREENLDE J (CoRDOil) (6)
45159 407"
49.28z,337,%z
382312
73791
2010 1987
5fl
UDI FF
}ICI }IT IREPARK
LOCUST .
E. HIGHIIARKETAVOII
RIOGEt4AlllpRESTon
605-606E1 392-393E2 386-387E3 519-563E4 562-597E5 547-578E6 583-543e7 525-542E8 715-745E9 621-617
TOTAL
F1 353-39372 351-437F3 376-377t4 449-150F5 y1-342F6 334-413t7 511-514F8 510-327t9 523-524F10 504-703
UEST ALTBARRACKS
us 29HYDRAUL T C
GROVE
I,IDI.'8RK HG
IIEADOTJCRK
sR 631sR 20RIO EXT
E9 BYPASS
ALD€R',IA}I29 gus
RUGEYxAlllRIDGE2lrDAVOII
CARLTO}I
t-64
1789023801 237175t235 1766328555 219152495 1534t107 5166
28689855e1051
20353
0z1ZZ23?39!-1?
15t431 95723 382
2010 1987 ZDIFFscREEr{Lt}rE x (7)
479'tt80 OLD LYIICH702-422 5THE5t-850 sn 742504-503 SR 20
TOTAL
scREEllLtllE F (3)LITIK
190728 99995
2010 198V
l.8Z
IDI FF
4U2410221z171437az34;302502
382@z55z33r
K1
K?x3K4
42926 258359445 7362
23211 226E69570 7',49
16589 1377838874 ?19901545 1092
196a7 130148809 6171
29091 11689
51783 32880 47X
c1G2
TOIAL
SCREENLI}IE G
LI}IK
504-703707-748
TOTAL
t-&us 250
201785 134146 yZ
e010 1987 'Dr
FF
29091 14689 50243488 21510 44?,
TOTAT ALL SCREETILINES
?010 1987 XDIFF
fi11153 674000 397
72579 39229 167,
B-6
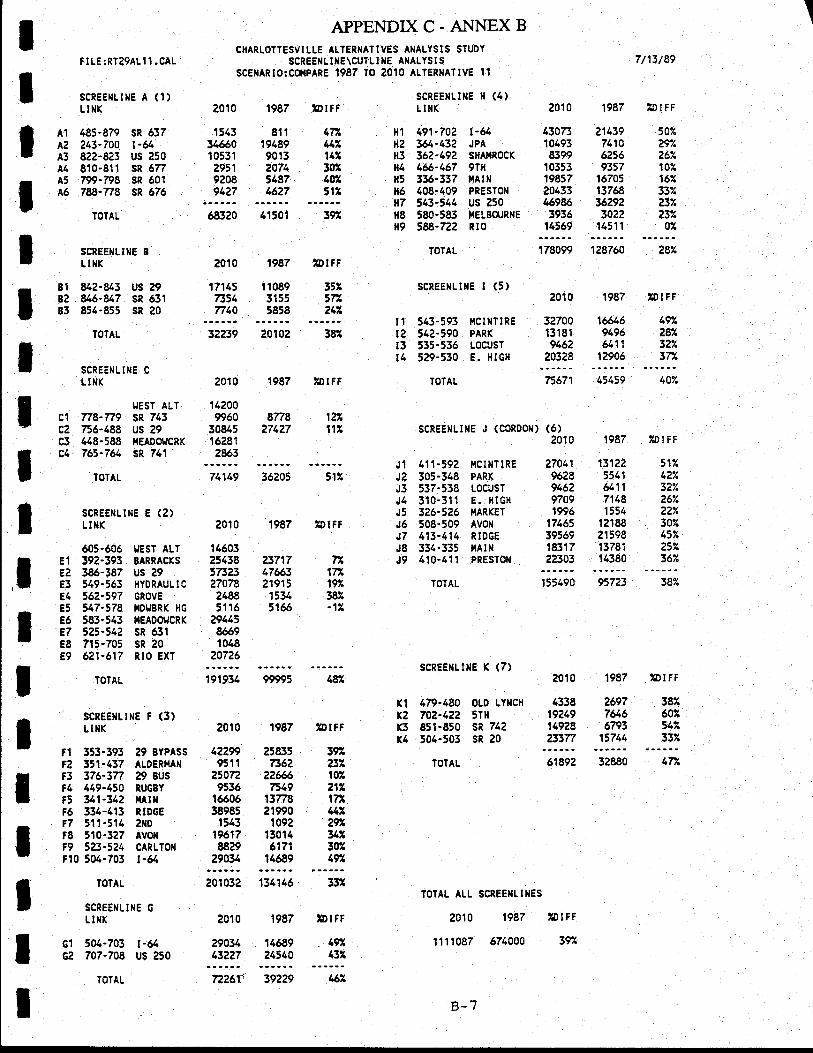
\
an./
297.?6%
167.33%232232
oz
47A4421423{n4ga5lz
sR 637l-64us 250sR 677sR 601sR 676
A1
A2A3A4A5A6
IIIlI
8n8 1427427 11I
c1c2c5c4
IIII
4338192191492823377
K1
x2Br4
397az't0z21/171I4Za7yl30r49u
IIItII
FILE:RTZ9ALll.CAL
SCREENLINE A (1)LTNK
485-879243-700822-823810-81 1
799-798788-7?8
TOTAL
SCREEXLINE 8tINK
Elz-u3u6-&7854-855
TOTAL
SCREENLINE C
LINK
T'€ST ALTn8-n9 sR 743756-488 US ?9448-588
',|€ADOUCRK765-764 SR 741
TOTAL
SCREENLINE E (2)LI}IK
APPENDIX C. ANNEX BCHARLOTTESVILLE ALTERNATIVES ANALYSIS STUDY
SCREEIIL IIIE\CUTL t XE ANALYS I S
SCENARIO:CSIPARE 1987 To 2010 ALTERNATIvE 11
SCREEXLIIIE H (4)LII{K
7/13/89
2010 1987 lDr FF?01 0
15433466010531
295192089427
1987
811194899013207451a7t$27
,OIFF
68320 41501
H1 491-7A2H2 36/.-4;2H3 362-192H4 166-167H5 336-337H5 408'409A7 513-544
'|8 580-583
H9 58-72?
IOTAL
Jl 411-192J2 305-348J3 537-538Jl 310-311J5 326-526J6 508-509J7 413-414J8 334-335J9 410-411
TOTAL
r-64JPASHAI.IR0CK
9THf,tAtllPRESTON
us 250}IELBCT.,RIIE
RIO
I,ICINTIREPARK
LOCUST
E. IIIGHI,IARKET
AVON
RIDGEilAtxPRESTOTI
43073 2143910493 74108399 625610353 935719857 1670520433 1376846985 36?923936 302214569 14511
lii2010
17145735r,7710
us 29sR 631sR 20
1987 IDIFF
11089 35X3155 57a5858 24?.
SCREEIILINE T (5)
r 1 543-593 r,rcllrTlREt2 54a-590 PARK
13 535-536 roCrJsTt4 529-530 E. HIGH
TOTAL
178099 128760 ?87.
2010 1987 1DIFF
32700 1&613181 94969462 6111
20328 12906
IDI IF
32239
4010
142009950
3084516?81?%3
20102
1987
fia
UDITF
49/a287.3?7.37L
75671
SCREENLIIIE J (CoRDoN) (5)10
71149
z0'10 1987
,12
ZDIFF
27041 131229628 5511946? &119709 71181996 1554
17465 1218839569 2159818317 1378122303 14380
51:t42%3U.26%227.30/.157.25rl36%
382602547.337.
1987
26977&66793
15714
7A17r197387.-lr
,l605-606
E1 592-393E2 386-587€3 519-56sE4 562-t97E5 547-576E6 583-543E7 525-542E8 715-705E9 621-617
TOTAL
F1 353-393tz 351-437F3 376-377F4 449-450F5 341-y2t6 331-413?7 5t1-514F8 510-327t9 58-124Fl0 504-703
TIEST ALTEARRACKS
us e9I{YDRAUL I C
GROVE
IIDIIBRK HG
}iEADOI'CRKsR 631sR 20RIO EXT
1460325438 2371757323 176f'327078 219152488 15345116 514/
2944566691048
20726
387"
ZDIFF
SCREE}ILI}.IE F (3)LI}IK
TOTAL
SCREE}ILINE G
LIXK
504-703 r-6/707-708 us 250
TOTAL
201032 134146 3:'1
2010 1987 IDIFF
SCREE}ILIXE K (7)
479-480 OLD LYIICH702-122 5TH851-850 SR 742504-503 SR 20
TOTAL
2010
61E92
TOTAL ALL SCREE}ILINES
2010 1987 ?DtFt
1111087 674000 397,
191934
2010 1987
r.8Z
?otFt
29 SYPASSALDER',IAN
29 8usRUGBY
ilAIltRIDGEzil0AVOII
CARLTOIIl-&
42?99 258359511 736?
25472 226d69536 7519
16606 1377838985 219901543 1092
19617 130148829 6171
29034 14689
471
29034 14689 49A432?7 24340 432l::
I72261'
B-7
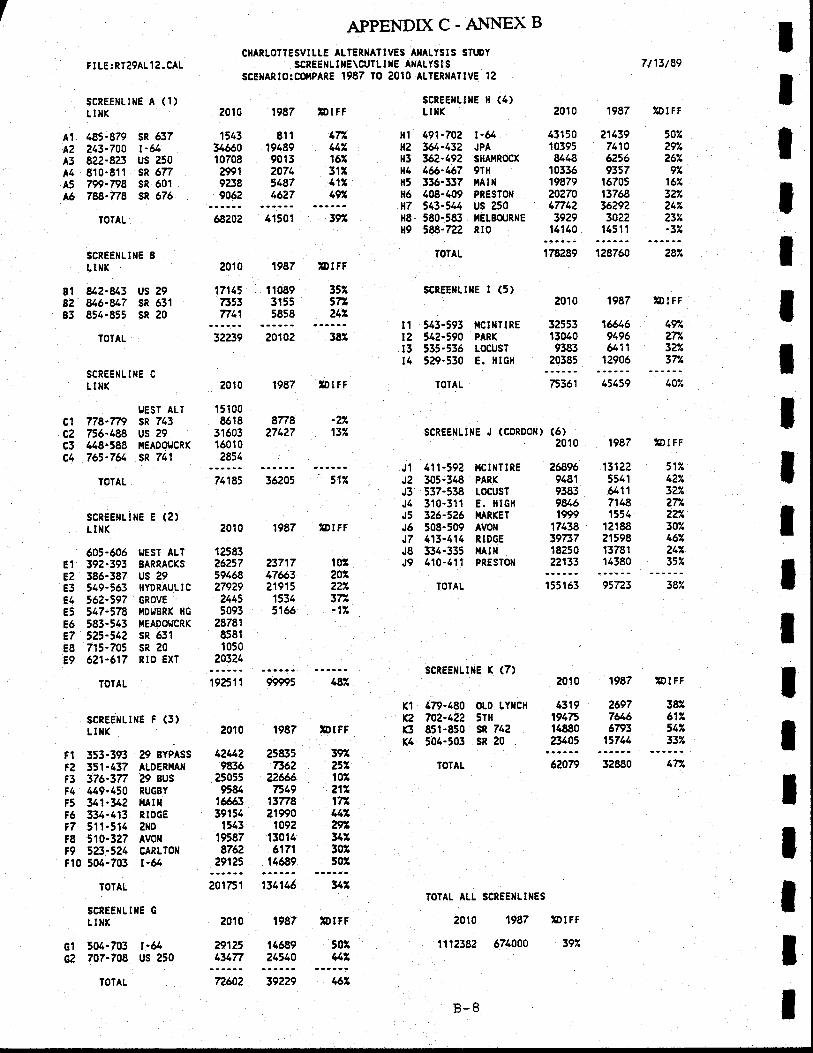
F t LE : RTZ9AL 1 2. CAL
SCREENLINE A (1)LINK
185-879 SR 637?13-700 t-&822-823 US 250610-811 SR 617799-798 sR 601788-7n SR 576
IOIAL
SCREEIILIXE 8LINK
u2-u3u6-u7854-855
TOTAL
SCREENLINE C
LIIIK
IIEST ALT778-n9 SR 743756-188 us 29448-588 ,,|EADo1,'CRK
765-7& SR 741
TOTAL
SCREENLI[E E (2)LIHK
r-& 43150 21139JPA 10395 7,10s,{Ar,rRocr u48 62t69TH 10336 9357lfArlr 19879 16705PRESTofl 20270 13768us 250 47712 %292tfELsClJRuE 3929 3022RlO 141t0 14511
7/13/89
2010 1987 zDtFt
178489 128760 287.
IDI FF
APPENDIXC-AI\iNEXBCHARLOTTESVILLE ALTERXATIVES ANALYSIS STUDY
SCREE}ILIIIE\CUTLIIIE AIIALYSISSCENAR!o:C0f4PARE 1987 TO 2010 ALTERIIATIVE 12
scREEilLmE H (4)LI}IK
IIIIIltItItItIIIItI
507.297.267.
97.162327,?4/.z3i/-32
47tuz16?,31r417.49/
AIA?A3A4A5A6
19227A327,37X
1987
1&69196&11
12906
32553110409383
?0385
51'/.12%32z,z7a?2'l307'467,217,3S't
38U61x54'33r
1987
26077&66793
15714
r1(?6K1
(3)
2010
1543v&010708?99192389062
1987
811194899013207151874627
ZDIFF
41501 39/
1987 XDrFF
rf 1 491-702ltz 361-132H5 362-492H4 4&-467H5 t36-337n6 408-409a7 513-544H8- 580-583lfg
'u-722TOTAL
Jl 411-592J2 305-348J3 537-538J4 310-311J5 326-526J6 508-509J7 413-414J8 334-335J9 410-411
TOTAL
68,202
2010
818283
17145 11089 35X7353 3155 5727711 5858 24/
us 29sR 631sR 20
20102 3E1
1987 brFF
scREExulE I (5)
t1 543-593 XCTUTIRE12 542-590 PARK
t5 535-536 LoCUSTt1 529-530 E. HIGH
TOIAL
201 0
75361 45459 rc%
scREElrLtrE J (CoRDoll) (5)2010 1987 ?DIFF
877827127
clc2c3c4
32e39
2010
151008618
316031601 02854
-22137
71185
2010
512
,DIFF
}ICINTIREPARK
LOCUST
E. I{IGH}IARKET
AVoilRIDGEilAltlPRESTOII
26n96 131229481 55119383 &119Pj/,6 71481999 1554
1?438 1218839737 2159818250 1378122133 14380
605-605E1 392-393E2 386-387E3 549-563e1 562-597E5 517-578E6 583-543e7 52t'5tzE8 715-705E9 6?1-617
TOTAL
UEST ALTBARRACKS
us 29IIYDRAUL I C
GROVE
I,IDIJBRK HG
ilEADoLlCRKsR 531sR 20nto ExT
1258326257 23717591fJa 1766,3279?9 219152145 15345093 5166
287816581t050
?0374
155163 95723
2010
431919181488023105
10z?0222/372-17
19251 1
2010
118/
1987 TDIFF
scR€ElrLllrE K (7)
479-480 otD LYI|CH7A2-Q2
'TH851-850 Sn 742504-503 SR 20
'OIAL
?oIFF
SCREE}ILI}IE F
LIIIK
Fl 353-393?2 351-437F3 376-3nF4 449-150F 341-342F6 334-413F7 511-514F8 510-327t9 523-521Fl0 504-703
29 BYPASS
ALDERI,IA}I
29 BUS
NUGEY
TAII{RIDGE2ltDAVorlCARLTON
t-g
12442 258359836 736?
25055 ?'26669584 7519
1&3 1377839154 219901113 1092
19587 130148762 617',1
29',125 14689
TOTAL
SCREENLIT.IE C
LI}{K
504-703 r-&707-708 US 250
TOTAL
201751 134146 y7
2010 1987 tDr FF
2912' 14689131V 24540
62079
IOTAL ALL SCREEIILINES
2010 1987 IDIFF
1112382 674000 3r/.
39?257102z1x172ua?9A317,30250x
47I
G1
GZ
50rtAl
72602 39229
B-B
APPENDIXC.ANNEXC
Annex C to Appendix C
ADT Volume Maps for 201.0 Alternatives
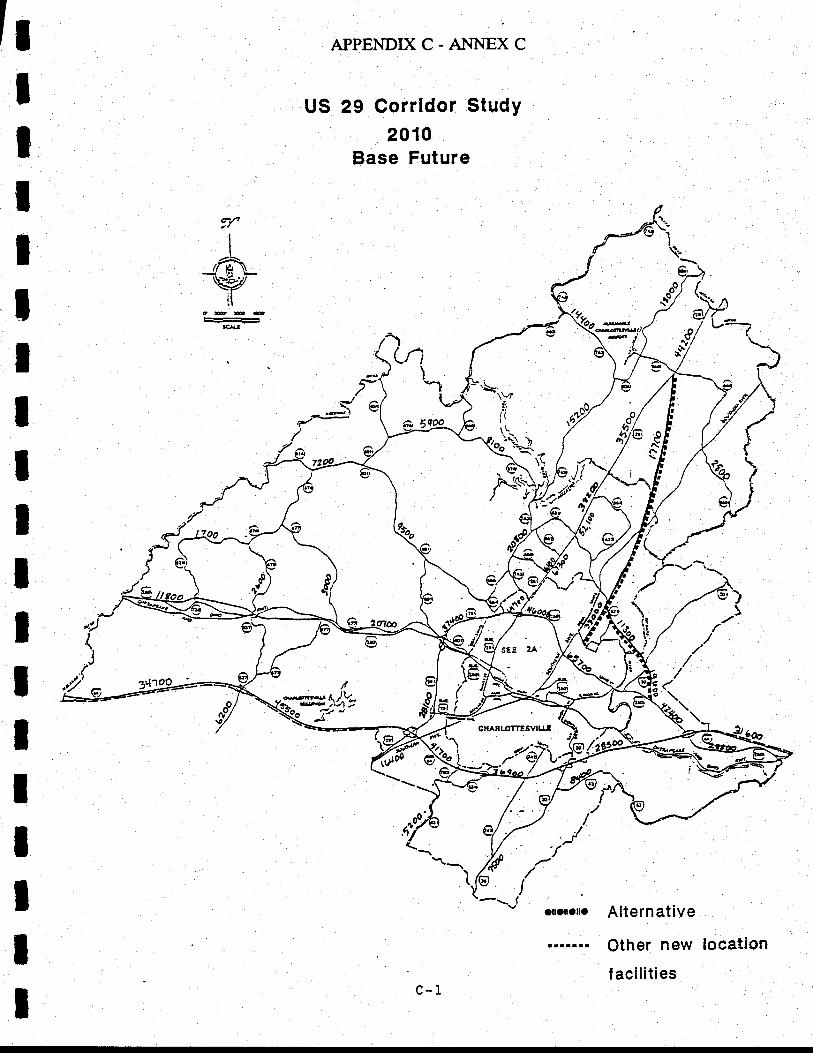
APPENDIX C. AI\iNEX C
US 29 Corrldor Study2010
Base Future
Alternative
Other new location
f acilities
(
%t..
(
I,t',,
llIIlItIItIIIlIIIIII c-1
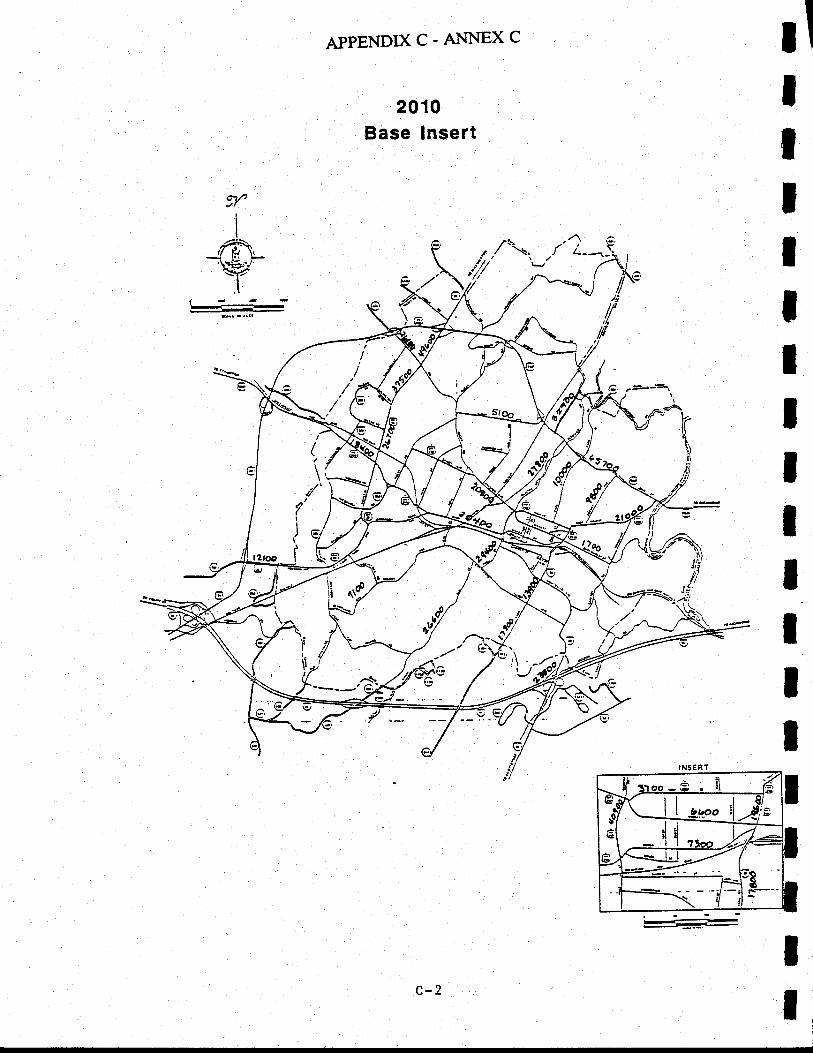
APPENDIX C. A}II.{EX C
2010Base lnsert
-i,,'-1.1/A€/a//t/
/f/
r'L-li:r/ \.
,'/ r' u, ,/t//a/t' rA
91'
I,4,n#-;l
L=+="::t'
\t/
/'It-.' Ert
t\u-fr:
c-2
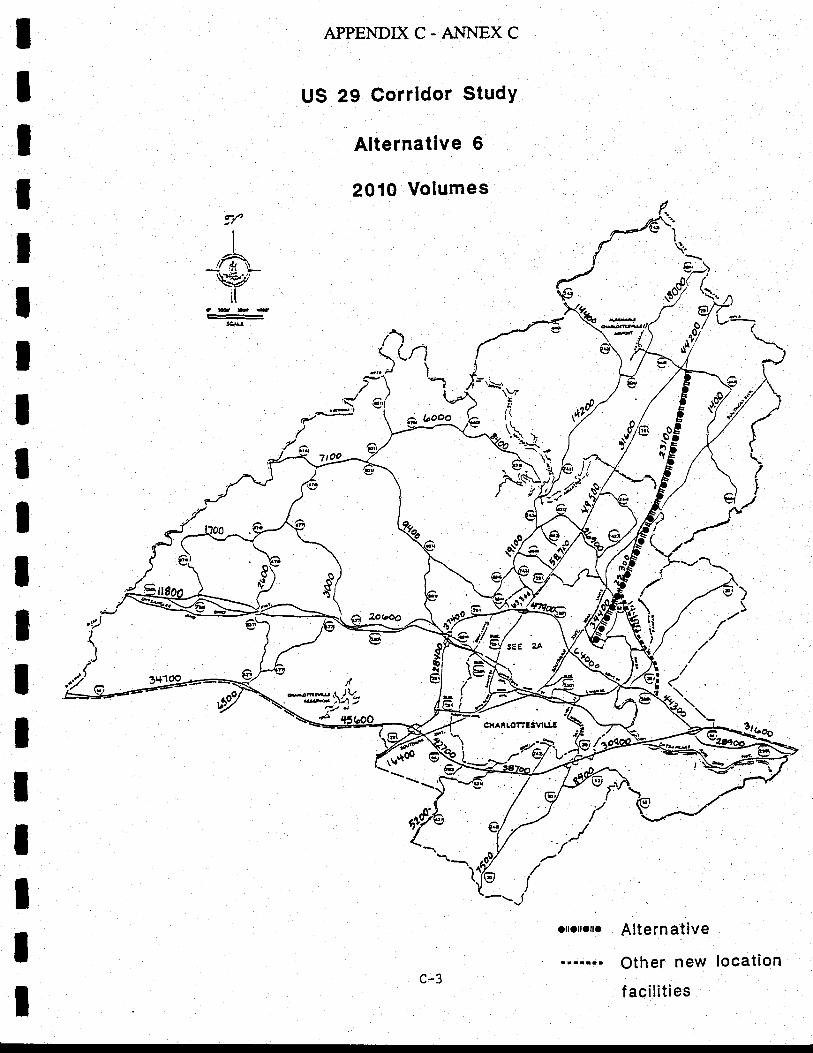
APPENDIXC-AI{NEXC
US 29 Corridor StudY
Alternative 6
20lO Volumes
rII/f"\lwril
a3-*
n\-'1
I
c. bOoo
1,.'io
ailoIalla Alternative
Other new location
f acilitiesc-3
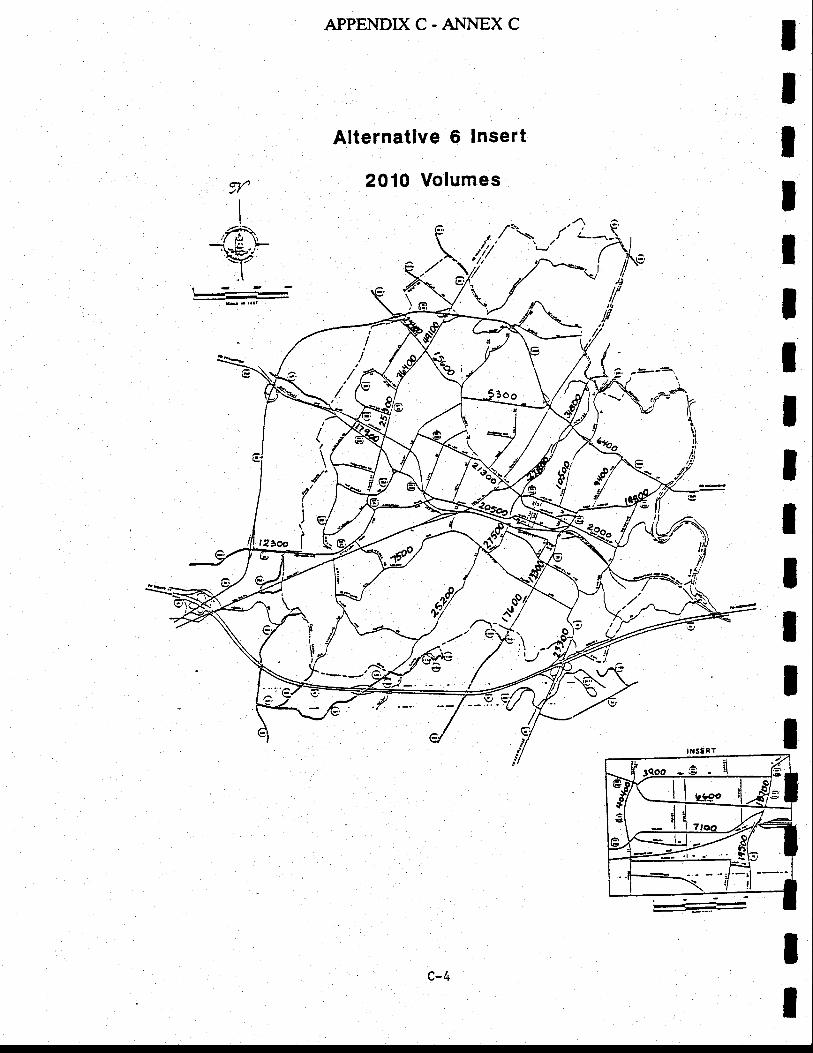
APPENDIX C. Ai"iNEX C
Alternatlve 6 lnsert
20 10 Votumes
tIIIIIIIIIIIII
,vII,,4'
\+;-;I
tF--:|-
C, .:----'
7 '\,
).L,,
(,
\{
a'(
i_(v
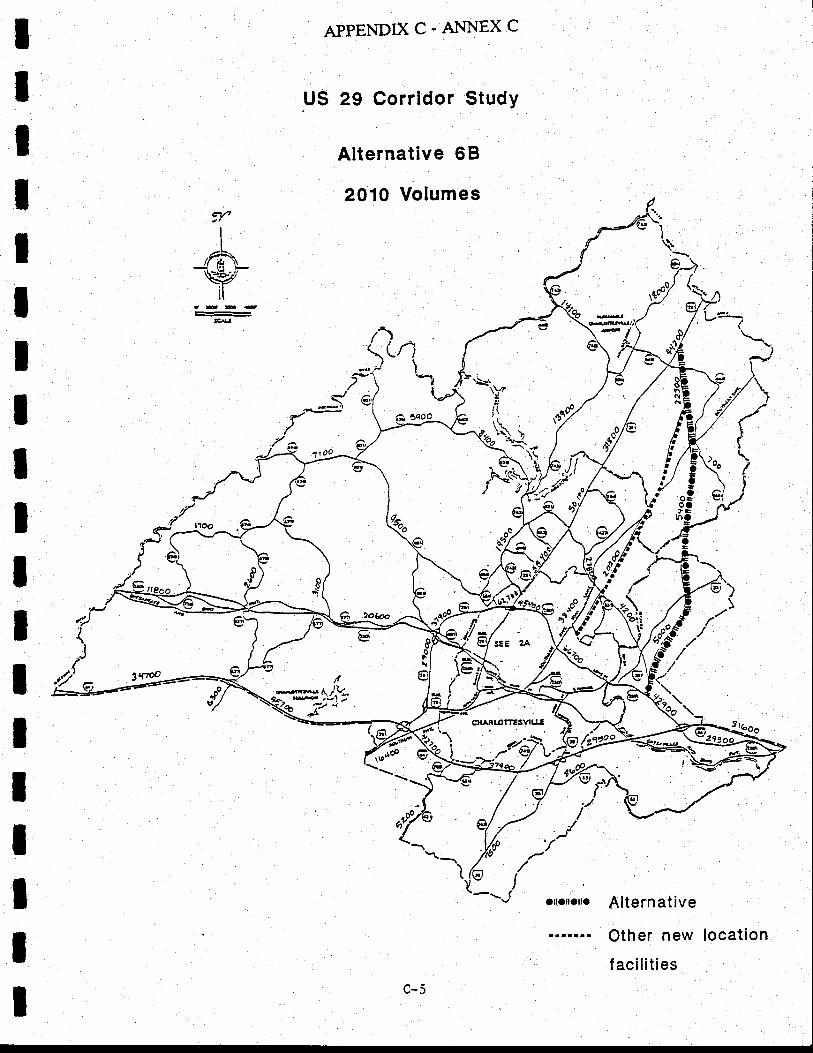
APPENDIXC-A].{NEXC
US 29 Corridor Study
Alternative 6 B
2010 Volumes
IIItIIIIIIII
ItIIII
vI
I/fhn€ri{
ff
le
/&//_/(vlv a[ailalla Alternative
Other new location
f acilities

APPENDIX C. AI\iNEX C
Alternative 5B lnsert
2OlO Volumes91"
It
,ffi'ns}-t
'---*=f-
,' ,/ \r.fu' ',-,e /.' tf'
-t1. (3,
.'t--q,\^a\. f Ao-\./ ilt/
t/tb\tp
,e-g/-'i/z<
IIc-6
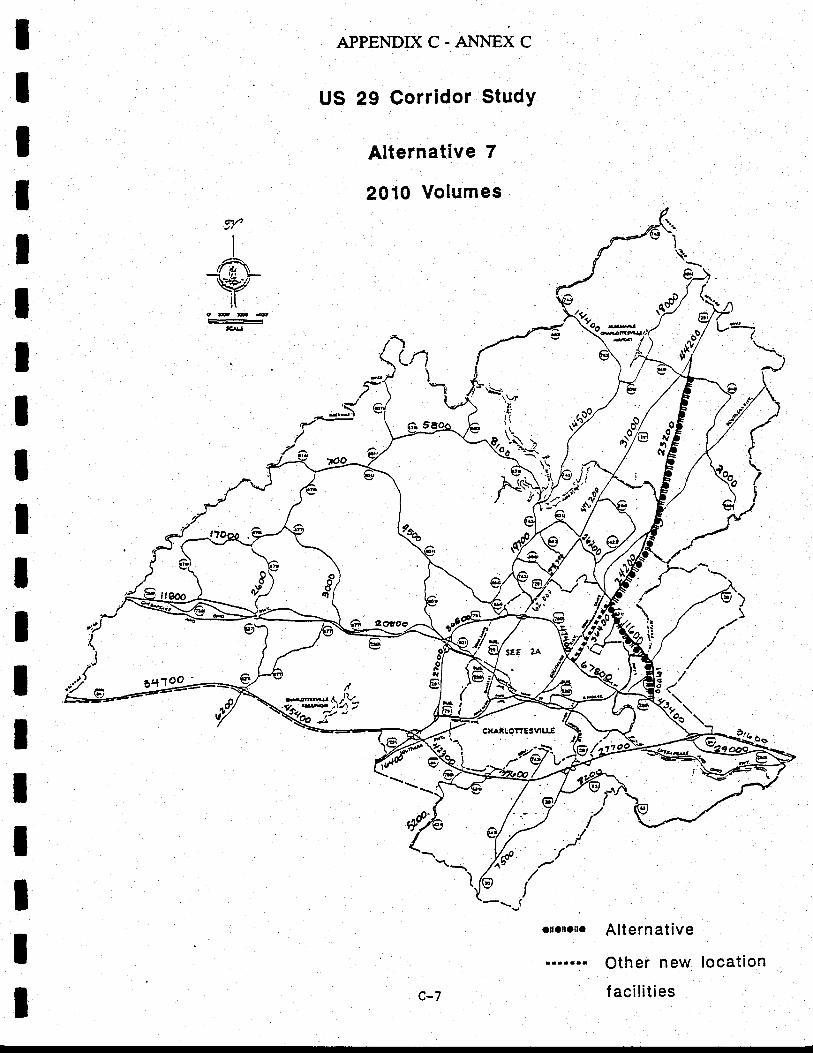
APPENDIX C. ANNEX C
US 29 Corridor StudY
Alternative 7
2010 Volumes
rII/f"\r€i-it
L*:;1--Qo ..=o
\s
o\yfi
\d\I.:l
9g (t.ta.
V,e "//az 7,T
I
ollallallo Alternative
Other new location
f acilitiesc-7
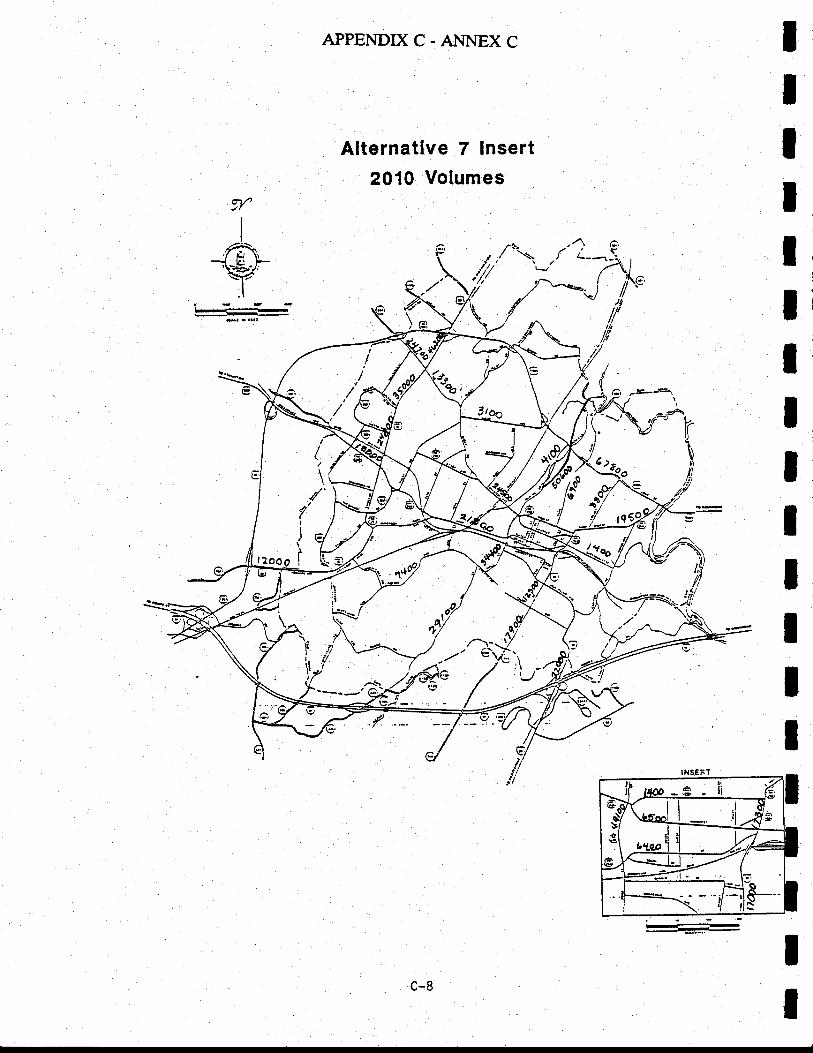
APPENDIXC-ANNEXC
Alternative 7 Insert2010 Volumes
9L
I
,,ff\,\+r:t
L_-jE:==::-
,r/\ ri)/' x
I/fr
'F slI '/_" ,
c-8
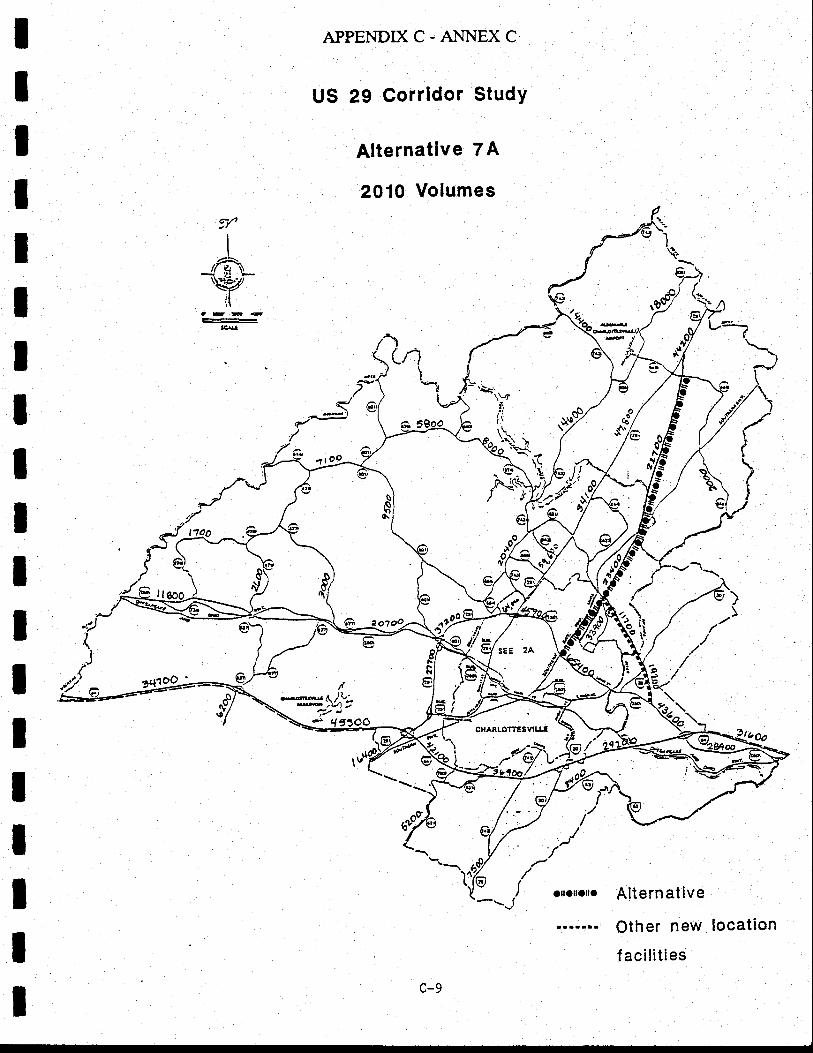
APPENDIX C. ANNEX C
US 29 Corridor StudY
Alternative 7 A
2010 Volumes
rI
I/f"\\git
a=--
7-J
*^.:\ e
*
rryti,
\f^ :'af )i\Qe'-qi
e./
w
Alternative
Other new location
f acilities
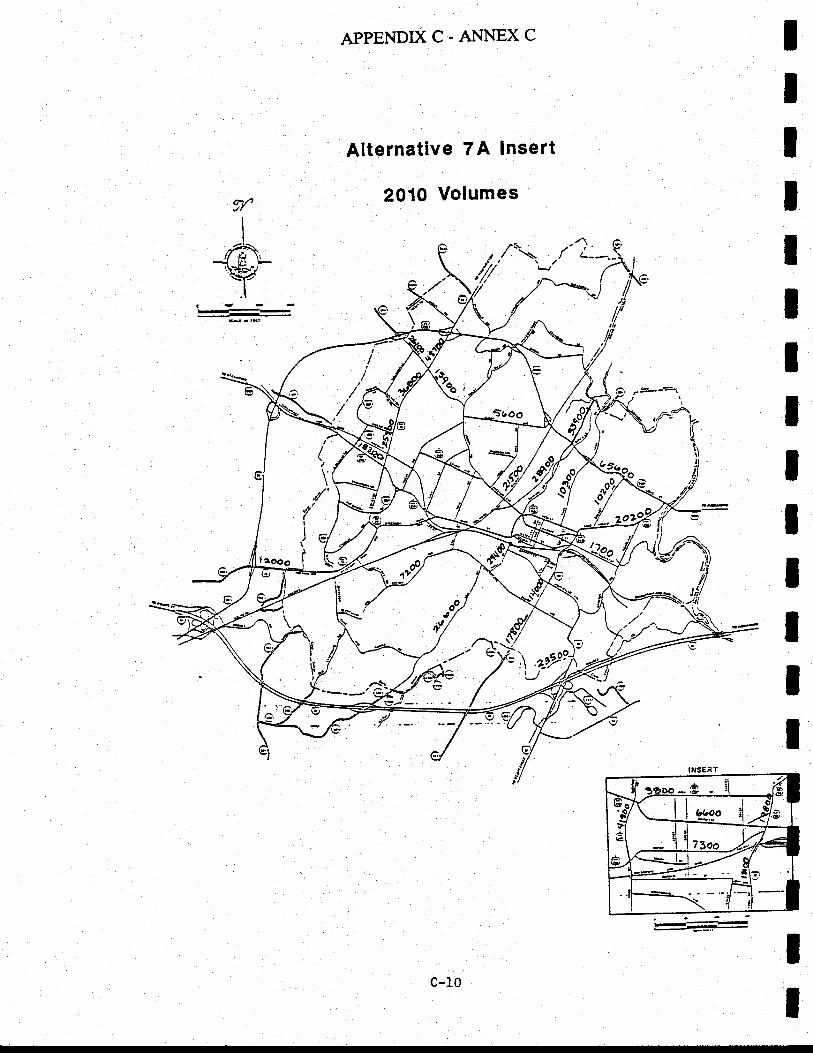
APPENDIX C. ANNEX C
Alternative 7A lnsert
2010 Volumes
'1"Im,\fl.t
L-:.:-
,,/\ r'2--.5/tt' X_ (
tzaoo I k e
c-L0
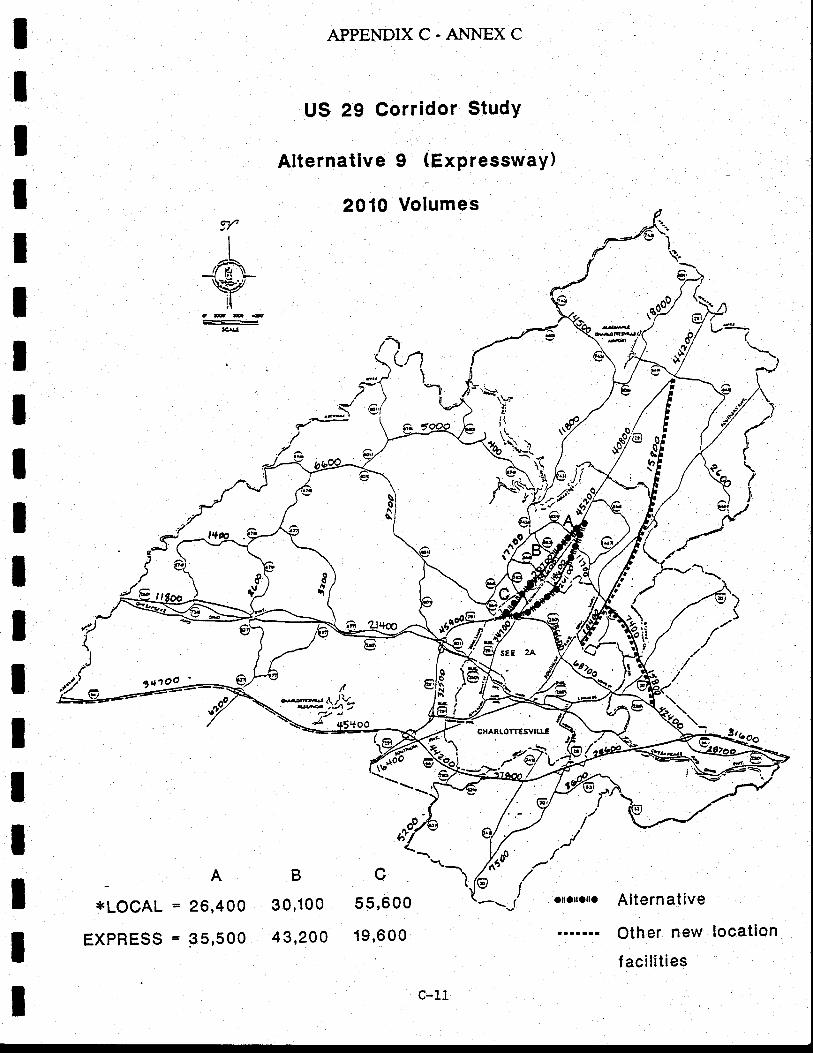
APPENDIX C. ANNEX C
US 29 Corridor StudY
Alternative 9 (Expressway)
2010 Volumes
IIIIIIIIIIIIIIItIII
tEr€
-
r*r
L11
*I-n I.*..
:,'il
q\I
**
a[alolla*LOCAL
EXPRESS
A
26,400
35,500
B
30,100
43,200
c55,600
19,600
Alternative
Other new location
f acilities
C-11
*e(I
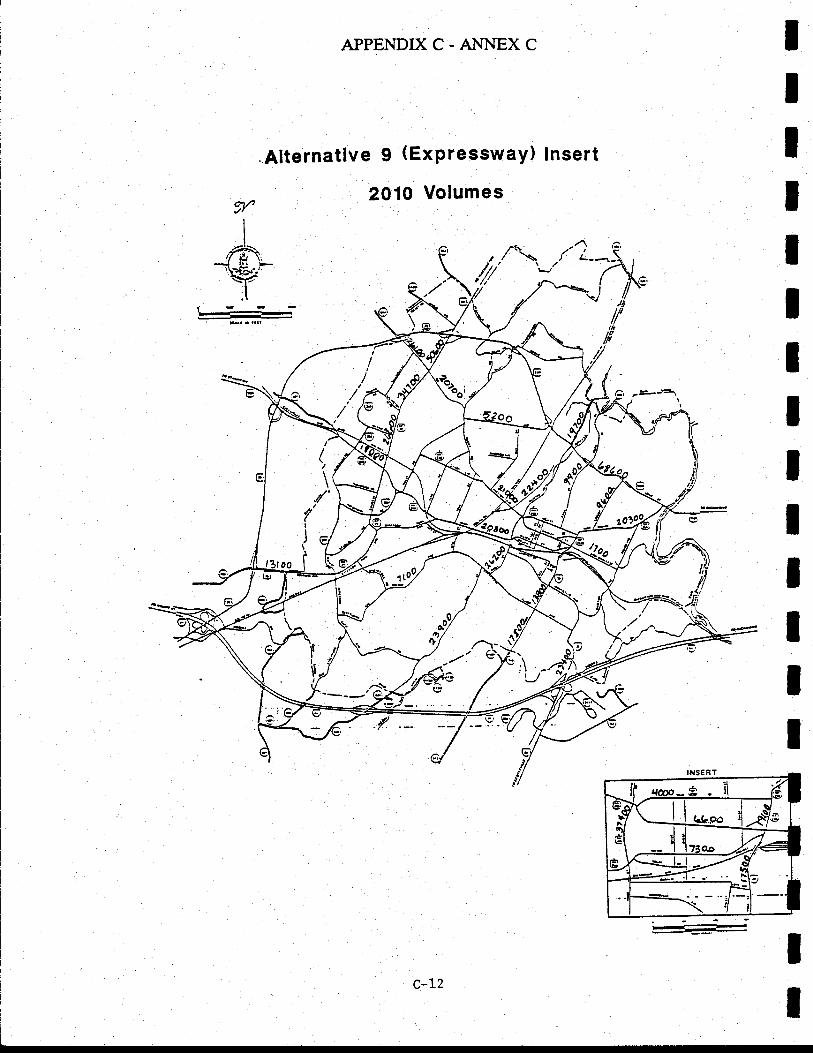
APPENDIX C. AI{NEX C
.Alternative 9 (Expressway) lnsert
2010 Volumes
IIIIIIItIII
97'"
I/ffi'nc?'-:l
!--:'il/o1
=lII
c-L2
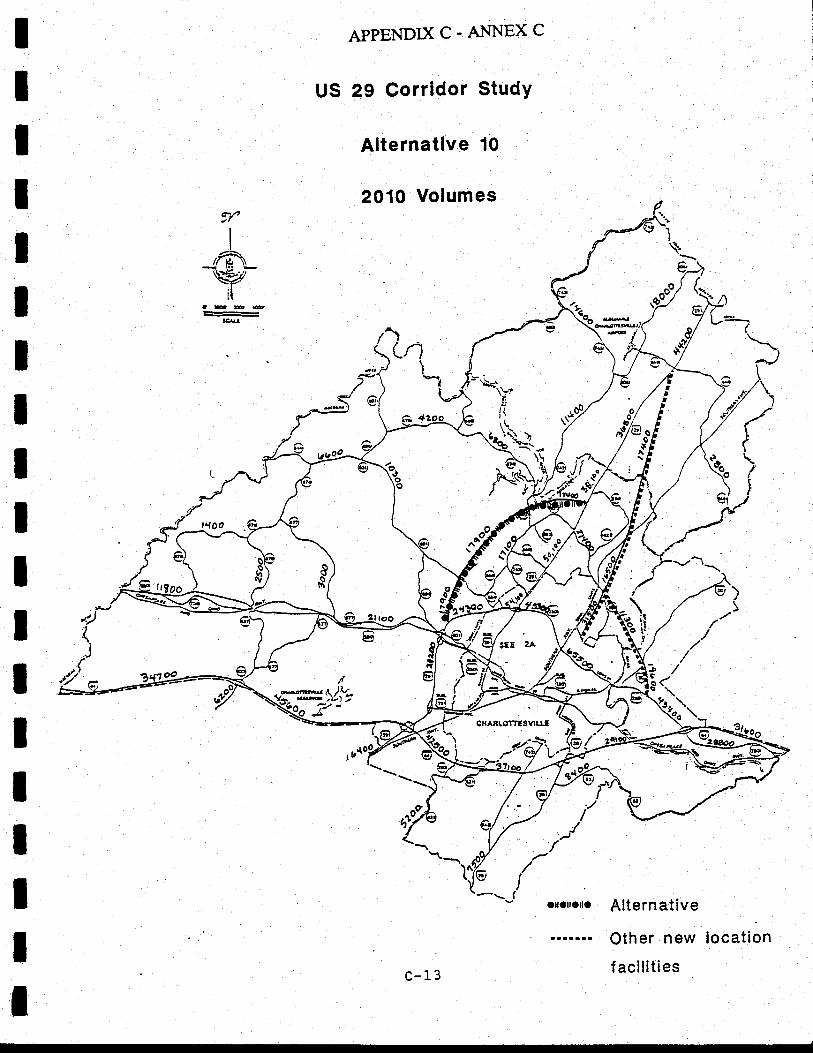
APPENDIXC-A}N{EXC
US 29 Corridor StudY
Alternative 1O
2010 VolumesvI
t/fng/-it
:--*
nI
I \;,f(
\{\_a. \!r --: \ 'i\
Alternative
Other new
f acilities
nffix\/YzK"f-
cHAitoTtEsvrut
c- 13
location
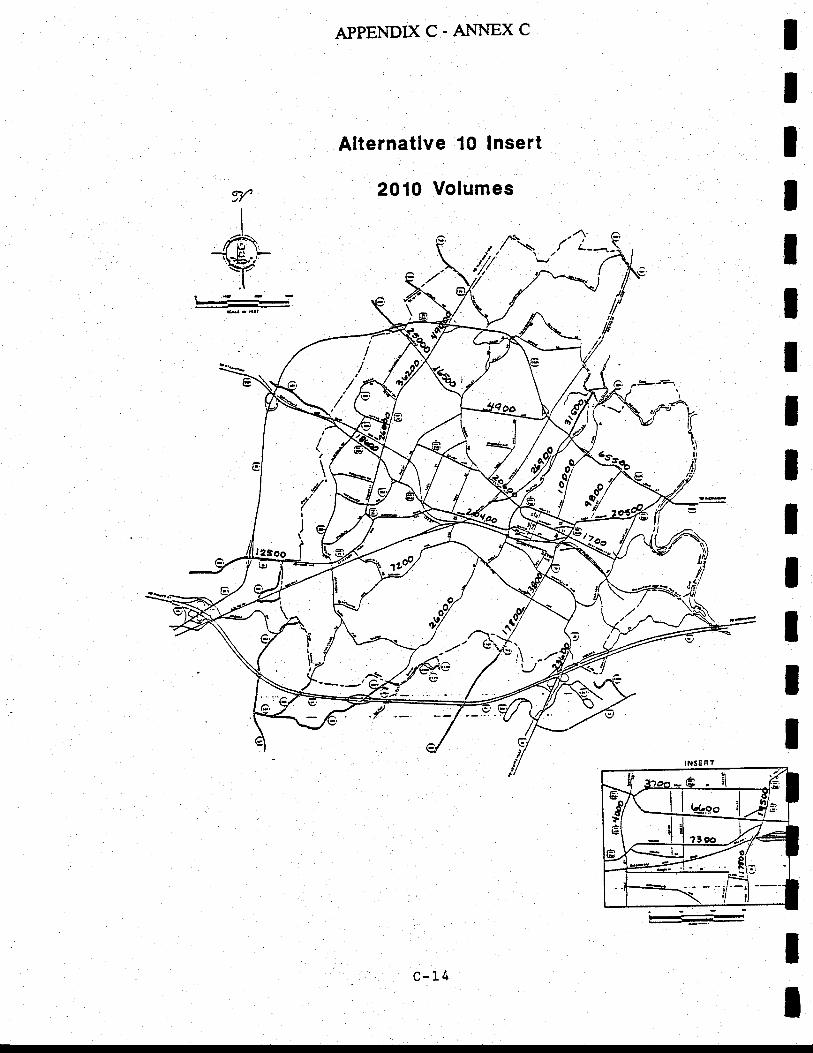
APPENDIXC-ANNEXC
Alternative 10 lnsert
2010 Volumes9]"
t
ffi\,v.t
l---#
, ,/^\,'7' '*''/r' rA.
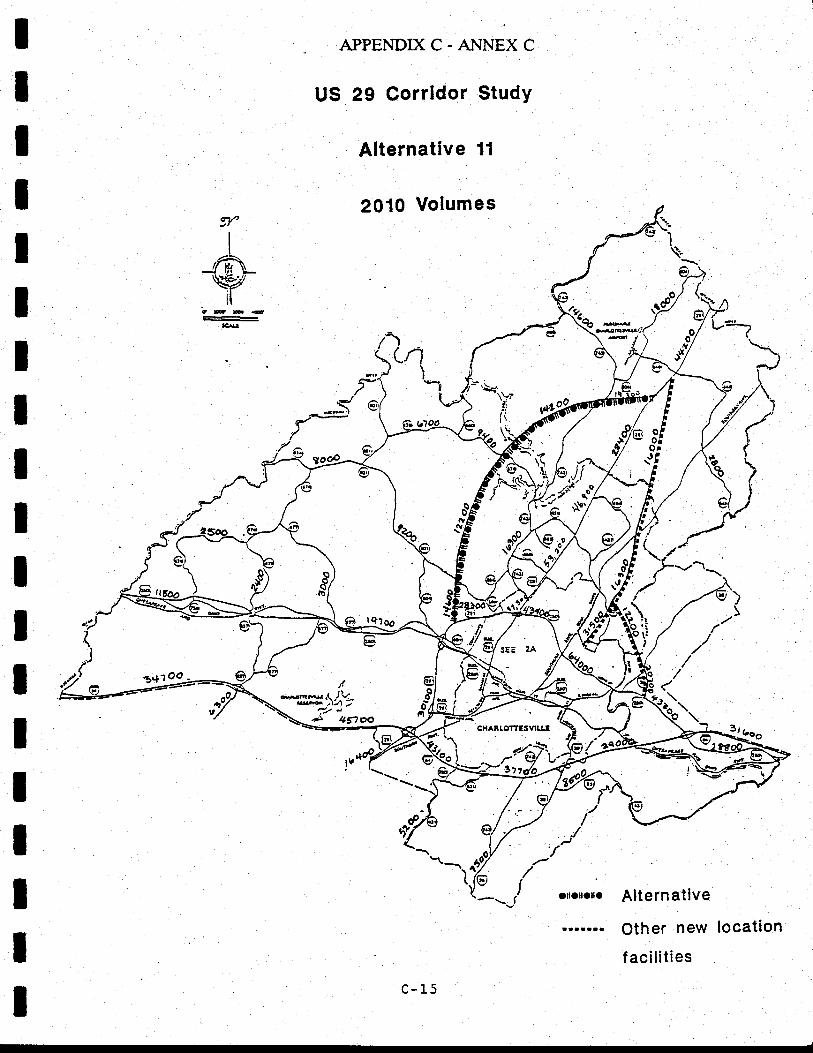
APPENDIXC-AI..INEXC
US 29 Corridor StudY
Alternative 11
2010 Volumes
\
-tfr*/ (i
f.^ Y @sQ"m",r/ J
,4r?
Alternative
Other new location
f acilities
J
CXARIOTT€sVITI.E
."#v'
c-r.5
{ ,-/1- i orr.rt.tro
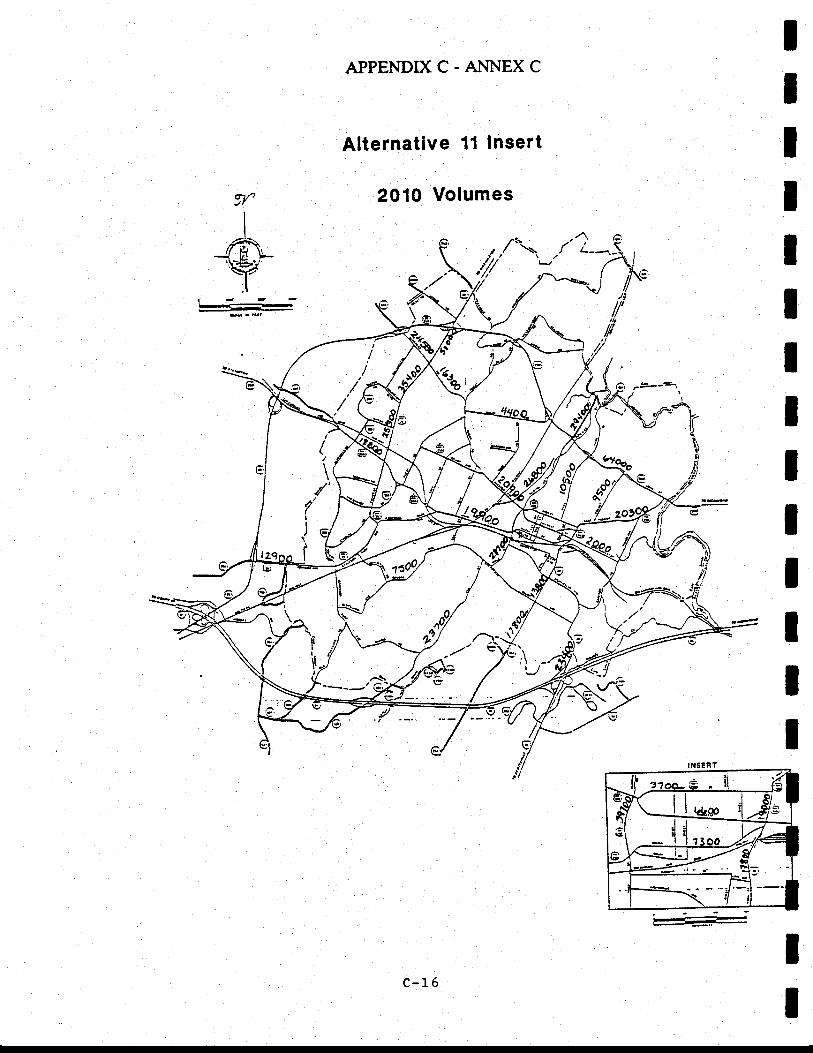
APPENDIX C. ANNEX C
Alternative 11 Insert
2010 Volumes91"
I_ffi\Y
--H:.t'
, ,/\
"//' X/ i--''-\ ,
/,--\l^**. f /A€v!!
ltl/tt/
/f
/fi,' t-
c-16
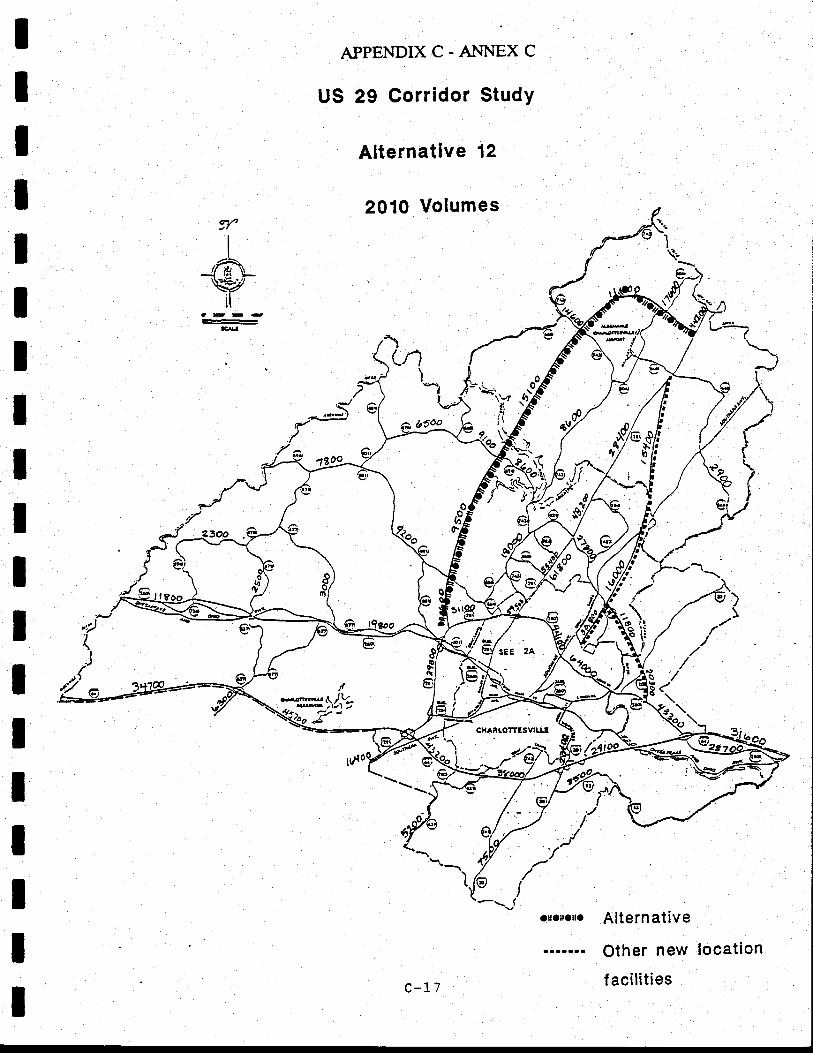
APPENDIX C. A}INEX C
US 29 Corridor Study
Alternative 12
2010 VolumesrI
I
/fR\ndzril
g
)*l\
ItCoo
/v>
Alternative
Other new location
f acilitiesc-17
a||t'ltolla
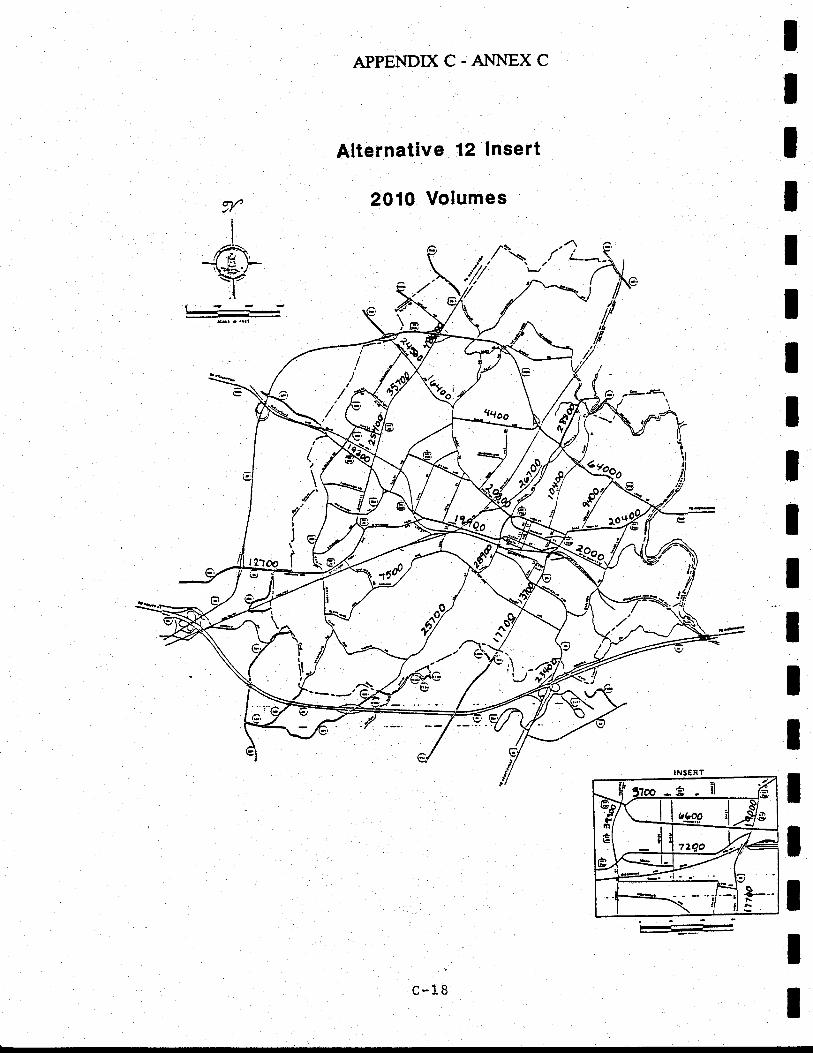
APPENDIX C. AI{NEX C
Alternative 12 Insert
2010 VolumesrI
-f,t\'v:l
l-!..-@
/i\- .'1 (r./ \ f L-.--,h' '--,' /t/r' rA. - I
Annex D to Appendix C
TTACTOR Documentation
tIIIIIIIIIIIIIIIIII
IIIIIIIIIItIIIIIIII
APPENpIXC_AITNEXD
TFACTOR D O CUMENTATIOI{
SUMMARY:
The purpose of this utility is to read in 3 nrrn files (Actual Observed, Base Model,
and Funrre Model), calculate a new turn count from these three files (this calculation is
explained below), then output a text file containing the new turn count. This new fiie can
be output in either arr:ay format (which can be read by the sofnrare package, NCAP) or in
the original column format.
USI.NG TI{E IJIILITY:
To execute tle utility, type in TFACTOR at the DOS prompt. A screen will appear for
entering the input files. You will notice that you car enter up to 5 fiienames for each of
the three turn file categories. This is really just a convenience feature. Entering several
fileneamres for a partiantar category would be the same as having combined those files into
ONE large file and entering that one filename.
When entering filenames, you must enter a valid DOS frlename, or an error message
will appear. The disk drive and path may be included in the filename (ex.
A:VOLUME1.TRN, C:\TURNS\VOLUMEI.TRN).
Fileuames that have been entered can be saved so that the next time the utility is
used with the same input filenames, it is not necessary to re-enter the names. Simply hold
D-1
APPENDIX C. ANNEX D
down the ALT key and press tle'S' key. This will save the fifteen input filenames that
have been entered. A beep indicates that the save was successful. Filenames are saved in
a binary file called TFACTOR.CFG. In order to retrieve them, press ALT-R. This will
,pull in, the fifteen filenames from TFACTOR.CFG and replace any filenames that may
bave been entered in the screen.
After the input filena"rres have been entered, press F10 to produce the output file
with the new turn counts. You must enter at least ONE input filename for each of the
TURN categories before attempting to produce the output file, otherwise an error message
will appear. you are then asked whether you want to output the file in array or column
format.
Next, will then be prompted for the number of number of iterations to apply the
FRATAR calculations. You should never need more than 4 iterations.
After the calculations are complete, you will be warned if any errors occurred during
the calculations. If any records were missing from the two MODEL turn files, those errors
will be written to the ERRORS.TXT file. A message will appear if there is an error. The
output file will be generated whether or not an elror occurs.
Next, you will be asked if the program should output any nodes that are which are
found in the BASE and FUTURE file but not in the ACTUAL frle' If you answer'Y" then
those nodes will be output'to a file called EXTRATXT'
IIIIIIIIIIIItItIIIID-2
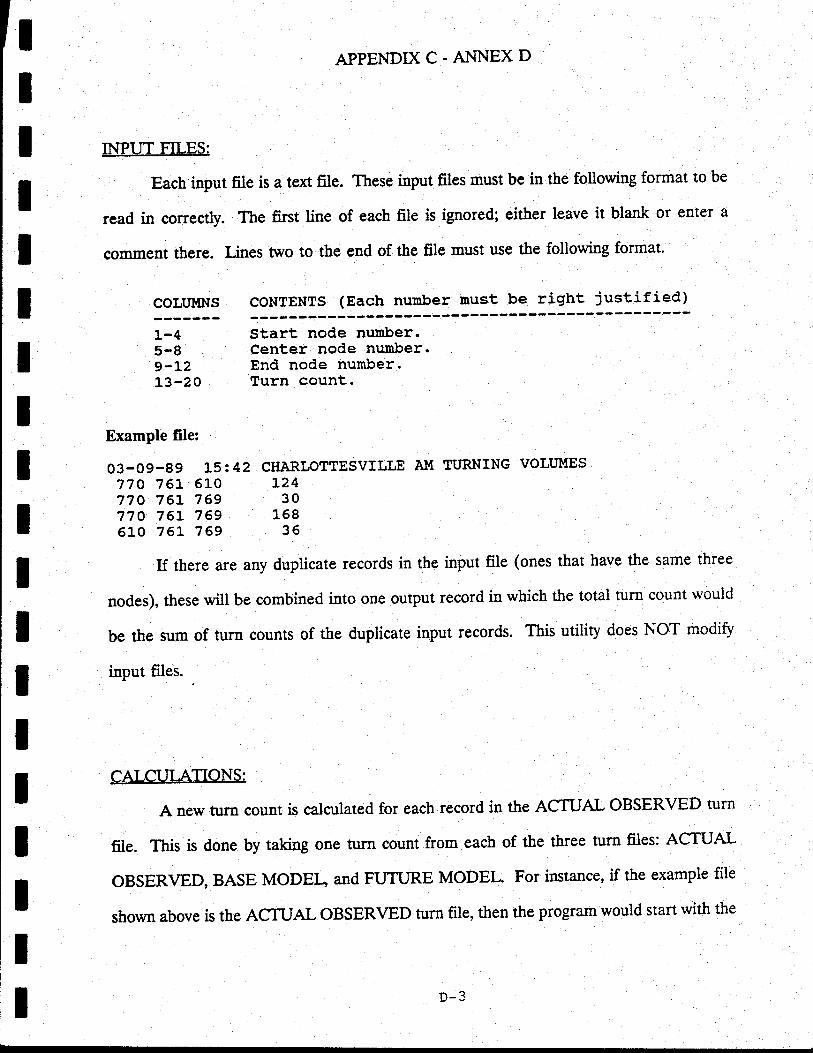
IIIIIIIIIIIIIIIIIII
APPENDIXC-AI'{NEXD
INPUT FILES:
Each input file is a text file. These input files must be in the following format to be
read in correctly. The first line of each file is ignored; either leave it blank or enter a
comment tlere. Lines two to the end of the frle must use the following format.
COLITMNS CONTENTS (Each number must be right justified)
1-4 Start node number.5-8 Center node number.g-L2 End node number.I3-2O Turn count.
Example frle:
03-09-89 L5t42 CHARLOTTESVILLE AI'{ guRNING VOLUMES
770 76L 610 L24770 76L 769 30770 76t 769 168510 76L 769 36
: any duplicate records in the input file (ones that have the same threeIf there are
nodes), tlese will be combined into one oulput record in which the total turn count would
be tbe sum of turn counts of the duplicate rnput records. This utility does NOT modify
input files.
CAI.CUTATIONS:
A new turn count is calculated for each record in the ACTTJAL OBSERVED turn
fite. This is done by taking one turn count from each of tle three turn files: ACTUAL
oBSERVED, BASE MODEI, and FUTURE MODEL. For ins131gs, if the example file
shown above is the ACTUAL OBSERVED turn file, then the program would start with the
D--"
APPENDIXC-ANNEXD
first recor d ( 770 761, 610 L24). It would then look up the turn count in the two
MODEL files by locating the record that also had the nodes '770 761' 610'. The new turn
count would then be calculated from these three turn counts using the fotlowing calculation:
ratio = €UTIIRE/BASE) + ACTUAL
This process would continue for the remaining records in the ACTUAL OBSERVED
nrrn fiIe. Therefore, if there were fifty records in tbe ACTUAL OBSERVED file, then fifty
new turn counts would have been calculated. lf arecord from the ACTUAL OBSERVED
file is not found in one of the two MODEL turn files, then an error message will be written
to a frle. You will be notified if any such errors occur.
After the new turn counts are calculated, the FRATAR method is applied to these
new turtr coun$. These final values are then output to a file.
FILES REOUIRED:
The only file required to use this utility is TFACTOR.EXE, howeriern TFACTOR.HLP
is needed if you wish to view this information. After executing TFACTOR, the following
temporary files are created and will remain until you delete them:
WORKl.DBF,woRK2.DB4WORK3.DBF,woRKl.NTlqwoRKz.}{r&WORK3.NTIL andERRORS.TXT.
tIIIIl'
IIIItIIIIIIIID-4
ItIIIIIIIIIIIItIIII
APPENDIX C. ANNEX D
TFACTOR.CFG will also exist if you have used the ALT-S capability. If you choose
not to delete these frles, then tle next time the prograq iS run, time is not spert re-creating
them. These frles can be deleted from the C: prompt.
OTHER OUTPUT FILES:
In addition to the output files mentioned above, 3 more additional files are output.
These files ATOTALS.TXT, BTOTAIJ.TICT, and FTOTAIS.TXT. These files contain the
turn count totals of the 5 input files displayed in column format. That is, ATOTAIJ.TXT
would gsalein all of tle records from the 5 ACTUAL OBSERVED input files and any
duplicate records would be combined into one with their turn counts added together.
O-5
APPENDIXC.A}{NEXE
Annex E to APPendix C
Thrning Movements on Alternative Links
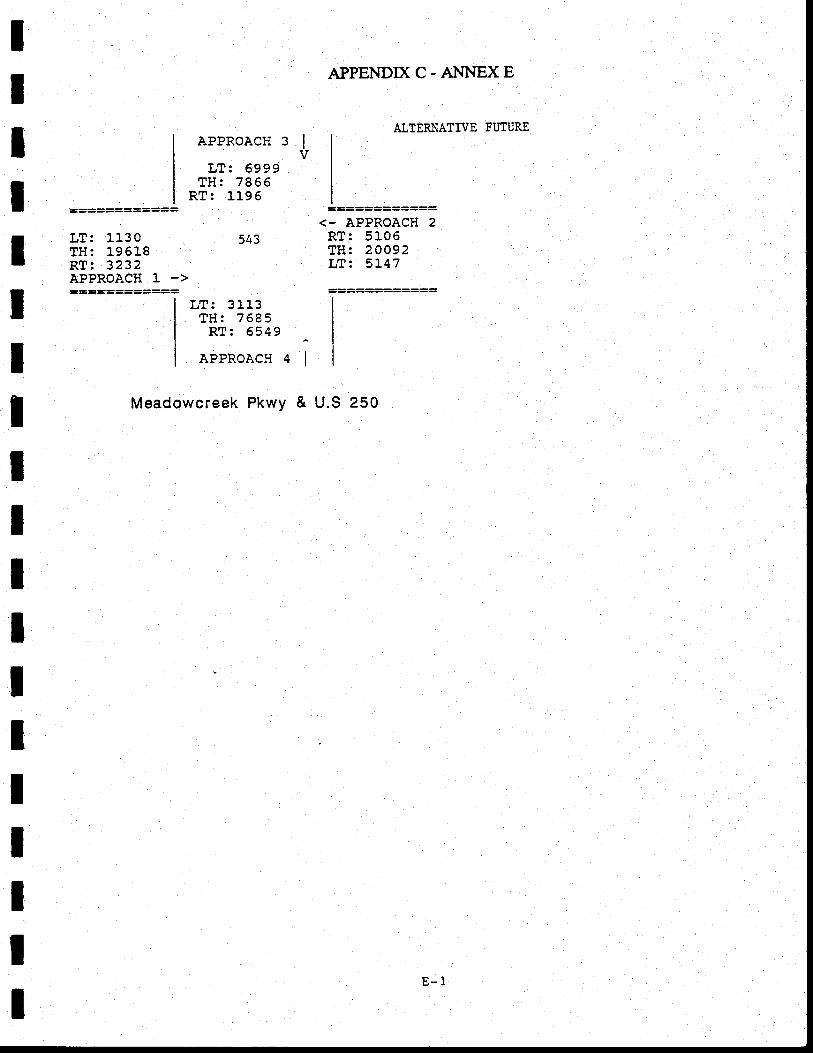
IIIIIIItIIIItIIIIII
APPROACH
LT: 6999TH:7566
RT:1L96
LT:3L13TH: 7685RT: 6549
APPROAC}i
^lJI
APPENDIXC.AT.INEXE
ALTERNATIVE FU"TLIRE
<- APPROACH 2RT: 5105TH: 2OO92LT: 5147
============
LT: LL30?H:19618RT:3232APPROACH ]. ->
)4J
4l
Meadowcreek Pkwy & U.S 250
E-1
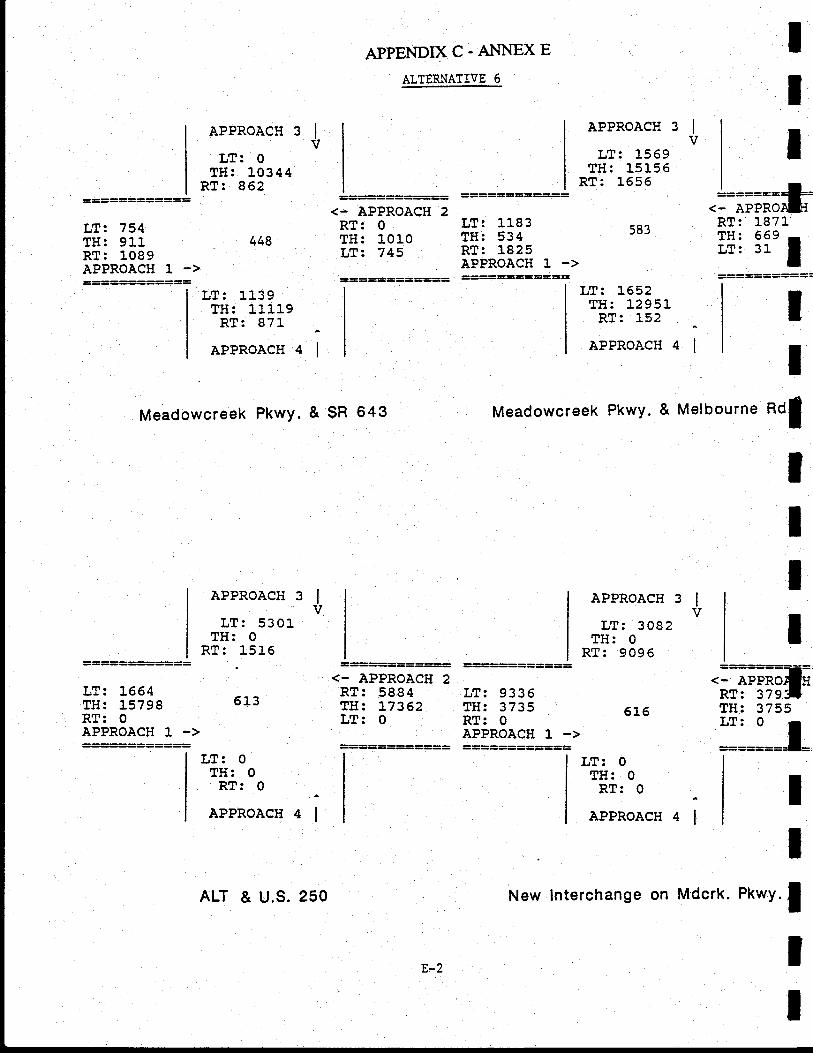
APPENDIXC.AI{NEXEALTERI{ATIVE 6
IItAPPRoACH 3 Iv
LT: O
TH: 10344RT:862
APPROACH
LT:1569TH:15155
RT:1656
LT: 1652TH: 12951RT: 152
APPROACH
.-tT;il;t=RT: L87L
l[: 3i'l===:====:=i
elV
LT: 754TH: 911RT: 1089APPROACH 1 ->
LT: T664TH: 15798RT: OAPPROACH 1 ->
448
LT: L139TH: 111L9RT: 87L
APPROACH
APPROACH
LT:5301lH: 0
RT:1516
<- APPROACH 2RT: O
TH: 1010LT: 745
--===:====-=<- APPROACH 2RT: 5884TH: L7362LT: O
LT: 1183TH: 534RT:1825APPROACH 1 ->
LT:9335TH: 3735RT: 0APPROACH 1 ->
APPROACH 3 IvLT:3082
TH: 0Rl: 9096
6t6
)6J
4; 4lII
.;;fittffTH: 3755
:::=:==f=
II
Meadowcreek PkwY. & SR 643 Meadowcreek PkwY. & Melbourne *Ol
alv
IItI
513
LT:0TH: O
RT: O
APPROACH
LT: 0TH: ORT: 0
APPROACH
New Interchange on
IMdcrk. Pkwy. I
I4; .l
ALT & u.s. 250
E-2
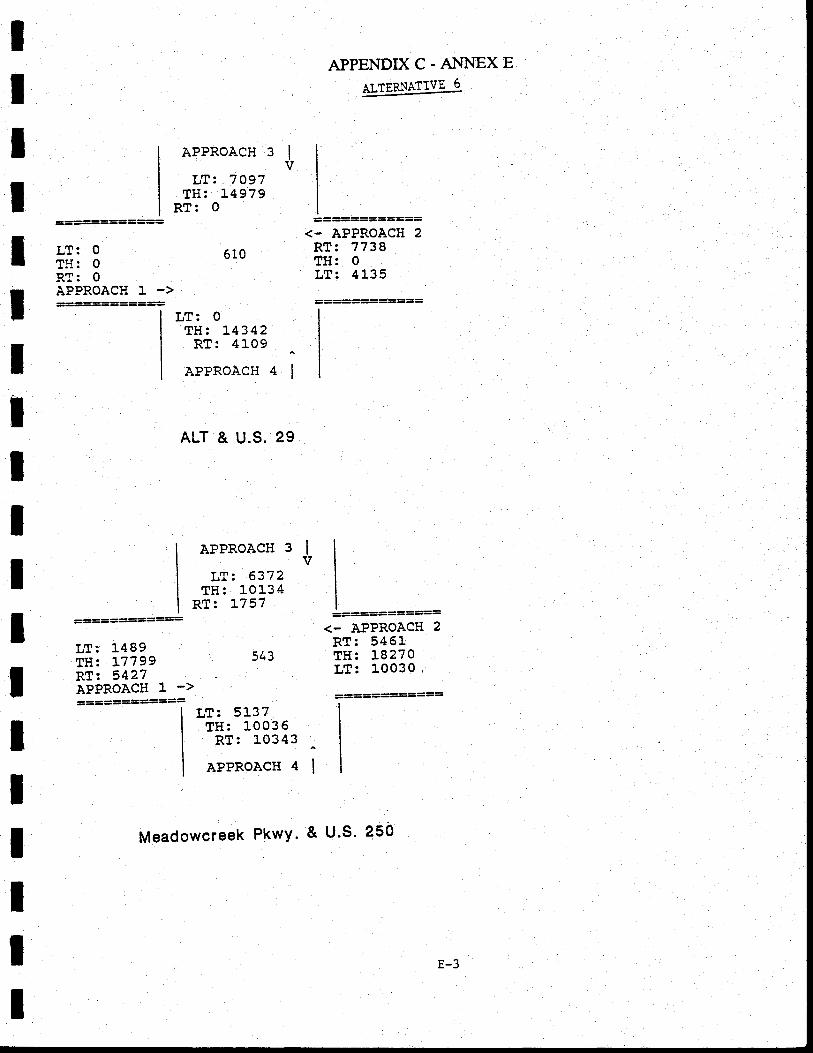
l
ItIIIItIIIIIIIIIIII
APPENDIXC-ANNEXEALTERNATIVE 6
APPROACH
LT: 7097TH: 14979
RT: O
LT:0TH: l.4342RT:4L09
APPROACH
<- APPROACH 2RT: 7739TH: O
LT:4135
3lv
=========-=
L?:0 610TIi: 0RT: O
APPROACH 1 ->
4l
ALT & U.S. 29
APPROACH
LT: 6372TH: 10L34
RT: L757
3lv
LT:1489TH: L7799RT: 5427APPROACH 1 ->============
-=-:=======<- APPROACH 2RT:5461
543 TH: 18270LT: 10030 '
LT: 5137TH:10036RT: L0343
APPROACI{ 4
Meadowcreek PkwY. & U'S' 250
E-3
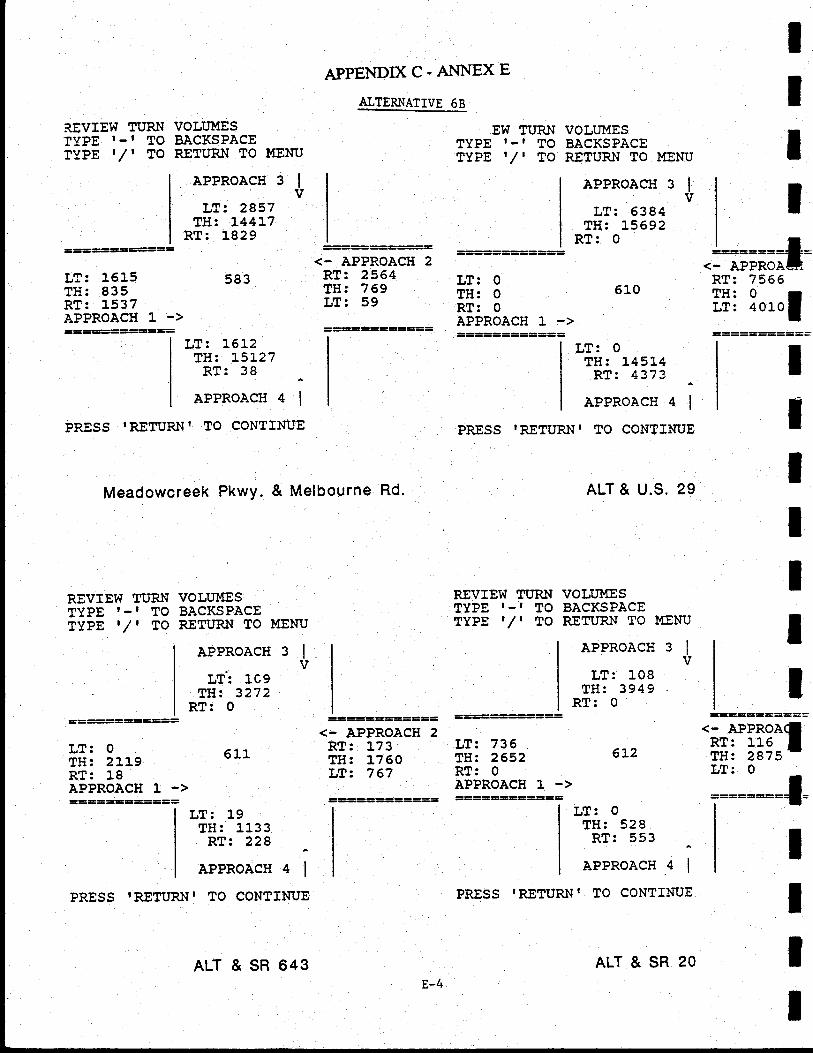
APPENDIX C. A}'INEX E
ATTERNATIVE 5B
IItt
IIIIIlI
IIII
R.EVIEW TURNIYPE I-I TOTYPE '/t TO
L?:1615TH:835RT: L537APPROACH 1 ->
REVIEW lrURNTYPE I-I TOTyPE '/' TO
LT: O
TH: 2119RT: 18APPROACH 1 ->
PRESS IRETURNI
VOLUMESBACKSPACERETURN TO I{ENIJ
APPROACH 3 IvLT: 2857
TH: L44L7RT:1829
583
VOLUMESBACKSPACERETURN TO MENU
APPROACH 3 Iv
LT': 1C9TH: 3272
RT:0
611
LT: 19TH:1133RT: 228
APPROACH 4 |
IO CONTINUE
<- APPROACH 2RT: 2564TH: 7 69LT:59
.8W rURNTYPE I-I TOTYPE '/' TO
LT: O
TH: 0RT: 0APPROACII 1 ->
PRESS IRETURNI
REVIEW 1rURNTYPE T-T TOTYPE '/' TO
voLUI'IESBACKSPACERETURN TO MENU
APPROACH 3 Iv53 84
!5592
510
LT:0TH: 145L1RT: 4373
APPRoACH 4 ITO CONTINUE
ALT & U.S. 29
VOLUMESBACKSPACERETURN TO MENU
APPRoACH 3 |v
LT: 108TH: 3949
Rl: 0
.ix;m*=RT: 7565
l$: lo'of
?llro!I .rFlf .
RT:0
LT: 16]-2TH: :..5].27RT:38
APPROACH 4 |
PRESS 'RETURN' TO CONTINUE
Meadowcreek PkwY. & Melbourne Rd.
<- APPROACH 2RT: l.13TH: L760LT:767
LT: 736TH: 2652RT: O
APPROACH 1 ->
'*ili"ii?llLT: 0
6L2
LT: 0TH: 528RT:553
APPRoACH 4 |
PRESS 'RETURNI TO CON?INUE
ALT & SR 643E-4
ALT & SR 20
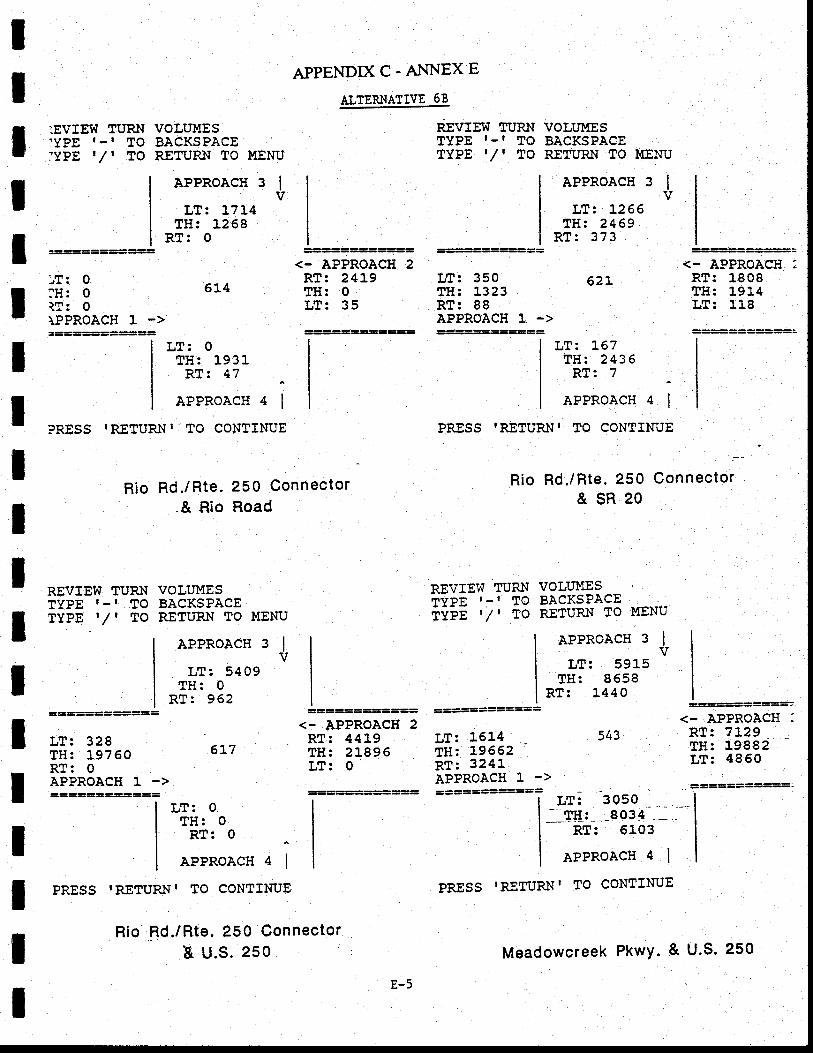
IIItII
VOLUMESBACKSPACEREWRN TO MENU
APPROACH 3 |vLT: :-7t4
TH: ].,26eRT: O
647
LT: O
TH: O
Rt: 0
APPROACH 4 |
TO CONTINUE
APPENDIX C. ANNEX E
ALTERNATIVE 68
rbvrsw ruRNTYPE I-I TOTYPE t/' TO
IEVtrEW TURN:YPE I-I TO]YPE t /' TO
REVIEW :rURNTYPE I-I TOTYPE '/, TO
LT: 328TH: 19760RT: OAPPROACH 1 ->
PRESS IRETURNI
VOLUMESBACKSPACEP€TURN TO MENU
APPRoACH 3 |vLT: L266
TH: 2469RT: 373
,T: O
lH: 0?T: O
\PPROACH ]- ->
6L4
LT:0TH: 1931RT: 47
APPROACH 4 |
?RESS 'RETURNI TO CONTINUE
<- APPROACH 2Rl: 2419TH: O
LT: 35
Ll: 350TH: t323RT: 88APPROACH 1 ->
62L
LT: 167TH:2436RT: 7
<- APPROACH :RT: 1808TH: 1914LT: 118
<- APPROACHRT: 7129TH: 19882LT: 4860
III
543
IIItI
Rio Rd./Rte. 250 Connector.& Rio Road
VOLUMESBACKSPACERETURN TO !{ENU
APPRoACH 3 |vLT:5409
TH: O
RT: 962
APPROACH 4 |
IO CONTINUEPRESS IRETURNI
REVIEW TURNTYPE '-I TOTYPE '/, TO
Rio Rd./Rte. 250 Connector&SR20
VOLUUESBACKSPACERETURN TO MENU
APPROACH 3 |vLT: 5915
TH: 8658RT: L44O
<- APPROACII 2RT: 4419TH: 21896LT: O
============
LT: 1514TH: 19652 -nT: 3241APPROACH ]. ->============
Rio Rd./Rte. 250 Connector& u.s. zso
RT: 6103
APPRoACH 4 |
PRESS 'RETURN' TO CONTINUE
It
Meadowcreek PkwY. & U.S. 250
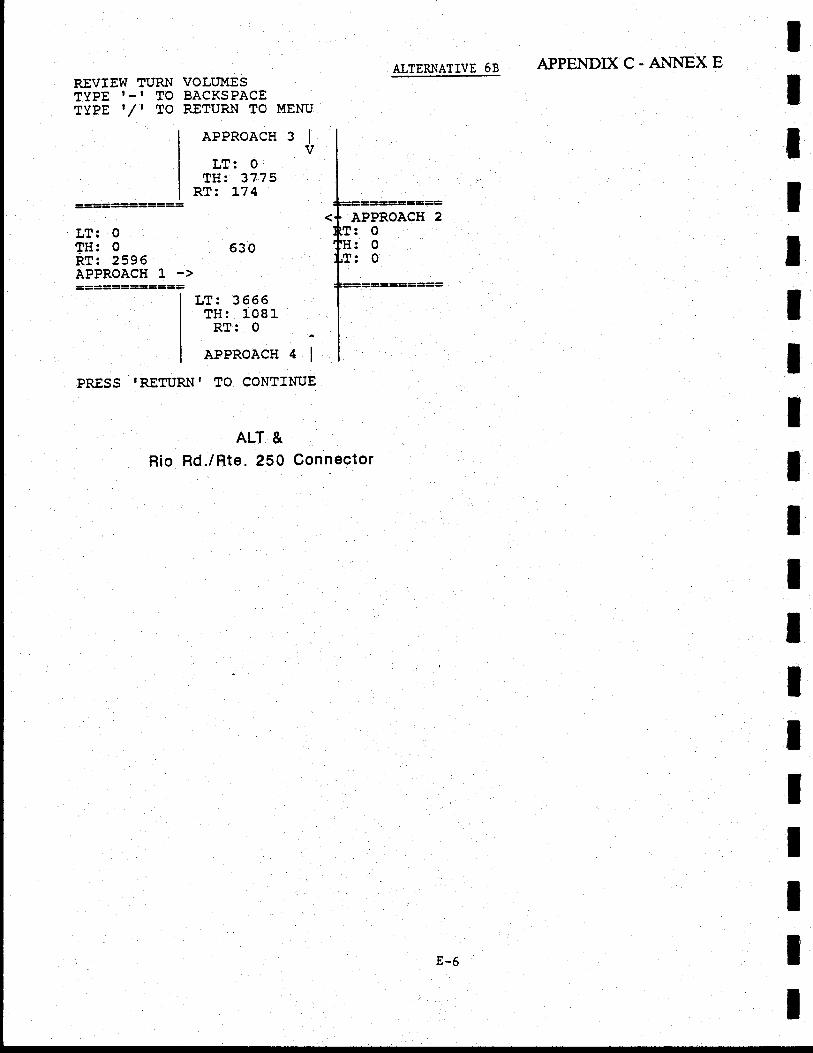
ALTERNATIVE 68 APPENDIX C. A}-INEX EtIIIIIIIIIIIIIIIIII
REVTEW TURNTYPE I-I TOTYPE '/' TO
PRESS 'RETURNI
LT: O
TH: 0 530RT:2596APPROACH 1 ->===E========
VOLUMESBACKSPACERETURN TO MENTI
APPRoACH 3 |
vLT: O
TH: 37?5RT: l,.74
LT:3665TH: 108LRT: O
APPRoACH 4 iTO CONTINTIE
ALT &Rio Rd./Rte. 250 Connector
E-6
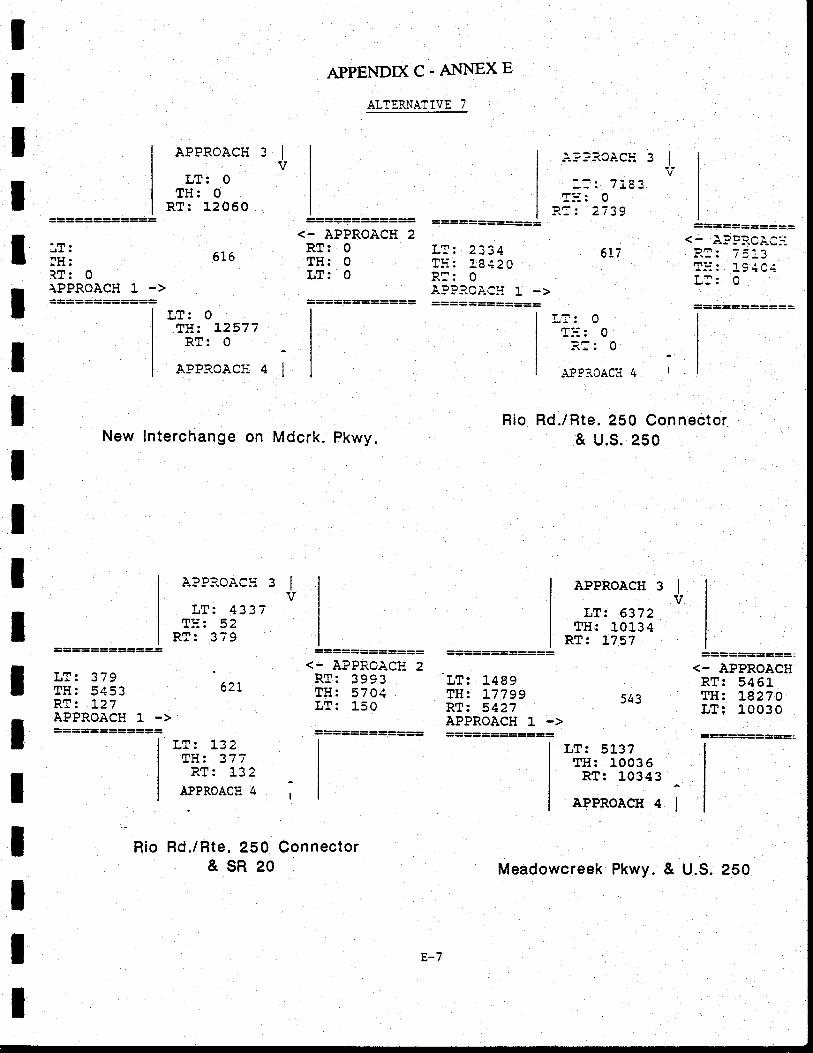
t.iir. n
E-. n
A3P3.OAC:{ 4 |
Rio
IItIIIIIIIIttIIIIII
APPENDIXC.AI'{NEXE
ALTER.NATIVE 7
APPROACIi 3 It7TrFr n!l . V
TH: 0RT: 12060
6i5
sjij(UA{-ii
i-. ?14"fl"--- . n
RT: 2739
Jl
'.F.
iH:1T:0\PPR.OAC}T 1 ->
<- APPROACH 2RT: 0TH: O
LT: 0
-=====:====<- APPROACTi 2PT. 'l oo 1lH:5701LT: 150
=-===::====L?: 2334 6t7TIi: !8420DF. nA9PP.CAC:{ 1 ->======:=====
===========<- A?PF.CF-C:{p?. ?:1'rI J
'JTll: L94 0itF. nv
<- APPROACHRT: 546LTH: 18270LT: 10030
TH: L2577RT:0
APPROAC}i
t finfiA r ^?-l T55.LJl1(-.:
LT: 4337rFti . Ei t
RT:379
,;*l
New lnterchange on Mdcrk. Pkwy.Rd./Rte. 250 Connector
& u.s. 2s0
APPRoACH 3 IvLT: 6372
TH: 10134RT: L757
LT: 379TIi:5453 621RT: 127APPR,OACH 1 ->============
LT: L489TH: 17799RT: 5427APPROACH 1 ->
543
LT: 5137TH:10035RT: 10343
APPROACH 4
LT: :..32tTrlt . 11-4l:. J t I
RT:1-32APPROACE 4
Rd./Rte. 250 Connector&SR20
E-7
Meadowcreek Pkwy. & U.S. 250
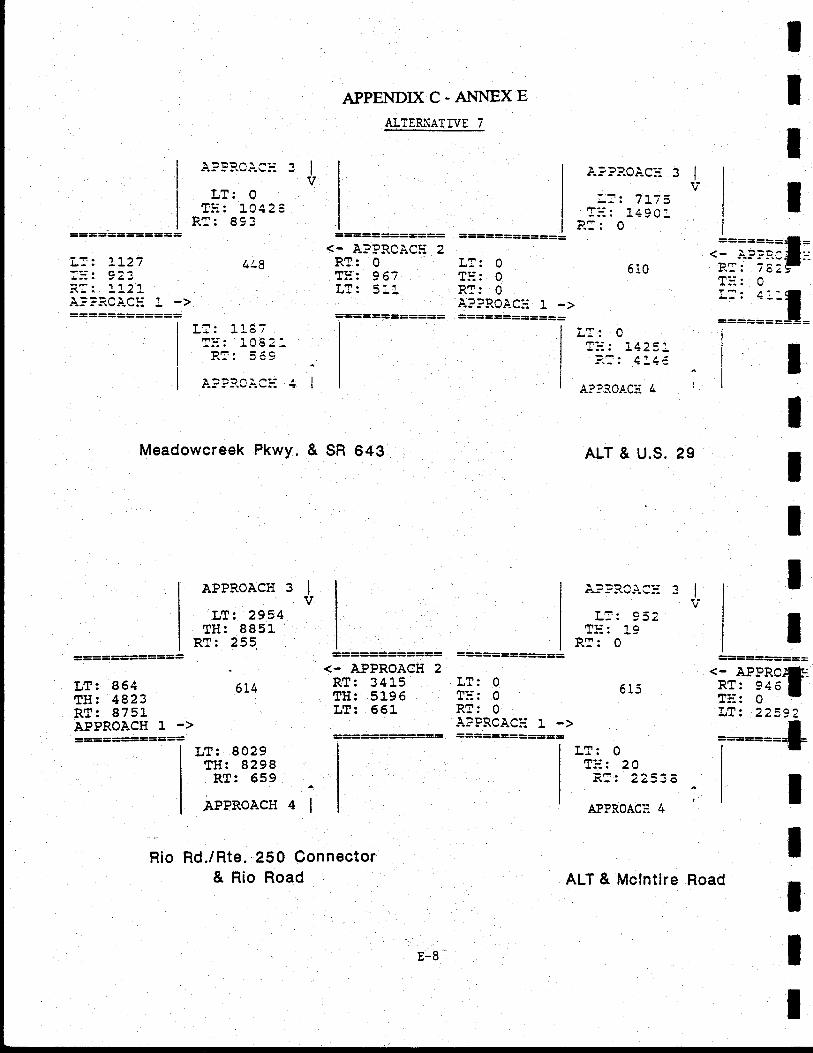
APPENDXC-A}INEXEAITERNATIVE 7
IIII
"lv'
a=D?cfaL'-, IIttY
============
Lf: 864 614TH: 4823RT:875LAPPROACH ]. ->============
LT: 0Tli: 1C4 2I
En . Q c'..
TT. 114;.Tr!:. 'tnf;t'
^^9
=-====:====<- A?PRCAC!: 2RT: 0
. Tii: 96iTr?r. E:1
TE. 11
RT: 0A??P.OLcii 1 ->===========:
I -ti^r a?-4L5--5.LrA'r-:
510
A??3,oACH 4
ALT & U.S. 29
i:. i1':=ILIJ
TI: 1490iPF. A
fT---. l taC-3-.. 12aJ-??: 1!4€
';;?;;;til;.r--- . n
::==::=I=
alIIIIII
Meadowcreek Pkwy. & SR 643
APPROACH 3 IvLT:2954
TH: 8851RT: 255
! -FiA
a at-llt.S--]tr'vJ{g---
T i. O.:Fnls . 't o
RT: 0
<- APPROACH 2RI: 3415TH: 5L96LT: 65i
T'.tr. nrF';. nprir . t1
APFRCAC!: 1 ->===-====-==
615
20Zza: o
A?PROACS 4
'ni1*fL?:22t92
+IIIII
=:====LT:8029TH: 8298RT: 659
APPROACH 4
Rio Rd./Rte. 250 Connector& Rio Road
I
E-8 *
ALT & Mclntire Road
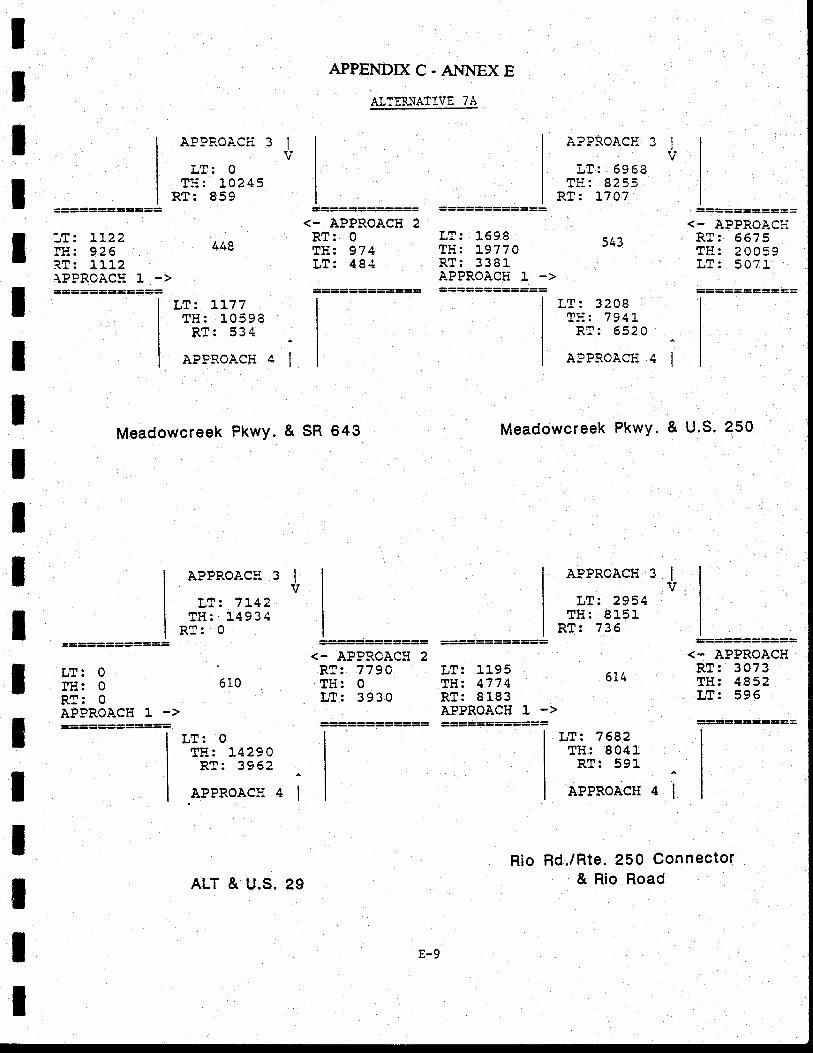
I
543
Rio
5r0
IIIIIIIIIIIIIIIIIII
APPENDD(C-AN}.iEXE
AITEX.\ATIVE 7A
lT: Ll22nJ. AtA3.T: lLl2.\PPROAC:I L ->
LT:0fH: 0R!: 0APPROACH 1 ->
AT.-KIJA\-Tr J
L?: O
T5:r.0243RT:859
448
LTz ll77TH: 10598RT: 534
APFROACIi
LT:0TE: :..4290RT:3962
APPROACH
============<- APPROACH 2RT:0TIi: 97 4LT: 481
<- APgRCACI{ 2RT:779ATli: O
LT: 3930
Tl1r. l AOArFll. 1O??nRT:3381-APPROACIi L ->============
LT: 1195TH: 477 4RT:8183APPROACH 1 ->
t inFAt A"? -J1--5.:I'\Jlt.Lft J
rT. Ac Azmtt. arRi
RT: L7O7
LT: 3208Tii: 7941,RT:6520
APPROACT{
===========<- APPROACIiRT:6675Tli: 20059?m. Rn?1!3 . JW I L
<- APPROACHRt: 3073TH: 4852LT: 596
tl''I
nl'l
tl.. 1
Meadowcreek PkwY. & sR 643
APPROACII 3 IvLT: ?L42
TH:14934RT: 0
Meadowcreek Pkwy. & U.S. 2s0
APPRoACH 3 |v
LT: 2954TH:815L
RT:736
4l
6t4
LT: 7682TH: 8041RT: 591
APPROACH
Rd./Rte. 250 Connector& Rio RoadALT & U.S. 29
E-9
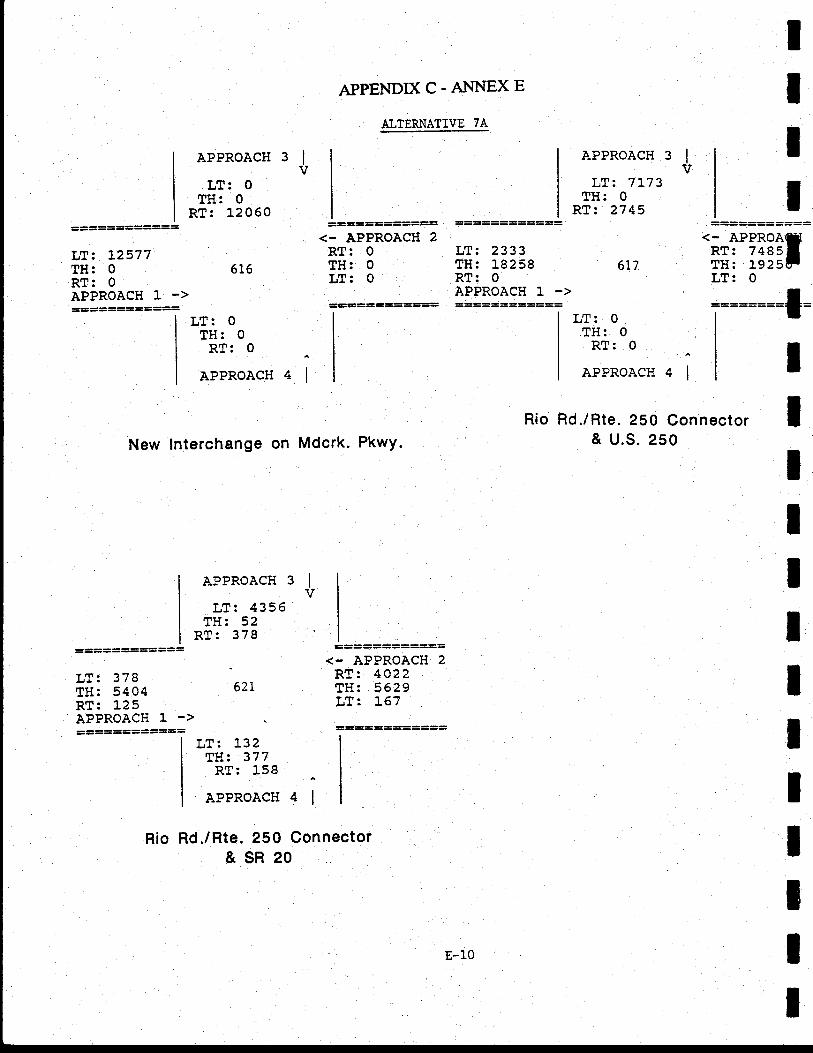
APPENDIXC-ANNEXE
ATTERNATIVE 74
IIIt
APPROACH
LT: O
TH: 0RT:12060
LT: O
TH: O
RT: 0
APPROACH
3lv
APPROACH
LT:7L73TH: 0
RT: 2745
3lv
============
LT: L2577TH:O 616RT:0APPROACH 1 ->============
==========g=<- APPROACH 2RT: O
TH: 0LT: O
<- APPROACH 2RT:4022TH:5629LT: r.67
=========:==-
LT: 2333TH: L8258 617RT: O
APPROACH 1 ->
Rio
=-==:======:'tni"?lllILT: 0
=--:--==f=
IIIItIIIIIIII
Rio
.iLT: 0TH: 0RT: O
APPROACH 4 |
Rd./Rte. 250 Connector& u.s. 250New Interchange on Mdcrk. PkwY.
APPROACH 3 |
V
LT: 4356TH: 52
RT: 378
LT: 378TH: 5404RT: 1,25APPROAC}i 1 .>============
62t
LT: T32TH: 377RT:158
APPRoACII 4 I
Rd./Rte. 250 Connector&SR20
E-10
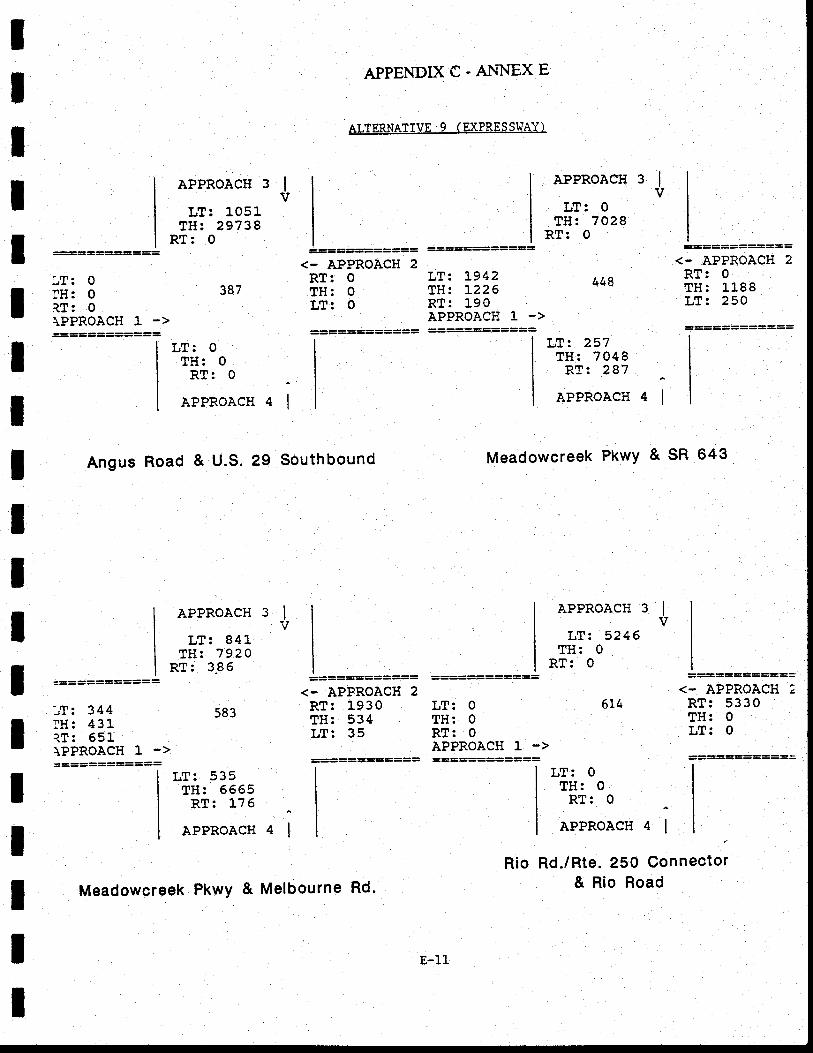
448
IIIItItItIIIIIIIIII
APPENDIX C. ANNEX E
ALTERNATIVE 9 (EXPRESSIJAJ)
;T: O
IH: 0RT: O
\PPROACH 1 ->
APPROACH 3
LT:105LTH: 29738
RT: O
387
LT: O
TH: O
RT:0APPROACH
<- APPROACH 2RT: O
TH: O
LT: O
==:=:=======<- APPROACH 2RT: L930TH: 534LT: 35
APPROACH
LT: O
TH: 7028RT: 0
LT: 1942TH:1226RT: L90APPROACH 1 ->============ LT: 257
TH: 7048RT: 287
APPROACH
LT:O 614TH: O
RT: 0APPROACH ]- ->
<- APPROACH 2RT: O
TH: 1188LT: 250
<- APPROACH 2RT:5330TH: O
LT: O
3lv
.l tl=l
Angus Road & U.S. 29 Southbound
APPROACH 3 |V
LT: s41"TH: 7920
RT;3.86
Meadowcreek Pkwy & SR 643
APPROACH 3 |vLT:5246
TH: 0RT: O
:=========:=
.T: 344 583lH: 4 311T: 65L\PPROACH ]. ->=====-====== LT:535
TH: 5665RT: 176
APPROACH 4 |
LT: O
TH: 0RT: 0
APPROACH 4 |
Rio Rd./Rte. 250 Connector& Rio RoadMeadowcreek PkwY & Metbourne Rd.
E-11
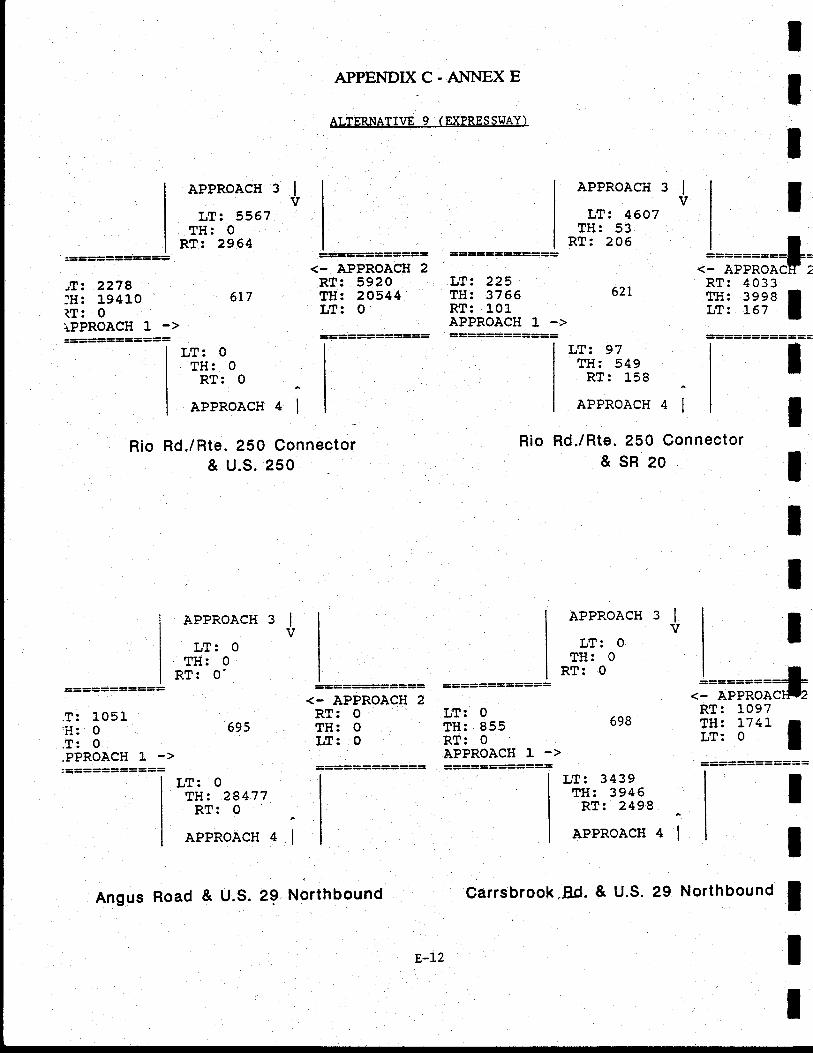
APPENDIXC.AI{NEXE
ALTERNATIVE 9 (EXPRESSIIAY)
IIIIAPPROACH 3 Iv
LT: 5567TH: O
RT: 2964
APPROACH
LT: 4607TH: 53
RT:2O5
APPROACH
LT: O
TH: 0RT: O
LT:3439TH: 3946RT: 2498
APPROACH
.lTFil;#;RT:4033
I$; i??'l
.lT;ffi;il*RT: LO97TH: 174L ILT:O t============
:lv
,T: 2278tH:19410 617?T: O
\PPROACH 1 ->============
Rio
<- APPROACH 2RT: 5920TH: 20544LT: o
LT: 225TH: 3766 621RT: 10LAPPROACH 1 ->
Rio
LT: O
TH: O
RT:O-arenoacn a I
Rd./Rte. 250 Connector& u.s. 2s0
APPRoACH 3 |vLT:0
TH: 0RT:0'
LT: 97TH: 549RT: l-58
APPRoACH 4 |
Rd./Rte. 250 Connector&SR20
IIIItI^lrl
v
=====-===:=
.T:105L'H: 0.T: 0.PPROACH 1 ->:===========
695
LT:0fH:28477RT: O
APPROACH
<- APPROACH 2RT: oTH: O
LT: O
LT: 0TH: 855RT: 0APPROACH ]. ->===========:
698
4l rlel
II
tI
29 Northbound Carrsbrook.Bd. & U.S. 29 Northbound IAngus Road & U.S.
E-L2
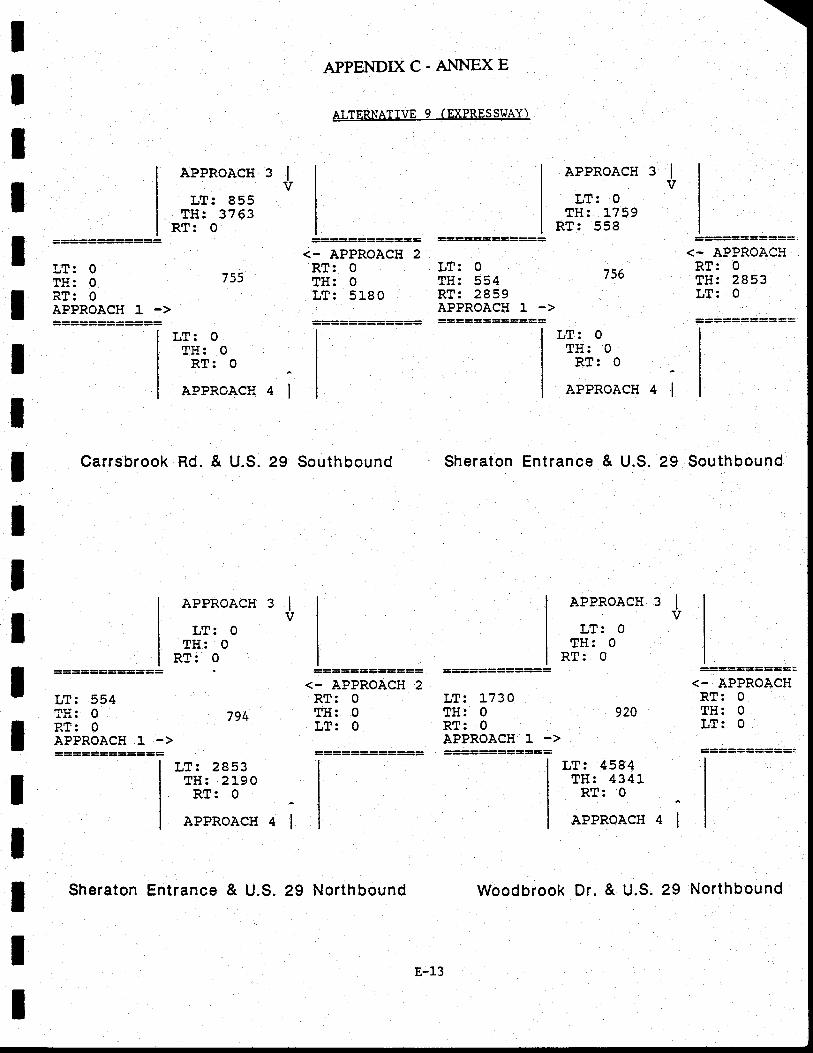
tIItIIIIIIIIIIttIIt
4l
.i
APPENDIXC.ANNEXE
ALTERNATTVE 9 (D(PRESSIiAY)
APPRoACH 3 IvLT: 855
TH: 37 63RT: O
t))
APPRoACH 3 |vLT: 0
tTtlt. 1 ? RO3fI .
-t -JRT:558
756
<- APPR,OAC}T .
RT: 0TH: 2853LT: 0
<- APPROACHRT: 0TH: O
LT: 0
LT: 0TH: O
RT:0EPPROACH 1 ->
LT: 554?H: O
P.T: O
APPROACH 1
<- APPROACH 2RT: 0TH: O
LT:5L80
<- APPROACH 2RT: 0TH: O
LT: O
LT: 0TH: 554RT: 2859APPROACH 1 ->
LT: l73oTH: O
RT: 0APPROACH 1 ->
LT: O
TH: 0RT: O
APPROACH
794
LT: 2853TH: 2190RT: O
APPROACH
APPROACH 3 Iv
LT:0TH: 0
RT: O
LT:0rFlr. nRT: 0
APPROACH
920
LT:4584TH: 434LRT: 0
APPROACH
APPROACH 3 -l--V
LT: 0TH: O
RT: O
tl
Carrsbrook Rd. & U.S. 29 Southbound Sheraton Entrance & U.S. 29 Southbound
4l
Sheraton Entrance & U.S. 29 Northbound
E-13
Woodbrook Dr. & U.S. 29 Northbound
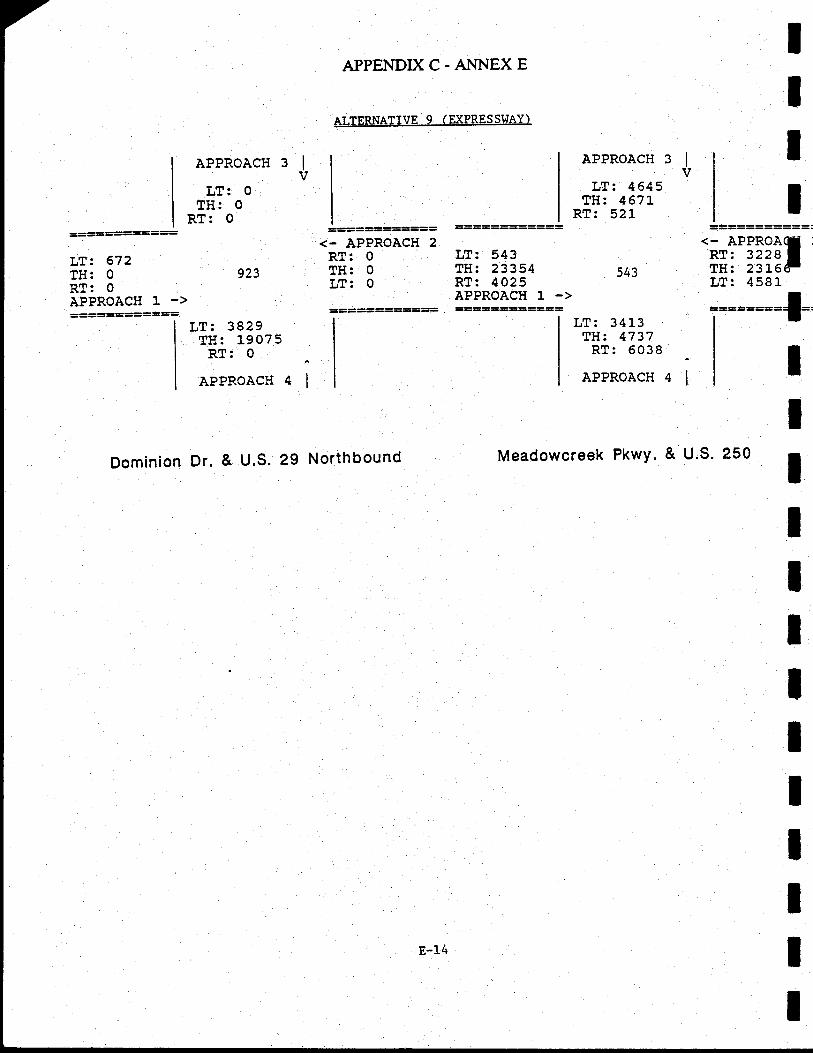
APPENDIXC-ANNEXE
ALTERNATIVE 9 (EXPRESSWAY)
IItI
APPROACH 3 |vLT:0
TH: 0RT: O
====-======<- APPROACII 2RT: 0TH: O
LT: 0
============
LT: 543TH: 23354RT: 4025APPROACH ]- ->
APPROACH
LT: 4645TH: 467:'.
RT: 521
543
LT: 341-3TH: 4737RT:6038
APPROACH
===========:'ffii"ii?al'LT:458L
=--====-f-.
3lv
LT: 672TE: O 923RT: 0APPROACH 1 ->====-======= LT: 3829
lH:19075RT:O .
APPRoACH 4 |
Dominion Dr. & U.S. 29 Northbound Meadowcreek PkwY. & u.s. 250
-lIT
IIIIIIIIIE-14
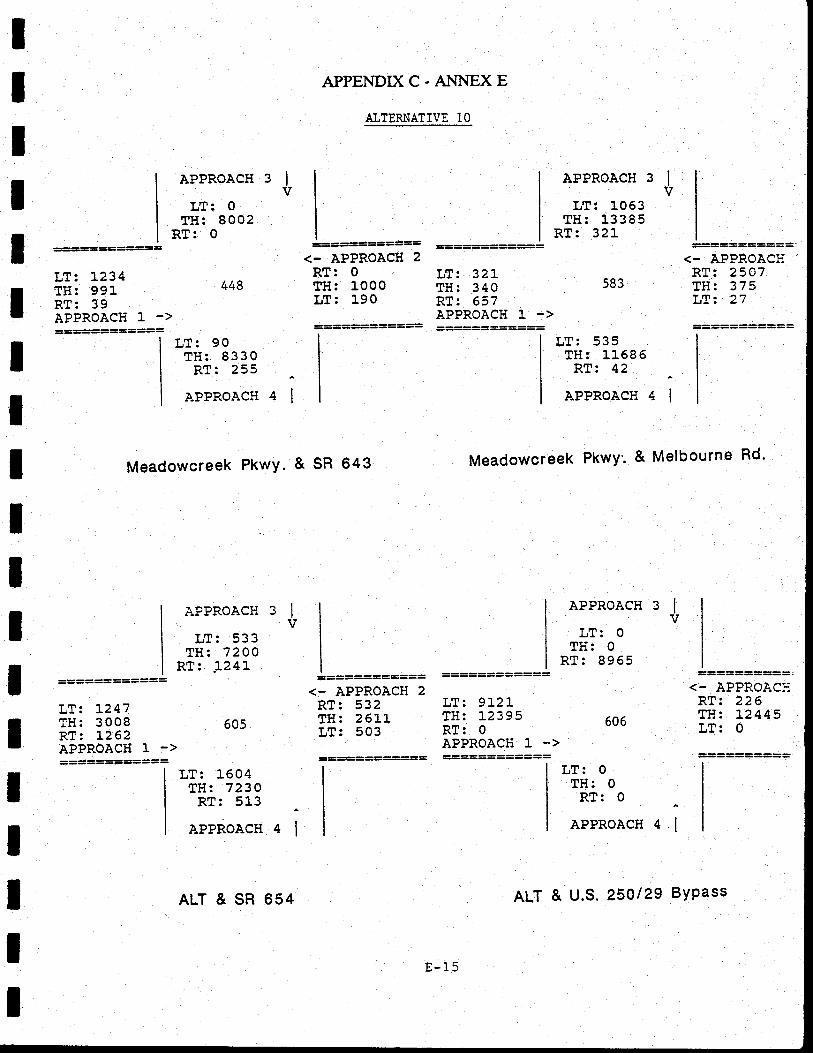
a;
tIIIIIIIIIItIIIIIII
APPENDIX C. ANNEX E
ALTERNATIVE 10
============
LT: L234TH: 991RT: 39APPROACH ]- ->============
============
LT: :..247TH:3008RT: 1262APPROACH 1 ->============
APPROACH 3 |vLT: O
TH: 8002RT: 0
448
LT:90TH: 8330RT: 255
APPROACH
<. APPROACI{ 2RT: 0TH: 1000LT:190
============II
I
II
II
===========g<- APPROACH 2RT: 532TH: 26ILLT: 503
LT: 32]-TH: 340RT: 657APPROACH ]" ->
LT: 9:..2]-TH: L2395RT:0APPROACH 1 ->
APPROACH
LT: 1053TH: 13385
RT: 32]-
583
y rTr o Ra <!4. JJJ
TH: 11685RT: 42
APPROACH
505
LT: O
TH: O
RT: 0
APPROACH
<- APPROACIiRT: 2507TH: 375LT: 27
<- APPROACHRT:226TH:12445LT:0
==========
alv
4l
Meadowcreek PkwY. & sR 643
APPROACH 3 IvLT:533
TH: 72OORT: I24l
Meadowcreek Pkwy'. & Melbourne Rd'
APPROACH 3 |vLT: O
fll: 0RT: 8955
605
LT:1604TH: 7230Rl: 513
APPROACH 4i 4l
ALT & SR 654
E- 15
& U.S. 250129 BYPass
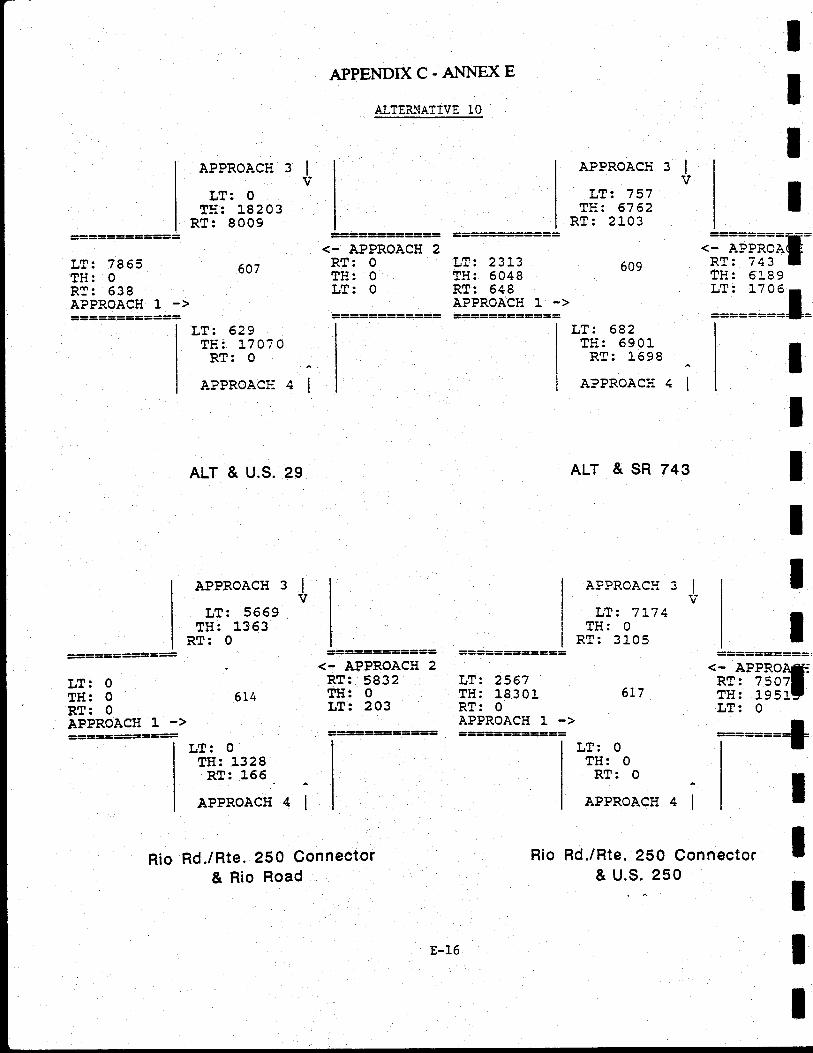
APPENDIXC-AI{NEXE
ALTER.NATIVE 10
IItt
LT:7863TH: 0RT:638APPROACH 1 ->============
============
LT:0TH: 0RT: 0APPROACH 1 ->
APPROACT:
LT:0TIi:18203
RT:8009
LT: 629Ti:: L7 07 0RT: O
APPROACIi
LT: 2567TH: L8301RT: 0APPROACH 1 ->
APPROACIi
Ll: 757TIi: 67 62
RT:2L03
609
LT: 682tTli. AOnlRT: L598
A?PROAC:i
APPROACH
LT:7l..71rFlI . n
RT:3L05
617
';;1;ttFI=fFtr. <1aq
ll==lllll=
'lHl"?5!?[LT:0
3lv
:l
647
<- APPROACH 2RT: 0 LT: 2313TH:0 TI{:5048LT: O RT: 648
APPROACH 1 ->
slil zlIItIII
& u.s. 2e
APPROACH 3 |vLT: 5669 ,
TH: 1363RT: O
614
LT: O
TIt: 1328RT: L66
APPROACH 4 I
ALT & SR 743
^l
<- APPROACH 2RT: 5832TH: O
LT: 2O3
Rd./Rte. 250 Connector& Rio Road
LT: 0TH: 0RT:0
^
APPRoACH 4 I
Rd.lRte. 250 Connector& u.s. 250
IIIII
Rio
E-16
Rio
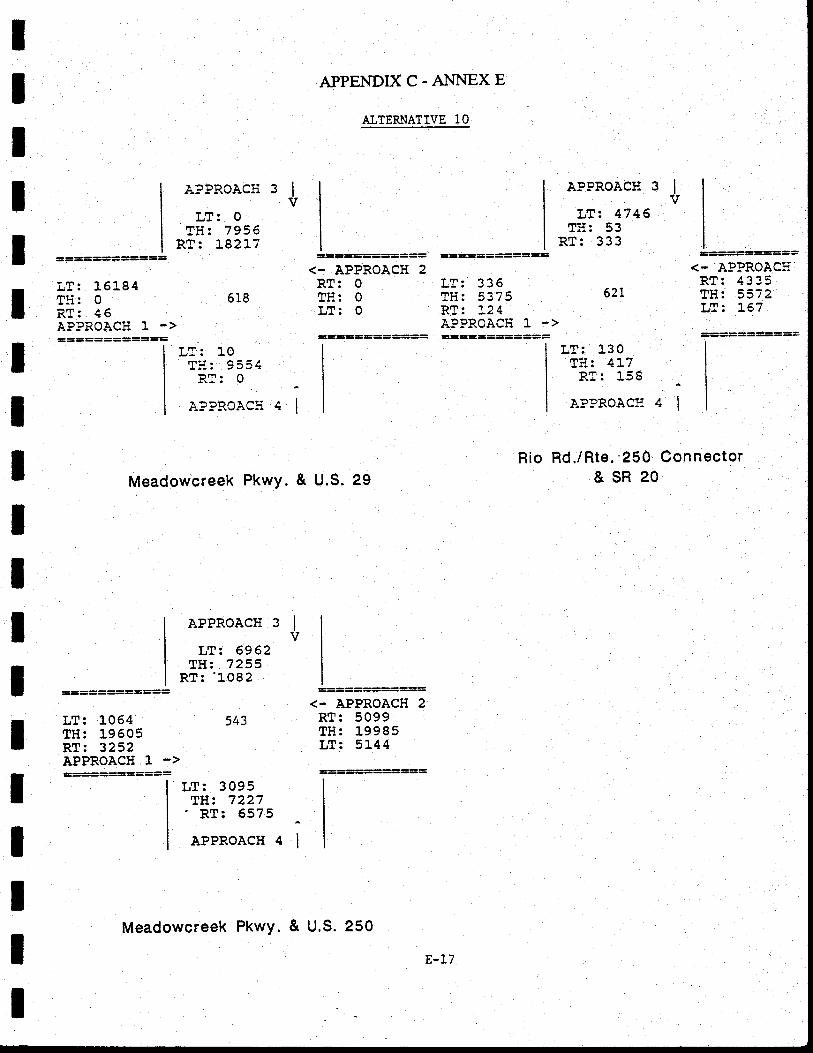
IIIIIItIItIIIIIIIII
LT: 15184Tii: O 618RT: 16APPROACH 1 ->====-:======
A?PROACH
?frr nIJt . vtTii. TqqA
R?: L8217
APPROACH
LT: 6962TH: 7255
RT:'L082
LT: 3095TH: 7227' RT: 6575
APPROACH
T..1r. "?6rFE. R'r?< 621
f lf . JJ. J
RT: !21APPROACH 1 ->
<- APPROAS:R?:4335TH:5372LT: L67
3lv
3lv
APPENDIXC-A}.INEXE
A],TERNATIVE 10
<- APPROACH 2RT: 0tnlr. nLT: O
APPROACH 3 |ttvLT:4746
rFtJ. t?RT:333
Tm. 1nTli: 9551Rl:0
A?PROACIi
Meadowcreek PkwY. & u.s. 29
*iLT:130TH: 4L7RT: 158
APPROACI{ 4 I
Rd./Rte. -250 Connector&SR20
Rio
LT:1054 543TH: 19605RT: 3252APPROACH ]- ->E===========
<- APPROACH 2RT:5099TH:19985LT: 5L44
4l
Meadowcreek PkwY. & u.s. 250
E-17
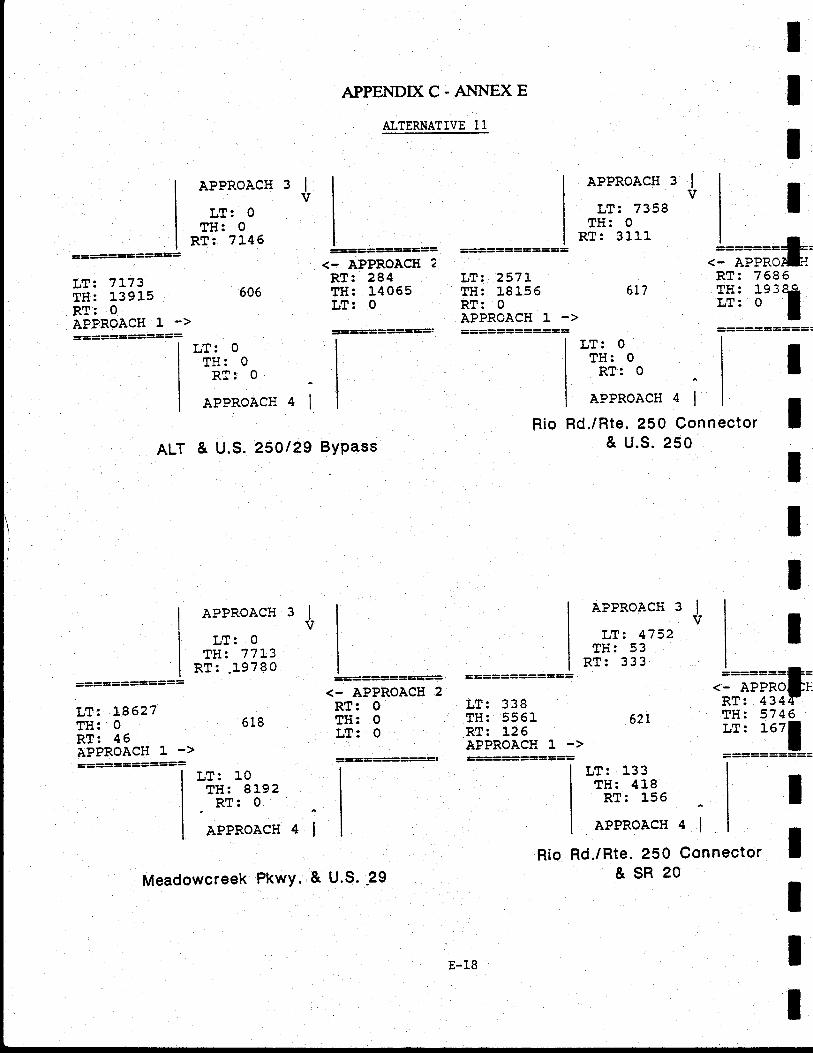
IIAPPENDD( C. AI-.INEX E
AJ.TERNATIVE 11
APPRoACH 3 |vLT:0
TH: 0RT: 7L46
APPROACH 3 |v
LT:7358TH: 0
RT:311L==========2=
LT:7173TH:13915RT:0APPROACH 1 :)============
============
LT: 18627TH: O 618RT: 46APPROACH 1 ->============
=-=====#=t<- APPROACII 2
RT: 284TH:14055LT: 0
<- APPROACH 2RT: O
TH: 0LT: O
LT: 257:..TH: L8L56 617RT: 0APPROACH 1 ->
Rio
.iTililt=RT: 7686mlr. 1O?QOii: o--II
606
LT: 0r.trg. nRT: O
^
APPROACH 4 I
ALT & U.S. 250129 BYPass
APPRoACH 3 IvLT:0
TH: 7713Rl: .L9780
LT: O
TH: 0RT:O^
APPROACH 4 |
Rd./Rte. 250 Connector& u.s. 2s0
APPROACIi 3 |vLT: 4752
Tli: 53RT:333
I
LT: L0TH: 8192
. RT: 0
APPROACH 4
IIII
IIIII
I
LT:338TH: 5561 621RT: L26APPROACH ]. ->=========:==
';;Ftrtf;TH: 5745LT: 16?l
LT: 133TH: 4LBRT:156
APPROACH 4 |
Rd./Rte. 250 Connector&SR20Meadowcreek PkwY.,& U.S- ,29
E-18
Rio
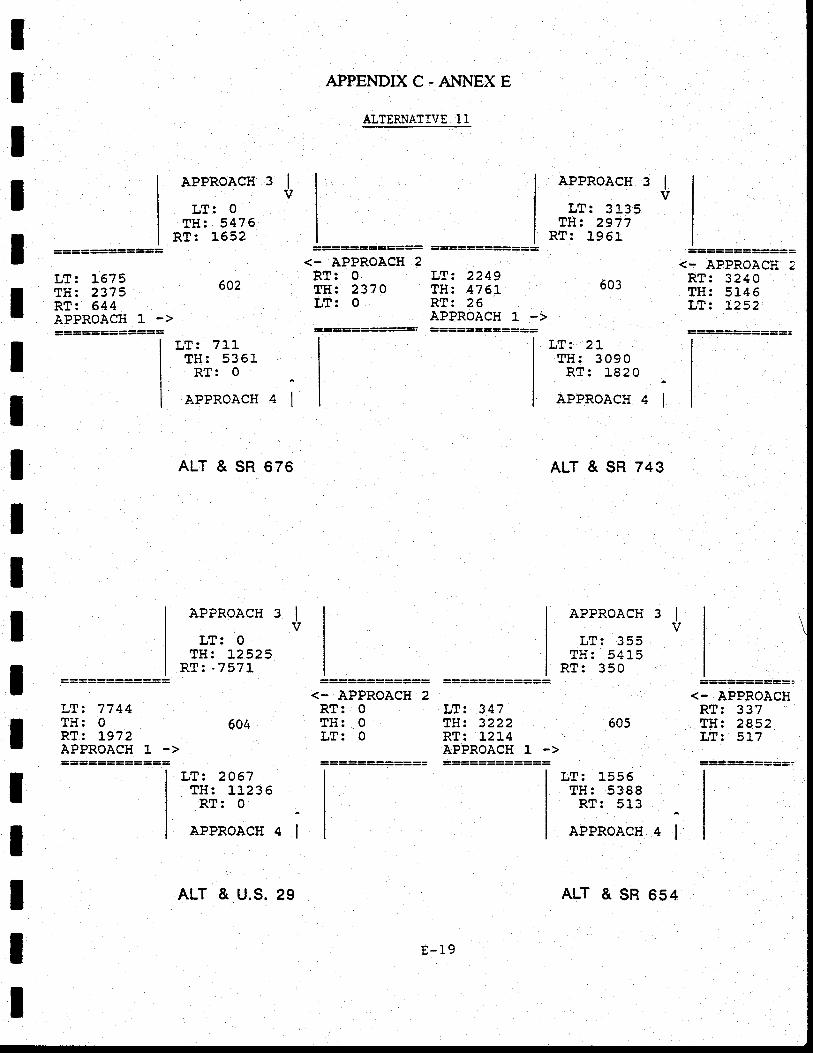
IIIIIII
APPENDIXC.AI{NEXE
ALTERNATIVE 11
APPROACH
LT: O
TH: 547 6RT: L652
LT: 7r.l.TH: 5351RT:0
APPROACH
6A4
LT: 2067TH: L1236RT: O
APPROACH
3lv
APPROACTI 3 |vLT: 3135
TH: 2977RT: 1961
LT: T675Tli:2375RT: 644APPROACH ].===========:
LT:7744Til: 0RT: L972APPROACH ]. ->
ALT & SR 676
APPROACH 3 IV
LT: O
TIt: ],2525RT: -757I
ALT & SR 743
LT:2LTH:3090RT:1820
APPROACH
APPROACH
T.rF. ? E Rtnuo Er .l ErJl . Jt LJ
RT: 350
<- APPROACH 2RT: O
TH: 2310LT: O
LT: 2249TH:4761RT: 26APPROACH 1 ->
<- APPROACH 2rA^ RT:3240our TH: 5r-4 6
LT: )"252
sl Al=lIIIttIIIIItI
3l
4l
.:;;ilffi-;RT: 0lnll . nTrn. nuL. v
=-=:====:===
Tm. .rA1U4. Ja t
?H: 3222RT: ].2]-4APPROACH 1 ->
605
LT: l-556TH:5388RT: 5L3
APPROACH
==========:<. APPROACHRT: 337lH: 2852Ttn. R1t
==========:
4l
ALT & U.S. 29
E- 19
ALT & SR 654
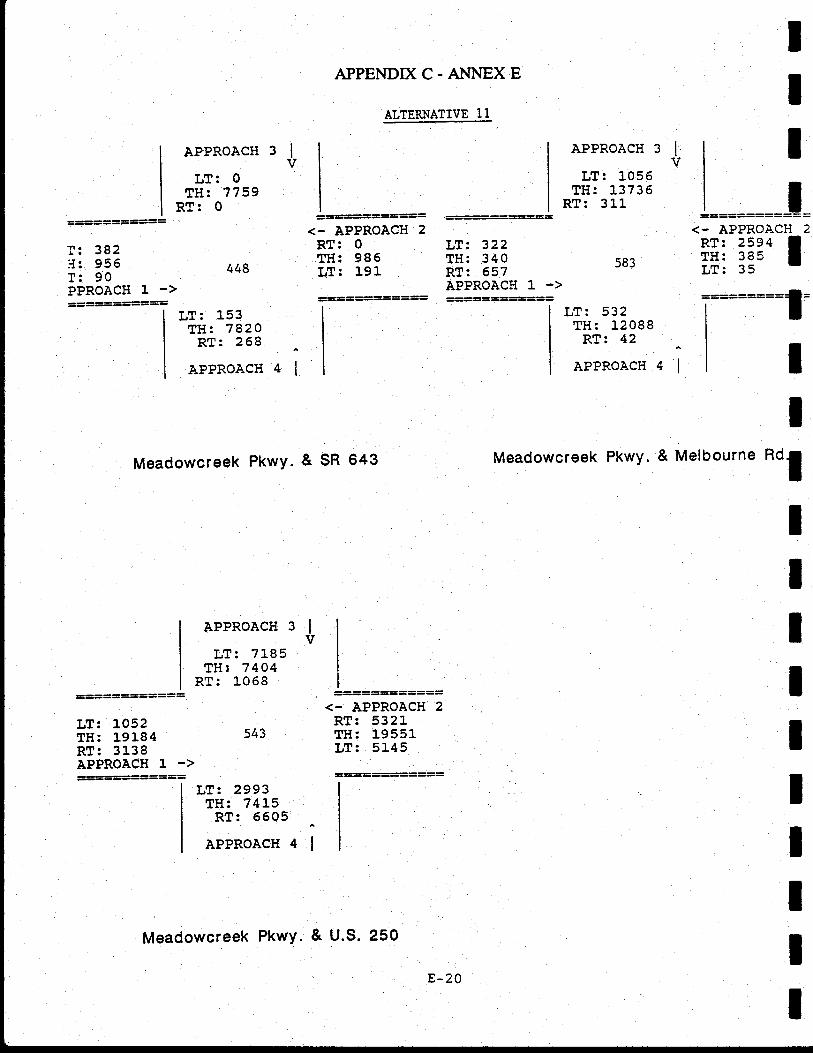
APPENDIX C. A}.INEX E
ALTERNATIVE 11
IT
IPkwy. &"Melbourne Rd1
II
II
II
APPROACH
LT: oTH: 7759
RT: 0
448
LT:153TH: 7820RT: 268
APPROACH
3lv
APPROACH
LT: 1056TI{:13736
RT:311
3lv I
=:=I=I: 382:I: 955T: 90PPROACH 1 ->===========
==:=-==:===<- APPROACH 2RT: 0TH: 986LT:191
LT: 322TH: 340RT: 657APPROACH 1 ->
<- APPROACH 2
lil: i!3-l
4l
583
LT: 532TH: L2088RT:42
APPROACH *i
Meadowcreek PkwY. & sR 643
APPROACH 3 |vLT: 7L85
TH:7404RT: 1068
Meadowcreek
LT: 1052TH: 19184 543RT: 3138APPROACH ]. ->=-=========
=========:==<- APPROACH 2RT: 5321TH: 19551LT: 5L45
LT: 2993TH: 74L5RT: 6605
APPROACH a;
Meadowcreek PkwY. & u.s. 2s0
E-20
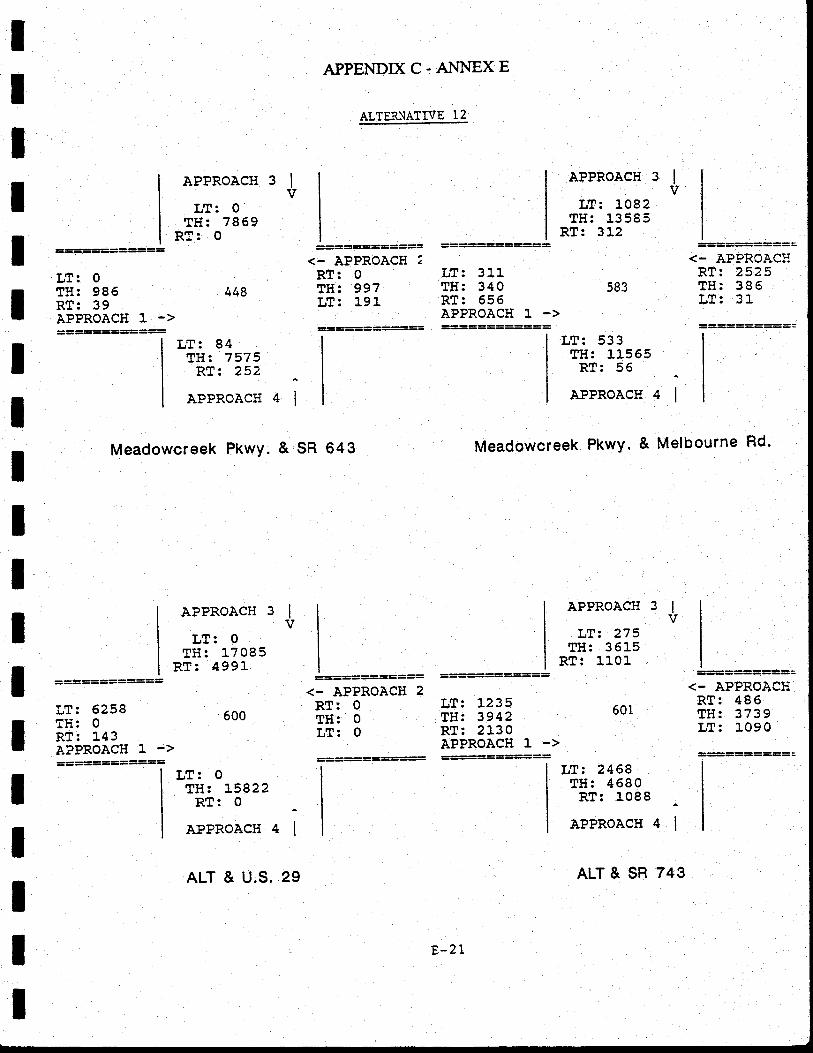
IIIIIIIIItt
601
IIIIIII
APPENDIXC-A}.INEXE
ALTERNATIVE 12
LT: O
TH: 985RT: 39APPROACH 1 ->=====-===-
448
LT: 84TH: 7575RT: 252
APPROACH
T: O
TH: L5822RT: O
APPROACH
<- APPROACH :RT: O
TH: 997LT:19L
LT: 311TH: 340RT:556APPROACH 1 ->
APPRoAC}{ 3 |vLT: 1082
TH: 13585RT: 312
583
LT:533TH: L1565RT: 56
APPRoACH 4 |
LT:2468TH:4680RT:1088
APPROACH
<- APPROACHRT: 2525TH: 385?rno ?1!4. JJ
<- APPROACHRT:486TH:3739LT: 1O9O
APPROACH 3 |vLT: O
TIi: 7869RT: O
*iMeadowcreek Pkwy. & SR 643
APPROACH 3
LT: O
TH:17085RT: 4991
Meadowcreek PkwY. & Melbourne Rd'
APPROACH 3 |v
LT:275TH:361-5
RT: L101
LT: 6258Tti: o 600
RT:143APPROACH ], ->-==a==-====-
===-========<- APPROACIT 2RT: 0TH: O
LT: 0
============II
II
IIII
LT: 1235TI{: 3942RT: 2l-30APPROACH 1 ->========-==
4i nl=l
ALT & U.S. 29
E-27
ALT & SR 743
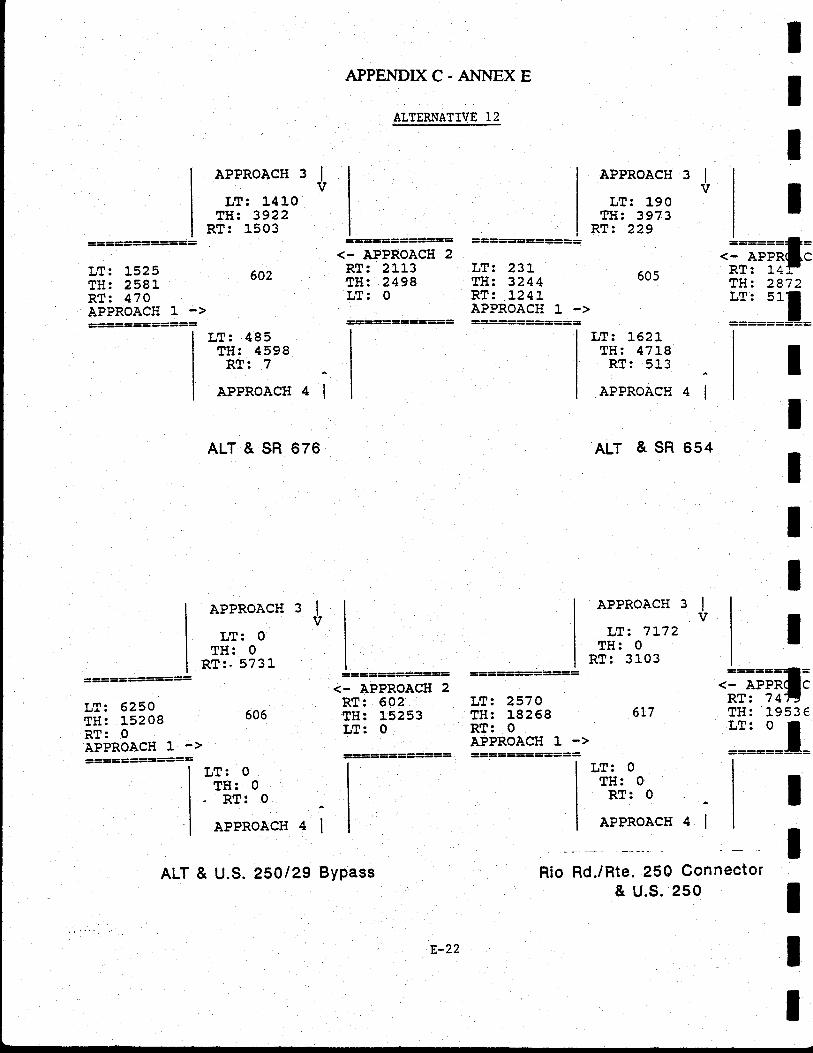
APPENDIXC-ANNEXE.t
ALTERNATIVE 12
IIII
TrF. 'lRttD1.
'JEJ3H:2581RT: 47OAPPROACH 1============
LT: 6250TH: 15208RT: O
APPROACH 1 ->==-========-
APPROACH
LT: 1410lH: 3922
RT: 1503
LT:485TH: 4598RT: 7
APPROACH
<- APPROACH 2RT:2113TH: 2498LT: O
LT: 231TH: 3244RT: l24lAPPROAC}I 1 ->
APPROACH 3 IvL?: 190
fH: 3973RT: 229
605
LT:1521TH: 47L8RT: 5L3
APPROACH
ALT & SR 654
';;Fitil;TH: 2872
::::::l=
3lv
4l .lIIIIII
ALT & SR 676
APPRoACH 3 |vLT: 0
TH: 0RT:. 5731
APPROACH
LT:777?TH: 0
RT:31-03
^lrlv
========-==<- APPROACH 2RT: 602TH:15253LT: O
LT: 2570TH: 18268RT: O
APPROACH 1 ->
6t7
LT: 0TH: 0RT:O
^
APPROACH 4 I
nio nO.ln,". ZSO Connector& u.s. 2s0
.;;Fttil;TH:1953€
:::=:=l=LT:0TH: 0
-RT:OAPPROACH 4
IIIII
II
ALT & U.S. 250/29 BYPass
E-22
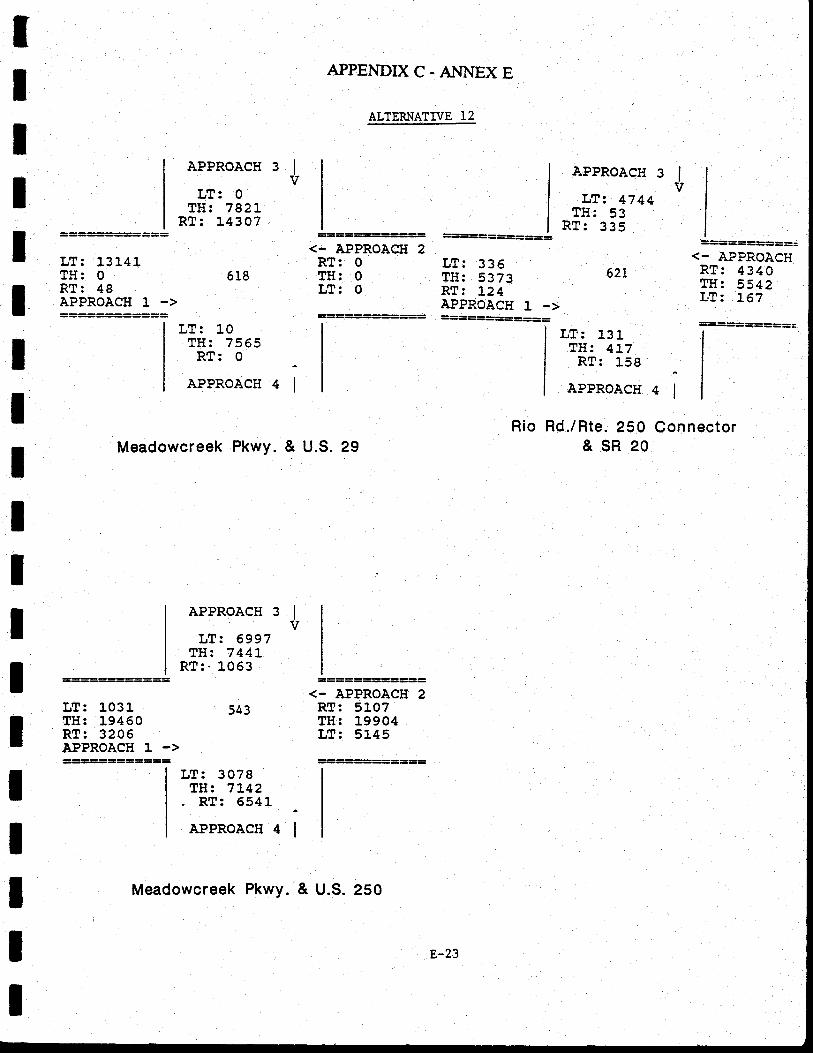
T
IIT
IIIIIIIIIIIIItI
APPENDIXC-Al.tNEXE
ALTERNATIVE 12
==E=====-i===
LT:13141TH: O 618RT: 48APPROACH 1 ->
<- APPROACH 2RT: O
III: 0tT: O
APPROACIT 3 IvLT:4744
'TtI . R2JJ
RT: 335
62L
===========<- APPROACHRT:434ATH: 5542LT: L67
LT:335TH: 5373RT:].,24APPROACH 1 ->
Rio
APPROACH 3 |v
LT: O
TH: 782LRT: L43O7
LT:10TH: 7565RT: O
APPROACH
LT: 131TH: 4T7RT: 159
APPROACH
Rd./Rte. 250 Connector&sR20
======:===a.I
II-lI
t | |-tl
Meadowcreek
4l
Pkwy. & U.S. 29
APPROACH 3 |v
LT: 6997TH:744t
RT:-1063
LT: 1031TH: 19460RT: 3246APPROACH I .>
543<- APPROACH 2RT: 5107TH: 19904LT: 5145
LT:3078TH: 7L42
. RT: 654L -APPROACH 4 |
Meadowcreek Pkwy. & U.S. 250
E-23