Embed Size (px)
Citation preview

www.elsevier.com/locate/cogbrainres
Cognitive Brain Research
Research Report
Cortical activation during Pavlovian fear conditioning depends on heart
rate response patterns: An MEG study
Stephan Moratti*, Andreas Keil
Department of Psychology, University of Konstanz, P.O. Box D25, D-78457 Konstanz, Germany
Accepted 21 July 2005
Available online 2 September 2005
Abstract
In the present study, we examined stimulus-driven neuromagnetic activity in a delayed Pavlovian aversive conditioning paradigm using
steady state visual evoked fields (SSVEF). Subjects showing an accelerative heart rate (HR) component to the CS+ during learning trials
exhibited an increased activation in sensory and parietal cortex due to CS+ depiction in the extinction block. This was accompanied by a
selective orientation response (OR) to the CS+ during extinction as indexed by HR deceleration. However, they did not show any differential
cortical activation patterns during acquisition. In contrast, subjects not showing an accelerative HR component but rather unspecific HR
changes during learning were characterized by greater activity in left orbito-frontal brain regions in the acquisition block but did not show
differential SSVEF patterns during extinction. The results suggest that participants expressing different HR responses also differ in their
stimulus-driven neuromagnetic response pattern to an aversively conditioned stimulus.
D 2005 Elsevier B.V. All rights reserved.
Theme: Neural basis of behavior
Topic: Motivation and emotion
Keywords: Pavlovian conditioning; Cortical activation; MEG; Heart rate; Fear response; Steady state visual evoked field
1. Introduction
Learning that certain events in an individual’s environ-
ment signal potential threat or danger is an important ability
to ensure survival of the organism. Pavlovian fear con-
ditioning [69] as a laboratory model of the aforementioned
ability represents a simple form of associative learning that
is part of most mammalian defensive behavior systems [21].
The neural systems underlying fear conditioning have
been elucidated by animal models as well as human imaging
studies using functional magnetic resonance imaging (fMRI)
and positron emission tomography (PET) [13,58]. The
amygdala has been regarded as the key structure processing
aversive stimuli via afferents from sensory thalamus [55,84],
enabling fast evaluation of noxious stimuli without complex
computations of the cortex. As the amygdaloidal complex is
0926-6410/$ - see front matter D 2005 Elsevier B.V. All rights reserved.
doi:10.1016/j.cogbrainres.2005.07.006
* Corresponding author. Fax: +49 7531 884601.
E-mail address: [email protected] (S. Moratti).
highly interconnected with the temporal, orbito-frontal, and
insular cortices [1,2,64,74], the amygdala is anatomically
well placed for stimulus association learning in various
sensory domains. Given its fast access to sensory informa-
tion and its neuroanatomical location, the amygdala has been
assigned a central role in mediating synaptic changes at the
cortical level [59] necessary for the association between the
conditioned (CS) and the unconditioned stimulus (US). For
example, Buchel and colleagues [14] demonstrated in an
fMRI study that the amygdala activation was most prominent
during acquisition of the conditioned response (CR) and
LaBar and collaborators [50] showed a decline of amygdala
activation over trials possibly reflecting that amygdala
activation is only necessary until associations between the
CS and US have been formed.
In addition to amygdala circuitry and highly intercon-
nected with it, a distributed network of cortical areas seems
to be involved in classical fear conditioning as well. For
example, standard fear conditioning paradigms using
25 (2005) 459 – 471

S. Moratti, A. Keil / Cognitive Brain Research 25 (2005) 459–471460
auditory CS not only reported enhanced spike firing rates in
neurons of the amygdala and hippocampus, but also of
neurons in auditory cortex [5,52,75]. In the visual system of
primates, the amygdala projects back to various stages in the
ventral visual path and receives itself highly processed
sensory information [3]. This neural architecture may be the
basis of a mechanism, which enhances stimulus processing
in visual sensory systems. In line with this notion, imaging
studies in humans have shown greater activations for the
reinforced visual CS (CS+) as compared to the non-
reinforced CS (CS�) in temporal and occipital cortices
[15,39].
Additional support to the involvement of cortical areas in
fear conditioning comes from cognitive theories of Pavlo-
vian conditioning that emphasize anticipation or attentional
processes [70]. For instance, Rescorla [77] has emphasized
that the CS+ in a Pavlovian conditioning paradigm gains
predictive value that enables the organism to anticipate an
aversive event. The ability to obtain such a predictive value
has been associated with the salience of a stimulus [57].
Thus, at a neurophysiological level, cortical systems media-
ting attentional and evaluative processes should come into
play.
There is good evidence for the involvement of a
widespread fronto-parietal cortical network in orienting to
a stimulus and integrating its features [16,54,68,80]. Human
imaging studies of Pavlovian conditioning have consistently
reported enhancement of cortical activity for visual rein-
forced CSs in brain regions like the frontal, temporal,
parietal cortices, and the anterior cingulate [14,22,23,
39,47,50] possibly reflecting the involvement of a neural
network mediating attention/emotion aspects of that stimu
lus. In a recent fMRI study, Armony and Dolan [4]
demonstrated that a visual context stimulus modulated
conditioned BOLD responses in auditory cortex associated
with activity in parietal cortex, further illustrating the
importance of cortical structures being part of a cortical
attention network.
In the present work, we investigated changes of cortical
processes over time using the steady state visual evoked
field (SSVEF) technique. SSVEFs (a counterpart of the
SSVEP in EEG research) reflect widely distributed func-
tional networks oscillating coherently at the driving stimulus
frequency and are sensitive to attentional and complex
cognitive processes [61,66,71,85].
As expectancy and attentional processes may be
involved in Pavlovian conditioning as outlined above,
the SSVEP/SSVEF paradigm seems to be an adequate tool
in order to track ongoing neural activity associated with
processes of aversive conditioning. A recent SSVEP study
by Gray and coworkers [26] investigated cortical oscil-
latory activity during the anticipation of an electric shock
and revealed the involvement of frontal, temporal, and
occipital electrode sites during anticipatory anxiety.
Recently, Moratti and collaborators [60] have identified
a fronto-parietal network during visual affective stimulus
processing using magnetoencephalography (MEG) and the
SSVEF technique. This finding supports the involvement
of networks traditionally related to attention processes in
processing of emotional information. In the same vein, it
has been demonstrated that cued spatial attention and
motivated attention to affective stimuli possibly interact
within the same neuronal networks of attention and
stimulus processing [44]. This raises the question whether
similar neurophysiological processes are associated with
viewing arbitrary visual stimuli which are associated with
aversive responses as a consequence of classical fear
conditioning. There is, however, no study to date using
the SSVEP/SSVEF technique in combination with a
discriminative aversive conditioning design which allows
the direct comparison between the stimulus-driven neuro-
magnetic response of a reinforced (CS+) and nonrein-
forced (CS�) stimulus during acquisition and extinction
blocks.
Therefore, the aim of the present study was to examine
cortical sources of the SSVEF as modulated by the
predictive value of a visual CS during acquisition and
extinction, using MEG. Since the SSVEF response is a
stimulus-driven ongoing oscillatory response in cortical
networks responsible for processing the visual CS+ and
CS�, estimating the underlying sources should elucidate the
involvement of relevant cortical structures in Pavlovian
conditioning. Applying the minimum norm estimate (MNE)
[34,35] to the SSVEF response to determine the cortical
sources of the neuromagnetic field, we hypothesized that
after an association between the CS+ and the US has been
established, the motivationally relevant CS+ will generate
greater amplitudes in fronto-parietal and extrastriate cortex
responsible for allocating attention and feature extraction,
respectively. As the MEG has sufficient temporal resolution,
we were interested at what time interval during CS depiction
a differential activation pattern in the aforementioned
cortical structures could be observed for the CS+ and
CS�, respectively.
Heart rate (HR) was recorded to validate the effective-
ness of the conditioning procedure. Further, we wanted to
evaluate the brain responses of subjects who reacted with
accelerative or decelerative HR change components in
response to the CS+ during acquisition as has been observed
by various authors [28,32,38]. Hodes et al. [38] hypothe-
sized that HR accelerators learn a fear response whereas HR
decelerators just learn that two events are related in time.
Hamm and Vaitl [28] demonstrated that only subjects
responding with an accelerative HR component displayed
potentiated startle responses to the CS+. We wanted to
explore if attentional and sensory cortical networks during
Pavlovian conditioning are involved in HR accelerators and
decelerators to the same extent. Subjective judgments of the
US were obtained in order to assess the aversiveness of the
US. Further, we collected questionnaire data in order
to evaluate state/trait anxiety and depressiveness of the
participants.

S. Moratti, A. Keil / Cognitive Brain Research 25 (2005) 459–471 461
2. Materials and methods
2.1. Participants
Nineteen paid volunteers (10 females, 9 males, all right
handed [67]) gave written consent to participate in the study.
Their mean age was 27.1 years (range: 20–49 years). They
had normal or corrected to normal vision and no family
history of photic epilepsy. They did not report a recent
critical live event or any history of psychotherapy. On the
German version of the state–trait anxiety inventory (STAI)
[53], subjects reported a mean state anxiety score of 31.1
(T1.1) and a mean trait anxiety score of 34.2 (T1.8). Theirmean depression score measured by a German version of the
Beck depression inventory (BDI) [36] was 3.8 (T0.8). Dueto equipment malfunction, we lost HR data of one subject.
Another subject had to be excluded from the analysis
because of noise-contaminated MEG data. The MEG data of
the participant with the missing HR data was excluded from
further processing because the MEG data of groups
associated with different HR responses were analyzed
separately (see below). Finally, HR data of eighteen [10
females, 8 males, state anxiety: 31.1 (T1.1), trait anxiety:34.4 (T1.9), BDI: 3.8 (T0.8)] subjects and MEG data of
seventeen subjects [9 females, 8 males, state anxiety: 31.3
(T1.2), trait anxiety: 34.4 (T2.0), BDI: 3.4 (T0.7)] will bereported.
2.2. Stimuli
Two gray shaded 45- gratings perpendicularly oriented
to each other served as conditioned stimuli (CS). Using a
video projector (JVCi, DLA-G11E) and a mirror system,
the CSs were projected on a screen in the magnetically
shielded room in random order, subtending a visual angle
of 8- both horizontally and vertically. A red fixation cross
was shown in the middle of the screen and was present
throughout the whole experiment. In each trial, a grating
was shown in a luminance-modulated mode of 12.5 Hz for
a time period of 5000 ms resulting in 63 on/off cycles, the
grating being shown for 40 ms, followed by 40 ms black
screen during each cycle. During the intertrial interval,
which varied randomly between 6 and 8 s, a black screen
was shown. The luminance modulation was done in order
to elicit visual evoked steady state fields that can be
recorded with MEG.
One of the two gratings was selected as the CS+ or CS�,
counterbalanced across subjects. Using an air tube system
attached to a sound amplifier (BTi \ ASG, 1996), the
unconditioned stimulus (US) consisting of a 95-dB white
noise with instantaneous onset was presented binaurally for
1 s during the last second of CS+ depiction, and terminated
together with CS+ offset. In 15% of the trials (see below),
the red fixation cross turned from blue into red color for 500
ms either 1000, 2500, or 4000 ms after CS+ and CS� onset,
each time lag occurring with the same probability.
2.3. Procedure
Upon arriving at the laboratory, subjects were familiar-
ized with the MEG chamber in which the recording took
place. Subsequently, participants were instructed about the
experimental procedure (see below). Then, subjects gave
written consent and completed the STAI and the BDI.
Thereafter, participants were prepared for the recordings.
For artifact control, four electrodes for the electrooculo-
gram (EOG) were attached, two at the left and right outer
canthi and two above and below the right eye. Additionally,
two electrodes for the electrocardiogram (ECG) were placed
at the left lower costal arch and the right collarbone.
Participants were then seated in the MEG chamber, their
head shapes were digitized, and index points (left and right
periauricular points, nasion, a pseudo-vertex and a pseudo
inion point at the forehead) were determined to calculate the
relative head position within the MEG helmet for source
analysis. Finally, they were positioned under the MEG
sensors and a projection screen was placed in front of them.
The experimental session started with participants read-
ing a written instruction on the screen in the MEG chamber
explaining again the task and ensuring subjects that no loud
noise would be delivered during the first block, which
served as a habituation phase. The habituation block
consisted of twenty CS+, twenty CS�, and six target trials
which requested a button press after the red cross had turned
into blue. The stimuli were depicted without pairing of the
CS+ with the US. Thereafter, a short break of 1 min was
allowed and subjects were instructed via text depicted on the
screen that during the next block, they will hear a loud noise
from time to time. After the break, the acquisition block
began, which was identical to the habituation block, except
that the CS+ was always paired with the US. The extinction
phase started without a break after the acquisition trials,
containing the same number of trials as the individual
blocks before. The CS+ and CS� were never paired with
the US during extinction. After the experiment, participants
rated pleasantness/unpleasantness and the level of arousal
on a 10-cm analog scale each, whereas a greater distance
from the left starting point of the analog scale represented a
higher level of unpleasantness and arousal, respectively.
Finally, participants were interviewed if they had detected a
rule behind US presentation and were coded as aware or
unaware of conditioning contingency depending on rule
identification. Subjects were paid C15 (approximately 15
US dollars) for participation.
2.4. Data acquisition and preprocessing
The MEG was recorded continuously, and digitized at a
rate of 254.3 Hz, using a 148-channel whole head system
(MAGNESi 2500 WH, 4D Neuroimage, San Diego,
USA). A bandpass filter of 0.1–50 Hz was applied on line.
The EOG and ECG acquisition was performed by means of
a Synamps amplifier (NEUROSCANi) using Ag/Cl

S. Moratti, A. Keil / Cognitive Brain Research 25 (2005) 459–471462
electrodes. As the EOG and ECG recordings were coupled
with the MEG acquisition, the same sampling rate and
bandpass filter were applied to them.
SSVEFs were derived for each condition (CS+ and CS�)
and every experimental block (habituation, acquisition,
extinction) by averaging the MEG data over 4000 ms
subtracting a 500-ms pre-stimulus baseline. The last 1000
ms of CS presentations were omitted because during CS+
trials in the acquisition block, a loud noise as US was
presented and startling of the subjects caused movement
artifacts. The target trials (subjects were requested to press a
button) were not submitted to further analysis. Eye artifact
topography was corrected using the algorithm implemented
in BESAi software [9]. Additionally, all data were
inspected visually for movement artifacts.
Subspace out-projection [88] of the eye artifact topo-
graphy was applied on the SSVEFs for each condition (CS+
and CS�) and each experimental block (habituation,
acquisition, and extinction) in order to account for topo-
graphy distortions using the eye correction algorithm (see
below). Thereafter, the SSVEFs were complex demodulated
[76] at the stimulation frequency of 12.5 Hz in order to
obtain stimulus-driven amplitudes for the sine and cosine
parts of the demodulated SSVEFs over time.
As with the MEG data, only the first 4000 ms of HR
change during stimulus presentation were analyzed. Target
trials were not submitted to analysis. HR change waveforms
were calculated for 4000 ms of stimulus viewing in 500-ms
steps subtracting a 2000-ms pre-stimulus baseline. The
frequency of the occurrence of an R-wave was derived from
the interbeat-interval and vectorized by weighting it by the
distance to a 500-ms bin within the time vector. The
HR change was transformed in beats per minute (bpm).
Habituation blocks were not analyzed.
2.5. Source analysis
In order to estimate the cortical sources of the complex
demodulated SSVEFs, a minimum norm estimation (MNE)
technique was applied [27]. The MNE procedure utilized in
the present study was described in more detail in Moratti et
al. [60] and will be outlined only in brief, here. The
estimated current density of the sources is obtained by
solving the following equation:
b ¼ Axþ e ð1Þ
where b is the data vector, A is the lead-field matrix
describing the sensor’s sensitivity to the sources located,
e.g., on a shell, x is the solution of the current density of the
sources, and e is the noise component.
The MNE is characterized by minimizing the power of
the estimated solution x (L2-norm). Given the presence of
noise and a high number of sensors, a regularization during
pseudo-inversion of A is necessary to obtain a stable current
density solution [10]. Here, a Tikhonov–Phillips regulari-
zation was applied in order to suppress the noise part of the
solution. For the determination of the regularization para-
meter k, the L-curve method was used [31]. The L-curve
method determines a trade off between a good data fit and
minimizing the power of the solution [31].
For the computation of the lead-field matrix A, we used
the algorithm suggested by Hauk et al. [34]. To this end, A
was calculated for each participant, based on information on
the center of a fitted sphere to the digitized head shape, and
the positions of the MEG sensors relative to the head. A
subspace projection [88] of the eye artifact topography was
applied to the lead-field matrix A in order to account for
topographical distortions caused by the eye artifact correc-
tion (see above). A spherical shell with evenly distributed
350 dipole locations served as source space. The radius of
the shell was 80% of the radius of the fitted sphere.
According to Hauk et al. [34], this radius was considered as
a good approximation of the location of cortical sources.
For the derivation of k and computation of the MNE
solution, we used an L-curve and Tikhonov–Phillips
regularization algorithm implemented in MATLABi by
Hansen and O’Leary [31] available at http://www.imm.
dtu.dk/~pch/. As the phase information of the measured
MEG signal is crucial for the computation of the MNE and
is lacking in a complex demodulated signal, the MNE was
estimated for the sine and cosine parts of the 12.5-Hz
complex demodulated SSVEFs separately for every con-
dition (CS+ and CS�), experimental block (habituation,
acquisition, and extinction), and for each subject. This
procedure was derived from an algorithm calculating the
MNE in the frequency domain suggested by Jensen and
Vanni [40]. The square root of the sum of squares of the
MNE amplitudes for the sine and cosine parts served as a
measure of the total 12.5 Hz current source density over
stimulus presentation time:
Ampi tð Þ ¼ffiffiffiffiffiffiffiffiffiffiffiffiffiffiffiffiffiffiffiffiffiffiffiffiffiffiffiffiffiffiffiffiffiffiffiffiffiffiffiffiffiffiffiffiffiffiffiffiffiffiffiffiffiffiAmp2i;sine tð Þ þ Amp2i;cosine tð Þ
q;
ia 1; N ; 350½ �; ta 0 ms; N ; 4000 ms½ � ð2Þ
where Ampi(t) is the total amplitude of the 12.5-Hz
demodulated SSVEF at dipole location i and time t, and
Ampi,sine(t) and Ampi,cosine(t) are the corresponding ampli-
tudes of the sine and cosine parts for time t.
L-curves were calculated for the averaged baseline
topography over the 500-ms pre-stimulus interval for each
condition (CS+, CS�), experimental block (habituation,
acquisition, extinction), and sine/cosine parts within one
subject. The highest k value determined from the resulting
L-curves was used as regularization parameter. This
procedure was chosen in order to prevent that different
regularizations could account for condition effects. Finally,
the MNE solutions were projected on a standard brain
implemented in the EMEGS* analyzing software [41]
freely available at http://www.uni-konstanz.de/win/emegs
and submitted to a statistical mapping procedure (see
below).

S. Moratti, A. Keil / Cognitive Brain Research 25 (2005) 459–471 463
2.6. Statistical analysis
In order to evaluate differences between processing of
the CS+ and CS� over stimulus presentation time, the MNE
amplitudes were averaged across three time windows (t1:
0–1.3 s; t2: 1.3–2.6 s and t3: 2.6–3.9 s) for each condition
(CS+, CS�), each experimental block (habituation, acquis-
ition, and extinction), and each subject. Within every
experimental block, the interaction between condition
(CS+, CS�) and time (t1, t2, t3) was modeled at 273 of
the 350 sources of the MNE shell in order to identify source
clusters of differential activations for the CS+ and CS�.
Sources located at the bottom of the shell were not
considered as meaningful and were omitted in order to
reduce noise and to enhance statistical power (reducing the
number of dipoles from 350 to 273). The P values for the
interaction terms were corrected for 273 multiple tests by
the false discovery rate procedure [8,45] and mapped on a
standard brain implemented in the EMEGS* analyzing
software.
The interactions were modeled using a linear mixed
effects model (LME) applying restricted maximum like-
lihood estimators (REML) for parameter estimation. A
detailed introduction of LME models in psychophysiolog-
ical research is given by Bagiella et al. [6]. As LME models
use vertical data matrices, the degrees of freedom of the
denominator are higher than those obtained by univariate
analysis of variance. A description of the REML estimation
method can be found in Searle et al. [83]. As the factor time
implies dependence of observations, a first-order autore-
gressive [AR(1)] covariance structure was applied that
estimates one correlation parameter between observations
and assumes that the interdependence of observations
decays exponentially. Such serial correlation structures have
been introduced to model dependence in time-series data
and are discussed, for example, in Pinheiro and Bates [73] in
more detail. In the LME model, we chose condition and
time as fixed effects. As we were not interested in mean
differences in MNE amplitudes between subjects over all
conditions and within conditions, we selected the intercept
to be a random effect at the subject and condition within
subject level. The statistical modeling was done using R*
[87], a freely available statistical package.
Source clusters were considered as meaningful whenever
at four or more neighboring source locations the interaction
terms survived the false discovery rate procedure for 273
tests and thus consisted of sources with associated corrected
P values less than 0.05. The mean amplitude across dipoles
of an identified source cluster was submitted to LME
analysis identical to the one described above, except that we
added the fixed effect time2 to the fixed effect time and
considered them as ordered factors in order to assess
different time courses of cortical activations for the CS+
and CS� (linear and quadratic time courses). Whenever the
kind of time course (linear and/or quadratic) interacted with
condition, the time courses were modeled for the CS+ and
CS� condition, separately. Additionally, we conducted
paired t tests in order to assess at which time slots (t1, t2,
t3) the CS+ and CS� generated different cortical source
activations.
Finally, following the procedure described by Hodes et al.
[38], a cluster analysis was performed on heart rate data
obtained in acquisition trials during CS+ presentation. This
approach was chosen because we wanted to identify
subjects who accelerated or decelerated in their HR response
to the CS+ during acquisition as observed by previous
studies [28,32,38].
The HR obtained change time series for groups derived
by cluster analysis was analyzed using an LME model. The
model was identical to the LME model presented above,
except that time, time2, time3, and time4 served as ordered
fixed effects in order to assess a linear, quadratic, cubic, and
quartic time course of the HR data. This was implemented
on the basis of earlier notions [89] suggesting that analyzing
differences in HR waveform components is more mean-
ingful than comparing means. The time factors consisted of
nine time bins containing 500 ms each (see above). As we
were not interested in mean differences or drifts of the HR
response curve per subject over all conditions and within
conditions, we chose the intercept and the linear slope (time)
to be random effects at both the subject and condition within
subject level.
The difference between HR accelerators and decelerators
with respect to the sum scores of the questionnaires and to
the distance from the left starting point of the analog scales
were analyzed using t tests. The frequency distributions of
females and males and of subjects aware or unaware of
conditioning contingency were assessed by v2 tests.
3. Results
3.1. Delineation of different HR change responders by
cluster analysis
The cluster analysis on HR change in acquisition trials
during CS+ presentation revealed three groups. One group
of subjects showed a defensive accelerative HR component
in response to the CS+ (N = 8) and the other two subgroups
depicted a decelerative pattern (N = 6 and N = 4,
respectively). In order to obtain samples of sufficient size
for further analysis, the latter two subgroups were collapsed
into one decelerative group (N = 10). The obtained grouping
structure was applied to the extinction trials in order to
evaluate possible learning differences between accelerators
and decelerators.
As suggested by Fig. 1A and a strong interaction of a
quartic waveform component (suggesting a triphasic pat-
tern) and condition (CS+ and CS�), accelerators showed a
defense response to the CS+ (see Table 1) within a general
HR deceleration as the HR change values were below the
baseline. This was confirmed by separate analysis of the

Fig. 1. (A) Heart rate change (in beats per minute) in acquisition (left panel) and extinction (right panel) blocks during CS+ and CS� depiction for accelerators
(N = 8). (B) Heart rate change in acquisition (left panel) and extinction (right panel) blocks during CS+ and CS� depiction for decelerators (N = 10). The zero
value in the time scale indicates the onset of the visual CS+ and CS�.
S. Moratti, A. Keil / Cognitive Brain Research 25 (2005) 459–471464
CS+ and CS� trials yielding only a quartic and linear
waveform component for the CS+ [quartic: F(1,60) = 28.3,
P < 0.0001; linear: F(1,60) = 12.1; P < 0.001]. At CS�trials, HR response only contained a weak linear component
[F(1,60) = 3.5; P < 0.10] and no other waveform
components. During the extinction block of the experiment,
accelerators reacted with an orientation response to the CS+
Table 1
Interaction between waveform components (linear, quadratic, cubic, and
quartic trends) and condition (CS+, CS�) during acquisition for subjects
with an accelerative component in acquisition trials
Interaction with condition numDF denDF F value P value
Linear 1 120 1.1 n.s.
Quadratic 1 120 0.5 n.s.
Cubic 1 120 0.4 n.s.
Quartic 1 120 15.4 <0.0001
n.s. = not significant, numDF = degrees of freedom numerator, denDF =
degrees of freedom denominator.
but not to the CS� [see Fig. 1 and Table 2 for interaction;
linear component CS+: F(1,60) = 18.7, P < 0.0001; CS�:
not significant (n.s.)].
For decelerators, a weak but statistically significant
interaction between a quadratic waveform component and
condition was obtained in the acquisition block (see Table
3). Separate analyses of the acquisition trials during CS+
Table 2
Interaction between waveform components (linear, quadratic, cubic, and
quartic trends) and condition (CS+, CS�) during extinction for subjects
with an accelerative component in acquisition trials
Interaction with condition numDF denDF F value P value
Linear 1 120 9.4 <0.01
Quadratic 1 120 3.6 n.s.
Cubic 1 120 3.7 n.s.
Quartic 1 120 0.5 n.s.
n.s. = not significant, numDF = degrees of freedom numerator, denDF =
degrees of freedom denominator.

Table 3
Interaction between waveform components (linear, quadratic, cubic, and
quartic trends) and condition (CS+, CS�) during acquisition for
decelerators
Interaction with condition numDF denDF F value P value
Linear 1 152 0.3 n.s.
Quadratic 1 152 4.4 <0.05
Cubic 1 152 0.7 n.s.
Quartic 1 152 1.0 n.s.
n.s. = not significant, numDF = degrees of freedom numerator, denDF =
degrees of freedom denominator.
S. Moratti, A. Keil / Cognitive Brain Research 25 (2005) 459–471 465
and CS� presentation showed that the quadratic component
was more prominent for the CS+ [F(1,76) = 20.6, P <
0.0001] than for the CS� [F(1,76) = 4.0, P < 0.05]. During
extinction, decelerators did not show any differential HR
changes for the CS+ and CS� (see Fig. 1B).
Thus, the HR data indicated that specifically subjects
with an accelerative HR component showed a differential
defense—and orientation response to the CS+ during
acquisition and extinction, respectively. During acquisition,
the other subject group showed a decelerative quadratic time
Fig. 2. Grand mean of the minimum norm estimates (MNE) over all subjects (
extinction phase of the experiment. Left and right hemispheres are shown. The arro
of the depicted MNE topographies is indicated. The color bars on the right show t
and CS� depiction.
course of HR change for both the CS+ and CS� but
somewhat stronger for the CS+. The former group will be
denoted accelerators and the latter decelerators. Within
extinction trials, decelerators did not differentiate between
the CS+ and CS� with respect to HR change.
3.2. MNE data
Fig. 2 depicts the grand mean of the MNE topography
across all subjects (N = 17) in order to give an impression of
visual cortical activation by steady state stimulation for each
condition and across three different time intervals after
stimulus onset. As can be seen, the SSVEF amplitude in
visual areas declines over stimulus presentation time and is
more prominent at left hemispheric sources.
3.2.1. Subjects showing an accelerative HR component
During habituation and acquisition, no interaction
between condition (CS+, CS�) and time (t1, t2, t3) could
be observed in any brain region. However, in extinction
trials, statistical mapping revealed a differentiated SSVEF
response in certain brain areas to the CS+ and CS� for the
N = 17) for CS+ and CS� trials during the habituation, acquisition, and
ws indicate the time of CS presentation. Below the arrows, the time interval
he activation strength in nAm. Time 0.0 s indicates the onset of visual CS+
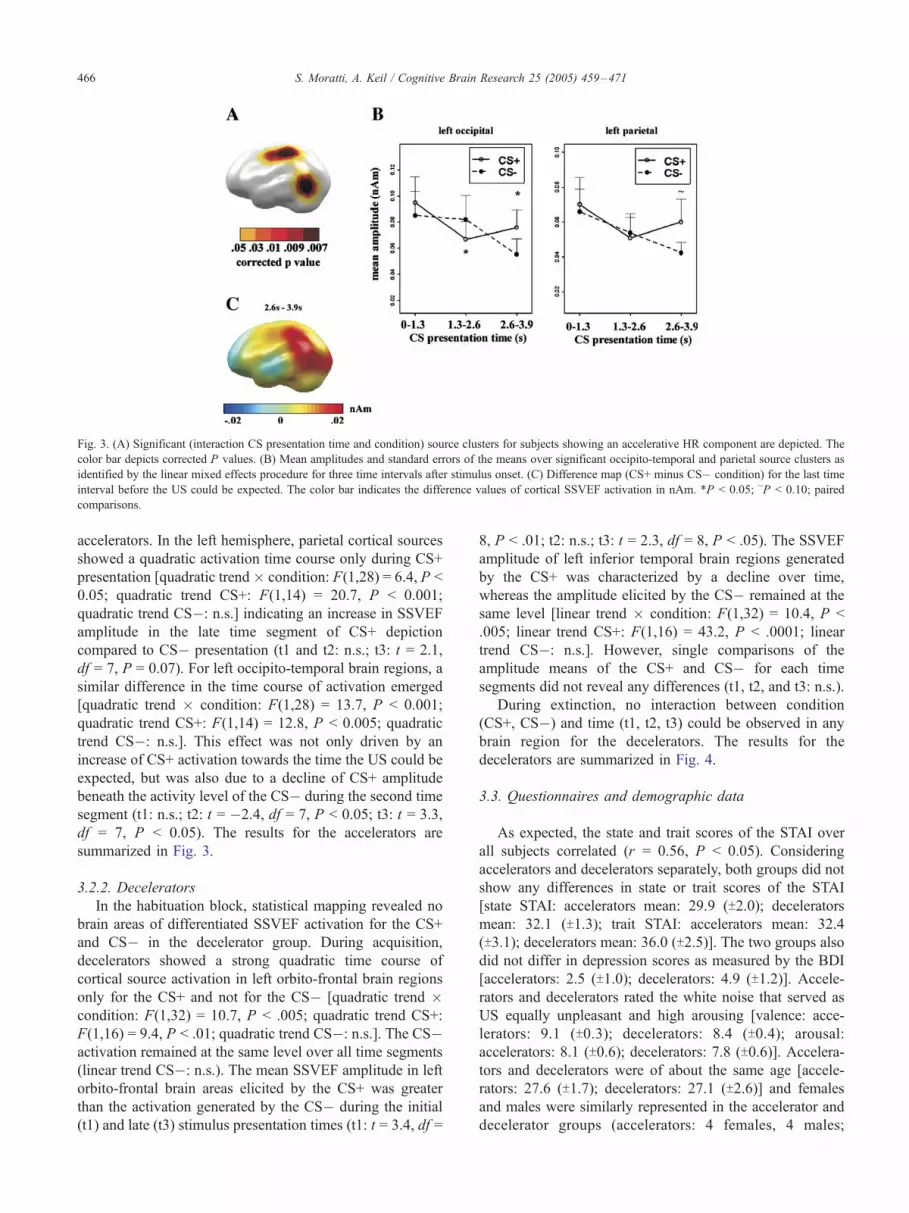
Fig. 3. (A) Significant (interaction CS presentation time and condition) source clusters for subjects showing an accelerative HR component are depicted. The
color bar depicts corrected P values. (B) Mean amplitudes and standard errors of the means over significant occipito-temporal and parietal source clusters as
identified by the linear mixed effects procedure for three time intervals after stimulus onset. (C) Difference map (CS+ minus CS� condition) for the last time
interval before the US could be expected. The color bar indicates the difference values of cortical SSVEF activation in nAm. *P < 0.05; ~P < 0.10; paired
comparisons.
S. Moratti, A. Keil / Cognitive Brain Research 25 (2005) 459–471466
accelerators. In the left hemisphere, parietal cortical sources
showed a quadratic activation time course only during CS+
presentation [quadratic trend� condition: F(1,28) = 6.4, P <
0.05; quadratic trend CS+: F(1,14) = 20.7, P < 0.001;
quadratic trend CS�: n.s.] indicating an increase in SSVEF
amplitude in the late time segment of CS+ depiction
compared to CS� presentation (t1 and t2: n.s.; t3: t = 2.1,
df = 7, P = 0.07). For left occipito-temporal brain regions, a
similar difference in the time course of activation emerged
[quadratic trend � condition: F(1,28) = 13.7, P < 0.001;
quadratic trend CS+: F(1,14) = 12.8, P < 0.005; quadratic
trend CS�: n.s.]. This effect was not only driven by an
increase of CS+ activation towards the time the US could be
expected, but was also due to a decline of CS+ amplitude
beneath the activity level of the CS� during the second time
segment (t1: n.s.; t2: t = �2.4, df = 7, P < 0.05; t3: t = 3.3,
df = 7, P < 0.05). The results for the accelerators are
summarized in Fig. 3.
3.2.2. Decelerators
In the habituation block, statistical mapping revealed no
brain areas of differentiated SSVEF activation for the CS+
and CS� in the decelerator group. During acquisition,
decelerators showed a strong quadratic time course of
cortical source activation in left orbito-frontal brain regions
only for the CS+ and not for the CS� [quadratic trend �condition: F(1,32) = 10.7, P < .005; quadratic trend CS+:
F(1,16) = 9.4, P < .01; quadratic trend CS�: n.s.]. The CS�activation remained at the same level over all time segments
(linear trend CS�: n.s.). The mean SSVEF amplitude in left
orbito-frontal brain areas elicited by the CS+ was greater
than the activation generated by the CS� during the initial
(t1) and late (t3) stimulus presentation times (t1: t = 3.4, df =
8, P < .01; t2: n.s.; t3: t = 2.3, df = 8, P < .05). The SSVEF
amplitude of left inferior temporal brain regions generated
by the CS+ was characterized by a decline over time,
whereas the amplitude elicited by the CS� remained at the
same level [linear trend � condition: F(1,32) = 10.4, P <
.005; linear trend CS+: F(1,16) = 43.2, P < .0001; linear
trend CS�: n.s.]. However, single comparisons of the
amplitude means of the CS+ and CS� for each time
segments did not reveal any differences (t1, t2, and t3: n.s.).
During extinction, no interaction between condition
(CS+, CS�) and time (t1, t2, t3) could be observed in any
brain region for the decelerators. The results for the
decelerators are summarized in Fig. 4.
3.3. Questionnaires and demographic data
As expected, the state and trait scores of the STAI over
all subjects correlated (r = 0.56, P < 0.05). Considering
accelerators and decelerators separately, both groups did not
show any differences in state or trait scores of the STAI
[state STAI: accelerators mean: 29.9 (T2.0); decelerators
mean: 32.1 (T1.3); trait STAI: accelerators mean: 32.4
(T3.1); decelerators mean: 36.0 (T2.5)]. The two groups also
did not differ in depression scores as measured by the BDI
[accelerators: 2.5 (T1.0); decelerators: 4.9 (T1.2)]. Accele-rators and decelerators rated the white noise that served as
US equally unpleasant and high arousing [valence: acce-
lerators: 9.1 (T0.3); decelerators: 8.4 (T0.4); arousal:
accelerators: 8.1 (T0.6); decelerators: 7.8 (T0.6)]. Accelera-tors and decelerators were of about the same age [accele-
rators: 27.6 (T1.7); decelerators: 27.1 (T2.6)] and females
and males were similarly represented in the accelerator and
decelerator groups (accelerators: 4 females, 4 males;

Fig. 4. (A) Significant (interaction CS presentation time and condition) source clusters for HR decelerators are depicted. The color bar depicts corrected P
values. (B) Mean amplitudes and standard errors of the means over significant left orbito-frontal and inferior temporal source clusters as identified by the linear
mixed effects procedure for three time intervals after stimulus onset. (C) Difference map (CS+ minus CS� condition) for the first time interval after stimulus
onset. The color bar indicates the difference values of cortical SSVEF activation in nAm. *P < 0.05; paired comparisons.
S. Moratti, A. Keil / Cognitive Brain Research 25 (2005) 459–471 467
decelerators: 6 females, 4 males). Altogether, only 3 out of
18 subjects could report a contingency awareness. Two
aware subjects were accelerators and one aware subject was
a decelerator. The corresponding t tests and v2 tests were not
significant.
4. Discussion
Examining MEG correlates of Pavlovian fear condition-
ing by means of steady state visual evoked fields
(SSVEF), we studied the modulation of stimulus-driven
magnetocortical responses to visual stimuli differing in
their motivational significance (reinforced CS+ vs. non-
reinforced CS�) after one stimulus had been paired with
an aversive event. Using the techniques of complex
demodulation and minimum norm estimation, we aimed
to investigate the changes in cortical processing over
stimulus presentation time related to the experimental
manipulation that one previous biologically irrelevant
stimulus such as a grating gains predictive value of an
aversive event. Additionally, we recorded the HR change
with respect to CS onset in order to evaluate physiological
responding to the CS+ and CS�.
4.1. Heart rate response
By means of cluster analysis, we separated two groups of
HR responders to the CS+ during acquisition trials. In
general, subjects reacted with an orientation response (OR)
[25,86] to the visual CS as all HR change values were below
the pre-stimulus baseline. However, one group of partici-
pants showed an accelerative component within the OR
response to the CS+ during acquisition as indicated by a
strong interaction of condition (CS+ and CS�) and a quartic
waveform component [89]. Accelerative components within
a general decelerative HR pattern have been observed in HR
recordings before in humans and animals [12,49]. Although
cluster analysis in human Pavlovian conditioning studies
have revealed stronger accelerative reactions above baseline
[28,32,38], we argue that participants of our study depicting
an accelerative HR component acquired a fear response to
the CS+ during acquisition. Accelerative HR responses are
generally associated with fear reactions [33]. A possible
explanation why the accelerative component observed in
our study was not strong enough to push the HR response
above the baseline may lie in the fact that only 3 out of 17
subjects could report the CS–US contingencies after the
experiment although the 45- gratings that were perpendic-
ularly oriented to each other were easy to discriminate. The
reaction task during the conditioning procedure may have
distracted attention and resulted in unawareness of the CS–
US contingencies. Additionally, the reaction task could have
prompted an overall OR generating the HR patterns
observed here. However, subjects of the accelerator group
reacted with a marked OR response (HR deceleration) solely
to the CS+ during extinction supporting that HR condition-
ing took place during learning trials. Pavlovian conditioning
in unaware subjects has been demonstrated by several
studies [19,28,30,46,62,63]. However, as our study was not
designed to address this question and the validity of post-
experimental interviews has been criticized [56], we cannot
draw clear conclusions of the role of awareness in the
present study.
Participants not showing an accelerative component to
the CS+ during acquisition trials strongly decelerated to
both the CS+ and CS�. Although there was a weak but
statistically significant interaction of a quadratic waveform

S. Moratti, A. Keil / Cognitive Brain Research 25 (2005) 459–471468
component, we did not obtain the usually observed selec-
tively decelerative HR pattern to the CS+ obtained by
cluster analysis during acquisition trials [29,32,38]. Addi-
tionally, the decelerators of the present study did not show
any differential HR response to the CS+ and CS� during
extinction reflecting the possibility that the cluster analysis
simply separated subjects that did show conditioning
(accelerators) or not (decelerators of the present study) with
respect to HR.
With respect to behavioral data, HR accelerators and
subjects that unspecifically decelerated their HR response
to both the CS+ and CS� did not differ in the pleasantness
and aversiveness ratings of the US. Thus, differences in
the subjective evaluation of the US could not account for
the discriminative HR responses of the two groups.
Further, accelerators did not report higher levels of state/
trait anxiety and BDI depression scores than decelerators
nor were there any gender differences between the two
groups.
4.2. Cortical activation patterns in HR decelerators
Although the HR decelerators of the current study
possibly did not show successful Pavlovian autonomic
conditioning with respect to HR change, this group showed
a differentiated neuromagnetic SSVEF response with
respect to the CS+ and CS� during acquisition. In left
orbito-frontal regions, the CS+ generated greater SSVEF
activity during early CS+ presentation time (0–1.3 s) and
just before US onset (2.6–3.9 s) compared to CS� elicited
brain activity.
Orbito-frontal brain regions have recently been associ-
ated with emotion regulation in general [17] and with
reversal learning in particular that has been characterized
as changing emotional behavior in response to a previously
punished (or rewarded) stimulus [78,79]. Humans with
higher left frontal baseline activity have been reported to
be more successful in suppressing negative emotional
states [17]. Recently, Ghashghaei and Barbas [24] showed
that the orbito-frontal cortex exercises inhibitory control
onto the central nucleus of the amygdala. The subjects of
our study who did not show an accelerative defense HR
reaction generated more SSVEF activity in response to the
CS+ than to the CS� at orbito-frontal cortical sources
possibly reflecting a suppression of an autonomic fear
response such as an HR accelerative component. Hamm
and Vaitl [28] demonstrated in a Pavlovian fear condition-
ing experiment that conditioned startle potentiation was
stronger for cardiac accelerators than for decelerators
further supporting that HR acceleration indicates learned
fear and that HR decelerators do not acquire a fear/defense
response. Altogether, increased activity in the orbito-frontal
cortex may have suppressed the acquisition of a fear
response as indexed by an accelerative HR component and
possibly prevented successful Pavlovian conditioning with
respect to HR change in that sub-sample.
4.3. Cortical activation patterns in subjects showing an
accelerative HR component
Contrary, subjects showing an accelerative HR waveform
component did not show any differences in the time course
of SSVEF activations with respect to the CS+ and CS� in
the acquisition block. However, they showed marked
differences during extinction. We observed a stimulus-
driven amplitude enhancement in left parietal and left
occipito-temporal brain regions during extinction trials.
Imaging studies in the field of Pavlovian conditioning
reported that stimuli associated with an aversive event have
generated more activity in brain areas of the visual system
[15,39] and parietal cortex [4,23] paralleling our results.
Further, our observations confirmed the hypothesis that
sensory and attentional cortical networks may be involved
in Pavlovian fear conditioning at least for subjects respond-
ing with an accelerative HR component to the CS+ during
acquisition and an OR to the CS+ during extinction.
Therefore, these effects could be caused by attentional
processes reflected by the OR response to the CS+ and by
the amplitude amplification in left occipito-temporal and
parietal regions towards the end of CS+ presentation when
the US could be expected. There are several lines of
argumentation that support this view.
First, the grand average of MNE solutions clearly
showed a left lateralized topography of stimulus processing
for both the CS+ and CS�. The statistical map depicting
activity modulation with respect to condition (CS+, CS�)
and time (t1, t2, t3) in left occipito-temporal regions
demonstrated that the motivational significant stimulus
generated a greater amplitude in areas where the stimulus
was processed. Thus, the lateralization to the left parietal
and left occipito-temporal regions may be due to the grating
perception per se. A similar relationship between topo-
graphical activity distributions and lateralization was ob-
served in a study by Keil et al. [43], who suggested that
motivated attention acts to amplify activity in cortical areas
that are engaged in processing of specific features.
Facilitation of the SSVEF response for a stimulus that has
high motivational relevance is in line with results in the field
of attention research showing that attended visual stimuli
produce greater SSVEPs than unattended [61,65]. Further,
ERP studies have elucidated that attention can modulate
activity in extrastriate and primary visual cortex [18,37].
Finally, studies in the area of emotion research showed that
high arousing biologically significant stimuli generate
greater neural responses in posterior areas [42,43,60].
Second, parietal brain areas often have been associated
with attentional processes [16,54,68,80]. Although these
processes have been linked to the right hemisphere, the left
dominant processing of the stimuli could have caused the
involvement of the left parietal cortex in the present study.
Third, the observed facilitated SSVEF for the CS+ in left
parietal areas were observed towards the end of CS+
depiction when the US could be expected further supporting

S. Moratti, A. Keil / Cognitive Brain Research 25 (2005) 459–471 469
the involvement of attentional processes. As the time
courses of activations in left occipito-temporal and left
parietal areas were quite parallel, it can be assumed that
attentional processes may tune feature processing in sensory
areas reflecting a sensory gain mechanism as hypothesized
by authors in the field of selective attention [37].
Taken together, when the OR as indexed by HR
deceleration reached its maximum towards late CS+
depiction just before US presentation, left parietal brain
regions showed enhanced electrocortical activity. This
process may influence the sensory cortex by top–down
processes in order to facilitate stimulus analysis in extras-
triate cortex. However, only three out of 17 subjects were
aware of the contingency between the CS+ and the US,
challenging the argumentation in favor of attentional
processes as long as consciousness is regarded a necessary
prerequisite to attention. However, Hamm and Vaitl [28]
argued that the fear network can be activated automatically
and that overt knowledge of past stimulus relations is not
necessary for the expression of fear responses to the CS+.
But as stated above, our study was not designed to address
this question and we cannot draw definite conclusions about
the participant’s awareness of CS–US contingencies.
Interestingly, the observed left occipito-temporal and
parietal SSVEF amplification by the CS+ did not emerge
during acquisition but during extinction trials in HR
accelerators. This is in line with the notion that extinction
is not a passive but an active learning process (for review,
see [11]). Several recent studies have investigated the
extinction processes in humans reporting that the amygdala
was not only active during early acquisition but also during
early extinction trials [48,51,72] paralleling results from
animal research that showed that blocking of NMDA
receptors within the amygdala prevented extinction [7,20,
82]. Although we did not model amygdala activity as the
neuromagnetic field attenuates by the square of the distance
and deep sources are unlikely to contribute to magnetic
fields measured over the scalp, the amygdala as a highly
interconnected structure with visual cortical areas [2,81]
could be responsible for the facilitated sensory processing of
the CS+ reported here. This could represent an alternative
mechanism to higher-order attentional top–down processes
as outlined above. Knight et al. [48] observed no differential
amygdala activation during acquisition trials but at early
extinction trials paralleling our results in the visual sensory
domain. Knight and collaborators [48] argued that changes
in CS–US contingencies could be responsible for the
amygdala activations after changing the experimental phase
(from acquisition to extinction) and that the amygdala
circuitry might be involved in drawing attention to the CS+.
An alternative and more simple explanation for the
occurrence of the elevated SSVEF activity in sensory and
parietal cortex only during extinction could be that learning
was slow in our HR accelerator group reflecting the possible
unawareness of the CS–US contingency. Therefore, learn-
ing-related changes in cortical processing of the CS+ may
have emerged after acquisition trials, specifically. In our
laboratory, we are currently investigating this hypothesis by
instructing subjects about the CS–US contingency in order
to induce full awareness, with the same experimental
design.
Enhanced neuromagnetic activity in left orbito-frontal
brain regions in HR decelerators were observed during
acquisition trials. As we have outlined above, left orbito-
frontal activation could reflect a suppression process
interfering with autonomic conditioning. The occurrence
of such an activation pattern during the early experimental
phase in subjects showing rather unspecific HR changes
adds evidence that inhibition of fear conditioning may have
taken place in these subjects.
Finally, we found support for our original hypothesis that
motivationally relevant stimuli engage cortical networks
that are involved in sensory and attentional processes at
least in subjects showing an accelerative HR component to
the CS+ during acquisition and selective HR deceleration in
CS+ trials during extinction. Different HR and SSVEF
activation patterns in HR accelerators and decelerators could
not be explained by behavioral data.
Amplification of SSVEF amplitude in left extrastriate
cortex by the CS+ and the parallel time course of that
difference at parietal sources indicated that top–down
processes facilitated the processing of a motivationally
significant stimulus in sensory areas. To what extent
afferents from the amygdala were involved could not be
inferred from our study. The observation of enhanced CS+
driven activity in extrastriate and parietal cortex was
restricted to subjects that showed a fear response in
acquisition trials and an OR response during extinction.
Subjects that had no accelerative component in their HR
response to the CS+ during acquisition responded with
greater orbito-frontal brain activity during learning possibly
reflecting a fear reaction suppression process, thus prevent-
ing autonomic conditioning. Our work added evidence of
different response patterns at the cortical level with respect
to cardiac response patterns.
Acknowledgments
We like to thank Leonie Koban and Ursula Lommen for
help with data acquisition. Research was supported by the
Deutsche Forschungsgesellschaft (DFG) and the Volkswa-
gen Stiftung.
References
[1] J.P. Aggleton, M.J. Burton, R.E. Passingham, Cortical and subcortical
afferents to the amygdala of the rhesus monkey (Macaca mulatta),
Brain Res. 190 (1980) 347–368.
[2] D.G. Amaral, Amygdalohippocampal and amygdalocortical pro-
jections in the primate brain, Adv. Exp. Med. Biol. 203 (1986)
3–17.

S. Moratti, A. Keil / Cognitive Brain Research 25 (2005) 459–471470
[3] D.G. Amaral, J.L. Price, A. Pitkaenen, S.T. Carmichael, Anatomical
organization of the primate amygdaloid complex, in: J.P. Aggleton
(Ed.), The Amygdala: Neurobiological Aspects of Emotion,
Memory, and Mental Dysfunction, Wiley-Liss, New York, 1992,
pp. 1–66.
[4] J.L. Armony, R.J. Dolan, Modulation of auditory neural responses by
a visual context in human fear conditioning, NeuroReport 12 (2001)
3407–3411.
[5] J.L. Armony, G.J. Quirk, J.E. LeDoux, Differential effects of
amygdala lesions on early and late plastic components of auditory
cortex spike trains during fear conditioning, J. Neurosci. 18 (1998)
2592–2601.
[6] E. Bagiella, R.P. Sloan, D.F. Heitjan, Mixed-effects models in
psychophysiology, Psychophysiology 37 (2000) 13–20.
[7] J.D. Baker, J.L. Azorlosa, The NMDA antagonist MK-801 blocks the
extinction of Pavlovian fear conditioning, Behav. Neurosci. 110
(1996) 618–620.
[8] Y. Benjamini, Y. Hochberg, Controlling the false discovery rate: a
practical and powerful approach to multiple testing, J. R. Stat. Soc.
Ser., B 57 (1995) 289–300.
[9] P. Berg, M. Scherg, A multiple source approach to the correction of
eye artifacts, Electroencephalogr. Clin. Neurophysiol. 90 (1994)
229–241.
[10] M. Bertero, C. DeMol, E.R. Pike, Linear inverse problems with
discrete data: II. Stability and regularization, Inverse Probl. 4 (1988)
573–594.
[11] M.E. Bouton, Context, ambiguity, and unlearning: sources of relapse
after behavioral extinction, Biol. Psychiatry 52 (2002) 976–986.
[12] M.M. Bradley, M. Codispoti, D. Sabatinelli, P.J. Lang, Emotion and
motivation II: sex differences in picture processing, Emotion 1 (2001)
300–319.
[13] C. Buchel, R.J. Dolan, Classical fear conditioning in functional
neuroimaging, Curr. Opin. Neurobiol. 10 (2000) 219–223.
[14] C. Buchel, J. Morris, R.J. Dolan, K.J. Friston, Brain systems
mediating aversive conditioning: an event-related fMRI study, Neuron
20 (1998) 947–957.
[15] D.T. Cheng, D.C. Knight, C.N. Smith, E.A. Stein, F.J. Helmstetter,
Functional MRI of human amygdala activity during Pavlovian fear
conditioning: stimulus processing versus response expression, Behav.
Neurosci. 117 (2003) 3–10.
[16] M. Corbetta, Frontoparietal cortical networks for directing attention
and the eye to visual locations: identical, independent, or overlapping
neural systems? Proc. Natl. Acad. Sci. U. S. A. 95 (1998) 831–838.
[17] R.J. Davidson, K.M. Putnam, C.L. Larson, Dysfunction in the neural
circuitry of emotion regulation—A possible prelude to violence,
Science 289 (2000) 591–594.
[18] F. Di Russo, A. Martinez, S.A. Hillyard, Source analysis of event-
related cortical activity during visuo-spatial attention, Cereb. Cortex.
13 (2003) 486–499.
[19] F. Esteves, C. Parra, U. Dimberg, A. Ohman, Nonconscious
associative learning: Pavlovian conditioning of skin conductance
responses to masked fear-relevant facial stimuli, Psychophysiology
31 (1994) 375–385.
[20] W.A. Falls, M.J. Miserendino, M. Davis, Extinction of fear-potentiated
startle: blockade by infusion of an NMDA antagonist into the
amygdala, J. Neurosci. 12 (1992) 854–863.
[21] M.S. Fanselow, Neural organization of the defensive behavior system
responsible for fear, Psychon. Bull. Rev. 1 (1994) 429–438.
[22] H. Fischer, J.L. Andersson, T. Furmark, G. Wik, M. Fredrikson, Right-
sided human prefrontal brain activation during acquisition of
conditioned fear, Emotion 2 (2002) 233–241.
[23] M. Fredrikson, G. Wik, H. Fischer, J. Andersson, Affective and
attentive neural networks in humans: a PET study of Pavlovian
conditioning, NeuroReport 7 (1995) 97–101.
[24] H.T. Ghashghaei, H. Barbas, Pathways for emotion: interactions of
prefrontal and anterior temporal pathways in the amygdala of the
rhesus monkey, Neuroscience 115 (2002) 1261–1279.
[25] F.K. Graham, R.K. Clifton, Heart-rate change as a component of the
orienting response, Psychol. Bull. 65 (1966) 305–320.
[26] M. Gray, A.H. Kemp, R.B. Silberstein, P.J. Nathan, Cortical neuro-
physiology of anticipatory anxiety: an investigation utilizing steady
state probe topography (SSPT), NeuroImage 20 (2003) 975–986.
[27] M.S. Hamalainen, R.J. Ilmoniemi, Interpreting magnetic fields of the
brain: minimum norm estimates, Med. Biol. Eng. Comput. 32 (1994)
35–42.
[28] A.O. Hamm, D. Vaitl, Affective learning: awareness and aversion,
Psychophysiology 33 (1996) 698–710.
[29] A.O. Hamm, B.N. Cuthbert, J. Globisch, D. Vaitl, Fear and the startle
reflex: blink modulation and autonomic response patterns in animal
and mutilation fearful subjects, Psychophysiology 34 (1997) 97–107.
[30] A.O. Hamm, A.I. Weike, H.T. Schupp, T. Treig, A. Dressel, C.
Kessler, Affective blindsight: intact fear conditioning to a visual cue in
a cortically blind patient, Brain 126 (2003) 267–275.
[31] P.C. Hansen, D.P. O’Leary, The use of the L-curve in the regulariza-
tion of discrete ill-posed problems, SIAM J. Sci. Comput. 14 (1993)
1487–1503.
[32] R.D. Hare, Cardiovascular components of orienting and defensive
responses, Psychophysiology 9 (1972) 606–614.
[33] R.D. Hare, G. Blevings, Defensive responses to phobic stimuli, Biol.
Psychol. 3 (1975) 1–13.
[34] O. Hauk, A. Keil, T. Elbert, M.M. Muller, Comparison of data
transformation procedures to enhance topographical accuracy in time
series analysis of the human EEG, J. Neurosci. Methods 113 (2002)
111–122.
[35] O. Hauk, P. Berg, C. Wienbruch, B. Rockstroh, T. Elbert, The
minimum norm method as an effective mapping tool for MEG
analysis, Biomag., vol. 98, Sendai, Japan, 1998.
[36] M. Hautzinger, M. Bailer, H. Worall, F. Keller, Beck-Depressions-
Inventar, Huber, Bern, 1992.
[37] S.A. Hillyard, L. Anllo-Vento, Event-related brain potentials in the
study of visual selective attention, Proc. Natl. Acad. Sci. U. S. A. 95
(1998) 781–787.
[38] R.L. Hodes, E.W. Cook III, P.J. Lang, Individual differences in
autonomic response: conditioned association or conditioned fear?
Psychophysiology 22 (1985) 545–560.
[39] K. Hugdahl, A. Berardi, W.L. Thompson, S.M. Kosslyn, R. Macy,
D.P. Baker, N.M. Alpert, J.E. LeDoux, Brain mechanisms in human
classical conditioning: a PET blood flow study, NeuroReport 6 (1995)
1723–1728.
[40] O. Jensen, S. Vanni, A new method to identify multiple sources of
oscillatory activity from magnetoencephalographic data, Neuroimage
15 (2002) 568–574.
[41] M. Junghofer, P. Peyk, Analyse und Visualisierung von Hirnstrom-
und Hirnmagnetfeld-Messungen, MATLAB select. 2 (2004) 24–28.
[42] M. Junghofer, M.M. Bradley, T.R. Elbert, P.J. Lan, Fleeting images: a
new look at early emotion discrimination, Psychophysiology 38
(2001) 175–178.
[43] A. Keil, M.M. Bradley, O. Hauk, B. Rockstroh, T. Elbert, P.J. Lang,
Large-scale neural correlates of affective picture processing, Psycho-
physiology 39 (2002) 641–649.
[44] A. Keil, S. Moratti, D. Sabatinelli, M.M. Bradley, J.P. Lang, Additive
effects of emotional content and spatial selective attention on electro-
cortical facilitation, Cereb. Cortex 15 (8) (2004) 1187–1197.
[45] H.J. Keselman, R. Cribbie, B. Holland, Controlling the rate of Type I
error over a large set of statistical tests, Br. J. Math. Stat. Psychol. 55
(2002) 27–39.
[46] D.C. Knight, H.T. Nguyen, P.A. Bandettini, Expression of conditional
fear with and without awareness, Proc. Natl. Acad. Sci. U. S. A. 100
(2003) 15280–15283.
[47] D.C. Knight, D.T. Cheng, C.N. Smith, E.A. Stein, F.J. Helmstetter,
Neural substrates mediating human delay and trace fear conditioning,
J. Neurosci. 24 (2004) 218–228.
[48] D.C. Knight, C.N. Smith, D.T. Cheng, E.A. Stein, F.J. Helmstetter,
Amygdala and hippocampal activity during acquisition and extinction

S. Moratti, A. Keil / Cognitive Brain Research 25 (2005) 459–471 471
of human fear conditioning, Cogn. Affect. Behav. Neurosci. 4 (2004)
317–325.
[49] M. Kuniecki, A.M. Coenen, J. Kaiser, Correlation between long
latency evoked potentials from amygdala and evoked cardiac response
to fear conditioned stimulus in rats, Acta Neurobiol. Exp. (Wars) 62
(2002) 85–92.
[50] K.S. LaBar, J.F. Disterhoft, Conditioning, awareness, and the hippo-
campus, Hippocampus 8 (1998) 620–626.
[51] K.S. LaBar, J.C. Gatenby, J.C. Gore, J.E. LeDoux, E.A. Phelps,
Human amygdala activation during conditioned fear acquisition
and extinction: a mixed-trial fMRI study, Neuron 20 (1998)
937–945.
[52] S. Laroche, V. Doyere, V. Bloch, Linear relation between the
magnitude of long-term potentiation in the dentate gyrus and
associative learning in the rat. A demonstration using commissural
inhibition and local infusion of an N-methyl-d-aspartate receptor
antagonist, Neuroscience 28 (1989) 375–386.
[53] L. Laux, P. Glanzmann, P. Schaffner, C.D. Spielberger, Das State-
Trait-Angstinventar, Beltz, Weinheim, 1981.
[54] T.H. Le, J.V. Pardo, X. Hu, 4 T-fMRI study of nonspatial shifting of
selective attention: cerebellar and parietal contributions, J. Neuro-
physiol. 79 (1998) 1535–1548.
[55] J.E. LeDoux, Emotional networks in the brain, in: J.M.H. Michael
Lewis (Ed.), Handbook of Emotions, Guilford Press, New York, NY,
USA, 1993, pp. 109–118.
[56] P.F. Lovibond, D.R. Shanks, The role of awareness in Pavlovian
conditioning: empirical evidence and theoretical implications, J. Exp.
Psychol., Anim. Behav. Process 28 (2002) 3–26.
[57] N.J. Mackintosh, Pavlov and associationism, Span J. Psychol. 6
(2003) 177–184.
[58] S. Maren, Neurobiology of Pavlovian fear conditioning, Annu. Rev.
Neurosci. 24 (2001) 897–931.
[59] J.L. McGaugh, L. Cahill, B. Roozendaal, Involvement of the
amygdala in memory storage: interaction with other brain systems,
Proc. Natl. Acad. Sci. U. S. A. 93 (1996) 13508–13514.
[60] S. Moratti, A. Keil, M. Stolarova, Motivated attention in emotional
picture processing is reflected by activity modulation in cortical
attention networks, NeuroImage 21 (2004) 954–964.
[61] S.T. Morgan, J.C. Hansen, S.A. Hillyard, Selective attention to
stimulus location modulates the steady-state visual evoked potential,
Proc. Natl. Acad. Sci. U. S. A. 93 (1996) 4770–4774.
[62] J.S. Morris, A. Ohman, R.J. Dolan, Conscious and unconscious
emotional learning in the human amygdala, Nature 393 (1998)
467–470.
[63] J.S. Morris, A. Ohman, R.J. Dolan, A subcortical pathway to the right
amygdala mediating ‘‘unseen’’ fear, Proc. Natl. Acad. Sci. U. S. A. 96
(1999) 1680–1685.
[64] E.J. Mufson, M.M. Mesulam, D.N. Pandya, Insular interconnections
with the amygdala in the rhesus monkey, Neuroscience 6 (1981)
1231–1248.
[65] M.M. Muller, T.W. Picton, P. Valdes-Sosa, J. Riera, W.A. Teder-
Salejarvi, S.A. Hillyard, Effects of spatial selective attention on the
steady-state visual evoked potential in the 20–28 Hz range, Brain Res.
Cogn. Brain Res. 6 (1998) 249–261.
[66] M.M. Muller, W. Teder-Salejarvi, S.A. Hillyard, The time course of
cortical facilitation during cued shifts of spatial attention, Nat.
Neurosci. 1 (1998) 631–634.
[67] R.C. Oldfield, The assessment and analysis of handedness: the
Edinburgh inventory, Neuropsychologia 9 (1971) 97–113.
[68] J.V. Pardo, P.T. Fox, M.E. Raichle, Localization of a human system for
sustained attention by positron emission tomography, Nature 349
(1991) 61–64.
[69] I.P. Pavlov, Conditioned Reflexes: An Investigation of the Physio-
logical Activity of the Cerebral Cortex, Oxford Univ. Press, London,
1927.
[70] J.M. Pearce, G. Hall, A model for Pavlovian learning: variations in the
effectiveness of conditioned but not of unconditioned stimuli, Psychol.
Rev. 87 (1980) 532–552.
[71] W.M. Perlstein, M.A. Cole, M. Larson, K. Kelly, P. Seignourel, A. Keil,
Steady-state visual evoked potentials reveal frontally-mediated work-
ing memory activity in humans, Neurosci. Lett. 342 (2003) 191–195.
[72] E.A. Phelps, M.R. Delgado, K.I. Nearing, J.E. LeDoux, Extinction
learning in humans: role of the amygdala and vmPFC, Neuron 43
(2004) 897–905.
[73] J.C. Pinheiro, D.M. Bates, Mixed-Effects Models in S and S-PLUS,
1 edR, Springer, New York, 2000.
[74] L.J. Porrino, A.M. Crane, P.S. Goldman-Rakic, Direct and indirect
pathways from the amygdala to the frontal lobe in rhesus monkeys,
J. Comp. Neurol. 198 (1981) 121–136.
[75] G.J. Quirk, J.L. Armony, J.E. LeDoux, Fear conditioning enhances
different temporal components of tone-evoked spike trains in auditory
cortex and lateral amygdala, Neuron 19 (1997) 613–624.
[76] D. Regan, Human Brain Electrophysiology: Evoked Potentials and
Evoked Magnetic Fields in Science and Medicine, Elsevier, New
York, 1989.
[77] R.A. Rescorla, Pavlovian conditioning. It’s not what you think it is,
Am. Psychol. 43 (1988) 151–160.
[78] E.T. Rolls, The Brain and Emotion, Oxford Univ. Press, Oxford, 1999.
[79] E.T. Rolls, J. Hornak, D. Wade, J. McGrath, Emotion-related learning
in patients with social and emotional changes associated with frontal
lobe damage, J. Neurol. Neurosurg. Psychiatry 57 (1994) 1518–1524.
[80] M.F. Rushworth, T. Paus, P.K. Sipila, Attention systems and the
organization of the human parietal cortex, J. Neurosci. 21 (2001)
5262–5271.
[81] D. Sabatinelli, M.M. Bradley, J.R. Fitzsimmons, P.J. Lang, Parallel
amygdala and inferotemporal activation reflect emotional intensity and
fear relevance, NeuroImage 24 (2005) 1265–1270.
[82] E. Santini, R.U. Muller, G.J. Quirk, Consolidation of extinction
learning involves transfer from NMDA-independent to NMDA-
dependent memory, J. Neurosci. 21 (2001) 9009–9017.
[83] S.R. Searle, G. Casella, C.E. McCulloch, Variance Components,
Wiley, New York, 1992.
[84] C. Shi, M. Davis, Visual pathways involved in fear conditioning
measured with fear-potentiated startle: behavioral and anatomic
studies, J. Neurosci. 21 (2001) 9844–9855.
[85] R.B. Silberstein, P.L. Nunez, A. Pipingas, P. Harris, F. Danieli, Steady
state visually evoked potential (SSVEP) topography in a graded
working memory task, Int. J. Psychophysiol. 42 (2001) 219–232.
[86] E.N. Sokolov, Perception and the Conditioned Reflex, Pergamon,
Oxford, 1963.
[87] R Developer Core Team, R: A Language and Environment for
Statistical Computing. R Foundation for Statistical Computing, R
Foundation for Statistical Computing, Vienna, Austria, 2004.
[88] M.A. Uusitalo, R.J. Ilmoniemi, Signal-space projection method for
separating MEG or EEG into components, Med. Biol. Eng. Comput.
35 (1997) 135–140.
[89] R.S. Wilson, CARDIVAR: the statistical analysis of heart rate data,
Psychophysiology 11 (1974) 76–85.


