Embed Size (px)
Citation preview

RESEARCH ARTICLE Open Access
Cortico-cerebral histogenesis in the opossumMonodelphis domestica: generation of ahexalaminar neocortex in the absence of a basalproliferative compartmentElisa Puzzolo, Antonello Mallamaci*
Abstract
Background: The metatherian Monodelphis domestica, commonly known as the South-American short-tailedopossum, is an appealing animal model for developmental studies on cortico-cerebral development. Given itsphylogenetic position, it can help in tracing evolutionary origins of key traits peculiar to the eutherian centralnervous system. The capability of its pup to regenerate damaged cortico-spinal connections makes it an idealsubstrate for regenerative studies. Recent sequencing of its genome and the ex utero accessibility of its developingcerebral cortex further enhance its experimental interest. However, at the moment, a comprehensive cellular andmolecular characterization of its cortical development is missing.
Results: A systematic analysis of opossum cortico-cerebral development was performed, including: origin ofcortical neurons; migration of these neurons from their birthplaces to their final layer destinations; and moleculardifferentiation of distinct neocortical laminae.We observed that opossum projection neurons and interneurons are generated by pallial and subpallial precursors,respectively, similar to rodents. A six-layered cortex with a eutherian-like molecular profile is laid down, accordingto the inside-out rule. However, neocortical projection neurons are generated by apical neural precursors andalmost no basal progenitors may be found in the neuronogenic neopallial primordium. In the opossum neocortex,Tbr2, the hallmark of eutherian basal progenitors, is transiently expressed by postmitotic progenies of apical precur-sors prior to the activation of more mature neuronal markers.
Conclusions: The neocortical developmental program predates Eutheria-Methatheria branching. However, inmetatherians, unlike eutherians, a basal proliferative compartment is not needed for the formation of a six-layeredneuronal blueprint.
BackgroundThe marsupial South-American short-tailed opossum,Monodelphis domestica, is an appealing animal modelfor developmental studies on cortico-cerebral develop-ment for a variety of reasons. First is the phylogeneticposition of marsupials, with its implications. Metather-ians (or marsupials) are one of the three subclasses ofmodern mammals, the other two being prototherians(or monotremes) and eutherians (commonly referred toas placentals). Branching between modern sauropsides
and mammals took place about 300 million years (My)ago; separations among mammalian subclasses weremore recent, 180 My ago for eutherian/metatherianlineages [1], and around 210 My ago for the protother-ian lineage [2,3]. Accordingly, marsupials can provide avaluable tool for tracing evolutionary origins of keytraits peculiar to the placental central nervous system(CNS). A second reason for our interest is that theopossum pup is able to regenerate connections betweenneurons of the cerebral cortex and spinal cord damagedby experimental trauma, which makes it an ideal sub-strate for regenerative studies [4-7]. Third, since theopossum cortex mainly develops after birth, newborns
* Correspondence: [email protected] School for Advanced Studies (SISSA/ISAS), Trieste, Italy
Puzzolo and Mallamaci Neural Development 2010, 5:8http://www.neuraldevelopment.com/content/5/1/8
© 2010 Puzzolo and Mallamaci; licensee BioMed Central Ltd. This is an Open Access article distributed under the terms of the CreativeCommons Attribution License (http://creativecommons.org/licenses/by/2.0), which permits unrestricted use, distribution, andreproduction in any medium, provided the original work is properly cited.

of this species are particularly suitable for early ex uteromicro-surgical manipulations of such structures [8,9].Fourth, the complete M. domestica genome has recentlybeen sequenced [10], facilitating molecular studies onthis model. Important also is that Monodelphis is parti-cularly suitable for laboratory studies since it is small,has a short gestational period (2 weeks) and reproducesprolifically throughout the year [8].Until recently, marsupial cortico-cerebral development
has been commonly investigated using classic histologymethods [11]. A hexalaminar cortical organitazion, simi-lar to the placental one, has been recognized inM. domestica and Didelphis virginiana [8,12], and an‘inside-out’ gradient of neuronal generation has beenassessed in Trichosurus vulpecula [13]. Thalamo-corticalconnectivity has also been studied by lipophylic dye tra-cing [14]. However, several features of Monodelphis cor-ticogenesis are unknown. The generation times ofdistinct neocortical laminae have not been determined,knowledge of their molecular diversification is relativelypoor, and little is known about where and how distinc-tive neocortical neuron types are generated. Glutamater-gic neurons might largely originate from progenitorswithin the pallial ventricular zone (VZ), since a basalprogenitor compartment, corresponding to the source ofthe vast majority of neocortical projection neurons inplacentals [15-17], appears in the opossum only at latedevelopmental stages [18,19]. Conversely, GABAergicinterneurons might arise from the ventral telencephalon,as in other amniota [20-22]. However, both issues havestill to be experimentally addressed.Nowadays, the large body of molecular tools and
methodologies used for developmental studies on thecortex of placentals is suitable for addressing corticalhistogenesis in marsupials in detail. The availability ofM. domestica genomic sequence data makes theirexploitation even more feasible. Taking advantage ofthese tools, we tried to fill gaps in our knowledge ofopossum corticogenesis, studying the origin of corticalneurons, their laminar differentiation and their migra-tion profiles from periventricular layers to their finallayer positions.
ResultsMolecular differentiation of neurons belonging to distinctneocortical laminae and their radial migrationThe placental neocortex is formed of six layers, eachexpressing a well defined set of molecular markers [23].To assay possible conservation of the neocortical lami-nar profile between placentals and marsupials, welooked at the distribution of a selection of these markersin the opossum neocortex at postnatal day (P)30, adevelopmental age at which radial neuronal migrationseems to be largely completed (Figure 1A). Tbr1,
expressed by mouse subplate, marginal zone and layerVI (as well as, to a lesser extent, layers III and II) [24],was detectable in the opossum in two stripes of cells.The deeper, corresponding to layer VI, included stron-ger labeled neurons; the more superficial, correspondingto layers II and III, displayed less intense immunoreac-tivity. Only a few weakly labelled Tbr1+ cells were foundin layer I, if any. Foxp2 and Tle4, markers of deep layersin placentals, were both confined to the deep grey mat-ter of the opossum. As expected, Tle4, expressed bymouse layers VI and V, displayed a wider radial domaincompared to Foxp2, restricted to murine layer VI only[24]. Conversely, Cux1 and Brn1, markers of upperlayers in placentals, were both confined to the superfi-cial grey matter. Again as expected, Brn1, also labeling asubset of layer V neurons in the mouse [25], displayed awider radial domain compared to Cux1, a marker oflayers II to IV only [26].Next, to reconstruct the temporal order of layer gen-
eration, we followed two complementary approaches.First, we assayed the time-course of expression ofselected laminar markers, Tle4, Foxp2, and Cux1 forcortical plate (CP) as well as Calretinin and Reelin(Reln) mRNA for preplate (PPL). Second, we performedsystematic bromodeoxyuridine (BrdU) pulse-chase birth-dating analysis.Time-course analysis of laminar markers gave results
similar to the mouse. There were, however, some differ-ences. As for Foxp2, no neocortical signal was detectableat P0, when a few strongly labeled cells were converselypresent in basal ganglia (data not shown). A Foxp2 signalappeared in lateral neocortex by P4. At P8, this signalspread to the entire cortical plate, becoming progressivelyconfined to the deepest part of it at later developmentalages (Figure 1B). A similar profile was displayed by thedeep cortical plate marker Tle4 (data not shown andFigure 1C). As for Cux1 (Figure 1D), two weak andhardly detectable signals were found at P10, in periventri-cular layers and in a few cells in the upper cortical plate.These signals were stronger at P12, and, by P18, theabventricular expression domain became wider than theperiventricular one. By P25, Cux1+ cells were tightly clus-tered in the most superficial cortical plate and no moreCux1 was detectable near the ventricle.Calretinin (Calb2), expressed by mouse subplate and
Cajal-Retzius cells, was detectable in the opossum tele-ncephalon throughout neuronogenesis (Figure 2A). AtP1, Calretinin+ cells were mainly localized in the ventraltelencephalon and, within the cortex, restricted to themost marginal-lateral part of it (Figure 2Aa,a’, arrow-heads). At P4, positive cells were throughout the corticalplexiform layer (PPL), including the hippocampus;within the lateral cortex, the Calretinin+ domain wassplit into two stripes, the more superficial including the
Puzzolo and Mallamaci Neural Development 2010, 5:8http://www.neuraldevelopment.com/content/5/1/8
Page 2 of 18

marginal zone (MZ), the deeper corresponding to thesubplate (SP) (Figure 2Ab,b’). This SP domain, relativelywider compared to the mouse one (Figure 2Ac,c’,d,d’),persisted up to P18 (Additional file 1A), disappearingaround P20 (Additional file 1B, C). This domain wasseparated from the ventricular Pax6 domain by theinterposed intermediate zone (IZ; Figure 2Ae,e’) andabutted the layer VI-V Tle4 domain on its marginal side
(Figure 2Af). However, Calretinin was not restricted toPPL and its derivatives. From P4 until P18, weakerlabeled Calretinin+ cells were detectable within the out-most cortical plate, where the last generated neuronssettle (Figure 2Ab,c’,d’; Additional file 1A). Starting fromP20 and, better, at P30, a distinct, areally restricted,strong Calretinin expression domain was evident a fewcell rows deeper to the MZ (Additional file 1B-F).
Figure 1 Expression profiles of layer-specific markers in the opossum neocortex. (A) DAPI staining and Tbr1, Foxp2, Tle4, Brn1 and Cux1immunofluorescence, on adjacent P30 mid-frontal neocortical sections. (B-D) Time course immunoprofiling of Foxp2, Tle4 and Cux1 on mid-frontal neocortical sections, from P4 to P25. Abbreviations: I, II, III, IV, V, VI refer to cortical layers; cp, cortical plate; e, ependyma; iz, intermediatezone; mz, marginal zone; ppl, preplate; se, subependymal zone; sp, subplate; vz, ventricular zone; wm, white matter. Scale bars: 100 μm.
Puzzolo and Mallamaci Neural Development 2010, 5:8http://www.neuraldevelopment.com/content/5/1/8
Page 3 of 18

Figure 2 Dynamics of Calretinin and Reelin expression in the developing opossum telencephalon. (Aa-d) Time course immunoprofilingof Calretinin (Calb2) from P1 to P12. (Aa’-d’) Magnifications of boxed areas in (Aa-d). (Ae-f) Comparisons among distributions of Calretinin, Pax6(Ae,e’) and Tle4 (Af). (B) In situ hybridization of Reelin (Reln) mRNA on coronal sections of P3, P6 and P15 opossum telencephalons. (Ba’-d”) aremagnifications of boxed areas in (Ba-d). Abbreviations: II-IV, V, VI refer to cortical layers; cp, cortical plate; iz, intermediate zone; mz, marginalzone; ppl, preplate; sp, subplate; vz, ventricular zone. Scale bars: 100 μm. Arrowheads in A point to Calb2+ cells within the ppl (a,a’); arrowheadsin B point to Reln+ neurons at around the septo-pallial border (b,b’), in the neocortical marginal zone (c,c’), the cortical hem (c,c”,d,d”), theneocortical outer cortical plate (d,d’).
Puzzolo and Mallamaci Neural Development 2010, 5:8http://www.neuraldevelopment.com/content/5/1/8
Page 4 of 18

As for Reelin, this glycoprotein is a hallmark of Cajal-Retzius cells in the mouse, where additional Reln+ cellscan also be found in layers IV-V of the late corticalplate [27-29]. We studied Reln expression in the opos-sum by a riboprobe corresponding to exons 1 to 12 andfound a spatio-temporal profile similar to the mouseone (Figure 2B). No Reln signal was detectable in thepallium at P3, that is, just before the appearance of theCP (Figure 2Ba,a’). Three days later, however, at P6,numerous Reln+ cells were found in the neocortical MZ(Figure 2Bc,c’), as well as in the marginal cingulate cor-tex (Figure 2Bb,b’) and in the stratum lacunosum-mole-culare of the hippocampus (Figure 2Bc,c”), that is, neartwo of the main birthplaces of Cajal-Retzius cellsdescribed in placentals [29,30]. This expression patternwas retained at least up to P15. At this age Reln+ cellswithin the neocortical MZ were much more sparse andadditional Reln+ elements were detectable within thedeveloping neocortical CP (Figure 2Bd-d”).To reconstruct the temporal order of layer generation,
we also performed systematic BrdU pulse-chase birth-dating analysis. By this approach, cells which were in S-phase at the time of BrdU injection and exited the cellcycle immediately afterwards, remained heavily labeledand, as such, easily traceable upon completion of theirradial migration. We injected opossum pups at differentdevelopmental ages (P1, P4, P6, P8, P10, P12, P14, P16,and P18) with a single pulse of saturating BrdU and leftthem to develop until the age of P30, when all neuronshave reached their final laminar position (as shownin Figures 1 and 2). We recovered their brains andanalyzed the cortices by BrdU immunofluorescence(Figure 3A). To compare radial distribution and laminaridentities of BrdU+ cells in distinct brains, we dividedthe cortical wall into 20 equally spaced bins, numberedfrom ventricular to marginal, and on this frameworkreported the approximative radial extension of distinctcortical laminae: layer I (evaluated by loose DAPI stain-ing), layers II-IV (by Cux1 immunofluorescence), andlayers V-VI (by Tle4 immunofluorescence). Then, foreach injection time, we counted BrdU+ cells, calculatedthe percentage of them falling into each bin and plottedthe data. Finally, we superimposed the resulting curves,obtaining a synopsis of the whole radial migration pro-cess (Figure 3B).We found that neocortical neurons were generated in a
wide temporal window, mainly from P1 to P14. Cellsborn at P16 reached superficial layers only to a limitedextent, suggesting that at that age neurogenesis was over,and P18 cells prevalently remained beneath the CP. Deepcortical plate neurons were prevalently born between P1and P6, and upper cortical plate neurons between P8 andP14. Colocalization of Tle4 and Cux1 with BrdU in P30animals injected at P4 and P12, respectively, confirmed
this conclusion (Figure 3C, D). As the SP is not anymoredistinguishable at P30, we assayed the date of birth of itsneurons in distinct, dedicated experiments. By adminis-tering P1 pups with BrdU and recovering their brains atP7 and P12, BrdU+/Calretinin+ cells were detectablebeneath the CP, especially in lateral cortex (Figure 3Eand data not shown), suggesting that the SP is mainlygenerated around birth. Finally, consistent with Relndata, P1 BrdU-pulsed/Calretinin+ cells, corresponding topresumptive Cajal-Retzius cells [31], were also detectableat P7 in the neocortical MZ (Figure 3F), the marginal cin-gulate cortex (Figure 3G), and the hippocampal stratumlacunosum-moleculare (Figure 3H).In conclusion: in the opossum, neocortical neurono-
genesis begins at the time of birth and ends 2 weekslater, at P14 to P16, and radial migration is completedby P25; the molecular laminar profile is very similar inmarsupials and placentals; and after PPL splitting, corti-cal plate neurons are laid down in both mammaliansubclasses according to the same ‘inside-out’ rule.
Does a basal progenitor compartment exist in theopossum?In placentals, neocortical projection neurons are preva-lently generated by basal progenitors or intermediateprogenitor cells, which lie around the pallial subventri-cular zone-VZ border and divide far from the ventricu-lar surface [16,17]. In the developing opossum cortex, asubventricular zone is not morphologically distinguish-able [8]. A basal proliferative compartment has beenreported recently [19], although only after neuronogen-esis completion (Figure 3B). We systematically read-dressed this issue by assaying mitosis distribution andimmunoprofiling distinct neuronogenic progenitorsthroughout the neuronogenetic window and beyond.First, we studied the distribution of cortical progeni-
tors undergoing mitosis at distinct radial positions, start-ing from P1 up to P25, by scoring the mitotic markerphospo-histone 3 (pH3) (Figure 4A). For each develop-mental age, we divided the cortical wall into fourunequally spaced bins, l (luminal, including the two ven-tricular most cell rows), p (periventricular, correspond-ing to the densely packed zone over the ventricle minusthe l belt), i (intermediate, corresponding to the regionbetween p and MZ), and m (marginal, corresponding tothe MZ), and plotted the percentages of pH3+ cells fall-ing in each of them (Figure 4B). We observed that thevast majority of pH3+ cells were aligned along the ven-tricular surface, as proper apical progenitors, whereasonly a few of them were scattered elsewhere. Up to P14,a few mitoses could be found in bin p, corresponding tothe main zone where basal progenitors divide in placen-tals (Figure 4Ab, B). These mitoses were prevalentlylocalized near the cortico-striatal notch, in the
Puzzolo and Mallamaci Neural Development 2010, 5:8http://www.neuraldevelopment.com/content/5/1/8
Page 5 of 18

Figure 3 Bromodeoxyuridine birthdating of opossum neocortical neurons. (A) BrdU immunoprofiling of mid-frontal neocortical sectionsfrom opossums injected with a single pulse of BrdU at the ages of P1, P4, P6, P8, P10, P12, P14, P16 and P18, and fixed at P30. Arrowheadspoint to grey matter BrdU+ cells. (B) Diagramatic representation of BrdU+ cells sampled in (A): the cortical wall is divided into 20 equally spacedbins, numbered from ventricular to marginal; radial extension of cortical laminae is indicated by white/grey shading; plots representingpercentages of BrdU+ cells falling into each bin, for each injection time. (C-H) Colocalization of layer-specific markers, Tle4 (C), Cux1 (D), Calb2(E-H), with BrdU injected at P4 (C), P12 (D) and P7 (E-H), respectively. Solid arrowheads in (E-H) point to Calb2+/BrdU+ cells; empty arrowheads in(F, H) point to Calb2-/BrdU+ cells. Abbreviations: I, II, III, IV, V, VI refer to cortical layers; e, ependyma; se, subependymal zone; wm, white matter.Scale bars: 100 μm in (A); 40 μm in (C-H).
Puzzolo and Mallamaci Neural Development 2010, 5:8http://www.neuraldevelopment.com/content/5/1/8
Page 6 of 18

presumptive paleocortical sector (Additional file 2). Thefrequency of p mitoses rose considerably after P18.Starting from this age, numerous abventricular mitosescould also be found in bins i and m (Figure 4Af, B), asdescribed for placental MZ glial progenitors [32].As a complementary approach, we looked for corticalexpression of the T-box transcription factor Tbr2, a
hallmark of basal progenitors in placentals [33]. Wefound numerous Tbr2+ cells at all stages under exami-nation, from P1 to P18 and later (Figure 4C and datanot shown). On 10-μm-thick sections, their linear fre-quency gradually rose from 37 ± 2 cells/100 μm at P1to 97 ± 14 cells/100 μm at P8 (P1 to P8 is the time win-dow when PPL, deep CP and part of superficial CP are
Figure 4 Dynamics of phospho-histone3 and Tbr2 expression in the developing opossum cortex. (A) Phospho-histone3 (pH3)immunoprofiling of mid-frontal neocortical sections of P1 to P25 opossums. Immunopositive cells are prevalently aligned near the ventricle;solid arrowheads point to rare abventricular pH3+ mitotic cells. (B) Diagrammatic representation of pH3+ cells sampled in (A). (C) Tbr2immunoprofiling of mid-frontal neocortical sections of P1 to P18 opossums. (D-F). Linear densities (D) and radial distributions (F) of Tbr2+ cellssampled in (C). (E) Linear densities of Tbr2+ cells in the mouse. Grey, pink and green shading in (D, E) demarcate peak neuronogenesis windowsfor primordial plexiform layer (ppl), inner cortical plate (i-cp) and outer cortical plate (o-cp), respectively. Abbreviations: II-IV, V, VI refer to corticallayers; cp, cortical plate; e, ependyma; iz, intermediate zone; mz, marginal zone; ppl, preplate; se, subependymal zone; sp, subplate; vz, ventricularzone; wm, white matter. Scale bars: 100 μm in (A, C).
Puzzolo and Mallamaci Neural Development 2010, 5:8http://www.neuraldevelopment.com/content/5/1/8
Page 7 of 18

generated), subsequently declining to 45 ± 3 cells/100μm at P15 (that is, just after the end of neuronogenesis)and even less at P18 (Figure 4D). Remarkably, this timecourse mirrored that of murine Tbr2+ cells (Figure 4E),which, however, were more numerous and reached theirpeak linear density slightly later, close to the end of neu-ronogenesis. Finally, as for radial distribution, modal dis-tance between Tbr2+ cells and ventricular surface variedin the opossum from about 120 to 140 μm at P1 to P8,to 60 μm at P15. In synthesis, Tbr2+ cells were detect-able throughout the neuronogenetic window, prevalentlyclustered around the border between the VZ and IZ,but also scattered within the VZ, exactly like placentalbasal progenitors [33] (Figure 4F).So, based on pH3 data, a basal proliferative compart-
ment does not seem to exist within the neuronogenic neo-cortical field (the frequency of abventricular mitoses startsto increase just around the end of neuronogenesis). Basedon Tbr2 expression, a compartment molecularly similar tothe basal one of placentals can be distinguished, inter-posed between ventricular precursors and abventricularneurons. How to solve this conundrum? Rather than beingdue to the absence of proliferative activity, the paucity ofabventricular pH3+ cells might reflect a very slow cellcycle progression in front of a short duration of M phase[34,35] (our unpublished observations), possibly leading toan underestimation of proliferative population. To ruleout this possibility, we looked for presumptive basal cellsin S phase, which would reasonably be several times morefrequent than the corresponding M phase ones [34,35]. So,we pulsed P4 to P10 opossum pups with BrdU, fixed theirbrains and looked for cortical Tbr2+ cells also immunor-eactive for BrdU. Such cells were extremely rare, (N(Tbr2
+BrdU+)/N(Tbr2+) = 0 at P4, 0 at P6, 3.3 ± 1.6 × 10⁻³ at P10),and the vast majority of Tbr2+ cells lay above the BrdU+
ones (Additional file 3A). Moreover, as expected, Tbr2+
cells were even more rarely positive for the mitotic pH3marker (N(Tbr2+pH3+)/N(Tbr2+) = 0 at P4, 0 at P6, 4.4 ±2.9 × 10⁻⁴ at P10, 5.4 ± 2.7 × 10⁻⁴ at P14; Additionalfile 3B). These data strongly suggest that, in marsupials,Tbr2+ cells are not proper basal progenitors, but mainlyrepresent a subventricular postmitotic compartment,interposed between intermitotic apical progenitors andpostmitotic abventricular neurons.To corroborate this interpretation, we further investi-
gated the origin and fate of Tbr2+ cells. In rodents,Tbr2+ cells are generated by a subset of neuronally com-mitted apical progenitors, called ‘pin-like’ cells or shortneural precursors, which, facing the ventricular cavityand not contacting the pial surface, can be distinguishedfrom radial glial cells for specific firing of the a1-tubulinpromoter (pTa1+ cells) [36,37]. We electroporated apTa1-enhanced green fluorescent protein (EGFP) con-struct into the P10 opossum cortex and fixed
electroporated brains 2 days later, after a final pulse(60 minutes) of BrdU. After verifying their vitality andcytoarchitectonic integrity (by scoring radial distributionof BrdU+ and Tbr2+ cells; Additional file 4), we finallylooked for GFP+/Tbr2+ cells (Figure 5A). We foundmany of them (Figure 5Ab-b”), confirming that opossumTbr2+ cells derive from apical progenitors, as in rodents.We then compared the distribution of Tbr2 and theneuronal marker b-tubulin on coronal slices of P10opossum brains (Figure 5B). Tbr2+ cells lay below themain b-tubulin domain, but a substantial overlapbetween the two antigens was detectable as well (Figure5Ba,b): in particular, around 30% of acutely dissociatedneocortical cells expressing Tbr2 were also positive forb-tubulin (Figure 5Bc-h), consistent with the hypothesisthat Tbr2 is transiently expressed before the activationof neuron-specific markers.Finally, to get a better temporal resolution of the devel-opmental process under examination, we pulsed P6pups with BrdU, fixed their brains after different times(from 6 h up to 72 h), and immunoprofiled BrdU+ cells,performing time-course analysis of their radial distribu-tion (Figure 5C, D). Comparing profiles obtained at dif-ferent times, BrdU+ cells seemed to move along a wave,from the ventricular side towards the marginal aspect ofthe cortical wall. In particular, up to 12 h, all BrdU+
cells lay deep to the Tbr2+ belt (Figure 5Cb); startingfrom 24 h, some of them were detectable within thisbelt (Figure 5Cc); at 48 h, about one-third of them wereabove it (Figure 5Cd); finally, at 72 h, most had over-come the Tbr2+ belt, so that only a few remained nearthe ventricle (Figure 5Ce). Remarkably, the percentageof Tbr2 cells also immunoreactive for BrdU displayed abiphasic trend, arising from about 0% at 12 h up 46% at24 h and subsequently declining to less than 10% at 3days (Figure 5E). In synthesis, neural progenitors exitingthe cell cycle leave the VZ and activate Tbr2 18 ± 6 hafter the last DNA synthesis; 1 day later, the same cellsmassively move to more marginal positions, where theydownregulate Tbr2, while activating neuron-specificmarkers (Figure 5Bc-h).
The apical proliferative compartment and its dynamicsPrevious results indicate that the apical progenitor com-partment is the place where pallial projection neuronsare generated. To reconstruct the dynamics of this com-partment, we performed time-course analysis of its hall-mark, Pax6 [33]. As in placentals, this homeoprotein wasspecifically expressed in the pallial VZ throughout neuro-nogenesis (Figure 6A). On 10-μm-thick sections, linearfrequencies of Pax6+ cells were 160 ± 16 cells/100 μm atP4, 132 ± 4 cells/100 μm at P8, 92 ± 8 cells/100 μm atP10, and 66 ± 11 cells/100 μm at P15 (Figure 6B). Thesevalues were slightly lower than the corresponding mouse
Puzzolo and Mallamaci Neural Development 2010, 5:8http://www.neuraldevelopment.com/content/5/1/8
Page 8 of 18
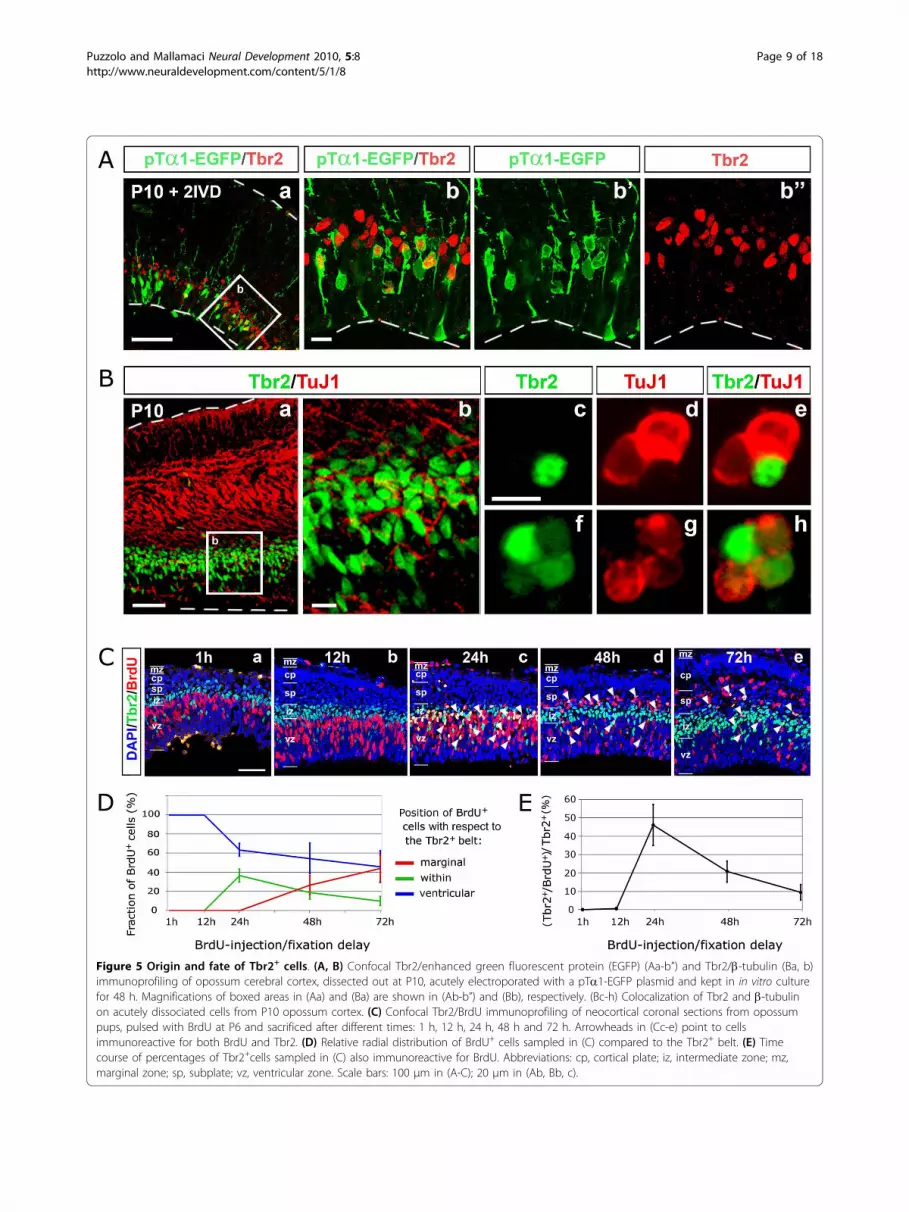
Figure 5 Origin and fate of Tbr2+ cells. (A, B) Confocal Tbr2/enhanced green fluorescent protein (EGFP) (Aa-b”) and Tbr2/b-tubulin (Ba, b)immunoprofiling of opossum cerebral cortex, dissected out at P10, acutely electroporated with a pTa1-EGFP plasmid and kept in in vitro culturefor 48 h. Magnifications of boxed areas in (Aa) and (Ba) are shown in (Ab-b”) and (Bb), respectively. (Bc-h) Colocalization of Tbr2 and b-tubulinon acutely dissociated cells from P10 opossum cortex. (C) Confocal Tbr2/BrdU immunoprofiling of neocortical coronal sections from opossumpups, pulsed with BrdU at P6 and sacrificed after different times: 1 h, 12 h, 24 h, 48 h and 72 h. Arrowheads in (Cc-e) point to cellsimmunoreactive for both BrdU and Tbr2. (D) Relative radial distribution of BrdU+ cells sampled in (C) compared to the Tbr2+ belt. (E) Timecourse of percentages of Tbr2+cells sampled in (C) also immunoreactive for BrdU. Abbreviations: cp, cortical plate; iz, intermediate zone; mz,marginal zone; sp, subplate; vz, ventricular zone. Scale bars: 100 μm in (A-C); 20 μm in (Ab, Bb, c).
Puzzolo and Mallamaci Neural Development 2010, 5:8http://www.neuraldevelopment.com/content/5/1/8
Page 9 of 18
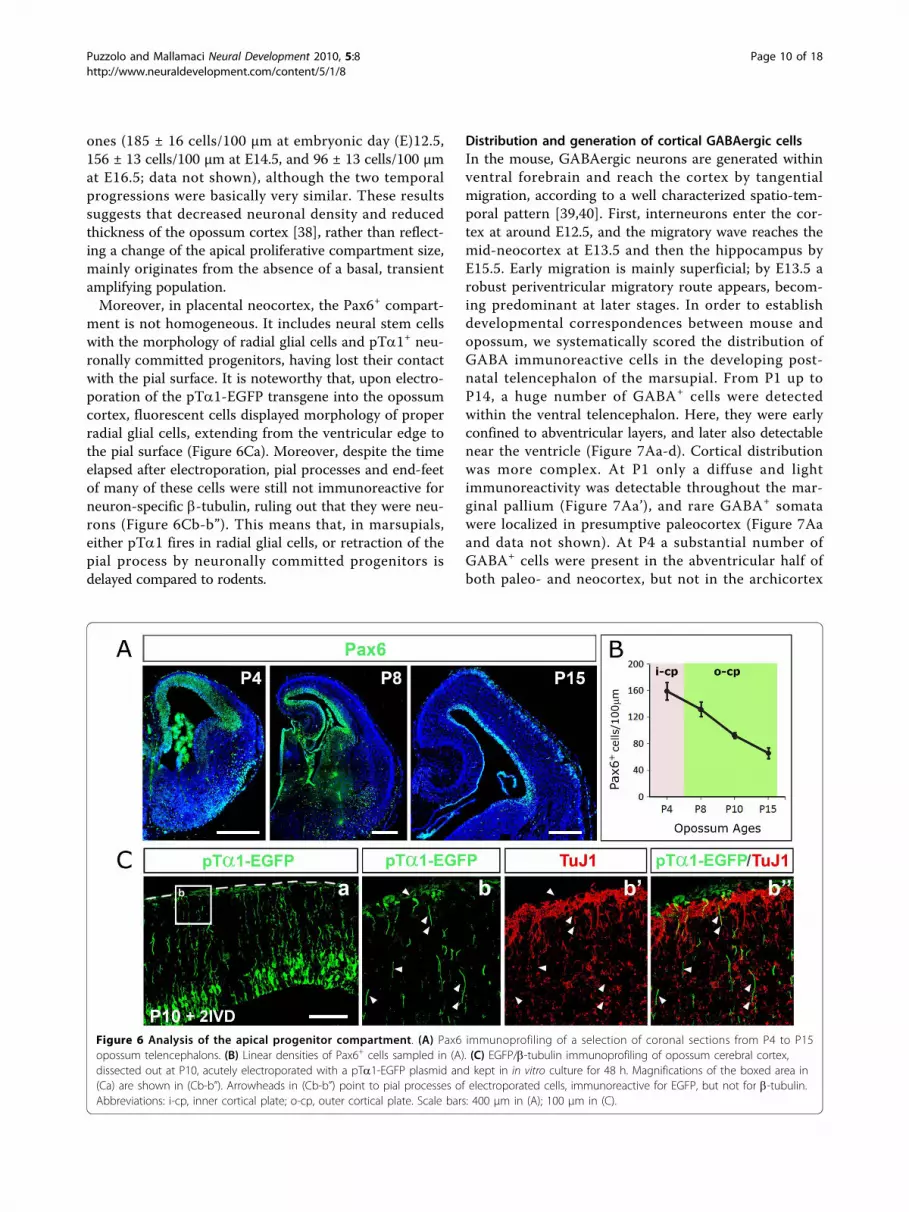
ones (185 ± 16 cells/100 μm at embryonic day (E)12.5,156 ± 13 cells/100 μm at E14.5, and 96 ± 13 cells/100 μmat E16.5; data not shown), although the two temporalprogressions were basically very similar. These resultssuggests that decreased neuronal density and reducedthickness of the opossum cortex [38], rather than reflect-ing a change of the apical proliferative compartment size,mainly originates from the absence of a basal, transientamplifying population.Moreover, in placental neocortex, the Pax6+ compart-
ment is not homogeneous. It includes neural stem cellswith the morphology of radial glial cells and pTa1+ neu-ronally committed progenitors, having lost their contactwith the pial surface. It is noteworthy that, upon electro-poration of the pTa1-EGFP transgene into the opossumcortex, fluorescent cells displayed morphology of properradial glial cells, extending from the ventricular edge tothe pial surface (Figure 6Ca). Moreover, despite the timeelapsed after electroporation, pial processes and end-feetof many of these cells were still not immunoreactive forneuron-specific b-tubulin, ruling out that they were neu-rons (Figure 6Cb-b”). This means that, in marsupials,either pTa1 fires in radial glial cells, or retraction of thepial process by neuronally committed progenitors isdelayed compared to rodents.
Distribution and generation of cortical GABAergic cellsIn the mouse, GABAergic neurons are generated withinventral forebrain and reach the cortex by tangentialmigration, according to a well characterized spatio-tem-poral pattern [39,40]. First, interneurons enter the cor-tex at around E12.5, and the migratory wave reaches themid-neocortex at E13.5 and then the hippocampus byE15.5. Early migration is mainly superficial; by E13.5 arobust periventricular migratory route appears, becom-ing predominant at later stages. In order to establishdevelopmental correspondences between mouse andopossum, we systematically scored the distribution ofGABA immunoreactive cells in the developing post-natal telencephalon of the marsupial. From P1 up toP14, a huge number of GABA+ cells were detectedwithin the ventral telencephalon. Here, they were earlyconfined to abventricular layers, and later also detectablenear the ventricle (Figure 7Aa-d). Cortical distributionwas more complex. At P1 only a diffuse and lightimmunoreactivity was detectable throughout the mar-ginal pallium (Figure 7Aa’), and rare GABA+ somatawere localized in presumptive paleocortex (Figure 7Aaand data not shown). At P4 a substantial number ofGABA+ cells were present in the abventricular half ofboth paleo- and neocortex, but not in the archicortex
Figure 6 Analysis of the apical progenitor compartment. (A) Pax6 immunoprofiling of a selection of coronal sections from P4 to P15opossum telencephalons. (B) Linear densities of Pax6+ cells sampled in (A). (C) EGFP/b-tubulin immunoprofiling of opossum cerebral cortex,dissected out at P10, acutely electroporated with a pTa1-EGFP plasmid and kept in in vitro culture for 48 h. Magnifications of the boxed area in(Ca) are shown in (Cb-b”). Arrowheads in (Cb-b”) point to pial processes of electroporated cells, immunoreactive for EGFP, but not for b-tubulin.Abbreviations: i-cp, inner cortical plate; o-cp, outer cortical plate. Scale bars: 400 μm in (A); 100 μm in (C).
Puzzolo and Mallamaci Neural Development 2010, 5:8http://www.neuraldevelopment.com/content/5/1/8
Page 10 of 18

Figure 7 Distribution of GABA and glutamate-decarboxylase immunoreactivity in developing opossum cortices. (Aa-d) Distribution ofGABA+ cells on frontal sections of P1 to P14 cortices. (Aa’-d’) Magnifications of boxed regions in (Aa-d). (Ba-c) Distribution of glutamate-decarboxylase (GAD)+ cells on frontal sections of P4, P8 and P10 cortices. (Ba’-c’) Magnifications of boxed regions in (Ba-c). GAD+ cells areevident in the marginal zone and the subplate since P4 (Ba’,b’, solid arrowheads). At P8, an additional reactivity is detectable in proliferativelayers (Bb’, empty arrowheads). Finally, at P10, both marginal zone and periventricular GAD signals are strengthened (Bc’,c”) and additional GAD+
cells are present throughout the cortical plate (Bc’). Abbreviations: cp, cortical plate; iz, intermediate zone; mz, marginal zone; sp, subplate; vz,ventricular zone. Scale bars: 400 μm in (Aa-d,Ba-c); 50 μm in (Aa’-d’, Ba’-c”).
Puzzolo and Mallamaci Neural Development 2010, 5:8http://www.neuraldevelopment.com/content/5/1/8
Page 11 of 18

(Figure 7Ab,b’). At P8, abventricular GABA+ cells werepresent throughout the cortex, including the marginalhippocampus; ventricular GABA+ cells were converselylimited to paleo- and neocortex (Figure 7Ac,c’). Finally,at P14, GABA+ cells were detectable throughout thecortex, clustered in a narrow periventricular belt andmore loosely distributed elsewhere (Figure 7Ad,d ’).Remarkably, the spatio-temporal distribution of gluta-mate-decarboxylases 65 and 67 (GAD65 and GAD67)was consistent with the GABA pattern (Figure 7B).The apparently higher frequency of GABA+ cells
within the opossum cortical VZ, compared to themouse, suggested that, in marsupials, at least some ofthese cells might be locally generated. To test thishypothesis, we assayed the capability of early cortical tis-sue, not containing any GABA+ cells and isolated fromventral forebrain, to generate such cells in vitro. We dis-sected out cerebral cortices from P1 opossum brains,cultured them in vitro for 8 days in the presence ofsaturating iododeoxyuridine (IdU), exposed then to afinal pulse of BrdU before fixation (90 minutes), andfinally immunoprofiled them for GABA, IdU and BrdU(Additional file 5Aa). We found cells expressing thethree antigens in different combinations. NumerousBrdU+ cells were detectable, suggesting that, before fixa-tion, cultures were still healthy (Additional file 5Ab).Among GABA+ cells, some were IdU- (Additional file5Ac-c”, empty arrowheads). These cells were reasonablygenerated before the dissection and acquired theirmature GABA+ phenotype in culture. However, a largefraction of GABA+ cells was also IdU+ (Additional file5Ac-c”, solid arrowheads), suggesting that they couldhave been locally generated by cortical progenitors thatunderwent their final DNA synthesis during in vitroculturing.To confirm such a conclusion, we re-addressed this
issue in vivo. We pulsed P5 pups with BrdU, fixedtheir brains 24 h later and finally looked for neocorticalBrdU+/GAD+ or BrdU+/GABA+ cells as an index of localinterneuron generation. We reasoned that 24 h should bea sufficiently long time delay to allow newborn neurons ofthe GABAergic lineage to switch robust GAD and GABAimmunoreactivities on and sufficiently short to avoid ven-trally generated interneurons entering the cortex. Asexpected, we found many BrdU+/GAD+ or BrdU+/GABA+
cells in basal ganglia. However, only very few of themwere detectable in neocortex (Additional file 5B). All thissuggests that, in marsupials, as in rodents, most interneur-ons are generated outside the cortex, in the basal telence-phalon. The relatively high frequency of IdU+/GABA+
cells we found in cortical explants may have two explana-tions. The few interneurons generated in cultured corticalexplants accumulated over as many as 8 days and, due toexperimental detachment of cortex from basal ganglia,
were poorly diluted by those coming from the subpallium.Moreover, in a large fraction of cases, IdU was probablynot uptaken by GABAergic-lineage pallial precursors dur-ing pre-neuronogenic DNA synthesis, but by progenies ofsubpallial precursors (already present in the corticalexplant at the time of its removal), during post-mitoticDNA repair. These two mechanisms are not mutuallyexclusive and may largely account for apparent inconsis-tencies between the results of the in vitro and in vivoapproaches.
Post-neuronal histogenesis: generation of astrocytes andoligodendrocytesIn rodents, gliogenesis follows neuronogenesis and thathappens in the developing opossum cortex as well. Toassess astrocytogenesis progression, we looked at thedistribution of the Glial fibrillary acid protein antigen(Gfap) from P8 (that is, the middle of the neuronogenicwindow) onward. A periventricular signal detected fromthe beginning was restricted to hippocampus at P8(Additional file 6Aa), and spread throughout the corticalfield at P12 (Additional file 6Ab). This signal presump-tively corresponds to the soma of radial glial cells,which, in primates, share this marker with true astro-cytes [41,42]. An abventricular Gfap signal associatedwith cells with the morphology of astrocytes could befound only later, starting from P18 to P20 (data notshown; Additional file 6Ac-f). These cells were detect-able in the MZ, the grey matter and white matter.A subset of them coexpressed the astrocyte markerS100b (Additional file 6Ag-i”).The differentiation of oligodendrocytes was studied by
monitoring immunoreactivity for the marker O4 [43].A strong signal was found at both analyzed ages, P40and P60, restricted to white matter, internal capsule andhippocampal commissure (Additional file 6Ba,b;M. domestica has no corpus callosum [44]).
DiscussionIn the present study we found that the cortico-cerebralneuronal complement is generated in the opossum pupbetween P1 and P16, molecular diversification of neu-rons belonging to distinct laminae largely resembles thatof placentals, and migration of cortical plate neuronsfollows the ‘inside-out’ rule. We demonstrated thatopossum neocortical projection neurons are almostentirely generated by apical progenitors, and that Tbr2,the hallmark of placental basal progenitors, is only tran-siently expressed by opossum post-mitotic elements,prior to the activation of neuron-specific genes. More-over, we showed that such absence of a basal transientamplifying population is the main reason for thereduced thickness and decreased neuronal density, dis-tinguishing the marsupial from the placental cortex
Puzzolo and Mallamaci Neural Development 2010, 5:8http://www.neuraldevelopment.com/content/5/1/8
Page 12 of 18

[38,45] despite conserved intracolumnar upper/lowerlayer neuron ratios [19]. As for GABAergic neurons, wefound that whereas many are born in the subpallium, asin rodents [39,40], and invade the cortex by P4, a smallfraction of them is also generated within cortical peri-ventricular layers. Finally, as in placentals, cortical histo-genesis continues with astrocytogenesis (from P18onward) and ends up with oligodentrocytogenesis(around P40 and later).We found that molecular diversification of the cortical
plate is highly conserved between marsupials and placen-tals, with Foxp2 and Tle4 restricted to deeper layers andBrn1 and Cux1 mainly confined to upper layers. Thissuggests that the neocortical hexalaminar profile arosebefore the branching between these two subclasses,about 180 My ago [46]. Minor differences were observedin derivatives of PPL, namely the phylogenetically mostancient component of our cortex [47]. Based on Calreti-nin immunostaining, the opossum SP appeared quiteprominent, as previously assessed by simple histologicalinspection [8], far thicker than in rodents [48]. Cellsexpressing Reln, a hallmark of Cajal-Retzius neurons,were detectable beneath the pia mater, in both neo- andarchicortex, like in placentals. However, their appearancedid not predate the splitting of the preplate, as happensin rodents [48]. We reconstructed rules governing mar-supial neocortical lamination by following two comple-mentary experimental approaches. First, we comparedthe mature distribution of neocortical laminar markerswith the radial settling profile of neurons generated atdifferent developmental times, as assessed by BrdUpulse-chase analysis. Second, we performed systematictime-course expression analysis of a selection of thesemarkers, from their appearance to the end of the lamina-tion process. Both approaches indicated that, in M.domestica, radial neuronal migration takes place in a waysimilar to placentals. Like in rodents [27-29], such a pro-cess is reasonably promoted by the glycoprotein Reelin,released by Cajal-Retzius cells and, later, by some CPneurons. This protein seems, however, to be dispensablefor PPL splitting, which apparently occurs in the absenceof detectable expression of its mRNA.Beyond the study of laminar differentiation and radial
migration, we paid special attention to the origin of cor-tical neurons, both glutamatergic and GABAergic. Inplacentals, glutamatergic neurons are generated withinthe dorsal telencephalon by two periventricular prolif-erative compartments, the apical and the basal, the for-mer confined to the VZ, the latter mainly lying in thesubventricular zone [17,49]. The existence of a basalcompartment in the opossum was controversial [18]. Arecent study reports that such a compartment is actuallypresent in developing marsupial brains, suggesting thatit emerged in the eutherian-metatherian lineage [19]. In
the opossum, however, basal proliferative activity arisesonly around the end of cortical neuronogenesis (Figure3B) and thus contributes little to the generation of theneocortical neuronal complement. We reanalyzed thistopic by an integrated approach, including scoring ofpH3+ mitoses and Tbr2+ cells, immunoprofiling ofacutely administrated BrdU and pTa1-driven EGFP, aswell as BrdU pulse-chase analysis. We found that, in theopossum, cells expressing Tbr2 do not form a transientamplifying population, but represent a postmitotic tran-sitional compartment, passed through by neuroblasts inthe process of switching Pax6 off and activating neuron-specific b-tubulin. Interestingly, among sporadic abven-tricular pH3+ precursors detectable in the cortex at P14,more than four-fifths do not express Tbr2 (Additionalfile 3B), suggesting that such precursors may belong notto the neuronogenic but to the gliogenic lineage. Thisscenario is not surprising. Tbr2 has been detected in thedeveloping pallium of other vertebrates missing a basalproliferative compartment, such as Anamnia and birds[50-52]. Moreover, besides corticogenesis, Tbr2 is alsoexpressed in the gastrulating embryo, where it promotesepithelium-to-mesenchyme transition [53]. So this tran-scription factor, rather than specifying basal progenitoridentity in the developing cortex, might play a moregeneral morphogenetic role, inducing apical precursorsto leave embryonic epithelia they belong to [16].Anyway, it has to be recalled that some abventricular
pH3+ mitoses can be found in the lateral-most opossumpallium. It is tempting to speculate that such basal pro-liferative activity might increase the final neuronal out-put of the small ventricular sector in between neopallialand striatal fields, in charge of generating paleocortexand other latero-ventral derivatives of the amniote tele-ncephalon [54].Time-course GABA/GAD immunoprofiling of the
developing cortex, immuno-characterization of earlycortical explants as well as in vivo short-term BrdUpulse-chase of GABAergic neurons showed that genera-tion of cortical interneurons in the opossum is mainlyconfined to ventral telencephalon, like in other Amniota[20-22]. Actually, there is some local cortical interneur-ono-genesis; however, the amplitude of this phenom-enon is modest as in rodents [55], far smaller than inprimates [56-58].
ConclusionsThis study provides three main results on the developingopossum cortex. First, projection neurons and interneur-ons are generetad by pallial and subpallial precursors,respectively, as in eutherians. Second, a neocortex with aeutherian-like molecular profile is laid down, followingthe inside-out rule, suggesting that the hexalaminar blue-print emerged prior to eutherian-metatherian branching.
Puzzolo and Mallamaci Neural Development 2010, 5:8http://www.neuraldevelopment.com/content/5/1/8
Page 13 of 18

Third, differently from eutherians, neocortical projectionneurons are almost entirely generated by apical neuralprecursors and basal progenitors hardly contribute totheir genesis; Tbr2, the hallmark of eutherian basal pro-genitors, is transiently expressed by postmitotic progeniesof apical precursors prior to the activation of moremature neuronal markers.Based on temporal progression of the morphogenetic
subroutines that were the subject of analysis, a compara-tive opossum/mouse cortical developmental timetable issketched in Figure 8.
Materials and methodsAnimalsOpossums (M. domestica) at different postnatal ageswere obtained from the colony maintained at the animalhouse facility of the University of Trieste, Italy. Mice(Mus musculus, strain CD1) were purchased from Har-lan (San Pietro al Natisone, UD, Italy). Opossums werestaged by systematic daily inspection of the colony fornewborn litters, P0 corresponding to the day of birth.Mice were staged by timed breeding and vaginal pluginspection. Animal handling and subsequent procedureswere in accordance with European laws (EuropeanCommunities Council Directive of November 24, 1986(86/609/EEC)) and with National Institutes of Health
guidelines. In particular, to harvest opossum brains(from P1 to P40), young animals were killed by decapi-tation, after hypothermia. When the entire CNS had tobe recovered, the animals were alternatively killed byaorta resection, again after hypothermia. In the case ofP60 animals, they were terminally anesthetized byurethane and transcardially perfused with 4% paformal-dehyde. Mouse embryos (E10.5 to E18.5) were harvestedfrom pregnant dames killed by cervical dislocation.
Bromodeoxyuridine administrationBrdU was administered to P1 to P18 opossum pups at adose of 200 μg/g body weight in 0.9% NaCl by subcuta-neous injections. During administration, pups were leftattached to the mother, previously anesthetized with iso-fluorane. All injected animals were sacrificed at the ageof P30 and their brains used for kinetic studies.
Organotypic culturesTwo kinds of organotypic brain cultures were used forthis study, adherent and floating. Adherent cultureswere set up according to the classical Stoppini method[59], with minor modifications. Briefly, P1 opossum neo-cortices and basal ganglia were dissected, placed on dis-tinct falcon cyclopore PET membranes and kept at theatmosphere-medium interface as follows. After priming
Figure 8 Opossum and mouse cortico-cerebral histogenesis: a comparison. (A) Radial distribution and approximate temporal generationwindows of neurons, astrocytes and oligodendrocytes in the opossum and mouse cerebral cortex. (B) Peak generation times for primordialplexiform layer, deep cortical plate and superficial cortical plate in opossum and mouse. (C) Temporal profile of interneurons spreading in thedeveloping cerebral cortex of opossum and mouse. Abbreviations: I, II-VI refer to cortical layers; cp, cortical plate; e, ependyma; ppl, primordialplexiform layer; se, subependymal zone; wm, white matter.
Puzzolo and Mallamaci Neural Development 2010, 5:8http://www.neuraldevelopment.com/content/5/1/8
Page 14 of 18

(1 h at 32°C in DMEM-F12-Glutamax, 10% FBS/N2, 0.6%glucose, under 95% air/5% CO2 atmosphere), membraneswere transferred into 12-multiwell plates, each well con-taining 1.2 ml of Neurobasal-B57-Glutamax, 0.6% glucose(supplemented with Fungizone/Pen/Strept mix), and keptfor 8 days at 32°C at the interface between medium and a95% air/5% CO2 atmosphere. For floating cultures, P10opossum CNSs were dissected and repeatedly washed inDMEM-F12-Glutamax/0.6% glucose/Fungizone/Pen/Strept, paying particular attention to avoid any damage.After further manipulations (DNA injection and electro-poration), CNSs were transferred to 50 ml Falcon tubes(one per tube), each containing 15 ml of DMEM-F12-Glutamax/0.6% glucose/N2, 1%FBS/Fungizone/Pen/Strept. Cultures were maintained at 32°C for two days, inthe presence of bubbling 95%O2/5%CO2. In cases of bothadherent and floating cultures, to verify brain vitality, afinal pulse of BrdU (5 μg/ml of medium) was given 90minutes before explant fixation.
Brain electroporationElectroporation was performed on acutely dissected P10opossum CNSs, put in a petri dish filled with 0.6% glu-cose, 1× PBS. An aqueous 1 μg/μl solution of plasmidDNA (1 μl; containing 0.01% fast green dye) wasinjected into a lateral ventricle using glass capillaries1B100-3 (World Precision Instruments, Sarasota, FL,USA) prepared using the micropipette puller P-97 (Sut-ter Instrument Company, Novato, CA, USA). Two par-allel, 5-cm spaced, rectangular electrode plates (4 cm ×6 cm) were placed on both sides of the telencephalonand three 100 V pulses (each 100 ms long; intervalbetween consecutive pulses 450 ms) were deliveredusing an electro-square-porator (BTX 830). PlasmidspTa1-EGFP (kindly provided by E Ruthazer) andpDsRed2-N1 (Clontech, Mountain View, CA, USA)were used for electroporation.
HistologyCNS specimens (both mouse and opossum, wholebrains and explants) were fixed in 4% paraformalde-hyde-PBS overnight at 4°C, cryoprotected in 30%sucrose/PBS and cut coronally at 10 μm. Cryosectionswere mounted on Fischer SuperFrost Plus slides, andsubsequently processed for in situ hybridization orimmunohistochemistry.To accurately determine the fraction of Tbr2+ cells
also expressing b-tubulin, six freshly dissected P10 opos-sum cortices were pooled and dissociated to single cellsby gentle trituration. Cells were resuspended in DMEM-F12, 1% serum, plated onto slides previously coveredwith 20 μg/ml poly-D-lysine, and left to attach for 1 hat room temperature. Slides were processed for immu-nofluorescence, as described elsewhere.
ImmunofluorescenceImmunofluorescence was performed as previouslydescribed [60], with minor modifications. Generally,prior to use, sections were boiled for 5 minutes in 10mM pH6 citrate buffer. This step was omitted in thecase of b-tubulin, b-tubulin/GFP, GAD and GABAstainings. In the case of BrdU detection, sections werealso treated for DNA depurination (2 M HCl, for 15minutes at room temperature) and then neutralized (in0.1 M borate buffer, pH 8.5, for 15 minutes at roomtemperature). For other combined immunofluorescences(BrdU/Tle4, BrdU/Cux1, BrdU/Tbr2, IdU/GABA, BrdU/GAD and BrdU/GABA), the HCl concentration wasreduced to 0.2 M. Sections were incubated for 1 h atroom temperature under blocking mix (1× PBS, 10%FBS, 1 mg/ml bovine serum albumin, 0.1% Triton X100)and then incubated at 4°C overnight with primary anti-body in blocking mix.Primary antibodies used were as follows: mouse
monoclonal anti-BrdU (clone B44, Becton Dickinson,Franklin Lakes, New Jersey, USA), 1:50; rat anti-BrdU(clone ICR1, Abcam, Cambridge, UK), 1:500; goat anti-Brn1 (Santa Cruz Biotechnology, Inc., Santa Cruz, CA,USA), 1:30; mouse monoclonal anti-Calretinin (cloneM7245, Dako, Glostrup, Denmark), 1:50; rabbit anti-Cux1 (Santa Cruz), 1:30; rabbit anti-Foxp2 (Abcam),1:1,500; rabbit anti-Gaba (Sigma-Aldrich Corp., St.Louis, MO, USA), 1:8,000; rabbit anti-GAD (Sigma),1:1,000; rabbit anti-Gfap (Dako), 1:500; chicken anti-GFP (Abcam), 1:800; mouse monoclonal anti-O4 (cloneO4, R&D Systems Inc., Minneapolis, MN, USA), 1:600;rabbit anti-Pax6 (Abcam); 1:300; rabbit anti-pH3(Upstate Biotechnology Inc, Lake Placid, NY, USA),1:600; mouse anti-pH3 (Cell Signaling Technologies Inc,Danvers, MA, USA), 1:100 (limited to pH3/Tbr2 coloca-lization assays); rabbit anti-S100b (Dako), 1:200; rabbitanti-Tbr1 (kindly provided by Robert Hevner), rabbitanti-Tbr2 (Abcam), 1:500; rabbit anti-Tle4 (Santa Cruz),1:30; mouse anti-neuron-specific class III b-tubulin(clone Tuj1, Covance, Emeryville, CA, USA), 1:500.Finally, immunoreactivity was revealed after 2-h incu-
bation with secondary Alexa antibodies, 488 and 594(Molecular Probes, Emeryville, CA, USA), 1:400.
In situ hybridizationNon-radioactive in situ hybridization was performed aspreviously described [61], with minor modifications. Theprobe used corresponded to exons 1 to 12 of theM. domestica Reelin (Reln) coding region (Ensemblmdo-chr.8: nt 155064879-154744337).
Imaging and confocal microscopyFluorescent labeled sections were imaged and analyzedusing a fluorescent Nikon (Tokyo, Japan) Eclipse 80i
Puzzolo and Mallamaci Neural Development 2010, 5:8http://www.neuraldevelopment.com/content/5/1/8
Page 15 of 18

microscope and a DS-2MBWC digital microscope cam-era. Confocal photos were taken by a TCS SP2 Leicaconfocal microscope; they were generally collected as1.0-μm-thick Z-stacks, and as 3.0-μm-thick Z-stacks inthe case of pTa1-EGFP electroporated cells. All imageswere processed using Adobe Photoshop CS3 software.
Sample sizingUnless otherwise stated, each experiment was performedat least in triplicate. In cases of laminar birthdating(Figure 3), per each BrdU pulsing time, three mid-frontal800-μm-wide neocortical sectors, from four cortices wereprofiled. pH3+ cell counting was performed in similarly,but throughout the neocortical field (Figure 4A, B). Thesame applies to Tbr2+ (Figure 4C-F), Tbr2+/BrdU+
(Figure 5C) and Pax6+ (Figure 6A) cell counting, butrestricted to 200-μm-wide parietal sectors. Error bars inFigures 4, 5 and 6 represent standard deviations. ForTbr2+/BrdU(1 h)+ and Tbr2+/pH3+ counting (Additionalfile 3), at least three animals per age were analyzed (onlytwo for Tbr2+/pH3+ counting at P6) and not less than600 (at P4), 1,600 (at P6), 3,000 (at P10) and 3,000(at P14) Tbr2+ cells were scored for each brain; Tbr2+/BrdU(1 h)+ and Tbr2+/pH3+ data are reported in themain text as average ± standard error of the mean.Finally, the prevalence of Tbr2+ elements among abven-tricular pH3+ cells at P14 was calculated by collectingand scoring about 15 abventricular pH3+ cells per brain,from three distinct brains.
Additional file 1: Late expression of Calretinin in the opossumcortex. (A-F) Calretinin (Calb2) immunoprofiling of coronal sections fromP18 to P30 opossum cortexes. Solid arrowheads point to immunopositivecells in the outer cortical plate at P18 (A), and double arrowheadsdemarcate the deeper, areally restricted expression domain visiblestarting from P20 onward (C-F). Empty arrowheads highlight the absenceof Calb2+ cells in more superficial rows of the CP at P20 and later (B, C,F). Abbreviations: e, ependyma; hi, hippocampus; mz, marginal zone; se,subependymal zone; wm, white matter; II, III, IV, V, VI are cortical layers.Scale bar: 100 μm.
Additional file 2: Abventricular mitotic pH3+ cells in the lateralopossum pallium. (A-D) Opossum telencephalons from P4 to P30. (A’-D’) Magnifications of boxed areas in (A-D). Solid arrowheads point toabventricular mitotic pH3+ cells within the lateral-most cortex. Scale bar:300 μm (A-D); 100 μm (A’-D’).
Additional file 3: Mutual periventricular distribution of Tbr2 andproliferation markers in the developing opossum cortex. (A)Comparative Tbr2/BrdU immunoprofiling of P4, P6 and P10 opossumneocortices, pulsed by BrdU 1 h before fixation. (B) Comparative Tbr2/pH3immunoprofiling of selected P4, P6, P10 and P14 opossum neocorticalsectors, harboring rare abventricular pH3+ precursors. Empty arrows in (B)point to places occupied by Tbr2-pH3+ elements. Scale bar: 50 μm.
Additional file 4: Cytoarchitectonic integrity of opossum corticalexplants. (A) Distribution of BrdU and Tbr2 immunoreactivity in thecortex of an opossum brain explanted at P10, electroporated by pTa1-EGFP, kept in floating culture for 48 h and terminally administered with a60-minute pulse of BrdU. Scale bar: 100 μm.
Additional file 5: Generation of opossum cortical GABA+ and GAD+
cells. (Aa) Strategy for assessing birthplaces of cortical GABA+ cells invitro, on cortical explants. (Ab-c”) BrdU/IdU/GABA immunoprofiling of
radial sections of neo-/archi-cortical explants, dissected out at P1, kept inculture for 8 days in the presence of IdU and terminally administeredwith BrdU. Empty arrowheads in (Ac-c”) point to GABA+/IdU- cells,presumptively born before tissue dissection; solid arrowheads point toGABA+/IdU+ cells, presumptively generated by cortical progenitors thatunderwent their final DNA synthesis in vitro. (Ba, Bd) GAD/BrdU andGABA/BrdU immunoprofiling of P6 telencephalons, from opossum brainspulsed by BrdU 24 h before fixation. (Bb-b”, Bc-c”) Magnifications ofboxed regions in (Ba); (Be-e”, Bf-f”) magnifications of boxed regions in(Bd). Arrowheads in (Bb”, Bc”) point to cortical and basal GAD+/BrdU+
cells, respectively. (Bb"’, Bc"’) Magnifications of boxed regions in (Bb”,Bc”), where large immunoreactivity spots are detectable around thenucleus of GAD+ cells, from both cortex and ganglia. Arrowheads in (Be”,Bf”) point to double positive GABA+/BrdU+ cells. (Be"’, Bf"’)Magnifications of boxed regions in (Be”, Bf”). Abbreviations: BG, basalganglia; CX, cortex. Scale bars: 200 μm in (Ba, Bd); 50 μm in (Ab-c”, Bb-b”,Bc-c”, Be-e”, Bf-f”).
Additional file 6: Gliogenesis in the opossum cortex. (Aa-f) Gfapimmunoprofiling of coronal sections from P8 to P60 cortices. Arrowheadsin (Aa) and in (Ab) point to Gfap+ presumptive radial glial cells, within P8hippocampus and P12 cortical periventricular layers, respectively. Arrowsin (Ac-f) indicate Gfap+ cells with astrocyte morphology. (Ag-i”)Combined Gfap/S100b immunoprofiling of P20 to P30 cortices, showingspecific colocalization of these two antigens within more matureastrocytes, in cortical plate (CP) and marginal zone (MZ). (Ba, b)Immunoprofiling of P40 to P60 mid-frontal cortical sections for theoligodendrocyte-specific marker O4: an intense staining may be found inwhite matter (WM), internal capsule (ic) and hippocampal commissure(hc). Scale bars: 100 μm in (Aa-f); 50 μm in (Ag-i); 200 μm in (B).
AbbreviationsBrdU: bromodeoxyuridine; CNS: central nervous system; CP: cortical plate;DMEM: Dulbecco’s modified Eagle’s medium; FBS: fetal bovine serum; GABA:gamma-aminobutyric acid; GAD: glutamate-decarboxylase; Gfap: Glial fibrillaryacid protein antigen; E: embryonic day; EGFP: enhanced green fluorescentprotein; IdU: iododeoxyuridine; IZ: intermediate zone; MZ: marginal zone; My:million years; P: postnatal day; PBS: phosphate-buffered saline; pH3: phospo-histone 3; PPL: preplate; SP: subplate; VZ: ventricular zone.
AcknowledgementsWe thank John Nicholls for his invaluable suggestions, his encouragementand critical reading of the manuscript. We also thank Salvo Guarino, for hishelp in handling opossums and performing in vivo injections, and MicaelaGrandolfo, for technical assistance in confocal microscopy. This work wasentirely supperted by intramural SISSA funding.
Authors’ contributionsEP performed the experiments. EP and AM designed the experiments,analyzed data and wrote the manuscript.
Competing interestsThe authors declare that they have no competing interests.
Received: 17 November 2009 Accepted: 19 March 2010Published: 19 March 2010
References1. Ji Q, Luo ZX, Yuan CX, Wible JR, Zhang JP, Georgi JA: The earliest known
eutherian mammal. Nature 2002, 416:816-822.2. Kumar S, Hedges SB: A molecular timescale for vertebrate evolution.
Nature 1998, 392:917-920.3. Woodburne M, Rich T, Springer MS: The evolution of tribospheny and the
antiquity of mammalian clades. Mol Phylogenet Evol 2003, 28:360-385.4. Nicholls JG, Saunders N: Regeneration of immature mammalian spinal
cord after injury. Trends Neurosci 1996, 19:229-234.5. Saunders NR, Adams E, Reader M, Møllgard K: Monodelphis domestica (gray
short-tailed opossum): an accessible model for studies of earlyneocortical development. Anat Embryol 1989, 180:227-236.
Puzzolo and Mallamaci Neural Development 2010, 5:8http://www.neuraldevelopment.com/content/5/1/8
Page 16 of 18

6. Lepre M, Fernandez J, Nicholls JG: Re-establishment of direct synapticconnections between sensory axons and motoneurons after lesions ofneonatal opossum CNS (Monodelphis domestica) in culture. Eur J Neurosci1998, 10:2500-2510.
7. Nicholls JG, Adams WB, Eugenin J, Geiser R, Lepre M, Luque JM, Wintzer M:Why does the central nervous system not regenerate after injury? SurvOphthalmol 1999, 43:S136-141.
8. Saunders NR, Kitchener P, Knott GW, Nicholls JG, Potter A, Smith T:Development of walking, swimming and neuronal connections aftercomplete spinal cord transection in the neonatal opossum, Monodelphisdomestica. J Neurosci 1998, 18:339-355.
9. Huffman KJ, Nelson J, Clarey J, Krubitzer L: Organization of somatosensorycortex in three species of marsupials, Dasyurus hallucatus, Dactylopsilatrivirgata, and Monodelphis domestica: neural correlates of morphologicalspecializations. J Comp Neurol 1999, 403:11810.
10. Mikkelsen TS, Wakefield MJ, Aken B, Amemiya CT, Chang JL, Duke S,Garber M, Gentles AJ, Goodstadt L, Heger A, Jurka J, Kamal M, Mauceli E,Searle SM, Sharpe T, Baker ML, Batzer MA, Benos PV, Belov K, Clamp M,Cook A, Cuff J, Das R, Davidow L, Deakin JE, Fazzari MJ, Glass JL,Grabherr M, Greally JM, Gu W, et al: Genome of the marsupialMonodelphis domestica reveals innovation in non-coding sequences.Nature 2007, 447:167-177.
11. Morest DK: A study of neurogenesis in the forebrain of opossum pouchyoung. Z Anat Entwicklungsgesch 1970, 130:265-305.
12. Krause WJ, Saunders NR: Brain growth and neocortical development inthe opossum. Ann Anat 1994, 176:395-407.
13. Sanderson KJ, Weller WL: Gradient of neurogenesis in possum neocortex.Brain Res Dev 1990, 55:269-274.
14. Molnar Z, Knott G, Blakemore C, Saunders NR: Development ofthalamocortical projections in the South American gray short-tailedopossum (Monodelphis domestica). J Comp Neurol 1998, 398:491-514.
15. Kriegstein A, Noctor S, Martinez-Cerdeno V: Patterns of neural stem andprogenitor cell division may underlie evolutionary cortical expansion.Nat Rev Neurosci 2006, 7:883-890.
16. Sessa A, Mao C, Hadjantonakis A, Klein W, Broccoli V: Tbr2 directsconversion of radial glia into basal precursors and guides neuronalamplification by indirect neurogenesis in the developing neocortex.Neuron 2008, 60:56-69.
17. Kowalczyk T, Pontious A, Englund C, Daza RAM, Bedogni F, Hodge R,Attardo A, Bell C, Huttner WB, Hevner RF: Intermediate neuronalprogenitors (basal progenitors) produce pyramidal-projection neuronsfor all layers of cerebral cortex. Cereb Cortex 2009, 19:2439-2450.
18. Abdel-Mannan OA, Cheung AFP, Molanr Z: Evolution of corticalneurogenesis. Brain Res Bull 2008, 75:398-404.
19. Cheung FPA, Kondo S, Abdel-Mannan O, Chodroff RA, Sirey TM, Bluy LE,Webber N, De Proto J, Karlen SJ, Krubitzer L, Stolp HB, Saunders NR,Molnár Z: The subventricular zone is the developmental milestone of a6-layered neocortex: comparisons in metatherian and eutherianmammals. Cerebr Cortex 2009, doi10:1093/cercor/bhp168.
20. Cobos I, Puelles L, Martinez S: The avian telencephalic subpalliumoriginates inhibitory neurons that invade tangentially the pallium (dorsalventricular ridge and cortical areas). Dev Biol 2001, 239:30-45.
21. Anderson SA, Eisenstat DD, Shi L, Rubenstein JL: Interneuron migrationfrom basal forebrain to neocortex: dependence on Dlx genes. Science1997, 278:474-476.
22. Metin C, Alvarez C, Modoux D, Vitalis T, Pieau C, Molnar Z: Conservedpattern of tangential neuronal migration during forebrain development:analysis in reptiles. Development 2007, 134:2815-2827.
23. Molyneaux BJ, Arlotta P, Menezes JRL, Macklis JD: Neuronal subtypespecification in the cerebral cortex. Nature Rev 2007, 8:427-437.
24. Hevner RF, Shi L, Justice N, Hsueh YP, Sheng YM, Smiga YS, Bulfone A,Goffinet AM, Campagnoni AT, Rubenstein JLR: Tbr1 regulatesdifferentiation of the preplate and layer 6 proliferative cells of theventricular zone. Neuron 2001, 29:353-366.
25. McEvilly RJ, De Diaz MO, Schonemann MD, Hooshmand F, Rosenfeld MG:Transcriptional regulation of cortical neuron migration by POU domainfactors. Science 2002, 295:1528-1532.
26. Nieto M, Monuki ES, Tang H, Imitola J, Haubst N, Khoury SJ, Cunningham J,Gotz M, Walsh CA: Expression of Cux-1 and Cux-2 in the subventricularzone and upper layers ii-iv of the cerebral cortex. J Comp Neurol 2004,479:168-180.
27. D’Arcangelo G, Miao GG, Chen S-C, Soares HD, Morgan JI, Curran T: Aprotein related to extracellular matrix proteins deleted in the mousemutant reeler. Nature 1995, 374:719-723.
28. Yoshida M, Assimacopoulos S, Jones KR, Grove EA: Massive loss of Cajal-Retzius cells does not disrupt neocortical layer order. Development 2005,133:537-545.
29. Takiguchi-Hayashi K, Sekiguchi M, Ashigaki S, Takamatsu M, Hasegawa H,Suzuki-Migishima R, Yokoyama M, Nakanishi S, Tanabe Y: Generation ofreelin-positive marginal zone cells from the caudomedial wall oftelencephalic vesicles. J Neurosci 2004, 3:2286-2295.
30. Bielle F, Griveau A, Narboux-Nême N, Vigneau S, Sigrist M, Arber S,Wassef M, Pierani A: Multiple origins of Cajal-Retzius cells at the bordersof the developing pallium. Nat Neurosci 2005, 8:1002-1012.
31. Alcántara S, Ruiz M, D’Arcangelo G, Ezan F, de Lecea L, Curran T, Sotelo C,Soriano E: Regional and cellular patterns of reelin mRNA expression inthe forebrain of the developing and adult mouse. J Neurosci 1998,18:7779-7799.
32. Costa MR, Kessaris N, Richardson WD, Gotz M, Hedin-Pereira C: Themarginal zone/layer i as a novel niche for neurogenesis and gliogenesisin developing cerebral cortex. J Neurosci 2007, 27:11376-11388.
33. Englund C, Fink A, Lau C, Pham D, Daza RA, Bulfone A, Kowalczyk T,Hevner RF: Pax6, Tbr2, and Tbr1 are expressed sequentially by radial glia,intermediate progenitor cells, and postmitotic neurons in developingneocortex. J Neurosci 2005, 25:247-251.
34. Takahashi T, Nowakowski RS, Caviness VS: Cell cycle parameters andpatterns of nuclear movement in the neocortical proliferative zone ofthe fetal mouse. J Neurosci 1993, 13:820-833.
35. Takahashi T, Nowakovsky RS, Caviness VS: Early ontogeny of the secondaryproliferative population of the embryonic murine cerebral wall. JNeurosci 1995, 15:6058-6068.
36. Gal JS, Morozov YM, Ayoub AE, Chatterjee M, Raklic P, Haydar TF: Molecularand morphological heterogeneity of neural precursors in the mouseneocortical proliferative zones. J Neurosci 2006, 26:1045-1056.
37. Ochiai W, Nakatani S, Takahara T, Kainuma M, Masaoka M, Minobe S,Namihira M, Nakashima K, Sakakibara A, Ogawa M, Miyata T: Periventricularnotch activation and asymmetric Ngn2 and Tbr2 expression in pair-generated neocortical daughter cells. Mol Cell Neurosci 2009, 40:225-233.
38. Haug : Brain sizes, surfaces, and neuronal sizes of the cortex cerebri: astereological investigation of man and his variability and a comparisonwith some mammals (primates, whales, marsupials, insectivores, andone elephant). Am J Anat 1987, 180:126-142.
39. Marin O, Rubenstein JL: A long, remarkable journey: tangential migrationin the telencephalon. Nat Rev Neurosci 2001, 2:780-790.
40. López-Bendito G, Sturgess K, Erdélyi F, Szabó G, Molnár Z, Paulsen O:Preferential origin and layer destination of GAD65-GFP corticalinterneurons. Cereb Cortex 2004, 14:1122-1133.
41. Levitt P, Rakic P: Immunoperoxidase localization of glial fibrillary acidicprotein in radial glial cells and astrocytes of the developing rhesusmonkey brain. J Comp Neurol 1980, 193:815-40.
42. Sancho-Tello M, Valles S, Montoliu C, Renau-Piqueras J, Guerri C:Developmental pattern of GFAP and vimentin gene expression in ratbrain and in radial glial cultures. Glia 1995, 15:157-66.
43. Sommer I, Schachner M: Monoclonal antibodies (O1 to O4) tooligodendrocyte cell surfaces: an immunocytological study in the centralnervous system. Dev Biol 1981, 83:311-327.
44. Abbie AA: The origin of the corpus callosum and the fate of structuresrelated to it. J Comp Neurol 1939, 71:16316.
45. BrainMaps.org. [http://brainmaps.org/].46. Murphy WJ, Pevzner PA, O’Brien SJ: Mammalian phylogenomics comes of
age. Trends Genet 2004, 20:631-639.47. Marin Padilla: Cajal Retzius cells and the development of the neocortex.
Trends Neurosci 1998, 21:64-71.48. Mallamaci A, Mercurio S, Muzio L, Cecchi C, Pardini CL, Gruss P, Boncinelli E:
The lack of Emx2 causes absence of Cajal-Retzius cells and reeler-likedefects of neuronal migration in the developing cerebral cortex. JNeurosci 2000, 20:1109-1118.
49. Guillemot F: Cellular and molecular control of neurogenesis in themammalian telencephalon. Cur Opin Cell Biol 2005, 17:639-647.
50. Brox A, Puelles L, Ferreiro B, Medina L: Expression of the genes Emx1,Tbr1, and Eomes (Tbr2) in the telencephalon of Xenopus laevis confirms
Puzzolo and Mallamaci Neural Development 2010, 5:8http://www.neuraldevelopment.com/content/5/1/8
Page 17 of 18
the existence of a ventral pallial division in all tetrapods. J Comp Neurol2004, 474:562-577.
51. Mueller T, Wullimann MF, Guo SJ: Early teleostean basal gangliadevelopment visualized by zebrafish Dlx2a, Lhx6, Lhx7, Tbr2 (eomes),and GAD67 gene expression. Comp Neurol 2008, 507:1245-1257.
52. Bulfone A, Martinez S, Marigo V, Campanella M, Basile A, Quaderi N,Gattuso C, Rubenstein JL, Ballabio A: Expression pattern of the Tbr2(Eomesodermin) gene during mouse and chick brain development.Mech Dev 1999, 84:133-138.
53. Arnold SJ, Hofmann UK, Bikoff EK, Robertson EJ: Pivotal roles foreomesodermin during axis formation, epithelium-to-mesenchymetransition and endoderm specification in the mouse. Development 2008,135:501-511.
54. Fernandez AS, Pieau C, Repérant J, Boncinelli E, Wassef M: Expression ofthe Emx-1 and Dlx-1 homeobox genes define three molecularly distinctdomains in the telencephalon of mouse, chick, turtle and frog embryos:implications for the evolution of telencephalic subdivisions in amniotes.Development 1998, 125:2099-2111.
55. Gorski JA, Talley T, Qiu M, Puelles L, Rubenstein JL, Jones KR: Corticalexcitatory neurons and glia, but not GABAergic neurons, are producedin the Emx1-expressing lineage. J Neurosci 2002, 22:6309-6314.
56. Letinic K, Zoncu R, Rakic P: Origin of GABAergic neurons in the humanneocortex. Nature 2002, 417:645-649.
57. Rakic S, Zecevic N: Emerging complexity of layer I in human cerebralcortex. Cereb Cortex 2003, 13:1072-1083.
58. Petanjek Z, Berger B, Esclapez M: Origins of cortical GABAergic neurons inthe cynomolgus monkey. Cereb Cortex 2009, 19:249-262.
59. Stoppini L, Buchas PA, Muller D: A simple method for organotypiccultures of nervous tissue. J Neurosci Methods 1991, 37:173-182.
60. Muzio L, Mallamaci A: Foxg1 confines Cajal-Retzius neuronogenesis andhipoccampal morphogenesis to the dorso-medial pallium. J Neurosci2005, 25:435-441.
61. Bovolenta P, Mallamaci A, Briata P, Corte G, Boncinelli E: Implication ofOtx2 in pigmented epithelium determination and neural retinadifferentiation. J Neurosci 1997, 17:4243-4252.
doi:10.1186/1749-8104-5-8Cite this article as: Puzzolo and Mallamaci: Cortico-cerebral histogenesisin the opossum Monodelphis domestica: generation of a hexalaminarneocortex in the absence of a basal proliferative compartment. NeuralDevelopment 2010 5:8.
Submit your next manuscript to BioMed Centraland take full advantage of:
• Convenient online submission
• Thorough peer review
• No space constraints or color figure charges
• Immediate publication on acceptance
• Inclusion in PubMed, CAS, Scopus and Google Scholar
• Research which is freely available for redistribution
Submit your manuscript at www.biomedcentral.com/submit
Puzzolo and Mallamaci Neural Development 2010, 5:8http://www.neuraldevelopment.com/content/5/1/8
Page 18 of 18


