Embed Size (px)
Citation preview

1
Corticofugal modulation of the tactile response coherence of projecting neurons in the gracilis nucleus
Nazareth P. Castellanos1, Eduardo Malmierca2, Angel Nuñez2, and Valeri A. Makarov3*
1Instituto Pluridisciplinar, Universidad Complutense de Madrid, Paseo Juan XXIII, 1, 28040 –Madrid, Spain2Depto. de Anatomía Histología y Neurociencia, Facultad de Medicina, Universidad Autónoma de Madrid, c. Arzobispo Morcillo s/n, 28029 – Madrid, Spain3Depto. De Matemática Aplicada, Escuela de Óptica, Universidad Complutense de Madrid, Avda. Arcos de Jalon s/n, 28037 - Madrid, Spain
*Corresponding author: Dr. Valeri A. MakarovDepto. De Matemática Aplicada, Escuela de Óptica, Universidad Complutense de Madrid, Avda. Arcos de Jalon s/n, 28037 - Madrid, SpainPhone: (34) 913946900FAX: (34) 913946885e-mail: [email protected]
Running head: Corticofugal modulation of the tactile response coherence
Page 1 of 40 Articles in PresS. J Neurophysiol (August 29, 2007). doi:10.1152/jn.00815.2007
Copyright © 2007 by the American Physiological Society.

2
Abstract:
Precise and reproducible spike timing is one of the alternatives of the sensory stimulus encoding. We test coherence (repeatability) of the response patterns elicited in projecting gracile neurons by tactile stimulation and its modulation provoked by electrical stimulation of the corticofugal feedback from the somatosensory (SI) cortex. To gain the temporal structure we adopt the wavelet based approach for quantification of the functional stimulus-neural response coupling. We show that the spontaneous firing patterns (when exist) are essentially random. Tactile stimulation of the neuron receptive field strongly increases the spectral power in the stimulus and 5-15 Hz frequency bands. However, the functional coupling (coherence) between the sensory stimulus and the neural response exhibits ultraslow oscillation (0.07 Hz). During this oscillation the stimulus coherence can temporarily fall down below the statistically significant level, i.e. the functional stimulus–response coupling may be temporarily lost for a single neuron. We further demonstrate that electrical stimulation of the SI cortexincreases the stimulus coherence for about 60% of cells. We find no significant correlation between the increment of the firing rate and the stimulus coherence, but we show that there is a positive correlation with the amplitude of PSTH. The latter argues that the observed facilitation of the neural response by the corticofugal pathway, at least in part, may be mediated through an appropriate ordering of the stimulus evoked firing pattern, and the coherence enhancement is more relevant in gracilis nucleus than an increase of the number of spikes elicited by the tactile stimulus.
Keywords: Gracilis nucleus, Tactile information, Corticofugal pathway, Wavelet Coherence
Page 2 of 40

3
1. Introduction
Sensory processing in the central nervous system involves dynamic adaptation of
the synaptic efficiency depending on the level of alertness or behavioural conditions. In
this process corticofugal projections to the subcortical relay stations may play an
important modulating role adding the temporal context to the internal dynamics. The
dorsal column nuclei (DCN), which include the gracilis and cuneate nuclei, are the first
relay station in the lemniscal pathway that receives somatosensory information from
the body through the dorsal column, and projects to the somatosensory thalamus. DCN
neurons receive two major excitatory synaptic inputs that control their activity. First,
due to ascending somatosensory fibers via the dorsal column, which establish contact
with both thalamic projection neurons and inhibitory interneurons (Rustioni and
Weinberg 1989; DeBiasi et al. 1994; Lue et al. 1996). Second, due to corticofugal
fibers, primarily from cells in the forelimb and hindlimb regions of the primary
somatosensory (SI) cortex and, to a lesser extent, from the secondary somatosensory
cortical area, running mainly through the pyramidal tract (Jabbur and Towe 1961;
Kuypers and Tuerk 1964; Valverde 1966; Weisberg and Rustioni 1976). The ascending
pathway has been extensively studied over the last decades (see e.g. Rustioni and
Weinberg 1989; DeBiasi et al. 1994; Lue et al. 1996), whereas little is known about the
role and dynamical properties of the corticofugal pathway. Meanwhile, studying the
interplay between the two pathways should shed light on the global picture of the tactile
information processing in the DCN.
Recently, it has been reported that the sensorimotor cortex exerts a selective
control of the somatosensory transmission at the DCN (Malmierca and Nuñez 1998,
2004; Canedo and Aguilar 2000; Aguilar et al. 2003). Indeed, the corticofugal input
facilitates sensory responses of gracile neurons with overlapping receptive fields and
inhibits sensory responses of cells with separate receptive fields, probably providing a
synaptic mechanism for the enhancement of contrast between sensory signals.
Besides, in vitro experiments have shown that activation of corticofugal fibers regulates
both incoming sensory signals through the dorsal column and corticofugal inputs
(homo- and heterosynaptic facilitation; Nuñez and Buño 1999, 2001). NMDA receptors
are activated by glutamate released from corticofugal terminals and induce Ca2+ inflow
through voltage-gated channels at DCN neurons, triggering these facilitating processes
(Nuñez and Buño 1999, 2001; Malmierca and Nuñez 2004). Although the synaptic
mechanisms of the corticofugal modulation on DCN neurons have been previously
studied, the dynamic changes of this corticofugal action have yet not been well
Page 3 of 40

4
established mainly due to the lack of adequate tools for the analysis of the temporal
evolution of sensory responses.
A very common method to track temporal coupling or functional association
between stimulus and neural response is the peristimulus time histogram (PSTH),
which characterizes the cross-correlation between two point processes, i.e. stimulus
events and a neural spike train (Perkel et al. 1967). Whereas the PSTH examines
temporal changes in the amount of generated spikes triggered by the stimulus,
analyses in the frequency domain can provide a more concise description of the
temporal correlation of the oscillatory patterns in spike trains. In the frequency domain
spectral coherence is a well established standard tool to analyze the linear relationship
between two (usually continuous) signals by determining the correlation between their
spectra. A high value of spectral coherence points to the presence of a functional
association between e.g. stimulus and neural response in the corresponding frequency
band. Starting from this concept several different modifications of the coherence
measure have been suggested (see e.g. Dahlhaus et al. 1997; Baccala and
Sameshima 2001; Korzeneiwska et al. 2003).
Although the above mentioned measures have been shown to be very useful in
different aspects of neuroscience, they suffer from the fundamental but unlikely to be
fulfilled assumption on stationarity of the neural response in question, and hence do not
allow inferring on the dynamical changes in associations (coupling) between stimulus
and neural response. Indeed, any analysis based entirely on the time averaging
(PSTH) or on the Fourier transform (coherence) ignores all temporal variations in the
functional coupling between tactile stimulation and neural response. An additional
temporal resolution is essential and demands replacement of the classical Fourier
(spectral) coherence by other methods. There have been successful attempts to adapt
Fourier-based methods to short time signals, for example by means of orthonormal
sliding windows (Bayram and Baraniuk 1996; Lovett and Ropella 1997; Xu et al. 1999),
which are similar to the classical Gabor transform (Mallat 1999).
Relatively recently a new method of time series analysis that can, and has been
designed to, cope with complex non-stationary signals has been introduced. The new,
wavelet transform, technique provides high temporal resolution with good frequency
resolution and offers a reasonable compromise for these parameters. The wavelet
transform has been used to analyze brain signals from the very beginning in
neuroscience. The majority of its applications are in electroencephalographic
recordings (see e.g. Schiff et al. 1994; Goelz et al. 2000; Alegre et al. 2003; Quiroga
and Garcia 2003; Makinen et al. 2004; Mormann et al. 2005; Murata 2005; Castellanos
and Makarov 2006). However, there are few studies on synchronization between pair
Page 4 of 40

5
of spike trains (e.g. stimulus–neural response). In this direction the wavelet cross-
spectrum has been used to analyze the phase-locked oscillations in simultaneously
recorded spike trains in the motor area of rhesus monkeys trained to produce a series
of visually guided hand movements according to changes in the target locations (Lee
2002, 2003).
The first studies of the wavelet coherence are very recent (Le Van Quyen et al.
2001; Lachaux et al. 2002; Grinsted et al. 2004; Klein et al. 2006). The wavelet
coherence, similarly to the spectral coherence, infers on the functional coupling
between e.g. stimulus and neural response, but additionally it also provides the
temporal structure of the coupling. Li et al. (2007) investigated the temporal interaction
in CA1 and CA3 regions in rats with induced epilepsy using the wavelet coherence. In
previous works (Pavlov et al. 2006, 2007) we advocated and illustrated the use of the
wavelet transform for analysis of neural spike trains recorded in the trigeminal nuclei
under tactile whisker stimulation.
In this paper we aim at quantification of the wavelet coherence (i.e. functional
association) of the gracile neural response to tactile stimulation and show that
activation of the SI cortex leads to a dynamical (i.e. varying in time) alteration of the
response characteristics of the neurons mediated by the corticofugal pathway. We first
describe how the wavelet coherence can be applied to investigation of the dynamical
properties of neural spike trains and then we apply the method to evaluate the
dynamical changes in the neural response to tactile stimulation in the gracilis nucleus
provoked by activation of the corticofugal feedback from the SI cortex. We show that
the corticofugal feedback can modulate the response of gracile neurons so that spiking
activity elicited by tactile stimulation can be stronger or weaker phase locked to the
stimulus events. Existence of such modulation can be interpreted as a possibility of
changing “attention” to relevant stimuli, since a reliable (coherent) response of gracile
neurons projecting to the thalamus will favor the transport of sensory stimuli from the
periphery to the thalamus and then to the cortex.
2. Materials and methods
2.1 Experimental recordings
Data were obtained from 15 urethane-anaesthetized (1.6 g/Kg i.p.) young adult
Wistar rats of either sex, weighing 180-250 g (from Iffa-Credo, France). Animals were
placed in a stereotaxic device and the body temperature was maintained at 37°C. To
record the electroencephalogram (EEG), a macroelectrode (120 µm diameter bluntly
cut insulated nichrome wire) was lowered 1.5 mm below the cortical surface into the
Page 5 of 40

6
frontal lobe. The EEG was band pass filtered in the range [0.3-30] Hz and continuously
monitored in an oscilloscope. Supplemental doses of the anesthetic were given when a
decrease in the amplitude of the EEG delta waves was observed. Experiments were
carried out in accordance with the European Communities Council Directive
(86/609/EEC).
Unit recordings
The cisterna magna was opened to introduce the recording electrodes at 60° angle
over the surface of the nucleus. Tungsten microelectrodes (2-5 MΩ; World Precission
Instruments) were used to obtain single unit recordings in the gracilis nucleus (A: -13.6
to -14.6 mm, L: 0.2 to 1.0 mm from the bregma; H: 0.0 to 0.5 mm from the surface of
the nucleus; according to the atlas of Paxinos and Watson 1986). Position of the
electrodes was visually controlled under a dissecting microscope. Unit firing was
filtered (0.3-3 KHz), amplified via an AC preamplifier (DAM80; World Precision
Instruments) and fed into a personal computer (sample rate: 8 KHz) with the temporal
reference of the stimuli for off-line analysis using Spike 2 software (Cambridge
Electronic Design, Cambridge, UK). The spike amplitude and shape were continuously
monitored on-line in an analog oscilloscope. Additional off-line spike amplitude and
shape analyses were performed to ensure that the same cell was recorded during the
entire experiment and to transform spikes into time point-processes for further data
analysis (see below).
Sensory stimulation
Tactile stimulation was performed by an electronically gated solenoid with a probe
of 1 mm in diameter that produced skin deflection not exceeding 0.5 mm. The receptive
field (RF) of gracile neurons was carefully mapped with a small hand-held brush to
identify neurons responding to light mechanical stimulation of the hindlimb, as detected
with an audio amplifier driven by the amplified neuronal activity. RFs were defined by
the limits at which stimuli elicited changes in the unit activity. Tactile stimulation
consisted in a sequence of 31 tactile pulses lasting 20 ms and delivered at the RF at 1
Hz rate. Thus each stimulation epoch lasted 32 s.
Neuron identification
To identify gracile neurons projecting to the thalamus, bipolar stimulating electrodes
were aimed at the medial lemniscus (A: -6.5 mm, L: 0.5 to 1.5 mm, H: 8 to 9 mm).
Antidromic firing was evoked by means of brief electrical pulses (0.1-0.3 ms, 50-500
µA).
Page 6 of 40

7
Cortical stimulation
To place the stimulating electrode, the bone over the contralateral SI cortex was
removed. Prior to placing the stimulating electrode, a tungsten microelectrode for
multiunit recording (0.5-1 MΩ; World Precission Instruments) was aimed at the cortex
(A: -1 to -3 mm, L: 2 to 5 mm, H: 1.2 mm) to locate a site with a vigorous multiunit
response to tactile stimulation of the hindlimb area. After detecting the RF in the SI
cortex, a bipolar stimulating electrode (120 µm diameter blunt cut stain steel wire) was
aimed at the same site as the recording electrode (1.0 mm depth; cortical layer 5).
Electrical stimulation of the selected cortical area was performed by a Grass S88
stimulator coupled to photoelectric stimulus isolation unit. Trains of brief rectangular
pulses (0.1-0.3 ms, 10-100 µA) at 50 Hz and lasting 500 ms were applied. This type of
electrical stimulation is restricted to an area less than 0.5 mm2.
2.2 Data analysis
Extracellular recordings were accepted for further mathematical analysis when the
fluctuation of the unit amplitude was lower than 10% throughout the experiment.
Summed peristimulus time histograms (PSTHs) were calculated off-line with Spike 2
software (Cambridge Electronic Design, Cambridge, UK) running on a PC. Then we
evaluated the PSTH area corresponding to the post-stimulus interval of 50 ms and the
area corresponding to 50 ms preceding the stimulus onset. If the former area was at
least three times bigger, we positively decided on the presence of the neural response
elicited by the stimulus. The latency of a sensory response was measured as the time
elapsed between the onset of the sensory stimulus and the largest peak in the PSTH.
All data are shown as mean ± standard error.
Then we analyze the time-frequency contents of the selected spike trains and their
correlation to the stimulus events. As we mentioned in Introduction, PSTH and ordinary
spectral coherence do not provide such information. Some insight however can be
obtained by the traditional dot-raster display. Although the raster display can capture
important temporal characteristics of the neural stimulus response it is merely visual
tool, i.e. no measure of, for instance, stability of the neural response can be directly
derived. Moreover, a correct comparison of raster displays generated by several
neurons with essentially different firing rates is difficult if not impossible. This finally
leads to a problem of generalizing results over the neural population. Meanwhile the
wavelet technique offers a natural way to study the temporal structure of the neural
stimulus response coherence.
Page 7 of 40

8
Wavelet transform of a spike train
The continuous wavelet transform (WT) of a signal ( )x t (e.g. spike train) involves
its projection onto a set of soliton-like basis functions obtained by rescaling and
translating along the time axis the so called “mother wavelet” Ψ
*1( , ) ( ) d
t zW p z x t t
pp
∞
−∞
−= Ψ
∫ , (1)
where parameters p and z define the wavelet time scale and localization,
respectively. The choice of the function Ψ depends on the research aim. To study
rhythmic components of a signal the Morlet-wavelet is well suited
2 20( ) exp( 2 )exp( / 2 )y j y y kπΨ = − , (2)
where 0k is a parameter, which can be tuned according to physical phenomena under
study. In the wavelet transform (1) the time scale p plays the role of the period of the
rhythmic component. Given a characteristic time scale (i.e. the period) p the resolution
of the wavelet in the time and frequency domains is given by
00
,c
t ck pk p
δ δω= = , (3)
where c is a constant of the order of unity. There is a trade-off between the frequency
and time resolutions, small values of 0k provide better time resolution, while using big
0k improves frequency resolution. The commonly adopted value is 0 1k = , and the
limit 0k →∞ corresponds to the Fourier transform. As we shall show below, for our
purpose 0 2k = is more suitable.
Since we deal with finite-length time series (spike trains), evaluation of the wavelet
spectrum (1) will have edge artifacts at the beginning and the end of the time interval.
The cone of influence (COI) is the region in ( , )p z plane where edge effects cannot be
ignored. We define the size of the COI when the wavelet power is dropped by 2e
(Torrence and Compo 1998), which gives 02z k p= .
The spiking output (point process) of a neuron can be represented as a series of δ-
functions at the times when action potentials occur
( ) ( )ii
x t t tδ= −∑ . (4)
Representation (4) allows us to estimate analytically the wavelet-coefficients
2 2 202 ( ) / ( ) / 21
( , ) i ij t z p t z k p
i
W p z e ep
π− − − −= ∑ . (5)
Page 8 of 40

9
Using the wavelet-transform (5) we can perform the time-frequency analysis of
rhythmic components hidden in the spike train. Wavelet-coefficients can be considered
as a parameterized function ( )pW z , where z plays the role of time.
Wavelet power spectrum and coherence
Spectral representation of a spike train can be in general obtained by the Fourier
transform. However, such transformation is known to have difficulties when dealing
with point processes (Brillinger 1978). To overcome some of them in the literature the
use of multi-taper Fourier transform has been advocated (Jarvis and Mitra 2001).
Although the multi-taper transform usually provides a good estimate of the power
spectrum, in the case of periodic spike trains (e.g. in experimental conditions of
periodic stimulation) it may fail to consistently represent the spectral density. The
wavelet transform can be used as an alternative way of the spectral analysis.
The wavelet power spectrum of a spike train can be defined by
2
0
1( , ) ( , )E p z W p z
rkπ= (6)
where r is the neuron mean firing rate. The normalization factor in (6) ensures unit
energy of the “white-noise” or “random” spike train (with equiprobable randomly
distributed inter-spike intervals). Thus for a random spike train the energy is
homogeneously distributed over all inter-spike periods ( ) 1z
E p = . Consequently, we
quantify the power distribution in the train under study in units of the power of the
random spike train with the same mean firing rate.
The global wavelet spectrum can be obtained from (6) by time averaging of the
local (time dependent) spectrum
0
1( ) ( , )d
T
GE p E p z zT
= ∫ , (7)
where T is the time length of the spike train. The global spectrum (7) provides an
unbiased and consistent estimation of the true power spectrum (Percival 1995).
Dealing with two spike trains N and M by analogy with the Fourier cross-spectrum
we can introduce the wavelet cross-spectrum *0( , ) /NM N M N MW p z W W k r rπ= . Then a
normalized measure of association between two spike trains is the wavelet coherence
(Grinsted et al. 2004)
2( ( , ) /
( , )( ( , ) / ) ( ( , ) / )
NMNM
N M
S W p z pC p z
S E p z p S E p z p= , (8)
Page 9 of 40

10
where S is a smoothing operator (see for details: Torrence and Webster 1998;
Grinsted et al. 2004). The coherence definition (8) can eventually give artificially high
values of coherence in the case of infinitesimally small values of the power spectrum of
either or both signals (i.e. when ( *, *) 0E p z ≈ ). To avoid this problem in numerical
calculations we employ thresholding procedure setting to zero the coherence when
either of the power values is below a threshold.
Two linearly independent spike trains have vanishing coherence, whereas
( , ) 1C p z = indicates a perfect linear relationship between the spike trains at the scale
p and localization z . Since we are interested in studying the coherence level (or
functional coupling) between the stimulus events and neural response we focus on the
frequency band corresponding to the stimulus frequency, i.e. on 1f = Hz, which
corresponds to the scale 1p = s. Thus to resolve well the stimulus induced frequency
contents in the neural response with minimal loosing in time resolution we set 0 2k = .
Then from (3) 1/ 2δω ≈ and 2tδ ≈ . Although the wavelet transform uses the time
scale (period) p as a parameter, to address the frequency contents we shall further
use frequency as the parameter formally defined as 1/f p= .
Statistical significance test
Although large amplitude of the coherence usually indicates the presence of a
consistent phase relationship (coupling) between two spike trains in a given time
interval, it is also possible that this may be a random casual variation in spike trains.
Thus one should cross-check statistical significance of the observed coherence.
The statistical significance of the wavelet coherence can be assessed relative to
the null hypotheses that the two spike trains generated by independent stationary
processes with given distribution of inter-spike intervals (ISIs) are not coherent. To
evaluate the significance level we use surrogate data test (Theiler et al. 1992;
Schreiber and Schmitz 2000) with Monte-Carlo simulation to establish 95% confidence
interval. The surrogate spike trains are obtained from the original one by randomizing
phase relations keeping intact other first order characteristics. We shuffle ISIs and
evaluate coherence among the surrogate spike trains. To conclude positively on the
connectivity between the stimulus train and neuronal response their coherence should
be higher than the obtained significance level.
Stimulus frequency band and the power spectrum of ultraslow oscillation of the wavelet
coherence
Page 10 of 40

11
The wavelet coherence allows studying temporal structure and variation of the
functional coupling among stimuli and neural response. To quantify this variation we
average the neural stimulus coherence over scales in a narrow band around the
stimulus frequency. An estimate of the band limits can be obtained from (3):
0 0[(1 / 2 ), (1 / 2 )]f c k c kπ π∈ − + , which for 2c = gives [0.83-1.16] Hz. This frequency
band we shall refer to as the stimulus frequency band. Obtained this way coherence is
a function of time ( )C t , which then is used to evaluate the power spectrum by the
conventional Fourier transform.
Effect of cortical stimulation on the stimulus response coherence
To examine the effect of cortical stimulation on the coherence of the neural
response to the stimulus we average the local coherences over time and the stimulus
frequency band
m mcntr cntr AESC AESCt t
( ) , ( )C C t C C t= = , (9)
where cntr ( )C t and AESC ( )C t are the coherences in the stimulus frequency band in
control and after the SI cortex stimulation conditions, respectively. For convenience we
also introduce the overall mean coherence m m mAESC cntr( ) / 2C C C= + . First we recall that
cntr ( )C t and AESC ( )C t are bounded functions of time, hence the maximal increment
m m mAESC cntrC C Cδ = − depends on the overall mean coherence and cannot exceed the
value m2(1 )C− . Thus the higher the overall mean coherence is, the lower the
coherence increment can be. Then we guess a linear model
m m(1 )C Cδ α= − , (10)
where α is a constant to be identified from the data.
Then for a given value of the wavelet coherence, using (10) we can evaluate the
expectation of the absolute value of the coherence increment. If the observed
increment is much smaller than the expectation we can doubt on its significance (i.e.
No-effect). To decide positively on the presence of an effect on the stimulus coherence
provoked by the SI cortex stimulation we require that the experimentally observed
increment mCδ is at least higher than 50% of the expectation value, i.e.
m m0.5 (1 )C Cδ α≥ − . Then we have coherence increase or I–effect for positive mCδ
and decrease or D–effect for negative values.
Page 11 of 40

12
3. Results
The analyzed data set consisted of 29 extracellular recordings (spike trains) of
unitary neural activity from the gracilis nucleus measured at three different epochs: (i)
spontaneous firing; and responses to periodical (1 Hz rate) RF stimulation in (ii) control
conditions and (iii) after electrical stimulation of the SI cortex. When appropriate the
latter stimulation epoch we shall abbreviate as AESC. All neurons were identified as
projecting to the thalamus because they were antidromically activated by medial
lemniscus stimulation. The criteria for the antidromic identification were fixed latency
with the mean 2.0±0.08 ms (range [1.2-2.8] ms), and ability to follow fast (over 100 Hz)
stimuli. The analyzed neurons showed a low spontaneous activity with the mean
1.1±0.4 spikes/s (range [0-10] spikes/s) whose pattern coincided with the firing
characteristics of projecting neurons previously described (Panetsos et al. 1997; Nuñez
et al. 2000). Also, selected neurons had a RF that overlapped (>50%) the stimulated
cortical area (matching condition; Malmierca and Nuñez 1998, 2004).
3.1 Example of the wavelet analysis of a neural spike train
First let us illustrate the wavelet analysis of a representative neural spike train.
Figure 1A shows the spike train during three different experimental epochs (for
illustration purpose we selected a neuron with a considerable spontaneous activity). In
spontaneous conditions the neuron exhibits irregular spiking pattern with a light peak at
70 ms manifested in the autocorrelation histogram (ACH, Fig. 1B, left panel).
Mechanical stimulation in the control conditions elicited a well pronounced neuron
response with 25 ms peak latency followed by a weakly rhythmic firing with 120 ms
period (Fig. 1B, middle panel). Electrical stimulation of the SI cortex facilitated the
neural response to the tactile stimulation. The response in the PSTH became more
prominent (Fig. 1B right panel). However, neither the response latency, nor mean firing
rate (21.1 versus 23.7 spike/s) varied much in respect to the control conditions.
Furthermore, the weak oscillatory behavior observed in the tail of the PSTH in control
conditions disappeared.
Wavelet power spectrum and coherence
The wavelet power spectrum (Fig. 1C, left panel) confirms irregularity of the
spontaneous firing observed in the ACH. There are many oscillatory rhythms localized
both in time and frequency domains with essentially erratic distribution. Thus spiking
activity has no well defined dominant periodic activity (although there is a feeble and
Page 12 of 40

13
not persistent in time power peak at 14 Hz). The distribution of the power in the control
conditions (Fig. 1C, middle panel) shows a consistent peak in the stimulus frequency
band (from 0.83 to 1.16 Hz, between two dotted horizontal lines). This peak indicates
the presence of the stimulus evoked rhythm in the neural firing. We also note that the
peak amplitude (power) is not persistent in time but instead exhibits a low frequency
(below 0.3 Hz) oscillation. Such oscillation of the spectral power suggests that the
neural response to the same tactile stimulation is not stable (identical) throughout time
but instead has some variability, i.e. the neuron fires essentially different number of
spikes with different inter-spike intervals to the same stimulus events along the
stimulation epoch. We also observe some increase of the spectral power around 8 Hz
consistent with the oscillations (120 ms period) observed in the corresponding PSTH
(Fig. 1B, middle panel). In accordance with the stimulus response facilitation observed
in the PSTH after the electrical cortex stimulation, the power peak at the stimulus
frequency band became even more pronounced (Fig. 1C, right panel). Now we have a
continuous practically black island going through the whole stimulation epoch in the
stimulus frequency band. Notice, however, that the ultra-low frequency oscillation of the
power is weaker, but still exists. Besides, there is a strong increase of the power of
harmonics of the 1 Hz rhythm and, in average, a higher presence of oscillations in the
domain of higher frequencies.
To quantify how coherent (reliable) the neural response to the stimulus events is,
we evaluated the wavelet coherence of the neural spike train and stimulus events. To
decide on the statistical significance of the found coherence level, i.e. on the presence
of functional associations (coupling) between the stimulus and neural response, we
performed a surrogate data test by randomizing phase relationships between two
signals. Figure 1D shows statistical significance curve (p-value 0.05) for the frequency
range observed in the neural spike train. Coherence above the curve is deemed
statistically significant, although if the area of the significant islands is small enough
(about 5% or less) then the conclusion on the coherent response should be made
carefully.
Figure 1E illustrates the wavelet coherence of the tactile stimulus events and
evoked neural response. Since the tactile stimulation is periodic (has only one
frequency), when speaking about the response coherence we shall refer to the
stimulus frequency band only (delimited by dotted lines in Fig. 1E). During the control
stimulation epoch we observe three islands of significant coherence in the stimulus
frequency band (Fig. 1E, left panel). This evidences the presence of stimulus-response
association previously observed in the corresponding PSTH. However, we also find
that the association or stimulus-response coupling is not constant but an oscillatory
Page 13 of 40

14
function of time. Notice also that the neural power spectrum in the corresponding
frequency band was not very strong (Fig. 1C, middle panel); however the coherence
clearly reveals the functional coupling between the neural firing dynamics and stimulus
events. The stimulus coherence of the neural response becomes stronger after
electrical stimulation of the somatosensory cortex (Fig. 1E, right panel). As we earlier
observed in the wavelet power spectra (Fig. 1C, middle and right panels), the stimulus
coherence also suffers from ultra-low frequency oscillations.
Thus for the given neuron we observed two phenomena: i) the strength of the
functional stimulus–neural response coupling is amplified by the electrical stimulation of
the SI cortex, and ii) the coupling strength is a dynamical quantity slowly oscillating in
time that can temporarily fall down below the significant level. The latter means that
stimulus–response association may be temporarily lost for a single neuron.
Global wavelet spectrum vs Fourier power spectrum and alpha frequency band
To illustrate possible pitfalls in the interpretation of the Fourier power spectrum, first
we evaluated the power spectrum through the multi-taper Fourier transform of the
neural spike trains shown in Fig. 1A. In accordance with the irregularity of firings in
spontaneous conditions the Fourier spectrum (Fig. 2A) is essentially flat with a peak at
14 Hz corresponding to the earlier observed periodicity in the ACH (Fig. 1B, left panel).
However, for the control stimulation epoch the overall spectral distribution is quit similar
to that of the spontaneous spectrum, and it lacks a peak at 1 Hz corresponding to the
neuron response at the stimulus frequency. Inversely, due to excessive periodicity of
the neural response, after the electrical stimulation of the SI cortex we observe an
unreasonably wide peak around 1 Hz followed by many strong harmonics
contaminating the high frequency range. Thus the Fourier transform of a spike train
may fail to consistently represent its spectral density.
Then we used the wavelet transform as an alternative way of the spectral analysis.
Figure 2B shows the global wavelet power spectra of the neuron firing counterpart to
the Fourier spectra. The wavelet spectra are much better consistent with the oscillatory
rhythms suggested by the previous analysis of spike trains by the ACH and PSTHs.
According to the normalization used in (6) the value of the power density equal to unity
corresponds to the power spectrum of a spike train with equiprobable randomly
distributed inter-spike intervals, which we shortly refer to as random spike train. Then
the spectral power above (or below) unity indicates the presence (or absence) of the
corresponding rhythm in the spike train with statistical power higher than just casual
ratio.
Page 14 of 40

15
During spontaneous activity the power spectrum of the neuron firing only slightly
deviates from the spectrum of the random train across all frequency bands (Fig. 2B,
dotted line). In agreement with the weak rhythm observed in the ACH (Fig. 1B, left
panel), the global wavelet spectrum has also a small peak at 14 Hz. We also detect
peaks at about 0.7 and 1.9 Hz. Going back to the complete wavelet spectrum (Fig. 1C,
left panel) we find that the latter peaks are due to a strong episodic events localized
between 4 and 7 s and between 10 and 16 s from the epoch beginning, respectively.
Thus spontaneous firing can be characterized as random showing no strong persistent
specific frequencies. Under the control tactile stimulation we observe a considerable
peak in the stimulus frequency band (Fig. 2B, solid line). Note that the peak is quite
narrow and has a harmonic at 2 Hz. Stimulation of the SI cortex boosts the amplitude
of the power peak in the stimulus frequency band and we also observe an important
enhancement of the power in the band ranged from about 5 and 15 Hz. For the higher
frequencies (> 15 Hz) there is no significant deviation of the power density from 1,
whereas for the range below 5 Hz the harmonics of the stimulus frequency rhythm are
manifested in the power spectrum. Accordingly we define the second frequency band
of interest [5-15] Hz that we shall shortly refer to as alpha frequency band. Thus, at the
single neuron level used in this study, we found that the frequency band corresponding
to the evoked neural spiking activity is localized in the stimulus and alpha frequency
bands.
3.2 Spectral changes in the neural response provoked by electrical stimulation of
the SI cortex
In order to assess statistical properties of the observed changes in the spectral
power of the neural firing we compared the global wavelet power spectra in
spontaneous conditions and under tactile stimulation in the control and after the SI
cortex stimulation conditions. Figure 3 summarizes our results.
The overall mean power in spontaneous conditions corresponds to the power of the
random spike train both in the stimulus and alpha frequency bands (Fig. 3A and 3B,
spontan.). This confirms that the firing pattern of projecting neurons in gracilis nucleus
is essentially random. Stimulation of the neuron receptive fields boosts the mean power
concentrated both in the alpha and in the stimulus frequency bands (Fig. 3A and 3B
control). Though, the increase in the stimulus band is much stronger (7 versus 2.5
times). Electrical stimulation of the SI cortex raises even more the power concentrated
in these frequency bands (Fig. 3A and 3B, AESC). However, in average the latter
Page 15 of 40

16
enhancement is not so drastic. The effect of the electrical stimulation lasted between
15 and 30 min, and then the neurons recovered their activity.
A balanced one way analysis of variance (ANOVA) ensures that the mean spectral
powers in three different epochs are significantly different with α-values 2.5e-5 for the
stimulus frequency band and 2.7e-5 for the alpha band. Multiple comparison test
shows that the values of the power during tactile stimulation in the control and after SI
cortex stimulation conditions are significantly different from the power of spontaneous
firing in both frequency bands, and they are statistically indistinguishable between each
other.
Although the mean spectral power across both frequency bands does not
significantly differ between tactile stimulations in control conditions and after electrical
stimulation of the SI cortex (Fig. 3A and 3B) in the majority of experiments we observed
an increase of the power provoked by the cortex stimulation. This result agrees with the
previously reported facilitation of the stimulus response provoked by the SI cortex
stimulation (Malmierca and Nuñez 1998, 2004; Canedo and Aguilar 2000; Aguilar et al.
2003). To quantify the percentage of the neurons exhibiting different types of the effect
of the stimulation of the SI cortex we evaluated the number of increases of the spectral
power or I–effects, the number of No–effects (when the difference was negligible), and
the number of decrease or D–effects. To decide on the type of the effect we used the
relative increment of the power in the certain frequency band
AESC cntr
AESC cntr( ) / 2
E EE
E E
−∆ =
+(11)
where cntrE and AESCE are the spectral power in the control and after the SI cortex
stimulation conditions. If the absolute increment was below 5% we assigned No–effect,
otherwise according to the sign of the increment we decided on I or D effect.
Figure 3C shows that indeed after stimulation of the SI cortex in the majority of
cases (66% and 69% for the stimulus and alpha frequency bands, respectively) the
power of firing in the both frequency bands increases, i.e. we have I–effect of the
cortex stimulation. In 17% of cases for the stimulus band and 14% for the alpha band
the cortex stimulation had no effect on the spectral characteristics of the neural
response. Finally, in 17% for the both bands the spectral effect of the cortex stimulation
was negative, i.e. the power diminished.
Thus tactile stimulation leads to a significant enhancement of the power of the
neuron firing both in the alpha and in the stimulus frequency bands. Besides, electrical
stimulation of the SI cortex amplifies the spectral power in these bands for about two
third of the neurons in gracilis nucleus. We also conclude that facilitation of the neural
Page 16 of 40

17
response by the corticofugal pathway is not only in an increase of the spikes elicited by
the stimulus but also in the ordering of the response pattern.
3.3 Effect of the electrical stimulation of the SI cortex on the stimulus coherence
Let us recall that coherence is a normalized measure of the cross-spectrum of two
signals, therefore it has a sense in the frequency bands presented both in the neural
spike train and in the stimulus. The latter has the fixed frequency of 1 Hz (up to small
variations due to experimental setup). Accordingly, we study the wavelet coherence of
the neural response to tactile stimulation in the stimulus frequency band only, whose
limits were set to [0.83-1.16] Hz.
To study the effect of the cortex stimulation on the neural response coherence in
the gracilis nucleus we evaluate the mean stimulus coherences in the control mcntrC and
after electrical stimulation of the SI cortex mAESCC conditions. Figure 4A shows the
absolute value of the coherence increment m m mAESC cntrC C Cδ = − as a function of the
mean overall coherence m m mAESC cntr( ) / 2C C C= + for the experimental data set. Not
surprisingly the plot shows a strong linear tendency of the coherence increment to be
smaller for higher values of the overall mean coherence. Fitting the model (10) to the
data in the least squares sense we obtain 0.41α = (solid straight line in Fig. 4A). Thus
for a given value of the wavelet coherence, using (10) we can evaluate the expectation
of the absolute value of the coherence increment and define the effect (No, I, or D)
provoked by the cortical stimulation (Fig. 4A).
Figure 4B shows percentage of different types of effects of the electrical stimulation
of the SI cortex on the tactile stimulus coherence of neuron firing in gracile projecting
neurons. In the majority of the cases (59%) electrical stimulation of the SI cortex
facilitates more reliable (higher coherent) neural response to the tactile stimulus. In
24% and in 17% of cases we had no effect or decrease of the coherence, respectively.
The observed relative increment of the coherence value for I and D effects was about
the same: 13% and 15%, respectively (Fig. 4C).
We note that the positive increment of the coherence (reliability of the neuron
response to tactile stimulation) was observed in a bit lower number of cases than the
increment of the power in the stimulus frequency band (59% in Figs. 4B vs 66% in Fig.
3C), which confirms the statement made above that an increase in the spectral power
is not necessarily accompanied by an increase of the coherence. Moreover, this
Page 17 of 40

18
suggests possible subtle changes occurring in the stimulus response pattern due to the
corticofugal pathway instead of simple increase of the firing rate.
To crosscheck whether the increment of the wavelet stimulus coherence correlates
with conventional characteristics of the neural activity we plotted increment of the mean
firing rate AESC cntrFR FR FRδ = − and increment of the amplitude of the response peak
in the PSTH PSTH AESC cntrA A Aδ = − versus mCδ (Fig. 5). In these plots a data point
belonging to quadrants I or III corresponds to a positive correlation between the
corresponding measures, i.e. an increase or decrease in coherence is associated with
analogous effect in the other characteristic, whereas quadrants II and IV establish the
contrary effect or anti-correlation. According to the above described findings we
expected that an enhancement of the reliability of the neural response to tactile
stimulation (i.e. m 0Cδ > ) should not be necessarily reflected in the neuron firing rate,
but it is reasonable to observe a better peaking of the PSTH and consequently
PSTH 0Aδ > .
Indeed, Fig. 5A shows that the data points in the case of the mean firing rate are
distributed quite arbitrary over the plane. The linear fit of the data confirms this. The
straight line and its 95% confidence interval are essentially horizontal showing no
significant correlation between the measures. A different picture is observed for the
increment of the amplitude of the PSTH peak (Fig. 5B). The best fit line and its 95%
confidence interval have a notable positive slope. Hence, as it was expected, we have
a positive correlation of the changes provoked by the electrical stimulation of the SI
cortex between the coherence and the amplitude of the PSTH peak. However we note
that an enhancement (or reduction) of the stimulus coherence is not always
accompanied by the increase (or decrease) of the PSTH amplitude. This means that
for a considerable number of experiments the PSTH measure fails to predict the effect
of changes in the coherence of the neural response to the tactile stimulus.
3.4 Ultra-low frequency oscillation of the stimulus response coherence
In Fig. 1E we qualitatively observed that the tactile stimulus coherence slowly
oscillates in time both for the control experimental conditions and after electrical
stimulation of the SI cortex. Let us now quantify these oscillations and study their
possible functional role.
Figure 6A shows two stripes cut out of the corresponding coherence functions in
the stimulus frequency band shown in Fig. 1E between two horizontal dotted lines. To
examine mean coherence and its modulation in time we average the local coherence
Page 18 of 40

19
over the stimulus frequency band. The obtained time series for the control cntr ( )C t and
after the SI cortex stimulation AESC ( )C t conditions give a measure of the reliability of
the neuron response to stimulation events along the corresponding stimulation epoch
(Fig. 6A, bottom panel). At the beginning of the stimulation epochs (up to about 20 s)
the stimulus response coherence is higher after the electrical cortex stimulation than in
the control conditions. Then both characteristics exhibit some decay (i.e. the neuron
firing becomes less stimulus coherent) and no big difference between the coherence
values is observed. Over the whole stimulation epochs we observed slow oscillation of
relatively high amplitude. We note that the period of slow oscillation is much lower than
the wavelet temporal resolution (about 10 to 15 s vs 2 s), which ensures the correct
identification of the coherence oscillatory behavior.
The observed oscillation may have a functional role. Indeed, for the control
stimulation epoch the coherence temporarily falls below the significance level (Fig. 1E,
left panel and Fig. 6A, bottom panel). Thus we can define time windows (segments)
with coherence above or below the level of statistical significance. In Fig. 6A these
windows are shown by white and gray boxes, so that the total length of the significant
and not significant segments is the same. Obviously, in windows with high coherence
the neuron should exhibit strong functional stimulus-response relationship. However,
when the stimulus coherence is not significant this functional association may be lost.
The “raw” PSTH (Fig. 1B, middle panel) does not evidence this phenomenon.
However, splitting the spike train into two parts according to the significance of the
observed coherence we indeed observe essential difference in the PSTHs (Fig. 6B). In
regions with significant coherence, the neuron exhibits a well pronounced stimulus
response (Fig. 6B, left panel), whereas its firing becomes practically stimulus-
uncorrelated in the time windows of not-significant coherence (Fig. 6B, right panel). We
can interpret this behavior as a temporal loss of the functional connectivity between the
tactile stimulus and the neuron. We also note that electrical stimulation of the SI cortex
increases the stimulus response coherence and it stays above the level of significance
practically the whole stimulation epoch and only after about 27 s the coherence
becomes non-significant. In such an “alerted” state the neuron maintains functional
coupling to the sensory stimulus sending coherent spikes to the thalamus.
Figure 6C shows Fourier power spectral densities of the ultra-low frequency
oscillation of the stimulus coherence in the control and after cortex stimulation
conditions. In the first case the spectrum has a peak at 0.09 Hz, whereas after the SI
cortex stimulation the peak shifts to lower frequency 0.06 Hz and becomes smaller.
Page 19 of 40

20
Figure 7 shows the mean frequency and power of the coherence oscillations
averaged over the neuron population during tactile stimulation in the control conditions
and after the electrical cortex stimulation. The mean frequency in control conditions
was 0.065 Hz, which is a bit lower than the oscillation frequency after the cortex
stimulation 0.068 Hz. However, there is no statistically confirmed significant difference
between the two means. Similarly, the mean oscillation power is slightly (but not
significantly) higher in the case of tactile stimulation preceded by electrical stimulation
of the SI cortex. Thus the mean frequency and amplitude of the ultra-low frequency
oscillations averaged over the neural population are not affected by the electrical
stimulation of the SI cortex.
4. Discussion
While neurons can communicate using the time averaged firing rate (Shadlen and
Newsome 1998), precise and reproducible spike timing is also frequently observed in
the central nervous system, increasing the likelihood that stimulus elicited firing
patterns encode sensory information (Abeles et al. 1993; Mainen and Sejnowski 1995;
Bair and Koch 1996). The latter possibility, if applicable, should manifest itself in the
somatosensory system as a repeated response pattern of projecting gracile neurons
coherent with the stimulus events. Then their synchronized stimulus-driven discharges
will induce EPSPs within a narrow temporal window in thalamic cells, increasing
chances of generating spikes to be further transmitted to the somatosensory (SI) cortex
(Nicolelis et al, 1995; Steinmetz et al, 2000). For this reason we studied the stimulus
response coherence of the firing patterns in gracilis nucleus and its temporal evolution
over stimulation epochs. This analysis has revealed that the coherence enhancement
may be more relevant in sensory processing than an increase in the number of spikes
elicited by the tactile stimulus. On the other hand the corticofugal feedback projecting
from the SI cortex to the gracilis nucleus closes the sensory information processing
loop. It has been hypothesized that oscillations in the SI cortex could facilitate an
association between functionally related cells (Murthy and Fetz 1992, 1996; Roy and
Alloway 1999). This “association hypothesis” may be also applied to the gracilis
nucleus. Indeed, sensory inputs may be integrated by oscillatory neuronal networks
composed of gracile neurons which are spatially distributed, but share common
receptive fields. Their activity may be modulated and enhanced through the
corticofugal feedback by the SI cortex. Thus, the rhythmic synchronization may
increase the contrast between the evoked EPSPs from rhythmically entrained neurons
and the synaptic outputs from non-coherent neurons. A selective facilitating effect of
the corticofugal feedback has been previously described in the somatosensory system
Page 20 of 40

21
(Malmierca and Nuñez 1998, 2004; Canedo and Aguilar 2000) and in other sensory
pathways (see e.g. Sillito et al. 1994; Yan and Suga 1996; Jen et al. 2002). The
facilitating effect is due to the activation of NMDA receptors in gracile neurons (Nuñez
and Buño, 2001; Malmierca and Nuñez 2004). This cortical selective feedback, called
“egocentric selection” by Jen et al. (2002), may play a pivotal role in gating the sensory
information that reaches the thalamus and then the cortex. To validate and develop the
association hypothesis we have studied the modulation of the tactile stimulus
coherence in gracile neurons by electrical activation of the SI cortex. Our results show
that activation of the corticofugal pathway in a majority (about 60%) of the cases
increases rhythmic activities synchronized with the sensory stimulus.
The achieved results have been made possible by employing wavelet coherence
for spike train analysis. Although some rough description of the somatosensory loop
could be obtained on the basis of analysis of PSTHs, methods from the rapidly growing
fields of nonlinear dynamics and complex systems theory can provide new insights on
the underlying complex biological processes (Pavlov et al. 2006). In this line we have
shown how the wavelet approach for analysis of non-stationary signals can be adapted
for the investigation of spike trains and can be used for quantification of the functional
stimulus-neural response coupling. The coupling between two signals (i.e. stimulus and
neural response) can be detected by means of the spectral coherence. However, its
Fourier transform origin limits the practical application to the neural spike trains. Here
the wavelet coherence is better suited and can be directly evaluated from the spike
trains. Besides providing valuable temporal structure of the functional relationships it
deals better with point processes (spike trains). For the optimal use of the wavelet
coherence it is desirable: i) to tune the Morlet parameter according to the problem, and
ii) to test coherence significance. For the constant frequency stimulus (1 Hz) we have
found that 0 2k = allows better resolve stimulus induced firing rhythm. The coherence
significance affects our (statistical) belief to which extent the observed functional
associations are not due to a chance. The latter can be tested by Monte-Carlo
simulation with surrogate spike trains obtained by shuffling inter-spike intervals.
By analysis of the wavelet power spectra we have shown that the spontaneous
firing pattern (when it exists) of projecting neurons in the gracilis nucleus is essentially
random and it is not affected by the electrical stimulation of the SI cortex. The latter
means that the corticofugal stimulation does not increase the overall neural excitability,
but specifically facilitates synaptic sensory responses. Tactile stimulation of the neuron
receptive field, as it was expected, strongly increases the spectral power in the
stimulus frequency band. Our results also show an enhancement of the power in the
Page 21 of 40
22
alpha frequency band (5-15 Hz), in agreement with the previously reported data
(Panetsos et al. 1998; Nuñez et al. 2000). Although at the single neuron level we have
found changes in the alpha and stimulus frequency bands only, other frequency bands
(e.g. gamma) may be present at the neural population (small networks) level. We have
further demonstrated that electrical stimulation of the SI cortex increases the power for
about 66% and 69% of the projecting neurons in the stimulus and alpha frequency
bands, respectively. However, the mean increase is not significant. This argues that the
observed facilitation of the neural response by the corticofugal pathway is not extensive
but, at least in part, may be mediated through an appropriate ordering of the stimulus
evoked firing pattern in the gracilis nucleus.
To verify this hypothesis we addressed the question of how coherent the neural
response to the tactile stimulus is. Although the spectral power of the neural spike train
in the stimulus frequency band can be high enough, this does not ensure a high
coherence of the neural response to the tactile stimulation. The level of the coherence
strongly depends on the repeatability of the stimulus elicited firing pattern, whereas due
to the normalization, the signal power in the given frequency band is less important.
We also have found no significant correlation between the increment of the firing rate
and coherence, but we have shown that there is a positive correlation of the changes
provoked by the electrical cortex stimulation in the coherence and the amplitude of the
stimulus response peak in the PSTH. However we note that an enhancement (or
reduction) of the stimulus coherence is not always accompanied by an increase (or
decrease) of the PSTH amplitude. This means that the peak amplitude is not a reliable
measure for evaluating on the coherence of the neural response to the tactile stimulus.
We have shown that an increment of the stimulus coherence provoked by electrical
stimulation of the SI cortex is observed in about 59% of gracile projecting neurons with
overlapping receptive fields (which is 7% lower than the power increase), whereas in
17% we observed a decrease of the stimulus response coherence. The latter effect
may be due to simultaneous activation of cortical fibers from overlapped and no-
overlapped receptive fields. This suggests that selective synchronization of stimulus-
driven discharges may enhance the contrast between synaptic inputs from the RF and
from other synaptic inputs. Therefore, the SI cortex may contribute to the fine focusing
of sensory responses in the gracile neurons, enhancing the activity of functionally
related neurons and filtering out the irrelevant sensory inputs from the periphery.
The possibility of studying the temporal structure of the stimulus response
coherence allowed us to describe ultraslow fluctuations in tactile responses of single
projecting neurons. We note that such oscillations are not directly observable in the
Fourier spectrum neither in the PSTH of the neural response. Instead, they represent
Page 22 of 40

23
slow modulation of the coherence (or reliability) of the neural response to the tactile
stimulation over a long time scale, i.e. the neuron fires essentially a different number of
spikes with different inter-spike intervals to the same stimulus events along the
stimulation epoch. Thus besides the observation of a facilitating of the tactile stimulus–
neural response functional coupling by the electrical stimulation of the SI cortex, we
have provided evidence that the functional coupling between the sensory stimulus input
and neural response oscillates slowly in time. During this oscillation, the stimulus
coherence can temporarily fall down below the significant level. The latter means that
the stimulus–response association may be temporarily lost for a single neuron. This
phenomenon argues that the information processing in gracilis nucleus occurs on the
network level, which may be “energetically” beneficial for the system. The mean
frequency of the observed coherence oscillation was about 0.07 Hz. Oscillations in the
same frequency band 0.02 to 0.2 Hz have been reported in studies of human EEG
(Vanhatalo et al. 2004). The authors showed that large-scale ultraslow oscillations in
widespread cortical regions may represent a cyclic modulation of cortical gross
excitability. This ultraslow oscillation of cortical activity might be transferred to the
gracilis nucleus through the corticofugal projections, modulating tactile responses.
Page 23 of 40

24
Acknowledgements
The authors are grateful to Dr. A. Pavlov for enlightening discussions. This research
has been sponsored by the Santander-Complutense grant PR41/06-15058, by
BFU2005-07486, FIS2007-65173, and by the Spanish Ministry of Education and
Science under a Ramon y Cajal grant.
Page 24 of 40

25
References
Abeles M, Bergman H, Margalit E, Vaadia E. Spatiotemporal firing patterns in the
frontal cortex of behaving monkeys. J Neurophysiol 70: 1629-1638, 1993.
Aguilar J, Rivadulla C, Soto C, Canedo A. New corticocuneate cellular mechanisms
underlying the modulation of cutaneous ascending transmission in anesthetized
cats. J Neurophysiol 89: 3328-39, 2003.
Alegre M, Labarga A, Gurtubay I, Iriarte J, Malanda A, Artieda J. Movementrelated
changes in cortical oscillatory activity in ballistic, sustained and negative
movements. Exp Brain Res 148: 17–25, 2003.
Baccalá L, Sameshima K. Partial directed coherence: a new concept in neural structure
determination. Biol Cybern 84: 463-474, 2001.
Bair W, Koch C. Temporal precision of spike trains in extrastriate cortex of the
behaving macaque monkey. Neural Comput 8: 1185-202, 1996.
Bayram M, Baraniuk R. Multiple window time frequency analysis. Proc IEEE-SP Int
Symp Time-Frequency and Time-scale analysis. 173-176, 1996.
Brillinger DR. Developments in statistics: Comparative aspects of the study of ordinary
time series and of point processes, Orlando, FL: Academic Press, 1978, p. 33–129.
Canedo A, Aguilar J. Spatial and cortical influences exerted on cuneothalamic and
thalamocortical neurons of the cat. Eur J Neurosci 12: 2515-33, 2000.
Castellanos NP, Makarov VA. Recovering EEG brain signals: Artifact suppression with
wavelet enhanced independent component analysis. J Neurosci Meth 158: 300–
312, 2006.
Dahlhaus R, Eichler M, Sandkühler J. Identification of synaptic connections in neural
ensembles by graphical models. J Neurosci Meth 77: 93-107, 1997.
DeBiasi S, Vitellaro-Zucarello L, Bernardi P, Valtschanoff JG, Weinberg R.
Ultrastructural and immunocytochemical characterization of terminals of
postsynaptic ascending dorsal column fibers in the rat cuneate nucleus. J Comp
Neurol 353: 109-118, 1994.
Grinsted A, Moore JC, Jevrejeva S. Application of the cross wavelet transform and
wavelet coherence to geophysical time series. Nonlinear Processes Geophys, 11:
561–566, 2004.
Goelz H, Jones R, Bones P. Wavelet analysis of transient biomedical signals and its
application to detection of epileptiform activity in the EEG. Clin Electroenc 31:181–
191, 2000.
Jabbur SJ, Towe AL. Analysis of the antidromic cortical response following stimulation
at the medullary pyramids. J Physiol (London) 155: 148-60, 1961
Page 25 of 40

26
Jarvis MR, Mitra PP. Sampling Properties of the Spectrum and Coherency of
Sequences of Action Potentials. Neural Comput 13: 717–749, 2001.
Jen PHS, Zhou X, Zhang J, Sun X. Brief and short-term corticofugal modulation of
acoustic signal processing in the bat midbrain. Hear Res 168: 196-207, 2002
Klein A, Sauer T, Jedynak A, Skrandies W. Conventional and wavelet coherence
applied to sensory–evoked electrical brain activity. IEEE Trans. Biomed. Engineer.
53: 266-272, 2006.
Korzeniewska A, Manczak M, Kaminski M, Blinowska K, Kasicki S. Determination of
information flow direction among brain structures by a modified directed transfer
function (dDTF) method. J Neurosci Meth 125: 195 – 207, 2003.
Kuypers HG, Tuerk JD. The distribution of the cortical fibres within the nuclei cuneatus
and gracilis in the cat. J Anat 98:143-62, 1964.
Lachaux JP, Lutz A, Rudrauf D, Cosmelli D, Le Van Quyen M, Martinerie J, Varela FJ.
Estimating the time-course of coherence between single-trial brain signals: an
introduction to wavelet coherence. Neurophysiol Clin 32: 157-74, 2002.
Le Van Quyen M, Foucher J, Lachaux JP, Rodriguez E, Lutz A, Martinerie J, Varela FJ.
Comparison of Hilbert transform and wavelet methods for the analysis of neuronal
synchrony. J Neurosci. Meth 111: 83–98, 2001.
Li X, Yao X, Fox J, Jefferys JG. Interaction dynamics of neuronal oscillations analysed
using wavelet transforms. J Neurosci Meth 160: 178–185, 2007.
Lovett EG, Ropella KM. Time-frequency coherence analysis of atrial fibrillation
termination during procainamide administration. Ann Biomed Eng, 25: 975-984,
1997.
Lue JH, Jiang-Shieh YF, Shieh JY, Wen CY. The synaptic interrelationships between
primary afferent terminals, cuneothalamic relay neurons and GABA-
immunoreactive boutons in the rat cuneate nucleus. Neurosci Res 24: 363-371,
1996.
Mainen ZF, Sejnowski TJ. Reliability of spike timing in neocortical neurons. Science.
268: 1503-1506, 1995.
Makinen V, May P, Tiitinen H. Spectral characterization of ongoin and auditory event-
related brain process. Neurol Clin Neurophysiol 3:104, 2004.
Mallat S. A Wavelet Tour of Signal Processing. New York: Academic, 1999.
Malmierca E, Nuñez A. Corticofugal action on somatosensory response properties of
rat nucleus gracilis cells. Brain Res 810: 172-180, 1998.
Malmierca E, Nuñez A. Primary somatosensory cortex modulation of tactile responses
in nucleus gracilis cells of rats. Eur J Neurosci 19: 1572-1580, 2004.
Page 26 of 40

27
Mormann F, Fell J, Axmancher N, Weber B, Lehnertz K, Elger C. Phase/amplitude
reset and theta-gamma interaction in the human medial temporal lobe during a
continous word recognition memory task. Hippocampus 15: 890–900, 2005.
Murata A. An attempt to evaluate mental workload using wavelet transform of EEG.
Hum Factors 47: 498–508, 2005.
Murthy VN, Fetz EE. Coherent 25- to 35-Hz oscillations in the sensorimotor cortex of
awake behaving monkeys. Proc Nat Acad Sci USA 89: 5670-5674, 1992.
Murthy VN, Fetz EE. Synchronization of neurons during local field potential oscillations
in sensorimotor cortex of awake monkeys. J Neurophysiol 76: 3968-3982, 1996.
Nicolelis MAL, Baccala LA, Lin RCS, Cahpin JK. Sensorimotor encoding by
synchronous neural ensembles activity at multiple levels of the somatosensory
system. Science 268: 1353-1358, 1995.
Nuñez A, Buño W. In vitro electrophysiological properties of rat dorsal column nuclei
neurons. Eur J Neurosci 11: 1865-1876, 1999.
Nuñez A, Buño W. Properties and plasticity of synaptic inputs to rat dorsal column
neurones recorded in vitro. J. Physiol (London) 535: 483-495, 2001.
Nuñez A, Panetsos F, Avendaño C. Rhythmic neuronal interactions and
synchronization in the rat dorsal column nuclei. Neuroscience 100: 599-609, 2000.
Nuñez A, Buño W. Properties and plasticity of synaptic inputs to rat dorsal column
neurons recorded in vitro. J Physiol (London) 535: 483-95, 2001.
Panetsos F, Núñez A, Avendaño C. Electrophysiological effects of temporary
differentiation on two characterized cell types in the nucleus gracilis of the rat.
Europ J Neurosci 9: 563-572, 1997.
Panetsos F, Núñez A, Avendaño C. Sensory information processing in the dorsal
column nuclei by neuronal oscillators. Neuroscience 84: 635-639, 1998.
Pavlov AN, Makarov VA, Mosekilde E, Sosnovtseva OV. Application of wavelet-based
tools to study the dynamics of biological processes”, Briefings Bioinformatics 7:
375-389, 2006.
Pavlov AN, Tupitsyn AN, Makarov VA, Panetsos F, Moreno A, Garcia-Gonzalez V,
Sanchez-Jimenez A. Tactile information processing in the trigeminal complex of the
rat, SPIE 2007.
Percival DP. On estimation of the wavelet variance. Biometrika 82: 619–631, 1995.
Perkel DH, Gerstein GL, Moore GP. Neuronal spike trains and stochastic point
processes. II. Simultaneous spike trains. Biophysical J 7: 419–440, 1967.
Quiroga R, Garcia H. Single-trial event-related potentials with wavelet denoising. Clin
Neurophysiol 114: 376–390, 2003.
Page 27 of 40

28
Roy S, Alloway KD. Synchronization of local neural networks in the somatosensory
cortex: a comparison of stationary and moving stimuli. J Neurophysiol 81: 999-
1013, 1999.
Rustioni A, Weinberg RJ. The somatosensory system. In: Björklund A, Hökfelt T,
Swanson LW (eds). Handbook of chemical neuroanatomy. Elsevier, Amsterdan, pp
219-221.
Schiff S, Aldroubi A, Unser M, Sato S. Fast wavelet transformation of EEG.
Electroenceph Clin Neurophysiol 91:442–455, 1994.
Schreiber JV, Schmitz A. Surrogate time series. Physica D 142: 646-652, 2000.
Shadlen MN, Newsome WT. The variable discharge of cortical neurons: implications
for connectivity, computation, and information coding. J Neurosci 18: 3870-3896,
1998.
Sillito AM, Jones HE, Gerstein GL, West DC. Feature-linked synchronization of
thalamic relay cell firing induced by feedback from the visual cortex. Nature 369:
479-482, 1994.
Steinmetz PN, Roy A, Fitzgerald PJ, Hsiao SS, Johnson KO, Neibur E. Attention
modulates synchronized neuronal firing in primate somatosensory cortex. Nature
404: 187-190, 2000.
Theiler J, Eubank S, Longtin A, Galdrikian B, Farmer D. Testing for nonlinearity in time
series: the method of surrogate data. Physica D 58: 77–94, 1992.
Torrence C, Compo GP. A Practical Guide to Wavelet Analysis. Bulletin American
Meteorol Soc 79: 61-78, 1998.
Torrence C, Webster PJ. The annual cycle of persistence in the El niño – Southern
oscillation. Quart. J Ray Meteor Soc 124: 1985-2004, 1998.
Valverde F. The pyramidal tract in rodents. A study of its relations with the posterior
column nuclei, dorsolateral reticular formation of the medulla, and cervical spinal
cord (Golgi and E.M. observations). Zeit Zellforsch 71: 297-363, 1966.
Vanhatalo CJM, Palva MD, Holmes JW, Miller J, Voipio K, Kaila A. Infraslow
oscillations modulate excitability and interictal epileptic activity in the human cortex
during sleep. Proc Nat Acad Sci USA 101: 5053-5057, 2004.
Weinberg RJ, Rustioni A. Brainstem projections to the rat cuneate nucleus. J Comp
Neurol 282: 142-56, 1989.
Weisberg RJ, Rustioni A. Cortical cells projecting to the dorsal column nuclei of cats.
An anatomical study with the horseradish peroxidase technique. J Comp Neurol.
168: 425-37, 1976.
Page 28 of 40
29
Xu Y, Haykin S, Racine RJ. Multiple window time frequency distribution and coherence
of EEG using slepian sequences and hermite functions. IEEE Trans Biomed Eng
46: 861-866, 1999.
Yan J, Suga N. Corticofugal modulation of time-domain processing of biosonar
information in bats. Science 273: 1100-1103, 1996.
Page 29 of 40
30
Figure legends:
Figure 1: Wavelet spectral and coherence analysis of experimental spike trains. A)
Stimulus events and neural spike trains during three experimental epochs:
spontaneous activity, control 32 s long tactile stimulation delivered to the neuron
receptive field at 1 Hz rate, and the same tactile stimulation repeated after electrical
stimulation of the SI cortex (AESC). B) Autocorrelation (ACH) and peristimulus time
(PSTH) histograms for the corresponding epochs. C) Wavelet power spectra of the
neural spike train for the corresponding epochs. x-axis corresponds to the localization
z (time), while along y-axis the oscillation frequency from 0.5 to 15 Hz in logarithmic
scale is plotted. The grey intensity is equivalent to the wavelet spectral power (6).
Dashed lines define the cone of influence, and horizontal dotted lines delimit the
stimulus frequency band [0.83-1.16] Hz. D) Level of statistical significance for the
wavelet coherence obtained by the surrogate data test. Coherence above the curve is
deemed significant. Gray area shows the frequency band of interest (around the
stimulus frequency). E) Wavelet coherence of the neural spike train to tactile
stimulation events for the control epoch and after the SI cortex stimulation. Solid black
lines delimit islands of statistically significant coherence (the stripe between two dotted
lines is of interest). The grey intensity corresponds to the strength of the stimulus
coherence of the neural response.
Figure 2: Spectral analysis of spike train (corresponding to Fig. 1A) for three different
epochs: spontaneous activity (dotted line), control tactile stimulation (solid line), and
tactile stimulation preceded by electrical stimulation of the SI cortex (dashed line,
AESC). Gray areas delimit alpha frequency band ranging from 5 to15 Hz, and stimulus
frequency band [0.83–1.16] Hz. A) Power spectra obtained by the multi-taper Fourier
transform. B) Global wavelet power spectra for the same epochs.
Figure 3: Spectral characteristics of gracile projecting neurons in the stimulus and
alpha frequency bands. A) Mean power of the global wavelet spectrum and its standard
error in the stimulus frequency band for spontaneous conditions and during response
to tactile stimulation in control conditions and after electrical stimulation of the SI cortex
(AESC). B) The same as (A) but for alpha frequency band. C) Statistics of the types of
the spectral effect of the electrical stimulation of the SI cortex for two frequency bands.
I, No, and D stand for increase, no effect, and decrease of the spectral power,
Page 30 of 40

31
respectively. Black and grey bars correspond to the stimulus and alpha frequency
bands, respectively.
Figure 4: Effect of the electrical activation of the SI cortex on the wavelet coherence
(reliability) of the response of projecting neurons in gracilis nucleus to tactile stimulation
of their RFs. A) Absolute value of the coherence increment mCδ as a function of the
mean overall coherence mC shows a strong linear tendency. Solid straight line is the
best fit of the data to the model (10). Gray area delimits the No–effect region (data
points shown by triangles) where the experimentally observed value of the coherence
increment is inferior 50% of the expectation. Circles and squares correspond to I (or
increase) and D (or decrease) types of effect of the electrical cortex stimulation on the
stimulus response coherence. B) Percentage of neurons exhibiting I, No, and D types
of effect. C) Relative changes (increase or decrease) of the coherence for I and D
effects.
Figure 5: Increment of the mean neural firing rate (A) and of the amplitude of the
PSTH peak (B) versus the increment of the neural stimulus response coherence.
Quadrants I and III correspond to positive correlation among two characteristics (i.e.
increase or decrease of one characteristics is accompanied by the same effect in the
other), whereas quadrants II and IV correspond to negative or anti- correlation (i.e.
when the effect in one characteristic is contrary to the effect in the other). Dashed
straight lines and grey areas around show the best linear fits of the data and their 95%
confidence limits. Direction and position of the fits imply the absence of correlation
between the firing rate and coherence measures and a positive correlation of the
amplitude of the PSTH peak and coherence measures. However, note the presence of
cases where changes in the PSTH amplitude do not correspond to the changes in the
coherence.
Figure 6: Oscillatory behaviour of the wavelet coherence of the neural response to
tactile stimulation events in the stimulus frequency band. A) Upper strips show
coherences evaluated in the stimulus frequency band 0.83-1.16 Hz (correspond to
those shown in Fig. 1E between horizontal dotted line) for the control (“control”) and
after electrical stimulation of the SI cortex (“AESC”) for the representative neuron. Gray
intensity corresponds to the local coherence value. Zero on the time axis corresponds
to the beginning of each epoch. Bottom panel: Thick curves shows the integral
(averaged over the stimulus frequency band) wavelet stimulus coherence of the neuron
Page 31 of 40

32
response along the stimulation epochs. Thin dash-dotted horizontal line defines the
level of statistical significance for the coherence in the control stimulation conditions.
According to the statistical significance we define time windows of significant (gray
boxes) and not significant (white boxes) coherence. B) PSTHs of the neural response
in control conditions evaluated over time windows with coherence above (left panel)
and below (right panel) significance level. In the windows of the coherent response the
neuron shows a pronounced peak, whereas it loses the stimulus correlation outside of
the coherent windows. C) Fourier power spectra of the oscillation of the wavelet
coherences in control (control) and after the SI cortex stimulation conditions (AESC).
Figure 7: Statistical properties of the ultraslow oscillations of the stimulus response
coherence of projecting neurons in the gracilis nucleus in control conditions and after
electrical stimulation of the SI cortex (AESC). A) Mean oscillation frequency. B) Mean
oscillation power.
Page 32 of 40

Figure 1: Wavelet spectral and coherence analysis of experimental spike trains. A) Stimulus events and neural spike trains during three experimental epochs: spontaneous activity, control 32 s long tactile stimulation delivered to the neuron receptive field at 1 Hz rate, and the same tactile stimulation repeated after electrical stimulation of the SI
cortex (AESC). B) Autocorrelation (ACH) and peristimulus time (PSTH) histograms for the corresponding epochs. C) Wavelet power spectra of the neural spike train for the
corresponding epochs. x-axis corresponds to the localization (time), while along y-axis the oscillation frequency from 0.5 to 15 Hz in logarithmic scale is plotted. The grey
intensity is equivalent to the wavelet spectral power (6). Dashed lines define the cone of influence, and horizontal dotted lines delimit the stimulus frequency band [0.83-1.16] Hz.
D) Level of statistical significance for the wavelet coherence obtained by the surrogate data test. Coherence above the curve is deemed significant. Gray area shows the
frequency band of interest (around the stimulus frequency). E) Wavelet coherence of the neural spike train to tactile stimulation events for the control epoch and after the SI
cortex stimulation. Solid black lines delimit islands of statistically significant coherence (the stripe between two dotted lines is of interest). The grey intensity corresponds to the
strength of the stimulus coherence of the neural response. 177x151mm (600 x 600 DPI)
Page 33 of 40
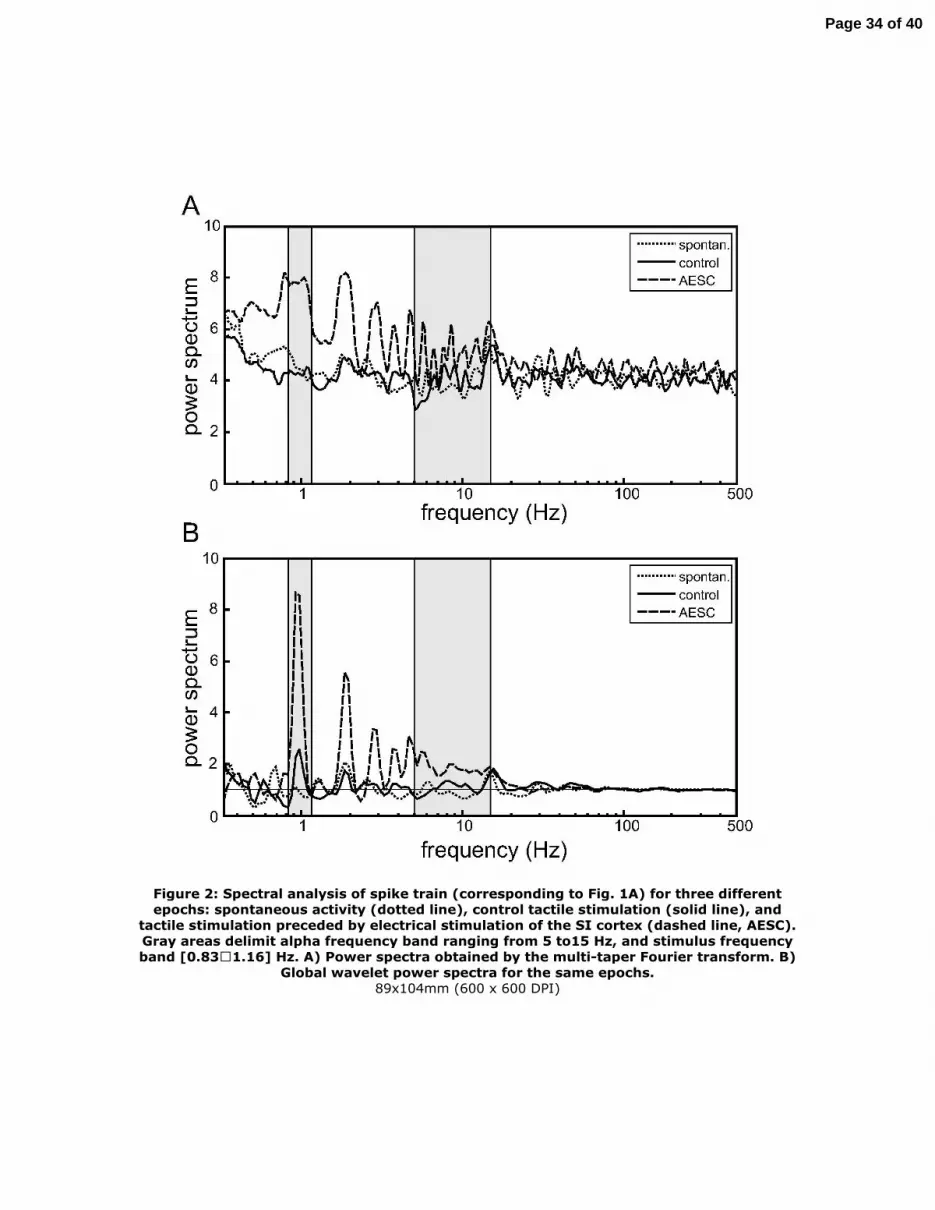
Figure 2: Spectral analysis of spike train (corresponding to Fig. 1A) for three different epochs: spontaneous activity (dotted line), control tactile stimulation (solid line), and
tactile stimulation preceded by electrical stimulation of the SI cortex (dashed line, AESC). Gray areas delimit alpha frequency band ranging from 5 to15 Hz, and stimulus frequency band [0.831.16] Hz. A) Power spectra obtained by the multi-taper Fourier transform. B)
Global wavelet power spectra for the same epochs. 89x104mm (600 x 600 DPI)
Page 34 of 40

Figure 3: Spectral characteristics of gracile projecting neurons in the stimulus and alpha frequency bands. A) Mean power of the global wavelet spectrum and its standard error in
the stimulus frequency band for spontaneous conditions and during response to tactile stimulation in control conditions and after electrical stimulation of the SI cortex (AESC).
B) The same as (A) but for alpha frequency band. C) Statistics of the types of the spectral effect of the electrical stimulation of the SI cortex for two frequency bands. I, No, and D stand for increase, no effect, and decrease of the spectral power, respectively. Black and
grey bars correspond to the stimulus and alpha frequency bands, respectively. 121x58mm (600 x 600 DPI)
Page 35 of 40

Figure 4: Effect of the electrical activation of the SI cortex on the wavelet coherence (reliability) of the response of projecting neurons in gracilis nucleus to tactile stimulation
of their RFs. A) Absolute value of the coherence increment as a function of the mean overall coherence shows a strong linear tendency. Solid straight line is the best fit of the data to the model (10). Gray area delimits the Noeffect region (data points shown by
triangles) where the experimentally observed value of the coherence increment is inferior 50% of the expectation. Circles and squares correspond to I (or increase) and D (or
decrease) types of effect of the electrical cortex stimulation on the stimulus response coherence. B) Percentage of neurons exhibiting I, No, and D types of effect. C) Relative
changes (increase or decrease) of the coherence for I and D effects. 88x101mm (600 x 600 DPI)
Page 36 of 40

Figure 5: Increment of the mean neural firing rate (A) and of the amplitude of the PSTH peak (B) versus the increment of the neural stimulus response coherence. Quadrants I and III correspond to positive correlation among two characteristics (i.e. increase or
decrease of one characteristics is accompanied by the same effect in the other), whereas quadrants II and IV correspond to negative or anti- correlation (i.e. when the effect in one characteristic is contrary to the effect in the other). Dashed straight lines and grey
areas around show the best linear fits of the data and their 95% confidence limits. Direction and position of the fits imply the absence of correlation between the firing rate
and coherence measures and a positive correlation of the amplitude of the PSTH peak and coherence measures. However, note the presence of cases where changes in the PSTH
amplitude do not correspond to the changes in the coherence. 116x62mm (600 x 600 DPI)
Page 37 of 40

Figure 6: Oscillatory behaviour of the wavelet coherence of the neural response to tactile stimulation events in the stimulus frequency band. A) Upper strips show coherences
evaluated in the stimulus frequency band 0.83-1.16 Hz (correspond to those shown in Fig. 1E between horizontal dotted line) for the control (control) and after electrical stimulation of the SI cortex (AESC) for the representative neuron. Gray intensity corresponds to the local coherence value. Zero on the time axis corresponds to the
beginning of each epoch. Bottom panel: Thick curves shows the integral (averaged over the stimulus frequency band) wavelet stimulus coherence of the neuron response along the stimulation epochs. Thin dash-dotted horizontal line defines the level of statistical significance for the coherence in the control stimulation conditions. According to the statistical significance we define time windows of significant (gray boxes) and not
significant (white boxes) coherence. B) PSTHs of the neural response in control conditions evaluated over time windows with coherence above (left panel) and below (right panel) significance level. In the windows of the coherent response the neuron shows a pronounced peak, whereas it loses the stimulus correlation outside of the
Page 38 of 40

coherent windows. C) Fourier power spectra of the oscillation of the wavelet coherences in control (control) and after the SI cortex stimulation conditions (AESC).
127x146mm (600 x 600 DPI)
Page 39 of 40

Figure 7: Statistical properties of the ultraslow oscillations of the stimulus response coherence of projecting neurons in the gracilis nucleus in control conditions and after electrical stimulation of the SI cortex (AESC). A) Mean oscillation frequency. B) Mean
oscillation power. 88x49mm (600 x 600 DPI)
Page 40 of 40


