Embed Size (px)
Citation preview
Transportation Industry Monthly: Trend Analysis
July 16, 2020
Important Disclosures Found In Appendix
Chris Johnson, CFA
Senior Research Analyst
(216) 649-7288
This report is for Tino Nieves. U
nauthorized redistribution is strictly prohibited and considered a violation of our intellectual property.
1
Key Themes for the Month
U.S. Trucking Trends
• Spot market activity continues to rise off mid-April lows, with dry-van TL rates now flat Y/Y (versus down 20% Y/Y in April, have been
declining Y/Y since 3Q18). As economic activity resumes post-COVID shutdowns in early 2Q, demand appears to be trending above
seasonal average to replenish inventories.
• Seasonally-adjusted truck tonnage in May fell 9% Y/Y according to the ATA, less bad than April’s 12% decline, as weak
industrial/automotive markets offset improving retail sales. The 3 month moving average (3MMA) was down 4.4% Y/Y in May, down
3.7% M/M. Cass shipment activity was down 20%+ Y/Y in April and May. With our work indicating a recovery in demand in June,
expectations for 2H indicate a normalization of demand, but limited forecasting remains a challenge.
• Average truckload rates (blended contract and spot) were down 6% Y/Y in June (excluding fuel surcharges and assessorial fees), according
to Cass Information Systems, as capacity exceeds demand. Linehaul rates have been declining Y/Y since August 2019 (spot rates have been
lower Y/Y since 3Q18). Feedback indicates TL contract rates are likely down 5-10% Y/Y in 2020 (2019 down 5-15%, 2018 up 8-11%).
Global Airfreight, Containerized Ocean Traffic
• Total US and Canadian container imports were down 5% Y/Y in June, according to PIERS, slightly better than our expectations. Our work
indicates ocean volumes will improve into 2H20, likely flat Y/Y in 4Q20.
• During the past 45 days, spot market rates from Asia to the U.S. West Coast rose from $1,700 to $2,700 due to capacity reductions and
incremental volume. FAK (spot rates with fuel) rates are now 30% above year ago levels according to the Shanghai Containerized Freight
Index. Our work indicates contract rates are likely flat Y/Y at ~$1,500 from Asia to the USWC, and shippers are seeing incremental request
for additional surcharge to move volumes above contracted commitments.
• Airfreight rates during May were up 145% Y/Y (up 11% M/M) as markets lap persistent demand weakness. We expect rates to decline over
the next 60 days as our work indicates rates slowing demand for PPE. The duration remains unclear for factory production schedules and
reduced passenger flights.
Rail Trends
• 3QTD volumes at CSX are down 6% (2Q was down 20%) while Norfolk Southern volumes are down 11% Y/Y (2Q was down 26%). Coal
declines are expected to persist down 10-20% through the end of the year, while intermodal/auto/chem outlooks stabilize (likely still down
Y/Y).
• Union Pacific’s 3QTD volumes are down 7% Y/Y (2Q was down 20%) mostly due to declines across chemicals, coal, and auto. BNSF’s
3QTD volumes are down 7% lead by lower coal and grain. Intermodal commentary is incrementally more positive versus 45 days ago.
This report is for Tino Nieves. U
nauthorized redistribution is strictly prohibited and considered a violation of our intellectual property.
2
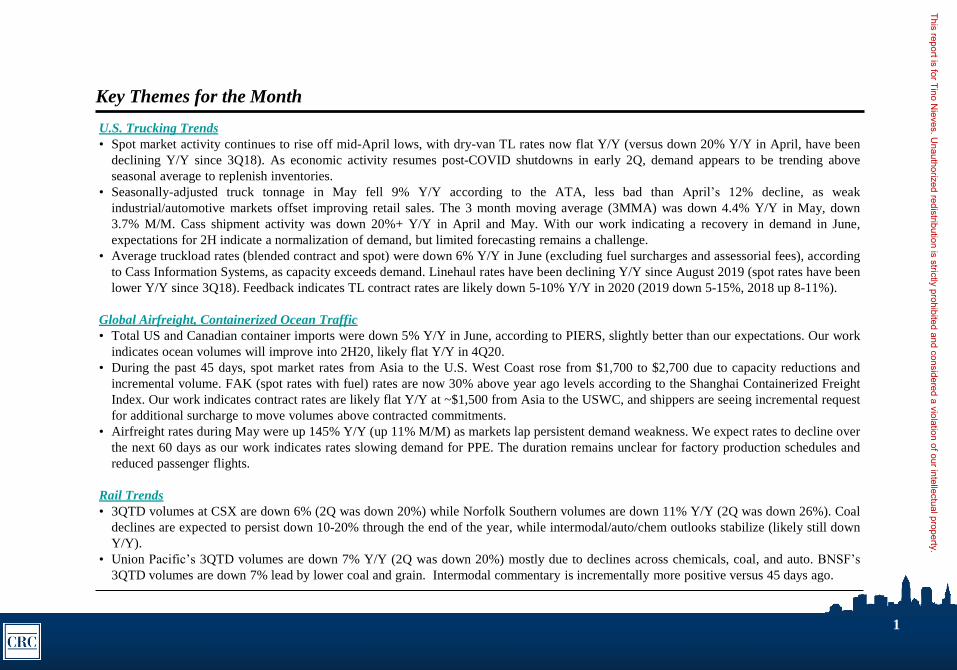
Transportation Universe: What Has Changed
The following charts summarize the results of our surveys and data analysis over the past thirty (30) days:
Source: Cleveland Research Analysis
CONTAINERIZED OCEAN SHIPPING
Import Volumes Export Volumes Container Rates Demand
Sequential Change
Year-Over-Year Change
INTERMODAL
Container Volumes Trailer Volumes
Sequential Change
Year-Over-Year Change
INTERNATIONAL AIRFREIGHT
Trans-Pacfic Rates Demand
Sequential Change
Year-Over-Year Change
MACRO INDICATORS INTERMODAL
Weekly Diesel Prices
Sequential Change
Year-Over-Year
TRUCKING INTERNATIONAL AIRFREIGHT
Demand Index Load to Truck
Sequential Change
Year-Over-Year Change
This report is for Tino Nieves. U
nauthorized redistribution is strictly prohibited and considered a violation of our intellectual property.
3
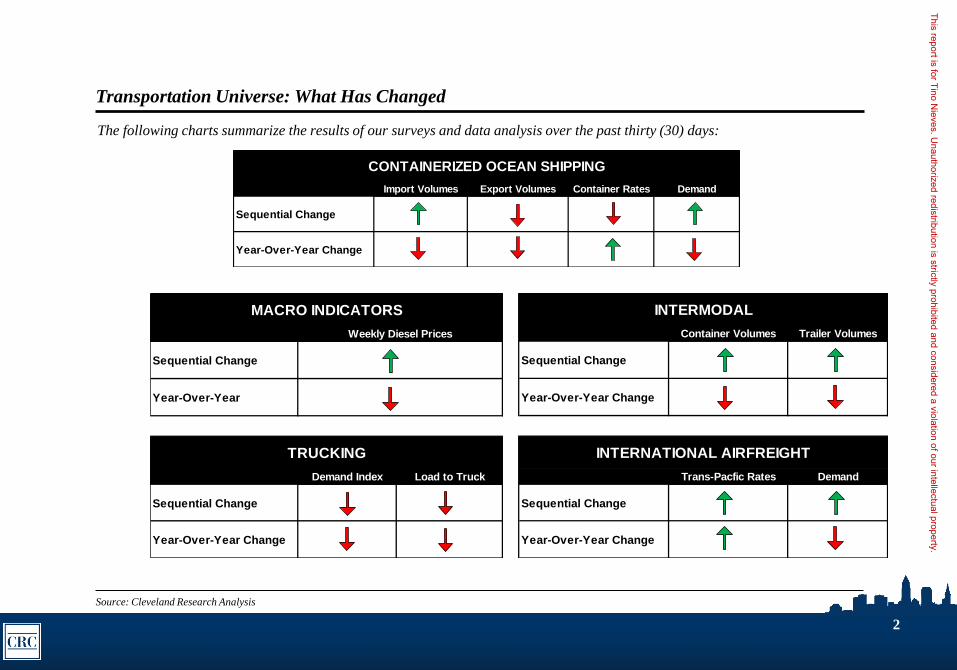
North American Freight Volumes
In June, shipments across all transport modes declined 18% Y/Y, its nineteenth consecutive month of Y/Y declines (up 3% M/M)
according to Cass Information Systems. 2019 shipments were down 4%, with an accelerated decline in 4Q19. Our work indicates a
more cautious 2H outlook given the economic impacts of COVID-19. Truckload shipments represent ~70% of US domestic
transport activity (by revenue).
This report is for Tino Nieves. U
nauthorized redistribution is strictly prohibited and considered a violation of our intellectual property.
4
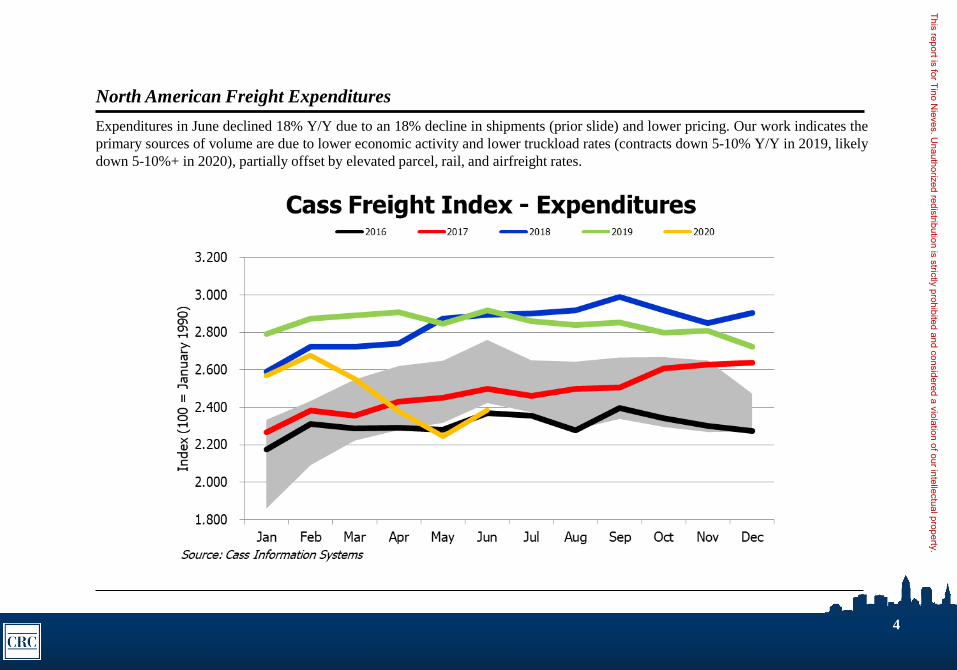
North American Freight Expenditures
Expenditures in June declined 18% Y/Y due to an 18% decline in shipments (prior slide) and lower pricing. Our work indicates the
primary sources of volume are due to lower economic activity and lower truckload rates (contracts down 5-10% Y/Y in 2019, likely
down 5-10%+ in 2020), partially offset by elevated parcel, rail, and airfreight rates.
This report is for Tino Nieves. U
nauthorized redistribution is strictly prohibited and considered a violation of our intellectual property.
Containerized Ocean Shipping
Monthly Industry Trend Summary and Analysis
This report is for Tino Nieves. U
nauthorized redistribution is strictly prohibited and considered a violation of our intellectual property.
6
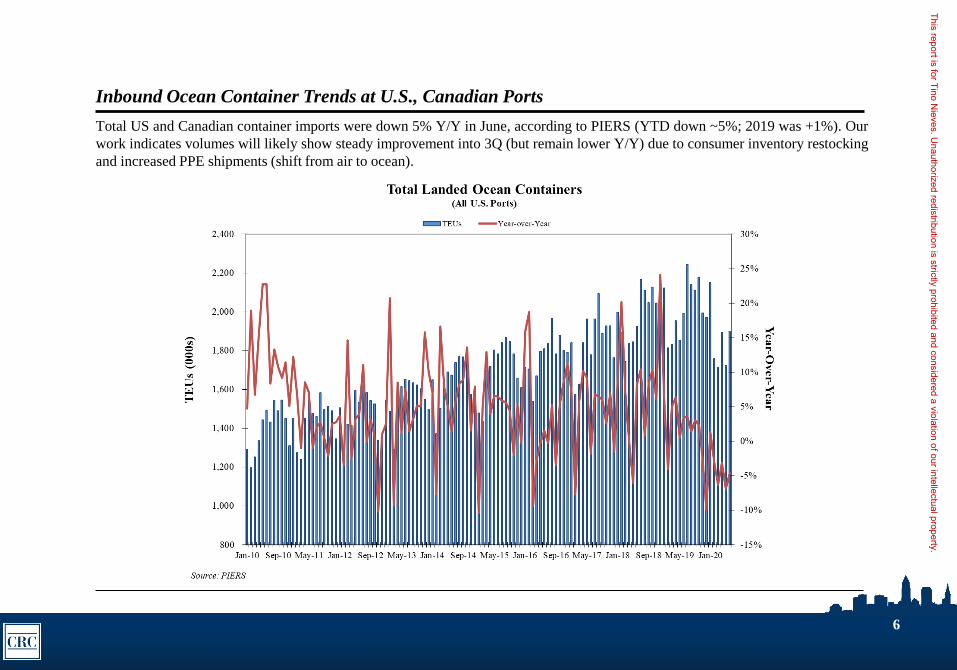
Inbound Ocean Container Trends at U.S., Canadian Ports
Total US and Canadian container imports were down 5% Y/Y in June, according to PIERS (YTD down ~5%; 2019 was +1%). Our
work indicates volumes will likely show steady improvement into 3Q (but remain lower Y/Y) due to consumer inventory restocking
and increased PPE shipments (shift from air to ocean).
This report is for Tino Nieves. U
nauthorized redistribution is strictly prohibited and considered a violation of our intellectual property.
7
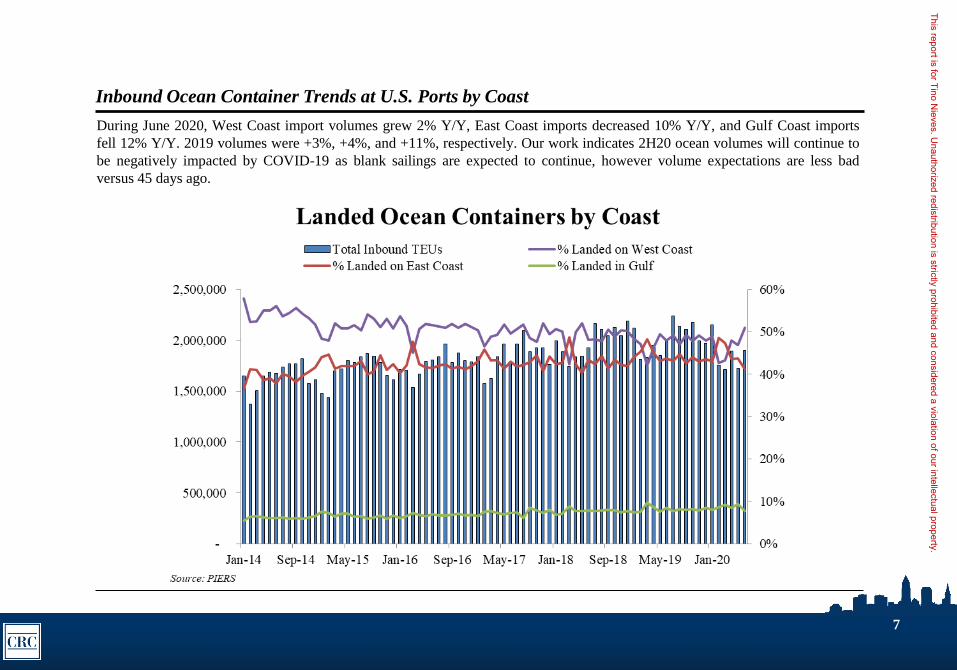
Inbound Ocean Container Trends at U.S. Ports by Coast
During June 2020, West Coast import volumes grew 2% Y/Y, East Coast imports decreased 10% Y/Y, and Gulf Coast imports
fell 12% Y/Y. 2019 volumes were +3%, +4%, and +11%, respectively. Our work indicates 2H20 ocean volumes will continue to
be negatively impacted by COVID-19 as blank sailings are expected to continue, however volume expectations are less bad
versus 45 days ago.
This report is for Tino Nieves. U
nauthorized redistribution is strictly prohibited and considered a violation of our intellectual property.
8
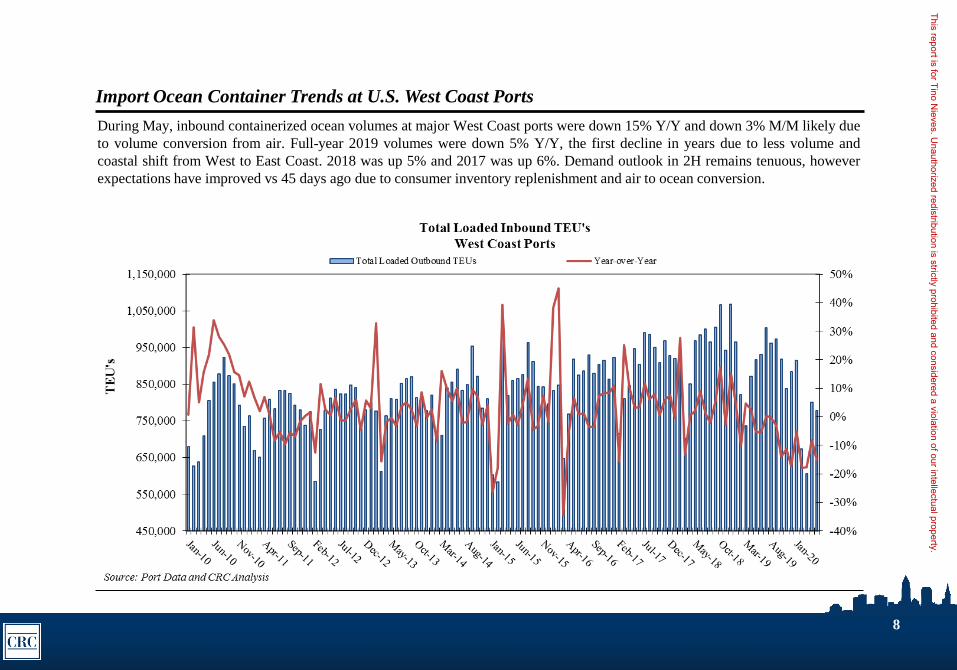
Import Ocean Container Trends at U.S. West Coast Ports
During May, inbound containerized ocean volumes at major West Coast ports were down 15% Y/Y and down 3% M/M likely due
to volume conversion from air. Full-year 2019 volumes were down 5% Y/Y, the first decline in years due to less volume and
coastal shift from West to East Coast. 2018 was up 5% and 2017 was up 6%. Demand outlook in 2H remains tenuous, however
expectations have improved vs 45 days ago due to consumer inventory replenishment and air to ocean conversion.
This report is for Tino Nieves. U
nauthorized redistribution is strictly prohibited and considered a violation of our intellectual property.
9
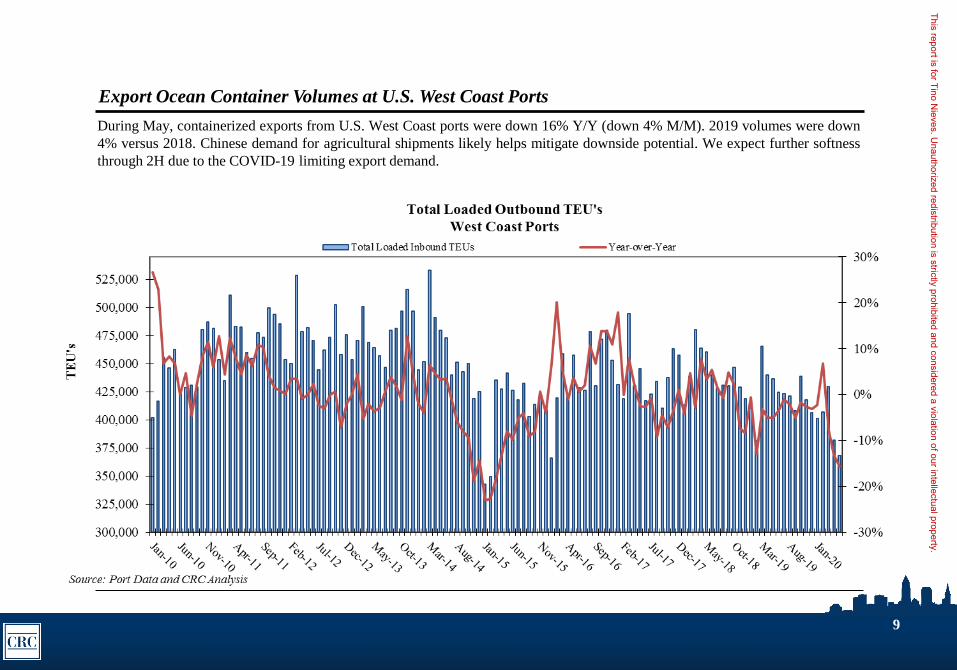
Export Ocean Container Volumes at U.S. West Coast Ports
During May, containerized exports from U.S. West Coast ports were down 16% Y/Y (down 4% M/M). 2019 volumes were down
4% versus 2018. Chinese demand for agricultural shipments likely helps mitigate downside potential. We expect further softness
through 2H due to the COVID-19 limiting export demand.
This report is for Tino Nieves. U
nauthorized redistribution is strictly prohibited and considered a violation of our intellectual property.
10
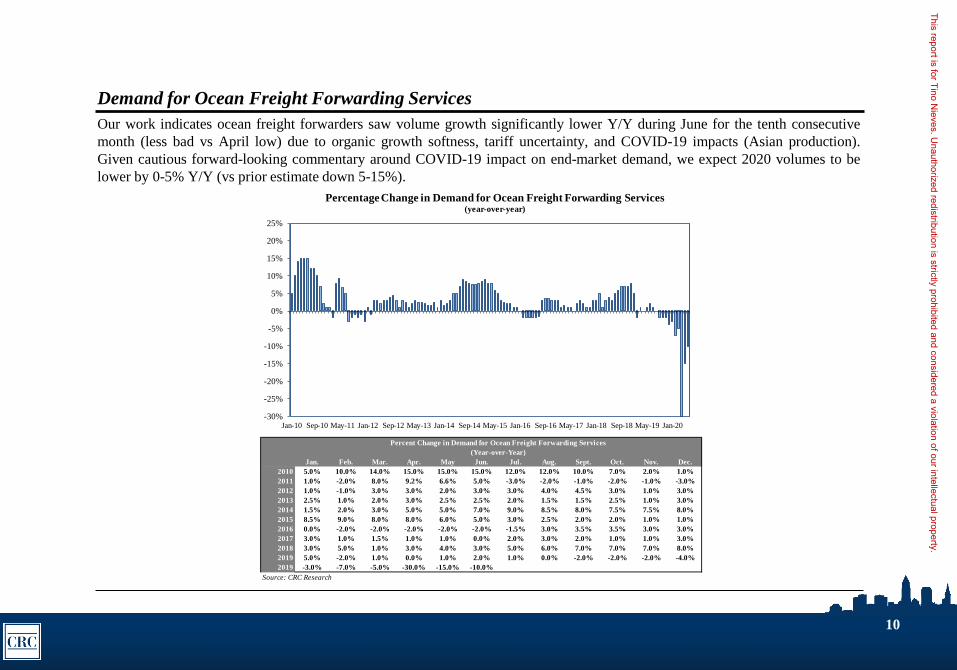
Demand for Ocean Freight Forwarding Services
Our work indicates ocean freight forwarders saw volume growth significantly lower Y/Y during June for the tenth consecutive
month (less bad vs April low) due to organic growth softness, tariff uncertainty, and COVID-19 impacts (Asian production).
Given cautious forward-looking commentary around COVID-19 impact on end-market demand, we expect 2020 volumes to be
lower by 0-5% Y/Y (vs prior estimate down 5-15%).
Jan. Feb. Mar. Apr. May Jun. Jul. Aug. Sept. Oct. Nov. Dec.
2010 5.0% 10.0% 14.0% 15.0% 15.0% 15.0% 12.0% 12.0% 10.0% 7.0% 2.0% 1.0%
2011 1.0% -2.0% 8.0% 9.2% 6.6% 5.0% -3.0% -2.0% -1.0% -2.0% -1.0% -3.0%
2012 1.0% -1.0% 3.0% 3.0% 2.0% 3.0% 3.0% 4.0% 4.5% 3.0% 1.0% 3.0%
2013 2.5% 1.0% 2.0% 3.0% 2.5% 2.5% 2.0% 1.5% 1.5% 2.5% 1.0% 3.0%
2014 1.5% 2.0% 3.0% 5.0% 5.0% 7.0% 9.0% 8.5% 8.0% 7.5% 7.5% 8.0%
2015 8.5% 9.0% 8.0% 8.0% 6.0% 5.0% 3.0% 2.5% 2.0% 2.0% 1.0% 1.0%
2016 0.0% -2.0% -2.0% -2.0% -2.0% -2.0% -1.5% 3.0% 3.5% 3.5% 3.0% 3.0%
2017 3.0% 1.0% 1.5% 1.0% 1.0% 0.0% 2.0% 3.0% 2.0% 1.0% 1.0% 3.0%
2018 3.0% 5.0% 1.0% 3.0% 4.0% 3.0% 5.0% 6.0% 7.0% 7.0% 7.0% 8.0%
2019 5.0% -2.0% 1.0% 0.0% 1.0% 2.0% 1.0% 0.0% -2.0% -2.0% -2.0% -4.0%
2019 -3.0% -7.0% -5.0% -30.0% -15.0% -10.0%
Source: CRC Research
Percent Change in Demand for Ocean Freight Forwarding Services
(Year-over-Year)
-30%
-25%
-20%
-15%
-10%
-5%
0%
5%
10%
15%
20%
25%
Jan-10 Sep-10 May-11 Jan-12 Sep-12 May-13 Jan-14 Sep-14 May-15 Jan-16 Sep-16 May-17 Jan-18 Sep-18 May-19 Jan-20
Percentage Change in Demand for Ocean Freight Forwarding Services(year-over-year)
70%
80%
90%
100%
Sources Reporting More Available Ocean Capacity(year-over-year)
This report is for Tino Nieves. U
nauthorized redistribution is strictly prohibited and considered a violation of our intellectual property.
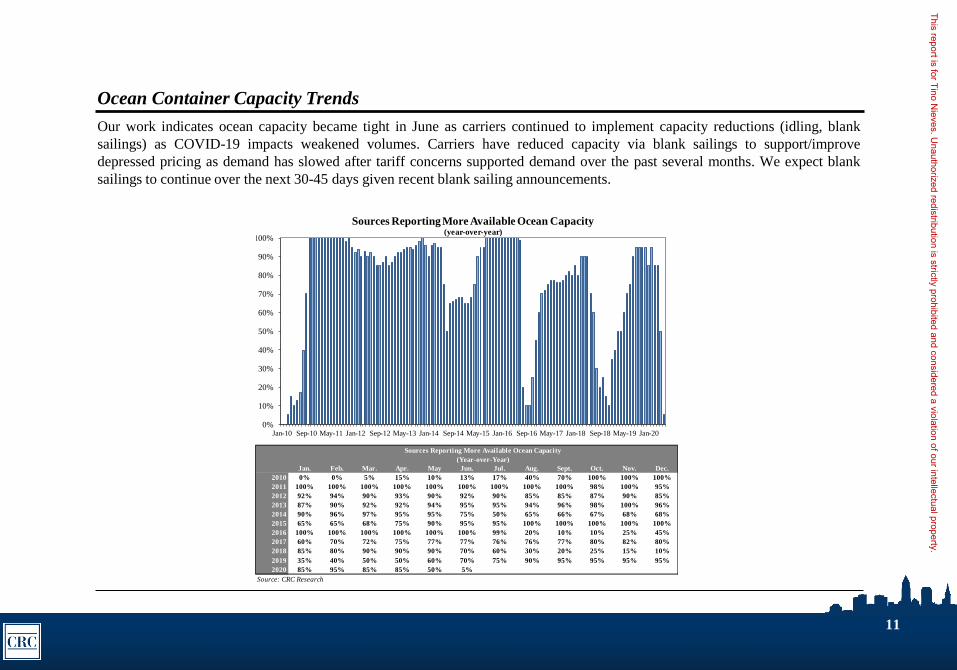
Our work indicates ocean capacity became tight in June as carriers continued to implement capacity reductions (idling, blank
sailings) as COVID-19 impacts weakened volumes. Carriers have reduced capacity via blank sailings to support/improve
depressed pricing as demand has slowed after tariff concerns supported demand over the past several months. We expect blank
sailings to continue over the next 30-45 days given recent blank sailing announcements.
11
Ocean Container Capacity Trends
Jan. Feb. Mar. Apr. May Jun. Jul. Aug. Sept. Oct. Nov. Dec.
2010 0% 0% 5% 15% 10% 13% 17% 40% 70% 100% 100% 100%
2011 100% 100% 100% 100% 100% 100% 100% 100% 100% 98% 100% 95%
2012 92% 94% 90% 93% 90% 92% 90% 85% 85% 87% 90% 85%
2013 87% 90% 92% 92% 94% 95% 95% 94% 96% 98% 100% 96%
2014 90% 96% 97% 95% 95% 75% 50% 65% 66% 67% 68% 68%
2015 65% 65% 68% 75% 90% 95% 95% 100% 100% 100% 100% 100%
2016 100% 100% 100% 100% 100% 100% 99% 20% 10% 10% 25% 45%
2017 60% 70% 72% 75% 77% 77% 76% 76% 77% 80% 82% 80%
2018 85% 80% 90% 90% 90% 70% 60% 30% 20% 25% 15% 10%
2019 35% 40% 50% 50% 60% 70% 75% 90% 95% 95% 95% 95%
2020 85% 95% 85% 85% 50% 5%
Source: CRC Research
Sources Reporting More Available Ocean Capacity
(Year-over-Year)
0%
10%
20%
30%
40%
50%
60%
70%
80%
90%
100%
Jan-10 Sep-10 May-11 Jan-12 Sep-12 May-13 Jan-14 Sep-14 May-15 Jan-16 Sep-16 May-17 Jan-18 Sep-18 May-19 Jan-20
Sources Reporting More Available Ocean Capacity(year-over-year)
This report is for Tino Nieves. U
nauthorized redistribution is strictly prohibited and considered a violation of our intellectual property.
12
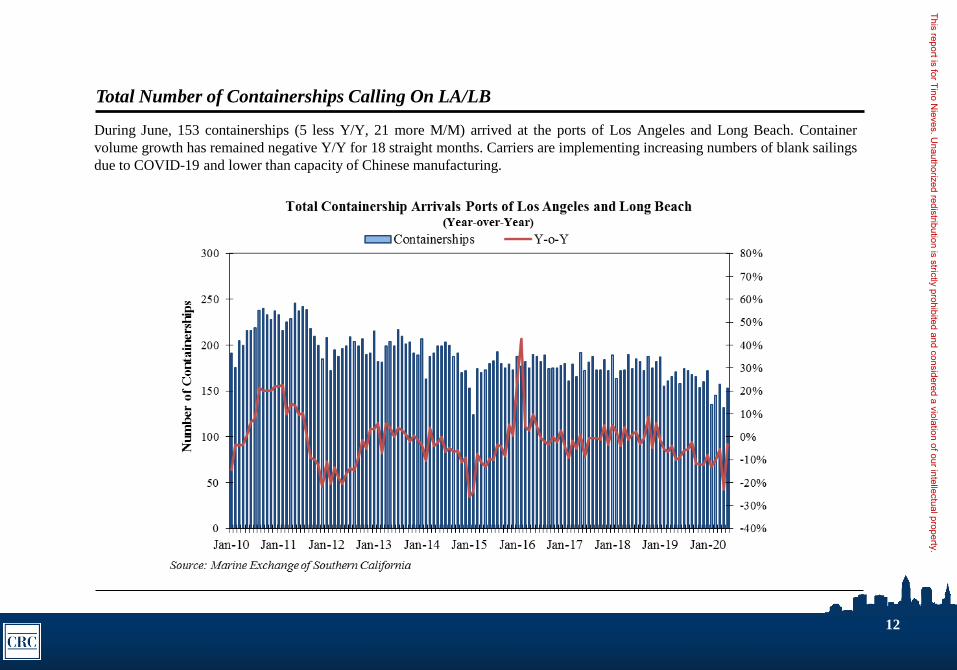
Total Number of Containerships Calling On LA/LB
During June, 153 containerships (5 less Y/Y, 21 more M/M) arrived at the ports of Los Angeles and Long Beach. Container
volume growth has remained negative Y/Y for 18 straight months. Carriers are implementing increasing numbers of blank sailings
due to COVID-19 and lower than capacity of Chinese manufacturing.
This report is for Tino Nieves. U
nauthorized redistribution is strictly prohibited and considered a violation of our intellectual property.
13
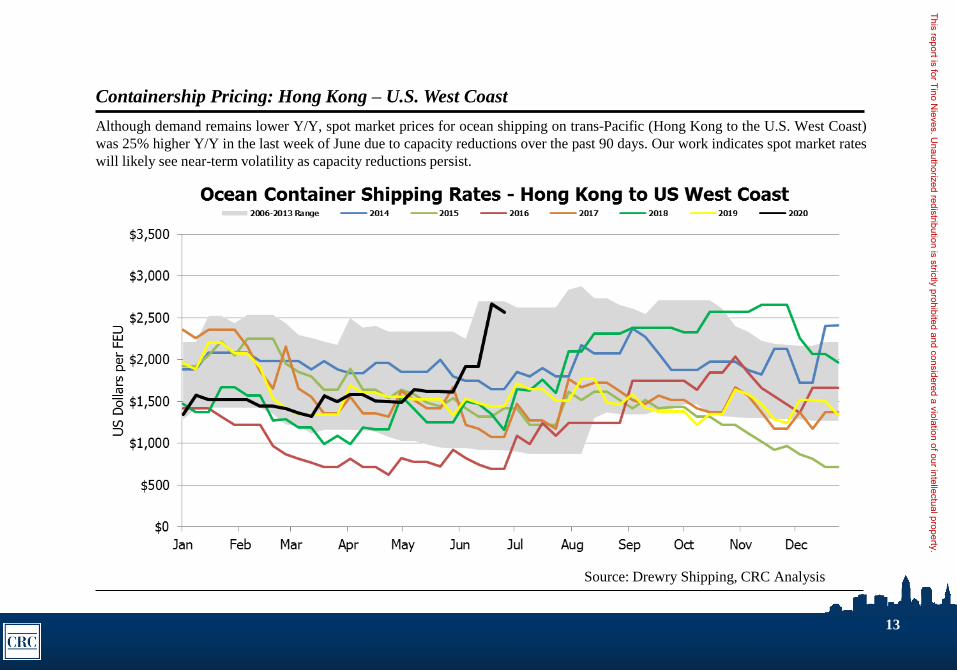
Containership Pricing: Hong Kong – U.S. West Coast
Although demand remains lower Y/Y, spot market prices for ocean shipping on trans-Pacific (Hong Kong to the U.S. West Coast)
was 25% higher Y/Y in the last week of June due to capacity reductions over the past 90 days. Our work indicates spot market rates
will likely see near-term volatility as capacity reductions persist.
Source: Drewry Shipping, CRC Analysis
This report is for Tino Nieves. U
nauthorized redistribution is strictly prohibited and considered a violation of our intellectual property.
14
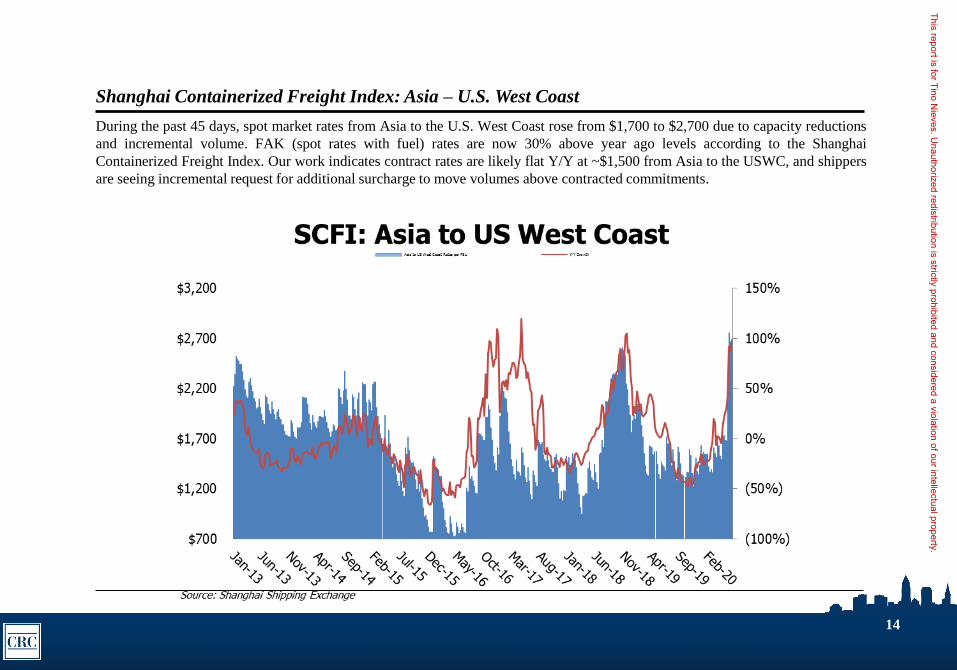
Shanghai Containerized Freight Index: Asia – U.S. West Coast
During the past 45 days, spot market rates from Asia to the U.S. West Coast rose from $1,700 to $2,700 due to capacity reductions
and incremental volume. FAK (spot rates with fuel) rates are now 30% above year ago levels according to the Shanghai
Containerized Freight Index. Our work indicates contract rates are likely flat Y/Y at ~$1,500 from Asia to the USWC, and shippers
are seeing incremental request for additional surcharge to move volumes above contracted commitments.
This report is for Tino Nieves. U
nauthorized redistribution is strictly prohibited and considered a violation of our intellectual property.
15
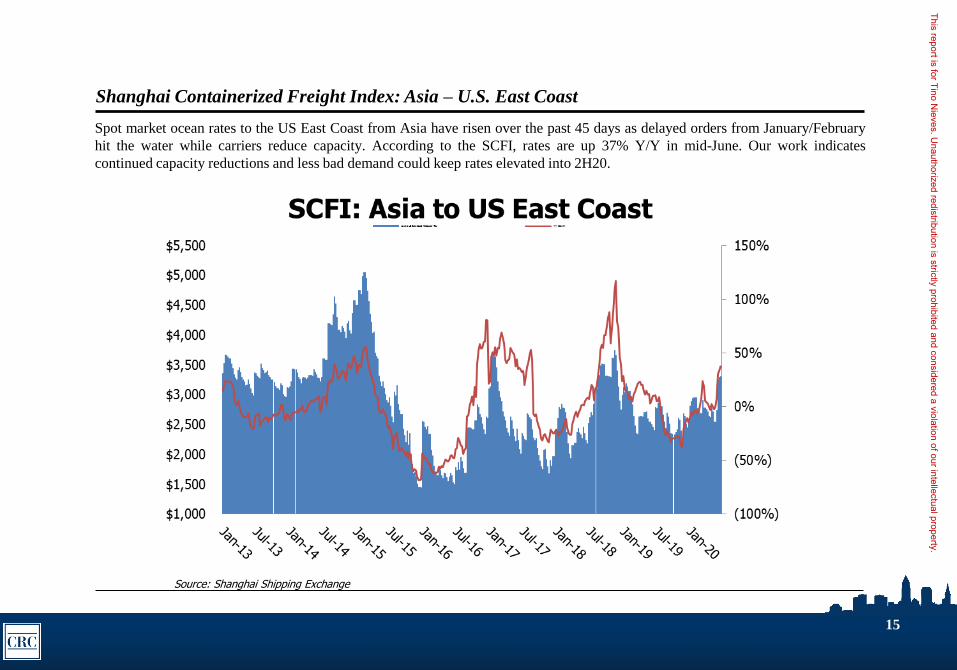
Shanghai Containerized Freight Index: Asia – U.S. East Coast
Source: Shanghai Shipping Exchange
Spot market ocean rates to the US East Coast from Asia have risen over the past 45 days as delayed orders from January/February
hit the water while carriers reduce capacity. According to the SCFI, rates are up 37% Y/Y in mid-June. Our work indicates
continued capacity reductions and less bad demand could keep rates elevated into 2H20.
This report is for Tino Nieves. U
nauthorized redistribution is strictly prohibited and considered a violation of our intellectual property.
16
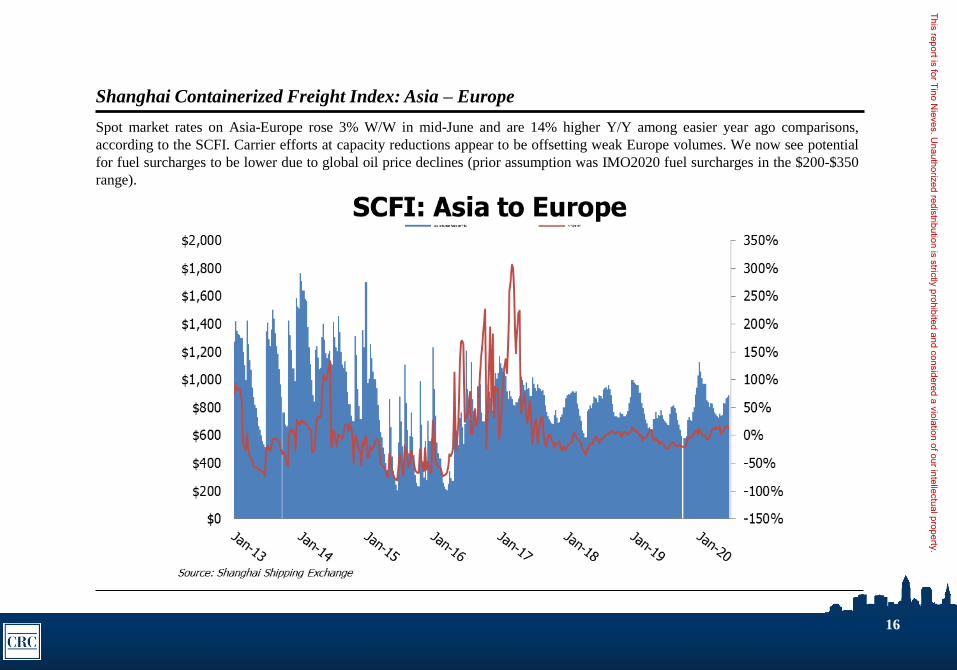
Shanghai Containerized Freight Index: Asia – Europe
Spot market rates on Asia-Europe rose 3% W/W in mid-June and are 14% higher Y/Y among easier year ago comparisons,
according to the SCFI. Carrier efforts at capacity reductions appear to be offsetting weak Europe volumes. We now see potential
for fuel surcharges to be lower due to global oil price declines (prior assumption was IMO2020 fuel surcharges in the $200-$350
range).
This report is for Tino Nieves. U
nauthorized redistribution is strictly prohibited and considered a violation of our intellectual property.
17
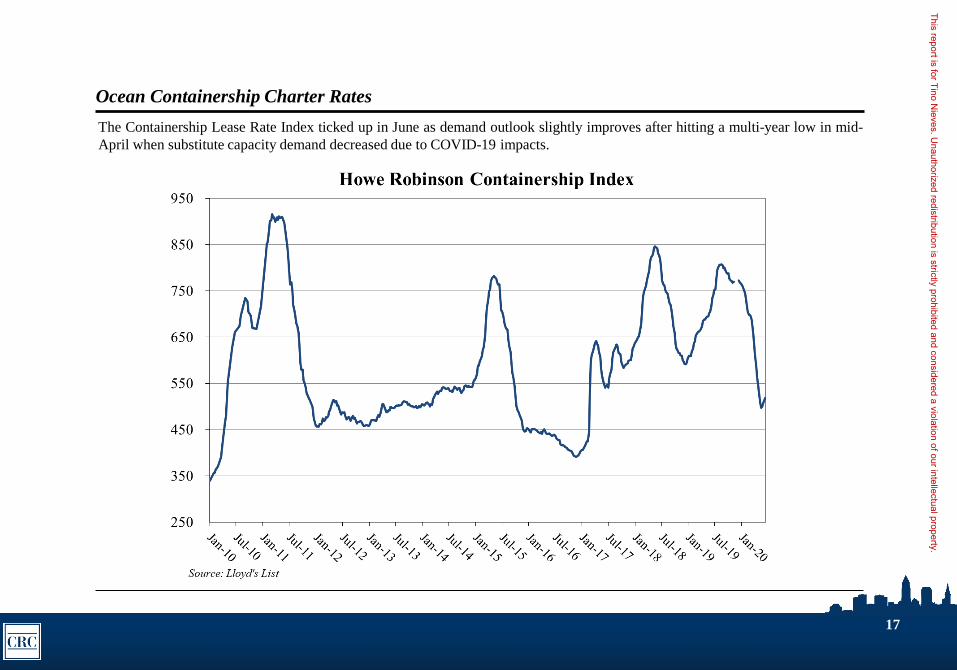
Ocean Containership Charter Rates
The Containership Lease Rate Index ticked up in June as demand outlook slightly improves after hitting a multi-year low in mid-
April when substitute capacity demand decreased due to COVID-19 impacts.
This report is for Tino Nieves. U
nauthorized redistribution is strictly prohibited and considered a violation of our intellectual property.
IATA Airfreight Trends
Monthly Industry Trend Summary and Analysis
This report is for Tino Nieves. U
nauthorized redistribution is strictly prohibited and considered a violation of our intellectual property.
19
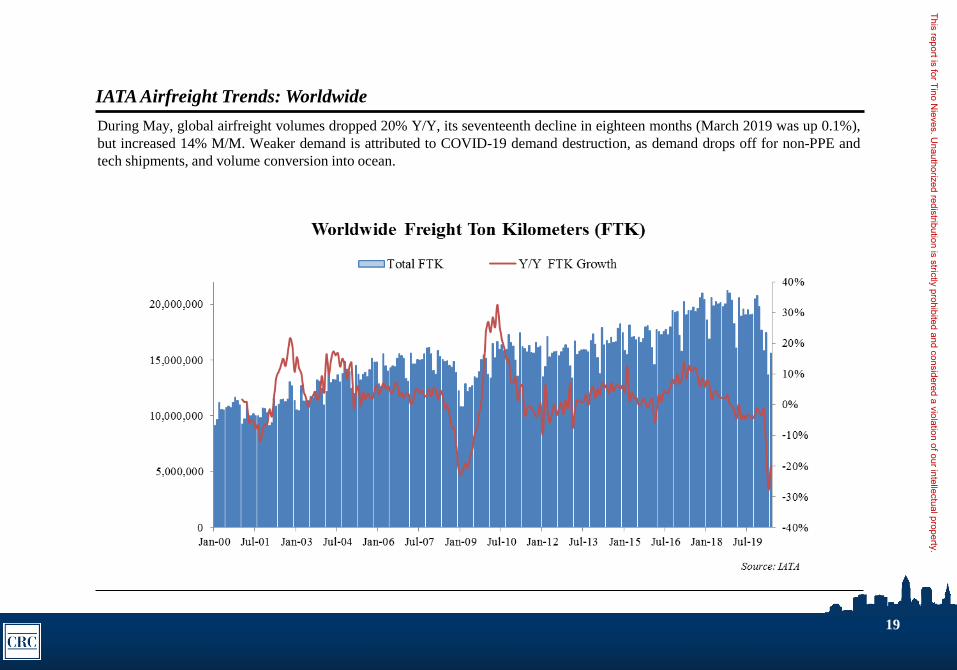
IATA Airfreight Trends: Worldwide
During May, global airfreight volumes dropped 20% Y/Y, its seventeenth decline in eighteen months (March 2019 was up 0.1%),
but increased 14% M/M. Weaker demand is attributed to COVID-19 demand destruction, as demand drops off for non-PPE and
tech shipments, and volume conversion into ocean.
This report is for Tino Nieves. U
nauthorized redistribution is strictly prohibited and considered a violation of our intellectual property.
20
IATA Airfreight Trends: Worldwide
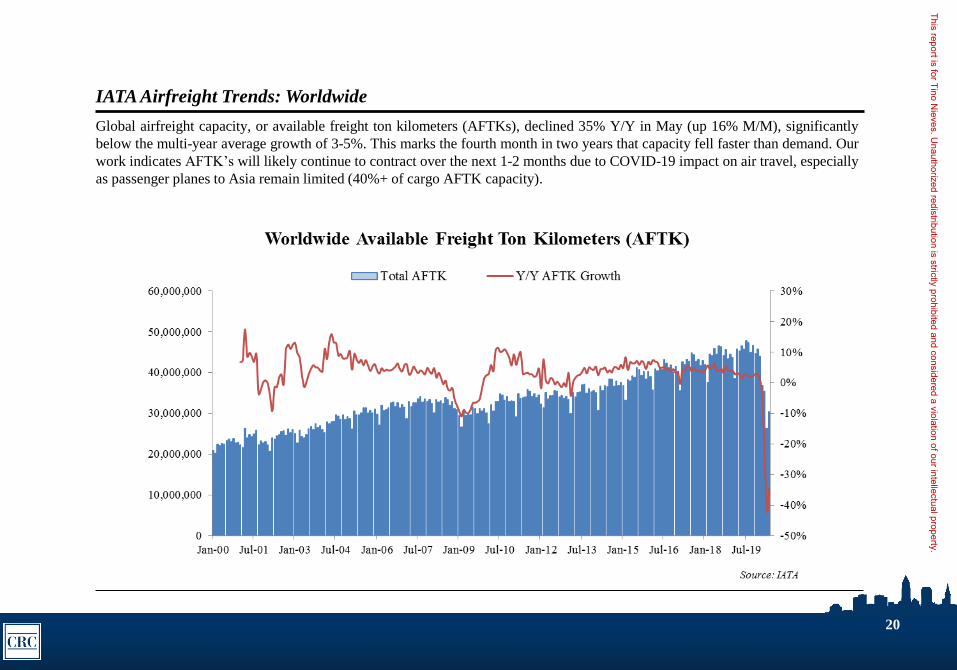
Global airfreight capacity, or available freight ton kilometers (AFTKs), declined 35% Y/Y in May (up 16% M/M), significantly
below the multi-year average growth of 3-5%. This marks the fourth month in two years that capacity fell faster than demand. Our
work indicates AFTK’s will likely continue to contract over the next 1-2 months due to COVID-19 impact on air travel, especially
as passenger planes to Asia remain limited (40%+ of cargo AFTK capacity).
This report is for Tino Nieves. U
nauthorized redistribution is strictly prohibited and considered a violation of our intellectual property.
21
IATA Airfreight Trends: US Domestic
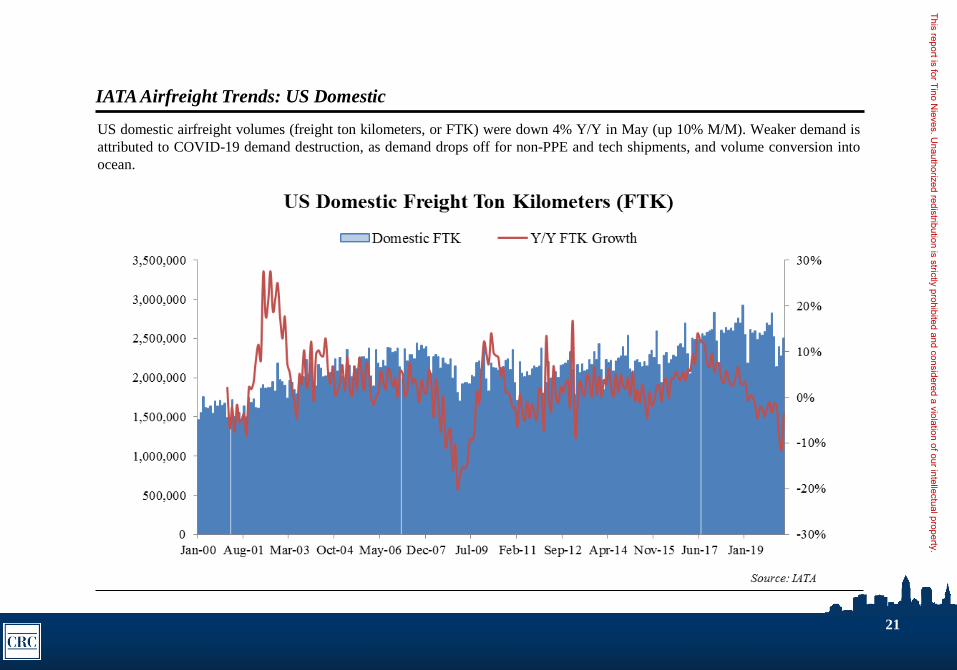
US domestic airfreight volumes (freight ton kilometers, or FTK) were down 4% Y/Y in May (up 10% M/M). Weaker demand is
attributed to COVID-19 demand destruction, as demand drops off for non-PPE and tech shipments, and volume conversion into
ocean.
This report is for Tino Nieves. U
nauthorized redistribution is strictly prohibited and considered a violation of our intellectual property.
22
IATA Airfreight Trends: US Domestic
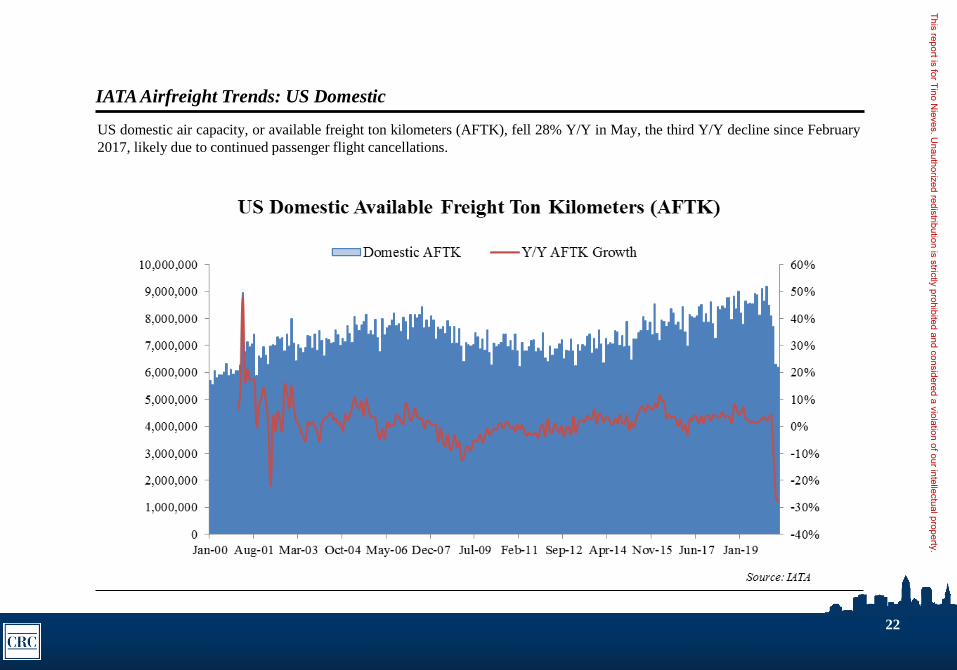
US domestic air capacity, or available freight ton kilometers (AFTK), fell 28% Y/Y in May, the third Y/Y decline since February
2017, likely due to continued passenger flight cancellations.
This report is for Tino Nieves. U
nauthorized redistribution is strictly prohibited and considered a violation of our intellectual property.
23
IATA Airfreight Trends: Total International
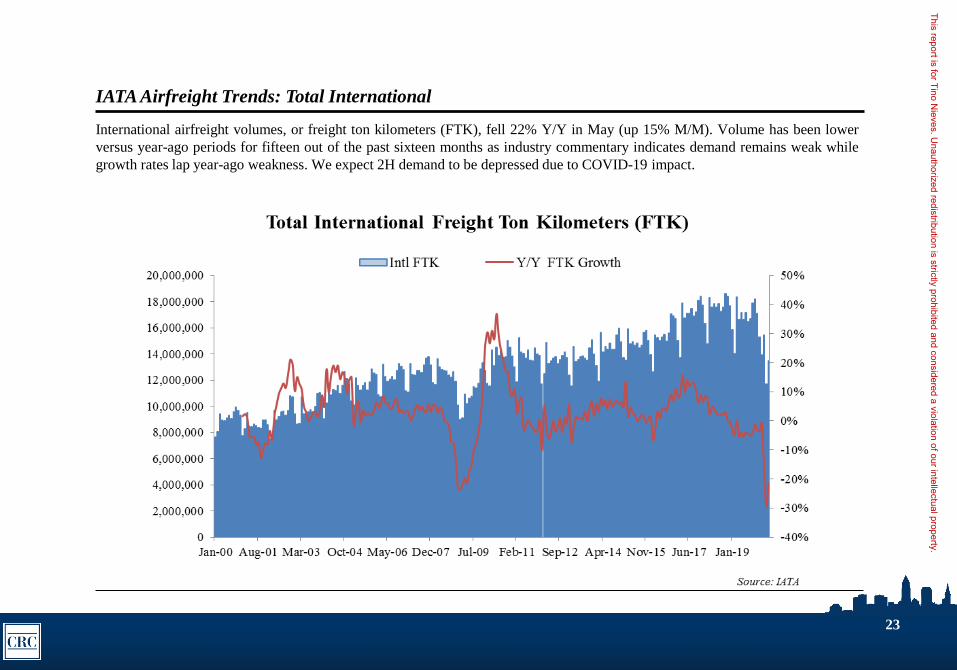
International airfreight volumes, or freight ton kilometers (FTK), fell 22% Y/Y in May (up 15% M/M). Volume has been lower
versus year-ago periods for fifteen out of the past sixteen months as industry commentary indicates demand remains weak while
growth rates lap year-ago weakness. We expect 2H demand to be depressed due to COVID-19 impact.
This report is for Tino Nieves. U
nauthorized redistribution is strictly prohibited and considered a violation of our intellectual property.
24
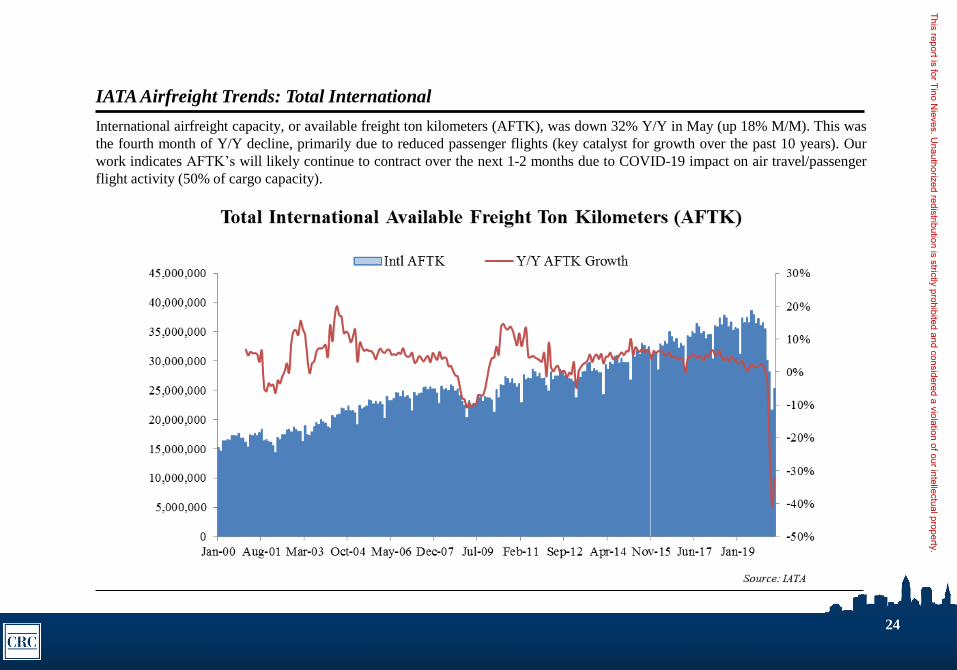
IATA Airfreight Trends: Total International
International airfreight capacity, or available freight ton kilometers (AFTK), was down 32% Y/Y in May (up 18% M/M). This was
the fourth month of Y/Y decline, primarily due to reduced passenger flights (key catalyst for growth over the past 10 years). Our
work indicates AFTK’s will likely continue to contract over the next 1-2 months due to COVID-19 impact on air travel/passenger
flight activity (50% of cargo capacity).
This report is for Tino Nieves. U
nauthorized redistribution is strictly prohibited and considered a violation of our intellectual property.
25
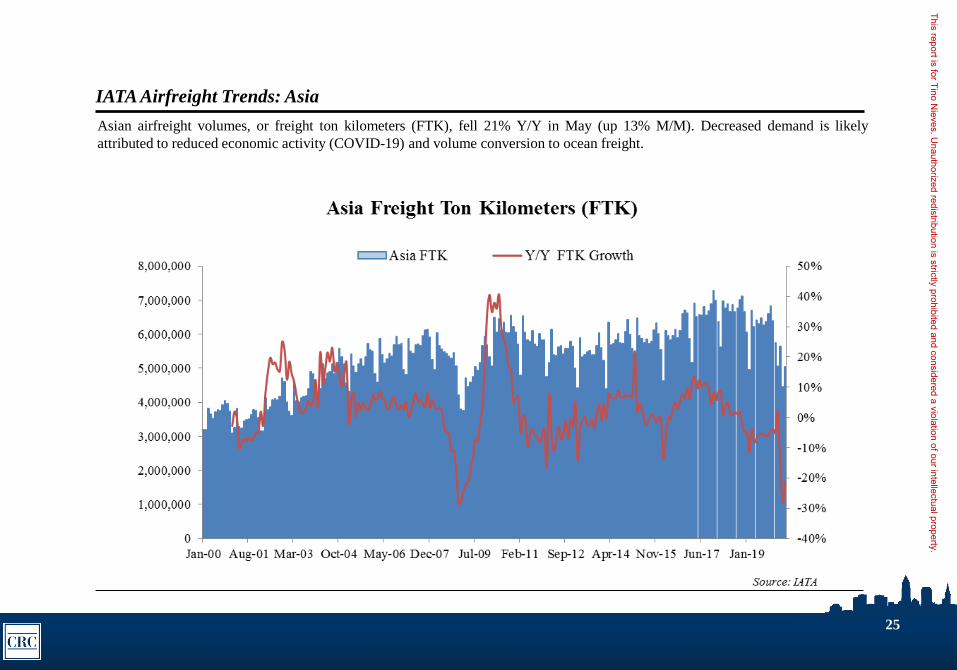
IATA Airfreight Trends: Asia
Asian airfreight volumes, or freight ton kilometers (FTK), fell 21% Y/Y in May (up 13% M/M). Decreased demand is likely
attributed to reduced economic activity (COVID-19) and volume conversion to ocean freight.
This report is for Tino Nieves. U
nauthorized redistribution is strictly prohibited and considered a violation of our intellectual property.
26
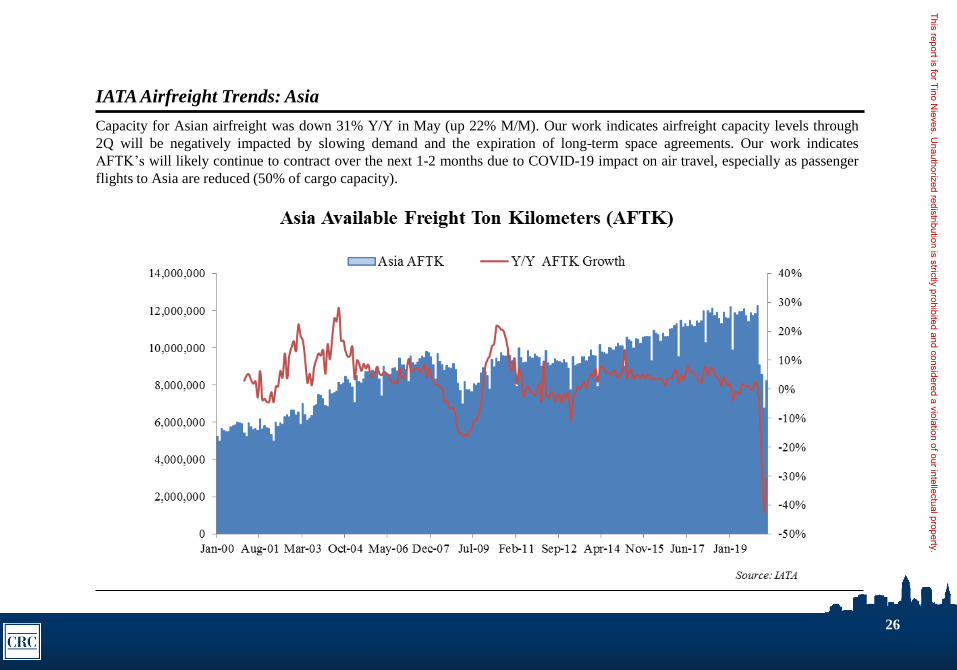
IATA Airfreight Trends: Asia
Capacity for Asian airfreight was down 31% Y/Y in May (up 22% M/M). Our work indicates airfreight capacity levels through
2Q will be negatively impacted by slowing demand and the expiration of long-term space agreements. Our work indicates
AFTK’s will likely continue to contract over the next 1-2 months due to COVID-19 impact on air travel, especially as passenger
flights to Asia are reduced (50% of cargo capacity).
This report is for Tino Nieves. U
nauthorized redistribution is strictly prohibited and considered a violation of our intellectual property.
International General Airfreight
Monthly Industry Trend Summary and Analysis
This report is for Tino Nieves. U
nauthorized redistribution is strictly prohibited and considered a violation of our intellectual property.
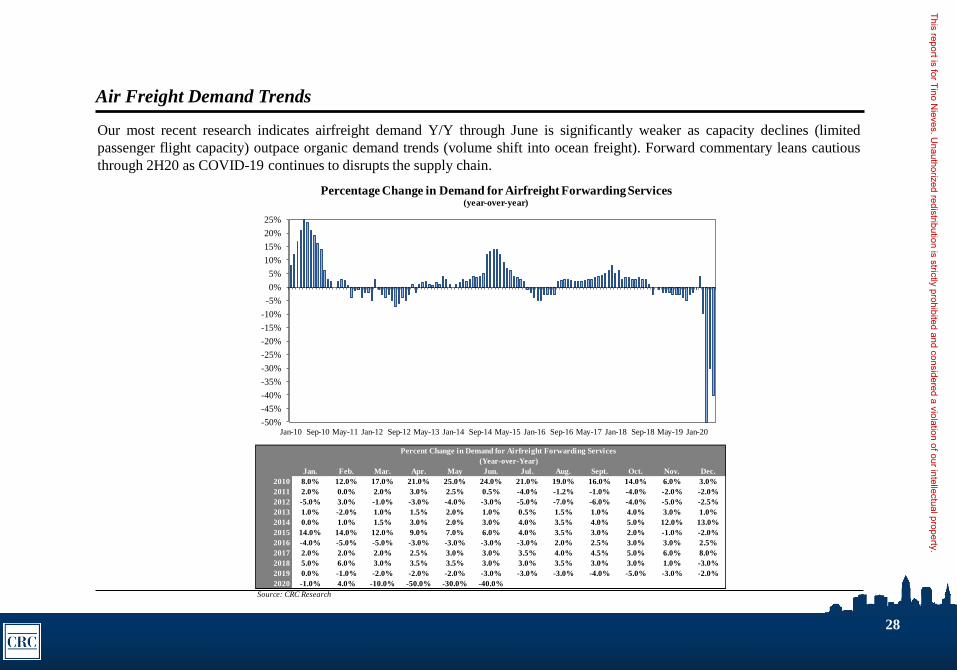
Our most recent research indicates airfreight demand Y/Y through June is significantly weaker as capacity declines (limited
passenger flight capacity) outpace organic demand trends (volume shift into ocean freight). Forward commentary leans cautious
through 2H20 as COVID-19 continues to disrupts the supply chain.
28
Air Freight Demand Trends
Jan. Feb. Mar. Apr. May Jun. Jul. Aug. Sept. Oct. Nov. Dec.
2010 8.0% 12.0% 17.0% 21.0% 25.0% 24.0% 21.0% 19.0% 16.0% 14.0% 6.0% 3.0%
2011 2.0% 0.0% 2.0% 3.0% 2.5% 0.5% -4.0% -1.2% -1.0% -4.0% -2.0% -2.0%
2012 -5.0% 3.0% -1.0% -3.0% -4.0% -3.0% -5.0% -7.0% -6.0% -4.0% -5.0% -2.5%
2013 1.0% -2.0% 1.0% 1.5% 2.0% 1.0% 0.5% 1.5% 1.0% 4.0% 3.0% 1.0%
2014 0.0% 1.0% 1.5% 3.0% 2.0% 3.0% 4.0% 3.5% 4.0% 5.0% 12.0% 13.0%
2015 14.0% 14.0% 12.0% 9.0% 7.0% 6.0% 4.0% 3.5% 3.0% 2.0% -1.0% -2.0%
2016 -4.0% -5.0% -5.0% -3.0% -3.0% -3.0% -3.0% 2.0% 2.5% 3.0% 3.0% 2.5%
2017 2.0% 2.0% 2.0% 2.5% 3.0% 3.0% 3.5% 4.0% 4.5% 5.0% 6.0% 8.0%
2018 5.0% 6.0% 3.0% 3.5% 3.5% 3.0% 3.0% 3.5% 3.0% 3.0% 1.0% -3.0%
2019 0.0% -1.0% -2.0% -2.0% -2.0% -3.0% -3.0% -3.0% -4.0% -5.0% -3.0% -2.0%
2020 -1.0% 4.0% -10.0% -50.0% -30.0% -40.0%
Source: CRC Research
Percent Change in Demand for Airfreight Forwarding Services
(Year-over-Year)
-50%
-45%
-40%
-35%
-30%
-25%
-20%
-15%
-10%
-5%
0%
5%
10%
15%
20%
25%
Jan-10 Sep-10 May-11 Jan-12 Sep-12 May-13 Jan-14 Sep-14 May-15 Jan-16 Sep-16 May-17 Jan-18 Sep-18 May-19 Jan-20
Percentage Change in Demand for Airfreight Forwarding Services(year-over-year)
This report is for Tino Nieves. U
nauthorized redistribution is strictly prohibited and considered a violation of our intellectual property.
29
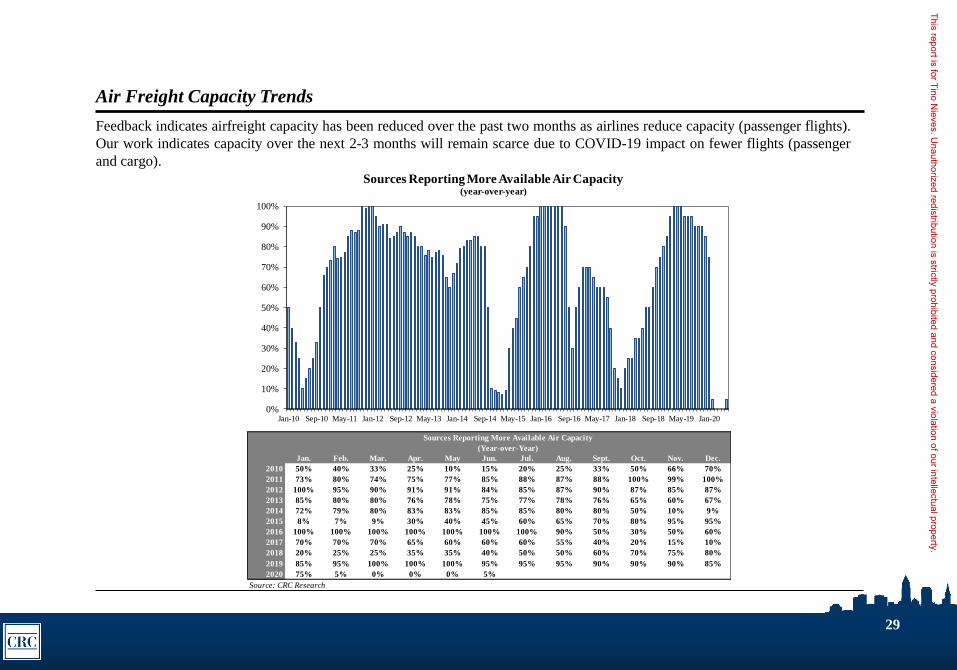
Air Freight Capacity Trends
Feedback indicates airfreight capacity has been reduced over the past two months as airlines reduce capacity (passenger flights).
Our work indicates capacity over the next 2-3 months will remain scarce due to COVID-19 impact on fewer flights (passenger
and cargo).
Jan. Feb. Mar. Apr. May Jun. Jul. Aug. Sept. Oct. Nov. Dec.
2010 50% 40% 33% 25% 10% 15% 20% 25% 33% 50% 66% 70%
2011 73% 80% 74% 75% 77% 85% 88% 87% 88% 100% 99% 100%
2012 100% 95% 90% 91% 91% 84% 85% 87% 90% 87% 85% 87%
2013 85% 80% 80% 76% 78% 75% 77% 78% 76% 65% 60% 67%
2014 72% 79% 80% 83% 83% 85% 85% 80% 80% 50% 10% 9%
2015 8% 7% 9% 30% 40% 45% 60% 65% 70% 80% 95% 95%
2016 100% 100% 100% 100% 100% 100% 100% 90% 50% 30% 50% 60%
2017 70% 70% 70% 65% 60% 60% 60% 55% 40% 20% 15% 10%
2018 20% 25% 25% 35% 35% 40% 50% 50% 60% 70% 75% 80%
2019 85% 95% 100% 100% 100% 95% 95% 95% 90% 90% 90% 85%
2020 75% 5% 0% 0% 0% 5%
Source: CRC Research
Sources Reporting More Available Air Capacity
(Year-over-Year)
0%
10%
20%
30%
40%
50%
60%
70%
80%
90%
100%
Jan-10 Sep-10 May-11 Jan-12 Sep-12 May-13 Jan-14 Sep-14 May-15 Jan-16 Sep-16 May-17 Jan-18 Sep-18 May-19 Jan-20
Sources Reporting More Available Air Capacity(year-over-year)
This report is for Tino Nieves. U
nauthorized redistribution is strictly prohibited and considered a violation of our intellectual property.
30
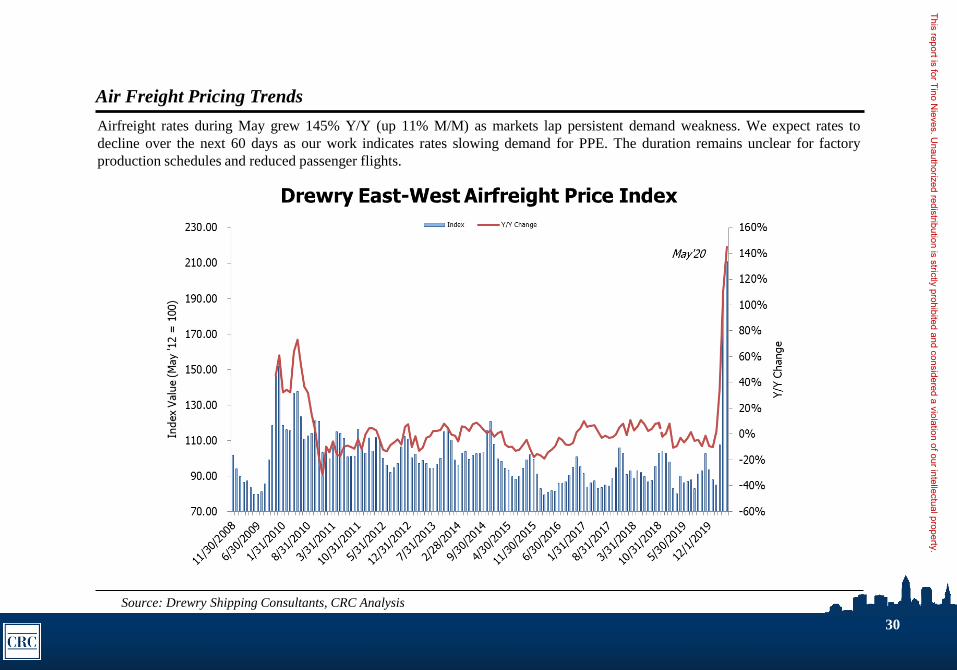
Air Freight Pricing Trends
Source: Drewry Shipping Consultants, CRC Analysis
Airfreight rates during May grew 145% Y/Y (up 11% M/M) as markets lap persistent demand weakness. We expect rates to
decline over the next 60 days as our work indicates rates slowing demand for PPE. The duration remains unclear for factory
production schedules and reduced passenger flights.
This report is for Tino Nieves. U
nauthorized redistribution is strictly prohibited and considered a violation of our intellectual property.
31
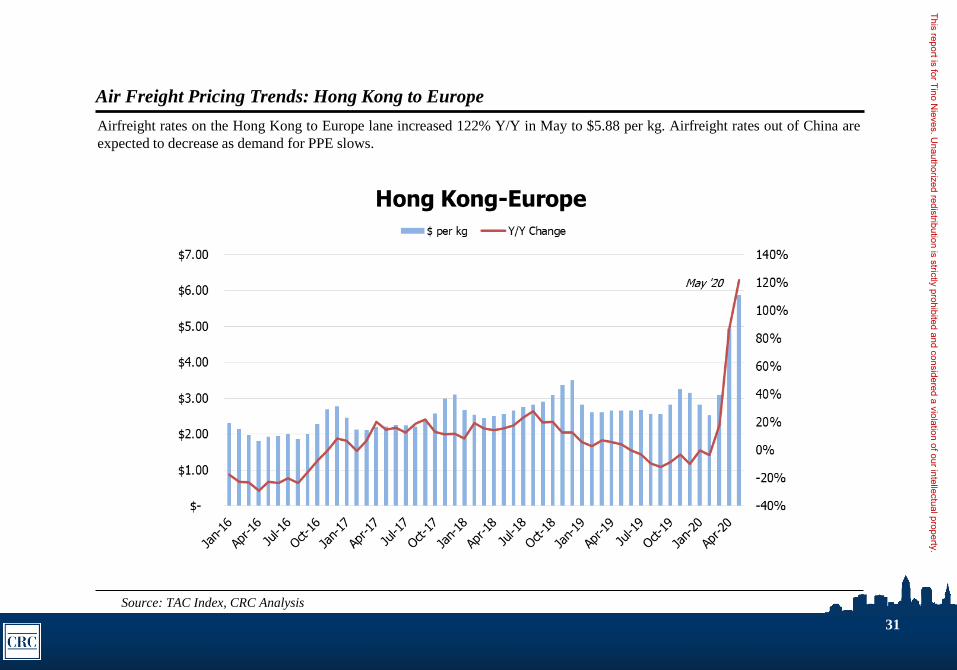
Air Freight Pricing Trends: Hong Kong to Europe
Airfreight rates on the Hong Kong to Europe lane increased 122% Y/Y in May to $5.88 per kg. Airfreight rates out of China are
expected to decrease as demand for PPE slows.
Source: TAC Index, CRC Analysis
This report is for Tino Nieves. U
nauthorized redistribution is strictly prohibited and considered a violation of our intellectual property.
32
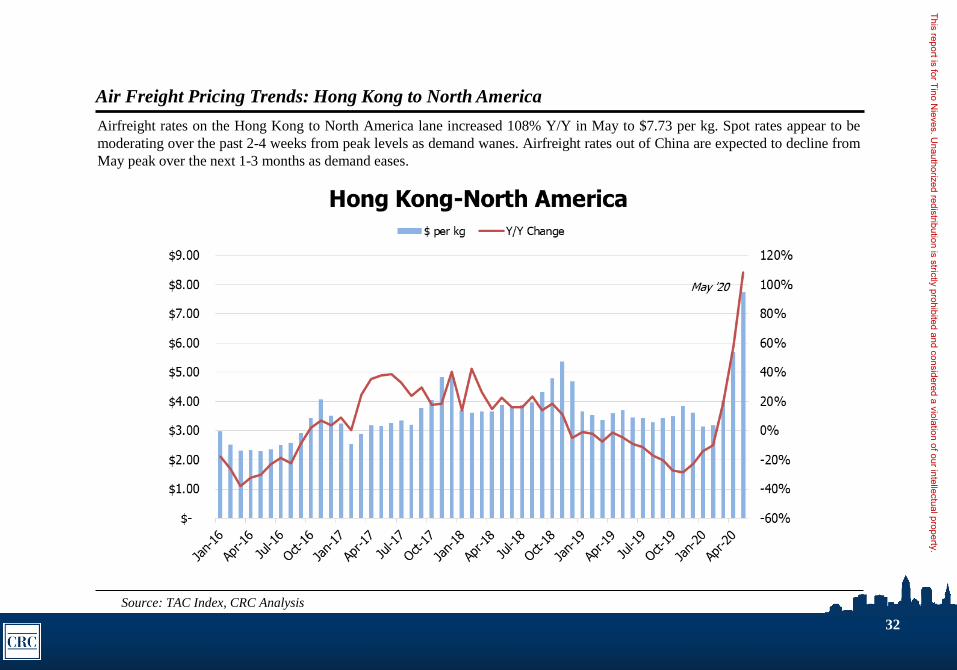
Air Freight Pricing Trends: Hong Kong to North America
Source: TAC Index, CRC Analysis
Airfreight rates on the Hong Kong to North America lane increased 108% Y/Y in May to $7.73 per kg. Spot rates appear to be
moderating over the past 2-4 weeks from peak levels as demand wanes. Airfreight rates out of China are expected to decline from
May peak over the next 1-3 months as demand eases.
This report is for Tino Nieves. U
nauthorized redistribution is strictly prohibited and considered a violation of our intellectual property.

33
Air Freight Pricing Trends: Frankfurt to North America
Airfreight rates on the Frankfurt to North America lane increased 68% Y/Y in April to $3.71 per kg (down 3% M/M). Airfreight
rates are expected to decline but likely remain elevated until backlogs may be meaningfully cleared and capacity tightness eases.
Source: TAC Index, CRC Analysis
This report is for Tino Nieves. U
nauthorized redistribution is strictly prohibited and considered a violation of our intellectual property.
34
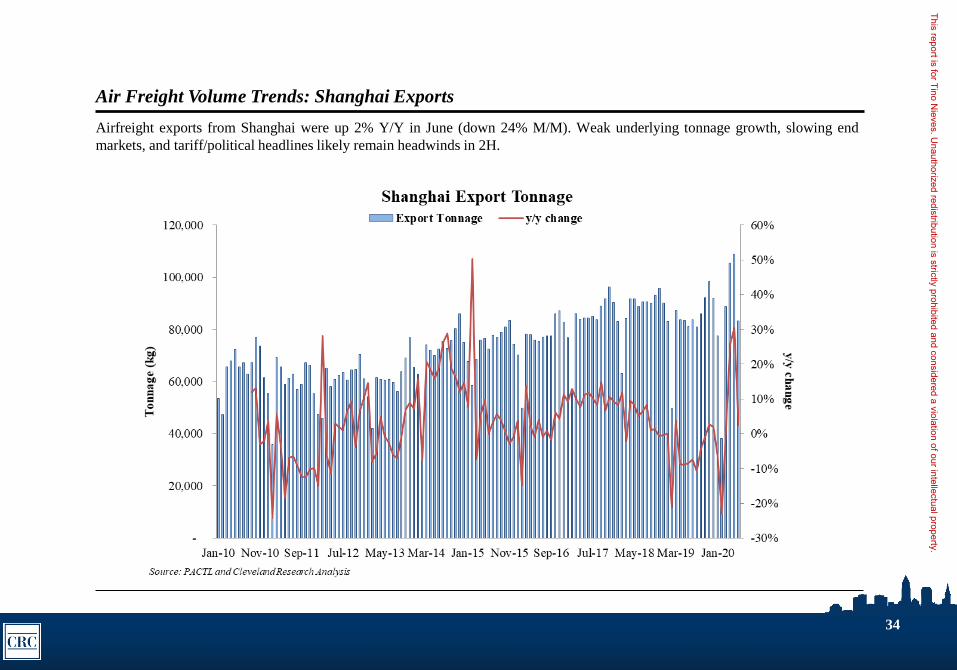
Air Freight Volume Trends: Shanghai Exports
Airfreight exports from Shanghai were up 2% Y/Y in June (down 24% M/M). Weak underlying tonnage growth, slowing end
markets, and tariff/political headlines likely remain headwinds in 2H.
This report is for Tino Nieves. U
nauthorized redistribution is strictly prohibited and considered a violation of our intellectual property.
35
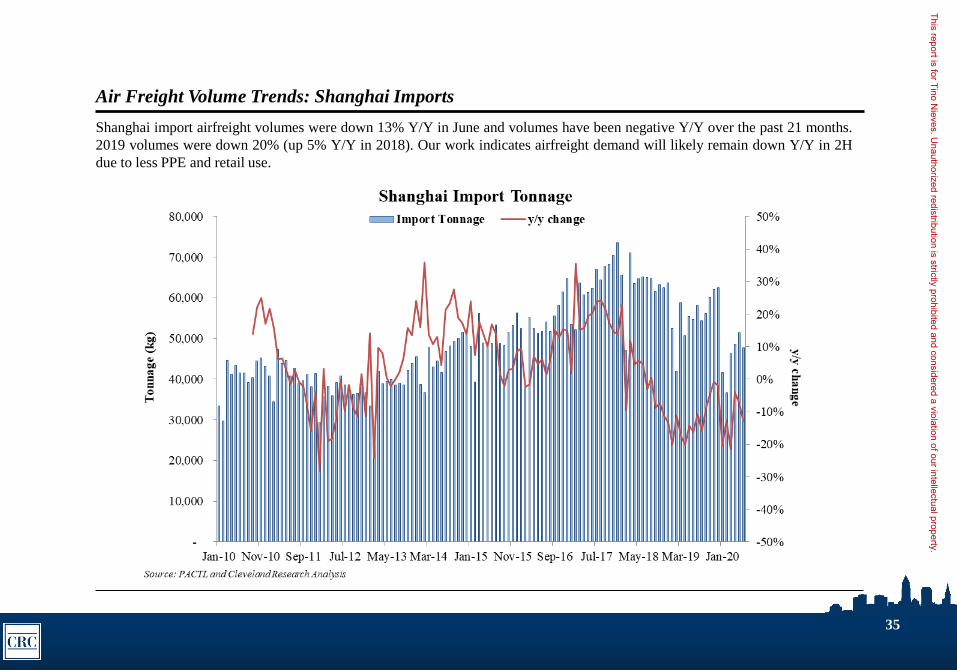
Air Freight Volume Trends: Shanghai Imports
Shanghai import airfreight volumes were down 13% Y/Y in June and volumes have been negative Y/Y over the past 21 months.
2019 volumes were down 20% (up 5% Y/Y in 2018). Our work indicates airfreight demand will likely remain down Y/Y in 2H
due to less PPE and retail use.
This report is for Tino Nieves. U
nauthorized redistribution is strictly prohibited and considered a violation of our intellectual property.
Trucking (Full-Truckload and Less-than-Truckload)
Monthly Industry Trend Summary and Analysis
This report is for Tino Nieves. U
nauthorized redistribution is strictly prohibited and considered a violation of our intellectual property.
37
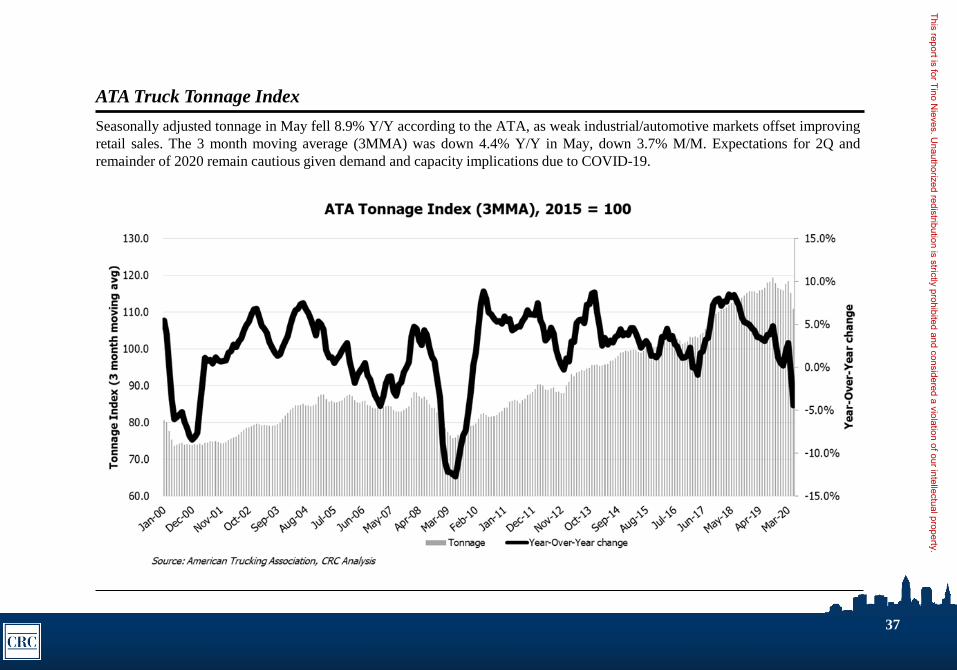
ATA Truck Tonnage Index
Seasonally adjusted tonnage in May fell 8.9% Y/Y according to the ATA, as weak industrial/automotive markets offset improving
retail sales. The 3 month moving average (3MMA) was down 4.4% Y/Y in May, down 3.7% M/M. Expectations for 2Q and
remainder of 2020 remain cautious given demand and capacity implications due to COVID-19.
This report is for Tino Nieves. U
nauthorized redistribution is strictly prohibited and considered a violation of our intellectual property.
38
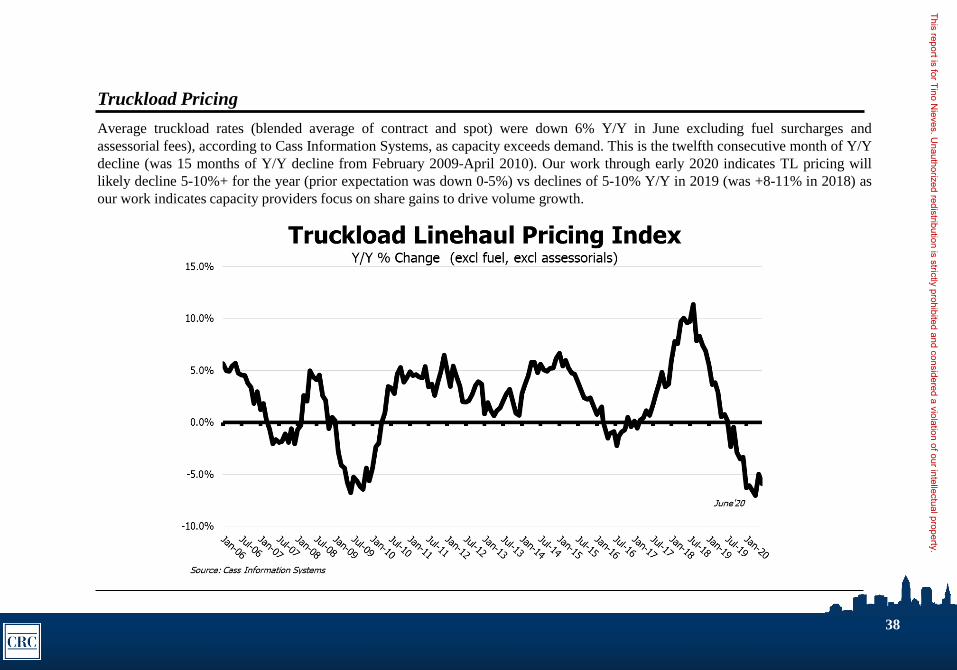
Truckload Pricing
Average truckload rates (blended average of contract and spot) were down 6% Y/Y in June excluding fuel surcharges and
assessorial fees), according to Cass Information Systems, as capacity exceeds demand. This is the twelfth consecutive month of Y/Y
decline (was 15 months of Y/Y decline from February 2009-April 2010). Our work through early 2020 indicates TL pricing will
likely decline 5-10%+ for the year (prior expectation was down 0-5%) vs declines of 5-10% Y/Y in 2019 (was +8-11% in 2018) as
our work indicates capacity providers focus on share gains to drive volume growth.
This report is for Tino Nieves. U
nauthorized redistribution is strictly prohibited and considered a violation of our intellectual property.
39
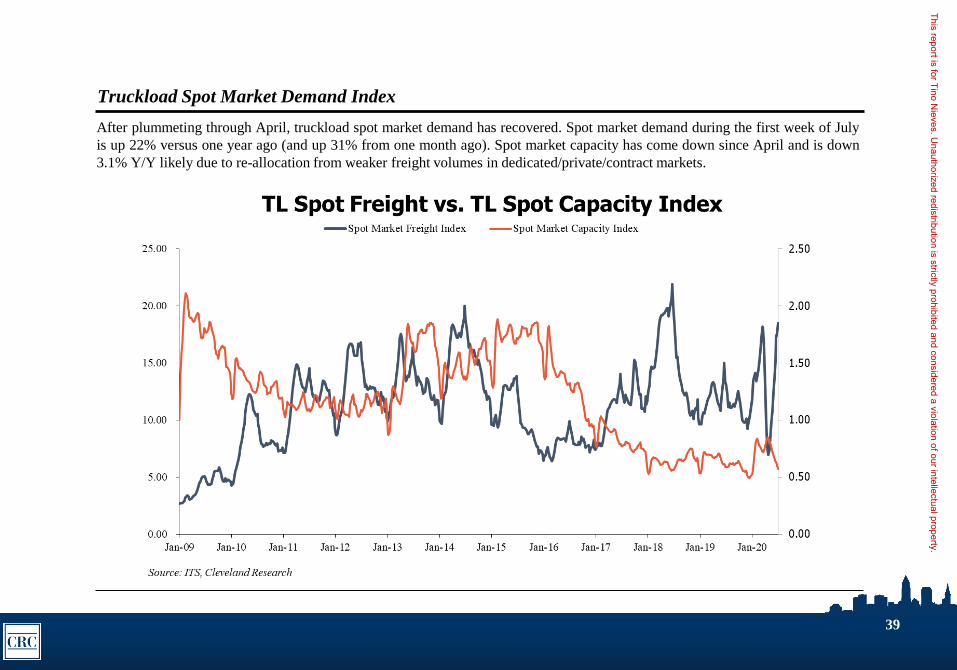
Truckload Spot Market Demand Index
After plummeting through April, truckload spot market demand has recovered. Spot market demand during the first week of July
is up 22% versus one year ago (and up 31% from one month ago). Spot market capacity has come down since April and is down
3.1% Y/Y likely due to re-allocation from weaker freight volumes in dedicated/private/contract markets.
This report is for Tino Nieves. U
nauthorized redistribution is strictly prohibited and considered a violation of our intellectual property.
40
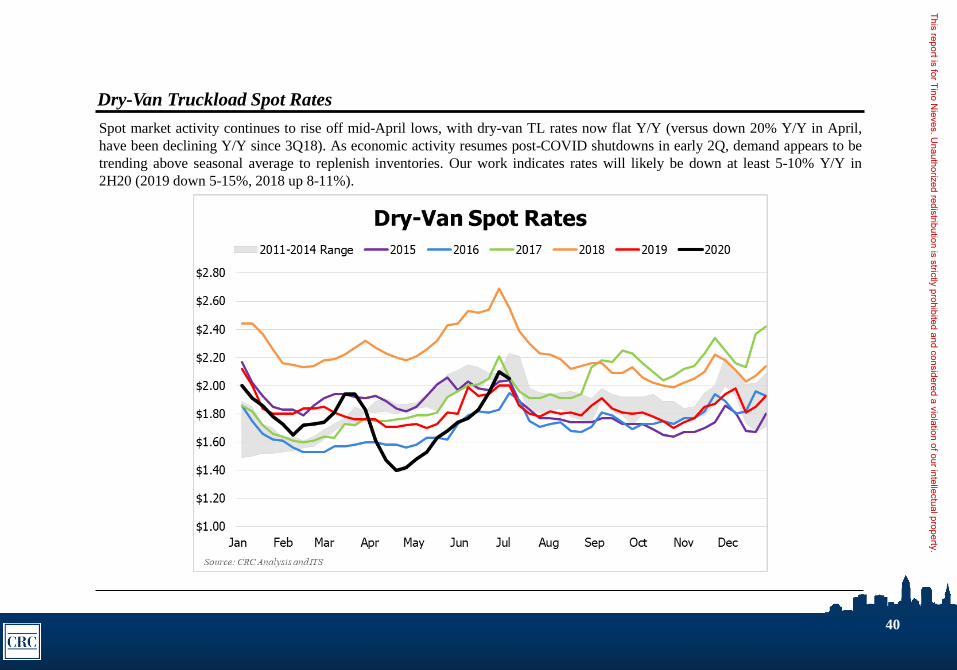
Dry-Van Truckload Spot Rates
Spot market activity continues to rise off mid-April lows, with dry-van TL rates now flat Y/Y (versus down 20% Y/Y in April,
have been declining Y/Y since 3Q18). As economic activity resumes post-COVID shutdowns in early 2Q, demand appears to be
trending above seasonal average to replenish inventories. Our work indicates rates will likely be down at least 5-10% Y/Y in
2H20 (2019 down 5-15%, 2018 up 8-11%).
This report is for Tino Nieves. U
nauthorized redistribution is strictly prohibited and considered a violation of our intellectual property.
41
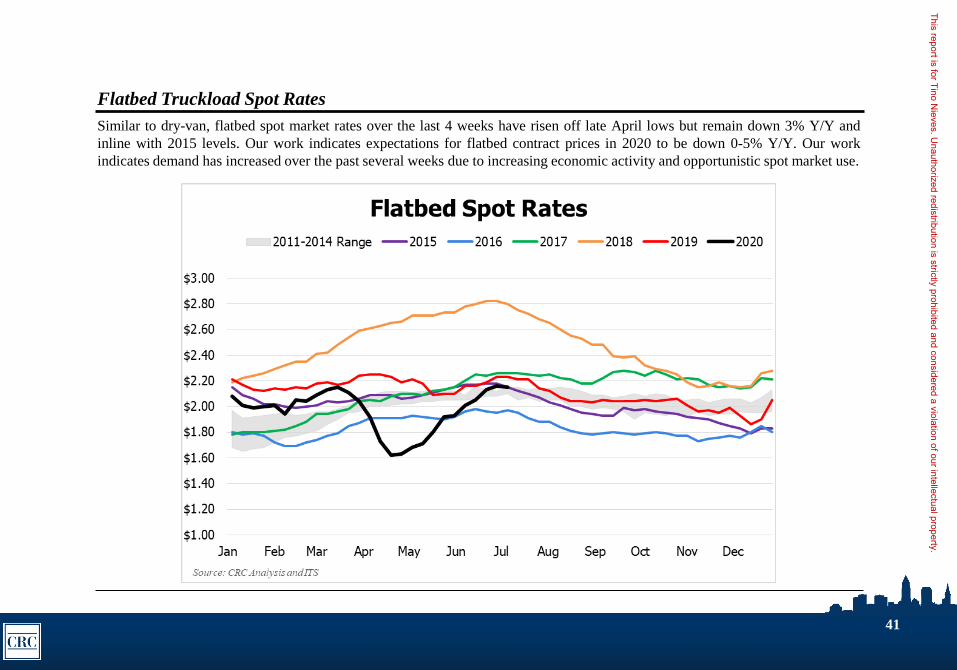
Flatbed Truckload Spot Rates
Similar to dry-van, flatbed spot market rates over the last 4 weeks have risen off late April lows but remain down 3% Y/Y and
inline with 2015 levels. Our work indicates expectations for flatbed contract prices in 2020 to be down 0-5% Y/Y. Our work
indicates demand has increased over the past several weeks due to increasing economic activity and opportunistic spot market use.
This report is for Tino Nieves. U
nauthorized redistribution is strictly prohibited and considered a violation of our intellectual property.
42
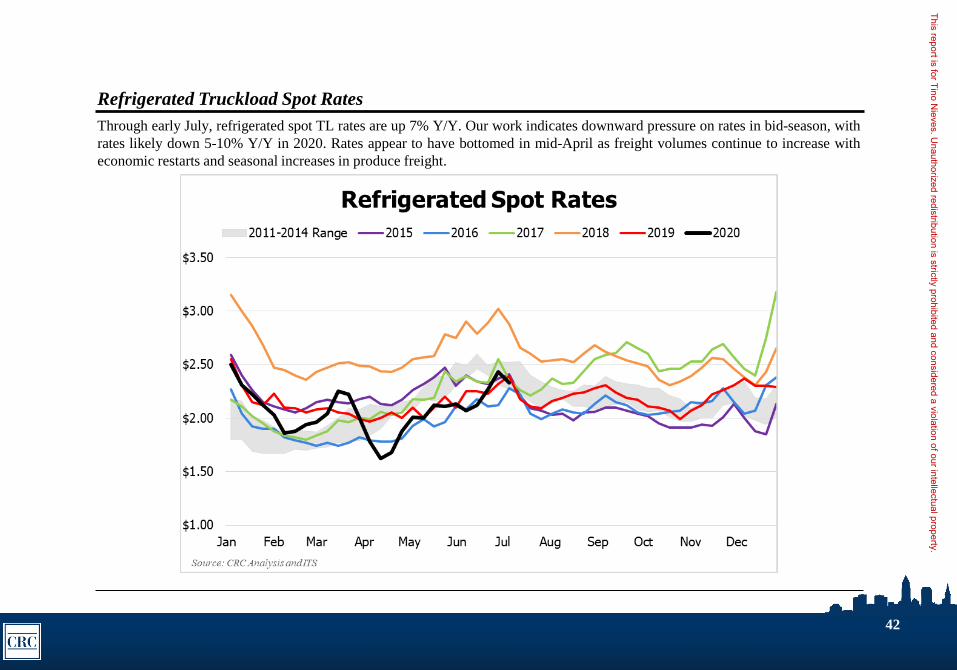
Refrigerated Truckload Spot Rates
Through early July, refrigerated spot TL rates are up 7% Y/Y. Our work indicates downward pressure on rates in bid-season, with
rates likely down 5-10% Y/Y in 2020. Rates appear to have bottomed in mid-April as freight volumes continue to increase with
economic restarts and seasonal increases in produce freight.
This report is for Tino Nieves. U
nauthorized redistribution is strictly prohibited and considered a violation of our intellectual property.
43
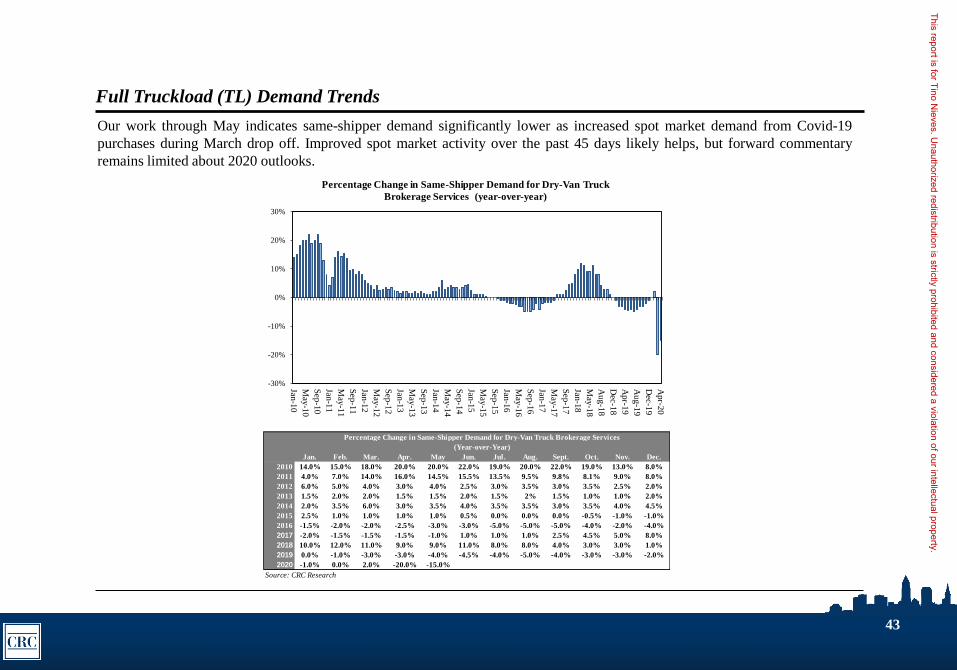
Full Truckload (TL) Demand Trends
Our work through May indicates same-shipper demand significantly lower as increased spot market demand from Covid-19
purchases during March drop off. Improved spot market activity over the past 45 days likely helps, but forward commentary
remains limited about 2020 outlooks.
Jan. Feb. Mar. Apr. May Jun. Jul. Aug. Sept. Oct. Nov. Dec.
2010 14.0% 15.0% 18.0% 20.0% 20.0% 22.0% 19.0% 20.0% 22.0% 19.0% 13.0% 8.0%
2011 4.0% 7.0% 14.0% 16.0% 14.5% 15.5% 13.5% 9.5% 9.8% 8.1% 9.0% 8.0%
2012 6.0% 5.0% 4.0% 3.0% 4.0% 2.5% 3.0% 3.5% 3.0% 3.5% 2.5% 2.0%
2013 1.5% 2.0% 2.0% 1.5% 1.5% 2.0% 1.5% 2% 1.5% 1.0% 1.0% 2.0%
2014 2.0% 3.5% 6.0% 3.0% 3.5% 4.0% 3.5% 3.5% 3.0% 3.5% 4.0% 4.5%
2015 2.5% 1.0% 1.0% 1.0% 1.0% 0.5% 0.0% 0.0% 0.0% -0.5% -1.0% -1.0%
2016 -1.5% -2.0% -2.0% -2.5% -3.0% -3.0% -5.0% -5.0% -5.0% -4.0% -2.0% -4.0%
2017 -2.0% -1.5% -1.5% -1.5% -1.0% 1.0% 1.0% 1.0% 2.5% 4.5% 5.0% 8.0%
2018 10.0% 12.0% 11.0% 9.0% 9.0% 11.0% 8.0% 8.0% 4.0% 3.0% 3.0% 1.0%
2019 0.0% -1.0% -3.0% -3.0% -4.0% -4.5% -4.0% -5.0% -4.0% -3.0% -3.0% -2.0%
2020 -1.0% 0.0% 2.0% -20.0% -15.0%
Source: CRC Research
Percentage Change in Same-Shipper Demand for Dry-Van Truck Brokerage Services
(Year-over-Year)
-30%
-20%
-10%
0%
10%
20%
30%
Jan-1
0
May
-10
Sep
-10
Jan-1
1
May
-11
Sep
-11
Jan-1
2
May
-12
Sep
-12
Jan-1
3
May
-13
Sep
-13
Jan-1
4
May
-14
Sep
-14
Jan-1
5
May
-15
Sep
-15
Jan-1
6
May
-16
Sep
-16
Jan-1
7
May
-17
Sep
-17
Jan-1
8
May
-18
Aug-1
8
Dec-1
8
Apr-1
9
Aug-1
9
Dec-1
9
Apr-2
0
Percentage Change in Same-Shipper Demand for Dry-Van Truck
Brokerage Services (year-over-year)
This report is for Tino Nieves. U
nauthorized redistribution is strictly prohibited and considered a violation of our intellectual property.
44
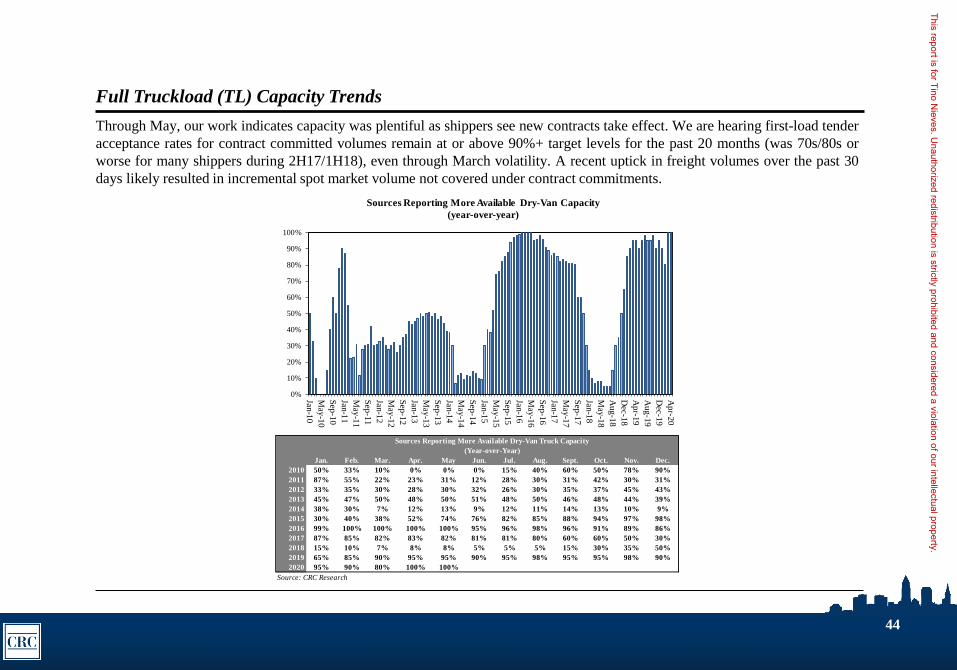
Full Truckload (TL) Capacity Trends
Through May, our work indicates capacity was plentiful as shippers see new contracts take effect. We are hearing first-load tender
acceptance rates for contract committed volumes remain at or above 90%+ target levels for the past 20 months (was 70s/80s or
worse for many shippers during 2H17/1H18), even through March volatility. A recent uptick in freight volumes over the past 30
days likely resulted in incremental spot market volume not covered under contract commitments.
Jan. Feb. Mar. Apr. May Jun. Jul. Aug. Sept. Oct. Nov. Dec.
2010 50% 33% 10% 0% 0% 0% 15% 40% 60% 50% 78% 90%
2011 87% 55% 22% 23% 31% 12% 28% 30% 31% 42% 30% 31%
2012 33% 35% 30% 28% 30% 32% 26% 30% 35% 37% 45% 43%
2013 45% 47% 50% 48% 50% 51% 48% 50% 46% 48% 44% 39%
2014 38% 30% 7% 12% 13% 9% 12% 11% 14% 13% 10% 9%
2015 30% 40% 38% 52% 74% 76% 82% 85% 88% 94% 97% 98%
2016 99% 100% 100% 100% 100% 95% 96% 98% 96% 91% 89% 86%
2017 87% 85% 82% 83% 82% 81% 81% 80% 60% 60% 50% 30%
2018 15% 10% 7% 8% 8% 5% 5% 5% 15% 30% 35% 50%
2019 65% 85% 90% 95% 95% 90% 95% 98% 95% 95% 98% 90%
2020 95% 90% 80% 100% 100%
Source: CRC Research
Sources Reporting More Available Dry-Van Truck Capacity
(Year-over-Year)
0%
10%
20%
30%
40%
50%
60%
70%
80%
90%
100%
Jan-1
0
May
-10
Sep
-10
Jan-1
1
May
-11
Sep
-11
Jan-1
2
May
-12
Sep
-12
Jan-1
3
May
-13
Sep
-13
Jan-1
4
May
-14
Sep
-14
Jan-1
5
May
-15
Sep
-15
Jan-1
6
May
-16
Sep
-16
Jan-1
7
May
-17
Sep
-17
Jan-1
8
May
-18
Aug-1
8
Dec-1
8
Apr-1
9
Aug-1
9
Dec-1
9
Apr-2
0
Sources Reporting More Available Dry-Van Capacity
(year-over-year)
This report is for Tino Nieves. U
nauthorized redistribution is strictly prohibited and considered a violation of our intellectual property.
45
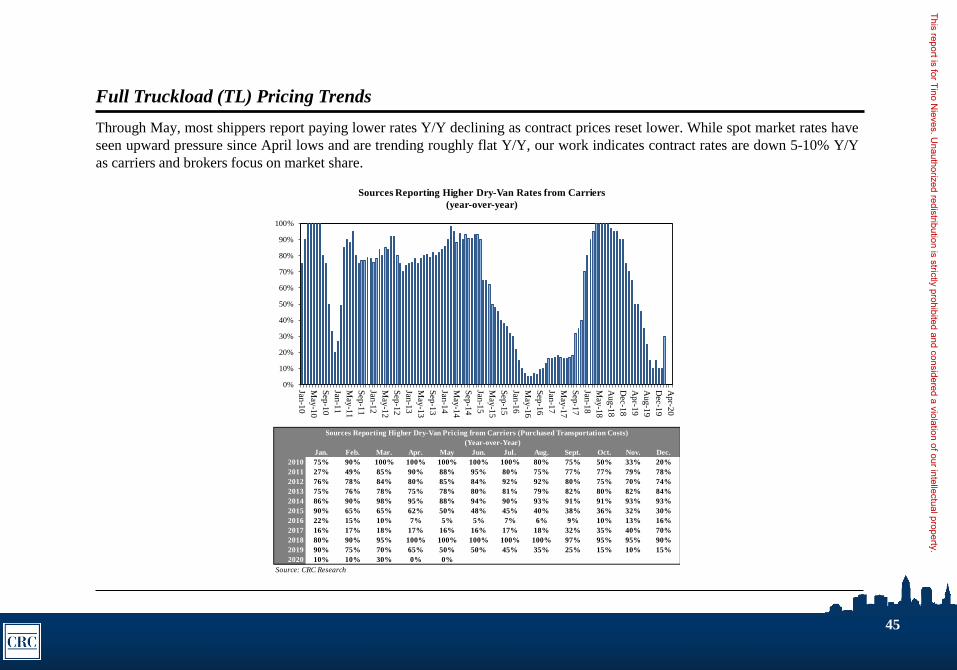
Full Truckload (TL) Pricing Trends
Through May, most shippers report paying lower rates Y/Y declining as contract prices reset lower. While spot market rates have
seen upward pressure since April lows and are trending roughly flat Y/Y, our work indicates contract rates are down 5-10% Y/Y
as carriers and brokers focus on market share.
Jan. Feb. Mar. Apr. May Jun. Jul. Aug. Sept. Oct. Nov. Dec.
2010 75% 90% 100% 100% 100% 100% 100% 80% 75% 50% 33% 20%
2011 27% 49% 85% 90% 88% 95% 80% 75% 77% 77% 79% 78%
2012 76% 78% 84% 80% 85% 84% 92% 92% 80% 75% 70% 74%
2013 75% 76% 78% 75% 78% 80% 81% 79% 82% 80% 82% 84%
2014 86% 90% 98% 95% 88% 94% 90% 93% 91% 91% 93% 93%
2015 90% 65% 65% 62% 50% 48% 45% 40% 38% 36% 32% 30%
2016 22% 15% 10% 7% 5% 5% 7% 6% 9% 10% 13% 16%
2017 16% 17% 18% 17% 16% 16% 17% 18% 32% 35% 40% 70%
2018 80% 90% 95% 100% 100% 100% 100% 100% 97% 95% 95% 90%
2019 90% 75% 70% 65% 50% 50% 45% 35% 25% 15% 10% 15%
2020 10% 10% 30% 0% 0%
Source: CRC Research
Sources Reporting Higher Dry-Van Pricing from Carriers (Purchased Transportation Costs)
(Year-over-Year)
0%
10%
20%
30%
40%
50%
60%
70%
80%
90%
100%
Jan-1
0
May
-10
Sep
-10
Jan-1
1
May
-11
Sep
-11
Jan-1
2
May
-12
Sep
-12
Jan-1
3
May
-13
Sep
-13
Jan-1
4
May
-14
Sep
-14
Jan-1
5
May
-15
Sep
-15
Jan-1
6
May
-16
Sep
-16
Jan-1
7
May
-17
Sep
-17
Jan-1
8
May
-18
Au
g-1
8
Dec-1
8
Ap
r-19
Au
g-1
9
Dec-1
9
Ap
r-20
Sources Reporting Higher Dry-Van Rates from Carriers
(year-over-year)
This report is for Tino Nieves. U
nauthorized redistribution is strictly prohibited and considered a violation of our intellectual property.
46
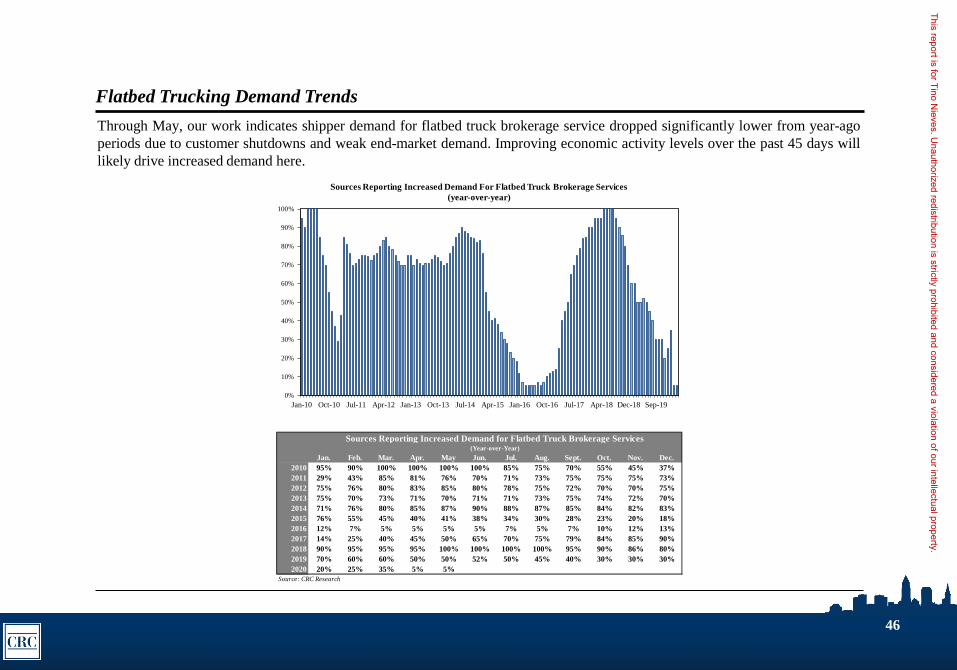
Flatbed Trucking Demand Trends
Through May, our work indicates shipper demand for flatbed truck brokerage service dropped significantly lower from year-ago
periods due to customer shutdowns and weak end-market demand. Improving economic activity levels over the past 45 days will
likely drive increased demand here.
Jan. Feb. Mar. Apr. May Jun. Jul. Aug. Sept. Oct. Nov. Dec.
2010 95% 90% 100% 100% 100% 100% 85% 75% 70% 55% 45% 37%
2011 29% 43% 85% 81% 76% 70% 71% 73% 75% 75% 75% 73%
2012 75% 76% 80% 83% 85% 80% 78% 75% 72% 70% 70% 75%
2013 75% 70% 73% 71% 70% 71% 71% 73% 75% 74% 72% 70%
2014 71% 76% 80% 85% 87% 90% 88% 87% 85% 84% 82% 83%
2015 76% 55% 45% 40% 41% 38% 34% 30% 28% 23% 20% 18%
2016 12% 7% 5% 5% 5% 5% 7% 5% 7% 10% 12% 13%
2017 14% 25% 40% 45% 50% 65% 70% 75% 79% 84% 85% 90%
2018 90% 95% 95% 95% 100% 100% 100% 100% 95% 90% 86% 80%
2019 70% 60% 60% 50% 50% 52% 50% 45% 40% 30% 30% 30%
2020 20% 25% 35% 5% 5%
Source: CRC Research
(Year-over-Year)
Sources Reporting Increased Demand for Flatbed Truck Brokerage Services
0%
10%
20%
30%
40%
50%
60%
70%
80%
90%
100%
Jan-10 Oct-10 Jul-11 Apr-12 Jan-13 Oct-13 Jul-14 Apr-15 Jan-16 Oct-16 Jul-17 Apr-18 Dec-18 Sep-19
Sources Reporting Increased Demand For Flatbed Truck Brokerage Services
(year-over-year)
This report is for Tino Nieves. U
nauthorized redistribution is strictly prohibited and considered a violation of our intellectual property.
47
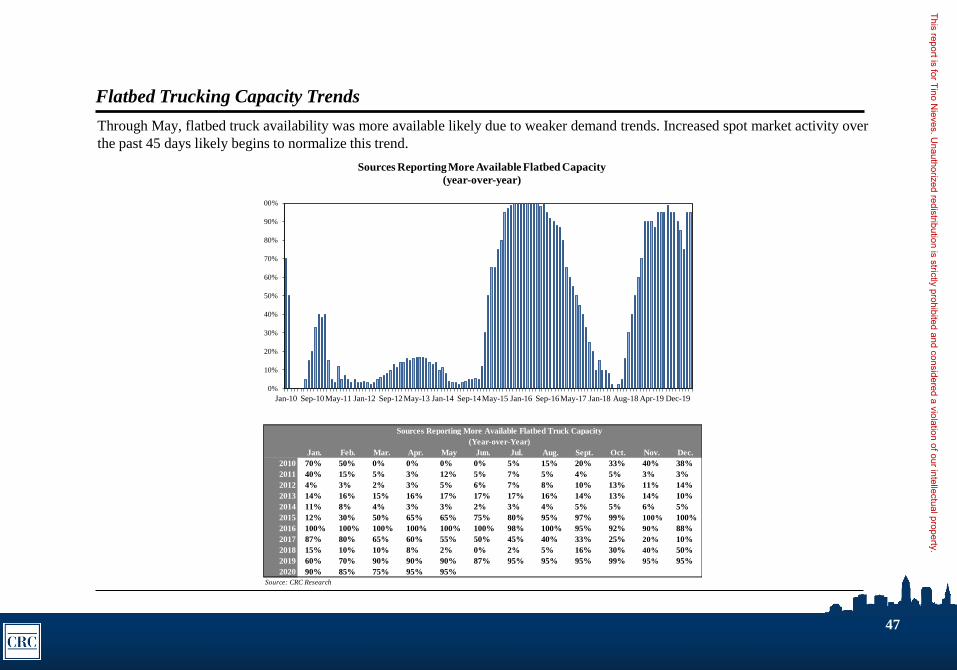
Flatbed Trucking Capacity Trends
Through May, flatbed truck availability was more available likely due to weaker demand trends. Increased spot market activity over
the past 45 days likely begins to normalize this trend.
Jan. Feb. Mar. Apr. May Jun. Jul. Aug. Sept. Oct. Nov. Dec.
2010 70% 50% 0% 0% 0% 0% 5% 15% 20% 33% 40% 38%
2011 40% 15% 5% 3% 12% 5% 7% 5% 4% 5% 3% 3%
2012 4% 3% 2% 3% 5% 6% 7% 8% 10% 13% 11% 14%
2013 14% 16% 15% 16% 17% 17% 17% 16% 14% 13% 14% 10%
2014 11% 8% 4% 3% 3% 2% 3% 4% 5% 5% 6% 5%
2015 12% 30% 50% 65% 65% 75% 80% 95% 97% 99% 100% 100%
2016 100% 100% 100% 100% 100% 100% 98% 100% 95% 92% 90% 88%
2017 87% 80% 65% 60% 55% 50% 45% 40% 33% 25% 20% 10%
2018 15% 10% 10% 8% 2% 0% 2% 5% 16% 30% 40% 50%
2019 60% 70% 90% 90% 90% 87% 95% 95% 95% 99% 95% 95%
2020 90% 85% 75% 95% 95%
Source: CRC Research
Sources Reporting More Available Flatbed Truck Capacity
(Year-over-Year)
0%
10%
20%
30%
40%
50%
60%
70%
80%
90%
100%
Jan-10 Sep-10May-11 Jan-12 Sep-12May-13 Jan-14 Sep-14May-15 Jan-16 Sep-16May-17 Jan-18 Aug-18 Apr-19 Dec-19
Sources Reporting More Available Flatbed Capacity
(year-over-year)
This report is for Tino Nieves. U
nauthorized redistribution is strictly prohibited and considered a violation of our intellectual property.
48
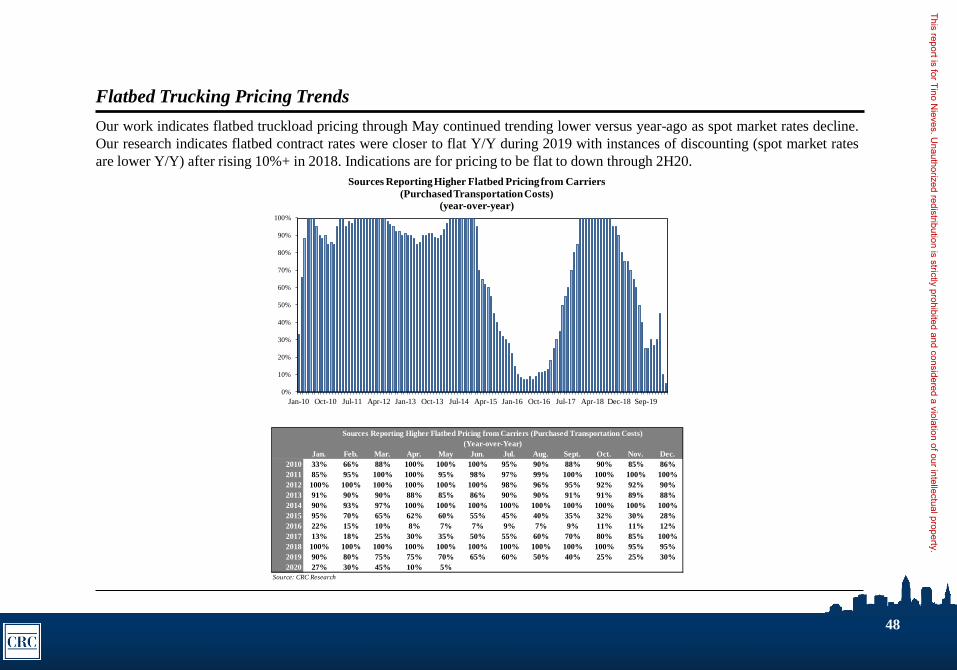
Flatbed Trucking Pricing Trends
Our work indicates flatbed truckload pricing through May continued trending lower versus year-ago as spot market rates decline.
Our research indicates flatbed contract rates were closer to flat Y/Y during 2019 with instances of discounting (spot market rates
are lower Y/Y) after rising 10%+ in 2018. Indications are for pricing to be flat to down through 2H20.
Jan. Feb. Mar. Apr. May Jun. Jul. Aug. Sept. Oct. Nov. Dec.
2010 33% 66% 88% 100% 100% 100% 95% 90% 88% 90% 85% 86%
2011 85% 95% 100% 100% 95% 98% 97% 99% 100% 100% 100% 100%
2012 100% 100% 100% 100% 100% 100% 98% 96% 95% 92% 92% 90%
2013 91% 90% 90% 88% 85% 86% 90% 90% 91% 91% 89% 88%
2014 90% 93% 97% 100% 100% 100% 100% 100% 100% 100% 100% 100%
2015 95% 70% 65% 62% 60% 55% 45% 40% 35% 32% 30% 28%
2016 22% 15% 10% 8% 7% 7% 9% 7% 9% 11% 11% 12%
2017 13% 18% 25% 30% 35% 50% 55% 60% 70% 80% 85% 100%
2018 100% 100% 100% 100% 100% 100% 100% 100% 100% 100% 95% 95%
2019 90% 80% 75% 75% 70% 65% 60% 50% 40% 25% 25% 30%
2020 27% 30% 45% 10% 5%
Source: CRC Research
Sources Reporting Higher Flatbed Pricing from Carriers (Purchased Transportation Costs)
(Year-over-Year)
0%
10%
20%
30%
40%
50%
60%
70%
80%
90%
100%
Jan-10 Oct-10 Jul-11 Apr-12 Jan-13 Oct-13 Jul-14 Apr-15 Jan-16 Oct-16 Jul-17 Apr-18 Dec-18 Sep-19
Sources Reporting Higher Flatbed Pricing from Carriers
(Purchased Transportation Costs)(year-over-year)
This report is for Tino Nieves. U
nauthorized redistribution is strictly prohibited and considered a violation of our intellectual property.
49
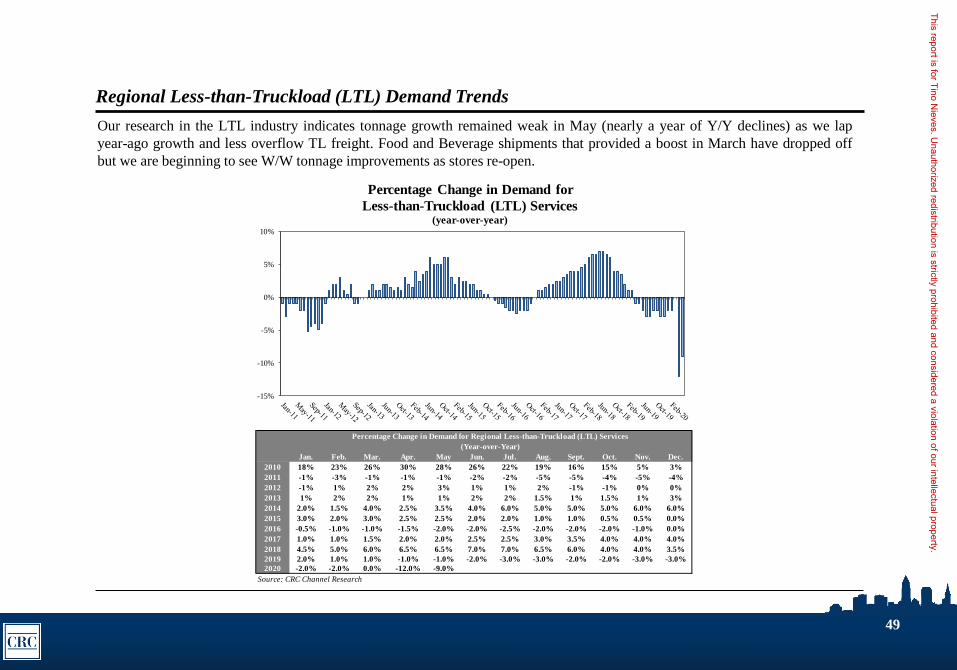
Regional Less-than-Truckload (LTL) Demand Trends
Our research in the LTL industry indicates tonnage growth remained weak in May (nearly a year of Y/Y declines) as we lap
year-ago growth and less overflow TL freight. Food and Beverage shipments that provided a boost in March have dropped off
but we are beginning to see W/W tonnage improvements as stores re-open.
Jan. Feb. Mar. Apr. May Jun. Jul. Aug. Sept. Oct. Nov. Dec. Jan. Feb. Mar. Apr. May Jun. Jul. Aug. Sept. Oct. Nov. Dec.
2010 18% 23% 26% 30% 28% 26% 22% 19% 16% 15% 5% 3% 2010 66% 66% 50% 25% 10% 0% 0% 0% 5% 5% 0% 0%
2011 -1% -3% -1% -1% -1% -2% -2% -5% -5% -4% -5% -4% 2011 0% 0% 0% 0% 0% 0% 0% 0% 0% 0% 0% 0%
2012 -1% 1% 2% 2% 3% 1% 1% 2% -1% -1% 0% 0% 2012 0% 2% 1% 1% 2% 1% 2% 1% 2% 4% 4% 5%
2013 1% 2% 2% 1% 1% 2% 2% 1.5% 1% 1.5% 1% 3% 2013 5% 5% 4% 6% 6% 6% 8% 7% 5% 8% 10% 12%
2014 2.0% 1.5% 4.0% 2.5% 3.5% 4.0% 6.0% 5.0% 5.0% 5.0% 6.0% 6.0% 2014 12% 10% 7% 5% 3% 2% 0% 0% 0% 0% 0% 0%
2015 3.0% 2.0% 3.0% 2.5% 2.5% 2.0% 2.0% 1.0% 1.0% 0.5% 0.5% 0.0% 2015 1% 2% 1% 4% 7% 10% 12% 20% 22% 25% 29% 30%
2016 -0.5% -1.0% -1.0% -1.5% -2.0% -2.0% -2.5% -2.0% -2.0% -2.0% -1.0% 0.0% 2016 31% 35% 38% 38% 40% 40% 42% 43% 48% 51% 50% 51%
2017 1.0% 1.0% 1.5% 2.0% 2.0% 2.5% 2.5% 3.0% 3.5% 4.0% 4.0% 4.0% 2017 50% 50% 50% 49% 49% 49% 47% 44% 42% 35% 30% 25%
2018 4.5% 5.0% 6.0% 6.5% 6.5% 7.0% 7.0% 6.5% 6.0% 4.0% 4.0% 3.5% 2018 15% 10% 8% 4% 0% 0% 0% 0% 0% 0% 0% 0%
2019 2.0% 1.0% 1.0% -1.0% -1.0% -2.0% -3.0% -3.0% -2.0% -2.0% -3.0% -3.0% 2019 0% 0% 0% 2% 5% 10% 10% 10% 10% 10% 12% 13%
2020 -2.0% -2.0% 0.0% -12.0% -9.0% 2020 13% 15% 18% 22% 25%
Source: CRC Channel Research Source: CRC Channel Research
Sources Reporting More Aggressive Pricing (Greater Discounts) for Regional Less-than-Truckload Services
(Year-over-Year)
Percentage Change in Demand for Regional Less-than-Truckload (LTL) Services
(Year-over-Year)
-15%
-10%
-5%
0%
5%
10%
Percentage Change in Demand for
Less-than-Truckload (LTL) Services(year-over-year)
0%
10%
20%
30%
40%
50%
60%
Sources Reporting Greater Discounts
for LTL Services
This report is for Tino Nieves. U
nauthorized redistribution is strictly prohibited and considered a violation of our intellectual property.
50
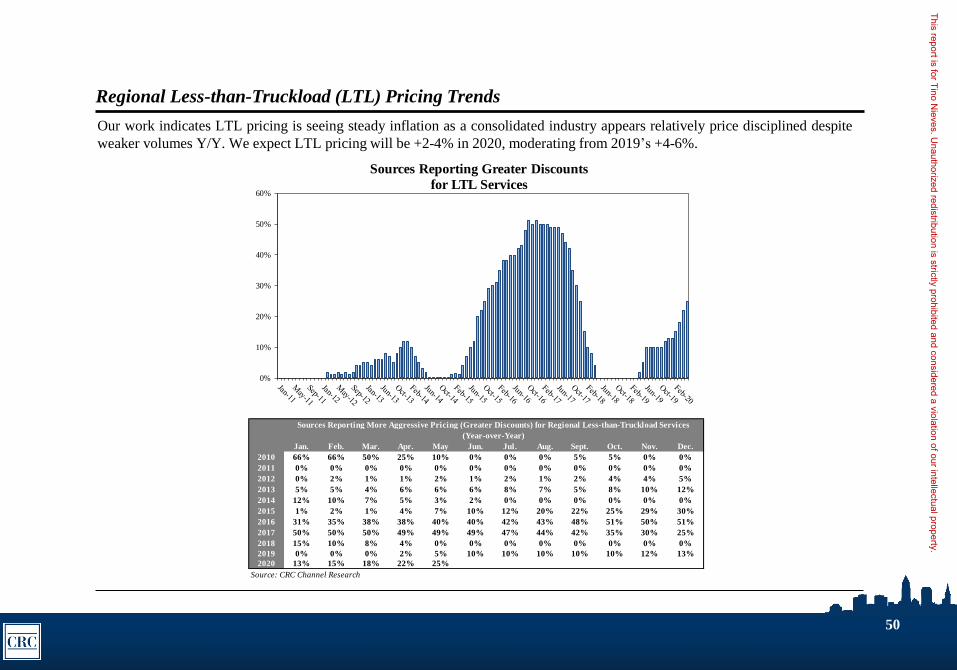
Regional Less-than-Truckload (LTL) Pricing Trends
Our work indicates LTL pricing is seeing steady inflation as a consolidated industry appears relatively price disciplined despite
weaker volumes Y/Y. We expect LTL pricing will be +2-4% in 2020, moderating from 2019’s +4-6%.Oct-09
Nov-09
Dec-09
Jan-10
Feb-10
Mar-10
Apr-10
May-10
Jun-10
Jul-10
Aug-10
Sep-10
Oct-10
Nov-10
Dec-10
Jan-11
Feb-11
Mar-11
Apr-11
May-11
Jun-11
Jul-11
Aug-11
Sep-11
Oct-11
Nov-11
Dec-11
Jan. Feb. Mar. Apr. May Jun. Jul. Aug. Sept. Oct. Nov. Dec. Jan-12
2010 66% 66% 50% 25% 10% 0% 0% 0% 5% 5% 0% 0% Feb-12
2011 0% 0% 0% 0% 0% 0% 0% 0% 0% 0% 0% 0% Mar-12
2012 0% 2% 1% 1% 2% 1% 2% 1% 2% 4% 4% 5% Apr-12
2013 5% 5% 4% 6% 6% 6% 8% 7% 5% 8% 10% 12% May-12
2014 12% 10% 7% 5% 3% 2% 0% 0% 0% 0% 0% 0% Jun-12
2015 1% 2% 1% 4% 7% 10% 12% 20% 22% 25% 29% 30% Jul-12
2016 31% 35% 38% 38% 40% 40% 42% 43% 48% 51% 50% 51% Aug-12
2017 50% 50% 50% 49% 49% 49% 47% 44% 42% 35% 30% 25% Sep-12
2018 15% 10% 8% 4% 0% 0% 0% 0% 0% 0% 0% 0% Oct-12
2019 0% 0% 0% 2% 5% 10% 10% 10% 10% 10% 12% 13% Nov-12
2020 13% 15% 18% 22% 25% Dec-12
Source: CRC Channel Research Jan-13
Feb-13
Mar-13
Apr-13
May-13
Jun-13
Jul-13
Aug-13
Sep-13
Oct-13
Nov-13
Dec-13
Jan-14
Feb-14
Mar-14
Apr-14
Sources Reporting More Aggressive Pricing (Greater Discounts) for Regional Less-than-Truckload Services
(Year-over-Year)
0%
10%
20%
30%
40%
50%
60%
Sources Reporting Greater Discounts
for LTL Services
This report is for Tino Nieves. U
nauthorized redistribution is strictly prohibited and considered a violation of our intellectual property.
51
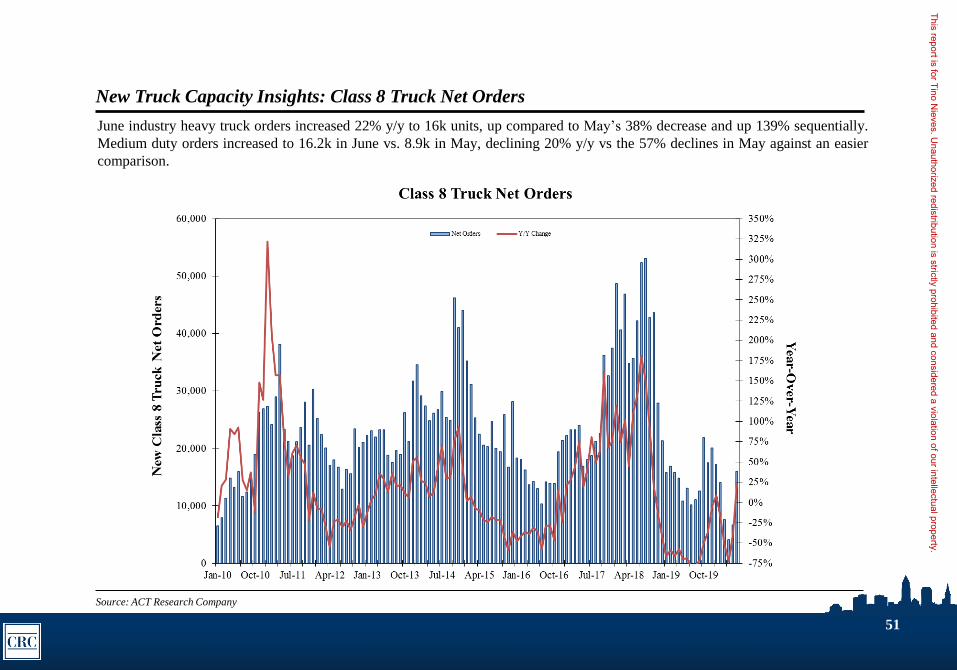
New Truck Capacity Insights: Class 8 Truck Net Orders
June industry heavy truck orders increased 22% y/y to 16k units, up compared to May’s 38% decrease and up 139% sequentially.
Medium duty orders increased to 16.2k in June vs. 8.9k in May, declining 20% y/y vs the 57% declines in May against an easier
comparison.
Source: ACT Research Company
This report is for Tino Nieves. U
nauthorized redistribution is strictly prohibited and considered a violation of our intellectual property.
52
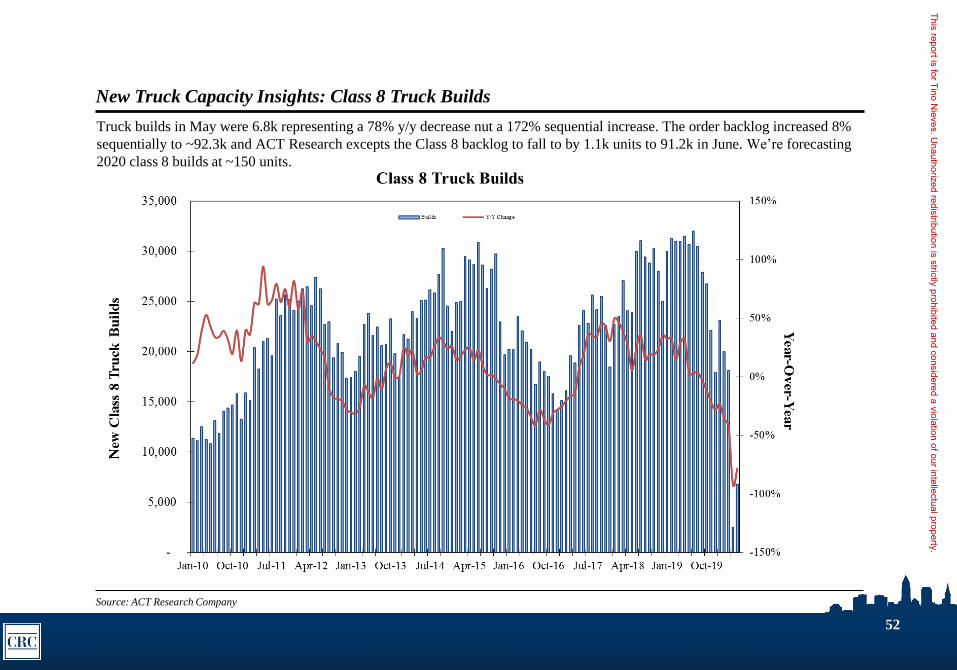
New Truck Capacity Insights: Class 8 Truck Builds
Truck builds in May were 6.8k representing a 78% y/y decrease nut a 172% sequential increase. The order backlog increased 8%
sequentially to ~92.3k and ACT Research excepts the Class 8 backlog to fall to by 1.1k units to 91.2k in June. We’re forecasting
2020 class 8 builds at ~150 units.
Source: ACT Research Company
This report is for Tino Nieves. U
nauthorized redistribution is strictly prohibited and considered a violation of our intellectual property.
Railroad
Monthly Industry Trend Summary and Analysis
This report is for Tino Nieves. U
nauthorized redistribution is strictly prohibited and considered a violation of our intellectual property.
54
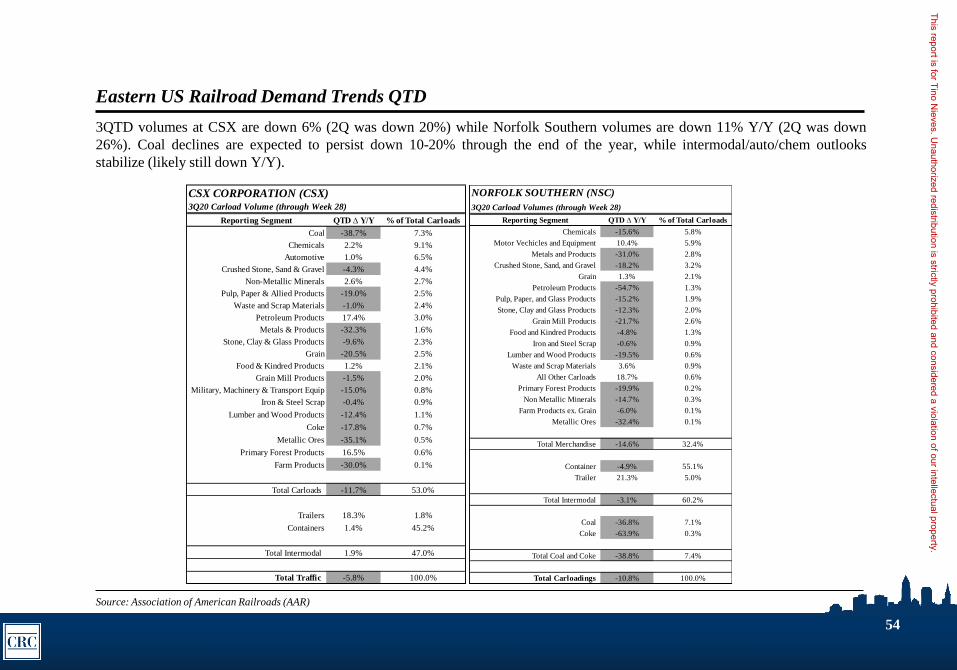
Eastern US Railroad Demand Trends QTD
Source: Association of American Railroads (AAR)
3QTD volumes at CSX are down 6% (2Q was down 20%) while Norfolk Southern volumes are down 11% Y/Y (2Q was down
26%). Coal declines are expected to persist down 10-20% through the end of the year, while intermodal/auto/chem outlooks
stabilize (likely still down Y/Y).
CSX CORPORATION (CSX) 3Q20 Carload Volume (through Week 28)
Reporting Segment QTD ∆ Y/Y % of Total Carloads
Coal -38.7% 7.3%
Chemicals 2.2% 9.1%
Automotive 1.0% 6.5%
Crushed Stone, Sand & Gravel -4.3% 4.4%
Non-Metallic Minerals 2.6% 2.7%
Pulp, Paper & Allied Products -19.0% 2.5%
Waste and Scrap Materials -1.0% 2.4%
Petroleum Products 17.4% 3.0%
Metals & Products -32.3% 1.6%
Stone, Clay & Glass Products -9.6% 2.3%
Grain -20.5% 2.5%
Food & Kindred Products 1.2% 2.1%
Grain Mill Products -1.5% 2.0%
Military, Machinery & Transport Equip -15.0% 0.8%
Iron & Steel Scrap -0.4% 0.9%
Lumber and Wood Products -12.4% 1.1%
Coke -17.8% 0.7%
Metallic Ores -35.1% 0.5%
Primary Forest Products 16.5% 0.6%
Farm Products -30.0% 0.1%
Total Carloads -11.7% 53.0%
Trailers 18.3% 1.8%
Containers 1.4% 45.2%
Total Intermodal 1.9% 47.0%
Total Traffic -5.8% 100.0%
NORFOLK SOUTHERN (NSC)
3Q20 Carload Volumes (through Week 28)
Reporting Segment QTD ∆ Y/Y % of Total Carloads
Chemicals -15.6% 5.8%
Motor Vechicles and Equipment 10.4% 5.9%
Metals and Products -31.0% 2.8%
Crushed Stone, Sand, and Gravel -18.2% 3.2%
Grain 1.3% 2.1%
Petroleum Products -54.7% 1.3%
Pulp, Paper, and Glass Products -15.2% 1.9%
Stone, Clay and Glass Products -12.3% 2.0%
Grain Mill Products -21.7% 2.6%
Food and Kindred Products -4.8% 1.3%
Iron and Steel Scrap -0.6% 0.9%
Lumber and Wood Products -19.5% 0.6%
Waste and Scrap Materials 3.6% 0.9%
All Other Carloads 18.7% 0.6%
Primary Forest Products -19.9% 0.2%
Non Metallic Minerals -14.7% 0.3%
Farm Products ex. Grain -6.0% 0.1%
Metallic Ores -32.4% 0.1%
Total Merchandise -14.6% 32.4%
Container -4.9% 55.1%
Trailer 21.3% 5.0%
Total Intermodal -3.1% 60.2%
Coal -36.8% 7.1%
Coke -63.9% 0.3%
Total Coal and Coke -38.8% 7.4%
Total Carloadings -10.8% 100.0%
This report is for Tino Nieves. U
nauthorized redistribution is strictly prohibited and considered a violation of our intellectual property.
55
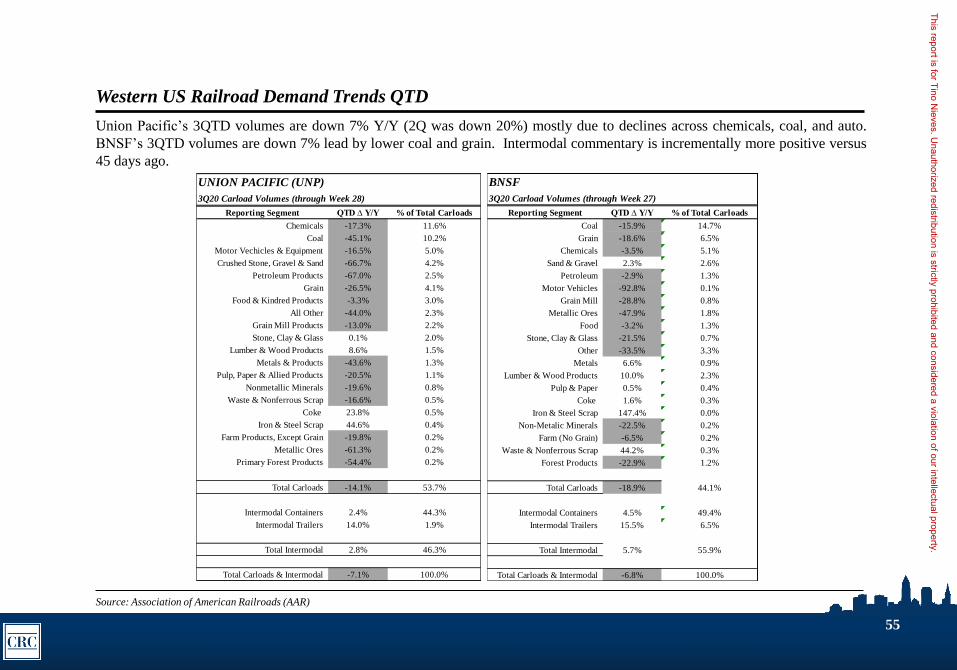
Western US Railroad Demand Trends QTD
Source: Association of American Railroads (AAR)
Union Pacific’s 3QTD volumes are down 7% Y/Y (2Q was down 20%) mostly due to declines across chemicals, coal, and auto.
BNSF’s 3QTD volumes are down 7% lead by lower coal and grain. Intermodal commentary is incrementally more positive versus
45 days ago.
UNION PACIFIC (UNP)
3Q20 Carload Volumes (through Week 28)
Reporting Segment QTD ∆ Y/Y % of Total Carloads
Chemicals -17.3% 11.6%
Coal -45.1% 10.2%
Motor Vechicles & Equipment -16.5% 5.0%
Crushed Stone, Gravel & Sand -66.7% 4.2%
Petroleum Products -67.0% 2.5%
Grain -26.5% 4.1%
Food & Kindred Products -3.3% 3.0%
All Other -44.0% 2.3%
Grain Mill Products -13.0% 2.2%
Stone, Clay & Glass 0.1% 2.0%
Lumber & Wood Products 8.6% 1.5%
Metals & Products -43.6% 1.3%
Pulp, Paper & Allied Products -20.5% 1.1%
Nonmetallic Minerals -19.6% 0.8%
Waste & Nonferrous Scrap -16.6% 0.5%
Coke 23.8% 0.5%
Iron & Steel Scrap 44.6% 0.4%
Farm Products, Except Grain -19.8% 0.2%
Metallic Ores -61.3% 0.2%
Primary Forest Products -54.4% 0.2%
Total Carloads -14.1% 53.7%
Intermodal Containers 2.4% 44.3%
Intermodal Trailers 14.0% 1.9%
Total Intermodal 2.8% 46.3%
Total Carloads & Intermodal -7.1% 100.0%
BNSF
3Q20 Carload Volumes (through Week 27)
Reporting Segment QTD ∆ Y/Y % of Total Carloads
Coal -15.9% 14.7%
Grain -18.6% 6.5%
Chemicals -3.5% 5.1%
Sand & Gravel 2.3% 2.6%
Petroleum -2.9% 1.3%
Motor Vehicles -92.8% 0.1%
Grain Mill -28.8% 0.8%
Metallic Ores -47.9% 1.8%
Food -3.2% 1.3%
Stone, Clay & Glass -21.5% 0.7%
Other -33.5% 3.3%
Metals 6.6% 0.9%
Lumber & Wood Products 10.0% 2.3%
Pulp & Paper 0.5% 0.4%
Coke 1.6% 0.3%
Iron & Steel Scrap 147.4% 0.0%
Non-Metalic Minerals -22.5% 0.2%
Farm (No Grain) -6.5% 0.2%
Waste & Nonferrous Scrap 44.2% 0.3%
Forest Products -22.9% 1.2%
Total Carloads -18.9% 44.1%
Intermodal Containers 4.5% 49.4%
Intermodal Trailers 15.5% 6.5%
Total Intermodal 5.7% 55.9%
Total Carloads & Intermodal -6.8% 100.0%
This report is for Tino Nieves. U
nauthorized redistribution is strictly prohibited and considered a violation of our intellectual property.
56
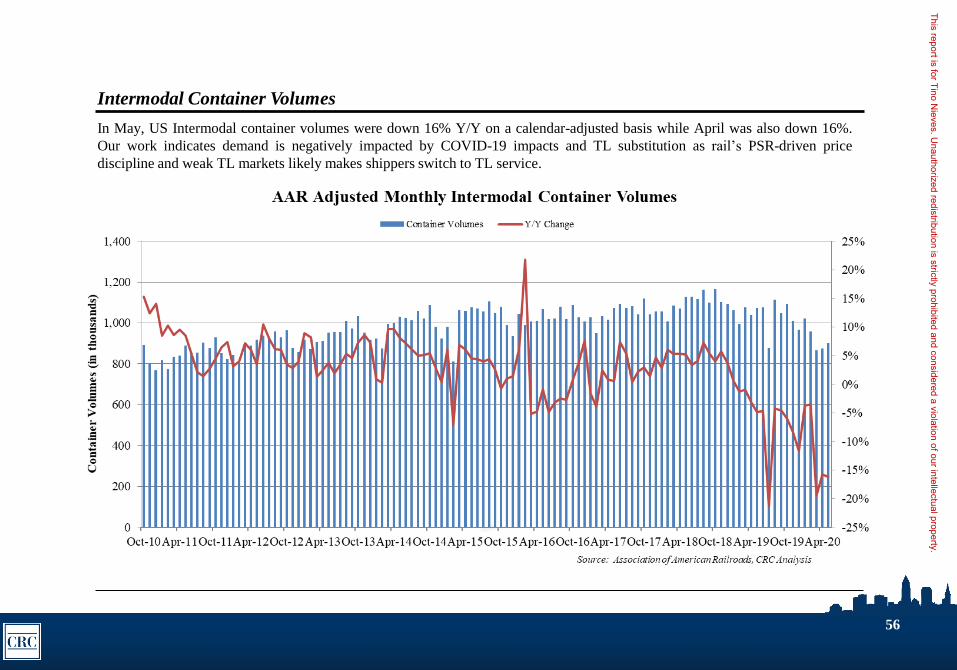
Intermodal Container Volumes
In May, US Intermodal container volumes were down 16% Y/Y on a calendar-adjusted basis while April was also down 16%.
Our work indicates demand is negatively impacted by COVID-19 impacts and TL substitution as rail’s PSR-driven price
discipline and weak TL markets likely makes shippers switch to TL service.
This report is for Tino Nieves. U
nauthorized redistribution is strictly prohibited and considered a violation of our intellectual property.
57
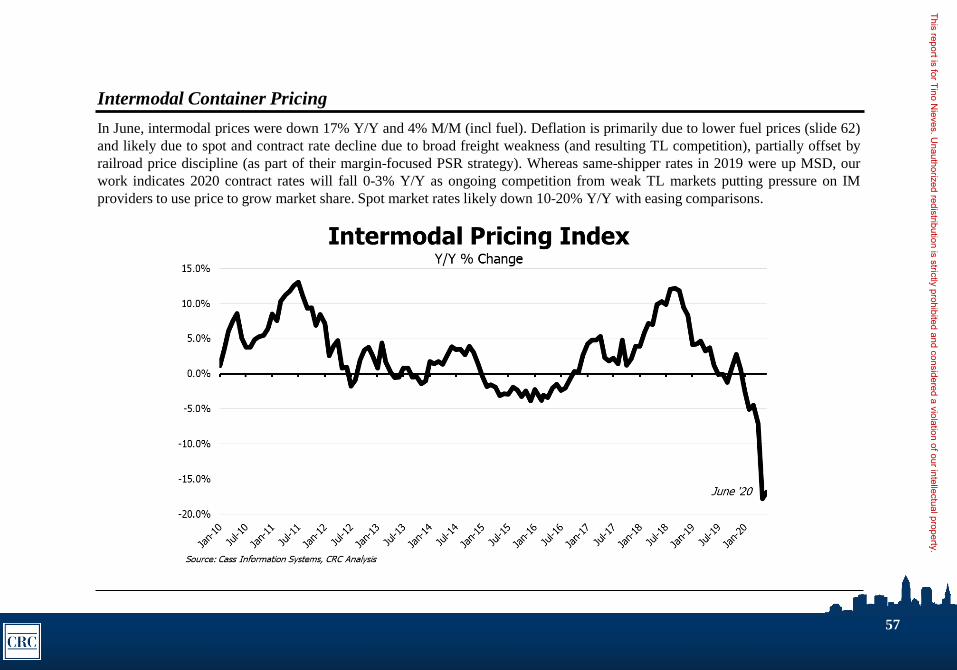
Intermodal Container Pricing
In June, intermodal prices were down 17% Y/Y and 4% M/M (incl fuel). Deflation is primarily due to lower fuel prices (slide 62)
and likely due to spot and contract rate decline due to broad freight weakness (and resulting TL competition), partially offset by
railroad price discipline (as part of their margin-focused PSR strategy). Whereas same-shipper rates in 2019 were up MSD, our
work indicates 2020 contract rates will fall 0-3% Y/Y as ongoing competition from weak TL markets putting pressure on IM
providers to use price to grow market share. Spot market rates likely down 10-20% Y/Y with easing comparisons.
This report is for Tino Nieves. U
nauthorized redistribution is strictly prohibited and considered a violation of our intellectual property.
58
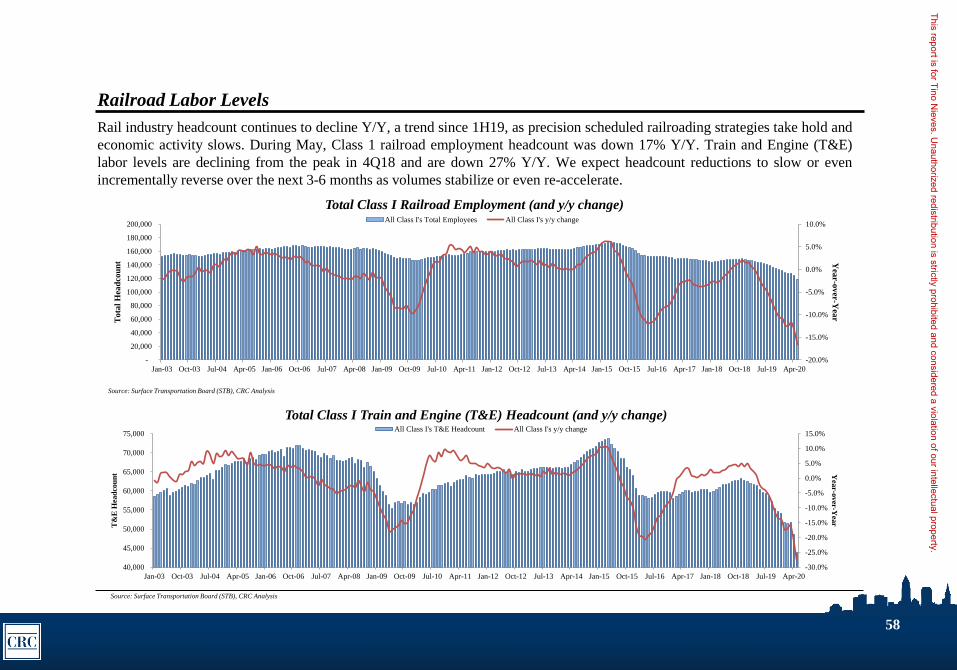
Railroad Labor Levels
Rail industry headcount continues to decline Y/Y, a trend since 1H19, as precision scheduled railroading strategies take hold and
economic activity slows. During May, Class 1 railroad employment headcount was down 17% Y/Y. Train and Engine (T&E)
labor levels are declining from the peak in 4Q18 and are down 27% Y/Y. We expect headcount reductions to slow or even
incrementally reverse over the next 3-6 months as volumes stabilize or even re-accelerate.
-20.0%
-15.0%
-10.0%
-5.0%
0.0%
5.0%
10.0%
-
20,000
40,000
60,000
80,000
100,000
120,000
140,000
160,000
180,000
200,000
Jan-03 Oct-03 Jul-04 Apr-05 Jan-06 Oct-06 Jul-07 Apr-08 Jan-09 Oct-09 Jul-10 Apr-11 Jan-12 Oct-12 Jul-13 Apr-14 Jan-15 Oct-15 Jul-16 Apr-17 Jan-18 Oct-18 Jul-19 Apr-20
Yea
r-ov
er-Y
ear
To
tal
Hea
dco
un
t
Total Class I Railroad Employment (and y/y change)All Class I's Total Employees All Class I's y/y change
Source: Surface Transportation Board (STB), CRC Analysis
-30.0%
-25.0%
-20.0%
-15.0%
-10.0%
-5.0%
0.0%
5.0%
10.0%
15.0%
40,000
45,000
50,000
55,000
60,000
65,000
70,000
75,000
Jan-03 Oct-03 Jul-04 Apr-05 Jan-06 Oct-06 Jul-07 Apr-08 Jan-09 Oct-09 Jul-10 Apr-11 Jan-12 Oct-12 Jul-13 Apr-14 Jan-15 Oct-15 Jul-16 Apr-17 Jan-18 Oct-18 Jul-19 Apr-20
Yea
r-over-Y
ear
T&
E H
ead
cou
nt
Total Class I Train and Engine (T&E) Headcount (and y/y change)All Class I's T&E Headcount All Class I's y/y change
Source: Surface Transportation Board (STB), CRC Analysis
This report is for Tino Nieves. U
nauthorized redistribution is strictly prohibited and considered a violation of our intellectual property.
59
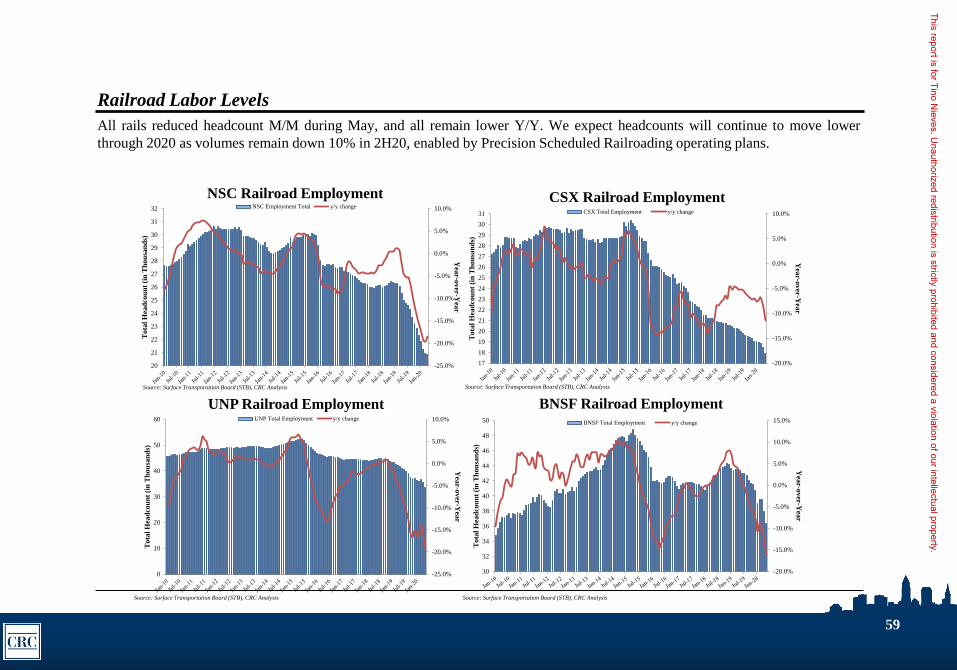
Railroad Labor Levels
All rails reduced headcount M/M during May, and all remain lower Y/Y. We expect headcounts will continue to move lower
through 2020 as volumes remain down 10% in 2H20, enabled by Precision Scheduled Railroading operating plans.
-25.0%
-20.0%
-15.0%
-10.0%
-5.0%
0.0%
5.0%
10.0%
20
21
22
23
24
25
26
27
28
29
30
31
32
Yea
r-ov
er-Y
ear
To
tal
Hea
dco
un
t (i
n T
ho
usa
nd
s)
NSC Railroad Employment NSC Employment Total y/y change
Source: Surface Transportation Board (STB), CRC Analysis
-20.0%
-15.0%
-10.0%
-5.0%
0.0%
5.0%
10.0%
17
18
19
20
21
22
23
24
25
26
27
28
29
30
31
Yea
r-ov
er-Y
ear
To
tal
Hea
dco
un
t (i
n T
ho
usa
nd
s)
CSX Railroad EmploymentCSX Total Employment y/y change
Source: Surface Transportation Board (STB), CRC Analysis
-25.0%
-20.0%
-15.0%
-10.0%
-5.0%
0.0%
5.0%
10.0%
0
10
20
30
40
50
60
Yea
r-ov
er-Y
ear
To
tal
Hea
dco
un
t (i
n T
ho
usa
nd
s)
UNP Railroad EmploymentUNP Total Employment y/y change
Source: Surface Transportation Board (STB), CRC Analysis
-20.0%
-15.0%
-10.0%
-5.0%
0.0%
5.0%
10.0%
15.0%
30
32
34
36
38
40
42
44
46
48
50
Yea
r-o
ver
-Yea
r
To
tal
Hea
dco
un
t (i
n T
ho
usa
nd
s)
BNSF Railroad EmploymentBNSF Total Employment y/y change
Source: Surface Transportation Board (STB), CRC Analysis
This report is for Tino Nieves. U
nauthorized redistribution is strictly prohibited and considered a violation of our intellectual property.
60
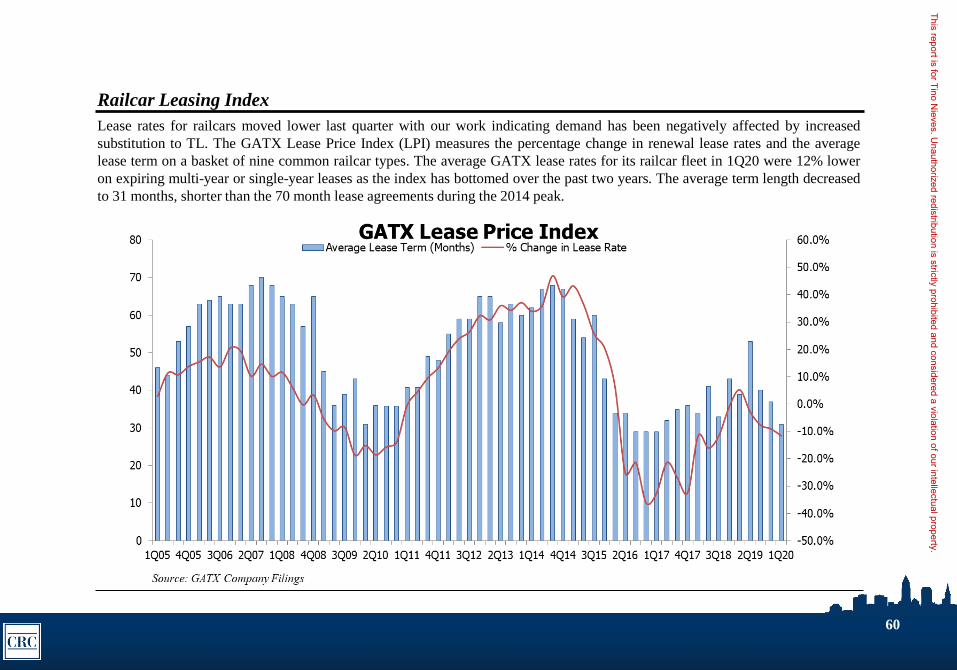
Railcar Leasing Index
Lease rates for railcars moved lower last quarter with our work indicating demand has been negatively affected by increased
substitution to TL. The GATX Lease Price Index (LPI) measures the percentage change in renewal lease rates and the average
lease term on a basket of nine common railcar types. The average GATX lease rates for its railcar fleet in 1Q20 were 12% lower
on expiring multi-year or single-year leases as the index has bottomed over the past two years. The average term length decreased
to 31 months, shorter than the 70 month lease agreements during the 2014 peak.
This report is for Tino Nieves. U
nauthorized redistribution is strictly prohibited and considered a violation of our intellectual property.
61
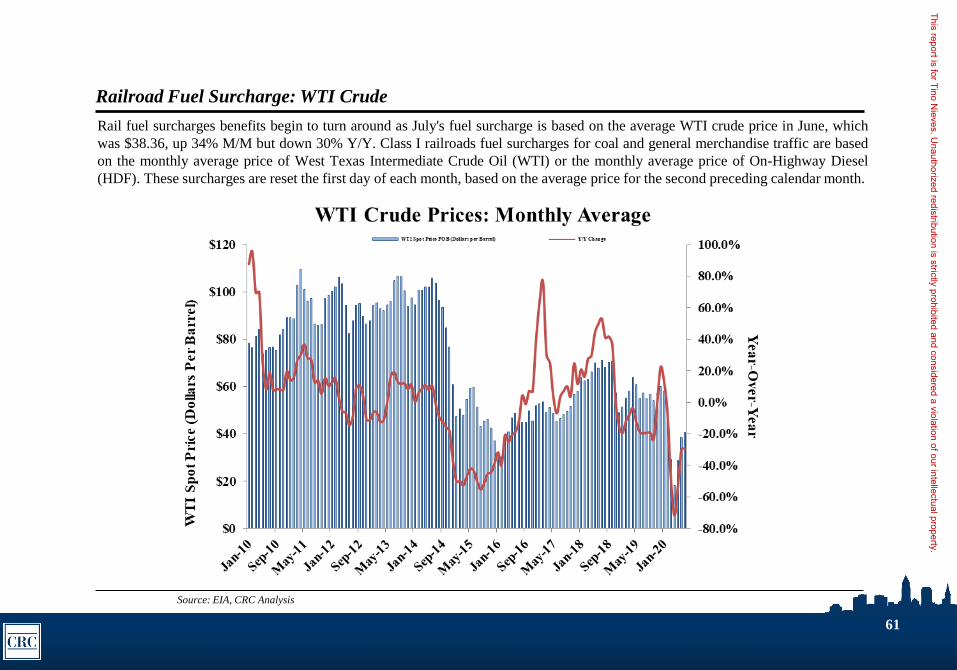
Railroad Fuel Surcharge: WTI Crude
Rail fuel surcharges benefits begin to turn around as July's fuel surcharge is based on the average WTI crude price in June, which
was $38.36, up 34% M/M but down 30% Y/Y. Class I railroads fuel surcharges for coal and general merchandise traffic are based
on the monthly average price of West Texas Intermediate Crude Oil (WTI) or the monthly average price of On-Highway Diesel
(HDF). These surcharges are reset the first day of each month, based on the average price for the second preceding calendar month.
Source: EIA, CRC Analysis
This report is for Tino Nieves. U
nauthorized redistribution is strictly prohibited and considered a violation of our intellectual property.
62
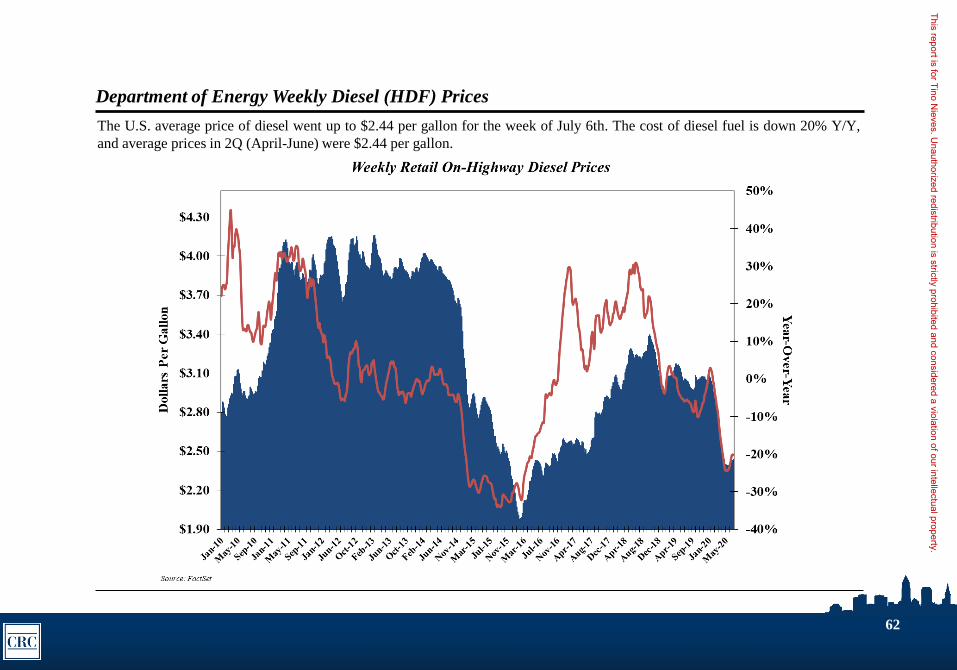
Department of Energy Weekly Diesel (HDF) Prices
The U.S. average price of diesel went up to $2.44 per gallon for the week of July 6th. The cost of diesel fuel is down 20% Y/Y,
and average prices in 2Q (April-June) were $2.44 per gallon.
This report is for Tino Nieves. U
nauthorized redistribution is strictly prohibited and considered a violation of our intellectual property.
63
APPENDIX
Important Disclosures
Important disclosures can be found at www.cleveland-research.com/clients/disclosures
Other Disclosures: I, Chris Johnson, certify that the views expressed in the research report(s) accurately reflect my personal views about the subject security(s). Further, I certify that no part of my
compensation was, is, or will be directly or indirectly related to the specific recommendations or views contained in the research report(s). CRC and its principals have investments and own a minority
interest in a fund manager which may or may not have a position in this security in the funds it manages and oversees. Cleveland Research Company provides no investment banking services of any type
on this or any company. Proprietary research and Information contained herein which forms the basis for findings or opinions expressed by Cleveland Research Company may be used by Cleveland
Research for other purposes in the course of compensated consulting and other services rendered to third parties. The information transmitted is intended only for the person or entity to which it is
addressed. Any review, retransmission, dissemination or other use of, or taking of any action in reliance upon, this information by persons or entities other than the intended recipient is prohibited. If
you received this in error, please contact the sender and delete the material from any computer. Member FINRA/SIPC
This report is for Tino Nieves. U
nauthorized redistribution is strictly prohibited and considered a violation of our intellectual property.


