Embed Size (px)
Citation preview
Trend Detection in Folksonomies
Andreas Hotho1, Robert Jaschke1,2, Christoph Schmitz1, Gerd Stumme1,2
1 Knowledge & Data Engineering Group, Department of Mathematics and Computer Science,University of Kassel, Wilhelmshoher Allee 73, D–34121 Kassel, Germany
http://www.kde.cs.uni-kassel.de2 Research Center L3S, Expo Plaza 1, D–30539 Hannover, Germany
http://www.l3s.de
Abstract. As the number of resources on the web exceeds by far the numberofdocuments one can track, it becomes increasingly difficult to remain up to date onones own areas of interest. The problem becomes more severe with the increasingfraction of multimedia data, from which it is difficult to extract some conceptualdescription of their contents.One way to overcome this problem are social bookmark tools, which are rapidlyemerging on the web. In such systems, users are setting up lightweight concep-tual structures called folksonomies, and overcome thus theknowledge acquisi-tion bottleneck. As more and more people participate in the effort, the use of acommon vocabulary becomes more and more stable. We present an approach fordiscovering topic-specific trends within folksonomies. Itis based on a differen-tial adaptation of the PageRank algorithm to the triadic hypergraph structure ofa folksonomy. The approach allows for any kind of data, as it does not rely onthe internal structure of the documents. In particular, this allows to consider dif-ferent data types in the same analysis step. We run experiments on a large-scalereal-world snapshot of a social bookmarking system.
1 Social Resource Sharing and Folksonomies
With the growth of the web, both the number and the heterogeneity of types of avail-able resources have increased dramatically. The management of such a collection of re-sources includes many subtasks like search, retrieval, clustering, reasoning, and knowl-edge discovery. For all these tasks, some sort of conceptualdescription of the documentsis essential. While there are many approaches that have beenapplied successfully foryears for extracting such descriptions from text documents— ranging from the bag-of-words model for information retrieval to ontology learning— there are fewer solutionsfor images, videos, audio tracks and music data up to now. Theway from the features ofthe different resources to a conceptual description is generally far more difficult for mul-timedia data. Furthermore, these techniques have to be developed separately for eachkind of data. For applications like the detection of trends from a collection of resourcesconsisting of several types of (multimedia) data — which is the topic of this paper —first a common format for the representation of the conceptual model plus extractiontechniques for each of the data types would have to be defined.
Complementing the extraction of conceptual descriptions from the documents them-selves, social resource sharing tools are currently emerging on the web, as a part of whatis called “social software” or “Web 2.0”. In these user-centric publishing and knowledge
management platforms, a conceptual description is provided to each document by theuser in the form of a collection of ‘tags’, i. e., of arbitrary, user-defined catchwords. Asthis description is independent of the format of the resource, the social tagging approachprovides a unified model for all kinds of resources, including in particular multimediaformats.
Social resource sharing tools, such as Flickr3 or del.icio.us4 (see Fig. 1), have ac-quired large numbers of users within less than two years. Thesocial photo gallery Flickr,for instance, is estimated to have over a million users. The reason for the immediatesuccess of these systems is the fact that no specific skills are needed for participating,and that these tools yield immediate benefit for each individual user (e.g. organizingones bookmarks in a browser-independent, persistent fashion) without too much over-head. Large numbers of users have created huge amounts of information within a veryshort period of time. The frequent use of these systems showsclearly that web- andfolksonomy-based approaches are able to overcome the knowledge acquisition bottle-neck, which was a serious handicap for many knowledge-basedsystems in the past.
Social resource sharing systems are web-based systems thatallow users to uploadtheir resources, and to label them. All these systems share the same core functionality.Once a user is logged in, he can add a resource to the system, and assign arbitrarylabels, so-calledtags, to it. Resources can be almost anything. In systems such as ourBibSonomy,5 for instance, resources are bookmarks and bibliographic references, inFlickr they are photos, inlast.fm6 music files, inYouTube7 videos, and in43Things8
even goals in private life.The collection of all assignments of a user is called hispersonomy, the collection
of all personomies is calledfolksonomy. The user can also explore the personomies ofthe other users in all dimensions: for a given user he can see the resources that user haduploaded, together with the tags he had assigned to them; when clicking on a resourcehe sees which other users have uploaded this resource and howthey tagged it; and whenclicking on a tag he sees who assigned it to which resources (see Fig. 1).
The word ‘folksonomy’ is a blend of the words ‘taxonomy’ and ‘folk’, and standsfor conceptual structures created by the people. Folksonomies are thus a bottom-upcomplement to more formalized Semantic Web technologies, as they rely onemergentsemantics[17, 18] which result from the converging use of the same vocabulary.
In this paper, we will analyze this emergence of common semantics by exploringtrends in the folksonomy. Since the structure of a folksonomy is symmetric with re-spect to the dimensions ‘user’, ‘tag’, and ‘resource’, we can apply the same approachto study upcoming users, upcoming tags, and upcoming resources. We present a tech-nique for analyzing the evolution of topic-specific trends.Our approach is based onourFolkRankalgorithm [10], a differential adaptation of the PageRank algorithm [3] tothe tri-partite hypergraph structure of a folksonomy. Compared to pure co-occurrencecounting, FolkRank takes also into account elements that are related to the focus ofinterest with respect to the underlying graph/folksonomy.In particular, FolkRank rankssynonyms higher, which usually do not occur in the same bookmark posting together.
3 http://www.flickr.com/ 4 http://del.icio.us 5 http://www.bibsonomy.org6 http://www.last.fm 7 http://www.youtube.com/ 8 http://www.43things.com/
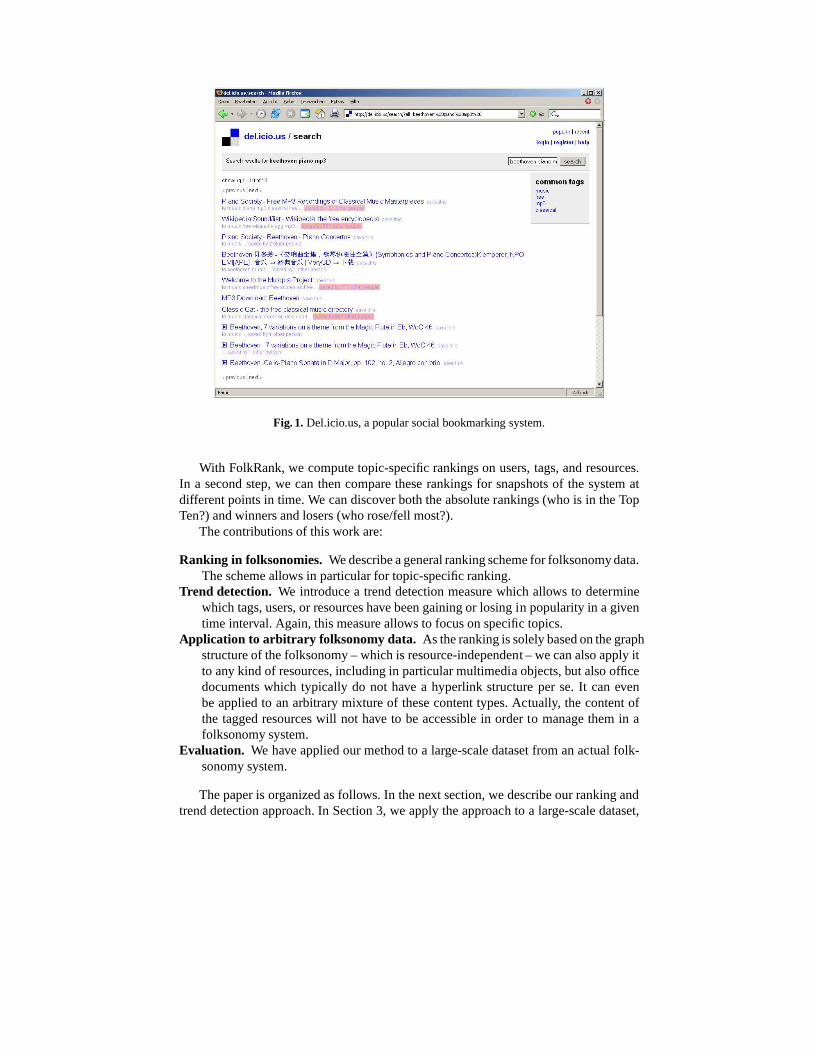
Fig. 1. Del.icio.us, a popular social bookmarking system.
With FolkRank, we compute topic-specific rankings on users,tags, and resources.In a second step, we can then compare these rankings for snapshots of the system atdifferent points in time. We can discover both the absolute rankings (who is in the TopTen?) and winners and losers (who rose/fell most?).
The contributions of this work are:
Ranking in folksonomies. We describe a general ranking scheme for folksonomy data.The scheme allows in particular for topic-specific ranking.
Trend detection. We introduce a trend detection measure which allows to determinewhich tags, users, or resources have been gaining or losing in popularity in a giventime interval. Again, this measure allows to focus on specific topics.
Application to arbitrary folksonomy data. As the ranking is solely based on the graphstructure of the folksonomy – which is resource-independent – we can also apply itto any kind of resources, including in particular multimedia objects, but also officedocuments which typically do not have a hyperlink structureper se. It can evenbe applied to an arbitrary mixture of these content types. Actually, the content ofthe tagged resources will not have to be accessible in order to manage them in afolksonomy system.
Evaluation. We have applied our method to a large-scale dataset from an actual folk-sonomy system.
The paper is organized as follows. In the next section, we describe our ranking andtrend detection approach. In Section 3, we apply the approach to a large-scale dataset,
a one-year snapshot of the del.icio.us system. Section 4 discusses related work, andSection 5 concludes with an outlook on future topics in this field.
2 Trend Detection in Folksonomies
For discovering trends in a social resource sharing system,we will need snapshots ofits folksonomy at different points of time. For each snapshot, we will need a ranking,such that we can compare the rankings of consecutive snapshots. As we also want todiscover topic-specific trends, we will additionally need aranking method that allowsto focus on the specific topic. We will make use of our search and ranking algorithmFolkRank[10] which we summarize below.
2.1 Basic Notions
A folksonomy basically describes the users, resources, tags, and allows users to assign(arbitrary) tags to resources. We will make use of the following notions. Afolksonomyis a tupleF := (U, T, R, Y,≺) where
– U , T , andR are finite sets, whose elements are calledusers, tagsandresources,resp.,
– Y is a ternary relation between them, i. e.,Y ⊆ U × T × R, whose elements arecalled tag assignments (TAS for short), and
– ≺ is a user-specific subtag/supertag-relation, i. e.,≺⊆ U × T × T , calledsub-tag/supertag relation.
ThepersonomyPu of a given useru ∈ U is the restriction ofF to u, i. e., Pu :=(Tu, Ru, Iu,≺u) with Iu := {(t, r) ∈ T × R | (u, t, r) ∈ Y }, Tu := π1(Iu), Ru :=π2(Iu), and≺u:= {(t1, t2) ∈ T × T | (u, t1, t2) ∈≺} (whereasπ stands for theprojection).
Users are typically described by their user ID, and tags may be arbitrary strings.What is considered as a resource depends on the type of system. For instance, indel.icio.us, the resources are URLs, and in Flickr, the resources are pictures. From animplementation point of view, resources are internally represented by some ID.
In this paper, we do not make use of the subtag/supertag relation for sake of simplic-ity. I. e.,≺= ∅, and we will simply note a folksonomy as a quadrupleF := (U, T, R, Y ).This structure is known in Formal Concept Analysis [20, 7] asa triadic context[13, 19].An equivalent view on folksonomy data is that of a tripartite(undirected) hypergraphG = (V, E), whereV = U ∪T ∪R is the set of nodes, andE = {{u, t, r} | (u, t, r) ∈Y } is the set of hyperedges (∪ is the disjunctive union).
2.2 Ranking
In this section we recall the principles of theFolkRankalgorithm that we developedfor supporting Google-like search in folksonomy-based systems. It is inspired by theseminal PageRank algorithm [3].
A B
C
D
E
F
G
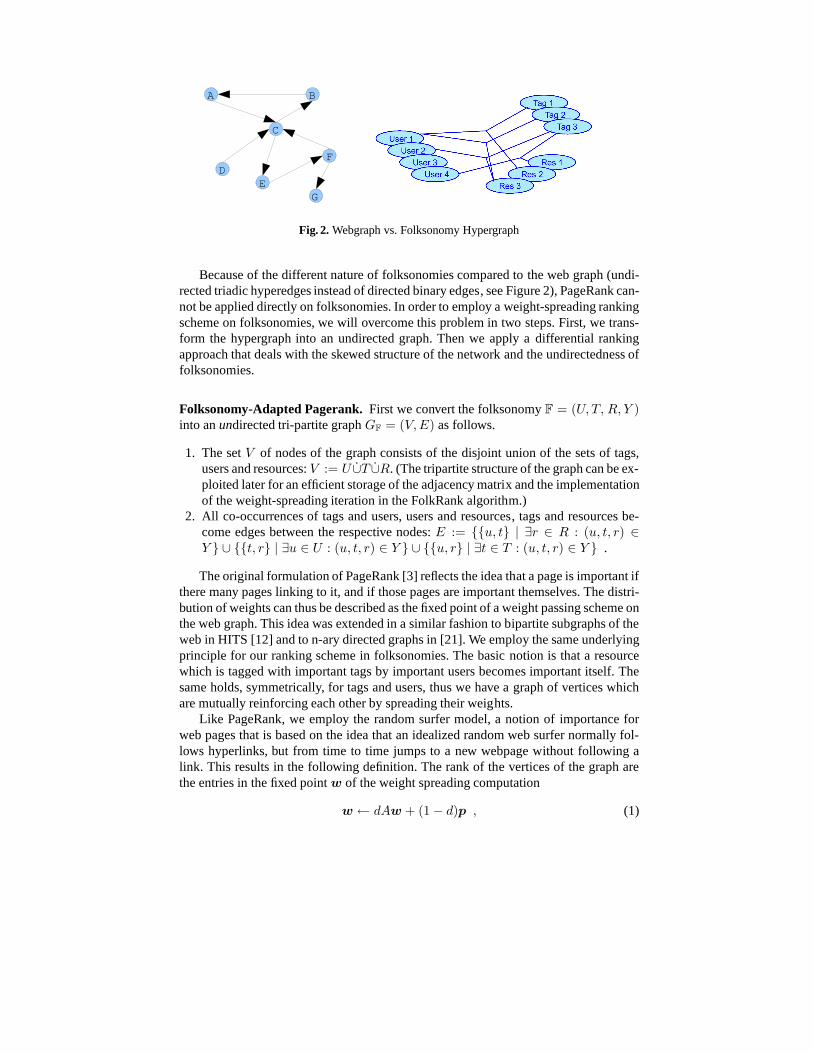
Fig. 2. Webgraph vs. Folksonomy Hypergraph
Because of the different nature of folksonomies compared tothe web graph (undi-rected triadic hyperedges instead of directed binary edges, see Figure 2), PageRank can-not be applied directly on folksonomies. In order to employ aweight-spreading rankingscheme on folksonomies, we will overcome this problem in twosteps. First, we trans-form the hypergraph into an undirected graph. Then we apply adifferential rankingapproach that deals with the skewed structure of the networkand the undirectedness offolksonomies.
Folksonomy-Adapted Pagerank.First we convert the folksonomyF = (U, T, R, Y )into anundirected tri-partite graphGF = (V, E) as follows.
1. The setV of nodes of the graph consists of the disjoint union of the sets of tags,users and resources:V := U ∪T ∪R. (The tripartite structure of the graph can be ex-ploited later for an efficient storage of the adjacency matrix and the implementationof the weight-spreading iteration in the FolkRank algorithm.)
2. All co-occurrences of tags and users, users and resources, tags and resources be-come edges between the respective nodes:E := {{u, t} | ∃r ∈ R : (u, t, r) ∈Y } ∪ {{t, r} | ∃u ∈ U : (u, t, r) ∈ Y } ∪ {{u, r} | ∃t ∈ T : (u, t, r) ∈ Y } .
The original formulation of PageRank [3] reflects the idea that a page is important ifthere many pages linking to it, and if those pages are important themselves. The distri-bution of weights can thus be described as the fixed point of a weight passing scheme onthe web graph. This idea was extended in a similar fashion to bipartite subgraphs of theweb in HITS [12] and to n-ary directed graphs in [21]. We employ the same underlyingprinciple for our ranking scheme in folksonomies. The basicnotion is that a resourcewhich is tagged with important tags by important users becomes important itself. Thesame holds, symmetrically, for tags and users, thus we have agraph of vertices whichare mutually reinforcing each other by spreading their weights.
Like PageRank, we employ the random surfer model, a notion ofimportance forweb pages that is based on the idea that an idealized random web surfer normally fol-lows hyperlinks, but from time to time jumps to a new webpage without following alink. This results in the following definition. The rank of the vertices of the graph arethe entries in the fixed pointw of the weight spreading computation
w ← dAw + (1− d)p , (1)
wherew is a weight vector with one entry for each web page,A is a row-stochastic ver-sion of the adjacency matrix of the graphGF defined above,p is the random surfer com-ponent that outweighs the loss of weight in dangling links, andd ∈ [0, 1] is determiningthe influence ofp. Usually, one will choosep = 1, i. e., the vector composed by 1’s,to achieve uniform damping. In order to compute personalized PageRanks, however,p
can be used to express user preferences by giving a higher weight to the componentswhich represent the user’s preferred web pages. If||w||1 = ||p||1,9 the weight in thesystem will remain constant.
As the graphGF is undirected, most of the weight that went through an edge atmomentt will flow back att + 1. The results are thus rather similar (but not identical,due to the damping) to a ranking that is simply based on edge degrees. The reason forapplying the more expensive PageRank approach nonethelessis that its random surfervector allows for topic-specific ranking.
FolkRank — Topic-Specific Ranking. As the graphGF that we created in the previousstep is undirected, we face the problem that an application of the original PageRankwould result in weights that flow in one direction of an edge and then ‘swash back’along the same edge in the next iteration, so that one would basically rank the nodesin the folksonomy by their degree distribution. This makes it very difficult for othernodes than those with high edge degree to become highly ranked, no matter what thepreference vector is.
This problem is solved by thedifferentialapproach in FolkRank, which computes apersonalized ranking of the elements in a folksonomy as follows:
1. The preference vectorp is used to determine the topic. It may have any distributionof weights, as long as||w||1 = ||p||1 holds. Typically a single entry or a small setof entries is set to a higher value, and the remaining weight is equally distributedover the other entries. Since the structure of folksonomiesis symmetric, we candefine a topic by giving a higher value to either one or more tags and/or one ormore users and/or one or more resources.
2. Letw0 be the fixed point from Equation (1) withd = 1.3. Letw1 be the fixed point from Equation (1) withd < 1. In our experiments, we set
d = 0.85.4. w := w1 −w0 is the final weight vector.
Thus, we compute the winners and losers of the mutual reinforcement of nodes when auser preference is given, compared to the baseline without apreference vector. We callthe resulting weightw[x] of an elementx of the folksonomy theFolkRankof x. In [10]we showed thatw provides indeed valuable results on a large-scale real-world datasetwhilew1 provides an unstructured mix of topic-relevant elements with elements havinghigh edge degree.
2.3 Trend Detection
In order to analyze the trends around a specific topic, we firsthave to describe thetopic by defining the preference vectorp. Then we compute, for each point in time9 . . . and if there are no rank sinks – but this holds trivially inour graphGF.
t ∈ {0, . . . , n}, the rank vectorwt within the folksonomyFt which consists of all tagassignments performed beforet.10
We select then from the resulting rank vectors those entrieswhich are assigned toone of the three dimensions ‘tags’, ‘users’, and ‘resources’ — depending on where wewant to see rising and falling elements. Else an analysis would be difficult, since usershave higher weights than tags, which in their turn have higher weights than resources,due to the different sizes of the setsU , T , andR.
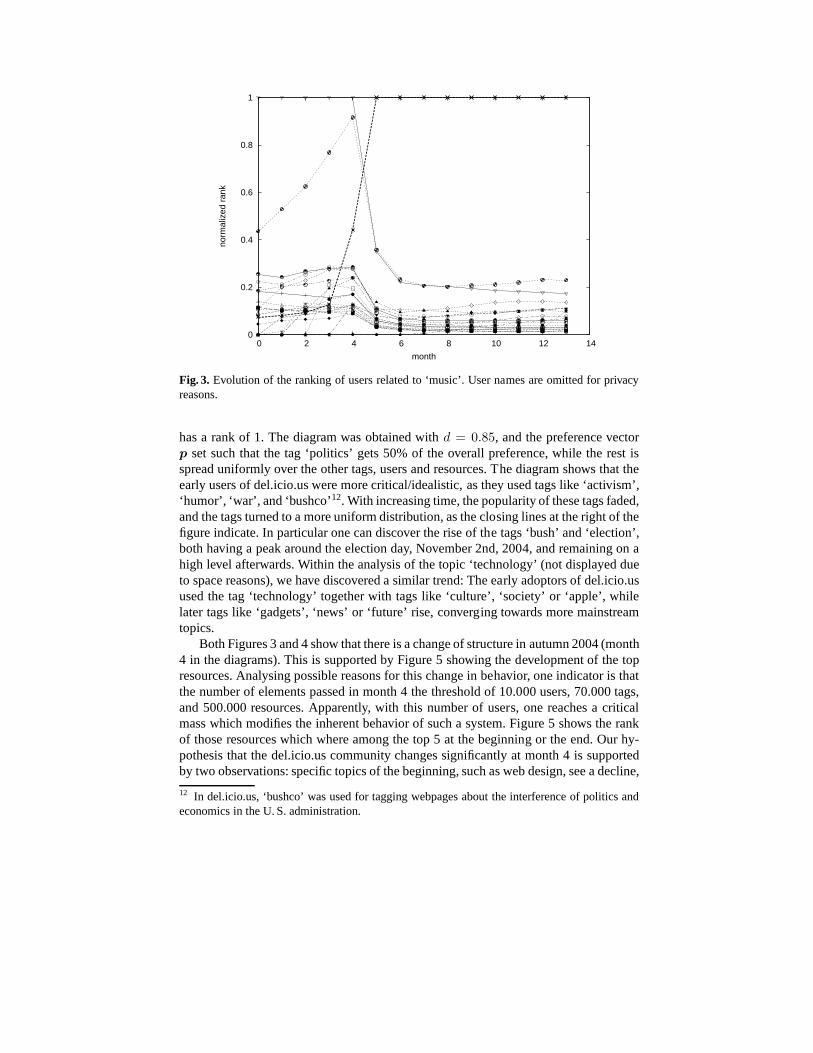
As the total weight in the system will differ at different points of time becauseof new tags, users, and resources, we normalize at last each rank vector such that itslargest value equals 1. This allows to compare rankings fromdifferent points in time. Ifthe preference vector has only one distinguished element, then this element is the onewith the highest value in the resulting weight vector. The closer another entry is to thisvalue, the more important is its associated element to the topic. By plotting the valuesof the Top 10 or Top 20 over time, one can thus discover the riseand fall of the mostpopular elements. Figure 3 shows such a plot for the del.icio.us users which are mostimportant for the topic ‘music’, while Figure 4 shows the tags which are most importantfor the topic ‘politics’. How these diagrams are to be read, and what the most importantfindings are, will be described in detail in the next section.
Going a step further, we may not only be interested in the mostimportant elements,but also in those where the increase or decrease of rank is thesteepest. To this end, wehave developed the followingpopularity changemeasure, which allows for detectingtopic-specific trends.
Assumex is a tag, user or resource of the folksonomyF, i. e.x ∈ U ∪T ∪R. (In thefollowing, we assume it is a resource; the same methods applysymmetrically for tagsand users.) Similar to the relative change used for word occurrences in [11], we definethepopularity changepct0→t1(x) of x from t0 to t1 as follows.
At timest0 < t1, let the resourcex be ranked at positionr0 andr1, respectively, inthe descending weight order of the FolkRank computation. Let n0 andn1 be the sizes|R| of the resource dimension at timest0, t1. The popularity change is defined as
pct0→t1(x) :=
(
r0
n0
−r1
n1
)
log10
(
n1
r1
)
(2)
(where elements not present at timeti are treated as being positioned atri = ni + 1).Here, the fractions in the first term indicate the relative positions ofx at the given times,1/ni being the best (i. e. having maximum FolkRank) and 1 being theworst. The secondterm discounts the change with respect to the relative position where the change tookplace: to get from a top 90 % position to a top 80 % one would be considered three timeseasier than to get from the top 0.09 % to the top 0.08 %.
Combined with a topic-directed FolkRank computation, we use this measure of achange in popularity to get an insight into what are the trends in a certain communityin the folksonomy. We point out the winning and losing elements of the folksonomy ina given time interval.
10 If no entries were deleted,Ft+1 contains thusFt, for all t.
3 Experiments
3.1 Evaluation of Popularity Change in del.icio.us
In order to evaluate our approach, we have analyzed the popular social bookmarkingsytem del.icio.us.11 Del.icio.us is a server-based system with a simple-to-use inter-face that allows users to organize and share bookmarks on theinternet. The resourcesdel.icio.us is pointing to cover various formats (text, audio, video, etc.). In particular,the system is not restricted to a single type (like photos in Flickr). As discussed above,our approach is specially suited for this situation. In addition to the URL, del.icio.usallows to store a description, an extended description, andtags (i. e., arbitrary labels).Del.icio.us is online for a sufficiently long time (since May2002) to allow for extractingsignificant time series.
For our experiments, we collected data from the del.icio.ussystem between July27 and July 30, 2005 in the following way. Initially we usedwget starting from thestart page of del.icio.us to obtain nearly 6900 users and 700tags as a starting set. Out ofthis dataset we extracted all users and resources (i. e., del.icio.us’ MD5-hashed urls). Wedownloaded in a recursive manner user pages to get new resources and resource pages toget new users. Furthermore we monitored the del.icio.us start page to gather additionalusers and resources. This way we collected a list of several thousand usernames whichwe used for accessing the first 10000 resources each user had tagged. From the collecteddata we finally took the user files to extract resources, tags,dates, descriptions, extendeddescriptions, and the corresponding username.
We obtained a folksonomy with|U | = 75, 242 users,|T | = 533, 191 tags and|R| = 3, 158, 297 resources, related by in total|Y | = 17, 362, 212 tag assignments. Wecreated monthly snapshots as follows.F0 contains all tag assignments performed on orbefore June 15, 2004, together with the involved users, tags, and resources;F1 all tagassignments performed on or before July 15, 2004, together with the involved users,tags, and resources; and so on untilF13 which contains all tag assignments performedon or before July 15, 2005, together with the involved tags, users, and resources.
Figure 3 shows the evolution of the ranking of all users tags that were among theTop 10 in at least one month for the topic ‘music’. The diagramwas obtained withd = 0.85, and the preference vectorp set such that the tag ‘music’ gets 50% of theoverall preference, the rest is spread uniformly as described above. The user nameshave been omitted for privacy reasons. The diagram shows three outstanding users. Thefirst one could keep the top position for the first four months,followed by a steep fall.Another user could approach him steadily during the first four months, followed byalmost the same fall. The fall of both was caused by the steep rise of a new user, whichalso shadowed the rankings of all other users related to ‘music’. A detailed analysis ofthis user’s data in the system revealed us that he posted morethan 5500 bookmarks,85 % of which tagged with ‘music’. In total he used only about 100 tags. The 5500bookmarks account for about 2% ofall occurrences of ‘music’ in the system (withmore than 70.000 users in the system at that time), and are about 3.5 times as many asthose of the second user for that tag.
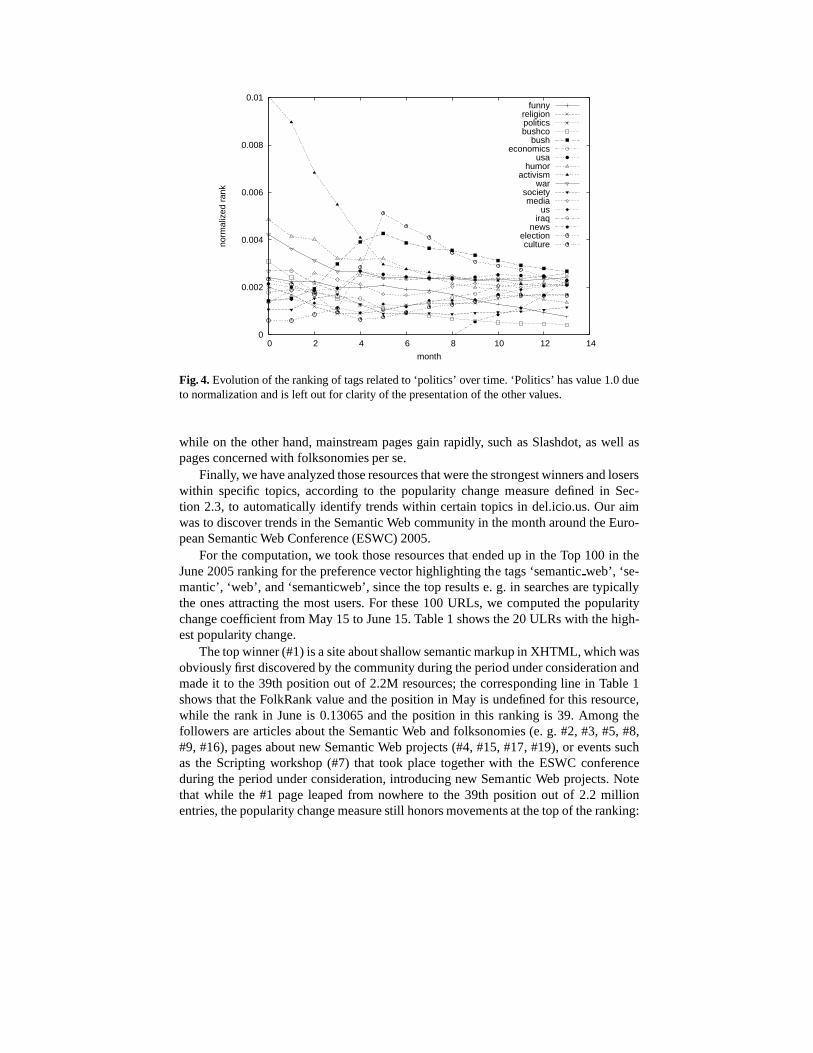
Figure 4 shows the evolution of all tags that were among the Top Ten in at least onemonth for the topic ‘politics’. The line for the topic ’politics’ itself can’t be seen, as it11 http://del.icio.us
0
0.2
0.4
0.6
0.8
1
0 2 4 6 8 10 12 14
norm
aliz
ed r
ank
month
Fig. 3. Evolution of the ranking of users related to ‘music’. User names are omitted for privacyreasons.
has a rank of 1. The diagram was obtained withd = 0.85, and the preference vectorp set such that the tag ‘politics’ gets 50% of the overall preference, while the rest isspread uniformly over the other tags, users and resources. The diagram shows that theearly users of del.icio.us were more critical/idealistic,as they used tags like ‘activism’,‘humor’, ‘war’, and ‘bushco’12. With increasing time, the popularity of these tags faded,and the tags turned to a more uniform distribution, as the closing lines at the right of thefigure indicate. In particular one can discover the rise of the tags ‘bush’ and ‘election’,both having a peak around the election day, November 2nd, 2004, and remaining on ahigh level afterwards. Within the analysis of the topic ‘technology’ (not displayed dueto space reasons), we have discovered a similar trend: The early adoptors of del.icio.usused the tag ‘technology’ together with tags like ‘culture’, ‘society’ or ‘apple’, whilelater tags like ‘gadgets’, ‘news’ or ‘future’ rise, converging towards more mainstreamtopics.
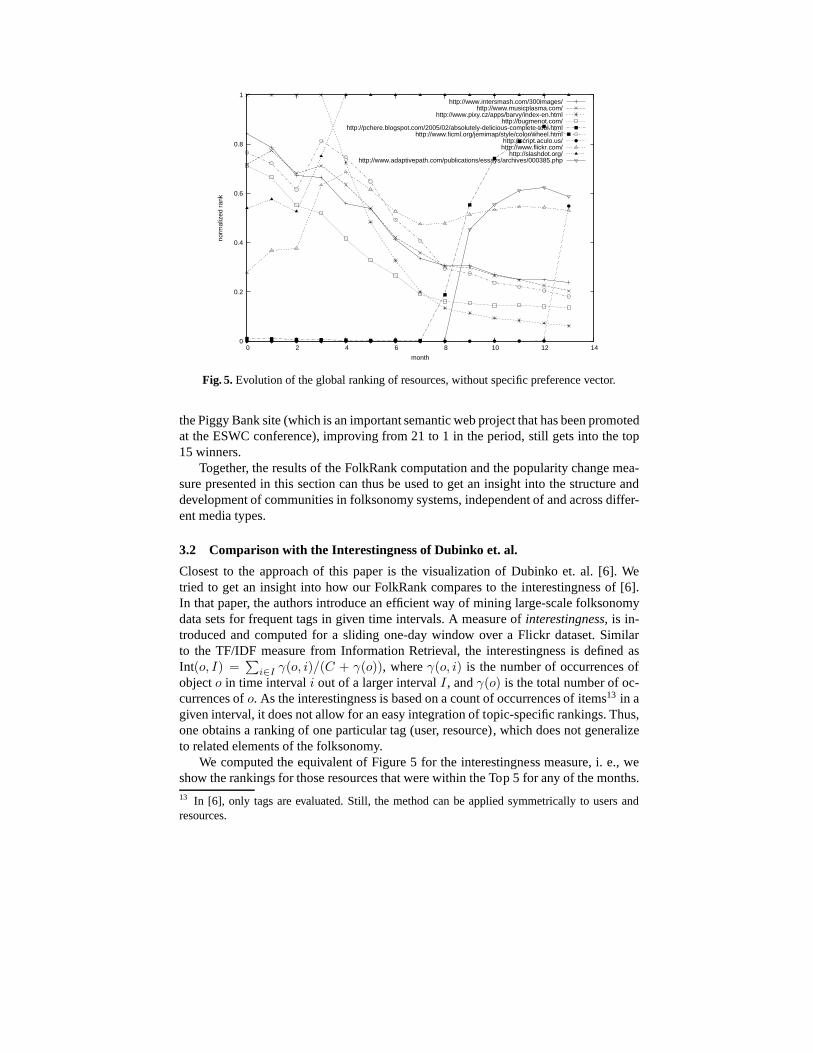
Both Figures 3 and 4 show that there is a change of structure inautumn 2004 (month4 in the diagrams). This is supported by Figure 5 showing the development of the topresources. Analysing possible reasons for this change in behavior, one indicator is thatthe number of elements passed in month 4 the threshold of 10.000 users, 70.000 tags,and 500.000 resources. Apparently, with this number of users, one reaches a criticalmass which modifies the inherent behavior of such a system. Figure 5 shows the rankof those resources which where among the top 5 at the beginning or the end. Our hy-pothesis that the del.icio.us community changes significantly at month 4 is supportedby two observations: specific topics of the beginning, such as web design, see a decline,
12 In del.icio.us, ‘bushco’ was used for tagging webpages about the interference of politics andeconomics in the U. S. administration.
0
0.002
0.004
0.006
0.008
0.01
0 2 4 6 8 10 12 14
norm
aliz
ed r
ank
month
funnyreligionpoliticsbushco
busheconomics
usahumor
activismwar
societymedia
usiraq
newselectionculture
Fig. 4.Evolution of the ranking of tags related to ‘politics’ over time. ‘Politics’ has value 1.0 dueto normalization and is left out for clarity of the presentation of the other values.
while on the other hand, mainstream pages gain rapidly, suchas Slashdot, as well aspages concerned with folksonomies per se.
Finally, we have analyzed those resources that were the strongest winners and loserswithin specific topics, according to the popularity change measure defined in Sec-tion 2.3, to automatically identify trends within certain topics in del.icio.us. Our aimwas to discover trends in the Semantic Web community in the month around the Euro-pean Semantic Web Conference (ESWC) 2005.
For the computation, we took those resources that ended up inthe Top 100 in theJune 2005 ranking for the preference vector highlighting the tags ‘semanticweb’, ‘se-mantic’, ‘web’, and ‘semanticweb’, since the top results e.g. in searches are typicallythe ones attracting the most users. For these 100 URLs, we computed the popularitychange coefficient from May 15 to June 15. Table 1 shows the 20 ULRs with the high-est popularity change.
The top winner (#1) is a site about shallow semantic markup inXHTML, which wasobviously first discovered by the community during the period under consideration andmade it to the 39th position out of 2.2M resources; the corresponding line in Table 1shows that the FolkRank value and the position in May is undefined for this resource,while the rank in June is 0.13065 and the position in this ranking is 39. Among thefollowers are articles about the Semantic Web and folksonomies (e. g. #2, #3, #5, #8,#9, #16), pages about new Semantic Web projects (#4, #15, #17, #19), or events suchas the Scripting workshop (#7) that took place together withthe ESWC conferenceduring the period under consideration, introducing new Semantic Web projects. Notethat while the #1 page leaped from nowhere to the 39th position out of 2.2 millionentries, the popularity change measure still honors movements at the top of the ranking:
0
0.2
0.4
0.6
0.8
1
0 2 4 6 8 10 12 14
norm
aliz
ed r
ank
month
http://www.intersmash.com/300images/http://www.musicplasma.com/
http://www.pixy.cz/apps/barvy/index-en.htmlhttp://bugmenot.com/
http://pchere.blogspot.com/2005/02/absolutely-delicious-complete-tool.htmlhttp://www.ficml.org/jemimap/style/color/wheel.html
http://script.aculo.us/http://www.flickr.com/
http://slashdot.org/http://www.adaptivepath.com/publications/essays/archives/000385.php
Fig. 5.Evolution of the global ranking of resources, without specific preference vector.
the Piggy Bank site (which is an important semantic web project that has been promotedat the ESWC conference), improving from 21 to 1 in the period,still gets into the top15 winners.
Together, the results of the FolkRank computation and the popularity change mea-sure presented in this section can thus be used to get an insight into the structure anddevelopment of communities in folksonomy systems, independent of and across differ-ent media types.
3.2 Comparison with the Interestingness of Dubinko et. al.
Closest to the approach of this paper is the visualization ofDubinko et. al. [6]. Wetried to get an insight into how our FolkRank compares to the interestingness of [6].In that paper, the authors introduce an efficient way of mining large-scale folksonomydata sets for frequent tags in given time intervals. A measure of interestingness, is in-troduced and computed for a sliding one-day window over a Flickr dataset. Similarto the TF/IDF measure from Information Retrieval, the interestingness is defined asInt(o, I) =
∑
i∈I γ(o, i)/(C + γ(o)), whereγ(o, i) is the number of occurrences ofobjecto in time intervali out of a larger intervalI, andγ(o) is the total number of oc-currences ofo. As the interestingness is based on a count of occurrences ofitems13 in agiven interval, it does not allow for an easy integration of topic-specific rankings. Thus,one obtains a ranking of one particular tag (user, resource), which does not generalizeto related elements of the folksonomy.
We computed the equivalent of Figure 5 for the interestingness measure, i. e., weshow the rankings for those resources that were within the Top 5 for any of the months.13 In [6], only tags are evaluated. Still, the method can be applied symmetrically to users andresources.
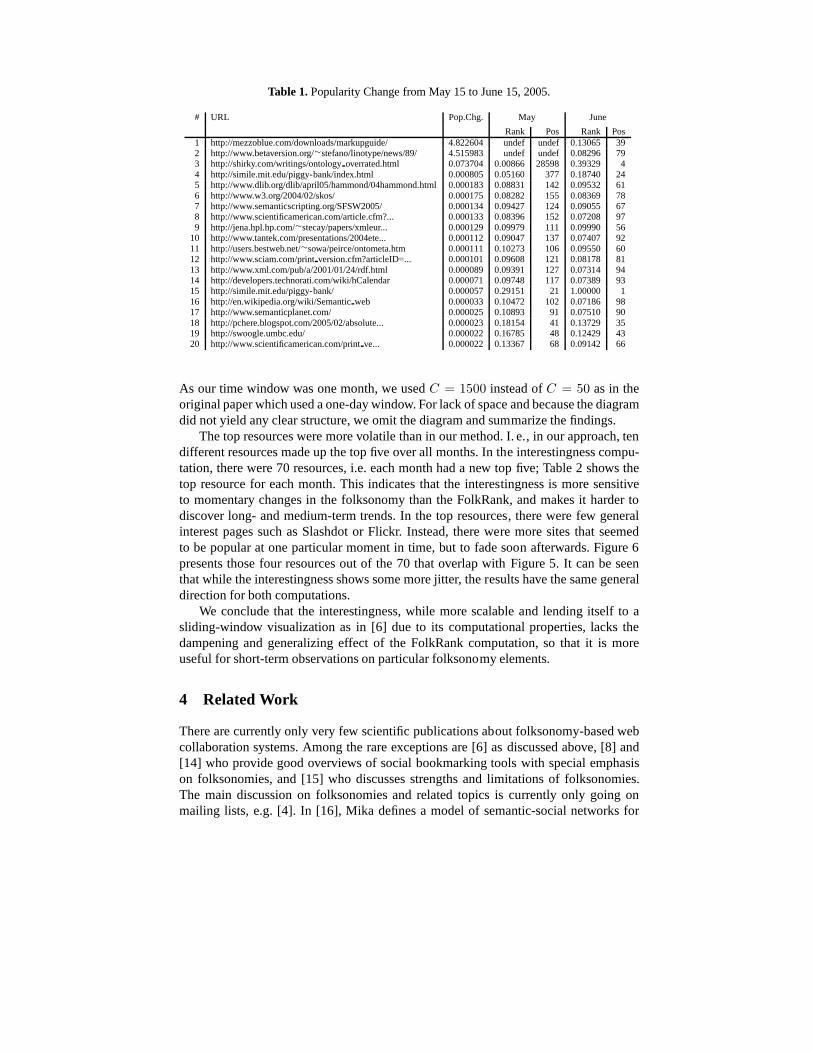
Table 1.Popularity Change from May 15 to June 15, 2005.
# URL Pop.Chg. May June
Rank Pos Rank Pos1 http://mezzoblue.com/downloads/markupguide/ 4.822604 undef undef 0.13065 392 http://www.betaversion.org/∼stefano/linotype/news/89/ 4.515983 undef undef 0.08296 793 http://shirky.com/writings/ontologyoverrated.html 0.073704 0.00866 28598 0.39329 44 http://simile.mit.edu/piggy-bank/index.html 0.000805 0.05160 377 0.18740 245 http://www.dlib.org/dlib/april05/hammond/04hammond.html 0.000183 0.08831 142 0.09532 616 http://www.w3.org/2004/02/skos/ 0.000175 0.08282 155 0.08369 787 http://www.semanticscripting.org/SFSW2005/ 0.000134 0.09427 124 0.09055 678 http://www.scientificamerican.com/article.cfm?... 0.000133 0.08396 152 0.07208 979 http://jena.hpl.hp.com/∼stecay/papers/xmleur... 0.000129 0.09979 111 0.09990 56
10 http://www.tantek.com/presentations/2004ete... 0.000112 0.09047 137 0.07407 9211 http://users.bestweb.net/∼sowa/peirce/ontometa.htm 0.000111 0.10273 106 0.09550 6012 http://www.sciam.com/printversion.cfm?articleID=... 0.000101 0.09608 121 0.08178 8113 http://www.xml.com/pub/a/2001/01/24/rdf.html 0.000089 0.09391 127 0.07314 9414 http://developers.technorati.com/wiki/hCalendar 0.000071 0.09748 117 0.07389 9315 http://simile.mit.edu/piggy-bank/ 0.000057 0.29151 21 1.00000 116 http://en.wikipedia.org/wiki/Semanticweb 0.000033 0.10472 102 0.07186 9817 http://www.semanticplanet.com/ 0.000025 0.10893 91 0.07510 9018 http://pchere.blogspot.com/2005/02/absolute... 0.000023 0.18154 41 0.13729 3519 http://swoogle.umbc.edu/ 0.000022 0.16785 48 0.12429 4320 http://www.scientificamerican.com/printve... 0.000022 0.13367 68 0.09142 66
As our time window was one month, we usedC = 1500 instead ofC = 50 as in theoriginal paper which used a one-day window. For lack of spaceand because the diagramdid not yield any clear structure, we omit the diagram and summarize the findings.
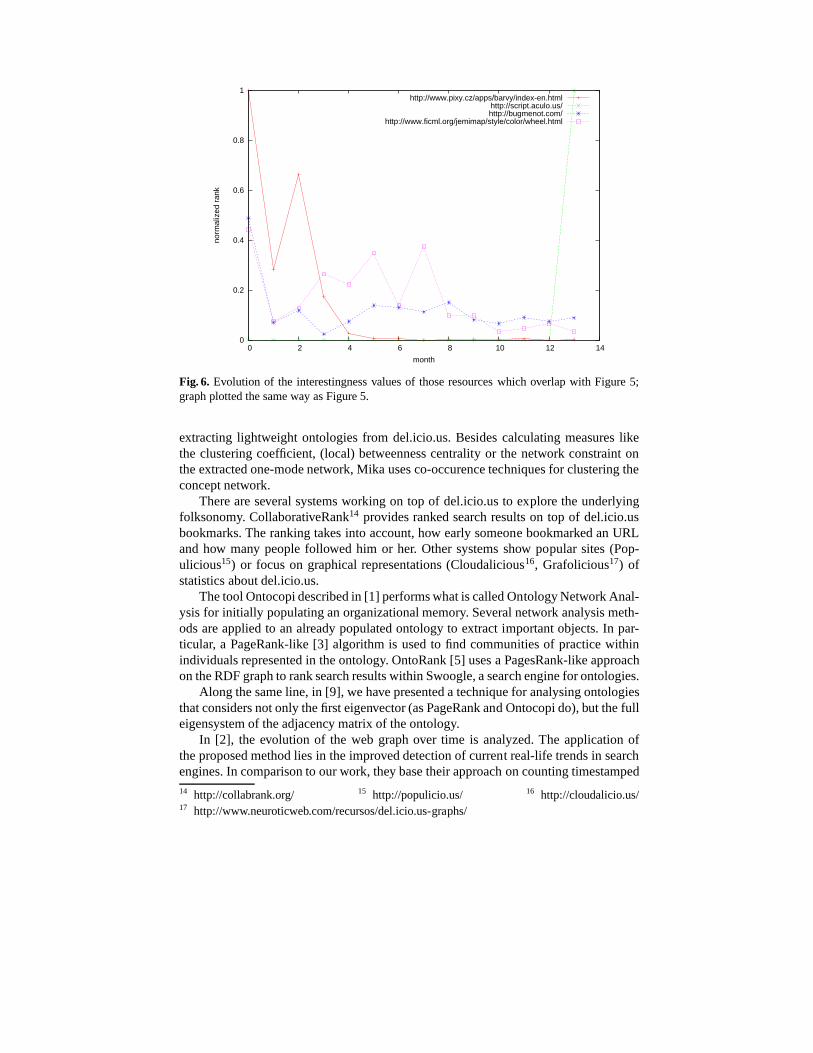
The top resources were more volatile than in our method. I. e., in our approach, tendifferent resources made up the top five over all months. In the interestingness compu-tation, there were 70 resources, i.e. each month had a new topfive; Table 2 shows thetop resource for each month. This indicates that the interestingness is more sensitiveto momentary changes in the folksonomy than the FolkRank, and makes it harder todiscover long- and medium-term trends. In the top resources, there were few generalinterest pages such as Slashdot or Flickr. Instead, there were more sites that seemedto be popular at one particular moment in time, but to fade soon afterwards. Figure 6presents those four resources out of the 70 that overlap withFigure 5. It can be seenthat while the interestingness shows some more jitter, the results have the same generaldirection for both computations.
We conclude that the interestingness, while more scalable and lending itself to asliding-window visualization as in [6] due to its computational properties, lacks thedampening and generalizing effect of the FolkRank computation, so that it is moreuseful for short-term observations on particular folksonomy elements.
4 Related Work
There are currently only very few scientific publications about folksonomy-based webcollaboration systems. Among the rare exceptions are [6] asdiscussed above, [8] and[14] who provide good overviews of social bookmarking toolswith special emphasison folksonomies, and [15] who discusses strengths and limitations of folksonomies.The main discussion on folksonomies and related topics is currently only going onmailing lists, e.g. [4]. In [16], Mika defines a model of semantic-social networks for
0
0.2
0.4
0.6
0.8
1
0 2 4 6 8 10 12 14
norm
aliz
ed r
ank
month
http://www.pixy.cz/apps/barvy/index-en.htmlhttp://script.aculo.us/http://bugmenot.com/
http://www.ficml.org/jemimap/style/color/wheel.html
Fig. 6. Evolution of the interestingness values of those resourceswhich overlap with Figure 5;graph plotted the same way as Figure 5.
extracting lightweight ontologies from del.icio.us. Besides calculating measures likethe clustering coefficient, (local) betweenness centrality or the network constraint onthe extracted one-mode network, Mika uses co-occurence techniques for clustering theconcept network.
There are several systems working on top of del.icio.us to explore the underlyingfolksonomy. CollaborativeRank14 provides ranked search results on top of del.icio.usbookmarks. The ranking takes into account, how early someone bookmarked an URLand how many people followed him or her. Other systems show popular sites (Pop-ulicious15) or focus on graphical representations (Cloudalicious16, Grafolicious17) ofstatistics about del.icio.us.
The tool Ontocopi described in [1] performs what is called Ontology Network Anal-ysis for initially populating an organizational memory. Several network analysis meth-ods are applied to an already populated ontology to extract important objects. In par-ticular, a PageRank-like [3] algorithm is used to find communities of practice withinindividuals represented in the ontology. OntoRank [5] usesa PagesRank-like approachon the RDF graph to rank search results within Swoogle, a search engine for ontologies.
Along the same line, in [9], we have presented a technique foranalysing ontologiesthat considers not only the first eigenvector (as PageRank and Ontocopi do), but the fulleigensystem of the adjacency matrix of the ontology.
In [2], the evolution of the web graph over time is analyzed. The application ofthe proposed method lies in the improved detection of current real-life trends in searchengines. In comparison to our work, they base their approachon counting timestamped14 http://collabrank.org/ 15 http://populicio.us/ 16 http://cloudalicio.us/17 http://www.neuroticweb.com/recursos/del.icio.us-graphs/
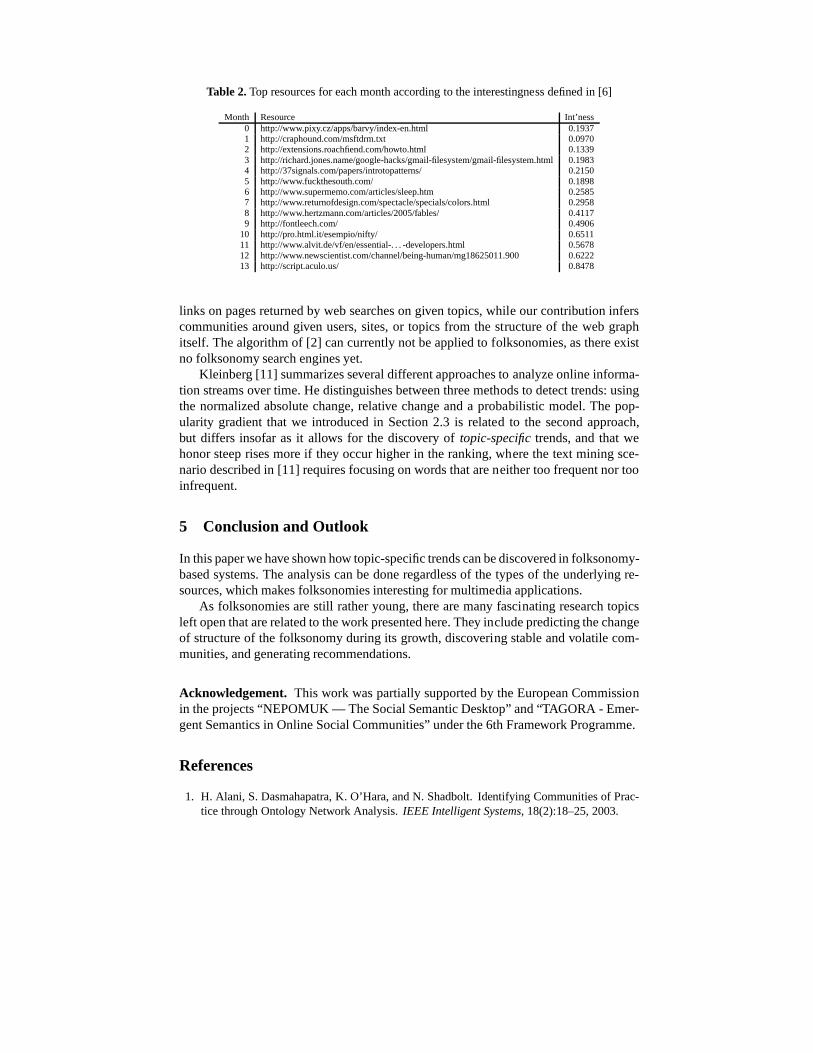
Table 2.Top resources for each month according to the interestingness defined in [6]
Month Resource Int’ness0 http://www.pixy.cz/apps/barvy/index-en.html 0.19371 http://craphound.com/msftdrm.txt 0.09702 http://extensions.roachfiend.com/howto.html 0.13393 http://richard.jones.name/google-hacks/gmail-filesystem/gmail-filesystem.html 0.19834 http://37signals.com/papers/introtopatterns/ 0.21505 http://www.fuckthesouth.com/ 0.18986 http://www.supermemo.com/articles/sleep.htm 0.25857 http://www.returnofdesign.com/spectacle/specials/colors.html 0.29588 http://www.hertzmann.com/articles/2005/fables/ 0.41179 http://fontleech.com/ 0.4906
10 http://pro.html.it/esempio/nifty/ 0.651111 http://www.alvit.de/vf/en/essential-. . . -developers.html 0.567812 http://www.newscientist.com/channel/being-human/mg18625011.900 0.622213 http://script.aculo.us/ 0.8478
links on pages returned by web searches on given topics, while our contribution inferscommunities around given users, sites, or topics from the structure of the web graphitself. The algorithm of [2] can currently not be applied to folksonomies, as there existno folksonomy search engines yet.
Kleinberg [11] summarizes several different approaches toanalyze online informa-tion streams over time. He distinguishes between three methods to detect trends: usingthe normalized absolute change, relative change and a probabilistic model. The pop-ularity gradient that we introduced in Section 2.3 is related to the second approach,but differs insofar as it allows for the discovery oftopic-specifictrends, and that wehonor steep rises more if they occur higher in the ranking, where the text mining sce-nario described in [11] requires focusing on words that are neither too frequent nor tooinfrequent.
5 Conclusion and Outlook
In this paper we have shown how topic-specific trends can be discovered in folksonomy-based systems. The analysis can be done regardless of the types of the underlying re-sources, which makes folksonomies interesting for multimedia applications.
As folksonomies are still rather young, there are many fascinating research topicsleft open that are related to the work presented here. They include predicting the changeof structure of the folksonomy during its growth, discovering stable and volatile com-munities, and generating recommendations.
Acknowledgement. This work was partially supported by the European Commissionin the projects “NEPOMUK — The Social Semantic Desktop” and “TAGORA - Emer-gent Semantics in Online Social Communities” under the 6th Framework Programme.
References
1. H. Alani, S. Dasmahapatra, K. O’Hara, and N. Shadbolt. Identifying Communities of Prac-tice through Ontology Network Analysis.IEEE Intelligent Systems, 18(2):18–25, 2003.
2. E. Amitay, D. Carmel, M. Herscovici, R. Lempel, and A. Soffer. Trend detection throughtemporal link analysis.J. Am. Soc. Inf. Sci. Technol., 55(14):1270–1281, 2004.
3. S. Brin and L. Page. The Anatomy of a Large-Scale Hypertextual Web Search Engine.Computer Networks and ISDN Systems, 30(1-7):107–117, April 1998.
4. Connotea Mailing List. https://lists.sourceforge.net/lists/listinfo/connotea-discuss.5. L. Ding, R. Pan, T. W. Finin, A. Joshi, Y. Peng, and P. Kolari. Finding and ranking knowledge
on the semantic web. InInternational Semantic Web Conference, pages 156–170, 2005.6. M. Dubinko, R. Kumar, J. Magnani, J. Novak, P. Raghavan, and A. Tomkins. Visualizing
tags over time. InProc. 15th Int. WWW Conference, May 2006.7. B. Ganter and R. Wille.Formal Concept Analysis: Mathematical foundations. Springer,
1999.8. T. Hammond, T. Hannay, B. Lund, and J. Scott. Social Bookmarking Tools (I): A General
Review.D-Lib Magazine, 11(4), April 2005.9. B. Hoser, A. Hotho, R. Jaschke, C. Schmitz, and G. Stumme.Semantic network analysis of
ontologies. In Y. Sure and J. Domingue, editors,The Semantic Web: Research and Applica-tions, volume 4011 ofLNAI, pages 514–529, Heidelberg, June 2006. Springer.
10. A. Hotho, R. Jaschke, C. Schmitz, and G. Stumme. Information retrieval in folksonomies:Search and ranking. In Y. Sure and J. Domingue, editors,The Semantic Web: Research andApplications, volume 4011 ofLNAI, pages 411–426, Heidelberg, June 2006. Springer.
11. J. Kleinberg. Temporal dynamics of on-line informationstreams. In M. Garofalakis,J. Gehrke, and R. Rastogi, editors,Data Stream Management: Processing High-Speed DataStreams. Springer, 2006.
12. J. M. Kleinberg. Authoritative sources in a hyperlinkedenvironment.Journal of the ACM,46(5):604–632, 1999.
13. F. Lehmann and R. Wille. A triadic approach to formal concept analysis. InConceptualStructures: Applications, Implementation and Theory, volume 954 ofLNCS. Springer, 1995.
14. B. Lund, T. Hammond, M. Flack, and T. Hannay. Social Bookmarking Tools (II): A CaseStudy - Connotea.D-Lib Magazine, 11(4), April 2005.
15. A. Mathes. Folksonomies – Cooperative Classification and CommunicationThrough Shared Metadata, December 2004. http://www.adammathes.com/academic/computer-mediated-communication/folk%sonomies.html.
16. P. Mika. Ontologies Are Us: A Unified Model of Social Networks and Semantics. In Y. Gil,E. Motta, V. R. Benjamins, and M. A. Musen, editors,ISWC 2005, volume 3729 ofLNCS,pages 522–536, Berlin Heidelberg, November 2005. Springer-Verlag.
17. S. Staab, S. Santini, F. Nack, L. Steels, and A. Maedche. Emergent semantics.IntelligentSystems, IEEE [see also IEEE Expert], 17(1):78–86, 2002.
18. L. Steels. The origins of ontologies and communication conventions in multi-agent systems.Autonomous Agents and Multi-Agent Systems, 1(2):169–194, October 1998.
19. G. Stumme. A finite state model for on-line analytical processing in triadic contexts. InB. Ganter and R. Godin, editors,Proc. 3rd Intl. Conf. on Formal Concept Analysis, volume3403 ofLecture Notes in Computer Science, pages 315–328. Springer, 2005.
20. R. Wille. Restructuring lattice theory: An approach based on hierarchies of concepts. InI. Rival, editor,Ordered Sets, pages 445–470. Reidel, Dordrecht-Boston, 1982.
21. W. Xi, B. Zhang, Y. Lu, Z. Chen, S. Yan, H. Zeng, W. Ma, and E.Fox. Link fusion: A unifiedlink analysis framework for multi-type interrelated data objects. InProc. 13th InternationalWorld Wide Web Conference, New York, 2004.


