Embed Size (px)
Citation preview
CRÉDIT AGRICOLE S.A.
CONSOLIDATED FINANCIAL STATEMENTS AT 31
DECEMBER 2017
Approved by the Crédit Agricole S.A. Board of Directors on 13 February 2018 and subject to approval by the General Meeting of Shareholders on 16 May 2018
UNAUDITED VERSION
Consolidated financial statements of Crédit Agricole S.A. – 31 December 2017
2
CONTENTS
GENERAL FRAMEWORK ................................................................................................................................... 4
>> LEGAL PRESENTATION OF THE ENTITY ........................................................................................... 4 >> CREDIT AGRICOLE INTERNAL RELATIONS ...................................................................................... 5 >> RELATED PARTIES ............................................................................................................................ 12
CONSOLIDATED FINANCIAL STATEMENTS ................................................................................................. 14
>> INCOME STATEMENT ......................................................................................................................... 14 >> NET INCOME AND OTHER COMPREHENSIVE INCOME ................................................................. 15 >> BALANCE SHEET – ASSETS ............................................................................................................. 16 >> BALANCE SHEET – LIABILITIES ....................................................................................................... 17 >> STATEMENT OF CHANGES IN EQUITY ............................................................................................ 18 >> CASH FLOW STATEMENT ................................................................................................................. 20
NOTES TO THE CONSOLIDATED FINANCIAL STATEMENTS ...................................................................... 23
1. GROUP ACCOUNTING POLICIES AND PRINCIPLES, ASSESSMENTS AND ESTIMATES. ............................... 23 1.1 Applicable standards and comparability ............................................................................. 23 1.2 Presentation of financial statements ................................................................................... 32 1.3 Accounting policies and principles ...................................................................................... 33 1.4 Consolidation principles and methods (IFRS 10, IFRS 11 and IAS 28) ............................ 62
2. MAJOR STRUCTURAL TRANSACTIONS AND MATERIAL EVENTS DURING THE PERIOD .............................. 68 2.1 Tax law changes in France and the United States .............................................................. 68 2.2 Main changes in the scope of consolidation ....................................................................... 69 2.3 Impairment losses on goodwill International retail banking - Poland CGU ..................... 74 2.4 Home purchase savings schemes provision ...................................................................... 74 2.5 Cheque Image Exchange litigation ....................................................................................... 74 2.6 Consequences of early redemption of macro-hedged loans ............................................ 75 2.7 Optimising the debt of the Crédit Agricole S.A. group ...................................................... 75
3. FINANCIAL MANAGEMENT, RISK EXPOSURE AND HEDGING POLICY....................................................... 76 3.1 Credit risk ................................................................................................................................ 76 3.2 Market risk ............................................................................................................................... 83 3.3 Liquidity and financing risk ................................................................................................... 86 3.4 Cash flow and fair value interest rate and foreign exchange hedging ............................. 88 3.5 Operational risks .................................................................................................................... 89 3.6 Capital management and regulatory ratios ......................................................................... 89
4. NOTES TO THE INCOME STATEMENT AND OTHER COMPREHENSIVE INCOME .......................................... 90 4.1 Interest income and expenses ............................................................................................................ 90 4.2 Net fees and commissions ................................................................................................................... 90 4.3 Net gains (losses) on financial instruments at fair value through profit or loss............................. 91 4.4 Net gains (losses) on available-for-sale financial assets ......................................................................... 92 4.5 Net income (expenses) on other activities ............................................................................................... 93 4.6 Operating expenses ................................................................................................................................. 93 4.7 Depreciation, amortisation and impairment of property, plant & equipment and intangible assets ......... 94 4.8 Cost of risk ............................................................................................................................................... 95 4.9 Net gains (losses) on other assets ........................................................................................................... 95 4.10 Income tax charge .................................................................................................................................. 96 4.11 Changes in other comprehensive income ............................................................................................. 98
5. SEGMENT REPORTING .................................................................................................................... 100
Consolidated financial statements of Crédit Agricole S.A. – 31 December 2017
3
5.1 Operating segment information .............................................................................................. 103 5.2 Segment information : geographical analysis ........................................................................ 104 5.3 Insurance specificities ............................................................................................................ 105
6. NOTES TO THE BALANCE SHEET .............................................................................................................. 107 6.1 Cash, central banks ............................................................................................................................... 107 6.2 Financial assets and liabilities at fair value through profit or loss .......................................................... 107 6.3 Hedging derivative instruments .............................................................................................................. 109 6.4 Available-for-sale financial assets .......................................................................................................... 110 6.5 Loans and receivables due from credit institutions and due from customers ........................................ 111 6.6 Held-to-maturity financial assets ............................................................................................................ 112 6.7 Transferred assets not derecognised or derecognised with on-going involvement .............................. 113 6.8 Impairment deducted from financial assets ........................................................................................... 116 6.9 Exposure to sovereign risk ..................................................................................................................... 117 6.10 Due to credit institutions and to customers .......................................................................................... 118 6.11 Debt securities and subordinated debt ................................................................................................ 119 6.12 Information on the offsetting of financial assets and financial liabilities ............................................... 123 6.13 Current and deferred tax assets and liabilities ..................................................................................... 125 6.14 Accrued income and expenses and other assets and liabilities .......................................................... 126 6.15 Joint ventures and associates .............................................................................................................. 127 6.16 Investment properties........................................................................................................................... 130 6.17 Property, plant & equipment and intangible assets (excluding goodwill) ............................................. 131 6.18 Goodwill 131 6.19 Insurance company technical reserves ................................................................................................ 134 6.20 Provisions ............................................................................................................................................. 135 6.21 Equity 142 6.22 Non-controlling interests ...................................................................................................................... 146 6.23 Breakdown of financial assets and financial liabilities by contractual maturity .................................... 148
7. EMPLOYEE BENEFITS AND OTHER COMPENSATION ................................................................................... 150 7.1 Analysis of employee expenses ......................................................................................... 150 7.2 Headcount at year-end ......................................................................................................... 150 7.3 Post-employment benefits, defined-contribution plans ................................................... 150 7.4 Post-employment benefits, defined-benefit plans ............................................................ 151 7.5 Other employee benefits ..................................................................................................... 154 7.6 Share-based payments ........................................................................................................ 154 7.7 Executive compensation ..................................................................................................... 154
8. COMMITMENTS GIVEN AND RECEIVED ...................................................................................................... 156 9. RECLASSIFICATION OF FINANCIAL INSTRUMENTS ..................................................................................... 159 10. FAIR VALUE OF FINANCIAL INSTRUMENTS .............................................................................................. 161
10.1 Fair value of financial assets and liabilities measured at cost ............................................................. 162 10.2 Information about financial instruments measured at fair value .......................................................... 165 10.3 Estimated impact of inclusion of the margin at inception ..................................................................... 179
11. SCOPE OF CONSOLIDATION AT 31 DECEMBER 2017 .............................................................................. 180 11.1 Information on subsidiaires .............................................................................................................. 180 11.2 Scope of consolidation...................................................................................................................... 182
12. INVESTMENTS IN NON-CONSOLIDATED COMPANIES AND STRUCTURED ENTITIES ....................................... 187 12.1 Information on subsidiaries .................................................................................................................. 191 12.2 Non-consolidated structured entities .................................................................................................... 191
13. EVENTS SUBSEQUENT TO 31 DECEMBER 2017 ...................................................................................... 195 13.1 Agreement to acquire the majority of the share capital of Banca Leonardo .......................... 195 13.2 Elimination of loyalty dividends .............................................................................................. 195
Consolidated financial statements of Crédit Agricole S.A. – 31 December 2017
4
GENERAL FRAMEWORK
>> LEGAL PRESENTATION OF THE ENTITY
Since the Extraordinary General Meeting of Shareholders of 29 November 2001, the Company’s name has been: Crédit Agricole S.A. Since 1 July 2012, the address of the Company’s registered office has been: 12, place des États-Unis, 92127 Montrouge Cedex, France. Registration number: 784 608 416 Nanterre Trade and Companies Register NAF code: 6419Z Crédit Agricole S.A. is a French Public Limited Company (Société Anonyme) with a Board of Directors governed by ordinary company law and more specifically by Book II of the French Commercial Code. Crédit Agricole S.A. is also subject to the provisions of the French Monetary and Financial Code and more specifically Articles L. 512-47 et seq. thereof. Crédit Agricole S.A. was licensed as an authorised lending institution in the mutual and cooperative banks category on 17 November 1984. As such, it is subject to oversight by the banking supervisory authorities, and more particularly by the French Regulatory and Resolution Supervisory Authority (ACPR) and the European Central Bank. Crédit Agricole S.A. shares are admitted for trading on Euronext Paris. Crédit Agricole S.A. is subject to the prevailing stock market regulations particularly with respect to public disclosure obligations.
Consolidated financial statements of Crédit Agricole S.A. – 31 December 2017
5
>> CREDIT AGRICOLE INTERNAL RELATIONS
A BANK WITH MUTUAL ROOTS
SAS Rue La Boétie, which is wholly owned by the Regional Banks, holds the majority of Crédit
Agricole S.A.’s share capital. Shares in SAS Rue La Boétie may not be transferred outside the
Regional Banks’ network. Furthermore, any trading in these shares between Regional Banks is
governed by a liquidity agreement that in particular sets out the procedures for determining the
transaction price. This encompasses both disposals of shares between the Regional Banks and
capital increases at SAS Rue La Boétie.
The Fédération Nationale du Crédit Agricole (FNCA) acts as a consultative and representative
body, and as a communication forum for the Regional Banks.
In accordance with the provisions of the French Monetary and Financial Code (Articles L. 511-31
and L. 511-32), as the central body of the Crédit Agricole network, Crédit Agricole S.A. is
responsible for exercising administrative, technical and financial control over the institutions
affiliated to it in order to maintain a cohesive network (as defined in Article R. 512-18 of the French
Monetary and Financial Code) and to ensure their proper functioning and compliance with all
regulations and legislation governing them. In that regard, Crédit Agricole S.A. may take all
necessary measures notably to ensure the liquidity and solvency of the network as a whole and of
each of its affiliated institutions.
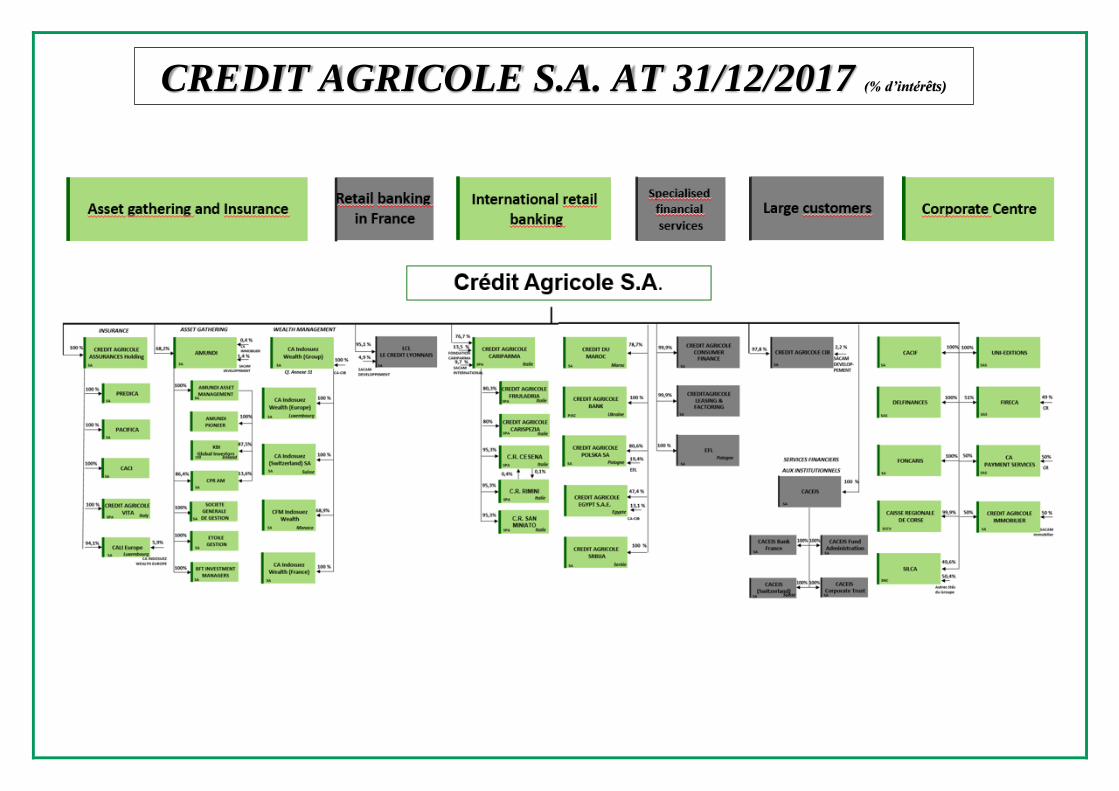
CREDIT AGRICOLE S.A. AT 31/12/2017 (% d’intérêts)
>> CRÉDIT AGRICOLE INTERNAL RELATIONS
INTERNAL FINANCING MECHANISMS
Crédit Agricole has instituted a number of internal financing mechanisms specific to the Group.
Regional Banks’ current accounts
Each Regional Bank holds a current account with Crédit Agricole S.A., which records the financial
movements resulting from internal financial transactions within the Group. This account, which may
be in credit or debit, is presented in the balance sheet under “Crédit Agricole internal transactions
– Current Accounts” and integrated on a specific line item, either “Loans and receivables due from
credit institutions” or “Due to credit institutions”.
Special savings accounts
Funds held in special savings accounts (popular savings plans (Livret d’épargne populaire),
sustainable development passbook accounts (Livret de développement durable), home purchase
savings plans and accounts, youth passbook accounts and Livret A passbook savings accounts)
are collected by the Regional Banks on behalf of Crédit Agricole S.A. These funds are required to
be transferred to the latter. Crédit Agricole S.A. recognises them on its balance sheet as “Due to
customers”.
Term deposits and advances
The Regional Banks also collect savings funds (passbook accounts, bonds, warrants, certain term
accounts and related accounts, etc.) on behalf of Crédit Agricole S.A. These funds are transferred
to Crédit Agricole S.A., and are recognised as such on its balance sheet.
Special savings accounts and time deposits and advances are used by Crédit Agricole S.A. to make
“advances” (loans) to the Regional Banks, with a view to funding their medium and long-term loans.
A series of four internal financial reforms has been implemented. These reforms have permitted the
transfer back to the Regional Banks, in the form of mirror advances (with maturities and interest
rates precisely matching those of the savings funds received) of first 15%, 25%, then 33% and,
since 31 December 2001, 50% of the savings resources, which they are free to use at their
discretion.
Since 1 January 2004, the financial margins generated by the centralised management of funds
collected (and not transferred back via mirror advances) are shared by the Regional Banks and
Crédit Agricole S.A. and are determined by using replacement models and applying market rates.
Furthermore, 50% of new loans written since 1st January 2004 and falling within the field of
application of financial relations between Crédit Agricole S.A. and the Regional Banks may be
refinanced in the form of advances negotiated at market rates with Crédit Agricole S.A.
Consolidated financial statements of Crédit Agricole S.A. – 31 December 2017
8
Hence, there are currently two types of advances: advances governed by financial rules from before
1 January 2004 and those governed by the new rules.
Crédit Agricole S.A. may also make additional financing available to the Regional Banks at market
rates.
Transfer of Regional Banks’ liquidity surpluses
The Regional Banks may use their monetary deposits (demand deposits, non-centralised term
deposits and negotiable certificates of deposit) to finance lending to their customers. Surpluses
must be transferred to Crédit Agricole S.A. where they are booked as current or term accounts,
under “Crédit Agricole internal transactions”.
Investment of Regional Banks’ surplus capital with Crédit Agricole S.A.
Available surplus capital may be invested with Crédit Agricole S.A. in the form of three to ten-year
instruments with the same characteristics of interbank money market transactions in all respects.
Foreign currency transactions
Crédit Agricole S.A. represents the Regional Banks with respect to the Bank of France and
centralises their foreign currency transactions.
Medium and long-term notes issued by Crédit Agricole S.A.
These are placed mainly on the market or by the Regional Banks with their customers. They are
booked by Crédit Agricole S.A. under liabilities either as “Debt securities” or as “Subordinated debt”,
depending on the type of security issued.
HEDGING OF LIQUIDITY AND SOLVENCY RISKS
Under the legal internal financial solidarity mechanism enshrined in Article L. 511-31 of the French
Monetary and Financial Code, Crédit Agricole S.A. as a central body, must take all measures
necessary to ensure the liquidity and solvency of each affiliated credit institution, as well as the
network as a whole. As a result, each member of the network and each affiliated institution benefits
from this internal financial solidarity mechanism.
The general provisions of the French Monetary and Financial Code are transposed into internal
provisions setting out the operational measures required for this internal financial solidarity
mechanism.
During the IPO of Crédit Agricole S.A. in 2001, CNCA (now Crédit Agricole S.A.) signed an
agreement with the Regional Banks to govern internal relations within Crédit Agricole Group. The
agreement notably provided for the creation of a Fund for Bank Liquidity and Solvency Risks
(FRBLS) designed to enable Crédit Agricole S.A. to fulfil its role as central body by providing
assistance to any affiliated members that may experience difficulties. The main provisions of this
agreement are set out in Chapter III of the registration document filed by Crédit Agricole S.A. with
Consolidated financial statements of Crédit Agricole S.A. – 31 December 2017
9
the Commission des Opérations de Bourse on 22 October 2001 under number R. 01-453. The fund
was originally allocated €610 million in assets. At 31 December 2017 it totalled €1,112 million,
having been increased by €36 million in the course of the year.
European legislation relating to the resolution of banking crises adopted in 2014 (the BRRD
directive transposed into French law by Ordinance 2015-1024 of 20 August 2015, which also
brought French law into line with the regulation establishing a Single Resolution Mechanism)
introduced a number of significant changes to the regulations applicable to credit institutions.
Moreover, European legislation relating to the resolution of banking crises adopted in 2014 (the
BRRD directive transposed into French law by Ordinance 2015-1024 of 20 August 2015, which also
brought French law into line with the regulation establishing a Single Resolution Mechanism)
introduced a number of significant changes to the regulations applicable to credit institutions.
The new framework, which includes measures to prevent and to resolve banking crises, is intended
to preserve financial stability, to ensure the continuity of activities, services and operations of
institutions whose failure could significantly impact the economy, to protect depositors and to avoid
or limit, as much as possible, the use of public financial support. In this context, the European
resolution authorities, including the Single Resolution Board, were granted extensive powers to take
all necessary measures in connection with the resolution of all or part of a credit institution or the
group to which it belongs.
This resolution framework does not affect the legal internal financial solidarity mechanism enshrined
in Article L. 511-31 of the French Monetary and Financial Code, which applies to the Crédit Agricole
Network, as defined in Article R. 512-18 of the same Code. Crédit Agricole S.A. considers that, in
practice, this mechanism should be implemented prior to any resolution procedure, given that, as
central body, Crédit Agricole must take all measures necessary to ensure the liquidity and solvency
of each network member, as well as the network as a whole. As a result, each member of the
network (including Crédit Agricole S.A.) benefits from this internal financial solidarity mechanism.
The application of the resolution procedure to Crédit Agricole Group would thus mean that the legal
internal solidarity mechanism had failed to cope with the bankruptcy of one or more Group affiliates,
and hence of the network as a whole. By its very nature it also hinders the monitoring of the
conditions for implementing the guarantee of the obligations of Crédit Agricole S.A. granted in 1988
to its third party creditors by the Regional Banks on a joint and several basis, and up to the
aggregate amount of their own funds. It should be recalled that this guarantee may be exercised in
the event of an asset shortfall at Crédit Agricole S.A. identified in the course of its bankruptcy or
dissolution.
In connection with the institution of a resolution procedure, the Single Resolution Board (SRB),
should respect the fundamental principle that no creditor must suffer losses in connection with a
resolution procedure that are greater than those it would suffer if the entity had been liquidated in a
normal insolvency procedure (the “No Creditor Worse Off than on Liquidation” – NCWOL – principle,
set forth in Article L. 613-57-I - of the French Monetary and Financial Code, and Article 73 of the
BRRD directive). Because this principle must be respected, Crédit Agricole S.A. considers that the
existence of the guarantee granted in 1988 by the Regional Banks in favour of the creditors of Crédit
Consolidated financial statements of Crédit Agricole S.A. – 31 December 2017
10
Agricole S.A.,will have to be taken into account by the SRB, although it is not possible to determine
how this will be done.
SPECIFIC GUARANTEES PROVIDED BY THE REGIONAL BANKS TO CRÉDIT
AGRICOLE S.A. (SWITCH)
The Switch guarantee mechanism, established on 23 December 2011 and supplemented by an
initial addendum signed on 19 December 2013 and twice amended in 2016 on 17 February
(amendment no. 2) and 21 July (amendment no. 3) respectively, forms parts of the financial
arrangements between Crédit Agricole S.A., as central body, and the mutual network of Crédit
Agricole Regional Banks. The new guarantees took effect retroactively on 1 July 2016, replacing
the previous guarantees, and expire on 1 March 2027, subject to total or partial early termination or
extension in accordance with the terms of the contract.
With this mechanism, and subject to the upper limit specified in the agreement, the Regional Banks
assume, on behalf of Crédit Agricole S.A., regulatory requirements relating to the equity method of
accounting for certain equity investments held by Crédit Agricole S.A. They also assume the
associated economic risks in the form of compensation, where applicable.
The guarantees allow the transfer of regulatory requirements that henceforth apply to Crédit
Agricole S.A.'s equity investments in Crédit Agricole Assurances (CAA), the latter being equity-
accounted for regulatory reasons: we are now talking about the Insurance Switch guarantees. They
are subject to fixed remuneration covering the present value of the risk and the cost of capital for
the Regional Banks.
The effectiveness of the mechanism is secured by cash deposits paid by the Regional Banks to
Crédit Agricole S.A. These security deposits are calibrated to show the capital savings generated
by Crédit Agricole S.A., and are compensated at a fixed rate based on conditions prevailing for
long-term liquidity.
The Insurance Switch guarantees protect Crédit Agricole S.A. from a decline in the equity-
accounted value of these equity investments, subject to payment by the Regional Banks of
compensation from the security deposit. Likewise, if the equity-accounted value later recovers,
Crédit Agricole S.A. could return previously paid compensation in accordance with a clawback
provision.
In regulatory terms:
- Crédit Agricole S.A. reduces its capital requirements in proportion to the amount of the guarantee
provided by the Regional Banks;
- The Regional Banks symmetrically record capital requirements matching those offloaded by Crédit
Agricole S.A.
This mechanism, which is neutral at Crédit Agricole Group level, enables the rebalancing of capital
allocation between Crédit Agricole S.A. and the Regional Banks.
Consolidated financial statements of Crédit Agricole S.A. – 31 December 2017
11
In accounting terms:
The guarantees are essentially insurance contracts, due to the existence of an insurance risk as
defined by IFRS 4.
For the insured, they are treated as a first demand guarantee received and their compensation is
recognised in stages as a deduction from the interest margin under Revenues.
In the event of a call on guarantees, or following an improvement in fortunes, where applicable, the
compensation payment or redemption proceeds would be recognised under cost of risk.
It should be noted that the Insurance Switch guarantees are triggered on a half-yearly basis and
are assessed on the basis of half-yearly changes in the equity-accounted value of the Crédit
Agricole Assurances equity investments. At each quarterly closing, the Regional Banks are required
to estimate if there is a risk that compensation will be payable and to fund provisions accordingly.
On the other hand, Crédit Agricole, S.A. cannot recognise equivalent income because it is not
certain. At each half-yearly close, and if the conditions have been met, Crédit Agricole. S.A. and
the Regional Banks recognise on a symmetrical basis the effects of triggering the guarantees
(calling or claw-back).
CAPITAL TIES BETWEEN CRÉDIT AGRICOLE S.A. AND THE REGIONAL BANKS
The capital ties between Crédit Agricole S.A. and the Regional Banks are governed by an
agreement entered into by the parties prior to Crédit Agricole S.A.’s initial public offering.
Under the terms of this agreement, the Regional Banks exercise their control over Crédit Agricole
S.A. through SAS Rue La Boétie, a holding company wholly-owned by them. The purpose of SAS
Rue La Boétie is to hold enough shares to ensure that it always owns at least 50% of the share
capital and voting rights of Crédit Agricole S.A.
In addition, under the agreement, Crédit Agricole S.A. directly owned approximately 25% of the
share capital of each Regional Bank (except for the Caisse Régionale de la Corse which is owned
at 100%).
Following the transaction to simplify the Group's capital structure on 3 August 2016, the bulk of the
cooperative investment certificates (Certificats coopératifs d’investissement or CCIs) and the
cooperative associate certificates (Certificats coopératifs d’associés or CCAs) held by Crédit
Agricole S.A. were transferred to a holding company ("Sacam Mutualisation") jointly owned by the
Regional Banks (see Note 2 "Major structural transactions and material events during the period",
"Simplification of the Group's capital through the transfer of Crédit Agricole S.A.'s equity
investments in the Regional Banks to Sacam Mutualisation").
Consolidated financial statements of Crédit Agricole S.A. – 31 December 2017
12
>> RELATED PARTIES
The related parties of Crédit Agricole S.A. Group are the consolidated companies, including
companies accounted for using the equity method, the Group’s Senior Executives and the Regional
Banks, given the Group’s legal structure and due to fact that Crédit Agricole S.A. is the central body
of the Crédit Agricole network.
In accordance with the internal financial mechanisms at Crédit Agricole, transactions between
Crédit Agricole S.A. and the Regional Banks1 are presented on the balance sheet and income
statement as Crédit Agricole internal transactions (Note 4.1 « Interest income and expenses », Note
4.2 « Net fees and commissions », Note 6.5 « Loans and receivables due from credit institutions
and due from customers » and Note 6.10 « Due to credit institutions and to customers »).
Other shareholders’ agreements
Shareholder agreements signed during the year are detailed in Note 2 « Major structural
transactions and material events during the period ».
Relationships between controlled companies affecting the consolidated balance
sheet
A list of Crédit Agricole S.A. Group companies can be found in Note 11 « Scope of consolidation at
31 December 2017 ». Since the transactions and outstandings at year-end between the Group’s
fully consolidated companies are eliminated on consolidation, only transactions with companies
consolidated by the equity method affect the Group’s consolidated financial statements.
The main corresponding outstandings and commitments in the consolidated balance sheet at 31
December 2017 relate to transactions with companies consolidated by the equity method for the
following amounts:
loans and receivables due from credit institutions: €3,799 million;
loans and receivables due from customers: €2,074 million;
amounts due to credit institutions: €2,076 million ;
amounts due to customers: €150 million;
commitments given on financial instruments: €2,369 million;
commitments received on financial instruments: €994 million.
The transactions entered into with these entities did not have a material effect on the income
statement for the period.
1 Except for the Caisse Régionale de la Corse, which is fully consolidated.
Consolidated financial statements of Crédit Agricole S.A. – 31 December 2017
13
Management of retirement, early retirement and end-of-career allowances: internal
hedging contracts within the Group
As presented in Note 1.3 “Accounting policies and principles”, employees are provided with various
types of post-employment benefits. These include:
end-of-career allowances;
retirement plans, which may be either “defined-contribution” or “defined-benefit” plans.
The liability in this respect is partially funded by collective insurance contracts taken out with
Predica, Crédit Agricole Group’s life insurance company.
These contracts govern:
the setting up by the insurance company of mutual funds for investing contributions made
by the employer to build up sufficient funds to cover end-of-career allowances or retirement
benefits;
the management of the funds by the insurance company;
the payment to the beneficiaries of the allowances and of the benefits due under the various
plans.
Information on post-employment benefits is provided in Note 7 “Employee benefits and other
compensation” in paragraphs 7.3 and 7.4.
Relations with senior management
Detailed information on senior management compensation is provided in paragraph 7.7 of Note 7
"Employee benefits and other compensation", as well as in the "Compensation policy" section,
Chapter 3 "Corporate governance" of the Registration Document.
There exist no material transactions between Crédit Agricole S.A. and its senior management, their
families or the companies they control and which are not included in the Group’s scope of
consolidation.
Consolidated financial statements of Crédit Agricole S.A. – 31 December 2017
14
CONSOLIDATED FINANCIAL STATEMENTS
The transfer of cooperative investment certificates (Certificats coopératifs d’investissement or CCIs)
and cooperative associate certificates (Certificats coopératifs d’associés or CCAs) in the Regional
Banks held by Crédit Agricole S.A. to Sacam Mutualisation on 3 August 2006, following the
simplification of the Group's capital structure, had an impact on a number of headings of the
consolidated financial statements at 31 December 2016 : Net income from discontinued operations,
Other comprehensive income on items that will not be reclassified to profit and loss from
discontinued operations, and Other comprehensive income on items that may be reclassified to
profit and loss from discontinued operations.
>> INCOME STATEMENT
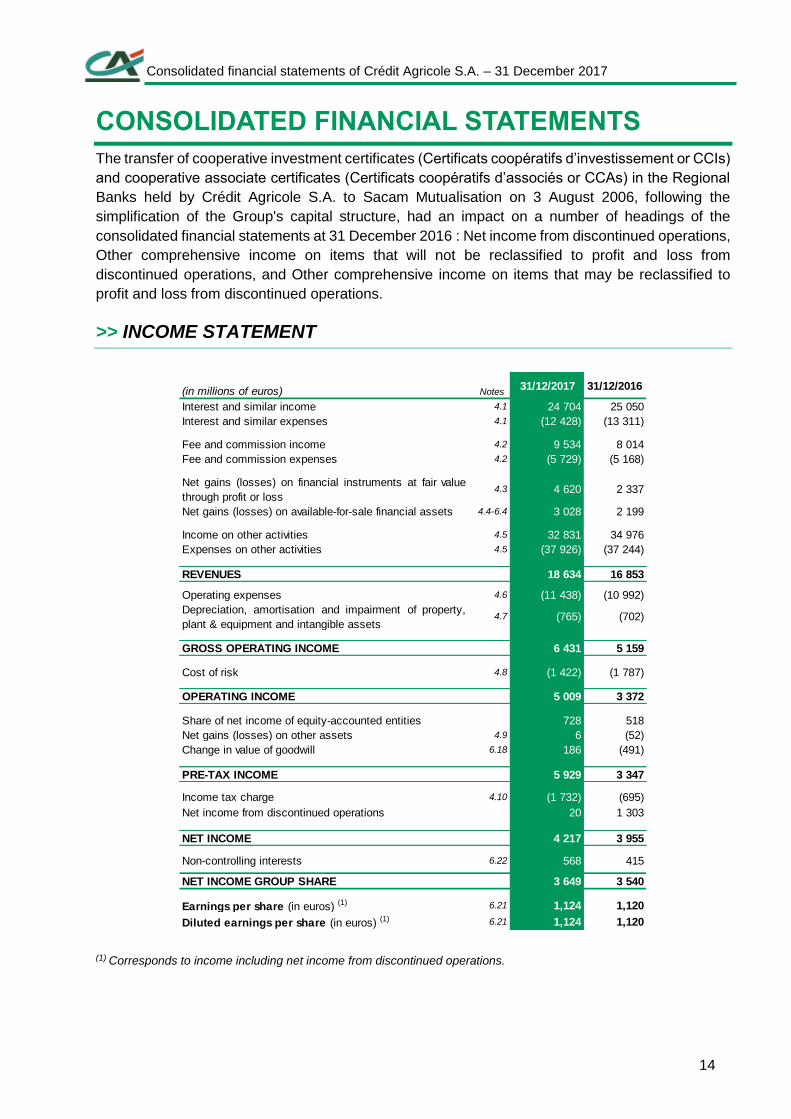
(1) Corresponds to income including net income from discontinued operations.
(in millions of euros) Notes 31/12/2017 31/12/2016
Interest and similar income 4.1 24 704 25 050
Interest and similar expenses 4.1 (12 428) (13 311)
Fee and commission income 4.2 9 534 8 014
Fee and commission expenses 4.2 (5 729) (5 168)
Net gains (losses) on financial instruments at fair value
through profit or loss4.3 4 620 2 337
Net gains (losses) on available-for-sale financial assets 4.4-6.4 3 028 2 199
Income on other activities 4.5 32 831 34 976
Expenses on other activities 4.5 (37 926) (37 244)
REVENUES 18 634 16 853
Operating expenses 4.6 (11 438) (10 992)
Depreciation, amortisation and impairment of property,
plant & equipment and intangible assets4.7 (765) (702)
GROSS OPERATING INCOME 6 431 5 159
Cost of risk 4.8 (1 422) (1 787)
OPERATING INCOME 5 009 3 372
Share of net income of equity-accounted entities 728 518
Net gains (losses) on other assets 4.9 6 (52)
Change in value of goodwill 6.18 186 (491)
PRE-TAX INCOME 5 929 3 347
Income tax charge 4.10 (1 732) (695)
Net income from discontinued operations 20 1 303
NET INCOME 4 217 3 955
Non-controlling interests 6.22 568 415
NET INCOME GROUP SHARE 3 649 3 540
Earnings per share (in euros) (1) 6.21 1,124 1,120
Diluted earnings per share (in euros) (1) 6.21 1,124 1,120
Consolidated financial statements of Crédit Agricole S.A. – 31 December 2017
15
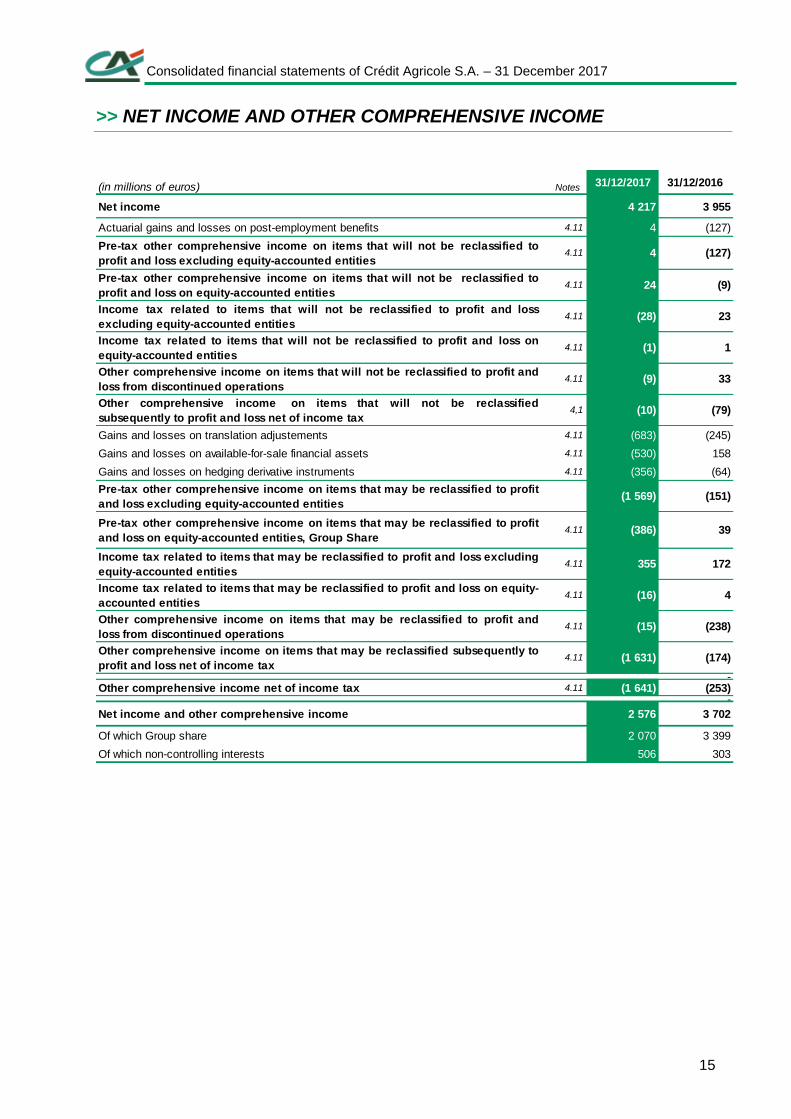
>> NET INCOME AND OTHER COMPREHENSIVE INCOME
(in millions of euros) Notes 31/12/2017 31/12/2016
Net income 4 217 3 955
Actuarial gains and losses on post-employment benefits 4.11 4 (127)
Pre-tax other comprehensive income on items that will not be reclassified to
profit and loss excluding equity-accounted entities4.11 4 (127)
Pre-tax other comprehensive income on items that will not be reclassified to
profit and loss on equity-accounted entities4.11 24 (9)
Income tax related to items that will not be reclassified to profit and loss
excluding equity-accounted entities4.11 (28) 23
Income tax related to items that will not be reclassified to profit and loss on
equity-accounted entities4.11 (1) 1
Other comprehensive income on items that will not be reclassified to profit and
loss from discontinued operations4.11 (9) 33
Other comprehensive income on items that will not be reclassified
subsequently to profit and loss net of income tax4,1 (10) (79)
Gains and losses on translation adjustements 4.11 (683) (245)
Gains and losses on available-for-sale financial assets 4.11 (530) 158
Gains and losses on hedging derivative instruments 4.11 (356) (64)
Pre-tax other comprehensive income on items that may be reclassified to profit
and loss excluding equity-accounted entities(1 569) (151)
Pre-tax other comprehensive income on items that may be reclassified to profit
and loss on equity-accounted entities, Group Share4.11 (386) 39
Income tax related to items that may be reclassified to profit and loss excluding
equity-accounted entities4.11 355 172
Income tax related to items that may be reclassified to profit and loss on equity-
accounted entities4.11 (16) 4
Other comprehensive income on items that may be reclassified to profit and
loss from discontinued operations4.11 (15) (238)
Other comprehensive income on items that may be reclassified subsequently to
profit and loss net of income tax4.11 (1 631) (174)
- -Other comprehensive income net of income tax 4.11 (1 641) (253)
- -
Net income and other comprehensive income 2 576 3 702
Of which Group share 2 070 3 399
Of which non-controlling interests 506 303
Consolidated financial statements of Crédit Agricole S.A. – 31 December 2017
16
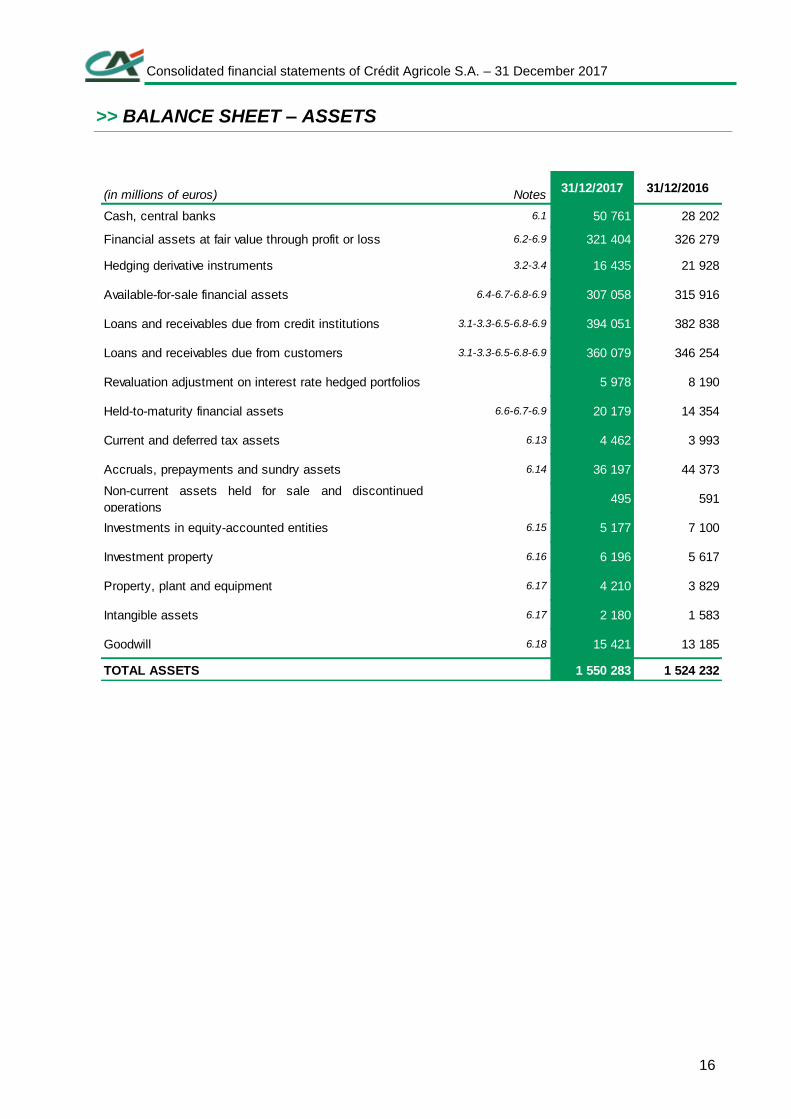
>> BALANCE SHEET – ASSETS
(in millions of euros) Notes31/12/2017 31/12/2016
Cash, central banks 6.1 50 761 28 202
Financial assets at fair value through profit or loss 6.2-6.9 321 404 326 279
Hedging derivative instruments 3.2-3.4 16 435 21 928
Available-for-sale financial assets 6.4-6.7-6.8-6.9 307 058 315 916
Loans and receivables due from credit institutions 3.1-3.3-6.5-6.8-6.9 394 051 382 838
Loans and receivables due from customers 3.1-3.3-6.5-6.8-6.9 360 079 346 254
Revaluation adjustment on interest rate hedged portfolios 5 978 8 190
Held-to-maturity financial assets 6.6-6.7-6.9 20 179 14 354
Current and deferred tax assets 6.13 4 462 3 993
Accruals, prepayments and sundry assets 6.14 36 197 44 373
Non-current assets held for sale and discontinued
operations495 591
Investments in equity-accounted entities 6.15 5 177 7 100
Investment property 6.16 6 196 5 617
Property, plant and equipment 6.17 4 210 3 829
Intangible assets 6.17 2 180 1 583
Goodwill 6.18 15 421 13 185
TOTAL ASSETS 1 550 283 1 524 232
Consolidated financial statements of Crédit Agricole S.A. – 31 December 2017
17
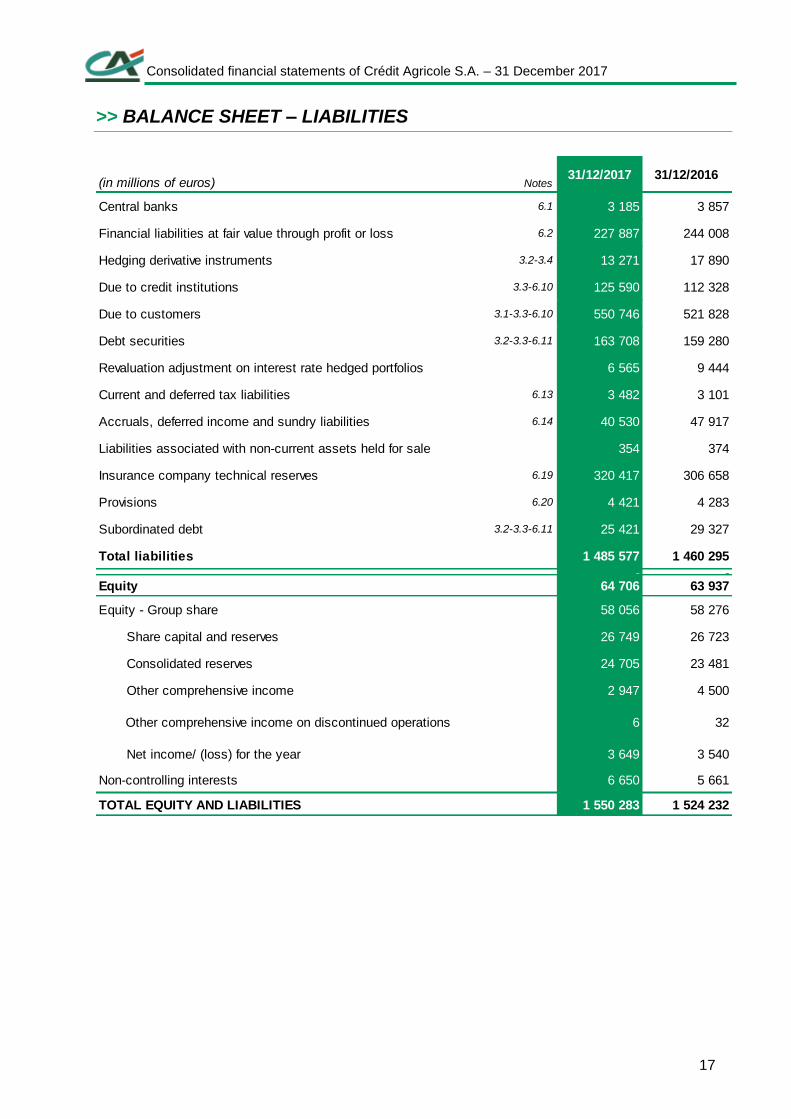
>> BALANCE SHEET – LIABILITIES
(in millions of euros) Notes31/12/2017 31/12/2016
Central banks 6.1 3 185 3 857
Financial liabilities at fair value through profit or loss 6.2 227 887 244 008
Hedging derivative instruments 3.2-3.4 13 271 17 890
Due to credit institutions 3.3-6.10 125 590 112 328
Due to customers 3.1-3.3-6.10 550 746 521 828
Debt securities 3.2-3.3-6.11 163 708 159 280
Revaluation adjustment on interest rate hedged portfolios 6 565 9 444
Current and deferred tax liabilities 6.13 3 482 3 101
Accruals, deferred income and sundry liabilities 6.14 40 530 47 917
Liabilities associated with non-current assets held for sale 354 374
Insurance company technical reserves 6.19 320 417 306 658
Provisions 6.20 4 421 4 283
Subordinated debt 3.2-3.3-6.11 25 421 29 327
Total liabilities 1 485 577 1 460 295
- -Equity 64 706 63 937
Equity - Group share 58 056 58 276
Share capital and reserves 26 749 26 723
Consolidated reserves 24 705 23 481
Other comprehensive income 2 947 4 500
6 32
Net income/ (loss) for the year 3 649 3 540
Non-controlling interests 6 650 5 661
TOTAL EQUITY AND LIABILITIES 1 550 283 1 524 232
Other comprehensive income on discontinued operations
Consolidated financial statements of Crédit Agricole S.A. – 31 December 2017
18
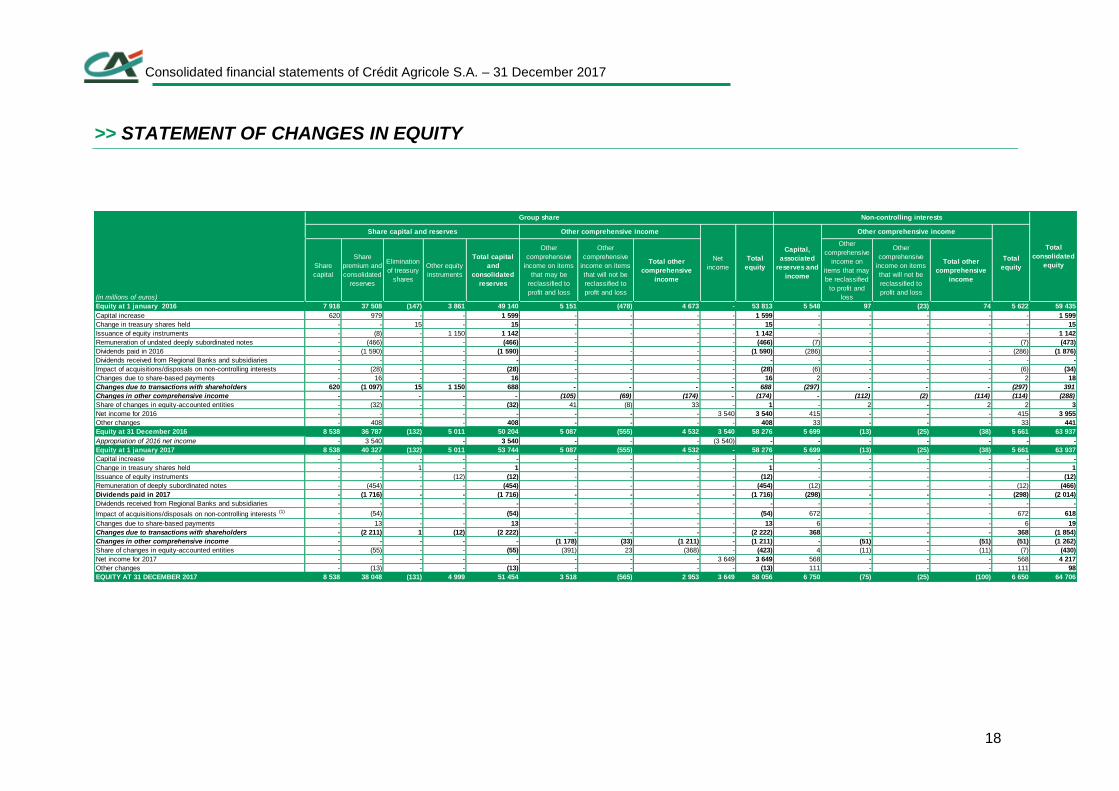
>> STATEMENT OF CHANGES IN EQUITY
(in millions of euros)
Share
capital
Share
premium and
consolidated
reserves
Elimination
of treasury
shares
Other equity
instruments
Total capital
and
consolidated
reserves
Other
comprehensive
income on items
that may be
reclassified to
profit and loss
Other
comprehensive
income on items
that will not be
reclassified to
profit and loss
Total other
comprehensive
income
Other
comprehensive
income on
items that may
be reclassified
to profit and
loss
Other
comprehensive
income on items
that will not be
reclassified to
profit and loss
Total other
comprehensive
income
Equity at 1 january 2016 7 918 37 508 (147) 3 861 49 140 5 151 (478) 4 673 - 53 813 5 548 97 (23) 74 5 622 59 435
Capital increase 620 979 - - 1 599 - - - - 1 599 - - - - - 1 599
Change in treasury shares held - - 15 - 15 - - - - 15 - - - - - 15
Issuance of equity instruments - (8) - 1 150 1 142 - - - - 1 142 - - - - - 1 142
Remuneration of undated deeply subordinated notes - (466) - - (466) - - - - (466) (7) - - - (7) (473)
Dividends paid in 2016 - (1 590) - - (1 590) - - - - (1 590) (286) - - - (286) (1 876)
Dividends received from Regional Banks and subsidiaries - - - - - - - - - - - - - - - -
Impact of acquisitions/disposals on non-controlling interests - (28) - - (28) - - - - (28) (6) - - - (6) (34)
Changes due to share-based payments - 16 - - 16 - - - - 16 2 - - - 2 18
Changes due to transactions with shareholders 620 (1 097) 15 1 150 688 - - - - 688 (297) - - - (297) 391
Changes in other comprehensive income - - - - - (105) (69) (174) - (174) - (112) (2) (114) (114) (288)
Share of changes in equity-accounted entities - (32) - - (32) 41 (8) 33 - 1 - 2 - 2 2 3
Net income for 2016 - - - - - - - - 3 540 3 540 415 - - - 415 3 955
Other changes - 408 - - 408 - - - - 408 33 - - - 33 441
Equity at 31 December 2016 8 538 36 787 (132) 5 011 50 204 5 087 (555) 4 532 3 540 58 276 5 699 (13) (25) (38) 5 661 63 937
Appropriation of 2016 net income - 3 540 - - 3 540 - - - (3 540) - - - - - - -
Equity at 1 january 2017 8 538 40 327 (132) 5 011 53 744 5 087 (555) 4 532 - 58 276 5 699 (13) (25) (38) 5 661 63 937
Capital increase - - - - - - - - - - - - - - - -
Change in treasury shares held - - 1 - 1 - - - - 1 - - - - - 1
Issuance of equity instruments - - - (12) (12) - - - - (12) - - - - - (12)
Remuneration of deeply subordinated notes - (454) - - (454) - - - - (454) (12) - - - (12) (466)
Dividends paid in 2017 - (1 716) - - (1 716) - - - - (1 716) (298) - - - (298) (2 014)
Dividends received from Regional Banks and subsidiaries - - - - - - - - - - - - - - - -
Impact of acquisitions/disposals on non-controlling interests (1) - (54) - - (54) - - - - (54) 672 - - - 672 618
Changes due to share-based payments - 13 - - 13 - - - - 13 6 - - - 6 19
Changes due to transactions with shareholders - (2 211) 1 (12) (2 222) - - - - (2 222) 368 - - - 368 (1 854)
Changes in other comprehensive income - - - - - (1 178) (33) (1 211) - (1 211) - (51) - (51) (51) (1 262)
Share of changes in equity-accounted entities - (55) - - (55) (391) 23 (368) - (423) 4 (11) - (11) (7) (430)
Net income for 2017 - - - - - - - - 3 649 3 649 568 - - - 568 4 217
Other changes - (13) - - (13) - - - - (13) 111 - - - 111 98
EQUITY AT 31 DECEMBER 2017 8 538 38 048 (131) 4 999 51 454 3 518 (565) 2 953 3 649 58 056 6 750 (75) (25) (100) 6 650 64 706
Total
equity
Total
consolidated
equity
Non-controlling interestsGroup share
Share capital and reserves Other comprehensive income Other comprehensive income
Capital,
associated
reserves and
income
Total
equity
Net
income
Consolidated financial statements of Crédit Agricole S.A. – 31 December 2017
19
(1) As part of efforts to increase the Group’s regulatory capital, Crédit Agricole S.A. issued on 19 January 2016
Additional Tier 1 deeply subordinated undated bonds of $1,250 million. The balance of these issues
represents €1,142 million, net of issuance costs.
(2) The other changes at 31 December 2016 mainly concern the intra-Group transaction adjustment with
respect to the processing of insurance unit-linked investments. This adjustment has no significant effect on
the Group’s indicators and ratios.
(3) The acquisition of Pioneer Investments on 3 July 2017 was financed for €1,413 million from a capital
increase (see Note 2 “Major structural transactions and material events during the period”). The impact of this
transaction at 31 December 2017 was €98 million in Shareholder's equity Group share and €817 million in
equity - non-controlling interests.
(3) On 22 December 2017, Crédit Agricole S.A. Group completed the €380 million acquisition of the 15% stake
held by Natixis in CACEIS, its asset servicing subsidiary, which it now owns outright. The transaction reduced
Shareholder's equity Group share by €148 million and non-controlling interests by €232 million.
(3) Crédit Agricole Cariparma acquired 95% of the share capital of the Cesena, Rimini and San Miniato savings
banks on 21 December 2017. The acquisition was financed by a €320 million capital increase by Crédit
Agricole Cariparma, completed on 21 December 2017, and subscribed by Crédit Agricole S.A. in the amount
of €256 million. The impact of these transactions on equity - non-controlling interests was €87 million.
Consolidated financial statements of Crédit Agricole S.A. – 31 December 2017
20
>> CASH FLOW STATEMENT
The cash flow statement is presented using the indirect method. Operating activities show the impact of cash inflows and outflows arising from Crédit Agricole S.A. Group’s income-generating activities, including those associated with assets classified as held-to-maturity financial assets. Tax inflows and outflows are included in full within operating activities. Investment activities show the impact of cash inflows and outflows associated with purchases and sales of investments in consolidated and non-consolidated companies, property, plant and equipment and intangible assets. This section includes strategic equity investments classified as available-for-sale financial assets. Financing activities show the impact of cash inflows and outflows associated with operations of financial structure concerning equity and long-term borrowing. The net cash flows attributable to the operating, investment and financing activities of discontinued operations are presented on separate lines in the cash flow statement. Net cash and cash equivalents include cash, debit and credit balances with central banks and debit and credit demand balances with credit institutions.
Consolidated financial statements of Crédit Agricole S.A. – 31 December 2017
21
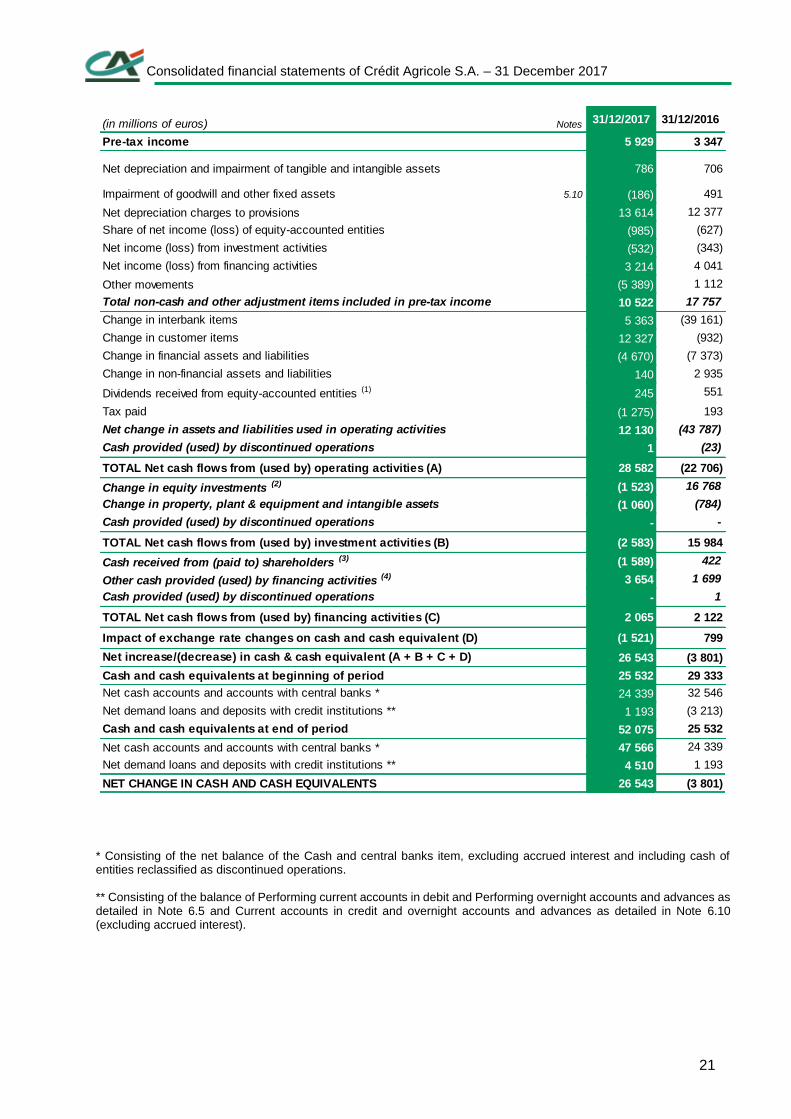
* Consisting of the net balance of the Cash and central banks item, excluding accrued interest and including cash of entities reclassified as discontinued operations. ** Consisting of the balance of Performing current accounts in debit and Performing overnight accounts and advances as detailed in Note 6.5 and Current accounts in credit and overnight accounts and advances as detailed in Note 6.10 (excluding accrued interest).
(in millions of euros) Notes 31/12/2017 31/12/2016
Pre-tax income 5 929 3 347
Net depreciation and impairment of tangible and intangible assets 786 706
Impairment of goodwill and other fixed assets 5.10 (186) 491
Net depreciation charges to provisions 13 614 12 377
Share of net income (loss) of equity-accounted entities (985) (627)
Net income (loss) from investment activities (532) (343)
Net income (loss) from financing activities 3 214 4 041
Other movements (5 389) 1 112
Total non-cash and other adjustment items included in pre-tax income 10 522 17 757
Change in interbank items 5 363 (39 161)
Change in customer items 12 327 (932)
Change in financial assets and liabilities (4 670) (7 373)
Change in non-financial assets and liabilities 140 2 935
Dividends received from equity-accounted entities (1) 245 551
Tax paid (1 275) 193
Net change in assets and liabilities used in operating activities 12 130 (43 787)
Cash provided (used) by discontinued operations 1 (23)
TOTAL Net cash flows from (used by) operating activities (A) 28 582 (22 706)
Change in equity investments (2) (1 523) 16 768
Change in property, plant & equipment and intangible assets (1 060) (784)
Cash provided (used) by discontinued operations - -
TOTAL Net cash flows from (used by) investment activities (B) (2 583) 15 984
Cash received from (paid to) shareholders (3) (1 589) 422
Other cash provided (used) by financing activities (4) 3 654 1 699
Cash provided (used) by discontinued operations - 1
TOTAL Net cash flows from (used by) financing activities (C) 2 065 2 122
Impact of exchange rate changes on cash and cash equivalent (D) (1 521) 799
Net increase/(decrease) in cash & cash equivalent (A + B + C + D) 26 543 (3 801)
Cash and cash equivalents at beginning of period 25 532 29 333
Net cash accounts and accounts with central banks * 24 339 32 546
Net demand loans and deposits with credit institutions ** 1 193 (3 213)
Cash and cash equivalents at end of period 52 075 25 532
Net cash accounts and accounts with central banks * 47 566 24 339
Net demand loans and deposits with credit institutions ** 4 510 1 193
NET CHANGE IN CASH AND CASH EQUIVALENTS 26 543 (3 801)
Consolidated financial statements of Crédit Agricole S.A. – 31 December 2017
22
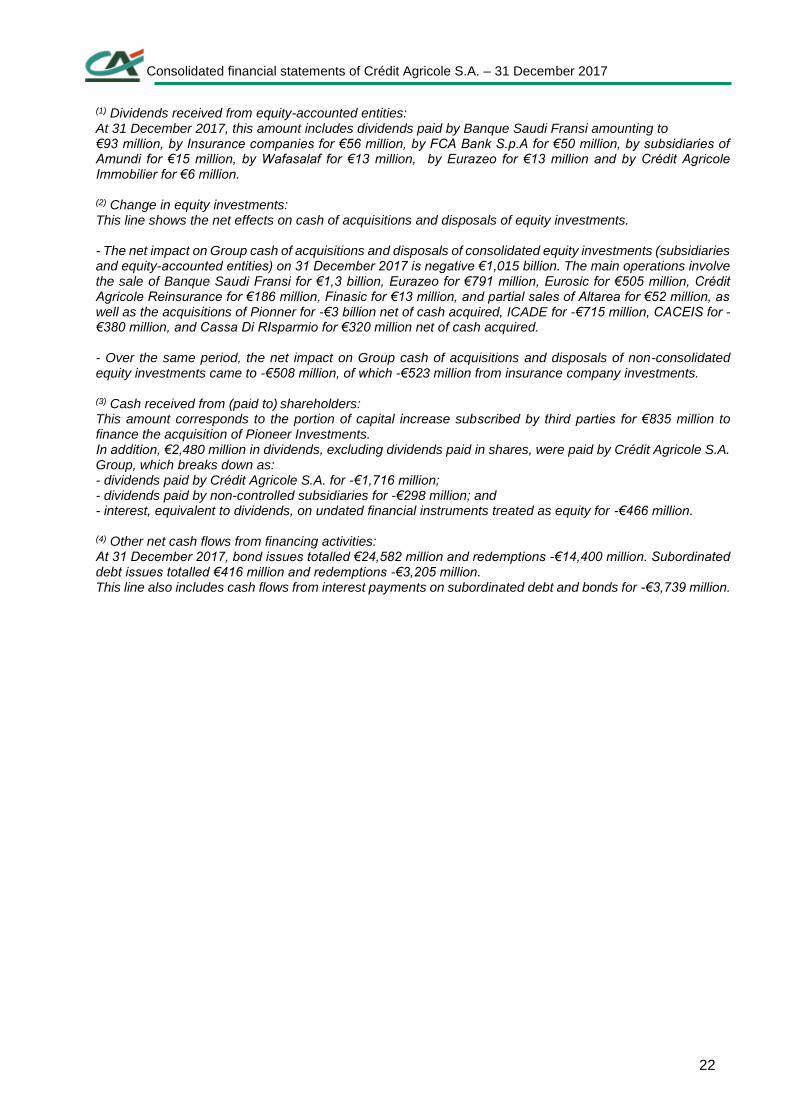
(1) Dividends received from equity-accounted entities: At 31 December 2017, this amount includes dividends paid by Banque Saudi Fransi amounting to €93 million, by Insurance companies for €56 million, by FCA Bank S.p.A for €50 million, by subsidiaries of Amundi for €15 million, by Wafasalaf for €13 million, by Eurazeo for €13 million and by Crédit Agricole Immobilier for €6 million. (2) Change in equity investments: This line shows the net effects on cash of acquisitions and disposals of equity investments. - The net impact on Group cash of acquisitions and disposals of consolidated equity investments (subsidiaries and equity-accounted entities) on 31 December 2017 is negative €1,015 billion. The main operations involve the sale of Banque Saudi Fransi for €1,3 billion, Eurazeo for €791 million, Eurosic for €505 million, Crédit Agricole Reinsurance for €186 million, Finasic for €13 million, and partial sales of Altarea for €52 million, as well as the acquisitions of Pionner for -€3 billion net of cash acquired, ICADE for -€715 million, CACEIS for -€380 million, and Cassa Di RIsparmio for €320 million net of cash acquired. - Over the same period, the net impact on Group cash of acquisitions and disposals of non-consolidated equity investments came to -€508 million, of which -€523 million from insurance company investments. (3) Cash received from (paid to) shareholders: This amount corresponds to the portion of capital increase subscribed by third parties for €835 million to finance the acquisition of Pioneer Investments. In addition, €2,480 million in dividends, excluding dividends paid in shares, were paid by Crédit Agricole S.A. Group, which breaks down as: - dividends paid by Crédit Agricole S.A. for -€1,716 million; - dividends paid by non-controlled subsidiaries for -€298 million; and - interest, equivalent to dividends, on undated financial instruments treated as equity for -€466 million. (4) Other net cash flows from financing activities: At 31 December 2017, bond issues totalled €24,582 million and redemptions -€14,400 million. Subordinated debt issues totalled €416 million and redemptions -€3,205 million. This line also includes cash flows from interest payments on subordinated debt and bonds for -€3,739 million.
Consolidated financial statements of Crédit Agricole S.A. – 31 December 2017
23
NOTES TO THE CONSOLIDATED FINANCIAL
STATEMENTS
1. Group accounting policies and principles, assessments and
estimates.
1.1 Applicable standards and comparability
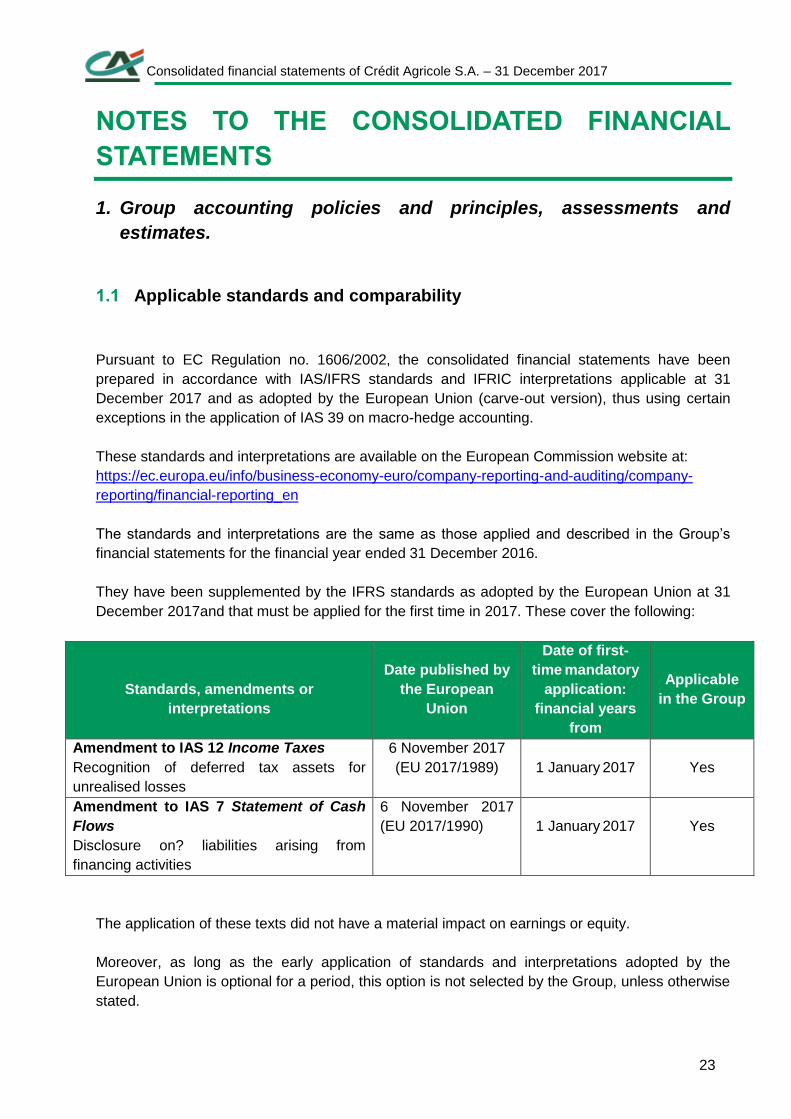
Pursuant to EC Regulation no. 1606/2002, the consolidated financial statements have been
prepared in accordance with IAS/IFRS standards and IFRIC interpretations applicable at 31
December 2017 and as adopted by the European Union (carve-out version), thus using certain
exceptions in the application of IAS 39 on macro-hedge accounting.
These standards and interpretations are available on the European Commission website at:
https://ec.europa.eu/info/business-economy-euro/company-reporting-and-auditing/company-
reporting/financial-reporting_en
The standards and interpretations are the same as those applied and described in the Group’s
financial statements for the financial year ended 31 December 2016.
They have been supplemented by the IFRS standards as adopted by the European Union at 31
December 2017and that must be applied for the first time in 2017. These cover the following:
Standards, amendments or
interpretations
Date published by
the European
Union
Date of first-
time mandatory
application:
financial years
from
Applicable
in the Group
Amendment to IAS 12 Income Taxes
Recognition of deferred tax assets for
unrealised losses
6 November 2017
(EU 2017/1989)
1 January 2017
Yes
Amendment to IAS 7 Statement of Cash
Flows
Disclosure on? liabilities arising from
financing activities
6 November 2017
(EU 2017/1990)
1 January 2017
Yes
The application of these texts did not have a material impact on earnings or equity.
Moreover, as long as the early application of standards and interpretations adopted by the
European Union is optional for a period, this option is not selected by the Group, unless otherwise
stated.
Consolidated financial statements of Crédit Agricole S.A. – 31 December 2017
24
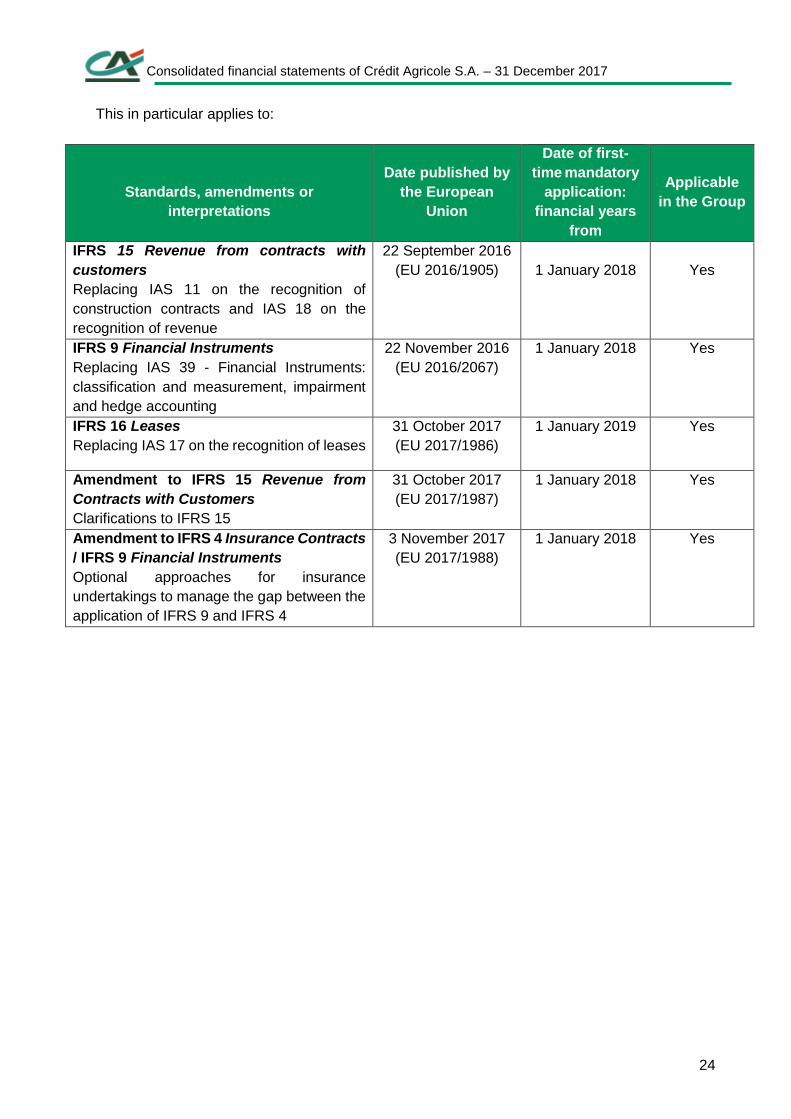
This in particular applies to:
Standards, amendments or
interpretations
Date published by
the European
Union
Date of first-
time mandatory
application:
financial years
from
Applicable
in the Group
IFRS 15 Revenue from contracts with
customers
Replacing IAS 11 on the recognition of
construction contracts and IAS 18 on the
recognition of revenue
22 September 2016
(EU 2016/1905)
1 January 2018
Yes
IFRS 9 Financial Instruments
Replacing IAS 39 - Financial Instruments:
classification and measurement, impairment
and hedge accounting
22 November 2016
(EU 2016/2067)
1 January 2018 Yes
IFRS 16 Leases
Replacing IAS 17 on the recognition of leases
31 October 2017
(EU 2017/1986)
1 January 2019 Yes
Amendment to IFRS 15 Revenue from
Contracts with Customers
Clarifications to IFRS 15
31 October 2017
(EU 2017/1987)
1 January 2018 Yes
Amendment to IFRS 4 Insurance Contracts
/ IFRS 9 Financial Instruments
Optional approaches for insurance
undertakings to manage the gap between the
application of IFRS 9 and IFRS 4
3 November 2017
(EU 2017/1988)
1 January 2018 Yes
Consolidated financial statements of Crédit Agricole S.A. – 31 December 2017
25
IFRS 15 Revenue from Contracts with Customers
IFRS 15 Revenue from contracts with customers will become effective for accounting years
opening from 1st January 2018 (in accordance with EU regulation 2016/1905). The "Clarification
to IFRS 15" amendment, which provides further details, comes into effect on the same date
(pursuant to EU Regulation 2017/1987).
For the first-time application of this standard, Crédit Agricole Group chose to apply the modified
retrospective method, recognising the cumulative effect as of 1 January 2018, with no
comparison for 2017, by detailing any impact that the standard could have on the various items
in the financial statements being detailed in the notes.
IFRS 15 will replace IAS 11 Construction contracts and IAS 18 Revenue, along with all the
related interpretations relating to IFRIC 13 Customer loyalty programs, IFRIC 15 Agreements for
the construction of real estate, IFRIC 18 Transfers of assets from customers and SIC 31
Revenue - barter transactions involving advertising services.
It brings into a single text the principles for recognising revenue for long-term sales contracts,
sales of goods and the provision of services that do not enter in the scope the scope of standards
related to financial instruments (IAS 39/IFRS 9), insurance contracts (IFRS 4/IFRS 17) or leases
(IAS 17/IFRS 16). It introduces new concepts that may affect the accounting treatment of certain
components of net banking income.
Based on the findings of the impact assessment carried out in the first half of 2016, the Group
considers that the adoption of IFRS 15 will have no material impact on opening equity at 1
January 2018.
IFRS 9 Financial Instruments
IFRS 9 Financial Instruments will replace IAS 39 Financial Instruments: Recognition and
Measurement. It was adopted by the European Union on 22 November 2016 and published in the
Official Journal of the European Union on 29 November 2016. It will be mandatory for accounting
years opening from the 1st January 2018. The "Prepayment features with negative compensation"
amendment, which provides guidance on the recognition of debt instruments with such features is
currently being adopted by the European Union and should come into effect on 1 January 2019 with
possible early application from 1 January 2018. Crédit Agricole S.A. Group plans to apply the
amendment early in line with the AMF's recommendations.
IFRS 9 sets new principles governing the classification and measurement of financial instruments,
impairment of credit risk and hedge accounting, excluding macro-hedging transactions.
Consolidated financial statements of Crédit Agricole S.A. – 31 December 2017
26
The main changes introduced by the standard
Classification and measurement of financial assets
Under IFRS 9, the classification and measurement criteria depend on the nature of the financial
asset, namely whether it qualifies as a debt instrument (i.e. loan, advance, credit, bond, fund unit)
or an equity instrument (i.e. share).
In the case of debt instruments (loans and fixed or determinable income securities), IFRS 9 tests
the business model on one side and contractual terms on other side to classify and measure
financial assets.
Three business models:
o the model of pure collect whose the intention is to collect the contractual cash flows over
the life of the asset;
o the mixed model where the intention is to collect the contractual cash flows over the life of
the asset and to dispose of the assets. Under this model, both the sale of the financial assets
and receipt of cash flows are essential; and
o the selling only model where the intention is to dispose of the asset.
The contractual terms (“Solely Payments of Principal & Interest” or “SPPI” test):
This second criterion is applied to the contractual terms of the loan or debt security to finally
determine the accounting classification and measurement category to which the instrument
belongs.
When the debt instrument has expected cash flows that are not solely payments of principal and
interest (i.e. simple rate), its contractual terms are deemed too complex and as a result, the loan or
debt security is recognised at fair value through profit or loss regardless of their business model.
This involves the instruments that do not satisfy the conditions of the “SPPI” test.
Contractual characteristics (or SPPI) testing combines a set of criteria, examined cumulatively, to
establish whether contractual cash flows meet the characteristics of simple financing (principal
repayments and interest payments on the remaining amount of principal due).
In simple financing, interest represents the cost of the passage of time, the price of credit and
liquidity risk over the period, and other components related to the cost of carrying the asset (e.g.
administrative costs).
In some cases, when qualitative analysis of this nature does not allow a conclusion to be made,
quantitative analysis (or benchmark testing) is carried out. This additional analysis consists of
comparing the contractual cash flows of the asset under review with the cash flows of a benchmark
asset.
If the difference between the cash flows of the financial asset and the benchmark asset is
considered immaterial, the asset is deemed to be simple financing.
Consolidated financial statements of Crédit Agricole S.A. – 31 December 2017
27
Moreover, specific analysis is conducted when the financial asset is issued by special purpose
entities establishing a differentiated order of payment among the holders of the financial assets by
contractually linking multiple instruments and creating concentrations of credit risk (“tranches”).
Each tranche is assigned a rank of subordination that specifies the order of distribution of cash
flows generated by the structured entity.
In this case, the SPPI test requires an analysis of the characteristics of the contractual cash flows
of the underlying assets and the credit risk borne by the tranches subscribed under the “look-
through” approach.
On the basis of the foregoing criteria:
o a debt instrument is recognised at amortised cost when it is held to collect cash flows that
are solely payments of principal and interest “SPPI” compliant;
o a debt instrument is recognised at fair value through other comprehensive income (items
that can be reclassified) in the case of a mixed model to collect cash flows and sell where
opportunities arise, provided its contractual terms also comprise solely payments of principal
and interest “SPPI” compliant;
o a debt instrument that does not qualify for the amortised cost or fair value through other
comprehensive income category (items that can be reclassified) is recognised at fair value
through profit or loss. The same applies to debt instruments where the business model is
selling only. This also includes non-consolidated UCITS units that are debt instruments that
fail to satisfy the “SPPI” test regardless of the business model.
In the case of equity instruments (investments such as shares), they must, by default, be recognised
at fair value through profit or loss, except in the case of an irrevocable election to classify them at
fair value through other comprehensive income not recyclable (items that cannot be reclassified). If
the option is selected, only dividends received on these instruments will be recognised in the income
statement.
In summary, the Group’s application of the classification and measurement criteria under IFRS 9
should lead to:
- an increase in assets at fair value through profit or loss, given the reclassification of UCITS
and the majority of equity instruments in this category, resulting in increased profit or loss
volatility;
- the classification at amortised cost of the vast majority of loans and receivables, provided
they pass the SPPI (Solely Payments of Principal and Interest) test;
- the classification of debt instruments at fair value through other comprehensive income
(items that can be reclassified) or at amortised cost, depending on the documented business
model at the date of initial application.
Consolidated financial statements of Crédit Agricole S.A. – 31 December 2017
28
Impairment
IFRS 9 introduces a new impairment model that requires the recognition of Expected Credit Losses
(ECL) on credit and debt instruments measured at amortised cost or at fair value through other
comprehensive income (items that can be reclassified), on loan commitments and financial
guarantee contracts that are not recognised at fair value, as well as on lease receivables and trade
receivables.
This new ECL approach is designed to anticipate as much as possible the recognition of expected
credit losses, whereas under the IAS 39 provisioning model, it is subject to there being objective
evidence that an impairment loss has been incurred.
ECL is defined as the weighted expected probable value of the discounted credit loss (principal and
interest). It represents the present value of the difference between the contractual cash flows and
the expected cash flows (including principal and interest).
The formula includes the probability of default, loss given default and exposure at default
parameters.
These calculations are broadly based on the internal models used as part of the regulatory
framework when existent, but with adjustments to determine an economic ECL. IFRS 9
recommends a Point in Time analysis while having regard to historical loss data and forward looking
macro-economic data, whereas the prudential regulation analyses the perspectives Through The
Cycle for probability of default and in a downturn for Loss Given Default.
The accounting approach also requires the recalculation of certain Basel parameters, in particular
to eliminate internal recovery costs or floors that are imposed by the regulator in the regulatory
calculation of Loss Given Default (LGD).
The new credit risk provisioning model has three stages:
o first stage: upon initial recognition of the financial instrument (credit, debt security,
guarantee, etc.), the entity recognises the twelve-month expected credit losses;
o second stage: if the credit quality subsequently significantly deteriorates for a particular
portfolio or transaction, the entity recognises the full lifetime expected credit losses;
o third stage: at a later date, once one or more default events have occurred on the transaction
or on a counterparty having an adverse effect on the estimated future cash flows, the entity
recognises incurred credit losses at maturity.
At the second stage, the monitoring and estimation of the significant deterioration in credit risk can
be done on a transaction-by-transaction basis or collectively at portfolio level by grouping financial
instruments on the basis of similar credit risk characteristics. The approach calls on a wide range
of information, including historical data on observed losses, cyclical and structural adjustments, and
loss projections based on reasonable scenarios.
This deterioration depends on the risk level on the date of initial recognition and must be recognised
before the transaction is impaired (third stage).
Consolidated financial statements of Crédit Agricole S.A. – 31 December 2017
29
In order to assess the significant deterioration, the Group employs a process built around two levels
of analysis:
o the first level is based on absolute and relative criteria and rules applying to all Group
entities;
o the second level is linked to local assessment of the qualitative criteria of the risk held by
each entity in its portfolios that may result in a tightening of the deterioration criteria defined
in the first level (switching a portfolio or sub-portfolio to ECL stage 2 at maturity).
There is a rebuttable presumption of a significant deterioration in the event of a non-payment for
over thirty days. The Group may rebut this presumption on the scope of outstanding amounts for
which internal rating systems have been put in place, in particular exposures using the advanced
approach, given that all the information incorporated into the rating systems allow for a more
detailed assessment than just the non-payment for over thirty days criterion.
In the absence of the internal rating model, the Group will use the absolute threshold of non-
payments for over thirty days as the maximum threshold for significant deterioration and
classification in stage 2.
With respect to the scope of instruments subject to stage 3 provisioning, the Group will bring the
definition of default into line with the one currently used in management for prudential regulation
purposes.
A debtor is, therefore, considered to be in default when at least one of the following conditions has
been met:
o a payment generally more than ninety days past due, unless specific circumstances point
to the fact that the delay is due to reasons independent of the debtor’s financial situation;
o the entity believes that the debtor is unlikely to settle its credit obligations unless it avails
itself of certain measures such as enforcement of collateral security right.
In short, the new provisioning model in IFRS 9 may lead to an increase in the amount of impairment
on loans and securities recognised on the balance sheet at amortised cost or at fair value through
other comprehensive income (items that can be reclassified), and on off-balance sheet
commitments as well as lease receivables and trade receivables.
The change between impairment losses under IAS 39 and impairment losses under IFRS 9 will be
recognised in non-recyclable equity.
Hedge accounting
With respect to hedge accounting (excluding fair value macro-hedging transactions), IFRS 9 makes
limited changes from IAS 39. The standard’s requirements apply to the following scope:
o all micro-hedging transactions; and
o only cash flow macro-hedging transactions.
Consolidated financial statements of Crédit Agricole S.A. – 31 December 2017
30
Fair value macro-hedging transactions for interest rate risk are excluded and may remain subject
to IAS 39 (option).
Upon first time application of IFRS 9, there are two possibilities under the standard:
o apply the “hedge accounting” requirements of IFRS 9; or
o continue to apply IAS 39 until application of IFRS 9 for all hedging relationships (at the latest
when the fair value macro-hedging for interest rate risk text is adopted by the European
Union).
After having carried out a feasibility study in the first half of 2015, the Group decided not to apply
this aspect of the standard.
Nevertheless, information must be provided in the notes to the financial statements with increased
granularity on risk management and the effects of hedge accounting on the financial statements.
Others requirements relating to first-time application
IFRS 9 allows the early adoption of requirements relating to specific credit risk relating to financial
liabilities designated as at fair value through profit or loss, namely the recognition of changes in
value attributable to specific credit risk in other comprehensive income (items that cannot be
reclassified). The Group will not apply these requirements early. Moreover, the IASB specified the
accounting treatment for a non-substantial amendment to the contractual terms and conditions of a
debt not resulting in its derecognition. The impact of the amendment is henceforth immediately
recognised in profit and loss with keeping of the original effective interest rate.
In addition, the IASB published an amendment to IFRS 4 Insurance contracts to give companies
whose business activity is the issue of insurance contracts two possible approaches to limit the
effects of the gap between the application of IFRS 9 and the future standard on the measurement
of insurance liabilities (IFRS 17). The Group will apply IFRS 9 to its insurance activities using the
overlay approach. Under this approach, the entity will reclassify in other comprehensive income the
difference between the amount recognised in profit and loss under IFRS 9 and the amount that
should have been recognised in profit and loss under IAS 39 for designated financial assets.
Project roll-out within Crédit Agricole Group
In 2015, the Group began taking steps to implement IFRS 9 within the required timeframe, bringing
together the accounting, finance, risk and IT functions along with all entities.
Project milestones and achievements to date
In the first half of 2015, work focused on:
o examining the standard's requirements, with particular attention on the changes resulting
from the new classification and measurement criteria for financial assets and the overhaul
Consolidated financial statements of Crédit Agricole S.A. – 31 December 2017
31
of the credit risk impairment model, which switches from provisioning for incurred credit
losses to expected credit losses (ECL);
o the identification of the key questions and of the main areas of accounting interpretation on
the basis of the initial high-level assessment of the impact of the standard.
Following this review and assessment phase, the Group launched the project implementation phase
in September 2015 by setting out the detailed timelines and road maps of the various areas of work,
which were then applied at their level by all Group entities.
In 2016, the main achievements were:
o the standardisation work with identification of the main areas of impact on the financial
statements and the definition of the target provisioning through the drafting of a
methodological framework shared with the entities;
o methodological work to define the possible options regarding the provision calculation
formula, significant deterioration and forward looking, as well as the methodology for
calculating the fair value of credit;
o provisional simulations of the impact of the new standard on the financial statements and
regulatory capital, in particular to better address the requirements of the European Banking
Authority. This work was done in the largest Group entities, on the basis of accounting data
at 31 December 2015;
o IT-related work on the major areas of impact on the IT systems, involving the specifications
of the Risk and Finance tools and choice of shared tools, namely: a central provisioning tool
and, for listed debt securities, a tool to analyse the contractual terms, making it possible to
automate the “SPPI” test.
All this implementation work continued in 2017. It incorporated the impact assessment on the basis
of the financial statements at 31 December 2016, first and foremost to satisfy the requirements of
the European Banking Authority (EBA).
In particular, the Group set out the cross-functional governance applicable to the future provisioning
mechanism. This governance will be based on the mechanism put in place to meet the CRR/CRD
regulatory prudential requirements. The Group Risk Management Department is responsible for
defining the Group's organisational and methodological framework and for disseminating it
throughout the entities.
Transition
IFRS 9 is applied retrospective with a mandatory effective date of 1 January 2018 by adjusting the
opening balance sheet on the date of first-time application, with no restatement of the 2017
comparative financial statements. As a result, the Group does not plan to restate the financial
statements presented for comparative purposes with the 2018 financial statements.
IFRS 16 Leases
IFRS 16 Leases will supersede IAS 17 and all related interpretations (IFRIC 4 Determining whether
an arrangement contains alLease.
Consolidated financial statements of Crédit Agricole S.A. – 31 December 2017
32
SIC 15 Operating leases - Incentives and SIC 27 Evaluating the substance of transactions in the
legal form of a lease). It will apply to reporting periods beginning 1 January 2019.
The main change made by IFRS 16 relates to accounting for lessees. IFRS 16 will call for a model
in respect of lessees that recognises all leases on the balance sheet, with a lease liability on the
liability side representing commitments over the life of the lease and on the asset side, an
amortisable right-to-use.
An impact study on the implementation of the standard in the Crédit Agricole Group was undertaken
in the second quarter of 2017. At this stage of the project, the Group remains wholly focussed on
defining the key options relating to the interpretation of the standard.
The standards and interpretations published by the IASB at 31 December 2017 but not yet adopted
by the European Union are not applied by the Group. They will become mandatory only as from the
date planned by the European Union and have not been applied by the Group at 31 December
2017.
This concerns IFRS 17 in particular.
IFRS 17 (Insurance contracts) will replace IFRS 4. It will apply to reporting periods beginning 1
January 2021 subject to adoption by the European Union. It sets out the new measurement and
recognition principles for insurance contract liabilities and evaluation of their profitability, in addition
to their presentation. In 2017, scoping work began on the implementation project in order to identify
the challenges and impacts of the standard on the Group's insurance subsidiaries. This work will
continue until the standard comes into effect.
In addition, a number of amendments and two interpretations to existing standards were published
by the IASB, which do not significantly impact the Group, which apply subject to their adoption by
the European Union. This firstly includes the amendment to IFRS 12 Disclosure of Interests in Other
Entities applicable from 1 January 2017, amendments to IFRS 2 Classification and Measurement
of Share-based Payment Transactions, to IAS 28 Investments in Associates and Joint Ventures
and to IAS 40 Investment property applicable from 1 January 2018, and a second amendment to
IAS 28 Investments in Associates and Joint Ventures applicable from 1 January 2019. Secondly, it
includes IFRIC 22 Foreign Currency Transactions and Advance Consideration applicable from 1
January 2018 and IFRIC 23 Uncertainty over Income Tax Treatments applicable from 1 January
2019.
1.2 Presentation of financial statements
In the absence of a required presentation format under IFRS, Crédit Agricole S.A. Group’s complete
set of financial statements (balance sheet, income statement, statement of comprehensive income,
statement of changes in equity and cash flow statement) has been presented in the format set out
in ANC Recommendation 2013-04 of 7 November 2013.
Consolidated financial statements of Crédit Agricole S.A. – 31 December 2017
33
1.3 Accounting policies and principles
USE OF ASSESSMENTS AND ESTIMATES TO PREPARE THE FINANCIAL STATEMENTS
Estimates made to draw up the financial statements are by nature based on certain assumptions
and involve risks and uncertainties as to whether they will be achieved in the future.
Future results may be influenced by many factors, including:
activity in domestic and international financial markets;
fluctuations in interest and foreign exchange rates;
the economic and political climate in certain industries or countries;
changes in regulations or legislation.
This list is not exhaustive.
Accounting estimates based on assumptions are principally used in the following assessments:
financial instruments measured at fair value;
investments in non-consolidated companies;
pension schemes and other post-employment benefits;
stock option plans;
long-term impairment of available-for-sale financial assets and held-to-maturity financial assets;
impairment of loans;
provisions;
impairment of goodwill;
deferred tax assets;
valuation of equity-accounted entities;
policyholders' deferred profit sharing.
The procedures for the use of assessments or estimates are described in the relevant sections
below.
Consolidated financial statements of Crédit Agricole S.A. – 31 December 2017
34
FINANCIAL INSTRUMENTS (IAS 32 AND 39)
Financial assets and liabilities are treated in the financial statements in accordance with IAS 39 as
endorsed by the European Commission.
At the time of initial recognition, financial assets and liabilities are measured at fair value including
transaction costs (with the exception of financial instruments recognised at fair value through profit
or loss). Subsequently, financial assets and liabilities are measured according to their classification,
either at fair value or at amortised cost based on the effective interest rate method.
IFRS 13 defines fair value as the price that would be received to sell an asset or paid to transfer a
liability in an ordinary transaction between market participants, on the principal or the most
advantageous market, at the measurement date.
The effective interest rate is the rate that exactly discounts estimated future cash payments or
receipts through the expected life of the financial instrument or, when appropriate, a shorter period,
to obtain the net carrying amount of the financial asset or financial liability.
Securities
Classification of financial assets
Under IAS 39, securities are divided into four categories:
financial assets at fair value through profit or loss classified as held for trading or designated at
fair value through profit or loss;
held-to-maturity financial assets;
loans and receivables;
available-for-sale financial assets.
o Financial assets at fair value through profit or loss classified as held for
trading or designated at fair value through profit or loss
According to IAS 39, this portfolio comprises securities that are classified under financial assets at
fair value through profit or loss either as a result of a genuine intention to trade them (financial
assets held for trading) or of being designated at fair value by Crédit Agricole S.A. Group.
Financial assets at fair value through profit or loss are assets acquired or generated by the
enterprise primarily with the aim of disposal in the short term or which are included in a portfolio of
financial instruments managed as a unit and with the purpose of making a profit from short term
price fluctuations or an arbitrage margin.
Financial assets, provided they meet the conditions specified in the standard, can be designated
as at fair value through profit or loss in the following three cases: for hybrid instruments comprising
one or more embedded derivatives, where the fair value option would reduce an accounting
Consolidated financial statements of Crédit Agricole S.A. – 31 December 2017
35
mismatch or for a group of financial assets under management whose performance is measured at
fair value. This method is generally used so that derivatives embedded in hybrid instruments do not
have to be recognised and measured separately.
To this end, Crédit Agricole S.A. Group has designated the following assets at fair value through
profit or loss:
assets backing unit-linked contracts;
private equity portfolio.
Securities that are classified under financial assets at fair value through profit or loss are recognised
at fair value at inception, excluding transaction costs attributable directly to their acquisition (which
are taken directly to profit or loss).
They are subsequently carried at fair value and changes in fair value are taken to profit or loss.
No impairment losses are booked for this category of securities.
Outstanding syndication securities held for sale are recognised as financial assets at fair value
through profit or loss and are marked to market.
o Held-to-maturity financial assets
The category Held-to-maturity financial assets (applicable to securities with fixed maturities)
includes securities with fixed or determinable payments that Crédit Agricole S.A. Group has the
intention and ability to hold until maturity, other than:
securities that are initially designated as financial assets at fair value through profit or loss at the
time of initial recognition by Crédit Agricole S.A. Group;
securities that fall into the “Loans and receivables” category. Hence, debt securities that are not
traded in an active market cannot be included in the “Held-to-maturity financial assets” category.
Classification as held-to-maturity means that the entity must abide by the prohibition on the sale of
securities prior to maturity, except where allowed under IAS 39.
Hedging of interest rate risk for this category of securities is not allowed for hedge accounting under
IAS 39.
Held-to-maturity financial assets are initially recognised at acquisition price, including transaction
costs that are directly attributable to the acquisition and including accrued interest.
They are subsequently measured at amortised cost with amortisation of any premium or discount
and transaction costs using the corrected effective interest rate method.
Consolidated financial statements of Crédit Agricole S.A. – 31 December 2017
36
Impairment rules for this financial asset category are disclosed in the section on “Impairment of
securities” for securities measured at amortised cost.
o Loans and receivables
Loans and receivables comprise unlisted financial assets that generate fixed or determinable
payments.
Securities within the Loans and receivables portfolio are initially recognised at acquisition cost,
including transaction costs that are directly attributable to the acquisition and including accrued
interest.
They are subsequently measured at amortised cost with amortisation of any premium or discount
and transaction costs using the corrected effective interest rate method.
Impairment rules for this financial asset category are disclosed in the section on “Impairment of
securities” for securities measured at amortised cost.
o Available-for-sale financial assets
IAS 39 defines available-for-sale financial assets as default category or as assets that are
designated as available-for-sale .
Available-for-sale financial assets are initially recognised at fair value, including transaction costs
that are directly attributable to the acquisition and including accrued interest.
Available-for-sale financial assets are later measured at fair value and subsequent changes in fair
value are recorded in other comprehensive income.
If the securities are sold, these changes are transferred to the income statement.
Amortisation of any premiums or discounts and transaction costs on fixed-income securities is
recognised in the income statement using the effective interest rate method.
Impairment rules for this financial asset category are disclosed in the section on “Impairment of
securities”.
Impairment of securities
Impairment shall be booked when there is objective evidence of impairment as a result of one or
more events that occurred after the initial recognition of the securities, other than assets measured
as at fair value through profit or loss.
Consolidated financial statements of Crédit Agricole S.A. – 31 December 2017
37
Objective evidence of loss corresponds to a prolonged or significant decline in the value of the
security for equity securities or the appearance of significant deterioration in credit risk evidenced
by a risk of non-recovery for debt securities.
For equity securities, Crédit Agricole S.A. Group uses quantitative criteria as indicators of potential
impairment. These quantitative criteria are mainly based on a loss of 30% or more of the value of
the equity instrument over a period of six consecutive months. Crédit Agricole S.A. Group may also
take account of other factors such as financial difficulties of the issuer, or short term prospects, etc.
Notwithstanding the above-mentioned criteria, Crédit Agricole S.A. Group recognises an
impairment loss when there is a decline in the value of the equity instrument higher than 50% or
prolonged over three years.
For debt securities, impairment criteria are the same as for loans and receivables.
Such impairment is only recognised when it translates into a probable loss of all or part of the
amount invested:
for securities measured at amortised cost through the use of an impairment account, the amount
of the loss is recognised in the income statement, and may be reversed in case of subsequent
improvements;
for available-for-sale securities, the amount of the aggregate loss is transferred from other
comprehensive income to the income statement; in the event of subsequent recovery in the price
of the securities, the loss previously transferred to the income statement may be reversed when
justified by circumstances for debt instruments.
Recognition date of securities
Crédit Agricole S.A. recognises on the settlement date securities classified as Assets held for
trading, Held-to-maturity financial assets, and Loans and receivables. Other securities, regardless
of type or classification, are recognised on the trading date.
Reclassification of financial assets
IAS 39 allows Available-for-sale financial assets to be reclassified as Held-to-maturity financial
assets where there is a change in management intention and if the criteria for reclassification as
Held-to-maturity are respected.
In accordance with the amendment to IAS 39 as published and adopted by the European Union in
October 2008, the following reclassifications are also allowed:
from the Financial assets held for trading and Available-for-sale financial assets categories to
the Loans and receivables category, if the entity now has the intention and ability to hold the
financial asset for the foreseeable future or until maturity and if the eligibility criteria for this
category are met upon the transfer date (in particular, financial asset not listed in an active
market);
Consolidated financial statements of Crédit Agricole S.A. – 31 December 2017
38
in rare documented circumstances, from Financial assets held for trading to Available-for-sale
financial assets or Held-to-maturity financial assets if the eligibility criteria are met upon the
transfer date for each category.
The fair value on the date of reclassification becomes the new cost or amortised cost, as applicable,
of the reclassified financial asset.
Information on reclassifications made by Crédit Agricole S.A. Group under the terms of the
amendment to IAS 39 is provided in Note 9 “Reclassification of financial instruments”.
Temporary investments in/disposals of securities
Within the meaning of IAS 39, temporary sales of securities (securities lending/borrowing,
repurchase agreements) do not generally fulfil the derecognition conditions of IAS 39 and are
regarded as collateralised financing.
Securities lent or sold under repurchase agreements remain on the balance sheet. If applicable,
the amounts received, representing the liability to the transferee, are recognised on the liability side
of balance sheet by the transferor.
Items borrowed or bought under repurchase agreements are not recognised on the balance sheet
of the transferee. A receivable is recognised for the amount paid. If the security is subsequently
resold, the transferee records a liability equivalent to the fair value of fulfilling their obligation to
return the security received under the agreement.
Revenue and expenses relating to such transactions are posted to profit and loss on a prorata
temporis basis, except in the case of assets and liabilities recognised at fair value through profit or
loss.
Lending operations
Loans are principally allocated to the Loans and receivables category. In accordance with IAS 39,
they are initially valued at fair value and subsequently valued at amortised cost using the effective
interest rate method. The effective interest rate is the rate that exactly discounts estimated future
cash payments to the original net loan amount. This rate includes the discounts and any transaction
income or costs that are an integral part of the effective interest rate.
Syndication loans held with the aim of disposal in the short term are classified as financial assets
held for trading and are marked to market.
Subordinated loans and repurchase agreements (represented by certificates or securities) are
included under the various categories of loans and receivables according to counterparty type.
Income calculated based on the effective interest rate is recognised in the balance sheet under
accrued interests and in the income statement.
Consolidated financial statements of Crédit Agricole S.A. – 31 December 2017
39
Advances made by Crédit Agricole S.A. to the Regional Banks do not represent a direct risk for
Crédit Agricole S.A. with respect to the corresponding customer loans made by the Regional Banks.
They do, however, represent a potential indirect risk with respect to the financial strength of the
Regional Banks. Crédit Agricole S.A. has not made any provisions for such advances to the
Regional Banks.
Impairment of loans
In accordance with IAS 39, loans classified under Loans and receivables are impaired whenever
there is objective indication of impairment as a result of one or more loss events occurring after the
initial recognition of these loans, such as:
borrower in serious financial difficulties;
a breach of contract such as a default on the payment of interest or principal;
the granting by the lender to the borrower, for economic or legal reasons connected with the
borrower’s financial difficulties, of a facility that the lender would not have envisaged under
other circumstances (loan restructuring);
increasing probability of bankruptcy or other financial restructuring of the borrower.
Impairment may be individual or collective, or in the form of discounts on loans that have been
restructured due to customer default.
Impairment charges and reversals of impairment losses for non-recovery risk are recognised in cost
of risk and any increase in the carrying amount of the loan arising from the accretion of the
impairment or amortisation of the restructured loan discount is recognised in interest margin.
Impairment losses are discounted and estimated on the basis of several factors, notably business-
or sector-related. It is possible that future assessments of the credit risk may differ significantly from
current estimates, which may lead to an increase or decrease in the amount of the impairment.
Probable losses in respect off-balance sheet commitments are covered by provisions recognised as
liabilities.
o Loans individually assessed for impairment
Each loan is first individually assessed for known risk of loss. Projected losses are thus measured
by means of individual impairment losses for all types of loans, including collateralised, where there
is objective indication of impairment. The amount of impairment losses is the difference between the
carrying amount of loans (at amortised cost) and the sum of estimated future flows, discounted at
the original effective interest rate.
Possible losses in respect of portfolios of small loans with similar characteristics may be estimated
on a statistical basis rather than individually assessed.
Consolidated financial statements of Crédit Agricole S.A. – 31 December 2017
40
o Loans collectively assessed for impairment
Statistical and historical customer default experience shows that there is an identified risk of partial
uncollectibility of loans not individually impaired. To cover this risk, which cannot by nature be
allocated to individual loans, Crédit Agricole S.A. Group takes various collective impairment
charges, calculated using models developed on the basis of these statistical data, by way of
deduction from asset values. These are determined for each homogenous class of loans displaying
similar credit risk characteristics.
Calculation of impairment losses using Basel models:
Under Basel regulations, each Crédit Agricole S.A. Group’s entity calculates the amount of losses
anticipated within one year, using statistical tools and databases, based on a variety of observation
criteria that meet the definition of a “loss event” within the meaning of IAS 39.
The amount of impairment is based on the probability of default in each rating class assigned to
borrowers, and also on management’s experienced judgement.
The amount of this impairment is obtained by applying to the amount of anticipated losses
calculated using the Basel models a maturity correction factor designed to take account of the need
to record impairment charges for the anticipated losses up to maturity.
Other loans collectively assessed for impairment:
Crédit Agricole S.A. Group also sets aside collective impairment charges to cover customer risks
that are not allocated to individual loans, such as sector or country at risk impairment losses. These
provisions are intended to cover estimated risks based on a sector or geographical analysis for
which there is statistical or historical risk of partial non-recovery.
Loan restructuring
Loans restructured due to financial difficulties are loans for which the entity changed the initial
financial terms (interest rate, term) for economic or legal reasons connected with the borrower’s
financial difficulties, in a manner that would not have been considered under other circumstances.
They therefore consist of loans that are classified as in default and, since 1 January 2014,
performing loans at the date they are restructured.
The reduction of future flows granted to a counterparty, which may notably stem from these flows
being postponed as part of the restructuring, results in the recognition of a discount. It represents
future loss of cash flow discounted at the original effective interest rate.
It is equal to the difference between: - the carrying amount of the loan;
- and the sum of theoretical future cash flows from the restructured loan, discounted at the
original effective interest rate (defined at the date of the financing commitment).
Consolidated financial statements of Crédit Agricole S.A. – 31 December 2017
41
The loss recognised when a loan is restructured is recorded under cost of risk. Its amortisation then
affects the interest margin.
Restructured loans are monitored based on ratings in accordance with Basel rules and are impaired
on the basis of the estimated credit risk. They are individually impaired within 30 days of a missed
payment.
Restructured loans remain in this category for two years (three years if they were in default when
restructured).
Watch list loans
Watch list loans consist of loans for which payment arrears have been recorded but for which no
individual impairment has been set aside.
Commercial renegotiations
Renegotiated loans for commercial reasons without financial difficulties of the counterpart with the
aim of developing or keeping a commercial relation are derecognised at the date of the
renegotiation. The new loans accorded to customers are initially recognised at the same date at fair
value and subsequently at the same date at amortised cost using the effective interest rate method
according to the conditions of the new contract.
Subsidised loans (IAS 20)
Under French Government measures to support the agricultural and rural sector and to help home
buyers, certain Crédit Agricole S.A. Group entities grant subsidised loans at rates fixed by the
Government. Consequently, the Government pays these entities the difference between the
subsidised lending rate and a predetermined benchmark rate. Accordingly, no discounts are
recognised against subsidised loans.
The subsidy system is periodically reviewed by the Government.
In accordance with IAS 20, subsidies received from the Government are recorded under Interest
and similar income and spread over the life of the corresponding loans.
Consolidated financial statements of Crédit Agricole S.A. – 31 December 2017
42
Financial liabilities
IAS 39 as endorsed by the European Union recognises three categories of financial liabilities:
financial liabilities at fair value through profit or loss. Fair value changes on this portfolio are
recognised in profit or loss at accounting end-periods;
financial liabilities designated at fair value through profit or loss. Financial liabilities, provided
they meet the conditions specified in the standard, can be designated as at fair value through
profit or loss in the following three cases: for hybrid instruments comprising one or more
embedded derivatives, where the fair value option would reduce an accounting mismatch or for
a group of financial liabilities under management whose performance is measured at fair value.
This method is generally used so that derivatives embedded in hybrid instruments do not have
to be recognised and measured separately;
other financial liabilities: this includes other financial liabilities. These liabilities are initially
measured at fair value (including transaction income and costs) and subsequently at amortised
cost using the effective interest rate method.
The valuation of Group issues recorded at fair value includes the change in own credit risk of the
Group.
Securities classified as financial liabilities or equity
o Distinction between debt instruments and equity
Securities are classed as debt instruments or equity instruments based on the economic substance
of the contractual terms.
A debt instrument is a contractual obligation to:
deliver cash or another financial asset; or
exchange instruments under potentially unfavourable conditions.
An equity instrument is a contract that offers a discretionary return, represents a residual interest in
a company’s net assets after deducting all liabilities and is not qualified as a debt instrument.
o Treasury shares buy-back
Treasury shares (or equivalent derivative instruments, such as stock options) bought back by Crédit
Agricole S.A. Group, including shares held to cover stock option plans, do not meet the definition
of a financial asset and are deducted from equity. They do not generate any impact on the income
statement.
Consolidated financial statements of Crédit Agricole S.A. – 31 December 2017
43
Deposits and savings accounts
All deposits and savings accounts are recorded under the category “Due to customers” in spite of
the characteristics of the collection system within Crédit Agricole Group, with deposits originating
from the Regional Banks centralised at Crédit Agricole S.A. For the Group, the ultimate counterparty
for these deposits is the end customer.
The deposits and savings are initially measured at fair value and subsequently at amortised cost.
Regulated savings products are by nature deemed to be at market rates.
Provisions are taken where necessary against home purchase savings plans and accounts as set
out in Note 6.20 “Provisions”.
Derivative instruments
Derivative instruments are financial assets or liabilities and are recognised on the balance sheet at
fair value at inception of the transaction. At the end of each reporting period, derivatives are
measured at fair value, whether they are held for trading purposes or used for hedging.
Any change in the value of derivatives on the balance sheet is recorded in the income statement
(except in the special case of a cash flow hedging relationship).
Hedge accounting
Fair value hedges are intended to provide protection from exposure to a change in the fair value of
an asset or of a liability that has been recognised, or of a firm commitment that has not been
recognised.
Cash flow hedges are intended to provide protection from a change in future cash flows from
financial instruments associated with a recognised asset or liability (for example, with all or part of
future interest payments on a floating-rate debt) or a projected transaction that is considered to be
highly probable.
Hedges of net investments in a foreign operation are intended to provide protection from the risk of
an adverse movement in fair value arising from the foreign exchange risks associated with a foreign
investment in a currency other than the euro.
Hedges must meet the following criteria in order to be eligible for hedge accounting:
the hedging instrument and the instrument hedged must be eligible;
there must be formal documentation from inception, primarily including the individual
identification and characteristics of the hedged item, the hedging instrument, the nature of the
hedging relationship and the nature of the hedged risk;
Consolidated financial statements of Crédit Agricole S.A. – 31 December 2017
44
the effectiveness of the hedge must be demonstrated, at inception and retrospectively, by testing
at each reporting date.
For interest rate hedges for a portfolio of financial assets or financial liabilities, Crédit Agricole S.A.
Group documents the hedging relationship for fair value hedges in accordance with the carve-out
version of IAS 39 as endorsed by the European Union.
The Group also documents these hedging relationships based on its gross position in derivative
instruments and hedged items.
The effectiveness of the hedging relationships is measured by maturity schedules.
The change in value of the derivative is recorded in the financial statements as follows:
fair value hedges: the change in value of the derivative is recognised in the income statement
symmetrically with the change in value of the hedged item in the amount of the hedged risk. Only
the net amount of any ineffective portion of the hedge is recognised in the income statement;
cash flow hedges: the change in value of the derivative is recognised in the balance sheet
through a specific account in other comprehensive income for the effective portion and any
eventual ineffective portion of the hedge is recognised in the income statement. Profits or losses
on the derivative accrued through other comprehensive income are reclassified in the income
statement when the hedged cash flows occur;
hedges of net investment in a foreign operation: the change in value of the derivative is
recognised in the balance sheet in the translation adjustment equity account and any ineffective
portion of the hedge is recognised in the income statement.
Where the conditions for benefiting from hedge accounting are no longer met, the following
accounting treatment must be applied prospectively:
fair value hedges: only the hedging instrument continues to be revalued through profit or loss.
The hedged item is wholly accounted for according to its classification. For available-for-sale
securities, changes in fair value subsequent to the ending of the hedging relationship are
recorded in other comprehensive income. For hedged items valued at amortised cost, which
were interest rate hedged, the revaluation adjustment is amortised over the remaining life of
those hedged items;
cash flow hedges: the hedging instrument is valued at fair value through profit or loss. The
amounts accumulated in other comprehensive income under the effective portion of the hedging
remain in other comprehensive income until the hedged element affects profit or loss. For interest
rate hedged instruments, income statement is affected according to the payment of interest. The
revaluation adjustment is therefore amortised over the remaining life of those hedged items;
hedges of net investment in a foreign operation: the amounts accumulated in other
comprehensive income under the effective portion of the hedging remain in other comprehensive
Consolidated financial statements of Crédit Agricole S.A. – 31 December 2017
45
income as long as the net investment is held. The income is recorded once the net investment
in a foreign operation exits the scope of consolidation.
Embedded derivatives
An embedded derivative is a component of a hybrid contract that meets the definition of a derivative
product. Embedded derivatives must be accounted for separately from the host contract if the
following three conditions are met:
the hybrid contract is not measured at fair value through profit or loss;
the embedded component taken separately from the host contract has the characteristics of a
derivative;
the characteristics of the derivative are not closely related to those of the host contract.
Determination of the fair value of financial instruments
When determining the fair value of financial instruments observable inputs must be prioritised. It is
presented using the hierarchy defined in IFRS 13.
IFRS 13 defines fair value as the price that would be received to sell an asset or paid to transfer a
liability in an ordinary transaction between market participants, on the principal or the most
advantageous market, at the measurement date.
Fair value applies individually to each financial asset or financial liability. A portfolio exemption may
be used where the management and risk monitoring strategy so allow and are appropriately
documented. Thus, certain fair value parameters are calculated on a net basis when a group of
financial assets and financial liabilities is managed on the basis of its net exposure to market or
credit risks. This is notably true of the CVA/DVA calculation.
The Group considers that the best evidence of fair value is reference to quoted prices published in
an active market.
When such quoted prices are not available, fair value is established by using valuation techniques
based on observable data or unobservable inputs.
Fair value of structured issues
In accordance with IFRS 13, the Group values its structured issues, recognised at fair value, by
taking as a reference the issuer spread that specialist participants agree to receive to acquire new
Group issues.
Consolidated financial statements of Crédit Agricole S.A. – 31 December 2017
46
Counterparty risk on derivative instruments
Crédit Agricole S.A. Group incorporates into fair value the assessment of counterparty risk for
derivative assets (Credit Valuation Adjustment or CVA) and, using a symmetrical treatment, the
non-performance risk for derivative liabilities (Debit Valuation Adjustment or DVA or own credit risk).
The CVA makes it possible to determine the expected losses due to the counterparty from the
perspective of Crédit Agricole Group, and DVA, the expected losses due to Crédit Agricole Group
from the perspective of the counterparty.
The CVA/DVA is calculated on the basis of an estimate of expected losses based on the probability
of default and loss given default. The methodology used maximises the use of observable market
inputs. It is primarily based on market data such as registered and listed CDS (or Single Name
CDS) or index CDS in the absence of registered CDS on the counterparty. In certain circumstances,
historical default data may also be used.
Fair value hierarchy
The standard classifies fair value into three levels based on the observability of inputs used in
valuation techniques.
Level 1: fair value corresponding to quoted prices (unadjusted) in active markets.
Level 1 is composed of financial instruments that are directly quoted in active markets for identical
assets and liabilities that the entity can access at the measurement date. These are stocks and
bonds quoted in active markets (such as the Paris Stock Exchange, the London Stock Exchange
or the New York Stock Exchange, etc.) and also fund securities quoted in an active market and
derivatives traded on an organised market, in particular futures.
A market is regarded as being active if quoted prices are readily and regularly available from an
exchange, broker, dealer, pricing service or regulatory agency, and those prices represent actual
and regularly occurring market transactions on an arm’s length basis.
For financial assets and liabilities with offsetting market risks, Crédit Agricole S.A. Group uses mid-
prices as a basis for establishing fair values for the offsetting risk positions. The Group applies the
current asking price to open short positions and the current bid price toopen long positions.
Consolidated financial statements of Crédit Agricole S.A. – 31 December 2017
47
Level 2: fair values measured using directly or indirectly observable inputs other than those in
Level 1.
The inputs used are observable either directly (i.e. prices) or indirectly (derived from prices) and
generally consist of data from outside the Company, which are publicly available or accessible and
based on a market consensus.
Level 2 is composed of:
stocks and bonds quoted in an inactive market or not quoted in an active market but for which
the fair value is established using a valuation methodology usually used by market participants
(such as discounted cash flow techniques or the Black & Scholes model) and based on
observable market data;
instruments that are traded over the counter, the fair value of which is measured with models
using observable market data, i.e. derived from various independently available external sources
which can be obtained on a regular basis. For example, the fair value of interest rate swaps is
generally derived from the yield curves of market interest rates as observed at the reporting date.
When the models are consistent notably with standard models based on observable market data
(such as interest rate yield curves or implied volatility surfaces), the day one gain or loss resulting
from the initial fair value measurement of the related instruments is recognised in profit or loss at
inception.
Level 3: fair value that is measured using significant unobservable inputs.
For some complex instruments that are not traded in an active market, fair value measurement is
based on valuation techniques using assumptions that cannot be observed on the market for an
identical instrument. These instruments are disclosed within Level 3.
This mainly concerns complex interest rate instruments, equity derivatives, structured credit
instruments for which fair value measurement includes, for instance, correlation or volatility inputs
that are not directly benchmarkable with market data.
The transaction price is deemed to reflect the fair value at initial recognition, any recognition of day
one gain or loss is deferred.
The margin relating to these structured financial instruments is generally recognised through profit
or loss over the period during which inputs are deemed unobservable. When market data become
“observable”, the remaining margin to be deferred is immediately recognised in profit or loss.
Valuation methodologies and models used for financial instruments that are disclosed within Levels
2 and 3 incorporate all factors that market participants would consider in setting a price. They shall
be beforehand validated by an independent control. Fair value measurement notably includes both
liquidity risk and counterparty risk.
Consolidated financial statements of Crédit Agricole S.A. – 31 December 2017
48
Absence of accepted valuation method to determine equity instruments’ fair value
In accordance with IAS 39 principles, if the estimates obtained using the various methods differ
excessively, the security is valued at cost and stays recorded under Available-for-sale financial
assets. In this case, the Group does not report a fair value, in accordance with the applicable
recommendations of IFRS 7. These primarily include equity investments in companies that are not
quoted in an active market and whose fair value is complex to measure.
Net gains (losses) on financial instruments
Net gains (losses) on financial instruments at fair value through profit or loss
For financial instruments designated at fair value through profit or loss and financial assets and
liabilities held for trading, this heading mainly includes the following income statement items:
dividends and other revenues from equities and other variable-income securities which are
classified under financial assets at fair value through profit or loss;
changes in fair value of financial assets or liabilities at fair value through profit or loss;
gains and losses on disposal of financial assets at fair value through profit or loss;
changes in fair value and gains and losses on disposal or termination of derivative instruments
not included in a fair value hedging relationship or cash flow hedge.
This heading also includes the ineffective portion of hedges.
Net gains (losses) on available-for-sale financial assets
For available-for-sale financial assets, this heading mainly includes the following income statement
items:
dividends and other revenues from equities and other variable-income securities which are
classified as available-for-sale financial assets;
gains and losses on disposal of fixed-income and variable-income securities which are classified
as available-for-sale financial assets;
losses in value of variable-income securities;
net income on disposal or termination of instruments used for fair value hedges of available-for-
sale financial assets when the hedged item is sold;
gains and losses on disposal or termination of loans and receivables and held-to-maturity
securities in those cases provided for by IAS 39.
Consolidated financial statements of Crédit Agricole S.A. – 31 December 2017
49
Offsetting of financial assets and financial liabilities
In accordance with IAS 32, Crédit Agricole S.A. Group nets a financial asset and a financial liability
and reports the net amount when, and only when, it has a legally enforceable right to offset the
amounts reported and intends either to settle on a net basis, or to realise the asset and settle the
liability simultaneously.
The derivative instruments and the repurchase agreements handled with clearing houses that meet
the two criteria required by IAS 32 have been offset on the balance sheet.
The effect of this offsetting is presented in the table in Note 6.12 on the amendment to IFRS 7 on
disclosures regarding the offsetting of financial assets and financial liabilities.
Financial guarantees given
A financial guarantee contract is a contract that calls for specific payments to be made by the issuer
to reimburse the holder for a loss incurred due to a specified debtor’s failure to make a payment
when due under the initial or amended terms of a debt instrument.
Financial guarantee contracts are recognised at fair value initially then subsequently at the higher
of:
the amount calculated in accordance with IAS 37 Provisions, Contingent Liabilities and
Contingent Assets; or
the amount initially recognised, less any depreciation recognised in accordance with IAS 18
Revenue.
Financing commitments that are not designated as fair value through profit or loss or not treated as
derivative instruments within the meaning of IAS 39 are not recognised on the balance sheet. They
are, however, covered by provisions in accordance with IAS 37.
Derecognition of financial instruments
A financial asset (or group of financial assets) is fully or partially derecognised if:
the contractual rights to the cash flows from the financial asset expire;
or are transferred or are deemed to have expired or been transferred because they belong de
facto to one or more beneficiaries; and substantially all the risks and rewards of the financial
asset are transferred.
In this case, any rights or obligations created or retained at the time of transfer are recognised
separately as assets and liabilities.
If the contractual rights to the cash flows are transferred but some of the risks and rewards of
ownership as well as control are retained, the financial assets continue to be recognised to the
Consolidated financial statements of Crédit Agricole S.A. – 31 December 2017
50
extent of the Group’s continuing involvement in the asset.
A financial liability is derecognised in full or in part:
when it is extinguished; or
when quantitative or qualitative analyses suggest it has undergone a substantial change
following restructuring.
PROVISIONS (IAS 37 and 19)
Crédit Agricole S.A. Group has identified all obligations (legal or constructive) resulting from a past
event for which it is probable that an outflow of resources will be required to settle the obligation,
and for which the due date or amount of the settlement is uncertain but can be reliably estimated.
These estimates are discounted where applicable whenever there is a material impact.
For obligations other than those related to credit risk, Crédit Agricole S.A. Group has set aside
general provisions to cover:
operational risks;
employee benefits;
commitment execution risks;
claims and liability guarantees;
tax risks;
risks related to home purchase savings schemes.
The latter provision is designed to cover the Group’s obligations in the event of unfavourable moves
impacting home purchase savings schemes. These obligations are: i) to pay a fixed interest rate on
the savings contract determined at inception for an undefined period of time; and ii) to grant a loan
to home purchase savings plan and account savers at a rate fixed at inception of the contract. The
provision is calculated for each generation of home purchase savings plan and for all home
purchase savings accounts, with no netting of obligations between generations.
The amount of these obligations is calculated taking account notably of:
subscriber behaviour models, based on assumptions regarding subscriber behaviour drawn from
historical experience, which may not necessarily reflect actual trends in future behaviour;
an estimate of the amount and term of the loans that will be granted in the future, based on
historical experience over an extended period of time;
the yield curve for market rates and reasonably foreseeable trends.
Consolidated financial statements of Crédit Agricole S.A. – 31 December 2017
51
Certain estimates may be made to determine the amount of the following provisions:
the provision for operational risks, which although subject to examination for identified risks,
requires Management to make assessments with regard to incident frequency and the potential
financial impact;
the provision for legal risks, which is based on Management’s best estimate in light of the
information in its possession at the end of the reporting period.
Detailed information is provided in Note 6.20 “Provisions”.
EMPLOYEE BENEFITS (IAS 19)
In accordance with IAS 19, employee benefits are recorded in four categories:
short-term employee benefits, including salaries, social security contributions, annual leave,
profit-sharing and incentive plans and premiums, are defined as those which are expected to be
settled within twelve months of the period in which the related services have been rendered;
long-term employee benefits (long-service awards, variable compensation and premium payable
12 months or more after the end of the period);
termination benefits;
post-employment benefits falling into two categories: defined-benefit schemes and defined-
contribution schemes.
Long-term employee benefits
Long-term employee benefits are employee benefits other than post-employment benefits or
termination benefits but not fully due to employees within twelve months after the end of the period
in which the related services have been rendered.
These include, in particular, bonuses and other deferred compensation payable twelve or more
months after the end of the period in which they were earned, but which are not share-based.
The measurement method is similar to the one used by the Group for post-employment benefits
with defined-benefit plans.
Consolidated financial statements of Crédit Agricole S.A. – 31 December 2017
52
Post-employment benefits
Defined-benefit plans
At each reporting date, Crédit Agricole S.A. Group sets aside reserves to cover its liabilities for
retirement and similar benefits and all other employee benefits falling in the category of defined-
benefit plans.
In keeping with IAS 19, these commitments are stated based on a set of actuarial, financial and
demographic assumptions, and in accordance with the Projected Credit Units method. Under this
method, for each year of service, a charge is booked in an amount corresponding to the employee’s
vested benefits for the period. The charge is calculated based on the discounted future benefit.
Liabilities for retirement and other future employee benefits are based on assumptions made by
Management with respect to the discount rate, staff turnover rate and probable increases in salary
and social security costs. If the actual figures differ from the assumptions made, the retirement
liability may increase or decrease in future years (see Note 7.4 “Post-employment benefits, defined-
benefit plans”).
Discount rates are determined based on the average term of the commitment, that is, the
arithmetical average of the terms calculated between the valuation date and the payment date
weighted by employee turnover assumptions.
The anticipated return on plan assets is also estimated by Management. Returns are estimated on
the basis of expected returns on fixed income securities, and notably bond yields.
The expected return on plan assets is determined using discount rates applied to measure the
defined benefit obligation.
In accordance with IAS 19 revised, all actuarial gains or losses are recognised in other
comprehensive income.
The amount of the provision is equal to:
the present value of the obligation to provide the defined benefits at the end of the reporting
period, calculated in accordance with the actuarial method recommended by IAS 19;
if necessary, reduced by the fair value of the assets allocated to covering these commitments.
These may be represented by an eligible insurance policy. In the event that 100% of the
obligation is covered by a policy that meets exactly the expense amount payable over the period
for all or part of a defined-benefit plan, the fair value of the policy is deemed to be the value of
the corresponding obligation, i.e. the amount of the corresponding actuarial liability.
For such obligations that are not covered, a provision for retirement benefits is recognised under
Provisions on the liabilities side of the balance sheet. This provision is equal to Crédit Agricole S.A.
Group’s liabilities towards employees in service at financial year-end, governed by the Crédit
Agricole Group collective agreement that came into effect on 1 January 2005.
Consolidated financial statements of Crédit Agricole S.A. – 31 December 2017
53
A provision to cover the cost of early retirement commitments is also listed under Provisions. This
provision covers the additional discounted cost of the various early retirement agreements signed
by Crédit Agricole Group entities under which employees of eligible age may take early retirement.
Lastly, certain Group companies are liable to pay supplementary retirement benefits. A provision is
calculated on the basis of the Company’s actuarial liability for these benefits. These provisions are
also shown on the liabilities side of the balance sheet under Provisions.
Defined contribution plans
Employers contribute to a variety of compulsory pension schemes. Pension schemes assets are
managed by independent organisations and the contributing companies have no legal or implied
obligation to pay additional contributions if the funds managed do not have sufficient assets to cover
all benefits corresponding to services rendered by employees during the year and during prior
years. Consequently, Crédit Agricole S.A. Group has no liabilities in this respect other than its on-
going contributions.
SHARE-BASED PAYMENTS (IFRS 2)
IFRS 2 on Share-based payment requires valuation of share-based payment transactions in the
Company’s income statement and balance sheet. This standard applies to transactions with
employees and more specifically to:
share-based payment transactions settled in equity instruments;
share-based payment transactions settled in cash.
Share-based payment plans initiated by Crédit Agricole S.A. Group that are eligible for IFRS 2 are
mainly transactions settled in equity instruments (stock options, free share allocation plans, variable
compensation settled in indexed cash or in shares, etc.).
Options granted are measured at their fair value on the date of grant primarily using the Black &
Scholes model. These options are recognised as a charge under Employee expenses, with a
corresponding adjustment to equity, spread over the vesting period (four years for existing plans).
Employee share issues offered to employees as part of the Employee savings plans are also subject
to the IFRS 2 standard. Shares may be offered to employees with a maximum discount of 20%.
These plans have no vesting period but the shares are subject to a lock-up period of five years. The
benefit granted to employees is measured as the difference between the fair value per share
acquired taking account of the lock-up period and the purchase price paid by the employee on the
subscription date multiplied by the number of shares subscribed.
A more detailed description of the method, existing plans and valuation methods is provided in Note
7.6 “Share-based payments”.
Consolidated financial statements of Crédit Agricole S.A. – 31 December 2017
54
The cost of share based payments settled in Crédit Agricole S.A. equity instruments and the cost
of share subscriptions are recognised in the financial statements of the entities that employ the plan
beneficiaries. The impact is recorded under Employee expenses, with a corresponding increase in
Consolidated reserves-Group share.
CURRENT AND DEFERRED TAXES
In accordance with IAS 12, the income tax charge includes all income taxes, whether current or
deferred.
IAS 12 defines current tax liability as “the amount of income tax payable (recoverable) in respect of
the taxable profit (tax loss) for a reporting period”. Taxable income is the profit (or loss) for a given
accounting period measured in accordance with the rules determined by the tax authorities.
The applicable rates and rules used to measure the current tax liability are those in effect in each
country where the Group’s companies are established.
The current tax liability includes all taxes on income, payable or recoverable, for which payment is
not subordinated to the completion of future transactions, even if payment is spread over several
years.
The current tax liability must be recognised as a liability until it is paid. If the amount that has already
been paid for the current year and previous years exceeds the amount due for these years, the
surplus must be recognised under assets.
Moreover, certain transactions carried out by the entity may have tax consequences that are not
taken into account in measuring the current tax liability. IAS 12 defines a difference between the
carrying amount of an asset or liability and its tax base as a temporary difference.
This standard requires that deferred taxes be recognised in the following cases:
- a deferred tax liability should be recognised for any taxable temporary differences between the
carrying amount of an asset or liability on the balance sheet and its tax base, unless the
deferred tax liability arises from:
initial recognition of goodwill,
the initial recognition of an asset or a liability in a transaction that is not a business
combination and that does not affect either the accounting or the taxable profit (taxable
loss) at the transaction date;
- a deferred tax asset should be recognised for any deductible temporary differences between
the carrying amount of an asset or liability on the balance sheet and its tax base, insofar as it
is deemed probable that a future taxable profit will be available against which such deductible
temporary differences can be allocated;
- a deferred tax asset should also be recognised for carrying forward unused tax losses and tax
credits insofar as it is probable that a future taxable profit will be available against which the
Consolidated financial statements of Crédit Agricole S.A. – 31 December 2017
55
unused tax losses and tax credits can be allocated.
The tax rates applicable in each country are used as apporpriate.
Deferred taxes are not discounted.
Taxable unrealised gains on securities do not generate any taxable temporary differences between
the carrying amount of the asset and the tax base. As a result, deferred tax is not recognised on
these gains. When the relevant securities are classified as available-for-sale securities, unrealised
gains and losses are recognised directly through other comprehensive income. The tax charge or
saving effectively borne by the entity arising from these unrealised gains or losses is reclassified as
a deduction from these gains.
In Franceof long-term capital gains on the sale of equity investments, as defined by the General
Tax Code, are exempt from tax as from the tax year commencing on 1 January 2007; with the
exception of 12% of long-term capital gains that are taxed at the normally applicable rate.
Accordingly, unrealised gains recognised at the end of the year generate a temporary difference
requiring the recognition of deferred tax on this share.
Current and deferred tax is recognised in net income for the financial year, unless the tax arises
from:
either a transaction or event that is recognised directly through other comprehensive income,
during the same year or during another year, in which case it is directly debited or credited to
other comprehensive income;
or a business combination.
Deferred tax assets and liabilities are offset against each other if, and only if:
the entity has a legally enforceable right to offset current tax assets against current tax liabilities;
and
the deferred tax assets and liabilities apply to income taxes assessed by the same tax authority:
a) either for the same taxable entity, or
b) for different taxable entities that intend either to settle current tax assets and liabilities on a
net basis, or to settle their tax assets and liabilities at the same time during each future financial
year in which it is expected that substantial deferred tax assets or liabilities will be paid or
recovered.
When tax credits on income from securities portfolios and amounts receivable are effectively used
to pay income tax due for the year, they are recognised under the same heading as the income with
which they are associated. The corresponding tax charge continues to be recognised under the
Income tax charge heading in the income statement.
However, given that the legislative intent when introducing the tax credit for competitiveness and
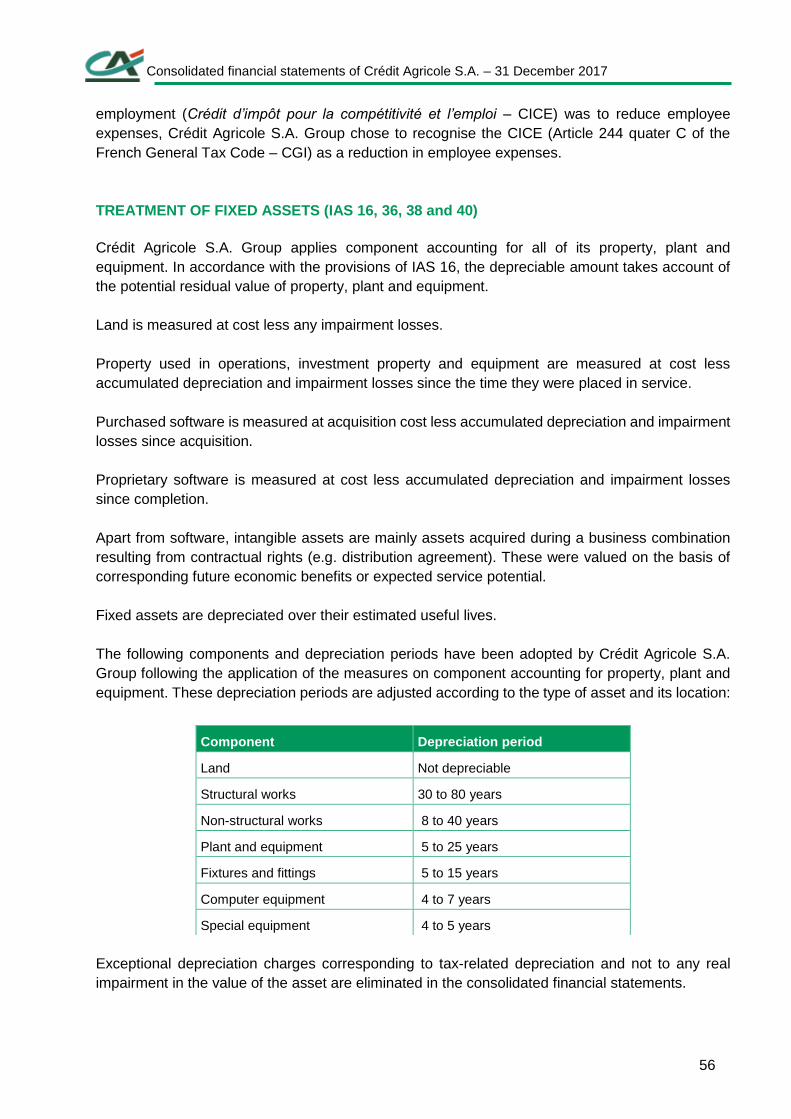
Consolidated financial statements of Crédit Agricole S.A. – 31 December 2017
56
employment (Crédit d’impôt pour la compétitivité et l’emploi – CICE) was to reduce employee
expenses, Crédit Agricole S.A. Group chose to recognise the CICE (Article 244 quater C of the
French General Tax Code – CGI) as a reduction in employee expenses.
TREATMENT OF FIXED ASSETS (IAS 16, 36, 38 and 40)
Crédit Agricole S.A. Group applies component accounting for all of its property, plant and
equipment. In accordance with the provisions of IAS 16, the depreciable amount takes account of
the potential residual value of property, plant and equipment.
Land is measured at cost less any impairment losses.
Property used in operations, investment property and equipment are measured at cost less
accumulated depreciation and impairment losses since the time they were placed in service.
Purchased software is measured at acquisition cost less accumulated depreciation and impairment
losses since acquisition.
Proprietary software is measured at cost less accumulated depreciation and impairment losses
since completion.
Apart from software, intangible assets are mainly assets acquired during a business combination
resulting from contractual rights (e.g. distribution agreement). These were valued on the basis of
corresponding future economic benefits or expected service potential.
Fixed assets are depreciated over their estimated useful lives.
The following components and depreciation periods have been adopted by Crédit Agricole S.A.
Group following the application of the measures on component accounting for property, plant and
equipment. These depreciation periods are adjusted according to the type of asset and its location:
Exceptional depreciation charges corresponding to tax-related depreciation and not to any real
impairment in the value of the asset are eliminated in the consolidated financial statements.
Component Depreciation period
Land Not depreciable
Structural works 30 to 80 years
Non-structural works 8 to 40 years
Plant and equipment 5 to 25 years
Fixtures and fittings 5 to 15 years
Computer equipment 4 to 7 years
Special equipment 4 to 5 years
Consolidated financial statements of Crédit Agricole S.A. – 31 December 2017
57
Based on available information, Crédit Agricole S.A. Group has concluded that impairment testing
would not lead to any change in the existing amount of its fixed assets at the end of the reporting
period.
FOREIGN CURRENCY TRANSACTIONS (IAS 21)
In accordance with IAS 21, a distinction is made between monetary and non-monetary items.
On the reporting date, foreign-currency denominated monetary assets and liabilities are translated
into Crédit Agricole S.A. Group’s functional currency at the closing rate. The resulting translation
adjustments are recorded in the income statement. There are two exceptions to this rule:
for available-for-sale financial assets, only the translation adjustments calculated on amortised
cost are taken to the income statement; the balance is recorded in equity;
translation adjustments on elements designated as cash flow hedges or forming part of a net
investment in a foreign entity are recognised in other comprehensive income.
Non-monetary items are treated differently depending on the type of items:
items at historical cost are measured at the foreign exchange rate on the transaction date;
items at fair value are measured at the foreign exchange rate at the end of the reporting period.
Translation adjustments on non-monetary items are recognised:
in the income statement if the gain or loss on the non-monetary item is recorded in the income
statement;
in other comprehensive income if the gain or loss on the non-monetary item is recorded in other
comprehensive income.
FEES AND COMMISSIONS (IAS 18)
Fee and commission income and expenses are recognised in income based on the nature of
services with which they are associated:
fees and commissions that are an integral part of the effective yield on a financial instrument are
recognised as an adjustment to the yield on the instrument and included in its effective interest
rate;
when the result from a transaction involving the rendering of services can be estimated reliably,
revenue from fees and commissions associated with the transaction is recognised in Fees and
commissions by reference to the stage of completion of the transaction at the end of the reporting
period:
Consolidated financial statements of Crédit Agricole S.A. – 31 December 2017
58
a) fees and commissions paid or received in consideration for non-recurring services are fully
recognised in the income statement.
Fees and commissions payable or receivable that are contingent upon meeting a
performance target are recognised only if all the following conditions are met:
i) the amount of fees and commissions can be reliably estimated,
ii) it is probable that the future economic benefits from the services rendered will flow
to the Company,
iii) the stage of completion of the service can be reliably estimated, and the costs
incurred for the service and the costs to complete it can be reliably estimated;
b) fees and commissions in consideration for on-going services, such as fees and commissions
on payment instruments, are recognised in the income statement and spread over the
duration of the service rendered.
INSURANCE BUSINESSES (IFRS 4)
Liabilities remain partially valued under French GAAP, as permitted by IAS and IFRS regulations,
pending further amendments to the existing standards. Financial assets held by Crédit Agricole S.A.
Group’s insurance companies have been reclassified into the financial assets categories set out in
IAS 39.
Contracts containing discretionary participation features are collectively classified as a liability under
insurance company’s technical reserves. They are recognised in the same way as insurance
contracts. Premiums on these contracts are recognised as income and the increase in obligations
to policyholders is recognised as an expense.
Life insurance technical reserves are conservatively estimated based on the technical rates defined
in the contracts. Liabilities associated with contracts with or without discretionary participation
features or minimum guarantee, are measured based on the fair value of the underlying assets or
its equivalent at the end of the reporting period and are recorded under financial liabilities.
The financial margin on these policies is taken to profit or loss, after reversal of technical items
(premiums, benefits, etc.), according to deposit accounting principles.
Property and casualty insurance policy liabilities are estimated at the end of the reporting period,
without applying any discount. Claims management costs associated with technical reserves are
charged to a provision in the financial statements at the reporting date.
For non-life insurance contracts, acquisition costs are recognised as and when the premium is
earned. For life insurance contracts, directly identifiable acquisition costs are deferred over the profit
generation period.
Total expenses related to the insurance business are presented in Note 4.5 “Net income (expenses)
on other activities”.
Consolidated financial statements of Crédit Agricole S.A. – 31 December 2017
59
As permitted by the extension of local GAAP specified by IFRS 4 and CRC Regulation 2000-05
pertaining to consolidated financial statements for insurance companies, “shadow accounting” is
used to account for insurance liabilities for contracts with discretionary participation features. Under
this practice, positive or negative valuation differences in the corresponding financial assets that
will potentially revert to policyholders are recognised in a “Deferred profit sharing” account.
This policyholders' deferred profit sharing is recognised on the liabilities side of the balance sheet
under Insurance company technical reserves or on the asset side with an offsetting entry in the
income statement or in the valuation reserve, in the same way as unrealised gains and losses on
the underlying assets.
The method used for valuation of deferred policyholders’ profit-sharing, resulting from the
application of shadow accounting, was changed in 2015.
The rate of deferred policyholders’ profit-sharing, previously based on historically observed data, is
now valued prospectively on the basis of analysis scenarios consistent with the Company’s
management policies. It is only updated if it changes significantly.
To determine whether the deferred profit-sharing asset is recoverable, tests are carried out to
determine whether any unrealised losses can be applied to future surpluses before testing for
liability shortfall in accordance with the CNC recommendation of 19 December 2008.
These tests are based:
firstly, on liquidity analyses of the Company, which show the company’s capacity to access
funding sources to meet its obligations and its ability to hold assets with unrealised losses even
if new production declines. The tests were performed with and without new production;
secondly, on a comparison between the average value of future services measured by the
internal model replicating the Company’s management decisions and the value of the assets
representing the obligations at market value. This shows the company’s ability to meet its
obligations.
Lastly, sensitivity tests on the ability to activate the deferred profit sharing are also carried out:
in the event of a uniform 15% increase in redemptions applied to redemption rates drawn from
scenarios similar to those used by the French Regulatory and Resolution Supervisory Authority;
in the event of an additional 10% decline in the equity markets.
In accordance with IFRS 4, at each reporting date, the Group also ascertains that insurance
liabilities (net of deferred acquisition costs and associated intangible assets) are adequate to meet
estimated future cash flows.
The liability adequacy test used to verify this must meet the following minimum requirements, as
defined in paragraph 16 of the standard:
Consolidated financial statements of Crédit Agricole S.A. – 31 December 2017
60
it must consider all future contractual cash flows, including associated management costs, fees
and commissions as well as options and guarantees implicit in these contracts;
If the test shows that the liability is inadequate, it is wholly recognised in profit or loss.
LEASES (IAS 17)
As required by IAS 17, leases are analysed in accordance with their substance and financial reality.
They are classified as operating leases or finance leases.
Finance lease transactions are treated as an acquisition of a fixed asset by the lessee financed by
a loan from the lessor.
In the lessor’s financial statements, analysis of the economic substance of the transactions results
in the following:
recognition of a financial receivable from the customer, which is amortised by the lease payments
received;
lease payments are broken down into interest and principal, known as financial amortisation;
recognition of a net reserve for unrealised gains or losses. This is equal to the difference
between:
a) the net lease receivable: amount owed by the lessee, comprising outstanding finance lease
receivable and financial amortisation for the period between the most recent instalment and
the reporting date,
b) the net carrying amount of the leased fixed assets,
c) the provision for deferred taxes.
In the lessee’s financial statements, finance leases are restated such that they are recognised in
the same way as if the asset had been purchased on credit, by recognising a financial liability,
recording the purchased asset on the balance sheet and depreciating the asset.
In the income statement, the theoretical depreciation charge (the charge that would have been
recognised if the asset had been purchased) and the finance expenses (incurred in connection with
the financing) are recorded in the place of the lease payments.
For operating leases, the lessee recognises payments as expenses and the lessor records the
corresponding income under rents, and the leased assets on its balance sheet.
Consolidated financial statements of Crédit Agricole S.A. – 31 December 2017
61
NON-CURRENT ASSETS HELD FOR SALE AND DISCONTINUED OPERATIONS (IFRS 5)
A non-current asset (or a group destined for sale) is classified as held-for-sale if its carrying amount
will be recovered principally through a sale transaction rather than through continuing use.
For this to be the case, the asset (or group destined for sale) must be available for immediate sale
in its present condition and its sale must be highly probable.
The relevant assets and liabilities are shown separately on the balance sheet under Non-current
assets held-for-sale and discontinued operations and Liabilities associated with non-current assets
held-for-sale and discontinued operations.
A non-current asset (or group destined for sale) classified as held-for-sale is measured at the lower
of its carrying amount and fair value less costs of sale. In case ofunrealised losses, impairment is
recognised in the income statement. Non current assets are no longer amortised when they are
reclassified.
If the fair value of a group held for sale less selling costs is less than its carrying amount after
impairment of non-current assets, the difference is allocated to other group held for sale assets
including the financial assets and is recognised under net income of held-for-sale operations.
A discontinued operation is a component that the Group has either disposed of, or that is classified
as held-for-sale, according to the following situations:
it represents a separate major business line or geographical area of operations;
it is part of a single coordinated plan to dispose of a separate major business line or geographical
area of operations; or
it is a subsidiary acquired exclusively with a view to resale.
The following are disclosed on a separate line of the income statement:
the profit or loss from discontinued operations until the date of disposal, net of tax;
the gain or loss recognised on the disposal or on measurement to fair value less costs of sale of
the assets and liabilities constituting the discontinued operations, net of tax.
Consolidated financial statements of Crédit Agricole S.A. – 31 December 2017
62
1.4 Consolidation principles and methods (IFRS 10, IFRS 11 and IAS 28)
SCOPE OF CONSOLIDATION
The consolidated financial statements include the financial statements of Crédit Agricole S.A. and
those of all companies over which, in compliance with IFRS 10, IFRS 11 and IAS 28, Crédit Agricole
S.A. exercises control, joint control or significant influence.
Definitions of control
In compliance with international accounting standards, all entities under control, under joint control
or under significant influence are consolidated, provided that they are not covered by the exclusions
below.
Exclusive control over an entity is deemed to exist if Crédit Agricole S.A. is exposed to or entitled
to receive variable returns as a result of its involvement with the entity and if the power it holds over
this entity allows it to influence these returns. Power in this context means substantive (voting or
contractual) rights. Rights are considered substantive if the holder of the rights can in practice
exercise them when decisions about the Company’s relevant activities are made.
Crédit Agricole S.A. is deemed to control a subsidiary through voting rights when its rights give it
the practical ability to direct the subsidiary’s relevant activities. Crédit Agricole S.A. is generally
considered to control a subsidiary when it holds more than half the existing or potential voting rights
in an entity, whether directly or indirectly through subsidiaries, except when it can be clearly
demonstrated that such ownership does not give it the power to direct its relevant activities. Control
is also deemed to exist where Crédit Agricole S.A. holds half or less than half of the voting rights,
including potential rights, in an entity but is able in practice to direct its relevant activities at its sole
discretion, notably because of the existence of contractual arrangements, the size of its stake in the
voting rights compared to those of other investors, or other reasons.
Control of a structured entity is not assessed on the basis of voting rights as these have no effect
on the entity’s returns. When assessing control, consideration is given not only to contractual
arrangements in force but also to whether Crédit Agricole S.A. was involved in creating the entity
and what decisions it made at that time, what agreements were made at its inception and what risks
are borne by Crédit Agricole S.A., any rights under agreements that give the investor the power to
direct relevant activities in specific circumstances only and any other facts or circumstances that
indicate the investor can direct the entity’s relevant activities. Where there is a management
agreement, the extent of decision-making powers granted to the delegated manager and the
remuneration accorded by such contractual arrangements are examined to establish whether the
manager is in practice acting as an agent (with delegated powers) or as a principal (on their own
account).
Furthermore, when decisions on the entity’s relevant activities are taken, the indicators used to
assess whether an entity is acting as agent or principal are as follows: the extent of the decision-
making powers compared to the powers over the entity delegated to the manager, the remuneration
provided for under the contractual arrangements, any substantive rights that may affect the
Consolidated financial statements of Crédit Agricole S.A. – 31 December 2017
63
decision-making capacity of other parties involved in the entity and the exposure to variable returns
of other interests in the entity.
Joint control is deemed to exist when there is a contractual division of control over an economic
activity. Decisions affecting the entity’s relevant activities require unanimous agreement of the joint
controllers.
In traditional entities, significant influence is defined as the power to influence but not control a
company’s financial and operational policies. Crédit Agricole S.A. is presumed to have significant
influence if it owns 20% or more of the voting rights in an entity, whether directly or indirectly through
subsidiaries.
Exclusions from the scope of consolidation
In accordance with IAS 28 minority interests held by venture capital entities are excluded from the
scope of consolidation insofar as they are classified under financial assets at fair value through
profit or loss (including financial assets held for trading and financial assets designated at fair value
through profit or loss).
CONSOLIDATION METHODS
The methods of consolidation are respectively defined by IFRS 10 and IAS 28 revised. They depend
on the type of control exercised by Crédit Agricole S.A. over the entities that can be consolidated,
regardless of activity or whether or not they have legal entity status:
full consolidation, for controlled entities, including entities with different financial statement
structures, even if their business is not an extension of that of Crédit Agricole S.A.;
the equity method, for the entities over which Crédit Agricole S.A. exercises significant influence
and joint control.
Full consolidation consists in substituting for the value of the shares each of the assets and liabilities
carried by each subsidiary. The equity and income attributable to non-controlling interests is
presented separately in the consolidated balance sheet and income statement.
Non-controlling interests are as defined by IFRS 10 and incorporate instruments representing
present ownership interests and that give right to a proportional share of the net assets in the event
of liquidation and the other equity instruments issued by the subsidiary and not held by the Group.
The equity method consists in substituting for the value of shares the Group’s proportional share of
the equity and income of the companies concerned.
The change in the carrying amount of these shares includes changes in goodwill.
In the event of incremental share purchases or partial disposals with continued joint control or
significant influence, Crédit Agricole S.A. Group recognises:
Consolidated financial statements of Crédit Agricole S.A. – 31 December 2017
64
- in the case of an increase in the percentage of interest, additional goodwill;
- in the case of a reduction in the percentage of interest, a gain or loss on disposal/dilution in
profit or loss.
RESTATEMENTS AND ELIMINATIONS
Where necessary, financial statements are restated to harmonise the valuation methods applied by
consolidated companies.
The impact of Group internal transactions on the consolidated balance sheet and income statement
is eliminated for fully consolidated entities.
Capital gains or losses arising from intra-Group asset transfers are eliminated; any potential lasting
impairment measured at the time of disposal in an internal transaction is recognised.
TRANSLATION OF FOREIGN SUBSIDIARIES’ FINANCIAL STATEMENTS (IAS 21)
Financial statements of subsidiaries denominated in foreign currencies are translated into euros in
two stages:
if applicable, the local currency in which the financial statements are prepared is translated into
the functional currency (currency of the main business environment of the entity). The translation
is made as if the information had been recognised initially in the functional currency (same
translation principles as for foreign currency transactions);
the functional currency is translated into euros, the currency in which the Group’s consolidated
financial statements are presented. Assets and liabilities are translated at the closing rate.
Income and expenses included in the income statement are translated at the average exchange
rate for the period. Translation adjustments for assets, liabilities and income statement items are
recorded under a specific item in equity. These translation differences are recognised as income
during the total or partial transfer of the entity. In the event of the sale of a subsidiary (exclusive
control), the reclassification of equity as income takes place only in the event of a loss of control.
Consolidated financial statements of Crédit Agricole S.A. – 31 December 2017
65
BUSINESS COMBINATIONS - GOODWILL
Business combinations are accounted for using the acquisition method in accordance with IFRS 3,
except for business combinations under common control (in particular mergers of Regional Banks),
which are excluded from the field of application of IFRS 3. Pursuant to IAS 8, these transactions
are entered at carrying amount using the pooling of interests method, with reference to US standard
ASU805-50 which seems to comply with the IFRS general principles.
On the date of acquisition, the identifiable assets, liabilities and contingent liabilities of the acquired
entity which satisfy the conditions for recognition set out in IFRS 3 are recognised at their fair value.
Notably, restructuring liabilities are only recognised as a liability of the acquired entity if, at the date
of acquisition, the acquiree is under an obligation to complete the restructuring.
Price adjustment clauses are recognised at fair value even if their application is not probable.
Subsequent changes in the fair value of clauses if they are financial liabilities are recognised in the
income statement. Only price adjustment clauses relating to transactions where control was
obtained at the latest by 31 December 2009 may still be recorded against goodwill, because these
transactions were accounted for under IFRS 3 pre revision (2004).
The non-controlling interests that are shares of current interests giving rights to a share of the net
assets in the event of liquidation may be measured, at acquirer’s choice, in two ways:
at fair value on the date of acquisition;
at the share of the identifiable assets and liabilities of the acquired company revalued at fair
value.
The option may be exercised at each acquisition.
The balance of interests not allowing control (equity instruments issued by the subsidiary and not
held by the Group) should be recognised for its fair value on the date of acquisition.
The initial assessment of assets, liabilities and contingent liabilities may be revised within a
maximum period of 12 months after the date of acquisition.
Some transactions relating to the acquired entity are recognised separately from the business
combination. This applies primarily to:
transactions that end an existing relationship between the acquired company and the acquiring
company;
transactions that compensate employees or the selling shareholders of the acquired company
for future services;
transactions whose aim is to have the acquired company or its former shareholders repay
expenses borne by the acquirer.
Consolidated financial statements of Crédit Agricole S.A. – 31 December 2017
66
These separate transactions are generally recognised in the income statement at the acquisition
date.
The transferred consideration at the time of a business combination (the acquisition cost) is
measured as the total of fair values transferred by the acquirer, on the date of acquisition in
exchange for control of the acquired entity (for example: cash, equity instruments, etc.).
The costs directly attributable to the business combination shall be recognised as expenses,
separately from the business combination. If the transaction has very strong possibilities of
occurring, they are recognised under the heading Net gains (losses) on other assets, otherwise
they are recognised under the heading Operating expenses.
The difference between the sum of acquisition costs and non-controlling interests and the net
balance on the date of acquisition of acquired identifiable assets and liabilities assumed, valued at
their fair value, is recognised, when it is positive, in the assets side of the consolidated balance
sheet, under the heading Goodwill when the acquired entity is fully consolidated and under the
heading Investments in equity-accounted entities when the acquired company is consolidated using
the equity method of accounting. Any badwillis recognised immediately through profit or loss.
Goodwill is carried in the balance sheet at its initial amount in the currency of the acquired entity
and translated at the closing rate at the end of the reporting period.
When control is taken by stages, the interest held before taking control is revalued at fair value
through profit or loss at the date of acquisition and the goodwill is calculated once, using the fair
value at the date of acquisition of acquired assets and liabilities taken over.
Goodwill is tested for impairment whenever there is objective evidence of a loss of value and at
least once a year.
The choices and assumptions used in assessing the holdings that do not allow control at the date
of acquisition may influence the amount of initial goodwill and any impairment resulting from a loss
of value.
For the purpose of impairment testing, goodwill is allocated to the Group Cash Generating Units
(CGUs) that are expected to benefit from the business combination. The CGUs have been defined
within the Group’s business lines as the smallest identifiable group of assets and liabilities
functioning in a single business model. Impairment testing consists of comparing the carrying
amount of each CGU, including any goodwill allocated to it, with its recoverable amount.
The recoverable amount of the CGU is defined as the higher of fair value diminished of selling costs
and value in use. The value in use is the present value of the future cash flows of the CGU, as set
out in medium-term business plans prepared by the Group for management purposes.
When the recoverable amount is lower than the carrying amount, a corresponding impairment loss
is recognised for the goodwill allocated to the CGU. This impairment is irreversible.
Consolidated financial statements of Crédit Agricole S.A. – 31 December 2017
67
In the case of an increase in the percentage ownership interest of the Group in an entity that is
already exclusively controlled, the difference between the acquisition cost and the share of net
assets acquired is recognised under the item Consolidated reserves, Group share; in the event that
the Group’s percentage ownership interest in an entity that remains under its exclusive control
declines, the difference between the selling price and the carrying amount of the share of net assets
sold is also recognised directly under Consolidated reserves, Group share. The expenses arising
from these transactions are recognised in equity.
The accounting treatment of sale options granted to minority shareholders is as follows:
when a sale option is granted to the minority shareholders of a fully consolidated subsidiary, a
liability is recognised in the balance sheet; on initial recognition, the liability is measured at the
estimated present value of the exercise price of the options granted to the minority shareholders.
Against this liability, the share of net assets belonging to the minority shareholders concerned is
reduced to zero and the remainder is deducted from equity;
subsequent changes in the estimated value of the exercise price will affect the amount of the
liability, offset by an equity adjustment. Symmetrically, subsequent changes in the share of net
assets due to minority shareholders are cancelled, offset in equity.
When there is a loss of control, the proceeds from the disposal are calculated on the entirety of the
entity sold and any investment share kept is recognised in the balance sheet at its fair value on the
date control was lost.
Consolidated financial statements of Crédit Agricole S.A. – 31 December 2017
68
2. Major structural transactions and material events during the period
The scope of consolidation and changes to it are shown in detail at the end of the notes in Note 11 « Scope of consolidation at 31 December 2017».
2.1 Tax law changes in France and the United States
Elimination of the 3% surtax on dividends for French companies following the
decision of the French Constitutional Court
Following the ruling by the Court of Justice of the European Union on 17 May 2017 that it violated
European Directive 2011/96/EU on the common system of taxation applicable in the case of parent
companies and subsidiaries of different Member States, the Constitutional Court found the 3%
surtax on dividends unconstitutional in its judgement of 6 October 2017, regardless of whether these
dividends represent operating profits or dividends of French and foreign subsidiaries.
The 2018 Finance Act thus removed the 3% surtax on dividends from the French General Tax
Code. This provision applies to distributions paid out on or after 1 January 2018. The Group also
applied for tax relief for prior financial years.
The impact on the Group's net income comprises a request for the repayment of €81 million in
respect of this surtax.
French tax law changes
The first 2017 Amending Finance Act was approved by the French National Assembly on 1
December 2017, followed by the 2018 Finance Act and the second 2017 Amending Finance Act on
21 December 2017. The corporate income tax changes had a significant effect on the financial
statements of Crédit Agricole SA Group as of 31 December 2017.
Changes to the French corporate income tax rate by 2019/2022
The 2018 Finance Act speeds up the implementation of the reduction in the standard corporate
income tax rate for financial years beginning on or after 1 January 2019. For the 2019, 2020, 2021
and 2022 financial years, the maximum standard rate, including the 3.3% social contribution, will
be reduced to 32.03%, 28.92%, 27.37% and 25.83%, respectively.
Deferred tax assets and liabilities at 31 December 2017 were measured at the amount that is
expected to be paid to or received from the tax authorities having regard to the dates of repayment
or the recoverability of the deferred tax bases.
The impact of this law change on the Group's consolidated financial statements is a €61 million
increase in the tax charge.
Consolidated financial statements of Crédit Agricole S.A. – 31 December 2017
69
Extraordinary corporate income tax contributions by large French corporates
Following the striking down as unconstitutional of the 3% surcharge on dividend distributions (see
above), the following were introduced for financial years ending from 31 December 2017 to 30
December 2018:
an extraordinary contribution equal to 15% of the corporate income tax payable (before
deduction of relief, tax credits and tax receivables of all kinds) by companies with Revenues
of over €1 billion. This extraordinary contribution raises the effective tax rate to 39.43%;
an additional contribution equal to 15% of the corporate income tax payable (before
deduction of relief, tax credits and tax receivables of all kinds) by companies with Revenues
of over €3 billion. This extraordinary contribution raises the effective tax rate to 44.43%.
The impact on the Group's net income is an additional tax charge of -€336 million.
US tax law changes
Change in the US corporate income tax rate from 1 January 2018
Among other features, the US tax reform adopted at the end of December 2017 cuts the tax rate
on corporate profits from 35% to 21%.
Applicable from 1 January 2018, this tax cut has an immediate impact on the deferred taxes of the
Group's US subsidiaries, primarily pertaining to the Large Customers and Asset Gathering business
lines.
The recognition of the future corporate income tax reduction on the deferred tax assets and liabilities
of the Group's US companies had an impact of -€78 million in 2017.
2.2 Main changes in the scope of consolidation
Acquisition of Pioneer Investments
On 3 July 2017, Amundi acquired the Pioneer Investments group companies from Pioneer Global
Asset Management S.p.A. ("PGAM"), a UniCredit subsidiary, for a cash consideration of €3,539
million.
Amundi and UniCredit signed a definitive agreement on December 2016 in view of Amundi’s
acquisition of Pioneer Investments.
Founded in 1928, Pioneer Investments is an international asset management group active in 27
countries. Pioneer Investments primarily operates in Milan, Boston, Dublin and London and has a
significant presence among others in Germany, Austria and the Czech Republic. It had around
1,800 employees on the acquisition date.
Consolidated financial statements of Crédit Agricole S.A. – 31 December 2017
70
This deal created the 8th largest global asset management player in terms of assets under
management. The combined entity will service all customer segments with a wide range of products
and solutions coupled with unrivalled quality of service and commitment.
The 18 subsidiaries and 12 branches acquired are presented in Note 11 "Scope of consolidation at
31 December 2017". They are all fully consolidated, with the Group having a 68.5% interest.
This acquisition was financed, for €1,413 million, by Amundi’s capital increase, completed in March
2017, of which €578 million was subscribed by the Group, available capital of €1,481 million, and
the issuance of senior and subordinated debt for €645 million subscribed by Crédit Agricole S.A.
Impact of Amundi’s capital increase in the consolidated financial statements of Crédit
Agricole S.A.
The Group has sold some of its preferential subscription rights for €65 million. As a result of this
dilutive capital increase, Crédit Agricole S.A. Group holds 68,5% of Amundi’s equity before
restatement of Amundi’s treasury shares.
Under IFRS 3 (Revised), changes in an equity interest in a fully consolidated entity, without loss of
control, are recognised in equity.
The capital increase and the sale of the preferential subscription rights, considered as transactions
between shareholders, are recognised in equity.
This capital increase and the sale of the preferential subscription rights resulted in a €98 million
increase in consolidated reserves and a €817 million increase in non-controlling interests.
Other impacts of Pioneer's acquisition on the consolidated financial statements of Crédit
Agricole S.A. Group
This acquisition increased the Group's balance sheet by €3.5 billion.
The post-combination balance sheet, prepared as of 3 July 2017, reflects the fair value of the assets
acquired and liabilities assumed by the Group, namely €664 million, as well as the assets and
liabilities identified in the course of allocating Goodwill for €339 million net of deferred taxes and
mainly relate to the distribution agreements pertaining to retail customers in Italy, Germany, Austria
and the Czech Republic.
The goodwill from the deal totalled €2.5 billion (see Note 6.18 "Goodwill").
In accordance with IFRS 3 (Revised), the assets acquired and liabilities assumed from the subgroup
acquired were identified, classified and measured at fair value at the acquisition date; this process
could be finalised within 12 months of the acquisition.
Consolidated financial statements of Crédit Agricole S.A. – 31 December 2017
71
Contribution to the Group's consolidated net income and net income of the combined entity
Pursuant to IFRS 3 (Revised), the following are communicated:
the Revenues and Net Income of Pioneer Investments since the acquisition date, as
included in the consolidated income statement at 31 December 2017;
the Revenues and Net income of the Credit Agricole S.A ’s Group for the 2017 financial
year, as if the Pioneer Investments had been acquired at the beginning of the 2017 financial
year.
Acquisition of three Italian savings banks
Following the agreement reached with the Italian Interbank Deposit Protection Fund, on 21
December 2017, Crédit Agricole Cariparma acquired 95% of the share capital of the Cesena, Rimini
and San Miniato savings banks for €130 million. Following receipt of all regulatory clearance, these
entities were fully consolidated in the financial statements as of 31 December 2017.
In order to fund this deal, on 21 December 2017 Crédit Agricole Cariparma carried out a €320
million capital increase to which Crédit Agricole S.A. subscribed for €256 million.
In accordance with IFRS 3 (Revised), the post-combination balance sheets of these three banks,
as of 21 December 2017, reflect the fair value of the assets acquired and liabilities assumed by the
Group, namely €538 million. On this basis, Badwill totalling €408 million was recognised under
"Change in value of goodwill" in the income statement.
The work to identify, classify and measure the assets and liabilities of the companies acquired may
be finalised within twelve months of the acquisition.
The contribution of these three banks to the Group's consolidated net income and the net income
of the combined entity, excluding the impact of Badwill, is not material.
Acquisition by Crédit Agricole S.A. of the 15% stake in CACEIS held by Natixis
On 22 December 2017, Crédit Agricole S.A. Group completed the €380 million acquisition of the
15% stake held by Natixis in CACEIS, its asset servicing subsidiary, which it now owns outright.
Under IFRS 3 (Revised), changes in an equity interest in a fully consolidated entity, without taking
control, are recognised in equity. The transaction reduced Consolidated reserves by €144 million
and Non-controlling interests by €236 million.
In millions of eurosContribution of Pioneer Investments
since the acquisition
Impact as if the Pioneer
Investments had been acquired
at the beginning of the 2017
REVENUES 408 19 060
NET INCOME 106 4 343
Consolidated financial statements of Crédit Agricole S.A. – 31 December 2017
72
Additional acquisition of Icade shares
An Icade shareholder since 2013, Crédit Agricole Assurances increased its 5.6% holding on 19
June 2017 by buying out Groupama’s 12.9% stake in the company for a consideration of €715
million.
The transaction is in line with the Insurance business’ policy of taking minority stakes in listed
property companies. Icade is a property development and investment company that owns tertiary
sector property and healthcare facilities and is also involved in office and residential property
development when favourable market conditions arise. Icade is a major player of the Grand Paris
project and in other major French cities.
As a result of the transaction, Crédit Agricole Assurances is now Icade’s second-largest
shareholder. Accordingly, Icade’s shareholding structure is as follows: 39% held by Caisse des
Dépôts et Consignations and 18.5% by Crédit Agricole Assurances, with a free float of 42.5%.
The equity investment in Icade, recognised in Investments in equity-accounted entities, was valued
at €966 million at 31 December 2017.
Disposal by Crédit Agricole S.A. of its stake in Eurazeo
On 16 June 2017, Crédit Agricole S.A. sold its entire stake in Eurazeo, representing 15.42% of the company’s capital, to the Decaux family’s investment company, JCDecaux Holding, for a total of €790.5 million. In parallel, Crédit Agricole S.A. set up a mechanism which offsets the impact of fluctuations in the price of Eurazeo shares, used as collateral for the Crédit Agricole S.A. bonds exchangeable for Eurazeo shares issued in September 2016. The impact of this transaction on Crédit Agricole S.A.’s net income Group share at 31 December 2017 was +€100 million, including+ €103million recognised in Share of net income of equity-accounted entities, the residual amount corresponding to disposal fees net of tax.
Disposal by Crédit Agricole CIB of its stake in Banque Saudi Fransi
On 20 September 2017, of the 31.1% of Banque Saudi Fransi securities held, Cacib sold 16.2% to
Kingdom Holding Company (KHC) for €1.3 billion. This sale led to a significant loss of influence and
the securities retained were remeasured at fair value as part of their reclassification as available-
for-sale securities.
The impact of this disposal and the remeasurement of the shares that were retained, net of related
Saudi and French taxes, amounted to €102 million, recognised under Share of net income of equity-
accounted entities, or €101 million in Net income Group share as at 31 December 2017.
Consolidated financial statements of Crédit Agricole S.A. – 31 December 2017
73
Disposal by Crédit Agricole Assurances of its stake in Eurosic
Prior to the transaction, Crédit Agricole Assurances owned 18.3% of the share capital of Eurosic
and €70 million in Eurosic subordinated bonds redeemable in shares (OSRA) issued in 2015 and
2016. Eurosic was accounted for under the equity-method in the financial statements of Crédit
Agricole S.A. Group. CAA also held 13.2% of the share capital of Gecina, which was not
consolidated.
On 29 August 2017, Crédit Agricole S.A. Group sold 88% of its shares and 100% of its Eurosic
OSRA to Genica for €505 million at a price of €51 per share and per OSRA. On 1 November 2017,
the Group sold its remaining securities for €54 million.
In light of the recognition of net income of equity-accounted entities in the Insurance business as
Revenues, the disposal and remeasurement of Eurosic shares generated a consolidated capital
gain of +€19.7 million net of policyholders’ profit sharing and net of tax. The disposal of the Eurosic
OSRA generated a capital gain of €2.4 million net of policyholders' profit sharing and net of tax.
Sale of CARE
CARE, Crédit Agricole S.A.Group’s reinsurance company based in Luxembourg and wholly owned
by Crédit Agricole Assurances, was classified in Held-for-sale and discontinued operations in the
fourth quarter of 2016.
Its sale on 18 May 2017 for a consideration of €186 million generated a capital gain on disposal of
€30 million, recognised in Net income from discontinued or held-for-sale operations in the
consolidated financial statements at 31 December 2017.
Proposed sale of Banque Themis (IFRS 5)
On 22 June 2017, LCL received a firm offer for the sale of Banque Themis, which is consolidated
at 95% by Crédit Agricole S.A. group. This offer is currently before the European supervisory
authorities.
In light of the binding offer received, the contribution of Banque Themis to the consolidated financial
statements at 31 December 2017 is accounted for in accordance with IFRS 5 on entities held for
sale: the balance sheet items are transferred to special headings, namely €156 million under Non-
current assets held for sale and discontinued operations and €120 million under Liabilities
associated with non-current assets held for sale and discontinued operations. No unrealised loss
on disposal is expected.
Proposed sale of Forso Nordic AB (IFRS 5)
Crédit Agricole Consumer Finance (CACF) and SARACEN HOLDCO AB (HoldCo AB), a holding
company wholly owned by FCE (FORD), signed a partnership on 30 June 2008 covering automotive
financing activities in Sweden, Denmark, Norway and Finland through a joint venture, Forso Nordic
AB, owned 50:50 by HoldCo AB and CACF.
Consolidated financial statements of Crédit Agricole S.A. – 31 December 2017
74
In a registered letter dated 29 May 2017, CACF decided to terminate the agreement, effective from
31 August 2018. On 23 August 2017, HoldCo AB exercised its call option over the shares held by
CACF. The exercise of this call option represents a binding and irrevocable promise to buy out all
of CACF's stake.
With the conditions for applying IFRS 5 satisfied and the disposal being treated as discontinued
operations, the value of the Forso stake was transferred to a separate balance sheet line under
Non-current assets held for sale and discontinued operations for €69 million and net income
transferred to Net income from discontinued or held-for-sale operations for -€1 million. An
unrealised capital loss on disposal of -€15 million was recognised under the same heading in the
consolidated financial statements as of 31 December 2017.
2.3 Impairment losses on goodwill International retail banking - Poland CGU
Impairment testing on goodwill resulted in the write-off of the value of the International retail
banking – Poland CGU.
This impairment reflects the significant deterioration in the anticipated financial outlook for CA
Polska against the background of an adverse regulatory, competitive and interest rate
environment that is lasting longer than previously envisaged.
This impairment impacts Net income Group share by €222 million without affecting the Group's
solvency ratio, goodwill being fully deducted, or liquidity, the impairment charge being non-cash in
nature, or the dividend policy of Crédit Agricole S.A. Group.
2.4 Home purchase savings schemes provision
The Home purchase savings schemes provision at 31 December 2017 was impacted by the change
in some models. The extension to 18 years of the run-off model for the Home purchase savings
plan led to a €125 million reversal, while the change in calculation method for the savings reference
rate resulted in a €29 million reversal.
2.5 Cheque Image Exchange litigation
In its ruling handed down on 21 December 2017, the Paris Court of Appeal confirmed a decision by
the French Competition Authority (Autorité de la Concurrence - ADLC), which fined the main French
banks in 2010 for colluding to fix the prices and conditions for clearing cheques. In the wake of that
ruling, the fine owed by Crédit Agricole Group amounts to €97.5 million.
Following allocation of this fine to the companies in the Group, the impact for Crédit Agricole S.A.
Group is -€59.2 million recognised under Revenues.
Consolidated financial statements of Crédit Agricole S.A. – 31 December 2017
75
2.6 Consequences of early redemption of macro-hedged loans
Crédit Agricole S.A. group has performed a detailed analysis of its macro-hedging to take into
account the low interest rate environment as well as the impact of early repayments and home loan
renegotiations.
The persistence of low rates and the volume of early repayment and renegotiation requests
observed during the first half of 2017 led the Group to review the calculation assumptions set for
the coming years to determine the impacts on its over-hedging position.
In light of this, a -€2 million impact was recognised in Revenues at 31 December 2017,
corresponding to the derecognition of the revaluation of the loan book, initially covered, which was
repaid, and the inefficiency relative to the redesignation of hedging instruments.
2.7 Optimising the debt of the Crédit Agricole S.A. group
On 15 May 2017, Crédit Agricole S.A. simultaneous launched buy back offers in cash in respect of
6 outstanding undated deeply subordinated debt instruments to optimise its own equity structure
and at the same time that of the Credit Agricole Group.
The transaction was conducted between 23 May and 16 June 2017 for a nominal amount of
€1,2 billion.
Net of the hedging effect, these redemptions generated income of €39 million before tax in the
financial statements at 31 December 2017.
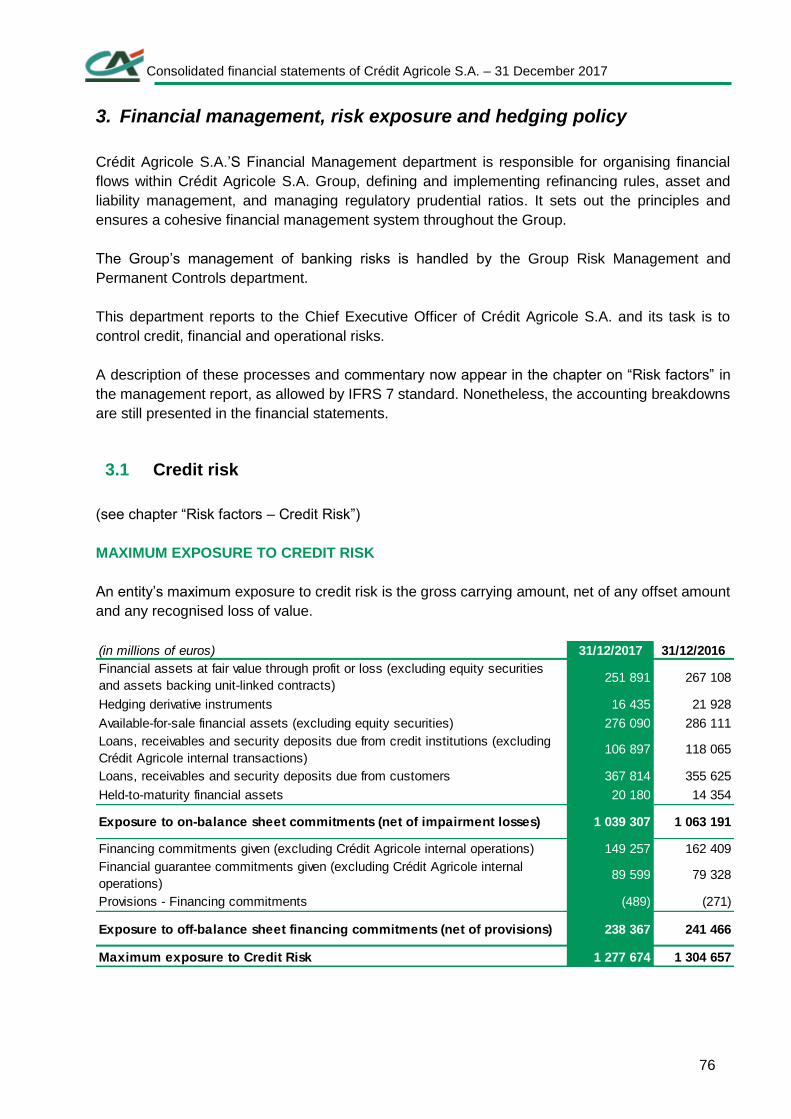
Consolidated financial statements of Crédit Agricole S.A. – 31 December 2017
76
3. Financial management, risk exposure and hedging policy
Crédit Agricole S.A.’S Financial Management department is responsible for organising financial
flows within Crédit Agricole S.A. Group, defining and implementing refinancing rules, asset and
liability management, and managing regulatory prudential ratios. It sets out the principles and
ensures a cohesive financial management system throughout the Group.
The Group’s management of banking risks is handled by the Group Risk Management and
Permanent Controls department.
This department reports to the Chief Executive Officer of Crédit Agricole S.A. and its task is to
control credit, financial and operational risks.
A description of these processes and commentary now appear in the chapter on “Risk factors” in
the management report, as allowed by IFRS 7 standard. Nonetheless, the accounting breakdowns
are still presented in the financial statements.
3.1 Credit risk
(see chapter “Risk factors – Credit Risk”)
MAXIMUM EXPOSURE TO CREDIT RISK
An entity’s maximum exposure to credit risk is the gross carrying amount, net of any offset amount
and any recognised loss of value.
(in millions of euros) 31/12/2017 31/12/2016
Financial assets at fair value through profit or loss (excluding equity securities
and assets backing unit-linked contracts) 251 891 267 108
Hedging derivative instruments 16 435 21 928
Available-for-sale financial assets (excluding equity securities) 276 090 286 111
Loans, receivables and security deposits due from credit institutions (excluding
Crédit Agricole internal transactions)106 897 118 065
Loans, receivables and security deposits due from customers 367 814 355 625
Held-to-maturity financial assets 20 180 14 354
Exposure to on-balance sheet commitments (net of impairment losses) 1 039 307 1 063 191
Financing commitments given (excluding Crédit Agricole internal operations) 149 257 162 409
Financial guarantee commitments given (excluding Crédit Agricole internal
operations)89 599 79 328
Provisions - Financing commitments (489) (271)
Exposure to off-balance sheet financing commitments (net of provisions) 238 367 241 466
Maximum exposure to Credit Risk 1 277 674 1 304 657
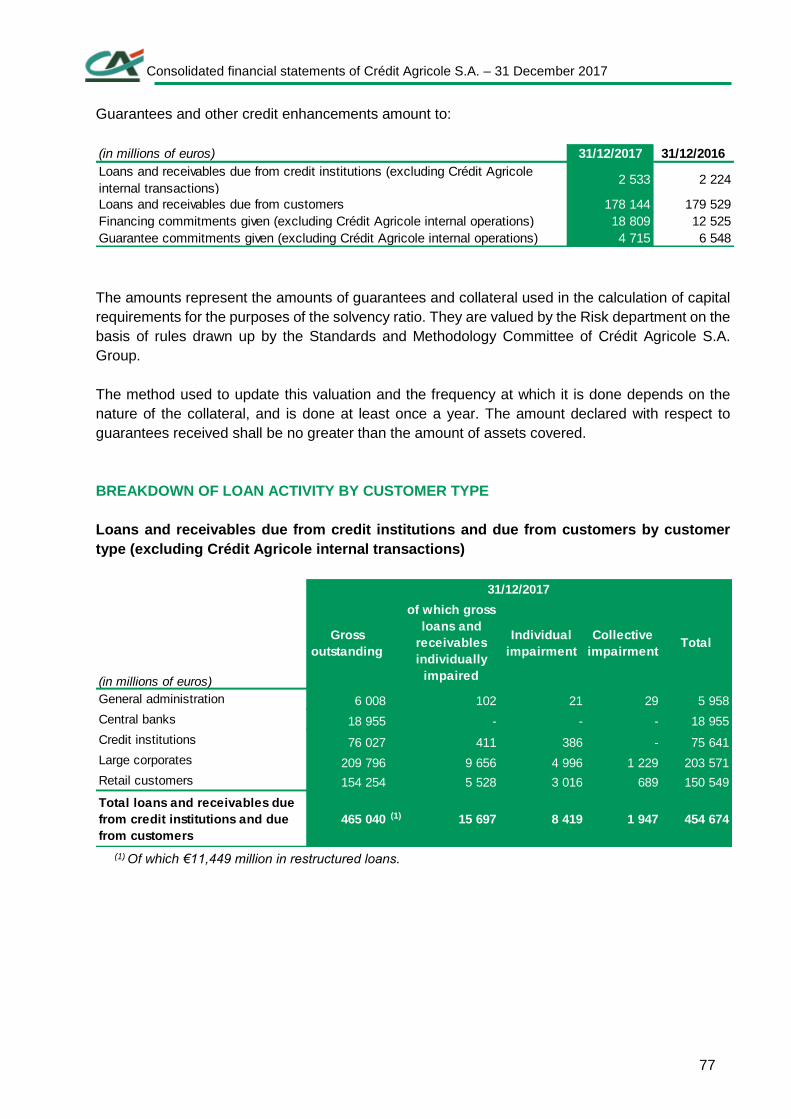
Consolidated financial statements of Crédit Agricole S.A. – 31 December 2017
77
Guarantees and other credit enhancements amount to:
The amounts represent the amounts of guarantees and collateral used in the calculation of capital
requirements for the purposes of the solvency ratio. They are valued by the Risk department on the
basis of rules drawn up by the Standards and Methodology Committee of Crédit Agricole S.A.
Group.
The method used to update this valuation and the frequency at which it is done depends on the
nature of the collateral, and is done at least once a year. The amount declared with respect to
guarantees received shall be no greater than the amount of assets covered.
BREAKDOWN OF LOAN ACTIVITY BY CUSTOMER TYPE
Loans and receivables due from credit institutions and due from customers by customer
type (excluding Crédit Agricole internal transactions)
(1) Of which €11,449 million in restructured loans.
(in millions of euros) 31/12/2017 31/12/2016
Loans and receivables due from credit institutions (excluding Crédit Agricole
internal transactions)2 533 2 224
Loans and receivables due from customers 178 144 179 529
Financing commitments given (excluding Crédit Agricole internal operations) 18 809 12 525
Guarantee commitments given (excluding Crédit Agricole internal operations) 4 715 6 548
6 008 102 21 29 5 958
18 955 - - - 18 955
76 027 411 386 - 75 641
209 796 9 656 4 996 1 229 203 571
154 254 5 528 3 016 689 150 549
465 040 (1) 15 697 8 419 1 947 454 674
Total loans and receivables due
from credit institutions and due
from customers
Retail customers
(in millions of euros)
31/12/2017
Gross
outstanding
of which gross
loans and
receivables
individually
impaired
Individual
impairment
Collective
impairmentTotal
General administration
Central banks
Credit institutions
Large corporates
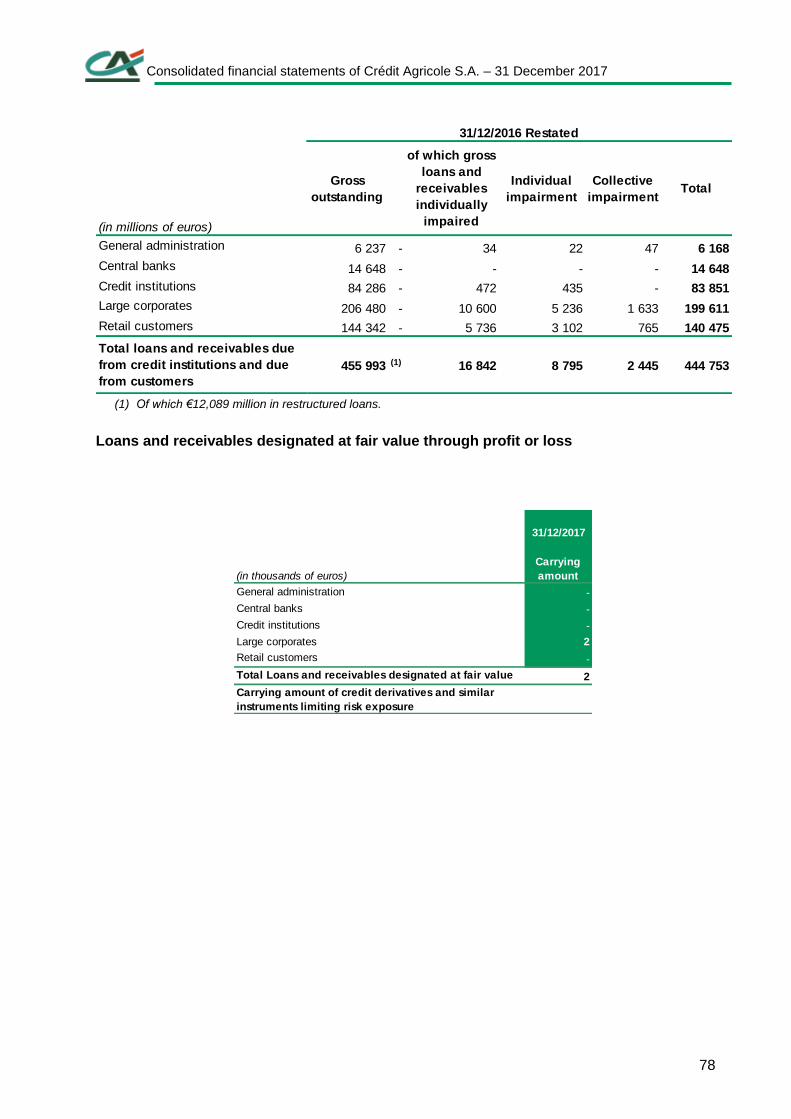
Consolidated financial statements of Crédit Agricole S.A. – 31 December 2017
78
(1) Of which €12,089 million in restructured loans.
Loans and receivables designated at fair value through profit or loss
6 237 - 34 22 47 6 168
14 648 - - - - 14 648
84 286 - 472 435 - 83 851
206 480 - 10 600 5 236 1 633 199 611
144 342 - 5 736 3 102 765 140 475
455 993 (1) 16 842 8 795 2 445 444 753
General administration
Central banks
Credit institutions
Total loans and receivables due
from credit institutions and due
from customers
Large corporates
Retail customers
(in millions of euros)
31/12/2016 Restated
Gross
outstanding
of which gross
loans and
receivables
individually
impaired
Individual
impairment
Collective
impairmentTotal
31/12/2017
Carrying
amount
General administration -
Central banks -
Credit institutions -
Large corporates 2
Retail customers -
Total Loans and receivables designated at fair value 2
Carrying amount of credit derivatives and similar
instruments limiting risk exposure
(in thousands of euros)
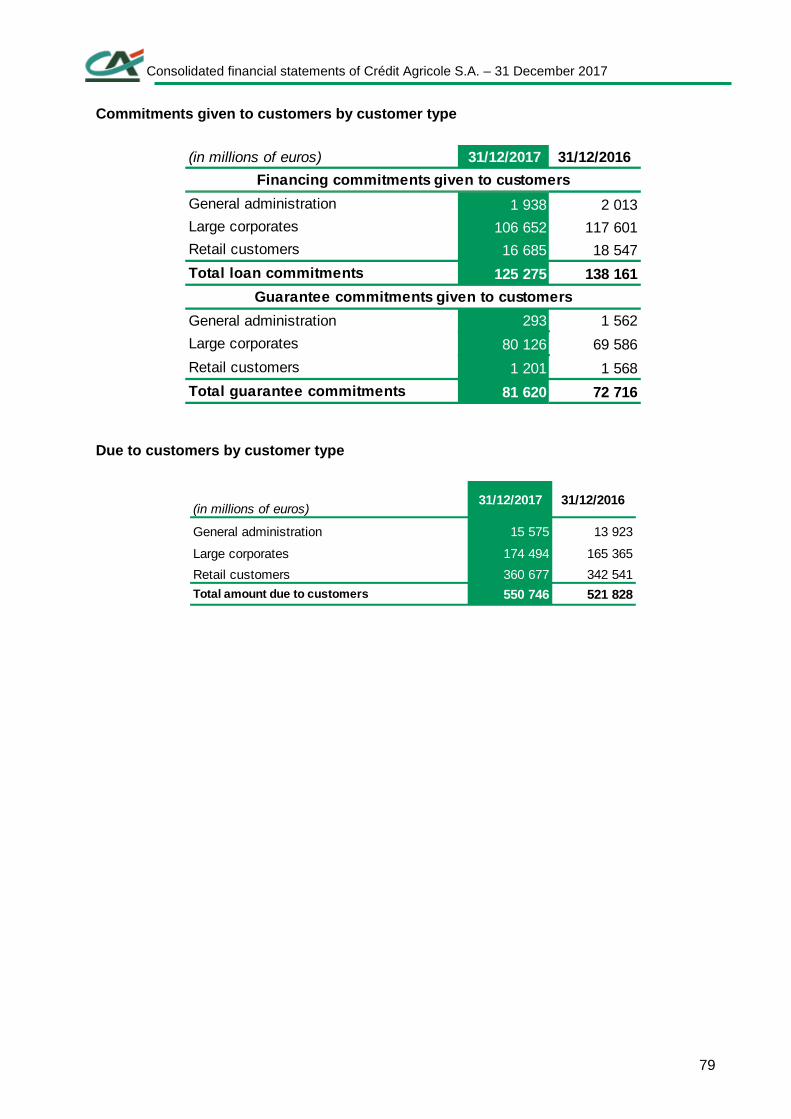
Consolidated financial statements of Crédit Agricole S.A. – 31 December 2017
79
Commitments given to customers by customer type
Due to customers by customer type
(in millions of euros) 31/12/2017 31/12/2016
1 938 2 013
106 652 117 601
16 685 18 547
125 275 138 161
293 1 562
80 126 69 586
1 201 1 568
81 620 72 716
General administration
Large corporates
Retail customers
Total guarantee commitments
Financing commitments given to customers
General administration
Large corporates
Retail customers
Total loan commitments
Guarantee commitments given to customers
(in millions of euros)31/12/2017 31/12/2016
15 575 13 923
174 494 165 365
360 677 342 541
550 746 521 828
General administration
Large corporates
Retail customers
Total amount due to customers
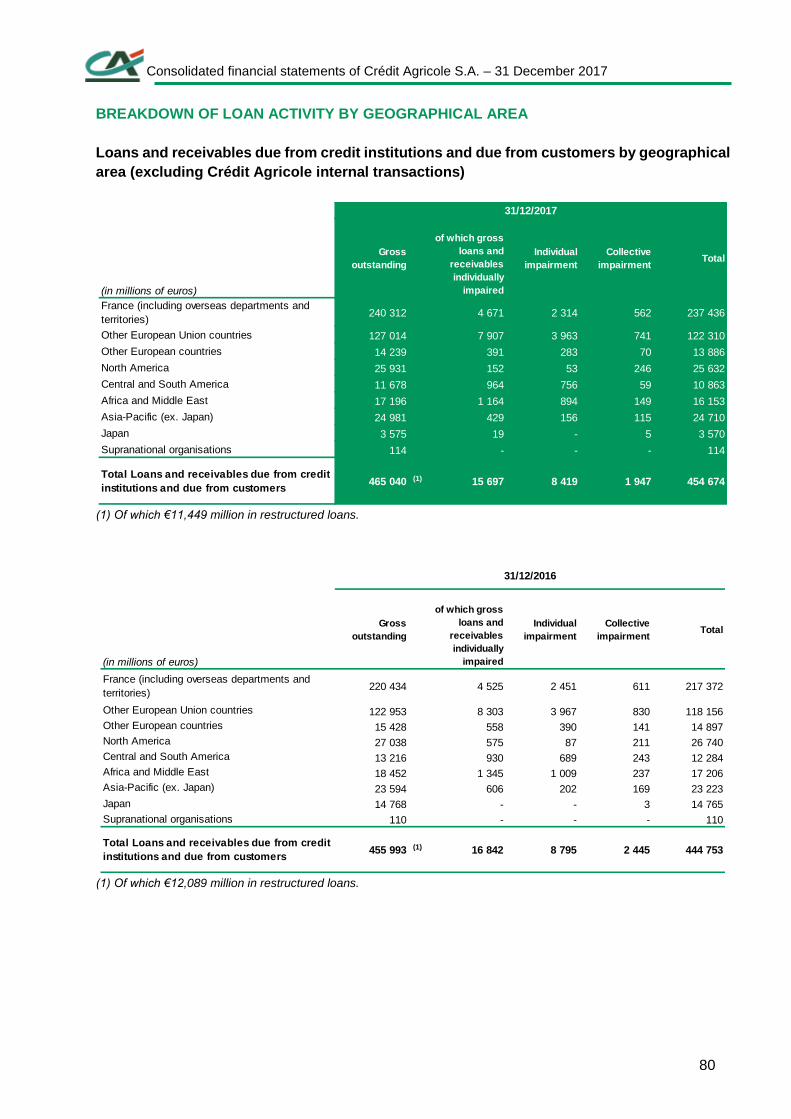
Consolidated financial statements of Crédit Agricole S.A. – 31 December 2017
80
BREAKDOWN OF LOAN ACTIVITY BY GEOGRAPHICAL AREA
Loans and receivables due from credit institutions and due from customers by geographical
area (excluding Crédit Agricole internal transactions)
(1) Of which €11,449 million in restructured loans.
(1) Of which €12,089 million in restructured loans.
Gross
outstanding
of which gross
loans and
receivables
individually
impaired
Individual
impairment
Collective
impairmentTotal
240 312 4 671 2 314 562 237 436
127 014 7 907 3 963 741 122 310
14 239 391 283 70 13 886
25 931 152 53 246 25 632
11 678 964 756 59 10 863
17 196 1 164 894 149 16 153
24 981 429 156 115 24 710
Japan 3 575 19 - 5 3 570
114 - - - 114
465 040 (1) 15 697 8 419 1 947 454 674
(in millions of euros)
31/12/2017
France (including overseas departments and
territories)
Other European Union countries
Other European countries
North America
Central and South America
Africa and Middle East
Asia-Pacific (ex. Japan)
Supranational organisations
Total Loans and receivables due from credit
institutions and due from customers
Gross
outstanding
of which gross
loans and
receivables
individually
impaired
Individual
impairment
Collective
impairmentTotal
220 434 4 525 2 451 611 217 372
122 953 8 303 3 967 830 118 156
15 428 558 390 141 14 897
27 038 575 87 211 26 740
13 216 930 689 243 12 284
18 452 1 345 1 009 237 17 206
23 594 606 202 169 23 223
Japan 14 768 - - 3 14 765
110 - - - 110
455 993 (1) 16 842 8 795 2 445 444 753Total Loans and receivables due from credit
institutions and due from customers
Supranational organisations
(in millions of euros)
31/12/2016
France (including overseas departments and
territories)
Other European Union countries
Other European countries
North America
Central and South America
Africa and Middle East
Asia-Pacific (ex. Japan)
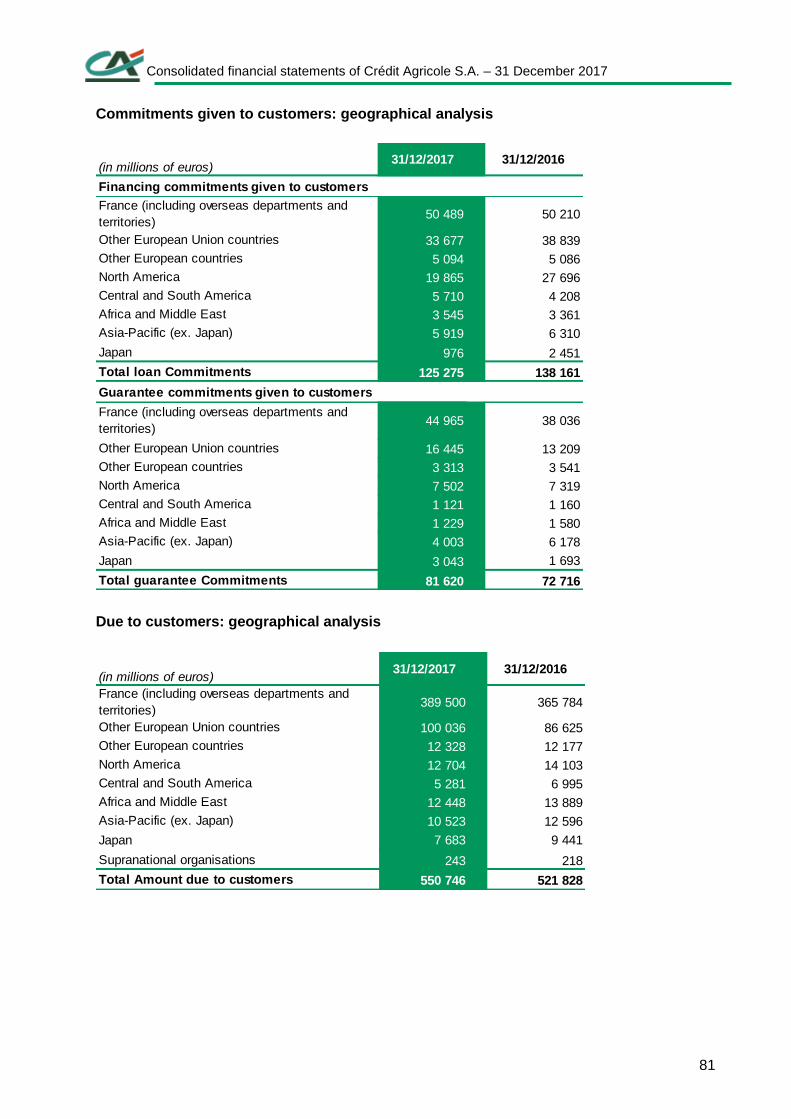
Consolidated financial statements of Crédit Agricole S.A. – 31 December 2017
81
Commitments given to customers: geographical analysis
Due to customers: geographical analysis
(in millions of euros)31/12/2017 31/12/2016
Financing commitments given to customers
50 489 50 210
33 677 38 839
5 094 5 086
19 865 27 696
5 710 4 208
3 545 3 361
5 919 6 310
Japan 976 2 451
125 275 138 161
Guarantee commitments given to customers
44 965 38 036
16 445 13 209
3 313 3 541
7 502 7 319
1 121 1 160
1 229 1 580
4 003 6 178
Japan 3 043 1 693
81 620 72 716
France (including overseas departments and
territories)
Other European Union countries
Other European countries
North America
Central and South America
Africa and Middle East
Asia-Pacific (ex. Japan)
Total guarantee Commitments
Total loan Commitments
France (including overseas departments and
territories)
Other European Union countries
Other European countries
North America
Central and South America
Africa and Middle East
Asia-Pacific (ex. Japan)
(in millions of euros)31/12/2017 31/12/2016
389 500 365 784
100 036 86 625
12 328 12 177
12 704 14 103
5 281 6 995
12 448 13 889
10 523 12 596
Japan 7 683 9 441
Supranational organisations 243 218
550 746 521 828
Central and South America
Africa and Middle East
Asia-Pacific (ex. Japan)
Total Amount due to customers
North America
France (including overseas departments and
territories)
Other European Union countries
Other European countries
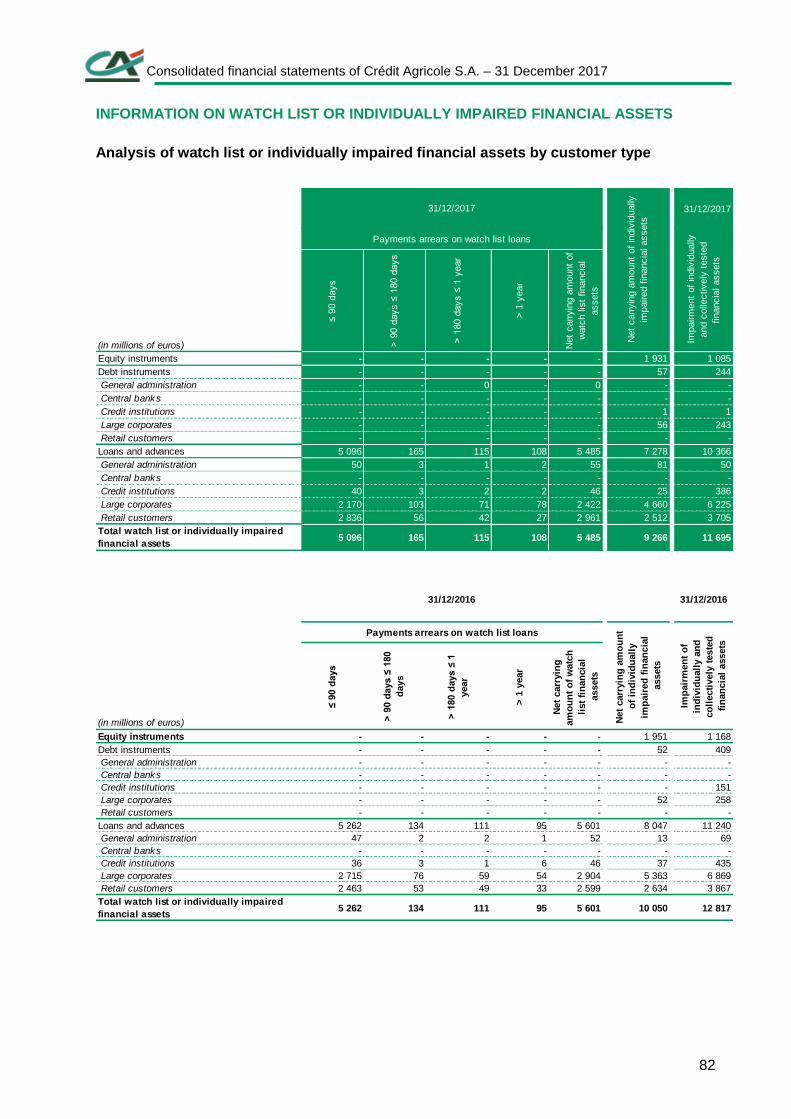
Consolidated financial statements of Crédit Agricole S.A. – 31 December 2017
82
INFORMATION ON WATCH LIST OR INDIVIDUALLY IMPAIRED FINANCIAL ASSETS
Analysis of watch list or individually impaired financial assets by customer type
31/12/2017
≤ 9
0 d
ays
> 9
0 d
ays ≤
180 d
ays
> 1
80 d
ays ≤
1 y
ear
> 1
year
Net
carr
yin
g a
mount
of
watc
h lis
t financia
l
assets
Equity instruments - - - - - 1 931 1 085
Debt instruments - - - - - 57 244
General administration - - 0 - 0 - -
Central banks - - - - - - -
Credit institutions - - - - - 1 1
Large corporates - - - - - 56 243
Retail customers - - - - - - -
Loans and advances 5 096 165 115 108 5 485 7 278 10 366
General administration 50 3 1 2 55 81 50
Central banks - - - - - - -
Credit institutions 40 3 2 2 46 25 386
Large corporates 2 170 103 71 78 2 422 4 660 6 225
Retail customers 2 836 56 42 27 2 961 2 512 3 705
5 096 165 115 108 5 485 9 266 11 695Total watch list or individually impaired
financial assets
31/12/2017
Net
carr
yin
g a
mount
of
indiv
idually
impaired f
inancia
l assets
Payments arrears on watch list loans
Impairm
ent
of
indiv
idually
and c
olle
ctively
teste
d
financia
l assets
(in millions of euros)
31/12/2016
≤ 9
0 d
ays
> 9
0 d
ays ≤
180
days
> 1
80 d
ays ≤
1
year
> 1
year
Net
carr
yin
g
am
ou
nt
of
watc
h
list
fin
an
cia
l
assets
Equity instruments - - - - - 1 951 1 168
Debt instruments - - - - - 52 409
General administration - - - - - - -
Central banks - - - - - - -
Credit institutions - - - - - - 151
Large corporates - - - - - 52 258
Retail customers - - - - - - -
Loans and advances 5 262 134 111 95 5 601 8 047 11 240
General administration 47 2 2 1 52 13 69
Central banks - - - - - - -
Credit institutions 36 3 1 6 46 37 435
Large corporates 2 715 76 59 54 2 904 5 363 6 869
Retail customers 2 463 53 49 33 2 599 2 634 3 867
5 262 134 111 95 5 601 10 050 12 817Total watch list or individually impaired
financial assets
31/12/2016
(in millions of euros)
Payments arrears on watch list loans
Net
carr
yin
g a
mo
un
t
of
ind
ivid
uall
y
imp
air
ed
fin
an
cia
l
assets
Imp
air
men
t o
f
ind
ivid
uall
y a
nd
co
llecti
vely
teste
d
fin
an
cia
l assets
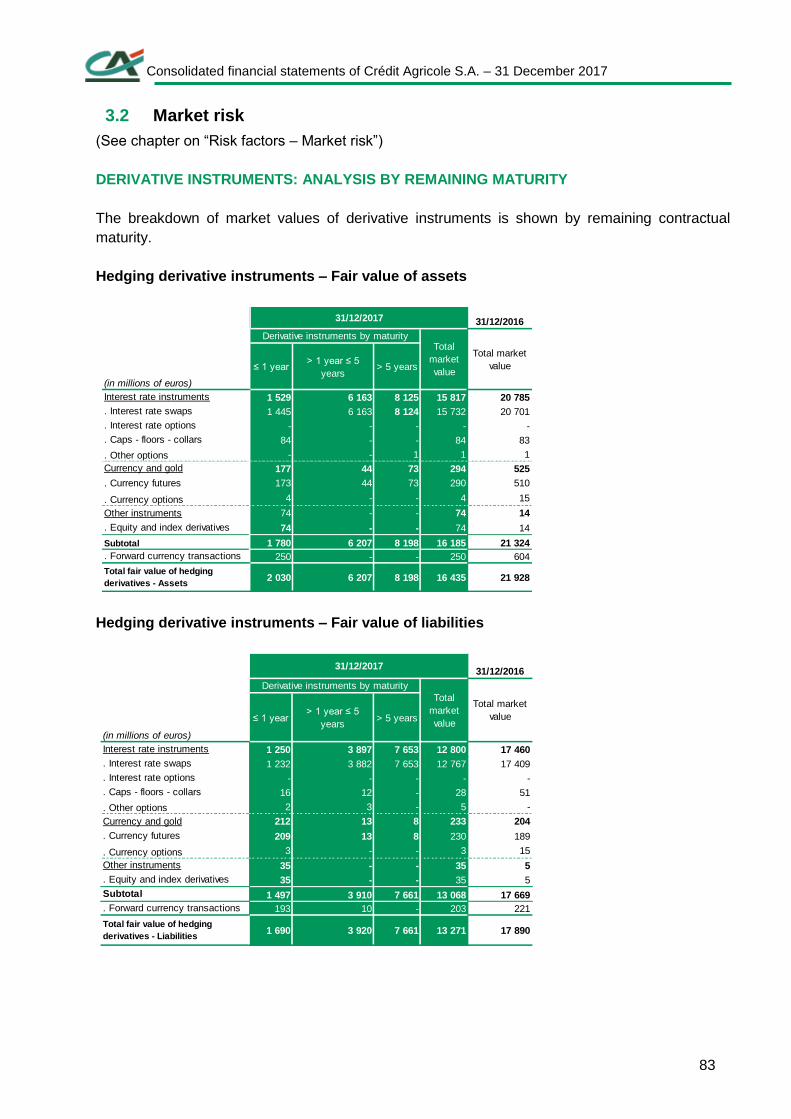
Consolidated financial statements of Crédit Agricole S.A. – 31 December 2017
83
3.2 Market risk
(See chapter on “Risk factors – Market risk”)
DERIVATIVE INSTRUMENTS: ANALYSIS BY REMAINING MATURITY
The breakdown of market values of derivative instruments is shown by remaining contractual
maturity.
Hedging derivative instruments – Fair value of assets
Hedging derivative instruments – Fair value of liabilities
31/12/2016
(in millions of euros)
≤ 1 year > 1 year ≤ 5
years> 5 years
1 529 6 163 8 125 15 817 20 785
1 445 6 163 8 124 15 732 20 701
- - - - -
84 - - 84 83
- - 1 1 1
177 44 73 294 525
173 44 73 290 510
4 - - 4 15
74 - - 74 14
74 - - 74 14
1 780 6 207 8 198 16 185 21 324
250 - - 250 604
2 030 6 207 8 198 16 435 21 928
31/12/2017
. Currency options
Other instruments
. Equity and index derivatives
Subtotal
. Forward currency transactions
Total fair value of hedging
derivatives - Assets
Total market
value
Interest rate instruments
. Currency futures
Derivative instruments by maturityTotal
market
value
. Interest rate swaps
. Interest rate options
. Caps - floors - collars
. Other options
Currency and gold
31/12/2016
(in millions of euros)
≤ 1 year > 1 year ≤ 5
years> 5 years
1 250 3 897 7 653 12 800 17 460
1 232 3 882 7 653 12 767 17 409
- - - - -
16 12 - 28 51
2 3 - 5 -
212 13 8 233 204
209 13 8 230 189
3 - - 3 15
35 - - 35 5
35 - - 35 5
1 497 3 910 7 661 13 068 17 669
193 10 - 203 221
1 690 3 920 7 661 13 271 17 890
31/12/2017
Total fair value of hedging
derivatives - Liabilities
. Forward currency transactions
Interest rate instruments
. Interest rate swaps
. Interest rate options
. Caps - floors - collars
. Other options
Currency and gold
. Currency futures
. Currency options
Other instruments
. Equity and index derivatives
Subtotal
Total market
value
Derivative instruments by maturity
Total
market
value
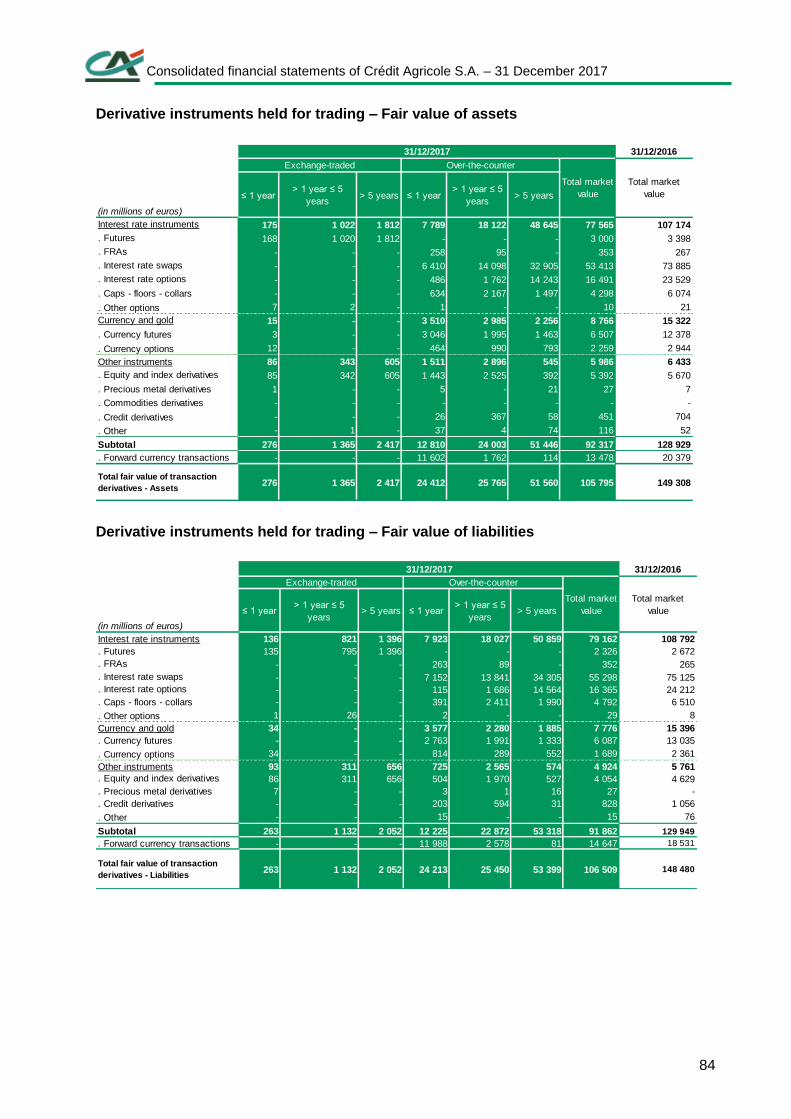
Consolidated financial statements of Crédit Agricole S.A. – 31 December 2017
84
Derivative instruments held for trading – Fair value of assets
Derivative instruments held for trading – Fair value of liabilities
31/12/2016
(in millions of euros)
≤ 1 year > 1 year ≤ 5
years> 5 years ≤ 1 year
> 1 year ≤ 5
years> 5 years
175 1 022 1 812 7 789 18 122 48 645 77 565 107 174
168 1 020 1 812 - - - 3 000 3 398
- - - 258 95 - 353 267
- - - 6 410 14 098 32 905 53 413 73 885
- - - 486 1 762 14 243 16 491 23 529
. Caps - floors - collars - - - 634 2 167 1 497 4 298 6 074
. Other options 7 2 - 1 - - 10 21
15 - - 3 510 2 985 2 256 8 766 15 322
. Currency futures 3 - - 3 046 1 995 1 463 6 507 12 378
. Currency options 12 - - 464 990 793 2 259 2 944
Other instruments 86 343 605 1 511 2 896 545 5 986 6 433
85 342 605 1 443 2 525 392 5 392 5 670
. Precious metal derivatives 1 - - 5 - 21 27 7
. Commodities derivatives - - - - - - - -
. Credit derivatives - - - 26 367 58 451 704
. Other - 1 - 37 4 74 116 52
276 1 365 2 417 12 810 24 003 51 446 92 317 128 929
. Forward currency transactions - - - 11 602 1 762 114 13 478 20 379
276 1 365 2 417 24 412 25 765 51 560 105 795 149 308
Currency and gold
. Equity and index derivatives
Subtotal
Total fair value of transaction
derivatives - Assets
Total market
value
Interest rate instruments
. Futures
. FRAs
. Interest rate swaps
. Interest rate options
31/12/2017
Exchange-traded Over-the-counter
Total market
value
31/12/2016
(in millions of euros)
≤ 1 year > 1 year ≤ 5
years> 5 years ≤ 1 year
> 1 year ≤ 5
years> 5 years
136 821 1 396 7 923 18 027 50 859 79 162 108 792
135 795 1 396 - - - 2 326 2 672
- - - 263 89 - 352 265
- - - 7 152 13 841 34 305 55 298 75 125
- - - 115 1 686 14 564 16 365 24 212
. Caps - floors - collars - - - 391 2 411 1 990 4 792 6 510
. Other options 1 26 - 2 - - 29 8
34 - - 3 577 2 280 1 885 7 776 15 396
. Currency futures - - - 2 763 1 991 1 333 6 087 13 035
. Currency options 34 - - 814 289 552 1 689 2 361
Other instruments 93 311 656 725 2 565 574 4 924 5 761
86 311 656 504 1 970 527 4 054 4 629
. Precious metal derivatives 7 - - 3 1 16 27 -
. Credit derivatives - - - 203 594 31 828 1 056
. Other - - - 15 - - 15 76
263 1 132 2 052 12 225 22 872 53 318 91 862 129 949
. Forward currency transactions - - - 11 988 2 578 81 14 647 18 531
263 1 132 2 052 24 213 25 450 53 399 106 509 148 480
Interest rate instruments
Total fair value of transaction
derivatives - Liabilities
. FRAs
. Interest rate swaps
. Interest rate options
Currency and gold
. Equity and index derivatives
Subtotal
. Futures
Total market
value
31/12/2017
Exchange-traded Over-the-counter
Total market
value
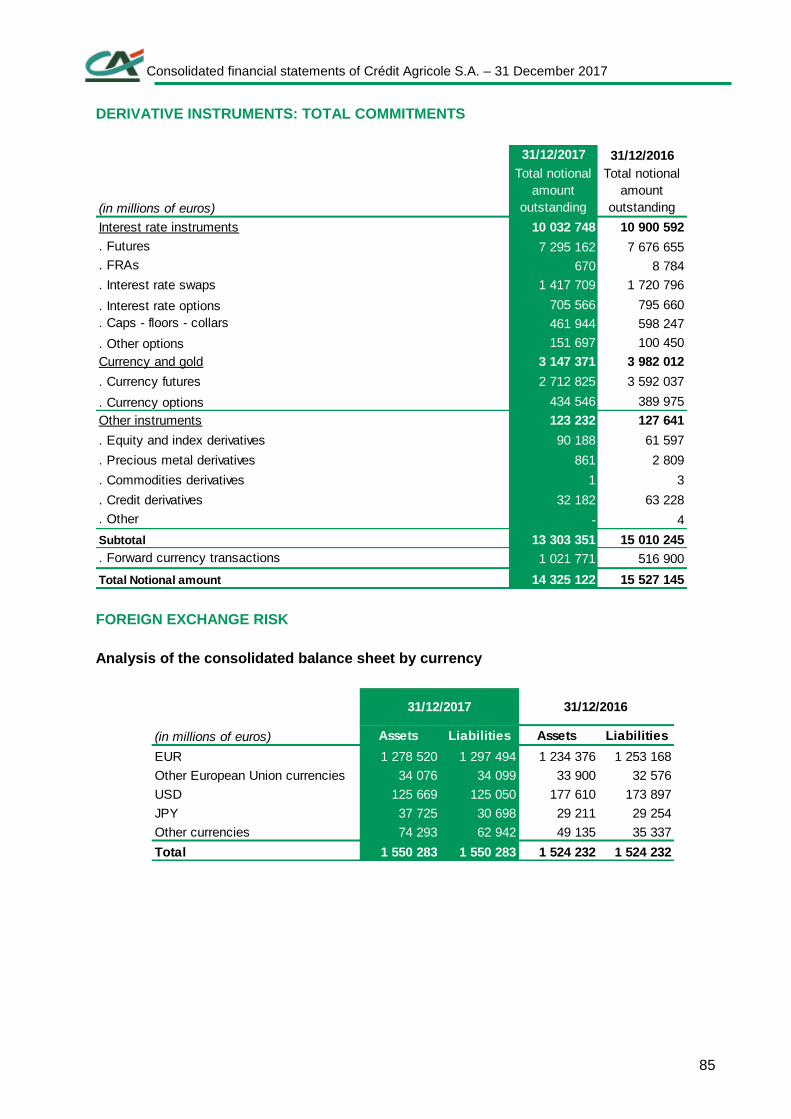
Consolidated financial statements of Crédit Agricole S.A. – 31 December 2017
85
DERIVATIVE INSTRUMENTS: TOTAL COMMITMENTS
FOREIGN EXCHANGE RISK
Analysis of the consolidated balance sheet by currency
31/12/2017 31/12/2016
(in millions of euros)
10 032 748 10 900 592
7 295 162 7 676 655
670 8 784
1 417 709 1 720 796
. Interest rate options 705 566 795 660
461 944 598 247
. Other options 151 697 100 450
3 147 371 3 982 012
2 712 825 3 592 037
434 546 389 975
123 232 127 641
90 188 61 597
861 2 809
1 3
32 182 63 228
- 4
13 303 351 15 010 245
1 021 771 516 900
14 325 122 15 527 145Total Notional amount
. Precious metal derivatives
. Commodities derivatives
. Credit derivatives
. Other
Subtotal
. Forward currency transactions
. Equity and index derivatives
Total notional
amount
outstanding
Total notional
amount
outstanding
Interest rate instruments
. Futures
. FRAs
. Interest rate swaps
. Caps - floors - collars
Currency and gold
. Currency futures
. Currency options
Other instruments
Assets Liabilities Assets Liabilities
EUR 1 278 520 1 297 494 1 234 376 1 253 168
34 076 34 099 33 900 32 576
USD 125 669 125 050 177 610 173 897
JPY 37 725 30 698 29 211 29 254
74 293 62 942 49 135 35 337
1 550 283 1 550 283 1 524 232 1 524 232Total
(in millions of euros)
31/12/2017 31/12/2016
Other European Union currencies
Other currencies
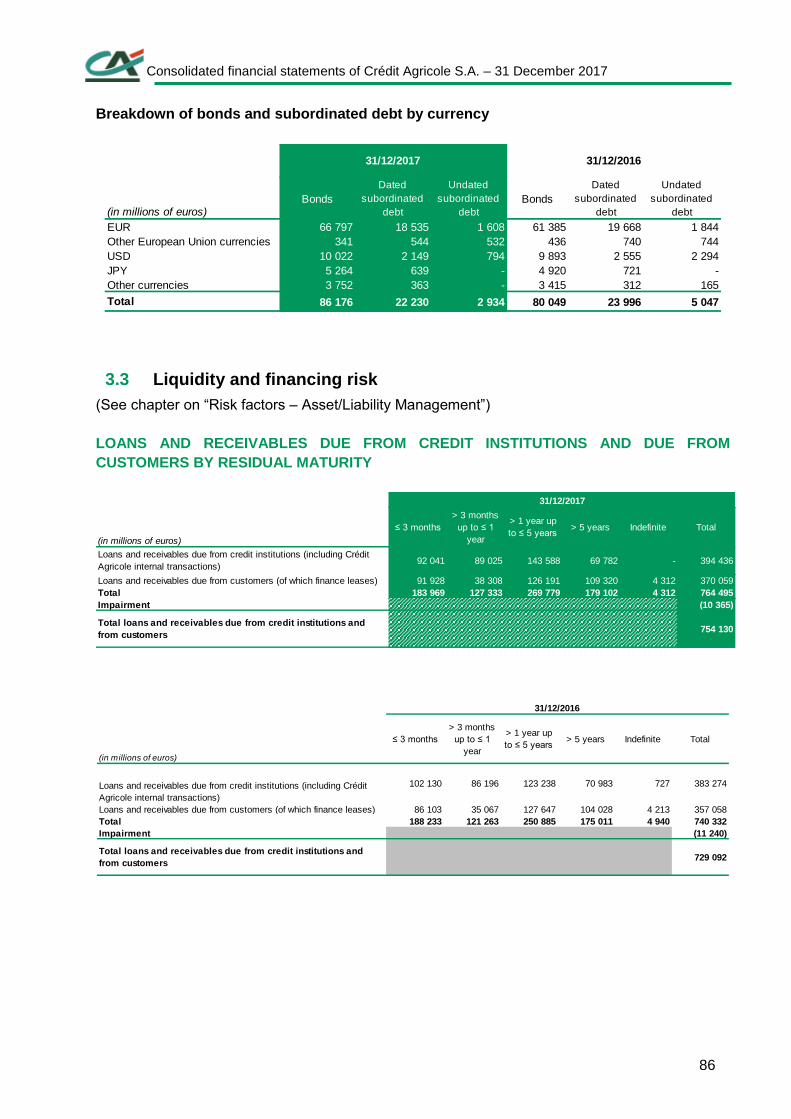
Consolidated financial statements of Crédit Agricole S.A. – 31 December 2017
86
Breakdown of bonds and subordinated debt by currency
3.3 Liquidity and financing risk
(See chapter on “Risk factors – Asset/Liability Management”)
LOANS AND RECEIVABLES DUE FROM CREDIT INSTITUTIONS AND DUE FROM
CUSTOMERS BY RESIDUAL MATURITY
Bonds
Dated
subordinated
debt
Undated
subordinated
debt
Bonds
Dated
subordinated
debt
Undated
subordinated
debt
66 797 18 535 1 608 61 385 19 668 1 844
341 544 532 436 740 744
10 022 2 149 794 9 893 2 555 2 294
5 264 639 - 4 920 721 -
3 752 363 - 3 415 312 165
86 176 22 230 2 934 80 049 23 996 5 047
JPY
Other currencies
Total
(in millions of euros)
31/12/2017 31/12/2016
EUR
Other European Union currencies
USD
92 041 89 025 143 588 69 782 - 394 436
91 928 38 308 126 191 109 320 4 312 370 059
183 969 127 333 269 779 179 102 4 312 764 495
(10 365)
754 130
Impairment
Total loans and receivables due from credit institutions and
from customers
Total
(in millions of euros)
31/12/2017
≤ 3 months
> 3 months
up to ≤ 1
year
> 1 year up
to ≤ 5 years> 5 years Indefinite Total
Loans and receivables due from credit institutions (including Crédit
Agricole internal transactions)
Loans and receivables due from customers (of which finance leases)
102 130 86 196 123 238 70 983 727 383 274
86 103 35 067 127 647 104 028 4 213 357 058
188 233 121 263 250 885 175 011 4 940 740 332
(11 240)
729 092Total loans and receivables due from credit institutions and
from customers
Impairment
(in millions of euros)
31/12/2016
≤ 3 months
> 3 months
up to ≤ 1
year
> 1 year up
to ≤ 5 years> 5 years Indefinite Total
Loans and receivables due from credit institutions (including Crédit
Agricole internal transactions)
Loans and receivables due from customers (of which finance leases)
Total
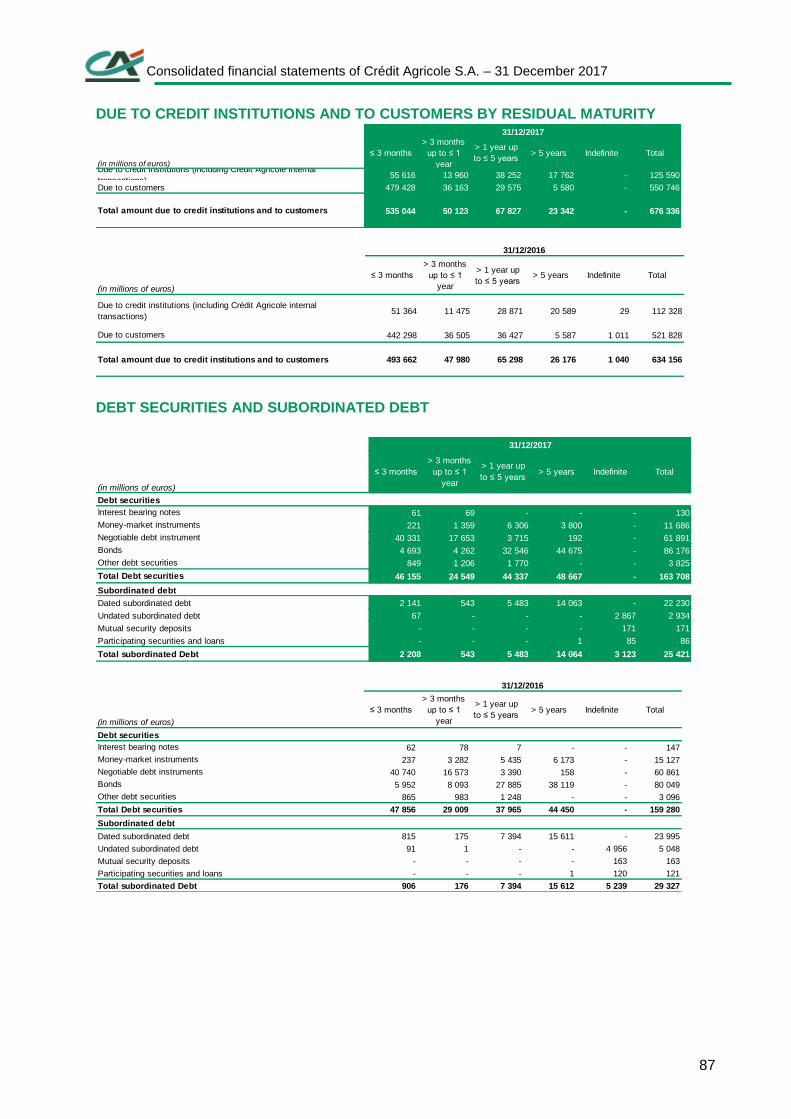
Consolidated financial statements of Crédit Agricole S.A. – 31 December 2017
87
DUE TO CREDIT INSTITUTIONS AND TO CUSTOMERS BY RESIDUAL MATURITY
DEBT SECURITIES AND SUBORDINATED DEBT
55 616 13 960 38 252 17 762 - 125 590
479 428 36 163 29 575 5 580 - 550 746
535 044 50 123 67 827 23 342 - 676 336
(in millions of euros)
31/12/2017
≤ 3 months
> 3 months
up to ≤ 1
year
> 1 year up
to ≤ 5 years> 5 years Indefinite Total
Due to credit institutions (including Crédit Agricole internal
transactions)Due to customers
Total amount due to credit institutions and to customers
51 364 11 475 28 871 20 589 29 112 328
442 298 36 505 36 427 5 587 1 011 521 828
493 662 47 980 65 298 26 176 1 040 634 156
Total
Due to credit institutions (including Crédit Agricole internal
transactions)
Due to customers
Total amount due to credit institutions and to customers
≤ 3 months
> 3 months
up to ≤ 1
year
> 1 year up
to ≤ 5 years> 5 years Indefinite
(in millions of euros)
31/12/2016
Debt securities
61 69 - - - 130
221 1 359 6 306 3 800 - 11 686
40 331 17 653 3 715 192 - 61 891
4 693 4 262 32 546 44 675 - 86 176
849 1 206 1 770 - - 3 825
46 155 24 549 44 337 48 667 - 163 708
Subordinated debt
2 141 543 5 483 14 063 - 22 230
Undated subordinated debt 67 - - - 2 867 2 934
Mutual security deposits - - - - 171 171
Participating securities and loans - - - 1 85 86
2 208 543 5 483 14 064 3 123 25 421
Dated subordinated debt
Total subordinated Debt
Negotiable debt instrument
Bonds
Other debt securities
Total Debt securities
Money-market instruments
(in millions of euros)
31/12/2017
≤ 3 months
> 3 months
up to ≤ 1
year
> 1 year up
to ≤ 5 years> 5 years Indefinite Total
Interest bearing notes
Debt securities
62 78 7 - - 147
237 3 282 5 435 6 173 - 15 127
40 740 16 573 3 390 158 - 60 861
5 952 8 093 27 885 38 119 - 80 049
865 983 1 248 - - 3 096
47 856 29 009 37 965 44 450 - 159 280
Subordinated debt
815 175 7 394 15 611 - 23 995
Undated subordinated debt 91 1 - - 4 956 5 048
Mutual security deposits - - - - 163 163
Participating securities and loans - - - 1 120 121
906 176 7 394 15 612 5 239 29 327
Total Debt securities
Dated subordinated debt
Total subordinated Debt
Interest bearing notes
Money-market instruments
Negotiable debt instruments
Bonds
Other debt securities
(in millions of euros)
31/12/2016
≤ 3 months
> 3 months
up to ≤ 1
year
> 1 year up
to ≤ 5 years> 5 years Indefinite Total
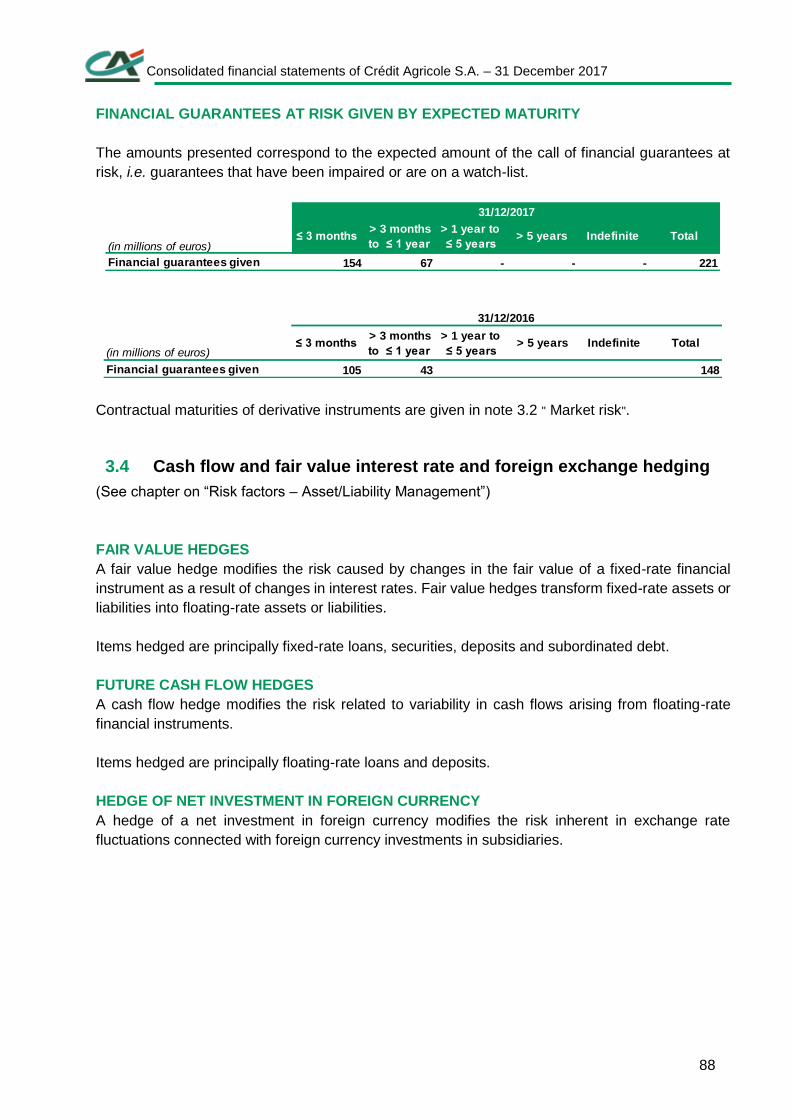
Consolidated financial statements of Crédit Agricole S.A. – 31 December 2017
88
FINANCIAL GUARANTEES AT RISK GIVEN BY EXPECTED MATURITY
The amounts presented correspond to the expected amount of the call of financial guarantees at
risk, i.e. guarantees that have been impaired or are on a watch-list.
Contractual maturities of derivative instruments are given in note 3.2 " Market risk".
3.4 Cash flow and fair value interest rate and foreign exchange hedging
(See chapter on “Risk factors – Asset/Liability Management”)
FAIR VALUE HEDGES
A fair value hedge modifies the risk caused by changes in the fair value of a fixed-rate financial
instrument as a result of changes in interest rates. Fair value hedges transform fixed-rate assets or
liabilities into floating-rate assets or liabilities.
Items hedged are principally fixed-rate loans, securities, deposits and subordinated debt.
FUTURE CASH FLOW HEDGES
A cash flow hedge modifies the risk related to variability in cash flows arising from floating-rate
financial instruments.
Items hedged are principally floating-rate loans and deposits.
HEDGE OF NET INVESTMENT IN FOREIGN CURRENCY
A hedge of a net investment in foreign currency modifies the risk inherent in exchange rate
fluctuations connected with foreign currency investments in subsidiaries.
Financial guarantees given 154 67 - - - 221
(in millions of euros)
31/12/2017
≤ 3 months > 3 months
to ≤ 1 year
> 1 year to
≤ 5 years> 5 years Indefinite Total
Financial guarantees given 105 43 148
(in millions of euros)
31/12/2016
≤ 3 months > 3 months
to ≤ 1 year
> 1 year to
≤ 5 years> 5 years Indefinite Total
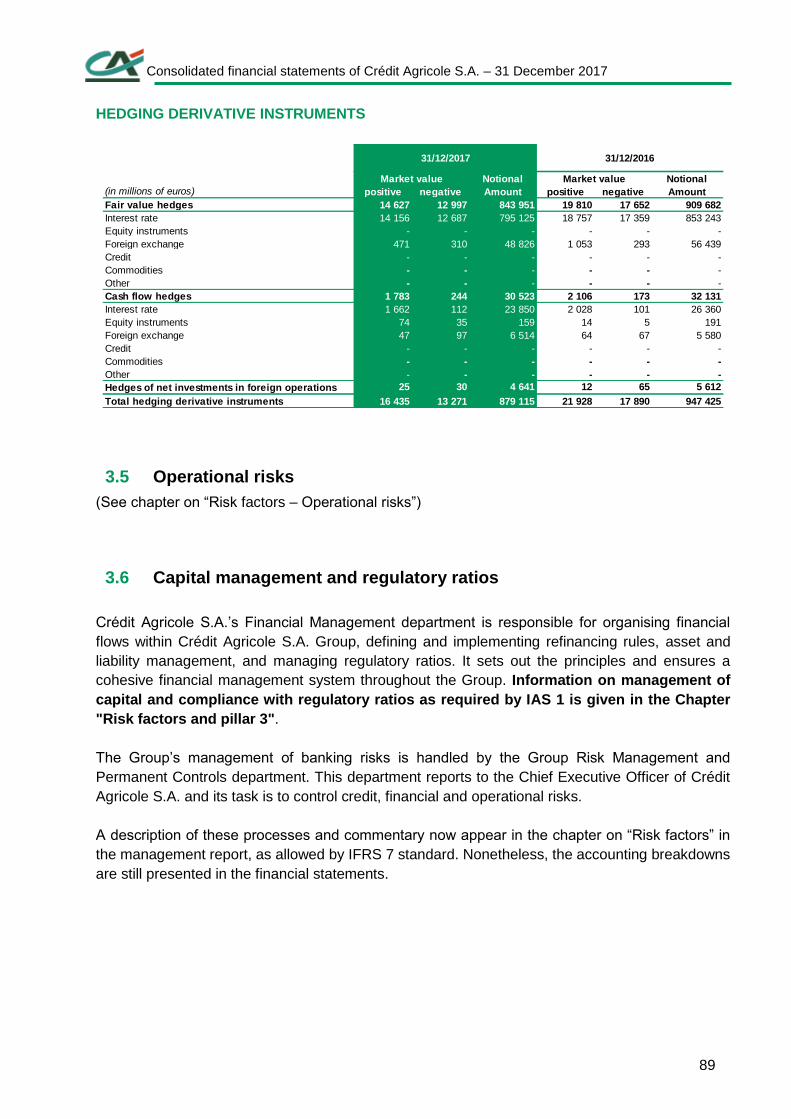
Consolidated financial statements of Crédit Agricole S.A. – 31 December 2017
89
HEDGING DERIVATIVE INSTRUMENTS
3.5 Operational risks
(See chapter on “Risk factors – Operational risks”)
3.6 Capital management and regulatory ratios
Crédit Agricole S.A.’s Financial Management department is responsible for organising financial
flows within Crédit Agricole S.A. Group, defining and implementing refinancing rules, asset and
liability management, and managing regulatory ratios. It sets out the principles and ensures a
cohesive financial management system throughout the Group. Information on management of
capital and compliance with regulatory ratios as required by IAS 1 is given in the Chapter
"Risk factors and pillar 3".
The Group’s management of banking risks is handled by the Group Risk Management and
Permanent Controls department. This department reports to the Chief Executive Officer of Crédit
Agricole S.A. and its task is to control credit, financial and operational risks.
A description of these processes and commentary now appear in the chapter on “Risk factors” in
the management report, as allowed by IFRS 7 standard. Nonetheless, the accounting breakdowns
are still presented in the financial statements.
positive negative positive negative
Fair value hedges 14 627 12 997 843 951 19 810 17 652 909 682
Interest rate 14 156 12 687 795 125 18 757 17 359 853 243
Equity instruments - - - - - -
Foreign exchange 471 310 48 826 1 053 293 56 439
Credit - - - - - -
Commodities - - - - - -
Other - - - - - -
Cash flow hedges 1 783 244 30 523 2 106 173 32 131
Interest rate 1 662 112 23 850 2 028 101 26 360
Equity instruments 74 35 159 14 5 191
Foreign exchange 47 97 6 514 64 67 5 580
Credit - - - - - -
Commodities - - - - - -
Other - - - - - -
Hedges of net investments in foreign operations 25 30 4 641 12 65 5 612
Total hedging derivative instruments 16 435 13 271 879 115 21 928 17 890 947 425
(in millions of euros)
31/12/2017 31/12/2016
Market value Notional
Amount
Market value Notional
Amount
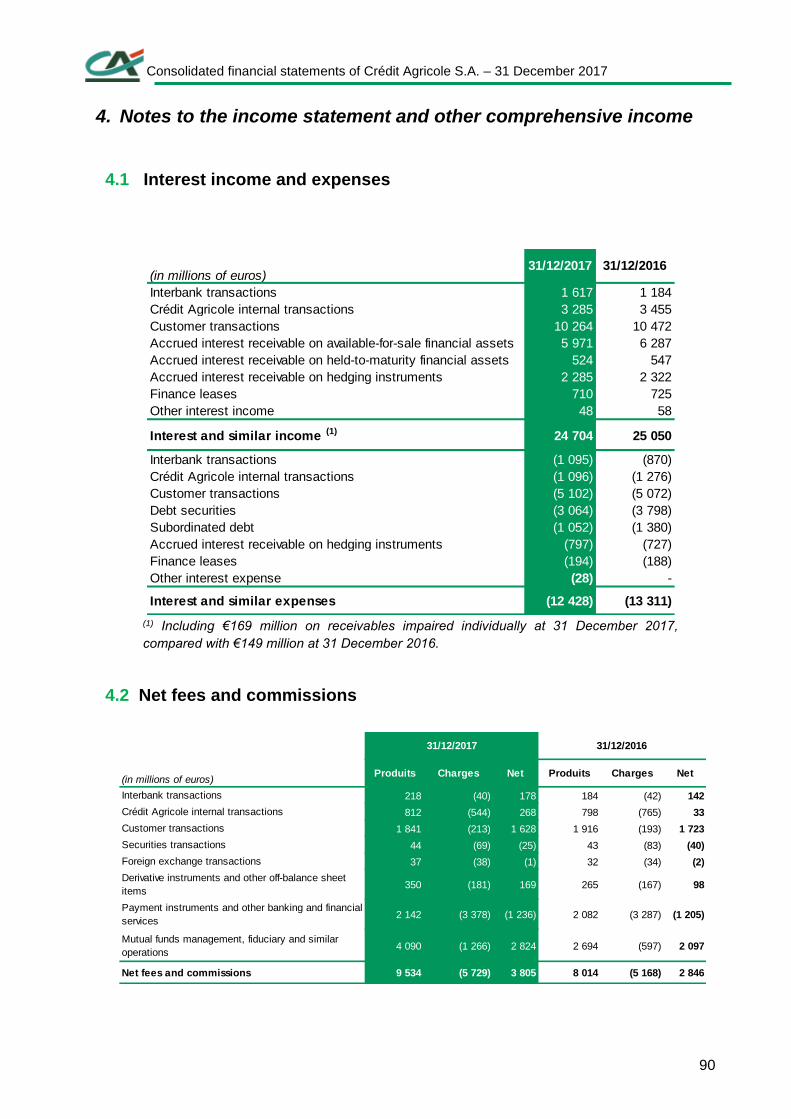
Consolidated financial statements of Crédit Agricole S.A. – 31 December 2017
90
4. Notes to the income statement and other comprehensive income
4.1 Interest income and expenses
(1) Including €169 million on receivables impaired individually at 31 December 2017,
compared with €149 million at 31 December 2016.
4.2 Net fees and commissions
1 617 1 184
3 285 3 455
10 264 10 472
5 971 6 287
524 547
2 285 2 322
710 725
48 58
24 704 25 050
(1 095) (870)
(1 096) (1 276)
(5 102) (5 072)
(3 064) (3 798)
(1 052) (1 380)
(797) (727)
(194) (188)
(28) -
(12 428) (13 311)
31/12/2016
Accrued interest receivable on hedging instruments
(in millions of euros)31/12/2017
Interbank transactions
Crédit Agricole internal transactions
Customer transactions
Accrued interest receivable on available-for-sale financial assets
Accrued interest receivable on held-to-maturity financial assets
Debt securities
Crédit Agricole internal transactions
Customer transactions
Finance leases
Finance leases
Other interest income
Interest and similar income (1)
Interbank transactions
Subordinated debt
Other interest expense
Interest and similar expenses
Accrued interest receivable on hedging instruments
218 (40) 178 184 (42) 142
812 (544) 268 798 (765) 33
1 841 (213) 1 628 1 916 (193) 1 723
44 (69) (25) 43 (83) (40)
37 (38) (1) 32 (34) (2)
350 (181) 169 265 (167) 98
2 142 (3 378) (1 236) 2 082 (3 287) (1 205)
4 090 (1 266) 2 824 2 694 (597) 2 097
9 534 (5 729) 3 805 8 014 (5 168) 2 846
Payment instruments and other banking and financial
services
Mutual funds management, fiduciary and similar
operations
Net fees and commissions
Foreign exchange transactions
Derivative instruments and other off-balance sheet
items
Produits Charges Net
Interbank transactions
Crédit Agricole internal transactions
Customer transactions
Securities transactions
(in millions of euros)
31/12/2017
Produits Charges Net
31/12/2016
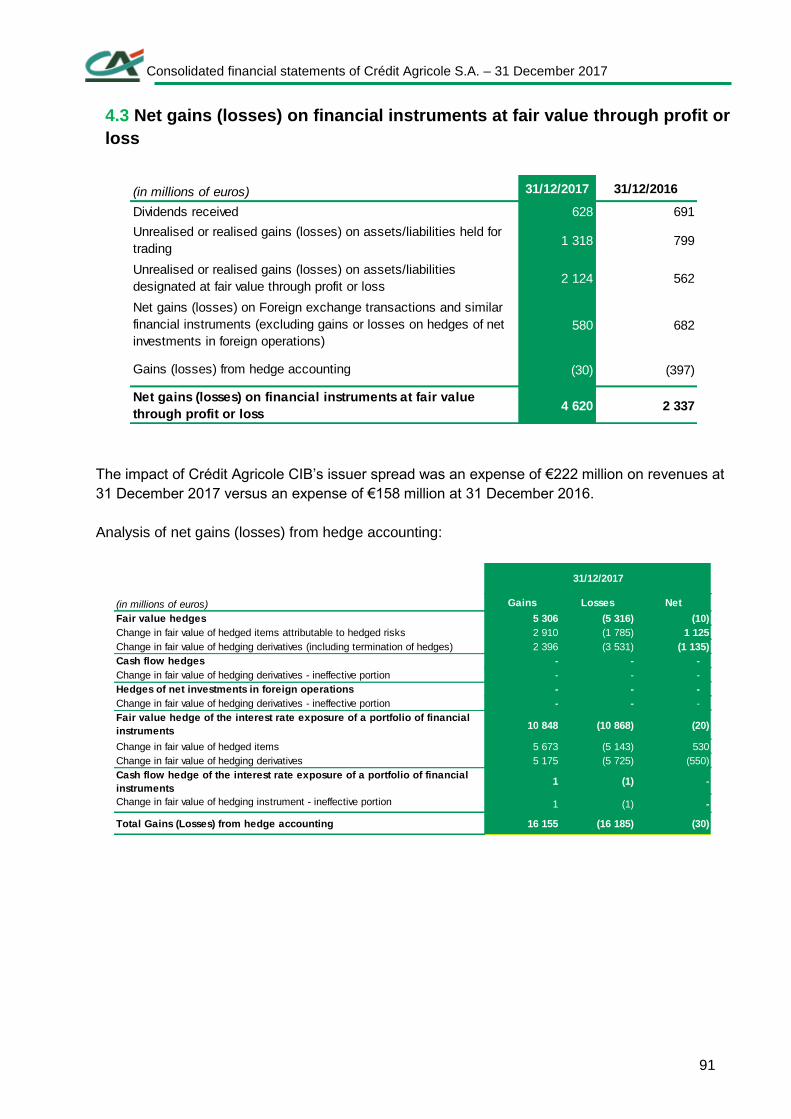
Consolidated financial statements of Crédit Agricole S.A. – 31 December 2017
91
4.3 Net gains (losses) on financial instruments at fair value through profit or
loss
The impact of Crédit Agricole CIB’s issuer spread was an expense of €222 million on revenues at
31 December 2017 versus an expense of €158 million at 31 December 2016.
Analysis of net gains (losses) from hedge accounting:
(in millions of euros) 31/12/2017 31/12/2016
628 691
1 318 799
2 124 562
580 682
(30) (397)
4 620 2 337
Dividends received
Unrealised or realised gains (losses) on assets/liabilities held for
trading
Unrealised or realised gains (losses) on assets/liabilities
designated at fair value through profit or loss
Net gains (losses) on Foreign exchange transactions and similar
financial instruments (excluding gains or losses on hedges of net
investments in foreign operations)
Gains (losses) from hedge accounting
Net gains (losses) on financial instruments at fair value
through profit or loss
Gains Losses Net
5 306 (5 316) (10)
2 910 (1 785) 1 125
2 396 (3 531) (1 135)
- - -
- - -
- - -
- - -
10 848 (10 868) (20)
5 673 (5 143) 530
5 175 (5 725) (550)
1 (1) -
1 (1) -
16 155 (16 185) (30)
Change in fair value of hedging derivatives
Cash flow hedge of the interest rate exposure of a portfolio of financial
instruments
Change in fair value of hedging instrument - ineffective portion
Total Gains (Losses) from hedge accounting
Change in fair value of hedging derivatives (including termination of hedges)
31/12/2017
(in millions of euros)
Fair value hedges
Change in fair value of hedged items attributable to hedged risks
Cash flow hedges
Change in fair value of hedging derivatives - ineffective portion
Hedges of net investments in foreign operations
Change in fair value of hedging derivatives - ineffective portion
Fair value hedge of the interest rate exposure of a portfolio of financial
instruments
Change in fair value of hedged items
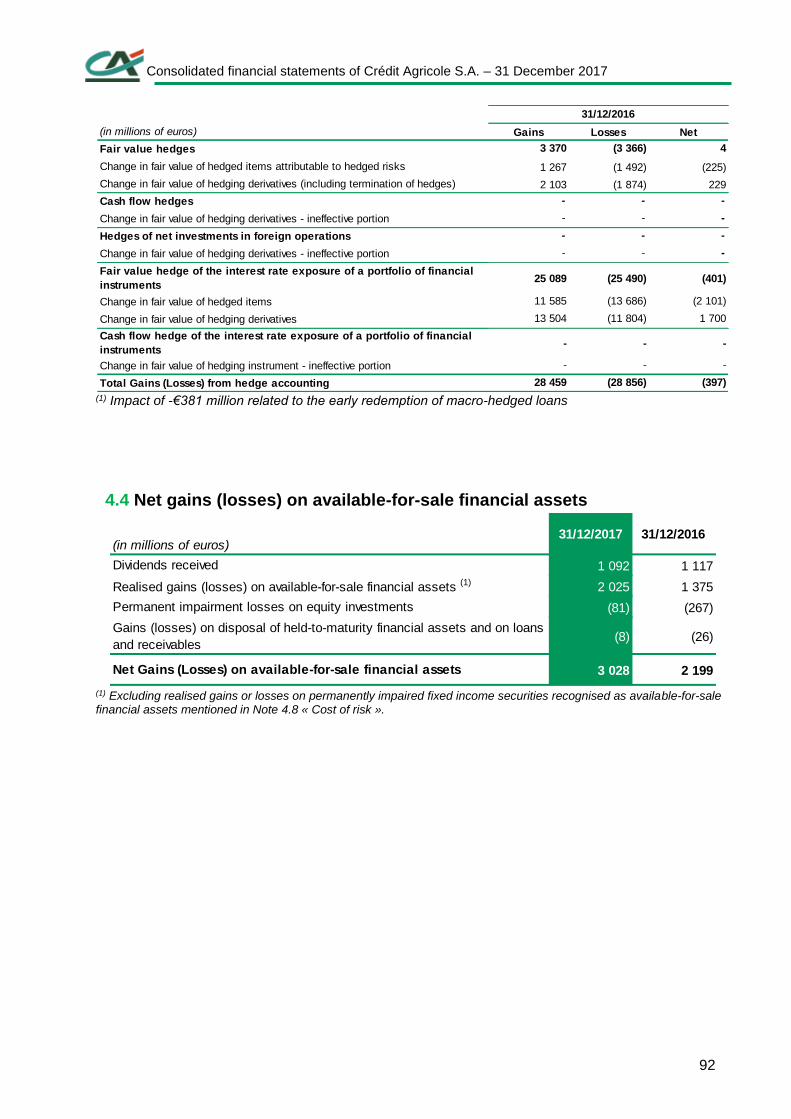
Consolidated financial statements of Crédit Agricole S.A. – 31 December 2017
92
(1) Impact of -€381 million related to the early redemption of macro-hedged loans
4.4 Net gains (losses) on available-for-sale financial assets
(1) Excluding realised gains or losses on permanently impaired fixed income securities recognised as available-for-sale financial assets mentioned in Note 4.8 « Cost of risk ».
Gains Losses Net
3 370 (3 366) 4
1 267 (1 492) (225)
2 103 (1 874) 229
- - -
- - -
- - -
- - -
25 089 (25 490) (401)
11 585 (13 686) (2 101)
13 504 (11 804) 1 700
- - -
- - -
28 459 (28 856) (397)
Change in fair value of hedging instrument - ineffective portion
Total Gains (Losses) from hedge accounting
Change in fair value of hedging derivatives - ineffective portion
Fair value hedge of the interest rate exposure of a portfolio of financial
instruments
Change in fair value of hedged items
Change in fair value of hedging derivatives
Cash flow hedge of the interest rate exposure of a portfolio of financial
instruments
Change in fair value of hedged items attributable to hedged risks
Change in fair value of hedging derivatives (including termination of hedges)
Cash flow hedges
Change in fair value of hedging derivatives - ineffective portion
Hedges of net investments in foreign operations
Fair value hedges
(in millions of euros)
31/12/2016
(in millions of euros)31/12/2017 31/12/2016
1 092 1 117
2 025 1 375
(81) (267)
(8) (26)
3 028 2 199Net Gains (Losses) on available-for-sale financial assets
Dividends received
Realised gains (losses) on available-for-sale financial assets (1)
Permanent impairment losses on equity investments
Gains (losses) on disposal of held-to-maturity financial assets and on loans
and receivables
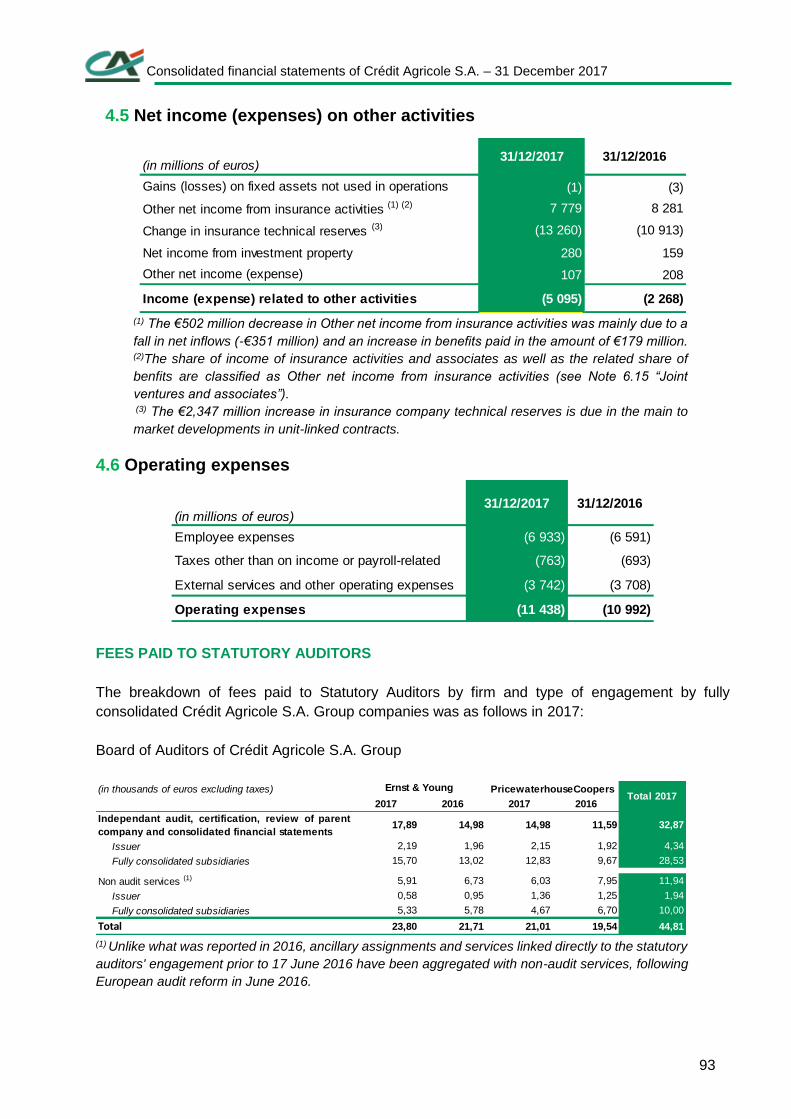
Consolidated financial statements of Crédit Agricole S.A. – 31 December 2017
93
4.5 Net income (expenses) on other activities
(1) The €502 million decrease in Other net income from insurance activities was mainly due to a
fall in net inflows (-€351 million) and an increase in benefits paid in the amount of €179 million. (2)The share of income of insurance activities and associates as well as the related share of
benfits are classified as Other net income from insurance activities (see Note 6.15 “Joint
ventures and associates”). (3) The €2,347 million increase in insurance company technical reserves is due in the main to
market developments in unit-linked contracts.
4.6 Operating expenses
FEES PAID TO STATUTORY AUDITORS
The breakdown of fees paid to Statutory Auditors by firm and type of engagement by fully
consolidated Crédit Agricole S.A. Group companies was as follows in 2017:
Board of Auditors of Crédit Agricole S.A. Group
(1) Unlike what was reported in 2016, ancillary assignments and services linked directly to the statutory
auditors' engagement prior to 17 June 2016 have been aggregated with non-audit services, following
European audit reform in June 2016.
(in millions of euros)31/12/2017 31/12/2016
(1) (3)
7 779 8 281
(13 260) (10 913)
280 159
107 208
Income (expense) related to other activities (5 095) (2 268)
Other net income (expense)
Gains (losses) on fixed assets not used in operations
Other net income from insurance activities (1) (2)
Change in insurance technical reserves (3)
Net income from investment property
(in millions of euros)31/12/2017 31/12/2016
Employee expenses (6 933) (6 591)
Taxes other than on income or payroll-related (763) (693)
External services and other operating expenses (3 742) (3 708)
Operating expenses (11 438) (10 992)
(in thousands of euros excluding taxes)
2017 2016 2017 2016
Independant audit, certification, review of parent
company and consolidated financial statements17,89 14,98 14,98 11,59 32,87
Issuer 2,19 1,96 2,15 1,92 4,34
Fully consolidated subsidiaries 15,70 13,02 12,83 9,67 28,53
Non audit services (1) 5,91 6,73 6,03 7,95 11,94
Issuer 0,58 0,95 1,36 1,25 1,94
Fully consolidated subsidiaries 5,33 5,78 4,67 6,70 10,00
Total 23,80 21,71 21,01 19,54 44,81
Ernst & Young PricewaterhouseCoopersTotal 2017
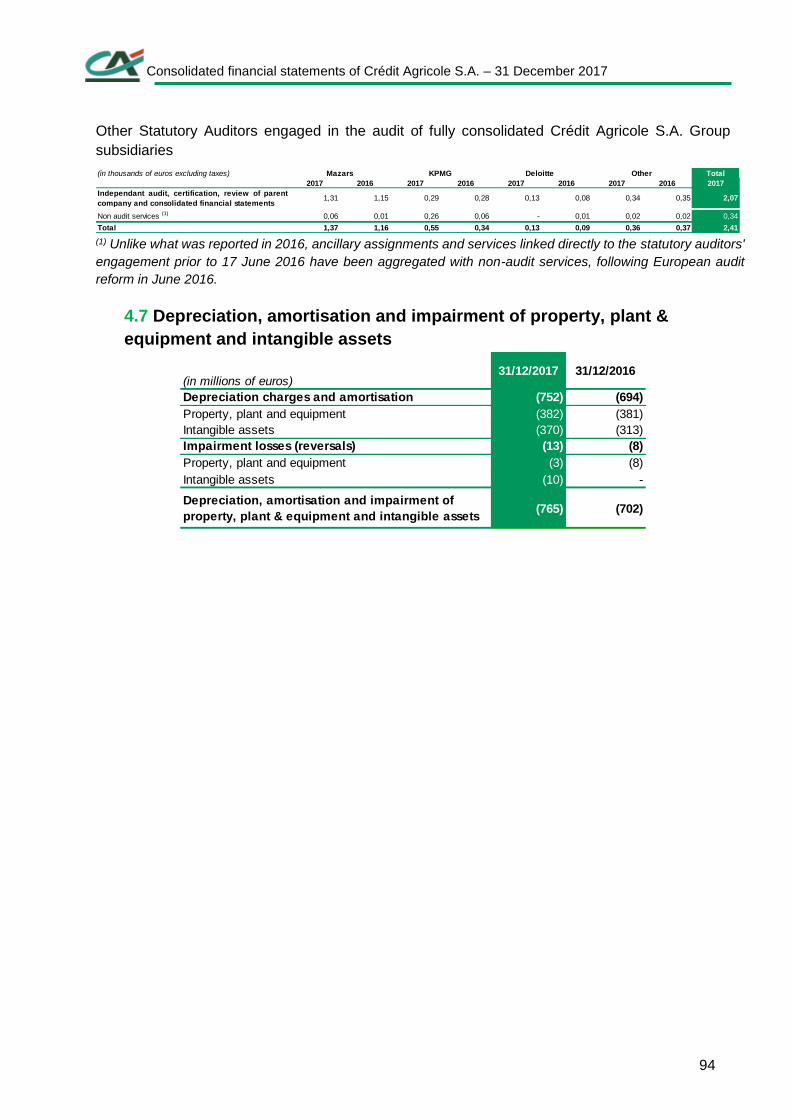
Consolidated financial statements of Crédit Agricole S.A. – 31 December 2017
94
Other Statutory Auditors engaged in the audit of fully consolidated Crédit Agricole S.A. Group
subsidiaries
(1) Unlike what was reported in 2016, ancillary assignments and services linked directly to the statutory auditors'
engagement prior to 17 June 2016 have been aggregated with non-audit services, following European audit
reform in June 2016.
4.7 Depreciation, amortisation and impairment of property, plant &
equipment and intangible assets
(in thousands of euros excluding taxes)
2017 2016 2017 2016 2017 2016 2017 2016
Independant audit, certification, review of parent
company and consolidated financial statements1,31 1,15 0,29 0,28 0,13 0,08 0,34 0,35 2,07
- - - - - - - - -
Non audit services (1) 0,06 0,01 0,26 0,06 - 0,01 0,02 0,02 0,34
Total 1,37 1,16 0,55 0,34 0,13 0,09 0,36 0,37 2,41
OtherMazars KPMG Deloitte Total
2017
(in millions of euros)31/12/2017 31/12/2016
(752) (694)
(382) (381)
(370) (313)
(13) (8)
(3) (8)
(10) -
(765) (702)
Intangible assets
Depreciation, amortisation and impairment of
property, plant & equipment and intangible assets
Depreciation charges and amortisation
Property, plant and equipment
Intangible assets
Impairment losses (reversals)
Property, plant and equipment
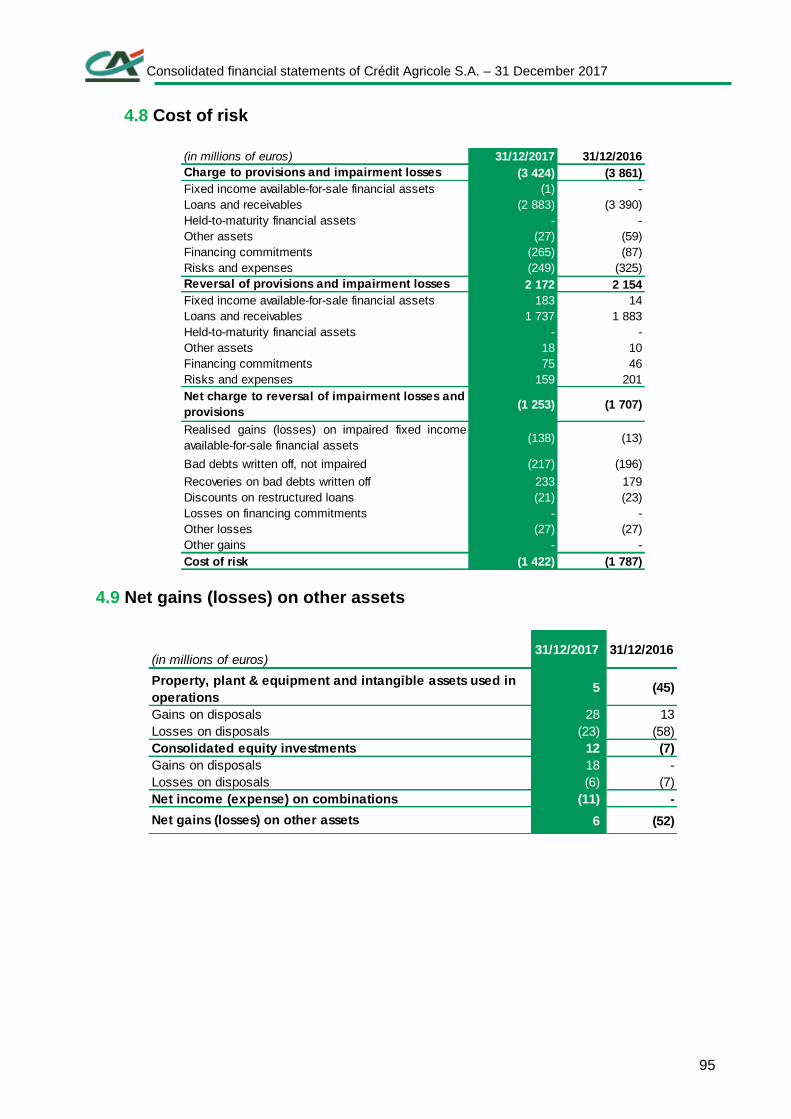
Consolidated financial statements of Crédit Agricole S.A. – 31 December 2017
95
4.8 Cost of risk
4.9 Net gains (losses) on other assets
(in millions of euros) 31/12/2017 31/12/2016
(3 424) (3 861)
(1) -
(2 883) (3 390)
Held-to-maturity financial assets - -
Other assets (27) (59)
Financing commitments (265) (87)
(249) (325)
2 172 2 154
183 14
1 737 1 883
Held-to-maturity financial assets - -
Other assets 18 10
Financing commitments 75 46
159 201
(1 253) (1 707)
(138) (13)
Bad debts written off, not impaired (217) (196)
Recoveries on bad debts written off 233 179
Discounts on restructured loans (21) (23)
Losses on financing commitments - -
Other losses (27) (27)
Other gains - -
(1 422) (1 787)
Charge to provisions and impairment losses
Fixed income available-for-sale financial assets
Loans and receivables
Cost of risk
Reversal of provisions and impairment losses
Risks and expenses
Fixed income available-for-sale financial assets
Loans and receivables
Risks and expenses
Net charge to reversal of impairment losses and
provisions
Realised gains (losses) on impaired fixed income
available-for-sale financial assets
(in millions of euros)31/12/2017 31/12/2016
5 (45)
28 13
(23) (58)
12 (7)
18 -
(6) (7)
Net income (expense) on combinations (11) -
6 (52)Net gains (losses) on other assets
Losses on disposals
Property, plant & equipment and intangible assets used in
operations
Gains on disposals
Consolidated equity investments
Gains on disposals
Losses on disposals
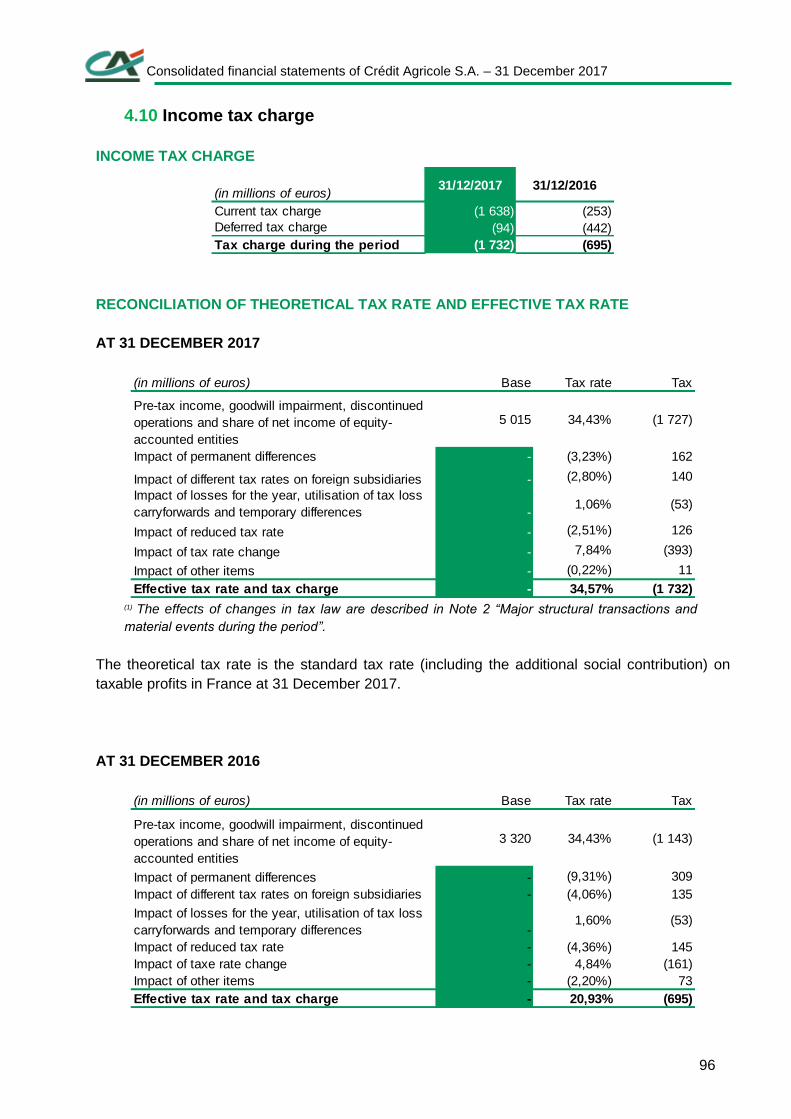
Consolidated financial statements of Crédit Agricole S.A. – 31 December 2017
96
4.10 Income tax charge
INCOME TAX CHARGE
RECONCILIATION OF THEORETICAL TAX RATE AND EFFECTIVE TAX RATE
AT 31 DECEMBER 2017
(1) The effects of changes in tax law are described in Note 2 “Major structural transactions and
material events during the period”.
The theoretical tax rate is the standard tax rate (including the additional social contribution) on
taxable profits in France at 31 December 2017.
AT 31 DECEMBER 2016
31/12/2017 31/12/2016
(1 638) (253)
(94) (442)
(1 732) (695)
(in millions of euros)
Current tax charge
Deferred tax charge
Tax charge during the period
Base Tax rate Tax
5 015 34,43% (1 727)
Impact of permanent differences - (3,23%) 162
- (2,80%) 140
-1,06% (53)
- (2,51%) 126
Impact of tax rate change - 7,84% (393)
- (0,22%) 11
- 34,57% (1 732)
(in millions of euros)
Impact of other items
Pre-tax income, goodwill impairment, discontinued
operations and share of net income of equity-
accounted entities
Impact of different tax rates on foreign subsidiaries
Impact of reduced tax rate
Effective tax rate and tax charge
Impact of losses for the year, utilisation of tax loss
carryforwards and temporary differences
Base Tax rate Tax
3 320 34,43% (1 143)
Impact of permanent differences - (9,31%) 309
- (4,06%) 135
-1,60% (53)
- (4,36%) 145
Impact of taxe rate change - 4,84% (161)
- (2,20%) 73
- 20,93% (695)
Pre-tax income, goodwill impairment, discontinued
operations and share of net income of equity-
accounted entities
Impact of other items
Impact of different tax rates on foreign subsidiaries
Impact of losses for the year, utilisation of tax loss
carryforwards and temporary differences
Impact of reduced tax rate
Effective tax rate and tax charge
(in millions of euros)
Consolidated financial statements of Crédit Agricole S.A. – 31 December 2017
97
The theoretical tax rate is the tax rate applicable under ordinary law (including the additional social
contribution and) to taxable profits in France for the year ended 31 December 2016.
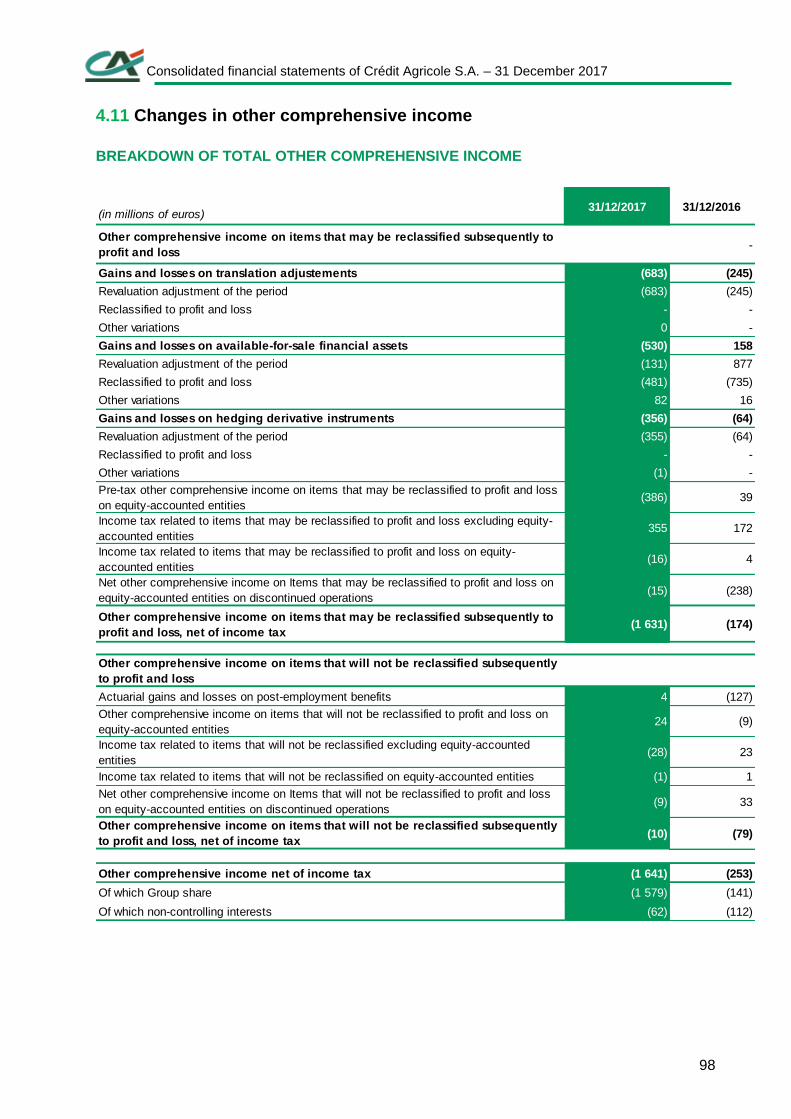
Consolidated financial statements of Crédit Agricole S.A. – 31 December 2017
98
4.11 Changes in other comprehensive income
BREAKDOWN OF TOTAL OTHER COMPREHENSIVE INCOME
(in millions of euros)31/12/2017 31/12/2016
Other comprehensive income on items that may be reclassified subsequently to
profit and loss - -
Gains and losses on translation adjustements (683) (245)
Revaluation adjustment of the period (683) (245)
Reclassified to profit and loss - -
Other variations 0 -
Gains and losses on available-for-sale financial assets (530) 158
Revaluation adjustment of the period (131) 877
Reclassified to profit and loss (481) (735)
Other variations 82 16
Gains and losses on hedging derivative instruments (356) (64)
Revaluation adjustment of the period (355) (64)
Reclassified to profit and loss - -
Other variations (1) -
Pre-tax other comprehensive income on items that may be reclassified to profit and loss
on equity-accounted entities(386) 39
Income tax related to items that may be reclassified to profit and loss excluding equity-
accounted entities355 172
Income tax related to items that may be reclassified to profit and loss on equity-
accounted entities(16) 4
Net other comprehensive income on Items that may be reclassified to profit and loss on
equity-accounted entities on discontinued operations(15) (238)
Other comprehensive income on items that may be reclassified subsequently to
profit and loss, net of income tax(1 631) (174)
Other comprehensive income on items that will not be reclassified subsequently
to profit and loss
Actuarial gains and losses on post-employment benefits 4 (127)
Other comprehensive income on items that will not be reclassified to profit and loss on
equity-accounted entities24 (9)
Income tax related to items that will not be reclassified excluding equity-accounted
entities(28) 23
Income tax related to items that will not be reclassified on equity-accounted entities (1) 1
Net other comprehensive income on Items that will not be reclassified to profit and loss
on equity-accounted entities on discontinued operations(9) 33
Other comprehensive income on items that will not be reclassified subsequently
to profit and loss, net of income tax(10) (79)
Other comprehensive income net of income tax (1 641) (253)
Of which Group share (1 579) (141)
Of which non-controlling interests (62) (112)
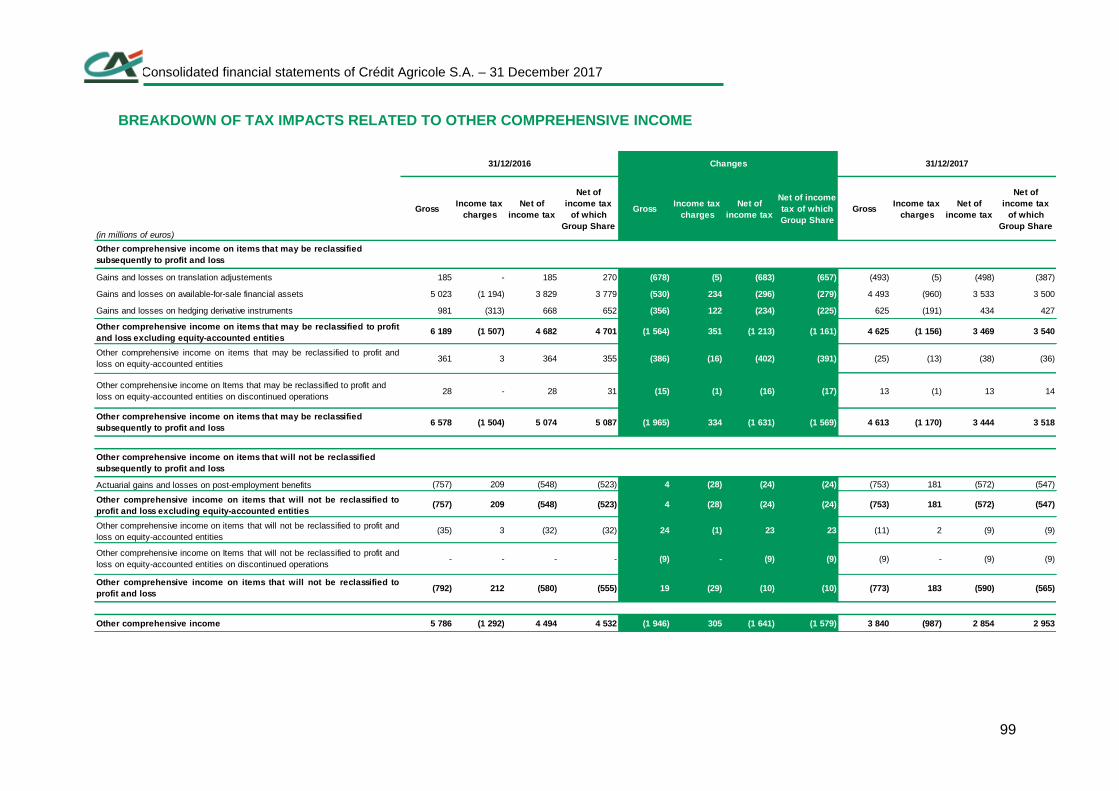
Consolidated financial statements of Crédit Agricole S.A. – 31 December 2017
99
BREAKDOWN OF TAX IMPACTS RELATED TO OTHER COMPREHENSIVE INCOME
(in millions of euros)
GrossIncome tax
charges
Net of
income tax
Net of
income tax
of which
Group Share
GrossIncome tax
charges
Net of
income tax
Net of income
tax of which
Group Share
GrossIncome tax
charges
Net of
income tax
Net of
income tax
of which
Group Share
Gains and losses on translation adjustements 185 - 185 270 (678) (5) (683) (657) (493) (5) (498) (387)
Gains and losses on available-for-sale financial assets 5 023 (1 194) 3 829 3 779 (530) 234 (296) (279) 4 493 (960) 3 533 3 500
Gains and losses on hedging derivative instruments 981 (313) 668 652 (356) 122 (234) (225) 625 (191) 434 427
6 189 (1 507) 4 682 4 701 (1 564) 351 (1 213) (1 161) 4 625 (1 156) 3 469 3 540
361 3 364 355 (386) (16) (402) (391) (25) (13) (38) (36)
28 - 28 31 (15) (1) (16) (17) 13 (1) 13 14
6 578 (1 504) 5 074 5 087 (1 965) 334 (1 631) (1 569) 4 613 (1 170) 3 444 3 518
(757) 209 (548) (523) 4 (28) (24) (24) (753) 181 (572) (547)
(757) 209 (548) (523) 4 (28) (24) (24) (753) 181 (572) (547)
(35) 3 (32) (32) 24 (1) 23 23 (11) 2 (9) (9)
- - - - (9) - (9) (9) (9) - (9) (9)
(792) 212 (580) (555) 19 (29) (10) (10) (773) 183 (590) (565)
5 786 (1 292) 4 494 4 532 (1 946) 305 (1 641) (1 579) 3 840 (987) 2 854 2 953
Changes 31/12/2017
Other comprehensive income on items that may be reclassified
subsequently to profit and loss
Other comprehensive income on items that may be reclassified to profit
and loss excluding equity-accounted entities
Other comprehensive income on items that may be reclassified to profit and
loss on equity-accounted entities
Other comprehensive income on Items that may be reclassified to profit and
loss on equity-accounted entities on discontinued operations
Other comprehensive income on Items that will not be reclassified to profit and
loss on equity-accounted entities on discontinued operations
31/12/2016
Other comprehensive income
Other comprehensive income on items that may be reclassified
subsequently to profit and loss
Actuarial gains and losses on post-employment benefits
Other comprehensive income on items that will not be reclassified to
profit and loss excluding equity-accounted entities
Other comprehensive income on items that will not be reclassified to profit and
loss on equity-accounted entities
Other comprehensive income on items that will not be reclassified to
profit and loss
Other comprehensive income on items that will not be reclassified
subsequently to profit and loss
Consolidated financial statements of Crédit Agricole S.A. – 31 December 2017
100
5. Segment reporting
DEFINITION OF OPERATING SEGMENTS
According to IFRS 8, information disclosed is based on the internal reporting that is used by the
Executive Committee to manage Crédit Agricole S.A. Group, to assess performance, and to make
decisions about resources to be allocated to the identified operating segments.
Operating segments according to the internal reporting consist of the business lines of the Group.
At 31 December 2017, Crédit Agricole S.A.’s business activities were organised into six operating
segments:
the following five business lines:
asset gathering,
french retail banking – LCL,
international retail banking,
specialised financial services,
large customers;
as well as the “Corporate centre”.
PRESENTATION OF BUSINESS LINES
1. Asset gathering
This business line encompasses:
insurance activity:
o life insurance and personal insurance, conducted mainly by Predica in France and
CA Vita in Italy,
o property & casualty insurance, conducted primarily by Pacifica,
o creditor insurance, conducted by Crédit Agricole Creditor Insurance;
the asset management activities of the Amundi Group (including the operations of Pioneer
Investments since July 2018), offering savings solutions for individuals and investment solutions for
institutions;
as well as wealth management activities conducted mainly by Crédit Agricole Indosuez Wealth
Management subsidiaries (CA Indosuez Switzerland S.A. CA Indosuez Wealth Europe, CFM
Indosuez Wealth, CA Indosuez Wealth AM, etc.).
Consolidated financial statements of Crédit Agricole S.A. – 31 December 2017
. 101
2. French retail banking - LCL
French retail banking network with a strong presence in urban areas. It is organised into four
business lines: retail banking for individual customers, retail banking for small businesses, private
banking and corporate banking.
LCL offers a full range of banking products and services, together with asset management,
insurance and wealth management products.
It should ne noted that Themis Bank’s contribution to the consolidated financial statements in the
year ended 31 December 2017 is accounted for in accordance with IFRS 5 on entities held for sale.
3. International retail banking
This business line encompasses foreign subsidiaries and investments that are mainly involved in
retail banking.
These subsidiaries and equity investments are primarily located in Europe: with Cariparma Group
in Italy, Crédit Agricole Polska in Poland and others in Ukraine and Serbia.
Other subsidiaries operate around the Mediterranean through Crédit du Maroc and Crédit Agricole
Egypt.
Finally, this division also includes banks that are not significant in size.
Foreign consumer credit, leasing and factoring subsidiaries (subsidiaries of Crédit Agricole
Consumer Finance, Crédit Agricole Leasing & Factoring and EFL in Poland, etc.) are not included
in this division, but in “Specialised financial services”, except Calit in Italy, which is part of retail
banking.
It should ne noted that Cassa di Risparmio di Cesena, Cassa di Risparmio di San Miniato and
Cassa di Risparmio di Rimini in Italy have been consolidated.
4. SFS
Specialised financial services comprises the Group subsidiaries that provide financial products and
services to individual customers, small businesses, corporates and local authorities in France and
abroad. These include:
consumer finance companies around Crédit Agricole Consumer Finance in France and through
its subsidiaries or partnerships outside France (Agos, Creditplus Bank, Ribank, Credibom,
Interbank Group and FCA Bank). Forso was reclassified under IFRS 5 in the financial statements
at 31 December 2017, following the end of the partnership with Ford;
Consolidated financial statements of Crédit Agricole S.A. – 31 December 2017
. 102
specialised financial services for companies such as factoring and lease finance (Crédit Agricole
Leasing & Factoring Group, EFL).
5. Large customers
The Large customers division includes the Corporate and Investment bank, which itself consists of
two main lines of business most of which are carried out by Crédit Agricole CIB, and asset servicing
for institutions (CACEIS):
financing activities, which include corporate banking in France and internationally and structured
finance. Structured Finance consists of originating, structuring and financing large-scale
operations in exporting and investing, often collateralised by physical assets (planes, boats,
office buildings, commodities, etc.) and complex and structured credit instruments;
capital markets and investment banking activities bring together capital market activities
(treasury, foreign exchange, interest rate derivatives, debt markets), and investment banking
activities (mergers and acquisitions consulting and primary equity advisory);
asset servicing: CACEIS Bank for custody and CACEIS Fund Administration for fund
administration.
6. Corporate Centre
This segment mainly encompasses Crédit Agricole S.A.’s central body function, asset and liability
management and management of debt connected with acquisitions of subsidiaries or equity
investments.
It also includes:
the results of the private equity business and results of various other Crédit Agricole S.A. Group
companies (Uni-édition, Foncaris, etc.);
the income from management companies, real-estate companies holding properties used in
operations by several business lines and by activities undergoing reorganisation;
the net impact of tax consolidation for Crédit Agricole S.A. as well as the revaluation of structured
debt issued by Crédit Agricole CIB.
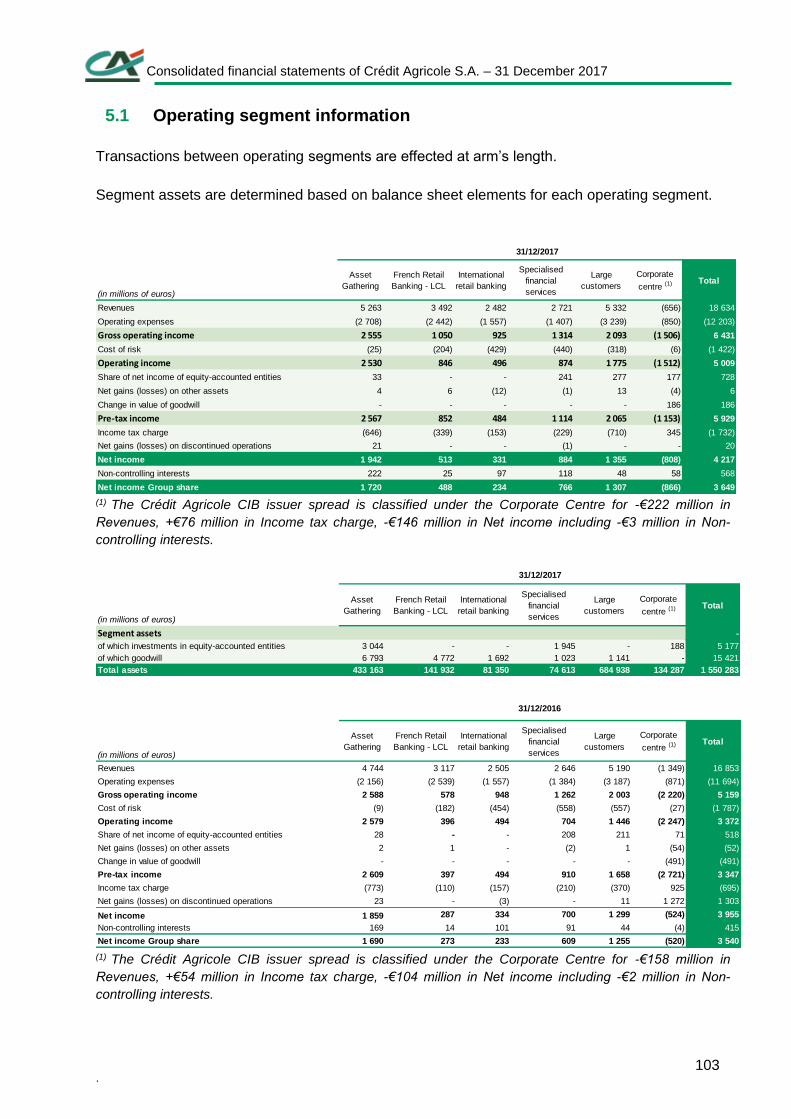
Consolidated financial statements of Crédit Agricole S.A. – 31 December 2017
. 103
5.1 Operating segment information
Transactions between operating segments are effected at arm’s length.
Segment assets are determined based on balance sheet elements for each operating segment.
(1) The Crédit Agricole CIB issuer spread is classified under the Corporate Centre for -€222 million in
Revenues, +€76 million in Income tax charge, -€146 million in Net income including -€3 million in Non-
controlling interests.
(1) The Crédit Agricole CIB issuer spread is classified under the Corporate Centre for -€158 million in
Revenues, +€54 million in Income tax charge, -€104 million in Net income including -€2 million in Non-
controlling interests.
(in millions of euros)
Asset
Gathering
French Retail
Banking - LCL
International
retail banking
Specialised
financial
services
Large
customers
Corporate
centre (1) Total
Revenues 5 263 3 492 2 482 2 721 5 332 (656) 18 634
Operating expenses (2 708) (2 442) (1 557) (1 407) (3 239) (850) (12 203)
Gross operating income 2 555 1 050 925 1 314 2 093 (1 506) 6 431
Cost of risk (25) (204) (429) (440) (318) (6) (1 422)
Operating income 2 530 846 496 874 1 775 (1 512) 5 009
Share of net income of equity-accounted entities 33 - - 241 277 177 728
Net gains (losses) on other assets 4 6 (12) (1) 13 (4) 6
Change in value of goodwill - - - - - 186 186
Pre-tax income 2 567 852 484 1 114 2 065 (1 153) 5 929
Income tax charge (646) (339) (153) (229) (710) 345 (1 732)
Net gains (losses) on discontinued operations 21 - - (1) - - 20
Net income 1 942 513 331 884 1 355 (808) 4 217
Non-controlling interests 222 25 97 118 48 58 568
Net income Group share 1 720 488 234 766 1 307 (866) 3 649
31/12/2017
(in millions of euros)
Asset
Gathering
French Retail
Banking - LCL
International
retail banking
Specialised
financial
services
Large
customers
Corporate
centre (1) Total
Segment assets -
of which investments in equity-accounted entities 3 044 - - 1 945 - 188 5 177
of which goodwill 6 793 4 772 1 692 1 023 1 141 - 15 421
Total assets 433 163 141 932 81 350 74 613 684 938 134 287 1 550 283
31/12/2017
(in millions of euros)
Asset
Gathering
French Retail
Banking - LCL
International
retail banking
Specialised
financial
services
Large
customers
Corporate
centre (1) Total
Revenues 4 744 3 117 2 505 2 646 5 190 (1 349) 16 853
Operating expenses (2 156) (2 539) (1 557) (1 384) (3 187) (871) (11 694)
Gross operating income 2 588 578 948 1 262 2 003 (2 220) 5 159
Cost of risk (9) (182) (454) (558) (557) (27) (1 787)
Operating income 2 579 396 494 704 1 446 (2 247) 3 372
Share of net income of equity-accounted entities 28 - - 208 211 71 518
Net gains (losses) on other assets 2 1 - (2) 1 (54) (52)
Change in value of goodwill - - - - - (491) (491)
Pre-tax income 2 609 397 494 910 1 658 (2 721) 3 347
Income tax charge (773) (110) (157) (210) (370) 925 (695)
Net gains (losses) on discontinued operations 23 - (3) - 11 1 272 1 303
Net income 1 859 287 334 700 1 299 (524) 3 955
Non-controlling interests 169 14 101 91 44 (4) 415
Net income Group share 1 690 273 233 609 1 255 (520) 3 540
31/12/2016
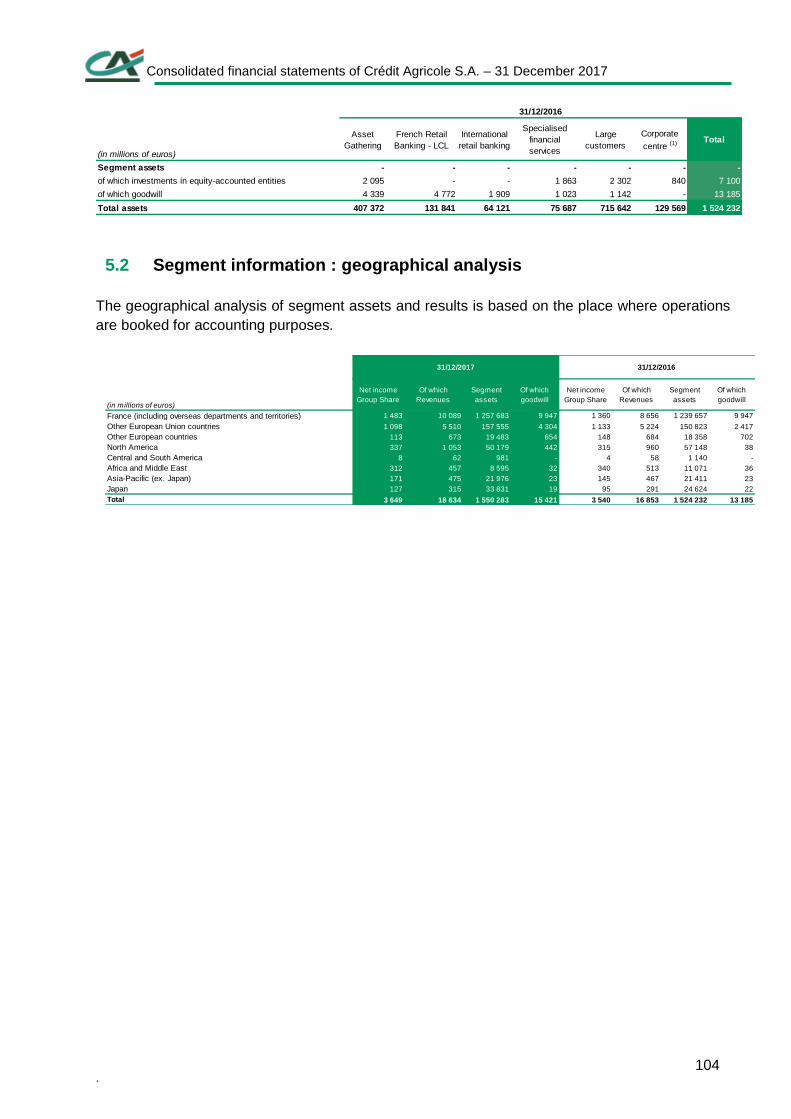
Consolidated financial statements of Crédit Agricole S.A. – 31 December 2017
. 104
5.2 Segment information : geographical analysis
The geographical analysis of segment assets and results is based on the place where operations
are booked for accounting purposes.
(in millions of euros)
Asset
Gathering
French Retail
Banking - LCL
International
retail banking
Specialised
financial
services
Large
customers
Corporate
centre (1) Total
Segment assets - - - - - - -
of which investments in equity-accounted entities 2 095 - - 1 863 2 302 840 7 100
of which goodwill 4 339 4 772 1 909 1 023 1 142 - 13 185
Total assets 407 372 131 841 64 121 75 687 715 642 129 569 1 524 232
31/12/2016
31/12/2016
(in millions of euros)
France (including overseas departments and territories) 1 483 10 089 1 257 683 9 947 1 360 8 656 1 239 657 9 947
Other European Union countries 1 098 5 510 157 555 4 304 1 133 5 224 150 823 2 417
Other European countries 113 673 19 483 654 148 684 18 358 702
North America 337 1 053 50 179 442 315 960 57 148 38
Central and South America 8 62 981 - 4 58 1 140 -
Africa and Middle East 312 457 8 595 32 340 513 11 071 36
Asia-Pacific (ex. Japan) 171 475 21 976 23 145 467 21 411 23
Japan 127 315 33 831 19 95 291 24 624 22
Total 3 649 18 634 1 550 283 15 421 3 540 16 853 1 524 232 13 185
Of which
goodwill
Net income
Group Share
Of which
Revenues
Segment
assets
31/12/2017
Net income
Group Share
Of which
Revenues
Segment
assets
Of which
goodwill
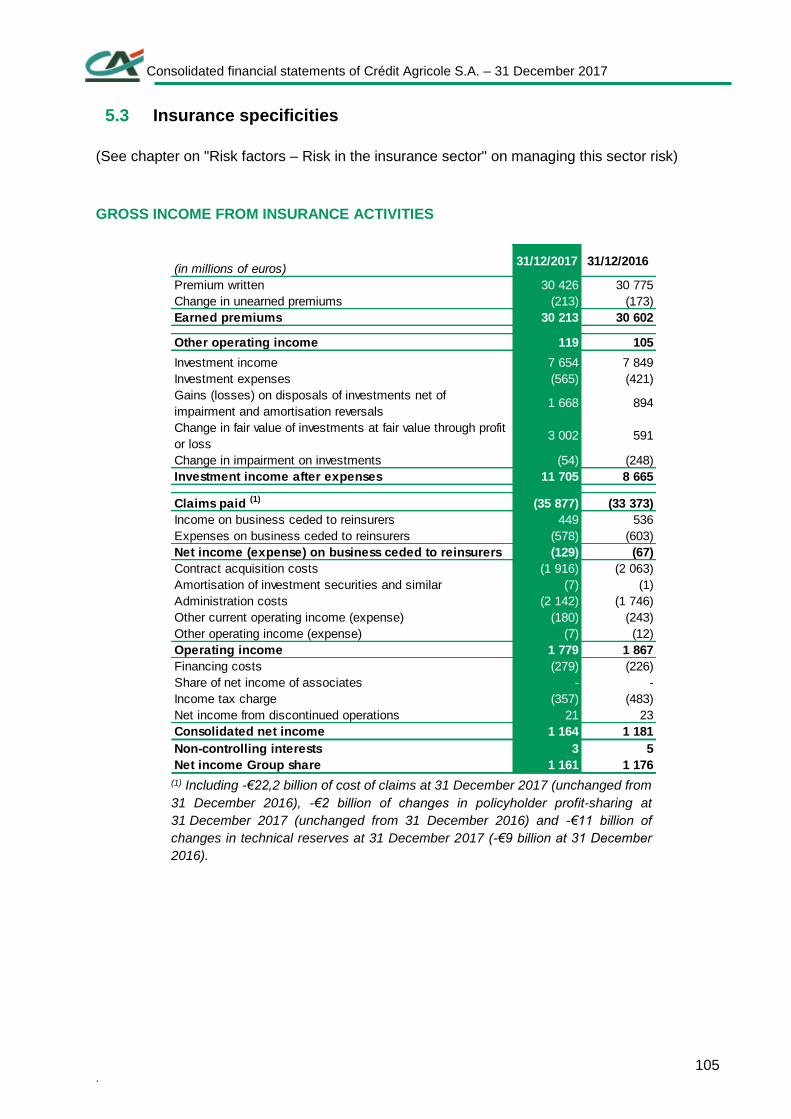
Consolidated financial statements of Crédit Agricole S.A. – 31 December 2017
. 105
5.3 Insurance specificities
(See chapter on "Risk factors – Risk in the insurance sector" on managing this sector risk)
GROSS INCOME FROM INSURANCE ACTIVITIES
(1) Including -€22,2 billion of cost of claims at 31 December 2017 (unchanged from
31 December 2016), -€2 billion of changes in policyholder profit-sharing at
31 December 2017 (unchanged from 31 December 2016) and -€11 billion of
changes in technical reserves at 31 December 2017 (-€9 billion at 31 December
2016).
(in millions of euros)31/12/2017 31/12/2016
Premium written 30 426 30 775
Change in unearned premiums (213) (173)
Earned premiums 30 213 30 602
Other operating income 119 105- -
Investment income 7 654 7 849
Investment expenses (565) (421)
Gains (losses) on disposals of investments net of
impairment and amortisation reversals1 668 894
Change in fair value of investments at fair value through profit
or loss3 002 591
Change in impairment on investments (54) (248)
Investment income after expenses 11 705 8 665
Claims paid (1) (35 877) (33 373)
Income on business ceded to reinsurers 449 536
Expenses on business ceded to reinsurers (578) (603)
Net income (expense) on business ceded to reinsurers (129) (67)
Contract acquisition costs (1 916) (2 063)
Amortisation of investment securities and similar (7) (1)
Administration costs (2 142) (1 746)
Other current operating income (expense) (180) (243)
Other operating income (expense) (7) (12)
Operating income 1 779 1 867
Financing costs (279) (226)
Share of net income of associates - -
Income tax charge (357) (483)
Net income from discontinued operations 21 23
Consolidated net income 1 164 1 181
Non-controlling interests 3 5
Net income Group share 1 161 1 176
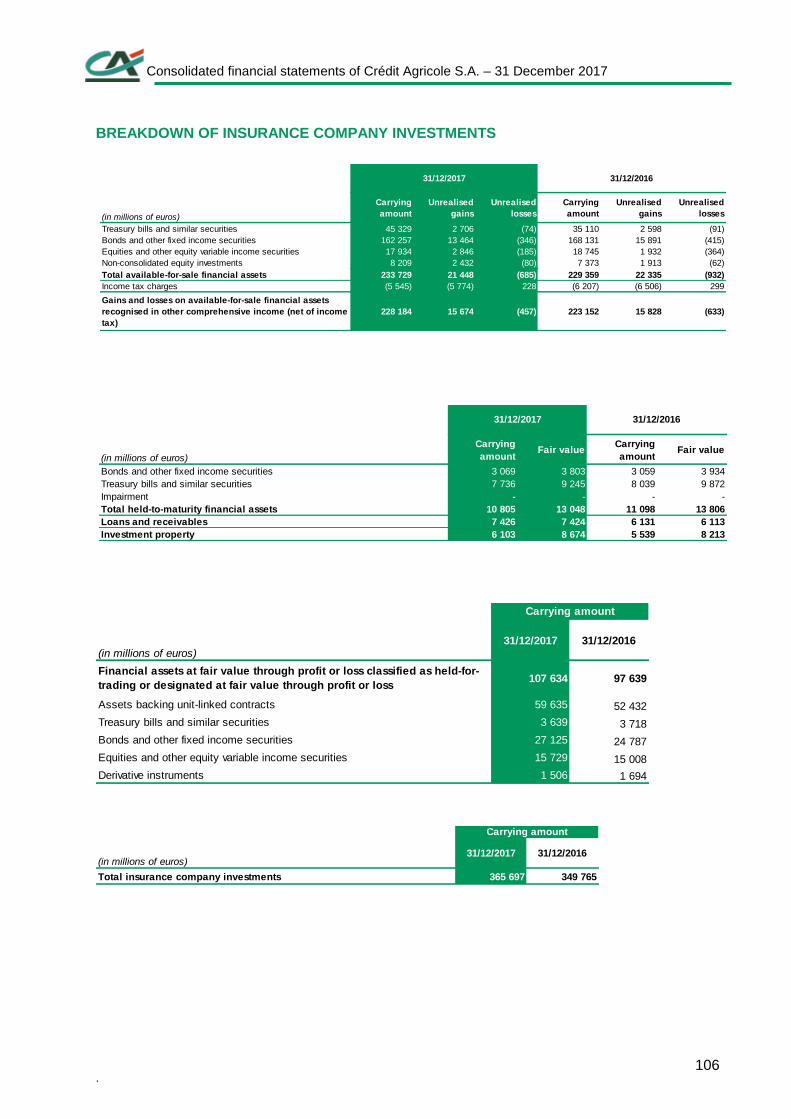
Consolidated financial statements of Crédit Agricole S.A. – 31 December 2017
. 106
BREAKDOWN OF INSURANCE COMPANY INVESTMENTS
Carrying
amount
Unrealised
gains
Unrealised
losses
Carrying
amount
Unrealised
gains
Unrealised
losses
Treasury bills and similar securities 45 329 2 706 (74) 35 110 2 598 (91)
Bonds and other fixed income securities 162 257 13 464 (346) 168 131 15 891 (415)
Equities and other equity variable income securities 17 934 2 846 (185) 18 745 1 932 (364)
Non-consolidated equity investments 8 209 2 432 (80) 7 373 1 913 (62)
Total available-for-sale financial assets 233 729 21 448 (685) 229 359 22 335 (932)
Income tax charges (5 545) (5 774) 228 (6 207) (6 506) 299
Gains and losses on available-for-sale financial assets
recognised in other comprehensive income (net of income
tax)
228 184 15 674 (457) 223 152 15 828 (633)
(in millions of euros)
31/12/2017 31/12/2016
(in millions of euros)
Carrying
amountFair value
Carrying
amountFair value
Bonds and other fixed income securities 3 069 3 803 3 059 3 934
Treasury bills and similar securities 7 736 9 245 8 039 9 872
Impairment - - - -
Total held-to-maturity financial assets 10 805 13 048 11 098 13 806
Loans and receivables 7 426 7 424 6 131 6 113
Investment property 6 103 8 674 5 539 8 213
31/12/2017 31/12/2016
(in millions of euros)
107 634 97 639
Assets backing unit-linked contracts 59 635 52 432
Treasury bills and similar securities 3 639 3 718
Bonds and other fixed income securities 27 125 24 787
Equities and other equity variable income securities 15 729 15 008
Derivative instruments 1 506 1 694
Financial assets at fair value through profit or loss classified as held-for-
trading or designated at fair value through profit or loss
31/12/2017 31/12/2016
Carrying amount
(in millions of euros)
Total insurance company investments 365 697 349 765
Carrying amount
31/12/2017 31/12/2016
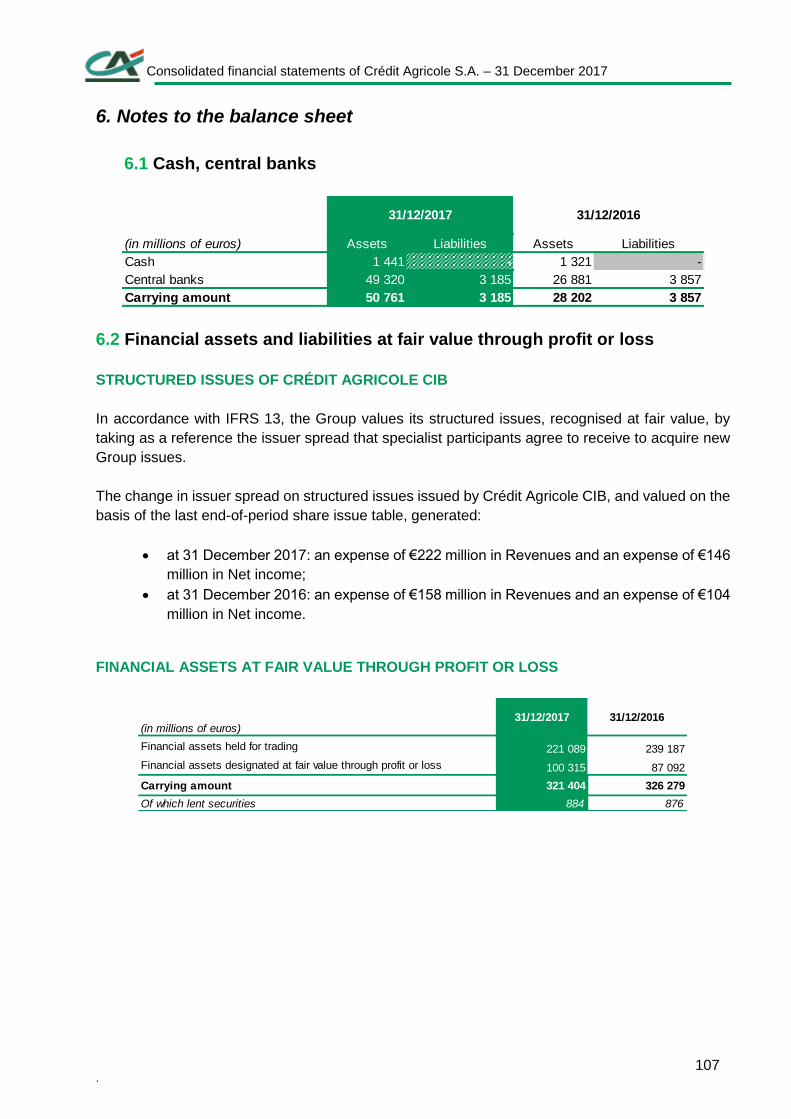
Consolidated financial statements of Crédit Agricole S.A. – 31 December 2017
. 107
6. Notes to the balance sheet
6.1 Cash, central banks
6.2 Financial assets and liabilities at fair value through profit or loss
STRUCTURED ISSUES OF CRÉDIT AGRICOLE CIB
In accordance with IFRS 13, the Group values its structured issues, recognised at fair value, by
taking as a reference the issuer spread that specialist participants agree to receive to acquire new
Group issues.
The change in issuer spread on structured issues issued by Crédit Agricole CIB, and valued on the
basis of the last end-of-period share issue table, generated:
at 31 December 2017: an expense of €222 million in Revenues and an expense of €146
million in Net income;
at 31 December 2016: an expense of €158 million in Revenues and an expense of €104
million in Net income.
FINANCIAL ASSETS AT FAIR VALUE THROUGH PROFIT OR LOSS
(in millions of euros) Assets Liabilities Assets Liabilities
Cash 1 441 - 1 321 -
Central banks 49 320 3 185 26 881 3 857
Carrying amount 50 761 3 185 28 202 3 857
31/12/2017 31/12/2016
(in millions of euros)31/12/2017 31/12/2016
Financial assets held for trading 221 089 239 187
100 315 87 092
Carrying amount 321 404 326 279
Of which lent securities 884 876
Financial assets designated at fair value through profit or loss
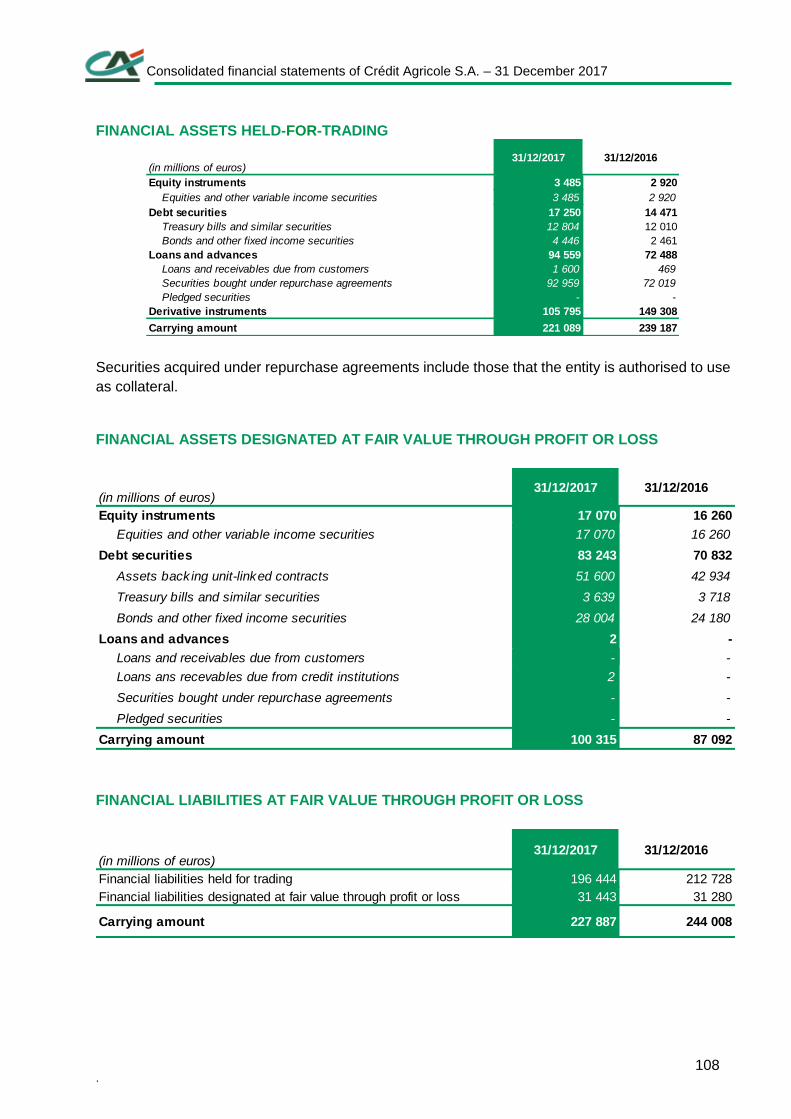
Consolidated financial statements of Crédit Agricole S.A. – 31 December 2017
. 108
FINANCIAL ASSETS HELD-FOR-TRADING
Securities acquired under repurchase agreements include those that the entity is authorised to use
as collateral.
FINANCIAL ASSETS DESIGNATED AT FAIR VALUE THROUGH PROFIT OR LOSS
FINANCIAL LIABILITIES AT FAIR VALUE THROUGH PROFIT OR LOSS
(in millions of euros)31/12/2017 31/12/2016
Equity instruments 3 485 2 920
Equities and other variable income securities 3 485 2 920
Debt securities 17 250 14 471
Treasury bills and similar securities 12 804 12 010
Bonds and other fixed income securities 4 446 2 461
Loans and advances 94 559 72 488
Loans and receivables due from customers 1 600 469
Securities bought under repurchase agreements 92 959 72 019
Pledged securities - -
Derivative instruments 105 795 149 308
Carrying amount 221 089 239 187
(in millions of euros)31/12/2017 31/12/2016
Equity instruments 17 070 16 260
Equities and other variable income securities 17 070 16 260
Debt securities 83 243 70 832
Assets back ing unit-linked contracts 51 600 42 934
Treasury bills and similar securities 3 639 3 718
Bonds and other fixed income securities 28 004 24 180
Loans and advances 2 -
Loans and receivables due from customers - -
Loans ans recevables due from credit institutions 2 -
Securities bought under repurchase agreements - -
Pledged securities - -
Carrying amount 100 315 87 092
(in millions of euros)31/12/2017 31/12/2016
196 444 212 728
31 443 31 280
Carrying amount 227 887 244 008
Financial liabilities designated at fair value through profit or loss
Financial liabilities held for trading
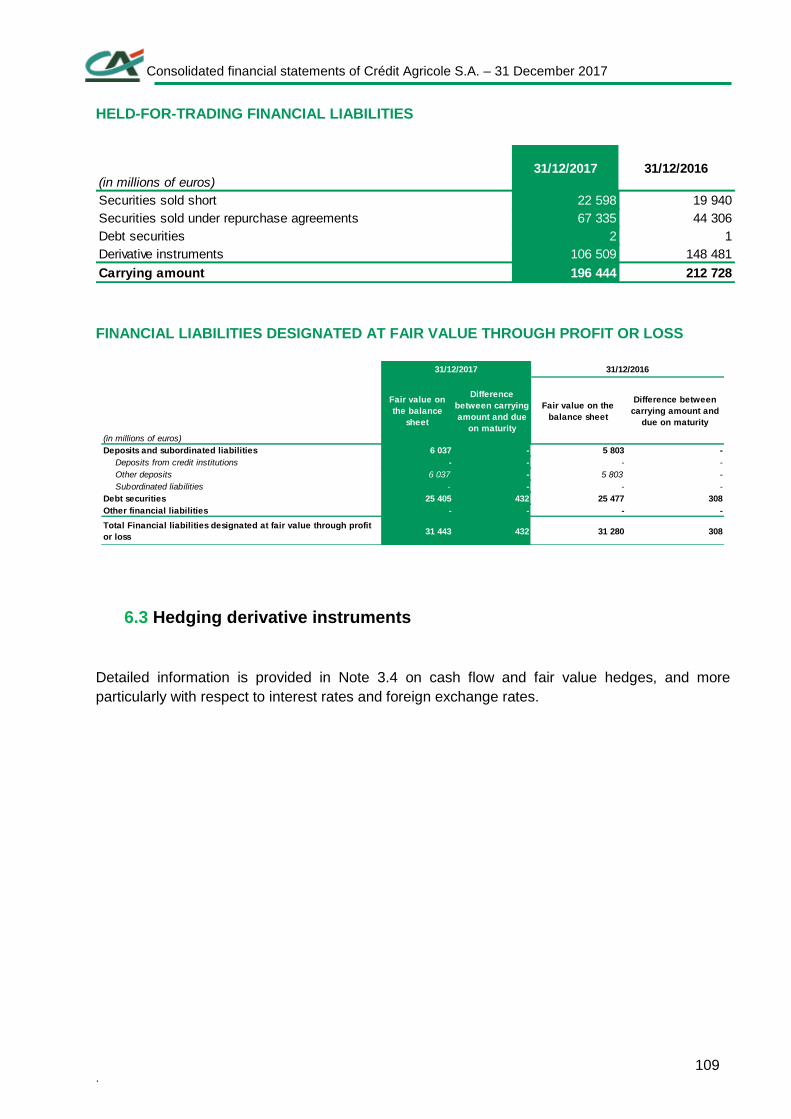
Consolidated financial statements of Crédit Agricole S.A. – 31 December 2017
. 109
HELD-FOR-TRADING FINANCIAL LIABILITIES
FINANCIAL LIABILITIES DESIGNATED AT FAIR VALUE THROUGH PROFIT OR LOSS
6.3 Hedging derivative instruments
Detailed information is provided in Note 3.4 on cash flow and fair value hedges, and more
particularly with respect to interest rates and foreign exchange rates.
(in millions of euros)31/12/2017 31/12/2016
Securities sold short 22 598 19 940
Securities sold under repurchase agreements 67 335 44 306
Debt securities 2 1
Derivative instruments 106 509 148 481
Carrying amount 196 444 212 728
(in millions of euros)
Fair value on
the balance
sheet
Difference
between carrying
amount and due
on maturity
Fair value on the
balance sheet
Difference between
carrying amount and
due on maturity
Deposits and subordinated liabilities 6 037 - 5 803 -
Deposits from credit institutions - - - -
Other deposits 6 037 - 5 803 -
Subordinated liabilities - - - -
Debt securities 25 405 432 25 477 308
Other financial liabilities - - - -
Total Financial liabilities designated at fair value through profit
or loss31 443 432 31 280 308
31/12/201631/12/2017
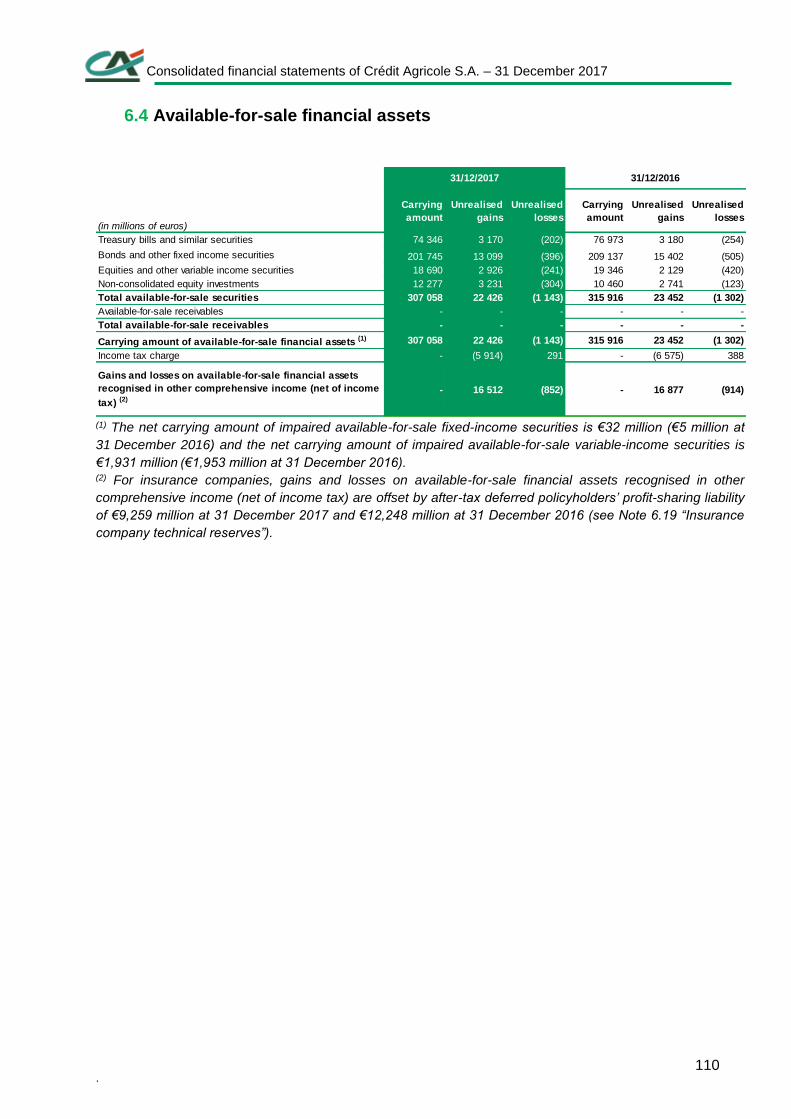
Consolidated financial statements of Crédit Agricole S.A. – 31 December 2017
. 110
6.4 Available-for-sale financial assets
(1) The net carrying amount of impaired available-for-sale fixed-income securities is €32 million (€5 million at
31 December 2016) and the net carrying amount of impaired available-for-sale variable-income securities is
€1,931 million (€1,953 million at 31 December 2016). (2) For insurance companies, gains and losses on available-for-sale financial assets recognised in other
comprehensive income (net of income tax) are offset by after-tax deferred policyholders’ profit-sharing liability
of €9,259 million at 31 December 2017 and €12,248 million at 31 December 2016 (see Note 6.19 “Insurance
company technical reserves”).
(in millions of euros)
Carrying
amount
Unrealised
gains
Unrealised
losses
Carrying
amount
Unrealised
gains
Unrealised
losses
Treasury bills and similar securities 74 346 3 170 (202) 76 973 3 180 (254)
201 745 13 099 (396) 209 137 15 402 (505)
Equities and other variable income securities 18 690 2 926 (241) 19 346 2 129 (420)
Non-consolidated equity investments 12 277 3 231 (304) 10 460 2 741 (123)
Total available-for-sale securities 307 058 22 426 (1 143) 315 916 23 452 (1 302)
Available-for-sale receivables - - - - - -
Total available-for-sale receivables - - - - - -
307 058 22 426 (1 143) 315 916 23 452 (1 302)
Income tax charge - (5 914) 291 - (6 575) 388
- 16 512 (852) - 16 877 (914)
31/12/2017 31/12/2016
Bonds and other fixed income securities
Carrying amount of available-for-sale financial assets (1)
Gains and losses on available-for-sale financial assets
recognised in other comprehensive income (net of income
tax) (2)
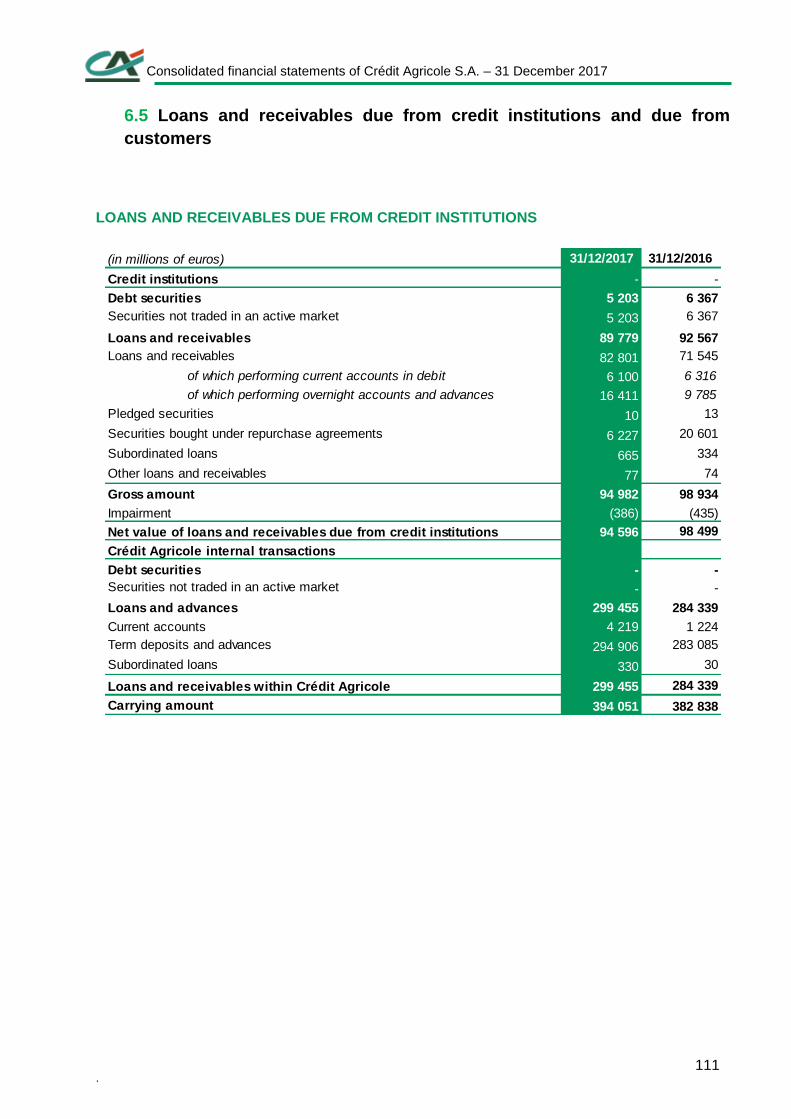
Consolidated financial statements of Crédit Agricole S.A. – 31 December 2017
. 111
6.5 Loans and receivables due from credit institutions and due from
customers
LOANS AND RECEIVABLES DUE FROM CREDIT INSTITUTIONS
31/12/2017 31/12/2016
- -
Debt securities 5 203 6 367
5 203 6 367
Loans and receivables 89 779 92 567
82 801 71 545
of which performing current accounts in debit 6 100 6 316
of which performing overnight accounts and advances 16 411 9 785
10 13
6 227 20 601
665 334
77 74
94 982 98 934
(386) (435)
94 596 98 499
Crédit Agricole internal transactions
Debt securities - -
- -
Loans and advances 299 455 284 339
4 219 1 224
294 906 283 085
330 30
299 455 284 339
394 051 382 838
Term deposits and advances
Loans and receivables within Crédit Agricole
(in millions of euros)
Credit institutions
Pledged securities
Securities bought under repurchase agreements
Subordinated loans
Securities not traded in an active market
Other loans and receivables
Gross amount
Current accounts
Loans and receivables
Impairment
Net value of loans and receivables due from credit institutions
Carrying amount
Subordinated loans
Securities not traded in an active market
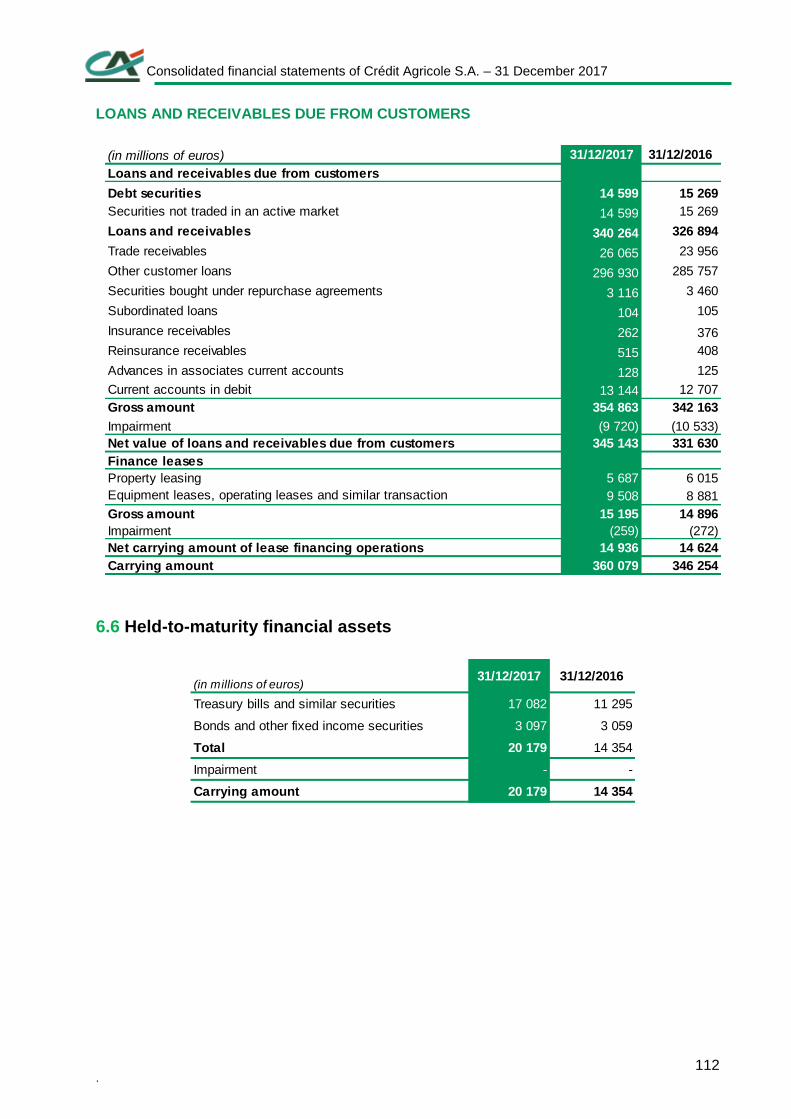
Consolidated financial statements of Crédit Agricole S.A. – 31 December 2017
. 112
LOANS AND RECEIVABLES DUE FROM CUSTOMERS
6.6 Held-to-maturity financial assets
31/12/2017 31/12/2016
Loans and receivables due from customers
Debt securities 14 599 15 269
14 599 15 269
Loans and receivables 340 264 326 894
26 065 23 956
296 930 285 757
3 116 3 460
104 105
262 376
515 408
128 125
13 144 12 707
354 863 342 163
Impairment (9 720) (10 533)
345 143 331 630
Finance leases
5 687 6 015
9 508 8 881
15 195 14 896
Impairment (259) (272)
14 936 14 624
360 079 346 254
Reinsurance receivables
Advances in associates current accounts
Current accounts in debit
Securities not traded in an active market
Trade receivables
Other customer loans
Securities bought under repurchase agreements
Subordinated loans
Insurance receivables
(in millions of euros)
Carrying amount
Gross amount
Property leasing
Equipment leases, operating leases and similar transaction
Net value of loans and receivables due from customers
Gross amount
Net carrying amount of lease financing operations
31/12/2017 31/12/2016
17 082 11 295
3 097 3 059
20 179 14 354
Impairment - -
20 179 14 354Carrying amount
(in millions of euros)
Treasury bills and similar securities
Bonds and other fixed income securities
Total
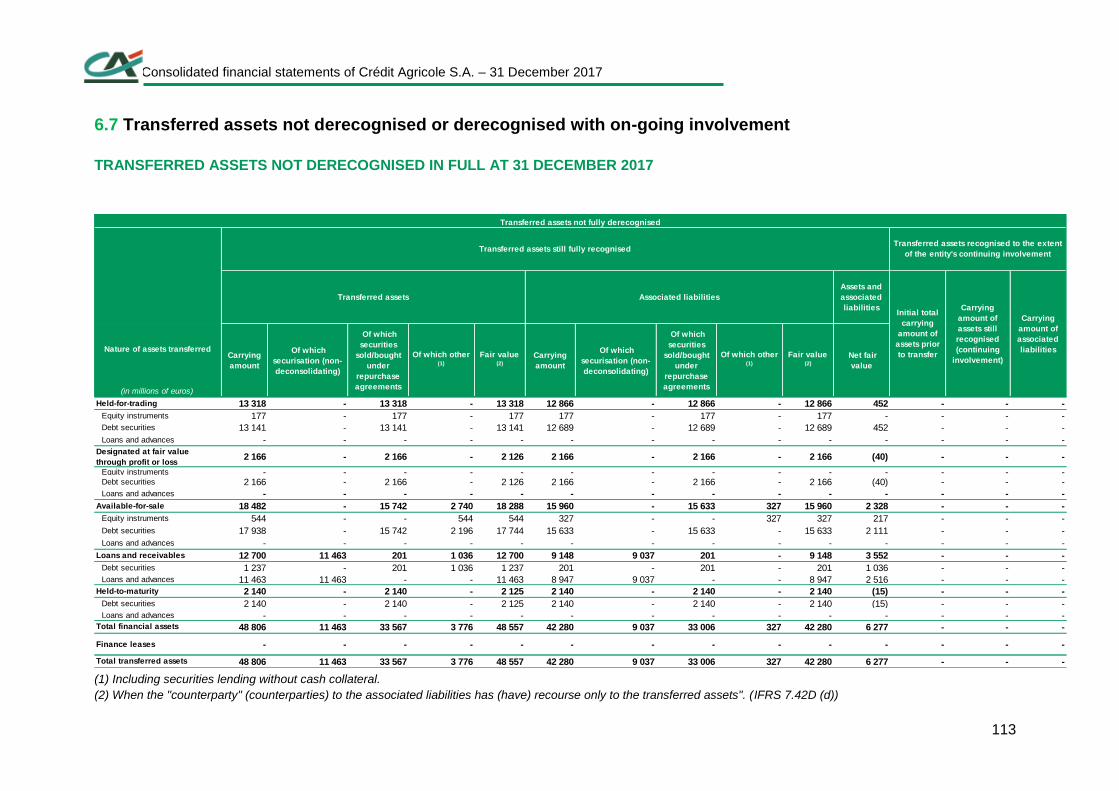
Consolidated financial statements of Crédit Agricole S.A. – 31 December 2017
113
6.7 Transferred assets not derecognised or derecognised with on-going involvement
TRANSFERRED ASSETS NOT DERECOGNISED IN FULL AT 31 DECEMBER 2017
(1) Including securities lending without cash collateral.
(2) When the "counterparty" (counterparties) to the associated liabilities has (have) recourse only to the transferred assets". (IFRS 7.42D (d))
Assets and
associated
liabilities
Nature of assets transferred
(in millions of euros)
Carrying
amount
Of which
securisation (non-
deconsolidating)
Of which
securities
sold/bought
under
repurchase
agreements
Of which other (1)
Fair value (2)
Carrying
amount
Of which
securisation (non-
deconsolidating)
Of which
securities
sold/bought
under
repurchase
agreements
Of which other (1)
Fair value (2)
Net fair
value
Held-for-trading 13 318 - 13 318 - 13 318 12 866 - 12 866 - 12 866 452 - - -
Equity instruments 177 - 177 - 177 177 - 177 - 177 - - - -
Debt securities 13 141 - 13 141 - 13 141 12 689 - 12 689 - 12 689 452 - - -
Loans and advances - - - - - - - - - - - - - -
Designated at fair value
through profit or loss2 166 - 2 166 - 2 126 2 166 - 2 166 - 2 166 (40) - - -
Equity instruments - - - - - - - - - - - - - - Debt securities 2 166 - 2 166 - 2 126 2 166 - 2 166 - 2 166 (40) - - -
Loans and advances - - - - - - - - - - - - - -
Available-for-sale 18 482 - 15 742 2 740 18 288 15 960 - 15 633 327 15 960 2 328 - - -
Equity instruments 544 - - 544 544 327 - - 327 327 217 - - -
Debt securities 17 938 - 15 742 2 196 17 744 15 633 - 15 633 - 15 633 2 111 - - -
Loans and advances - - - - - - - - - - - - - -
Loans and receivables 12 700 11 463 201 1 036 12 700 9 148 9 037 201 - 9 148 3 552 - - -
Debt securities 1 237 - 201 1 036 1 237 201 - 201 - 201 1 036 - - -
Loans and advances 11 463 11 463 - - 11 463 8 947 9 037 - - 8 947 2 516 - - -
Held-to-maturity 2 140 - 2 140 - 2 125 2 140 - 2 140 - 2 140 (15) - - -
Debt securities 2 140 - 2 140 - 2 125 2 140 - 2 140 - 2 140 (15) - - -
Loans and advances - - - - - - - - - - - - - - Total financial assets 48 806 11 463 33 567 3 776 48 557 42 280 9 037 33 006 327 42 280 6 277 - - -
Finance leases - - - - - - - - - - - - - -
Total transferred assets 48 806 11 463 33 567 3 776 48 557 42 280 9 037 33 006 327 42 280 6 277 - - -
Transferred assets not fully derecognised
Transferred assets still fully recognisedTransferred assets recognised to the extent
of the entity's continuing involvement
Transferred assets Associated liabilities
Initial total
carrying
amount of
assets prior
to transfer
Carrying
amount of
assets still
recognised
(continuing
involvement)
Carrying
amount of
associated
liabilities
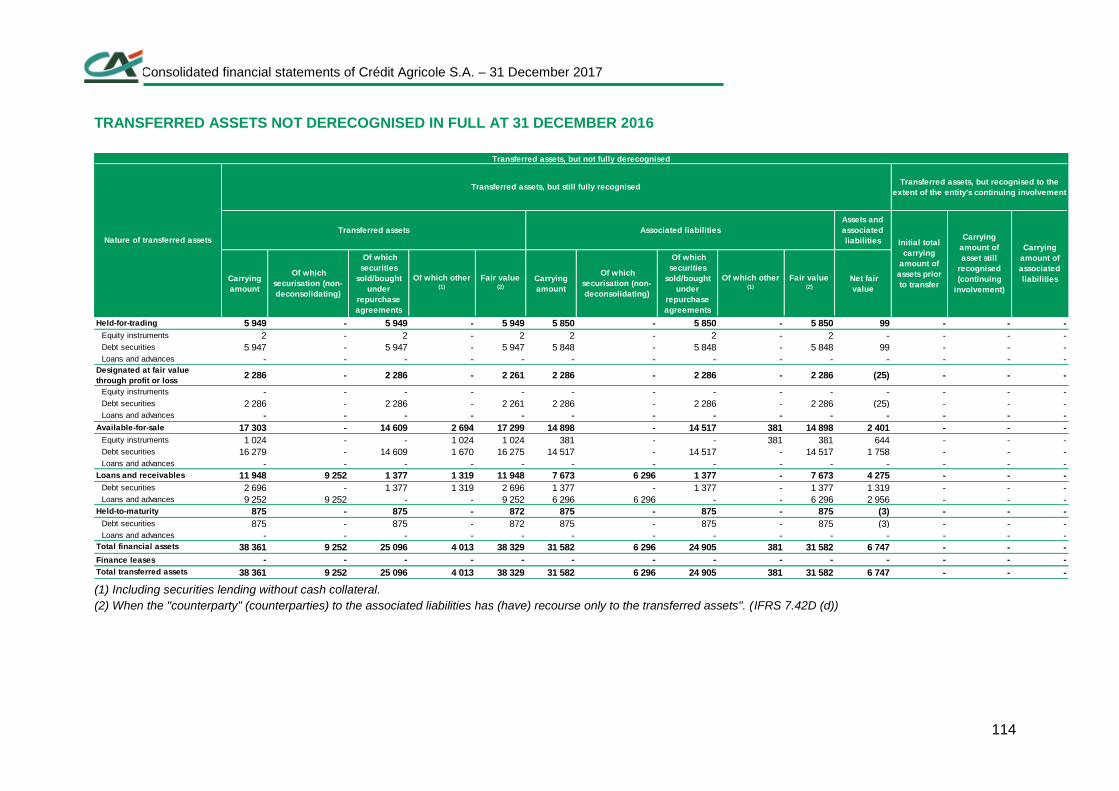
Consolidated financial statements of Crédit Agricole S.A. – 31 December 2017
114
TRANSFERRED ASSETS NOT DERECOGNISED IN FULL AT 31 DECEMBER 2016
(1) Including securities lending without cash collateral.
(2) When the "counterparty" (counterparties) to the associated liabilities has (have) recourse only to the transferred assets". (IFRS 7.42D (d))
Assets and
associated
liabilities
Carrying
amount
Of which
securisation (non-
deconsolidating)
Of which
securities
sold/bought
under
repurchase
agreements
Of which other (1)
Fair value (2)
Carrying
amount
Of which
securisation (non-
deconsolidating)
Of which
securities
sold/bought
under
repurchase
agreements
Of which other (1)
Fair value (2)
Net fair
value
Held-for-trading 5 949 - 5 949 - 5 949 5 850 - 5 850 - 5 850 99 - - -
Equity instruments 2 - 2 - 2 2 - 2 - 2 - - - -
Debt securities 5 947 - 5 947 - 5 947 5 848 - 5 848 - 5 848 99 - - -
Loans and advances - - - - - - - - - - - - - - Designated at fair value
through profit or loss2 286 - 2 286 - 2 261 2 286 - 2 286 - 2 286 (25) - - -
Equity instruments - - - - - - - - - - - - - -
Debt securities 2 286 - 2 286 - 2 261 2 286 - 2 286 - 2 286 (25) - - -
Loans and advances - - - - - - - - - - - - - -
Available-for-sale 17 303 - 14 609 2 694 17 299 14 898 - 14 517 381 14 898 2 401 - - -
Equity instruments 1 024 - - 1 024 1 024 381 - - 381 381 644 - - -
Debt securities 16 279 - 14 609 1 670 16 275 14 517 - 14 517 - 14 517 1 758 - - -
Loans and advances - - - - - - - - - - - - - -
Loans and receivables 11 948 9 252 1 377 1 319 11 948 7 673 6 296 1 377 - 7 673 4 275 - - -
Debt securities 2 696 - 1 377 1 319 2 696 1 377 - 1 377 - 1 377 1 319 - - -
Loans and advances 9 252 9 252 - - 9 252 6 296 6 296 - - 6 296 2 956 - - -
Held-to-maturity 875 - 875 - 872 875 - 875 - 875 (3) - - -
Debt securities 875 - 875 - 872 875 - 875 - 875 (3) - - -
Loans and advances - - - - - - - - - - - - - - Total financial assets 38 361 9 252 25 096 4 013 38 329 31 582 6 296 24 905 381 31 582 6 747 - - -
Finance leases - - - - - - - - - - - - - -
Total transferred assets 38 361 9 252 25 096 4 013 38 329 31 582 6 296 24 905 381 31 582 6 747 - - -
Transferred assets, but not fully derecognised
Transferred assets, but still fully recognisedTransferred assets, but recognised to the
extent of the entity's continuing involvement
Transferred assets Associated liabilities
Initial total
carrying
amount of
assets prior
to transfer
Carrying
amount of
asset still
recognised
(continuing
involvement)
Carrying
amount of
associated
liabilities
Nature of transferred assets
Consolidated financial statements of Crédit Agricole S.A. – 31 December 2017
115
Securitisations
Consolidated securitisations with external investors are a transfer of assets within the meaning of
the amendment to IFRS 7. The Group effectively has an indirect contractual obligation to deliver to
external investors the cash flows from assets sold to the securitisation fund (although these assets
are recorded in the Group balance sheet through the consolidation of the fund). Receivables
assigned to the securitisation fund are used as collateral for investors.
Fully self-subscribed consolidated securitisations do not constitute a transfer of assets within the
meaning of IFRS 7.
Crédit Agricole Consumer Finance Securitisations
At 31 December 2017, Crédit Agricole Consumer Finance managed 15 consolidated vehicles for
securitisation of retail consumer loans and car dealer financing in Europe. Securitisation
transactions carried out within Crédit Agricole Consumer Finance Group are not considered to form
part of a deconsolidation transaction under IFRS and have therefore been reintegrated into Crédit
Agricole S.A. Group’s consolidated financial statements.
The carrying amounts of the relevant assets (net of related liabilities) amounted to €8,364 million at
31 December 2017. They include, in particular, outstanding customer loans with a net carrying
amount of €6,419 million. The amount of securities mobilised on the market stood at €6,899 million.
The value of securities still available to be mobilised stood at €7,995 million.
Cariparma Securitisations
At 31 December 2017, Cariparma managed two home loan securitisation vehicles. These
securitisation transactions are not considered to form part of a deconsolidation transaction under
IFRS and have therefore been reintegrated into Crédit Agricole S.A. Group’s consolidated financial
statements.
The carrying amounts of the relevant assets amounted to €10,340 million at 31 December 2017.
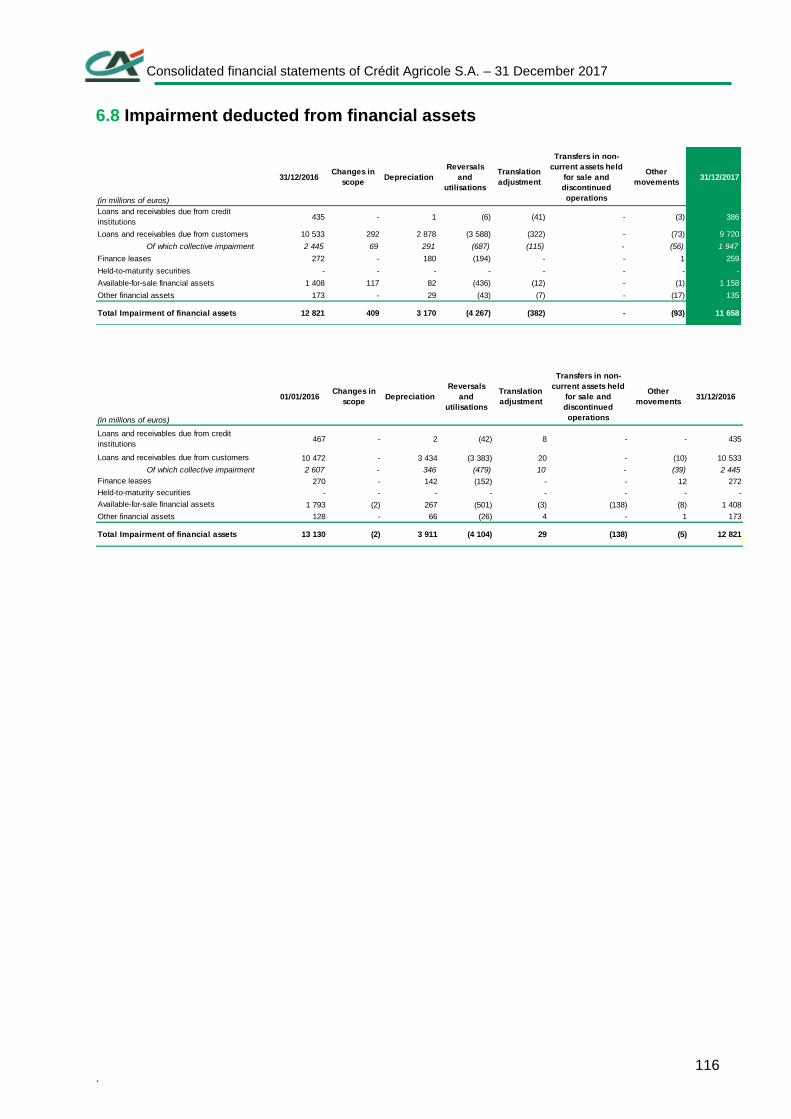
Consolidated financial statements of Crédit Agricole S.A. – 31 December 2017
. 116
6.8 Impairment deducted from financial assets
31/12/2016Changes in
scopeDepreciation
Reversals
and
utilisations
Translation
adjustment
Transfers in non-
current assets held
for sale and
discontinued
operations
Other
movements31/12/2017
435 - 1 (6) (41) - (3) 386
10 533 292 2 878 (3 588) (322) - (73) 9 720
Of which collective impairment 2 445 69 291 (687) (115) - (56) 1 947
272 - 180 (194) - - 1 259
- - - - - - - -
1 408 117 82 (436) (12) - (1) 1 158
173 - 29 (43) (7) - (17) 135
(in millions of euros)
Loans and receivables due from credit
institutions
Loans and receivables due from customers
Finance leases
Held-to-maturity securities
Available-for-sale financial assets
Other financial assets
Total Impairment of financial assets 12 821 (93)409 3 170 (4 267) (382) - 11 658
01/01/2016Changes in
scopeDepreciation
Reversals
and
utilisations
Translation
adjustment
Transfers in non-
current assets held
for sale and
discontinued
operations
Other
movements31/12/2016
467 - 2 (42) 8 - - 435
10 472 - 3 434 (3 383) 20 - (10) 10 533
Of which collective impairment 2 607 - 346 (479) 10 - (39) 2 445
270 - 142 (152) - - 12 272
- - - - - - - -
1 793 (2) 267 (501) (3) (138) (8) 1 408
128 - 66 (26) 4 - 1 173
Loans and receivables due from credit
institutions
Loans and receivables due from customers
Available-for-sale financial assets
Other financial assets
Total Impairment of financial assets 13 130
Finance leases
(in millions of euros)
12 8213 911 (5)(2) (4 104) 29 (138)
Held-to-maturity securities
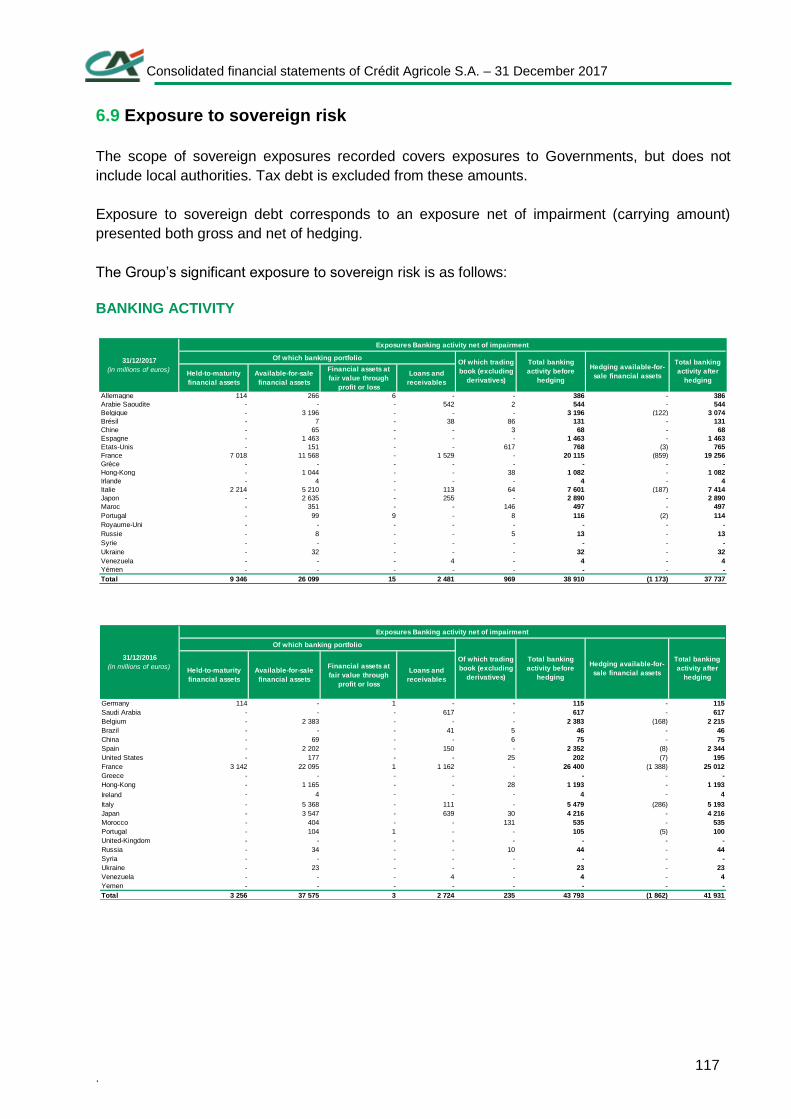
Consolidated financial statements of Crédit Agricole S.A. – 31 December 2017
. 117
6.9 Exposure to sovereign risk
The scope of sovereign exposures recorded covers exposures to Governments, but does not
include local authorities. Tax debt is excluded from these amounts.
Exposure to sovereign debt corresponds to an exposure net of impairment (carrying amount)
presented both gross and net of hedging.
The Group’s significant exposure to sovereign risk is as follows:
BANKING ACTIVITY
Held-to-maturity
financial assets
Available-for-sale
financial assets
Financial assets at
fair value through
profit or loss
Loans and
receivables
Allemagne 114 266 6 - - 386 - 386
Arabie Saoudite - - - 542 2 544 - 544
Belgique - 3 196 - - - 3 196 (122) 3 074
Brésil - 7 - 38 86 131 - 131
Chine - 65 - - 3 68 - 68
Espagne - 1 463 - - - 1 463 - 1 463
Etats-Unis - 151 - - 617 768 (3) 765
France 7 018 11 568 - 1 529 - 20 115 (859) 19 256
Grèce - - - - - - - -
Hong-Kong - 1 044 - - 38 1 082 - 1 082
Irlande - 4 - - - 4 - 4
Italie 2 214 5 210 - 113 64 7 601 (187) 7 414
Japon - 2 635 - 255 - 2 890 - 2 890
Maroc - 351 - - 146 497 - 497
Portugal - 99 9 - 8 116 (2) 114
Royaume-Uni - - - - - - - -
Russie - 8 - - 5 13 - 13
Syrie - - - - - - - -
Ukraine - 32 - - - 32 - 32
Venezuela - - - 4 - 4 - 4
Yémen - - - - - - - -
Total 9 346 26 099 15 2 481 969 38 910 (1 173) 37 737
Total banking
activity before
hedging
Hedging available-for-
sale financial assets
Total banking
activity after
hedging
31/12/2017
(in millions of euros)
Exposures Banking activity net of impairment
Of which banking portfolioOf which trading
book (excluding
derivatives)
Held-to-maturity
financial assets
Available-for-sale
financial assets
Financial assets at
fair value through
profit or loss
Loans and
receivables
Germany 114 - 1 - - 115 - 115
Saudi Arabia - - - 617 - 617 - 617
Belgium - 2 383 - - - 2 383 (168) 2 215
Brazil - - - 41 5 46 - 46
China - 69 - - 6 75 - 75
Spain - 2 202 - 150 - 2 352 (8) 2 344
United States - 177 - - 25 202 (7) 195
France 3 142 22 095 1 1 162 - 26 400 (1 388) 25 012
Greece - - - - - - - -
Hong-Kong - 1 165 - - 28 1 193 - 1 193
Ireland - 4 - - - 4 - 4
Italy - 5 368 - 111 - 5 479 (286) 5 193
Japan - 3 547 - 639 30 4 216 - 4 216
Morocco - 404 - - 131 535 - 535
Portugal - 104 1 - - 105 (5) 100
United-Kingdom - - - - - - - -
Russia - 34 - - 10 44 - 44
Syria - - - - - - - -
Ukraine - 23 - - - 23 - 23
Venezuela - - - 4 - 4 - 4
Yemen - - - - - - - -
Total 3 256 37 575 3 2 724 235 43 793 (1 862) 41 931
Of which banking portfolio
Of which trading
book (excluding
derivatives)
Total banking
activity before
hedging
Hedging available-for-
sale financial assets
Total banking
activity after
hedging
31/12/2016
(in millions of euros)
Exposures Banking activity net of impairment
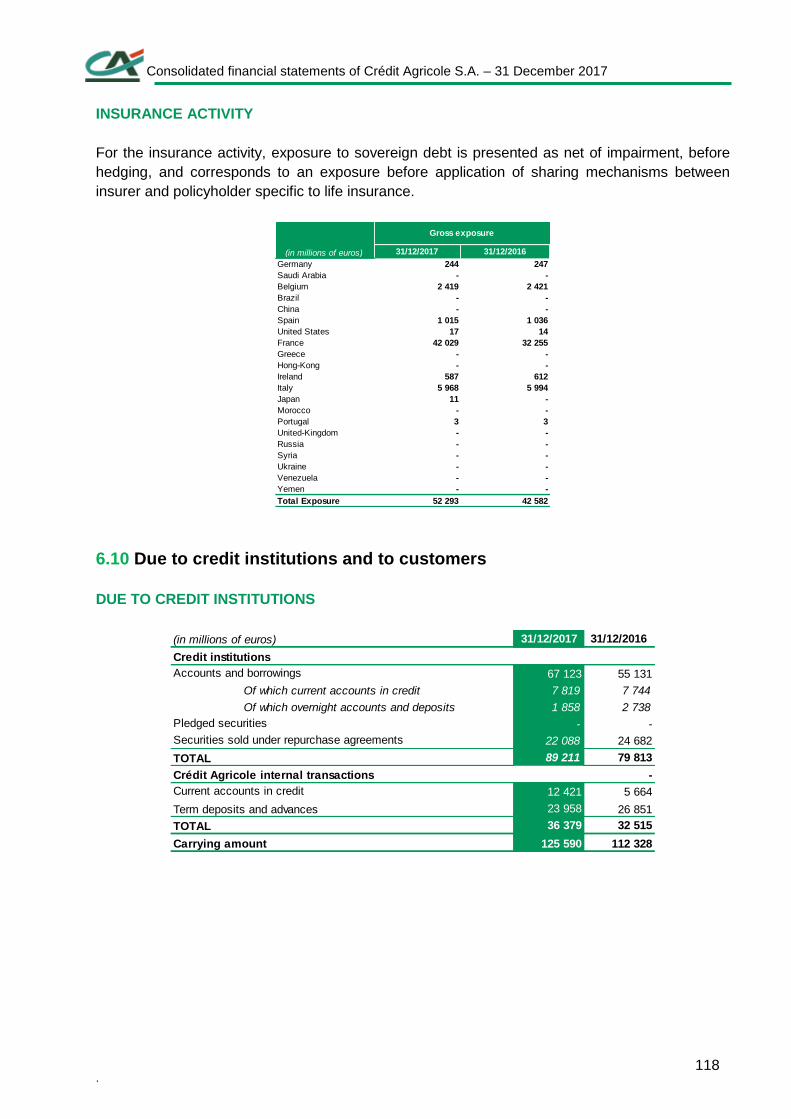
Consolidated financial statements of Crédit Agricole S.A. – 31 December 2017
. 118
INSURANCE ACTIVITY
For the insurance activity, exposure to sovereign debt is presented as net of impairment, before
hedging, and corresponds to an exposure before application of sharing mechanisms between
insurer and policyholder specific to life insurance.
6.10 Due to credit institutions and to customers
DUE TO CREDIT INSTITUTIONS
31/12/2017 31/12/2016
Germany 244 247
Saudi Arabia - -
Belgium 2 419 2 421
Brazil - -
China - -
Spain 1 015 1 036
United States 17 14
France 42 029 32 255
Greece - -
Hong-Kong - -
Ireland 587 612
Italy 5 968 5 994
Japan 11 -
Morocco - -
Portugal 3 3
United-Kingdom - -
Russia - -
Syria - -
Ukraine - -
Venezuela - -
Yemen - -
Total Exposure 52 293 42 582
(in millions of euros)
Gross exposure
31/12/2017 31/12/2016
67 123 55 131
Of which current accounts in credit 7 819 7 744
Of which overnight accounts and deposits 1 858 2 738
- -
22 088 24 682
89 211 79 813
-
12 421 5 664
Term deposits and advances 23 958 26 851
36 379 32 515
125 590 112 328
(in millions of euros)
Credit institutions
Accounts and borrowings
Pledged securities
Securities sold under repurchase agreements
TOTAL
Crédit Agricole internal transactions
Current accounts in credit
TOTAL
Carrying amount
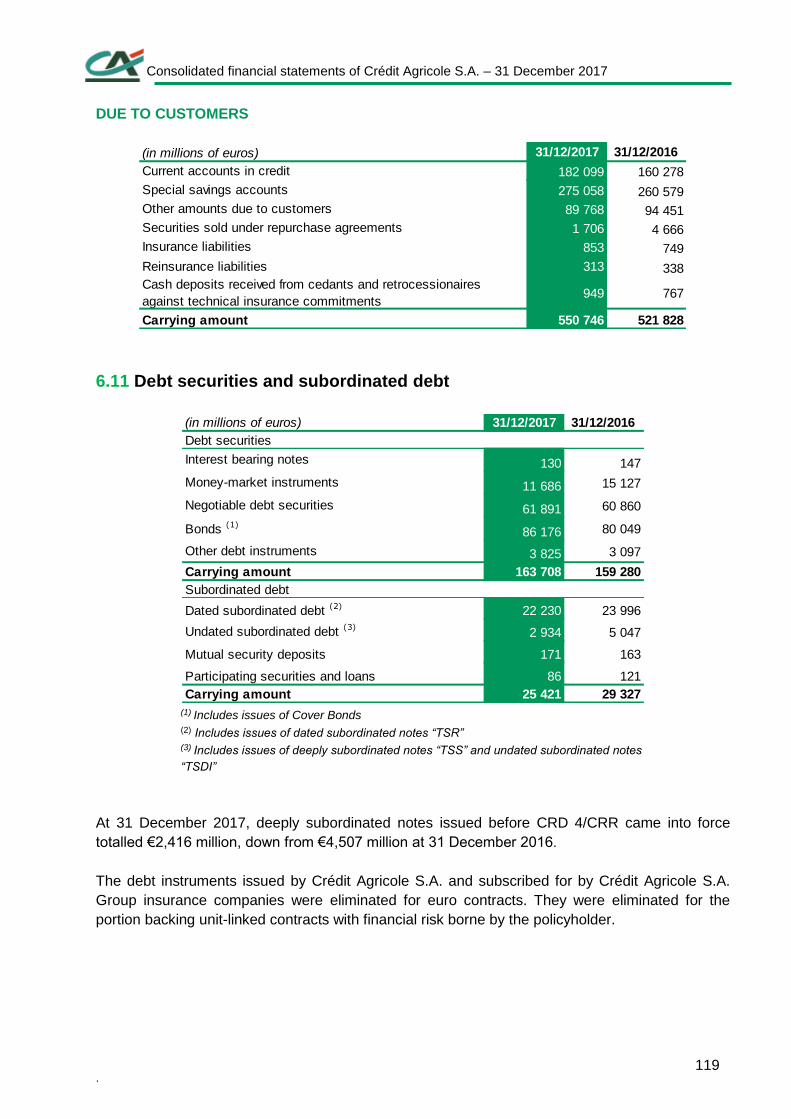
Consolidated financial statements of Crédit Agricole S.A. – 31 December 2017
. 119
DUE TO CUSTOMERS
6.11 Debt securities and subordinated debt
(1) Includes issues of Cover Bonds (2) Includes issues of dated subordinated notes “TSR” (3) Includes issues of deeply subordinated notes “TSS” and undated subordinated notes
“TSDI”
At 31 December 2017, deeply subordinated notes issued before CRD 4/CRR came into force
totalled €2,416 million, down from €4,507 million at 31 December 2016.
The debt instruments issued by Crédit Agricole S.A. and subscribed for by Crédit Agricole S.A.
Group insurance companies were eliminated for euro contracts. They were eliminated for the
portion backing unit-linked contracts with financial risk borne by the policyholder.
31/12/2017 31/12/2016
182 099 160 278
275 058 260 579
89 768 94 451
1 706 4 666
853 749
313 338
949 767
550 746 521 828
Current accounts in credit
(in millions of euros)
Carrying amount
Special savings accounts
Other amounts due to customers
Securities sold under repurchase agreements
Insurance liabilities
Reinsurance liabilities
Cash deposits received from cedants and retrocessionaires
against technical insurance commitments
31/12/2017 31/12/2016
Debt securities
130 147
11 686 15 127
61 891 60 860
86 176 80 049
3 825 3 097
163 708 159 280
22 230 23 996
Undated subordinated debt (3)2 934 5 047
Mutual security deposits 171 163
Participating securities and loans 86 121
25 421 29 327
(in millions of euros)
Other debt instruments
Carrying amount
Subordinated debt
Interest bearing notes
Money-market instruments
Negotiable debt securities
Bonds (1)
Carrying amount
Dated subordinated debt (2)
Consolidated financial statements of Crédit Agricole S.A. – 31 December 2017
. 120
SUBORDINATED DEBT ISSUES
The issue of subordinated debt plays a part in regulatory capital management while contributing to
refinancing all of Crédit Agricole S.A.’s operations.
The Capital Requirements Regulation and Directive (CRD 4/CRR) define the conditions under
which subordinated instruments qualify as regulatory capital and set out the terms and conditions
for progressive disqualification of older instruments that do not meet these requirements, between
1 January 2014 (effective date of the CRD 4/CRR) and 1 January 2022.
All subordinated debt issuance, whether new or old, is likely to be subject to Bail-in in certain
circumstances, particularly in the event of resolution of the issuing bank, in accordance with the
Order of 20 August 2015 containing various provisions adapting French legislation to EU law on
financial matters, transposing EU Directive of 15 May 2014 establishing a framework for the
recovery and resolution of credit institutions and investment firms (Bank Recovery and Resolution
Directive, or BRRD).
Details of the types of subordinated debt issued by Crédit Agricole S.A. and still outstanding are as
follows: they comprise undated subordinated debt (issued before CRD IV/CRR came into force),
dated subordinated notes “TSR”, deeply subordinated notes “TSS” issued before CRD IV/CRR
came into force and deeply subordinated notes “TSS” issued after CRD IV/CRR came into force.
Deeply subordinated notes (TSS)
TSS - Volumes issued before CRD IV/CRR came into force
Deeply subordinated notes (TSS) issued by Crédit Agricole S.A. are either fixed or floating-rate and
undated (unless they contain a contractually defined early redemption clause and subject to certain
conditions). They are senior to Common Equity Tier 1 Capital (CET1), including Crédit Agricole S.A.
shares, but subordinated (lower-ranking) to all other more senior subordinated debt (including dated
subordinated notes and undated subordinated notes).
Deeply subordinated notes are generally fixed-rate then floating-rate beyond a certain duration and
include early repayment options at the discretion of Crédit Agricole S.A. (with certain reserves)
beyond this same duration.
The coupons are non-cumulative and payment of a dividend by Crédit Agricole S.A. entails the
obligation to pay the coupon on the TSS for a period of one year. However, the coupons may not
be paid if Crédit Agricole S.A. experiences a regulatory event, i.e., falls below the legal minimum
equity ratio as defined by Pillar 1 or Pillar 2, or if the competent regulator anticipates such an event
in the near future.
The notional amount and accrued interest are impaired, up to a maximum of 0.01 of the security’s
monetary unit if the issuer’s total capital ratio falls below a minimum threshold, either contractual or
regulatory, or by decision of the competent regulator.
Additional Tier 1 (AT1) TSS issued after CRD IV/CRR came into force
The Additional Tier 1 deeply subordinated notes issued by Crédit Agricole S.A. are consistent with
the new CRD IV/CRR rules.
The Additional Tier 1 (AT1) TSS issued by Crédit Agricole S.A. are either fixed and/or floating-rate
and undated (unless they contain a contractually defined early redemption clause and subject to
Consolidated financial statements of Crédit Agricole S.A. – 31 December 2017
. 121
certain conditions). They are senior to Common Equity Tier 1 Capital (CET1), including Crédit
Agricole S.A. shares, but subordinated to all other more senior subordinated debt and rank pari
passu with TSS issued before CRD IV/CRR came into force.
Additional Tier 1 TSS are generally fixed-rate but resettable beyond a certain duration and can
include early repayment options subject to certain conditions beyond this same duration.
Additional Tier 1 TSS issued by Crédit Agricole S.A. contain a clause providing for temporary partial
impairment of the securities in the event the phased-in Basel III Common Equity Tier 1 regulatory
ratio of Crédit Agricole Group falls below 7% or the phased-in Basel III Common Equity Tier 1
regulatory ratio of Crédit Agricole S.A. falls below 5.125%. They may be impaired up to a maximum
of 0.01 of the issue’s monetary unit.
Coupons are optional at the discretion of Crédit Agricole S.A. (which may decide on the suspension
of interest payments) or at the competent regulator’s request, and subject to regulatory limits if
distributable amounts are insufficient or the Crédit Agricole Group or Crédit Agricole S.A. Group
fails to meet regulatory requirements for total capital (including capital buffers).
Undated subordinated notes (TSDI) (issued before CRD IV/CRR came into
force)
Undated subordinated notes (TSDI) issued by Crédit Agricole S.A. before CRD IV/CRR came into
force are usually fixed-rate and pay interest quarterly, on a perpetual basis.
They are only redeemable in the event of Crédit Agricole S.A.’s liquidation (judicial or otherwise),
unless they contain a contractually defined early redemption clause and subject to certain
conditions (see “Early redemption as part of the conditions for all subordinated note issues (TSDI,
TSR or TSS)” below).
Like the dated subordinated notes ("TSR" - see below « Issues of dated subordinated notes (TSR)
and contingent capital securities "), they are subordinated securities (principal and interest) in
reference to Article L. 228-97 of the French Commercial Code.
In particular, the coupon may be suspended if the General Meeting of Shareholders of Crédit
Agricole S.A. duly notes that there were no distributable earnings for the relevant financial year.
It should be noted that TSDI have a contractually defined rank senior to Common Equity Tier 1
Capital (CET1), including Crédit Agricole S.A. shares, TSS (deeply subordinated notes),
participating notes granted to Crédit Agricole S.A. and participating securities issued by it; they rank
pari passu with other TDSI and TSR (see below) of the same rank and subordinate to all other more
senior debt (notably preferred and non-preferred senior bonds).
Dated subordinated notes (TSR) and contingent capital securities
Dated subordinated notes (TSR) issued by Crédit Agricole S.A. are usually fixed-rate and pay
interest on a quarterly or annual basis with a fixed maturity. They may be redeemed prior to maturity
under contractually defined conditions and subject to certain conditions.
TSR are issued either on the French market under French law or on the international markets under
UK, State of New York (United States) or Japanese law.
TSR differ from preferred and non-preferred senior bonds in terms of their ranking (principal and
interest) as contractually defined by the subordination clause with reference to Article L. 228-97 of
the French Commercial Code.
In the case of notes issued by Crédit Agricole S.A., in the event of liquidation (judicial or otherwise),
dated subordinated notes (TSR) will be repaid after all other secured and unsecured creditors
(including creditors of preferred and non-preferred senior bonds), but before either participating
Consolidated financial statements of Crédit Agricole S.A. – 31 December 2017
. 122
loans provided to Crédit Agricole S.A., or any participating notes issued by the Bank, as well as any
deeply subordinated notes (“TSS”, see above “Deeply subordinated notes (TSS)”).
Early redemption as part of the conditions for all subordinated note issues
(TSDI, TSR or TSS)
The above-mentioned TSDI, TSR or TSS may be the subject of:
• buy-back transactions, either on the market through public takeover bids or exchange offers
subject to approval by the competent regulator, where appropriate, and/or at the initiative of Crédit
Agricole S.A., in accordance with the contractual clauses applicable to each issue;
• the exercise of an early redemption option at the initiative of Crédit Agricole S.A. (“call
option”), under the conditions and subject to approval by the competent regulator, where
appropriate, at the times defined by the contractual terms of the issue, in the event that the issuance
agreement for the securities contains such a clause.
SENIOR NON-PREFERRED DEBT
The law on transparency, the fight against corruption and the modernisation of the economy (also
referred to as the “Sapin 2 Law”) was published in the Official Journal on 10 December 2016 and
became effective on 11 December, 2016. As part of this law, France created a new category of
senior debt -- senior “non-preferred” debt -- meeting the eligibility criteria of the TLAC and MREL
ratios (as they are presently defined). This new category of debt is also taken into account in the
draft amendment to the Bank Recovery and Resolution Directive (BRRD) published on 23
November, 2016, which points to a harmonisation of banks’ creditor ranking.
In the course of a resolution process (likely to occur prior to liquidation), it will be possible to impair
senior non-preferred securities in full or in part, or to convert them into equity as part of the bail-in
procedure, ahead of other senior debt securities (senior “preferred” debt securities), but only after
the full depreciation or the conversion into equity of subordinated instruments. The latter include
own funds-related instruments of first category (CET1 and Additional Tier 1) and second category
instruments (Tier 2). Only if the impairment or conversion of these instruments is insufficient will
senior-non preferred debt securities be used in the bail-in of a particular institution.
In a liquidation event, senior non-preferred securities will be redeemed if there still are funds
available, after the repayment of all senior preferred instruments, but ahead of subordinated
securities (in particular of dated subordinated notes TSR known as “Tier 2” own funds).
The inaugural issue of these new senior non-preferred debt securities was launched by Crédit
Agricole S.A. on 13 December 2016. The outstanding amount of senior non-preferred securities of
Crédit Agricole S.A. and Crédit Agricole Group thus stood at €7,6 billion at 31 December 2017.
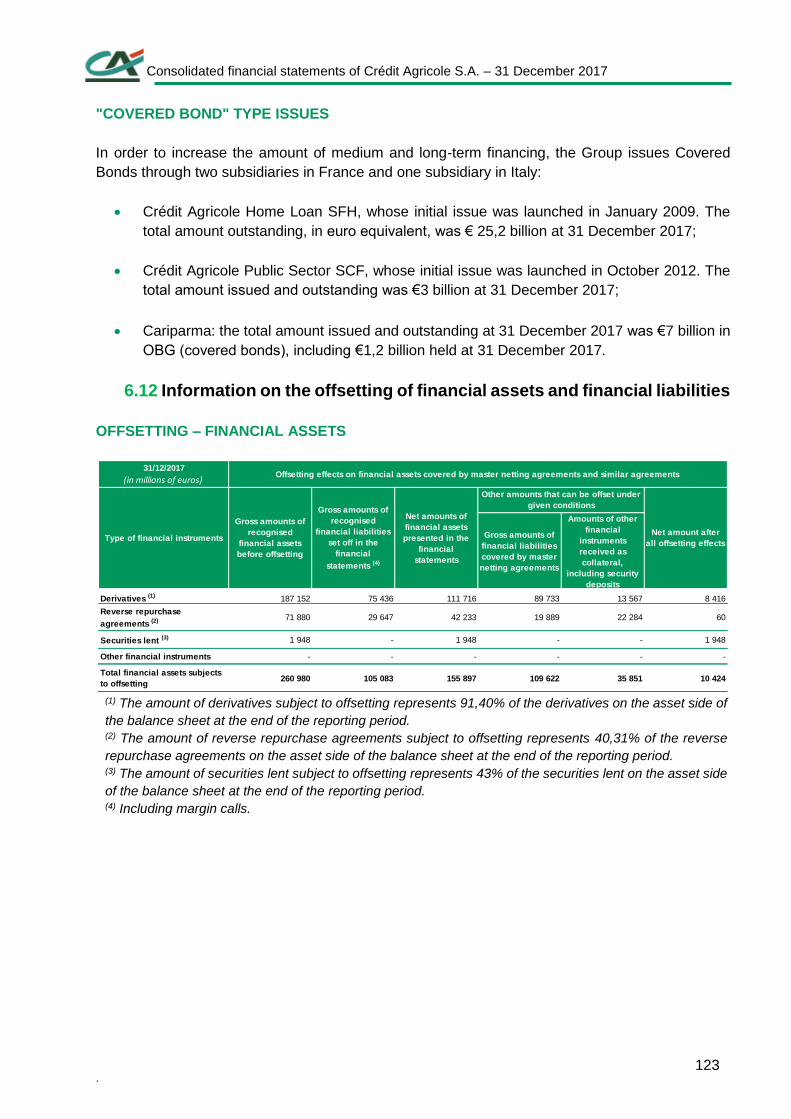
Consolidated financial statements of Crédit Agricole S.A. – 31 December 2017
. 123
"COVERED BOND" TYPE ISSUES
In order to increase the amount of medium and long-term financing, the Group issues Covered
Bonds through two subsidiaries in France and one subsidiary in Italy:
Crédit Agricole Home Loan SFH, whose initial issue was launched in January 2009. The
total amount outstanding, in euro equivalent, was € 25,2 billion at 31 December 2017;
Crédit Agricole Public Sector SCF, whose initial issue was launched in October 2012. The
total amount issued and outstanding was €3 billion at 31 December 2017;
Cariparma: the total amount issued and outstanding at 31 December 2017 was €7 billion in
OBG (covered bonds), including €1,2 billion held at 31 December 2017.
6.12 Information on the offsetting of financial assets and financial liabilities
OFFSETTING – FINANCIAL ASSETS
(1) The amount of derivatives subject to offsetting represents 91,40% of the derivatives on the asset side of
the balance sheet at the end of the reporting period. (2) The amount of reverse repurchase agreements subject to offsetting represents 40,31% of the reverse
repurchase agreements on the asset side of the balance sheet at the end of the reporting period. (3) The amount of securities lent subject to offsetting represents 43% of the securities lent on the asset side
of the balance sheet at the end of the reporting period. (4) Including margin calls.
31/12/2017
(in millions of euros)
Gross amounts of
financial liabilities
covered by master
netting agreements
Amounts of other
financial
instruments
received as
collateral,
including security
deposits
Derivatives (1) 187 152 75 436 111 716 89 733 13 567 8 416
Reverse repurchase
agreements (2) 71 880 29 647 42 233 19 889 22 284 60
Securities lent (3) 1 948 - 1 948 - - 1 948
Other financial instruments - - - - - -
Total financial assets subjects
to offsetting260 980 105 083 155 897 109 622 35 851 10 424
Offsetting effects on financial assets covered by master netting agreements and similar agreements
Type of financial instruments
Gross amounts of
recognised
financial assets
before offsetting
Gross amounts of
recognised
financial liabilities
set off in the
financial
statements (4)
Net amounts of
financial assets
presented in the
financial
statements
Other amounts that can be offset under
given conditions
Net amount after
all offsetting effects
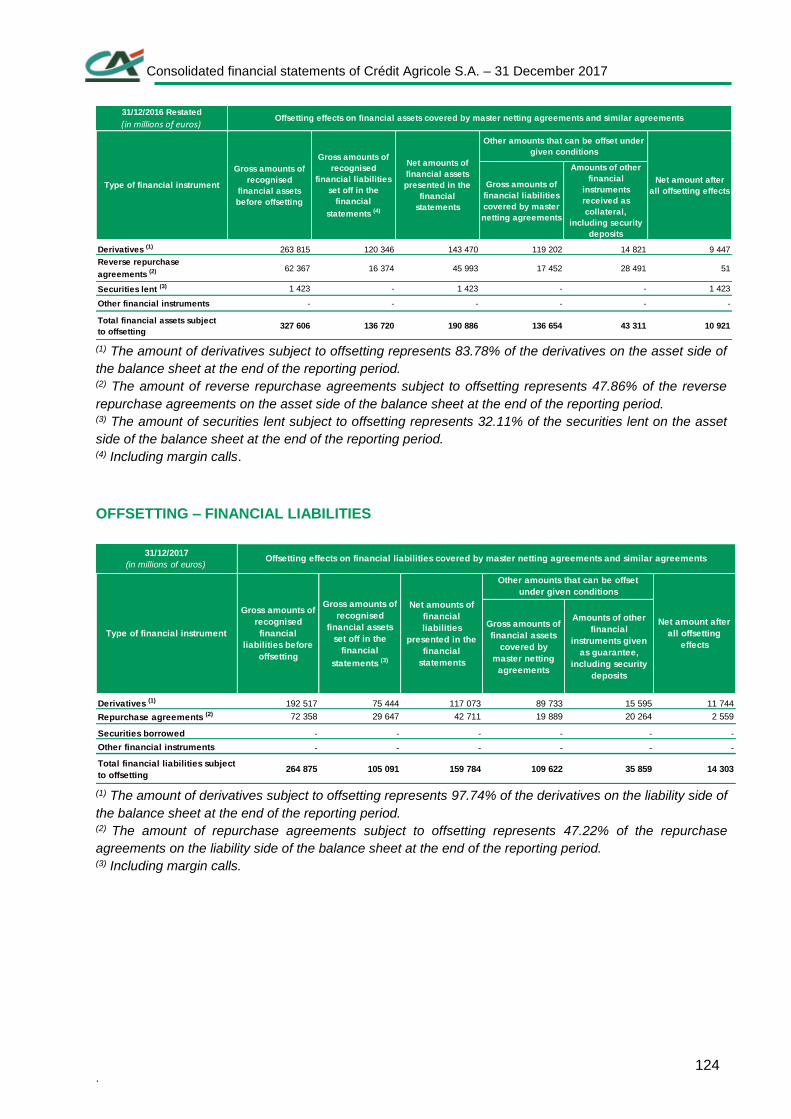
Consolidated financial statements of Crédit Agricole S.A. – 31 December 2017
. 124
(1) The amount of derivatives subject to offsetting represents 83.78% of the derivatives on the asset side of
the balance sheet at the end of the reporting period. (2) The amount of reverse repurchase agreements subject to offsetting represents 47.86% of the reverse
repurchase agreements on the asset side of the balance sheet at the end of the reporting period. (3) The amount of securities lent subject to offsetting represents 32.11% of the securities lent on the asset
side of the balance sheet at the end of the reporting period. (4) Including margin calls.
OFFSETTING – FINANCIAL LIABILITIES
(1) The amount of derivatives subject to offsetting represents 97.74% of the derivatives on the liability side of
the balance sheet at the end of the reporting period. (2) The amount of repurchase agreements subject to offsetting represents 47.22% of the repurchase
agreements on the liability side of the balance sheet at the end of the reporting period. (3) Including margin calls.
31/12/2016 Restated
(in millions of euros)
Gross amounts of
financial liabilities
covered by master
netting agreements
Amounts of other
financial
instruments
received as
collateral,
including security
deposits
Derivatives (1) 263 815 120 346 143 470 119 202 14 821 9 447
Reverse repurchase
agreements (2) 62 367 16 374 45 993 17 452 28 491 51
Securities lent (3) 1 423 - 1 423 - - 1 423
Other financial instruments - - - - - -
Total financial assets subject
to offsetting327 606 136 720 190 886 136 654 43 311 10 921
Other amounts that can be offset under
given conditions
Net amount after
all offsetting effects
Offsetting effects on financial assets covered by master netting agreements and similar agreements
Type of financial instrument
Gross amounts of
recognised
financial assets
before offsetting
Gross amounts of
recognised
financial liabilities
set off in the
financial
statements (4)
Net amounts of
financial assets
presented in the
financial
statements
31/12/2017
(in millions of euros)
Gross amounts of
financial assets
covered by
master netting
agreements
Amounts of other
financial
instruments given
as guarantee,
including security
deposits
Derivatives (1) 192 517 75 444 117 073 89 733 15 595 11 744
Repurchase agreements (2) 72 358 29 647 42 711 19 889 20 264 2 559
Securities borrowed - - - - - -
Other financial instruments - - - - - -
Total financial liabilities subject
to offsetting 264 875 105 091 159 784 109 622 35 859 14 303
Offsetting effects on financial liabilities covered by master netting agreements and similar agreements
Type of financial instrument
Gross amounts of
recognised
financial
liabilities before
offsetting
Gross amounts of
recognised
financial assets
set off in the
financial
statements (3)
Net amounts of
financial
liabilities
presented in the
financial
statements
Other amounts that can be offset
under given conditions
Net amount after
all offsetting
effects
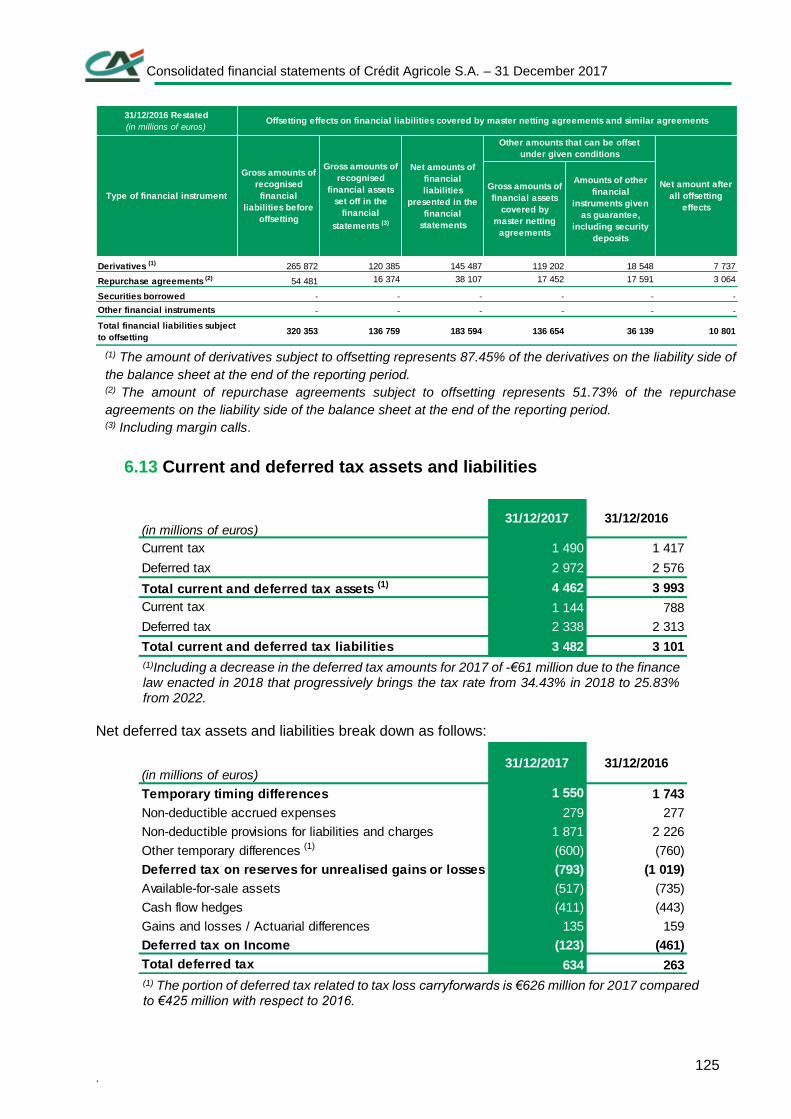
Consolidated financial statements of Crédit Agricole S.A. – 31 December 2017
. 125
(1) The amount of derivatives subject to offsetting represents 87.45% of the derivatives on the liability side of
the balance sheet at the end of the reporting period. (2) The amount of repurchase agreements subject to offsetting represents 51.73% of the repurchase
agreements on the liability side of the balance sheet at the end of the reporting period. (3) Including margin calls.
6.13 Current and deferred tax assets and liabilities
(1)Including a decrease in the deferred tax amounts for 2017 of -€61 million due to the finance law enacted in 2018 that progressively brings the tax rate from 34.43% in 2018 to 25.83% from 2022.
Net deferred tax assets and liabilities break down as follows:
(1) The portion of deferred tax related to tax loss carryforwards is €626 million for 2017 compared to €425 million with respect to 2016.
31/12/2016 Restated
(in millions of euros)
Gross amounts of
financial assets
covered by
master netting
agreements
Amounts of other
financial
instruments given
as guarantee,
including security
deposits
Derivatives (1) 265 872 120 385 145 487 119 202 18 548 7 737
Repurchase agreements (2) 54 481 16 374 38 107 17 452 17 591 3 064
Securities borrowed - - - - - -
Other financial instruments - - - - - -
Total financial liabilities subject
to offsetting 320 353 136 759 183 594 136 654 36 139 10 801
Other amounts that can be offset
under given conditions
Net amount after
all offsetting
effects
Offsetting effects on financial liabilities covered by master netting agreements and similar agreements
Type of financial instrument
Gross amounts of
recognised
financial
liabilities before
offsetting
Gross amounts of
recognised
financial assets
set off in the
financial
statements (3)
Net amounts of
financial
liabilities
presented in the
financial
statements
1 490 1 417
2 972 2 576
4 462 3 993
1 144 788
2 338 2 313
3 482 3 101
31/12/2017 31/12/2016
Current tax
Deferred tax
Current tax
Deferred tax
Total current and deferred tax liabilities
Total current and deferred tax assets (1)
(in millions of euros)
1 550 1 743
279 277
1 871 2 226
(600) (760)
(793) (1 019)
Available-for-sale assets (517) (735)
Cash flow hedges (411) (443)
Gains and losses / Actuarial differences 135 159
Deferred tax on Income (123) (461)
634 263
Deferred tax on reserves for unrealised gains or losses
Total deferred tax
Temporary timing differences
Non-deductible accrued expenses
Non-deductible provisions for liabilities and charges
31/12/2017 31/12/2016(in millions of euros)
Other temporary differences (1)
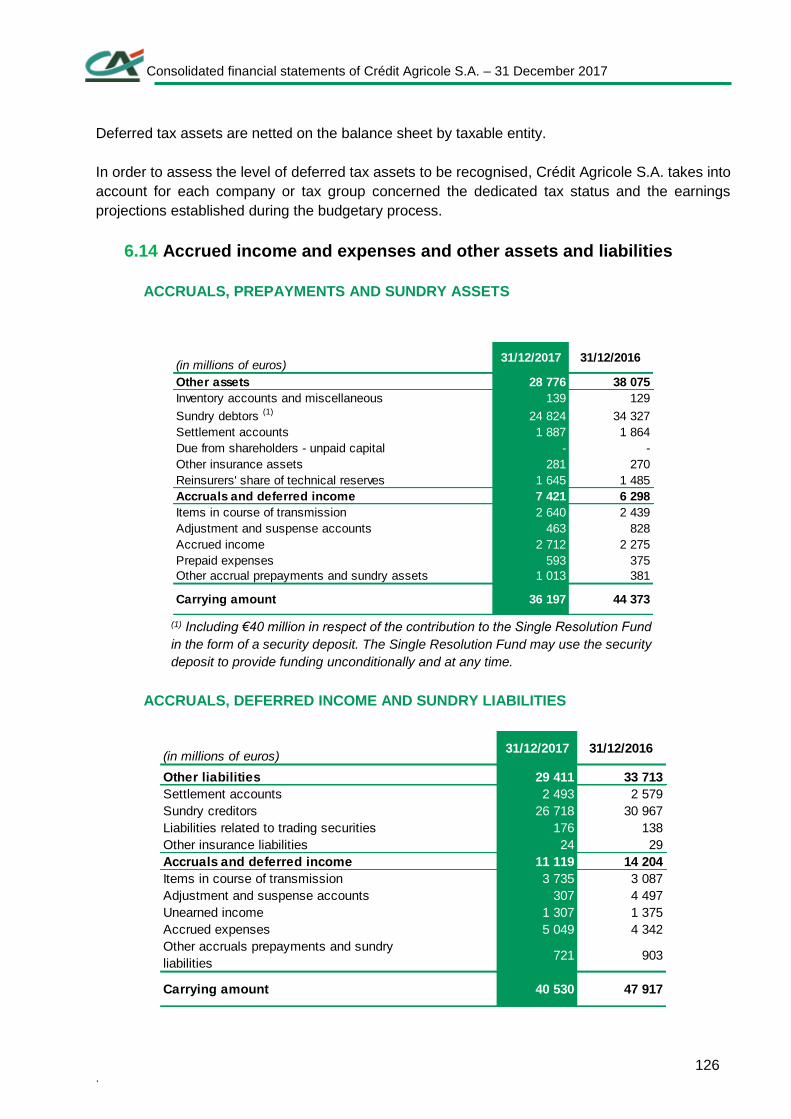
Consolidated financial statements of Crédit Agricole S.A. – 31 December 2017
. 126
Deferred tax assets are netted on the balance sheet by taxable entity.
In order to assess the level of deferred tax assets to be recognised, Crédit Agricole S.A. takes into
account for each company or tax group concerned the dedicated tax status and the earnings
projections established during the budgetary process.
6.14 Accrued income and expenses and other assets and liabilities
ACCRUALS, PREPAYMENTS AND SUNDRY ASSETS
(1) Including €40 million in respect of the contribution to the Single Resolution Fund
in the form of a security deposit. The Single Resolution Fund may use the security
deposit to provide funding unconditionally and at any time.
ACCRUALS, DEFERRED INCOME AND SUNDRY LIABILITIES
(in millions of euros)31/12/2017 31/12/2016
28 776 38 075
139 129
24 824 34 327
1 887 1 864
- -
Other insurance assets 281 270
1 645 1 485
7 421 6 298
2 640 2 439
463 828
2 712 2 275
593 375
1 013 381
Prepaid expenses
Other assets
Inventory accounts and miscellaneous
Sundry debtors (1)
Settlement accounts
Due from shareholders - unpaid capital
Reinsurers' share of technical reserves
Accruals and deferred income
Items in course of transmission
Adjustment and suspense accounts
Accrued income
Other accrual prepayments and sundry assets
Carrying amount 36 197 44 373
(in millions of euros)31/12/2017 31/12/2016
Other liabilities 29 411 33 713
2 493 2 579
Sundry creditors 26 718 30 967
Liabilities related to trading securities 176 138
Other insurance liabilities 24 29
Accruals and deferred income 11 119 14 204
Items in course of transmission 3 735 3 087
Adjustment and suspense accounts 307 4 497
Unearned income 1 307 1 375
Accrued expenses 5 049 4 342
Other accruals prepayments and sundry
liabilities721 903
Carrying amount 40 530 47 917
Settlement accounts
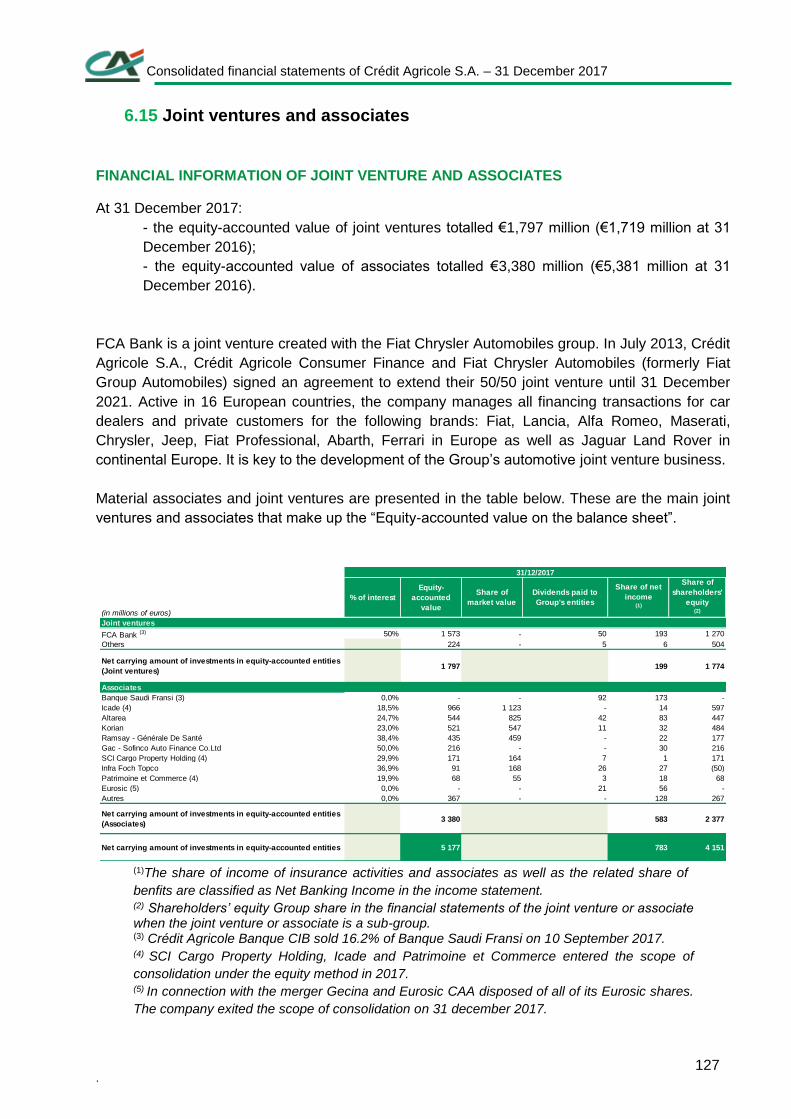
Consolidated financial statements of Crédit Agricole S.A. – 31 December 2017
. 127
6.15 Joint ventures and associates
FINANCIAL INFORMATION OF JOINT VENTURE AND ASSOCIATES
At 31 December 2017:
- the equity-accounted value of joint ventures totalled €1,797 million (€1,719 million at 31
December 2016);
- the equity-accounted value of associates totalled €3,380 million (€5,381 million at 31
December 2016).
FCA Bank is a joint venture created with the Fiat Chrysler Automobiles group. In July 2013, Crédit
Agricole S.A., Crédit Agricole Consumer Finance and Fiat Chrysler Automobiles (formerly Fiat
Group Automobiles) signed an agreement to extend their 50/50 joint venture until 31 December
2021. Active in 16 European countries, the company manages all financing transactions for car
dealers and private customers for the following brands: Fiat, Lancia, Alfa Romeo, Maserati,
Chrysler, Jeep, Fiat Professional, Abarth, Ferrari in Europe as well as Jaguar Land Rover in
continental Europe. It is key to the development of the Group’s automotive joint venture business.
Material associates and joint ventures are presented in the table below. These are the main joint
ventures and associates that make up the “Equity-accounted value on the balance sheet”.
(1)The share of income of insurance activities and associates as well as the related share of
benfits are classified as Net Banking Income in the income statement. (2) Shareholders’ equity Group share in the financial statements of the joint venture or associate when the joint venture or associate is a sub-group. (3) Crédit Agricole Banque CIB sold 16.2% of Banque Saudi Fransi on 10 September 2017. (4) SCI Cargo Property Holding, Icade and Patrimoine et Commerce entered the scope of
consolidation under the equity method in 2017. (5) In connection with the merger Gecina and Eurosic CAA disposed of all of its Eurosic shares.
The company exited the scope of consolidation on 31 december 2017.
FCA Bank (3) 50% 1 573 - 50 193 1 270
Others 224 - 5 6 504
Net carrying amount of investments in equity-accounted entities
(Joint ventures)1 797 199 1 774
Banque Saudi Fransi (3) 0,0% - - 92 173 -
Icade (4) 18,5% 966 1 123 - 14 597
Altarea 24,7% 544 825 42 83 447
Korian 23,0% 521 547 11 32 484
Ramsay - Générale De Santé 38,4% 435 459 - 22 177
Gac - Sofinco Auto Finance Co.Ltd 50,0% 216 - - 30 216
SCI Cargo Property Holding (4) 29,9% 171 164 7 1 171
Infra Foch Topco 36,9% 91 168 26 27 (50)
Patrimoine et Commerce (4) 19,9% 68 55 3 18 68
Eurosic (5) 0,0% - - 21 56 -
Autres 0,0% 367 - - 128 267
Net carrying amount of investments in equity-accounted entities
(Associates)3 380 583 2 377
Net carrying amount of investments in equity-accounted entities 5 177 783 4 151
Share of
shareholders'
equity (2)
31/12/2017
Joint ventures
Associates
(in millions of euros)
Equity-
accounted
value
Share of
market value
Dividends paid to
Group's entities
Share of net
income(1)
% of interest
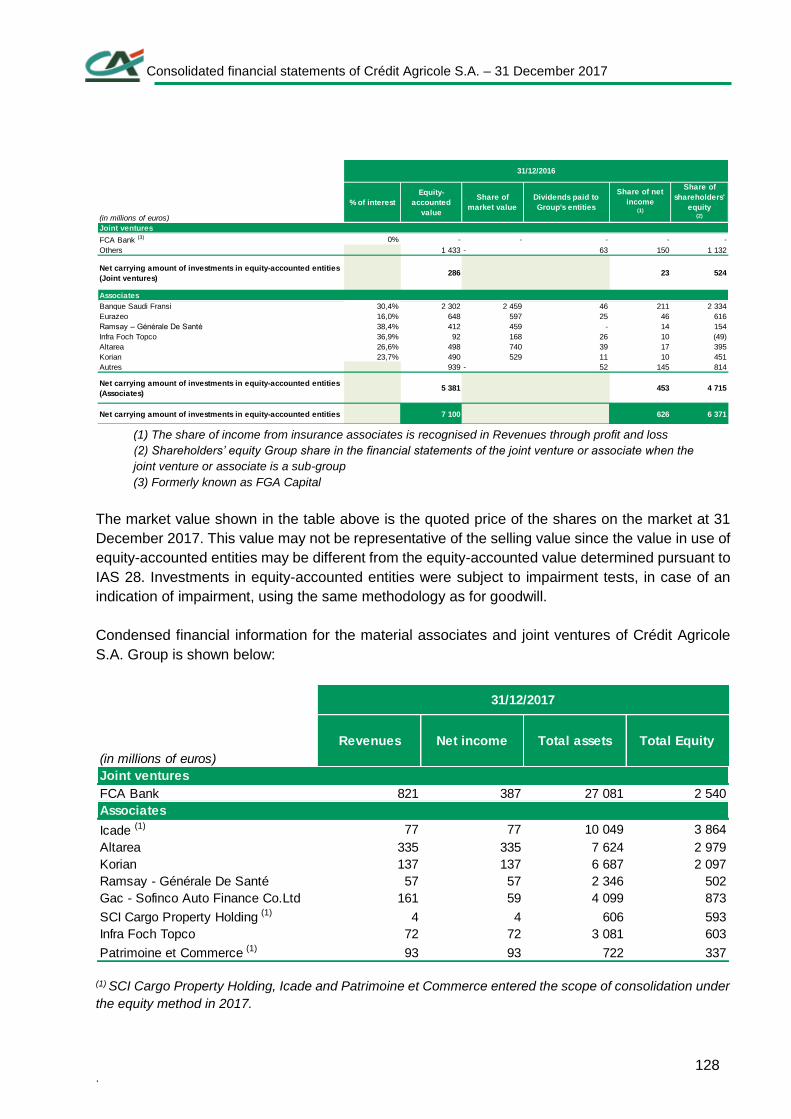
Consolidated financial statements of Crédit Agricole S.A. – 31 December 2017
. 128
(1) The share of income from insurance associates is recognised in Revenues through profit and loss
(2) Shareholders’ equity Group share in the financial statements of the joint venture or associate when the
joint venture or associate is a sub-group
(3) Formerly known as FGA Capital
The market value shown in the table above is the quoted price of the shares on the market at 31
December 2017. This value may not be representative of the selling value since the value in use of
equity-accounted entities may be different from the equity-accounted value determined pursuant to
IAS 28. Investments in equity-accounted entities were subject to impairment tests, in case of an
indication of impairment, using the same methodology as for goodwill.
Condensed financial information for the material associates and joint ventures of Crédit Agricole
S.A. Group is shown below:
(1) SCI Cargo Property Holding, Icade and Patrimoine et Commerce entered the scope of consolidation under
the equity method in 2017.
FCA Bank (3) 0% - - - - -
Others 1 433 - 63 150 1 132
Net carrying amount of investments in equity-accounted entities
(Joint ventures)286 23 524
Banque Saudi Fransi 30,4% 2 302 2 459 46 211 2 334
Eurazeo 16,0% 648 597 25 46 616
Ramsay – Générale De Santé 38,4% 412 459 - 14 154
Infra Foch Topco 36,9% 92 168 26 10 (49)
Altarea 26,6% 498 740 39 17 395
Korian 23,7% 490 529 11 10 451
Autres 939 - 52 145 814
Net carrying amount of investments in equity-accounted entities
(Associates)5 381 453 4 715
Net carrying amount of investments in equity-accounted entities 7 100 626 6 371
(in millions of euros)
31/12/2016
% of interest
Joint ventures
Associates
Equity-
accounted
value
Share of
market value
Dividends paid to
Group's entities
Share of net
income(1)
Share of
shareholders'
equity (2)
FCA Bank 821 387 27 081 2 540
Icade (1) 77 77 10 049 3 864
Altarea 335 335 7 624 2 979
Korian 137 137 6 687 2 097
Ramsay - Générale De Santé 57 57 2 346 502
Gac - Sofinco Auto Finance Co.Ltd 161 59 4 099 873
SCI Cargo Property Holding (1) 4 4 606 593
Infra Foch Topco 72 72 3 081 603
Patrimoine et Commerce (1) 93 93 722 337
Total assets Total Equity
Joint ventures
Associates
(in millions of euros)
31/12/2017
Revenues Net income
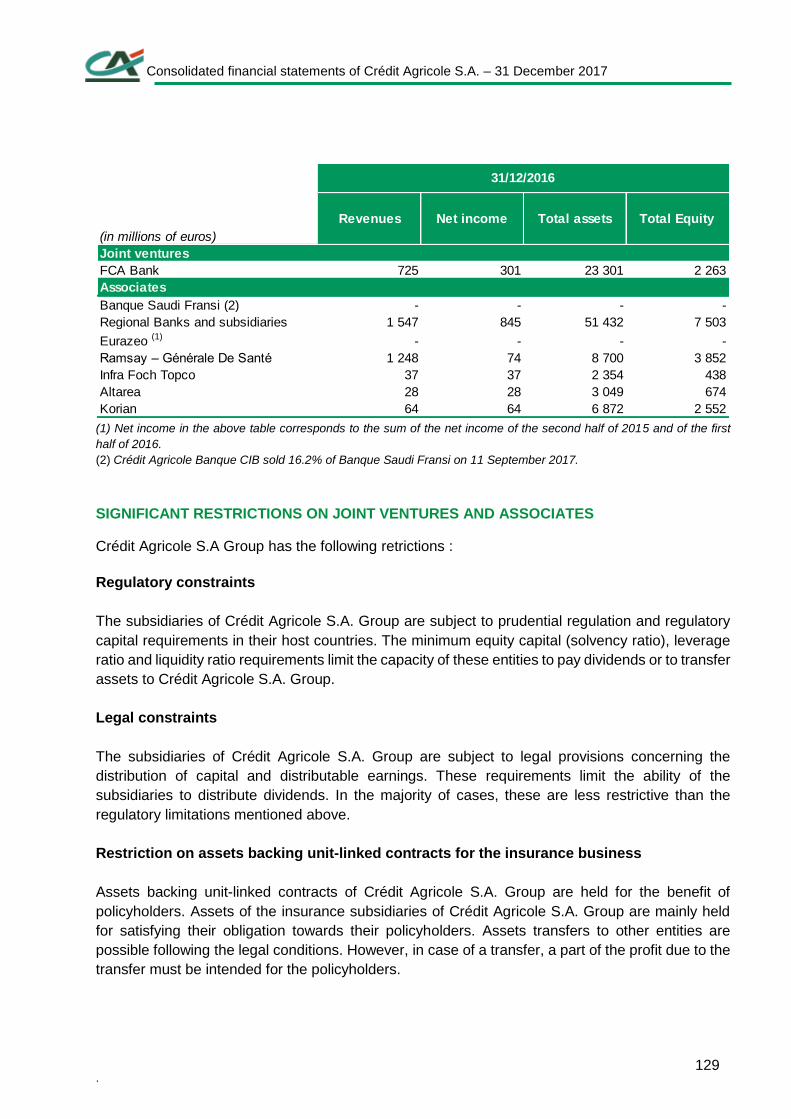
Consolidated financial statements of Crédit Agricole S.A. – 31 December 2017
. 129
(1) Net income in the above table corresponds to the sum of the net income of the second half of 2015 and of the first
half of 2016.
(2) Crédit Agricole Banque CIB sold 16.2% of Banque Saudi Fransi on 11 September 2017.
SIGNIFICANT RESTRICTIONS ON JOINT VENTURES AND ASSOCIATES
Crédit Agricole S.A Group has the following retrictions :
Regulatory constraints
The subsidiaries of Crédit Agricole S.A. Group are subject to prudential regulation and regulatory
capital requirements in their host countries. The minimum equity capital (solvency ratio), leverage
ratio and liquidity ratio requirements limit the capacity of these entities to pay dividends or to transfer
assets to Crédit Agricole S.A. Group.
Legal constraints
The subsidiaries of Crédit Agricole S.A. Group are subject to legal provisions concerning the
distribution of capital and distributable earnings. These requirements limit the ability of the
subsidiaries to distribute dividends. In the majority of cases, these are less restrictive than the
regulatory limitations mentioned above.
Restriction on assets backing unit-linked contracts for the insurance business
Assets backing unit-linked contracts of Crédit Agricole S.A. Group are held for the benefit of
policyholders. Assets of the insurance subsidiaries of Crédit Agricole S.A. Group are mainly held
for satisfying their obligation towards their policyholders. Assets transfers to other entities are
possible following the legal conditions. However, in case of a transfer, a part of the profit due to the
transfer must be intended for the policyholders.
FCA Bank 725 301 23 301 2 263
Banque Saudi Fransi (2) - - - -
Regional Banks and subsidiaries 1 547 845 51 432 7 503
Eurazeo (1) - - - -
Ramsay – Générale De Santé 1 248 74 8 700 3 852
Infra Foch Topco 37 37 2 354 438
Altarea 28 28 3 049 674
Korian 64 64 6 872 2 552
Joint ventures
Associates
Revenues Net income Total assets Total Equity
(in millions of euros)
31/12/2016
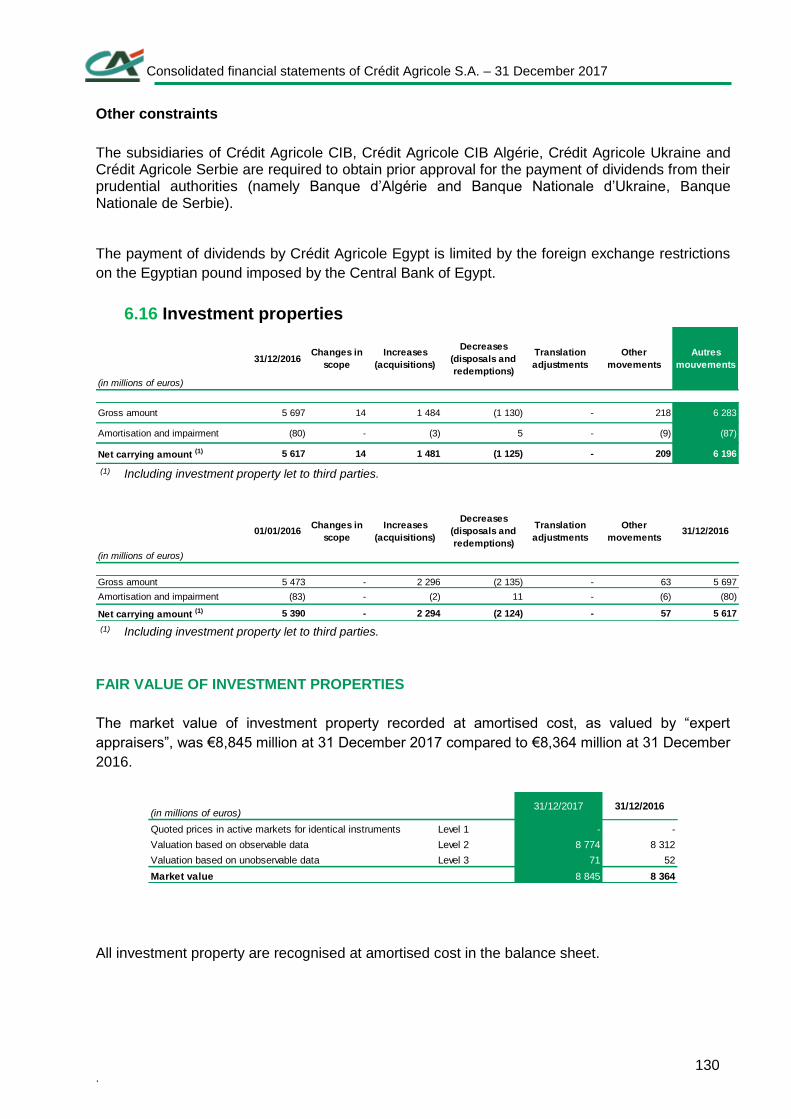
Consolidated financial statements of Crédit Agricole S.A. – 31 December 2017
. 130
Other constraints
The subsidiaries of Crédit Agricole CIB, Crédit Agricole CIB Algérie, Crédit Agricole Ukraine and Crédit Agricole Serbie are required to obtain prior approval for the payment of dividends from their prudential authorities (namely Banque d’Algérie and Banque Nationale d’Ukraine, Banque Nationale de Serbie). The payment of dividends by Crédit Agricole Egypt is limited by the foreign exchange restrictions
on the Egyptian pound imposed by the Central Bank of Egypt.
6.16 Investment properties
(1) Including investment property let to third parties.
(1) Including investment property let to third parties.
FAIR VALUE OF INVESTMENT PROPERTIES
The market value of investment property recorded at amortised cost, as valued by “expert
appraisers”, was €8,845 million at 31 December 2017 compared to €8,364 million at 31 December
2016.
All investment property are recognised at amortised cost in the balance sheet.
(in millions of euros)
31/12/2016Changes in
scope
Increases
(acquisitions)
Decreases
(disposals and
redemptions)
Translation
adjustments
Other
movements
Autres
mouvements
Gross amount 5 697 14 1 484 (1 130) - 218 6 283
Amortisation and impairment (80) - (3) 5 - (9) (87)
Net carrying amount (1) 5 617 14 1 481 (1 125) - 209 6 196
(in millions of euros)
01/01/2016Changes in
scope
Increases
(acquisitions)
Decreases
(disposals and
redemptions)
Translation
adjustments
Other
movements 31/12/2016
Gross amount 5 473 - 2 296 (2 135) - 63 5 697
Amortisation and impairment (83) - (2) 11 - (6) (80)
Net carrying amount (1) 5 390 - 2 294 (2 124) - 57 5 617
(in millions of euros)31/12/2017 31/12/2016
Quoted prices in active markets for identical instruments Level 1 - -
Valuation based on observable data Level 2 8 774 8 312
Valuation based on unobservable data Level 3 71 52
Market value 8 845 8 364
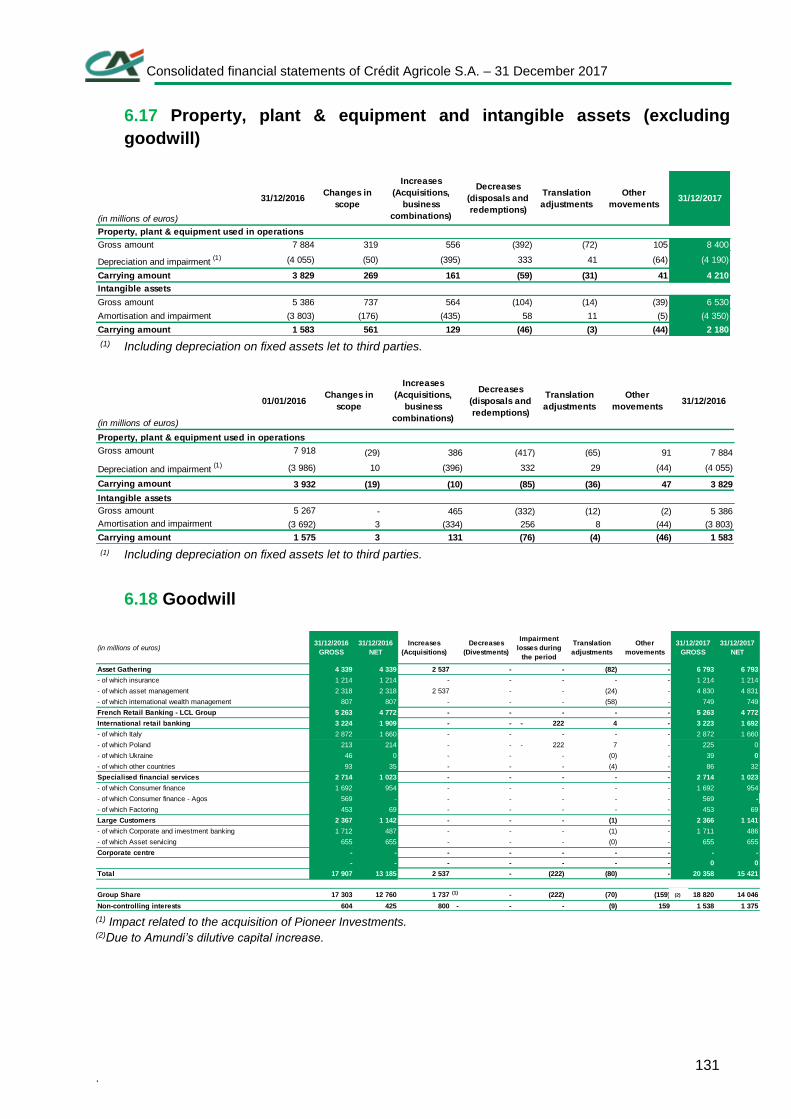
Consolidated financial statements of Crédit Agricole S.A. – 31 December 2017
. 131
6.17 Property, plant & equipment and intangible assets (excluding
goodwill)
(1) Including depreciation on fixed assets let to third parties.
(1) Including depreciation on fixed assets let to third parties.
6.18 Goodwill
(1) Impact related to the acquisition of Pioneer Investments. (2)Due to Amundi’s dilutive capital increase.
(in millions of euros)
31/12/2016Changes in
scope
Increases
(Acquisitions,
business
combinations)
Decreases
(disposals and
redemptions)
Translation
adjustments
Other
movements31/12/2017
Gross amount 7 884 319 556 (392) (72) 105 8 400
Depreciation and impairment (1) (4 055) (50) (395) 333 41 (64) (4 190)
Carrying amount 3 829 269 161 (59) (31) 41 4 210
Gross amount 5 386 737 564 (104) (14) (39) 6 530
Amortisation and impairment (3 803) (176) (435) 58 11 (5) (4 350)
Carrying amount 1 583 561 129 (46) (3) (44) 2 180
Property, plant & equipment used in operations
Intangible assets
(in millions of euros)
01/01/2016Changes in
scope
Increases
(Acquisitions,
business
combinations)
Decreases
(disposals and
redemptions)
Translation
adjustments
Other
movements31/12/2016
Gross amount 7 918 (29) 386 (417) (65) 91 7 884
Depreciation and impairment (1) (3 986) 10 (396) 332 29 (44) (4 055)
Carrying amount 3 932 (19) (10) (85) (36) 47 3 829
Gross amount 5 267 - 465 (332) (12) (2) 5 386
Amortisation and impairment (3 692) 3 (334) 256 8 (44) (3 803)
Carrying amount 1 575 3 131 (76) (4) (46) 1 583
Intangible assets
Property, plant & equipment used in operations
(in millions of euros)31/12/2016
GROSS
31/12/2016
NET
Increases
(Acquisitions)
Decreases
(Divestments)
Impairment
losses during
the period
Translation
adjustments
Other
movements
31/12/2017
GROSS
31/12/2017
NET
Asset Gathering 4 339 4 339 2 537 - - (82) - 6 793 6 793
- of which insurance 1 214 1 214 - - - - - 1 214 1 214
- of which asset management 2 318 2 318 2 537 - - (24) - 4 830 4 831
- of which international wealth management 807 807 - - - (58) - 749 749
French Retail Banking - LCL Group 5 263 4 772 - - - - - 5 263 4 772
International retail banking 3 224 1 909 - - - 222 4 - 3 223 1 692
- of which Italy 2 872 1 660 - - - - - 2 872 1 660
- of which Poland 213 214 - - - 222 7 - 225 0
- of which Ukraine 46 0 - - - (0) - 39 0
- of which other countries 93 35 - - - (4) - 86 32
Specialised financial services 2 714 1 023 - - - - - 2 714 1 023
- of which Consumer finance 1 692 954 - - - - - 1 692 954
- of which Consumer finance - Agos 569 - - - - - - 569 -
- of which Factoring 453 69 - - - - - 453 69
Large Customers 2 367 1 142 - - - (1) - 2 366 1 141
- of which Corporate and investment banking 1 712 487 - - - (1) - 1 711 486
- of which Asset servicing 655 655 - - - (0) - 655 655
Corporate centre - - - - - - - - -
- - - - - - - 0 0
Total 17 907 13 185 2 537 - (222) (80) - 20 358 15 421
Group Share 17 303 12 760 1 737 (1) - (222) (70) (159) 18 820 14 046
Non-controlling interests 604 425 800 - - - (9) 159 1 538 1 375
(2)
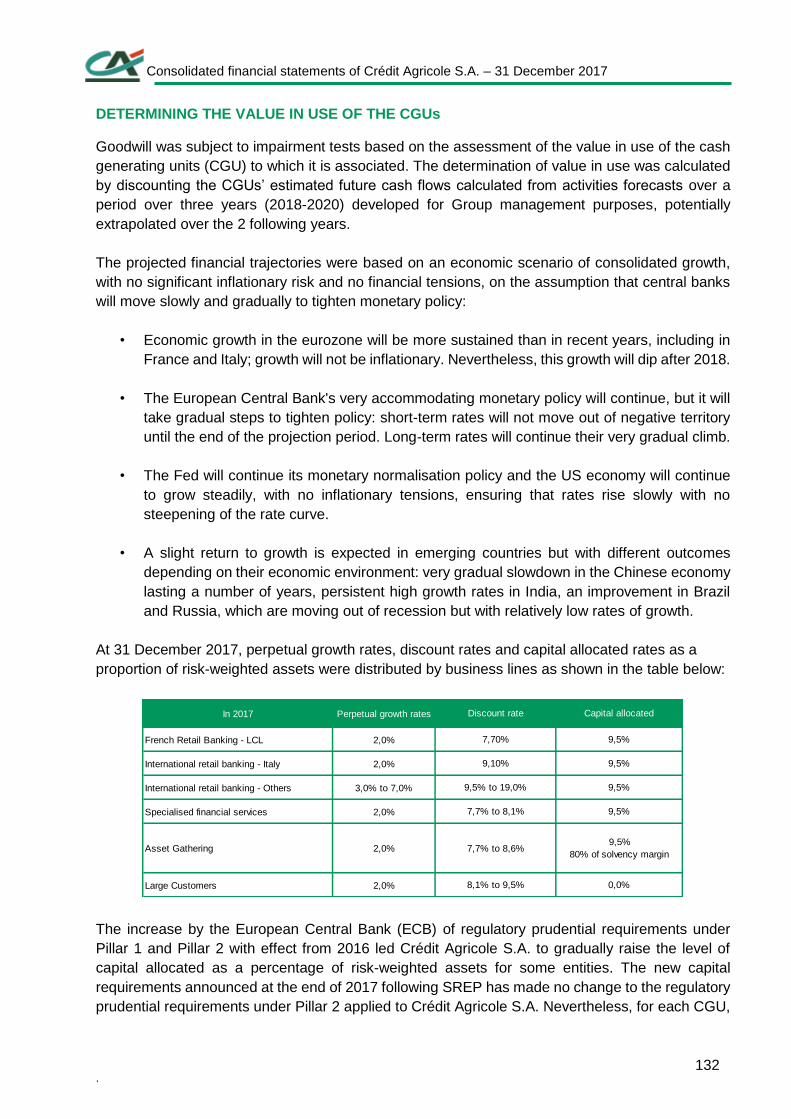
Consolidated financial statements of Crédit Agricole S.A. – 31 December 2017
. 132
DETERMINING THE VALUE IN USE OF THE CGUs
Goodwill was subject to impairment tests based on the assessment of the value in use of the cash
generating units (CGU) to which it is associated. The determination of value in use was calculated
by discounting the CGUs’ estimated future cash flows calculated from activities forecasts over a
period over three years (2018-2020) developed for Group management purposes, potentially
extrapolated over the 2 following years.
The projected financial trajectories were based on an economic scenario of consolidated growth,
with no significant inflationary risk and no financial tensions, on the assumption that central banks
will move slowly and gradually to tighten monetary policy:
• Economic growth in the eurozone will be more sustained than in recent years, including in
France and Italy; growth will not be inflationary. Nevertheless, this growth will dip after 2018.
• The European Central Bank's very accommodating monetary policy will continue, but it will
take gradual steps to tighten policy: short-term rates will not move out of negative territory
until the end of the projection period. Long-term rates will continue their very gradual climb.
• The Fed will continue its monetary normalisation policy and the US economy will continue
to grow steadily, with no inflationary tensions, ensuring that rates rise slowly with no
steepening of the rate curve.
• A slight return to growth is expected in emerging countries but with different outcomes
depending on their economic environment: very gradual slowdown in the Chinese economy
lasting a number of years, persistent high growth rates in India, an improvement in Brazil
and Russia, which are moving out of recession but with relatively low rates of growth.
At 31 December 2017, perpetual growth rates, discount rates and capital allocated rates as a
proportion of risk-weighted assets were distributed by business lines as shown in the table below:
The increase by the European Central Bank (ECB) of regulatory prudential requirements under
Pillar 1 and Pillar 2 with effect from 2016 led Crédit Agricole S.A. to gradually raise the level of
capital allocated as a percentage of risk-weighted assets for some entities. The new capital
requirements announced at the end of 2017 following SREP has made no change to the regulatory
prudential requirements under Pillar 2 applied to Crédit Agricole S.A. Nevertheless, for each CGU,
In 2017 Perpetual growth rates
French Retail Banking - LCL 2,0%
International retail banking - Italy 2,0%
International retail banking - Others 3,0% to 7,0%
Specialised financial services 2,0%
Asset Gathering 2,0%
Large Customers 2,0%
7,7% to 8,1% 9,5%
Discount rate Capital allocated
7,70% 9,5%
9,10% 9,5%
9,5% to 19,0% 9,5%
7,7% to 8,6%
8,1% to 9,5%
9,5%
80% of solvency margin
0,0%
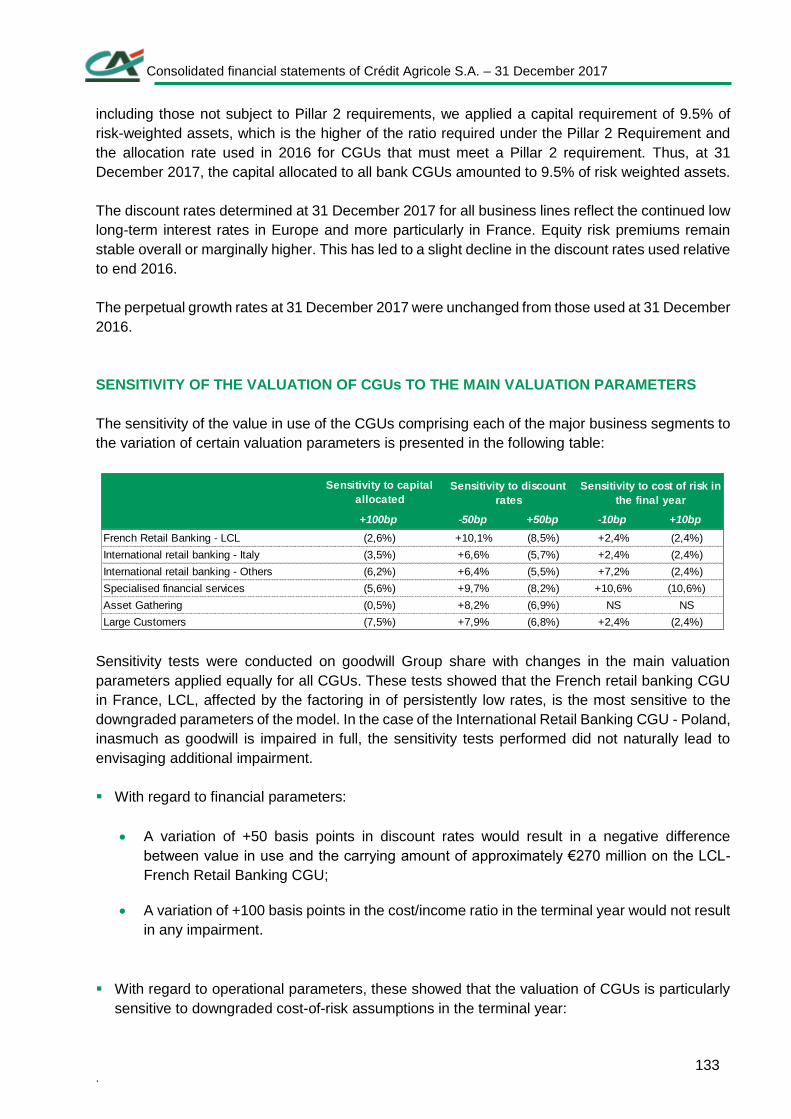
Consolidated financial statements of Crédit Agricole S.A. – 31 December 2017
. 133
including those not subject to Pillar 2 requirements, we applied a capital requirement of 9.5% of
risk-weighted assets, which is the higher of the ratio required under the Pillar 2 Requirement and
the allocation rate used in 2016 for CGUs that must meet a Pillar 2 requirement. Thus, at 31
December 2017, the capital allocated to all bank CGUs amounted to 9.5% of risk weighted assets.
The discount rates determined at 31 December 2017 for all business lines reflect the continued low
long-term interest rates in Europe and more particularly in France. Equity risk premiums remain
stable overall or marginally higher. This has led to a slight decline in the discount rates used relative
to end 2016.
The perpetual growth rates at 31 December 2017 were unchanged from those used at 31 December
2016.
SENSITIVITY OF THE VALUATION OF CGUs TO THE MAIN VALUATION PARAMETERS
The sensitivity of the value in use of the CGUs comprising each of the major business segments to
the variation of certain valuation parameters is presented in the following table:
Sensitivity tests were conducted on goodwill Group share with changes in the main valuation
parameters applied equally for all CGUs. These tests showed that the French retail banking CGU
in France, LCL, affected by the factoring in of persistently low rates, is the most sensitive to the
downgraded parameters of the model. In the case of the International Retail Banking CGU - Poland,
inasmuch as goodwill is impaired in full, the sensitivity tests performed did not naturally lead to
envisaging additional impairment.
With regard to financial parameters:
A variation of +50 basis points in discount rates would result in a negative difference
between value in use and the carrying amount of approximately €270 million on the LCL-
French Retail Banking CGU;
A variation of +100 basis points in the cost/income ratio in the terminal year would not result
in any impairment.
With regard to operational parameters, these showed that the valuation of CGUs is particularly
sensitive to downgraded cost-of-risk assumptions in the terminal year:
Sensitivity to capital
allocated
+100bp -50bp +50bp -10bp +10bp
French Retail Banking - LCL (2,6%) +10,1% (8,5%) +2,4% (2,4%)
International retail banking - Italy (3,5%) +6,6% (5,7%) +2,4% (2,4%)
International retail banking - Others (6,2%) +6,4% (5,5%) +7,2% (2,4%)
Specialised financial services (5,6%) +9,7% (8,2%) +10,6% (10,6%)
Asset Gathering (0,5%) +8,2% (6,9%) NS NS
Large Customers (7,5%) +7,9% (6,8%) +2,4% (2,4%)
Sensitivity to discount
rates
Sensitivity to cost of risk in
the final year
Consolidated financial statements of Crédit Agricole S.A. – 31 December 2017
. 134
A variation of +100 basis points in the cost/income ratio in the terminal year would not result
in any impairment;
While a +10% variation in the cost of risk in the terminal year would only result in a negative
difference between value in use and the carrying amount of less than €50 million for the
Specialized Financial Services-Consumer Credit CGU, excluding Agos.
6.19 Insurance company technical reserves
BREAKDOWN OF INSURANCE TECHNICAL RESERVES
Reinsurers’ share in technical reserves and other insurance liabilities is recognised under accruals,
prepayments and sundry liabilities. The breakdown of insurance company technical provisions
contracts is presented before elimination of emissions in euro and in units of account subscribed
by insurance companies.
Life Non-life International Creditor Total
Insurance contracts 169 685 4 892 16 516 1 773 192 866
Investment contracts with discretionary profit-sharing 90 169 - 12 789 - 102 958
Investment contracts without discretionary profit-sharing 2 507 - 1 394 - 3 901
Deferred participation benefits (liability) 20 978 - 500 - 21 478
Total technical reserves 283 339 4 892 31 199 1 773 321 203
Deferred participation benefits (asset) - - - - -
Reinsurers' share of technical reserves (918) (398) (59) (270) (1 645)
Net technical reserves 282 421 4 494 31 140 1 503 319 558
(in millions of euros)
31/12/2017
Life Non-life International Creditor Total
Insurance contracts 159 397 4 442 14 314 1 636 179 789
Investment contracts with discretionary profit-sharing 91 550 - 12 017 - 103 567
Investment contracts without discretionary profit-sharing 2 476 - 1 193 - 3 669
Deferred participation benefits (liability) 20 554 - 474 - 21 028
Total technical reserves 273 977 4 442 27 998 1 636 308 053
Deferred participation benefits (asset) - - - - -
Reinsurers' share of technical reserves (827) (342) (55) (261) (1 485)
Net technical reserves 273 150 4 100 27 943 1 375 306 568
(in millions of euros)
31/12/2016
Consolidated financial statements of Crédit Agricole S.A. – 31 December 2017
. 135
Deferred policyholders’ profit-sharing, before tax, at 31 December 2017 and 31 December 2016 breaks down as follows:
(1) Note 6.4 « Available-for-sale financial assets »
6.20 Provisions
(1) See Notes 7.4 “Post employment benefits” and 7.5 “Other employee benefits”.
At 31 December 2017, employment-related commitments (retirement schemes) and similar benefits
included €79 million (€122 million in 2016) of provisions arising from social costs of restructuring
plans and the provision for restructuring includes the non-social costs of those plans.
Deferred participation benefits
31/12/2017
Deferred
participation
benefits in
liabilities
31/12/2016
Deferred
participation
benefits in
liabilities
Deferred participation on revaluation of held-for-sale securities and hedging
derivatives18 255 18 830
of which deferred participation on revaluation of held-for-sale securities (1) 17 408 17 933
of which deferred participation hedging derivatives 847 897
Deferred participation on trading securities mark-to-market adjustment 443 (323)
Other deferred participation (liquidity risk reserve cancellation) 2 780 2 521
Total 21 478 21 028
(in millions of euros)
31/12/2016Changes in
scope
Depreciation
charges
Reversals,
amounts
used
Reversals,
amounts not
used
Translation
adjustments
Other
movements31/12/2017
Home purchase savings plan risks 463 - - - (222) - - 241
Financing commitment execution risks 271 18 265 (7) (76) (19) 37 489
Operational risks 167 1 32 (120) (16) - (1) 63
Employee retirement and similar benefits 1 762 182 187 (227) (46) (25) (1) 1 832
Litigation 895 180 400 (122) (209) (4) (1) 1 139
Equity investments 6 - 10 (3) - - - 13
Restructuring 44 1 - (8) (2) - - 35
Other risks 675 3 131 (96) (110) (7) 13 609
Total 4 283 385 1 025 (583) (681) (55) 47 4 421
(in millions of euros)
31/12/2015Changes in
scope
Depreciation
charges
Reversals,
amounts
used
Reversals,
amounts not
used
Translation
adjustments
Other
movements31/12/2016
Home purchase savings plan risks 380 - 83 - - - - 463
Financing commitment execution risks 215 (1) 87 (1) (46) 17 - 271
Operational risks 64 - 127 (10) (14) - - 167
Employee retirement and similar benefits 1 719 - 210 (185) (84) (3) 105 1 762
Litigation 919 1 265 (103) (156) (2) (29) 895
Equity investments 6 - 3 - (2) - (1) 6
Restructuring 12 3 34 (5) - - - 44
Other risks 776 - 191 (158) (162) 3 25 675
Total 4 091 3 1 000 (462) (464) 15 100 4 283
Consolidated financial statements of Crédit Agricole S.A. – 31 December 2017
. 136
TAX AUDITS
Crédit Agricole S.A. tax audit
Crédit Agricole S.A. underwent a tax audit covering the 2013 financial year. On conclusion of the
audit the tax authorities issued a tax adjustment rejecting a tax deduction that was made, following
the loss on the disposal of Emporiki Bank securities issued from a capital increase on 28 January
2013, four days prior to the sale of Emporiki Bank to Alpha Bank. The tax authorities dispute the
fact that the securities of this subsidiary were treated as investment securities.
This adjustment is being contested. In view of the circumstances of the case, no provision has been
set aside. The assessment notice dated 15 March 2017 for an amount of 312 million euros resulted
in a payment, and concurrently, a debt of the same amount was recorded at 31 December 2017.
On 13 January 2017, the National Tax Commission decided that the tax adjustment should be
abandoned.
Crédit Agricole S.A. underwent another tax audit covering the years 2014 and 2015. A provision
was recognised to cover the estimated risks.
LCL tax audit
In 2010 and 2011, LCL was the object of an audit of accounts covering years 2007, 2008 and 2009,
as well as an audit on regulated savings. All the resulting financial consequences have been paid,
with only one sanction relating to regulated savings currently the subject of a dispute. It culminated
in cancelling the fines in 2017, which were repaid in full during this financial year.
LCL was the object of an audit of accounts in 2015 and 2016, as well as an audit on regulated
savings for the 2011, 2012 and 2013 financial years. All adjustments and fines have been paid and
the financial consequences were covered by a reversal of the provision constituted for this purpose.
Some adjustments and penalties have been or will be contested. In 2017, LCL challenged the fines
imposed under the audit of regulated savings. The challenge led to a full tax credit and full
repayment of the fines during the 2017 financial year.
Crédit Agricole CIB Paris tax audit
Crédit Agricole CIB is currently the object of an audit of accounts covering years 2013, 2014 and
2015. Two adjustment notices suspending the limitation period were received in late 2016 and late
2017. Crédit Agricole CIB is challenging the proposed adjustments. A provision has been
recognised to cover the estimated risk.
Consolidated financial statements of Crédit Agricole S.A. – 31 December 2017
. 137
Merisma tax audit
Merisma, a Crédit Agricole CIB subsidiary, consolidated by Crédit Agricole S.A. Group for tax
purposes, has been the object of tax adjustment notices for financial years 2006 to 2010, plus
surcharges for abuse of law.
Although still challenged, provisions have been set aside for the adjustments.
Crédit Agricole CIB Milan and London tax audit regarding transfer pricing
Following audits, Crédit Agricole CIB Milan and London respectively received adjustment notices
for 2005 to 2012, 2003 to 2006 and 2008 from the Italian and UK tax authorities regarding transfer
pricing. Crédit Agricole CIB challenged the proposed adjustments. At the same time, the case has
been referred to the competent French - Italian and French - British authorities for all years. A
provision was recognised to cover the estimated risk.
CLSA liability guarantee
In 2013 Crédit Agricole S.A. Group sold the CLSA entities to the Chinese group CITICS.
Following tax adjustments made to some CLSA entities in India and the Philippines, CITICS invoked
the liability guarantee against Crédit Agricole S.A. Group. Reasoned arguments have been
submitted challenging the adjustments. A provision was recognised to cover the estimated risk.
Crédit Agricole Indosuez Wealth
Crédit Agricole Indosuez Wealth (formerly Crédit Agricole Private Banking) had two tax audits
covering the years 2012 to 2015. All adjustments have been paid. One of the adjustments is
currently the subject of a dispute
Crédit Agricole Assurances tax audit
Crédit Agricole Assurances underwent a tax audit covering the years 2008 and 2009. The notified
adjustment, for a non-material amount, is currently the subject of a dispute and has been submitted
to the Administrative Court of Appeal by the Council of State. It has been paid in full.
Pacifica tax audit
Pacifica underwent a tax audit covering the years 2009 and 2010. A comprehensive settlement
notice has been issued. Only one notified adjustment, which is fully provisioned, remains
outstanding and is currently the subject of a dispute.
Pacifica was also the object of an audit of accounts covering the years 2013 and 2014. The notified
adjustments have been challenged in part and provisions made.
Consolidated financial statements of Crédit Agricole S.A. – 31 December 2017
. 138
Crédit Agricole Consumer Finance tax audit
Crédit Agricole Consumer Finance is currently the object of an audit of accounts covering years
2014 and 2015. It received an adjustment notice in late 2017. CA Consumer Financing is in
discussions with the tax authorities to challenge the adjustments. A provision has been recognised
to cover the estimated risk in the 2017 financial statements.
INQUIRIES AND REQUESTS FOR REGULATORY INFORMATION
The main files linked to inquiries and requests for regulatory information are:
Office of Foreign Assets Control (OFAC)
In October 2015, Crédit Agricole S.A. and its subsidiary Crédit Agricole Corporate and Investment Bank (Crédit Agricole CIB) reached agreements with the US and New York authorities that had been conducting investigations regarding US dollar transactions with countries subject to US economic sanctions. The events covered by this agreement took place between 2003 and 2008. Crédit Agricole CIB and Crédit Agricole S.A., which cooperated with the US and New York authorities in connection with their investigations, have agreed to pay a total penalty amount of $787.3 million (i.e. €692.7 million). The payment of this penalty has been allocated to the pre-existing reserve that had already been taken and, therefore, has not affected the accounts for the second half of 2015. The agreements with the Board of Governors of the Federal Reserve System (Federal Reserve) and the New-York State Department of Financial Services (NYDFS) are with CASA and Crédit Agricole CIB. The agreement with the Office of Foreign Assets Control (OFAC) of the US Department of the Treasury is with Crédit Agricole CIB. Crédit Agricole CIB also entered into separate deferred prosecution agreements (DPAs) with the United States Attorney’s Office for the District of Columbia (USAO) and the District Attorney of the County of New York (DANY), the terms of which are three years. The USAO and DANY have agreed to take no further action against Crédit Agricole CIB, CASA, or any of Crédit Agricole CIB’s subsidiaries or affiliates regarding the conduct subject to this investigation if Crédit Agricole CIB complies with its obligations under the DPAs. Within the framework of the implementation of these agreements, Crédit Agricole continues to strengthen its internal procedures and its compliance programs regarding laws on international sanctions and will continue to cooperate fully with the US and New York authorities regarding this matter, with its home regulators, the European Central Bank and the French Regulatory and Resolution Supervisory Authority (ACPR), and with the other regulators across its worldwide network. Pursuant to the agreements with NYDFS and the US Federal Reserve, Crédit Agricole’s compliance program is subject to regular reviews to evaluate its effectiveness, including a review by an independent consultant appointed by NYDFS for a term of one year and annual reviews by an independent consultant approved by the Federal Reserve.
Euribor/Libor and other indexes
Crédit Agricole S.A. and its subsidiary Crédit Agricole CIB, in their capacity as contributors to a number of interbank rates, have received requests for information from a number of authorities as
Consolidated financial statements of Crédit Agricole S.A. – 31 December 2017
. 139
part of investigations into: (i) the calculation of the Libor (London Interbank Offered Rates) in a number of currencies, the Euribor (Euro Interbank Offered Rate) and certain other market indices; and (ii) transactions connected with these rates and indices. These demands covered several periods from 2005 to 2012. As part of its cooperation with the authorities, Crédit Agricole S.A. and its subsidiary Crédit Agricole CIB carried out investigations in order to gather the information requested by the various authorities and in particular the American authorities – the DOJ (Department of Justice) and CFTC (Commodity Future Trading Commission) – with which they are in discussions. It is currently not possible to know the outcome of these discussions, nor the date when they will be concluded. Furthermore, Crédit Agricole CIB is currently under investigation opened by the Attorney General of the State of Florida on both the Libor and the Euribor. Following its investigation and an unsuccessful settlement procedure, on 21 May 2014, the European Commission sent a notification of grievances to Crédit Agricole S.A. and to Crédit Agricole CIB pertaining to agreements or concerted practices for the purpose and/or effect of preventing, restricting or distorting competition in derivatives related to the Euribor. In a decision dated 7 December 2016, the European Commission jointly fined Crédit Agricole S.A. and Crédit Agricole CIB €114,654,000 for participating in a cartel in euro interest rate derivatives. Crédit Agricole S.A. and Crédit Agricole CIB are challenging this decision and have asked the European Court of Justice to overturn it. Additionally, the Swiss competition authority, COMCO, is conducting an investigation into the market for interest rate derivatives, including the Euribor, with regard to Crédit Agricole S.A. and several Swiss and international banks. Moreover, in June 2016 the South Korean competition authority (KFTC) decided to close the investigation launched in September 2015 into Crédit Agricole CIB and the Libor index on various currencies, Euribor and Tibor indices. The KFTC investigation into certain foreign exchange derivatives (ABS-NDF) is ongoing. Concerning the two class actions in the United States of America in which Crédit Agricole S.A. and Crédit Agricole CIB have been named since 2012 and 2013 along with other financial institutions, both as defendants in one (“Sullivan” for the Euribor) and only Crédit Agricole S.A. as defendant for the other (“Lieberman” for Libor), the “Lieberman” class action is at the preliminary stage that consists in the examination of its admissibility; proceedings are still suspended before the US District Court of New York State. Concerning the“Sullivan” class action, Crédit Agricole S.A. and Crédit Agricole CIB introduced a motion to dismiss the applicants’ claim. The US District Court of New York State upheld the motion to dismiss regarding Crédit Agricole SA and Crédit Agricole-CIB in first instance. This decision is subject to appeal. Since 1 July 2016, Crédit Agricole S.A. and Crédit Agricole CIB, together with other banks, are also party to a new class action suit in the United States (“Frontpoint”) relating to the SIBOR (Singapore Interbank Offered Rate) and SOR (Singapore Swap Offer Rate) indices. Crédit Agricole S.A. and Crédit Agricole CIB have filed a motion to dismiss. The New York Federal Court, ruling in first instance, granted this request last August 18th, in favor of Crédit Agricole S.A. and Crédit Agricole CIB. Following federal procedure which allows them to do so, the plaintiffs modified the terms of their action to refer the case to the judge again. As a consequence, Crédit Agricole S.A. and Crédit Agricole CIB have submitted a new motion to dismiss, which must be examined by the New York Federal Court soon. These class actions are civil actions in which the plaintiffs claim that they are victims of the methods used to set the Euribor, Libor, SIBOR and SOR rates, and seek repayment of the sums they allege were unlawfully received, as well as damages and reimbursement of costs and fees paid.
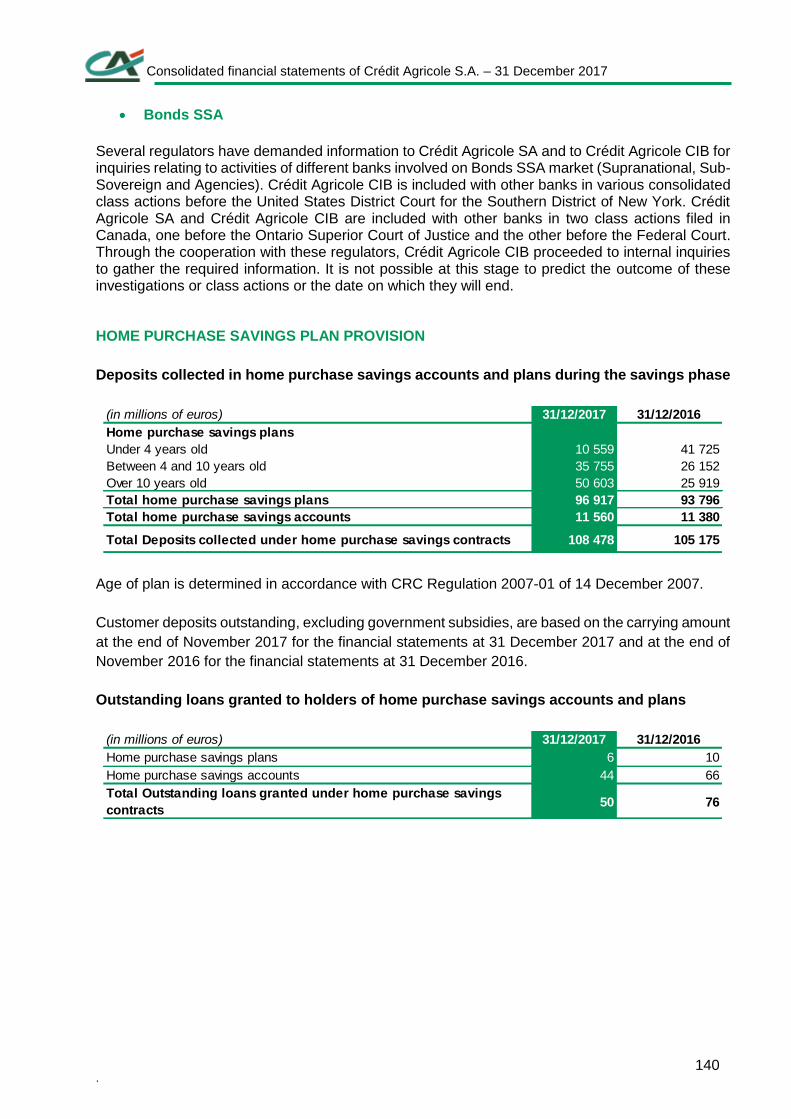
Consolidated financial statements of Crédit Agricole S.A. – 31 December 2017
. 140
Bonds SSA
Several regulators have demanded information to Crédit Agricole SA and to Crédit Agricole CIB for inquiries relating to activities of different banks involved on Bonds SSA market (Supranational, Sub-Sovereign and Agencies). Crédit Agricole CIB is included with other banks in various consolidated class actions before the United States District Court for the Southern District of New York. Crédit Agricole SA and Crédit Agricole CIB are included with other banks in two class actions filed in Canada, one before the Ontario Superior Court of Justice and the other before the Federal Court. Through the cooperation with these regulators, Crédit Agricole CIB proceeded to internal inquiries to gather the required information. It is not possible at this stage to predict the outcome of these investigations or class actions or the date on which they will end. HOME PURCHASE SAVINGS PLAN PROVISION
Deposits collected in home purchase savings accounts and plans during the savings phase
Age of plan is determined in accordance with CRC Regulation 2007-01 of 14 December 2007.
Customer deposits outstanding, excluding government subsidies, are based on the carrying amount
at the end of November 2017 for the financial statements at 31 December 2017 and at the end of
November 2016 for the financial statements at 31 December 2016.
Outstanding loans granted to holders of home purchase savings accounts and plans
(in millions of euros) 31/12/2017 31/12/2016
Home purchase savings plans
Under 4 years old 10 559 41 725
Between 4 and 10 years old 35 755 26 152
Over 10 years old 50 603 25 919
Total home purchase savings plans 96 917 93 796
Total home purchase savings accounts 11 560 11 380
Total Deposits collected under home purchase savings contracts 108 478 105 175
(in millions of euros) 31/12/2017 31/12/2016
Home purchase savings plans 6 10
Home purchase savings accounts 44 66
Total Outstanding loans granted under home purchase savings
contracts50 76
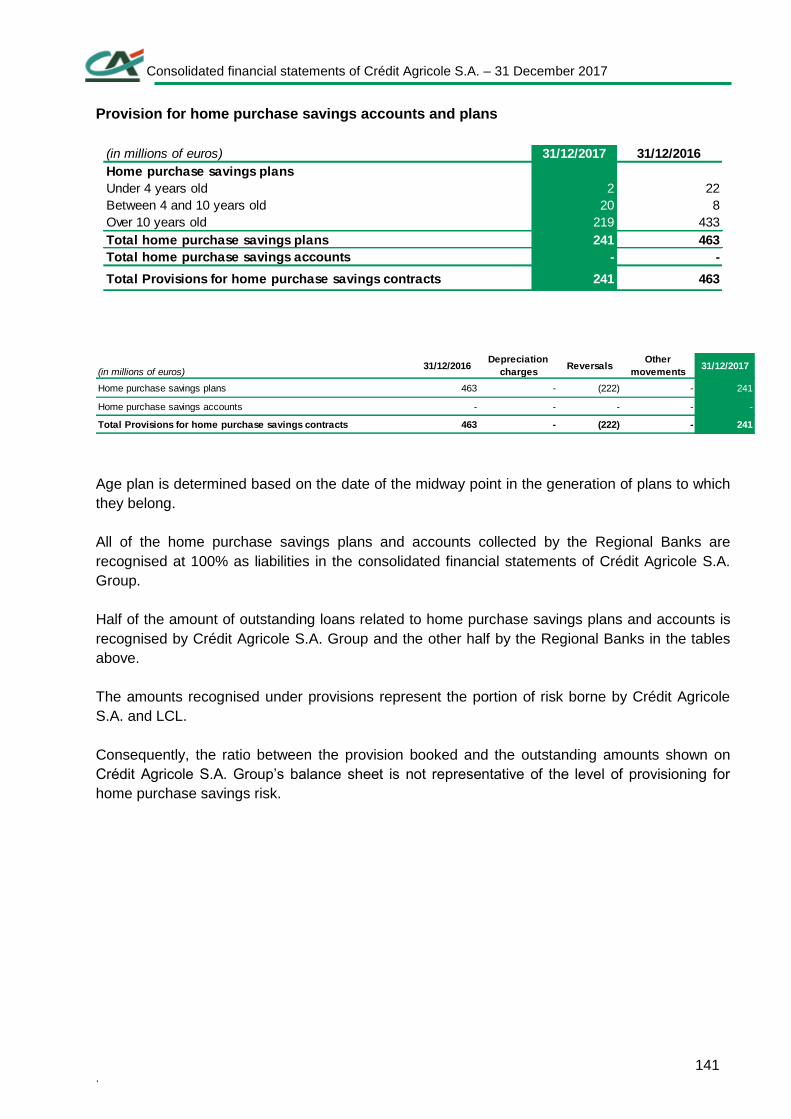
Consolidated financial statements of Crédit Agricole S.A. – 31 December 2017
. 141
Provision for home purchase savings accounts and plans
Age plan is determined based on the date of the midway point in the generation of plans to which
they belong.
All of the home purchase savings plans and accounts collected by the Regional Banks are
recognised at 100% as liabilities in the consolidated financial statements of Crédit Agricole S.A.
Group.
Half of the amount of outstanding loans related to home purchase savings plans and accounts is
recognised by Crédit Agricole S.A. Group and the other half by the Regional Banks in the tables
above.
The amounts recognised under provisions represent the portion of risk borne by Crédit Agricole
S.A. and LCL.
Consequently, the ratio between the provision booked and the outstanding amounts shown on
Crédit Agricole S.A. Group’s balance sheet is not representative of the level of provisioning for
home purchase savings risk.
(in millions of euros) 31/12/2017 31/12/2016
Home purchase savings plans
Under 4 years old 2 22
Between 4 and 10 years old 20 8
Over 10 years old 219 433
Total home purchase savings plans 241 463
Total home purchase savings accounts - -
Total Provisions for home purchase savings contracts 241 463
(in millions of euros)31/12/2016
Depreciation
chargesReversals
Other
movements31/12/2017
Home purchase savings plans 463 - (222) - 241
Home purchase savings accounts - - - - -
Total Provisions for home purchase savings contracts 463 - (222) - 241
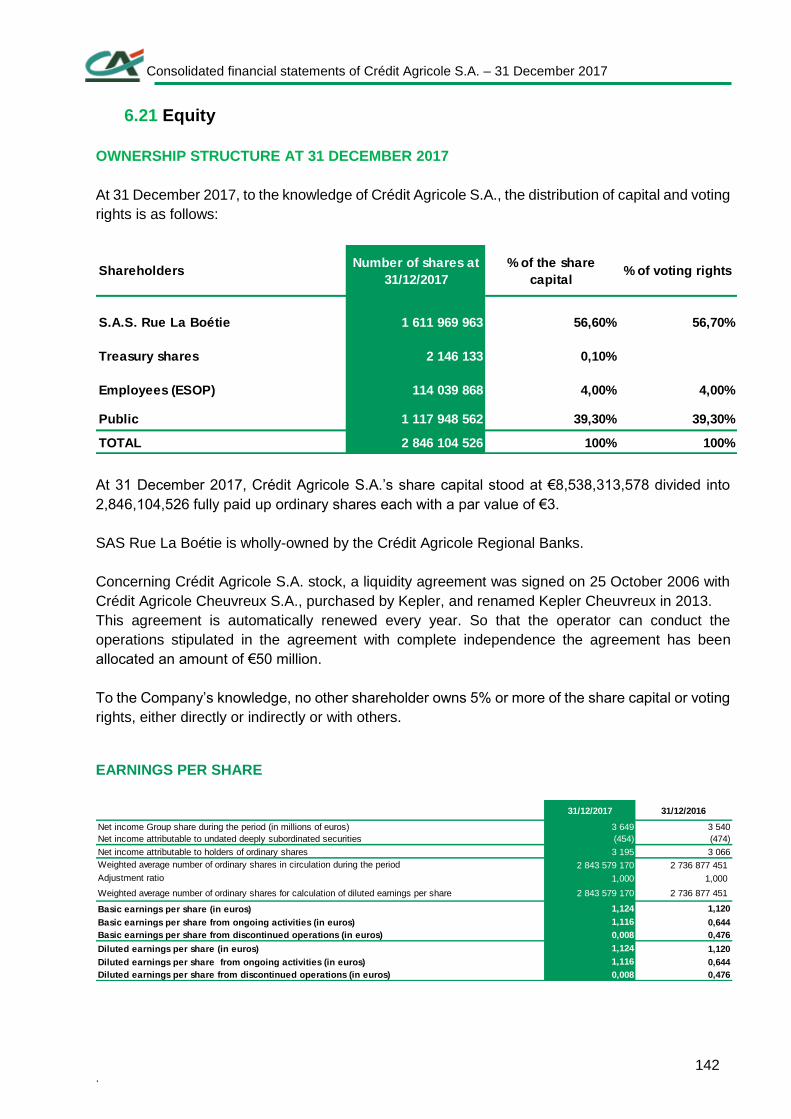
Consolidated financial statements of Crédit Agricole S.A. – 31 December 2017
. 142
6.21 Equity
OWNERSHIP STRUCTURE AT 31 DECEMBER 2017
At 31 December 2017, to the knowledge of Crédit Agricole S.A., the distribution of capital and voting
rights is as follows:
At 31 December 2017, Crédit Agricole S.A.’s share capital stood at €8,538,313,578 divided into
2,846,104,526 fully paid up ordinary shares each with a par value of €3.
SAS Rue La Boétie is wholly-owned by the Crédit Agricole Regional Banks.
Concerning Crédit Agricole S.A. stock, a liquidity agreement was signed on 25 October 2006 with
Crédit Agricole Cheuvreux S.A., purchased by Kepler, and renamed Kepler Cheuvreux in 2013.
This agreement is automatically renewed every year. So that the operator can conduct the
operations stipulated in the agreement with complete independence the agreement has been
allocated an amount of €50 million.
To the Company’s knowledge, no other shareholder owns 5% or more of the share capital or voting
rights, either directly or indirectly or with others.
EARNINGS PER SHARE
ShareholdersNumber of shares at
31/12/2017
% of the share
capital% of voting rights
S.A.S. Rue La Boétie 1 611 969 963 56,60% 56,70%
Treasury shares 2 146 133 0,10%
Employees (ESOP) 114 039 868 4,00% 4,00%
Public 1 117 948 562 39,30% 39,30%
TOTAL 2 846 104 526 100% 100%
31/12/2017 31/12/2016
Net income Group share during the period (in millions of euros) 3 649 3 540
Net income attributable to undated deeply subordinated securities (454) (474)
Net income attributable to holders of ordinary shares 3 195 3 066
2 843 579 170 2 736 877 451
1,000 1,000
2 843 579 170 2 736 877 451
Basic earnings per share (in euros) 1,124 1,120
Basic earnings per share from ongoing activities (in euros) 1,116 0,644
Basic earnings per share from discontinued operations (in euros) 0,008 0,476
Diluted earnings per share (in euros) 1,124 1,120
Diluted earnings per share from ongoing activities (in euros) 1,116 0,644
Diluted earnings per share from discontinued operations (in euros) 0,008 0,476
Weighted average number of ordinary shares in circulation during the period
Adjustment ratio
Weighted average number of ordinary shares for calculation of diluted earnings per share
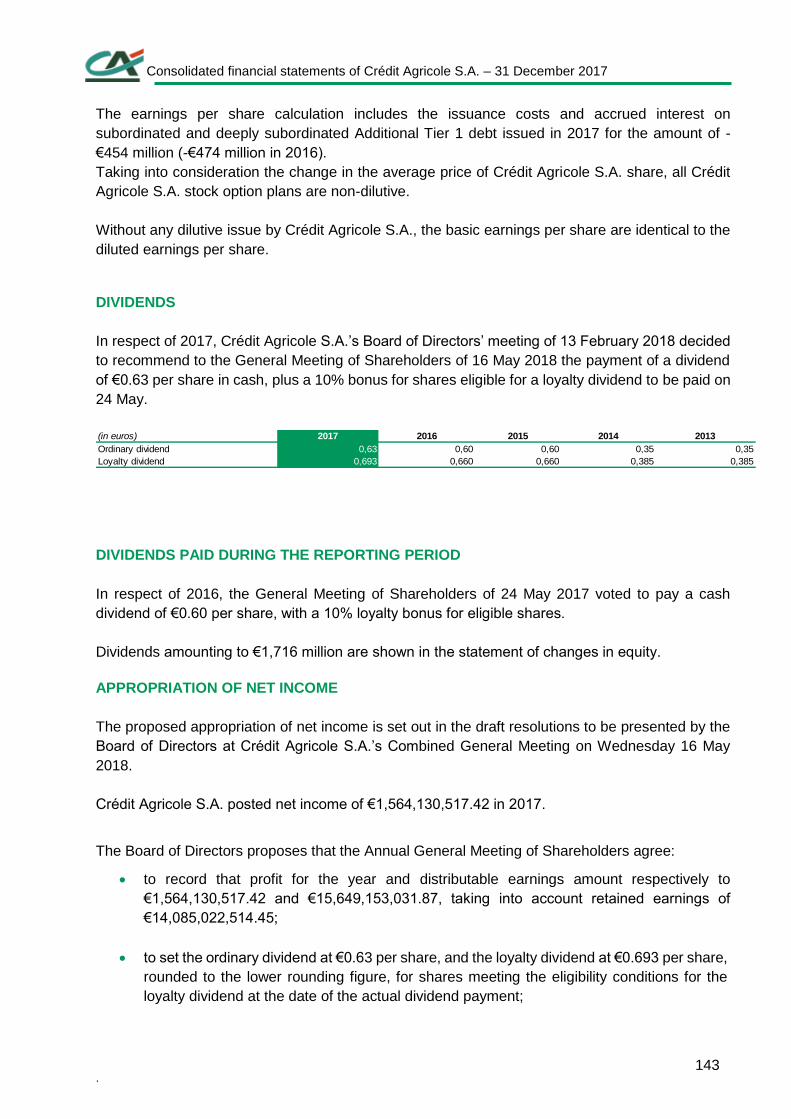
Consolidated financial statements of Crédit Agricole S.A. – 31 December 2017
. 143
The earnings per share calculation includes the issuance costs and accrued interest on
subordinated and deeply subordinated Additional Tier 1 debt issued in 2017 for the amount of -
€454 million (-€474 million in 2016).
Taking into consideration the change in the average price of Crédit Agricole S.A. share, all Crédit
Agricole S.A. stock option plans are non-dilutive.
Without any dilutive issue by Crédit Agricole S.A., the basic earnings per share are identical to the
diluted earnings per share.
DIVIDENDS
In respect of 2017, Crédit Agricole S.A.’s Board of Directors’ meeting of 13 February 2018 decided
to recommend to the General Meeting of Shareholders of 16 May 2018 the payment of a dividend
of €0.63 per share in cash, plus a 10% bonus for shares eligible for a loyalty dividend to be paid on
24 May.
DIVIDENDS PAID DURING THE REPORTING PERIOD
In respect of 2016, the General Meeting of Shareholders of 24 May 2017 voted to pay a cash
dividend of €0.60 per share, with a 10% loyalty bonus for eligible shares.
Dividends amounting to €1,716 million are shown in the statement of changes in equity.
APPROPRIATION OF NET INCOME
The proposed appropriation of net income is set out in the draft resolutions to be presented by the
Board of Directors at Crédit Agricole S.A.’s Combined General Meeting on Wednesday 16 May
2018.
Crédit Agricole S.A. posted net income of €1,564,130,517.42 in 2017.
The Board of Directors proposes that the Annual General Meeting of Shareholders agree:
to record that profit for the year and distributable earnings amount respectively to
€1,564,130,517.42 and €15,649,153,031.87, taking into account retained earnings of
€14,085,022,514.45;
to set the ordinary dividend at €0.63 per share, and the loyalty dividend at €0.693 per share,
rounded to the lower rounding figure, for shares meeting the eligibility conditions for the
loyalty dividend at the date of the actual dividend payment;
(in euros) 2017 2016 2015 2014 2013
Ordinary dividend 0,63 0,60 0,60 0,35 0,35
Loyalty dividend 0,693 0,660 0,660 0,385 0,385
Consolidated financial statements of Crédit Agricole S.A. – 31 December 2017
. 144
to distribute the dividend paid out of distributable earnings in the amount of
€1803,842,387.11(1);
to allocate the undistributed balance of €13,845,310,064.761, to retained earnings.
1 This amount will be adjusted where appropriate to reflect the following events: (a) creation of new shares eligible
for dividends before the ex-dividend date, (b) change in the number of treasury shares prior to the ex-dividend date,
(c) loss of entitlement to the additional 10% dividend for some registered shares before the payment date
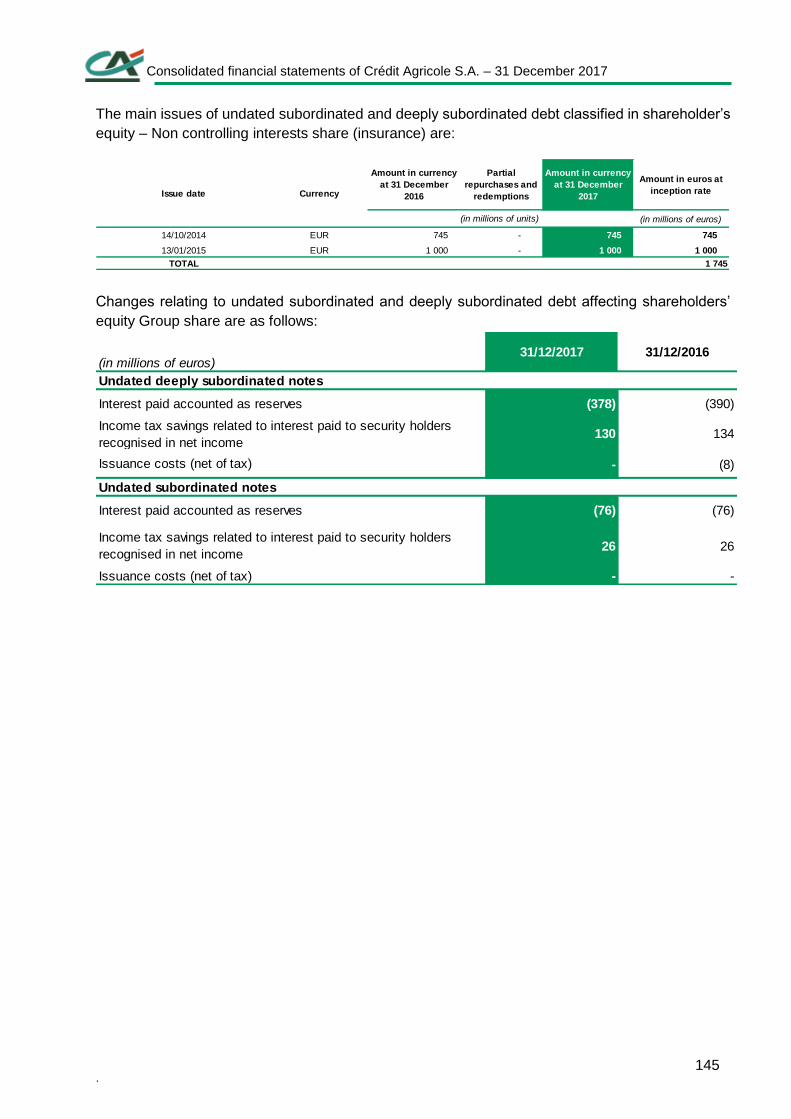
Consolidated financial statements of Crédit Agricole S.A. – 31 December 2017
. 145
The main issues of undated subordinated and deeply subordinated debt classified in shareholder’s
equity – Non controlling interests share (insurance) are:
Changes relating to undated subordinated and deeply subordinated debt affecting shareholders’
equity Group share are as follows:
(in millions of euros)
14/10/2014 EUR 745 - 745 745
13/01/2015 EUR 1 000 - 1 000 1 000
TOTAL 1 745
Issue date Currency
Amount in currency
at 31 December
2016
Partial
repurchases and
redemptions
Amount in currency
at 31 December
2017
Amount in euros at
inception rate
(in millions of units)
(in millions of euros)31/12/2017 31/12/2016
Undated deeply subordinated notes
(378) (390)
130 134
- (8)
Undated subordinated notes
(76) (76)
26 26
- -
Income tax savings related to interest paid to security holders
recognised in net income
Interest paid accounted as reserves
Income tax savings related to interest paid to security holders
recognised in net income
Issuance costs (net of tax)
Interest paid accounted as reserves
Issuance costs (net of tax)
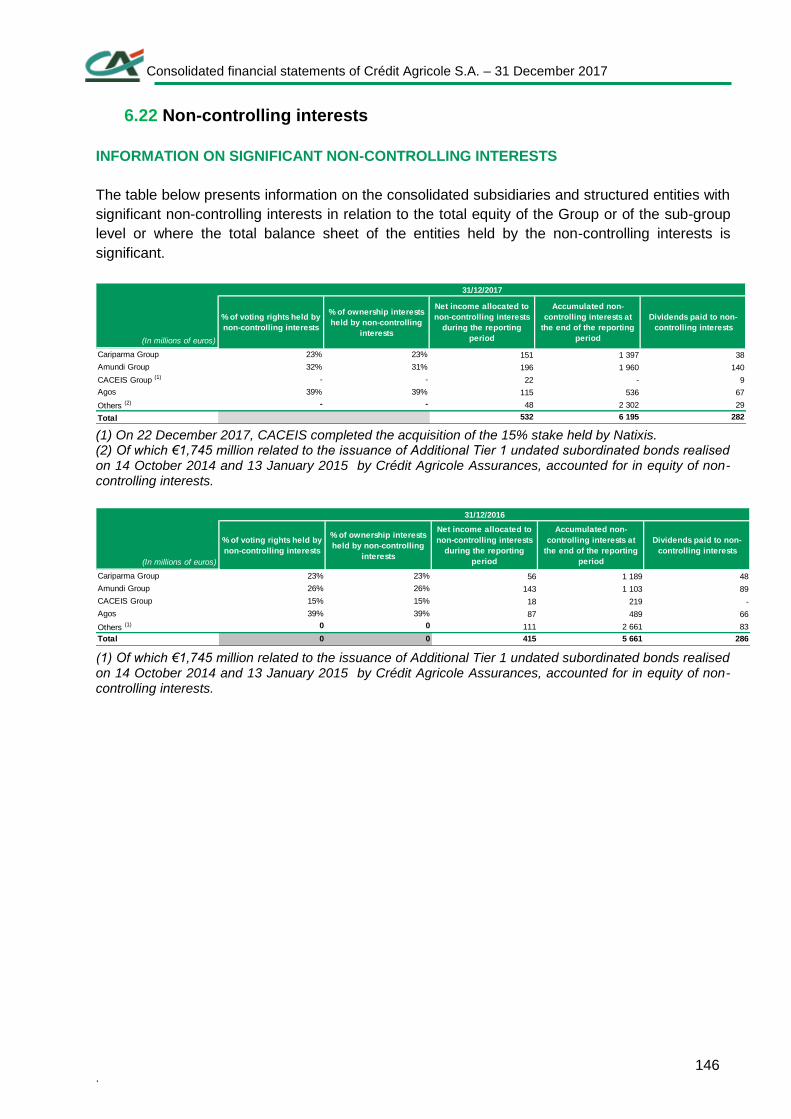
Consolidated financial statements of Crédit Agricole S.A. – 31 December 2017
. 146
6.22 Non-controlling interests
INFORMATION ON SIGNIFICANT NON-CONTROLLING INTERESTS
The table below presents information on the consolidated subsidiaries and structured entities with
significant non-controlling interests in relation to the total equity of the Group or of the sub-group
level or where the total balance sheet of the entities held by the non-controlling interests is
significant.
(1) On 22 December 2017, CACEIS completed the acquisition of the 15% stake held by Natixis. (2) Of which €1,745 million related to the issuance of Additional Tier 1 undated subordinated bonds realised on 14 October 2014 and 13 January 2015 by Crédit Agricole Assurances, accounted for in equity of non-controlling interests.
(1) Of which €1,745 million related to the issuance of Additional Tier 1 undated subordinated bonds realised on 14 October 2014 and 13 January 2015 by Crédit Agricole Assurances, accounted for in equity of non-controlling interests.
(In millions of euros)
% of voting rights held by
non-controlling interests
% of ownership interests
held by non-controlling
interests
Net income allocated to
non-controlling interests
during the reporting
period
Accumulated non-
controlling interests at
the end of the reporting
period
Dividends paid to non-
controlling interests
Cariparma Group 23% 23% 151 1 397 38
Amundi Group 32% 31% 196 1 960 140
CACEIS Group (1) - - 22 - 9
Agos 39% 39% 115 536 67
Others (2) - - 48 2 302 29
Total 532 6 195 282
31/12/2017
(In millions of euros)
% of voting rights held by
non-controlling interests
% of ownership interests
held by non-controlling
interests
Net income allocated to
non-controlling interests
during the reporting
period
Accumulated non-
controlling interests at
the end of the reporting
period
Dividends paid to non-
controlling interests
Cariparma Group 23% 23% 56 1 189 48
Amundi Group 26% 26% 143 1 103 89
CACEIS Group 15% 15% 18 219 -
Agos 39% 39% 87 489 66
Others (1) 0 0 111 2 661 83
Total 0 0 415 5 661 286
31/12/2016
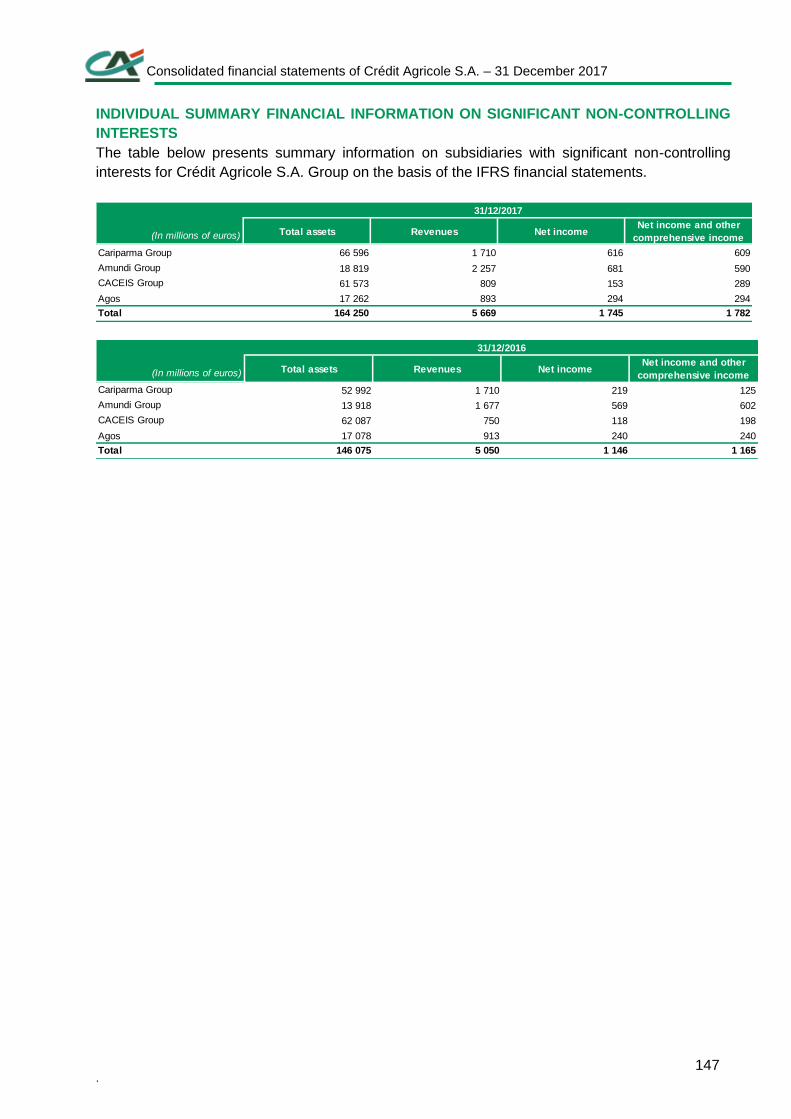
Consolidated financial statements of Crédit Agricole S.A. – 31 December 2017
. 147
INDIVIDUAL SUMMARY FINANCIAL INFORMATION ON SIGNIFICANT NON-CONTROLLING
INTERESTS
The table below presents summary information on subsidiaries with significant non-controlling
interests for Crédit Agricole S.A. Group on the basis of the IFRS financial statements.
(In millions of euros) Total assets Revenues Net incomeNet income and other
comprehensive income
Cariparma Group 66 596 1 710 616 609
Amundi Group 18 819 2 257 681 590
CACEIS Group 61 573 809 153 289
Agos 17 262 893 294 294
Total 164 250 5 669 1 745 1 782
31/12/2017
(In millions of euros) Total assets Revenues Net incomeNet income and other
comprehensive income
Cariparma Group 52 992 1 710 219 125
Amundi Group 13 918 1 677 569 602
CACEIS Group 62 087 750 118 198
Agos 17 078 913 240 240
Total 146 075 5 050 1 146 1 165
31/12/2016
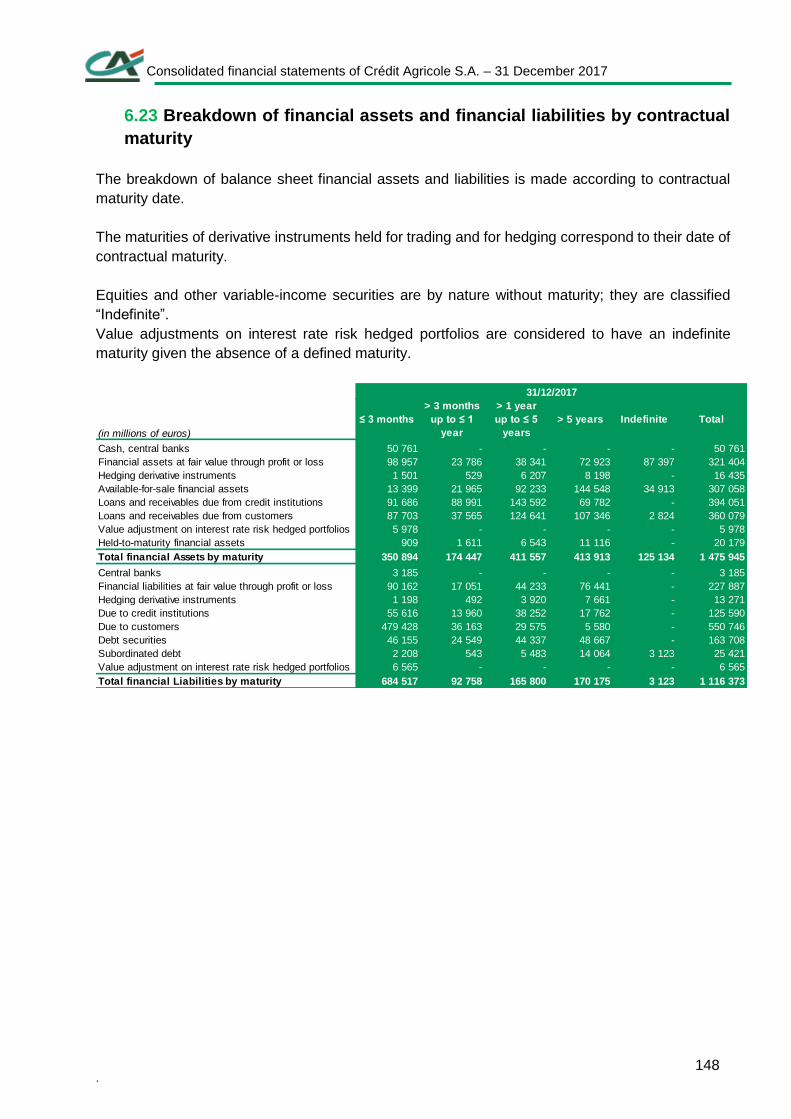
Consolidated financial statements of Crédit Agricole S.A. – 31 December 2017
. 148
6.23 Breakdown of financial assets and financial liabilities by contractual
maturity
The breakdown of balance sheet financial assets and liabilities is made according to contractual
maturity date.
The maturities of derivative instruments held for trading and for hedging correspond to their date of
contractual maturity.
Equities and other variable-income securities are by nature without maturity; they are classified
“Indefinite”.
Value adjustments on interest rate risk hedged portfolios are considered to have an indefinite
maturity given the absence of a defined maturity.
50 761 - - - - 50 761
98 957 23 786 38 341 72 923 87 397 321 404
1 501 529 6 207 8 198 - 16 435
13 399 21 965 92 233 144 548 34 913 307 058
91 686 88 991 143 592 69 782 - 394 051
87 703 37 565 124 641 107 346 2 824 360 079
5 978 - - - - 5 978
909 1 611 6 543 11 116 - 20 179
350 894 174 447 411 557 413 913 125 134 1 475 945
3 185 - - - - 3 185
90 162 17 051 44 233 76 441 - 227 887
1 198 492 3 920 7 661 - 13 271
55 616 13 960 38 252 17 762 - 125 590
479 428 36 163 29 575 5 580 - 550 746
46 155 24 549 44 337 48 667 - 163 708
Subordinated debt 2 208 543 5 483 14 064 3 123 25 421
6 565 - - - - 6 565
684 517 92 758 165 800 170 175 3 123 1 116 373
Loans and receivables due from customers
(in millions of euros)
31/12/2017
≤ 3 months
> 3 months
up to ≤ 1
year
> 1 year
up to ≤ 5
years
> 5 years Indefinite Total
Cash, central banks
Financial assets at fair value through profit or loss
Hedging derivative instruments
Available-for-sale financial assets
Loans and receivables due from credit institutions
Value adjustment on interest rate risk hedged portfolios
Held-to-maturity financial assets
Total financial Assets by maturity
Central banks
Financial liabilities at fair value through profit or loss
Hedging derivative instruments
Due to credit institutions
Due to customers
Debt securities
Value adjustment on interest rate risk hedged portfolios
Total financial Liabilities by maturity
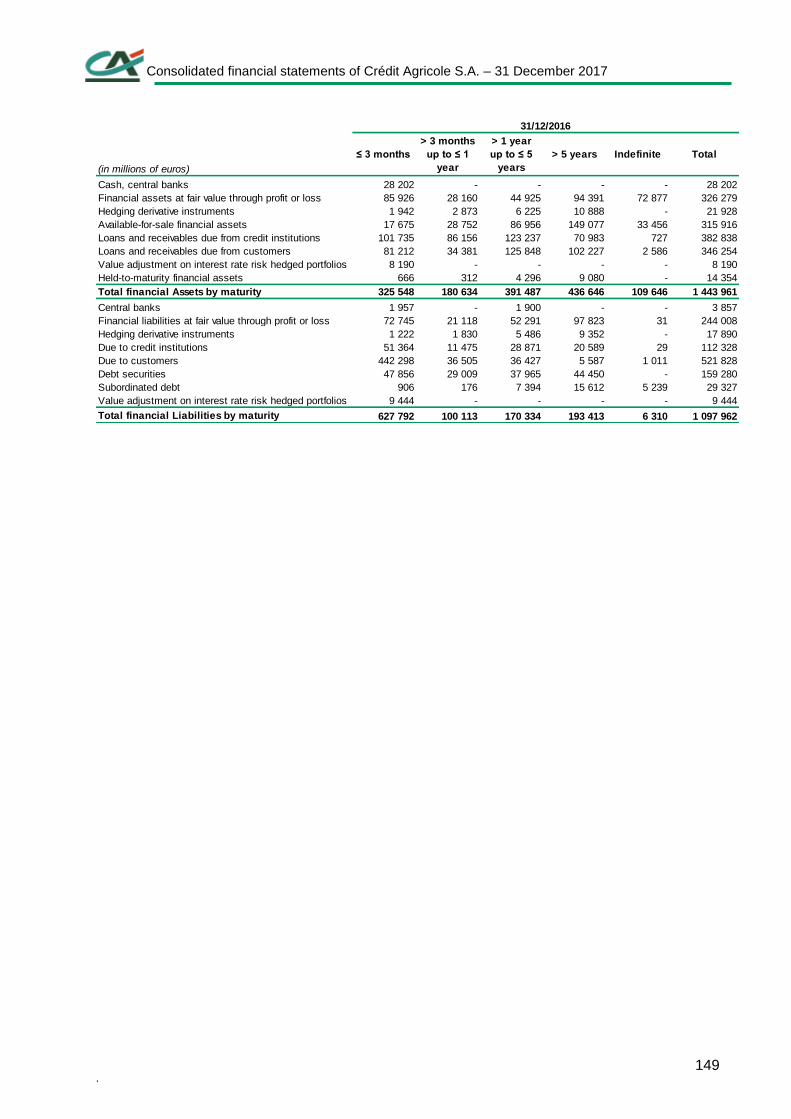
Consolidated financial statements of Crédit Agricole S.A. – 31 December 2017
. 149
28 202 - - - - 28 202
85 926 28 160 44 925 94 391 72 877 326 279
1 942 2 873 6 225 10 888 - 21 928
17 675 28 752 86 956 149 077 33 456 315 916
101 735 86 156 123 237 70 983 727 382 838
81 212 34 381 125 848 102 227 2 586 346 254
8 190 - - - - 8 190
666 312 4 296 9 080 - 14 354
325 548 180 634 391 487 436 646 109 646 1 443 961
1 957 - 1 900 - - 3 857
72 745 21 118 52 291 97 823 31 244 008
1 222 1 830 5 486 9 352 - 17 890
51 364 11 475 28 871 20 589 29 112 328
442 298 36 505 36 427 5 587 1 011 521 828
47 856 29 009 37 965 44 450 - 159 280
Subordinated debt 906 176 7 394 15 612 5 239 29 327
9 444 - - - - 9 444
627 792 100 113 170 334 193 413 6 310 1 097 962
(in millions of euros)
31/12/2016
≤ 3 months
> 3 months
up to ≤ 1
year
> 1 year
up to ≤ 5
years
> 5 years Indefinite Total
Hedging derivative instruments
Cash, central banks
Financial assets at fair value through profit or loss
Hedging derivative instruments
Available-for-sale financial assets
Loans and receivables due from credit institutions
Loans and receivables due from customers
Value adjustment on interest rate risk hedged portfolios
Held-to-maturity financial assets
Total financial Assets by maturity
Central banks
Financial liabilities at fair value through profit or loss
Due to credit institutions
Due to customers
Debt securities
Value adjustment on interest rate risk hedged portfolios
Total financial Liabilities by maturity
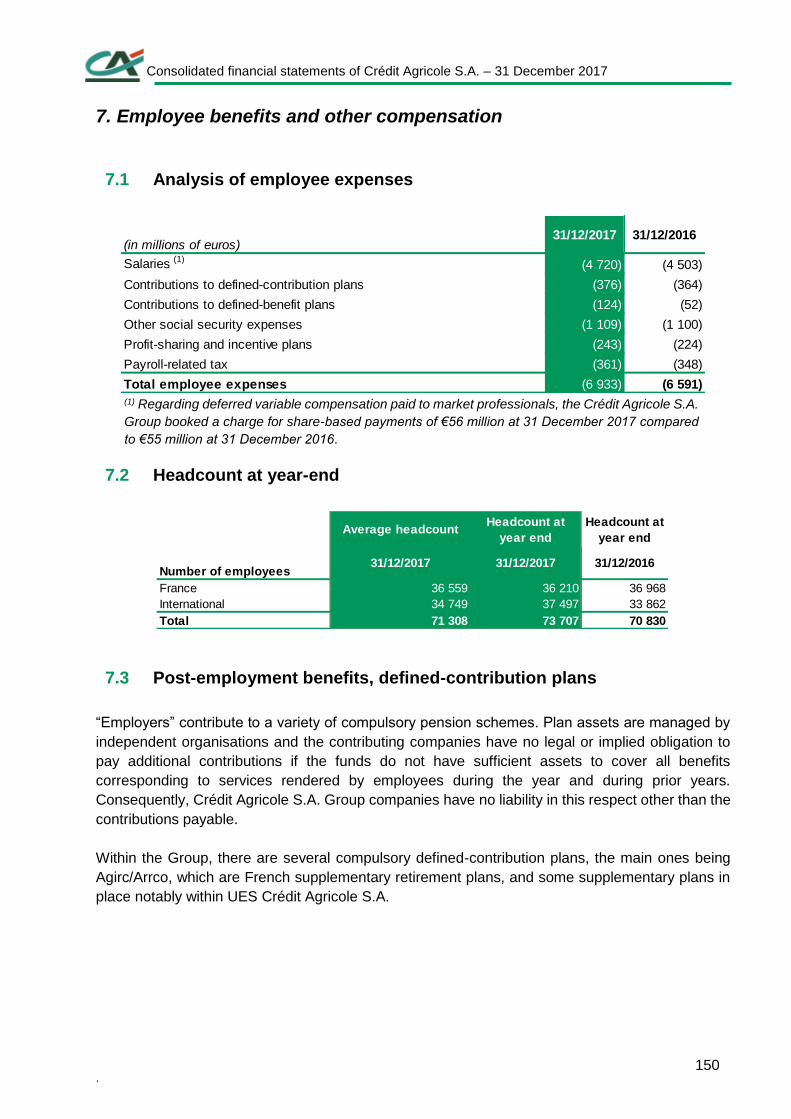
Consolidated financial statements of Crédit Agricole S.A. – 31 December 2017
. 150
7. Employee benefits and other compensation
7.1 Analysis of employee expenses
(1) Regarding deferred variable compensation paid to market professionals, the Crédit Agricole S.A.
Group booked a charge for share-based payments of €56 million at 31 December 2017 compared
to €55 million at 31 December 2016.
7.2 Headcount at year-end
7.3 Post-employment benefits, defined-contribution plans
“Employers” contribute to a variety of compulsory pension schemes. Plan assets are managed by
independent organisations and the contributing companies have no legal or implied obligation to
pay additional contributions if the funds do not have sufficient assets to cover all benefits
corresponding to services rendered by employees during the year and during prior years.
Consequently, Crédit Agricole S.A. Group companies have no liability in this respect other than the
contributions payable.
Within the Group, there are several compulsory defined-contribution plans, the main ones being
Agirc/Arrco, which are French supplementary retirement plans, and some supplementary plans in
place notably within UES Crédit Agricole S.A.
(in millions of euros)31/12/2017 31/12/2016
Salaries (1)(4 720) (4 503)
Contributions to defined-contribution plans (376) (364)
Contributions to defined-benefit plans (124) (52)
Other social security expenses (1 109) (1 100)
Profit-sharing and incentive plans (243) (224)
Payroll-related tax (361) (348)
Total employee expenses (6 933) (6 591)
Average headcountHeadcount at
year end
Headcount at
year end
Number of employees
France 36 559 36 210 36 968
International 34 749 37 497 33 862
Total 71 308 73 707 70 830
31/12/2017 31/12/201631/12/2017
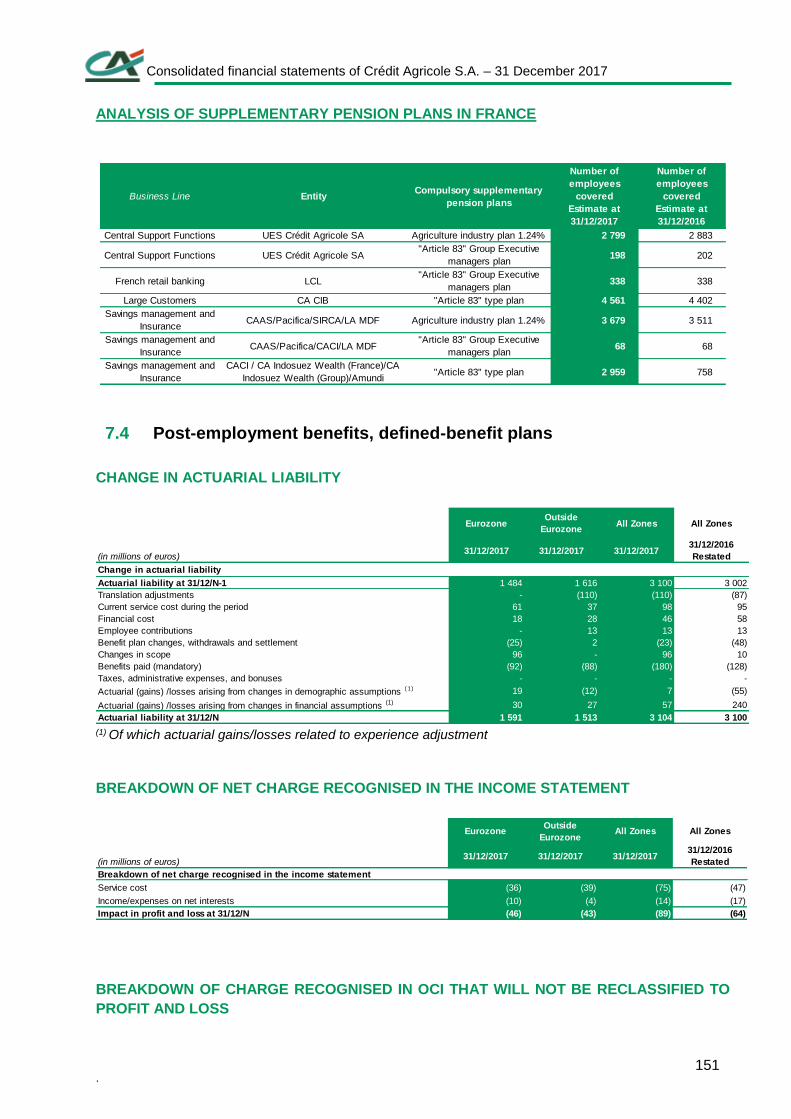
Consolidated financial statements of Crédit Agricole S.A. – 31 December 2017
. 151
ANALYSIS OF SUPPLEMENTARY PENSION PLANS IN FRANCE
7.4 Post-employment benefits, defined-benefit plans
CHANGE IN ACTUARIAL LIABILITY
(1) Of which actuarial gains/losses related to experience adjustment
BREAKDOWN OF NET CHARGE RECOGNISED IN THE INCOME STATEMENT
BREAKDOWN OF CHARGE RECOGNISED IN OCI THAT WILL NOT BE RECLASSIFIED TO
PROFIT AND LOSS
Business Line EntityCompulsory supplementary
pension plans
Number of
employees
covered
Estimate at
31/12/2017
Number of
employees
covered
Estimate at
31/12/2016
Central Support Functions UES Crédit Agricole SA Agriculture industry plan 1.24% 2 799 2 883
Central Support Functions UES Crédit Agricole SA"Article 83" Group Executive
managers plan198 202
French retail banking LCL"Article 83" Group Executive
managers plan338 338
Large Customers CA CIB "Article 83" type plan 4 561 4 402
Savings management and
InsuranceCAAS/Pacifica/SIRCA/LA MDF Agriculture industry plan 1.24% 3 679 3 511
Savings management and
InsuranceCAAS/Pacifica/CACI/LA MDF
"Article 83" Group Executive
managers plan68 68
Savings management and
Insurance
CACI / CA Indosuez Wealth (France)/CA
Indosuez Wealth (Group)/Amundi"Article 83" type plan 2 959 758
EurozoneOutside
EurozoneAll Zones All Zones
(in millions of euros)31/12/2017 31/12/2017 31/12/2017
31/12/2016
Restated
Change in actuarial liability
Actuarial liability at 31/12/N-1 1 484 1 616 3 100 3 002
Translation adjustments - (110) (110) (87)
Current service cost during the period 61 37 98 95
Financial cost 18 28 46 58
Employee contributions - 13 13 13
Benefit plan changes, withdrawals and settlement (25) 2 (23) (48)
Changes in scope 96 - 96 10
Benefits paid (mandatory) (92) (88) (180) (128)
Taxes, administrative expenses, and bonuses - - - -
Actuarial (gains) /losses arising from changes in demographic assumptions (1) 19 (12) 7 (55)
Actuarial (gains) /losses arising from changes in financial assumptions (1) 30 27 57 240
Actuarial liability at 31/12/N 1 591 1 513 3 104 3 100
EurozoneOutside
EurozoneAll Zones All Zones
(in millions of euros)31/12/2017 31/12/2017 31/12/2017
31/12/2016
Restated
Breakdown of net charge recognised in the income statement
Service cost (36) (39) (75) (47)
Income/expenses on net interests (10) (4) (14) (17)
Impact in profit and loss at 31/12/N (46) (43) (89) (64)
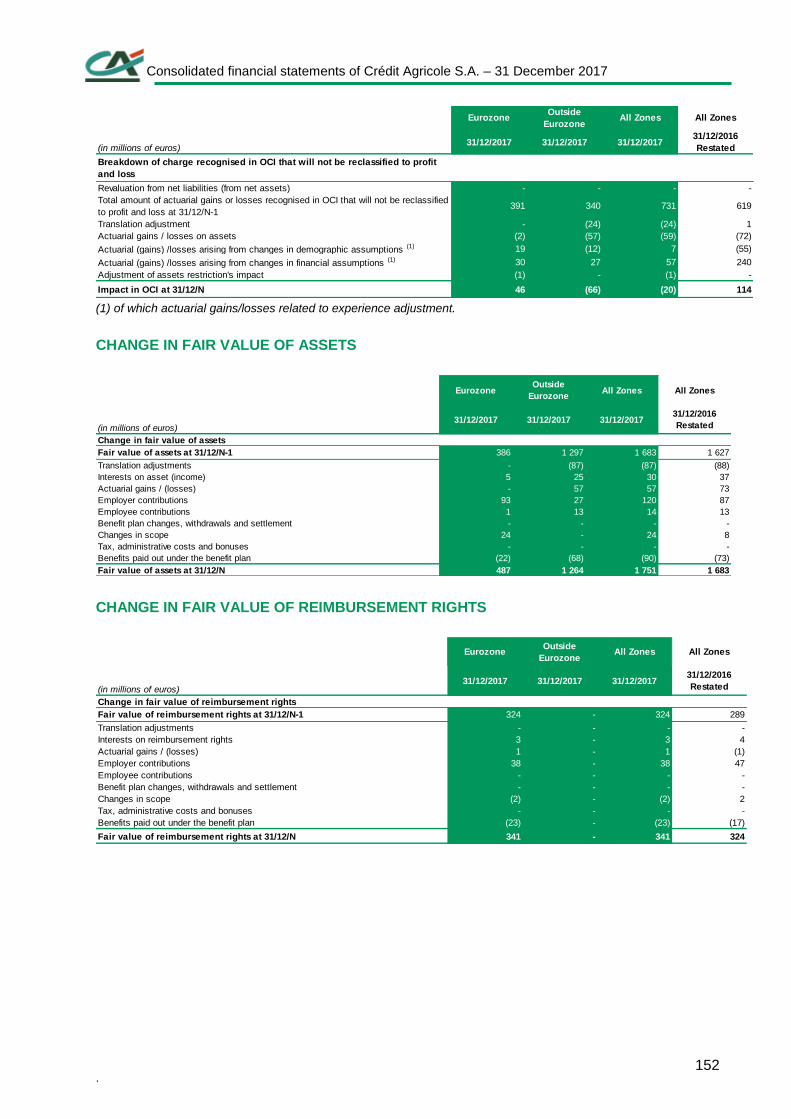
Consolidated financial statements of Crédit Agricole S.A. – 31 December 2017
. 152
(1) of which actuarial gains/losses related to experience adjustment.
CHANGE IN FAIR VALUE OF ASSETS
CHANGE IN FAIR VALUE OF REIMBURSEMENT RIGHTS
EurozoneOutside
EurozoneAll Zones All Zones
(in millions of euros)31/12/2017 31/12/2017 31/12/2017
31/12/2016
Restated
Breakdown of charge recognised in OCI that will not be reclassified to profit
and loss
Revaluation from net liabilities (from net assets) - - - -
Total amount of actuarial gains or losses recognised in OCI that will not be reclassified
to profit and loss at 31/12/N-1391 340 731 619
Translation adjustment - (24) (24) 1
Actuarial gains / losses on assets (2) (57) (59) (72)
Actuarial (gains) /losses arising from changes in demographic assumptions (1) 19 (12) 7 (55)
Actuarial (gains) /losses arising from changes in financial assumptions (1) 30 27 57 240
Adjustment of assets restriction's impact (1) - (1) -
Impact in OCI at 31/12/N 46 (66) (20) 114
EurozoneOutside
EurozoneAll Zones All Zones
(in millions of euros)31/12/2017 31/12/2017 31/12/2017
31/12/2016
Restated
Change in fair value of assets
Fair value of assets at 31/12/N-1 386 1 297 1 683 1 627
Translation adjustments - (87) (87) (88)
Interests on asset (income) 5 25 30 37
Actuarial gains / (losses) - 57 57 73
Employer contributions 93 27 120 87
Employee contributions 1 13 14 13
Benefit plan changes, withdrawals and settlement - - - -
Changes in scope 24 - 24 8
Tax, administrative costs and bonuses - - - -
Benefits paid out under the benefit plan (22) (68) (90) (73)
Fair value of assets at 31/12/N 487 1 264 1 751 1 683
EurozoneOutside
EurozoneAll Zones All Zones
(in millions of euros)31/12/2017 31/12/2017 31/12/2017
31/12/2016
Restated
Change in fair value of reimbursement rights
Fair value of reimbursement rights at 31/12/N-1 324 - 324 289
Translation adjustments - - - -
Interests on reimbursement rights 3 - 3 4
Actuarial gains / (losses) 1 - 1 (1)
Employer contributions 38 - 38 47
Employee contributions - - - -
Benefit plan changes, withdrawals and settlement - - - -
Changes in scope (2) - (2) 2
Tax, administrative costs and bonuses - - - -
Benefits paid out under the benefit plan (23) - (23) (17)
Fair value of reimbursement rights at 31/12/N 341 - 341 324
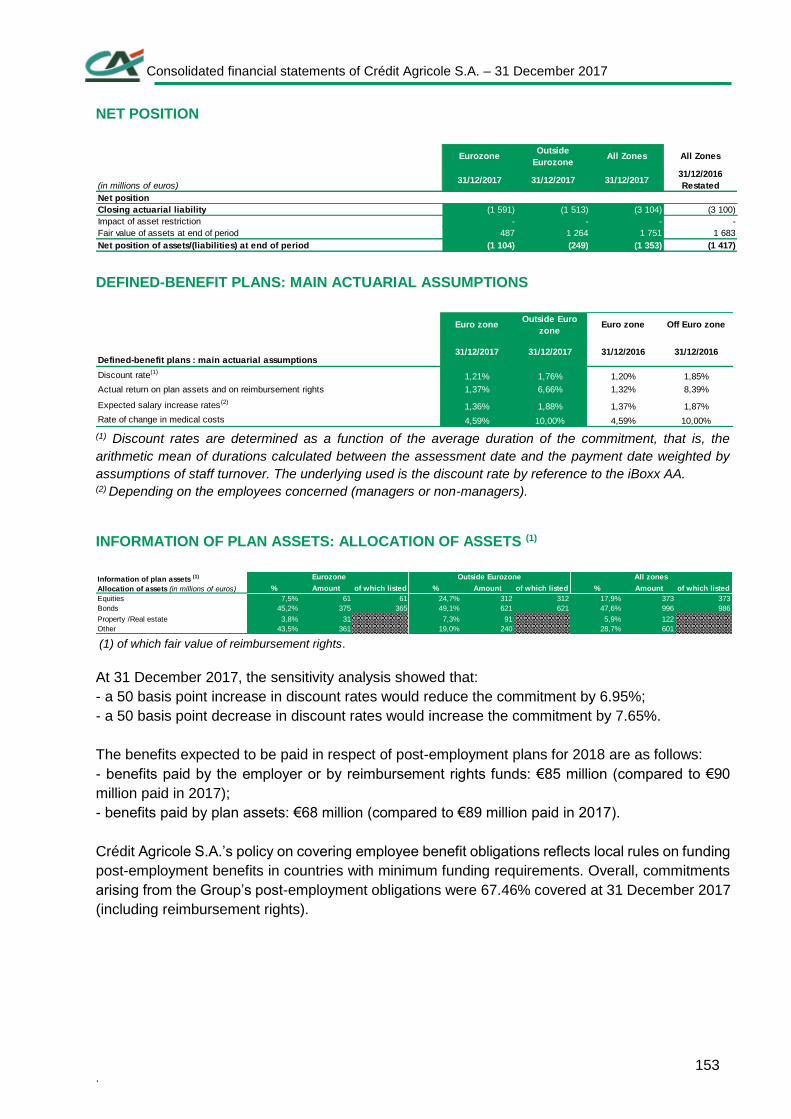
Consolidated financial statements of Crédit Agricole S.A. – 31 December 2017
. 153
NET POSITION
DEFINED-BENEFIT PLANS: MAIN ACTUARIAL ASSUMPTIONS
(1) Discount rates are determined as a function of the average duration of the commitment, that is, the
arithmetic mean of durations calculated between the assessment date and the payment date weighted by
assumptions of staff turnover. The underlying used is the discount rate by reference to the iBoxx AA. (2) Depending on the employees concerned (managers or non-managers).
INFORMATION OF PLAN ASSETS: ALLOCATION OF ASSETS (1)
(1) of which fair value of reimbursement rights.
At 31 December 2017, the sensitivity analysis showed that:
- a 50 basis point increase in discount rates would reduce the commitment by 6.95%;
- a 50 basis point decrease in discount rates would increase the commitment by 7.65%.
The benefits expected to be paid in respect of post-employment plans for 2018 are as follows:
- benefits paid by the employer or by reimbursement rights funds: €85 million (compared to €90
million paid in 2017);
- benefits paid by plan assets: €68 million (compared to €89 million paid in 2017).
Crédit Agricole S.A.’s policy on covering employee benefit obligations reflects local rules on funding
post-employment benefits in countries with minimum funding requirements. Overall, commitments
arising from the Group’s post-employment obligations were 67.46% covered at 31 December 2017
(including reimbursement rights).
EurozoneOutside
EurozoneAll Zones All Zones
(in millions of euros)31/12/2017 31/12/2017 31/12/2017
31/12/2016
Restated
Net position
Closing actuarial liability (1 591) (1 513) (3 104) (3 100)
Impact of asset restriction - - - -
Fair value of assets at end of period 487 1 264 1 751 1 683
Net position of assets/(liabilities) at end of period (1 104) (249) (1 353) (1 417)
Euro zoneOutside Euro
zoneEuro zone Off Euro zone
Defined-benefit plans : main actuarial assumptions31/12/2017 31/12/2017 31/12/2016 31/12/2016
Discount rate(1)1,21% 1,76% 1,20% 1,85%
Actual return on plan assets and on reimbursement rights 1,37% 6,66% 1,32% 8,39%
Expected salary increase rates(2)1,36% 1,88% 1,37% 1,87%
Rate of change in medical costs 4,59% 10,00% 4,59% 10,00%
% Amount of which listed % Amount of which listed % Amount of which listed
Equities 7,5% 61 61 24,7% 312 312 17,9% 373 373
Bonds 45,2% 375 365 49,1% 621 621 47,6% 996 986
Property /Real estate 3,8% 31 7,3% 91 5,9% 122
Other 43,5% 361 19,0% 240 28,7% 601
Information of plan assets (1)
Allocation of assets (in millions of euros)
Eurozone Outside Eurozone All zones
Consolidated financial statements of Crédit Agricole S.A. – 31 December 2017
. 154
7.5 Other employee benefits
In France, the Group’s main entities pay long-service awards. The amounts vary according to
practices and collective bargaining agreements in place.
The provisions funded by Crédit Agricole S.A. Group for these other employee benefit obligations
amounted to €375 million at 31 December 2017.
7.6 Share-based payments
7.6.1 STOCK OPTION PLAN
No new plan was implemented in 2017.
7.6.2 DEFERRED VARIABLE COMPENSATION SETTLED EITHER IN SHARES OR IN
CASH INDEXED TO THE SHARE PRICE
The deferred variable compensation plans implemented by the Group take two forms:
- equity-settled plans;
- cash-settled plans indexed to the Crédit Agricole S.A. share price.
Since 1 January 2016, all existing and future deferred variable-compensation plans are now cash-
settled plans indexed to the Crédit Agricole S.A. share price. The impact of the revaluation of the
commitment on the basis of the Crédit Agricole S.A. share price, which is not material, was
recognised in equity.
This deferred variable compensation is subject to continued employment and a performance
condition. It is broken down into thirds that are payable in March 2018, March 2019 and March
2020.
The expense related to these plans is recognised in compensation expenses on a straight-line basis
over the vesting period to factor in continued employment, and a liability is recorded in employee
expenses, the amount of which is subject to periodical revaluation through profit or loss until the
settlement date, depending on the evolution of the share price of Crédit Agricole S.A. and on vesting
conditions (continued employment and performance).
7.7 Executive compensation
Senior management includes all members of the Executive Committee, namely the Chief Executive
Officer, Deputy Chief Executive Officer, Deputy Chief Executive Officers for the Group’s different
divisions, Chief Executive Officers of the main subsidiaries and the heads of the Group’s core
business activities.
Compensation and benefits paid to the members of the Executive Committee in 2017 were as
follows:
Consolidated financial statements of Crédit Agricole S.A. – 31 December 2017
. 155
short-term benefits: €26.3 million for fixed and variable compensation (of which €4.1 million
paid in share-indexed instruments), including social security expenses and benefits in kind;
post-employment benefits: €4.5 million for end-of-career allowances and for the
supplementary pension plan for Group executive managers;
other long-term employee benefits: the amount of long-service awards granted was not
material;
employment contract termination indemnities: not material;
other share-based payment: not applicable.
Total Directors’ fees paid to members of Crédit Agricole S.A.’s Board of Directors in 2017 in
consideration for serving as Directors of Crédit Agricole S.A. amounted to €839,141.
These amounts included the compensation and benefits paid to the Chief Executive Officer and
Deputy Chief Executive Officer of Crédit Agricole S.A.
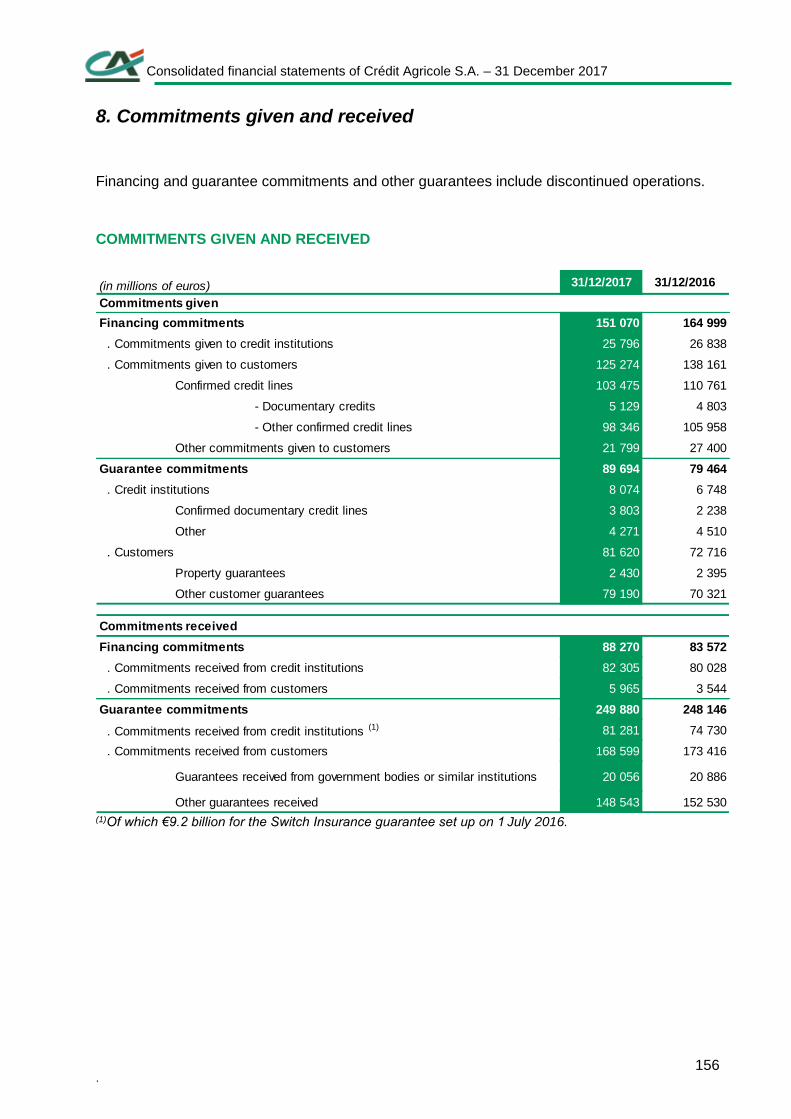
Consolidated financial statements of Crédit Agricole S.A. – 31 December 2017
. 156
8. Commitments given and received
Financing and guarantee commitments and other guarantees include discontinued operations.
COMMITMENTS GIVEN AND RECEIVED
(1)Of which €9.2 billion for the Switch Insurance guarantee set up on 1 July 2016.
(in millions of euros) 31/12/2017 31/12/2016
151 070 164 999
25 796 26 838
125 274 138 161
Confirmed credit lines 103 475 110 761
- Documentary credits 5 129 4 803
- Other confirmed credit lines 98 346 105 958
Other commitments given to customers 21 799 27 400
89 694 79 464
8 074 6 748
Confirmed documentary credit lines 3 803 2 238
Other 4 271 4 510
81 620 72 716
Property guarantees 2 430 2 395
Other customer guarantees 79 190 70 321
88 270 83 572
82 305 80 028
5 965 3 544
249 880 248 146
81 281 74 730
168 599 173 416
20 056 20 886
Other guarantees received 148 543 152 530
. Commitments received from credit institutions (1)
. Commitments received from customers
Guarantees received from government bodies or similar institutions
Guarantee commitments
Commitments given
Financing commitments
. Commitments given to credit institutions
. Commitments given to customers
Guarantee commitments
. Credit institutions
. Customers
Commitments received
Financing commitments
. Commitments received from credit institutions
. Commitments received from customers
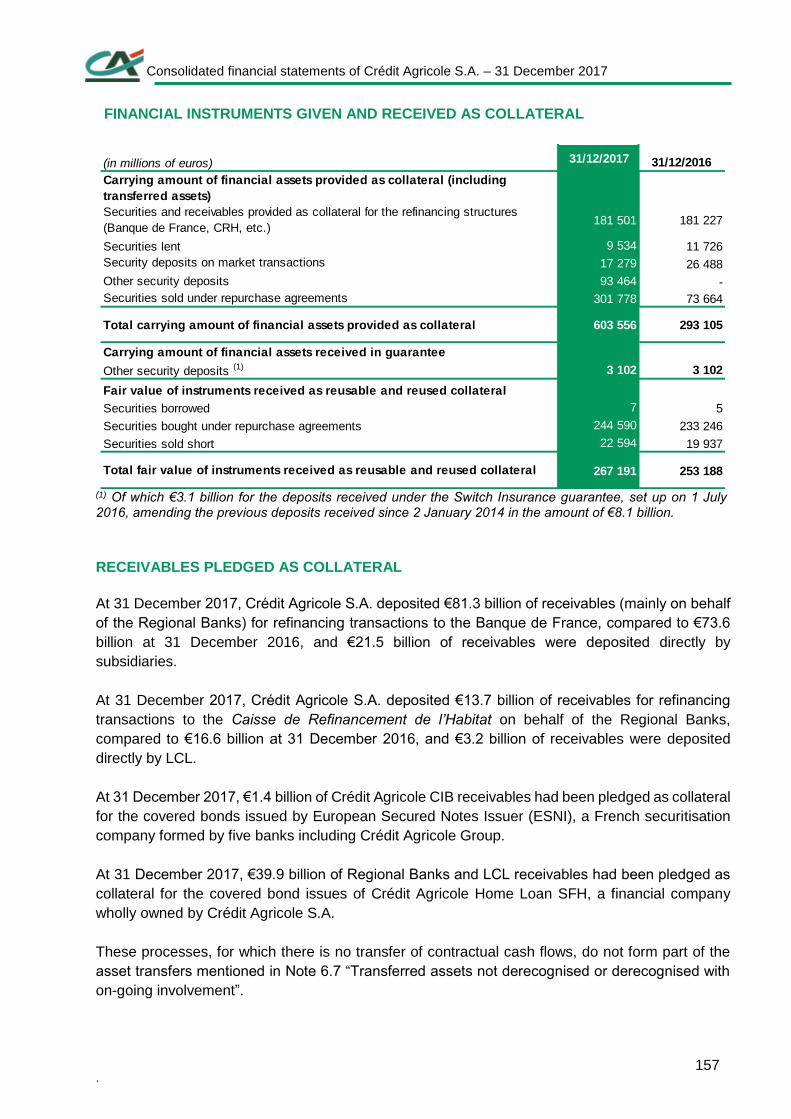
Consolidated financial statements of Crédit Agricole S.A. – 31 December 2017
. 157
FINANCIAL INSTRUMENTS GIVEN AND RECEIVED AS COLLATERAL
(1) Of which €3.1 billion for the deposits received under the Switch Insurance guarantee, set up on 1 July 2016, amending the previous deposits received since 2 January 2014 in the amount of €8.1 billion.
RECEIVABLES PLEDGED AS COLLATERAL
At 31 December 2017, Crédit Agricole S.A. deposited €81.3 billion of receivables (mainly on behalf
of the Regional Banks) for refinancing transactions to the Banque de France, compared to €73.6
billion at 31 December 2016, and €21.5 billion of receivables were deposited directly by
subsidiaries.
At 31 December 2017, Crédit Agricole S.A. deposited €13.7 billion of receivables for refinancing
transactions to the Caisse de Refinancement de l’Habitat on behalf of the Regional Banks,
compared to €16.6 billion at 31 December 2016, and €3.2 billion of receivables were deposited
directly by LCL.
At 31 December 2017, €1.4 billion of Crédit Agricole CIB receivables had been pledged as collateral
for the covered bonds issued by European Secured Notes Issuer (ESNI), a French securitisation
company formed by five banks including Crédit Agricole Group.
At 31 December 2017, €39.9 billion of Regional Banks and LCL receivables had been pledged as
collateral for the covered bond issues of Crédit Agricole Home Loan SFH, a financial company
wholly owned by Crédit Agricole S.A.
These processes, for which there is no transfer of contractual cash flows, do not form part of the
asset transfers mentioned in Note 6.7 “Transferred assets not derecognised or derecognised with
on-going involvement”.
(in millions of euros) 31/12/2017 31/12/2016
181 501 181 227
Securities lent 9 534 11 726
17 279 26 488
Other security deposits 93 464 -
301 778 73 664
603 556 293 105
Carrying amount of financial assets received in guarantee
Other security deposits (1) 3 102 3 102
Securities borrowed 7 5
Securities bought under repurchase agreements 244 590 233 246
Securities sold short 22 594 19 937
267 191 253 188
Fair value of instruments received as reusable and reused collateral
Total fair value of instruments received as reusable and reused collateral
Carrying amount of financial assets provided as collateral (including
transferred assets)
Securities and receivables provided as collateral for the refinancing structures
(Banque de France, CRH, etc.)
Security deposits on market transactions
Securities sold under repurchase agreements
Total carrying amount of financial assets provided as collateral
Consolidated financial statements of Crédit Agricole S.A. – 31 December 2017
. 158
GUARANTEES HELD
Guarantees held and assets received as collateral by Crédit Agricole S.A. Group which it is allowed
to sell or to use as collateral are mostly held within Crédit Agricole S.A. for €97 billion and within
Crédit Agricole CIB for €117,2 billion. The majority of these are receivables pledged as collateral
by the Regional Banks to Crédit Agricole S.A., the latter acting as the central body with regard to
the external refinancing organisations, in order to obtain refinancing. These receivables (property-
related, or loans to businesses or local authorities) are selected and rated for their quality and
retained on the balance sheet of the Regional Banks.
The majority of these guarantees consist of mortgage liens, collateral or guarantees received,
regardless of the quality of the assets guaranteed. They are mainly related to repurchase
agreements and securities pledged to guarantee brokerage transactions.
Crédit Agricole S.A. Group policy is to sell seized collateral as soon as possible. Crédit Agricole
CIB and Crédit Agricole S.A. had no such assets at 31 December 2017.
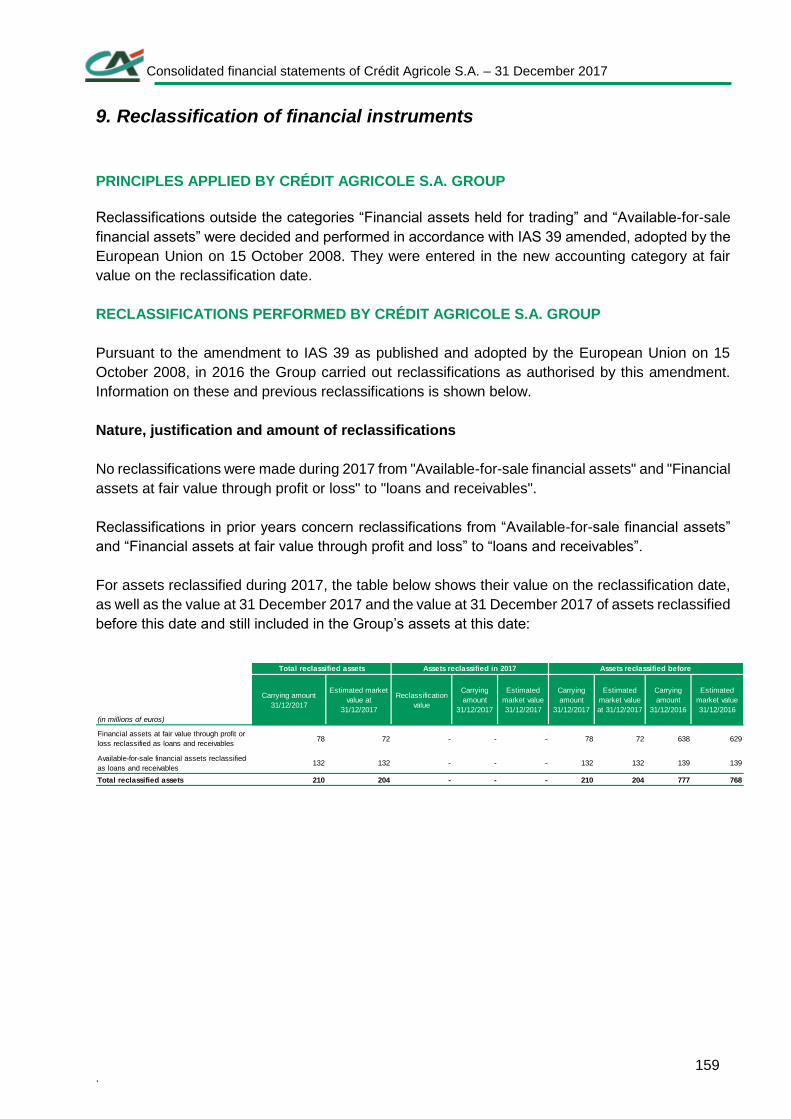
Consolidated financial statements of Crédit Agricole S.A. – 31 December 2017
. 159
9. Reclassification of financial instruments
PRINCIPLES APPLIED BY CRÉDIT AGRICOLE S.A. GROUP
Reclassifications outside the categories “Financial assets held for trading” and “Available-for-sale
financial assets” were decided and performed in accordance with IAS 39 amended, adopted by the
European Union on 15 October 2008. They were entered in the new accounting category at fair
value on the reclassification date.
RECLASSIFICATIONS PERFORMED BY CRÉDIT AGRICOLE S.A. GROUP
Pursuant to the amendment to IAS 39 as published and adopted by the European Union on 15
October 2008, in 2016 the Group carried out reclassifications as authorised by this amendment.
Information on these and previous reclassifications is shown below.
Nature, justification and amount of reclassifications
No reclassifications were made during 2017 from "Available-for-sale financial assets" and "Financial
assets at fair value through profit or loss" to "loans and receivables".
Reclassifications in prior years concern reclassifications from “Available-for-sale financial assets”
and “Financial assets at fair value through profit and loss” to “loans and receivables”.
For assets reclassified during 2017, the table below shows their value on the reclassification date,
as well as the value at 31 December 2017 and the value at 31 December 2017 of assets reclassified
before this date and still included in the Group’s assets at this date:
(in millions of euros)
Carrying amount
31/12/2017
Estimated market
value at
31/12/2017
Reclassification
value
Carrying
amount
31/12/2017
Estimated
market value
31/12/2017
Carrying
amount
31/12/2017
Estimated
market value
at 31/12/2017
Carrying
amount
31/12/2016
Estimated
market value
31/12/2016
Financial assets at fair value through profit or
loss reclassified as loans and receivables78 72 - - - 78 72 638 629
Available-for-sale financial assets reclassified
as loans and receivables132 132 - - - 132 132 139 139
Total reclassified assets 210 204 - - - 210 204 777 768
Total reclassified assets Assets reclassified in 2017 Assets reclassified before
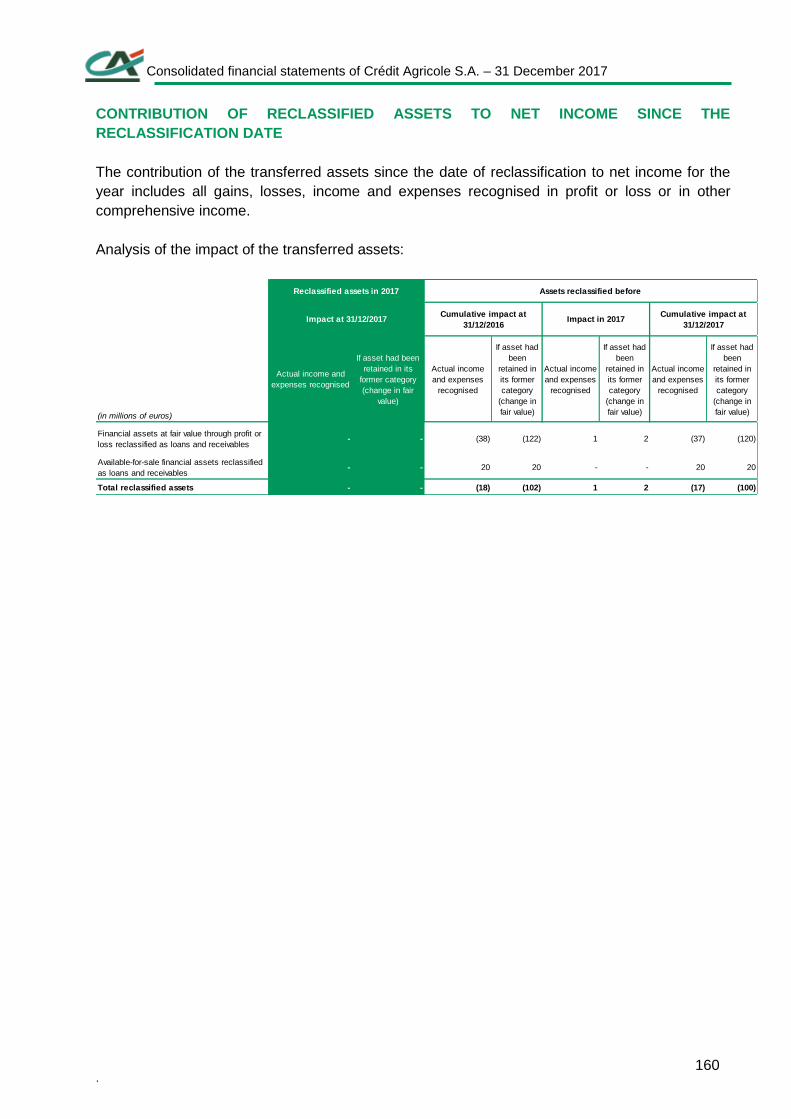
Consolidated financial statements of Crédit Agricole S.A. – 31 December 2017
. 160
CONTRIBUTION OF RECLASSIFIED ASSETS TO NET INCOME SINCE THE
RECLASSIFICATION DATE
The contribution of the transferred assets since the date of reclassification to net income for the
year includes all gains, losses, income and expenses recognised in profit or loss or in other
comprehensive income.
Analysis of the impact of the transferred assets:
(in millions of euros)
Actual income and
expenses recognised
If asset had been
retained in its
former category
(change in fair
value)
Actual income
and expenses
recognised
If asset had
been
retained in
its former
category
(change in
fair value)
Actual income
and expenses
recognised
If asset had
been
retained in
its former
category
(change in
fair value)
Actual income
and expenses
recognised
If asset had
been
retained in
its former
category
(change in
fair value)
Financial assets at fair value through profit or
loss reclassified as loans and receivables- - (38) (122) 1 2 (37) (120)
Available-for-sale financial assets reclassified
as loans and receivables- - 20 20 - - 20 20
Total reclassified assets - - (18) (102) 1 2 (17) (100)
Reclassified assets in 2017 Assets reclassified before
Impact at 31/12/2017Cumulative impact at
31/12/2016Impact in 2017
Cumulative impact at
31/12/2017

Consolidated financial statements of Crédit Agricole S.A. – 31 December 2017
. 161
10. Fair value of financial instruments
Fair value is the price that would be received at the sale of an asset or paid to transfer a liability in
a standard transaction between market participants at the measurement date.
Fair value is defined on the basis of the exit price.
The fair values shown below are estimates made on the reporting date using observable market
data wherever possible. These are subject to change in subsequent periods due to developments
in market conditions or other factors.
The calculations represent best estimates. They are based on a number of assumptions. It is
assumed that market participants act in their best economic interest.
To the extent that these models contain uncertainties, the fair values shown may not be achieved
upon actual sale or immediate settlement of the financial instruments concerned.
The fair value hierarchy of financial assets and liabilities is broken down according to the general
observability criteria of the valuation inputs, pursuant to the principles defined under IFRS 13.
Level 1 applies to the fair value of financial assets and liabilities quoted in active markets.
Level 2 applies to the fair value of financial assets and liabilities with observable inputs. This
agreement includes market data relating to interest rate risk or credit risk when the latter can be
revalued based on Credit Default Swap (CDS) spread. Securities received under repurchase
agreements with underlyings quoted in an active market are also included in Level 2 of the
hierarchy, as are financial assets with a demand component for which fair value is measured at
unadjusted amortised cost.
Level 3 indicates the fair value of financial assets and liabilities with unobservable inputs or for
which some data can be revalued using internal models based on historical data. This mainly
includes market data relating to credit risk or early redemption risk.
In some cases, market values are close to carrying amounts. This applies primarily to:
assets or liabilities at variable rates for which interest rate changes do not have a significant
influence on the fair value, since the rates on these instruments frequently adjust themselves
to the market rates;
short-term assets or liabilities where we consider the redemption value to be close to the market
value;
demand assets and liabilities;
transactions for which there are no reliable observable data.
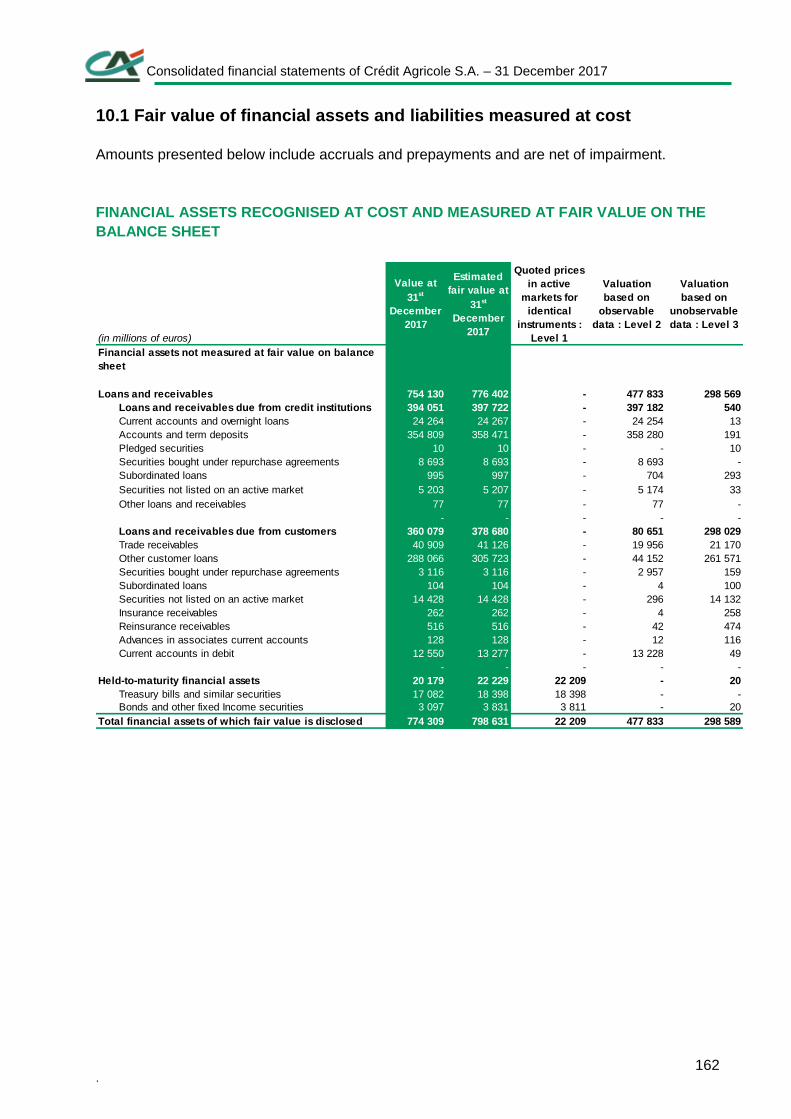
Consolidated financial statements of Crédit Agricole S.A. – 31 December 2017
. 162
10.1 Fair value of financial assets and liabilities measured at cost
Amounts presented below include accruals and prepayments and are net of impairment.
FINANCIAL ASSETS RECOGNISED AT COST AND MEASURED AT FAIR VALUE ON THE
BALANCE SHEET
Value at
31st
December
2017
Estimated
fair value at
31st
December
2017
Quoted prices
in active
markets for
identical
instruments :
Level 1
Valuation
based on
observable
data : Level 2
Valuation
based on
unobservable
data : Level 3
Loans and receivables 754 130 776 402 - 477 833 298 569
Loans and receivables due from credit institutions 394 051 397 722 - 397 182 540
Current accounts and overnight loans 24 264 24 267 - 24 254 13
Accounts and term deposits 354 809 358 471 - 358 280 191
Pledged securities 10 10 - - 10
Securities bought under repurchase agreements 8 693 8 693 - 8 693 -
Subordinated loans 995 997 - 704 293
Securities not listed on an active market 5 203 5 207 - 5 174 33
Other loans and receivables 77 77 - 77 -
- - - - -
Loans and receivables due from customers 360 079 378 680 - 80 651 298 029
Trade receivables 40 909 41 126 - 19 956 21 170
Other customer loans 288 066 305 723 - 44 152 261 571
Securities bought under repurchase agreements 3 116 3 116 - 2 957 159
Subordinated loans 104 104 - 4 100
Securities not listed on an active market 14 428 14 428 - 296 14 132
Insurance receivables 262 262 - 4 258
Reinsurance receivables 516 516 - 42 474
Advances in associates current accounts 128 128 - 12 116
Current accounts in debit 12 550 13 277 - 13 228 49
- - - - -
Held-to-maturity financial assets 20 179 22 229 22 209 - 20
Treasury bills and similar securities 17 082 18 398 18 398 - -
Bonds and other fixed Income securities 3 097 3 831 3 811 - 20
774 309 798 631 22 209 477 833 298 589
Financial assets not measured at fair value on balance
sheet
Total financial assets of which fair value is disclosed
(in millions of euros)
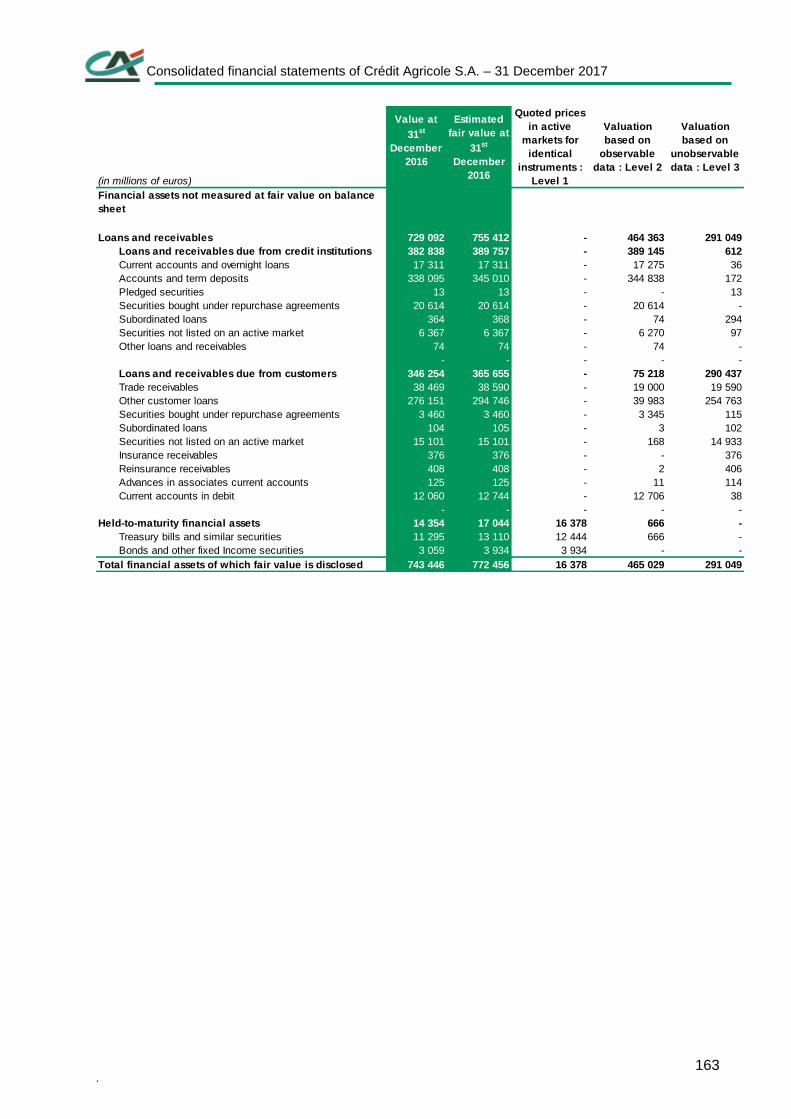
Consolidated financial statements of Crédit Agricole S.A. – 31 December 2017
. 163
Value at
31st
December
2016
Estimated
fair value at
31st
December
2016
Quoted prices
in active
markets for
identical
instruments :
Level 1
Valuation
based on
observable
data : Level 2
Valuation
based on
unobservable
data : Level 3
Loans and receivables 729 092 755 412 - 464 363 291 049
Loans and receivables due from credit institutions 382 838 389 757 - 389 145 612
Current accounts and overnight loans 17 311 17 311 - 17 275 36
Accounts and term deposits 338 095 345 010 - 344 838 172
Pledged securities 13 13 - - 13
Securities bought under repurchase agreements 20 614 20 614 - 20 614 -
Subordinated loans 364 368 - 74 294
Securities not listed on an active market 6 367 6 367 - 6 270 97
Other loans and receivables 74 74 - 74 -
- - - - -
Loans and receivables due from customers 346 254 365 655 - 75 218 290 437
Trade receivables 38 469 38 590 - 19 000 19 590
Other customer loans 276 151 294 746 - 39 983 254 763
Securities bought under repurchase agreements 3 460 3 460 - 3 345 115
Subordinated loans 104 105 - 3 102
Securities not listed on an active market 15 101 15 101 - 168 14 933
Insurance receivables 376 376 - - 376
Reinsurance receivables 408 408 - 2 406
Advances in associates current accounts 125 125 - 11 114
Current accounts in debit 12 060 12 744 - 12 706 38
- - - - -
Held-to-maturity financial assets 14 354 17 044 16 378 666 -
Treasury bills and similar securities 11 295 13 110 12 444 666 -
Bonds and other fixed Income securities 3 059 3 934 3 934 - -
743 446 772 456 16 378 465 029 291 049
(in millions of euros)
Financial assets not measured at fair value on balance
sheet
Total financial assets of which fair value is disclosed
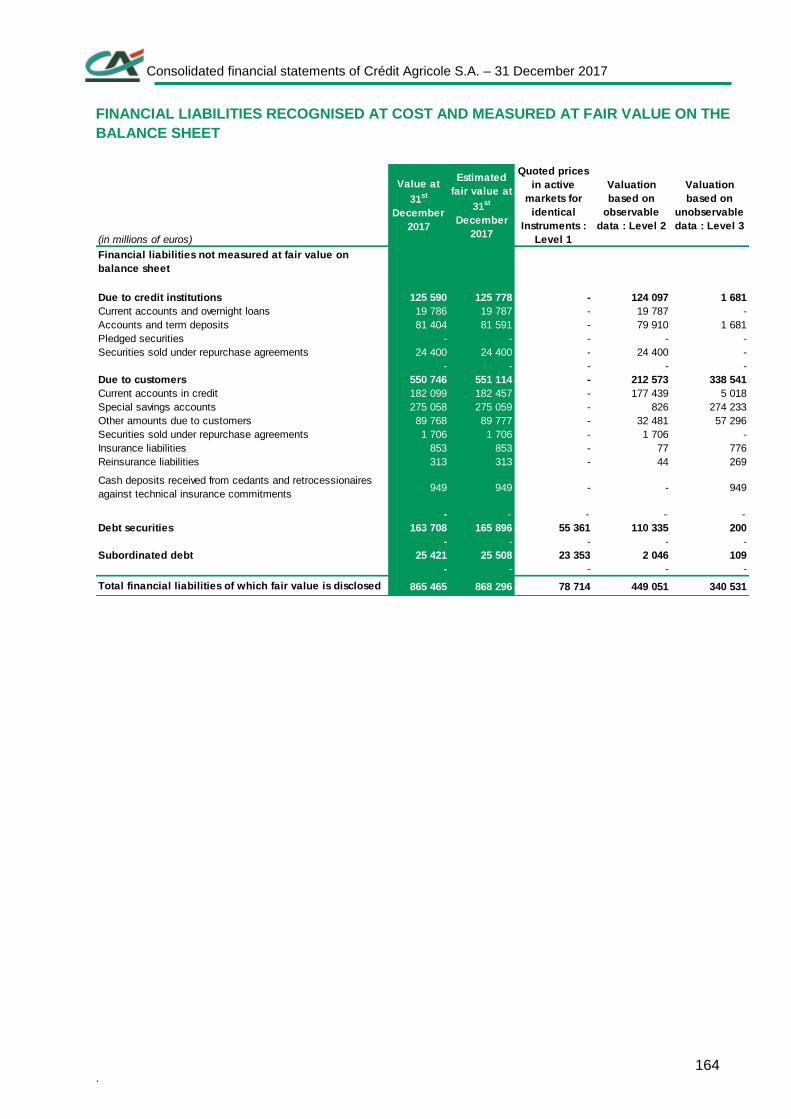
Consolidated financial statements of Crédit Agricole S.A. – 31 December 2017
. 164
FINANCIAL LIABILITIES RECOGNISED AT COST AND MEASURED AT FAIR VALUE ON THE
BALANCE SHEET
Value at
31st
December
2017
Estimated
fair value at
31st
December
2017
Quoted prices
in active
markets for
identical
Instruments :
Level 1
Valuation
based on
observable
data : Level 2
Valuation
based on
unobservable
data : Level 3
Due to credit institutions 125 590 125 778 - 124 097 1 681
Current accounts and overnight loans 19 786 19 787 - 19 787 -
Accounts and term deposits 81 404 81 591 - 79 910 1 681
Pledged securities - - - - -
Securities sold under repurchase agreements 24 400 24 400 - 24 400 -
- - - - -
Due to customers 550 746 551 114 - 212 573 338 541
Current accounts in credit 182 099 182 457 - 177 439 5 018
Special savings accounts 275 058 275 059 - 826 274 233
Other amounts due to customers 89 768 89 777 - 32 481 57 296
Securities sold under repurchase agreements 1 706 1 706 - 1 706 -
Insurance liabilities 853 853 - 77 776
Reinsurance liabilities 313 313 - 44 269
949 949 - - 949
- - - - -
Debt securities 163 708 165 896 55 361 110 335 200
- - - - -
Subordinated debt 25 421 25 508 23 353 2 046 109
- - - - -
865 465 868 296 78 714 449 051 340 531
(in millions of euros)
Financial liabilities not measured at fair value on
balance sheet
Cash deposits received from cedants and retrocessionaires
against technical insurance commitments
Total financial liabilities of which fair value is disclosed
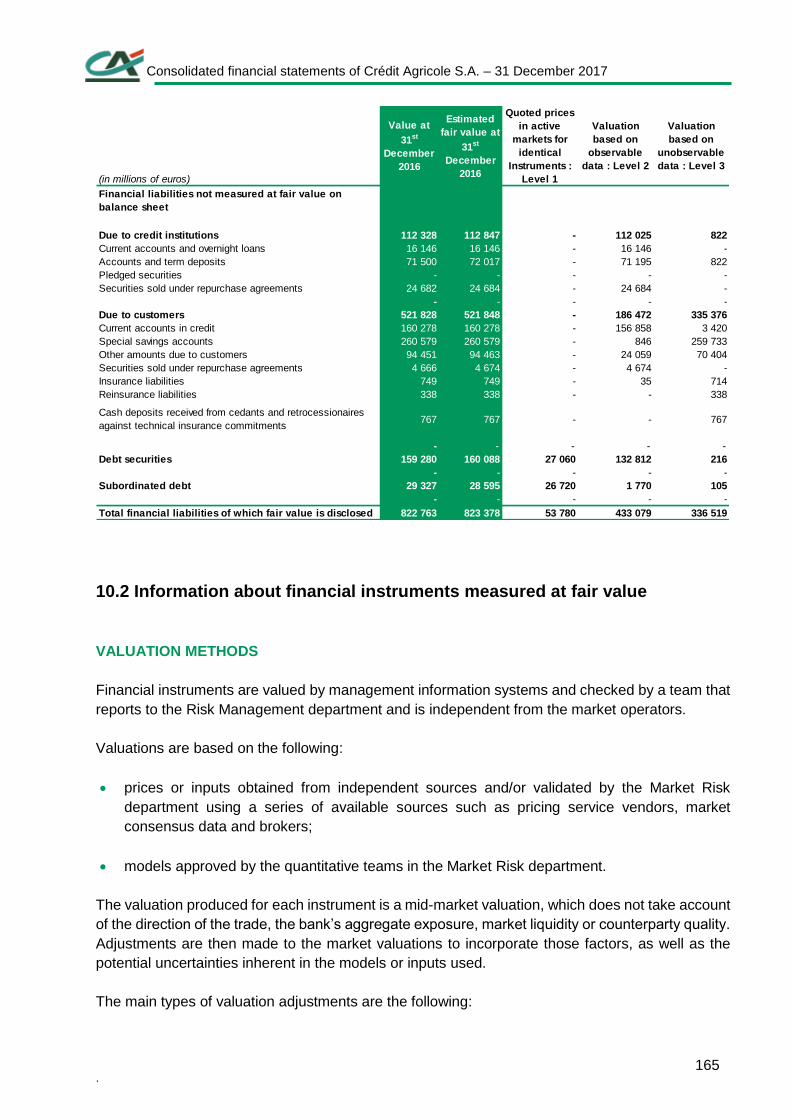
Consolidated financial statements of Crédit Agricole S.A. – 31 December 2017
. 165
10.2 Information about financial instruments measured at fair value
VALUATION METHODS
Financial instruments are valued by management information systems and checked by a team that
reports to the Risk Management department and is independent from the market operators.
Valuations are based on the following:
prices or inputs obtained from independent sources and/or validated by the Market Risk
department using a series of available sources such as pricing service vendors, market
consensus data and brokers;
models approved by the quantitative teams in the Market Risk department.
The valuation produced for each instrument is a mid-market valuation, which does not take account
of the direction of the trade, the bank’s aggregate exposure, market liquidity or counterparty quality.
Adjustments are then made to the market valuations to incorporate those factors, as well as the
potential uncertainties inherent in the models or inputs used.
The main types of valuation adjustments are the following:
Value at
31st
December
2016
Estimated
fair value at
31st
December
2016
Quoted prices
in active
markets for
identical
Instruments :
Level 1
Valuation
based on
observable
data : Level 2
Valuation
based on
unobservable
data : Level 3
Due to credit institutions 112 328 112 847 - 112 025 822
Current accounts and overnight loans 16 146 16 146 - 16 146 -
Accounts and term deposits 71 500 72 017 - 71 195 822
Pledged securities - - - - -
Securities sold under repurchase agreements 24 682 24 684 - 24 684 -
- - - - -
Due to customers 521 828 521 848 - 186 472 335 376
Current accounts in credit 160 278 160 278 - 156 858 3 420
Special savings accounts 260 579 260 579 - 846 259 733
Other amounts due to customers 94 451 94 463 - 24 059 70 404
Securities sold under repurchase agreements 4 666 4 674 - 4 674 -
Insurance liabilities 749 749 - 35 714
Reinsurance liabilities 338 338 - - 338
767 767 - - 767
- - - - -
Debt securities 159 280 160 088 27 060 132 812 216
- - - - -
Subordinated debt 29 327 28 595 26 720 1 770 105
- - - - -
822 763 823 378 53 780 433 079 336 519
Cash deposits received from cedants and retrocessionaires
against technical insurance commitments
Total financial liabilities of which fair value is disclosed
Financial liabilities not measured at fair value on
balance sheet
(in millions of euros)
Consolidated financial statements of Crédit Agricole S.A. – 31 December 2017
. 166
Mark-to-market adjustments: Mark-to-market adjustments: these adjustments correct any
potential variance between the mid-market valuation of an instrument obtained using internal
valuation models and the associated inputs and the valuation obtained from external sources or
market consensus data. These adjustments can be positive or negative.
Bid/ask reserves : these adjustments incorporate the bid/ask spread for a given instrument in order
to reflect the price at which the position could be reversed. These adjustments are always negative.
Uncertainty reserves: these adjustments constitute a risk premium taken into account by all
market participants. These adjustments are always negative.
seek to incorporate in the valuation of an instrument any uncertainty that might exist as regards
one or more of the inputs used;
model uncertainty reserves seek to incorporate in the valuation of an instrument any uncertainty
that might exist due to the choice of model used.
In addition, in accordance with IFRS 13 “Fair value measurement”, Crédit Agricole S.A. prices in to
the fair value calculated for its OTC derivatives (i.e. those traded over the counter) various
adjustments linked to the default risk and credit quality (Credit Valuation Adjustment, Debit
Valuation Adjustment) and also to future funding costs and benefits (Funding Valuation
Adjustment).
Credit Valuation Adjustment (CVA)
The Credit Valuation Adjustment (CVA) is a mark-to-market adjustment that aims to price into the
fair value of the OTC derivatives the market value of our counterparties’ default risk (risk that
amounts due to us are not repaid in the event of default or a deterioration in creditworthiness). This
adjustment is calculated per counterparty based on the positive future exposure of the trading
portfolio (taking into account any netting or collateral agreements, where such exist) weighted by
the probabilities of default (of our counterparties) and losses given default. To the maximum extent
possible, the CVA estimation methodology uses observable inputs (probabilities of default are
derived in priority directly from listed CDS, proxies of listed CDS and other credit instruments where
these are deemed sufficiently liquid). This adjustment is always negative and reduces the fair value
of the OTC derivative assets held in the portfolio.
DVA - Debit Valuation Adjustment
The Debit Valuation Adjustment (DVA) is a mark-to-market adjustment that aims to price into the
fair value of OTC derivatives the market value of our own default risk (potential losses to which
CASA may expose its counterparties in the event of default or a deterioration in its creditworthiness).
This adjustment is calculated for the scope of the transactions covered by a perfect/golden CSA
(Credit Support Annex) and on the basis of the negative future exposure of the trading portfolio
weighted by (CASA's) probability of default and losses given default. The calculation aims to factor
in the Margin Period of Risk (MPR, calculated as the sum of "collateral contract period" + "estimated
time to liquidate the portfolio"). To the maximum extent possible, the DVA estimation methodology
Consolidated financial statements of Crédit Agricole S.A. – 31 December 2017
. 167
uses observable inputs (CASA CDS to determine the probability of default). This adjustment is
always positive and reduces the fair value of the OTC derivative liabilities held in the portfolio.
Funding Valuation Adjustment (FVA)
The Funding Valuation Adjustment (FVA) is a mark-to-market adjustment that aims to price into the
fair value of OTC derivatives the additional future funding costs and benefits based on ALM (Asset
& Liability Management) funding costs. This adjustment is calculated for the scope of the
transactions not covered by a CSA (Credit Support Annex), or covered by an imperfect/not golden
CSA, and on the basis of the positive and negative future exposures weighted by ALM funding
spreads.
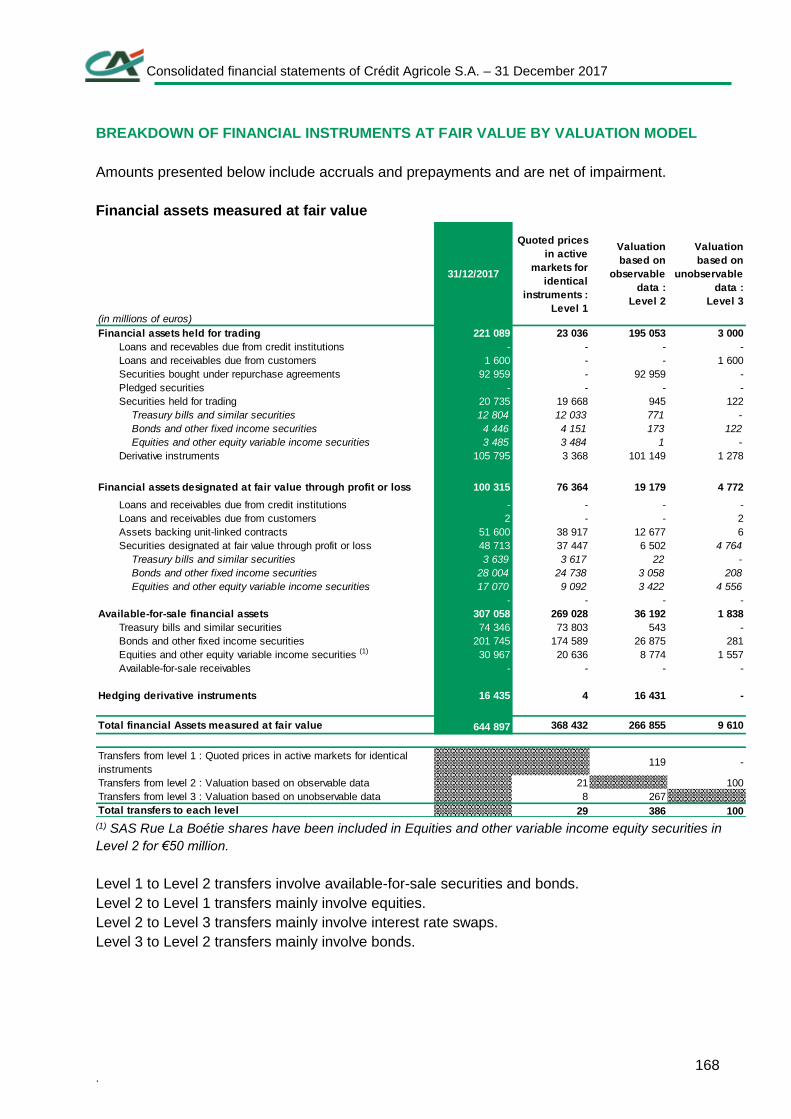
Consolidated financial statements of Crédit Agricole S.A. – 31 December 2017
. 168
BREAKDOWN OF FINANCIAL INSTRUMENTS AT FAIR VALUE BY VALUATION MODEL
Amounts presented below include accruals and prepayments and are net of impairment.
Financial assets measured at fair value
(1) SAS Rue La Boétie shares have been included in Equities and other variable income equity securities in
Level 2 for €50 million.
Level 1 to Level 2 transfers involve available-for-sale securities and bonds.
Level 2 to Level 1 transfers mainly involve equities.
Level 2 to Level 3 transfers mainly involve interest rate swaps.
Level 3 to Level 2 transfers mainly involve bonds.
31/12/2017
Quoted prices
in active
markets for
identical
instruments :
Level 1
Valuation
based on
observable
data :
Level 2
Valuation
based on
unobservable
data :
Level 3
221 089 23 036 195 053 3 000
Loans and recevables due from credit institutions - - - -
Loans and receivables due from customers 1 600 - - 1 600
Securities bought under repurchase agreements 92 959 - 92 959 -
Pledged securities - - - -
Securities held for trading 20 735 19 668 945 122
Treasury bills and similar securities 12 804 12 033 771 -
Bonds and other fixed income securities 4 446 4 151 173 122
Equities and other equity variable income securities 3 485 3 484 1 -
Derivative instruments 105 795 3 368 101 149 1 278
Financial assets designated at fair value through profit or loss 100 315 76 364 19 179 4 772
Loans and receivables due from credit institutions - - - -
Loans and receivables due from customers 2 - - 2
Assets backing unit-linked contracts 51 600 38 917 12 677 6
Securities designated at fair value through profit or loss 48 713 37 447 6 502 4 764
Treasury bills and similar securities 3 639 3 617 22 -
Bonds and other fixed income securities 28 004 24 738 3 058 208
Equities and other equity variable income securities 17 070 9 092 3 422 4 556
- - - -
Available-for-sale financial assets 307 058 269 028 36 192 1 838
Treasury bills and similar securities 74 346 73 803 543 -
Bonds and other fixed income securities 201 745 174 589 26 875 281
Equities and other equity variable income securities (1) 30 967 20 636 8 774 1 557
Available-for-sale receivables - - - -
Hedging derivative instruments 16 435 4 16 431 -
644 897 368 432 266 855 9 610
119 -
21 100
8 267
29 386 100
(in millions of euros)
Financial assets held for trading
Total financial Assets measured at fair value
Transfers from level 1 : Quoted prices in active markets for identical
instruments
Transfers from level 2 : Valuation based on observable data
Transfers from level 3 : Valuation based on unobservable data
Total transfers to each level
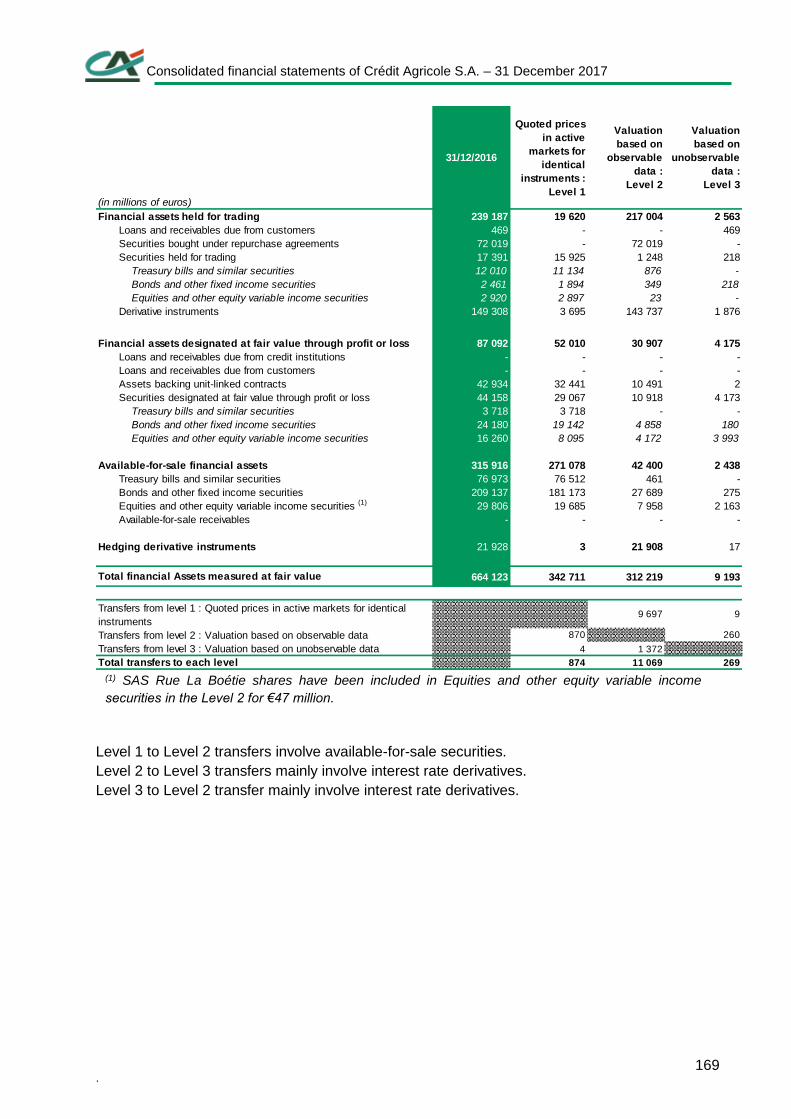
Consolidated financial statements of Crédit Agricole S.A. – 31 December 2017
. 169
(1) SAS Rue La Boétie shares have been included in Equities and other equity variable income
securities in the Level 2 for €47 million.
Level 1 to Level 2 transfers involve available-for-sale securities.
Level 2 to Level 3 transfers mainly involve interest rate derivatives.
Level 3 to Level 2 transfer mainly involve interest rate derivatives.
31/12/2016
Quoted prices
in active
markets for
identical
instruments :
Level 1
Valuation
based on
observable
data :
Level 2
Valuation
based on
unobservable
data :
Level 3
239 187 19 620 217 004 2 563
Loans and receivables due from customers 469 - - 469
Securities bought under repurchase agreements 72 019 - 72 019 -
Securities held for trading 17 391 15 925 1 248 218
Treasury bills and similar securities 12 010 11 134 876 -
Bonds and other fixed income securities 2 461 1 894 349 218
Equities and other equity variable income securities 2 920 2 897 23 -
Derivative instruments 149 308 3 695 143 737 1 876
Financial assets designated at fair value through profit or loss 87 092 52 010 30 907 4 175
Loans and receivables due from credit institutions - - - -
Loans and receivables due from customers - - - -
Assets backing unit-linked contracts 42 934 32 441 10 491 2
Securities designated at fair value through profit or loss 44 158 29 067 10 918 4 173
Treasury bills and similar securities 3 718 3 718 - -
Bonds and other fixed income securities 24 180 19 142 4 858 180
Equities and other equity variable income securities 16 260 8 095 4 172 3 993
Available-for-sale financial assets 315 916 271 078 42 400 2 438
Treasury bills and similar securities 76 973 76 512 461 -
Bonds and other fixed income securities 209 137 181 173 27 689 275
Equities and other equity variable income securities (1) 29 806 19 685 7 958 2 163
Available-for-sale receivables - - - -
Hedging derivative instruments 21 928 3 21 908 17
664 123 342 711 312 219 9 193
9 697 9
870 260
4 1 372
874 11 069 269
Transfers from level 3 : Valuation based on unobservable data
Total transfers to each level
Financial assets held for trading
Transfers from level 1 : Quoted prices in active markets for identical
instruments
Transfers from level 2 : Valuation based on observable data
Total financial Assets measured at fair value
(in millions of euros)
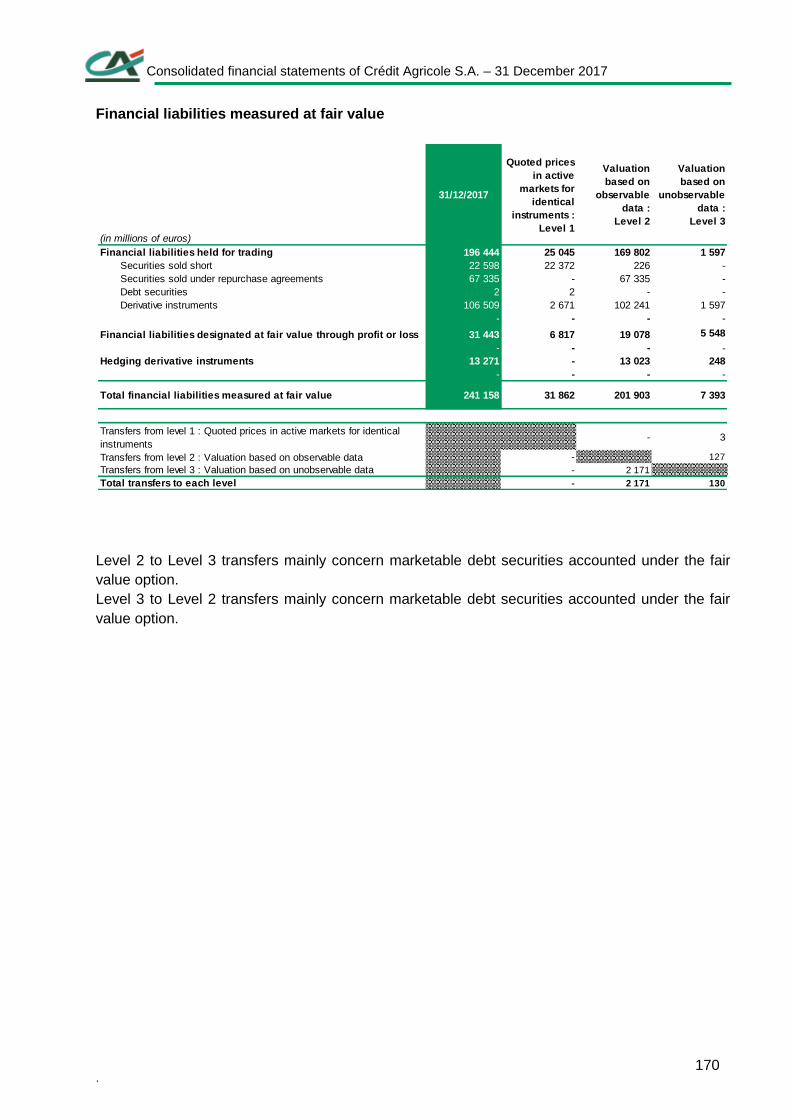
Consolidated financial statements of Crédit Agricole S.A. – 31 December 2017
. 170
Financial liabilities measured at fair value
Level 2 to Level 3 transfers mainly concern marketable debt securities accounted under the fair
value option.
Level 3 to Level 2 transfers mainly concern marketable debt securities accounted under the fair
value option.
31/12/2017
Quoted prices
in active
markets for
identical
instruments :
Level 1
Valuation
based on
observable
data :
Level 2
Valuation
based on
unobservable
data :
Level 3
196 444 25 045 169 802 1 597
Securities sold short 22 598 22 372 226 -
Securities sold under repurchase agreements 67 335 - 67 335 -
Debt securities 2 2 - -
Derivative instruments 106 509 2 671 102 241 1 597
- - - -
Financial liabilities designated at fair value through profit or loss 31 443 6 817 19 078 5 548
- - - -
Hedging derivative instruments 13 271 - 13 023 248
- - - -
241 158 31 862 201 903 7 393
-
- 3
Transfers from level 2 : Valuation based on observable data - 127
Transfers from level 3 : Valuation based on unobservable data - 2 171
Total transfers to each level - 2 171 130
Transfers from level 1 : Quoted prices in active markets for identical
instruments
Total financial liabilities measured at fair value
(in millions of euros)
Financial liabilities held for trading
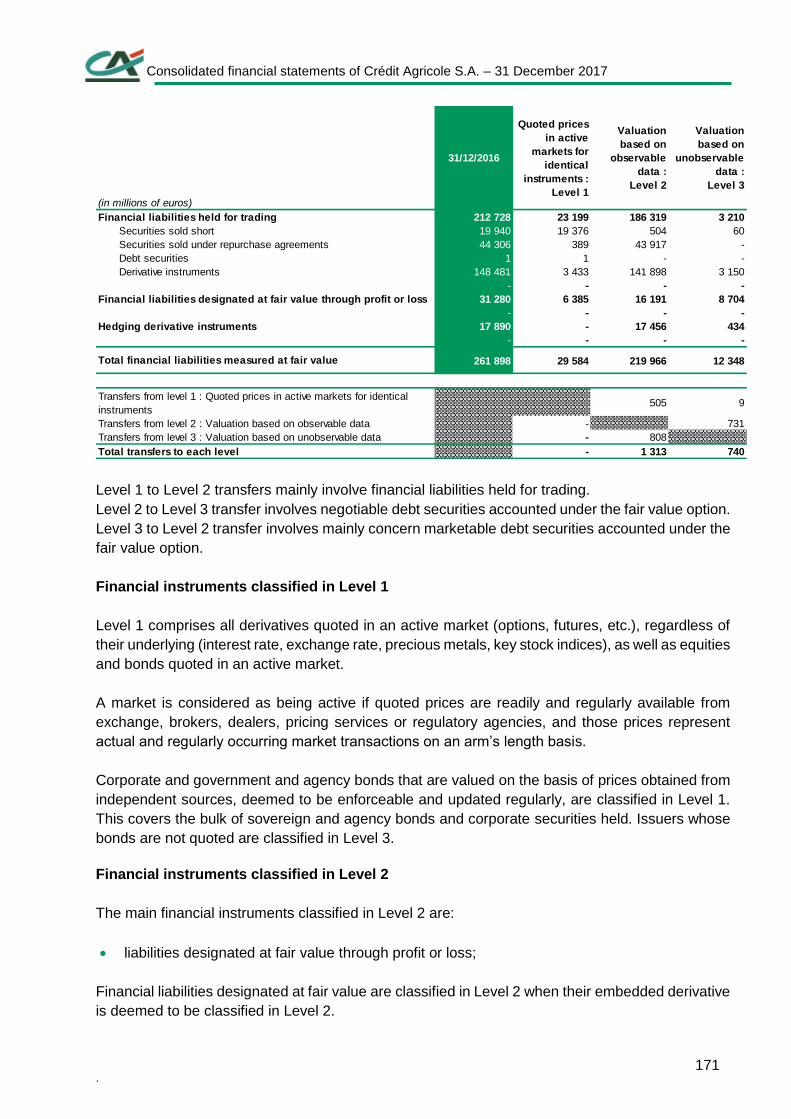
Consolidated financial statements of Crédit Agricole S.A. – 31 December 2017
. 171
Level 1 to Level 2 transfers mainly involve financial liabilities held for trading.
Level 2 to Level 3 transfer involves negotiable debt securities accounted under the fair value option.
Level 3 to Level 2 transfer involves mainly concern marketable debt securities accounted under the
fair value option.
Financial instruments classified in Level 1
Level 1 comprises all derivatives quoted in an active market (options, futures, etc.), regardless of
their underlying (interest rate, exchange rate, precious metals, key stock indices), as well as equities
and bonds quoted in an active market.
A market is considered as being active if quoted prices are readily and regularly available from
exchange, brokers, dealers, pricing services or regulatory agencies, and those prices represent
actual and regularly occurring market transactions on an arm’s length basis.
Corporate and government and agency bonds that are valued on the basis of prices obtained from
independent sources, deemed to be enforceable and updated regularly, are classified in Level 1.
This covers the bulk of sovereign and agency bonds and corporate securities held. Issuers whose
bonds are not quoted are classified in Level 3.
Financial instruments classified in Level 2
The main financial instruments classified in Level 2 are:
liabilities designated at fair value through profit or loss;
Financial liabilities designated at fair value are classified in Level 2 when their embedded derivative
is deemed to be classified in Level 2.
(in millions of euros)
31/12/2016
Quoted prices
in active
markets for
identical
instruments :
Level 1
Valuation
based on
observable
data :
Level 2
Valuation
based on
unobservable
data :
Level 3
Financial liabilities held for trading 212 728 23 199 186 319 3 210
Securities sold short 19 940 19 376 504 60
Securities sold under repurchase agreements 44 306 389 43 917 -
Debt securities 1 1 - -
Derivative instruments 148 481 3 433 141 898 3 150
- - - -
Financial liabilities designated at fair value through profit or loss 31 280 6 385 16 191 8 704
- - - -
Hedging derivative instruments 17 890 - 17 456 434
- - - -
261 898 29 584 219 966 12 348
505 9
Transfers from level 2 : Valuation based on observable data - 731
Transfers from level 3 : Valuation based on unobservable data - 808
Total transfers to each level - 1 313 740
Transfers from level 1 : Quoted prices in active markets for identical
instruments
Total financial liabilities measured at fair value
Consolidated financial statements of Crédit Agricole S.A. – 31 December 2017
. 172
over-the-counter derivatives.
The main OTC derivatives classified in Level 2 are those valued using inputs considered to be
observable and where the valuation technique does not generate any significant exposure to a
model risk.
Level 2 therefore mainly includes:
linear derivative products such as interest rate swaps, currency swaps and forward FX. They
are valued using simple models widely used in the market, based either on directly observable
inputs (foreign exchange rates, interest rates), or inputs derived from observable market prices
(currency swaps);
non-linear vanilla instruments such as caps, floors, swaptions, currency options, equity options
and credit default swaps, including digital options. They are valued using simple models widely
used in the market, based either on directly observable inputs (foreign exchange rates, interest
rates, share prices) or inputs that can be derived from observable market prices (volatilities);
simple exotic single-underlying instruments such as cancellable swaps, currency baskets of
major currencies. They are valued using models that are sometimes slightly more complex but
still widely used in the market. The inputs are mainly observable inputs and market prices,
obtained notably from brokers and/or market consensus data, which can be used to corroborate
internal valuations;
securities listed on a market deemed inactive and for which independent valuation data are
available.
Financial instruments classified in Level 3
Financial instruments classified in Level 3 are those which do not meet the conditions for
classification in Level 1 or 2. They are therefore mainly financial instruments with a high model risk
whose valuation requires substantial use of unobservable inputs.
The initial margin on all new transactions classified in Level 3 is reserved at the date of initial
recognition. It is reintegrated in the profit or loss account either spread over the period during which
the inputs are considered to be unobservable or in full on the date when the inputs become
observable.
Level 3 therefore mainly comprises:
securities;
Level 3 securities mainly include:
- unlisted shares or bonds for which no independent valuation is available,
- ABSs and CLOs for which there are indicative independent quotes but which are not necessarily
executable,
Consolidated financial statements of Crédit Agricole S.A. – 31 December 2017
. 173
- ABSs, CLOs and super senior and mezzanine CDO tranches where it cannot be demonstrated
that the market is active;
liabilities designated at fair value through profit or loss;
Financial liabilities designated at fair value are classified in Level 3 when their embedded derivative
is deemed to be classified in Level 3.
over-the-counter derivatives.
Products that are not observable due to the underlying items: some products, which are mostly
classified in Level 2, may be considered to fall within Level 3 due to their underlying currency or
maturity. An observability table defines the maximum maturity considered to be observable for each
instrument/currency pair. Observability is a function of the input’s liquidity and the availability of
observable sources enabling its valuation.
Level 3 mainly comprises:
interest rate exposures or very long-dated currency swaps;
equity exposures, mainly through products traded on shallow option markets or indexed to
volatility and long-dated forward or futures contracts;
exposures to non-linear long-dated products (interest rate or currency) on key
currencies/indices. It also includes vanilla options and simple exotic derivatives such as
cancellable swaps;
non-linear exposures to emerging market currencies.
Complex derivatives: complex derivatives are classified in Level 3 as their valuation requires the
use of unobservable inputs. The main exposures involved are:
products whose underlying is the difference between two interest rates, such as options, binary
options or exotic products. These products are based on a correlation between the two rates,
which is considered to be unobservable due to reduced liquidity. The valuation of these
exposures is nonetheless adjusted at the month-end on the basis of correlation levels derived
from market consensus data;
products whose underlying is the forward volatility of an index (Euribor, CMS spread). These
products are deemed unobservable as there is significant model risk and their thin liquidity
prevents regular accurate estimates of inputs;
securitisation swaps generating an exposure to the prepayment rate. The prepayment rate is
determined on the basis of historical data on similar portfolios. The assumptions and inputs
used are checked regularly on the basis of actual prepayments;
Consolidated financial statements of Crédit Agricole S.A. – 31 December 2017
. 174
hybrid long-term interest rate/FX products, such as Power Reverse Dual Currency notes, which
mainly involve the USD/JPY currency pair or products whose underlying is a basket of
currencies. The correlation parameters between interest rates and currencies as well as
between the two interest rates are determined using an internal methodology based on
historical data. Results are cross-checked against market consensus data to ensure that the
overall method is coherent;
multiple-underlying products generating an exposure to correlations, regardless of the
underlyings concerned (interest rates, credit, FX, inflation). This category includes cross-asset
products such as dual range, emerging market currency baskets and Credit Default Baskets.
Correlations are determined conservatively as a function of the bank’s aggregate exposure,
based on historical data. If the diversity of correlations is high, exposures to each one remain
measured;
equity correlation and hybrid equity products, whose payoff depends on the relative
performance of shares or indices in a basket (a basket which may sometimes include not just
equities but other instruments such as indices or commodities). Measurements of these
products are sensitive to the correlation between the basket components and may be classed
as Level 3 depending on their maturity, hybrid nature and the composition of the underlying
basket;
interest rate derivatives whose coupon is indexed to forward volatility (Vol bonds);
CDOs based on corporate credit baskets. The valuation model for these products uses both
observable inputs (credit default swap (CDS) prices) and unobservable inputs (default
correlations). For the least liquid Senior tranches, Crédit Agricole CIB has introduced valuation
inputs that are tailored to its assessment of the intrinsic risk of its exposures. The market risk
of the CDO derivatives book was sold to a fund managed by JP Morgan Capital in 2012;
the market risk on complex equity derivative portfolios was transferred to an external
counterparty on 31 December 2013.
For most of these products, the table below shows the valuation techniques and the main
unobservable inputs with their value interval.
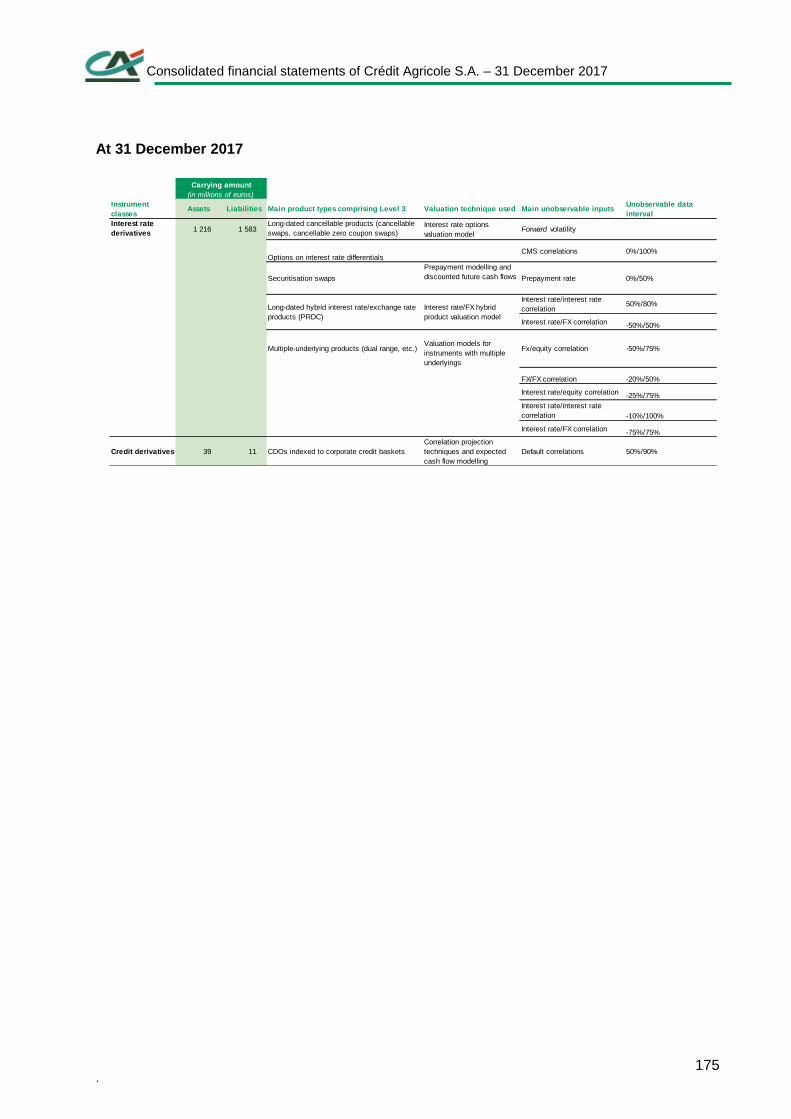
Consolidated financial statements of Crédit Agricole S.A. – 31 December 2017
. 175
At 31 December 2017
Instrument
classesAssets Liabilities Main product types comprising Level 3 Valuation technique used Main unobservable inputs
Unobservable data
interval
Interest rate
derivatives1 216 1 583
Long-dated cancellable products (cancellable
swaps, cancellable zero coupon swaps)Interest rate options
valuation modelForward volatility
Options on interest rate differentials CMS correlations 0%/100%
Securitisation swaps
Prepayment modelling and
discounted future cash flows Prepayment rate 0%/50%
Interest rate/interest rate
correlation50%/80%
Interest rate/FX correlation -50%/50%
Multiple-underlying products (dual range, etc.)Valuation models for
instruments with multiple
underlyings
Fx/equity correlation -50%/75%
FX/FX correlation -20%/50%
Interest rate/equity correlation -25%/75%
Interest rate/interest rate
correlation -10%/100%
Interest rate/FX correlation -75%/75%
Credit derivatives 39 11 CDOs indexed to corporate credit baskets
Correlation projection
techniques and expected
cash flow modelling
Default correlations 50%/90%
Long-dated hybrid interest rate/exchange rate
products (PRDC)
Interest rate/FX hybrid
product valuation model
Carrying amount
(in millions of euros)
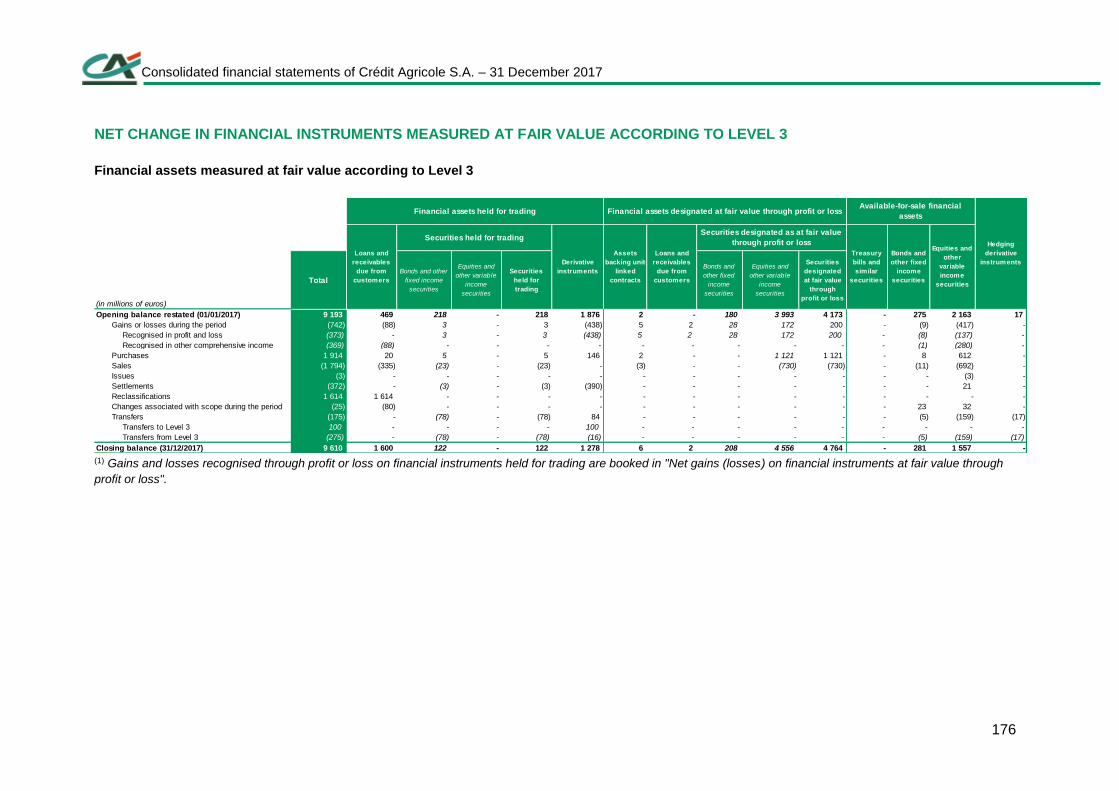
Consolidated financial statements of Crédit Agricole S.A. – 31 December 2017
176
NET CHANGE IN FINANCIAL INSTRUMENTS MEASURED AT FAIR VALUE ACCORDING TO LEVEL 3
Financial assets measured at fair value according to Level 3
(1) Gains and losses recognised through profit or loss on financial instruments held for trading are booked in "Net gains (losses) on financial instruments at fair value through
profit or loss".
Total
Bonds and other
fixed income
securities
Equities and
other variable
income
securities
Securities
held for
trading
Bonds and
other fixed
income
securities
Equities and
other variable
income
securities
Securities
designated
at fair value
through
profit or loss
9 193 469 218 - 218 1 876 2 - 180 3 993 4 173 - 275 2 163 17
Gains or losses during the period (742) (88) 3 - 3 (438) 5 2 28 172 200 - (9) (417) -
Recognised in profit and loss (373) - 3 - 3 (438) 5 2 28 172 200 - (8) (137) -
Recognised in other comprehensive income (369) (88) - - - - - - - - - - (1) (280) -
Purchases 1 914 20 5 - 5 146 2 - - 1 121 1 121 - 8 612 -
Sales (1 794) (335) (23) - (23) - (3) - - (730) (730) - (11) (692) -
Issues (3) - - - - - - - - - - - - (3) -
Settlements (372) - (3) - (3) (390) - - - - - - - 21 -
Reclassifications 1 614 1 614 - - - - - - - - - - - - -
Changes associated with scope during the period (25) (80) - - - - - - - - - - 23 32 -
Transfers (175) - (78) - (78) 84 - - - - - - (5) (159) (17)
Transfers to Level 3 100 - - - - 100 - - - - - - - - -
Transfers from Level 3 (275) - (78) - (78) (16) - - - - - - (5) (159) (17)
Closing balance (31/12/2017) 9 610 1 600 122 - 122 1 278 6 2 208 4 556 4 764 - 281 1 557 -
(in millions of euros)
Financial assets held for trading
Loans and
receivables
due from
customers
Derivative
instruments
Opening balance restated (01/01/2017)
Hedging
derivative
instruments
Available-for-sale financial
assetsFinancial assets designated at fair value through profit or loss
Securities held for trading
Assets
backing unit-
linked
contracts
Loans and
receivables
due from
customers
Securities designated as at fair value
through profit or loss
Treasury
bills and
similar
securities
Bonds and
other fixed
income
securities
Equities and
other
variable
income
securities
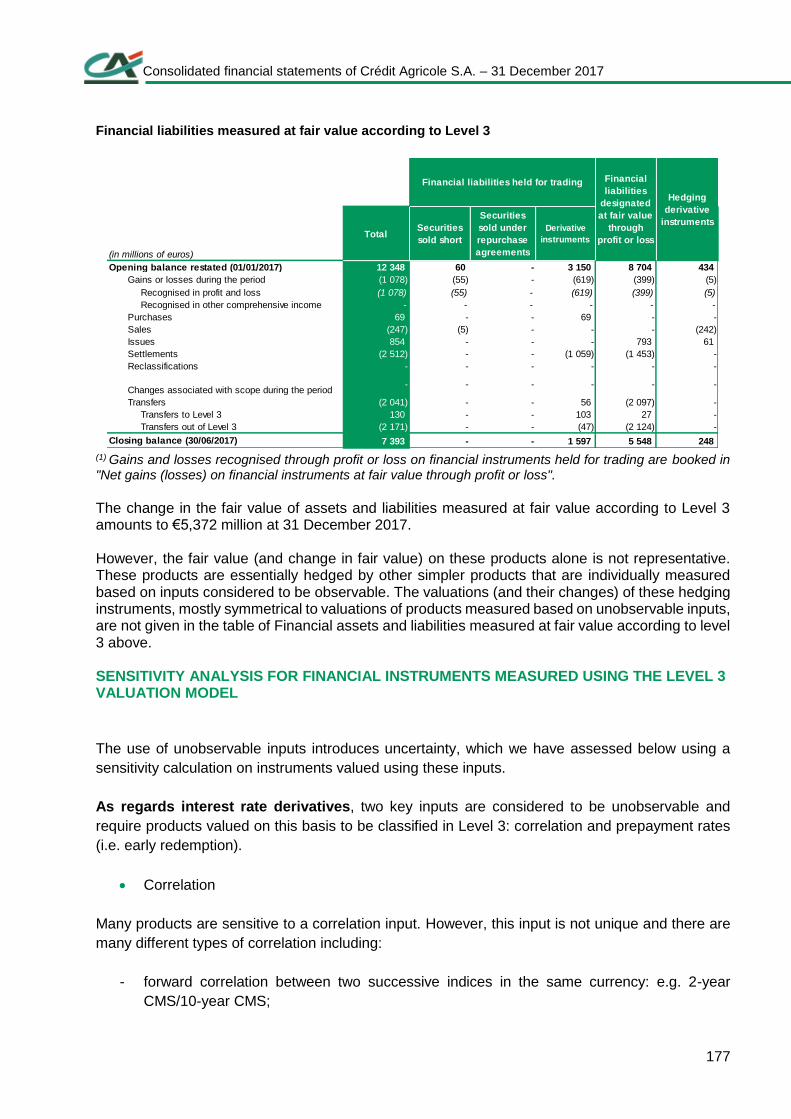
Consolidated financial statements of Crédit Agricole S.A. – 31 December 2017
177
Financial liabilities measured at fair value according to Level 3
(1) Gains and losses recognised through profit or loss on financial instruments held for trading are booked in "Net gains (losses) on financial instruments at fair value through profit or loss".
The change in the fair value of assets and liabilities measured at fair value according to Level 3 amounts to €5,372 million at 31 December 2017. However, the fair value (and change in fair value) on these products alone is not representative. These products are essentially hedged by other simpler products that are individually measured based on inputs considered to be observable. The valuations (and their changes) of these hedging instruments, mostly symmetrical to valuations of products measured based on unobservable inputs, are not given in the table of Financial assets and liabilities measured at fair value according to level 3 above. SENSITIVITY ANALYSIS FOR FINANCIAL INSTRUMENTS MEASURED USING THE LEVEL 3 VALUATION MODEL
The use of unobservable inputs introduces uncertainty, which we have assessed below using a
sensitivity calculation on instruments valued using these inputs.
As regards interest rate derivatives, two key inputs are considered to be unobservable and
require products valued on this basis to be classified in Level 3: correlation and prepayment rates
(i.e. early redemption).
Correlation
Many products are sensitive to a correlation input. However, this input is not unique and there are
many different types of correlation including:
- forward correlation between two successive indices in the same currency: e.g. 2-year
CMS/10-year CMS;
TotalSecurities
sold short
Securities
sold under
repurchase
agreements
Derivative
instruments
12 348 60 - 3 150 8 704 434
Gains or losses during the period (1 078) (55) - (619) (399) (5)
Recognised in profit and loss (1 078) (55) - (619) (399) (5)
Recognised in other comprehensive income - - - - - -
Purchases 69 - - 69 - -
Sales (247) (5) - - - (242)
Issues 854 - - - 793 61
Settlements (2 512) - - (1 059) (1 453) -
Reclassifications - - - - - -
Changes associated with scope during the period- - - - - -
Transfers (2 041) - - 56 (2 097) -
Transfers to Level 3 130 - - 103 27 -
Transfers out of Level 3 (2 171) - - (47) (2 124) -
7 393 - - 1 597 5 548 248Closing balance (30/06/2017)
(in millions of euros)
Opening balance restated (01/01/2017)
Hedging
derivative
instruments
Financial
liabilities
designated
at fair value
through
profit or loss
Financial liabilities held for trading
Consolidated financial statements of Crédit Agricole S.A. – 31 December 2017
. 178
- interest rate/interest rate correlation (different indices): e.g. Libor 3M USD/Libor 3M EUR;
- interest rate/FX correlation (or Quanto): e.g. USD/JPY – USD;
- equity/equity correlation;
- equity/FX correlation;
- equity/interest rate correlation;
- FX/FX correlation.
The biggest source of correlation exposure is, within the Non-Linear business line, the cross asset
business.
Prepayment rate
The prepayment rate is the rate of early repayment on securitisation portfolios, whether voluntary
or involuntary (default). Exposure to this risk factor may stem from two types of source: direct
exposure to these asset classes, or certain "securitisation" swaps, i.e. where the variations in their
nominal amounts are adjusted automatically to the nominal amount of the underlying portfolio, with
no mark-to-market payment. The prepayment rate plays a significant part in their valuation.
Calculation of impact:
With respect to correlation
The results presented below have been obtained by applying the following shocks:
- correlations between successive indices in the same currency (i.e. CMS correlations): 3%;
- cross-asset correlations (e.g. Equity/FX or IR/Equity) and between two interest-rate curves
in different currencies: 5%.
The result of the stress test is obtained by adding up the absolute values obtained. For each
correlation type, we took the absolute values by currency and by book, therefore assuming that the
correlations were not correlated among themselves. For the CMS correlations, we considered the
various underlyings independently (e.g. 1y10y, 2y10y).
At 29 December 2017, sensitivity to the inputs used in the interest rate derivative models was
therefore +/-€5.7 million, with the level down by €1.2 million compared to 31 December 2016 (+/-
€6.9 million).
There are no longer any Legacy activities, the transactions having been unwound or transferred to
the Euro, Non-Euro and JPY structured books;
The main contributors are now:
- Cross Asset : €1.4 million (vs. €1.9 million at 31 December 2016) with the €0.5 million
decline being mainly due to the decline in the interest rate-EUR/GBP exchange rate
correlation;
- Structured Non-Euro: €1.4 million (vs. €1.9 million at 31 December 2016) with a decline of €0.5
million as a result of lower interest rate/interest rate correlations;
- Structured Euro: €2.2 million (versus €2.0 million at 31 December 2016); - Long Term FX: €0.3 million (versus €0.6 million at 31 December 2016).
Contributions from other scopes are immaterial.
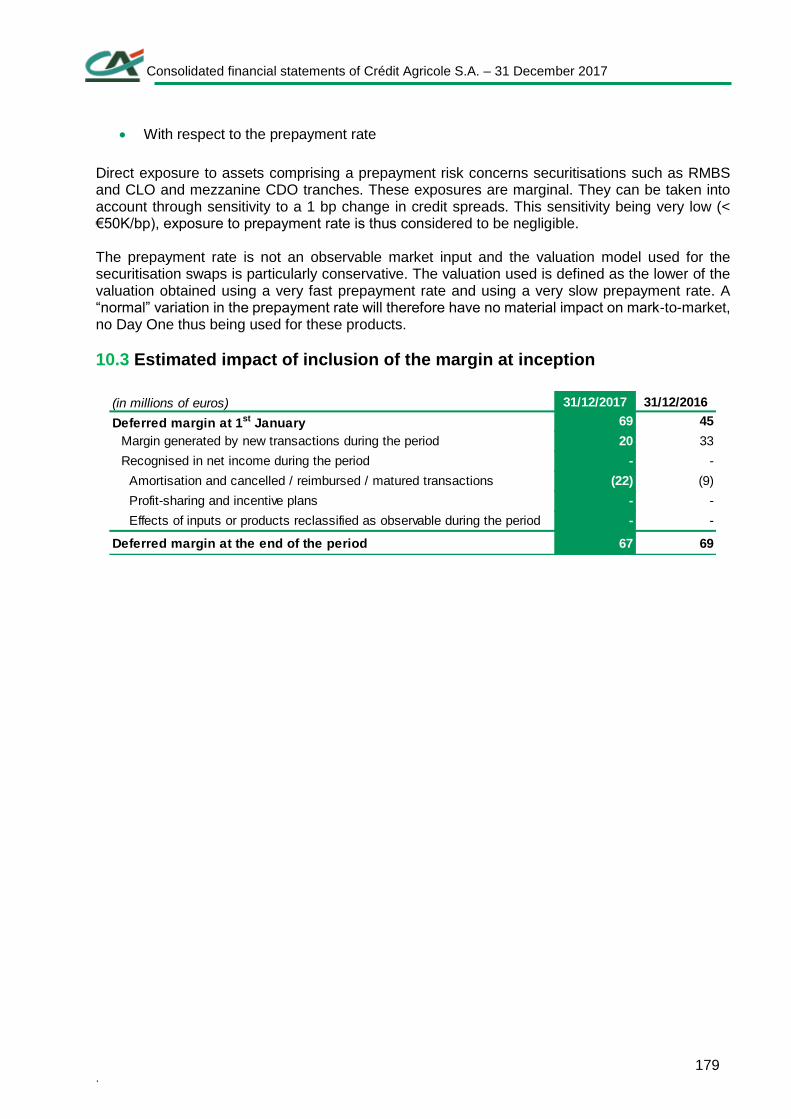
Consolidated financial statements of Crédit Agricole S.A. – 31 December 2017
. 179
With respect to the prepayment rate
Direct exposure to assets comprising a prepayment risk concerns securitisations such as RMBS and CLO and mezzanine CDO tranches. These exposures are marginal. They can be taken into account through sensitivity to a 1 bp change in credit spreads. This sensitivity being very low (< €50K/bp), exposure to prepayment rate is thus considered to be negligible. The prepayment rate is not an observable market input and the valuation model used for the securitisation swaps is particularly conservative. The valuation used is defined as the lower of the valuation obtained using a very fast prepayment rate and using a very slow prepayment rate. A “normal” variation in the prepayment rate will therefore have no material impact on mark-to-market, no Day One thus being used for these products.
10.3 Estimated impact of inclusion of the margin at inception
(in millions of euros) 31/12/2017 31/12/2016
Deferred margin at 1st January 69 45
Margin generated by new transactions during the period 20 33
Recognised in net income during the period - -
Amortisation and cancelled / reimbursed / matured transactions (22) (9)
Profit-sharing and incentive plans - -
Effects of inputs or products reclassified as observable during the period - -
67 69Deferred margin at the end of the period
Consolidated financial statements of Crédit Agricole S.A. – 31 December 2017
. 180
11. Scope of consolidation at 31 December 2017
11.1 Information on subsidiaires
11.1.1RESTRICTIONS ON ENTITIES
Crédit Agricole S.A. Group is subject to the following restrictions:
Regulatory constraints
The subsidiaries of Crédit Agricole S.A. Group are subject to prudential regulation and regulatory
capital requirements in their host countries. The minimum equity capital (solvency ratio), leverage
ratio and liquidity ratio requirements limit the capacity of these entities to pay dividends or to transfer
assets to Crédit Agricole S.A. Group.
Legal constraints
The subsidiaries of Crédit Agricole S.A. Group are subject to legal provisions concerning the
distribution of capital and distributable earnings. These requirements limit the ability of the
subsidiaries to distribute dividends. In the majority of cases, these are less restrictive than the
regulatory limitations mentioned above.
Restriction on assets backing unit-linked contracts for the insurance business
Assets backing unit-linked contracts of Crédit Agricole S.A. Group are held for the benefit of
policyholders. Assets of the insurance subsidiaries of Crédit Agricole S.A. Group are mainly held
for satisfying their obligation towards their policyholders. Assets transfers to other entities are
possible following the legal conditions. However, in case of a transfer, a part of the profit due to the
transfer must be intended for the policyholders.
Other constraints
The subsidiaries of Crédit Agricole S.A., Crédit Agricole CIB Algérie and Crédit Agricole Ukraine
ans Crédit Agricole Serbie are required to obtain prior approval for the payment of dividends from
their prudential authority (Banque d’Algérie and Banque Nationale d’Ukraine and Banque Nationale
de Serbie).
The payment of CA Egypt dividends is subject to a currency translation restriction on the Egyptian
pound imposed by the Banque Centrale d’Égypte.
Consolidated financial statements of Crédit Agricole S.A. – 31 December 2017
. 181
11.1.2 SUPPORT FOR STRUCTURED ENTITIES UNDER GROUP CONTROL
Crédit Agricole CIB has contractual arrangements with some consolidated structured entities that
equate to commitments to provide financial support.
To meet its funding needs, Crédit Agricole CIB uses structured debt issuance vehicles to raise cash
on financial markets. Securities issued by these entities are fully underwritten by Crédit Agricole
CIB. At 31 December 2017, the outstanding volume of these issues was €24 billion compared to
€21 billion at 31 December 2016.
As part of its third-party securitisation business, Crédit Agricole CIB provides liquidity lines to its
ABCP conduits (see Note 1.1 for more detail). At 31 December 2017, these liquidity lines totalled
€32 billion compared to €31 billion at 31 December 2016.
Crédit Agricole S.A. provided no other financial support for any structured entities consolidated at
31 December 2017 and 31 December 2016.
11.2 SECURITISATION TRANSACTIONS AND DEDICATED FUNDS
Various Group entities conduct securitisation operations on their own account as part of
collateralised refinancing transactions. Depending on the circumstances, these transactions can be
wholly or partially placed with investors, sold under repurchase agreements or kept on the issuer’s
balance sheet as liquid securities reserves that can be used to manage refinancing. Following the
IAS 39 decision tree, these transactions are considered to form part of deconsolidating or non-
deconsolidating transactions: for non-deconsolidating transactions, the assets are retained on the
consolidated balance sheet of Crédit Agricole S.A. Group.
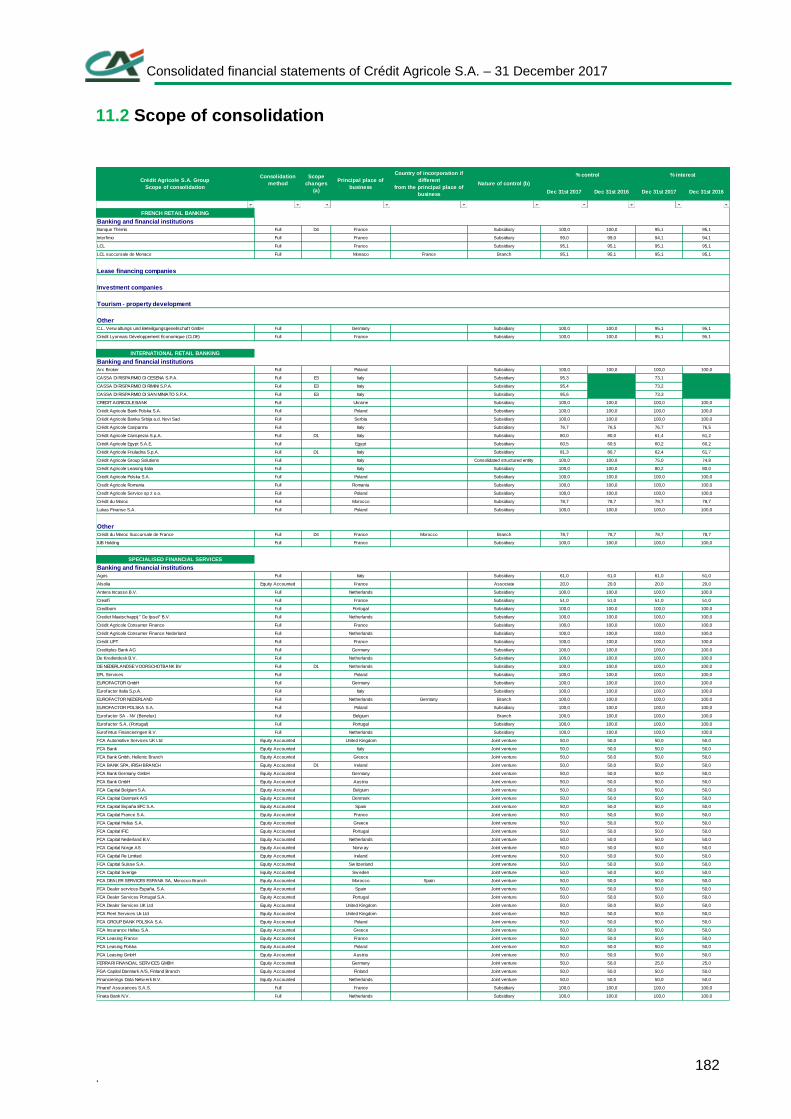
Consolidated financial statements of Crédit Agricole S.A. – 31 December 2017
. 182
11.2 Scope of consolidation
Dec 31st 2017 Dec 31st 2016 Dec 31st 2017 Dec 31st 2016
FRENCH RETAIL BANKING
Banking and financial institutions
Banque Thémis Full D4 France Subsidiary 100,0 100,0 95,1 95,1
Interf imo Full France Subsidiary 99,0 99,0 94,1 94,1
LCL Full France Subsidiary 95,1 95,1 95,1 95,1
LCL succursale de Monaco Full Monaco France Branch 95,1 95,1 95,1 95,1
Lease financing companies
Investment companies
Tourism - property development
Other
C.L. Verw altungs und Beteiligungsgesellschaft GmbH Full Germany Subsidiary 100,0 100,0 95,1 95,1
Crédit Lyonnais Développement Économique (CLDE) Full France Subsidiary 100,0 100,0 95,1 95,1
INTERNATIONAL RETAIL BANKING
Banking and financial institutions
Arc Broker Full Poland Subsidiary 100,0 100,0 100,0 100,0
CASSA DI RISPARMIO DI CESENA S.P.A. Full E3 Italy Subsidiary 95,3 73,1
CASSA DI RISPARMIO DI RIMINI S.P.A. Full E3 Italy Subsidiary 95,4 73,2
CASSA DI RISPARMIO DI SAN MINIATO S.P.A. Full E3 Italy Subsidiary 95,6 73,3
CREDIT AGRICOLE BANK Full Ukraine Subsidiary 100,0 100,0 100,0 100,0
Crédit Agricole Bank Polska S.A. Full Poland Subsidiary 100,0 100,0 100,0 100,0
Crédit Agricole Banka Srbija a.d. Novi Sad Full Serbia Subsidiary 100,0 100,0 100,0 100,0
Crédit Agricole Cariparma Full Italy Subsidiary 76,7 76,5 76,7 76,5
Crédit Agricole Carispezia S.p.A. Full D1 Italy Subsidiary 80,0 80,0 61,4 61,2
Crédit Agricole Egypt S.A.E. Full Egypt Subsidiary 60,5 60,5 60,2 60,2
Crédit Agricole Friuladria S.p.A. Full D1 Italy Subsidiary 81,3 80,7 62,4 61,7
Crédit Agricole Group Solutions Full Italy Consolidated structured entity 100,0 100,0 75,0 74,8
Crédit Agricole Leasing Italia Full Italy Subsidiary 100,0 100,0 80,2 80,0
Crédit Agricole Polska S.A. Full Poland Subsidiary 100,0 100,0 100,0 100,0
Credit Agricole Romania Full Romania Subsidiary 100,0 100,0 100,0 100,0
Credit Agricole Service sp z o.o. Full Poland Subsidiary 100,0 100,0 100,0 100,0
Crédit du Maroc Full Morocco Subsidiary 78,7 78,7 78,7 78,7
Lukas Finanse S.A. Full Poland Subsidiary 100,0 100,0 100,0 100,0
Other
Crédit du Maroc Succursale de France Full D4 France Morocco Branch 78,7 78,7 78,7 78,7
IUB Holding Full France Subsidiary 100,0 100,0 100,0 100,0
SPECIALISED FINANCIAL SERVICES
Banking and financial institutions
Agos Full Italy Subsidiary 61,0 61,0 61,0 61,0
Alsolia Equity Accounted France Associate 20,0 20,0 20,0 20,0
Antera Incasso B.V. Full Netherlands Subsidiary 100,0 100,0 100,0 100,0
Crealf i Full France Subsidiary 51,0 51,0 51,0 51,0
Credibom Full Portugal Subsidiary 100,0 100,0 100,0 100,0
Crediet Maatschappij " De Ijssel" B.V. Full Netherlands Subsidiary 100,0 100,0 100,0 100,0
Crédit Agricole Consumer Finance Full France Subsidiary 100,0 100,0 100,0 100,0
Crédit Agricole Consumer Finance Nederland Full Netherlands Subsidiary 100,0 100,0 100,0 100,0
Crédit LIFT Full France Subsidiary 100,0 100,0 100,0 100,0
Creditplus Bank AG Full Germany Subsidiary 100,0 100,0 100,0 100,0
De Kredietdesk B.V. Full Netherlands Subsidiary 100,0 100,0 100,0 100,0
DE NEDERLANDSE VOORSCHOTBANK BV Full D1 Netherlands Subsidiary 100,0 100,0 100,0 100,0
EFL Services Full Poland Subsidiary 100,0 100,0 100,0 100,0
EUROFACTOR GmbH Full Germany Subsidiary 100,0 100,0 100,0 100,0
Eurofactor Italia S.p.A. Full Italy Subsidiary 100,0 100,0 100,0 100,0
EUROFACTOR NEDERLAND Full Netherlands Germany Branch 100,0 100,0 100,0 100,0
EUROFACTOR POLSKA S.A. Full Poland Subsidiary 100,0 100,0 100,0 100,0
Eurofactor SA - NV (Benelux) Full Belgium Branch 100,0 100,0 100,0 100,0
Eurofactor S.A. (Portugal) Full Portugal Subsidiary 100,0 100,0 100,0 100,0
Eurofintus Financieringen B.V. Full Netherlands Subsidiary 100,0 100,0 100,0 100,0
FCA Automotive Services UK Ltd Equity Accounted United Kingdom Joint venture 50,0 50,0 50,0 50,0
FCA Bank Equity Accounted Italy Joint venture 50,0 50,0 50,0 50,0
FCA Bank Gmbh, Hellenic Branch Equity Accounted Greece Joint venture 50,0 50,0 50,0 50,0
FCA BANK SPA, IRISH BRANCH Equity Accounted D1 Ireland Joint venture 50,0 50,0 50,0 50,0
FCA Bank Germany GmbH Equity Accounted Germany Joint venture 50,0 50,0 50,0 50,0
FCA Bank GmbH Equity Accounted Austria Joint venture 50,0 50,0 50,0 50,0
FCA Capital Belgium S.A. Equity Accounted Belgium Joint venture 50,0 50,0 50,0 50,0
FCA Capital Danmark A/S Equity Accounted Denmark Joint venture 50,0 50,0 50,0 50,0
FCA Capital España EFC S.A. Equity Accounted Spain Joint venture 50,0 50,0 50,0 50,0
FCA Capital France S.A. Equity Accounted France Joint venture 50,0 50,0 50,0 50,0
FCA Capital Hellas S.A. Equity Accounted Greece Joint venture 50,0 50,0 50,0 50,0
FCA Capital IFIC Equity Accounted Portugal Joint venture 50,0 50,0 50,0 50,0
FCA Capital Nederland B.V. Equity Accounted Netherlands Joint venture 50,0 50,0 50,0 50,0
FCA Capital Norge AS Equity Accounted Norw ay Joint venture 50,0 50,0 50,0 50,0
FCA Capital Re Limited Equity Accounted Ireland Joint venture 50,0 50,0 50,0 50,0
FCA Capital Suisse S.A. Equity Accounted Sw itzerland Joint venture 50,0 50,0 50,0 50,0
FCA Capital Sverige Equity Accounted Sw eden Joint venture 50,0 50,0 50,0 50,0
FCA DEALER SERVICES ESPANA SA, Morocco Branch Equity Accounted Morocco Spain Joint venture 50,0 50,0 50,0 50,0
FCA Dealer services España, S.A. Equity Accounted Spain Joint venture 50,0 50,0 50,0 50,0
FCA Dealer Services Portugal S.A. Equity Accounted Portugal Joint venture 50,0 50,0 50,0 50,0
FCA Dealer Services UK Ltd Equity Accounted United Kingdom Joint venture 50,0 50,0 50,0 50,0
FCA Fleet Services Uk Ltd Equity Accounted United Kingdom Joint venture 50,0 50,0 50,0 50,0
FCA GROUP BANK POLSKA S.A. Equity Accounted Poland Joint venture 50,0 50,0 50,0 50,0
FCA Insurance Hellas S.A. Equity Accounted Greece Joint venture 50,0 50,0 50,0 50,0
FCA Leasing France Equity Accounted France Joint venture 50,0 50,0 50,0 50,0
FCA Leasing Polska Equity Accounted Poland Joint venture 50,0 50,0 50,0 50,0
FCA Leasing GmbH Equity Accounted Austria Joint venture 50,0 50,0 50,0 50,0
FERRARI FINANCIAL SERVICES GMBH Equity Accounted Germany Joint venture 50,0 50,0 25,0 25,0
FGA Capital Danmark A/S, Finland Branch Equity Accounted Finland Joint venture 50,0 50,0 50,0 50,0
Financierings Data Netw erk B.V. Equity Accounted Netherlands Joint venture 50,0 50,0 50,0 50,0
Finaref Assurances S.A.S. Full France Subsidiary 100,0 100,0 100,0 100,0
Finata Bank N.V. Full Netherlands Subsidiary 100,0 100,0 100,0 100,0
% control % interestCrédit Agricole S.A. Group
Scope of consolidation
Consolidation
method
Scope
changes
(a)
Principal place of
business
Country of incorporation if
different
from the principal place of
business
Nature of control (b)
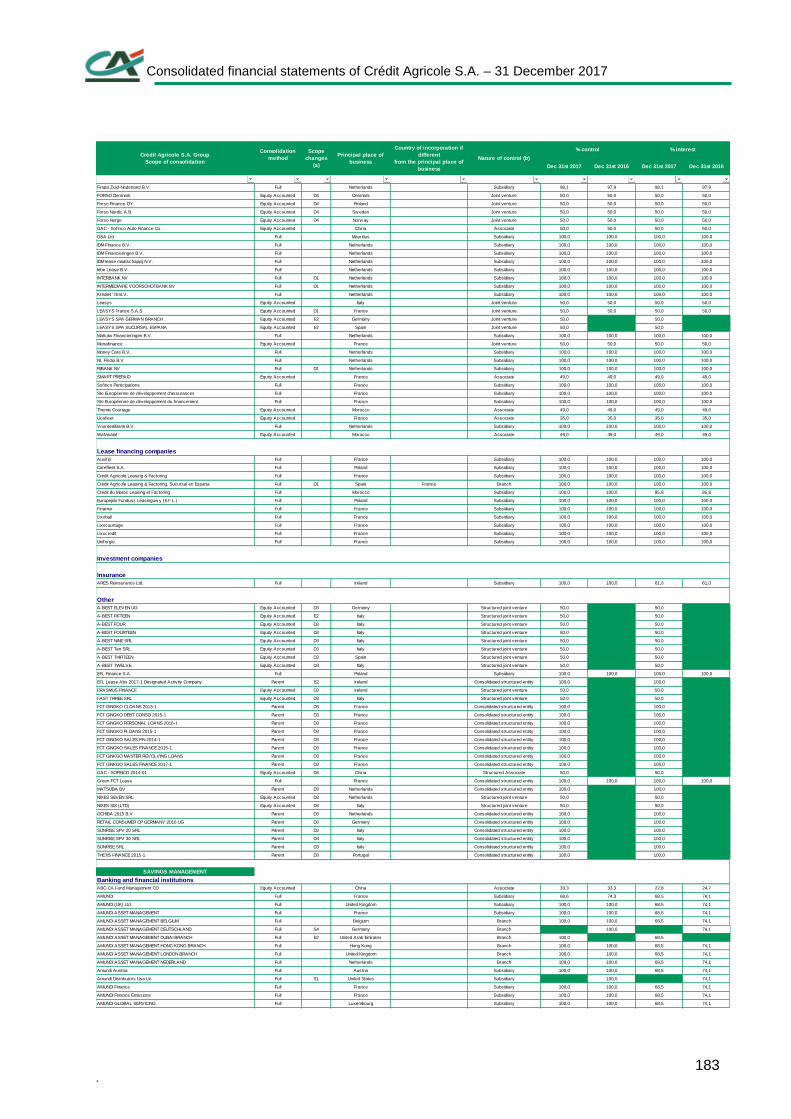
Consolidated financial statements of Crédit Agricole S.A. – 31 December 2017
. 183
Dec 31st 2017 Dec 31st 2016 Dec 31st 2017 Dec 31st 2016
Finata Zuid-Nederland B.V. Full Netherlands Subsidiary 98,1 97,9 98,1 97,9
FORSO Denmark Equity Accounted D4 Denmark Joint venture 50,0 50,0 50,0 50,0
Forso Finance OY Equity Accounted D4 Finland Joint venture 50,0 50,0 50,0 50,0
Forso Nordic A.B. Equity Accounted D4 Sw eden Joint venture 50,0 50,0 50,0 50,0
Forso Norge Equity Accounted D4 Norw ay Joint venture 50,0 50,0 50,0 50,0
GAC - Sofinco Auto Finance Co. Equity Accounted China Associate 50,0 50,0 50,0 50,0
GSA Ltd Full Mauritius Subsidiary 100,0 100,0 100,0 100,0
IDM Finance B.V. Full Netherlands Subsidiary 100,0 100,0 100,0 100,0
IDM Financieringen B.V. Full Netherlands Subsidiary 100,0 100,0 100,0 100,0
IDM lease maatschappij N.V. Full Netherlands Subsidiary 100,0 100,0 100,0 100,0
Iebe Lease B.V. Full Netherlands Subsidiary 100,0 100,0 100,0 100,0
INTERBANK NV Full D1 Netherlands Subsidiary 100,0 100,0 100,0 100,0
INTERMEDIAIRE VOORSCHOTBANK BV Full D1 Netherlands Subsidiary 100,0 100,0 100,0 100,0
Krediet '78 B.V. Full Netherlands Subsidiary 100,0 100,0 100,0 100,0
Leasys Equity Accounted Italy Joint venture 50,0 50,0 50,0 50,0
LEASYS France S.A.S Equity Accounted D1 France Joint venture 50,0 50,0 50,0 50,0
LEASYS SPA GERMAN BRANCH Equity Accounted E2 Germany Joint venture 50,0 50,0
LEASYS SPA SUCURSAL ESPANA Equity Accounted E2 Spain Joint venture 50,0 50,0
Mahuko Financieringen B.V. Full Netherlands Subsidiary 100,0 100,0 100,0 100,0
Menafinance Equity Accounted France Joint venture 50,0 50,0 50,0 50,0
Money Care B.V. Full Netherlands Subsidiary 100,0 100,0 100,0 100,0
NL Findio B.V Full Netherlands Subsidiary 100,0 100,0 100,0 100,0
RIBANK NV Full D1 Netherlands Subsidiary 100,0 100,0 100,0 100,0
SMART PREPAID Equity Accounted France Associate 49,0 49,0 49,0 49,0
Sofinco Participations Full France Subsidiary 100,0 100,0 100,0 100,0
Ste Européenne de développement d'assurances Full France Subsidiary 100,0 100,0 100,0 100,0
Ste Européenne de développement du f inancement Full France Subsidiary 100,0 100,0 100,0 100,0
Themis Courtage Equity Accounted Morocco Associate 49,0 49,0 49,0 49,0
Ucafleet Equity Accounted France Associate 35,0 35,0 35,0 35,0
VoordeelBank B.V. Full Netherlands Subsidiary 100,0 100,0 100,0 100,0
Wafasalaf Equity Accounted Morocco Associate 49,0 49,0 49,0 49,0
Lease financing companies
Auxif ip Full France Subsidiary 100,0 100,0 100,0 100,0
Carefleet S.A. Full Poland Subsidiary 100,0 100,0 100,0 100,0
Crédit Agricole Leasing & Factoring Full France Subsidiary 100,0 100,0 100,0 100,0
Crédit Agricole Leasing & Factoring, Sucursal en Espana Full D1 Spain France Branch 100,0 100,0 100,0 100,0
Crédit du Maroc Leasing et Factoring Full Morocco Subsidiary 100,0 100,0 85,8 85,8
Europejski Fundusz Leasingow y (E.F.L.) Full Poland Subsidiary 100,0 100,0 100,0 100,0
Finamur Full France Subsidiary 100,0 100,0 100,0 100,0
Lixxbail Full France Subsidiary 100,0 100,0 100,0 100,0
Lixxcourtage Full France Subsidiary 100,0 100,0 100,0 100,0
Lixxcredit Full France Subsidiary 100,0 100,0 100,0 100,0
Unifergie Full France Subsidiary 100,0 100,0 100,0 100,0
Investment companies
Insurance
ARES Reinsurance Ltd. Full Ireland Subsidiary 100,0 100,0 61,0 61,0
Other
A-BEST ELEVEN UG Equity Accounted D3 Germany Structured joint venture 50,0 50,0
A-BEST FIFTEEN Equity Accounted E2 Italy Structured joint venture 50,0 50,0
A-BEST FOUR Equity Accounted D3 Italy Structured joint venture 50,0 50,0
A-BEST FOURTEEN Equity Accounted D3 Italy Structured joint venture 50,0 50,0
A-BEST NINE SRL Equity Accounted D3 Italy Structured joint venture 50,0 50,0
A-BEST Ten SRL Equity Accounted D3 Italy Structured joint venture 50,0 50,0
A-BEST THIRTEEN Equity Accounted D3 Spain Structured joint venture 50,0 50,0
A-BEST TWELVE Equity Accounted D3 Italy Structured joint venture 50,0 50,0
EFL Finance S.A. Full Poland Subsidiary 100,0 100,0 100,0 100,0
EFL Lease Abs 2017-1 Designated Activity Company Parent E2 Ireland Consolidated structured entity 100,0 100,0
ERASMUS FINANCE Equity Accounted D3 Ireland Structured joint venture 50,0 50,0
FAST THREE SRL Equity Accounted D3 Italy Structured joint venture 50,0 50,0
FCT GINGKO CLOANS 2013-1 Parent D3 France Consolidated structured entity 100,0 100,0
FCT GINGKO DEBT CONSO 2015-1 Parent D3 France Consolidated structured entity 100,0 100,0
FCT GINGKO PERSONAL LOANS 2016-1 Parent D3 France Consolidated structured entity 100,0 100,0
FCT GINGKO PLOANS 2015-1 Parent D3 France Consolidated structured entity 100,0 100,0
FCT GINGKO SALES FIN 2014-1 Parent D3 France Consolidated structured entity 100,0 100,0
FCT GINGKO SALES FINANCE 2015-1 Parent D3 France Consolidated structured entity 100,0 100,0
FCT GINKGO MASTER REVOLVING LOANS Parent D3 France Consolidated structured entity 100,0 100,0
FCT GINKGO SALES FINANCE 2017-1 Parent D3 France Consolidated structured entity 100,0 100,0
GAC - SOFINCO 2014-01 Equity Accounted D3 China Structured Associate 50,0 50,0
Green FCT Lease Full France Consolidated structured entity 100,0 100,0 100,0 100,0
MATSUBA BV Parent D3 Netherlands Consolidated structured entity 100,0 100,0
NIXES SEVEN SRL Equity Accounted D3 Netherlands Structured joint venture 50,0 50,0
NIXES SIX (LTD) Equity Accounted D3 Italy Structured joint venture 50,0 50,0
OCHIBA 2015 B.V Parent D3 Netherlands Consolidated structured entity 100,0 100,0
RETAIL CONSUMER CP GERMANY 2016 UG Parent D3 Germany Consolidated structured entity 100,0 100,0
SUNRISE SPV 20 SRL Parent D3 Italy Consolidated structured entity 100,0 100,0
SUNRISE SPV 30 SRL Parent D3 Italy Consolidated structured entity 100,0 100,0
SUNRISE SRL Parent D3 Italy Consolidated structured entity 100,0 100,0
THETIS FINANCE 2015-1 Parent D3 Portugal Consolidated structured entity 100,0 100,0
SAVINGS MANAGEMENT
Banking and financial institutions
ABC-CA Fund Management CO Equity Accounted China Associate 33,3 33,3 22,8 24,7
AMUNDI Full France Subsidiary 68,6 74,3 68,5 74,1
AMUNDI (UK) Ltd. Full United Kingdom Subsidiary 100,0 100,0 68,5 74,1
AMUNDI ASSET MANAGEMENT Full France Subsidiary 100,0 100,0 68,5 74,1
AMUNDI ASSET MANAGEMENT BELGIUM Full Belgium Branch 100,0 100,0 68,5 74,1
AMUNDI ASSET MANAGEMENT DEUTSCHLAND Full S4 Germany Branch 100,0 74,1
AMUNDI ASSET MANAGEMENT DUBAI BRANCH Full E2 United Arab Emirates Branch 100,0 68,5
AMUNDI ASSET MANAGEMENT HONG KONG BRANCH Full Hong Kong Branch 100,0 100,0 68,5 74,1
AMUNDI ASSET MANAGEMENT LONDON BRANCH Full United Kingdom Branch 100,0 100,0 68,5 74,1
AMUNDI ASSET MANAGEMENT NEDERLAND Full Netherlands Branch 100,0 100,0 68,5 74,1
Amundi Austria Full Austria Subsidiary 100,0 100,0 68,5 74,1
Amundi Distributors Usa Llc Full S1 United States Subsidiary 100,0 74,1
AMUNDI Finance Full France Subsidiary 100,0 100,0 68,5 74,1
AMUNDI Finance Emissions Full France Subsidiary 100,0 100,0 68,5 74,1
AMUNDI GLOBAL SERVICING Full Luxembourg Subsidiary 100,0 100,0 68,5 74,1
% control % interestCrédit Agricole S.A. Group
Scope of consolidation
Consolidation
method
Scope
changes
(a)
Principal place of
business
Country of incorporation if
different
from the principal place of
business
Nature of control (b)
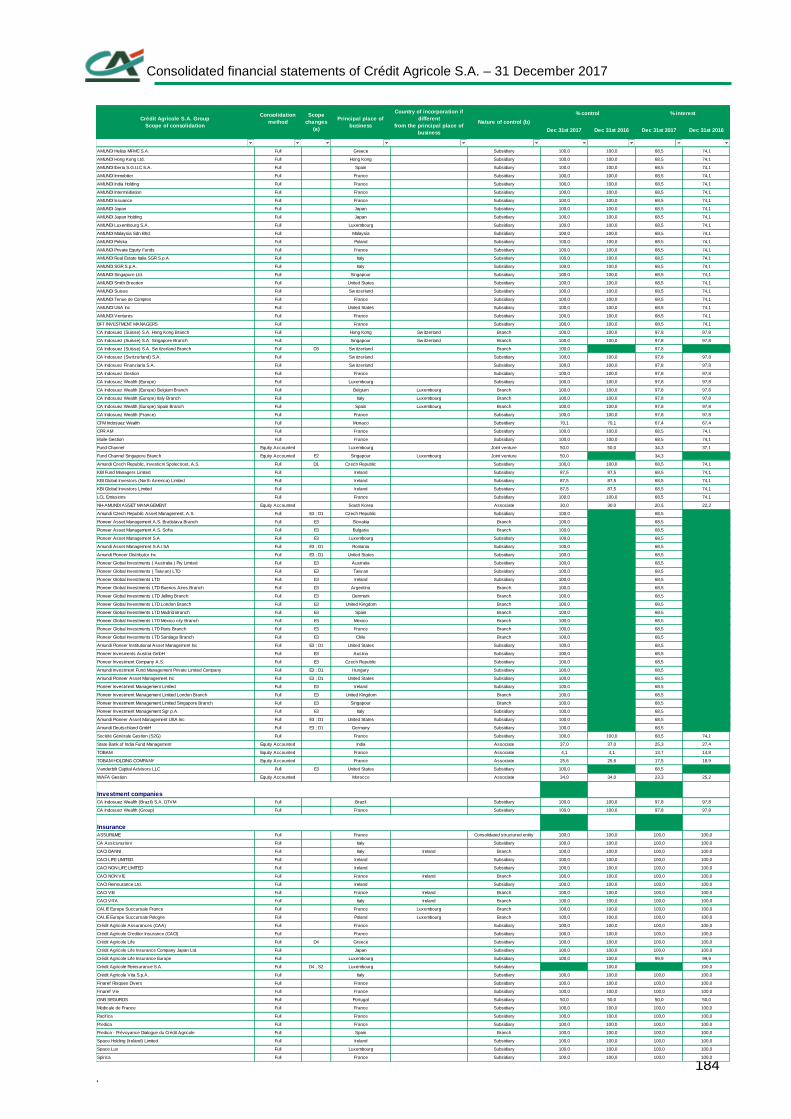
Consolidated financial statements of Crédit Agricole S.A. – 31 December 2017
. 184
Dec 31st 2017 Dec 31st 2016 Dec 31st 2017 Dec 31st 2016
AMUNDI Hellas MFMC S.A. Full Greece Subsidiary 100,0 100,0 68,5 74,1
AMUNDI Hong Kong Ltd. Full Hong Kong Subsidiary 100,0 100,0 68,5 74,1
AMUNDI Iberia S.G.I.I.C S.A. Full Spain Subsidiary 100,0 100,0 68,5 74,1
AMUNDI Immobilier Full France Subsidiary 100,0 100,0 68,5 74,1
AMUNDI India Holding Full France Subsidiary 100,0 100,0 68,5 74,1
AMUNDI Intermédiation Full France Subsidiary 100,0 100,0 68,5 74,1
AMUNDI Issuance Full France Subsidiary 100,0 100,0 68,5 74,1
AMUNDI Japan Full Japan Subsidiary 100,0 100,0 68,5 74,1
AMUNDI Japan Holding Full Japan Subsidiary 100,0 100,0 68,5 74,1
AMUNDI Luxembourg S.A. Full Luxembourg Subsidiary 100,0 100,0 68,5 74,1
AMUNDI Malaysia Sdn Bhd Full Malaysia Subsidiary 100,0 100,0 68,5 74,1
AMUNDI Polska Full Poland Subsidiary 100,0 100,0 68,5 74,1
AMUNDI Private Equity Funds Full France Subsidiary 100,0 100,0 68,5 74,1
AMUNDI Real Estate Italia SGR S.p.A. Full Italy Subsidiary 100,0 100,0 68,5 74,1
AMUNDI SGR S.p.A. Full Italy Subsidiary 100,0 100,0 68,5 74,1
AMUNDI Singapore Ltd. Full Singapour Subsidiary 100,0 100,0 68,5 74,1
AMUNDI Smith Breeden Full United States Subsidiary 100,0 100,0 68,5 74,1
AMUNDI Suisse Full Sw itzerland Subsidiary 100,0 100,0 68,5 74,1
AMUNDI Tenue de Comptes Full France Subsidiary 100,0 100,0 68,5 74,1
AMUNDI USA Inc Full United States Subsidiary 100,0 100,0 68,5 74,1
AMUNDI Ventures Full France Subsidiary 100,0 100,0 68,5 74,1
BFT INVESTMENT MANAGERS Full France Subsidiary 100,0 100,0 68,5 74,1
CA Indosuez (Suisse) S.A. Hong Kong Branch Full Hong Kong Sw itzerland Branch 100,0 100,0 97,8 97,8
CA Indosuez (Suisse) S.A. Singapore Branch Full Singapour Sw itzerland Branch 100,0 100,0 97,8 97,8
CA Indosuez (Suisse) S.A. Sw itzerland Branch Full D3 Sw itzerland Branch 100,0 97,8
CA Indosuez (Sw itzerland) S.A. Full Sw itzerland Subsidiary 100,0 100,0 97,8 97,8
CA Indosuez Finanziaria S.A. Full Sw itzerland Subsidiary 100,0 100,0 97,8 97,8
CA Indosuez Gestion Full France Subsidiary 100,0 100,0 97,8 97,8
CA Indosuez Wealth (Europe) Full Luxembourg Subsidiary 100,0 100,0 97,8 97,8
CA Indosuez Wealth (Europe) Belgium Branch Full Belgium Luxembourg Branch 100,0 100,0 97,8 97,8
CA Indosuez Wealth (Europe) Italy Branch Full Italy Luxembourg Branch 100,0 100,0 97,8 97,8
CA Indosuez Wealth (Europe) Spain Branch Full Spain Luxembourg Branch 100,0 100,0 97,8 97,8
CA Indosuez Wealth (France) Full France Subsidiary 100,0 100,0 97,8 97,8
CFM Indosuez Wealth Full Monaco Subsidiary 70,1 70,1 67,4 67,4
CPR AM Full France Subsidiary 100,0 100,0 68,5 74,1
Etoile Gestion Full France Subsidiary 100,0 100,0 68,5 74,1
Fund Channel Equity Accounted Luxembourg Joint venture 50,0 50,0 34,3 37,1
Fund Channel Singapore Branch Equity Accounted E2 Singapour Luxembourg Joint venture 50,0 34,3
Amundi Czech Republic, Investicni Spolecnost, A.S. Full D1 Czech Republic Subsidiary 100,0 100,0 68,5 74,1
KBI Fund Managers Limited Full Ireland Subsidiary 87,5 87,5 68,5 74,1
KBI Global Investors (North America) Limited Full Ireland Subsidiary 87,5 87,5 68,5 74,1
KBI Global Investors Limited Full Ireland Subsidiary 87,5 87,5 68,5 74,1
LCL Emissions Full France Subsidiary 100,0 100,0 68,5 74,1
NH-AMUNDI ASSET MANAGEMENT Equity Accounted South Korea Associate 30,0 30,0 20,5 22,2
Amundi Czech Republic Asset Management, A.S. Full E3 ; D1 Czech Republic Subsidiary 100,0 68,5
Pioneer Asset Management A.S. Bratislava Branch Full E3 Slovakia Branch 100,0 68,5
Pioneer Asset Management A.S. Sofia Full E3 Bulgaria Branch 100,0 68,5
Pioneer Asset Management S.A. Full E3 Luxembourg Subsidiary 100,0 68,5
Amundi Asset Management S.A.I SA Full E3 ; D1 Romania Subsidiary 100,0 68,5
Amundi Pioneer Distributor Inc Full E3 ; D1 United States Subsidiary 100,0 68,5
Pioneer Global Investments ( Australia ) Pty Limited Full E3 Australia Subsidiary 100,0 68,5
Pioneer Global Investments ( Taiw an) LTD Full E3 Taiw an Subsidiary 100,0 68,5
Pioneer Global Investments LTD Full E3 Ireland Subsidiary 100,0 68,5
Pioneer Global Investments LTD Buenos Aires Branch Full E3 Argentina Branch 100,0 68,5
Pioneer Global Investments LTD Jelling Branch Full E3 Denmark Branch 100,0 68,5
Pioneer Global Investments LTD London Branch Full E3 United Kingdom Branch 100,0 68,5
Pioneer Global Investments LTD Madrid Branch Full E3 Spain Branch 100,0 68,5
Pioneer Global Investments LTD Mexico city Branch Full E3 Mexico Branch 100,0 68,5
Pioneer Global Investments LTD Paris Branch Full E3 France Branch 100,0 68,5
Pioneer Global Investments LTD Santiago Branch Full E3 Chile Branch 100,0 68,5
Amundi Pioneer Institutional Asset Management Inc Full E3 ; D1 United States Subsidiary 100,0 68,5
Pioneer Invesments Austria GmbH Full E3 Austria Subsidiary 100,0 68,5
Pioneer Investment Company A.S. Full E3 Czech Republic Subsidiary 100,0 68,5
Amundi Investment Fund Management Private Limited Company Full E3 ; D1 Hungary Subsidiary 100,0 68,5
Amundi Pioneer Asset Management Inc Full E3 ; D1 United States Subsidiary 100,0 68,5
Pioneer Investment Management Limited Full E3 Ireland Subsidiary 100,0 68,5
Pioneer Investment Management Limited London Branch Full E3 United Kingdom Branch 100,0 68,5
Pioneer Investment Management Limited Singapore Branch Full E3 Singapour Branch 100,0 68,5
Pioneer Investment Management Sgr p.A. Full E3 Italy Subsidiary 100,0 68,5
Amundi Pioneer Asset Management USA Inc Full E3 ; D1 United States Subsidiary 100,0 68,5
Amundi Deutschland GmbH Full E3 ; D1 Germany Subsidiary 100,0 68,5
Société Générale Gestion (S2G) Full France Subsidiary 100,0 100,0 68,5 74,1
State Bank of India Fund Management Equity Accounted India Associate 37,0 37,0 25,3 27,4
TOBAM Equity Accounted France Associate 4,1 4,1 13,7 14,8
TOBAM HOLDING COMPANY Equity Accounted France Associate 25,6 25,6 17,5 18,9
Vanderbilt Capital Advisors LLC Full E3 United States Subsidiary 100,0 68,5
WAFA Gestion Equity Accounted Morocco Associate 34,0 34,0 23,3 25,2
Investment companies
CA Indosuez Wealth (Brazil) S.A. DTVM Full Brazil Subsidiary 100,0 100,0 97,8 97,8
CA Indosuez Wealth (Group) Full France Subsidiary 100,0 100,0 97,8 97,8
Insurance
ASSUR&ME Full France Consolidated structured entity 100,0 100,0 100,0 100,0
CA Assicurazioni Full Italy Subsidiary 100,0 100,0 100,0 100,0
CACI DANNI Full Italy Ireland Branch 100,0 100,0 100,0 100,0
CACI LIFE LIMITED Full Ireland Subsidiary 100,0 100,0 100,0 100,0
CACI NON LIFE LIMITED Full Ireland Subsidiary 100,0 100,0 100,0 100,0
CACI NON VIE Full France Ireland Branch 100,0 100,0 100,0 100,0
CACI Reinsurance Ltd. Full Ireland Subsidiary 100,0 100,0 100,0 100,0
CACI VIE Full France Ireland Branch 100,0 100,0 100,0 100,0
CACI VITA Full Italy Ireland Branch 100,0 100,0 100,0 100,0
CALIE Europe Succursale France Full France Luxembourg Branch 100,0 100,0 100,0 100,0
CALIE Europe Succursale Pologne Full Poland Luxembourg Branch 100,0 100,0 100,0 100,0
Crédit Agricole Assurances (CAA) Full France Subsidiary 100,0 100,0 100,0 100,0
Crédit Agricole Creditor Insurance (CACI) Full France Subsidiary 100,0 100,0 100,0 100,0
Crédit Agricole Life Full D4 Greece Subsidiary 100,0 100,0 100,0 100,0
Crédit Agricole Life Insurance Company Japan Ltd. Full Japan Subsidiary 100,0 100,0 100,0 100,0
Crédit Agricole Life Insurance Europe Full Luxembourg Subsidiary 100,0 100,0 99,9 99,9
Crédit Agricole Reinsurance S.A. Full D4 ; S2 Luxembourg Subsidiary 100,0 100,0
Crédit Agricole Vita S.p.A. Full Italy Subsidiary 100,0 100,0 100,0 100,0
Finaref Risques Divers Full France Subsidiary 100,0 100,0 100,0 100,0
Finaref Vie Full France Subsidiary 100,0 100,0 100,0 100,0
GNB SEGUROS Full Portugal Subsidiary 50,0 50,0 50,0 50,0
Médicale de France Full France Subsidiary 100,0 100,0 100,0 100,0
Pacif ica Full France Subsidiary 100,0 100,0 100,0 100,0
Predica Full France Subsidiary 100,0 100,0 100,0 100,0
Predica - Prévoyance Dialogue du Crédit Agricole Full Spain Branch 100,0 100,0 100,0 100,0
Space Holding (Ireland) Limited Full Ireland Subsidiary 100,0 100,0 100,0 100,0
Space Lux Full Luxembourg Subsidiary 100,0 100,0 100,0 100,0
Spirica Full France Subsidiary 100,0 100,0 100,0 100,0
% control % interestCrédit Agricole S.A. Group
Scope of consolidation
Consolidation
method
Scope
changes
(a)
Principal place of
business
Country of incorporation if
different
from the principal place of
business
Nature of control (b)
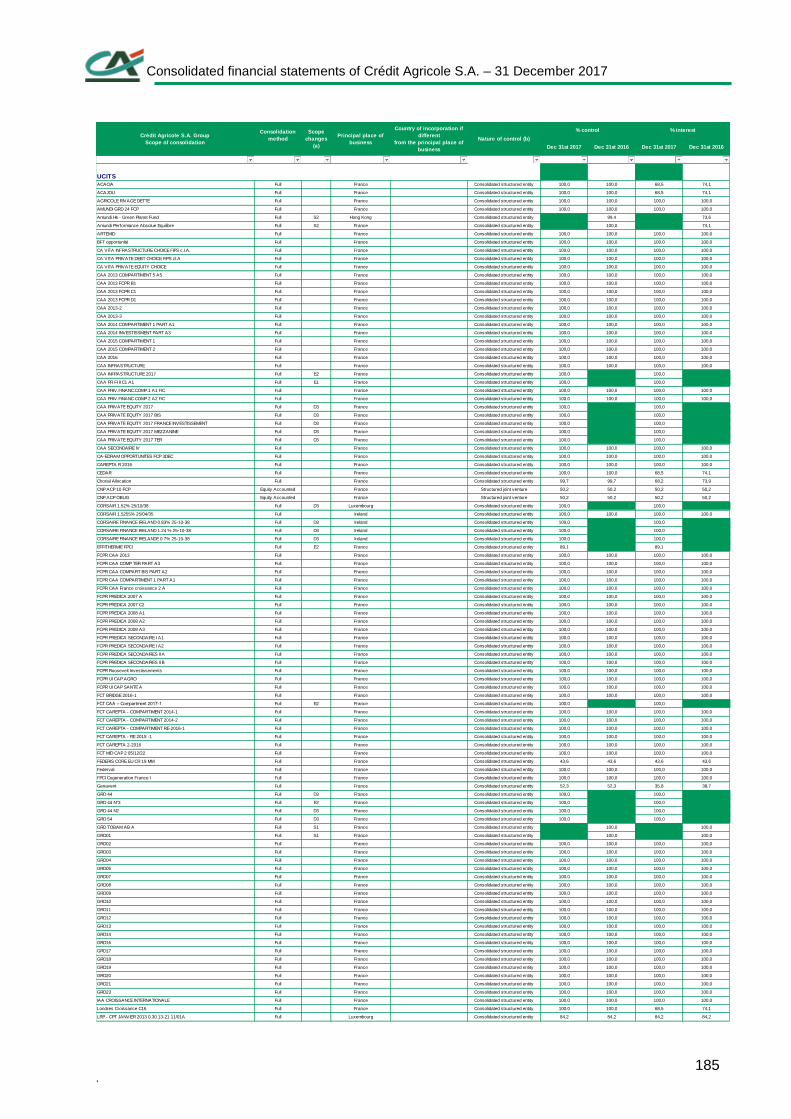
Consolidated financial statements of Crédit Agricole S.A. – 31 December 2017
. 185
Dec 31st 2017 Dec 31st 2016 Dec 31st 2017 Dec 31st 2016
UCITS
ACACIA Full France Consolidated structured entity 100,0 100,0 68,5 74,1
ACAJOU Full France Consolidated structured entity 100,0 100,0 68,5 74,1
AGRICOLE RIVAGE DETTE Full France Consolidated structured entity 100,0 100,0 100,0 100,0
AMUNDI GRD 24 FCP Full France Consolidated structured entity 100,0 100,0 100,0 100,0
Amundi Hk - Green Planet Fund Full S2 Hong Kong Consolidated structured entity 99,4 73,6
Amundi Performance Absolue Equilibre Full S2 France Consolidated structured entity 100,0 74,1
ARTEMID Full France Consolidated structured entity 100,0 100,0 100,0 100,0
BFT opportunité Full France Consolidated structured entity 100,0 100,0 100,0 100,0
CA VITA INFRASTRUCTURE CHOICE FIPS c.I.A. Full France Consolidated structured entity 100,0 100,0 100,0 100,0
CA VITA PRIVATE DEBT CHOICE FIPS cl.A Full France Consolidated structured entity 100,0 100,0 100,0 100,0
CA VITA PRIVATE EQUITY CHOICE Full France Consolidated structured entity 100,0 100,0 100,0 100,0
CAA 2013 COMPARTIMENT 5 A5 Full France Consolidated structured entity 100,0 100,0 100,0 100,0
CAA 2013 FCPR B1 Full France Consolidated structured entity 100,0 100,0 100,0 100,0
CAA 2013 FCPR C1 Full France Consolidated structured entity 100,0 100,0 100,0 100,0
CAA 2013 FCPR D1 Full France Consolidated structured entity 100,0 100,0 100,0 100,0
CAA 2013-2 Full France Consolidated structured entity 100,0 100,0 100,0 100,0
CAA 2013-3 Full France Consolidated structured entity 100,0 100,0 100,0 100,0
CAA 2014 COMPARTIMENT 1 PART A1 Full France Consolidated structured entity 100,0 100,0 100,0 100,0
CAA 2014 INVESTISSMENT PART A3 Full France Consolidated structured entity 100,0 100,0 100,0 100,0
CAA 2015 COMPARTIMENT 1 Full France Consolidated structured entity 100,0 100,0 100,0 100,0
CAA 2015 COMPARTIMENT 2 Full France Consolidated structured entity 100,0 100,0 100,0 100,0
CAA 2016 Full France Consolidated structured entity 100,0 100,0 100,0 100,0
CAA INFRASTRUCTURE Full France Consolidated structured entity 100,0 100,0 100,0 100,0
CAA INFRASTRUCTURE 2017 Full E2 France Consolidated structured entity 100,0 100,0
CAA PR FI II C1 A1 Full E1 France Consolidated structured entity 100,0 100,0
CAA PRIV.FINANC.COMP.1 A1 FIC Full France Consolidated structured entity 100,0 100,0 100,0 100,0
CAA PRIV.FINANC.COMP.2 A2 FIC Full France Consolidated structured entity 100,0 100,0 100,0 100,0
CAA PRIVATE EQUITY 2017 Full D3 France Consolidated structured entity 100,0 100,0
CAA PRIVATE EQUITY 2017 BIS Full D3 France Consolidated structured entity 100,0 100,0
CAA PRIVATE EQUITY 2017 FRANCE INVESTISSEMENT Full D3 France Consolidated structured entity 100,0 100,0
CAA PRIVATE EQUITY 2017 MEZZANINE Full D3 France Consolidated structured entity 100,0 100,0
CAA PRIVATE EQUITY 2017 TER Full D3 France Consolidated structured entity 100,0 100,0
CAA SECONDAIRE IV Full France Consolidated structured entity 100,0 100,0 100,0 100,0
CA-EDRAM OPPORTUNITES FCP 3DEC Full France Consolidated structured entity 100,0 100,0 100,0 100,0
CAREPTA R 2016 Full France Consolidated structured entity 100,0 100,0 100,0 100,0
CEDAR Full France Consolidated structured entity 100,0 100,0 68,5 74,1
Chorial Allocation Full France Consolidated structured entity 99,7 99,7 68,2 73,9
CNP ACP 10 FCP Equity Accounted France Structured joint venture 50,2 50,2 50,2 50,2
CNP ACP OBLIG Equity Accounted France Structured joint venture 50,2 50,2 50,2 50,2
CORSAIR 1.52% 25/10/38 Full D3 Luxembourg Consolidated structured entity 100,0 100,0
CORSAIR 1.5255% 25/04/35 Full Ireland Consolidated structured entity 100,0 100,0 100,0 100,0
CORSAIRE FINANCE IRELAND 0.83% 25-10-38 Full D3 Ireland Consolidated structured entity 100,0 100,0
CORSAIRE FINANCE IRELAND 1.24 % 25-10-38 Full D3 Ireland Consolidated structured entity 100,0 100,0
CORSAIRE FINANCE IRELANDE 0.7% 25-10-38 Full D3 Ireland Consolidated structured entity 100,0 100,0
EFFITHERMIE FPCI Full E2 France Consolidated structured entity 89,1 89,1
FCPR CAA 2013 Full France Consolidated structured entity 100,0 100,0 100,0 100,0
FCPR CAA COMP TER PART A3 Full France Consolidated structured entity 100,0 100,0 100,0 100,0
FCPR CAA COMPART BIS PART A2 Full France Consolidated structured entity 100,0 100,0 100,0 100,0
FCPR CAA COMPARTIMENT 1 PART A1 Full France Consolidated structured entity 100,0 100,0 100,0 100,0
FCPR CAA France croissance 2 A Full France Consolidated structured entity 100,0 100,0 100,0 100,0
FCPR PREDICA 2007 A Full France Consolidated structured entity 100,0 100,0 100,0 100,0
FCPR PREDICA 2007 C2 Full France Consolidated structured entity 100,0 100,0 100,0 100,0
FCPR PREDICA 2008 A1 Full France Consolidated structured entity 100,0 100,0 100,0 100,0
FCPR PREDICA 2008 A2 Full France Consolidated structured entity 100,0 100,0 100,0 100,0
FCPR PREDICA 2008 A3 Full France Consolidated structured entity 100,0 100,0 100,0 100,0
FCPR PREDICA SECONDAIRE I A1 Full France Consolidated structured entity 100,0 100,0 100,0 100,0
FCPR PREDICA SECONDAIRE I A2 Full France Consolidated structured entity 100,0 100,0 100,0 100,0
FCPR PREDICA SECONDAIRES II A Full France Consolidated structured entity 100,0 100,0 100,0 100,0
FCPR PREDICA SECONDAIRES II B Full France Consolidated structured entity 100,0 100,0 100,0 100,0
FCPR Roosevelt Investissements Full France Consolidated structured entity 100,0 100,0 100,0 100,0
FCPR UI CAP AGRO Full France Consolidated structured entity 100,0 100,0 100,0 100,0
FCPR UI CAP SANTE A Full France Consolidated structured entity 100,0 100,0 100,0 100,0
FCT BRIDGE 2016-1 Full France Consolidated structured entity 100,0 100,0 100,0 100,0
FCT CAA – Compartment 2017-1 Full E2 France Consolidated structured entity 100,0 100,0
FCT CAREPTA - COMPARTIMENT 2014-1 Full France Consolidated structured entity 100,0 100,0 100,0 100,0
FCT CAREPTA - COMPARTIMENT 2014-2 Full France Consolidated structured entity 100,0 100,0 100,0 100,0
FCT CAREPTA - COMPARTIMENT RE-2016-1 Full France Consolidated structured entity 100,0 100,0 100,0 100,0
FCT CAREPTA - RE 2015 -1 Full France Consolidated structured entity 100,0 100,0 100,0 100,0
FCT CAREPTA 2-2016 Full France Consolidated structured entity 100,0 100,0 100,0 100,0
FCT MID CAP 2 05/12/22 Full France Consolidated structured entity 100,0 100,0 100,0 100,0
FEDERIS CORE EU CR 19 MM Full France Consolidated structured entity 43,6 43,6 43,6 43,6
Federval Full France Consolidated structured entity 100,0 100,0 100,0 100,0
FPCI Cogeneration France I Full France Consolidated structured entity 100,0 100,0 100,0 100,0
Genavent Full France Consolidated structured entity 52,3 52,3 35,8 38,7
GRD 44 Full D3 France Consolidated structured entity 100,0 100,0
GRD 44 N°3 Full E2 France Consolidated structured entity 100,0 100,0
GRD 44 N2 Full D3 France Consolidated structured entity 100,0 100,0
GRD 54 Full D3 France Consolidated structured entity 100,0 100,0
GRD TOBAM AB A Full S1 France Consolidated structured entity 100,0 100,0
GRD01 Full S1 France Consolidated structured entity 100,0 100,0
GRD02 Full France Consolidated structured entity 100,0 100,0 100,0 100,0
GRD03 Full France Consolidated structured entity 100,0 100,0 100,0 100,0
GRD04 Full France Consolidated structured entity 100,0 100,0 100,0 100,0
GRD05 Full France Consolidated structured entity 100,0 100,0 100,0 100,0
GRD07 Full France Consolidated structured entity 100,0 100,0 100,0 100,0
GRD08 Full France Consolidated structured entity 100,0 100,0 100,0 100,0
GRD09 Full France Consolidated structured entity 100,0 100,0 100,0 100,0
GRD10 Full France Consolidated structured entity 100,0 100,0 100,0 100,0
GRD11 Full France Consolidated structured entity 100,0 100,0 100,0 100,0
GRD12 Full France Consolidated structured entity 100,0 100,0 100,0 100,0
GRD13 Full France Consolidated structured entity 100,0 100,0 100,0 100,0
GRD14 Full France Consolidated structured entity 100,0 100,0 100,0 100,0
GRD16 Full France Consolidated structured entity 100,0 100,0 100,0 100,0
GRD17 Full France Consolidated structured entity 100,0 100,0 100,0 100,0
GRD18 Full France Consolidated structured entity 100,0 100,0 100,0 100,0
GRD19 Full France Consolidated structured entity 100,0 100,0 100,0 100,0
GRD20 Full France Consolidated structured entity 100,0 100,0 100,0 100,0
GRD21 Full France Consolidated structured entity 100,0 100,0 100,0 100,0
GRD23 Full France Consolidated structured entity 100,0 100,0 100,0 100,0
IAA CROISSANCE INTERNATIONALE Full France Consolidated structured entity 100,0 100,0 100,0 100,0
Londres Croissance C16 Full France Consolidated structured entity 100,0 100,0 68,5 74,1
LRP - CPT JANVIER 2013 0.30 13-21 11/01A Full Luxembourg Consolidated structured entity 84,2 84,2 84,2 84,2
% control % interestCrédit Agricole S.A. Group
Scope of consolidation
Consolidation
method
Scope
changes
(a)
Principal place of
business
Country of incorporation if
different
from the principal place of
business
Nature of control (b)
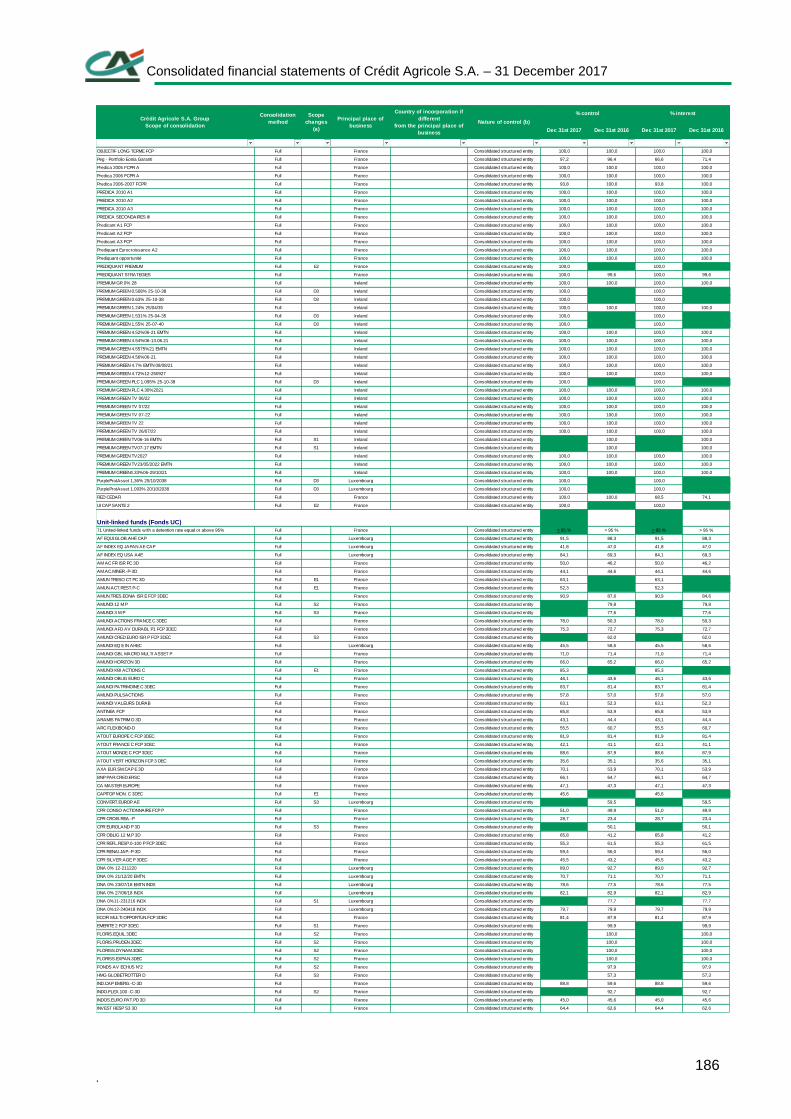
Consolidated financial statements of Crédit Agricole S.A. – 31 December 2017
. 186
Dec 31st 2017 Dec 31st 2016 Dec 31st 2017 Dec 31st 2016
OBJECTIF LONG TERME FCP Full France Consolidated structured entity 100,0 100,0 100,0 100,0
Peg - Portfolio Eonia Garanti Full France Consolidated structured entity 97,2 96,4 66,6 71,4
Predica 2005 FCPR A Full France Consolidated structured entity 100,0 100,0 100,0 100,0
Predica 2006 FCPR A Full France Consolidated structured entity 100,0 100,0 100,0 100,0
Predica 2006-2007 FCPR Full France Consolidated structured entity 93,8 100,0 93,8 100,0
PREDICA 2010 A1 Full France Consolidated structured entity 100,0 100,0 100,0 100,0
PREDICA 2010 A2 Full France Consolidated structured entity 100,0 100,0 100,0 100,0
PREDICA 2010 A3 Full France Consolidated structured entity 100,0 100,0 100,0 100,0
PREDICA SECONDAIRES III Full France Consolidated structured entity 100,0 100,0 100,0 100,0
Predicant A1 FCP Full France Consolidated structured entity 100,0 100,0 100,0 100,0
Predicant A2 FCP Full France Consolidated structured entity 100,0 100,0 100,0 100,0
Predicant A3 FCP Full France Consolidated structured entity 100,0 100,0 100,0 100,0
Prediquant Eurocroissance A2 Full France Consolidated structured entity 100,0 100,0 100,0 100,0
Prediquant opportunité Full France Consolidated structured entity 100,0 100,0 100,0 100,0
PREDIQUANT PREMIUM Full E2 France Consolidated structured entity 100,0 100,0
PREDIQUANT STRATEGIES Full France Consolidated structured entity 100,0 99,6 100,0 99,6
PREMIUM GR 0% 28 Full Ireland Consolidated structured entity 100,0 100,0 100,0 100,0
PREMIUM GREEN 0.508% 25-10-38 Full D3 Ireland Consolidated structured entity 100,0 100,0
PREMIUM GREEN 0.63% 25-10-38 Full D3 Ireland Consolidated structured entity 100,0 100,0
PREMIUM GREEN 1.24% 25/04/35 Full Ireland Consolidated structured entity 100,0 100,0 100,0 100,0
PREMIUM GREEN 1.531% 25-04-35 Full D3 Ireland Consolidated structured entity 100,0 100,0
PREMIUM GREEN 1.55% 25-07-40 Full D3 Ireland Consolidated structured entity 100,0 100,0
PREMIUM GREEN 4.52%06-21 EMTN Full Ireland Consolidated structured entity 100,0 100,0 100,0 100,0
PREMIUM GREEN 4.54%06-13.06.21 Full Ireland Consolidated structured entity 100,0 100,0 100,0 100,0
PREMIUM GREEN 4.5575%21 EMTN Full Ireland Consolidated structured entity 100,0 100,0 100,0 100,0
PREMIUM GREEN 4.56%06-21 Full Ireland Consolidated structured entity 100,0 100,0 100,0 100,0
PREMIUM GREEN 4.7% EMTN 08/08/21 Full Ireland Consolidated structured entity 100,0 100,0 100,0 100,0
PREMIUM GREEN 4.72%12-250927 Full Ireland Consolidated structured entity 100,0 100,0 100,0 100,0
PREMIUM GREEN PLC 1.095% 25-10-38 Full D3 Ireland Consolidated structured entity 100,0 100,0
PREMIUM GREEN PLC 4.30%2021 Full Ireland Consolidated structured entity 100,0 100,0 100,0 100,0
PREMIUM GREEN TV 06/22 Full Ireland Consolidated structured entity 100,0 100,0 100,0 100,0
PREMIUM GREEN TV 07/22 Full Ireland Consolidated structured entity 100,0 100,0 100,0 100,0
PREMIUM GREEN TV 07-22 Full Ireland Consolidated structured entity 100,0 100,0 100,0 100,0
PREMIUM GREEN TV 22 Full Ireland Consolidated structured entity 100,0 100,0 100,0 100,0
PREMIUM GREEN TV 26/07/22 Full Ireland Consolidated structured entity 100,0 100,0 100,0 100,0
PREMIUM GREEN TV06-16 EMTN Full S1 Ireland Consolidated structured entity 100,0 100,0
PREMIUM GREEN TV07-17 EMTN Full S1 Ireland Consolidated structured entity 100,0 100,0
PREMIUM GREEN TV2027 Full Ireland Consolidated structured entity 100,0 100,0 100,0 100,0
PREMIUM GREEN TV23/05/2022 EMTN Full Ireland Consolidated structured entity 100,0 100,0 100,0 100,0
PREMIUM GREEN4.33%06-29/10/21 Full Ireland Consolidated structured entity 100,0 100,0 100,0 100,0
PurpleProtAsset 1,36% 25/10/2038 Full D3 Luxembourg Consolidated structured entity 100,0 100,0
PurpleProtAsset 1.093% 20/10/2038 Full D3 Luxembourg Consolidated structured entity 100,0 100,0
RED CEDAR Full France Consolidated structured entity 100,0 100,0 68,5 74,1
UI CAP SANTE 2 Full E2 France Consolidated structured entity 100,0 100,0
Unit-linked funds (Fonds UC)
71 United-linked funds w ith a detention rate equal or above 95% Full France Consolidated structured entity > 95 % > 95 % > 95 % > 95 %
AF EQUI.GLOB.AHE CAP Full Luxembourg Consolidated structured entity 91,5 88,3 91,5 88,3
AF INDEX EQ JAPAN AE CAP Full Luxembourg Consolidated structured entity 41,8 47,0 41,8 47,0
AF INDEX EQ USA A4E Full Luxembourg Consolidated structured entity 84,1 69,3 84,1 69,3
AM AC FR ISR PC 3D Full France Consolidated structured entity 50,0 46,2 50,0 46,2
AM.AC.MINER.-P-3D Full France Consolidated structured entity 44,1 44,6 44,1 44,6
AMUN TRESO CT PC 3D Full E1 France Consolidated structured entity 63,1 63,1
AMUN.ACT.REST.P-C Full E1 France Consolidated structured entity 52,3 52,3
AMUN.TRES.EONIA ISR E FCP 3DEC Full France Consolidated structured entity 90,9 87,6 90,9 84,6
AMUNDI 12 M P Full S2 France Consolidated structured entity 79,8 79,8
AMUNDI 3 M P Full S3 France Consolidated structured entity 77,6 77,6
AMUNDI ACTIONS FRANCE C 3DEC Full France Consolidated structured entity 78,0 50,3 78,0 50,3
AMUNDI AFD AV DURABL P1 FCP 3DEC Full France Consolidated structured entity 75,3 72,7 75,3 72,7
AMUNDI CRED.EURO ISR P FCP 3DEC Full S3 France Consolidated structured entity 62,0 62,0
AMUNDI EQ E IN AHEC Full Luxembourg Consolidated structured entity 45,5 58,6 45,5 58,6
AMUNDI GBL MACRO MULTI ASSET P Full France Consolidated structured entity 71,0 71,4 71,0 71,4
AMUNDI HORIZON 3D Full France Consolidated structured entity 66,0 65,2 66,0 65,2
AMUNDI KBI ACTIONS C Full E1 France Consolidated structured entity 85,3 85,3
AMUNDI OBLIG EURO C Full France Consolidated structured entity 46,1 43,6 46,1 43,6
AMUNDI PATRIMOINE C 3DEC Full France Consolidated structured entity 83,7 81,4 83,7 81,4
AMUNDI PULSACTIONS Full France Consolidated structured entity 57,8 57,0 57,8 57,0
AMUNDI VALEURS DURAB Full France Consolidated structured entity 63,1 52,3 63,1 52,3
ANTINEA FCP Full France Consolidated structured entity 65,8 53,9 65,8 53,9
ARAMIS PATRIM D 3D Full France Consolidated structured entity 43,1 44,4 43,1 44,4
ARC FLEXIBOND-D Full France Consolidated structured entity 55,5 60,7 55,5 60,7
ATOUT EUROPE C FCP 3DEC Full France Consolidated structured entity 81,9 81,4 81,9 81,4
ATOUT FRANCE C FCP 3DEC Full France Consolidated structured entity 42,1 41,1 42,1 41,1
ATOUT MONDE C FCP 3DEC Full France Consolidated structured entity 88,6 87,9 88,6 87,9
ATOUT VERT HORIZON FCP 3 DEC Full France Consolidated structured entity 35,6 35,1 35,6 35,1
AXA EUR.SM.CAP E 3D Full France Consolidated structured entity 70,1 53,9 70,1 53,9
BNP PAR.CRED.ERSC Full France Consolidated structured entity 66,1 64,7 66,1 64,7
CA MASTER EUROPE Full France Consolidated structured entity 47,1 47,3 47,1 47,3
CAPITOP MON. C 3DEC Full E1 France Consolidated structured entity 45,6 45,6
CONVERT.EUROP.AE Full S3 Luxembourg Consolidated structured entity 59,5 59,5
CPR CONSO ACTIONNAIRE FCP P Full France Consolidated structured entity 51,0 49,9 51,0 49,9
CPR CROIS.REA.-P Full France Consolidated structured entity 28,7 23,4 28,7 23,4
CPR EUROLAND P 3D Full S3 France Consolidated structured entity 50,1 50,1
CPR OBLIG 12 M.P 3D Full France Consolidated structured entity 65,8 41,2 65,8 41,2
CPR REFL.RESP.0-100 P FCP 3DEC Full France Consolidated structured entity 55,3 61,5 55,3 61,5
CPR RENAI.JAP.-P-3D Full France Consolidated structured entity 59,4 56,0 59,4 56,0
CPR SILVER AGE P 3DEC Full France Consolidated structured entity 45,5 43,2 45,5 43,2
DNA 0% 12-211220 Full Luxembourg Consolidated structured entity 89,0 92,7 89,0 92,7
DNA 0% 21/12/20 EMTN Full Luxembourg Consolidated structured entity 70,7 71,1 70,7 71,1
DNA 0% 23/07/18 EMTN INDX Full Luxembourg Consolidated structured entity 78,6 77,5 78,6 77,5
DNA 0% 27/06/18 INDX Full Luxembourg Consolidated structured entity 82,1 82,9 82,1 82,9
DNA 0%11-231216 INDX Full S1 Luxembourg Consolidated structured entity 77,7 77,7
DNA 0%12-240418 INDX Full Luxembourg Consolidated structured entity 79,7 79,9 79,7 79,9
ECOFI MULTI OPPORTUN.FCP 3DEC Full France Consolidated structured entity 81,4 87,9 81,4 87,9
EMERITE 2 FCP 3DEC Full S1 France Consolidated structured entity 99,9 99,9
FLORIS.EQUIL.3DEC Full S2 France Consolidated structured entity 100,0 100,0
FLORIS.PRUDEN.3DEC Full S2 France Consolidated structured entity 100,0 100,0
FLORISS.DYNAM.3DEC Full S2 France Consolidated structured entity 100,0 100,0
FLORISS.EXPAN.3DEC Full S2 France Consolidated structured entity 100,0 100,0
FONDS AV ECHUS N°2 Full S2 France Consolidated structured entity 97,9 97,9
HMG GLOBETROTTER D Full S3 France Consolidated structured entity 57,3 57,3
IND.CAP EMERG.-C-3D Full France Consolidated structured entity 88,8 59,6 88,8 59,6
INDO.FLEX.100 -C-3D Full S2 France Consolidated structured entity 92,7 92,7
INDOS.EURO.PAT.PD 3D Full France Consolidated structured entity 45,0 45,6 45,0 45,6
INVEST RESP S3 3D Full France Consolidated structured entity 64,4 62,6 64,4 62,6
% control % interestCrédit Agricole S.A. Group
Scope of consolidation
Consolidation
method
Scope
changes
(a)
Principal place of
business
Country of incorporation if
different
from the principal place of
business
Nature of control (b)
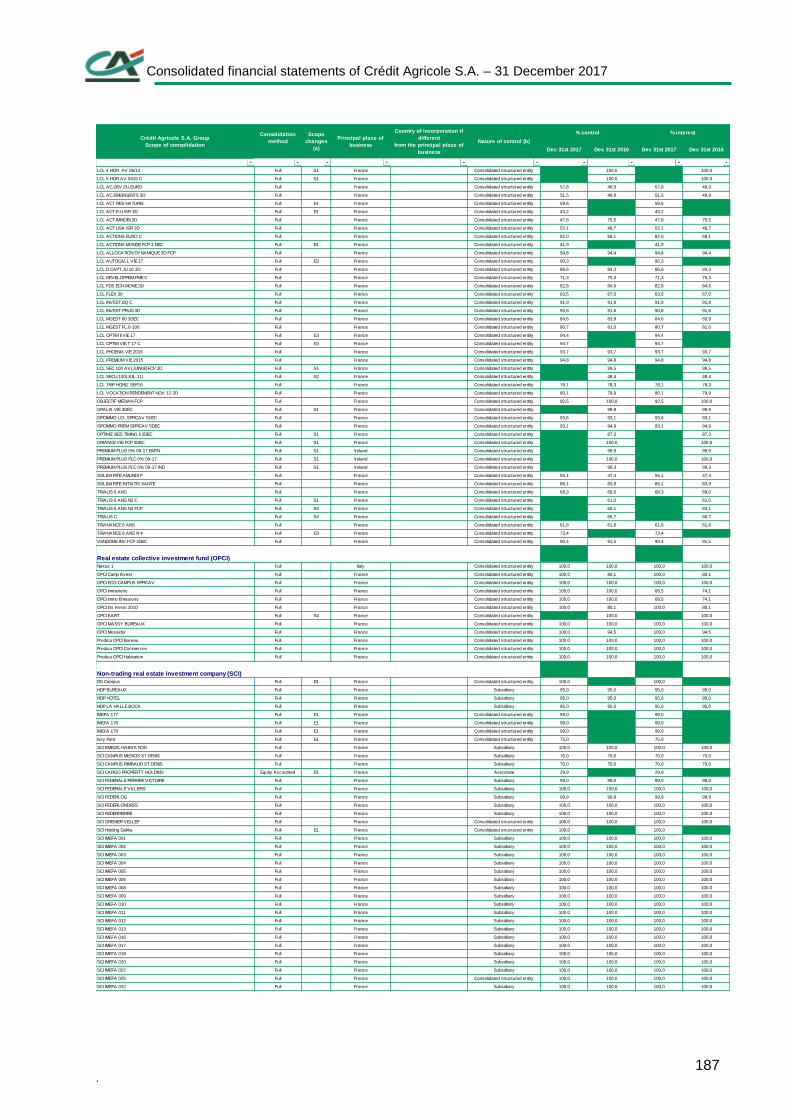
Consolidated financial statements of Crédit Agricole S.A. – 31 December 2017
. 187
Dec 31st 2017 Dec 31st 2016 Dec 31st 2017 Dec 31st 2016
LCL 4 HOR. AV 06/14 Full S1 France Consolidated structured entity 100,0 100,0
LCL 5 HOR.AV 0415 C Full S1 France Consolidated structured entity 100,0 100,0
LCL AC.DEV.DU.EURO Full France Consolidated structured entity 57,8 49,3 57,8 49,3
LCL AC.EMERGENTS 3D Full France Consolidated structured entity 51,5 49,9 51,5 49,9
LCL ACT RES NATUREL Full E1 France Consolidated structured entity 59,6 59,6
LCL ACT.E-U ISR 3D Full E1 France Consolidated structured entity 43,2 43,2
LCL ACT.IMMOBI.3D Full France Consolidated structured entity 47,8 75,5 47,8 75,5
LCL ACT.USA ISR 3D Full France Consolidated structured entity 52,1 49,7 52,1 49,7
LCL ACTIONS EURO C Full France Consolidated structured entity 82,0 68,1 82,0 68,1
LCL ACTIONS MONDE FCP 3 DEC Full E1 France Consolidated structured entity 41,9 41,9
LCL ALLOCATION DYNAMIQUE 3D FCP Full France Consolidated structured entity 94,8 94,4 94,8 94,4
LCL AUTOCALL VIE 17 Full E3 France Consolidated structured entity 90,3 90,3
LCL D.CAPT.JU.10 3D Full France Consolidated structured entity 86,6 84,3 86,6 84,3
LCL DEVELOPPEM.PME C Full France Consolidated structured entity 71,3 75,3 71,3 75,3
LCL FDS ECH.MONE.3D Full France Consolidated structured entity 82,8 84,6 82,8 84,6
LCL FLEX 30 Full France Consolidated structured entity 63,5 67,0 63,5 67,0
LCL INVEST.EQ C Full France Consolidated structured entity 91,9 91,8 91,9 91,8
LCL INVEST.PRUD.3D Full France Consolidated structured entity 90,8 91,6 90,8 91,6
LCL MGEST 60 3DEC Full France Consolidated structured entity 84,6 83,9 84,6 83,9
LCL MGEST FL.0-100 Full France Consolidated structured entity 80,7 81,0 80,7 81,0
LCL OPTIM II VIE 17 Full E3 France Consolidated structured entity 94,4 94,4
LCL OPTIM VIE T 17 C Full E3 France Consolidated structured entity 94,7 94,7
LCL PHOENIX VIE 2016 Full France Consolidated structured entity 93,7 93,7 93,7 93,7
LCL PREMIUM VIE 2015 Full France Consolidated structured entity 94,8 94,8 94,8 94,8
LCL SEC 100 AV(JUIN08)FCP 3D Full S1 France Consolidated structured entity 99,5 99,5
LCL SECU.100(JUIL.11) Full S2 France Consolidated structured entity 48,4 48,4
LCL TRIP HORIZ SEP16 Full France Consolidated structured entity 78,1 78,3 78,1 78,3
LCL VOCATION RENDEMENT NOV 12 3D Full France Consolidated structured entity 80,1 79,9 80,1 79,9
OBJECTIF MEDIAN FCP Full France Consolidated structured entity 92,5 100,0 92,5 100,0
OPALIA VIE 3DEC Full S1 France Consolidated structured entity 99,9 99,9
OPCIMMO LCL SPPICAV 5DEC Full France Consolidated structured entity 93,6 93,1 93,6 93,1
OPCIMMO PREM SPPICAV 5DEC Full France Consolidated structured entity 93,1 94,9 93,1 94,9
OPTIMIZ BES TIMING II 3DEC Full S1 France Consolidated structured entity 87,3 87,3
ORIANCE VIE FCP 3DEC Full S1 France Consolidated structured entity 100,0 100,0
PREMIUM PLUS 0% 09-17 EMTN Full S1 Ireland Consolidated structured entity 99,9 99,9
PREMIUM PLUS PLC 0% 09-17 Full S1 Ireland Consolidated structured entity 100,0 100,0
PREMIUM PLUS PLC 0% 09-17 IND Full S1 Ireland Consolidated structured entity 99,3 99,3
SOLIDARITE AMUNDI P Full France Consolidated structured entity 56,1 47,4 56,1 47,4
SOLIDARITE INITIATIS SANTE Full France Consolidated structured entity 86,1 83,9 86,1 83,9
TRIALIS 6 ANS Full France Consolidated structured entity 68,3 68,0 68,3 68,0
TRIALIS 6 ANS N2 C Full S1 France Consolidated structured entity 61,0 61,0
TRIALIS 6 ANS N3 FCP Full S4 France Consolidated structured entity 60,1 60,1
TRIALIS C Full S4 France Consolidated structured entity 66,7 66,7
TRIANANCE 6 ANS Full France Consolidated structured entity 61,8 61,6 61,8 61,6
TRIANANCE 6 ANS N 4 Full E3 France Consolidated structured entity 73,4 73,4
VENDOME INV.FCP 3DEC Full France Consolidated structured entity 90,4 91,5 90,4 91,5
Real estate collective investment fund (OPCI)
Nexus 1 Full Italy Consolidated structured entity 100,0 100,0 100,0 100,0
OPCI Camp Invest Full France Consolidated structured entity 100,0 80,1 100,0 80,1
OPCI ECO CAMPUS SPPICAV Full France Consolidated structured entity 100,0 100,0 100,0 100,0
OPCI Immanens Full France Consolidated structured entity 100,0 100,0 68,5 74,1
OPCI Immo Emissions Full France Consolidated structured entity 100,0 100,0 68,5 74,1
OPCI Iris Invest 2010 Full France Consolidated structured entity 100,0 80,1 100,0 80,1
OPCI KART Full S4 France Consolidated structured entity 100,0 100,0
OPCI MASSY BUREAUX Full France Consolidated structured entity 100,0 100,0 100,0 100,0
OPCI Messidor Full France Consolidated structured entity 100,0 94,5 100,0 94,5
Predica OPCI Bureau Full France Consolidated structured entity 100,0 100,0 100,0 100,0
Predica OPCI Commerces Full France Consolidated structured entity 100,0 100,0 100,0 100,0
Predica OPCI Habitation Full France Consolidated structured entity 100,0 100,0 100,0 100,0
Non-trading real estate investment company (SCI)
DS Campus Full E1 France Consolidated structured entity 100,0 100,0
HDP BUREAUX Full France Subsidiary 95,0 95,0 95,0 95,0
HDP HOTEL Full France Subsidiary 95,0 95,0 95,0 95,0
HDP LA HALLE BOCA Full France Subsidiary 95,0 95,0 95,0 95,0
IMEFA 177 Full E1 France Consolidated structured entity 99,0 99,0
IMEFA 178 Full E1 France Consolidated structured entity 99,0 99,0
IMEFA 179 Full E1 France Consolidated structured entity 99,0 99,0
Issy Pont Full E1 France Consolidated structured entity 75,0 75,0
SCI BMEDIC HABITATION Full France Subsidiary 100,0 100,0 100,0 100,0
SCI CAMPUS MEDICIS ST DENIS Full France Subsidiary 70,0 70,0 70,0 70,0
SCI CAMPUS RIMBAUD ST DENIS Full France Subsidiary 70,0 70,0 70,0 70,0
SCI CARGO PROPERTY HOLDING Equity Accounted E1 France Associate 29,9 29,9
SCI FEDERALE PEREIRE VICTOIRE Full France Subsidiary 99,0 99,0 99,0 99,0
SCI FEDERALE VILLIERS Full France Subsidiary 100,0 100,0 100,0 100,0
SCI FEDERLOG Full France Subsidiary 99,9 99,9 99,9 99,9
SCI FEDERLONDRES Full France Subsidiary 100,0 100,0 100,0 100,0
SCI FEDERPIERRE Full France Subsidiary 100,0 100,0 100,0 100,0
SCI GRENIER VELLEF Full France Consolidated structured entity 100,0 100,0 100,0 100,0
SCI Holding Dahlia Full E1 France Consolidated structured entity 100,0 100,0
SCI IMEFA 001 Full France Subsidiary 100,0 100,0 100,0 100,0
SCI IMEFA 002 Full France Subsidiary 100,0 100,0 100,0 100,0
SCI IMEFA 003 Full France Subsidiary 100,0 100,0 100,0 100,0
SCI IMEFA 004 Full France Subsidiary 100,0 100,0 100,0 100,0
SCI IMEFA 005 Full France Subsidiary 100,0 100,0 100,0 100,0
SCI IMEFA 006 Full France Subsidiary 100,0 100,0 100,0 100,0
SCI IMEFA 008 Full France Subsidiary 100,0 100,0 100,0 100,0
SCI IMEFA 009 Full France Subsidiary 100,0 100,0 100,0 100,0
SCI IMEFA 010 Full France Subsidiary 100,0 100,0 100,0 100,0
SCI IMEFA 011 Full France Subsidiary 100,0 100,0 100,0 100,0
SCI IMEFA 012 Full France Subsidiary 100,0 100,0 100,0 100,0
SCI IMEFA 013 Full France Subsidiary 100,0 100,0 100,0 100,0
SCI IMEFA 016 Full France Subsidiary 100,0 100,0 100,0 100,0
SCI IMEFA 017 Full France Subsidiary 100,0 100,0 100,0 100,0
SCI IMEFA 018 Full France Subsidiary 100,0 100,0 100,0 100,0
SCI IMEFA 020 Full France Subsidiary 100,0 100,0 100,0 100,0
SCI IMEFA 022 Full France Subsidiary 100,0 100,0 100,0 100,0
SCI IMEFA 025 Full France Consolidated structured entity 100,0 100,0 100,0 100,0
SCI IMEFA 032 Full France Subsidiary 100,0 100,0 100,0 100,0
% control % interestCrédit Agricole S.A. Group
Scope of consolidation
Consolidation
method
Scope
changes
(a)
Principal place of
business
Country of incorporation if
different
from the principal place of
business
Nature of control (b)
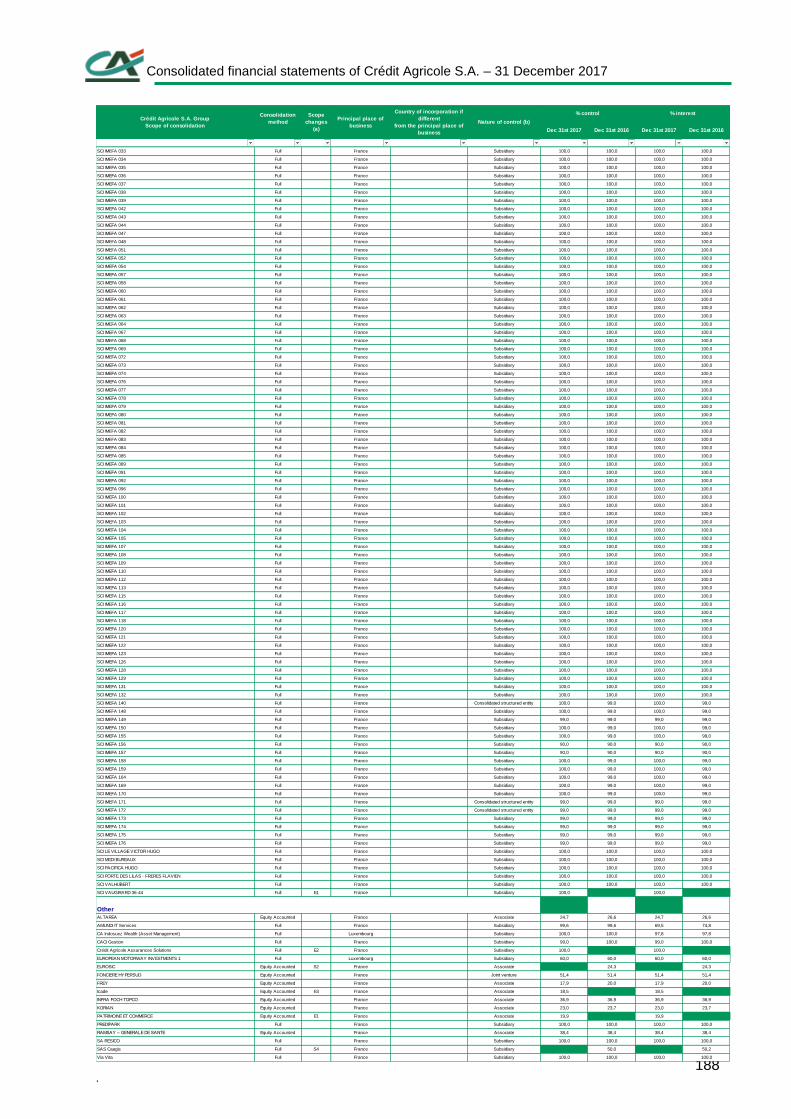
Consolidated financial statements of Crédit Agricole S.A. – 31 December 2017
. 188
Dec 31st 2017 Dec 31st 2016 Dec 31st 2017 Dec 31st 2016
SCI IMEFA 033 Full France Subsidiary 100,0 100,0 100,0 100,0
SCI IMEFA 034 Full France Subsidiary 100,0 100,0 100,0 100,0
SCI IMEFA 035 Full France Subsidiary 100,0 100,0 100,0 100,0
SCI IMEFA 036 Full France Subsidiary 100,0 100,0 100,0 100,0
SCI IMEFA 037 Full France Subsidiary 100,0 100,0 100,0 100,0
SCI IMEFA 038 Full France Subsidiary 100,0 100,0 100,0 100,0
SCI IMEFA 039 Full France Subsidiary 100,0 100,0 100,0 100,0
SCI IMEFA 042 Full France Subsidiary 100,0 100,0 100,0 100,0
SCI IMEFA 043 Full France Subsidiary 100,0 100,0 100,0 100,0
SCI IMEFA 044 Full France Subsidiary 100,0 100,0 100,0 100,0
SCI IMEFA 047 Full France Subsidiary 100,0 100,0 100,0 100,0
SCI IMEFA 048 Full France Subsidiary 100,0 100,0 100,0 100,0
SCI IMEFA 051 Full France Subsidiary 100,0 100,0 100,0 100,0
SCI IMEFA 052 Full France Subsidiary 100,0 100,0 100,0 100,0
SCI IMEFA 054 Full France Subsidiary 100,0 100,0 100,0 100,0
SCI IMEFA 057 Full France Subsidiary 100,0 100,0 100,0 100,0
SCI IMEFA 058 Full France Subsidiary 100,0 100,0 100,0 100,0
SCI IMEFA 060 Full France Subsidiary 100,0 100,0 100,0 100,0
SCI IMEFA 061 Full France Subsidiary 100,0 100,0 100,0 100,0
SCI IMEFA 062 Full France Subsidiary 100,0 100,0 100,0 100,0
SCI IMEFA 063 Full France Subsidiary 100,0 100,0 100,0 100,0
SCI IMEFA 064 Full France Subsidiary 100,0 100,0 100,0 100,0
SCI IMEFA 067 Full France Subsidiary 100,0 100,0 100,0 100,0
SCI IMEFA 068 Full France Subsidiary 100,0 100,0 100,0 100,0
SCI IMEFA 069 Full France Subsidiary 100,0 100,0 100,0 100,0
SCI IMEFA 072 Full France Subsidiary 100,0 100,0 100,0 100,0
SCI IMEFA 073 Full France Subsidiary 100,0 100,0 100,0 100,0
SCI IMEFA 074 Full France Subsidiary 100,0 100,0 100,0 100,0
SCI IMEFA 076 Full France Subsidiary 100,0 100,0 100,0 100,0
SCI IMEFA 077 Full France Subsidiary 100,0 100,0 100,0 100,0
SCI IMEFA 078 Full France Subsidiary 100,0 100,0 100,0 100,0
SCI IMEFA 079 Full France Subsidiary 100,0 100,0 100,0 100,0
SCI IMEFA 080 Full France Subsidiary 100,0 100,0 100,0 100,0
SCI IMEFA 081 Full France Subsidiary 100,0 100,0 100,0 100,0
SCI IMEFA 082 Full France Subsidiary 100,0 100,0 100,0 100,0
SCI IMEFA 083 Full France Subsidiary 100,0 100,0 100,0 100,0
SCI IMEFA 084 Full France Subsidiary 100,0 100,0 100,0 100,0
SCI IMEFA 085 Full France Subsidiary 100,0 100,0 100,0 100,0
SCI IMEFA 089 Full France Subsidiary 100,0 100,0 100,0 100,0
SCI IMEFA 091 Full France Subsidiary 100,0 100,0 100,0 100,0
SCI IMEFA 092 Full France Subsidiary 100,0 100,0 100,0 100,0
SCI IMEFA 096 Full France Subsidiary 100,0 100,0 100,0 100,0
SCI IMEFA 100 Full France Subsidiary 100,0 100,0 100,0 100,0
SCI IMEFA 101 Full France Subsidiary 100,0 100,0 100,0 100,0
SCI IMEFA 102 Full France Subsidiary 100,0 100,0 100,0 100,0
SCI IMEFA 103 Full France Subsidiary 100,0 100,0 100,0 100,0
SCI IMEFA 104 Full France Subsidiary 100,0 100,0 100,0 100,0
SCI IMEFA 105 Full France Subsidiary 100,0 100,0 100,0 100,0
SCI IMEFA 107 Full France Subsidiary 100,0 100,0 100,0 100,0
SCI IMEFA 108 Full France Subsidiary 100,0 100,0 100,0 100,0
SCI IMEFA 109 Full France Subsidiary 100,0 100,0 100,0 100,0
SCI IMEFA 110 Full France Subsidiary 100,0 100,0 100,0 100,0
SCI IMEFA 112 Full France Subsidiary 100,0 100,0 100,0 100,0
SCI IMEFA 113 Full France Subsidiary 100,0 100,0 100,0 100,0
SCI IMEFA 115 Full France Subsidiary 100,0 100,0 100,0 100,0
SCI IMEFA 116 Full France Subsidiary 100,0 100,0 100,0 100,0
SCI IMEFA 117 Full France Subsidiary 100,0 100,0 100,0 100,0
SCI IMEFA 118 Full France Subsidiary 100,0 100,0 100,0 100,0
SCI IMEFA 120 Full France Subsidiary 100,0 100,0 100,0 100,0
SCI IMEFA 121 Full France Subsidiary 100,0 100,0 100,0 100,0
SCI IMEFA 122 Full France Subsidiary 100,0 100,0 100,0 100,0
SCI IMEFA 123 Full France Subsidiary 100,0 100,0 100,0 100,0
SCI IMEFA 126 Full France Subsidiary 100,0 100,0 100,0 100,0
SCI IMEFA 128 Full France Subsidiary 100,0 100,0 100,0 100,0
SCI IMEFA 129 Full France Subsidiary 100,0 100,0 100,0 100,0
SCI IMEFA 131 Full France Subsidiary 100,0 100,0 100,0 100,0
SCI IMEFA 132 Full France Subsidiary 100,0 100,0 100,0 100,0
SCI IMEFA 140 Full France Consolidated structured entity 100,0 99,0 100,0 99,0
SCI IMEFA 148 Full France Subsidiary 100,0 99,0 100,0 99,0
SCI IMEFA 149 Full France Subsidiary 99,0 99,0 99,0 99,0
SCI IMEFA 150 Full France Subsidiary 100,0 99,0 100,0 99,0
SCI IMEFA 155 Full France Subsidiary 100,0 99,0 100,0 99,0
SCI IMEFA 156 Full France Subsidiary 90,0 90,0 90,0 90,0
SCI IMEFA 157 Full France Subsidiary 90,0 90,0 90,0 90,0
SCI IMEFA 158 Full France Subsidiary 100,0 99,0 100,0 99,0
SCI IMEFA 159 Full France Subsidiary 100,0 99,0 100,0 99,0
SCI IMEFA 164 Full France Subsidiary 100,0 99,0 100,0 99,0
SCI IMEFA 169 Full France Subsidiary 100,0 99,0 100,0 99,0
SCI IMEFA 170 Full France Subsidiary 100,0 99,0 100,0 99,0
SCI IMEFA 171 Full France Consolidated structured entity 99,0 99,0 99,0 99,0
SCI IMEFA 172 Full France Consolidated structured entity 99,0 99,0 99,0 99,0
SCI IMEFA 173 Full France Subsidiary 99,0 99,0 99,0 99,0
SCI IMEFA 174 Full France Subsidiary 99,0 99,0 99,0 99,0
SCI IMEFA 175 Full France Subsidiary 99,0 99,0 99,0 99,0
SCI IMEFA 176 Full France Subsidiary 99,0 99,0 99,0 99,0
SCI LE VILLAGE VICTOR HUGO Full France Subsidiary 100,0 100,0 100,0 100,0
SCI MEDI BUREAUX Full France Subsidiary 100,0 100,0 100,0 100,0
SCI PACIFICA HUGO Full France Subsidiary 100,0 100,0 100,0 100,0
SCI PORTE DES LILAS - FRERES FLAVIEN Full France Subsidiary 100,0 100,0 100,0 100,0
SCI VALHUBERT Full France Subsidiary 100,0 100,0 100,0 100,0
SCI VAUGIRARD 36-44 Full E1 France Subsidiary 100,0 100,0
Other
ALTAREA Equity Accounted France Associate 24,7 26,6 24,7 26,6
AMUNDI IT Services Full France Subsidiary 99,6 99,6 69,5 74,8
CA Indosuez Wealth (Asset Management) Full Luxembourg Subsidiary 100,0 100,0 97,8 97,8
CACI Gestion Full France Subsidiary 99,0 100,0 99,0 100,0
Crédit Agricole Assurances Solutions Full E2 France Subsidiary 100,0 100,0
EUROPEAN MOTORWAY INVESTMENTS 1 Full Luxembourg Subsidiary 60,0 60,0 60,0 60,0
EUROSIC Equity Accounted S2 France Associate 24,3 24,3
FONCIERE HYPERSUD Equity Accounted France Joint venture 51,4 51,4 51,4 51,4
FREY Equity Accounted France Associate 17,9 20,0 17,9 20,0
Icade Equity Accounted E3 France Associate 18,5 18,5
INFRA FOCH TOPCO Equity Accounted France Associate 36,9 36,9 36,9 36,9
KORIAN Equity Accounted France Associate 23,0 23,7 23,0 23,7
PATRIMOINE ET COMMERCE Equity Accounted E1 France Associate 19,9 19,9
PREDIPARK Full France Subsidiary 100,0 100,0 100,0 100,0
RAMSAY – GENERALE DE SANTE Equity Accounted France Associate 38,4 38,4 38,4 38,4
SA RESICO Full France Subsidiary 100,0 100,0 100,0 100,0
SAS Caagis Full S4 France Subsidiary 50,0 50,2
Via Vita Full France Subsidiary 100,0 100,0 100,0 100,0
% control % interestCrédit Agricole S.A. Group
Scope of consolidation
Consolidation
method
Scope
changes
(a)
Principal place of
business
Country of incorporation if
different
from the principal place of
business
Nature of control (b)
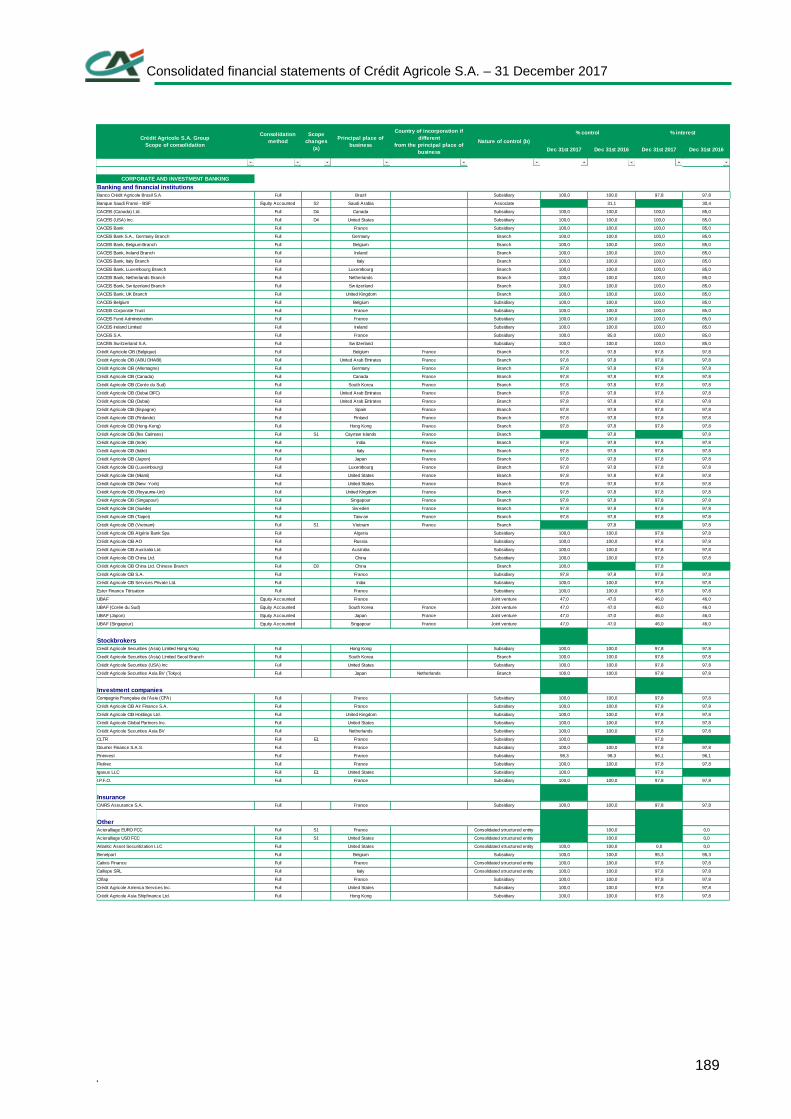
Consolidated financial statements of Crédit Agricole S.A. – 31 December 2017
. 189
Dec 31st 2017 Dec 31st 2016 Dec 31st 2017 Dec 31st 2016
CORPORATE AND INVESTMENT BANKING
Banking and financial institutions
Banco Crédit Agricole Brasil S.A. Full Brazil Subsidiary 100,0 100,0 97,8 97,8
Banque Saudi Fransi - BSF Equity Accounted S2 Saudi Arabia Associate 31,1 30,4
CACEIS (Canada) Ltd. Full D4 Canada Subsidiary 100,0 100,0 100,0 85,0
CACEIS (USA) Inc. Full D4 United States Subsidiary 100,0 100,0 100,0 85,0
CACEIS Bank Full France Subsidiary 100,0 100,0 100,0 85,0
CACEIS Bank S.A., Germany Branch Full Germany Branch 100,0 100,0 100,0 85,0
CACEIS Bank, Belgium Branch Full Belgium Branch 100,0 100,0 100,0 85,0
CACEIS Bank, Ireland Branch Full Ireland Branch 100,0 100,0 100,0 85,0
CACEIS Bank, Italy Branch Full Italy Branch 100,0 100,0 100,0 85,0
CACEIS Bank, Luxembourg Branch Full Luxembourg Branch 100,0 100,0 100,0 85,0
CACEIS Bank, Netherlands Branch Full Netherlands Branch 100,0 100,0 100,0 85,0
CACEIS Bank, Sw itzerland Branch Full Sw itzerland Branch 100,0 100,0 100,0 85,0
CACEIS Bank, UK Branch Full United Kingdom Branch 100,0 100,0 100,0 85,0
CACEIS Belgium Full Belgium Subsidiary 100,0 100,0 100,0 85,0
CACEIS Corporate Trust Full France Subsidiary 100,0 100,0 100,0 85,0
CACEIS Fund Administration Full France Subsidiary 100,0 100,0 100,0 85,0
CACEIS Ireland Limited Full Ireland Subsidiary 100,0 100,0 100,0 85,0
CACEIS S.A. Full France Subsidiary 100,0 85,0 100,0 85,0
CACEIS Sw itzerland S.A. Full Sw itzerland Subsidiary 100,0 100,0 100,0 85,0
Crédit Agriciole CIB (Belgique) Full Belgium France Branch 97,8 97,8 97,8 97,8
Crédit Agricole CIB (ABU DHABI) Full United Arab Emirates France Branch 97,8 97,8 97,8 97,8
Crédit Agricole CIB (Allemagne) Full Germany France Branch 97,8 97,8 97,8 97,8
Crédit Agricole CIB (Canada) Full Canada France Branch 97,8 97,8 97,8 97,8
Crédit Agricole CIB (Corée du Sud) Full South Korea France Branch 97,8 97,8 97,8 97,8
Crédit Agricole CIB (Dubai DIFC) Full United Arab Emirates France Branch 97,8 97,8 97,8 97,8
Crédit Agricole CIB (Dubai) Full United Arab Emirates France Branch 97,8 97,8 97,8 97,8
Crédit Agricole CIB (Espagne) Full Spain France Branch 97,8 97,8 97,8 97,8
Crédit Agricole CIB (Finlande) Full Finland France Branch 97,8 97,8 97,8 97,8
Crédit Agricole CIB (Hong-Kong) Full Hong Kong France Branch 97,8 97,8 97,8 97,8
Crédit Agricole CIB (Îles Caïmans) Full S1 Cayman Islands France Branch 97,8 97,8
Crédit Agricole CIB (Inde) Full India France Branch 97,8 97,8 97,8 97,8
Crédit Agricole CIB (Italie) Full Italy France Branch 97,8 97,8 97,8 97,8
Crédit Agricole CIB (Japon) Full Japan France Branch 97,8 97,8 97,8 97,8
Crédit Agricole CIB (Luxembourg) Full Luxembourg France Branch 97,8 97,8 97,8 97,8
Crédit Agricole CIB (Miami) Full United States France Branch 97,8 97,8 97,8 97,8
Crédit Agricole CIB (New -York) Full United States France Branch 97,8 97,8 97,8 97,8
Crédit Agricole CIB (Royaume-Uni) Full United Kingdom France Branch 97,8 97,8 97,8 97,8
Crédit Agricole CIB (Singapour) Full Singapour France Branch 97,8 97,8 97,8 97,8
Crédit Agricole CIB (Suède) Full Sw eden France Branch 97,8 97,8 97,8 97,8
Crédit Agricole CIB (Taipei) Full Taiw an France Branch 97,8 97,8 97,8 97,8
Crédit Agricole CIB (Vietnam) Full S1 Vietnam France Branch 97,8 97,8
Crédit Agricole CIB Algérie Bank Spa Full Algeria Subsidiary 100,0 100,0 97,8 97,8
Crédit Agricole CIB AO Full Russia Subsidiary 100,0 100,0 97,8 97,8
Crédit Agricole CIB Australia Ltd. Full Australia Subsidiary 100,0 100,0 97,8 97,8
Crédit Agricole CIB China Ltd. Full China Subsidiary 100,0 100,0 97,8 97,8
Crédit Agricole CIB China Ltd. Chinese Branch Full D3 China Branch 100,0 97,8
Crédit Agricole CIB S.A. Full France Subsidiary 97,8 97,8 97,8 97,8
Crédit Agricole CIB Services Private Ltd. Full India Subsidiary 100,0 100,0 97,8 97,8
Ester Finance Titrisation Full France Subsidiary 100,0 100,0 97,8 97,8
UBAF Equity Accounted France Joint venture 47,0 47,0 46,0 46,0
UBAF (Corée du Sud) Equity Accounted South Korea France Joint venture 47,0 47,0 46,0 46,0
UBAF (Japon) Equity Accounted Japan France Joint venture 47,0 47,0 46,0 46,0
UBAF (Singapour) Equity Accounted Singapour France Joint venture 47,0 47,0 46,0 46,0
Stockbrokers
Credit Agricole Securities (Asia) Limited Hong Kong Full Hong Kong Subsidiary 100,0 100,0 97,8 97,8
Credit Agricole Securities (Asia) Limited Seoul Branch Full South Korea Branch 100,0 100,0 97,8 97,8
Crédit Agricole Securities (USA) Inc Full United States Subsidiary 100,0 100,0 97,8 97,8
Crédit Agricole Securities Asia BV (Tokyo) Full Japan Netherlands Branch 100,0 100,0 97,8 97,8
Investment companies
Compagnie Française de l’Asie (CFA) Full France Subsidiary 100,0 100,0 97,8 97,8
Crédit Agricole CIB Air Finance S.A. Full France Subsidiary 100,0 100,0 97,8 97,8
Crédit Agricole CIB Holdings Ltd. Full United Kingdom Subsidiary 100,0 100,0 97,8 97,8
Crédit Agricole Global Partners Inc. Full United States Subsidiary 100,0 100,0 97,8 97,8
Crédit Agricole Securities Asia BV Full Netherlands Subsidiary 100,0 100,0 97,8 97,8
CLTR Full E1 France Subsidiary 100,0 97,8
Doumer Finance S.A.S. Full France Subsidiary 100,0 100,0 97,8 97,8
Fininvest Full France Subsidiary 98,3 98,3 96,1 96,1
Fletirec Full France Subsidiary 100,0 100,0 97,8 97,8
Igasus LLC Full E1 United States Subsidiary 100,0 97,8
I.P.F.O. Full France Subsidiary 100,0 100,0 97,8 97,8
Insurance
CAIRS Assurance S.A. Full France Subsidiary 100,0 100,0 97,8 97,8
Other
Acieralliage EURO FCC Full S1 France Consolidated structured entity 100,0 0,0
Acieralliage USD FCC Full S1 United States Consolidated structured entity 100,0 0,0
Atlantic Asset Securitization LLC Full United States Consolidated structured entity 100,0 100,0 0,0 0,0
Benelpart Full Belgium Subsidiary 100,0 100,0 95,3 95,3
Calixis Finance Full France Consolidated structured entity 100,0 100,0 97,8 97,8
Calliope SRL Full Italy Consolidated structured entity 100,0 100,0 97,8 97,8
Clifap Full France Subsidiary 100,0 100,0 97,8 97,8
Crédit Agricole America Services Inc. Full United States Subsidiary 100,0 100,0 97,8 97,8
Crédit Agricole Asia Shipfinance Ltd. Full Hong Kong Subsidiary 100,0 100,0 97,8 97,8
% control % interestCrédit Agricole S.A. Group
Scope of consolidation
Consolidation
method
Scope
changes
(a)
Principal place of
business
Country of incorporation if
different
from the principal place of
business
Nature of control (b)
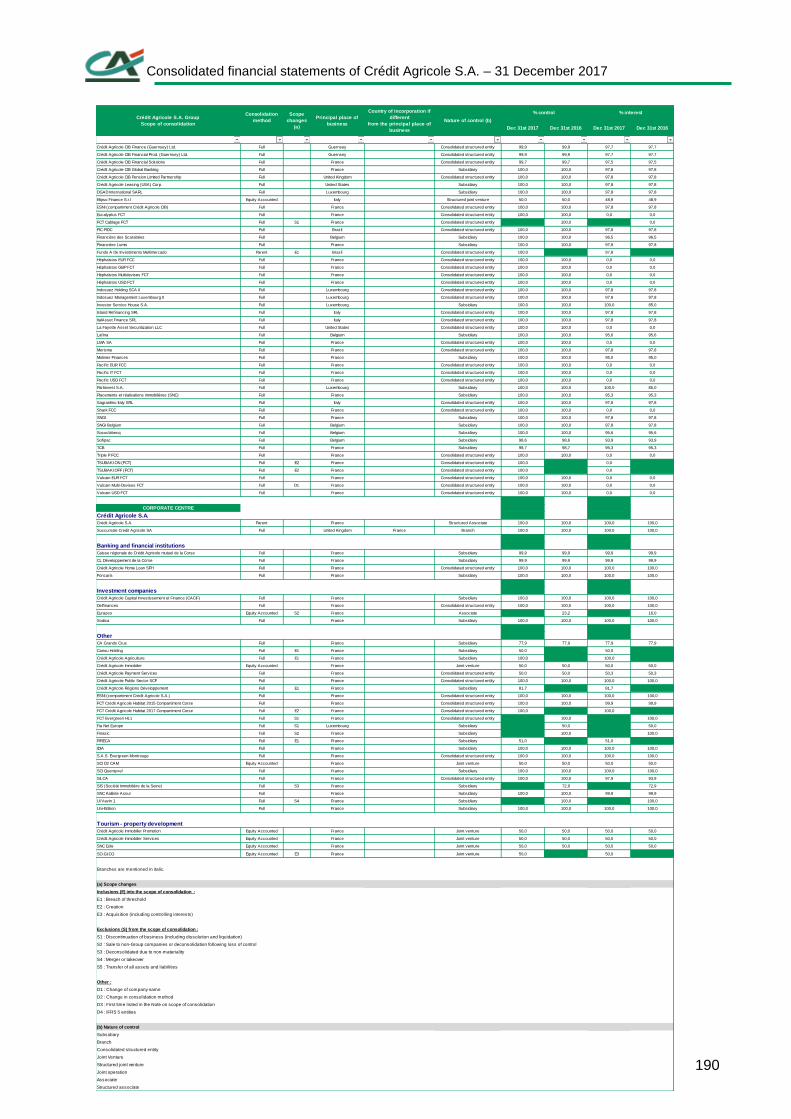
Consolidated financial statements of Crédit Agricole S.A. – 31 December 2017
. 190
Dec 31st 2017 Dec 31st 2016 Dec 31st 2017 Dec 31st 2016
Crédit Agricole CIB Finance (Guernsey) Ltd. Full Guernsey Consolidated structured entity 99,9 99,9 97,7 97,7
Crédit Agricole CIB Financial Prod. (Guernsey) Ltd. Full Guernsey Consolidated structured entity 99,9 99,9 97,7 97,7
Crédit Agricole CIB Financial Solutions Full France Consolidated structured entity 99,7 99,7 97,5 97,5
Crédit Agricole CIB Global Banking Full France Subsidiary 100,0 100,0 97,8 97,8
Crédit Agricole CIB Pension Limited Partnership Full United Kingdom Consolidated structured entity 100,0 100,0 97,8 97,8
Crédit Agricole Leasing (USA) Corp. Full United States Subsidiary 100,0 100,0 97,8 97,8
DGAD International SARL Full Luxembourg Subsidiary 100,0 100,0 97,8 97,8
Elipso Finance S.r.l Equity Accounted Italy Structured joint venture 50,0 50,0 48,9 48,9
ESNI (compartiment Crédit Agricole CIB) Full France Consolidated structured entity 100,0 100,0 97,8 97,8
Eucalyptus FCT Full France Consolidated structured entity 100,0 100,0 0,0 0,0
FCT Cablage FCT Full S1 France Consolidated structured entity 100,0 0,0
FIC-FIDC Full Brazil Consolidated structured entity 100,0 100,0 97,8 97,8
Financière des Scarabées Full Belgium Subsidiary 100,0 100,0 96,5 96,5
Financière Lumis Full France Subsidiary 100,0 100,0 97,8 97,8
Fundo A De Investimento Multimercado Parent E1 Brazil Consolidated structured entity 100,0 97,8
Héphaïstos EUR FCC Full France Consolidated structured entity 100,0 100,0 0,0 0,0
Héphaïstos GBP FCT Full France Consolidated structured entity 100,0 100,0 0,0 0,0
Héphaïstos Multidevises FCT Full France Consolidated structured entity 100,0 100,0 0,0 0,0
Héphaïstos USD FCT Full France Consolidated structured entity 100,0 100,0 0,0 0,0
Indosuez Holding SCA II Full Luxembourg Consolidated structured entity 100,0 100,0 97,8 97,8
Indosuez Management Luxembourg II Full Luxembourg Consolidated structured entity 100,0 100,0 97,8 97,8
Investor Service House S.A. Full Luxembourg Subsidiary 100,0 100,0 100,0 85,0
Island Refinancing SRL Full Italy Consolidated structured entity 100,0 100,0 97,8 97,8
ItalAsset Finance SRL Full Italy Consolidated structured entity 100,0 100,0 97,8 97,8
La Fayette Asset Securitization LLC Full United States Consolidated structured entity 100,0 100,0 0,0 0,0
Lafina Full Belgium Subsidiary 100,0 100,0 95,6 95,6
LMA SA Full France Consolidated structured entity 100,0 100,0 0,0 0,0
Merisma Full France Consolidated structured entity 100,0 100,0 97,8 97,8
Molinier Finances Full France Subsidiary 100,0 100,0 95,0 95,0
Pacif ic EUR FCC Full France Consolidated structured entity 100,0 100,0 0,0 0,0
Pacif ic IT FCT Full France Consolidated structured entity 100,0 100,0 0,0 0,0
Pacif ic USD FCT Full France Consolidated structured entity 100,0 100,0 0,0 0,0
Partinvest S.A. Full Luxembourg Subsidiary 100,0 100,0 100,0 85,0
Placements et réalisations immobilières (SNC) Full France Subsidiary 100,0 100,0 95,3 95,3
Sagrantino Italy SRL Full Italy Consolidated structured entity 100,0 100,0 97,8 97,8
Shark FCC Full France Consolidated structured entity 100,0 100,0 0,0 0,0
SNGI Full France Subsidiary 100,0 100,0 97,8 97,8
SNGI Belgium Full Belgium Subsidiary 100,0 100,0 97,8 97,8
Sococlabecq Full Belgium Subsidiary 100,0 100,0 95,6 95,6
Sofipac Full Belgium Subsidiary 98,6 98,6 93,9 93,9
TCB Full France Subsidiary 98,7 98,7 95,3 95,3
Triple P FCC Full France Consolidated structured entity 100,0 100,0 0,0 0,0
TSUBAKI ON (FCT) Full E2 France Consolidated structured entity 100,0 0,0
TSUBAKI OFF (FCT) Full E2 France Consolidated structured entity 100,0 0,0
Vulcain EUR FCT Full France Consolidated structured entity 100,0 100,0 0,0 0,0
Vulcain Multi-Devises FCT Full D1 France Consolidated structured entity 100,0 100,0 0,0 0,0
Vulcain USD FCT Full France Consolidated structured entity 100,0 100,0 0,0 0,0
CORPORATE CENTRE
Crédit Agricole S.A.
Crédit Agricole S.A. Parent France Structured Associate 100,0 100,0 100,0 100,0
Succursale Credit Agricole SA Full United Kingdom France Branch 100,0 100,0 100,0 100,0
Banking and financial institutions
Caisse régionale de Crédit Agricole mutuel de la Corse Full France Subsidiary 99,9 99,9 99,9 99,9
CL Développement de la Corse Full France Subsidiary 99,9 99,9 99,9 99,9
Crédit Agricole Home Loan SFH Full France Consolidated structured entity 100,0 100,0 100,0 100,0
Foncaris Full France Subsidiary 100,0 100,0 100,0 100,0
Investment companies
Crédit Agricole Capital Investissement et Finance (CACIF) Full France Subsidiary 100,0 100,0 100,0 100,0
Delf inances Full France Consolidated structured entity 100,0 100,0 100,0 100,0
Eurazeo Equity Accounted S2 France Associate 23,2 16,0
Sodica Full France Subsidiary 100,0 100,0 100,0 100,0
Other
CA Grands Crus Full France Subsidiary 77,9 77,9 77,9 77,9
Cariou Holding Full E1 France Subsidiary 50,0 50,0
Crédit Agricole Agriculture Full E1 France Subsidiary 100,0 100,0
Crédit Agricole Immobilier Equity Accounted France Joint venture 50,0 50,0 50,0 50,0
Crédit Agricole Payment Services Full France Consolidated structured entity 50,0 50,0 50,3 50,3
Crédit Agricole Public Sector SCF Full France Consolidated structured entity 100,0 100,0 100,0 100,0
Crédit Agricole Régions Développement Full E1 France Subsidiary 81,7 81,7
ESNI (compartiment Crédit Agricole S.A.) Full France Consolidated structured entity 100,0 100,0 100,0 100,0
FCT Crédit Agricole Habitat 2015 Compartiment Corse Full France Consolidated structured entity 100,0 100,0 99,9 99,9
FCT Crédit Agricole Habitat 2017 Compartiment Corse Full E2 France Consolidated structured entity 100,0 100,0
FCT Evergreen HL1 Full S1 France Consolidated structured entity 100,0 100,0
Fia Net Europe Full S1 Luxembourg Subsidiary 50,0 50,0
Finasic Full S2 France Subsidiary 100,0 100,0
FIRECA Full E1 France Subsidiary 51,0 51,0
IDIA Full France Subsidiary 100,0 100,0 100,0 100,0
S.A.S. Evergreen Montrouge Full France Consolidated structured entity 100,0 100,0 100,0 100,0
SCI D2 CAM Equity Accounted France Joint venture 50,0 50,0 50,0 50,0
SCI Quentyvel Full France Subsidiary 100,0 100,0 100,0 100,0
SILCA Full France Consolidated structured entity 100,0 100,0 97,9 93,9
SIS (Société Immobilière de la Seine) Full S3 France Subsidiary 72,9 72,9
SNC Kalliste Assur Full France Subsidiary 100,0 100,0 99,9 99,9
UI Vavin 1 Full S4 France Subsidiary 100,0 100,0
Uni-Edition Full France Subsidiary 100,0 100,0 100,0 100,0
Tourism - property development
Crédit Agricole Immobilier Promotion Equity Accounted France Joint venture 50,0 50,0 50,0 50,0
Crédit Agricole Immobilier Services Equity Accounted France Joint venture 50,0 50,0 50,0 50,0
SNC Eole Equity Accounted France Joint venture 50,0 50,0 50,0 50,0
SO.GI.CO Equity Accounted E3 France Joint venture 50,0 50,0
Branches are mentioned in italic.
(a) Scope changes
Inclusions (E) into the scope of consolidation :
E1 : Breach of threshold
E2 : Creation
E3 : Acquisition (including controlling interests)
Exclusions (S) from the scope of consolidation :
S1 : Discontinuation of business (including dissolution and liquidation)
S2 : Sale to non-Group companies or deconsolidation following loss of control
S3 : Deconsolidated due to non-materiality
S4 : Merger or takeover
S5 : Transfer of all assets and liabilities
Other :
D1 : Change of company name
D2 : Change in consolidation method
D3 : First time listed in the Note on scope of consolidation
D4 : IFRS 5 entities
(b) Nature of control
Subsidiary
Branch
Consolidated structured entity
Joint Venture
Structured joint venture
Joint operation
Associate
Structured associate
% control % interestCrédit Agricole S.A. Group
Scope of consolidation
Consolidation
method
Scope
changes
(a)
Principal place of
business
Country of incorporation if
different
from the principal place of
business
Nature of control (b)
Consolidated financial statements of Crédit Agricole S.A. – 31 December 2017
. 191
12. Investments in non-consolidated companies and structured entities
12.1 Information on subsidiaries
This line item amounted to € 12,277 million at 31 December 2017, compared with €10,460 million
at 31 December 2016. At 31 December 2017, the main investment in non-consolidated companies
where percentage of control is greater than 20% and which have significant value on the balance
sheet is Crédit Logement (shares A and B). The Group’s investment represents 33% of Crédit
Logement’s capital and amounts to €617 million but does not confer any significant influence over
this entity, which is jointly held by various French banks and companies.
12.1.1 Non-consolidated controlled entities
Information relating to conventional entities under exclusive control, under joint control and subject
to significant influence, and to controlled structured entities not included in the scope of
consolidation are available on the Crédit Agricole S.A. Group website at the following address:
https://www.credit-agricole.com/en/finance/finance/financial-publications
12.1.2 Material non-consolidated equity investments
Equity investments accounting for a fraction of capital greater than or equal to 10% and not included
in the scope of consolidation are presented in a table available online on the Crédit Agricole S.A.
Group website at:
https://www.credit-agricole.com/en/finance/finance/financial-publications
12.2 Non-consolidated structured entities
INFORMATION ON THE NATURE AND EXTENT OF INTERESTS HELD At 31 December 2017, Crédit Agricole S.A. Group entities had interests in certain non-consolidated structured entities, the main characteristics of which are presented below on the basis of their type of activity: Securitisation
Crédit Agricole S.A. Group, mainly through its subsidiaries in the Large Customers business line,
is tasked with structuring securitisation vehicles through the purchase of trade or financial
receivables. The vehicles fund such purchases by issuing multiple tranches of debt and equity
investments, with repayment being linked to the performance of the assets in such vehicles. It
invests in and provides liquidity facilities to the securitisation vehicles it has sponsored on behalf of
customers.
Consolidated financial statements of Crédit Agricole S.A. – 31 December 2017
. 192
Asset management
Crédit Agricole S.A. Group, through its subsidiaries in the Asset gathering business line, structures
and manages entities on behalf of customers wishing to invest in specific assets in order to obtain
the best possible return having regard to the chosen level of risk. Crédit Agricole S.A. Group entities
may thus either be required to hold interests in such entities in order to ensure a successful launch
or to guarantee the performance of such structures.
Investment funds
Entities in the Crédit Agricole S.A. Group Asset gathering business line invest in companies
established to meet investor demand in connection with treasury management and with the
investment of insurance premiums received from insurance company customers, in accordance
with the regulatory provisions in the French Insurance Code. Insurance company investments cover
commitments to policyholders over the life of insurance policies. Their value and returns are
correlated to these commitments.
Structured finance
Lastly, Crédit Agricole S.A. Group, via its subsidiaries in the Large customers business line, is
involved in special purpose asset acquisition entities. These entities may take the form of asset
financing companies or lease financing companies. In structured entities, the financing is secured
by the asset. The Group’s involvement is often limited to the financing or to financing commitments.
Sponsored entities Crédit Agricole S.A. Group sponsors structured entities in the following instances: - Crédit Agricole S.A. Group is involved in establishing the entity and that involvement, which is remunerated, is deemed essential for ensuring the proper completion of transactions;
-structuring takes place at the request of Crédit Agricole S.A. Group and it is the main user thereof;
-Crédit Agricole S.A. Group transfers its own assets to the structured entity;
-Crédit Agricole S.A. Group is the manager;
- The name of a subsidiary or of the parent company of Crédit Agricole S.A. Group is linked to the
name of the structured entity or of the financial instruments issued by it. Gross revenues from sponsored entities mainly comprise commissions in securitisation and
investment funds, in which Crédit Agricole Assurances and Crédit Agricole CIB do not hold any
interests at the reporting date. For Crédit Agricole Assurances they amount to €6 million and for
Crédit Agricole CIB €22 million as at 31 December 2017.
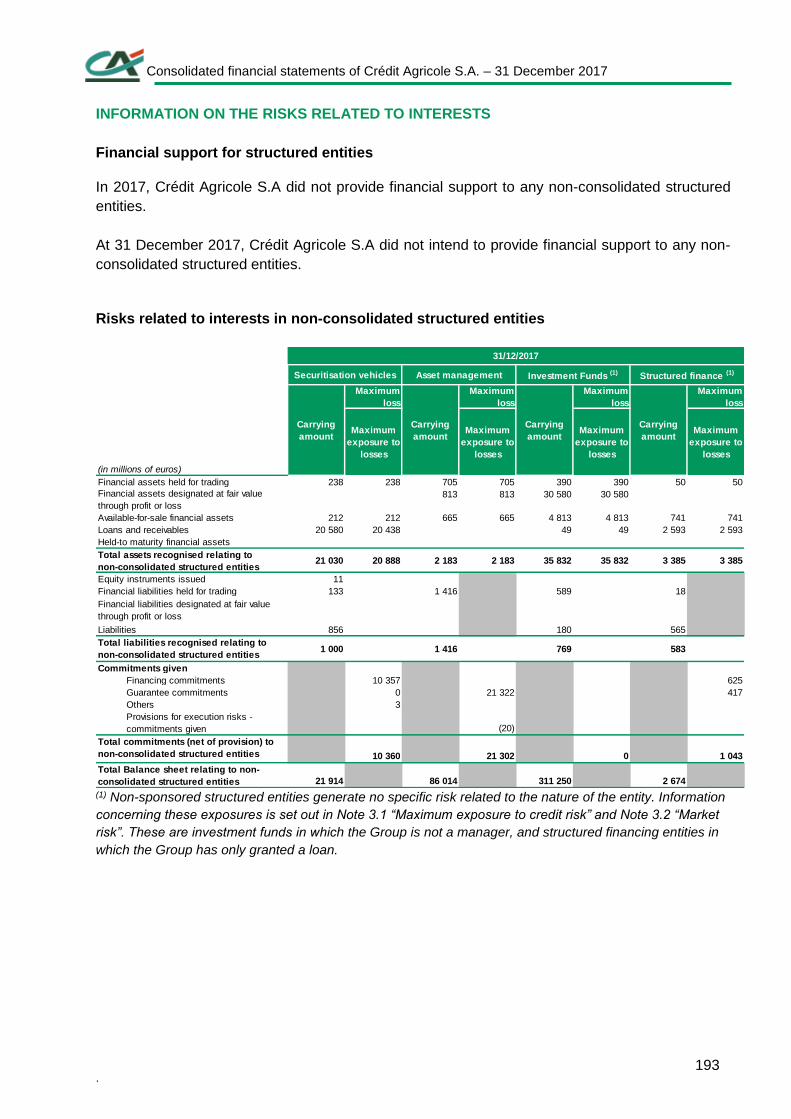
Consolidated financial statements of Crédit Agricole S.A. – 31 December 2017
. 193
INFORMATION ON THE RISKS RELATED TO INTERESTS
Financial support for structured entities
In 2017, Crédit Agricole S.A did not provide financial support to any non-consolidated structured
entities.
At 31 December 2017, Crédit Agricole S.A did not intend to provide financial support to any non-
consolidated structured entities.
Risks related to interests in non-consolidated structured entities
(1) Non-sponsored structured entities generate no specific risk related to the nature of the entity. Information
concerning these exposures is set out in Note 3.1 “Maximum exposure to credit risk” and Note 3.2 “Market
risk”. These are investment funds in which the Group is not a manager, and structured financing entities in
which the Group has only granted a loan.
Maximum
exposure to
losses
Maximum
exposure to
losses
Maximum
exposure to
losses
Maximum
exposure to
losses
238 238 705 705 390 390 50 50
813 813 30 580 30 580
212 212 665 665 4 813 4 813 741 741
20 580 20 438 49 49 2 593 2 593
21 030 20 888 2 183 2 183 35 832 35 832 3 385 3 385
11
133 1 416 589 18
856 180 565
1 000 1 416 769 583
Financing commitments 10 357 625
Guarantee commitments 0 21 322 417
Others 3
Provisions for execution risks -
commitments given (20)
10 360 21 302 0 1 043
21 914 86 014 311 250 2 674
Financial liabilities designated at fair value
through profit or loss
Liabilities
Total liabilities recognised relating to
non-consolidated structured entities
Commitments given
Total commitments (net of provision) to
non-consolidated structured entities
Total Balance sheet relating to non-
consolidated structured entities
Maximum
loss
Financial assets held for trading
Financial assets designated at fair value
through profit or loss
(in millions of euros)
31/12/2017
Securitisation vehicles Asset management Investment Funds (1) Structured finance (1)
Carrying
amount
Maximum
loss
Carrying
amount
Maximum
loss
Financial liabilities held for trading
Carrying
amount
Maximum
loss
Carrying
amount
Available-for-sale financial assets
Loans and receivables
Held-to maturity financial assets
Total assets recognised relating to
non-consolidated structured entities
Equity instruments issued
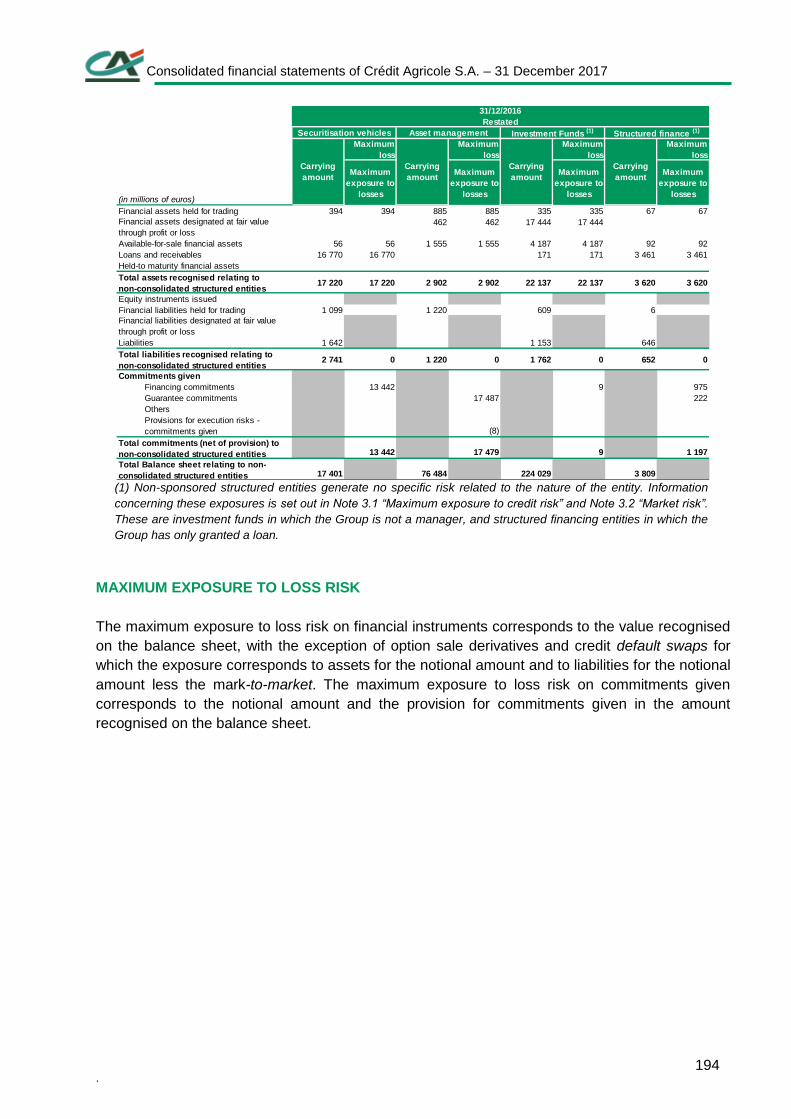
Consolidated financial statements of Crédit Agricole S.A. – 31 December 2017
. 194
(1) Non-sponsored structured entities generate no specific risk related to the nature of the entity. Information
concerning these exposures is set out in Note 3.1 “Maximum exposure to credit risk” and Note 3.2 “Market risk”.
These are investment funds in which the Group is not a manager, and structured financing entities in which the
Group has only granted a loan.
MAXIMUM EXPOSURE TO LOSS RISK
The maximum exposure to loss risk on financial instruments corresponds to the value recognised
on the balance sheet, with the exception of option sale derivatives and credit default swaps for
which the exposure corresponds to assets for the notional amount and to liabilities for the notional
amount less the mark-to-market. The maximum exposure to loss risk on commitments given
corresponds to the notional amount and the provision for commitments given in the amount
recognised on the balance sheet.
Maximum
exposure to
losses
Maximum
exposure to
losses
Maximum
exposure to
losses
Maximum
exposure to
losses
394 394 885 885 335 335 67 67
462 462 17 444 17 444
56 56 1 555 1 555 4 187 4 187 92 92
16 770 16 770 171 171 3 461 3 461
17 220 17 220 2 902 2 902 22 137 22 137 3 620 3 620
1 099 1 220 609 6
1 642 1 153 646
2 741 0 1 220 0 1 762 0 652 0
Financing commitments 13 442 9 975
Guarantee commitments 17 487 222
Others
Provisions for execution risks -
commitments given (8)
13 442 17 479 9 1 197
17 401 76 484 224 029 3 809
Total liabilities recognised relating to
non-consolidated structured entities
Commitments given
Total commitments (net of provision) to
non-consolidated structured entities
Total Balance sheet relating to non-
consolidated structured entities
Total assets recognised relating to
non-consolidated structured entities
Equity instruments issued
Financial liabilities held for trading
Financial liabilities designated at fair value
through profit or loss
Liabilities
Financial assets held for trading
Financial assets designated at fair value
through profit or loss
Available-for-sale financial assets
Loans and receivables
Held-to maturity financial assets
(in millions of euros)
31/12/2016
Restated
Securitisation vehicles Asset management Investment Funds (1) Structured finance (1)
Carrying
amount
Maximum
loss
Carrying
amount
Maximum
loss
Carrying
amount
Maximum
loss
Carrying
amount
Maximum
loss
Consolidated financial statements of Crédit Agricole S.A. – 31 December 2017
. 195
13. Events subsequent to 31 December 2017
13.1 Agreement to acquire the majority of the share capital of Banca
Leonardo
Indosuez Wealth Management signed an agreement to acquire the majority of the share capital of Banca Leonardo, a leading independent wealth management player in Italy.
This purchase is part of Crédit Agricole's Medium-Term Plan "Strategic Ambition 2020", which provides for targeted acquisitions for the Group's wealth management business. This is a milestone for Indosuez Wealth Management, enabling it to strengthen its presence in Europe by integrating an entity that operates in Crédit Agricole Group's second domestic market.
The transaction, which will be subject to approval by the competent supervisory authorities, should be finalised in the first half of 2018.
13.2 Elimination of loyalty dividends
Since its 2011 General Meeting, Crédit Agricole S.A. has had a loyalty dividend mechanism to reward shareholder loyalty, in accordance with the provisions of Article L. 232-14 of the French Commercial Code(1) and Article 31 of its Articles of Association.
As part of its remit, the European Banking Authority (EBA) concluded that the payment of a loyalty dividend by Crédit Agricole S.A. to its shareholders constituted a "preferential distribution" that violated the Capital Requirements Regulation (CRR).
The European Central Bank (ECB) confirmed this view and asked Crédit Agricole S.A. to remove the loyalty dividend clause from its articles of association by September 2018.
Crédit Agricole S.A. will implement the ECB's request, asking the General Meeting of Shareholders scheduled for 16 May 2018 to remove the loyalty dividend clause from the Articles of Association. The General Meeting of Shareholders will be preceded by a Special Meeting, called for 4 April 2018, of the beneficiaries of the loyalty dividend.
A compensatory measure for the beneficiary shareholders is being looked at(2).
(1) Only 6% of ordinary shares are currently eligible for the loyalty dividend, which represented an additional
pay-out of €10 million euros last year.
(2) It should be noted that only holders of Crédit Agricole S.A. shares registered in the name of the same
shareholder without interruption from 31/12/2015 to the date of payment of the dividend for the 2017 financial
year are eligible for the loyalty dividend for the 2017 financial year.