Embed Size (px)
Citation preview
AFWAL-TR-86-4042 5CRYSTALLIZATION AND MORPHOLOGY OF POLY (ARYL ETHER ETHER KETONE)
Satish KumarDavid P. AndersonUniversity of Dayton Research InstituteDayton, Ohio 45469
W. W. AdamsMaterials LaboratoryWright Aeronautical LaboratoriesWright-Patterson AFB Ohio 45433-6533
December 1986
Interim Report for Period June 1983 - July 1985
Approved for Public Release; Distribution is Unlimited
Best Available Copy
MATERIALS LABORATORYAIR FORCE WRIGHT AERONAUTICAL LABORATORIESAIR FORCE SYSTEMS COMMANDWRIGHT-PATTERSON AIR FORCE BASE, OHIO 45433-6533
ROA \ XA \ O!5V
NOTICE
When Government drawings, specifications, or other data are usedfor any purpose other than in connection with a definitely relatedGovernment procurement operation, the United States Government therebyincurs no responsibility nor any obligation whatsoever; and the factthat the Government may have formulated, furnished, or in any waysupplied the said drawings, specifications, or other data, is not to beregarded by implication or otherwise as in any manner licensing theholder or any other person or corporation, or conveying any rights orpermission to manufacture use, or sell any patented invention that mayin any way be related thereto.
This report has been reviewed by the Office of Public Affairs(ASD/PA) and is releasable to the National Technical Information Service(NTIS). At NTIS, it will be available to the general public, includingforeign nationals.
This technical report has been reviewed and is approved forpublication.
W. W. ADAMS R. L. VAN DEUSEN, ChiefProject Scientist Polymer Branch
FOR THE COMMANDER
"GAIL E. EICHELMAN, Assistant DirectorNonmeAt c Mateials Vivision
"If your address has changed, if you wish to be removed from our mailinglist, or if the addressee is no longer employed by your organizationplease notify AFWAL/MLBP, Wright-Patterson AFB OH 45433-6533 to help usmaintain a current mailing list."
Copies of this report should not be returned unless return is requiredby security considerations, contractual obligations, or notice on aspecific document.
UnclassifiedSECURITY CLASSIFICATION OF THIS PAGE
REPORT DOCUMENTATION PAGE'la. REPORT SECURITY CLASSIFICATION lb. RESTRICTIVE MARKINGS
Unclassified N/A
2a. SECURITY CLASSIFICATION AUTHORITY 3. DISTRIBUTION/AVAILABILITY OF REPORT
Approved for public release; distribution2b. DECLASSIFICATION/DOWNGRADING SCHEDULE is unlimited
4. PERFORMING ORGANIZATION REPORT NUMBER(S) 5. MONITORING ORGANIZATION REPORT NUMBER(S)
AFWAL-TR-86-4042
6a. NAME OF PERFORMING ORGANIZATION b. OFFICE SYMBOL 7a. NAME OF MONITORING ORGANIZATION(If applicable)
Materials Laboratory AFWAL/MLBP
6c. ADDRESS (City, State and ZIP Code) 7b. ADDRESS (City, State and ZIP Code)
Wright-Patterson AFB OH 45433-6533
8a. NAME OF FUNDING/SPONSORING Bb. OFFICE SYMBOL 9. PROCUREMENT INSTRUMENT IDENTIFICATION NUMBERORGANIZATION (I f applicable)
8c. ADDRESS (City. State and ZIP Code) 10. SOURCE OF FUNDING NOS.
PROGRAM PROJECT TASK WORK UNITELEMENT NO. NO. NO. NO.
11. TITLE (Include Security Classificationl CIfty S.W za.t on 9 Mo2 0
holoicLi oA Polt(AulZ EtheA Ethe Katone) 61102F 2303 Q3 0712. PERSONAL AUTHOR(S)
Satish Kumar, David P. Anderson, and W. Wade Adams13a. TYPE OF REPORT 13b. TIME COVERED 14. DATE OF REPORT (Yr., Mo., Day) 15. PA E COUNT
Interim FROM Jun 83 TO Jul 85 1986/December 40
16. SUPPLEMENTARY NOTATION
17. COSATI CODES 18. SUBJECT TERMS (Continue on reuerse if neceuary and identify by block number)
FIELD GROUP SUB. GR. PEEK Poly(aryl ether ether ketone) SALS07 04 Spherulite Birefringence SAXS WAXS11 04
19. ABSTRACT (Continue on reverse if neceasar and identify by block number)The morphology of poly(a ry ether ether ketone) (PEEK) has been studied using opticalmicroscopy (at room temperature and at elevated temperatures), small angle lightscattering (Hv and Vv), transmission electron microscopy (bright field, dark field, andselcted area electron diffraction), and wide and small angle x-ray scattering. Asexpected, density of nucleation and hence spherulite size depends on melt temperature.Higher melt temperatures gives rise to low nucleation density and hence large spherulites.The spherulite growth rate is independent of melt temperature and depends oncrystallization temperature. The sign of the spherulite birefringence was determinedbetween room temperature and 320 0C by polarizing microscopy and at room termperature by Vvlight scattering. In this temperature range the spherulites were negatively birefringent..From selected area electron diffraction, the crystal unit cell b-axis is found to alignalong the radius of the spherulite. The crystallographic (110) plane, which makes anangle of 52.7 degrees with the radial b-axis, appears to be the preferred growth plane.Chain polarizability was also calculated using refined atomic coordinates and the bond
20. DISTRIBUTION/AVAILABILITY OF ABSTRACT 21. ABSTRACT SECURITY CLASSIFICATION
UNCLASSIFIED/UNLIMITEDXX SAME AS RPT. El DTIC USERS 0 Unclassified
22a. NAME OF RESPONSIBLE INDIVIDUAL 22b. TELEPHONE NUMBER 22c. OFFICE SYMBOL(Include Area Code)
W. W. Adams (513) 255-9148 AFWAL/MLBP
DD FORM 1473, 83 APR EDITION OF 1 JAN 73 IS OBSOLETE. UnclassifiedSEC6uRITY CLASSIFICATION OF THIS PAGE
Unclassified
SECURITY CLASSIFICATION OF THIS PAGE
11. Poly(aryl ether ether ketone)
19. polarizabilities. PEEK crystals were more stable in the electron beam, by about anorder of magnitude, than polyethylene.
Unclassi f iedII SECURITY CLASSIFICATION OF THIS PAGE
FOREWORD
This report was prepared by the Polymer Branch of the Nonmetallic
Materials Division and The University of Dayton Research Tnstitute (UDIT)
under contract F33615-84-C-5020. The work was initiated under Project 2303,
"Research to Define the Structure Property Relationships," Task 2303Q3, Work
Unit Directive 2303Q307, "Structural Resins." Dr. Thaddeus F. Helminialt
served as the AF`WAL/M1L Work Unit Scientist. Co-auithors were: Satish Kumar
and Davi.d P. Anderson (UDRI) and V. W. Adams (AFWAL/MLBP).
The atomic coordinates in the repeat unit were made available by
Professor A. V. Fratini and the computer program for the calculation of chain
polarizabilitles was written by Dr. P. T. Bapu of the University of Dayton.
The authors are grateful for useful comments on the manuscript from Professor
E. L. Thomas of the University of Massachusetts.
This report covers research conducted from June 1983 to July 1985.
1. INTRODUCTION
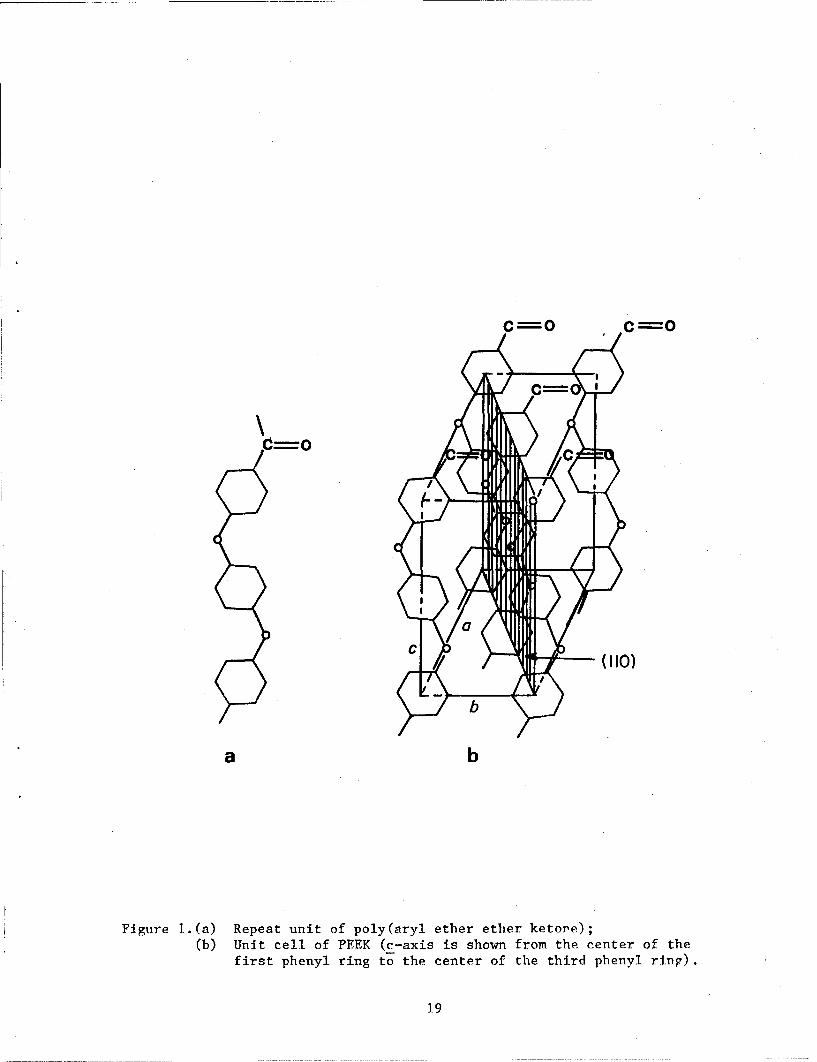
Poly(aryl ether ether ketone) (PEEK), repeat unit shown in figure la*,
crystallizes into an orthohombic unit cell structure (ref. 1-3). The
synthesis of this family of polymers is described by Attwood et al. (ref. 4).
Crystallization behavior and spherulitic growth have been studied by Blundell
and Osborn (ref. 5), and PEEK was shown to behave much in the same way as
poly(ethylene terephthalate). The morphology and solution properties of PEEK
have been the subject of recent studies (ref. 6-8).
The orthorhombic unit cell of PEEK has values of a, b, and c which are
reported to be in the range of 7.75-7.78A, 5.89-5.92A, and 9.88-10.06 A
respectively. The unit cell contains two chains each with two-thirds of the
repeat unit. However a unit cell with two repeat units has recently been
considered (ref. 9). The crystal structure of PEEK is similar to the
reported (ref. 10) crystal structure of poly(p-phenylene oxide), and the
ether and carbonyl units are considered to be cryrtallographically equivalent
(ref. 3). The crystal structure is shown in figure lb.
PEEK J.s a candidate as a thermoplastic to be used in composites (ref.
11), the properties of which will depend on processing history and
morphology. Therefore the understanding of morphology nrid its dependence on
processing parameters is important. WP have studied the crystallization
behavior of PEEK from the melt in a poIari7ing microscope. The morphology of
PEEK spberuiites has been studied using light-scattering and
x-ray-scattering, optical microscopy, as well as transmission electron
microscopy (dark field, bright field, and selected area electron
diffraction). The results of these Investigations are reported herein.
*Figures and tables are located at end of report.
2. EXPERIMENTAL METHODS
Studies reported in this paper were conducted on commercially available
PEEK received from Imperial Chemical Industries.
Crystallization studies were done in a metallurgical hot stage on a Leitz
optical microscope. A very small amount of PEEK resin (few milligrams) is
sandwiched between two circular glass plates of about half-a-centimeter in
diameter. The hot stage is then heated to the desired melt temperature
(between 380 C and 420 C) above the melting point of PEEK which is reported
to he in the range of 335 C to 350 C. After 5 minutes at the melt
temperature the hot stage is set to the crystall1zatlon temperature (300 C or
320 C) and the hot stage containing the specimen reaches this temperature
in approximately 30 seconds. Spherulite growth was recorded at the
crystallization temperature as a function of time, using crossed polars, on
Kodak VRIO00 35 mm film.
Wide-angle x-ray-scattering (WAXS), transmission electron microscopy
(TEN), and small-angle x-ray-scattering (SAXS) were performed on the samples
prepared in the following way. A mold containing the resin was placed In a
compression molding press preheated to 400 C, and nominal pressure was
applied. A thermocouple was in contact with the resin. In one case, 5
minutes after the thermocouple reached 400 C the press heaters were turned
off. The specimen reached room temperature in about 3 hours. This specimen
is referred to as slow-cooled (SC). In another case, 5 minutes after the
thermocouple reached 400 C, the mold containing the resin was removed from
the hot press and kept in a second press which was at room temperature. This
specimen came to room temperature in a few minutes and .s referred to as
fast-cooled (FC). Similar samples were also made from 420 C.
WAXS was done using the symmetric transmission geometry on a four-cirrle
automated Picker diffractometer. Lorentz, polarization, Compton-scattering,
and absorption corrections were applied. Correction for ingtruimental line
broadening for the crystal size measurement was done using crystalline
hexamethylenetetramine. For TEM, thin sections were prepared by using A
diamond knife to ultramicrotome epoxy-embedded blocks of PEEV at room
temperature. Transmission electron microscopy was done on a JEOL 100CX at
100 KV. SAXS was done on a modified Statton (Warhus) camera with pin-hole
collimation, camera-to-film distance of 72cm, and CuKa radiation. No
corrections were applied to the SAXS data.
3. RESULTS AND DISCUSSION
3.1 Nucleation and growth
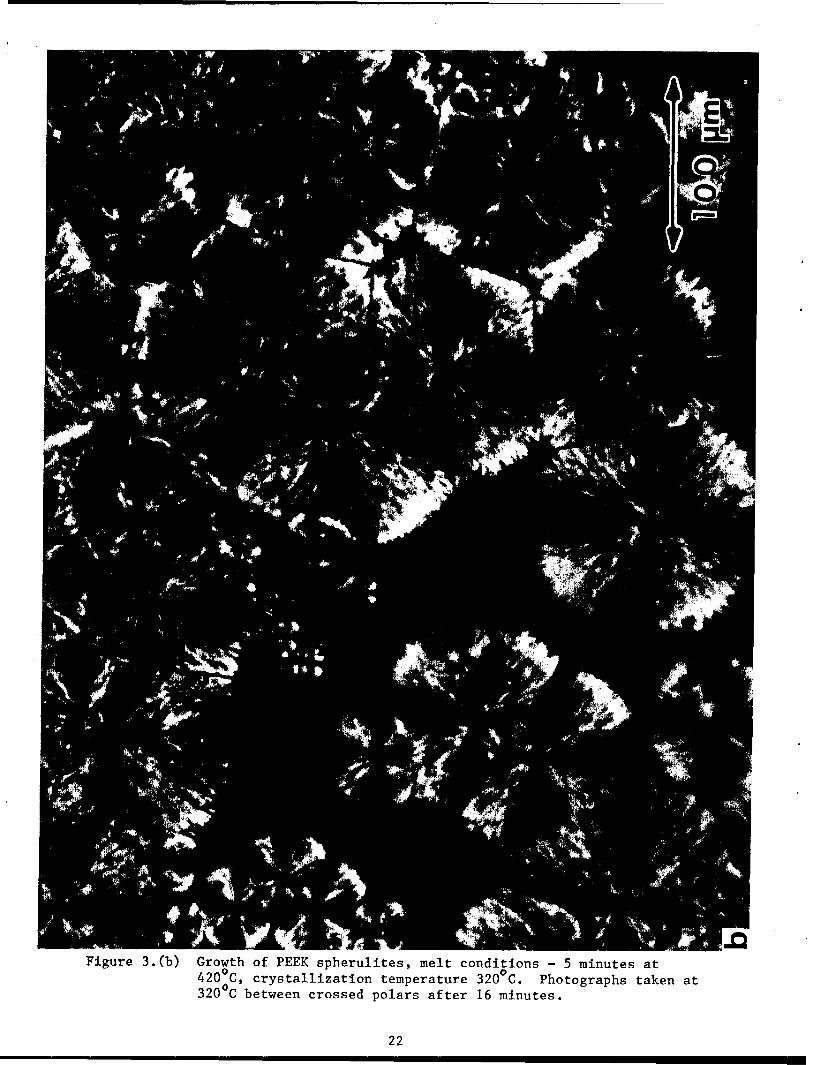
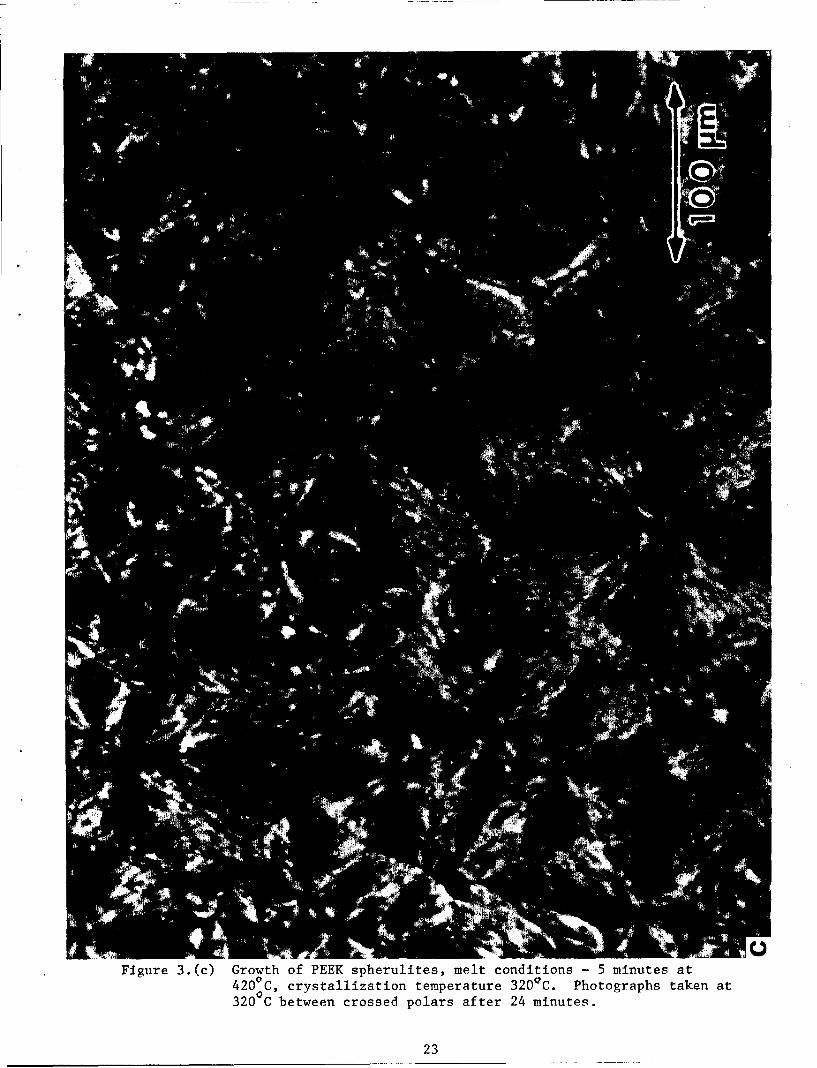
Isothermal crystallization of PEEK at 320 C, from the melt at 380 C and
at 420 C, is shown in figures 2 and 3 respectively. In figure 2 only the
completion of spherulite growth is shown. This is because nucleation density
was high in the specimens crystallized from lower melt temperatures, therefore
spheruiites growth is shown. This Is because nucleation density was high in
the specimens crystallized from lower melt temperatures, therefore
spherulites filled the volume rather quickly and spherulitic growth could not
be monitored visually. However, such growth can be monitored with a
state-of-the-art, automated small-angie light-scattering apparatus (ref. 12).
Figure 3 shows crystallization from higher melt temperature, with lower
nucleation density.
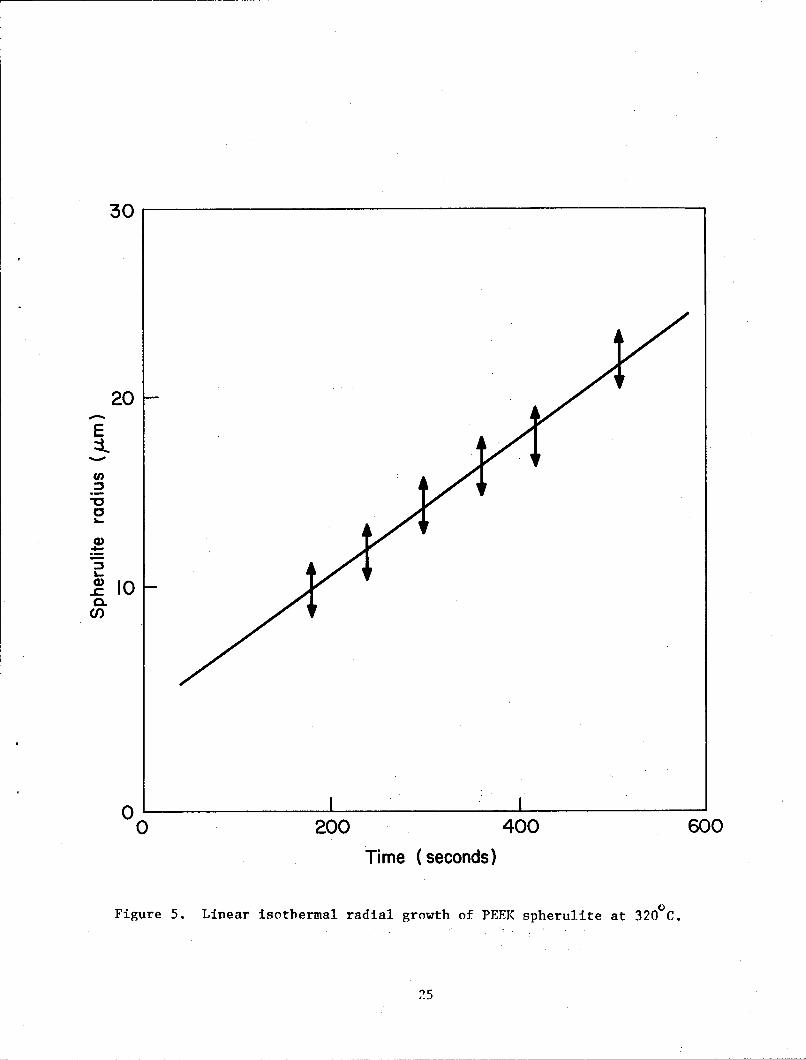
Spherulitic growth rate was monitored at crystallization temperatures of
300 C and 320 C from a melt of 420 C by measuring the spherulite radii from
3
optical micrographs taken at successive intervals. The radius can also b'
calculated from small-angle light-scattering (Hv) using the following
equation
47[(R /X) Sin (0 /2)=4.1 (1)s max
where Omax is the angle at maximum intensity, Xis the wavelength of light,
and Rs is the radius of the spherulite. For two-dimensional spherulites
(ref. 13) the constant in equation 1 will be 3.8 instead of 4.1. Typical Iv
and Vv light-scattering patterns of PEEK at room temperature are given In
figure 4. Spherulite sizes from optical micrographs and from SALS were
identical within the limits of experimental error. Average spherulite
radius, measured from optical micrographs up to the point where they start
impinging on each other, has been plotted in figure 5 for a crystallization
temperature of 320 C. The growth is linear and the average growth rates were
0.045 m/sec at 320 C and 0.32 m/sec at 300 C. Blundell and Osborn have
reported the maximum crystallization rate to be around 230 C as studied from
differential scanning calorimetery, with some dependence on heating rate.
Qualitatively our spherullte growth data is in agreement with this
observation in that we observe a higher growth rate at 300 C than at 320 C.
However, quantitatively the growth rate observed by us at 300 C corresponds
to that between 260 C and 270 C by Blundell and Osborn (the values of C in
table 3 of reference 5), and extrapolation of their datn to 300 C would give
a lower growth rate than what we hnve observed. This may occur for several.
1-easons: (i) differences In molecular weight, (ii secondary crystallzaition
which will be observed in DSC but not in optical micrographs; and
4
(iii) Blundell and Osborn calculated growth rate assuming that the peal?
crystallization time, t , corresponds to the point where the spherulitesC
impinge. Peak crystallization time would be analogous to the crystallization
time for figure 3(c) of this paper, which is an overestimation, because the
majority of the spherulites have stopped growing much earlier (figure 3(b).)
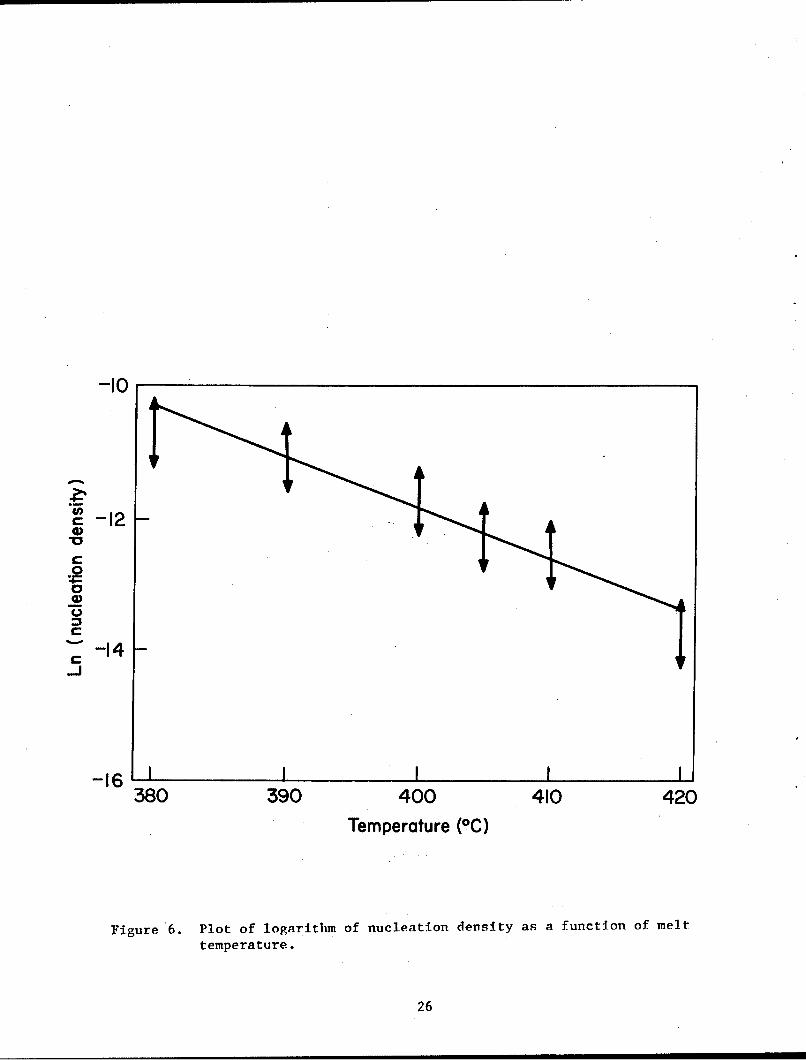
A plot of the logarithm of nucleation density (number of spherulites per
unit volume) as a function of melt temperature is given in figure 6. Within
the temperature range of the experiment nucleation density seems to fall off
exponentially with the temperature increase (logarithm of nucleation density
as a function of temperature is linear within the limits of experimental
error). Observation of the change in nucleation density in PEEK, as a
function of the temperature to which the melt was heated and the dwell time
at the high temperature, is by no means unique and has been reported for a
number of polymers (ref. 14). Possible reasons for the change in nucleation
density as a function of the melt temperature are discussed below:
(i). The melting point of PEEK has been reported to be 335 C (ref. 4, 5) and
350 C (ref. 15). However, the thermodynamic melting temperature, at which
perfect crystals of infinite size melt, has been estimated (ref. 4) to be 395
C. This leads to the possibility of the presence of some unmelted crystals
at a temperature higher than the normally measured melting point.
Self-nucleation by residual high molecular weight crystals can also possible
account for the above observation (ref. 14). The degree of self-nucleation
(number of embryos) decreases with increasing temperature, and hence results
in larger spherulite size from higher melt temperatures.
5
(ii.). Tnp,,rties in the specimen can lead to nucleation. A decrease in
nucleation density has been observed in purifying the material (ref. 7). The
purification was done by dissolving the material in sulfuric acid and
reprecipitating it. The problem of sulfonation of PEEK during treatment in
sulfuric acid also remains. In addition to the impurities which were removed
In acid the possibility of the presence of some other species of the
poly(aryl-ether-ketone) family (one of the species is reported (ref. 4) to
have a melting point of 416 C) cannot be excluded as a result of impuritie s
in the starting materials used in the synthesis. Since ether and ketone
units are crystallographically equivalent (ref. 3) certain different species
of the poly(aryl-ether-ketone) family may be able to crystallize together.
One nucleating crystal in one hundred billion crystals of average dimension
of 100 A, in a 50-percent-crystalline medium, will produce an average
spherulite radius of 36 pm.
Since the melting and crystallization studies reported in this paper are
done at rather high temperatures, it is only natural that the effect of these
conditions on polymer degradation be considered. The large spherulite size
has in fact been attributed to degradation from high melt temperatures (ref.
7). Therefore the effect of air at high temperatures must be considered.
Viscosity measurements (ref. 16) on PEEK in the presence of air in the
temperature range of 350 C to 380 C, showed an increase in viscosity with
increasing dwell time, which was attributed to crosslinking. Chain extension
may also be a possible cause for viscosity Increase, but this is likely to be
very limited because of the restricted mobility of the reactive groups.
Degradation will result in a decrease in viscosity. Chain crosslinking or
6
chain extension would only result in Inhibiting crystallization. In our
optical microscope studies the specimen has been heated between two glass
plates with virtually no air gap. Melting and recrystallization over several
cycles, melt time held to five minutes, resulted in reproducible spherulite
size and growth rate although nucleation did not occur in the same positions
after each melting. Also the PEEK resin between the microscope slides did
not discolor on repeated melting except at the very edge. Therefore we
believe that for this study significant degradation did not occur.
3.2 Birefringence
The sign of the spherulite birefringence can be determined using a
polarizing microscope or from Vv light-scattering (ref. 13). A Vv
light-scattering pattern of a PEEK sample, whose volume is completely filled
with spherulites as observed in the polarizing microscope at room
temperature, is given in figure 4b. This scattering pattern is strongly
oriented along the polarization direction indicating that the difference
between the radial and tangential polarizabilities is greater than the
difference between either one of them and the effective polari7ability of the
surroundings of the spherulite. The surroundings of the spherulite consists
of other spherulites since the whole volume is filled with them, and hence
the polarizability of the surroundings will be the average of the radial and
tangential polarizability. From this one can conclude that tangential
polarizability is larger than the radial polarizability.
The spherulite birefringence sign was also determined, from room
temperature to 320 C, using a polarizing microscope and a wave
7
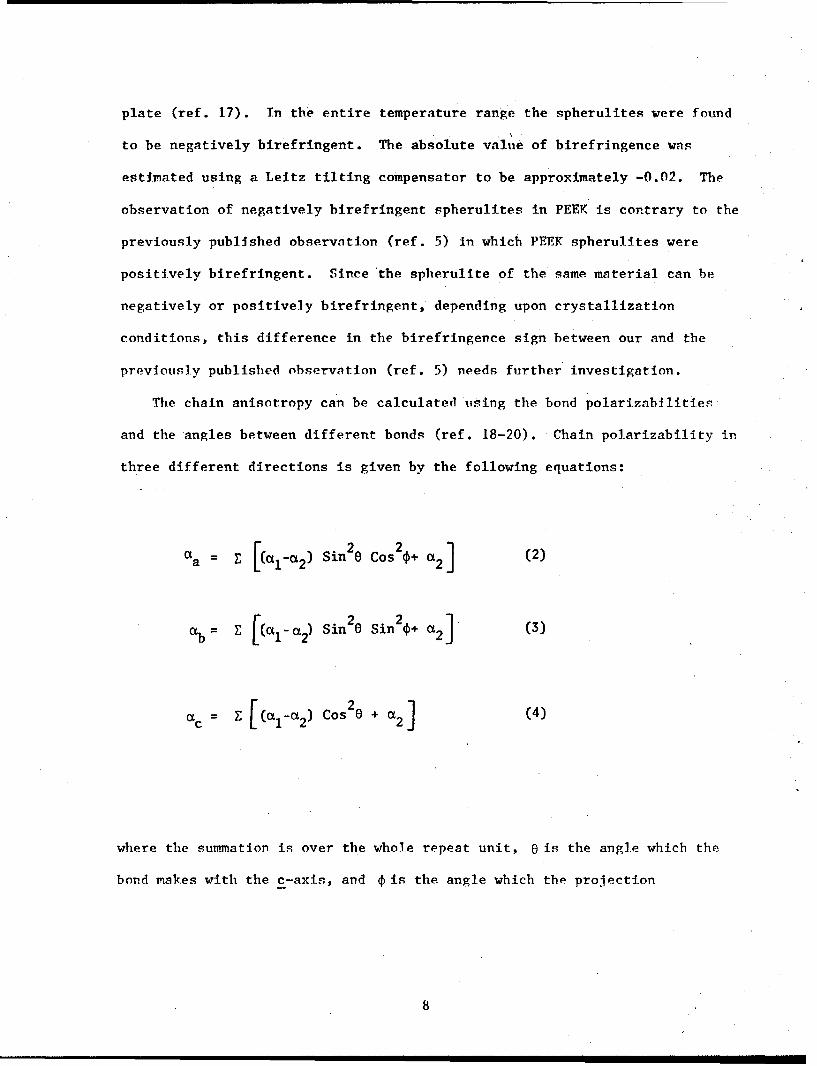
plate (ref. 17). Tn the entire temperature range the spherulites were found
to be negatively birefringent. The absolute value of birefringence was
estimated using a Leitz tilting compensator to be approximately -0.02. The
observation of negatively birefringent spherulites in PEEK is contrary to the
previously published observation (ref. 5) in which PEEK spherulites were
positively birefringent. Since the spherulite of the same material can be
negatively or positively birefringent, depending upon crystallization
conditions, this difference in the birefringence sign between our and the
previously published observation (ref. 5) needs further investigation.
The chain anisotropy can be calculated using the bond polarizabilities
and the angles between different bonds (ref. 18-20). Chain polarizability in
three different directions is given by the following equations:
a = E [(a1S-2 Sin2e Cos 2€ a2 ] (2)
a b = E [cal- a2) i 2e Si 2ý a2] (3)
ac = ( [ct1-a2 Cos 2e + a2 ] (4)
where the summation is over the whole repeat unit, 0 is the angle which the
bond makes with the c-axis, and @ is the angle which the projection
; ; i i i8
of the bond on the a-b plane makes with the a-axis. a I and. a 2 are the bond
polarizabilities parallel and perpendicular to the bond respectively. The
bond polarizability values are listed in table 1.
The PEEK chain coordinates have been refined in our laboratory (ref. 21).
Using these refined coordinates the following values of polarizabilities were
calculated.
Ot 3.38 X 10⁻²³ cm3
a
ct = 2.31 X 1.0 cm 3b
-23 3a = 4. 2 X 10 cm 3
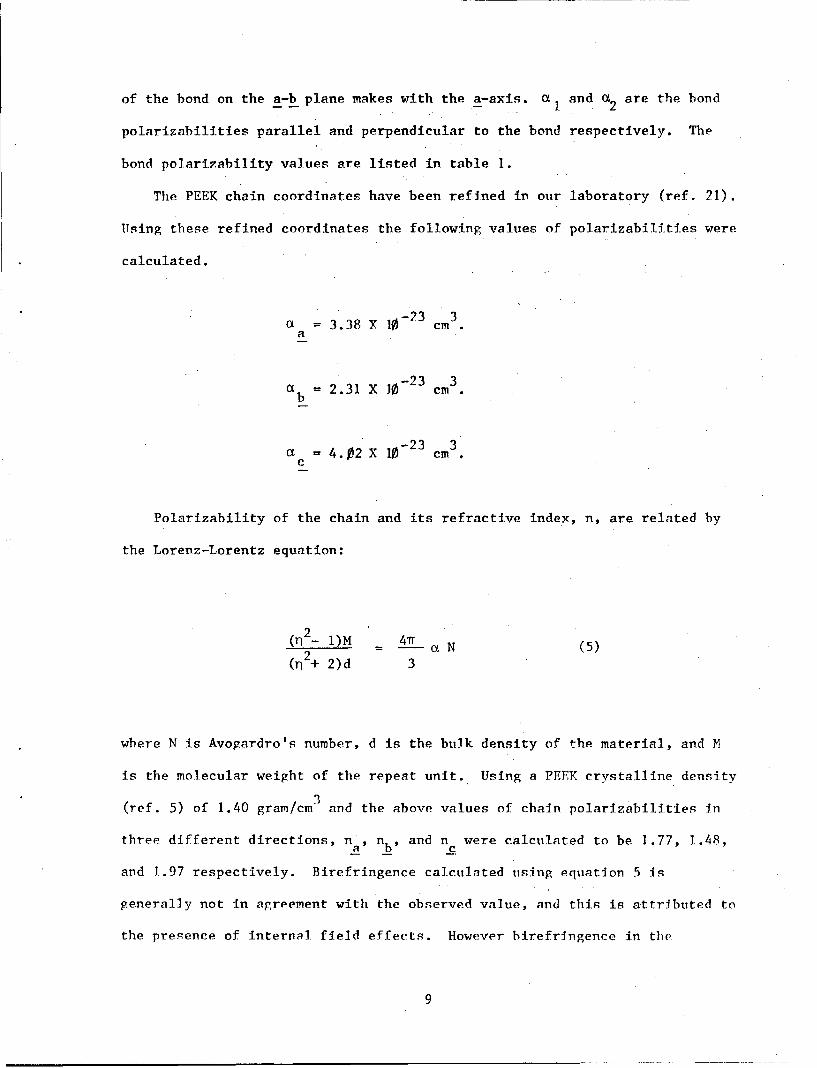
Polarizability of the chain and its refractive index, n, are related by
the Lorenz-Lorentz equation:
( 2_ -)M a•N (5)
(n2+ 2)d 3
where N is Avogardro's number, d is the bulk density of the material, and M
is the molecular weight of the repeat unit. Using a PEEK crystalline density
(ref. 5) of 1.40 gram/cm3 and the above values of chain polarizabilities in
three different directions, na, nb9 and n were calculated to be 1.77, 1.48,
and 1..97 respectively. Birefringence calculated using equation 5 is
generally not in agreement with the observed value, and this is attributed to
the presence of internal, field effects. However birefringence in the
9
spherulite and in a fiber was calculated using the above refractive indices.
As will be noted in a later section, the b crystal axis is radial in the PEEK
spherulite. Therefore the birefringence in the spherulite will be given by
nb-((na+nc)/ 2 ), or nspherulite= -0.39, which is about twenty times larger
than the observed value. Such a difference In the observed and calculated
birefringence has been attributed to Imperfect crystalline orientation, the
presence of amorphous regions, and form birefringence (ref. 13).
The birefringence in the fiber will be given by n c-((n a+nb )/2) and for
the obove refractive indices its value is 0.34. Experimental measurement of
birefringence on highly oriented PEEK fibers gave birefrIngence values of up
to 0.28. Because of the presence of less than imperfect orientation in the
fiber and the presence of amorphous regions, the true birefringence of the
PEEK fiber would be higher than 0.28. This indicates that the calculated
birefringence of PEEK fiber may be close to the true value.
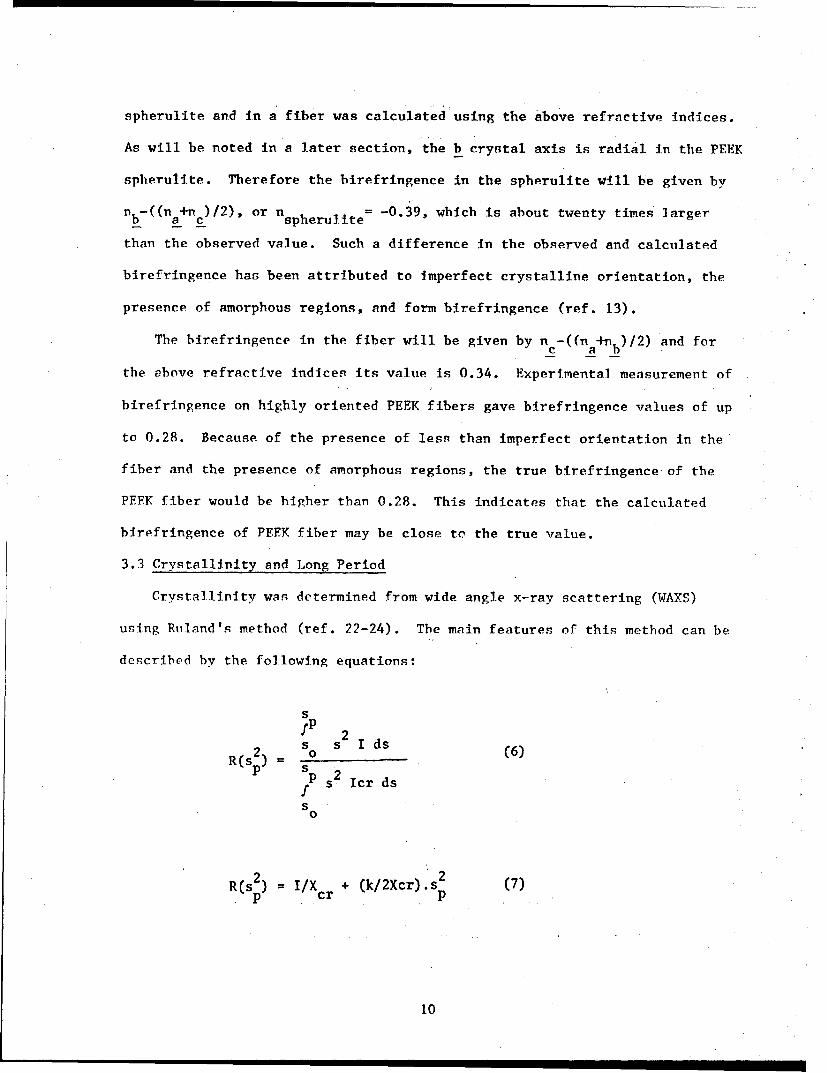
3.3 Crystallinity and Long Period
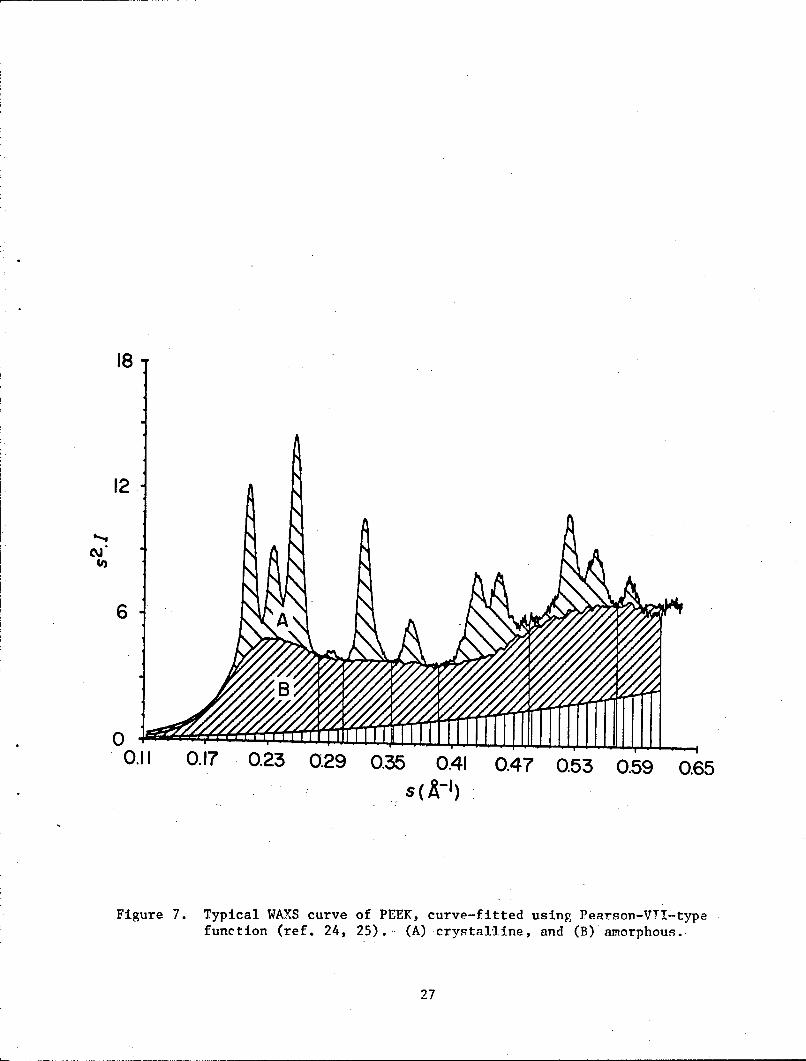
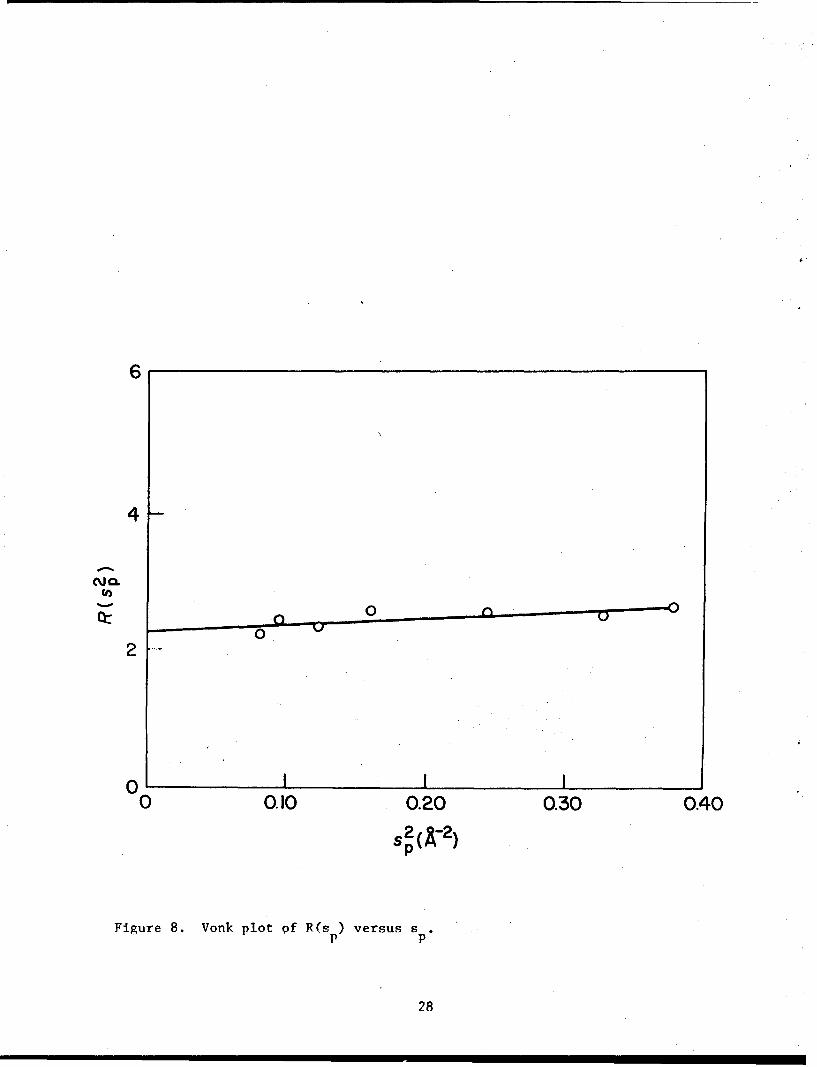
Crystallinity was determined from wide angle x-ray scattering (WAXS)
using Ruland's method (ref. 22-24). The main features of this method can be
described by the following equations:
s
fP 22 = so s I ds (6)
R P 2s 2 Icr ds
S0
R(S2 = I/X + ik/2Xcr).S 2 (7)
10
where s is 2sinO/X, and 0 is half the scattering angle and A the wavelength
of radiation used. s and s represent the lower and upper limits of thep
scattering range. I and I are the total and crystalline intensitiescr
respectively. X is the degree of crystallinity and k is the disordercr
parameter. A typical plot of s21 versus s is given in figure 7. An
amorphous PEEK diffraction scan was fit to the intensities between
crystalline peaks (25), which is also shown in the sbaded areas in figure 7.
2 2From this curve R(s ) was calculated for different values of s . A plot of
p p
R(s 2) as a function of s2 is given in figure 8, which is approximately ap p
straight line. From the slope and intercept of this line the values of
crystallinity and disorder parameters were obtained using equation 7.
Parameters obtained from WAXS and SAXS are listed In table 2 for resin
samples slow cooled from 400 and 420 C, and fast-cooled from 400 C. From
this table it is noted that, as expected, the fast-cooled sample has both
lower crystallinity and higher crystalline disorder compared to a slow-cooled
sample from the same melt temperature. For slow cooled samples,
crystallization from a higher melt temperature gives rise to a slightly lower
value of crystallinity and higher crystalline disorder. The crystallinity
values of 36% to 43% are in the upper range of the reported (ref. 5) PEEK
crystallinity values (0% to 45%). However, it must be noted that the
crystallinity as determined by Ruland's method (ref. 22) generally gives
higher values than obtained from simple intensity ratios since the values
from Rulnnd's method includes disorder effects.
Approximate crystallite sizes were determined from the line breadth of
the (211) reflection by Wilson's variance method (ref. 26,27). The
11
contribution to the line breadth from disorder was ignored, and hence the
crystal size reported in this paper represents the lower bound. The (211)
reflection was chosen because it did not overlap other reflections. The size
calculated for the sample slow-cooled from 420 C was larger than the size
calculated for the samp]e cooled from 400 C despite the higher disorder In
the sample from the higher temperature which would tend to decrease the
calculated size. The fast-cooled sample shows an even smaller crystallite
size. Approximate crystallite sizes were also calculated from the
line-broadening of the (110) and (200) reflections, which in turn were
obtained by curve-fitting the data. In the case of the (110) and (200)
reflection the subtraction of the instrumental line broadening was done
assuming gaussian profiles (the observed broadening is the sum of the squares
of the specimen and instrumental broadening). The instrumental, line profile
was indeed gaussian, however the specimen profiles were best fitted with a
Pearson-type VII function. Again the sample slow-cooled from 420 C shows
larger crystallite sizes than the other two samples. In this analysis no
significant differences between the fast and slow-cooled samples from 400 C
can be detected.
The unit cell parameters calculated from the positions of the reflections
obtained during the curve-fitting operation are also reported in table 2.
From these values it is noted that the fast-cooled sample has larger values
of a and c axes compared to the slow-cooled sample is perhaps due to the
chain-parking disorder in the a and c axes directions.
12
While several differences were observed in the WAXD analysis, a greater
range of process conditions will have to be investigated to fully understand
the crystalline behavior of this materfal.
3.4 Electron Radiation Damage
Different polymers are damaged in the electron beam to varying degrees
(ref. 28-31). In order to obtain useful information on the morphology of
polymers using electron microscopy, it is important that the polymer not be
exposed to such levels of electron radiation dose that the features of
interest are destroyed or altered significantly. A systematic study was
therefore undertaken (ref. 31) to quantitatively determine the dose required to
damage different polymers to the point where the intensity of diffraction is
reduced by a factor of l/e. This dose level is generally termed as D* and
its value for several polymers has previously been reported (ref. 28). The
D* value(3i) for the (110) reflection of PEEK, at a dose rate of 10-3 amp/cm2
is approximately 3x]- Coulomb/cr2. This is about an order of magnitude
greater than the D* value for polyethylene. The higher resistance of PEEK in
the electron beam rakes it relatively easier to study in the electron
microscope.
3.5 Radial and Growth Direction
Figure 9 shows an electron micrograph from a thin section microtomed from
a specimen fast-cooled from the melt at 400 C. In this figure, as observed
from selected area electron diffraction, regions marked A were am6rphous and
regions marked B were semicrystalline. The chatter produced due to
microtoming is largely responsible for contrast in the A regions. The B
regions are spherulites, which could not grow further due to fast-cooling.
13
In this specimen it was observed that a fraction of spberulites have grown to
their fullest extent. From this it can be inferred that for complete
crystallization from higher melt temperatures relatively slow-cooling rates
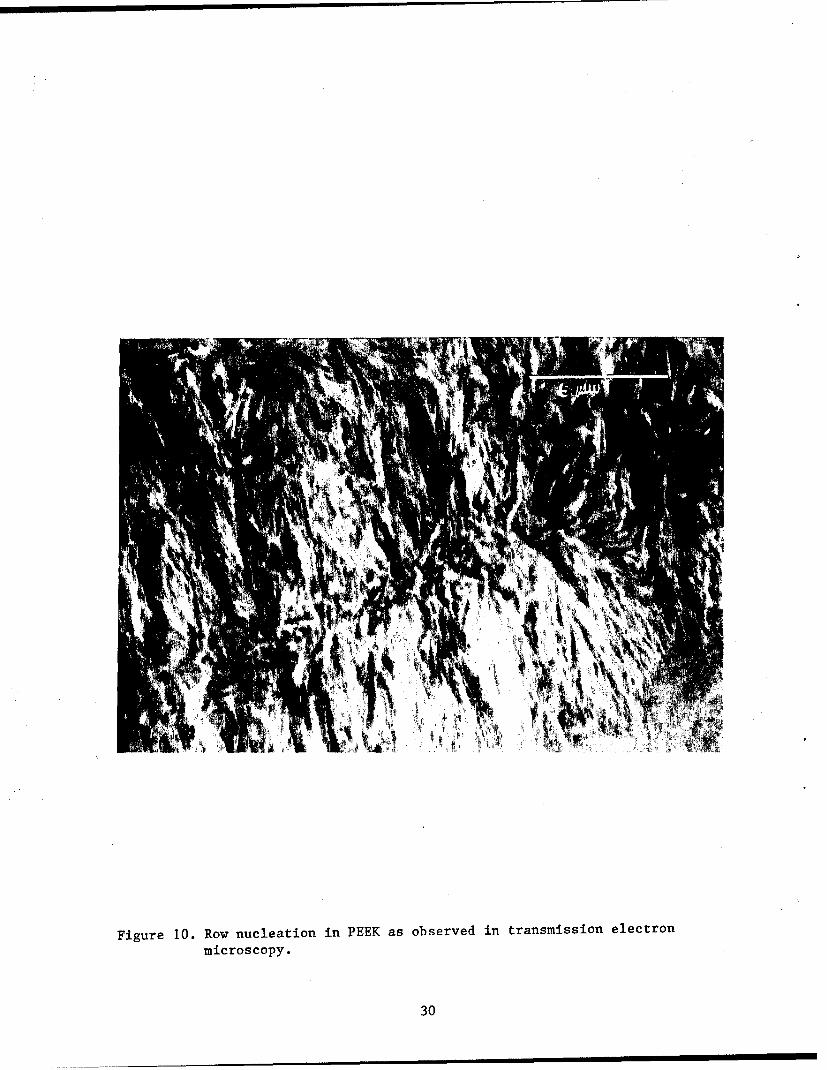
would be required. In the fast cooled sample row nucleation was also
observed as shown in figure 10. Such nucleation has also been observed in
isotactic polypropylene (ref. 32).
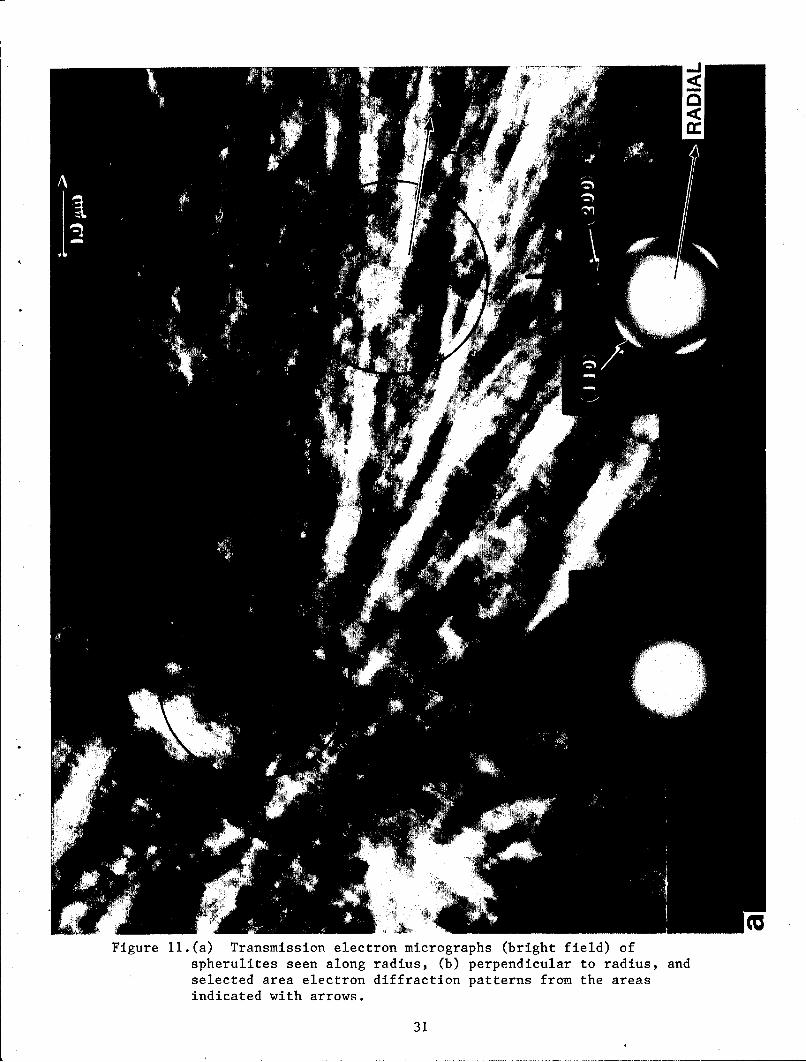
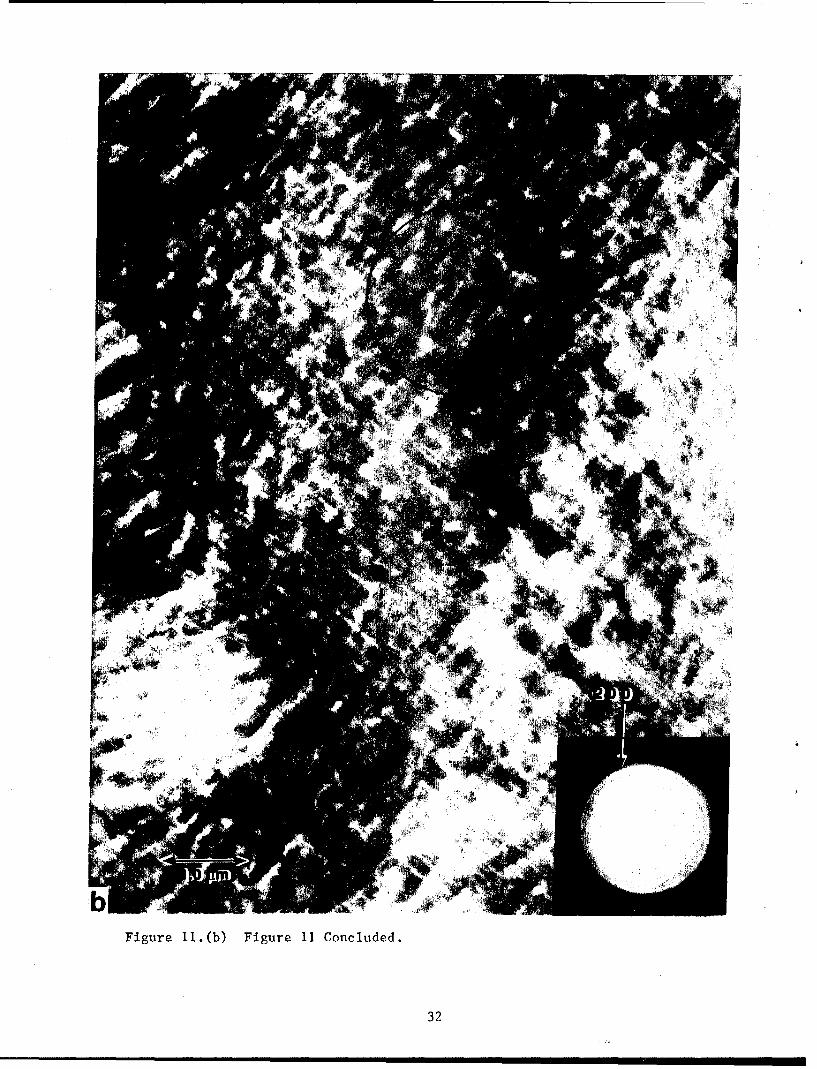
Transmission electron micrographs of a section of a spherulite in two
different directions in a sample slow-cooled from the melt at 400 C are shown
in figures Ila and b. From photographs taken on a large number of sections
it was ascertained that the section in figure Ila is a diametrical section
and the radial direction is in the plans of the paper. Selected area
electron diffraction patterns taken from different regions are shown in
figures Ila and hib; the corresponding regions are indicated by black arrows.
The two diffraction patterns In figure lla are similar except that the
diffraction pattern from the center of the spherulite is less oriented as
expected. The (110) reflection is the strongest in figure 11(a) and is
missing in figure 11(b). From the orientation of the diffraction pattern in
figure Ila it can be seen that the crystal unit.cell b-axis is radial and
hence the a and c axes are tangential.
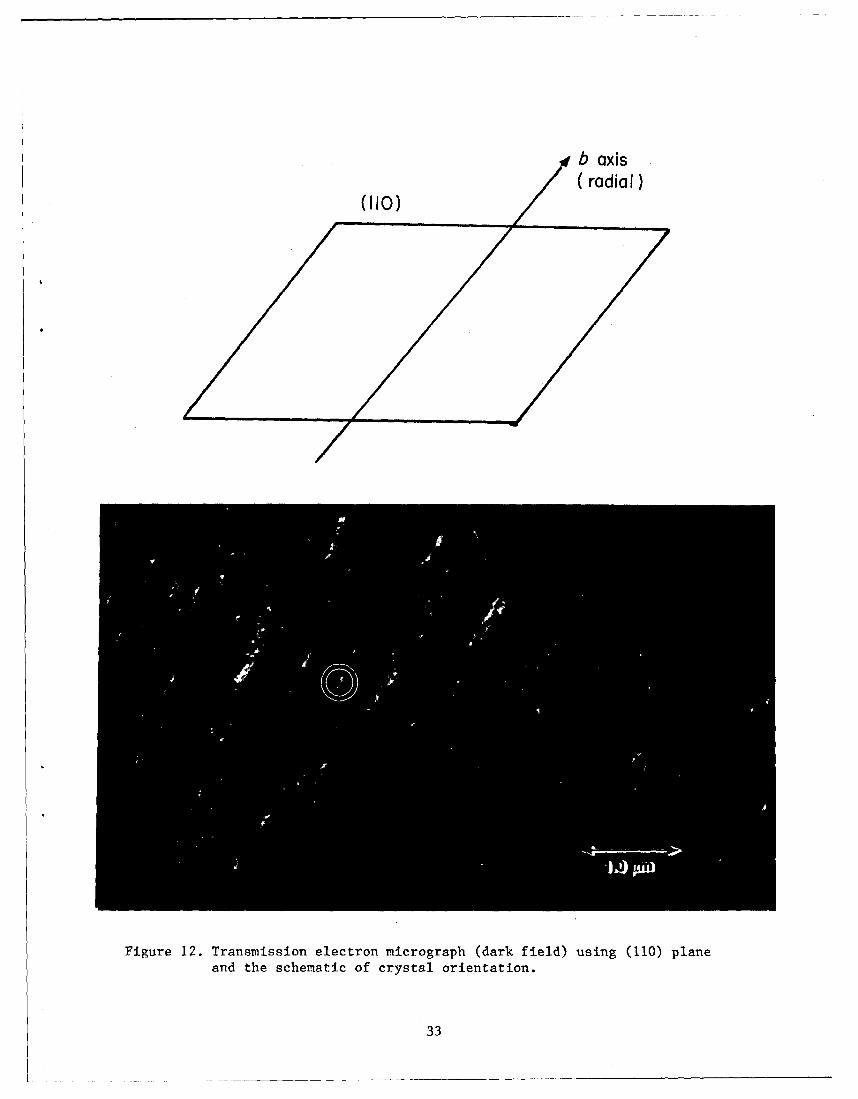
The growth direction of a spherulite is along its radius, and therefore
one would expect that the preferred growth plane in PEEK spberulites would be
an (010) plane. Information regarding the preferred growth plane can be
obtained from dark field electron microscopy. A dark field electron
micrograph using the (110) reflection is shown I.n figure 12. Careful
examination of the dark field electron micrographs (see the cl.rcled region in
14
figure 12) reveals that the growth faces of the crystallites and the radial
direction of the spherullte are not perpendicular to each other. From a
large number of these crystals where the growth face was distinct, the angle
between the radial direction and growth face was measured to be 55+8 degrees.
The calculated angle between the b axis and (110) plane is 52.7 degrees.
This observation is suggestive of the fact that (110) is probably the
preferred crystal growth plane. Following the dictates of the
Bravais-Friedel law (ref. 33) the (110) plane was in fact assumed (ref. 5) to
be the preferred growth plane In PEEK. Reported work on PEEK single crystals
(ref. 6) also suggests (110) as the preferred growth plane.
One of the problems which one encounters in the electron microscopy of
ultramicrotomed sections of polymers is the deformation introduced in the
process of microtoming. Since we were using dark field micrographs obtained
on ultramicrotomed sections to determine the preferred growth plane, the
consideration of crystal orientation smearing due to ultramicrotoming was
particularly important. Selected area electron diffraction on a large number
of spherulites with different cutting directions indicated that the b
crystal axis was always radial and was independent of microtoming direction
suggesting that no significant orientation smearing took place.
CONCLUSIONS
Crystallization of PEEK from the melt is sensitive to the melt
temperature, with significant differences observed in the nucleation
density, but only small differences in other parameters such as degree of
crystallinity, crystallite size, disorder, and long period. Samples
crystallized from higher melt temperature have a larger disorder parameter
15
and larger crystals. The nucleation density decreases with higher melt
temperature, thereby resulting in larger spherulites. Spherullte growth was
faster at 300 C compared to the growth rate at 320 C. PEEK crystallized from
the melt was found to have negatively birefringent spherulites. However,
since spherulites of the same material can be positive or negatively
birefringent and since positively blrefringent spherulites In PEEK have
previously been reported, this aspect needs further work in order to resolve
the question that there indeed are two different types of spherulites in
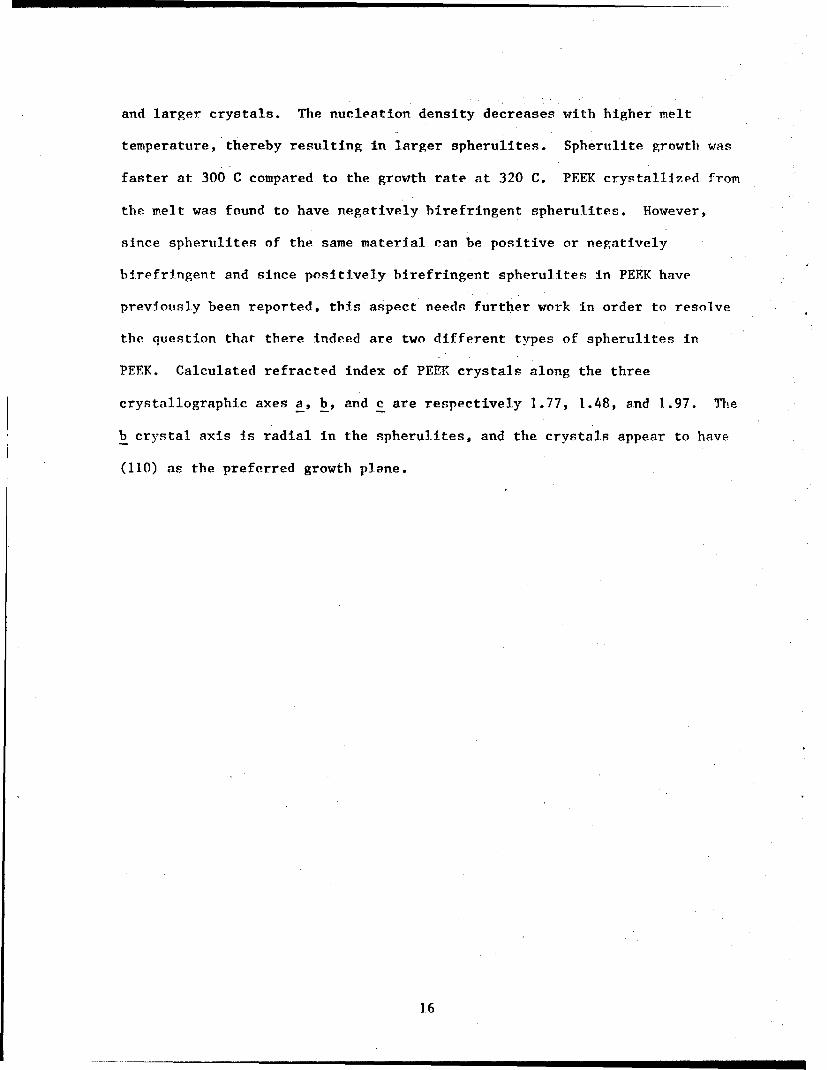
PEEK. Calculated refracted index of PEEK crystals along the three
crystallographic axes a, b, and c are respectively 1.77, 1.48, and 1.97. The
bcrystal axis Is radial in the spherulites, and the crystals appear to have
(110) as the preferred growth plane.
16
REFERENCES
1. P. C. Dawson and D. J. Blundell, Polymer, 21, 577 (1980).
2. D. R. Rueda, F. Ania, A. Richardson, I. M. Ward, and P. J. B. Calleja,Polymer Communications, 24, 258 (1983).
3. J. N. Hay, D. J. Kemmish, J. I. Langford, and A. I. M. Rae, Polymer, 25,175 (1984).
4. T. F. Attwood, P. C. Dawson, J. L. Freeman, L. R. J. Hoy, J. B. Rose, PndP. A. Staniland, Polymer, 22, 1096 (1981).
5. D. J. Blundell and B. N. Osborn, Polymer, 24, 953 (1983).
6. A. J. Lovinger and D. D. Davis, Bulletin of the American PhysicalSociety, 30, 249 (March 1985), and the presentation in March APS meeting.
7. P. Cebe, S. D. Hong, S. Y. Chung, A. Gupta, and A. Yavourian ir Bulletinof the American Physical Society, 30, pages 248, 488, 497 (March 1985).
8. I. T. Bishop, F. E. Karasz, P. S. Russo, and K. H. Langley,Macromolecules, 18, 86 (1985).
9. N. T. Wakelyn, Polymer Communications, 25, 207 (1984).
10. J. Boon and E. P. Magre, Die Makromolekulare Chemie, 1.26, 130 (1969).
11. J. T. Hartness and R. Y. Kim, 29th National SAMPE Symposium, 29, 459 and765 (1984).
12. R. J. Tabar, R. S. Stein, and M. Long, J. Polym, Sci. (Phys.), 20, 2041(1982).
13. R. S. Stein and M. B. Rhodes, J. Applied Physics, 31, 1873 (1960);American Physical Society short course on "Scattering Methods in PolymerScience," at Chicago (March 1979), coordinated by R. S. Stein.
14. B. Wunderlich, "Macromolecular Physics, Vol II - Crystal Nucleation,Growth, Annealing," Academic Press, p. 52 (1976), and references cited onpage 53.
15. R. N. Johnson, A. G. Fahrnham, R. A. Clendinning, U. P. Hale, and C. F.MerrIan, J. Polymer Sci. (Chem. ed.), 5, 2375 (1967).
16. Interim technical report no. 3 from Boeing Co. to AFWAL/M.,BC onThermoplastic Composite Technology Development, p. 16-18, May 1984.
17. F. M. Chamot and C. W. Mason, "Handbook of Chemical Microscopy," Vol I,John Wiley & Sons, p. 300 (1958).
17
18. C. W. Bunn, Chemical Crystallography, Oxford, London, 312 (1961).
19. J. Furukawa, S. Yamashita, T. Kotani, and M. Kawashima, J. Appl. PolymerSci., 13, 2527 (1969).
20. E. J. Roche, R. S. Stein, and E. L. Thomas, J. Polymer Sci. (Phys ed.),18, 1145 (1980).
21. A. Fratini, E. Cross, R. Whitaker, and W. W. Adams. Submitted toPolymer.
22. W. Rudland, Acta Crystallographica, 14, 1180 (1961).
23. C. G. Vonk, J. Appl. Crystallography, 6, 148 (1973).
24. D. P. Anderson, AFWAL-TR-85-4079, WPAFB, Ohio, 1985.
25. M. M. Hall Jr., V. G. Veeraraghavan, H. Rubin, and P. G. Winchell, J.Appl. Cryst., 10, 66 (1977).
26. A. J. C. Wilson, Proc. Physical Soc., London 80, 286 (1962).
27. E. Pitts and F. W. Willets, Acta Cryst., 14, 1302 (1961).
28. J. R. Minter, Ph.D. Thesis, Polymer Sci. and Engr., University ofMassachusetts, Amherst, p. 104 (1982).
29. E. L. Thomas and D. G. Ast, Polymer, 15, 37 (1974).
30. D. T. Grubb'and G. W. Groves, Phil. Mag., 24, 815 (1.971).
31. S. Kumar, S. J. Krause, W. W. Adams, Proceedings of Electron MicroscopySociety of America, 43, 84 (1985).
32. B. Maxwell, J. Polymer Sci., C9, 43 (1965).
33. B. Wunderlich, "Macromolecular Physics, Vol I - Crystal Structure,Morphology, Defects," Academic Press (1973).
18
C=
c\ooci
a b
Figure 1.(a) Repeat unit of poly(aryl ether ether ketor'e);(b) Unit cell of PEEK (c-axis is shown from the center of the
first phenyl ring to the center of the third phenyl ring).
19
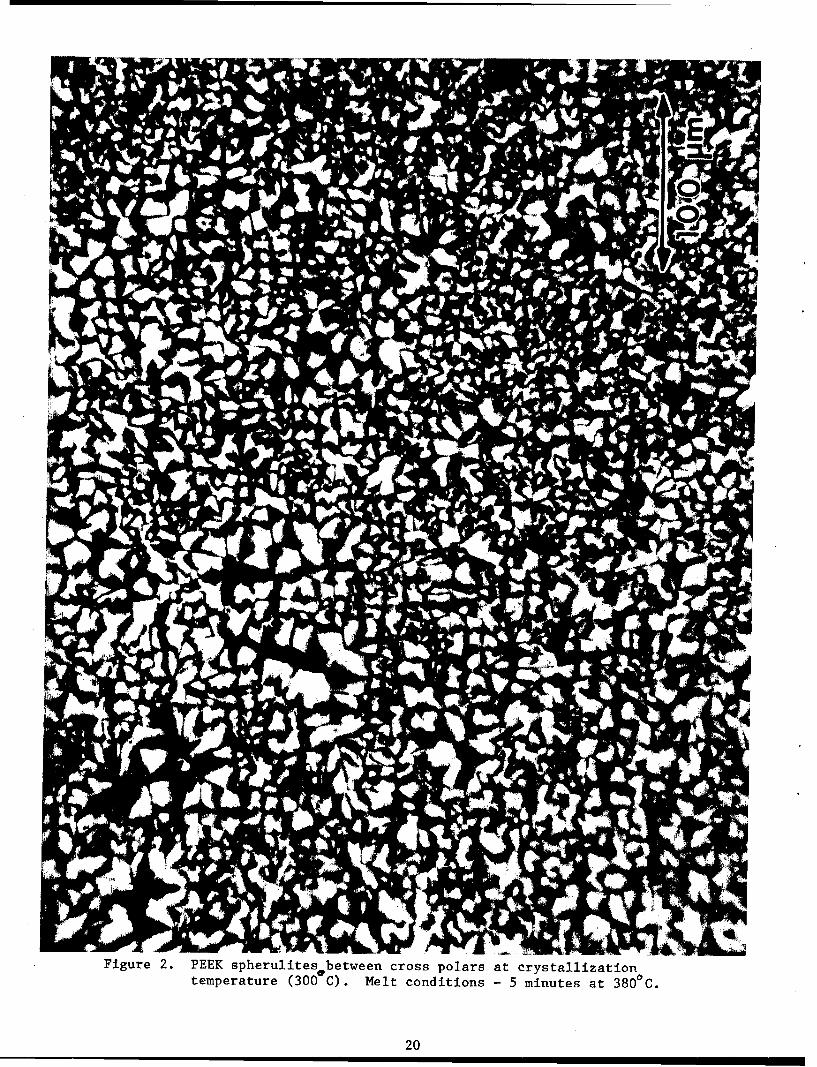
Figure 2. PEEK spherulites between cross polars at crystallizationtemperature (300 C). Melt conditions - 5 minutes at 3800C.
20
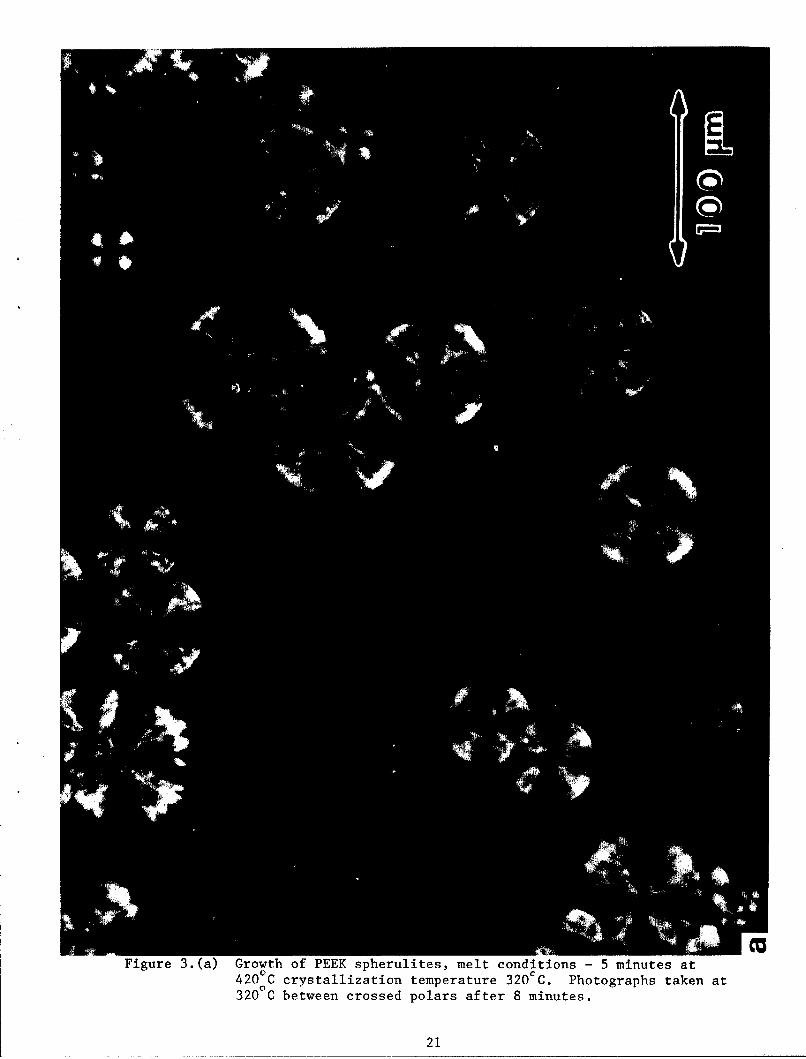
Figure 3.(a) Growth of PEEK spherulites, melt conditions - 5 minutes at420 C crystallization temperature 3200C. Photographs taken at320 C between crossed polars after 8 minutes.
21
E
4v~
411
Figure 3.(b) Growth of PEEK spherulites, melt conditions - 5 minutes at420 C, crystallization temperature 320 C. Photographs taken at320°0C between crossed polars after 16 minutes.
22
7 | g
'00
V1,)
Figure 3.(c) Growth of PEEK spherulites, melt conditions - 5 minutes at4200 C, crystallization temperature 320CC. Photographs taken at320 0 C between crossed polars after 24 minutes.
23
IN3
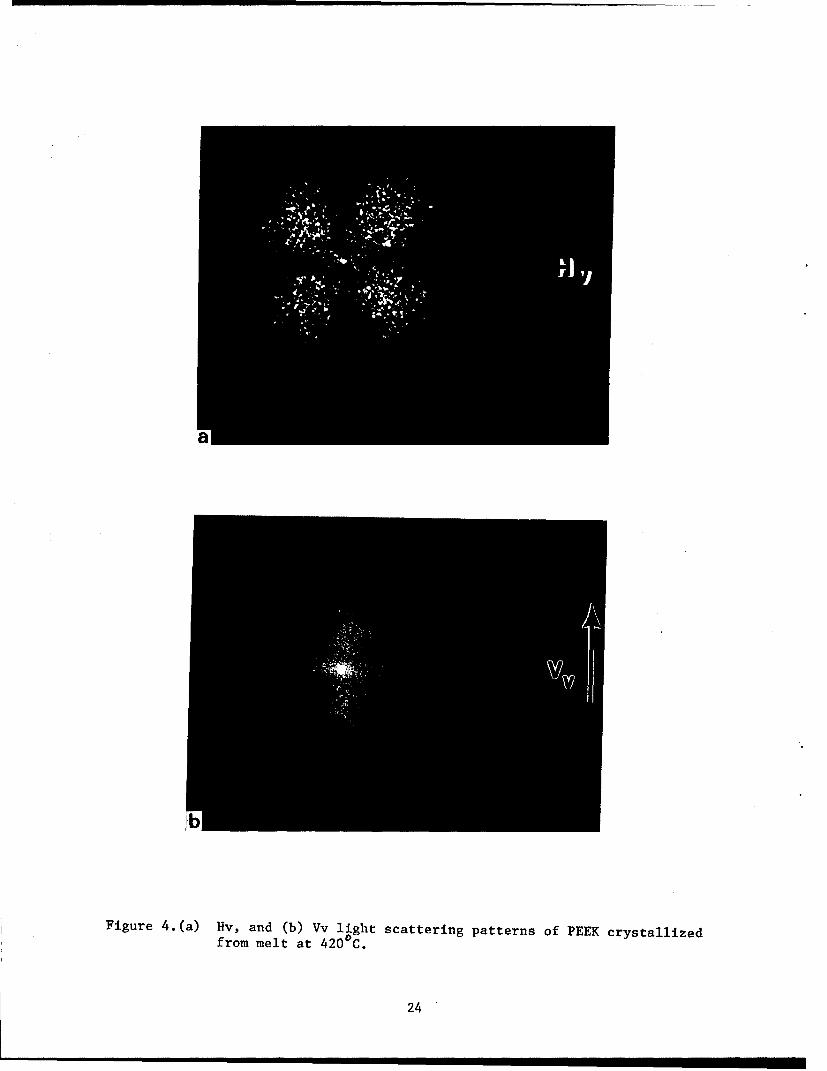
Figure 4.(a) Hv, and (b) Vv light scattering patterns of PEEK crystallizedfrom melt at 4200 C.
24
30
20
E
07
01
0 200 400 600
Time (seconds)
Figure 5. Linear isothermal radial growth of PEEK spherulite at 320,C.
25
-10
1-2
0
C
._o
%-I
0
-1
-16 I III380 390 400 410 420
Temperature (OC)
Figure 6. Plot of logarithm of nucleation density as a function of melt
temperature.
26
18
12
6
00'
0.11 0.17 0.23 0.29 0.Q5 0.41 0.47 053 0.59 0.65
Figure 7. Typical WAXS curve of PEEK, curve-fitted using Pearson-VTI-typefunction (ref. 24, 25).,. (A) crystalline, and (B) amorphous..
27
6
4-
NO.
00
0 I II
0 0.10 0.20 0.30 0.40
s1~2)-
Figure 8. Vonk plot of R(s ) versus s .
P P
28
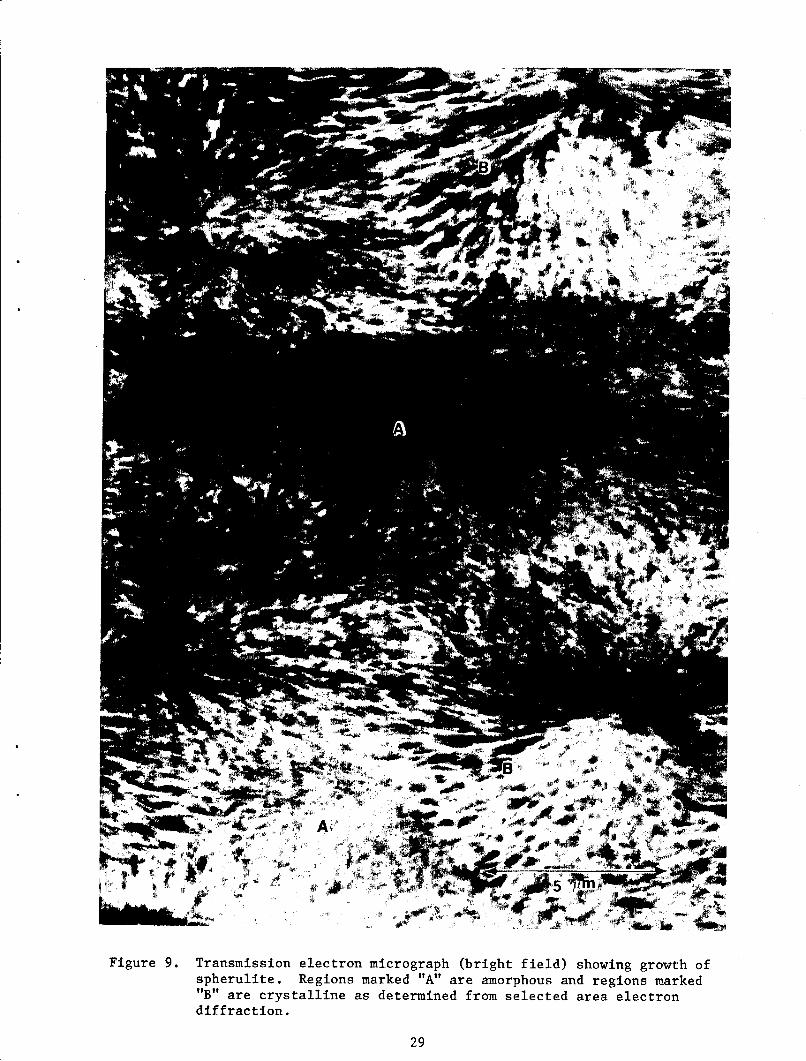
Figure 9. Transmission electron micrograph (bright field) showing growth ofspherulite. Regions marked "A" are amorphous and regions marked"B" are crystalline as determined from selected area electrondiffraction.
29
J ii
Figure 10. Row nucleation in PEEK as observed in transmission electron
microscopy.
30
AA
Figure 11.(a) Transmission electron micrographs (bright field) ofspherulites seen along radius, (b) perpendicular to radius, andselected area electron diffraction patterns from the areasindicated with arrows.
31
A
Figure 11.(b) Figure 11 Concluded.
32
. € b axis/ radia I
Figure 12. Transmission electron micrograph (dark field) using (110) plane
and the schematic of crystal orientation.
33
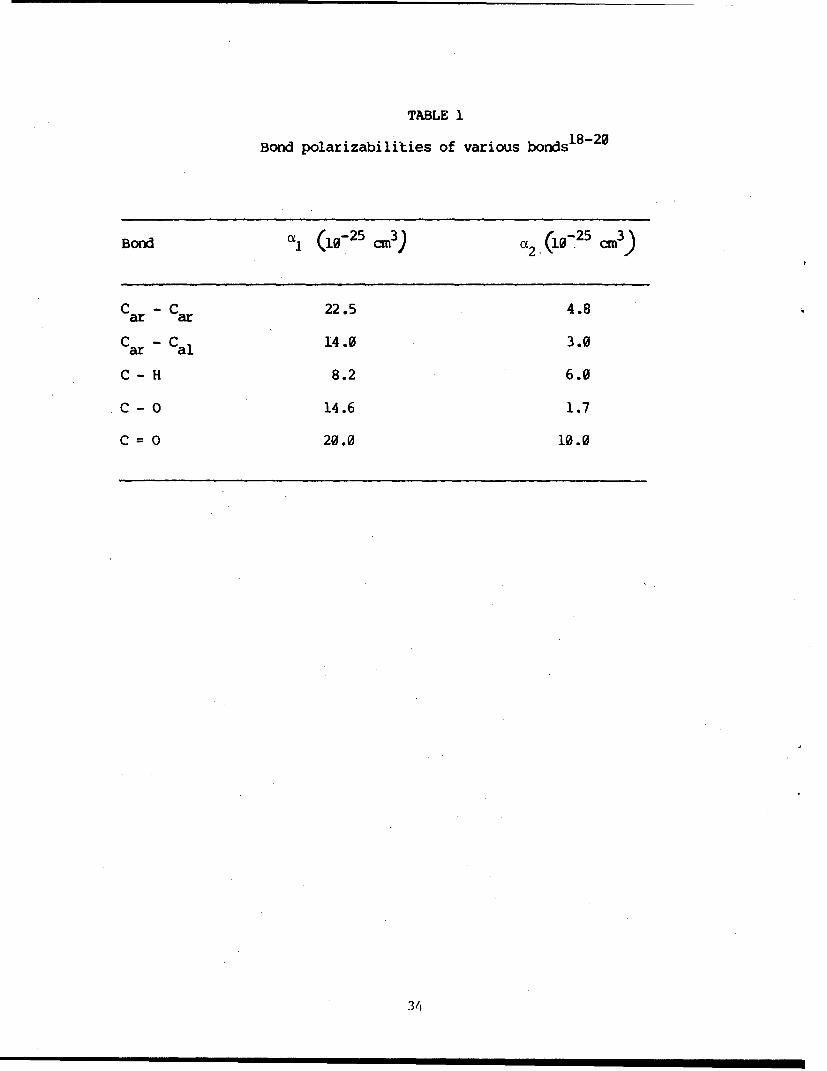
TABLE 1
Bond polarizabilities of various bonds18- 2 0
Bond c (10-25 cm3) O2 (0i-25 m3)
Car - Car 22.5 4.8
Car - Cal 14.0 3.0
C- H 8.2 6.0
C - 0 14.6 1.7
C =0 20.0 10.0
34
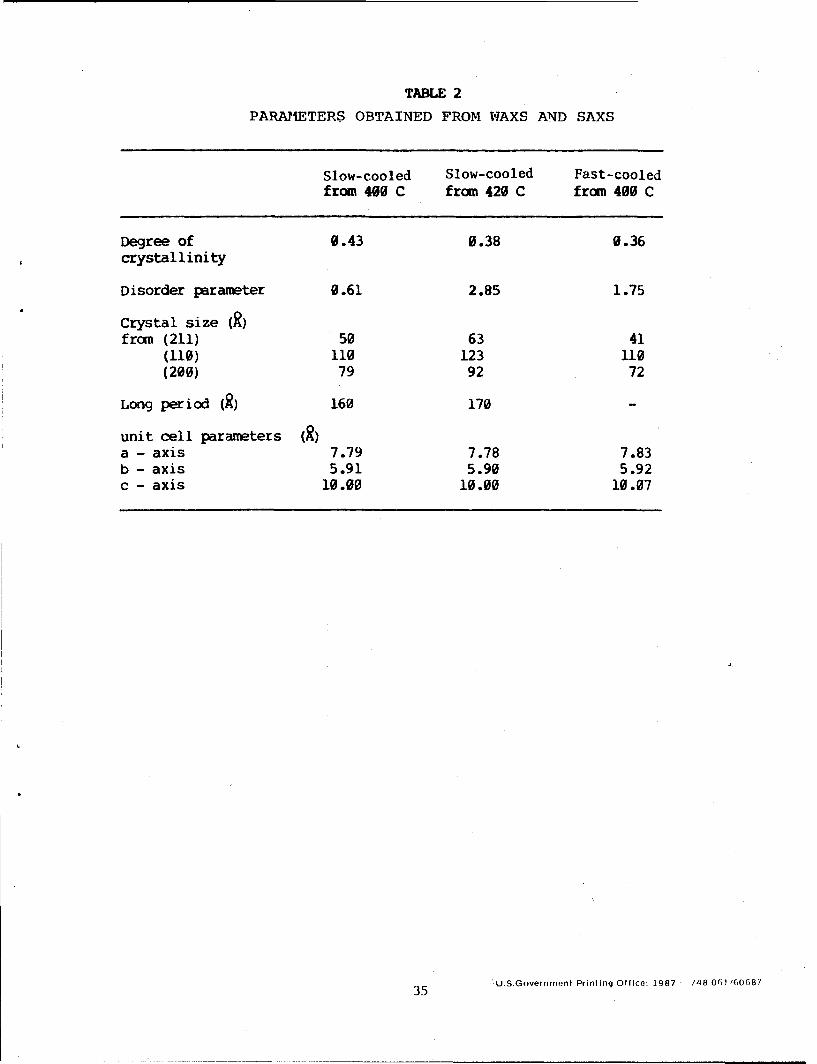
TABLE 2
PARAMETERS OBTAINED FROM WRAXS AND SAXS
Slow-cooled Slow-cooled Fast-cooledfrom 400 C from 420 C from 400 C
Degree of 0.43 0.38 0.36crystallinity
Disorder parameter 0.61 2.85 1.75
Crystal size (R)from (211) 50 63 41
(110) 110 123 110(200) 79 92 72
Long period (R) 160 170
unit cell parameters (R)a - axis 7.79 7.78 7.83b - axis 5.91 5.90 5.92c - axis 10.00 10.00 10.07
35 .U.S.Government Prinling Office: 1987 /48061 160687


![Studies on novel heat treated sulfonated poly(ether ether ketone) [SPEEK]/diol membranes for fuel cell applications](https://img.pdfslide.net/doc/110x75/6351bf555c21d80fde0aa205/studies-on-novel-heat-treated-sulfonated-polyether-ether-ketone-speekdiol-membranes.jpg)


