Embed Size (px)
Citation preview

Cure kinetics and morphology of blends of epoxy resin
with poly (ether ether ketone) containing pendant tertiary butyl groups
Bejoy Francisa, Geert Vanden Poelb, Fabrice Posadab, Gabriel Groeninckxb,V. Lakshmana Raoa, R. Ramaswamya, Sabu Thomasc,*
aPolymers and Special Chemicals Division, Vikram Sarabhai Space Centre, Thiruvananthapuram, Kerala 695-022, IndiabLaboratory of Macromolecular Structural Chemistry, Catholic University of Leuven, Celestijnenlaan 200F, 3001 Heverlee, Belgium
cSchool of Chemical Sciences, Mahatma Gandhi University, Priyadarshini Hills P.O., Kottayam, Kerala 686-560, India
Received 11 October 2002; received in revised form 27 March 2003; accepted 5 April 2003
Abstract
The cure kinetics and morphology of diglycidyl ether of bisphenol-A (DGEBA) epoxy resin modified with a poly (ether ether ketone)
based on tertiary butyl hydroquinone (PEEK-T) cured with diamino diphenyl sulphone (DDS) were investigated using differential scanning
calorimetry (DSC), scanning electron microscopy (SEM) and dynamic mechanical thermal analysis (DMTA). The results obtained from
DSC were applied to autocatalytic and diffusion controlled kinetic models. The reaction mechanism broadly showed autocatalytic behaviour
regardless of the presence of PEEK-T. At higher PEEK-T concentration, more diffusion controlled mechanism was observed. The rate of
curing reaction decreased with increase in thermoplastic content and also with the lowering of curing temperature. The activation energies of
the blends are higher than that of the neat resin. The blends showed a phase separated morphology. The dispersed phase showed a
homogeneous particle size distribution. The Tg of the neat resin decreased with the decrease in cure temperature. Two Tg’s corresponding to
the epoxy rich and thermoplastic rich phases were observed in the dynamic mechanical spectrum. The storage modulus of 10 and 20 phr
PEEK-T blends are found to be greater than the neat resin.
q 2003 Elsevier Science Ltd. All rights reserved.
Keywords: Epoxy resin/poly (ether ether ketone) blends; Cure kinetics; Morphology
1. Introduction
Among the thermosetting polymers used, epoxy resins
find a wide range of applications as adhesives, coatings,
sealant, in aerospace industry, etc. The wide range of
applications arise from the properties like easy processa-
bility, good chemical and corrosion resistance, good
adhesion to various substrates, easy cure, etc. [1,2]. But
due to the inborn brittle nature of the epoxy resin owing to
the high crosslink density, it is necessary to improve the
toughness for its use in many end use applications.
Considerable efforts have been made in the past to improve
the toughness by blending with reactive liquid rubbers
[3–6]. Improvement in toughness was achieved with the
lowering of other good properties like glass transition
temperature ðTgÞ; thermal and oxidative stability. Studies
had revealed that blending with engineering thermoplastics
such as polyethersulphone [7–9], polyetherimide [10–13],
polycarbonate [14], polyphenyleneoxide [15,16] and poly
ethylene terephthalate [17,18] could enhance the fracture
toughness without sacrificing strength, stiffness, Tg or any
other desirable properties. The ultimate properties of the
cured resin as well as the blends depend on various factors
such as the nature of curing agent, curing conditions (time,
temperature), chemical interactions between component
polymers etc. Blending epoxy resins with functionally
terminated polymers has been a recent focus on the
toughness enhancement. The functional groups were so
selected that there is some interaction between the
components to have better properties.
The kinetics of cure of epoxy resin has been studied by
different techniques [19–24]. The reaction mechanism was
found to be autocatalytic. Relatively few systematic studies
0032-3861/03/$ - see front matter q 2003 Elsevier Science Ltd. All rights reserved.
doi:10.1016/S0032-3861(03)00296-9
Polymer 44 (2003) 3687–3699
www.elsevier.com/locate/polymer
* Corresponding author. Tel.: þ91-481-2730003; fax: þ91-481-
2561190.
E-mail addresses: [email protected] (S. Thomas), sabuthom@satyam.
net.in (S. Thomas).

were done on the cure kinetics of blends of epoxy resins
with thermoplastics. It has been found that the reaction
mechanism remained autocatalytic irrespective of the
addition of thermoplastic [25–30].
Poly (ether ether ketone) (PEEK) is a tough, semi
crystalline high performance thermoplastic polymer with
good thermo mechanical properties. Because of its semi
crystalline nature, it is difficult to blend this with epoxy
resins. Hence only few literatures are available on blends of
epoxy resins with PEEK type polymers.
Since the processing was difficult, amorphous PEEK like
phenolphthalein poly (ether ether ketone) (PEK-C) or
functionally terminated PEEK with bulky pendant groups
was used for modifying epoxy resin [31–36]. Bennet et al.
[37] investigated the fracture toughness and mechanical
properties of blends of diglycidyl ether of bisphenol-A
(DGEBA) epoxy resin with amine terminated tertiary butyl
hydroquinone, methyl hydroquinone and bisphenol-A based
PEEK oligomers. In another study, Song et al. [31] found
that amorphous PEEK, PEK-C formed homogeneous blends
with tetrafunctional epoxy resin. The fracture toughness
decreased slightly with increase in PEK-C content. The
effect of curing agent and curing conditions on the
morphology was also investigated. According to Zhang
et al. [32] lowering of cure temperature favoured homo-
geneous morphology in amine cured DGEBA þ PEK-C
blends. But Guo et al. [33] obtained heterogeneous blends at
higher cure temperature. Also Guo et al. [34] found that the
morphology of epoxy þ PEK-C blends depend on the
nature of curing agent used. The phthalic anhydride cured
system gave homogeneous morphology while maleic and
hexahydrophthalic anhydride cured systems gave hetero-
geneous morphology. Recently efforts were made by
Brostow et al. [38,39] to develop low friction epoxy by
the addition of fluorinated PEK. They obtained 30%
reduction in friction by the addition of 10% fluorinated
PEK and also the properties depend strongly on the
morphology.
From the above discussion, it is clear that the processing of
blends could be improved by using PEEK with terminal
functional groups and also with bulky pendant groups. The
final properties were dependent on the morphology devel-
oped, which in turn was dependent on the type of curing
agent and curing conditions. Also to our knowledge no work
has been reported on the kinetics of cure in epoxy þ PEEK
blends. In the present work, DGEBA epoxy resin was
modified with poly (ether ether ketone) based on tertiary
butyl hydroquinone. As a result of the presence of the bulky
tertiary butyl groups on the polymer chain, the crystallinity
was reduced and as a consequence the processability was
greatly improved. We investigated in detail the effect of
curing conditions and composition of the blends on the curing
kinetics and morphology with a diamine curing agent.
2. Experimental
2.1. Materials used
A diglycidyl ether of bisphenol-A (DGEBA) epoxy resin
(LY 556, Ciba Geigy) with an epoxide equivalent weight of
188.68 was used. The curing agent used was diaminodi-
phenyl sulphone (DDS, Aldrich). The materials were used
as received without any further purification. The thermo-
plastic modifier, poly (ether ether ketone) based on tertiary
butyl hydroquinone (PEEK-T) was synthesised in the
laboratory. The structure and molecular weight were
characterized by IR and GPC measurements. The chemical
structures of the epoxy resin, DDS and PEEK-T are given in
Fig. 1.
Fig. 1. Chemical structures of DGEBA, DDS and PEEK-T.
B. Francis et al. / Polymer 44 (2003) 3687–36993688

2.2. Blend preparation
The blends were prepared using a solventless mixing
technique. The thermoplastic modifier was dissolved in
epoxy resin at 180 8C with constant stirring. The curing
agent was dissolved in the blend at 180 8C in less than 40 s
to minimize the curing reaction during mixing and the
mixture was immediately plunged into liquid nitrogen to
freeze the curing reaction. Blends with 0, 10, 20, 30, 40 and
50 phr thermoplastic were prepared. The amine to epoxide
ratio was one in all the cases.
2.3. DSC analysis
A power compensated type differential scanning calori-
meter (Perkin Elmer Pyris 1) was used for dynamic and
isothermal DSC measurements. The instrument was cali-
brated with indium, tin and benzophenone standards before
starting the measurements. Nitrogen was used as the purge
gas and samples of 5 – 10 mg were used for the
measurements.
Dynamic DSC measurements were carried out at 10, 7.5,
5 and 2.5 8C/min for the neat epoxy resin/DDS mixture.
Isothermal measurements were done at 180, 165 and 150 8C.
The curing reaction was assumed to be complete when the
isothermal curve leveled off to a straight line. The areas of
the peak under the isothermal curve at various times were
used to determine the conversion ðaÞ at various times. The
conversion a at time t was defined as a ¼ DHt=DHtot; where
DHt is the heat of cure at time t and DHtot is the total heat of
cure of the neat epoxy resin alone.
2.4. Scanning electron microscopy
The morphology of the blends cured at 180, 165 and
150 8C were examined using a Philips XL 20 scanning
electron microscope. The samples were fractured in liquid
nitrogen. The fracture surfaces were etched with chloroform
at room temperature to remove the thermoplastic phase. The
specimens were kept overnight in vacuum oven to remove
the remaining solvent. The fractured surfaces were sputter
coated with gold before taking the SEM micrographs.
2.5. Dynamic mechanical thermal analysis
The viscoelastic properties of the blends as well as the
neat resin cured at various temperatures were measured
using TA instruments DMA 2980 dynamic mechanical
thermal analyzer. The samples were cured at 180, 165 and
150 8C and the analyses were done in three point bending
mode. The samples were heated from 50 to 250 8C at the
heating rate of 3 8C/min. The frequency used was 10 Hz.
3. Results and discussion
3.1. DSC studies
Dynamic DSC measurements were done for the
DGEBA þ DDS mixture at 10, 7.5, 5 and 2.5 8C/min. The
dynamic heating curves at various heating rates are shown
in Fig. 2. It was observed that peak maximum shifted
towards the lower temperature side as the heating rate is
lowered. The total heat of reaction DHtot for the neat epoxy
system was taken as the average of the enthalpy values
Fig. 2. Dynamic DSC scans of the neat resin at different heating rates.
B. Francis et al. / Polymer 44 (2003) 3687–3699 3689

obtained at different heating rates. This value was taken as
DHtot for calculating the fractional conversion a at time t
[40,41].
The phenomenological model developed by Kamal [42]
was used for isothermal kinetic analysis. The amine epoxide
reaction was found to be autocatalytic in nature. The general
equation assumed for the curing reaction of epoxy–amine
system is given below [43–45].
da
dt¼ ðk1 þ k2a
mÞð1 2 aÞn ð1Þ
where a is the fractional conversion at time t; k1 and k2 are
the rate constants with two different activation energies, m
and n are the kinetic exponents of the reaction and m þ n
gives the overall reaction order. The constant k1 can be
calculated if the initial rate at a ¼ 0 can be estimated.
The kinetic constants k1 and k2 depend on temperature
according to Arrhenius law
ki ¼ Ai expð2Eai=RTÞ ð2Þ
where Ai is the pre exponential constant, Eai is the activation
Fig. 3. (a) Reaction rate vs time plot for neat resin and blends cured at 180 8C. (b) Reaction rate vs time plot for neat resin and blends cured at 165 8C. (c)
Reaction rate vs time plot for neat resin and blends cured at 150 8C.
B. Francis et al. / Polymer 44 (2003) 3687–36993690
energy, R is the gas constant and T is the absolute
temperature.
In order to investigate the cure kinetics, isothermal DSC
measurements were done at three curing temperatures. The
experimental value of conversion a and the reaction rate for
the complete course of reaction were then determined and
adjusted with the kinetic equation. The activation energies
and frequency factors were determined for each curing
temperature. Several methods were available for the
calculation of parameters of Eq. (1) from isothermal DSC
curves [46]. In our study the parameters k1; k2; m and n were
determined without any constraints on them.
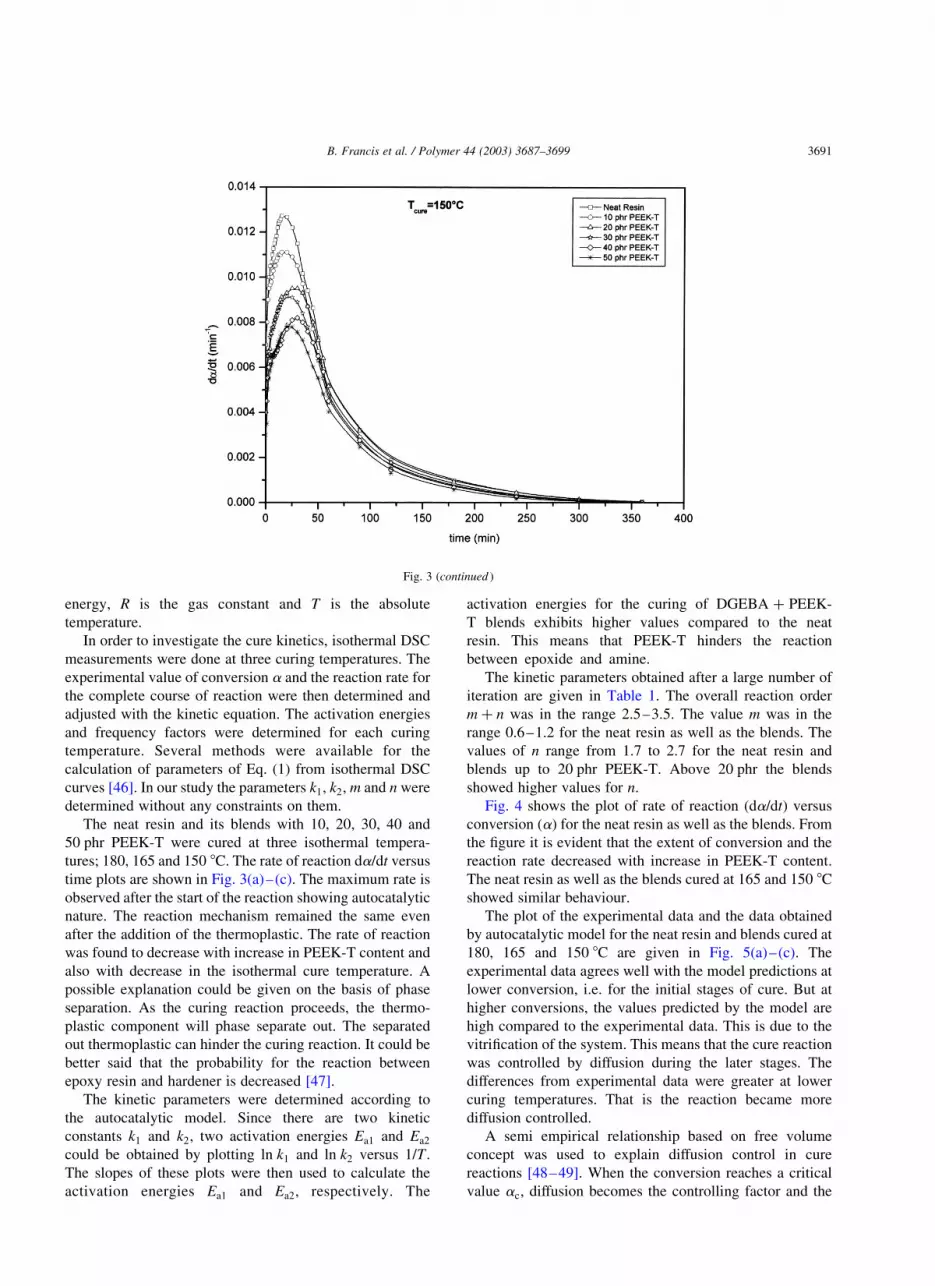
The neat resin and its blends with 10, 20, 30, 40 and
50 phr PEEK-T were cured at three isothermal tempera-
tures; 180, 165 and 150 8C. The rate of reaction da=dt versus
time plots are shown in Fig. 3(a)–(c). The maximum rate is
observed after the start of the reaction showing autocatalytic
nature. The reaction mechanism remained the same even
after the addition of the thermoplastic. The rate of reaction
was found to decrease with increase in PEEK-T content and
also with decrease in the isothermal cure temperature. A
possible explanation could be given on the basis of phase
separation. As the curing reaction proceeds, the thermo-
plastic component will phase separate out. The separated
out thermoplastic can hinder the curing reaction. It could be
better said that the probability for the reaction between
epoxy resin and hardener is decreased [47].
The kinetic parameters were determined according to
the autocatalytic model. Since there are two kinetic
constants k1 and k2; two activation energies Ea1 and Ea2
could be obtained by plotting ln k1 and ln k2 versus 1=T :
The slopes of these plots were then used to calculate the
activation energies Ea1 and Ea2; respectively. The
activation energies for the curing of DGEBA þ PEEK-
T blends exhibits higher values compared to the neat
resin. This means that PEEK-T hinders the reaction
between epoxide and amine.
The kinetic parameters obtained after a large number of
iteration are given in Table 1. The overall reaction order
m þ n was in the range 2.5–3.5. The value m was in the
range 0.6–1.2 for the neat resin as well as the blends. The
values of n range from 1.7 to 2.7 for the neat resin and
blends up to 20 phr PEEK-T. Above 20 phr the blends
showed higher values for n:
Fig. 4 shows the plot of rate of reaction ðda=dtÞ versus
conversion ðaÞ for the neat resin as well as the blends. From
the figure it is evident that the extent of conversion and the
reaction rate decreased with increase in PEEK-T content.
The neat resin as well as the blends cured at 165 and 150 8C
showed similar behaviour.
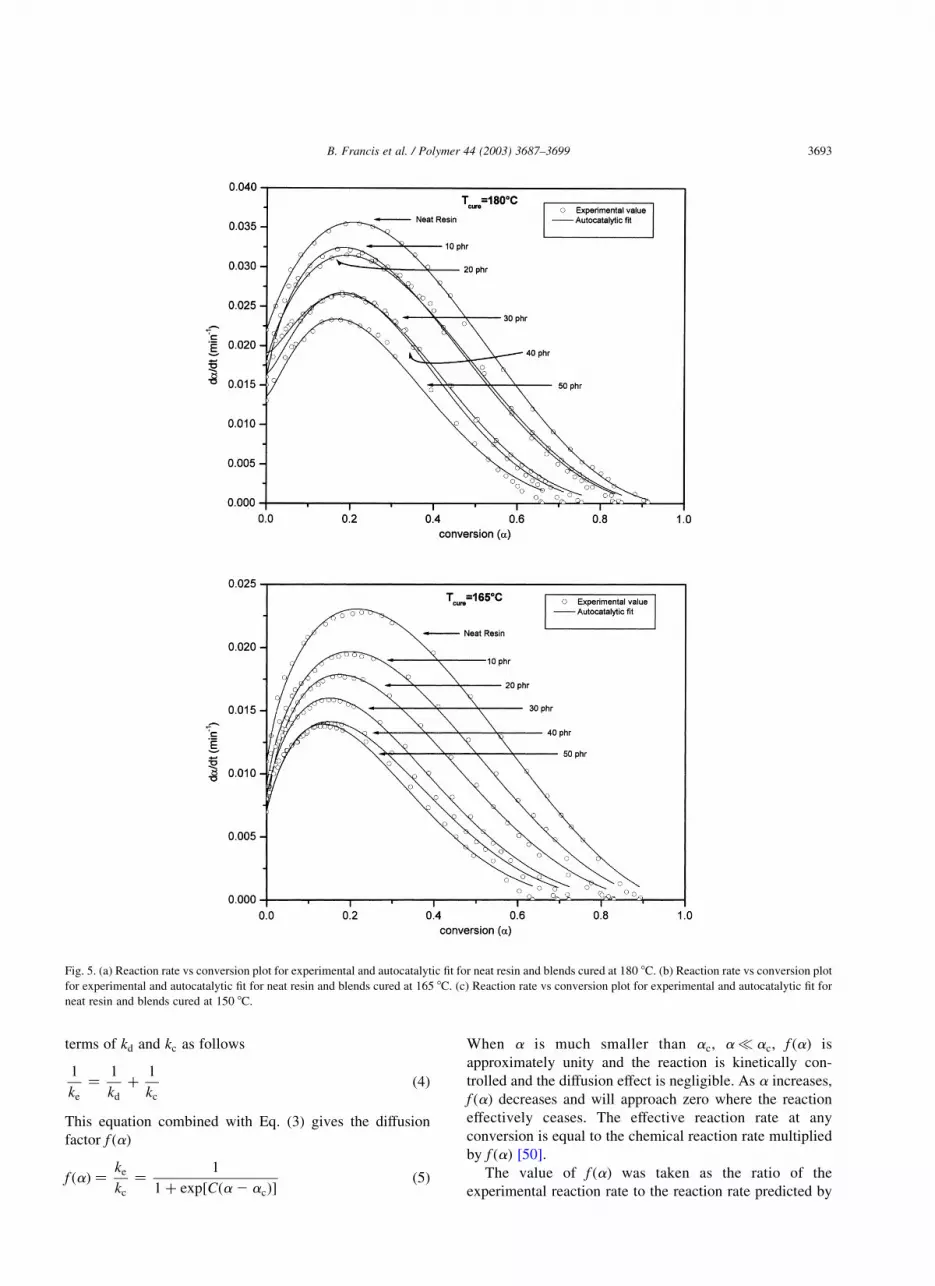
The plot of the experimental data and the data obtained
by autocatalytic model for the neat resin and blends cured at
180, 165 and 150 8C are given in Fig. 5(a)–(c). The
experimental data agrees well with the model predictions at
lower conversion, i.e. for the initial stages of cure. But at
higher conversions, the values predicted by the model are
high compared to the experimental data. This is due to the
vitrification of the system. This means that the cure reaction
was controlled by diffusion during the later stages. The
differences from experimental data were greater at lower
curing temperatures. That is the reaction became more
diffusion controlled.
A semi empirical relationship based on free volume
concept was used to explain diffusion control in cure
reactions [48–49]. When the conversion reaches a critical
value ac; diffusion becomes the controlling factor and the
Fig. 3 (continued )
B. Francis et al. / Polymer 44 (2003) 3687–3699 3691

rate constant kd is given by
kd ¼ kc exp½2Cða2 acÞ� ð3Þ
where kc is the rate constant for chemical kinetics and
C is a parameter. Eq. (3) corresponds to an abrupt
change from chemical control to diffusion control of the
curing reaction when conversion reaches ac: But the
onset of diffusion control is gradual and there is a
region where both diffusion and chemical factors are
controlling. The overall rate constant can be expressed in
Table 1
Autocatalytic model constants for PEEK-T ð �Mn—5400Þ modified DGEBA epoxy blends
m n m þ n k1 £ 1023 (min21) k2 £ 1023 (min21) ln A1 ln A2 Ea1 (kJ mol21) Ea2 (kJ mol21)
Neat epoxy
180 0.97 2.42 3.39 22.0 187.1
165 0.67 1.76 2.83 10.9 66.1 12.06 20.29 59.99 83.00
150 0.69 1.93 2.62 7.0 38.6
Epoxy/PEEK-T (10 phr)
180 0.93 2.63 3.56 18.1 170.8
165 0.81 2.37 3.18 9.2 89.7 9.04 17.37 50.21 72.33
150 0.79 2.37 3.16 7.0 44.1
Epoxy/PEEK-T (20 phr)
180 0.85 2.70 3.55 15.98 169.7
165 0.74 2.67 3.41 7.1 82.7 12.8 16.23 62.50 67.98
150 0.81 2.52 3.33 4.9 45.3
Epoxy/PEEK-T (30 phr)
180 1.28 3.90 5.18 19.0 346.47
165 0.86 3.41 4.27 8.3 99.9 14.36 24.43 69.28 96.58
150 0.99 3.43 4.42 5.3 72.9
Epoxy/PEEK-T (40 phr)
180 1.22 4.12 5.34 16.2 365.9
165 0.90 3.69 4.59 7.2 102.7 15.67 24.73 74.71 97.14
150 0.98 3.66 4.64 4.0 71.6
Epoxy/PEEK-T (50 phr)
180 1.27 4.76 6.03 13.5 417.8
165 0.94 4.33 5.27 7.1 123.9 17.24 28.34 81.08 110.48
150 0.68 3.69 4.37 2.9 41.6
Fig. 4. Reaction rate vs conversion plot for neat resin and blends cured at 180 8C.
B. Francis et al. / Polymer 44 (2003) 3687–36993692
terms of kd and kc as follows
1
ke
¼1
kd
þ1
kc
ð4Þ
This equation combined with Eq. (3) gives the diffusion
factor f ðaÞ
f ðaÞ ¼ke
kc
¼1
1 þ exp½Cða2 acÞ�ð5Þ
When a is much smaller than ac; ap ac; f ðaÞ is
approximately unity and the reaction is kinetically con-
trolled and the diffusion effect is negligible. As a increases,
f ðaÞ decreases and will approach zero where the reaction
effectively ceases. The effective reaction rate at any
conversion is equal to the chemical reaction rate multiplied
by f ðaÞ [50].
The value of f ðaÞ was taken as the ratio of the
experimental reaction rate to the reaction rate predicted by
Fig. 5. (a) Reaction rate vs conversion plot for experimental and autocatalytic fit for neat resin and blends cured at 180 8C. (b) Reaction rate vs conversion plot
for experimental and autocatalytic fit for neat resin and blends cured at 165 8C. (c) Reaction rate vs conversion plot for experimental and autocatalytic fit for
neat resin and blends cured at 150 8C.
B. Francis et al. / Polymer 44 (2003) 3687–3699 3693

the autocatalytic model. The value of f ðaÞ was around one
during the early stages of cure. As the curing reaction
proceeds further f ðaÞ decreases markedly due to the onset of
diffusion control. The plot of f ðaÞ versus a for 20 phr blend
is shown in Fig. 6. The decrease in f ðaÞ and hence in
effective reaction rate due to diffusion control is evident
from the figure. The other blends also showed the same
trend. The value of ac and C is obtained by applying non
linear regression to f ðaÞ versus a data to Eq. (5). The values
of ac and C are given in Table 2. The value of ac is
increased slightly as the cure temperature increased. ac
gives the state of the system at which the curing reaction
became more diffusion controlled. But it cannot be said
exactly that at this particular conversion diffusion control
begins, as the change from chemical control to diffusion
control is a gradual process.
3.2. Morphology
The scanning electron micrographs of the blends cured at
180, 165 and 150 8C are shown in Fig. 7. A phase separated
morphology was observed in all cases. The thermoplastic
Fig. 5 (continued )
Fig. 6. Plot of diffusion factor f ðaÞ against conversion at different curing temperatures for 20 phr blends.
B. Francis et al. / Polymer 44 (2003) 3687–36993694

rich phase was dispersed in epoxy rich phase at all the
curing temperatures up to 30 phr blends. The particle size
was measured using image analyzer. The dispersed particle
size is in the range 1.6–2.6 mm. The dispersed particle size
was observed to increase with the lowering of curing
temperature and also with increase in thermoplastic content.
At high cure temperature, the rate of curing reaction is high.
Hence time for gelation is less, which will result in smaller
particle size. Also with the progress of the curing reaction,
viscosity of the system will increase. As a result the
probability of the dispersed phase to coalesce decreases. A
homogeneous particle size distribution was observed at
higher curing temperatures but the polydispersity increased
with the lowering of curing temperature. The data are
summarised in Table 3. It is also important to add that unlike
thermoplastic þ thermoplastic, uncrosslinked rubber þ
rubber and thermoplastic þ uncrosslinked rubber blends,
coalescence is really suppressed in epoxy þ thermoplastic
blends. This is associated with the high viscosity of the
epoxy matrix as a result of gelation and vitrification upon
curing. We have observed similar results in the case of
epoxy þ rubber blend systems [51].
3.3. Dynamic mechanical thermal analysis
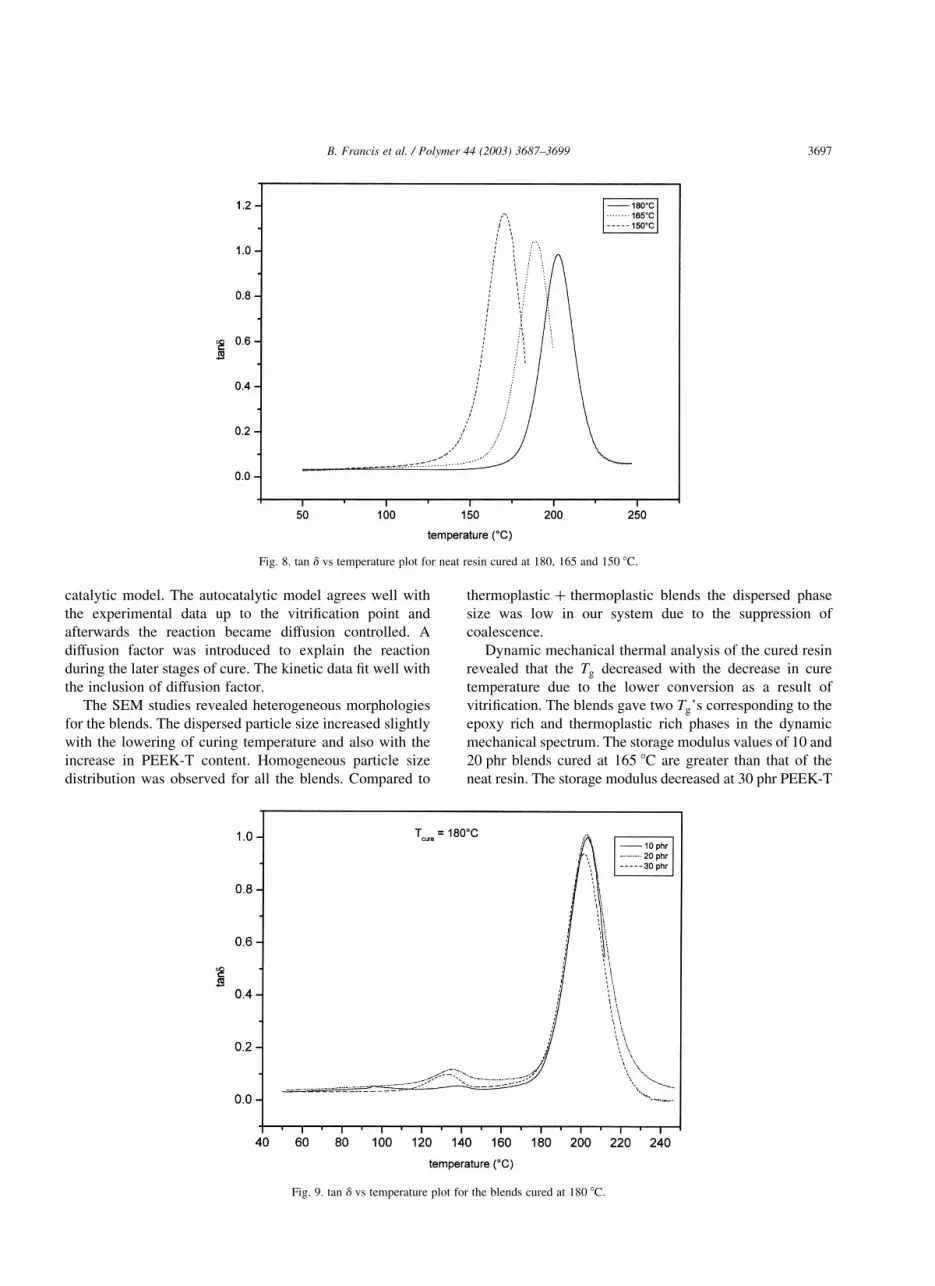
The tan d versus temperature plots for the neat resin
cured at 180, 165 and 150 8C are shown in Fig. 8. The glass
transition temperature ðTgÞ decreased with decrease in
curing temperature. The decrease in Tg was due to the
reduced conversion as a result of the lowering of curing
temperature.
The blends showed two peaks corresponding to the Tg’s
of epoxy rich and thermoplastic rich phases in the tan d
versus temperature plots. The tan d versus temperature plots
for the blends cured at 180 8C is given in Fig. 9. The Tg of
the blends cured at various temperatures is given in Table 4.
For the blends cured at 180 8C, the Tg values of both phases
remain close to that of the pure components. At lower curing
temperatures the Tg values of the two phases are less
compared to that of the pure components. This is due to the
presence of partially cured or uncured epoxy in both the
phases. At all curing temperatures the Tg of the thermo-
plastic rich phase decreases continuously with its increasing
concentration. This clearly indicates that epoxy molecules
get into thermoplastic phase, which acts as a plasticizer.
The storage modulae of the neat resin and the blends
cured at 165 8C is shown in Fig. 10. The storage modulus of
10 and 20 phr blends are greater than that of the neat resin
whereas that of 30 phr blends is lower than the neat resin. At
lower concentrations, PEEK-T acted as reinforcement to the
epoxy. At higher concentrations the phase separated PEEK-
T contain uncured or partially cured epoxy which acted as a
plasticizer which resulted in lowering of cross link density.
In fact we have PEEK-T rich phase and epoxy rich phase in
the system. The lowering of cross link density and the
plasticization effect by the uncured or partially cured epoxy
led to decrease in the storage modulus.
Table 2
Values of critical conversion ac and C parameters for epoxy þ PEEK-T
ð �Mn—5400Þ blends cured at different temperatures
T (8C) ac C
Neat epoxy
180 0.91 142.55
165 0.87 110.31
150 0.90 118.67
Epoxy/PEEK-T (10 phr)
180 0.83 94.58
165 0.88 73.72
150 0.80 65.33
Epoxy/PEEK-T (20 phr)
180 0.81 64.40
165 0.77
0.78 48.70
47.41
150
Epoxy/PEEK-T (30 phr)
180 0.74 81.34
165 0.68 31.90
150 0.67 54.36
Epoxy/PEEK-T (40 phr)
180 0.68 51.88
165 0.66 47.21
150 0.65 84.85
Epoxy/PEEK-T (50 phr)
180 0.62 44.88
165 0.59 57.00
150 0.56 46.03
Table 3
Dispersed particle size and polydispersity of the blends cured at different temperatures
Composition Curing temperature (8C)
180 165 150
�Dv (mm) �Dn (mm) PI �Dv (mm) �Dn (mm) PI �Dv (mm) �Dn (mm) PI
10 1.69 1.68 1.07 2.26 1.87 1.08 2.54 2.53 1.06
20 1.9 1.91 1.09 2.32 2.32 1.07 2.63 2.62 1.12
30 1.98 1.97 1.06 2.72 2.72 1.08 2.65 2.64 1.15
B. Francis et al. / Polymer 44 (2003) 3687–3699 3695

4. General discussion and concluding remarks
A DGEBA epoxy resin was modified with poly (ether
ether ketone) based on tertiary butyl hydroquinone using
DDS as curing agent. Autocatalytic model was used for the
kinetic analysis. Diffusion control was used to explain the
conversion during the final stage.
The curing reaction was followed with DSC. It was found
that the addition of PEEK-T did not affect the reaction
mechanism. The neat epoxy resin as well as the blends
exhibited autocatalytic mechanism. The extent and rate of
the reaction decreased with the lowering of cure tempera-
ture and also with the increase in thermoplastic content.
The kinetic parameters were determined using auto-
Fig. 7. SEM micrographs of the blends cured at different curing temperatures.
Table 4
Tg of the blends cured at different temperatures
Composition PEEK-T (phr) Curing temperature (8C)
180 165 150
Epoxy rich Thermoplastic rich Epoxy rich Thermoplastic rich Epoxy rich Thermoplastic rich
0 202 – 183 – 169 –
10 202 138.9 178.9 131.3 161.9 –
20 202.4 135.1 183.5 130.5 165.1 125.0
30 201 133.1 180.7 127.2 166.3 124.0
B. Francis et al. / Polymer 44 (2003) 3687–36993696
catalytic model. The autocatalytic model agrees well with
the experimental data up to the vitrification point and
afterwards the reaction became diffusion controlled. A
diffusion factor was introduced to explain the reaction
during the later stages of cure. The kinetic data fit well with
the inclusion of diffusion factor.
The SEM studies revealed heterogeneous morphologies
for the blends. The dispersed particle size increased slightly
with the lowering of curing temperature and also with the
increase in PEEK-T content. Homogeneous particle size
distribution was observed for all the blends. Compared to
thermoplastic þ thermoplastic blends the dispersed phase
size was low in our system due to the suppression of
coalescence.
Dynamic mechanical thermal analysis of the cured resin
revealed that the Tg decreased with the decrease in cure
temperature due to the lower conversion as a result of
vitrification. The blends gave two Tg’s corresponding to the
epoxy rich and thermoplastic rich phases in the dynamic
mechanical spectrum. The storage modulus values of 10 and
20 phr blends cured at 165 8C are greater than that of the
neat resin. The storage modulus decreased at 30 phr PEEK-T
Fig. 8. tan d vs temperature plot for neat resin cured at 180, 165 and 150 8C.
Fig. 9. tan d vs temperature plot for the blends cured at 180 8C.
B. Francis et al. / Polymer 44 (2003) 3687–3699 3697

due to the decrease in crosslink density and also due to the
presence of uncured or partially cured epoxy in the
thermoplastic rich phase. Finally it is important to add
that blends of modified PEEK and epoxy resin are extremely
important for generating new class of high performance
materials.
Acknowledgements
The authors thank the authorities of Vikram Sarabhai
Space Centre for giving permission to publish the article.
One of the authors (Bejoy Francis) thanks the Catholic
University, Leuven for the analytical and financial support
for the work.
References
[1] Potter WG. Epoxide resins. New York: Springer; 1970.
[2] May CA, Tanaka Y, editors. Epoxy resin chemistry and technology.
New York: Marcel Dekker; 1973.
[3] Yorkitis E, et al. In: Riew CK, Gilham JK, editors. Rubber modified
thermoset resins. Adv. Chem. Ser. No. 208, Washington, DC:
American Chemical Society; 1984.
[4] Cecere JA, Hedrick JL, McGrath JE. Polym Prepr 1985;26:298.
[5] Su CC, Woo EM. Polymer 1995;36:2883.
[6] Hourston DJ, Lane JM, Zhang HX. Polym Int 1997;42:439.
[7] Mimura K, Ito H, Fujikoa H. Polymer 2000;41:4451.
[8] Min HS, Kim SC. Polym Bull 1999;42:221.
[9] Varley RJ, Hodgkin JH, Simon GP. Polymer 2001;42:3847.
[10] Cho JB, Huang JW, Cho K, An JH, Park CE. Polymer 1993;34:4832.
[11] Girard Reydet E, Vicard V, Pacault JP, Sautereau H. J Appl Poym Sci
1997;65:2433.
[12] Bonnet A, Lestriez B, Pascault JP, Sautereau H. J Polym Sci Part B
Polym Phys 2001;39:363.
[13] Barral L, Cano J, Lopez J, Lopezs-Bueno I, Nogueira P, Ramirez C,
Torres A, Abad MJ. Thermochim Acta 2000;344:137.
[14] De Liello V, Martuscelli E, Musto P, Ragosta G, Scarinzi G.
Thermochim Acta 2000;344:137.
[15] Pearson RA, Yee AF. Polymer 1993;34:3658.
[16] Hedrick JC, Patel NM, McGrath JE, Adv. Chem. Ser., No. 233,
Washington, DC: American Chemical Society; 1993.
[17] Iijima T, Fujimoto K, Tomoi M. J Appl Poym Sci 2002;84:388.
[18] Japon S, Boogh L, Leterrier Y, Manson JAE. Polymer 2000;41:5809.
[19] Gao J, Li Y. Polym Int 2000;49:1590.
[20] Ooi SK, Cook WD, Simon GP, Such CH. Polymer 2000;41:3639.
[21] Lee JY, Choi HK, Shin MJ, Kim SW. Thermochim Acta 2000;343:
111.
[22] Rosu D, Mustata F, Casacaval CN. Thermochim Acta 2001;370:105.
[23] Lopez J, Ramirez C, Torres A, Abad MJ, Barral L, Cano J, Diez FJ.
J Appl Polym Sci 2002;83:78.
[24] Flammershein HJ, Oopferman JR. Macromol Mater Engng 2001;286:
143.
[25] Barral L, Cano J, Lopez J, Lopez-Bueno I, Nogueira P, Abad MJ,
Ramirez C. J Polym Sci Part B Polym Phys 2000;38:351.
[26] Jenninger W, Schawe JE, Alig I. Polymer 2000;41:1577.
[27] Barral L, Cano J, Lopez J, Lopez-Bueno I, Nogueira P, Torres A,
Ramirez C, Abad MJ. Thermochim Acta 2000;344:127.
[28] Zhong Z, Guo Q. Polymer 1998;39:3451.
[29] Hseih HK, Su CC, Woo EM. Polymer 1998;39:2175.
[30] Peng L, Cui J, Li S. Macromol Chem Phys 2000;201:699.
[31] Song X, Zheng S, Huang J, Zhu P, Guo Q. J Appl Polym Sci 2001;79:
598.
[32] Zhang Z, Zheng S, Huang J, Cheng X, Guo Q, Wei J. Polymer 1998;
39:1075.
[33] Guo Q, Huang J, Li B, Chen T, Zhang H, Feng Z. Polymer 1991;32:
58.
[34] Guo Q, Huang J, Ge L, Feng Z. Eur Polym J 1992;28:405.
[35] Iijima T, Tochimoto T, Tomoi M. J Appl Poym Sci 1991;43:1685.
[36] Cecere J, McGrath JE. Polym Prepr 1986;27:299.
[37] Bennet GS, Faris RJ, Thompson SA. Polymer 1991;32:1633.
[38] Brostow W, Cassidy PE, Hagg HE, Jaklewicz M, Motemartini PE.
Polymer 2001;42:7971.
[39] Brostow W, Bujard B, Cassidy PE, Hagg HE, Motemartini PE. Mater
Res Innovat 2002;6:7.
Fig. 10. Storage modulus vs temperature plot of the blends cured at 165 8C.
B. Francis et al. / Polymer 44 (2003) 3687–36993698

[40] Barton JM. Adv Polym Sci 1985;72:111.
[41] Varley RJ, Hodgkin JH, Hawthorne DJ, Simon GP, McCulloch D.
Polymer 2000;41:3425.
[42] Kamal MR. Polym Engng Sci 1974;14:23.
[43] Sourour S, Kamal MR. Thermochim Acta 1976;14:41.
[44] Keenan MR. J Appl Polym Sci 1987;33:1725.
[45] Horng TJ, Woo EM. Angew Makromol Chem 1998;260:31.
[46] Ryan ME, Dutta A. Polymer 1979;20:203.
[47] Chen JP, Lee YD. Polymer 1995;36:55.
[48] Chern CS, Pohlein GW. Polym Engng Sci 1987;27:782.
[49] Khanna V, Chanda M. J Appl Polym Sci 1993;49:319.
[50] Barral L, Cano J, Lopez J, Lopez-Bueno I, Nogueira P, Abad MJ,
Ramirez C. Polymer 2000;41:2657.
[51] Thomas R, Abraham J, Thomas S. J Polym Sci Part B Polym Phys
2003; in press.
B. Francis et al. / Polymer 44 (2003) 3687–3699 3699


![Studies on novel heat treated sulfonated poly(ether ether ketone) [SPEEK]/diol membranes for fuel cell applications](https://img.pdfslide.net/doc/110x75/6351bf555c21d80fde0aa205/studies-on-novel-heat-treated-sulfonated-polyether-ether-ketone-speekdiol-membranes.jpg)


