Embed Size (px)
Citation preview
Polymer 48 (2007) 1695e1710www.elsevier.com/locate/polymer
Cure kinetics, morphology and miscibility of modified DGEBA-basedepoxy resin e Effects of a liquid rubber inclusion
Raju Thomas a, Sebastien Durix b, Christophe Sinturel b, Tolib Omonov c, Sara Goossens d,Gabriel Groeninckx d, Paula Moldenaers c, Sabu Thomas e,*
a Department of Chemistry, Mar Thoma College, Tiruvalla 689103, Kerala, Indiab Centre de Recherche Sur la Matiere Divisee, Universite d’Orleans, France
c Department of Chemical Engineering, Catholic University of Leuven, de Croylaan 46, B-3001 Leuven, Belgiumd Laboratory of Macromolecular Structural Chemistry, Catholic University of Leuven, Celestijnenlaan 200F, 3001 Haverlee, Belgium
e School of Chemical Sciences, Mahatma Gandhi University, Priyadarshini Hills P.O., Kottayam 686560, Kerala, India
Received 5 August 2006; received in revised form 4 January 2007; accepted 12 January 2007
Available online 17 January 2007
Abstract
Kinetics of the curic reaction and morphology of a diglycidyl ether of bisphenol-A based epoxy resin (DGEBA), using an anhydride hardener(nadic methyl anhydride) at different weight contents of carboxyl-terminated copolymer of butadiene and acrylonitrile liquid rubber (CTBN)was investigated using a differential scanning calorimetry (DSC), dynamic mechanical thermal analysis (DMTA), and scanning electron micros-copy (SEM). The aim of the work is to understand the effects of inclusion of the liquid rubber phase in the transition phenomena that occurduring the curing reaction. The curic reaction at three different curic temperatures and at varying rubber contents in the range of 5e20 wt%has been studied. The reaction rate and conversions that occurred at the curic temperatures were analyzed. The increase in the rate with thecuric temperature showed this as a thermally catalyzed reaction. The rate of the reaction was found to decrease in liquid rubber-modified epoxiesdue to the effect of dilution and viscosity increase as obtained from the gelation times. The experimental data showed an autocatalytic behaviorof the reaction, which is explained by the model predicted by Kamal. This model includes two reaction constants k1 and k2 and two reactionorders m and n. The order of the overall reaction was found to be approximately 2. The activation energies Ea1 and Ea2 were estimated atall curic temperatures for neat and all modified epoxies. The results obtained from the DSC data were also applied to diffusion controlled kineticmodels. A schematic model to represent the curic reaction and phase separation was introduced and the molecular mechanism of this curingreaction was discussed. During the curic reaction, phase separation of the liquid rubber from the epoxy matrix took place and the modified ep-oxies showed phase separated morphology. The dispersed phase showed a homogenous particle size distribution. The size of the phase separateddomains increased with increasing concentration of the CTBN and decreased with rise in curing temperature. The glass transition temperature(Tg) of the modified epoxies decreased with increase in curic temperature as studied from dynamic mechanical thermal analysis. Addition of theliquid rubber lowered the Tg of the network. This became prominent in the modification of the matrix with 15 and 20 wt% of the elastomer. Thisis attributed to flexibilization of the matrix. The dissolved rubber plasticizes the epoxy network. The Tg of the neat rubber in the low-temperatureregion was shifted to higher temperature upon addition of the elastomer. A higher shift was noted for 15 and 20 phr inclusion. This was due todissolved epoxy in the rubber-rich phase that increased the modulus of the rubbery phase. The inclusion of a large wt% of carboxyl-terminatedbutadiene-co-acrylonitrile (CTBN) decreased the cross-linking density of the thermoset matrix.� 2007 Elsevier Ltd. All rights reserved.
Keywords: Epoxy resin/liquid rubber; DSC; Cure kinetics
* Corresponding author. Tel.: þ91 481 2730003; fax: þ91 481 2561190.
E-mail addresses: [email protected], [email protected] (S. Thomas).
0032-3861/$ - see front matter � 2007 Elsevier Ltd. All rights reserved.
doi:10.1016/j.polymer.2007.01.018

1696 R. Thomas et al. / Polymer 48 (2007) 1695e1710
1. Introduction
Epoxy resins are widely used as high-performance protec-tive coatings, structural adhesives, low-stress IC encapsulants,and matrix resins for composites. When cured these resins arehighly cross-linked and become amorphous thermosets. Theyare brittle and have poor resistance to crack growth. Theyare highly employed in ‘‘joining and fastening technology’’in many industries. The epoxy resin network is formed duringthe cross-linking reaction using a wide variety of cross-linkingagents or hardeners such as acids [1], anhydrides [2], andamines [3]. The reaction leads to the formation of a three-dimensional system which is found to be insoluble in usualsolvents.
Toughening of epoxy resins with low-molecular weightliquid rubbers has been studied [4e8]. Many authors [9e11]have also made comments on the increasingly wide use of rub-ber-modified epoxy resins as structural adhesives and as thematrix for fiber composites. Because of their properties, epoxyresins have many commercial applications. For this reason, itwas deemed interesting to modify them with rubber particles.Rubber was added to the uncured epoxy resins and after thecross-linking reactions the rubber-modified epoxy resinsexhibited a two-phase microstructure consisting of relativelysmall rubber particles dispersed in a matrix of epoxy. Thismicrostructure resulted in the material possessing a highertoughness than the unmodified one with only a minimal reduc-tion in other important properties, such as modulus. Toughen-ing of epoxy resin is extremely useful because application ofthis polymeric material imparts resistance against mechanicaldeformation at different loading rates. The brittle nature of theepoxy is the result of catastrophic strain localization in theform of crazes, which may cause premature fracture at arelatively small macroscopic deformation. Microstructural ad-justments in the system resulted in the introduction of hetero-geneity in polymer systems [12]. Rubber toughening [13] orcross-linking [14] of epoxy system results in the increase inhardening modulus.
The properties of the epoxy resin depend on the extent ofreaction. The knowledge of the mechanism and cure kineticsis necessary for assigning structureeproperty relationshipsand for the usage of the materials as structural adhesives andas matrices in fiber-reinforced composite. Generally the curingof the epoxy resin is studied by DSC [15e18]. This calorimet-ric technique gives a quantitative measurement on the amountof reaction and permits to determine the Tg of the material.Cure kinetics of the epoxyeanhydride system has been studiedusing various non-isothermal DSC scans, and hence the calcu-lation of activation energy has been done by many authors[19,20]. Certain studies deal with cure kinetics of a DGEBAepoxy resin in the presence of sulfanilamide (SAA) at differentheating rates by non-isothermal DSC [21]. Francis et al. havestudied the cure kinetics of DGEBA-based epoxy resin modi-fied with an engineering thermoplastic, i.e. poly(ether etherketone) with diaminodiphenyl sulfone (DDS) curing agent us-ing isothermal DSC, SEM, and DMTA [22]. Non-isothermalDSC technique was employed by Rosu et al. in a cure kinetic
study of DGEBA and diglycidyl ether of hydroquinone(DGEHQ) epoxy resin using triethylenetetramine (TETA) asthe curing agent [23]. Near-infrared (NIR) spectroscopy wasalso employed to analyze the cure kinetics of tetraglycidyl-4,40-diaminodiphenyl methane with DDS as a curative [24].Cure kinetics, using isothermal mode of DSC was employedto study a system composed of o-cresol formaldehyde epoxyresin (o-CFER) using succinic anhydride (SA) as the curativeand a tertiary amine as a catalyst [25]. In a certain studyby Raman and Palmese, Fourier transform infrared (FTIR)spectroscopy in the NIR region was used to monitor the curekinetics of DGEBA epoxy resin and 4,40-methylenebiscyclo-hexanamine in the presence of THF as a solvent [26]. DGEBAand aniline modified with a low-Tg poly(ethylene glycol)(PEG) were used as a model system to study the importanceof complex formation on the cure kinetics of multicomponentepoxy-amines [27]. In another study, wide-angle X-ray analy-sis (XRD) was carried out at different stages of cure to monitorthe kinetics of di-, tri-, and tetra-functional high-performance,epoxy-layered silicate nanocomposites [28]. Different tech-niques including DSC, FTIR, and transmission electronmicroscopy (TEM) have been used to demonstrate the curicreaction of epoxy thermoset and a block copolymer modifiersynthesized from polystyrene, polybutadiene, and poly(methylmethacrylate) incorporated by an acid-reactive functionality[29].
The inclusion of elastomers on epoxy resin results ina phase separated network on curing. However, there areseveral reports on DGEBA-based epoxy resin and elastomericmodified blends on immiscibility or miscibility dependingon the structure of the curing agent. In a very recent interestinginvestigation by Kalogeras et al. [30], aromatic amine-curedDGEBA epoxy resin and poly(ethylene oxide) (PEO) blendswere analyzed by DSC and dielectric techniques to study theparameters controlling miscibility. In another recent work[31], miscibility parameters were analyzed by DSC for ternarythermosetting blends composed of epoxy resin, PEO, andpoly(3-caprolactone) (PCL).
The epoxy curing generally shows a complex kinetics.Autocatalysis is the reason for initial acceleration. But dueto the onset of gelation, the reaction retards in the next stage.The cross-linking leads to an increase in the Tg of the curingmatrix. If the curic temperature (Tcure) is well above Tg, thekinetics of the reaction between epoxy and hardener is chem-ically controlled. The resin passes from a flexible rubbery stateto a rigid glassy one, when Tg approaches Tcure. The reaction,at this stage, becomes very slow, only diffusion controlled, andfinally attains vitrification stage and stops.
Many studies have been published on the cure kinetics ofDGEBA-based epoxy resin with carboxyl-terminated liquidrubber. Also, calorimetric method by DSC was employed inmost of the works. The curic reaction takes place betweenthe epoxy and the curative and hence the kinetics dependson the nature of the hardener employed. Thus, each systemcan be considered as a separate entity depending on the typeof curative used. The significance of the present study lies inthe investigation of cure kinetics of the DGEBA-based epoxy
1697R. Thomas et al. / Polymer 48 (2007) 1695e1710
resin with carboxyl-terminated liquid rubber using an anhy-dride as the curative. This keeps the system odd from othersand a new one to report cure kinetics to the best of our knowl-edge. In the present case, a cyclic anhydride, nadic methylanhydride, was used as the hardener. DSC in isothermalmode was employed for the calorimetric analysis. The kineticsof the first stage of the reaction as well as the later stageswhere the vitrification effect is dominant and controlled bydiffusion instead of chemical kinetics has been explained.The effect of the reactive liquid rubber, carboxyl-terminatedbutadiene-co-acrylonitrile (CTBN), inclusion of varyingweight content on the epoxy system has also been checked.The morphological development during the cure processeswas also analyzed. The viscoelastic behavior of the modifiedepoxies was analyzed using DMTA.
2. Experimental
2.1. Materials
The epoxy resin used was a diglycidyl ether of bisphenol-A(DGEBA, Gy-250). The curing agent was an anhydride, nadicmethyl anhydride, under the trade name Hy-906. A tertiary
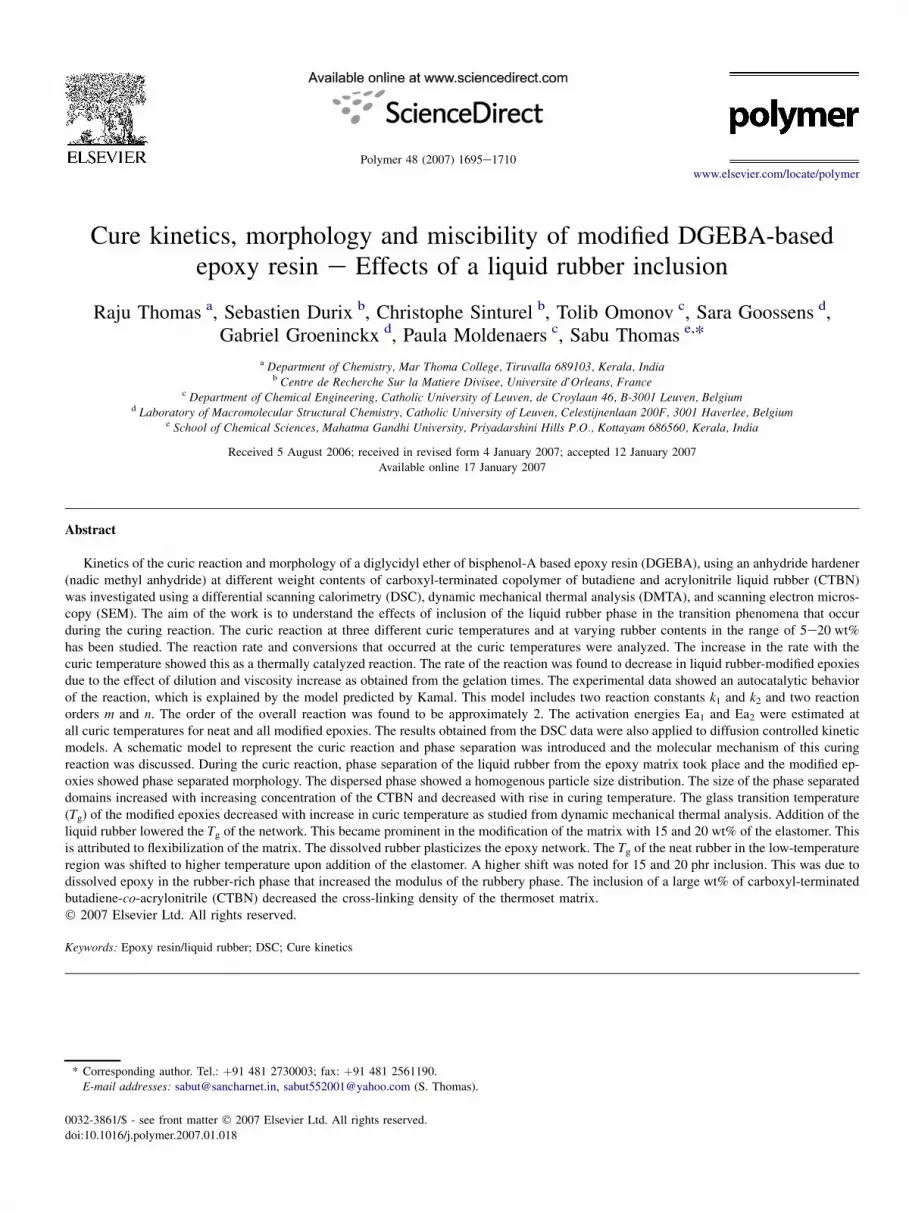
amine, N,N-dimethyl benzylamine (Dy-062), was used asan accelerator. The liquid rubber used was the carboxyl-terminated butadiene-co-acrylonitrile (CTBN), Hycar 1300*8.All the chemicals were kindly supplied by Huntsmann Co.and were used as received without purification. Fig. 1 showsthe structures of the materials used in the study. The character-istics of CTBN rubber are summarized in Table 1. The stoichi-ometry of epoxy and anhydride is 5:4. The mixture was stirredat room temperature and samples of about 15e20 mg weightswere analyzed.
2.2. Blend preparation
Solutions of varying CTBN concentrations in the epoxyresin were prepared by agitating the mixture using a mechani-cal stirrer at room temperature. Stoichiometric amount of an-hydride was added followed by the tertiary amine accelerator.Small amounts of samples taken from freshly prepared blendswere used for DSC analysis. For SEM analysis blended sam-ples were prepared by pouring the mixture into a preheatedsilicone mould. It was then precured under ambient conditionsfor 30 min at 120 �C and then postcured for 2 h at 140 and150 �C.
CH2
CH3
CH3
CH3
CH3
CH2
CH2
CH2CH2
CH3
CH2 CH2CH BA CH CHCH2 BA
BA
O
CH2 CH2
O
OH
O OC
O
O
O
CH CHx
CHy m
CN
COOHHOOC
N
=
(a) Epoxy resin
(c) CTBN
(d) N,N-dimethyl benzene
(b) nadic methyl anhyrdide
Fig. 1. Structure of compounds.

1698 R. Thomas et al. / Polymer 48 (2007) 1695e1710
2.3. Differential scanning calorimetry
The calorimetric measurements were performed with aPerkineElmerePyris DSC 6 differential scanning calorimetersupported by a PerkineElmer computer for data acquisition.The instrument was calibrated with indium and dry cyclohex-ane standards. Isothermal heating experiments were conductedin a nitrogen flow of 40 ml/min. The heating was done fromroom temperature to the temperature of the isotherm at a heat-ing rate of 100 �C/min. Isothermal heating study was per-formed at three different curic temperatures: 120, 140, and150 �C. The cure process and the thermal properties of thethermosetting material affect its macroscopic properties thatmostly govern its end use applications and performance. Dif-ferential scanning calorimetric (DSC) analysis was employedto study the extent of the reaction. The analysis is based onthe assumption that the heat generated during the epoxy curicreaction is equal to the total area under the heat flowetimecurve. The degree of cure is then determined from the heatof reaction. The curic reaction was assumed to be completewhen the isothermal curve of the blends leveled off to thebase line. The areas of the peak under the isothermal curvesat various times were used to determine the conversion (a)at various times. The conversion percentage was determined as
a¼�
DHtotal�DHresid
DHtotal epoxy
�� 100 ð1Þ
The reaction rate, da/dt has been calculated through theequation:
da
dt¼ ðdH=dtÞ
DHtotal epoxy
ð2Þ
where dH/dt is the heat flow as a function of the cure timeobtained from the isothermal DSC experiments.
2.4. Phase-morphology studies
The samples were fractured under liquid nitrogen and thedispersed rubber phase was extracted using toluene for 10 hat ambient temperature. The dried samples were sputter-coatedwith gold prior to SEM examination. JEOL JSM 5800 modelscanning electron microscope was used to view the specimens.
Table 1
Characteristics of CTBN
Propertiesa CTBN (1300*8)
Molecular weight, Mn (g mol�1) 3500
Acrylonitrile content (wt%) 18
Viscosity, Brookfield, cp (300 K) 570,000
Specific gravity 0.960
Solubility parameter, d (cal/cm3)1/2 9.14
Tgb (K) 215
a Material and data supplied by Huntsmann Co.b Glass transition temperature determined by DSC.
Several micrographs were taken for each sample. The dimen-sion of the dispersed phase was analyzed by image analyzer.
2.5. Dynamic mechanical thermal analysis
The viscoelastic properties of the modified epoxies as wellas the neat resin cured at different temperatures were mea-sured using TA instruments DMA 2960 dynamic mechanicalthermal analyzer. The samples were cured at 140, 150, and180 �C (as explained previously) and the analysis was donein a dual cantilever mode. The samples were heated from�100 to 250 �C at the heating rate of 3 �C/min. The frequencyused was 1 Hz.
3. Results and discussions
Typical plots of conversion (a) versus time of the neatepoxy cured at various temperatures of study are shown inFig. 2. The shape of the curve is similar to that expected foran autocatalytic reaction and similar to that observed for otherepoxy matrixes [32]. The curing reaction of a thermoset isa thermally catalyzed one and maximum conversion is attainedearlier at a higher curing temperature (Tcure). A similar trendwas observed during the kinetic study of the curic reactionfor a system of bisphenol-S epoxy resin (BPSER) with diami-nodiphenyl sulfone (DDS) as a curing agent [33]. And also,the curic reaction kinetics of a system of o-cresol formalde-hyde epoxy resin/succinic anhydride/tertiary amine, studiedby Ma and Gao [25] have noted a similar thermal evolution.As the curing progresses, epoxy resin undergoes polymeriza-tion to form three-dimensional network and hence the Tg ofthe system increases. Complete cure usually occurs at temper-atures in the vicinity of the maximum glass transition temper-ature. This is indicative of autocatalytic kinetics in the firststage of cure and diffusion controlled reaction (to be discussedlater) as the Tg rises [33]. When Tcure¼ 120 �C, the conversionreaches only to a stage of a¼ 0.97 and not to the maximum
0 1000 2000 3000 4000 5000 6000 70000.0
0.2
0.4
0.6
0.8
1.0
conv
ersi
on (α
)
time (s)
120 °C150 °C140 °C
neat epoxy
Fig. 2. Conversion versus time for neat epoxy cured at different temperatures.

1699R. Thomas et al. / Polymer 48 (2007) 1695e1710
level of a z 1.0. Also, the maximum possible conversion oc-curs in a higher period of time (t z 6740 s). However, ata higher temperature (Tcure¼ 140 �C), the degree of conver-sion becomes maximum (a¼ 0.99) in a lesser period oftime. When Tcure¼ 150 �C, the conversion plot comes to anend at time t z 3400 s. Again it is interesting to notice a de-crease in the maximum conversion by a fraction of 0.02(a¼ 0.97) when Tcure¼ 150 �C, as compared to that of a com-paratively lesser curic temperature, Tcure¼ 140 �C (a¼ 0.99).This can be explained based on the glass transition tempera-ture of the neat epoxy matrix. The Tg of the cured neat epoxywhen Tcure¼ 140 �C is 135 �C (as read from Fig. 14). It isnearer to the Tcure and maximum degree of conversion is pos-sible at this temperature. However, when the sample gets curedat 150 �C, the reaction and hence the network formation be-comes more speedy and the system reaches the stage of gela-tion before attaining the maximum degree of conversion. Also,in the present system, the initial speed of the reaction isslightly higher at 140 �C than at 150 �C. This may probablybe attributed to the immediate incipient formation of cross-linking structures at high temperatures that causes to slowdown the reaction comparatively.
Fig. 3 depicts conversion versus time at Tcure¼ 150 �C forneat and modified epoxies with varying weight contents ofCTBN. At a particular cure time, there is slight reduction inconversion for rubber-modified systems which is mainlyattributed to the physical changes like dilution effect and/orviscosity increase as a result of the liquid rubber addition[34e36] or by the reduction in the density of the reactivegroups [37]. The thermoset reactions are accelerated by ther-mal effect. Similar final conversions after isothermal curingwere observed by Fernandez et al. [38] for the tetraglycidyldiaminodiphenyl methane epoxy (TGDDM/DDM/PMMA)system.
Fig. 4(a)e(c) shows the isothermal rate of curing reactionversus time for the curing of the neat as well as CTBN-modified epoxies at 120, 140, and 150 �C, respectively. The
0 500 1000 1500 2000 2500 3000 3500 40000.0
0.2
0.4
0.6
0.8
1.0
Con
vers
ion,
α (-
)
Time (s)
1 neat2 5 phr3 10 phr4 15 phr5 20 phr
Tcure = 150 °C12345
Fig. 3. Conversion versus time for neat and modified epoxies cured at 150 �C.
above curves illustrate that the rate of curing increases withincrease in curic temperatures. The reaction rate increases withtime at a particular temperature and it occurs through a maxi-mum after the start of the reaction, showing autocatalyticnature. The reaction mechanism remained the same even afterthe inclusion of the liquid rubber. The maximum peak value ofthe rate of the reaction is higher as the isothermal temperatureis higher and shifts to shorter period of time with increase inisothermal temperature.
It is significant to discuss the curic reaction mechanism ofneat DGEBA/anhydride and DGEBA/anhydride/CTBN sys-tems in this context. Scheme 1 explains the curic reactionmechanism between the anhydride and the epoxy resin. Thereaction between the anhydride and the secondary hydroxylgroup of the epoxy resin results in the formation of a monoes-ter. The newly generated carboxyl group, then, reacts with theepoxide group and also with the secondary hydroxyl groupto form a diester. Thus the curic reaction initiates to form anetwork structure.
It is a known fact that the interaction of epoxy compoundswith anhydrides, amines and other nucleophiles is promotedby the addition of hydroxyl-containing compounds like water,alcohols, phenols, etc. Here the reaction is supposed to pro-ceed, initially, through a trimolecular transition state as Smith[39] has explained in the reaction of epoxy compounds withamines as shown below:
CH2CH CH2
O
N
HOR
The reaction was found to obey an nth order kinetics (to bediscussed later) as the maximum curic reaction rate was ob-served at t¼ 0 when carried out in the presence of hydroxyl-containing solvent. This is due to the participation of proton.But the cure kinetics of neat as well as modified epoxiesshow a maximum reaction rate at t> 0, negating the simplenth order kinetics.
Also, the tertiary amine acts as a catalyst during the courseof the reaction and the reaction is initiated by the activation ofthe anhydride as illustrated in Scheme 2. The negative oxygenion reacts with the epoxy group as well as with the anhydride.The mechanism is not a typical tertiary amine catalytic re-action, as the amine is not reformed in the reaction. Thus,an excellent network structure is formed in the epoxyeanhydride system [40]. As curing progresses, the cross-linkingdensity of the matrix increases and the liquid rubber becameno more soluble in the epoxy and ultimately the rubber getsphase separated out as domains in the epoxy matrix. Thesedomains hinder the curing reaction and the system reachesto a vitrified state e a physical transformation from liquidto glassy state via rubbery state.
Typical plots of the rate of cure versus conversion for theneat and modified systems at 120, 140, and 150 �C curic tem-peratures are depicted in Fig. 5(a)e(c). From the figures it isevident that the reaction rate for higher modified systemsand the extent of conversion for all modified systems

1700 R. Thomas et al. / Polymer 48 (2007) 1695e1710
(a)
0 1000 2000 3000 4000 50000.000
0.005
0.010
0.015
0.020
0.025
0.030
0.035
0.040
0.045
Rat
e (s
-1)
Rat
e (s
-1)
Rat
e (s
-1)
Time (s)
1. neat epoxy 2. 5 phr 3. 10 phr 4. 15 phr5. 20 phr
1. neat epoxy 2. 5 phr 3. 10 phr 4. 15 phr5. 20 phr
1. neat epoxy2. 5 phr3. 10 phr4. 15 phr5. 20 phr
Tcure = 120 °C Tcure = 140 °C
Tcure = 150 °C
1
2345
(b)
0 500 1000 1500 20000.00
0.02
0.04
0.06
0.08
0.10
0.12
0.14
Time (s)
1
2345
(c)
0 500 1000 15000.00
0.05
0.10
0.15
0.20
Time (s)
12
3
45
Fig. 4. Rate versus time for neat and modified epoxies at an isothermal curic temperature of (a) 120, (b) 140, and (c) 150 �C.
decreased with increase in CTBN content at a particular tem-perature. The rate of conversion significantly increases withincrease in temperature for neat as well as modified systems,showing the thermal effect of the curic reaction. A linear en-hancement in the reaction rate with conversion was indicatedfor all modified systems during the initial stages of cure atall temperatures. However, a deviation in the rate of reactionfrom linearity was noticed as conversion proceeds (up to60e80% of conversion, depending on the curing temperature).Deviations observed are attributed to the fact that the reactionbecomes diffusion controlled at the onset of gelation (thediffusion controlled model to be discussed next). As the curicreaction proceeds, the epoxy resin seems to develop a three-dimensional network structure with the liquid rubber, as thecarboxyl functionality of the CTBN and hydroxyl functional-ity of the epoxy resin react to a certain extent. The course ofthe reaction is depicted in Scheme 3. The carboxyl functional-ity of CTBN reacts with the secondary hydroxyl groups of theepoxy resin to form a diester. Similarly, the carboxyl groups
can also react with the epoxide group to generate a diester.Thus, a large excess of bisepoxy resin results and the rubberbeing encapped at both ends by one unit of epoxy. Further re-action of the rubber containing diepoxide may occur with theunreacted epoxy. The overall contribution of Schemes 1e3 re-sults in the formation of a three-dimensionally cross-linkednetwork. There is a simultaneous increase in molecular weightand viscosity along with the development of the network struc-ture. As a result, the rubber and epoxy become less compatibleand a phase separation state is reached whereby rubber-richdomains precipitate in the epoxy-rich matrix and the liquidrubber becomes phase separated. Thus ultimately, in the latestage of the curing process, the sample approaches a solidstate. The movement of the reacting groups and the productsis greatly diminished and the rate of reaction, which was pre-viously controlled by the chemical kinetics, now becomes dif-fusion controlled. Now the movement of the reacting groupsand the products is possible only by diffusion. Thus the curingslows down since further possible reaction is only due to

1701R. Thomas et al. / Polymer 48 (2007) 1695e1710
diffusion. Higher rubber content inclusion may cause moredilution and thus flexibilize the matrix instead of enhancingthe reaction rate.
3.1. Kinetic model and activation energies
Many researchers [41e43] have employed an nth orderkinetic model to explain the curic reactions of a thermoset.But the defect of these models is the lack of prediction ofthe peak observed in the isothermal rate of the reaction curveor the sigmoidal shape of the heat of the reaction curve. Alsosuch a kinetic model could never explain the entire curic reac-tion of a thermoset due to the physical transformations such asgelation and vitrification occurring during the curic reactionthat lead to the network formation of the matrix. It is evident
RC
RC
O
H3C
RCC
O
O
O
CH
OHC
O
OHOCH
C
O
O
OHOCH + CH2 CH
O
+
RC
OCH2CH
OH
C
O
O
OCH
+R
C OCHOCHC
O
O
CH
OH
R =
RC
O
C OHOCH
O
epoxide Diester
anhydride 2° hydroxyl group monoester
Diester
Scheme 1. Curic reaction mechanism of the anhydride and the epoxy resin.
from the curves that a maximum reaction rates are attained attime t> 0, and hence the nth order kinetics becomes invalidand suggests the autocatalytic model. The nth order kineticmodel is applicable only if the maximum reaction rate isobserved at t¼ 0. But as per the autocatalytic model, therate attains a maximum value at an intermediate conversion.The autocatalytic kinetics, expressed by Kamal [44], as givenbelow, is suitable to explain the isothermal curing behavior.
da
dt¼ ðk1þ k2amÞð1� aÞn ð3Þ
where a¼ extent of the reaction, obtained by the partial areaunder a DSC trace versus time, t. k1 and k2 are the specificrate constants of the models and are functions of temperature,m and n are the reaction orders and (mþ n) is the overallreaction order. Eq. (3) represents the experimental observa-tions (Fig. 4(a)e(c)) that the maximum in the exothermalcurve occurs at some point t> 0, and that the rate of the reac-tion at t¼ 0 is not zero, thereby excluding the simple nth orderkinetics. This has been successfully applied to similar epoxysystems [18]. To compute the parameters of Eq. (3) fromexperimental data, several methods have been proposed inthe literature [45e48]. In many of them the total reaction order(mþ n) was assumed to be 2, restraining the range of applica-tion of the proposed model.
To investigate the cure kinetics, isothermal DSC scans weredone at three curing temperatures say at 120, 140, and 150 �C.The experimental value of the rate of reaction da/dt and con-version (a) for the complete course of the reaction was com-puted and adjusted with the kinetic equation. In the presentstudy, the kinetic parameters k1, k2, m and n were estimatedwithout any constraints on them by fitting the experimentaldata of da/dt versus a at different temperatures using a non-linear least-square procedure. The typical representative plotsof the experimental data and the data obtained by autocatalyticmodel for the neat as well as modified epoxies at curic temper-atures 120 and 140 �C are shown in Figs. 6 (aee) and 7 (aee).The data of experimental as well as model predictions are wellin agreement at lower conversions, which represent the initial
C
CH2 CH
C
COO
COOCH2CHO
R'COO
R3N
COO
R3N+
R3N+
R3N+
R3N+
R3N+
C
O
O
O
+ CO
CO
+O
CO
COOCH2CHOCCO
COOCH2CHO + C
O
O
O
O
R'
R'R'
R'
R'C
O
R'
R'
3°amine anhydride
Scheme 2. Curic reaction mechanism of the anhydride and the epoxy in the presence of a tertiary amine.

1702 R. Thomas et al. / Polymer 48 (2007) 1695e1710
(a)
0.000
0.005
0.010
0.015
0.020
0.025
0.030
0.035
0.040
0.045
Rat
e (s
-1)
Rat
e (s
-1)
(b)
0.00
0.02
0.04
0.06
0.08
0.10
0.12
0.14
0.80.0 0.2 0.4 0.6 1.0Conversion, α (-)
0.80.0 0.2 0.4 0.6 1.0Conversion, α (-)
neat epoxy 5 phr 10 phr 15 phr20 phr
neat5 phr 10 phr 15 phr20 phr
Tcure = 120 °C Tcure = 140 °C
Rat
e (s
-1)
(c)
0.00
0.05
0.10
0.15
0.20
0.80.0 0.2 0.4 0.6 1.0Conversion, α (-)
neat5 phr 10 phr 15 phr20 phr
Tcure = 150 °C
Fig. 5. Rate versus conversion for neat and modified epoxies at an isothermal curic temperature of (a) 120, (b) 140, and (c) 150 �C.
stages of the curic reaction. But in the later stages of the curicreaction, i.e., at higher conversions the data of the model pre-dictions slightly deviate from that of the experimental. Thus inthe later stages of cure, the reaction was controlled by diffu-sion mechanism rather than by kinetic parameters. Differencebetween model predictions and experimental data is observed
HOOC - R -COOH CH
OH
HOOC - R -COOH CH2 CH
OHC-H2CO-C-R-C-OCH2-CH
O OHOH O
+
+
CTBN 2°hydroxyl group
HC-O-C-R -OCH
O
-C
O
diester
epoxy group diester
Scheme 3. Curic reaction of CTBN with epoxy resin.
to be greater when curing temperature decreases. This is re-lated to the Tg of the fully cured material. The free volumeis reduced, if the curing temperature is close to the glasstransition region of the highly cured material. The segmentalmobility within the polymer decreases, thereby reducing therate of diffusion of the molecules to the reactive sites. Thusthe reaction rate decreases. Since there are two kinetic con-stants k1 and k2, two activation energies Ea1 and Ea2 couldbe obtained by plotting ln k1 and ln k2 versus 1/T. The slopesof the plots were used to estimate the activation energiesEa1 and Ea2. The kinetic parameters obtained for the systemsat all curic temperatures after a large number of iteration aregiven in Tables 2e4. The overall reaction order (mþ n) wasobserved to be in the range of 1.5e2.5 at 120 and 140 �Cand greater than 2 at 150 �C. The values of m and n were inthe range of 0.5e1.0 and 1e2.5 for the neat resin as well asfor the blends. Generally speaking, the (mþ n) value increaseswith temperature. This is attributed to the trimolecular

1703R. Thomas et al. / Polymer 48 (2007) 1695e1710
0.000
0.005
0.010
0.015
0.020
0.025
0.030
0.035
0.040experimentalautocatalytic fit
Rat
e (s
-1)
0.80.0 0.2 0.4 0.6 1.0Conversion, α (-)
(e)
20 phr
0.000
0.005
0.010
0.015
0.020
0.025
0.030
0.035
0.040
0.00
0.01
0.02
0.03
0.04
0.05experimental valueautocatalytic fit
experimentalautocatalytic fit
experimentalautocatalytic fit
experimentalautocatalytic fit
0.80.0 0.2 0.4 0.6 1.0
Rat
e (s
-1)
0.000
0.005
0.010
0.015
0.020
0.025
0.030
0.035
0.040
Rat
e (s
-1)
0.000
0.005
0.010
0.015
0.020
0.025
0.030
0.035
Rat
e (s
-1)
Rat
e (s
-1)
Conversion, α (-)0.80.0 0.2 0.4 0.6 1.0
Conversion, α (-)
0.80.0 0.2 0.4 0.6 1.0Conversion, α (-)
0.80.0 0.2 0.4 0.6 1.0Conversion, α (-)
(c) (d)
(b)(a)
10 phr 15 phr
5 phrneat epoxy
Fig. 6. (aee) Comparison of experimental data with model predictions: rate versus conversion at 120 �C.
mechanism reported earlier [39]. Few of the hydroxyl groupsin the molecular chain of the epoxy resin participate in thereaction. However, this curing reaction is not a standard nthorder reaction. The eOH group in the molecular chain of theepoxy resin can become proton donor and participate in thereaction with the increasing curing temperature. The reactionshould follow a trimolecular mechanism with the participationof the proton. This is the reason for the increase in the (mþ n)value with the temperature. Similar results in the curing ofepoxies are reported elsewhere [25]. The correlation for k1
values was found to be poor compared with that for k2. Thisis because k1 is computed only with the two or three of the first
experimental data that may lead to imprecise calculatedvalues. It was observed that generally the k1 values of neatand modified epoxies are low compared with those obtainedfor k2. According to Arrhenius relationship, the reaction con-stants k1 and k2 depend on temperature, as per the relation:
k ¼ A expð �Ea=RTÞ ð4Þ
The higher values of the reaction rates are evident in this sys-tem. Fig. 8 is a typical Arrhenius plot. The activation energyvalues, Ea1 and Ea2, obtained for the neat epoxy and CTBN-modified epoxies are tabulated in Table 5. The activation

1704 R. Thomas et al. / Polymer 48 (2007) 1695e1710
experimentalautocatalytic fit
0.80.0 0.2 0.4 0.6 1.00.00
0.02
0.04
0.06
0.08
0.10
0.12
Rat
e (s
-1)
Conversion, α (-)
(e)
20phr
0.80.0 0.2 0.4 0.6 1.00.00
0.02
0.04
0.06
0.08
0.10
0.12
Rat
e (s
-1)
Conversion, α (-)0.80.0 0.2 0.4 0.6 1.0
0.00
0.02
0.04
0.06
0.08
0.10
0.12
Rat
e (s
-1)
Conversion, α (-)
experimentalautocatalytic
experimentalautocatalytic fit
experimentalautocatalytic fit
experimentalautocatalytic fit
(a)
0.80.0 0.2 0.4 0.6 1.0
0.02
0.04
0.06
0.08
0.10
0.12
Rat
e (s
-1)
Conversion, α (-)
neat
(b)
5phr
0.80.0 0.2 0.4 0.6 1.00.00
0.02
0.04
0.06
0.08
0.10
0.12
Rat
e (s
-1)
Conversion, α (-)
(d)
15phr(c)
10phr
Fig. 7. (aee) Comparison of experimental data with model predictions: rate versus conversion at 140 �C.
energies for the curing of CTBN-modified blends exhibita larger value compared to the neat resin. This is becausethe phase separated CTBN hinders the reaction betweenepoxide and anhydride.
Table 2
Autocatalytic model constants for CTBN-modified epoxy blends at 120 �C
Epoxy systems m n mþ n k1� 10�3 (min�1) k2� 10�3 (min�1)
Neat epoxy 0.23 1.05 1.28 2.2 67.1
5 phr CTBN 0.47 1.22 1.69 15.0 91.8
10 phr CTBN 0.88 1.07 1.95 25.3 93.6
15 phr CTBN 0.47 1.51 1.98 33.8 92.0
20 phr CTBN 0.61 2.01 2.62 13.4 115.3
3.2. Diffusion factor
The diffusion control in curic reaction was explained bya semiempirical relationship. This is based on free volume
Table 3
Autocatalytic model constants for CTBN-modified epoxy blends at 140 �C
Epoxy systems m n mþ n k1� 10�3 (min�1) k2� 10�3 (min�1)
Neat epoxy 0.24 1.33 1.57 15.8 291.0
5 phr CTBN 0.52 1.81 2.33 20.8 325.0
10 phr CTBN 0.45 1.47 1.92 31.1 270
15 phr CTBN 0.39 1.43 1.82 14.8 264
20 phr CTBN 0.36 1.34 1.70 11.0 243

1705R. Thomas et al. / Polymer 48 (2007) 1695e1710
considerations and was proposed by Chern and Poehlein [49],Khana and Chanda [50] have successfully applied this equa-tion for a catalyzed epoxyeanhydride system. After attaininga critical value, ac, the conversions become diffusion con-trolled and the corresponding rate constant, kd, is given by:
kd ¼ kceð�Cða�acÞÞ ð5Þ
where kc is the rate constant for chemical kinetics and C isa parameter.
Eq. (5) means an abrupt change in the diffusion controlfrom chemical control for the curic reaction after the conver-sion reaches the critical value, ac. But this change is gradualand there is a region where both factors control.
The overall effective rate constant, ke, can be expressed interms of kd and kc.
1
ke
¼ 1
kd
þ 1
kc
ð6Þ
Table 4
Autocatalytic model constants for CTBN-modified epoxy blends at 150 �C
Epoxy systems m n mþ n k1� 10�3 (min�1) k2� 10�3 (min�1)
Neat epoxy 0.40 1.69 2.09 23.6 539
5 phr CTBN 0.68 2.89 3.57 50.6 1167
10 phr CTBN 1.02 2.70 3.72 89.0 1852
15 phr CTBN 1.3 2.5 3.8 64.8 3836
20 phr CTBN 1.5 2.6 4.1 75.4 460
2.35 2.40 2.45 2.50 2.55-3.0
-2.5
-2.0
-1.5
-1.0
-0.5
ln k
1
1000/T (1/K)
Fig. 8. Arrhenius plot for rate constants.
Table 5
Activation energy values for neat and modified epoxies
Epoxy systems Ea1 (kJ mol�1) Ea2 (kJ mol�1)
Neat epoxy 71.2 96
5 phr CTBN 73.1 112.2
10 phr CTBN 75.4 118.6
15 phr CTBN 81.5 122.4
20 phr CTBN 98.4 140.3
The diffusion factor, f(a) [51], is defined from the aboveequations as:
f ðaÞ ¼ ke
kc
¼ 1
1þ eð�Cða�acÞÞð7Þ
with C and ac, the diffusion coefficient and the critical conver-sion, being two empirical parameters. When a is much smallerthan the critical value, a� ac, eð�Cða�acÞÞz0, then ke z kc,f(a) approximates to unity, the reaction is kinetically con-trolled and the effect of diffusion is negligible. When a
increases and approaches to ac, f(x) begins to decrease. Ata¼ ac, f(x) becomes 0.5 and beyond this point, approacheszero as the reaction effectively stops. But the change is notabrupt, rather a gradual one. This is the region where bothfactors are controlling. The effective reaction rate at anyconversion is given by the chemical reaction rate multipliedby f(a) [22].
The value of f(a) is considered as the ratio of the experi-mental reaction rate to the reaction rate predicted by the auto-catalytic model. During the early stages of cure the value off(a) is near unity. As the curing proceeds, the value decreasesdue to the onset of diffusion control. Fig. 9 depicts the plots off(a) versus conversion, a, at different curing temperatures fora 10 phr modified system. A possible explanation can be givenon the basis of the change in the Tg values as curing prog-resses. A schematic model of the curic reaction and the result-ing phase separation phenomenon is illustrated in Fig. 10. Atthe initial stage, a homogenous blend was obtained as repre-sented in A, which consists of only the components of theblend. The short wavy lines represent the components of theblend. At the very start of the curing reaction the degree ofcure was low and the system had a very low Tg value. Asthe reaction proceeds, a gradual and slow increase in mo-lecular weight takes place and this transition is a reflectionof the movement of linear molecular chains that are formedin the system, represented by B. During this early stage of
0.0 0.2 0.4 0.6 0.8 1.00.0
0.2
0.4
0.6
0.8
1.0
f (α)
(α)
120 °C140 °C150 °C
10 phr
Fig. 9. Plot of diffusion factor, f(a), versus conversion at different curic
temperatures for 10 phr modified epoxy.
1706 R. Thomas et al. / Polymer 48 (2007) 1695e1710
(a) (b) (c)
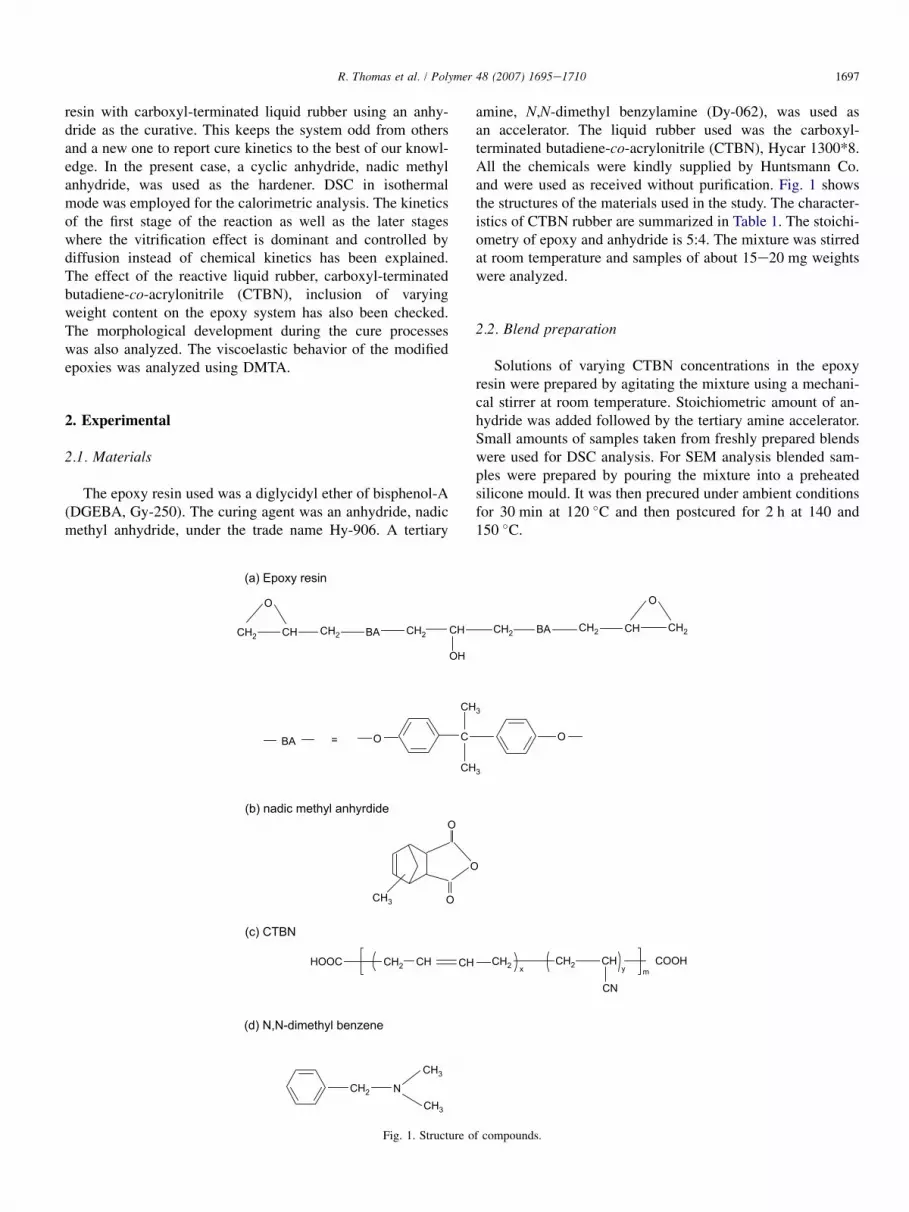
Fig. 10. A schematic representation of curic reaction and phase separation.
polymerization, only linear molecular chains prevailed in thesystem and have enough freedom to collide with other mole-cules to participate in the reaction. The long wavy lines repre-sent linear chains. This resulted in a high reaction rate. Anumber of arrows symbolize this situation. Phase separationinitiates at this stage, shown by spherical domains. As the mo-lecular weight is further increased, the system attains a gelstate, the mobility was limited, and reaction rate decreasedand became diffusion controlled. The reduction in the numberof arrows and later the broken arrows signifies this transforma-tion. Few cross-links are also developed during this change ofstate. The phase separation and the formation of domains be-come maximum. Both C and D in the scheme represent thisstage of development. The cross-linking density increasedwith cure time, and the Tg of the network was increasedwith a reduction in the distance between cross-link points.The Tg value, further, increased and approached Tcure, thesample attained the vitrified state as represented by E.
4. Morphological analysis
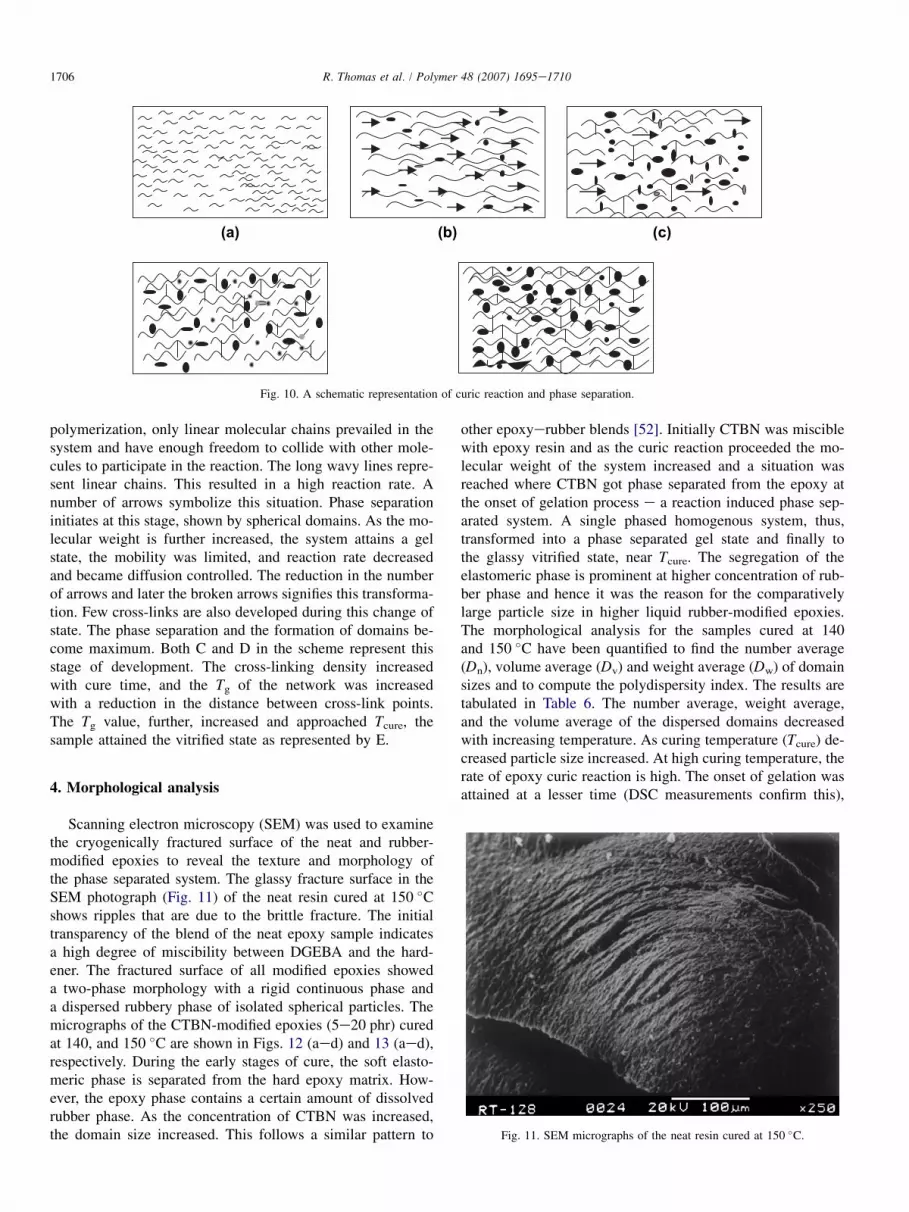
Scanning electron microscopy (SEM) was used to examinethe cryogenically fractured surface of the neat and rubber-modified epoxies to reveal the texture and morphology ofthe phase separated system. The glassy fracture surface in theSEM photograph (Fig. 11) of the neat resin cured at 150 �Cshows ripples that are due to the brittle fracture. The initialtransparency of the blend of the neat epoxy sample indicatesa high degree of miscibility between DGEBA and the hard-ener. The fractured surface of all modified epoxies showeda two-phase morphology with a rigid continuous phase anda dispersed rubbery phase of isolated spherical particles. Themicrographs of the CTBN-modified epoxies (5e20 phr) curedat 140, and 150 �C are shown in Figs. 12 (aed) and 13 (aed),respectively. During the early stages of cure, the soft elasto-meric phase is separated from the hard epoxy matrix. How-ever, the epoxy phase contains a certain amount of dissolvedrubber phase. As the concentration of CTBN was increased,the domain size increased. This follows a similar pattern to
other epoxyerubber blends [52]. Initially CTBN was misciblewith epoxy resin and as the curic reaction proceeded the mo-lecular weight of the system increased and a situation wasreached where CTBN got phase separated from the epoxy atthe onset of gelation process e a reaction induced phase sep-arated system. A single phased homogenous system, thus,transformed into a phase separated gel state and finally tothe glassy vitrified state, near Tcure. The segregation of theelastomeric phase is prominent at higher concentration of rub-ber phase and hence it was the reason for the comparativelylarge particle size in higher liquid rubber-modified epoxies.The morphological analysis for the samples cured at 140and 150 �C have been quantified to find the number average(Dn), volume average (Dv) and weight average (Dw) of domainsizes and to compute the polydispersity index. The results aretabulated in Table 6. The number average, weight average,and the volume average of the dispersed domains decreasedwith increasing temperature. As curing temperature (Tcure) de-creased particle size increased. At high curing temperature, therate of epoxy curic reaction is high. The onset of gelation wasattained at a lesser time (DSC measurements confirm this),
Fig. 11. SEM micrographs of the neat resin cured at 150 �C.

1707R. Thomas et al. / Polymer 48 (2007) 1695e1710
15 phr 20 phr
5 phr 10 phr
(a) (b)
(c) (d)
Fig. 12. SEM micrographs of the modified blends cured at 140 �C.
15 phr 20 phr
5 phr 10 phr
(a) (b)
(c) (d)
Fig. 13. SEM micrographs of the modified blends cured at 150 �C.

1708 R. Thomas et al. / Polymer 48 (2007) 1695e1710
which resulted in a lower degree of coalescence of particlesand ultimately in the phase separation of smaller particles.The increase in the viscosity of the system, the difference inthe solubility parameters, and surface tension of the rubberyphase [53] during the cure process, all adds to the formationof particles. The volume average domain size increased withthe concentration of CTBN content at a particular temperature.The polydispersity index was found to be greater than one inall cases.
5. Dynamic mechanical thermal analysis (DMTA)
Fig. 14 represents tan d versus temperature plots for theneat epoxy resin cured at 140, 150, and 180 �C. Tg decreaseswith decrease in curing temperature. The decrease in Tg wasattributed to the reduced conversion as a result of the loweringof curing temperature. The reaction practically stops afterattaining the vitrified state.
The tan d versus temperature curves for neat and modifiedepoxies at Tcure¼ 180 �C with different wt% of CTBN areshown in Fig. 15(a). The low-temperature region of the aboverelaxation curves is depicted in Fig. 15(b). The modifiedepoxies show two relaxation peaks. The higher peak notedat ca.140 �C is the Tg of the cured sample. The peak observed
Table 6
Dispersed particle size and polydispersity of the modified epoxies cured at
different temperatures
CTBN
composition
(phr)
Curing temperature (�C)
140 150
Dn
(mm)
Dv
(mm)
Dw
(mm)
PI Dn
(mm)
Dv
(mm)
Dw
(mm)
PI
5 0.84 1.31 0.90 1.07 0.81 1.28 0.87 1.06
10 0.86 1.42 0.93 1.08 0.82 1.39 0.92 1.11
15 0.87 1.53 0.97 1.11 0.86 1.46 0.94 1.09
20 0.91 1.65 1.05 1.15 0.88 1.55 0.97 1.10
-100 -50 0 50 100 150 200-0.2
0.0
0.2
0.4
0.6
0.8
1.0
1.2
1.4
1.6
1.8
tan
δ
temperature (°C)
140 °C 150 °C 180 °C
Fig. 14. Tan d versus temperature of the neat epoxy cured at 140, 150, and
180 �C.
at ca. �50 �C, b transition, is assigned due to the glass transi-tion of rubber as reported in the literature [54]. The addition ofthe liquid rubber lowers the Tg of the cured network, however,this become more significant when the wt% of CTBN ishigher. This is due to the incorporation of the liquid rubberphase into the epoxy matrix where it acts as a flexibilizer.The pure epoxy also shows a broad peak at low temperatureand this is contributed due to the crankshaft motion of theglyceryl-like groups in DGEBA [55,56]. The CTBN additionresulted in a slight change in the b-transition temperature.As the weight content of rubber increased, the Tg of the rubbermoved slightly to higher temperature. This shows that therubber domains have epoxy dissolved within the system in amolecular scale. Similarly, the continuous epoxy phase hassome dissolved rubber phase which is miscible in a molecularscale. Tgs of the neat and various wt% modified blends atdifferent Tcures are tabulated in the Table 7. The Tgs of bothphases decreased with decrease in curing temperature. A
(a)
-100 -50 0 50 100 150 200-0.2
0.0
0.2
0.4
0.6
0.8
1.0
1.2
1.4
1.6
1.8
Tan
δ
Temperature (°C)
neat5 phr 10 phr15 phr
Tcure = 180 °C
(b)
-100 -90 -80 -70 -60 -50 -40 -30 -20 -10 00.01
0.015
0.02
0.025
0.03
0.035
0.04ta
n δ
Temperature (°C)
0
5
10
15
Fig. 15. (a) Tan d versus temperature of the neat and modified epoxies at
Tcure¼ 180 �C. (b) Low-temperature region of the curves showed in (a).

1709R. Thomas et al. / Polymer 48 (2007) 1695e1710
schematic representation of the modified blend is depicted inFig. 16, which illustrates both of these phases in a modifiedblend.
The storage modulus of neat resin and the modified epoxieswith 5e20 wt% of CTBN are depicted in Fig. 17(a). The stor-age moduli of the modified epoxies with lower content ofCTBN are greater while that of a 20 phr blend is lower thanthat of the neat resin. At lower concentration, the phase sepa-rated CTBN leads to improved fracture toughness of the epoxynetwork. At a higher concentration, the liquid rubber flexibil-izes the epoxy matrix and reduces the cross-linking density.The decrease in the storage modulus is attributed to the lower-ing of the cross-linking density and plasticization effect of theliquid rubber into the epoxy matrix.
Fig. 17(b) represents the loss modulus, E00 versus tempera-ture for neat and modified blends at Tcure¼ 140 �C. The tran-sition peak becomes more intense by the cross-linking. Withmore and more inclusion of rubber, the peak shifts to lowertemperature. This is attributed to the dissolution of rubberinto the epoxy network, forming homogenous epoxy-richphase. Another reason for the peak shifting and broadeningcould be the decrease in the cross-linking density of the epoxyupon the incorporation of rubber. The distribution of relaxa-tion times of molecules in the epoxy matrix becomes broaderby the inclusion of more rubber.
6. Conclusion
A DGEBA-based epoxy resin was modified with a car-boxyl-terminated butadiene and acrylonitrile copolymer usingan anhydride hardener. The curing analysis was followed byDSC. The kinetic analysis was done by an autocatalytic
Table 7
Tg of CTBN-rich and epoxy-rich phases of blends cured at different
temperatures
CTBN
composition
(phr)
Curing temperature (�C)
180 150 140
Epoxy
rich
CTBN
rich
Epoxy
rich
CTBN
rich
Epoxy
rich
CTBN
rich
0 143.9 e 141 e 133 e5 140.6 �68 138 �69 130 e
10 132.8 �48 129.5 �52.5 127.2 �53.2
15 123.0 �43 121.2 �45 120.0 �46
100 e �78 e �79 e �80
model. The final stage of the reaction was analyzed by a diffu-sion control model. The physical transformations such asgelation and vitrification were examined and predicted. Theaddition of liquid rubber did not change the mechanism ofcure. However, on lowering the temperature, the rate and theextent of reaction decreased. The extent of reaction decreased
(b)
-100 -50 0 50 100 150 200
0
100
200
300
400Lo
ss M
odul
us (M
Pa)
Temperature (°C)
Tcure = 140 °C
(a)
-50 0 50 100 150 200
0
1000
2000
3000
4000
5000
6000
Stor
age
mod
ulus
( M
Pa)
Temperature (°C)
5
1
23
4
Tcure = 180 °C 1 = neat2 = 5 phr3 = 10 phr4 = 15 phr5 = 20 phr
neat10 phr15 phr
Fig. 17. (a) Storage modulus versus temperature of neat epoxy and blends
at Tcure¼ 180 �C. (b) Loss modulus versus temperature of neat epoxy and
modified blends at Tcure¼140 �C.
heatReaction induced phase
separation
Homogenous phase
Fig. 16. A schematic representation of phase separated blend. The double-headed broken arrow represents CTBN-rich domains having dissolved epoxy phase.
The solid arrow denotes epoxy-rich phase having dissolved CTBN phase. The dash type arrow shows cross-links in the epoxy matrix.

1710 R. Thomas et al. / Polymer 48 (2007) 1695e1710
after attaining the gelation point. This was due to the phaseseparation of rubber from the epoxy matrix. Addition ofa higher wt% of rubber decreases the rate and conversion.This was due to the dilution effect and increase in viscosity.Good fits are obtained between the autocatalytic model andthe experimental data up to the vitrification state. Afterwardsthe reaction became diffusion controlled. The reaction duringthe later stages of cure was explained by introducing a diffu-sion factor, which agrees well with the kinetic data. The curicreaction mechanism by which the network structure of epoxygets developed was discussed. The morphology developmentduring cure was monitored by SEM studies. Phase separatedmorphology was obtained. Homogenous particle size distribu-tion was observed for all blends. The SEM micrographs werequantified to find the size of the dispersed particles. The par-ticle size was increased on the addition of CTBN and on low-ering the curic temperature. The dynamic mechanical thermalanalysis of the cured (neat) resin showed a reduction in the Tg
value when Tcure was low. This is due to the lower conversionas a result of vitrification. The dynamic mechanical spectrumof the blends showed two Tgs corresponding to the modified-network and that of the rubber phase. The blends showedshifted Tgs on account of partial miscibility. The Tg of rubberphase was increased upon mixing with epoxy resin and thatof the epoxy phase decreased. The storage modulus of the mod-ified resin with a higher wt% of liquid rubber was lower corre-sponding to that of the neat resin, and that contain lower weightcontent of CTBN. This was due to the reduction in the cross-linking density and flexibilization of the epoxy network. Theshifted Tgs clearly indicate that the phases are not pure.
Acknowledgements
One of the authors (Raju Thomas) thanks the Catholic Uni-versity of Leuven, Belgium for analytical and financial supportof the work. The authors would like to thank Huntsmann forthe kind supply of chemicals for the study. Raju Thomasalso thanks Kerala State Council for Science, Technologyand Environment (KSCSTE) for SRS project.
References
[1] Bradleg TF. U.S. Patent; 1950. 449:2500.
[2] Caston P. U.S. Patent; 1943. 483:2324.
[3] Newey HA. U.S. Patent; 1958. 775:2264.
[4] Siebert AR. Rubber-modified thermoset resins. Adv. Chem. Series, vol.
208. Washington, DC; 1984. p. 179.
[5] Manzione LT, Gillham JK, McPherson CA. J Appl Polym Sci 1981;
26(889):907 and references cited therein.
[6] Kunz SC, Sayre JA, Assink RA. Polymer 1982;23:1897 and references
cited therein.
[7] Riew CK, Gillham JK, editors. Adv. Chem. Series, vol. 208. Washington
DC; 1984. p. 101.
[8] Riew CK, editor. Adv. Chem. Series, vol. 222; 1984.
[9] Paul NC, Richards DH, Thompson D. Polymer 1977;18:945.
[10] Baucer RS, editor. Epoxy Resin Chemistry 11. Washington, DC: ACS;
1983. p. 221.
[11] Bascom WD, Cottingham RL, Tones RL, Peyser P. J Appl Polym Sci
1979;19:2545.
[12] Smith RJM, Brekelmans WAM, Meijer HEH. J Mater Sci 2000;35:2855.
[13] Smith RJM, Brekelmans WAM, Meijer HEH. J Mater Sci 2000;35:2881.
[14] Henkee CS, Kramer EJ. J Polym Sci Polym Chem Ed 1984;22:721.
[15] ASTM E698-79, Annual book of ASTM standards, vol. 14; 1996. p. 2.
[16] Lange J, Altmann N, Kelley CT, Halley PJ. Polymer 2000;41:5949.
[17] Vergnaud JM, Bouzon J. Cure of thermosetting resins e modeling and
experiments. London: Springer-Verlag; 1992.
[18] Calabrese L, Valenza A. Eur Polym J 2003;39:1355.
[19] Caly J, Sabra A, Pascault JP. Polym Eng Sci 1986;26:1514.
[20] Zukas WX. Polym Eng Sci 1989;29:1553.
[21] Rosu D, Mititelu A, Cascaval CN. Polym Test 2004;23:209.
[22] Francis B, Poel GV, Posada F, Groeninckx G, Rao VL, Ramaswamy R,
et al. Polymer 2003;44:3687.
[23] Rosu D, Cascaval CN, Mustas F, Ciobanu C. Thermochim Acta 2002;
383(1e2):119.
[24] Nigel AJ, George AG. Polymer 1992;33(13):2679.
[25] Ma Z, Gao J. J Phys Chem B 2006;110:12380.
[26] Raman VI, Palmese GR. Macromolecules 2005;38:6923.
[27] Swier S, Assche GV, Vuchelen W, Mele BV. Macromolecules 2005;38:
2281.
[28] Becker O, Cheng YB, Varley RJ, Simon GP. Macromolecules 2003;36:
1616.
[29] Rebizant V, Venet AS, Tournilhac F, Pascault JP, Leibler L. Macromole-
cules 2004;37:8017.
[30] Kalogeras IM, Vassilikou-Dova A, Christakis I, Pietkiewicz D,
Brostow W. Macromol Chem Phys 2006;207:879.
[31] Yin M, Zheng S. Macromol Chem Phys 2005;206:929.
[32] Opalicki M, Kenny JM, Nicholias L. J Appl Polym Sci 1996;61:1025.
[33] Gao J, Li Y. Polym Int 2000;49:1590.
[34] Martinez I, Martin MD, Eceiza A, Cyanguren P, Mondragon I. Polymer
2000;41:1027.
[35] Cracknell JG, Akay MJ. Therm Anal 1993;40:565.
[36] Kim BS, Chiba T, Inoue T. Polymer 1993;34:2809.
[37] Jenninger W, Schawe JEK, Alig I. Polymer 2000;41:1577.
[38] Fernandez B, Corcuera MA, Marieta C, Mondragon I. Eur Polym J 2001;
37:1863.
[39] Smith IT. Polymer 1961;2:95.
[40] Park SJ, Kim TJ, Lee JR. J Polym Sci Part B Polym Phys 2000;38:2114.
[41] Acitelli MA, Prime RB, Sacher E. Polymer 1971;12:335.
[42] Prime RB, Sacher E. Polymer (London) 1972;13:455.
[43] Prime RB. Polym Eng Sci 1973;13:365.
[44] Kamal MR. Polym Eng Sci 1974;14:23.
[45] Barral L, Cano J, Lopez AJ, Lopez J, Nogueira P, Ramirez C. J Appl
Polym Sci 1995;56:1029.
[46] Ryan ME, Dutta A. Polymer 1979;20:203.
[47] Moroni A, Mijovic J, Pearce E, Foun C. J Appl Polym Sci 1986;32:3761.
[48] Kenny JM. J Appl Polym Sci 1994;51:761.
[49] Chern CS, Poehlein GW. Polym Eng Sci 1987;27:782.
[50] Khanna U, Chanda M. J Appl Polym Sci 1993;49:319.
[51] Rabinowitch E. Trans Faraday Soc 1937;33:1225.
[52] Karger-Kocsis J, Friedrich K. Compos Sci Technol 1993;48:263.
[53] Sayre JA, Assink RA, Lagasse RR. Polymer 1981;22:87.
[54] Thomas R, Abraham J, Thomas PS, Thomas S. J Polym Sci Part B Polym
Phys 2004;42:2531.
[55] Eklind H, Maurer FHJ. J Polym Sci Phys Ed 1996;34:1569.
[56] Eklind H, Maurer FHJ. Polymer 1997;38:1047.


