Embed Size (px)
Citation preview

This article appeared in a journal published by Elsevier. The attachedcopy is furnished to the author for internal non-commercial researchand education use, including for instruction at the authors institution
and sharing with colleagues.
Other uses, including reproduction and distribution, or selling orlicensing copies, or posting to personal, institutional or third party
websites are prohibited.
In most cases authors are permitted to post their version of thearticle (e.g. in Word or Tex form) to their personal website orinstitutional repository. Authors requiring further information
regarding Elsevier’s archiving and manuscript policies areencouraged to visit:
http://www.elsevier.com/copyright

Author's personal copy
Chemistry and Physics of Lipids 154 (2008) 68–77
Contents lists available at ScienceDirect
Chemistry and Physics of Lipids
journa l homepage: www.e lsev ier .com/ locate /chemphys l ip
Polymorphism and solid-state miscibility in the pentadecanoicacid–heptadecanoic acid binary system
Gabin Gbabodea,∗, Philippe Negriera, Denise Mondieiga, Evelyn Morenob,Teresa Calvetb, Miquel Angel Cuevas-Diarteb
a Centre de Physique Moleculaire Optique et Hertzienne, Universite Bordeaux I, 33405 Talence, Franceb Departament de Cristallografia, Mineralogia i Diposits Minerals, Universitat de Barcelona, 08028 Barcelona, Spain
a r t i c l e i n f o
Article history:Received 12 December 2007Received in revised form 4 April 2008Accepted 25 April 2008Available online 8 May 2008
Keywords:Fatty acidsPolymorphismSolid-state miscibilityHydrogen bondsPhase diagramStructural model
a b s t r a c t
The pentadecanoic acid–heptadecanoic acid (C15H29OOH–C17H33OOH) binary system is dealt with in thisarticle. Combined thermal analysis and X-ray powder diffraction experiments are performed to character-ize the polymorphism of the pure compounds and of their mixed samples. In particular, modern methodsof crystal structure resolution from powder data (direct space methods) are applied in order to investigateand compare the molecular arrangement within the solid phases of the fatty acids considered. A proposalof the binary phase diagram is given. It exhibits no less than eight distinct solid phases stabilized on rel-atively narrow domains of composition which shows the reduced miscibility of the constituents. Finally,a structural model of one of the intermediate solid solutions is developed which well accounts for themixing behaviour of the two fatty acids and permits to propose an explanation about their low solid-statemiscibility.
© 2008 Elsevier Ireland Ltd. All rights reserved.
1. Introduction
Numerous works have been undertaken in the past 10 years bythe members of our team concerning the polymorphism and solid-state miscibility of n-alkanes (CnH2n+2) (Rajabalee et al., 2000; Oonket al., 1998) and n-alkanols (CnH2n+1OH) (Ventola et al., 2002, 2003).They demonstrated in particular the feasibility of molecular alloysof n-alkanes as tuneable phase change materials (MAPCM) for ther-mal energy storage and thermal protection (Mondieig et al., 2003).It seemed interesting to pursue similar studies on other organicaliphatic long-chain compounds such as fatty acids (CnH2n−1OOH),as they are potential candidates for the applications. Indeed, theirphase change enthalpies are high (especially for the melting) andthey are also thermo-adjustable as temperatures of phase transi-tions are function of the chain length for pure compounds, andof the molar fraction for mixed samples. On the other hand, thestudy of the intermolecular interactions involved in these com-pounds (hydrogen bonds in particular) is of great interest too, sinceit should bring some indications to understand their crystal struc-
∗ Corresponding author at: Laboratory of Polymer Chemistry, Universite Libre deBruxelles, Boulevard du Triomphe CP206/1, 1050 Bruxelles, Belgium.Tel.: +32 2 650 53 88; fax: +32 2 650 54 10.
E-mail address: [email protected] (G. Gbabode).
ture and also their ability to form molecular alloys. This work couldbe also relevant for other domains of research as fatty acids are con-stituents of most of the fats present in foods, pharmaceuticals andalso cosmetics.
Several papers are reported on the pure materials (Francis et al.,1930; Sydow, 1954, 1955a,b,c; Berchiesi et al., 1976; Schaake et al.,1982; Goto and Asada, 1984; Gotoh, 1987; Kobayashi and Kaneko,1989) and on binary mixtures (Francis et al., 1930; Slagle and Ott,1933; Fieldes and Hartman, 1955; Moroi et al., 1972; Feldman et al.,1989; Dorfler and Pietschmann, 1990; Zhang et al., 2001) of fattyacids. Fatty acids arrange into bi-layers of molecules hold togetherby hydrogen bonds between the carboxyl groups. They exhibit veryrich polymorphism which differs with the parity of the number ofcarbon atoms. Namely, solid forms A, B, C and E (Francis et al., 1930;Goto and Asada, 1978; Gotoh, 1987; Kobayashi and Kaneko, 1989;Kaneko et al., 1990; Moreno et al., 2007) can be observed for even-numbered fatty acids and A′, B′, C′, C′′ and D′ (Francis et al., 1930;Gotoh, 1987; Kobayashi and Kaneko, 1989; Bond, 2004; Gbabodeet al., 2006, 2007) for odd-numbered ones. They are named thisway in decrease order of the inter-layer distance except for theE form which was discovered a little more recently (Goto andAsada, 1978; Kaneko et al., 1990). The existence of the C′′ formwas put forward by Bond (2004) and also by us (Gbabode et al.,2007) for the C13H25OOH and C15H29OOH. The crystal structuresof the C′ form of the fatty acids from C17H33OOH to C23H45OOH
0009-3084/$ – see front matter © 2008 Elsevier Ireland Ltd. All rights reserved.doi:10.1016/j.chemphyslip.2008.04.008

Author's personal copy
G. Gbabode et al. / Chemistry and Physics of Lipids 154 (2008) 68–77 69
have also been determined for the first time in the latter paper.The C′, C′′ and C forms are the only solid phases which melt. Theyare then called the high-temperature phases whereas all the othersolid forms are named the low-temperature phases, since theirstable state ranges below the transition to the high-temperaturephase. Contrary to pure compounds, the information on the poly-morphism of binary mixed samples of fatty acids is much morelimited. To our best knowledge, complete phase diagrams, estab-lished from both calorimetric and X-ray diffraction measurements,were only given in the article of Moroi et al. (1972). The phase dia-grams of the C12H23OOH–C18H35OOH and C14H27OOH–C18H35OOHbinary systems were presented. In particular, the existence of acompound was revealed at the equimolar fraction for both binarysystems and another one at around x = 0.12 (where x is the molarfraction of the longer acid) for the C12H23OOH–C18H35OOH binarysystem. Nevertheless, no structural characterization of these com-pounds was reported. As far as we know, no phase diagram ofodd–odd binary mixtures of fatty acids has been published yet.However, in another paper (Gbabode et al., in press), we have pro-posed a phase diagram for the pentadecanoic acid–hexadecanoicacid (C15H29OOH–C16H31OOH) binary system, for which the solidphases of the constituents are not isostructural at low as well asat high temperature. The phase diagram put forward a reducedsolid-state miscibility of the two acids.
Here, we point our interest on the pentadecanoicacid–heptadecanoic acid (C15H29OOH–C17H33OOH) binary system.The polymorphism of the constituents and also of their mixedsamples is investigated by means of X-ray powder diffraction andthermal analysis. In a first part, the crystallographic data of thevarious solid phases and the temperatures and enthalpies of phasetransitions are given for the pure compounds. Moreover, the crystalstructures of the solid forms of the two acids, determined fromX-ray powder data using direct space methods (see Section 2), arepresented and compared. In a second part, our proposal of phasediagram for the C15H29OOH–C17H33OOH binary system is giventogether with the relevant results from DSC and X-ray powderdiffraction experiments which allowed its drawing. The solid-statemiscibility of the two fatty acids is finally discussed from theanalysis of the phase diagram and also of the structural datadetermined for the pure compounds and the mixed samples. Inparticular, an original model of the disordered mixed structure ofthe solid solution, stabilized at high temperature for the equimolarcomposition, has been set up in order to illustrate the mixingbehaviour of the pentadecanoic and heptadecanoic acids.
2. Experimental
2.1. Materials
Samples of C15H29OOH and C17H33OOH were supplied by Fluka.The purity of both compounds is estimated by the supplier ashigher than 99%. The (1 − x)C15H29OOH–xC17H33OOH mixed sam-ples have been prepared, by the dissolution–evaporation methodusing diethyl ether. They were kept at room temperature from 1 to 2days under ventilation, in order to ensure the complete evaporationof the solvent.
2.2. Thermal analysis
Calorimetric measurements were carried out using aPerkinElmer DSC-7 instrument equipped with the cooling acces-sory allowing temperature rising from 110 to 950 K. Heating rate of2 K min−1 was currently used, but lower rates (0.5 and 0.2 K min−1)were also applied to distinguish phenomena with close temper-
atures of transition. Samples (about 4 mg) were put into sealedaluminium pans and weighed before and after the experiment tocontrol eventual mass loss. The shape factor method (Courchinouxet al., 1989) has been used to estimate the temperatures of endof transition of mixed samples (solvus superior and liquidus).Thermodynamic quantities are determined by averaging at leastfive experiments on each composition. The uncertainty on thetemperatures and enthalpies were determined using the Student’smethod with a 95% threshold of reliability. To this value was addedthe systematic error due to the calibration of the apparatus, whichwas set at ±0.2 K for the temperatures and ±1% for the enthalpies.
2.3. X-ray powder diffraction
Two X-ray powder diffractometers were used. Cu K� radiationwas selected in all cases as incident beam. Both of them were usedso as to provide isothermal experiments at different temperatures:
Siemens D500 works with a Bragg–Brentano geometry in the reflec-tion mode by a �/2� coupling of the sample and the detector. Thesamples were scanned with a step size of 0.02◦ and a step time of6 s. Powder (about 45 mg) is spread on a rectangular shape sam-ple support (15 mm × 10 mm). This particular geometry enhancesthe 0 0 � reflections because samples orient much more accordingto the symmetry of the holder. We currently explore the domains1–15◦ and 19–25◦ in 2� since, as regards the compounds underconsideration, they display the reflections with higher intensity.Inel CPS 120 works with the Debye–Scherrer transmission geom-etry and the diffracted beams are collected by gas ionisation(argon + C2H6) on a 120◦ curved counter. Samples are introducedin 0.5 mm diameter Lindemann glass capillaries. The latter rotatesaround its axis during the experiment in order to minimize prefer-ential orientations of the crystallites. Time of acquisition from 1 to6 h was used according to the cases. External calibration to convertthe measured 4096 channels to 2� degrees was applied using cubicNa2Ca3Al2F14 (Evain et al., 1993) by means of cubic spline fittings.The latter was combined with a low-angle calibration using sil-ver behenate (Huang et al., 1993), this material exhibiting severalreflections in the 2� range of 1.5–20◦.
2.4. Determination of the cell parameters
The cell parameters, the space groups and the crystal structuresof the stable solid forms of the two fatty acids were determinedfrom the X-ray powder diffraction patterns measured with the InelCPS 120.
The peak positions were determined after pseudo-Voigt fit-ting by the DIFFRACTINEL software. Potential solutions of cellparameters were obtained using the DICVOL (Boultif and Louer,1991) software. The cell parameters and the space group werefinally determined using the FULLPROF pattern matching proce-dure (Rodriguez-Carvajal, 1990).
The X-CELL software (Neumann, 2003) (available in the mod-ule POWDER INDEXING of the MATERIAL STUDIO application) wasalso used. It provides possible solutions of cell parameters andspace groups. The final solutions were obtained using a Pawleyprofile-fitting procedure (Pawley, 1981) implemented in the Mate-rial Studio application (Material Studio, 2004).
2.5. Determination of the structures
The molecule to be studied was drawn in a 3D worksheetand was minimized in energy by means of geometry optimisationusing the COMPASS force-field (Sun, 1998) to obtain the relevantdistances, angles and dihedral angles for its various bonds. This

Author's personal copy
70 G. Gbabode et al. / Chemistry and Physics of Lipids 154 (2008) 68–77
Fig. 1. X-ray diffraction pattern of the C′ form of C17H33OOH obtained at 333 K. Theh k l indexations of the reflections with higher intensities are indicated.
molecule was then set as a rigid body, but with the dihedral angleof the carboxyl group allowed to vary as this determines the goodestablishment of the hydrogen bonds. The rigid body was intro-duced in the unit cell whose dimensions had been previously found,together with its homologues related to the space group. The wholesystem was moved in the unit cell according to the seven degrees offreedom (three translations, three rotations and the dihedral angleof the carboxyl group), by using a Monte-Carlo type simulation(Engel et al., 1999) over several cycles to obtain the best reproduc-tion of the experimental X-ray powder diffraction pattern by thecalculated one. The final structure was then obtained after repeatedalternating application of Rietveld refinement (Rietveld, 1969) andgeometry optimisation by energy minimization in order to reachthe best agreement between X-ray powder diffraction and molec-ular interactions. The Rietveld procedure includes refinement ofthe translations, rotations and dihedral angle of the molecule, theglobal isotropic temperature factors and the preferred orientations,also with the parameters previously refined in the Pawley proce-dure (cell parameters, peak profile parameters, background andzero shift).
3. Results
3.1. Description and characterization of the polymorphism of thetwo fatty acids
Both C15H29OOH and C17H33OOH solids adopt the B′ form atroom temperature which transits when temperature increases intothe C′′ form for the former and into the C′ form for the latter, justbelow the melting point. The X-ray diffraction pattern of the C′ formof C17H33OOH is shown in Fig. 1 as an example.
Fig. 2. Evolution with time of the 0 0 3 reflections of C17H33OOH recrystallized fromdiethyl ether at room temperature (293 K). (a) Just after the recrystallization and (b)6 months later.
Similarly to C15H29OOH, the A′, C′ and D′ forms can be observedtogether with the B′ form for C17H33OOH according to the meth-ods of preparation of the samples (Gbabode et al., 2007, in press)(recrystallization from solvent, recrystallization from the meltingand crushing, respectively). Nevertheless, the B′ form is more stablethan the other forms a little below the transition to the C′ form. Inthe case of C15H29OOH, no conclusion could be made on the rela-tive stability of the A′ and B′ forms at room temperature. It is clearfor C17H33OOH that the B′ form is more stable than the A′ format room temperature as the amount of A′ decreased significantlywhen samples recrystallized from solvent had been kept for a longtime at room temperature (Fig. 2).
Temperatures and enthalpies of the phase transitions observedfor the two fatty acids are compiled in Table 1.
It emerges from these results that, as expected, heats of phasetransitions especially heats of melting are high for both compounds(it reaches 172 J/g for C17H33OOH). This allows us to class thesecompounds as potential candidates for the applications in thermalenergy storage or thermal protection. The temperatures of transi-tion are in agreement with those found in literature (Berchiesi etal., 1976; Schaake et al., 1982), except for the solid–solid transition,they are higher in our work for both compounds. Discrepancieslie in the enthalpies of melting according to the teams. These dif-ferences could be due to many factors such as the purity of thecompounds or the presence of a metastable phase (considering inparticular the systematically lower solid–solid transition temper-atures reported in the literature). Moreover, the solid–solid andsolid–liquid transitions happen at close temperature, even moresignificantly for C17H33OOH, bringing an additional uncertainty onthe determination of the temperatures and enthalpies of melting.
The crystallographic data determined for the B′, C′ and C′′ formsare listed in Table 2, together with those gathered from literature(Sydow, 1954; Goto and Asada, 1984; Bond, 2004; Gbabode et al.,
Table 1Temperatures and enthalpies of the phase change transitions
Solid–solid transition Melting Reference
T (K) �H (kJ mol−1) T (K) �H (kJ mol−1)
C15H29OOH B′ → C′′ C′′ → Liquid321.9 ± 0.4 8.2 ± 0.6 325.5 ± 0.4 40.4 ± 0.6 This work318.7 ± 0.1 8.1 ± 0.1 325.8 ± 0.1 41.5 ± 0.2 Schaake et al. (1982)– – 324.9 ± 0.3 46.1 ± 0.5 Berchiesi et al. (1976)
C17H33OOH B′ → C′ C′ → Liquid331.2 ± 0.5 7.5 ± 0.9 333.5 ± 0.5 46.5 ± 0.9 This work329.2 ± 0.2 7.4 ± 0.1 334.2 ± 0.1 51.4 ± 0.3 Schaake et al. (1982)– – 333.0 ± 0.3 51.9 ± 0.5 Berchiesi et al. (1976)

Author's personal copy
G. Gbabode et al. / Chemistry and Physics of Lipids 154 (2008) 68–77 71
Table 2Crystallographic data of the solid forms exhibited by the two fatty acids
Form Reference T (K) Density (g cm−3) a (A) b (A) c (A) ˛ (◦) ˇ (◦) � (◦)
B′15 This work 293 1.020 (1) 5.552 (1) 8.045 (1) 42.84 (1) 114.78 (1) 114.76 (1) 80.05 (1)
Triclinic P1 Z = 4
Sydow (1954) r. t 1.018 (13) 5.54 (1) 8.06 (3) 42.6 (1) 114.3 (2) 114.2 (2) 80.6 (1)Triclinic P1 Z = 4
B′17 This work 293 1.018 (1) 5.547 (1) 8.036 (1) 47.89 (1) 114.37 (2) 114.91 (2) 80.18 (1)
Triclinic P1 Z = 4
Goto and Asada (1984) r. t. 1.017 (1) 5.561 (1) 8.018 (1) 47.90 (1) 114.18 (1) 114.96 (1) 80.22 (1)Triclinic P1 Z = 4
C′′15 Gbabode et al. (2007) 324 0.975 (1) 9.723 (2) 4.951 (1) 84.01 (3) 90 125.30 (1) 90
Monoclinic A2/a Z = 8
Bond (2004) 320 0.975 (1) 9.720 (1) 4.956 (1) 84.02 (1) 90 125.29 (1) 90Monoclinic A2/a Z = 8
C′17 Gbabode et al. (2007) 333 0.974 (1) 9.634 (2) 4.953 (1) 50.03 (1) 90 129.44 (1) 90
Monoclinic P21/a Z = 4
r.t.: room temperature.
2007). The temperatures of measurement are also mentioned forall sources.
B′ phase is, for both compounds, triclinic with space group P1and four molecules per cell. The cell parameters are similar forboth acids, and are consistent with those from the literature. Athigh temperature, C′ and C′′ are both monoclinic but the formerwith space group P21/a and Z = 4 and the latter with space groupA2/a and Z = 8. The density calculated from the cell parameters isaround 1.02 g cm−3 for the low-temperature solid forms whereas itis around 0.97 g cm−3 for the high-temperature solid phases.
The representation in the (b, c) plane of the crystal structure ofthe B′ form of C15H29OOH determined at 293 K, is shown in Fig. 3.The agreement factor Rwp obtained for this structure is 3.70%, whichindicates a very good agreement with the measured and calcu-lated X-ray powder diffraction patterns. The determination of thecrystal structure of the B′ form of C17H33OOH has not been car-ried out as it had already been done by Goto and Asada (1984)from single crystals data. However, the experimental X-ray pow-der diffraction pattern has been compared with the calculated oneusing the atomic coordinates obtained from the single crystal struc-ture, with a very good agreement. The B′ structures consist of twoindependent molecules (noted (i) and (ii) in Fig. 3), the planes con-taining the zigzag chains of which being almost perpendicular. Eachmolecule gives a homologue by an inversion center in the unit cell.
In Table 3, structural data determined from the B′ structure ofC15H29OOH (powder data), C17H33OOH and also C19H37OOH (sin-gle crystal data) are gathered. Namely, the C–C–C–O dihedral angle,O–H· · ·O angle and O· · ·O distance (hydrogen bonds) are given foreach structure (in the case of C17H33OOH, the O–H· · ·O angle is notmentioned, as the positions of the hydrogen atoms were not solvedin the crystal structure). To be noticed, the oxygen atom taken intoaccount in the measurement of the C–C–C–O torsion angle is theone linked by a simple bond to the carbon atom of the carboxylgroup. The values of the O–H· · ·O angle obtained for the structure of
the B′ form of C15H29OOH (173◦ and 163◦) denote strong hydrogenbonds as for C19H37OOH (174◦ and 164◦). The dihedral angle of thecarboxyl groups and also the O· · ·O distances of the hydrogen bondsare similar for the three fatty acids. In particular, the three struc-tures exhibit the cis conformation of the carboxyl groups (C–C–C–Oangle close to 180◦). Moreover, the atomic positions determinedfor the three structures are consistent. These results imply a simi-lar arrangement of the molecules among this series. Finally, the B′
form of C15H29OOH and C17H33OOH, which are of interest in thepresent paper, are undoubtedly isostructural.
The crystal structures of the C′′ form of C15H29OOH and the C′
form of C17H33OOH are detailed elsewhere (Gbabode et al., 2007).The packing arrangement of the molecules is similar within thetwo solid forms (typical lamellar arrangement of dimmers formedby hydrogen bonding), but differs principally at the methyl groupinterface. Moreover, the C′′ structure is twofold of the C′ structureand the positions of the molecules in the unit cell are differentbetween the two solid forms. So, contrarily to the low-temperaturephases, the high-temperature solid forms exhibit different struc-tural frameworks.
3.2. The C15H29OOH–C17H33OOH binary system
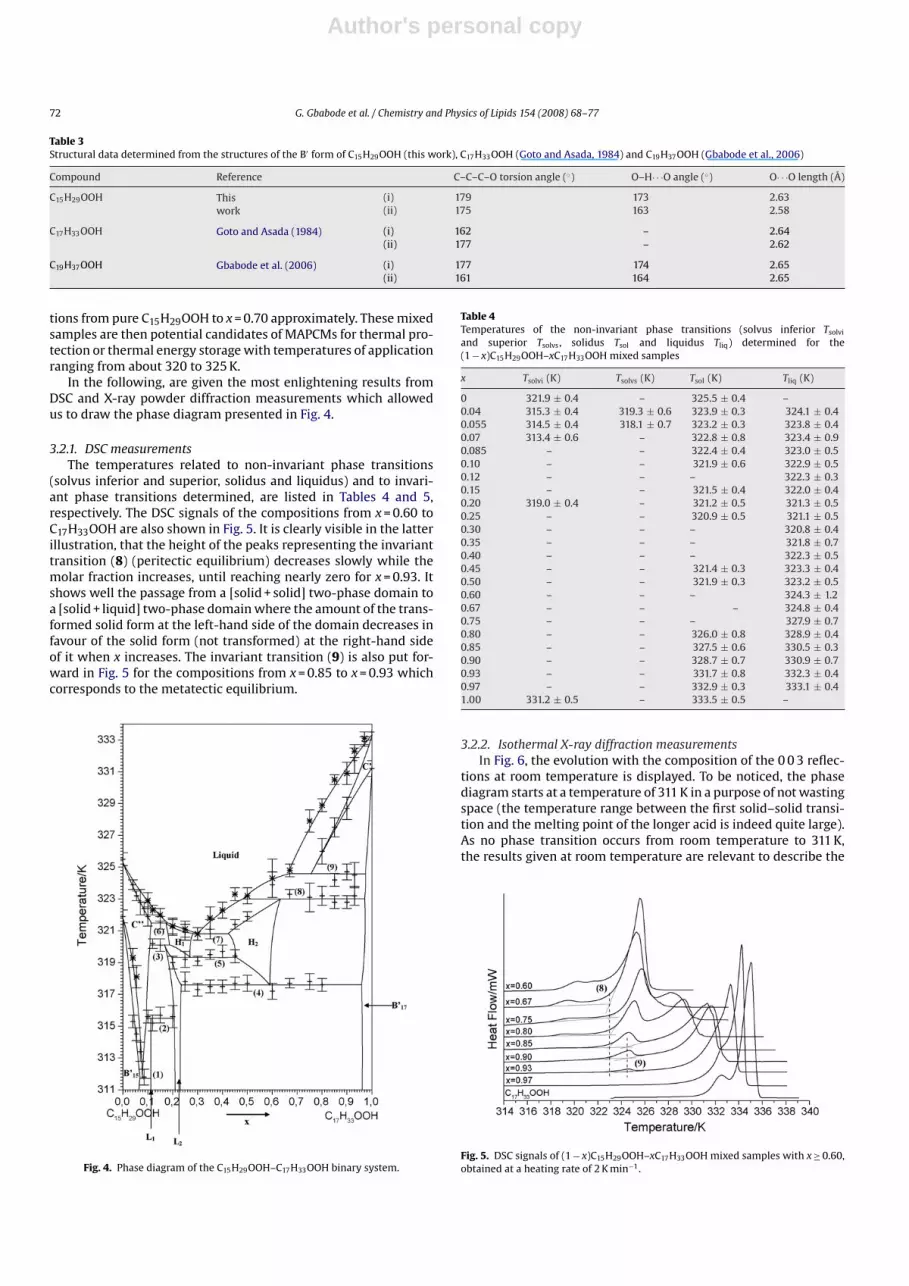
About 20 (1 − x)C15H29OOH–xC17H33OOH mixed samples wereexamined as a function of temperature by DSC and X-ray powderdiffraction. The phase diagram established from these results isexposed in Fig. 4. It shows 17 two-phase domains and 9 one-phasedomains. Nine invariant equilibria are put forward (numbered inFig. 4). In particular, the solid–liquid equilibria are characterizedby four invariants: two peritectic, at 321.5 K between x = 0.11 andx = 0.17 and at 323 K from x = 0.48 to x = 0.97; a eutectic at 320.8 Kspreading from x = 0.28 to x = 0.42, and a metatectic at 324.6 Kbetween x = 0.66 to x = 0.97. The temperature window delimited bythe start and end of melting is inferior than 2 K for the composi-
Fig. 3. Representation in the (b, c) plane of the crystal structure of the B′ form of C15H29OOH determined at 293 K.
Author's personal copy
72 G. Gbabode et al. / Chemistry and Physics of Lipids 154 (2008) 68–77
Table 3Structural data determined from the structures of the B′ form of C15H29OOH (this work), C17H33OOH (Goto and Asada, 1984) and C19H37OOH (Gbabode et al., 2006)
Compound Reference C–C–C–O torsion angle (◦) O–H· · ·O angle (◦) O· · ·O length (A)
C15H29OOH Thiswork
(i) 179 173 2.63(ii) 175 163 2.58
C17H33OOH Goto and Asada (1984) (i) 162 – 2.64(ii) 177 – 2.62
C19H37OOH Gbabode et al. (2006) (i) 177 174 2.65(ii) 161 164 2.65
tions from pure C15H29OOH to x = 0.70 approximately. These mixedsamples are then potential candidates of MAPCMs for thermal pro-tection or thermal energy storage with temperatures of applicationranging from about 320 to 325 K.
In the following, are given the most enlightening results fromDSC and X-ray powder diffraction measurements which allowedus to draw the phase diagram presented in Fig. 4.
3.2.1. DSC measurementsThe temperatures related to non-invariant phase transitions
(solvus inferior and superior, solidus and liquidus) and to invari-ant phase transitions determined, are listed in Tables 4 and 5,respectively. The DSC signals of the compositions from x = 0.60 toC17H33OOH are also shown in Fig. 5. It is clearly visible in the latterillustration, that the height of the peaks representing the invarianttransition (8) (peritectic equilibrium) decreases slowly while themolar fraction increases, until reaching nearly zero for x = 0.93. Itshows well the passage from a [solid + solid] two-phase domain toa [solid + liquid] two-phase domain where the amount of the trans-formed solid form at the left-hand side of the domain decreases infavour of the solid form (not transformed) at the right-hand sideof it when x increases. The invariant transition (9) is also put for-ward in Fig. 5 for the compositions from x = 0.85 to x = 0.93 whichcorresponds to the metatectic equilibrium.
Fig. 4. Phase diagram of the C15H29OOH–C17H33OOH binary system.
Table 4Temperatures of the non-invariant phase transitions (solvus inferior Tsolvi
and superior Tsolvs, solidus Tsol and liquidus Tliq) determined for the(1 − x)C15H29OOH–xC17H33OOH mixed samples
x Tsolvi (K) Tsolvs (K) Tsol (K) Tliq (K)
0 321.9 ± 0.4 – 325.5 ± 0.4 –0.04 315.3 ± 0.4 319.3 ± 0.6 323.9 ± 0.3 324.1 ± 0.40.055 314.5 ± 0.4 318.1 ± 0.7 323.2 ± 0.3 323.8 ± 0.40.07 313.4 ± 0.6 – 322.8 ± 0.8 323.4 ± 0.90.085 – – 322.4 ± 0.4 323.0 ± 0.50.10 – – 321.9 ± 0.6 322.9 ± 0.50.12 – – – 322.3 ± 0.30.15 – – 321.5 ± 0.4 322.0 ± 0.40.20 319.0 ± 0.4 – 321.2 ± 0.5 321.3 ± 0.50.25 – – 320.9 ± 0.5 321.1 ± 0.50.30 – – – 320.8 ± 0.40.35 – – – 321.8 ± 0.70.40 – – – 322.3 ± 0.50.45 – – 321.4 ± 0.3 323.3 ± 0.40.50 – – 321.9 ± 0.3 323.2 ± 0.50.60 – – – 324.3 ± 1.20.67 – – – 324.8 ± 0.40.75 – – – 327.9 ± 0.70.80 – – 326.0 ± 0.8 328.9 ± 0.40.85 – – 327.5 ± 0.6 330.5 ± 0.30.90 – – 328.7 ± 0.7 330.9 ± 0.70.93 – – 331.7 ± 0.8 332.3 ± 0.40.97 – – 332.9 ± 0.3 333.1 ± 0.41.00 331.2 ± 0.5 – 333.5 ± 0.5 –
3.2.2. Isothermal X-ray diffraction measurementsIn Fig. 6, the evolution with the composition of the 0 0 3 reflec-
tions at room temperature is displayed. To be noticed, the phasediagram starts at a temperature of 311 K in a purpose of not wastingspace (the temperature range between the first solid–solid transi-tion and the melting point of the longer acid is indeed quite large).As no phase transition occurs from room temperature to 311 K,the results given at room temperature are relevant to describe the
Fig. 5. DSC signals of (1 − x)C15H29OOH–xC17H33OOH mixed samples with x ≥ 0.60,obtained at a heating rate of 2 K min−1.

Author's personal copy
G. Gbabode et al. / Chemistry and Physics of Lipids 154 (2008) 68–77 73
Table 5Temperatures of the invariant phase transitions determined for the (1 − x)C15H29OOH–xC17H33OOH mixed samples
x T (K)
(1) (2) (3) (4) (5) (6) (7) (8) (9)
0.04 – – – – – – – – –0.055 – – – – – – – – –0.07 – – – – – – – – –0.085 311.8 ± 0.5 – – – – – – – –0.10 – 315.6 ± 0.4 – – – – – – –0.12 – 315.2 ± 0.5 320.2 ± 0.3 – – – – – –0.15 – 315.7 ± 0.5 320.1 ± 0.4 – – 321.5 ± 0.4 – – –0.20 – 315.6 ± 0.7 – – – – – – –0.25 – – – 317.8 ± 0.6 319.2 ± 0.5 – – – –0.30 – – – 317.3 ± 0.4 319.1 ± 0.3 320.8 ± 0.4 – –0.35 – – – 317.5 ± 0.4 319.5 ± 0.3 321.1 ± 0.6 – –0.40 – – – 317.5 ± 0.4 319.7 ± 0.4 – – – –0.45 – – – 317.7 ± 0.5 319.4 ± 0.4 – – – –0.50 – – – 317.7 ± 0.3 – – – – –0.60 – – – 317.2 ± 0.5 – – – 323.9 ± 0.8 –0.67 – – 317.7 ± 0.3 – – – 323.3 ± 0.3 –0.75 – – – 317.8 ± 0.5 – – – 323.1 ± 0.9 –0.80 – – – 317.6 ± 0.4 – – – 323.2 ± 0.6 –0.85 – – – – – – – 322.8 ± 0.4 324.2 ± 0.40.90 – – – – – – – 322.8 ± 0.4 324.7 ± 0.50.93 – – – – – – – 323.2 ± 0.6 324.5 ± 0.80.97 – – – – – – – – –
phase alternation as a function of the composition at 311 K. The exis-tence of three two-phase domains have been put forward: betweenx = 0.04 and x = 0.10, between x = 0.12 and 0.20, and finally betweenx = 0.25 and x = 0.90. The boundary limits of the two last domainsare in agreement with the limits of the invariants (2) and (4) deter-mined by calorimetric measurements. Thus, two new solid formsare created by mixing, named L1 and L2 (for low-temperature phase1 and 2).
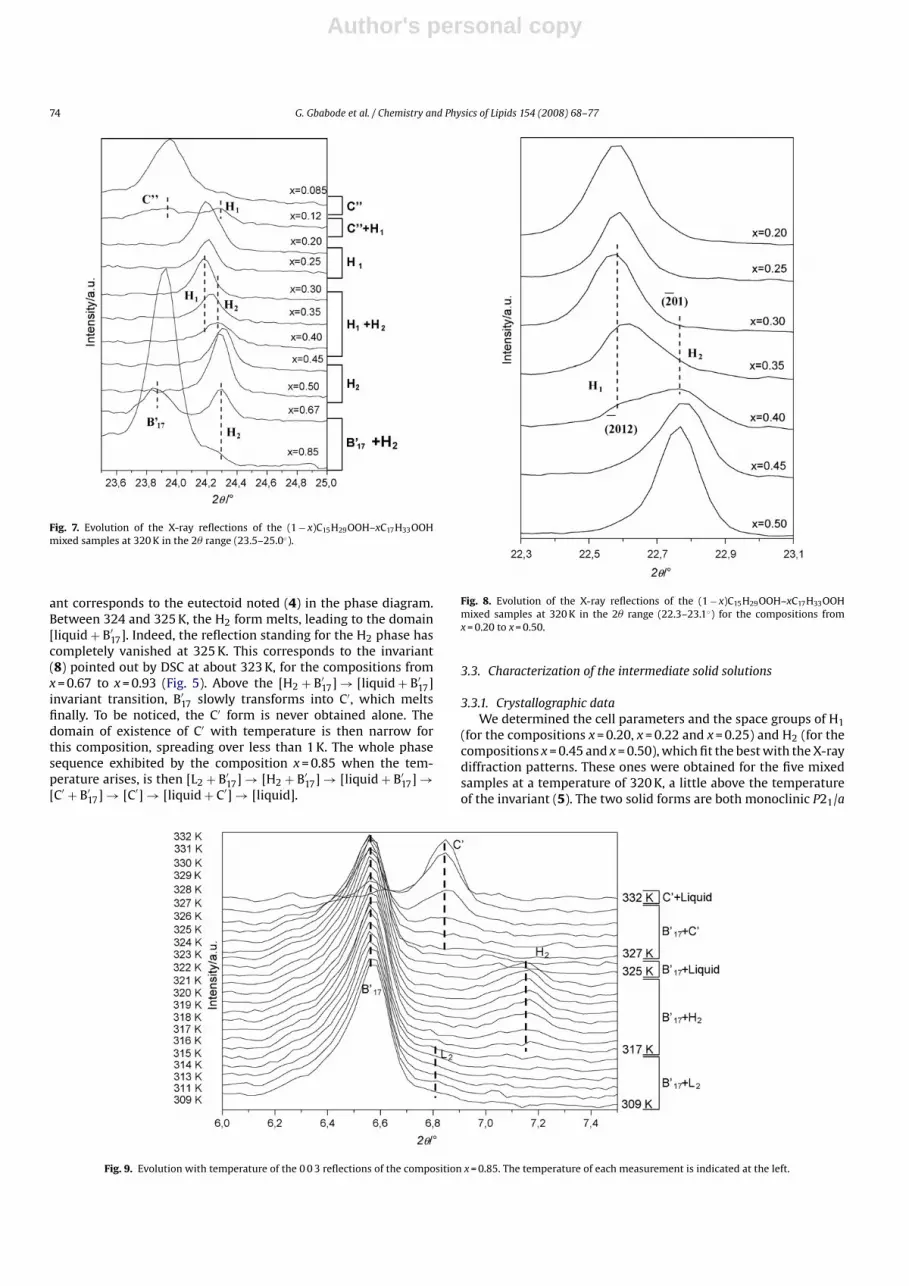
Similarly, at high temperature (about 320 K) three two-phasedomains were marked out: the first one for the composition x = 0.12,another one revealed by the compositions from x = 0.30 to x = 0.40,and the last one including the compositions x = 0.67 and x = 0.85(Fig. 7). Hence, two new solid forms named H1 and H2 (for high-temperature phases 1 and 2) are put forward. The domain ofdemixion [H1 + H2] is highlighted in Fig. 8, which shows the X-
ray diffraction patterns at 320 K for compositions from x = 0.20 tox = 0.50 in the 2� range [22.3–23.1◦]. The h k l indices are shownbetween brackets for the reflection of each phase.
3.2.3. Isopletic X-ray diffraction measurementsFinally, in Fig. 9, the evolution of the 0 0 3 reflections of the
composition x = 0.85 when temperature increases is exposed. Thiscomposition is interesting since its diffraction patterns show dis-tinctly the whole phase sequence involving all the solid phasesthat are observed for the compositions from x = 0.50 to x = 0.93approximately, when the temperature increases. This mixed sam-ple exhibits at room temperature both B′
17 and L2 forms. Theamount of L2 is very low, so it is inferred that this compositionis situated at the border of the [L2 + B′
17] domain, close to the[B′
17] domain. At around 317 K, L2 transits into H2. This invari-
Fig. 6. Evolution of the 0 0 3 reflections of the (1 − x)C15H29OOH–xC17H33OOH mixed samples at room temperature.
Author's personal copy
74 G. Gbabode et al. / Chemistry and Physics of Lipids 154 (2008) 68–77
Fig. 7. Evolution of the X-ray reflections of the (1 − x)C15H29OOH–xC17H33OOHmixed samples at 320 K in the 2� range (23.5–25.0◦).
ant corresponds to the eutectoid noted (4) in the phase diagram.Between 324 and 325 K, the H2 form melts, leading to the domain[liquid + B′
17]. Indeed, the reflection standing for the H2 phase hascompletely vanished at 325 K. This corresponds to the invariant(8) pointed out by DSC at about 323 K, for the compositions fromx = 0.67 to x = 0.93 (Fig. 5). Above the [H2 + B′
17] → [liquid + B′17]
invariant transition, B′17 slowly transforms into C′, which melts
finally. To be noticed, the C′ form is never obtained alone. Thedomain of existence of C′ with temperature is then narrow forthis composition, spreading over less than 1 K. The whole phasesequence exhibited by the composition x = 0.85 when the tem-perature arises, is then [L2 + B′
17] → [H2 + B′17] → [liquid + B′
17] →[C′ + B′
17] → [C′] → [liquid + C′] → [liquid].
Fig. 8. Evolution of the X-ray reflections of the (1 − x)C15H29OOH–xC17H33OOHmixed samples at 320 K in the 2� range (22.3–23.1◦) for the compositions fromx = 0.20 to x = 0.50.
3.3. Characterization of the intermediate solid solutions
3.3.1. Crystallographic dataWe determined the cell parameters and the space groups of H1
(for the compositions x = 0.20, x = 0.22 and x = 0.25) and H2 (for thecompositions x = 0.45 and x = 0.50), which fit the best with the X-raydiffraction patterns. These ones were obtained for the five mixedsamples at a temperature of 320 K, a little above the temperatureof the invariant (5). The two solid forms are both monoclinic P21/a
Fig. 9. Evolution with temperature of the 0 0 3 reflections of the composition x = 0.85. The temperature of each measurement is indicated at the left.

Author's personal copy
G. Gbabode et al. / Chemistry and Physics of Lipids 154 (2008) 68–77 75
Table 6Crystallographic data determined for H1 (compositions x = 0.20, x = 0.22 and x = 0.25)and H2 (compositions x = 0.45 and x = 0.50)
Molar fraction T (K) a (A) b (A) c (A) ˇ (◦)
H1
0.20 320 9.770 (3) 4.952 (1) 47.99 (1) 133.16 (1)Monoclinic P21/a Z = 4
0.22 320 9.809 (4) 4.952 (1) 47.96 (1) 133.13 (2)Monoclinic P21/a Z = 4
0.25 320 9.845 (3) 4.954 (1) 48.05 (1) 132.54 (2)Monoclinic P21/a Z = 4
H2
0.45 320 9.607 (2) 4.942 (1) 48.28 (1) 130.51 (1)Monoclinic P21/a Z = 4
0.50 320 9.607 (1) 4.947 (1) 48.37 (1) 130.45 (1)Monoclinic P21/a Z = 4
with four molecules per unit cell as exposed in Table 6. The cellparameters of H1 and H2 look like to each other. As expected, thec parameter increases for H1 as well as for H2 when x increases.However, it can be noticed that the a parameter increases for H1but remains constant for H2 when x increases.
Concerning the low-temperature phases L1 and L2, suit-able solutions of cell parameters and space group were notfound. Actually, these solid forms exhibit very thin domains ofoccurrence, and thus, the difficulty to obtain single phase sam-ples increases. Moreover, the X-ray diffraction patterns of L1and L2 are composed of a small number of broad reflectionswhich are not appropriate for the determination of the cellparameters.
3.3.2. Structural model for the H2 solid solutionWe propose a structural model describing the H2 form for
the composition x = 0.50. To determine this crystal structure, weassumed that the packing of the carboxyl groups should be thesame for both molecules of C15H29OOH and C17H33OOH in themixed crystal. Moreover, the packing of the chains was also sup-posed to be the same for both molecules except near the methylgroups (Gbabode et al., 2007). As the molecule of C17H33OOH islonger than the molecule of C15H29OOH, we assumed that the lastbonds near the methyl group should be allowed to move so that themolecules of C17H33OOH arrange correctly in the unit cell. Thus,the crystal structure was solved from a molecule of C17H33OOHwith all the atoms of the chain from the carboxyl group to the 15thmethylene group having an occupancy factor of 1, which meansthat all these atoms would be at the same positions in the cell,independently of the molecule, C15H29OOH or C17H33OOH. Thetwo last carbon atoms and their five hydrogen atoms were putwith an occupancy factor of 0.5 since they only belong to themolecule of C17H33OOH which is present in 50% of the cases onan average, due to the composition of the mixed sample. By thisrepresentation, one hydrogen atom misses in the methyl group ofC15H29OOH, but it was neglected since its absence would not affectmuch the crystal structure. Then, the C–C–C–O (carboxyl group)and the C–C–C–C (methyl group) torsion angles were allowed tovary.
The agreement factor Rwp reached after Rietveld refinement ofthe structure is 3.24%. It corresponds to a very good concordanceof the measured and calculated X-ray powder diffraction patterns(see Fig. 10). To be noticed, no energy minimization was performedon this solution since it would have no meaning due to the disorderinduced by the composition. The representation in the (a, c) plane
of the crystal structure of H2 is given in Fig. 11, the atoms with anoccupancy factor of 0.5 are shadowed.
The crystal structure of H2 seems like an ordered structure dueto the model used. The terminal methyl group is tilted from theaxis of the chain. The C–C–C–C dihedral angle is 111◦. However,this model is not perfect since some distances between the hydro-gen atoms of neighbouring molecules are too small, especiallynear the methyl groups. Indeed, the shortest distances betweenthe hydrogen atoms of the methyl groups of the molecules ofC17H33OOH and of the 15th carbon atom of nearby molecules arearound 1.9–2.0 A. These values are too small compared with thesum of the van der Waals radii of two hydrogen atoms (around2.4 A). The shortest H· · ·H distances between the methyl groups ofmolecules of C17H33OOH at the methyl group interface are around2.2–2.3 A, which is more acceptable. The O· · ·O length of the hydro-gen bonds is 2.81 A. This value is a little higher than the commonO· · ·O lengths found for crystal structures of fatty acids (Goto andAsada, 1978, 1984; Kaneko et al., 1990; Bond, 2004; Gbabode etal., 2006, 2007) (between 2.63 and 2.65 A). The hydrogen bonds inthe H2 mixed structure would then be weaker than in the crystalstructures of pure compounds. This result is consistent with thedisorder induced by the composition which prevails in the mixedstructure.
Other more complicated models were tried to improve thefirst one. In particular, we tried to allow torsions to the bondsat the methyl group side of the molecules of C15H29OOH andC17H33OOH (up to six successive torsions for C17H33OOH and twofor C15H29OOH) still with keeping the same packing of the car-boxyl groups for the two molecules. Nevertheless, some distancesbetween the hydrogen atoms of close molecules still remainedtoo small and moreover the agreement factor Rwp was not signifi-cantly improved. A model based on totally independent moleculesof C15H29OOH and C17H33OOH was also tried, but it led to incoher-ent distances between the carboxyl groups.
4. Discussion
The high-temperature solid forms of the pure compounds arenot isostructural. So, a total miscibility of the solid phases of theconstituents at high temperature is not expected. The phase dia-
Fig. 10. Calculated and measured X-ray powder diffraction patterns of the H2 form(x = 0.50). In red, the experimental X-ray diffraction pattern, in black the calculatedone, in blue the difference between them, in green bars the positions of the calcu-lated Bragg reflections. (For interpretation of the references to color in this figurelegend, the reader is referred to the web version of the article.)

Author's personal copy
76 G. Gbabode et al. / Chemistry and Physics of Lipids 154 (2008) 68–77
Fig. 11. Representation in the (a, c) plane of the crystal structure of the H2 form (x = 0.50). The atoms with an occupancy factor of 0.5 are shadowed.
gram confirms this statement and moreover narrow domains ofstabilization of the C′ and C′′ forms (the widest one-phase domain,[C′′], is less than 10% of the whole domain of composition) areobserved. Intermediate H1 and H2 forms are also stabilized by mix-ing at high temperature, and their domains of existence spread overabout 8% and 15% of the entire composition range, respectively. Atlow temperature, it appears that B′
15 and B′17 have narrow domain
of occurrence, even narrower than those of the high-temperaturesolid forms, although the B′ forms of the constituents are isostruc-tural. Moreover, the domains of existence of L1 and L2 are evennarrower (less than 3% of the domain of composition). Thus, themiscibility of the two fatty acids is also very limited at low tem-perature. In binary systems of n-alkanes, molecular alloys are alsostabilized on wider domains at high temperature, but in this case,a high miscibility is observed, which can even be total for someodd–odd mixtures (Mondieig et al., 2004). This mixing affinity ofn-alkanes is made possible by the existence of rotator phases athigh temperature, characterized by a rotation and a translation ofthe molecules along the chain axis. It is assumed that the disorderin composition (mixed samples) is compensated by the disorderin orientation (rotation and translation), which enables the sta-bilization of molecular alloys of this type on wide domains ofcomposition.
The model presented for the H2 solid solution shows that themolecules of C17H33OOH exhibit a conformation defect near theirmethyl groups allowing them to stack correctly in the mixedstructure. It has been proved for the high-temperature phases ofodd-numbered fatty acids, that the major displacements of theatoms due to thermal motion are located near the methyl group(Gbabode et al., 2007). The strong hydrogen bonds prevent fromlarge displacements of the atoms next to the carboxyl groups.Thus, in the present case, the existence of rotator phases is pro-hibited. Instead, thermal agitation induces a local disorder nearthe methyl groups of molecules of C17H33OOH which makes pos-sible the stabilization of the H2 form on a reasonable domainof composition, the latter being still negligible compared to thecase of high-temperature molecular alloys of binary mixtures of n-alkanes. When comparing the C15H29OOH–C16H31OOH (Gbabodeet al., in press) and C15H29OOH–C17H33OOH phase diagrams, bothof them reveal a reduced miscibility of the fatty acids concerned,even if solid forms of the constituents are isostructural (B′ formsfor the odd–odd binary system). However, in the case of theC15H29OOH–C16H31OOH binary system, an intermediate solid solu-tion is stabilized at low temperature on an appreciable domain ofcomposition (from around x = 0.30 to x = 0.50) whereas the interme-diate solid solutions spread on less than 3% of the whole domainof composition for the C15H29OOH–C17H33OOH binary system. Asa matter of fact, the molecules of C15H29OOH and C16H31OOHdiffer only by the addition of one CH2 group and then the co-existence of these two molecular entities in a same structure mustbe less energy consuming than for C15H29OOH–C17H33OOH mixedsamples. Finally, the structural model proposed for the H2 solidsolution pictures well the (binary) mixing behaviour of fatty acids,which is limited by the strong hydrogen bonds on the one hand
and the molecular mismatch of the constituents on the otherhand.
5. Conclusion
The (T, x) phase diagram of an odd–odd binary system of fattyacids is given for the first time. It provides information on thepolymorphism and solid-state miscibility of fatty acids and showsthe potentialities of their molecular alloys as MAPCMs for theapplications. The techniques used to investigate the crystallinearrangement of the pentadecanoic and heptadecanoic acids areinnovating, notably by the successful use of recent methods ofdetermination of crystal structures from X-ray powder data. Onecan mention, in particular, the simulation of the disordered mixedstructure of the H2 solid solution. Other �n = 1 and �n = 2 binarysystems of fatty acids (�n being the difference between the numberof carbon atoms of the two constituents) should be studied to com-plete the present work, with considering rather longer fatty acidsin order to see the influence of the chain length on the solid-statemiscibility of fatty acids.
6. Supporting information available
The X-ray Crystallographic Information Files (CIF) of the B′ formof C15H29OOH and of the H2 form of the composition x = 0.5 of theC15H29OOH–C15H29OOH binary system. This material is availablefree of charge via the Internet at http://pubs.acs.org.
References
Berchiesi, G., Bercuiesi, M.A., Lobbia, G.G., Leonesi, D., 1976. Consideration on themelting of some long-chain organic compounds. Gazz. Chim. Ital. 106, 549–555.
Bond, A.D., 2004. On the crystal structures and melting point alternation of then-alkyl carboxylic acids. New J. Chem. 28, 104–114.
Boultif, A., Louer, D., 1991. Indexing of powder diffraction patterns for low-symmetrylattices by the successive dichotomy method. J. Appl. Crystallogr. 24, 987–993.
Courchinoux, R., Chanh, N.B., Haget, Y., Calvet, T., Estop, E., Cuevas-Diarte, M.A., 1989.From signal to phenomena: a pratical way to determine binary phase diagramby termal analysis. J. Chim. Phys. 86 (3), 561–593.
Dorfler, H.-D., Pietschmann, N., 1990. Phase and miscibility behaviour of binary lipidsystems. Colloid Polym. Sci. 268 (6), 567–577.
Engel, G.E., Wilke, S., Konig, O., Harris, K.D.M., Leusen, F.J.J., 1999. PowderSolve—acomplete package for crystal structure solution from powder diffraction pat-terns. J. Appl. Crystallogr. 32, 1169–1179.
Evain, M., Deniard, P., Jouanneaux, A., Brec, R., 1993. Potential of the INEL X-rayposition-sensitive detector: a general study of the Debye–Scherrer setting. J.Appl. Crystallogr. 26, 563–569.
Feldman, D., Shapiro, M.M., Banu, D., Fuks, C., 1989. Fatty acids and their mixturesas phase-change materials for thermal energy storage. J. Sol. Energy Mater. 18,201–216.
Fieldes, M., Hartman, L., 1955. Compound formation in binary fatty-acid mixtures.Proc. R. Soc. A 233, 195–202.
Francis, F., Piper, S.H., Malkin, T., 1930. The n-fatty acids. Proc. R. Soc. London 128,214–252.
Gbabode, G., Negrier, P., Mondieig, D., Leger, J.M., Calvet, T., Cuevas-Diarte, M.A., 2006.Crystal structure of the B′ form of nonadecanoic acid. Anal. Sci. 22, x269–x270.
Gbabode, G., Negrier, P., Mondieig, D., Moreno, E., Calvet, T., Cuevas-Diarte, M.A.,2007. Structures of the high-temperature solid phases of the odd-numberedfatty acids form tridecanoic acid to tricosanoic acid. Chem. Eur. J. 13, 3150–3159.
Gbabode, G., Negrier, P., Mondieig, D., Moreno, E., Calvet, T., Cuevas-Diarte, M.A.,in press. Fatty acids polymorphism and solid-state miscibility: pentadecanoic

Author's personal copy
G. Gbabode et al. / Chemistry and Physics of Lipids 154 (2008) 68–77 77
acid–hexadecanoic acid binary system. J. Alloys Compd. (available online April1, 2008).
Goto, M., Asada, E., 1978. The crystal structure of the B form of stearic acid. Bull.Chem. Soc. Jpn. 51 (9), 2456–2459.
Goto, M., Asada, E., 1984. The crystal structure of the B′-form of heptadecanoic acid.Bull. Chem. Soc. Jpn. 57, 1145–1146.
Gotoh, M.J., 1987. Crystal structures and polymorphism of normal saturated fattyacids. Jpn. Oil Chem. Soc. 36 (12), 909–919.
Huang, T.C., Toraya, H., Blanton, T.N., Wu, Y., 1993. X-ray powder diffraction analysisof silver behenate, a possible low-angle diffraction standard. J. Appl. Crystallogr.26, 180–184.
Kaneko, F., Kobayashi, M., Kitagawa, Y., Matsuura, Y., 1990. Structure of stearic acidE form. Acta Crystallogr. C 46, 1490–1492.
Kobayashi, M., Kaneko, F., 1989. Molecular and crystal structures of lipids and relatedcompounds. J. Dispersion Sci. Technol. 10, 319–350.
Mondieig, D., Rajabalee, F., Laprie, A., Oonk, H.A.J., Calvet, T., Cuevas-Diarte, M.A.,2003. Protection of temperature sensitive biomedical products using molecularalloys as phase change material. Transfus. Apher. Sci. 28, 143–148.
Mondieig, D., Rajabalee, F., Metivaud, V., Oonk, H.A.J., Cuevas-Diarte, M.A., 2004.N-Alkane binary molecular alloys. Chem. Mater. 16, 786–798.
Moreno, E., Cordobilla, R., Calvet, T., Cuevas-Diarte, M.A., Gbabode, G., Negrier, P.,Mondieig, D., Oonk, H.A.J., 2007. Polymorphism of even saturated carboxylicacids from n-decanoic to n-eicosanoic acid. New J. Chem. 31, 947–957.
Moroi, Y., Hiraharu, T., Yoshino, S., Matuura, R., 1972. Phase equilibrium of two-component systems of long chain saturated fatty acids. Mem. Fac. Sci., KyushuUniv. C 8 (1), 43–54.
MS Modeling (Material Studio) 3.0 (2004). http://accelrys.com/products/materials-studio/modules/reflex.html.
Neumann, M.A., 2003. X-CELL—a novel indexing algorithm for routine tasks anddifficult cases. J. Appl. Crystallogr. 36, 356–365.
Oonk, H.A.J., Mondieig, D., Haget, Y., Cuevas-Diarte, M.A., 1998. Perfect families ofmixed crystals: the rotator I N-alkane case. J. Chem. Phys. 108 (2), 715–722.
Pawley, G.S., 1981. Unit-cell refinement from powder diffraction scans. J. Appl. Crys-tallogr. 14, 357–361.
Rajabalee, F., Metivaud, V., Oonk, H.A.J., Mondieig, D., Waldner, P., 2000. Perfect fam-ilies of mixed crystals: the “ordered” crystalline forms of n-alkanes. Phys. Chem.Chem. Phys. 2, 1345–1350.
Rietveld, H.M., 1969. A profile refinement method for nuclear and magnetic struc-tures. J. Appl. Crystallogr. 2, 65–71.
Rodriguez-Carvajal, J., 1990. FULLPROF a program for Rietveld refinement andpattern matching analyses. In: Abstracts of the Satellite Meeting on PowderDiffraction of the XV Congress of the International Union of Crystallography,Toulouse, France.
Schaake, R.C.F., van Miltenburg, J.C., de Kruif, C.G.J., 1982. Thermodynamic propertiesof the normal alkanoic acids. I. Moler heat capacities of seven odd-numberednormal alkanoic acids. Chem. Thermodyn. 14, 763–769.
Slagle, F.B., Ott, E., 1933. X-ray studies of mixtures of fatty acids. J. Am. Chem. Soc.55 (11), 4404–4418.
Sun, H., 1998. COMPASS: an ab initio force-field optimised for condensed-phaseapplications. Overview with details on alkane and benzene compounds. J. Phys.Chem. B 102, 7338–7364.
Sydow, E.V., 1954. On the structure of the crystal form B′ of n-pentadecanoic acid.Acta Crystallogr. 7, 823–826.
Sydow, E.V., 1955a. Crystallization of normal fatty acids. Acta Chem. Scand. 9,1685–1688.
Sydow, E.V., 1955b. On the structure of the crystal form C′ of n-hendecanoic acid.Acta Crystallogr. 8, 810–813.
Sydow, E.V., 1955c. The normal fatty acids in solid state. Arkiv Kemi 9, 231–254.Ventola, L., Calvet, T., Cuevas-Diarte, M.A., Mondieig, D., Oonk, H.A.J., 2002. The
C19H39OH–C20H41OH system: experimental phase diagram and thermodynamicmodelling. Phys. Chem. Chem. Phys. 4, 1953–1956.
Ventola, L., Calvet, T., Cuevas-Diarte, M.A., Solans, X., Mondieig, D., Negrier, P.,van Miltenburg, J.C., 2003. Solid state equilibrium in the n-alkanols fam-ily: the stability of binary mixed samples. Phys. Chem. Chem. Phys. 5, 947–952.
Zhang, J.-J., Zhang, J.-L., He, S.-M., Wu, K.-Z., Liu, X.D., 2001. Thermal studies on thesolid–liquid phase transition in binary systems of fatty acids. Thermochim. Acta369, 157–160.


