Embed Size (px)
Citation preview

© Blackwell Publishing Ltd/University of Adelaide and Flinders University of South Australia 2004.
CURRENCY MARKET CONTAGION IN THE ASIA-PACIFIC REGION
#
MARDI DUNGEY
The Australian National University
RENÉE FRY
The Australian National University
VANCE L. MARTIN
The University of Melbourne
During the East Asian currency crisis of 1997–98 the potential transmission of the crisis to developedmarkets such as Japan, Australia and New Zealand, was of considerable policy concern. Potentialchannels consist of anticipated movements stemming from common factors, spillovers and contagion.The empirical results show that the transmission of volatility in the East-Asian currency markets tothe developed markets in the region is not due to contagion, but rather attributed to common worldfactors. Spillovers have a minor role in the case of Japan and to a lesser degree, Australia.
I . I n t r o d u c t i o n
The East Asian currency crisis has been widely characterised as beginning with the float anddepreciation of the Thai baht on 2nd July, 1997. This was followed by depreciations of theMalaysian ringitt, and the Indonesian rupiah which was floated on the 14th August, 1997. Thetransmission of pressure between these export-competing economies is interpreted by Goldstein(1998) as a ‘competitive devaluation’, as the fall in the Thai baht created pressure on theMalaysian and Indonesian currencies. Even though this channel of pressure did not apply to theKorean won (see Krugman (1998)), the won nevertheless came under increasing pressure over1997, and eventually floated on December 22, 1997. Kaminsky and Schmulker (1999) providea chronology of the events over the East Asian crisis period. The size of these depreciations andthe subsequent increases in volatility are highlighted in Figure 1. The standard deviations ofcurrency returns reported in Table I reveal that volatility increased by around 1000% for Korea,Thailand and Malaysia, and over 5000% for Indonesia.
Figure 1 also reveals that the increase in volatility over the crisis period was not limited tothe East-Asian countries, but was also experienced by other countries on the periphery of theregion, such as Japan, Australia and New Zealand. The standard deviations reported in Table Ishow that volatility approximately doubled in the case of Australia and New Zealand, whilst
Correspondence: Renée Fry, Division of Economics, Research School of Pacific and Asian Studies, CoombsBuilding, the Australian National University, Canberra, ACT 0200. Email: [email protected],telephone:
+
61 2 6125 3387, fax:
+
61 2 6125 3700.# We would like to thank an anonymous referee and Stan Hurn for useful comments, and Leslie Hull forproviding us with background on New Zealand. This project was funded under ARC large grantA00001350.

380 AUSTRALIAN ECONOMIC PAPERS DECEMBER
© Blackwell Publishing Ltd/University of Adelaide and Flinders University of South Australia 2004.
for Japan it increased by about 13%.
1
Although the increased volatility for these economies isrelatively small compared with the East Asian currency markets, concern over the potentialtransmission of the crisis and its effects for these developed markets was widespread both at thetime, and as a continuing matter for international policy development. Central bank officials ineach of Japan, Australia and New Zealand commented widely on the likely impact of the crisison the domestic economy (Grenville (1998) for Australia, Brash (1998), Bollard and Rose (1998)for New Zealand and Cabinet Office (1998) for Japan). Additionally, each country pledgedextra financial assistance to the crisis countries over and above the packages co-ordinated by theIMF at the time.
2
Continued interest in understanding the vulnerabilities to crisis transmissionin the region is apparent in the ongoing participation of these countries in international andregional forums, such as the East Asia-Pacific Central Bank’s and Monetary Authority (EMEAP)investigations into payments and settlements systems, financial markets and banking supervi-sion. The Central Bank of each country also maintains ‘systems stability’ functions whichspecifically monitor and consider the potential domestic effects of disruptions to the interna-tional financial system.
3
In addition the crisis prompted a series of research papers on regionaleffects within government institutions; for example the conference hosted by the Reserve Bankof Australia on Capital Flows and the International Financial System reported in Gruen andGower (1999) which brought together officials from around the region.
4
1
Japan is a major source of Foreign Direct Investment and finance for countries in the region. It is alsoan important source of intermediate imports and a dominant export market; see IMF (1999), Kaminskyand Reinhart (2000), Diwan and Hoekman (1999).
2
In 1998, Japan announced the Miyazawa initiative, which was a US30bn package of long and short termsupport for the crisis economies (Ministry of Finance (1998) and Ministry of Foreign Affairs of Japan(1999)). Similarly, Australia pledged support in addition to the IMF adjustment programs of up to US1bnto each of Thailand, Korea and Indonesia, and also proposed the Asia Recovery Information Centre underthe auspices of the Asian Development Bank (Commonwealth Treasury (1998, 2000)). Although it isunclear how much of the money pledged was utilised, the intent recognises the degree of concernexpressed in the developed market economies.
3
These are the Banking Stability Department in the Reserve Bank of New Zealand, the Financial MarketsDepartment at the Bank of Japan and the Financial Systems Stability Department at the Reserve Bank ofAustralia.
4
This conference was attended by representatives from the People’s Bank of China, Bank of Japan, Bankof Korea, the Japanese Ministry of Finance, Reserve Bank of New Zealand, Bank of Thailand, MonetaryAuthority of Singapore, Hong Kong Monetary Authority, Bank Indonesia, the Reserve Bank of Australiaas well as American and European representatives.
Table I Descriptive statistics of percentage exchange rate returns against the USD over the pre-crisis period(3/1/1995 to 30/5/97) and the crisis period (2/6/1997 to 31/8/98).
Statistic
Country
Korea Indon. Thai. Malay. Japan Aust. N.Z.
Pre-crisis periodMean 0.020 0.017 0.004 −0.003 0.025 0.002 −0.012Max 1.175 0.768 1.188 1.276 4.580 2.153 1.935Min −1.685 −0.984 −2.312 −1.229 −4.188 −1.670 −1.045Std. Dev. 0.233 0.101 0.194 0.195 0.717 0.463 0.365
Crisis periodMean 0.132 0.474 0.163 0.161 0.062 0.092 0.103Max 14.654 28.947 14.513 11.598 2.882 2.749 2.902Min −23.432 −17.913 −10.489 −7.597 −4.846 −3.384 −4.359Std. Dev. 2.908 5.060 2.121 1.811 0.814 0.721 0.730

2004 CURRENCY MARKET CONTAGION 381
© Blackwell Publishing Ltd/University of Adelaide and Flinders University of South Australia 2004.
Figure 1. Exchange rate percentage returns against the USD: 3/1/1995 to 31/8/98.

382 AUSTRALIAN ECONOMIC PAPERS DECEMBER
© Blackwell Publishing Ltd/University of Adelaide and Flinders University of South Australia 2004.
Policy makers’ focus on the regional transmission of currency crises is well supported in theacademic literature. Goldstein (1998), Kaminsky and Reinhart (2000), Glick and Rose (1999)and Gerlach and Smets (1995) all emphasize the importance of regional effects in the transmis-sion of crises. Moreover, there is a growing body of evidence that financial crises in developingmarkets can impact upon mature market economies; for example Harrigan (2000), Wincoopand Yi (2000) and Dungey, Fry, González-Hermosillo and Martin (2002a,b). One set oftransmission mechanisms is based on market fundamentals such as strong trade linkages andinterdependence of financial markets. These linkages are described here as anticipated as theyrepresent systematic relationships which operate even over non-crisis periods. Another set isbased on unanticipated channels, more commonly known as contagion; see Masson (1999a,b,c),Sachs, Tornell and Velasco (1996) and Favero and Giavazzi (2002). Unlike systematic channelsbased on market fundamentals, additional linkages arising from contagion only occur duringperiods of financial crisis.
5
Differentiating the effects of contagion from general increases in volatility due to the inter-dependence of financial markets is an important part of the current paper. Forbes and Rigobon(2002) make a similar distinction by controlling for the increase in volatility observed in theevent of a crisis compared with a non-crisis period. They identify contagion as occurring whenthere is a distinct increase in volatility after controlling for the interdependence of bilateralfinancial markets. The methodology used here additionally quantifies the contribution of conta-gion to volatility in the crisis period in a multimarket framework. This is achieved using a latentfactor model where movements in bilateral exchange rates are expressed as linear combinationsof common and country-specific factors, similar to the work of Mahieu and Schotman (1994),Dungey (1999) and Dungey, Martin and Pagan (2000). This framework has the advantage ofabstracting from the need to condition on observed macroeconomic data to identify marketfundamentals, which, in turn, means the analysis can be carried out on high frequency data. Afurther advantage of adopting a common factor structure is that the model can be specified toinclude the volatility clustering that characterises financial data, especially during financial crises.This has the added advantage that it obviates the need to estimate large dimension volatility modelsas the volatility features of currency returns can be parsimoniously modelled using a small setof factors.
The rest of the paper proceeds as follows. A latent factor model of intra-regional spilloversand contagion is developed in Section II. The factor model is applied in Section III to decom-posing the volatility in currency returns during the East-Asian financial crisis. The key resultshows that the transmission of shocks from the crisis countries to Japan, Australia or New Zealandis mainly through anticipated channels, which reflect market fundamentals. There is little evidenceof transmissions through unanticipated channels, namely contagion. Concluding comments arepresented in Section IV.
I I . A Fac t o r M o d e l o f I n t r a - R e g i o na l C o n tag i o n
In this section a model of contagion is formally specified which builds on the frameworkof Dungey and Martin (2001, 2004) in two ways. First, the set of countries investigated isexpanded to include countries with well developed financial markets operating in the same time
5
See also Kaminsky and Reinhart (2002) who hypothesise that developed financial markets can act as aconduit for the spread of crises from one region to another.

2004 CURRENCY MARKET CONTAGION 383
© Blackwell Publishing Ltd/University of Adelaide and Flinders University of South Australia 2004.
zone. Second, the factor structure is extended to include a regional factor that captures the over-all turmoil experienced by currency markets in the East-Asian region. This more general factorstructure specification has the advantage of providing a parsimonious parameterisation in whichto model contagion from the crisis affected countries to those countries operating on the peripheryof the region. In constructing the model the transmission of both anticipated and unanticipatedshocks across exchange rate markets are specified. Before developing the most general modelof contagion, a model of market interdependence is first specified.
6
A factor model of interdependence
Let
y
i
,
t
represent the demeaned exchange rate return of the
i
th
country, computed against theUS dollar
y
i
,
t
=
s
i
,
t
−
ß
i
, (1)
where
s
i
,
t
is the continuously compounded percentage return of the
i
th
exchange rate at time
t
,and
ß
i
is the corresponding sample mean. A factor model of currency returns that allows forinterdependent linkages, but no contagion, is expressed as
y
i
,
t
=
λ
i
V
t
+
θ
F
t
+
φ
i
C
i
,
t
. (2)
The first factor
V
t
, is common to all countries but has varying impacts as given by the loadingparameter
λ
i
. The next factor
F
t
, is also common to all countries except the impact on eachcountry is fixed and equal to
θ
. This factor arises from defining the exchange rates relative to acommon numeraire, in this case the US dollar. The restriction that the loading parameter isconstant across currency returns imposes a no arbitrage condition on the model (Dungey (1999)).For these reasons, the factors
V
t
and
F
t
are respectively referred to as the variable and fixedfactors. As these two factors are common to all countries they are also referred to as the globalfactors, or monsoonal factors in Masson’s (1999a,b,c) terminology, which capture the effects ofchanging world economic conditions through changes in market fundamentals that impact uponall currency markets. The final factor is
C
i
,
t
which captures country-specific movements in cur-rency markets.
Equation (2) can be used to provide an expression for both the variance of currency returnsas well as the covariance between returns across different currency markets. Assuming that thefactors are
iid
(0, 1) random variables, the volatility of currency returns is given by the variance
(3)
This expression shows that exchange rate volatility of each country is decomposed into threecomponents. The first two terms represent the contributions of the variable ( ) and fixed (
θ
2
)factors, whilst the third component corresponds to the contribution of the country component( ) arising from shocks that are idiosyncratic to the
i
th
country’s currency market. Comove-ments in currency markets are represented by the covariance
Covar
(
y
i
,
t
,
y
j
,
t
)
=
E
[
y
i
,
t
y
j
,
t
](4)
=
λ
i
λ
j
+
θ
2
.
6
A further extension of this framework would be to study the strength of contagion both across countriesas well as across financial markets; see for example Dungey and Martin (2001), Favero and Giavazzi(2002), and Forbes and Rigobon (2001).
Var y E yi t i t
i i
( ) [ ]
., ,=
= + +
2
2 2 2λ θ φ
λ i2
φ i2

384 AUSTRALIAN ECONOMIC PAPERS DECEMBER
© Blackwell Publishing Ltd/University of Adelaide and Flinders University of South Australia 2004.
This expression shows that any comovements in currencies are totally determined by the twocommon factors (variable and fixed) impacting upon all currency markets. As the common factorsrepresent the market fundamentals, the currency markets are also referred to as being inter-dependent (Forbes and Rigobon (2002)).
The expressions for the variances and covariances in equations (3) and (4) respectively,provide a framework for interpreting the relative magnitudes of the empirical variances andcovariances of the data. If the impact of the variable common factor is similar for each cur-rency, so that
λ
i
λ
j
�
for example, then the differences between the variance and covariance ofthe data must be due to the contribution of the country-specific factor ( ). That is the expression
in the case where λiλj � . The variances and covariances ofthe currency returns of selected countries are presented in Table II, for the crisis period definedas 2nd June 1997 to 31st August 1998. It can be readily seen that the variances are in fact con-siderably higher than the covariances for each return and results to be presented later in thepaper, suggest that the approximation λiλj � does not hold in a slightly more complicatedmodel. Nevertheless, calibrating the parameters of the model to match the theoretical momentsin equations (3) and (4) to the empirical moments in Table II provides the basis of the estima-tion strategy for empirical application of this paper.
A model with contagion and spillovers
An important property of the factor model presented in (2) is that the covariances are fullydetermined by the contribution of the variable and fixed components. That is, comovements incurrency returns are totally governed by factors which act upon all exchange rates. These factorsare commonly interpreted as global factors which represent movements in key economicvariables underlying exchange rate market fundamentals. This suggests that the specification ofthe factor structure in (2) is inappropriate for modelling transmission channels which act inaddition to the standard economic channels arising from movements in market fundamentals. Itis this additional channel that is referred to as contagion.
To expand the model in (2) to include a contagious linkage from the set of East-Asian countriesto the developed countries of Japan (JP), Australia (AU) and New Zealand (NZ), it is necessary toidentify the component in Asian exchange rate movements which is unanticipated. One way todo this is to consider a regional factor which just impacts upon the East-Asian currency marketsat time t, thereby capturing the increased volatility encountered in the currency markets of Korea(KO), Indonesia (ID), Thailand (TH) and Malaysia (MY), during the East-Asian crisis. Assumingthat the regional factor follows an AR(1) process, this factor is written as7
7 This assumption is justified on the basis of the empirical characteristics of the data where there is evidenceof an AR(1) structure in the data but which is not captured by the factor model specified in equation (2).
Table II Variances and covariances of the M = 7 demeaned currency returns over the crisis period (2/6/1997to 31/8/98).
Korea Indon. Thai. Malay. Japan Aust. N.Z.
Korea 8.462Indon. 1.907 25.601Thai. 0.687 4.436 4.501Malay. 0.850 4.261 1.847 3.282Japan 0.136 0.877 0.300 0.342 0.663Aust. 0.280 1.061 0.410 0.485 0.238 0.520N.Z. 0.119 1.086 0.476 0.495 0.297 0.422 0.533
λ i2
φ i2
Var y Covar y yi t i t j t i( ) ( , ) , , ,− � φ 2 λ i2
λ i2
2004 CURRENCY MARKET CONTAGION 385
© Blackwell Publishing Ltd/University of Adelaide and Flinders University of South Australia 2004.
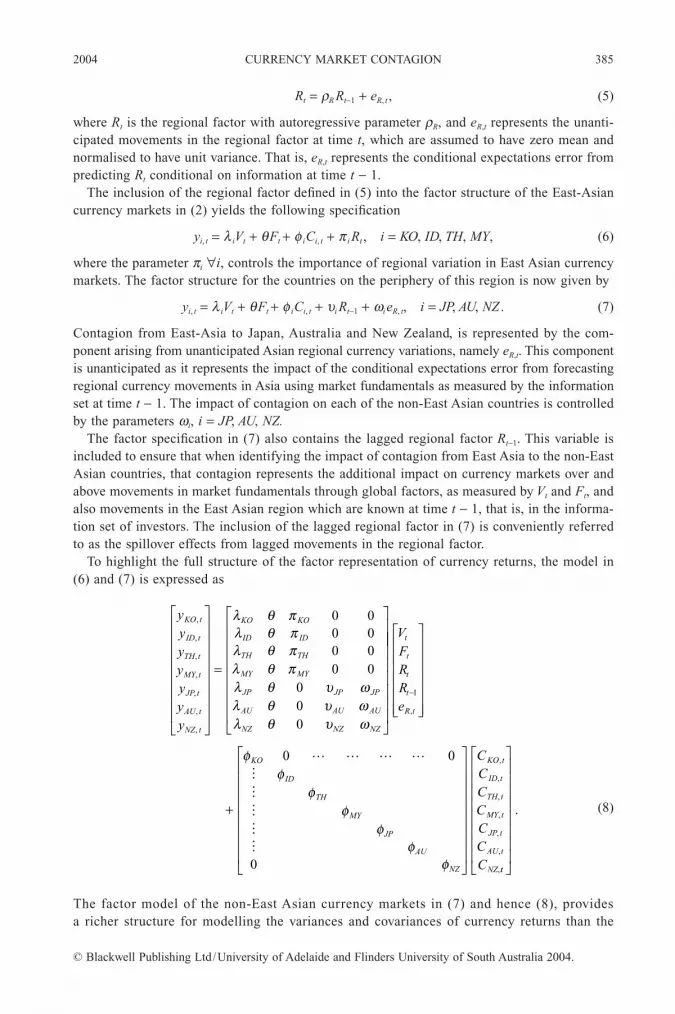
Rt = ρR Rt−1 + eR, t , (5)
where Rt is the regional factor with autoregressive parameter ρR, and eR,t represents the unanti-cipated movements in the regional factor at time t, which are assumed to have zero mean andnormalised to have unit variance. That is, eR,t represents the conditional expectations error frompredicting Rt conditional on information at time t − 1.
The inclusion of the regional factor defined in (5) into the factor structure of the East-Asiancurrency markets in (2) yields the following specification
yi, t = λ iVt + θFt + φ iCi, t + π i Rt , i = KO, ID, TH, MY, (6)
where the parameter πi ∀i, controls the importance of regional variation in East Asian currencymarkets. The factor structure for the countries on the periphery of this region is now given by
yi, t = λ iVt + θFt + φ iCi, t + υi Rt−1 + ωieR, t, i = JP, AU, NZ . (7)
Contagion from East-Asia to Japan, Australia and New Zealand, is represented by the com-ponent arising from unanticipated Asian regional currency variations, namely eR,t. This componentis unanticipated as it represents the impact of the conditional expectations error from forecastingregional currency movements in Asia using market fundamentals as measured by the informationset at time t − 1. The impact of contagion on each of the non-East Asian countries is controlledby the parameters ωi, i = JP, AU, NZ.
The factor specification in (7) also contains the lagged regional factor Rt−1. This variable isincluded to ensure that when identifying the impact of contagion from East Asia to the non-EastAsian countries, that contagion represents the additional impact on currency markets over andabove movements in market fundamentals through global factors, as measured by Vt and Ft, andalso movements in the East Asian region which are known at time t − 1, that is, in the informa-tion set of investors. The inclusion of the lagged regional factor in (7) is conveniently referredto as the spillover effects from lagged movements in the regional factor.
To highlight the full structure of the factor representation of currency returns, the model in(6) and (7) is expressed as
(8)
The factor model of the non-East Asian currency markets in (7) and hence (8), providesa richer structure for modelling the variances and covariances of currency returns than the
yyyyyyy
KO t
ID t
TH t
MY t
JP t
AU t
NZ t
KO KO
ID ID
TH TH
MY MY
JP JP JP
AU AU AU
NZ NZ NZ
,
,
,
,
,
,
,
=
λ θ πλ θ πλ θ πλ θ πλ θ υ ωλ θ υ ωλ θ υ ω
0 00 00 00 0
000
+
−
,
,
,
,
,
,
,
,
VFRRe
CCCCCCC
t
t
t
t
R t
KO
ID
TH
MY
JP
AU
NZ
KO t
ID t
TH t
MY t
JP t
AU t
NZ
1
0 0
0
φφ
φφ
φφ
φ
L L L L
M
M
M
M
M
tt
.

386 AUSTRALIAN ECONOMIC PAPERS DECEMBER
© Blackwell Publishing Ltd/University of Adelaide and Flinders University of South Australia 2004.
factor model given in (2). For example, in the case of Japan, Australia and New Zealand, theunconditional variance of currency returns given in (3) for the model of interdependence, nowbecomes
(9)
This expression shows that the average contribution of contagion to total volatility incurrency returns over the period is given by, . This term acts as a residual in the sense thatit represents the contribution to exchange rate volatility having taken into account variationsfrom all other sources including global movements ( + θ 2), variations specific to countries( ), as well as spillover effects ( ). This measure of contagion represents anempirical definition that is consistent with the definition of contagion proposed by Masson(1999b).
The unconditional covariance in (4) for the case of dependence from the ith country (Korea,Indonesia, Thailand, Malaysia) to the jth country (Japan, Australia, New Zealand), now becomes
(10)
This expression decomposes exchange rate comovements into an interdependent term arisingfrom global (λiλj + θ 2) and spillover ( ) effects, and a term that is the result ofcontagion (πiωj). Thus, this expression can be used to study the relative strengths of contagionarising from each of the four East-Asian currency markets to the Japanese, Australian and NewZealand currency markets.
An alternative representation of the definition of contagion is given by the change in the cor-relation of currency returns between the crisis and non-crisis periods (Forbes and Rigobon(2002)). Using the specifications of the contagion and interdependent models, the change incorrelation is expressed as
(11)
A test of no change in the correlation is given by testing ωj, which is also the same parameterthat controls the strength of contagion in the factor model.
Volatility specification
It is evident from Figure 1 that currency returns exhibit very pronounced volatility clusteringduring the period of the East-Asian crisis. To formalise this point, univariate GARCH(1, 1) modelsare estimated and presented in Table III for each country. The form of the GARCH model followsmuch of the literature and is given by (Bollerslev, Chou, and Kroner (1992))
Var y i JP AU NZi t i i
i
Ri( )
, , , ., = + + +
−+ =λ θ φ
υρ
ω2 2 22
22
1
ω i2
λ i2
φ i2
υ ρi R2 21/( )−
Covar y yi t j t i j
i j R
Ri j( , )
., , = + +
−+λ λ θ
π υ ρρ
π ω221
π υ ρ ρi j R R/( )1 2−
∆Corr y yi t j t
i ji ji R
Ri j
i ii
R
j jj
Rj
i ji ji
( , )
, , =+ +
−+
+ + +−
+ + +−
+
−+ +
λ λ θπ υ ρ
ρπ ω
λ θ φ πρ
λ θ φυ
ρω
λ λ θπ υ ρ
22
2 2 22
2
2 2 22
22
2
1
1 1
RR
R
i ii
R
j jj
R
1
1 1
2
2 2 22
2
2 2 22
2
.−
+ + +−
+ + +−
ρ
λ θ φ πρ
λ θ φυ
ρ

2004 CURRENCY MARKET CONTAGION 387
© Blackwell Publishing Ltd/University of Adelaide and Flinders University of South Australia 2004.
(12)
Parameter estimation is based on maximum likelihood, with the QMLE t-statistics given inbrackets. These results suggest that there is evidence of GARCH across the exchange ratereturns. There is also some commonality in the point estimates of the GARCH parametersacross countries suggesting that the volatility structures could be captured by a low dimensionalfactor structure. Finally, the results also show some evidence of autocorrelation in returns forKorea and Indonesia.
Given the results of the GARCH models of currency returns in Table III, a common factorstructure underlying conditional volatility across currency returns is specified whereby thevariable (V ), fixed (F) and regional (R ) factors are all specified to follow GARCH processes ofthe form
(13)
where
(14)
are unanticipated shocks arising from the variable, fixed and regional factors, and
(15)
An advantage of this specification is that it is a parsimonious representation of a multivariateGARCH model, thereby circumventing many of the problems inherent in estimating this classof models (Engle, Ng, Rothschild (1992), Diebold and Nerlove (1989)). To complete the spe-cification of the factor model, as with the specification of the regional factor in (5), the variableand fixed factors are also specified to exhibit first order autocorrelation
Vt = ρVVt−1 + eV, t , (16)Ft = ρFVt−1 + eF, t ,
where eV, t and eF, t are assumed to be iid (0, 1) random variables. The specification that the countryspecific factors are also iid (0, 1) random variables is retained.
s s e
e h u
h e h
u N
i t i t i t
i t i t i t
i t i t i t
i t
, , ,
, , ,
, , ,
,
,
,
,
~ ( , ).
= + +
== + +
−
−
ρ ρ
α α β
0 1 1
0 12
1 1
0 1
Table III Maximum likelihood parameter estimates of univariate GARCH(1, 1) models in equation (12)over the crisis period (2/6/1997 to 31/8/98): QMLE t-statistics in brackets.
Country
Parameter
ρ0 ρ1 α 0 α 1 β 1 ln L
Korea 0.030 (1.671) 0.204 (2.717) 0.004 (1.103) 0.313 (2.003) 0.767 (11.043) −434.191Indonesia −0.021 (−0.152) 0.190 (2.173) 1.604 (2.187) 0.584 (3.201) 0.478 (5.109) −884.474Thailand 0.048 (0.481) 0.001 (0.019) 0.068 (1.000) 0.273 (2.889) 0.786 (12.771) −647.784Malaysia 0.056 (1.212) 0.075 (1.073) 0.014 (1.606) 0.214 (2.545) 0.832 (17.168) −584.847Japan 0.086 (1.934) 0.058 (0.848) 0.210 (1.270) 0.141 (0.811) 0.545 (1.607) −378.006Australia 0.077 (2.284) 0.010 (0.209) 0.005 (5.390) −0.026 (−1.245) 1.020 (48.770) −326.843New
Zealand0.100 (2.994) −0.021 (−0.400) 0.004 (4.360) −0.020 (−0.792) 1.015 (44.440) −323.542
h e h k V F Rk t k k k k t k k t, , , , , , ,= − − + + =− −1 12
1α β α β
e h u k V F Rk t k t k t, , , , , , ,= =
u N k V F Rk t, ~ ( , ), , , .0 1 =

388 AUSTRALIAN ECONOMIC PAPERS DECEMBER
© Blackwell Publishing Ltd/University of Adelaide and Flinders University of South Australia 2004.
The unconditional variance decompositions for this extended factor model for the two sets ofcountries are as follows. For Japan, Australia and New Zealand it is
(17)
For the East-Asian crisis countries of Korea, Indonesia, Thailand and Malaysia, the volatilitydecomposition is
(18)
I I I . T h e E a s t- a s i a n C u r r e n cy C r i s i s
In this section the latent factor model specified in equations (8) and (13) to (16) is estimatedover the East-Asian currency crisis, taken as the period 2nd of June, 1997, to the 31st ofAugust, 1998. For comparison and as a test of the model, the factor model is also estimatedover a non-crisis period, beginning January 3rd, 1995 and ending March 27th, 1997. The set ofcrisis countries chosen are Korea, Indonesia, Thailand and Malaysia. The aim is to quantify therelative strength of any contagious channels linking the currency markets of the crisis affectedcountries of East-Asia with the currency markets of Japan, Australia and New Zealand.
The data consist of percentage exchange rate returns, computed as 100 times the differenceof the natural logarithm of each exchange rate. All currency returns are demeaned by subtractingthe sample mean from each returns series.
Estimation procedures
The model is estimated using a simulation based procedure following the approach ofGourieroux, Monfort and Renault (1993) and Gallant and Tauchen (1996). The application of thesimulation estimator to latent factor models is discussed in Dungey, Martin and Pagan (2000),with key details of the procedure to estimating the class of factor models studied here given inDungey and Martin (2004). The intuition behind the approach is that the parameters of thefactor model are chosen to match the moments of the currency returns data with the momentsof the simulated returns data, where the simulated data are obtained from simulating the factor
Var yi
i
V
F
i
i
R
i
( )
:
:
:
:
:
.=
−
−
−
λρ
θρ
φ
υρ
ω
2
2
2
2
2
2
2
2
1
1
1
Variable
Fixed
Country
Spillover
Contagion
Var yi
i
V
F
i
R
i
( )
:
:
:
:
.=
−
−
−
λρ
θρ
πρ
θ
2
2
2
2
2
2
2
1
1
1
Variable
Fixed
Regional
Country

2004 CURRENCY MARKET CONTAGION 389
© Blackwell Publishing Ltd/University of Adelaide and Flinders University of South Australia 2004.
model. The main moments chosen consist of the variances and covariances of returns, and theautocorrelations of both returns and squared returns. The variances and covariances are usedto identify the loading parameters {λi, θ, πi, ωi, φi; ∀i} in (8). Calculating moments based onautocorrelations identifies the autocorrelation parameters {ρV, ρF, ρR} which drive the variable,fixed and regional factors in equation (16) and (5) as well as {υi; ∀i} which control the spillovereffects. Finally, the GARCH parameters {αi , βi ; ∀i} in (13) governing the volatility dynamicsof these same factors, are identified from computing autocorrelations of the squared returns.
The total number of moment conditions is 42, which are used to identify the 34 unknownparameters in the factor model. Letting ! represent the (34 × 1) vector of unknown parameters,the simulation estimator of Ψ is given as the solution to
! = arg min G′I −1G, (19)
where G is a ( 42 × 1) vector of excess moment conditions equal to the difference between themoments of the actual returns and the moments of the simulated returns, and I is the Newey-West optimal weighting matrix based on the outer products of the moments of the actual returns(Gourieroux, Monfort and Renault (1993), Gallant and Tauchen (1996)).
All calculations are performed using the GAUSS programming language. The BFGS gradientalgorithm in the OPTMUM library of GAUSS is used to solve (19), with all gradients com-puted numerically. The GAUSS procedure RNDN is used to generate the normal random numbers.The length of the simulated time series is set at 20 × T + 100 = 6460, where T = 318 is the samplesize for the crisis period. The first 100 observations are discarded to overcome start-up problemswhen simulating the variable, fixed and regional factors. This makes the effective sample sizeof the simulated returns during the crisis period equal to 6360. The length of the lag distributionused to calculate I in (19) is chosen as L = 5.
Crisis period results
The volatility decomposition using equations (17) and (18) for the crisis period are reportedin Table IV. An overall test of the model is given by testing the number of overidentifyingrestrictions. The test statistic is calculated as the value of the objective function in (19) multipliedby the sample size. Under the null hypothesis that the model is correctly specified, this statisticis distributed asymptotically as where R = 42 − 34 = 8 is the number of overidentifyingrestrictions. The value of the test statistic is 11.779 with a p-value of 0.161, showing that the nullhypothesis that the model is correctly specified cannot be rejected at the 5% level.
Table IV Unconditional model volatility decompositions expressed as a percentage of total over the crisisperiod (2/6/1997 to 31/8/98): based on equations (17) to (18).
Country
Components
Variable Fixed Regional Country Spillovers Contagion
Korea 69.178 2.439 0.021 28.362Indonesia 22.037 2.353 19.008 56.602Thailand 11.531 10.363 14.383 63.723Malaysia 36.934 12.652 20.383 30.031Japan 18.210 39.583 28.018 14.060 0.129Australia 32.040 50.577 7.058 8.549 1.776New Zealand 55.548 31.474 9.546 0.351 3.081
χR2

390 AUSTRALIAN ECONOMIC PAPERS DECEMBER
© Blackwell Publishing Ltd/University of Adelaide and Flinders University of South Australia 2004.
The variance decompositions reported in Table IV show that for the developed countries onthe periphery of the crisis the contribution of contagion from the East-Asian regional factor tototal volatility is relatively small, 3% in New Zealand, slightly over half that for Australia andless than 1% in Japan. In contrast, the spillover from the East-Asian regional factor is relativelyimportant for Japan (14%) and Australia (9%), but small for New Zealand (less than 1%). Alarge proportion of the exchange rate volatility in the developed markets is attributed to globalshocks, equal to the sum of the variable and fixed components in Table IV: Japan (58%), Australia(83%), New Zealand (87%). Australia (51%) is the country most affected by the fixed factor outof all seven countries. In the developed markets the contribution of the country-specific factorto volatility is largest for Japan (28%), followed by New Zealand ( just under 10%) and Australia(7%). These results indicate that world factors dominated all non-Asian crisis economies withvery little exchange rate volatility evident due to contagion.
The point estimates of the parameters underlying these calculations are contained in TableVII of the Appendix. It is worth noting that the parameters λi do not satisfy the approximationλiλj � discussed in Section II. The appropriate expression for the comovements in the cur-rency returns in the framework of the estimated model is given as
(20)
As the components of the covariances are not all positive, the results for the covariance esti-mates presented in Table V are scaled by the Euclidean norm of the four components in (20).These results highlight the importance of the factors governing interdependent movementsin currency returns, with the variable and fixed factors, the first two terms in equation (20),dominating the covariance movements. Spillover effects from Indonesia and Thailand to Japan arerelatively more important than the contagion channel. The opposite result occurs for Australiaand New Zealand where contagion from Indonesia and Thailand is found to be relatively more
Table V Unconditional model covariance decompositions over crisis period (2/6/1997 to 31/8/98) from theEast-Asian countries to Japan, Australia and New Zealand. Decompositions in equation (20) standardised bythe Euclidean norm.
Country
Components
Variable Fixed Spillovers Contagion
JapanKorea −0.954 0.264 0.134 −0.050Indonesia −0.853 0.411 −0.300 0.112Thailand −0.554 0.774 −0.286 0.107Malaysia −0.748 0.645 −0.148 0.055
AustraliaKorea −0.960 0.227 −0.079 0.141Indonesia −0.862 0.354 0.178 −0.316Thailand −0.598 0.712 0.181 −0.321Malaysia −0.791 0.582 0.092 −0.163
New ZealandKorea −0.980 0.138 −0.012 0.144Indonesia −0.914 0.225 0.029 −0.335Thailand −0.745 0.532 0.035 −0.401Malaysia −0.899 0.396 0.016 −0.186
λ i2
Covar y yi t j ti j
V F
i j R
Ri j( , )
., , =
−+
−+
−+
λ λρ
θρ
π υ ρρ
π ω1 1 12
2
2 2

2004 CURRENCY MARKET CONTAGION 391
© Blackwell Publishing Ltd/University of Adelaide and Flinders University of South Australia 2004.
important than spillovers. However, neither of these linkages are as important as the two com-mon factor transmission channels. The interesting feature of the Australian and New Zealandresults is the similarity between the covariance decompositions of the two countries across bothEast-Asian country influences and across transmission mechanism channels.
The importance of world factors in contributing to volatility in the Australian and NewZealand dollar markets is supported by Ellis and Lewis (2000). They also found that Asianexchange market movements accounted for 8% and 5.5% of the variation in the AUS/US andNZ/US exchange rates respectively, similar in magnitude to the sum of the spillover and contagionreported here. Both Tavlas (2000) and Grenville (1999) support the contention that Australiawas not seriously effected by the Asian crisis attributing this to Australia’s relatively more maturefinancial markets. McKibbin (1998, 1999) comes to similar conclusions, while Summers (2001)presented predictions that the effects of the Asian crisis on the Australian economy wouldnot be as large as some feared. Duncan and Yang (2000) attributes Australia’s resilience to theAsian crisis to the low dependence on manufacturing exports in Australia, as there is muchpressure on this sector from those economies involved in the Asian crisis. In an examinationof contagion between currency and equity markets, Dungey and Martin (2001) also find littleevidence of contagion between Asia and Australia.
The evidence of only small transmission effects from contagion to Japan, Australia and NewZealand supports the finding of Bae, Karolyi and Stultz (2003) who argue that contagion is aphenomenon most applicable to emerging countries, rather than developed nations. In contrast,however, Dungey, Fry, González-Hermosillo and Martin (2002a, 2002b), find that both devel-oping and mature markets may be affected by contagion. It should, however, be noted that noattempt to measure contagion in the Asian crisis countries is undertaken in this study.
Existing analysis of the transmission of the East Asian crisis amongst the crisis countries hasemphasised the potentially different channels between Indonesia, Thailand and Malaysia, andthose to Korea, see Krugman (1998). This feature is reflected in the empirical results for theEast-Asian countries in Table IV. The contribution of the regional factor is similar for Indonesia(19%), and Malaysia (20%), slightly less for Thailand (14%), but practically insignificant forKorea with a value of less than 1%. The main factors governing Korea’s exchange rate volatilityover the crisis period are world shocks, 69% + 2% = 71%. This contrasts with the other threeEast-Asian economies where the contribution of world shocks is between 20% and 37%.
Pre-crisis period results
The results of the crisis period show a rich factor structure across the seven exchange ratesinvestigated. Given that contagion is hypothesised to occur during crisis periods, a test of themodel would be to determine if the model predicts any significant (spurious) contagious link-ages during the pre-crisis period. The pre-crisis period is taken as beginning January 3rd, 1995,and ending March 27th, 1997, yielding a sample of size T = 565.
The volatility decompositions in equations (17) and (18) from estimating the latent factormodel over the pre-crisis period are given in Table VI. These results show no strong evidenceof contagion from the East-Asian region to either Japan, Australia or New Zealand. The onlyform of interdependence between the two set of countries is, however, through spillovers in thecase of Australia and New Zealand, but not for Japan.
Closer inspection of the factor structure in Table VI reveals that currency returns for the pre-crisis period tend to be dominated by idiosyncratic country behaviour. This is particularly thecase for Korea and Indonesia where about 90% of volatility is internally driven. The dominantcomponent driving volatility in Malaysia is the regional factor. However, the regional factor is

392 AUSTRALIAN ECONOMIC PAPERS DECEMBER
© Blackwell Publishing Ltd/University of Adelaide and Flinders University of South Australia 2004.
acting as a surrogate factor for Malaysia’s idiosyncratic shocks as the regional factor is dom-inated by volatility in Malaysia’s currency returns. A similar feature occurs in the results forJapan, whereby practically all of the volatility in Japanese currency returns is determined bythe variable factor, implying that the variable factor can be equated with Japan. This result isinterpreted as giving Japan the status of an exogenous factor in the region. For Thailand, aboutone third of volatility in its currency market is the result of local shocks, with most of theremaining volatility attributed to the variable factor.8
I V. C o n c l u s i o n
This paper has provided a general framework to identify the transmission mechanismsoperating between those countries directly affected by the East-Asian currency crisis in 1997–98, and mature markets on the periphery of the region. The East-Asian countries consistedof Korea, Indonesia, Thailand and Malaysia, whilst the mature markets consisted of Japan,Australia and New Zealand. The methodology adopted followed Masson (1999a, 1999b, 1999c)who decomposed exchange rate volatility into monsoonal or global factors, spillovers and con-tagion. Whilst various methods of analysing contagion have been explored in the literature, alack of a consistent definition of contagion has meant that no consensus has been reached onthe most appropriate way to model currency crises and contagion. This lack of consensus on thenature, measurement and transmission of contagion has implications for not only the countriesdirectly involved in a currency crisis, but also countries on the periphery of the crisis, andorganisations such as the IMF who are entrusted with the co-ordination of rescue packages.
The main empirical result was that there was very little evidence of contagion over the periodof the currency crisis of 1997–98, from East-Asia to either Japan, Australia or New Zealand.The main factors underlying comovements in currency markets were global, which impactedjointly on all currency markets thereby resulting in interdependent movements in currencyreturns between countries within the Asia-Pacific region. There was some evidence of spillo-vers, as defined by lagged movements in a factor which encapsulated regional movements inEast Asia, but the contribution of this factor to volatility in Japan, Australia and New Zealandwas of a much lower order of importance than the global factors. These results are consistent
8 The interpretation of the factors during the pre-crisis period suggest that the factor model is over spe-cified. As the focus of the empirical analysis is on the crisis period, this alternative, reduced factor model,was not investigated further.
Table VI Unconditional model volatility decompositions expressed as a percentage of total over the pre-crisis period (3/1/1995 to 30/5/97): based on equations (17) to (18).
Country
Components
Variable Fixed Regional Country Spillover Contagion
Korea 8.122 1.505 0.391 89.982Indonesia 0.016 9.047 0.026 90.911Thailand 58.074 5.738 2.945 33.243Malaysia 9.564 2.115 88.215 0.105Japan 98.039 0.137 0.025 0.322 1.477Australia 2.619 0.301 67.825 28.758 0.497N. Zealand 6.546 0.490 31.869 61.092 0.003

2004 CURRENCY MARKET CONTAGION 393
© Blackwell Publishing Ltd/University of Adelaide and Flinders University of South Australia 2004.
with the empirical analysis of Forbes and Rigobon (2002) on East-Asian equity markets con-ducted over a similar period, who also found no strong statistical evidence of contagion.
The empirical results of this paper have useful policy implications. The predominance ofanticipated channels in transmitting the crisis from the East Asian markets to those of Australia,Japan and New Zealand, means that a thorough understanding of the linkages between theregional economies will help policy makers in the developed markets anticipate the effects ontheir economies. There is little evidence of transmission by unanticipated linkages, or contagion.Additionally, there is evidence that the linkages between the crisis currencies and Australiaand New Zealand shared a similar structure, so that information co-ordination between theseeconomies can help in analysing the effects of the crisis.
A p p e n d i x : Fac t o r M o d e l E s t i m at e s
R e f e r e n c e s
Bae, K.H, Karolyi, G.A. and Stulz, R.M. 2003, ‘A New Approach to Measuring Financial Contagion’,Review of Financial Studies, vol. 16, pp. 717–763.
Bollard, A. and Rose, J. 1998, ‘Responding to the Asian Crisis – A New Zealand Perspective’, Abackground paper for an address by Dr Alan Bollard, Secretary to the Treasury, to a seminar by theStrategic Management Society, Wellington Branch, on the Asian Crisis: Strategic and EconomicImplications.
Bollerslev, T., Chou, R.Y. and Kroner, K.F. 1992, ‘ARCH Modeling in Finance: A Review of the Theoryand Empirical Evidence’, Journal of Econometrics, vol. 52, pp. 5–59.
Brash, D.T. 1998, The Road Ahead, Speech, Donald T. Brash, Governor of the Reserve Bank of NewZealand to Small and Medium Sized Businesses, 25th November, 1998.
Cabinet Office 1998, ‘The Japanese Economy in 1998: A Review of Events and Challenges for theFuture – Recovering from the after Effects of the Bubble’s Collapse’, mimeo, Cabinet Office,Government of Japan.
Commonwealth Treasury 1998, ‘Australia’s Participation in Support Arrangements for East AsianAdjustment Programs’, Economic Roundup Summer 1998, pp. 89–105.
—— 2000, Australia and the Asian Development Bank 1998–1999 Annual Report to Parliament by theHon Peter Costello MP, Treasurer, Commonwealth Treasury, Canberra.
Table VII Parameter estimates of the contagion model in equations (8) and (13) to (16) estimated over thecrisis period (2/6/1997 to 31/8/98).
Country/Factor
Parameter
λi θ πi υi ω i φ i ρi αi βi
Korea −3.141 0.593 0.054 −2.033Indonesia −1.805 0.593 −1.647 2.924Thailand −0.622 0.593 −0.682 1.478Malaysia −1.008 0.593 −0.735 0.918
Japan 0.400 0.593 −0.355 0.033 −0.502Australia 0.470 0.593 0.245 −0.108 0.223New Zealand 0.783 0.593 0.063 −0.181 −0.328
Variable −0.146 0.981 0.001Fixed 0.107 0.046 0.907Regional 0.236 0.346 0.386

394 AUSTRALIAN ECONOMIC PAPERS DECEMBER
© Blackwell Publishing Ltd/University of Adelaide and Flinders University of South Australia 2004.
Diebold, F.X. and Nerlove, M. 1989, ‘The Dynamics of Exchange Rate Volatility: A MultivariateLatent-Factor ARCH Model’, Journal of Applied Econometrics, vol. 4, pp. 1–22.
Diwan, I. and Hoekman, B. 1999, ‘Competition, Complementarity and Contagion in East Asia’ inP.R. Agenor, M. Miller, D. Vines and A. Weber (eds), The Asian Financial Crisis: Causes, Contagionand Consequences, Cambridge University Press, Cambridge, UK.
Duncan, R. and Yang, Y. 2000, ‘The Impact of the Asian Crisis on Australia’s Primary Exports: Why ItWasn’t So Bad’, Australian Journal of Agricultural and Resource Economics, vol. 44, pp. 369–391.
Dungey, M. 1999, ‘Decomposing Exchange Rate Volatility Around the Asia-Pacific Rim’, Journal ofAsian Economics, vol. 10, pp. 525–535.
—— and Martin, V.L. 2004, ‘A Multifactor Model of Exchange Rates with Unanticipated Shocks:Measuring Contagion in the East Asian Currency Market’, Journal of Emerging Markets Finance,vol. 3, no. 3, pp. 305–330.
—— and —— 2001, ‘Contagion Across Financial Markets: An Empirical Assessment’, New YorkStock Exchange Conference Paper, February 16–17, 2001, Hawaii.
——, —— and Pagan, A.R. 2000, ‘A Multivariate Latent Factor Decomposition of International BondYield Spreads’, Journal of Applied Econometrics, vol. 15, pp. 697–715.
——, Fry, R.A., González-Hermosillo, B. and Martin, V.L. 2002a, ‘International Contagion Effectsfrom the Russian Crisis and the LTCM Near-Collapse’, IMF Working Paper #02/74.
——, Fry, R., González-Hermisillo, B. and Martin, V.L. 2002b, ‘The Transmission of Contagion inDeveloped and Developing International Bond Markets’, in Committee on the Global FinancialSystem (ed), Risk Measurement and Systemic Risk, Proceedings of the Third Joint Central BankResearch Conference, pp. 61–74.
Ellis, L. and Lewis, E. 2000, ‘The Response of Financial Markets in Australia and New Zealand toNews about the Asian Crisis’, BIS Conference on International Financial Markets and the Implica-tions for Monetary and Financial Stability, Basle, 25–26 October, 1999, vol. 8, pp. 308–348.
Engle, R.F., Ng, V.K. and Rothschild, M. 1992, ‘Asset Pricing with a Factor-ARCH Covariance Struc-ture: Empirical Estimates for Treasury Bills’, Journal of Econometrics, vol. 45, pp. 213–237.
Favero, C.A. and Giavazzi, F. 2002, ‘Is the International Propagation of Financial Shocks Non-linear?Evidence from the ERM’, Journal of International Economics, 57 (1), 231–46.
Forbes, K. and Rigobon, R. 2001, ‘Measuring Contagion, Conceptual and Empirical Issues’, inS. Claessens and K. Forbes (eds) International Financial Contagion, Kluwer Academic Publishers.
—— and —— 2002, ‘No Contagion, only Interdependence: Measuring Stock Market Co-movements’,Journal of Finance, vol. LVII, pp. 2223–2261.
Gallant, A.R. and Tauchen, F. 1996, ‘Which Moments to Match?’, Econometric Theory, vol. 12, pp. 657–681.
Gerlach, S. and Smets, F. 1995, ‘Contagious Speculative Attacks’, European Journal of Political Economy,vol. 11, pp. 45–63.
Glick, R. and Rose, A.K. 1999, ‘Contagion and Trade: Why are Currency Crises Regional?’, Journal ofInternational Money and Finance, vol. 18, pp. 603–617.
Goldstein, M. 1998, ‘The Asian Financial Crisis: Causes, Cures and Systemic Implications’, PolicyAnalysis in International Economics, 55, Institute for International Economics, Washington D.C.
Gourieroux, C., Monfort, A. and Renault, E. 1993, ‘Indirect Inference’, Journal of Applied Econometrics,vol. 8, pp. S85–S118.
Grenville, S. 1999, ‘Financial Crises and Globalisation’, Economics and Labour Relations Review,vol. 10, pp. 260–277.
—— 1998, ‘Capital Flows and Crises’, Reserve Bank of Australia Bulletin, December, pp. 16–31.Gruen, D. and L. Gower 1999, Capital Flows and the International Financial System: Proceedings of a
Conference, Reserve Bank of Australia, Sydney.Harrigan, J. 2000, ‘The Impact of the Asia Crisis on US Industry: An Almost Free Lunch?’, FRBNY
Economic Policy Review, vol. September, pp. 71–81.IMF 1999, ‘World Economic Outlook: International Financial Contagion’, May 1999.Kaminsky, G.L. and Schmukler, S.L. 1999, ‘What Triggers Market Jitters? A Chronicle of the Asian
Crisis’, Journal of International Money and Finance, vol. 18, pp. 537–560.—— and Reinhart, C.M. 2000, ‘On Crises, Contagion and Confusion’, Journal of International Eco-
nomics, vol. 51, pp. 145–168.

2004 CURRENCY MARKET CONTAGION 395
© Blackwell Publishing Ltd/University of Adelaide and Flinders University of South Australia 2004.
Krugman, P. 1998, ‘What Happened to Asia?’, mimeo, MIT.Mahieu, R. and Schotman, P. 1994, ‘Neglected Common Factors in Exchange Rate Volatility’, Journal
of Empirical Finance, vol. 1, pp. 279–311.Masson, P. 1999a, ‘Contagion: Macroeconomic Models With Multiple Equilibria’, Journal of Inter-
national Money and Finance, vol. 18, pp. 587–602.—— 1999b, ‘Contagion: Monsoonal Effects, Spillovers, and Jumps Between Multiple Equilibria’ in
P.R. Agenor, M. Miller, D. Vines and A. Weber (eds), The Asian Financial Crisis: Causes, Contagionand Consequences, Cambridge University Press, Cambridge, UK.
—— 1999c, ‘Multiple Equilibria, Contagion and the Emerging Market Crises’, IMF Working Paper#99/164.
McKibbin, W.J. 1998, ‘The Crisis in Asia: An Empirical Assessment’, Brooking Discussion Papers inInternational Economics, #136.
—— 1999, ‘International Capital Flows, Financial Reform and Consequences of Changing RiskPerceptions in APEC Economies’, Paper presented at the Institute of Policy Studies conference on‘Experiences of Economic Reform Within APEC’, Wellington New Zealand, July 12–14, 1999.
Ministry of Finance 1998, ‘An New Initiative to Overcome the Asian Currency Crisis’, Statement,Ministry of Finance, Japan, October 3, 1998.
Ministry of Foreign Affairs of Japan 1999, ‘Report of the Mission of Revitalization of Asian Economy:Living in Harmony with Asia in the Twenty-First Century’, mimeo, Ministry of Foreign Affairs ofJapan, November, 1999.
Sachs, J., Tornell, A. and Velasco, A. 1996, ‘Financial Crises in Emerging Markets: The Lessons from1995’, Brookings Papers on Economic Activity, vol. 0, pp. 147–98.
Summers, P.M. 2001, ‘Forecasting Australia’s Economic Performance During the Asia Crisis’, Inter-national Journal of Forecasting, vol. 17, pp. 499–515.
Tavlas, G. 2000, ‘On the Exchange Rate as a Nominal Anchor: The Rise and Fall of the CredibilityHypothesis’, Economic Record, vol. 76, pp. 183–201.
Wincoop, E. and Yi, K. 2000, ‘Asia Crisis Postmortem: Where Did the Money Go, and Did the UnitedStates Benefit?’, FRBNY Economic Policy Review, September, pp. 51–70.


