Embed Size (px)
Citation preview
E!ect of social group dynamics on contagion
Zhenyuan Zhao1, J.P. Calderon2, Chen Xu3, Dan Fenn4, Didier
Sornette5, Riley Crane5, Pak Ming Hui6 and Neil F. Johnson1
1Physics Department, University of Miami, Coral Gables, FL 33126, U.S.A.
2Industrial Engineering Department,
Universidad de Los Andes, Bogota, Colombia
3School of Physical Science and Technology,
Soochow University, Suzhou 215006, People’s Republic of China
4Oxford Centre for Industrial and Applied Maths,
Oxford University, Oxford OX1 3PU, U.K.
5ETH Zurich, D-MTEC, Kreuzplatz 5, 8001, Zurich, Switzerland
6Department of Physics, The Chinese University of Hong Kong, Shatin, Hong Kong
(Dated: October 16, 2009)
Abstract
Despite the many works on contagion phenomena in both well-mixed systems and heterogeneous
networks, there is still a lack of understanding of the intermediate regime where social group
structures evolve on a similar timescale to individual level transmission. We address this question
by considering the process of transmission through a model population comprising social groups
which follow simple dynamical rules for growth and break-up. Despite the simplicity of our model,
the profiles produced bear a striking resemblance to a wide variety of real-world examples – in
particular, empirical data that we have obtained for social (i.e. YouTube), financial (i.e. currency
markets), and biological (i.e. colds in schools) systems. The observation of multiple resurgent
peaks and abnormal decay times is qualitatively reproduced within the model simply by varying
the timescales for group coalescence and fragmentation. We provide an approximate analytic
treatment of the system and highlight a novel transition which arises as a result of the social group
dynamics.
1
I. INTRODUCTION
The world recently witnessed a ba!ing variety of global outbreak phenomena: the huge
fluctuations across the world’s financial markets, driven in part by the rapid global spread
of rumors[1]; an unexpected global outbreak of swine flu[2], driven in part by rapid social
mixing (e.g. within schools[3]); and even the sudden rise to global fame of an unknown
Scottish singer, driven in part by word-of-mouth sharing[4–6]. To understand how such
phenomena might arise, consider the following: The number and identity of the people with
whom we are each in instantaneous electronic or physical contact – and with whom we can
therefore instantaneously exchange information, rumors or viruses – can change slowly or
rapidly within any given day, according to the activities which we undertake and hence
the instantaneous social groups within which we happen to find ourselves. Even on the
shortest plane journeys, for example, passengers find themselves momentarily confined in an
enclosed space with complete strangers for up to an hour or more, enabling the exchange of
respiratory pathogens. On the blogosphere and on the Web, ephemeral groups form around
topics or content and exchange information, opinions and social contacts before flickering out
of existence. The transient transnational nature of online discussion groups and chat-rooms,
as frequented by financial traders or YouTube users[1, 5, 6] provides a vivid illustration.
A full description of such specific transmission processes would likely require rather so-
phisticated epidemiological models which incorporate system-specific details and considera-
tions (e.g. spatial topology, di"erential susceptibility). There are indeed many sophisticated
epidemiological models already under construction and study in the literature[7–16]. Some
of these focus on the well-mixed (i.e. mass-action) limit, some of these focus on the limit of
heterogeneous networks[10, 13–16] – and some attempt to move between the two by adding
patch-like structure to mass-action models, or dynamical link rewirings to network models.
In this paper, we focus on the less well understood dynamical regime where the group-
level dynamics and individual-level transmission processes can evolve on the same timescale,
and hence the number and identity of a given individual’s contacts can change abruptly over
time (see, for example, Fig 1(a) and (b)). In Sec. II, we introduce and analyze a simple
model which mimics the dynamical processes of social group formation/break-up and person-
to-person transmission of a virus or information, allowing them to co-exist on comparable
timescales. By varying the probabilities of group coalescence (!coal) and fragmentation
2
(!frag) relative to the standard SIR (Susceptible!Infected!Recovered) probabilities[7, 12]
for person-to-person transmission (p) and individual recovery (q), the entire range of relative
timescales can be easily explored – from a very slowly changing social network structure (i.e.
essentially a static network with infrequent rewirings) through to a rapidly changing social
network structure (i.e. essentially a well-mixed population). Most importantly, this includes
the complicated intermediate regime where both processes co-exist on the same timescale.
Figure 1 illustrates this intermediate regime, while Fig. 2 shows how an associated infection
profile I(t) is qualitatively very di"erent from the two limiting cases of the static (or quasi-
static) network or well-mixed population. Instead, the interplay of the group dynamics
and individual-level transmission generates epidemic profiles which exhibit a rich structure
(e.g. multiple resurgences and abnormal decay times, see Fig. 2). It turns out that such
profiles are strikingly similar to real-world outbreaks across the social, financial and biological
domains (see Fig. 3, and Sec. III). While it is conceivable that infection profiles similar to
Fig. 3 can also be obtained using alternative, more sophisticated epidemiological models
(e.g. by adding spatial topology or di"erential susceptibility), such models will typically
have more parameters and be more system-specific. By contrast, our model only has four
stochastic parameters for the probabilities (and hence timescales) of the individual level
transmission and group dynamics, i.e. p, q for the SIR process, and !coal and !frag which
describe the probability of social groups coalescing or fragmenting. We find it intriguing that
the qualitative shapes of such a wide range of empirical profiles (Fig. 3) can be reproduced
simply by varying these relative timescales. While we cannot prove that the empirically
observed profiles in Fig. 3 are indeed generated by such a simple model as ours, it seems
that more complex models are not required in order to reproduce their main features.
In Sec. IV, we o"er an approximate analytic analysis of the properties of our model.
While a detailed theoretical description of the infection profiles I(t) remains an open fu-
ture challenge, we find that the overall properties can be captured by making a mean-field
approximation of the behavior of connected pairs within the population. In Sec. V, we com-
ment on how our results also suggest a minimally-invasive dynamical method for controlling
outbreaks (see Fig. 4). Section VI provides a summary and outlook.
3
II. OUR MODEL
There are many plausible rules for generating human group dynamics[17]. The grouping
process that we choose involves simple cluster dynamics at each timestep, together with
individual-level transmission via SIR (Susceptible!Infected!Recovered). Provided that
the choice of social dynamics permits similar intrinsic self-amplification and suppression
processes by sporadically injecting infected individuals into susceptible groups (see Fig.
1(b) and bottom of Fig. 3), the resulting epidemic profiles from alternative choices of cluster
mechanism should exhibit similar characteristics – in particular, multiple resurgences and
abnormal decay times (see Figs. 2 and Fig. 3).
Our choice of cluster mechanism features the coalescence and fragmentation of groups
as described below, and illustrated in Fig. 1(b). There is a huge volume of work in the
mathematics, physics and chemistry literature on cluster models within a many-body pop-
ulation of interacting particles[18]. For modern social systems, one is typically interested in
mechanisms which mimic the long-range interactions that people can have (either through
transport in the case of transmission of viruses, or communications in the case of trans-
mission of a rumor or information). We choose the rate of coalescence of two groups of
size n1 and n2 respectively to be proportional to the combinatorial number of pairwise en-
counters between individuals, one from each group, i.e., the rate of coalescence is equal
to !coal · (n1/N) " (n2/N), where !coal # 1 is a coalescence probability. Similarly, a given
group of n individuals may break up (i.e. completely fragment) with a total rate equal to
!frag · (n/N), where !frag # 1 is a fragmentation probability with !frag + !coal # 1, reflect-
ing the increasing fragility of large groups (i.e. standard size e"ect). The implementation
of this social dynamics is essentially the same as Ref. [20], with the generalization that
the coalescence and fragmentation probabilities are general (i.e. !frag + !coal # 1 but !frag
is otherwise unrelated to !coal, in contrast to Ref. [20]). This specific cluster process has
real-world relevance for several reasons. First, it embodies the rare but dramatic changes
of contact networks that can occur, as mentioned in the introduction. Second, it produces
a distribution of group sizes which is power-law with exponent 2.5 for !coal $ !frag when
time-averaged, as shown in the related model for financial markets [20, 21]. This theoretical
model is therefore consistent with the observation of Gabaix et al.[19] who found that the
distribution of transaction sizes follows a power-law with slope near 2.5 for each of the three
4
major stock exchanges in New York, Paris and London. Third, this power-law exponent 2.5
is also consistent with the distribution of group sizes inferred for terrorists and insurgent
groups based on an analysis of casualty figures[22]. Fourth, the model is structurally robust
in that the group dynamic rules can be generalized to di"erent positive power exponents
" %= 1, # %= 1, $ %= 1, with coalescence and fragmentation rates given by !coal · n!1 " n"
2 and
!frag · n#, respectively, without losing the main qualitative features of the dynamics of the
number I(t) of infected individuals.
Individual connectivities within our model may change significantly on the same timescale
as the SIR process, thereby mimicking individuals participating in YouTube viewing, finan-
cial systems, and schools, who sometimes exhibit rapid moves among peer groups either
online or in real space, while simultaneously picking up and spreading rumors or pathogens.
A discrete illustration of our model over six time steps is shown in Fig. 1b and 1c. Fig.
1d contrasts the short-time group structure between individuals with the long-term linkage
between them: as time increases without bound, by ergodicity, all individuals will have even-
tually been part of some common group. While the latter long-time network structure is
the one usually emphasized in models of epidemic processes on complex networks, the short-
time limited linkage is essential to understand the competition between individual isolation
(which tends to stop an epidemic) and group coalescence which amplifies its spreading. In
short, this model provides us with a simple framework within which to explore and quantify
the interaction of these group dynamical processes and conventional SIR dynamics.
In the numerical implementation of the model, we run the above coalescence-
fragmentation dynamics until the time-averaged distribution of group sizes has become
stationary. Then, at some instant taken at the origin of time t = 0, one group is se-
lected, and an arbitrary individual in this group becomes infected, and hence the infection
profile unfolds according to the SIR process within each group, with all the groups un-
dergoing at the same time the coalescence-fragmentation dynamics according to the two
rates !coal and !frag. A typical simulation is shown in Figure 2, and is compared with the
popular approach that models spreading on static networks: (i) an instantaneous network
(T = 1, purple curve) and (ii) a global network formed by time-aggregating instantaneous
contacts over long times (T !&, green curve). SIR spreading dynamics on fixed networks
obtained at di"erent intermediate T gives curves that lie in the shaded area of Figure 2.
Our model can generate not only this type of dynamics, but also qualitatively new regimes
5
that arise from adjusting the coalescence-fragmentation rates: the large fluctuations, resur-
gences, and abnormally long decay time which are observed in our model (as illustrated in
Figure 2 (blue curve)) are generated by self-amplification and suppression processes due to
the coalescence-fragmentation group dynamics at all group-size scales.
III. THEORETICAL AND EMPIRICAL RESULTS
Figure 3 provides a comparison between two of the empirical profiles that we have col-
lected from each of three distinct real-world domains, and the theoretical infection profiles
I(t) produced by our model. By providing two empirical profiles for each real-world system,
our aim is to give confidence that the empirical features observed are not simply the result
of some irreproducible external noise. We could generate a number of metrics for comparing
the empirical and theoretical profiles (e.g. number of peaks, time interval between peaks,
peak-to-trough ratio) as is our intention for future studies when additional data is available
– but for now, the message that we wish to convey is a visual one, i.e. that our simple model
manages to capture the main qualitative features for each of these three distinct empirical
systems.
The sociological example (left column of Fig. 3) shows downloads for two similar YouTube
clips[5, 6]. Such downloads are typically driven by YouTube users absorbing and spreading
opinions as they share information in their social groups[6]. The two downloads appealed to
similar age-groups, and were measured close together in time, implying that a similar pool
of users accessed them both, in line with our model’s assumptions. Our model accounts well
for the long memory and aftershock-like decay. The top-left panel corresponds to ‘Gettin’
Enough’ from http://www.youtube.com/watch?v=AiXxMrkeklg. This video was uploaded
to the site on 8 November, 2006 at 13:33:12 GMT. The first record of a download is 9
November, 2006 at 17:21:35 GMT, with a view count of 5708. The last record is 24 May,
2007 at 21:34:30 GMT, with a view count of 257759. The video’s length is 225 seconds.
The middle-left panel shows downloads of music video ‘Borat’ from http://www.youtube.
com/watch?v=b1xXERFt_Zg. The video was uploaded to the site on 3 November, 2006 at
11:04:15 GMT. The first record of a download was 7 November, 2006 at 10:35:57 GMT
with a view count of 20745. The last record is 24 May, 2007 at 22:29:25 GMT, with a view
count of 254918. The video’s length is 154 seconds. These two music downloads are similar
6
in terms of appeal, age-group, total number of downloads, and lack of any public/global
announcement, news or advertisement, and are hence consistent with spreading through
contagion. The bottom-left panel shows our model’s output with !frag = 0.05, !coal = 0.81,
p = 0.001, q = 0.001.
The financial example (middle column of Fig. 3) shows foreign exchange movements as
a result of a specific rumor spreading among traders concerning revaluation of the Chinese
Yuan currency. This same rumor circulated twice in the space of a few months. The
fact that the currency pairs follow a similar dynamical pattern in each case, suggests that
the same underlying group dynamics developed, in line with our model. Note that this
financial epidemic is characterized by the largest coalescence rate !coal and much larger
infectivity parameter p among the three examples, reflecting the e#ciency of the information
cascade among currency traders. The top-centre panel corresponds to the CNY (Chinese
currency) revaluation rumor as detected from trader chat-rooms by HSBC bank (courtesy of
S. Williams). Specifically, we show the absolute returns on the timescale of 1-minute intervals
for the JPY (Japanese currency) exchange rates from 08:22 to 08:53 GMT, on 11 May 2005.
The middle-centre panel corresponds to the CNY actual revaluation. Absolute returns on the
timescale of 1-minute intervals are shown for JPY (Japanese currency) exchange rates from
11:03 to 11:34 GMT, on 21 July 2005. Since the CNY was not one of the directly traded
currencies, its e"ects on the JPY-X rates (where X is another currency) are indirect in
both cases, suggesting influence through contagion of the rumor/information. There was no
public announcement or global news to trigger this activity, which also supports spreading
through contagion. The bottom-centre panel shows our model output with !frag = 0.05,
!coal = 0.95, p = 0.009, q = 0.002. Since data are on 1-minute scale, but prices can change
on 1-second scale, we show an averaged output by providing value at regular equispaced
intervals, mimicking 1-minute.
The biological example (right column of Fig. 3) shows incidences of a cold among 1st
grade students in two schools in Bogota, Colombia. These data come from an ongoing moni-
toring experiment carried out by members of our team, in conjunction with the Universidad
de Los Andes, Bogota, based on weekly surveys of all students and sta" at Colegio Nueva
Granada (CNG) and Marymount School. The schools’ locations at the top of the Andes
guarantee that seasonal temperature variations are minimal. In addition, the student pop-
ulation of each approximates to a closed system due to local issues of security and social
7
segregation. We argue that the immune systems of the children have been subjected to a
soup of microbes coming and going, so that the successive bursts are part of the same dy-
namics, especially given the unchanging climatic conditions of this part of Columbia. Within
our approach, the school cold dynamics are found to be best described by the lowest frag-
mentation rate !frag and highest recovery parameter q, mirroring the more rigid structure
of inter-children contacts and the crucial role of multiple recuperations. The bottom-right
panel shows our model output with !frag = 0.001, !coal = 0.5, p = 0.001, q = 0.004. The
model output is smoothed, to mimic fact that data is recorded on the 1-week time interval.
We stress that more complex explanations of each empirical profile in Fig. 3 are un-
doubtedly possible – and may even be deemed as more realistic by specialists within each
field. However, our purpose here is to focus on a minimal description of common dynamical
features, and to highlight the fact that a common minimal description is possible.
IV. APPROXIMATE ANALYTIC ANALYSIS
A full analytic description of the I(t) profiles generated by our model represents a fas-
cinating open challenge. However some features can be captured by suitably generalizing
existing epidemiological machinery. A key quantity is the probability %SI(t) that a particular
link instantaneously exists and that it connects a susceptible and an infected. Thus, out of
a potential totality of N(N ' 1)/2 links among N individuals, only %SI(t) · N(N ' 1)/2 are
typically present. This provides an accurate equation for the number of susceptibles S(t) in
a given epidemic sequence: S(t) = 'p.%SI(t).N(N ' 1)/2, with p is the infectivity param-
eter quantifying the probability that a particular S is infected by a particular I to which
it is linked. We rewrite this in the conventional mass-action form S(t) = 'pPSI(t)S(t)I(t),
where PSI(t) is equivalent to %SI(t)N(N ' 1)/[2S(t)I(t)] and hence now incorporates the
complex dynamics which are so hard to capture analytically. We now approximate PSI(t) by
a constant term P , which is the time-averaged probability that any two arbitrarily chosen
nodes belong to the same cluster independent of SI-infection status. This approximation
throws out the dynamical details of I(t), but can provide useful insights, as shown below on
the non-spreading to spreading transition, provided that several coalescence-fragmentation
processes occur over the timescale of the entire outbreak.
In order to develop a more detailed analytic analysis, we start with the identification
8
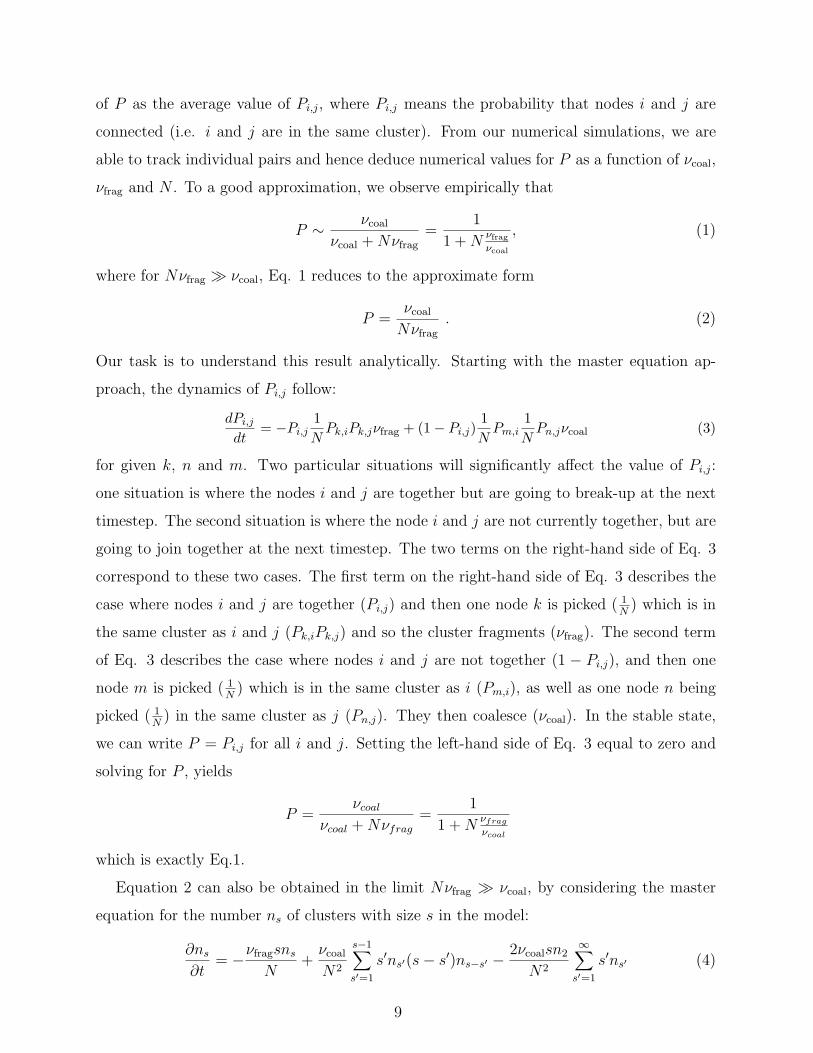
of P as the average value of Pi,j, where Pi,j means the probability that nodes i and j are
connected (i.e. i and j are in the same cluster). From our numerical simulations, we are
able to track individual pairs and hence deduce numerical values for P as a function of !coal,
!frag and N . To a good approximation, we observe empirically that
P ( !coal
!coal + N!frag=
1
1 + N $frag
$coal
, (1)
where for N!frag $ !coal, Eq. 1 reduces to the approximate form
P =!coal
N!frag. (2)
Our task is to understand this result analytically. Starting with the master equation ap-
proach, the dynamics of Pi,j follow:
dPi,j
dt= 'Pi,j
1N
Pk,iPk,j!frag + (1' Pi,j)1N
Pm,i1N
Pn,j!coal (3)
for given k, n and m. Two particular situations will significantly a"ect the value of Pi,j:
one situation is where the nodes i and j are together but are going to break-up at the next
timestep. The second situation is where the node i and j are not currently together, but are
going to join together at the next timestep. The two terms on the right-hand side of Eq. 3
correspond to these two cases. The first term on the right-hand side of Eq. 3 describes the
case where nodes i and j are together (Pi,j) and then one node k is picked ( 1N ) which is in
the same cluster as i and j (Pk,iPk,j) and so the cluster fragments (!frag). The second term
of Eq. 3 describes the case where nodes i and j are not together (1 ' Pi,j), and then one
node m is picked ( 1N ) which is in the same cluster as i (Pm,i), as well as one node n being
picked ( 1N ) in the same cluster as j (Pn,j). They then coalesce (!coal). In the stable state,
we can write P = Pi,j for all i and j. Setting the left-hand side of Eq. 3 equal to zero and
solving for P , yields
P =!coal
!coal + N!frag=
1
1 + N $frag
$coal
which is exactly Eq.1.
Equation 2 can also be obtained in the limit N!frag $ !coal, by considering the master
equation for the number ns of clusters with size s in the model:
&ns
&t= '!fragsns
N+
!coal
N2
s!1!
s!=1
s"ns!(s' s")ns!s! ' 2!coalsn2
N2
#!
s!=1
s"ns! (4)
9
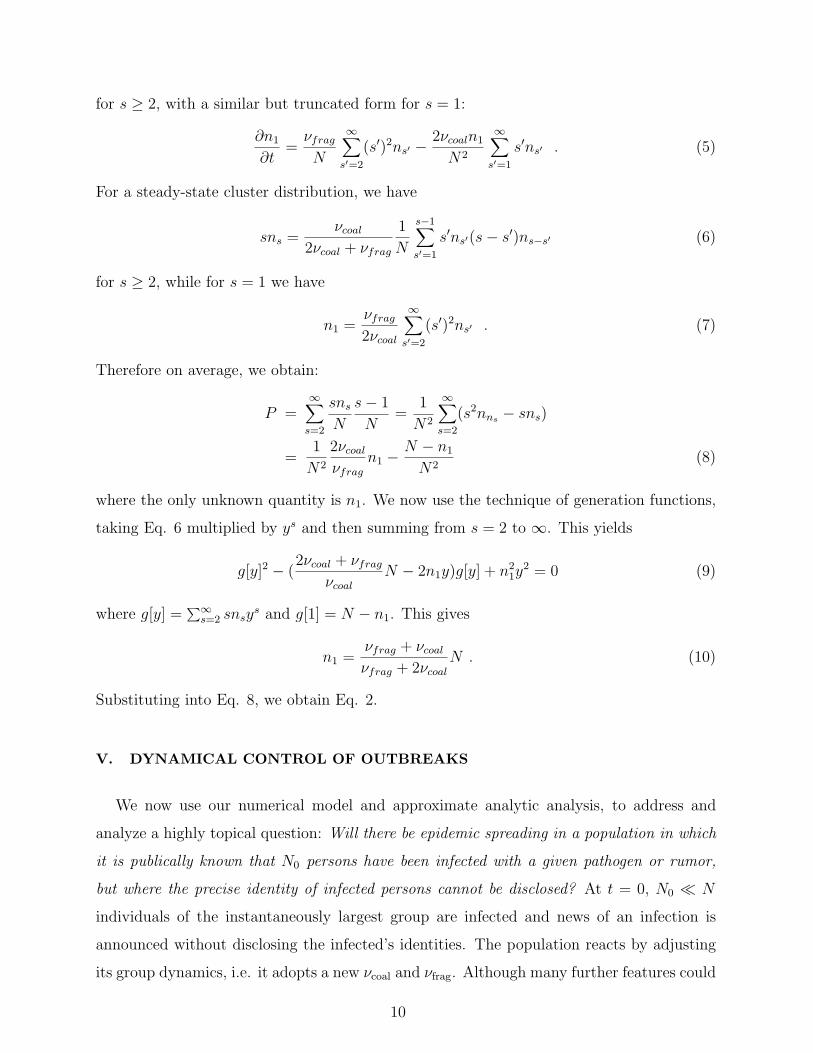
for s ) 2, with a similar but truncated form for s = 1:
&n1
&t=
!frag
N
#!
s!=2
(s")2ns! ' 2!coaln1
N2
#!
s!=1
s"ns! . (5)
For a steady-state cluster distribution, we have
sns =!coal
2!coal + !frag
1
N
s!1!
s!=1
s"ns!(s' s")ns!s! (6)
for s ) 2, while for s = 1 we have
n1 =!frag
2!coal
#!
s!=2
(s")2ns! . (7)
Therefore on average, we obtain:
P =#!
s=2
sns
N
s' 1
N=
1
N2
#!
s=2
(s2nns ' sns)
=1
N2
2!coal
!fragn1 '
N ' n1
N2(8)
where the only unknown quantity is n1. We now use the technique of generation functions,
taking Eq. 6 multiplied by ys and then summing from s = 2 to &. This yields
g[y]2 ' (2!coal + !frag
!coalN ' 2n1y)g[y] + n2
1y2 = 0 (9)
where g[y] ="#
s=2 snsys and g[1] = N ' n1. This gives
n1 =!frag + !coal
!frag + 2!coalN . (10)
Substituting into Eq. 8, we obtain Eq. 2.
V. DYNAMICAL CONTROL OF OUTBREAKS
We now use our numerical model and approximate analytic analysis, to address and
analyze a highly topical question: Will there be epidemic spreading in a population in which
it is publically known that N0 persons have been infected with a given pathogen or rumor,
but where the precise identity of infected persons cannot be disclosed? At t = 0, N0 * N
individuals of the instantaneously largest group are infected and news of an infection is
announced without disclosing the infected’s identities. The population reacts by adjusting
its group dynamics, i.e. it adopts a new !coal and !frag. Although many further features could
10
be added to mimic the population’s subsequent adjustment to knowledge of an outbreak, we
focus here on a simple case in order to better understand the e"ect of the initial reaction.
Numerical results are presented in Fig. 4, together with analytic curves for the transition
threshold, as a function of the new !coal and !frag. Our analytic analysis exploits the gener-
alized SIR equations developed above, and builds upon the theoretical framework discussed
in detail in Ref. [12]. The number of susceptibles in the long-time limit S(&) with N $ 1
is then given by the solution z to the following generalized form, z = exp[''(1' z)] where
z + S(&)/N and ' + p!coal/q!frag. For ' # 1, the only solution is z = 1, corresponding to
a vanishingly small fraction of infected individuals (i.e. total number of infected R(&) does
not exceed N0 * N). This solution bifurcates at ' = 1 into the following stable solution
z = '(1/') ·W ('' · e!%) valid for ' > 1, where W (z) is the Lambert function. For ' > 1.5,
z is very well-approximated by z , e!%/'. This shows a rather abrupt transition from non-
spreading epidemics for ' < 1 to global infection of a finite fraction of the population for
' > 1. The form of the epidemic control parameter ' + p!coal/q!frag exemplifies that infec-
tivity and coalescence play together against recovery and fragmentation in controlling the
propagation of the epidemics: Infectivity and coalescence promote the infection propagation,
while recovery and fragmentation hinders its spread.
Not only is our theory for the spreading threshold (dashed black line in Fig. 4) in good
agreement with the numerical results (white solid line), its simple analytic form suggests an
epidemic control scheme based on manipulation of the group coalescence and fragmentation
timescales (i.e. !!1coal and !!1
frag). An imminent epidemic can be suppressed (i.e. R(&) < N0)
by increasing the timescale for group coalescence with respect to the timescale for group
fragmentation (i.e. decrease !coal with respect to !frag), but it will get amplified if we decrease
the coalescence timescale with respect to the fragmentation timescale (i.e. increase !coal
with respect to !frag). Not only would such modest intervention allow the overall system to
continue functioning, it does not require knowledge of the infected’s identities. There is also
no assumption that the N0 members of the group which carries the initial infected case at
t = 0, remain in that group. In the school setting, schedules could be adjusted to slow down
or speed up classroom use and recess, without the need for disruptive school closures[3] or
the need to test, label or isolate infected children. Similar control can be achieved in the
online chatrooms frequented by financial traders, by basing the joining and leaving rules
on present occupancy. In viral marketing, the attractiveness of the message or product
11
quantified by the infectivity p can be completely subjugated by suitable management of
the group dynamics (!coal versus !frag), as firms using e-commerce and e-advertisement are
now realizing. These findings are potentially applicable to many other scenarios, given that
many real-world activity/infection curves resemble those in Figure 2.
VI. SUMMARY AND OUTLOOK
We have presented and analyzed a simple model of contagion within a population featur-
ing dynamically evolving connectivity, allowing group-level dynamics and the individual-level
transmission process to co-exist on similar timescales. In spite of the simplicity of our model,
we find that the profiles produced bear a striking resemblance to a wide variety of real-world
examples from social, financial and biological domains. The common features of multiple
resurgent peaks and abnormal decay times are observed both theoretically and empirically.
Although it is of course possible that such empirically observed profiles can be generated
by other more sophisticated models – e.g. more detailed social dynamic mechanisms, the
introduction of spatial heterogeneity, or the generalization of the SIR transmission process
(e.g. SIS, or public broadcasts of information) – we find it intriguing that our simple analysis
su#ces. We hope that these findings stimulate future work on the potential e"ects of
di"erent social group dynamics (see, for example, Palla et al. [17]) and on detailed analytic
descriptions of the resulting infection profiles.
[1] F.E. Harmon, Emergency Order by U.S. Securities and Exchange Commission: False rumors
can lead to a loss of confidence in our markets, Release Number 58166, July 15, 2008.
[2] D.G. McNeil, Containing flu is not feasible, specialists say, New York Times, Front Page,
Thursday, April 30, 2009.
[3] Report by The American Academy of Pediatrics (AAP), Pandemic Influenza: Warning, Chil-
dren At-Risk (2007).
[4] S. Lyall, Susan Boyle, Unlikely Singer Is YouTube Sensation, New York Times, Front Page,
Friday, April 17, 2009
[5] D. Sornette, F. Deschatres, T. Gilbert, and Y. Ageon, Phys. Rev. Lett. 93, 22 (2004).
12
[6] R. Crane, and D. Sornette, Proc. Nat. Acad. Sci. 105, 15649 (2008).
[7] M.J. Keeling, and P. Rohani. Modeling Infectious Diseases in Humans and Animals (Princeton
University Press, 2007).
[8] R.M. May, and A.L. Lloyd, Phys. Rev. E 64, 066112 (2001).
[9] F. Ball, D. Mollison, and G. Scalia-Tomba, Ann. Appl. Probab. 7 46 (1997).
[10] J. Shao, S. Havlin, and H.E. Stanley, Phys. Rev. Lett. 103, 018701 (2009).
[11] J.S. Koopman, in Biological Networks ed. F. Kepes (World Scientific, London, 2007).
[12] J.D. Murray, Mathematical Biology: I. An Introduction 3rd Edition (Springer, New York,
2007) Ch. 10.
[13] V. Colizza, and A. Vespignani, Phys. Rev. Lett. 99, 148701 (2007).
[14] D.J. Watts, R. Muhamad, D.C. Medina, and P.S. Dodds, Proc. Nat. Acad. Sci. 102, 11157
(2005); P.S. Dodds and D.J. Watts, Phys. Rev. Lett. 92, 218701 (2004).
[15] T. Gross, C. Dommar, and B. Blasius, Phys. Rev. Lett. 96, 20 (2006).
[16] L.B. Shaw, and I.B. Schwartz, Phys. Rev. E, 77, 066101 (2008).
[17] G. Palla, A.L. Barabasi, and T. Vicsek, Nature 446, 664 (2007).
[18] M. Smoluchowski, Physik. Zeitschr., 17, 557 (1916); J.A.D. Wattis, Physica D 222, 1 (2006).
[19] X. Gabaix, P. Gopakrishnan, V. Plerou and H.E. Stanley, Quart. Jour. Econ., 121, 461 (2006).
[20] V.M. Eguiluz, and M.G. Zimmermann, Phys. Rev. Lett. 85, 5659 (2000).
[21] N.F. Johnson, P. Je!eries, and P.M. Hui. Financial Market Complexity, (Oxford University
Press, 2003).
[22] N.F. Johnson. Complexity in Human Conflict, in Managing Complexity: Insights, Concepts,
Applications edited by Dirk Helbing (Springer, Berlin, 2008) p. 303.
13
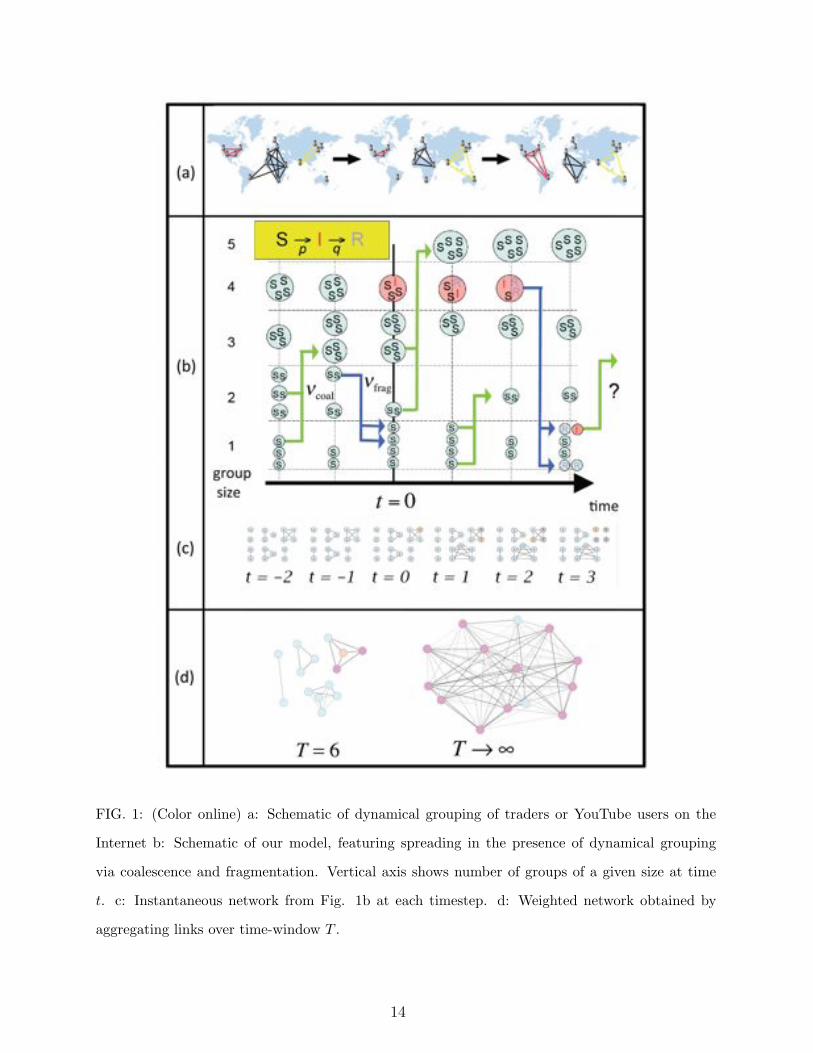
FIG. 1: (Color online) a: Schematic of dynamical grouping of traders or YouTube users on the
Internet b: Schematic of our model, featuring spreading in the presence of dynamical grouping
via coalescence and fragmentation. Vertical axis shows number of groups of a given size at time
t. c: Instantaneous network from Fig. 1b at each timestep. d: Weighted network obtained by
aggregating links over time-window T .
14
!"#$ % &''($'&!$)*+!&!",*-$!./(0***!!"
!"#$%&'()*+$,#!"-$+!'.(,*!'$)!%/0
!"#$ % &''($'&!$)*+!&!",*-$!./(0***!!1
!!!!!!!!!"#$%&'(!)("*%+*,!!!!!!!
!!!!&-*!
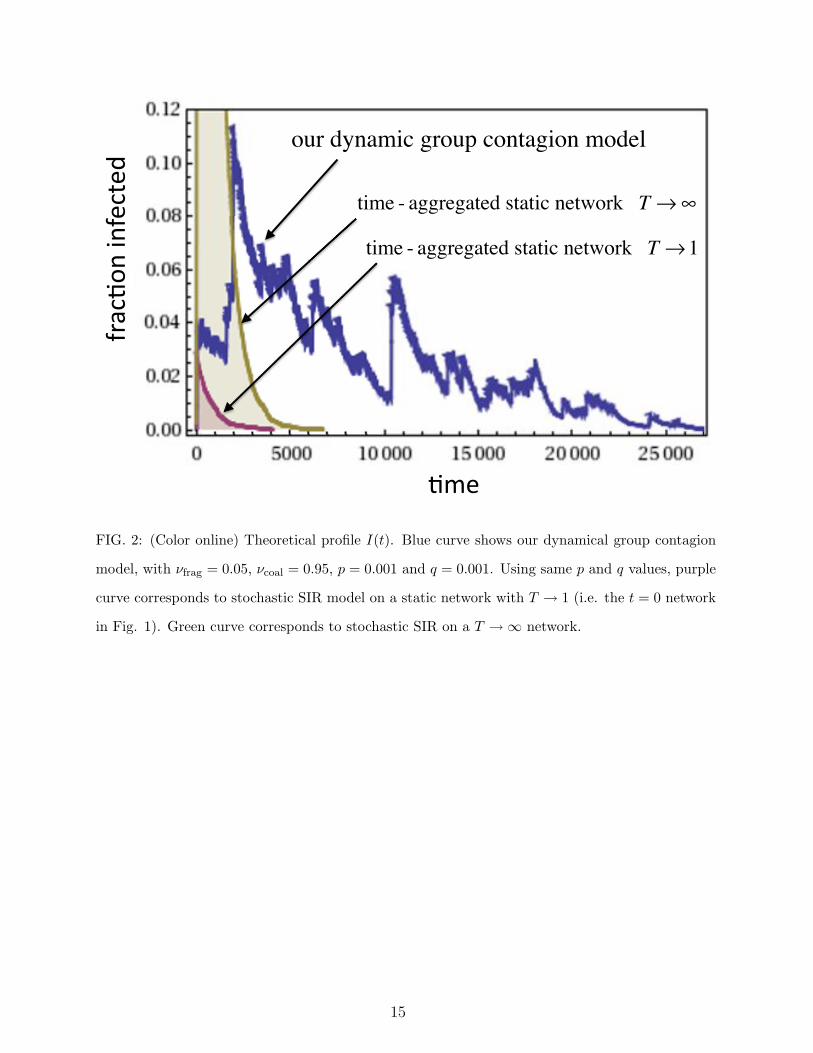
FIG. 2: (Color online) Theoretical profile I(t). Blue curve shows our dynamical group contagion
model, with !frag = 0.05, !coal = 0.95, p = 0.001 and q = 0.001. Using same p and q values, purple
curve corresponds to stochastic SIR model on a static network with T ! 1 (i.e. the t = 0 network
in Fig. 1). Green curve corresponds to stochastic SIR on a T !& network.
15
weeks
weeks
minutes
minutes
Social Epidemics
CNG School Jan-June ‘041st Grade (22 students)
Marymount School Jan-June ‘06 1st Grade (28 students)
Financial Epidemics Biological EpidemicsYouTube - “Gettin’ Enough”
YouTube - “Borat”
Repeated self-ampli!cation and suppression generatesmultiple peaks and slow overall decay
!!
! !!
!
"
+!!
! !!
! "
# $
" "
" " "
" "
%
"
""
"
&
"
&
" "
" & "
& "
'()*+,-.)./0-
months#111112111111$1111112111111%1111112111111311111121111114111111211111151111112111116111111
Total Views = 257,759
Total Views = 254,918
70)8,97,-7,10'1)1:;(,1!178;9.,(1</.=1)170-.)+/-).,>178;9.,(
():/>1)+:8/'/7)./0-10'1"?.@
():/>1>,7(,)9,1/-1"?.@1>;,1.018)7A10'1(,)>/8B1)C)/8)D8,1!
3
"
&
&&
&
&&
#111112111111$1111112111111%1111112111111311111121111114111111211111151111112111116111111
211#11211$111211%1112113112114112115111211611211E111211F11211#G12G111111111111111111111111111#G1111111111111111111111111111$G1111111111111111111111111111%G111111
G111111111111111111111111111#G1111111111111111111111111111$G1111111111111111111111111111%G111111211#11211$111211%1112113112114112115111211611211E111211F11211#G121##112
Em
piric
al R
esul
ts
Mod
el
May 2005
July 2005
;9>1);>1,;( 7)>17='1*D:
months
Valuation of JPY against:
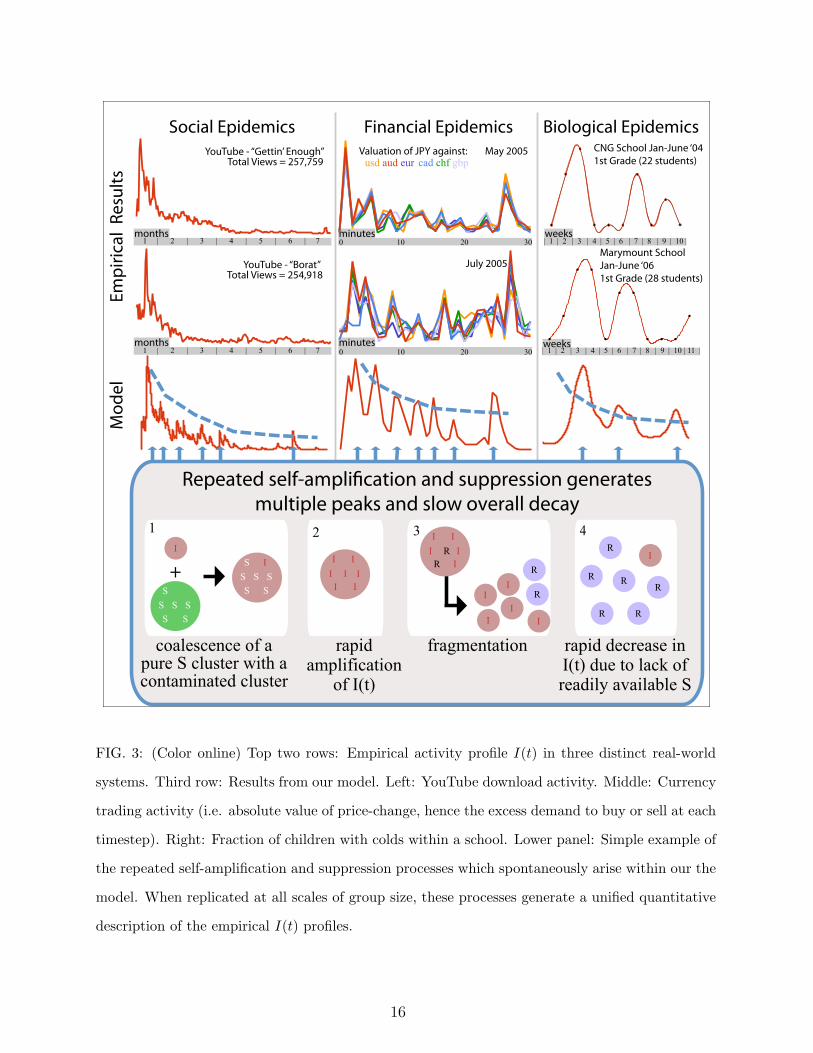
FIG. 3: (Color online) Top two rows: Empirical activity profile I(t) in three distinct real-world
systems. Third row: Results from our model. Left: YouTube download activity. Middle: Currency
trading activity (i.e. absolute value of price-change, hence the excess demand to buy or sell at each
timestep). Right: Fraction of children with colds within a school. Lower panel: Simple example of
the repeated self-amplification and suppression processes which spontaneously arise within our the
model. When replicated at all scales of group size, these processes generate a unified quantitative
description of the empirical I(t) profiles.
16
!!"#$
!!"#$
! ! !"!!#
" ! !"!!$
! ! !"!!#
" ! !"!!#
! ! !"!!#
" ! !"!!$
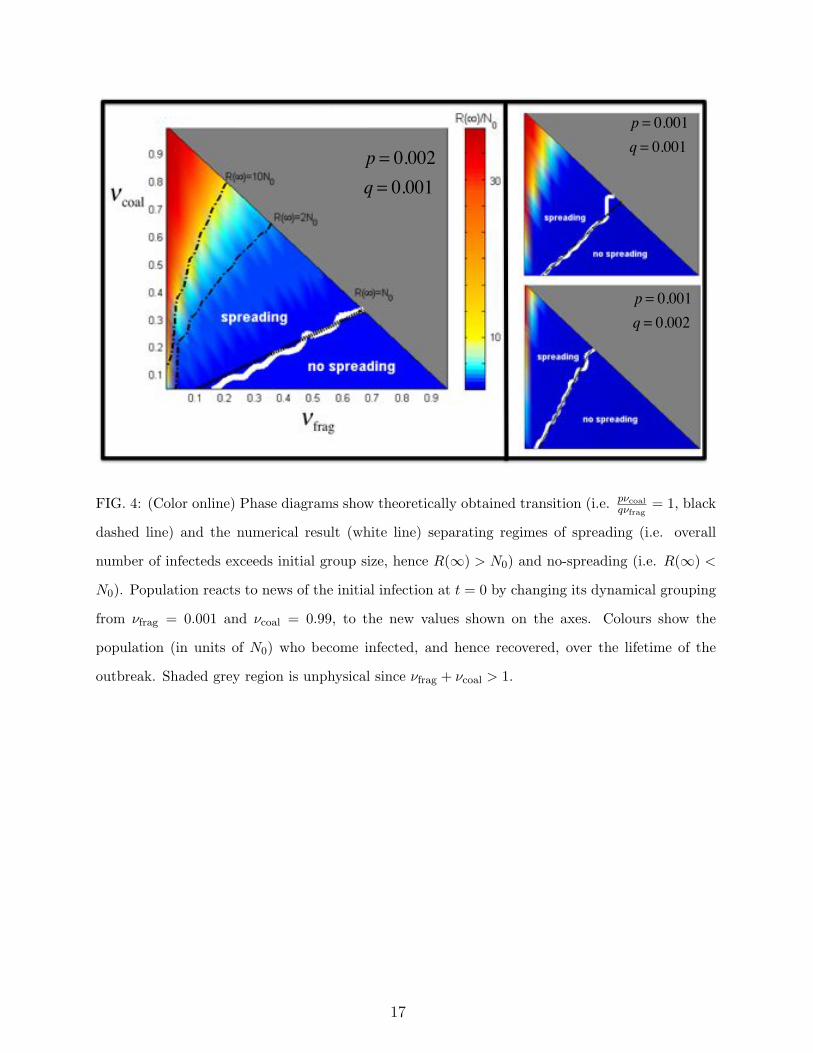
FIG. 4: (Color online) Phase diagrams show theoretically obtained transition (i.e. p$coalq$frag
= 1, black
dashed line) and the numerical result (white line) separating regimes of spreading (i.e. overall
number of infecteds exceeds initial group size, hence R(&) > N0) and no-spreading (i.e. R(&) <
N0). Population reacts to news of the initial infection at t = 0 by changing its dynamical grouping
from !frag = 0.001 and !coal = 0.99, to the new values shown on the axes. Colours show the
population (in units of N0) who become infected, and hence recovered, over the lifetime of the
outbreak. Shaded grey region is unphysical since !frag + !coal > 1.
17


