Embed Size (px)
Citation preview

Customer Needs Simulation System for Investigating Must-Be Attribute 64
Journal of Mechanical Engineering, Vol. ME 44, No. 1, June 2014 Transaction of the Mechanical Engineering Division, The Institution of Engineers, Bangladesh
CUSTOMER NEEDS SIMULATION SYSTEM FOR INVESTIGATING MUST-BE ATTRIBUTE
Md Mamunur Rashid*
Bangladesh Institute of Management, 4 Sobhanbag, Mirpur Road, Dhaka-1207, Bangladesh *Corresponding e-mail: [email protected]
Abstract: All the key features, functions, characteristics, and spirit of a design are needed for a full concept for a
product. Moreover, every product serves a certain purpose; if a product can’t serve its purpose, then it’s useless.
This is the basis of design, though it can hardly be evaluated and coped with properly. This type attribute is called
must-be attribute. Thus, Many trouble occur if Must design is ignored; consequently design cannot provide a
design warranty. Thus, computational tools are needed to assist a product development team to determine
beforehand the critical number of respondents to make a right decision. In this regard, absolutely this paper
presents a Kano model based customer needs simulation system for investigating must-be attribute.
Keywords: Product Development, Kano Model, Monte Carlo Simulation, Imprecise Probability, Fuzzy Logic.
INTRODUCTION
Product development is a complex engineering task
wherein a great deal of intellectual and physical
resources, methods, tools, and processes are involved
to tackle the technical and business issues in an
integrated manner so that the targeted group of
customers can be satisfied1,4,13
. Figure 1 shows a
simplified view of product development cycle that
consists of Strategic Goal, Customer Needs
Assessment, Product Conceptualization, Product
Realization, and Satisfaction.
Strategic Goal
Customer Needs
Assessment
Conceptualization
Product Realization
Satisfaction
Customer Needs
Assessment SystemProduct Development TeamProduct Development Cycle
Real Customers
Questionnaires
Goal of this
study
Figure 1. The context of this study.
As seen from Fig. 1, all technical issues of Product
Conceptualization and Product Realization are handled
after assessing the customer needs. Therefore, the
success of a product development process (i.e., desired
customer satisfaction) is sensitive to the customer needs
assessment process. In most cases, customer needs of a
product (or a product family) are incorporated by
setting the customer requirements and their relative
importance in the first house of quality of QFD7,8,12.
This process is somewhat ad hoc and does not provide a
clear link between customer satisfaction and product
attribute7,12
. In this regard, Kano Model9
is a better
choice. A great deal of research has been carried out to
get benefitted from Kano Model while setting the
customer needs with respect to customer satis-
faction2,3,5,10,11,22
. Yadav and Singh27
have drawn an
attention for creating convergent environments from
dynamic nature of market and globalization for product
development process. Non-conformities (NC) must be
removed for product development21
for creating
convergent dynamic market. Roy et al.20
was applied
one dimensional questionnaire for user centric design
by using Kansei Engineering is shown in Fig.2. In this
perspective, Kano model and two dimensional
questionnaire regarding Kano model can help to
remove Non-conformities (NC) of the product and
control the dynamic nature of market, i.e. people,
customers, users than one dimensional questionnaire of
Kansei is also shown in Fig 2.
As seen from Fig.2, one dimensional questionnaire is
shown both satisfaction and dissatisfaction on the same
questionnaires, which cannot reduce Non-conformities
(NC), because depth of understanding with customer is
little present, where two dimensional questionnaire,
satisfaction is shown in functional question, other side
dissatisfaction is shown in dysfunctional question,
which can create conformities in the market, due to
depth understanding with customer. Therefore, both
functional and dysfunctional questionnaires (two
dimensional) are applied to identify product attribute,
namely, Attractive, Must-be, One-dimensional,
Indifferent, and Reverse. i.e. Kano evaluation for
compliance customer needs with product development.
An attribute is considered a Must-be attribute, if its
absence produces absolute dissatisfaction and its
presence does not increase the satisfaction. For this
purpose, Must-be attribute is needed to study. Yet,
researchers could not study regarding must-be attribute.
Although they are active in this field13-19
. For this
purpose, the system development is studied in the
following section. Then next describes a case study
about the must-be attribute. Last section concludes.

Customer Needs Simulation System for Investigating Must-Be Attribute 65
Journal of Mechanical Engineering, Vol. ME 44, No. 1, June 2014 Transaction of the Mechanical Engineering Division, The Institution of Engineers, Bangladesh
One-dimensional Questionnaire:
The bicycle has circle-shaped wheels. Are your satisfied? Satisfied Somewhat Satisfied Less Satisfied Not Satisfied Not Sure
Two-dimensional Questionnaire:
Functional Question: Dysfunctional Question:
The bicycle does not have circle-shaped wheels ? Like Must-be Neutral Live-with Dislike
The bicycle has circle-shaped wheels ? Like Must-be Neutral Live-with Dislike
Figure 2. Examples of typical questionnaires.
Start
End
Input:
N (number of iterations)
FE = (xi | i = 1,…,5), PFE = (Pr(xi) | i = 1,…,5)
DE = (yj | j = 1,…,5), PDE = (Pr(yj) | j = 1,…,5)
Simulate:
Functional Answers using Eq. (1)
Simulate:
Dysfunctional Answers using Eq. (1)
Output/Input:
SFE = (SF1,…,SFN)
Output/Input:
SDE = (SD1,…,SDN)
Calculate:
Probabilities of the states of
the simulated functional
answers using Eq. (2). Error
using Eq. (3).
Calculate:
Probabilities of the states of
the simulated dysfunctional
answers using Eq. (2). Error
using Eq. (3).
Output:
PFE = (Pr(xi) | i = 1,…,5)
Error
Output:
PDE = (Pr(yj) | j = 1,…,5)
Error
Calculate:
Identify Kano evaluation for each pair of
simulated functional and dysfunctional
answers using Table A.2, (SFp,SDp) SKp
Output:
PFE = (Pr(zk) | k = 1,…,6)
Output/Input:
SKE = (SK1,…,SKN)
Calculate:
Probabilities of Kano
Evaluation using Eq. (2).
End End
Figure 3. Outline of the proposed system.

Customer Needs Simulation System for Investigating Must-Be Attribute 66
Journal of Mechanical Engineering, Vol. ME 44, No. 1, June 2014 Transaction of the Mechanical Engineering Division, The Institution of Engineers, Bangladesh
SYSTEMS DEVELOPMENT
This section describes the system development for
simulating functional/dysfunctional answers in
accordance with Kano Model. The simulation
procedure described in the previous section is used to
develop the system. First the layout of the system is
described as follows:
Consider that FE=(Like, Must-be, Neutral,
Live-with, Dislike) is a vector that contains all possible
states of functional answers. For convenience, xi will be
used to denote i-th element of FE, i=1,…,5.
PFE=(Pr(xi)|i=1,…,5) is the probability vector of the
states of functional answers defined by FE. The
corresponding cumulative probability vector is denoted
by CPFE= (CPr(xi)|i=1,…,5). In addition, consider that
DE= (Like, Must-be, Neutral, Live-with, Dislike) is a
vector that contains all possible states of dysfunctional
answers. For convenience, yj will be used to denote j-th
element of DE, j = 1,…, 5. PDE= (Pr(yj)|j=1,…,5) is the
probability vector of the states of dysfunctional answers
defined by DE. The corresponding cumulative
probability vector is denoted by
CPDE=(CPr(yj)|j=1,…,5). Moreover, consider that
KE=(Attractive, One-dimensional, Must-be,
Indifferent, Reverse, Questionable) is a vector that
contains all possible states of Kano evaluations. For
convenience, zk will be used to denote k-th element of
KE, k=1,…,6. PKE=(Pr(zk)|k=1,…,6) is the probability
vector of the states of Kano evaluation defined by KE.
A combination of functional and dysfunctional answers
(xi,yj) corresponds to a definite Kano evaluation zk, i.e.,
(xi,yj)zk, in accordance with the Kano model. See
Table A.2 for all possible mapping (xi,yj)zk.
However, to simulate functional answer xi and
dysfunctional answer yj, independently, and, thereby,
the Kano Evaluation zk, a simulation process is
proposed as illustrated in Fig. 3. The proposed process
composed of five steps (Step 0,…,Step 4). The steps are
explained as follows:
Step 0: This step is to input number of iterations (N),
event and probability vectors of functional and
dysfunctional answer (FE=(xi|i=1,…,5),
PFE=(Pr(xi)|i=1,…,5), DE=(yj|j=1,…,5), and
PDE=(Pr(yj)|j=1,…,5)).
Step 1: This step is to simulate and display the
functional and dysfunctional answers independently
using the process .The results are two vectors of
simulated functional and dysfunctional answers
SFE=(SF1,…,SFN) and SDE=(SD1,…,SDN),
respectively. As such, SFp=xi and SDp=yj, p=1,…,N,
i,j {1,…,5}.
Step 2: This step is to calculate and display the
probability vectors of simulated functional and
dysfunctional answers (PFE=(Pr(xi)|i=1,…,5) and
PDE=(Pr(yj)|j=1,…,5)) and corresponding Error using
the processes .
Step 3: This step is to use SFE=(SF1,…,SFN) and
SDE=(SD1,…,SDN) and identify the Kano Evaluation
for each pair of simulated functional and dysfunctional
answers using the definition (xi,yj)zk shown in Table
A.2. This step thus produces a vector of simulated Kano
Evaluations SKE=(SK1,…,SKN) so that
(SFp,SDp)SKp=zk, p=1,…,N, k{1,…,6}.
Step 4: This step is to determine the probability vector
of the simulated Kano Evaluations
PFE=(Pr(zk)|k=1,…,6) using the process .
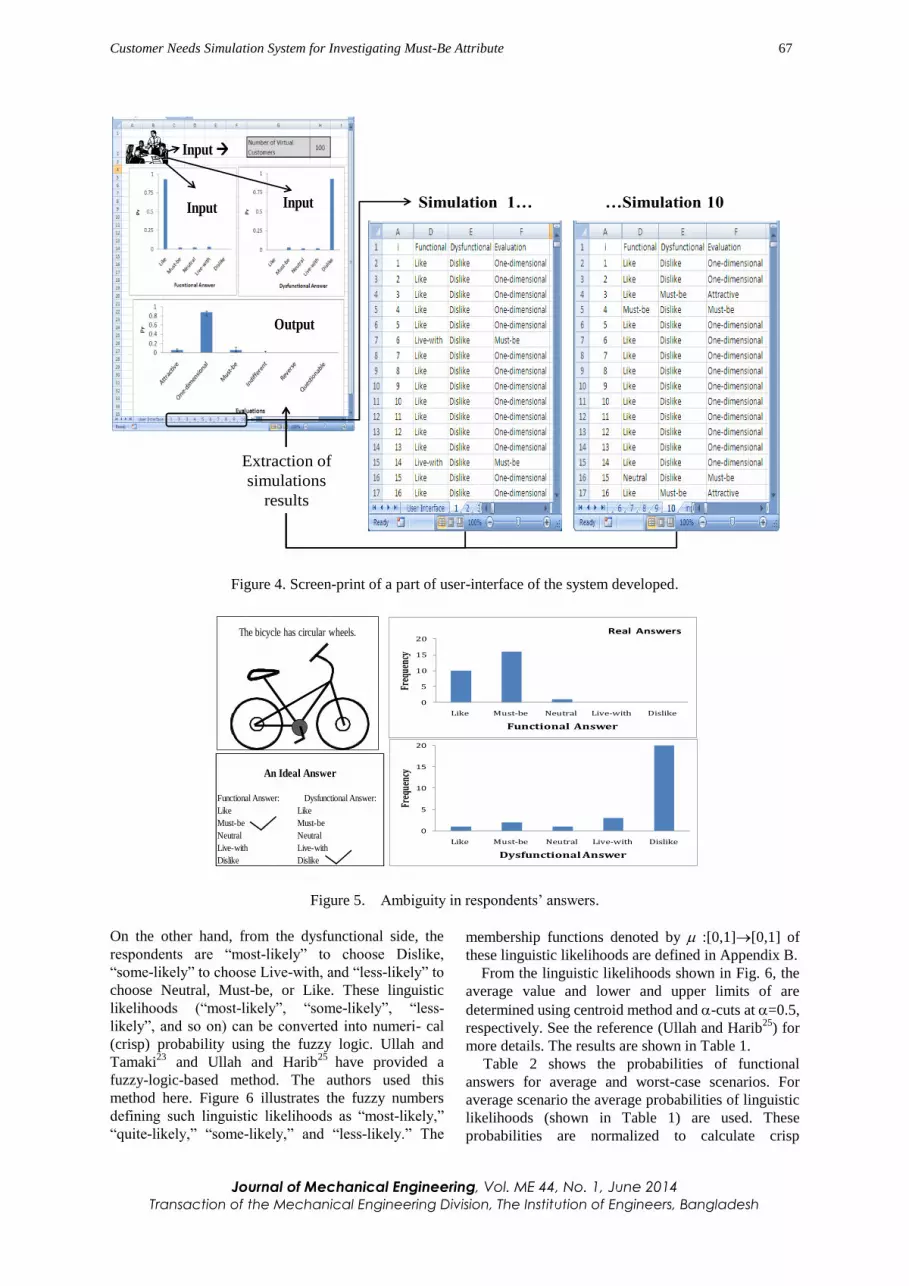
Based on the outline of the system, shown in Fig. 3 and
described by Step 0,…,Step 4, a system is developed
that runs on Microsoft Excel
environment. Figure 6
shows the screen-short of a part of the user-interface of
the developed system, wherein three input items
(Number of Virtual Customers (i.e., number of
iterations N), probabilities of the states of functional
answers, and probabilities of the states of dysfunctional
answers) are shown. In addition, one of the outputs
(Kano Evaluations) is also shown in Fig. 4. The errors
are not shown. The variation in the Kano Evaluation for
ten different independent simulations (each simulation
consists of 100 iterations, as shown in Fig. 4 is also
displayed in the bar chart of Kano Evolution in Fig. 4.
A CASE STUDY
Consider the case shown in Fig. 5. As seen from Fig.
5, there is a questionnaire regarding a product (bicycle)
attribute (circle-shaped wheel). It is well-known that
circular wheel of a bicycle is a “Must-be” (in Japanese
“Atarimae”) attribute. Therefore, the ideal answer of a
respondent would be “must-be” from functional side
(i.e., the bicycle should have circular wheel) and
“dislike” from dysfunctional side (i.e., other shapes of
wheel it is not at all desirable). This combination of
answer (must-be, dislike) yields a “Must-be” attribute
according to Kano Evaluation (see Table A. 2).
In reality, respondents exhibit a rather fuzzy
behavior and sometimes answer different than the ideal
one. For example, see the frequency of the answers of
27 respondents shown in Fig. 5 obtained during this
study. Some respondents answer makes the attribute
Must-be, some others answers make it “Attractive,” and
so on. This raises a fundamental question that is how
many respondents should be asked to know for sure that
the given attribute is a Must-be attribute.
This question can be answered using the system
shown in the previous section. To use the system shown
in the previous section, the first step is to input the
probability vectors of functional answers and
dysfunctional answers. To determine the probability
vectors of functional/dysfunctional answers the
following procedure can be used.
As it is seen from the case shown in Fig. 5, from the
functional side, the respondents are “most-likely” to
choose Must-be, “some-likely” to choose “Like” and
“less-likely” to choose Neutral, Live-with, or Dislike.
Customer Needs Simulation System for Investigating Must-Be Attribute 67
Journal of Mechanical Engineering, Vol. ME 44, No. 1, June 2014 Transaction of the Mechanical Engineering Division, The Institution of Engineers, Bangladesh
Input
Input Input
Output
Simulation 1… …Simulation 10
Extraction of
simulations
results
Figure 4. Screen-print of a part of user-interface of the system developed.
0
5
10
15
20
Like Must-be Neutral Live-with Dislike
Freq
uen
cy
Functional Answers
0
5
10
15
20
Like Must-be Neutral Live-with Dislike
Freq
uen
cy
Dysfunctional Answer
Real Answers
The bicycle has circular wheels.
An Ideal Answer
Functional Answer:
Like
Must-be
Neutral
Live-with
Dislike
Dysfunctional Answer:
Like
Must-be
Neutral
Live-with
Dislike
Like Like
Must-be Must-be
Neutral Neutral
Live-with Live-with
Dislike Dislike
Functional Answer: Dysfunctional Answer:
An Ideal Answer
0
5
10
15
20
Like Must-be Neutral Live-with Dislike
Freq
uenc
y
Functional Answer
Real Answers
0
5
10
15
20
Like Must-be Neutral Live-with Dislike
Freq
uenc
y
Dysfunctional Answer
Figure 5. Ambiguity in respondents’ answers.
On the other hand, from the dysfunctional side, the
respondents are “most-likely” to choose Dislike,
“some-likely” to choose Live-with, and “less-likely” to
choose Neutral, Must-be, or Like. These linguistic
likelihoods (“most-likely”, “some-likely”, “less-
likely”, and so on) can be converted into numeri- cal
(crisp) probability using the fuzzy logic. Ullah and
Tamaki23
and Ullah and Harib25
have provided a
fuzzy-logic-based method. The authors used this
method here. Figure 6 illustrates the fuzzy numbers
defining such linguistic likelihoods as “most-likely,”
“quite-likely,” “some-likely,” and “less-likely.” The
membership functions denoted by :[0,1][0,1] of
these linguistic likelihoods are defined in Appendix B.
From the linguistic likelihoods shown in Fig. 6, the
average value and lower and upper limits of are
determined using centroid method and -cuts at =0.5,
respectively. See the reference (Ullah and Harib25
) for
more details. The results are shown in Table 1.
Table 2 shows the probabilities of functional
answers for average and worst-case scenarios. For
average scenario the average probabilities of linguistic
likelihoods (shown in Table 1) are used. These
probabilities are normalized to calculate crisp

Customer Needs Simulation System for Investigating Must-Be Attribute 68
Journal of Mechanical Engineering, Vol. ME 44, No. 1, June 2014 Transaction of the Mechanical Engineering Division, The Institution of Engineers, Bangladesh
probabilities shown in 4-th column in Table 2. For
worst-case scenario, the lower limit of most-likely is
used and upper limits of some-likely and less-likely are
used. These limits are normalized to calculate the crisp
probabilities for worst-case scenarios, as shown in last
column in Table 2.
0
0.25
0.5
0.75
1
1.25
0 0.1 0.2 0.3 0.4 0.5 0.6 0.7 0.8 0.9 1
Pr
less-likely some-likely quite-likely most-likely
Figure 6. Defining linguistic likelihoods by fuzzy
numbers (adapted from Ullah & Tamaki23
).
Table 1. Numerical probability of
linguistic likelihoods.
Linguistic
likelihoods
Pr
Lower
limit
Upper
limit Average
most-likely 0.85 1 0.9
quite-likely 0.5 0.85 2/3
some-likely 0.15 0.5 1/3
less-likely 0 0.15 0.1
Table 2. Probabilities of functional answers for
average and worst-case scenarios.
average scenario worst-case scenario
Functional
Answers
Linguisti
c
likelihoo
ds
aver
age
Pr
Crisp Pr
upper/l
ower
limits
of Pr
Crisp Pr
Like some-likely 1/3 0.2173913
04 0.5 0.277777778
Must-be most-likely 0.9 0.5869565
22 0.85 0.472222222
Neutral less-likely 0.1 0.0652173
91 0.15 0.083333333
Live-with less-likely 0.1 0.0652173
91 0.15 0.083333333
Dislike less-likely 0.1 0.0652173
91 0.15 0.083333333
Similarly the probabilities of dysfunctional answers
for average and worst-case scenarios are determined
and listed in Table 3. The results shown in Tables 2-3
provide two sets of probabilities for simulating
functional/dysfunctional answers. These probabilities
are illustrated in Fig.7. Using these probabilities a study
has been carried out to determine the minimum number
of respondents to conclude that whether or not an
attribute is Must-be attribute or else. Figure 8 shows the
results for average scenario. As seen from Fig. 8, for 20
respondents there is overlaps among the probabilities
of Must-be, Attractive, and Indifferent. This means that
using the results of 20 respondents it is not possible to
conclude that the attribute is a Must-be attribute. For
the case of 50 respondents, still there is an overlap
between the probabilities of Must-be and Indifferent.
On the other hand, when 100 respondents are used, the
overlap disappears and the trend remains more or less
the same even if more respondents are used (e.g.,
compare the results of 100 respondents and 200
respondents shown in Fig. 9).
Table 3. Probabilities of dysfunctional answers
for average and worst-case scenarios.
average scenario worst-case scenario
Dysfunction
al
Answers
Linguistic
likelihoods
aver
age
Pr
Crisp
Pr
upper/
lower
limits
of Pr
Crisp Pr
Like less-likely 0.1 0.0652
17391 0.15 0.083333333
Must-be less-likely 0.1 0.0652
17391 0.15 0.083333333
Neutral less-likely 0.1 0.0652
17391 0.15 0.083333333
Live-with some-likely 1/3 0.2173
91304 0.5 0.277777778
Dislike most-likely 0.9 0.5869
56522 0.85 0.472222222
0
0.5
1
Pr
(.)
Functional Answers
Average scenario
0
0.5
1
Pr
(.)
Functional Answers
Worst-case scenario
0
0.5
1
Pr
(.)
Dysfunctional Answers
Average scenario
0
0.5
1
Pr
(.)
Dysfunctional Answers
Worst-case scenario
Figure 7. Probabilities of functional/dysfunctional
answers for two scenarios.
Therefore, at least answers from 100 respondents
should be collected to determine that an attribute is a
Must-be attribute. What if the other set of probabilities
(probabilities for worst-case scenario) is used? Figure 9
shows the results for this case. As seen from Fig. 9,
even though a large number of respondents are used, an
overlap between the probabilities of Must-be and
Indifferent remains.

Customer Needs Simulation System for Investigating Must-Be Attribute 69
Journal of Mechanical Engineering, Vol. ME 44, No. 1, June 2014 Transaction of the Mechanical Engineering Division, The Institution of Engineers, Bangladesh
( A) 20 respondents
( B) 50 respondents
( c) 100 respondents
( D) 200 respondents
Figure 8. Number of respondents versus Kano
Evaluation for average scenario.
( a) 100 respondents
( b) 200 respondents
c) 1000 respondents
( d) 2000 respondents
Figure 9. Number of respondents versus Kano
Evaluations for worst-case.

Customer Needs Simulation System for Investigating Must-Be Attribute 70
Journal of Mechanical Engineering, Vol. ME 44, No. 1, June 2014 Transaction of the Mechanical Engineering Division, The Institution of Engineers, Bangladesh
This means that if the there is tie between Must-be
and Indifferent, the attribute should be considered a
Must-be attribute. Otherwise, the probability of
Indifferent should have been much higher than that of
Must-be.
Based on the above results it can be concluded that if
the answers of at least 100 respondents show a tie
between must-be and Indifferent (worst-case scenario)
or probability of Must-be is greater than that of others,
then the attribute should be considered a Must-be
attribute. This working principle can be used as a
guideline while distinguishing a Must-be attribute from
others in all kinds of product. Similar study can be
carried out for other types of attributes.
Moreover, the presented system can be used to simulate
customer answers wherein the customers are taken from
different demographic and/or psychographic
background factors of the respondents of known and
unknown answers are similar. This issue remains open
for further study.
In Kano model, a questionnaire is a two-dimensional
one wherein a combination of two answers determines
the level of satisfaction. Sometimes, one-dimensional
questionnaire are used to know the level of satisfaction
(see for example the questionnaire in Roy et al.20
).
CONCLUDING REMARKS
The presented customer needs assessment system
can assist a product development team by providing an
answer to the question: at least how many respondents
should be asked to determine whether or not an
attribute is Must-be, Attractive, One-dimensional,
Indifferent, or Reverse attribute in accordance with
Kano Model. In particular, it is found that at least 100
respondents should be asked to determine whether or
not an attribute is a Must-be attribute. The system can
be customized for other customer needs assessment
model that uses one-dimensional questionnaire or
multi-dimensional questionnaire.
REFERENCES
1. Browning, T.R., Fricke, E. & Negele, H. (2006), Key
concepts in modeling product development processes,
Systems Engineering, 9(2), 104-128.
2. Chen, C.C. & Chuang, M.C. (2008), Integrating the
Kano Model into a Robust Design Approach to
Enhance Customer Satisfaction with Product Design,
International J. of Production Economics, 114(2),
667-681.
3.Chen, H.C., Lee, T.R. Lin, H.Y. & Wu, H.C. (2010),
Application of TRIZ and the Kano Method to Home
Life Industry Innovation, International J. of Innovation
and Learning, 7(1), 64-84.
4.Fujita, K. & Matsuo, T. (2006), Survey and analysis
of utilization of tools and methods in Product
development, Transactions of the Japan Society of
Mechanical Engineers, Series C,72(713), 290–297.
5.Fuller, J. & Matzler, M. (2007), Virtual product
experience and customer participation—A chance for
customer-centred, really new products, Technovation,
27(6-7), 378-387.
6. Hillier, F.S. & Lieberman, G.J. (2005). Introduction
to Operations Research, New York: McGraw Hill.
7.Hari, A., Kasser, J.E. & Weiss, M.P. (2007), How
Lessons Learned from Using QFD Led to the Evolution
of a Process for Creating Quality Requirements for
Complex Systems, Systems Engineering, 10(1),
45-63.
8.Kobayashi, H. (2006), A systematic approach to
eco-innovative product design based on life Cycle
planning, Advanced Engineering Informatics, 20(2),
113-125.
9. Kano, N.,Seraku, N.(1984), Takahashi, F. and Tsuji,
S., Attractive quality and must-be quality, Hinshitsu,
14(2),39–48.
10. Lee, Y.C. & Huang, S.Y. (2009), A New Fuzzy
Concept Approach for a New Fuzzy Concept on Kano's
Model, Expert Systems with Applications, 36(3),
4479-4484.
11.Matzler, K. & Hinterhuber, H.H. (1998), How to
make product development projects more successful by
integrating Kano's model of customer satisfaction into
quality function deployment, Technovation, 18(1),
25-38.
12. Poel, I.V.d. (2007), Methodological problems in
QFD and directions for future development, Research
in Engineering Design, 18(1), 21-36.
13.Rashid, M.M., Tamaki, J., Ullah, A.M.M.S. &
Kubo, A., (2010), A Virtual Customer Needs System
for Product Development, Proceedings of the JSPE
Hokkaido Chapter Annual Conference, 2010, Japan.
14. Rashid M. M. (2010), A Simulating functional and
dysfunctional answer from given Kano evaluation for
Product Development, Proceedings of 1st International
Conference on Mechanical,Industrial and Energy
Engineering, Khulna, Bangladesh,1-6.
15. Rashid M. M., Ullah A.M.M.S., Tamaki J. and
Kubo A. (2010), A Numerical Method for Customer
Need Analysis, Proceedings of the 13 Annual Paper
Meeting Conference on Mechanical Engineering APM,
IEB, Bangladesh, 1-6.
16. Rashid M. M. (2010), A review of state-of –Art on
Kano Model for Research Direction, International J.
of Engineering, Science and Technology, 2(12),7481-
7490.
17. Rashid M. M., Ullah A.M.M.S., Tamaki J. and
Kubo A. (2010). A Kano Model based Computer
System for Respondents determination: Customer
Needs Analysis for Product development Aspects,
Management Science and Engineering, 4 (4), 70-74.
18. Rashid M. M., Ullah A.M.M.S., Tamaki J. and
Kubo A. (2010), A proposed computer system on Kano
Model for new product development and innovation
aspect: A case study is conducted by an attractive

Customer Needs Simulation System for Investigating Must-Be Attribute 71
Journal of Mechanical Engineering, Vol. ME 44, No. 1, June 2014 Transaction of the Mechanical Engineering Division, The Institution of Engineers, Bangladesh
attribute of automobile, International J. of
Engineering, Science & Technology, 2(9),1-12.
19. Rashid M. M., Ullah A.M.M.S., Tamaki J. and
Kubo A. (2011), A Numerical Kano Model for
compliance customer needs with product development.
Industrial Engineering and Management Systems, 10
(2), 140-153.
20. Roy, R. Goatman, M. & Khangura, K. (2009),
User-centric design and Kansei Engineering, CIRP
Journal of Manufacturing Science and Technology, 1
(3), 172-178.
21.Savino, M.M., Apolloni, S. & Ouzrout, Y. (2008),
Product quality pointers for small lots Production: a
new driver for Quality Management System, Int. J.
Product Development, 5(1-2), 199-211.
22.Sireli, Y., Kauffmann, P. & Ozan, E. (2007),
Integration of Kano's Model into QFD for Multiple
Product Design, IEEE Transactions on Engineering
Management, 54(2),380-390.
23.Ullah, A.M.M.S. & Tamaki, J. (2009), Uncertain
Customer Needs Analysis for Product Development: A
Kano Model Perspective, Proceedings of the Sixth
International Symposium on Environmentally
Conscious Design and Inverse Manufacturing,
Sapporo, Japan.
24.Ullah, A.M.M.S. & Tamaki, J. (2010), Analysis of
Kano-Model-Based Customer Needs for Product
Development, Systems Engineering, 14(2), 154-172.
25.Ullah, A.M.M.S. & Harib, K.H. (2006), A
Human-Assisted Knowledge Extraction Method for
Machining Operations, Advanced Engineering
Informatics, 20(4), 335- 350.
26.Xu, Q., Jiao, R.J., Yang, X., Helander, M., Khalid,
H.M. & Opperud, A. (2009), An Analytical Kano
Model for Customer Need Analysis, Design Studies, 30
(1),87-110.
27.Yadav, O.P. and Singh, N. (2008), Perspectives and
challenges for product reliability assurance in the
product development process, Int. J. Product
development, 5 (1-2), 4-16.
APPENDIX A: Kano Model
Kano Model defines the relationships between
customer satisfaction and product attribute (Fig.A.1)
and provides five types of product attributes, namely,
Attractive, Must-be, One-dimensional, Indifferent, and
Reverse.In Fig.A.1, the upward vertical axis represents
satisfaction and downward vertical axis represents
dissatisfaction. The leftward horizontal axis represents
absence of performance (the attribute is not
working/not present) that is called dysfunctional side.
The rightward horizontal axis represents presence of
performance (the attribute is working/present) that is
called functional side.
Table A1 describes the meaning of Must-be (M),
One-dimensional (O), Attractive (A), Indifferent (I),
and Reverse (R) attribute.
Table A1. Five classes of product attributes
used in Kano model.
Product
attributes
Definition Recommendations
Attractive An attribute is
considered an Attractive
attribute, if it leads to a
better satisfaction,
whereas it is not
expected to be in the
product.
Include a good
number of Attractive
attributes
One
-dimensional
An attribute is
considered a
One-dimensional
attribute, if its
fulfillment helps
enhance the satisfaction
and vice versa.
Include a good
number of
One-dimensional
Must-be An attribute is
considered a Must-be
attribute, if its absence
produces absolute
dissatisfaction and its
presence does not
increase the satisfaction.
Continue Must-be
attributes
Indifferent An attribute is
considered an
Indifferent attribute, that
result neither in
satisfaction nor
dissatisfaction, whether
fulfilled or not.
Avoid Indifferent
attributes as many as
possible
Reverse The attribute that leads
to absolute
dissatisfaction.
Should be avoided
To know whether or not a given attribute is
Attractive, Must-be, One-dimensional, Indifferent, or
Reverse, it is important to fill out a two-dimensional
questionnaire prepared for each attribute under
consideration. One of the dimensions of the
questionnaire is called functional answer (i.e., the
answer when the attribute is working/present) and the
other dimension is called dysfunctional answer (i.e.,
the answer when the attribute is not working/not
present). A respondent needs to answer one state out of

Customer Needs Simulation System for Investigating Must-Be Attribute 72
Journal of Mechanical Engineering, Vol. ME 44, No. 1, June 2014 Transaction of the Mechanical Engineering Division, The Institution of Engineers, Bangladesh
Like, Must-be, Neutral, Live-with, and Dislike from
functional side. The respondent needs to do the same
for the dysfunctional side. The combination of answers
determines whether the respondent considers the
underlying attribute an Attractive, One-dimensional,
Must-be, Indifferent, or Reverse attribute. Some
combinations of answers do not make sense. This type
of answer is called “Questionable” answer. This leads
to a mapping called Kano Evaluation as shown in Table
A2.
Table A2. Kano Evaluations (zk)
Functional
Answer(xi)
Dysfunctional Answer (yj)
Like Must-be Neutral Live-with Dislike
Like Q A A A O
Must-be R I I I M
Neutral R I I I M
Live-with R I I I M
Dislike R R R R Q
A=Attractive, I=Indifferent, M=Must-be, O=One-dimensional,
Q=Questionable, and R=Reverse
Figure A1. Correlation between product attribute and customer satisfaction in Kano model.
APPENDIX B: Membership Functions of
Linguistic Likelihood
The membership functions ((.)(Pr)) of the linguistic
likelihoods denoted by less-likely, some-likely,
quite-likely, and most-likely are given, as follows:
03.0
Pr3.0,1min,0maxPrlikelyless (B.1)
3.07.0
Pr7.0,
03.0
0Prmin,0maxPrlikelysome (B.2)
7.01
Pr1,
3.07.0
3.0Prmin,0maxPrlikelyquite (B.3)
7.01
7.0Pr,1min,0maxPrlikelymost (B.4)
The lower limit and upper limit of Pr for less-likely,
some-likely, quite-likely, and most-likely are defined
by an -cut at =0.5. The average value of less-likely,
some-likely, quite-likely, and most-likely are
determined by centroid method. See the reference
(Ullah & Harib25
) for more details.