Embed Size (px)
Citation preview

Cyber Threat Trees for Large System Threat
Cataloging and Analysis*
P. Ongsakorn, K. Turney, M. Thornton, S. Nair, S. Szygenda, and T. Manikas
High Assurance Computing and Networking Laboratories
Department of Computer Science and Engineering
Southern Methodist University Dallas, TX, USA
{pongsak, kturney, mitch, nair, szygenda, manikas}@lyle.smu.edu
Abstract—The implementation of cyber threat
countermeasures requires identification of points in a system where redundancy or other modifications are needed. Because large systems have many possible threats that may be interdependent, it is crucial that such threats be cataloged in a manner that allows for efficient representation and ease of analysis to identify the most critical threats. To address this problem, we model large system threats by conceptually representing them as a Cyber Threat Tree implemented as a directed graph known as a Multiple-Valued Decision Diagram (MDD). The cyber threat tree structure improves upon both the classical fault tree and attack tree structures by expanding the representation of possible system threats. This cyber threat tree model is incorporated into an existing MDD software package to help identify and catalog possible system threats. We have also developed a new formal language, CyTML, which is used to represent cyber threat trees.
Index Terms—Cyber Attacks, System Threats, Tree Models.
I. INTRODUCTION
Cyber attacks on various infrastructures and large systems around the world are gaining increasing attention. The implementation of cyber threat countermeasures requires identification of those points in the system where redundancy or other modifications are needed. Because large systems have many possible threats that may be interdependent, it is crucial that such threats be cataloged in a manner that allows for efficient representation and ease of analysis to identify the most critical threats.
In analyzing the effect of large system threats, there is a need to efficiently catalog those threats so that further analyses can be performed to extract common characteristics among the threats and to devise suitable countermeasures. A very large system can have an enormous number of potential threat scenarios and a simple list of these is insufficient for analysis and classification. To address this need, we propose an extension to the well-known fault tree representation and further describe efficient data structures that allow for a convenient organization of the threats that is both canonic and amenable to automated analysis.
We also use the concepts of discrete multiple-valued logic (MVL), in particular the Post algebras which provide much more expressiveness than the binary Boolean algebras that traditional fault and trees are based upon. The fact that the MVL descriptions are more expressive has implications in the type of data structures used to represent the cyber threat trees as well as the analysis methods employed. We use and adapt of the Multiple-Valued Decision
Diagram (MDD) for the purpose of threat cataloging. The MDD not only allows for compact representation of extremely large numbers of threats but is also canonic in a mathematical sense and allows for easy identification of common characteristics among subsets of threats that may not be readily apparent to a human who is reading a simple threat list.
Our approach utilizes a threat representation structure called a Cyber Threat Tree. This idea was motivated from the ideas of fault trees, which were originally devised by Bell laboratories. Cyber threat trees have important differences from the fault trees in that many threat events are not statistically independent and that, unlike the fault tree model, we do not model threats as faults. In the fault tree model, a fault either exists or does not; hence, it is based on a binary Boolean logic switching function. Cyber threats have a probability of occurring that may result in total system failure, partial system degradation, or no effect. For this reason, we do not use a switching function based on a binary algebra, rather we use a multiple valued algebra so that various states of the threats can be modeled as well as their interdependence with one another.
The organization of this paper is that we will first provide background material on relevant topics that are used in the formulation of cyber threat trees such as a review of fault and attack trees. Next, we will introduce the new cyber threat tree and describe the new features that differentiate it from other structures. A simple example will be used to demonstrate the use of the cyber threat tree. The following section of the paper will deal with the implementation and representation of cyber threat trees using decision diagrams and a new formal language developed for this purpose known as CyTML. Next, we will address how cyber threat trees can be used for analysis purposes and then we conclude.
II. FAULT AND ATTACK TREES
Classical fault tree analysis [13] was developed to represent possible ways a system could fail as a result of component or subsystem failures. This approach essentially uses Boolean logic operations to represent how such failures are interrelated and could result in a system failure. Fault trees are represented as networks of Boolean logic operators where a fault is considered to either have occurred or not occurred. Fig. 1 contains an example of a simple fault tree where the circular nodes represent the event of a single component failure and the logic operators (AND/OR gates) show how the events combine to result in a subsystem failure. Referring to Fig. 1, if one or more of events 1, 2, or 3 occur, subsystem A will fail. Alternatively, both events 4 and 5 must occur for subsystem A to fail.
*Funded by Office of Naval Research - ONR Project N000140910784

Subsystem A
21 3 4 5
Fig. 1 Simple Fault Tree Example
Attack trees [8] are similar to fault trees but focus only on the security of a system and are an enumeration of possible attacks. The root of an attack tree represents a successful attack and the leaf nodes represent ways of achieving the planned attack. Like fault trees, attack trees also rely on binary-valued algebras.
III. CYBER THREAT TREES
Cyber Threat Trees are a superset of fault and attack trees since they are based on multiple-valued or radix-p valued algebras over a finite and discrete set of values. When the radix p=2, the cyber threat tree reduces to a fault or attack tree depending on the nature of the disruptive events. Generally, cyber threat trees have p>2: these additional logic states allow for more complicated interactions to be modeled.
Modeling different operational modes other than just the binary case of failure or normal operation are critical in analyzing large systems in the presence of threats. As an example, in the 2003 blackout of the US power grid, many complex interactions caused a blackout to occur in a large portion of the northeastern US; however, it would be incorrect to state that the entire US power grid failed. This type of system analysis and prediction must utilize a model such as the cyber threat tree since using an attack or fault tree would result in proclaiming either entire system failure or a normal system operational state.
Fig. 2 shows a small example Cyber Threat Tree that models part of the power grid related to a power outage with operational states and probabilities. On the right side of the tree, the power transmission lines are represented: if one of them is cut the power can still be delivered but if both of them are cut then no power can be delivered and there will be power outages. On the left side are the power generation plants and their operational states. We assigned numerical state numbers by the order of operational capability. The power plant operational state has numerical state “2” while the degraded and offline states have numerical values of “1” and “0” respectively. The same concept applies for the power transmission line states. Because we are not modeling power lines to have a degraded state, their operational states are either “2,” the non-operational state, or is “0,” the fully operational state.
The reliability characteristics of each power plant and the assigned states of power outage are given in TABLE I and TABLE II. To determine the MVL switching function combining the various states, a risk assessment phase is performed where a system expert answers a series of questions that results in the truth table of function f given in TABLE V. This table is then synthesized into a network of MVL logic operations represented by Cyber Threat Tree in Fig. 3.
Hydro
Plant
Wind
Plant
Coal
PlantTx
Line 1
Tx
Line 2
Min
Max
Switching Function Modeling
Power Generation Plant
Interactions
City’s Power
Condition
Fig. 2 Cyber Threat Tree for Small Power T&D Network
For example, if the coal power plant is Offline (0), the hydrodynamic power plant is in a Degraded state (1), and the wind power plant is Offline (0), then a Complete Outage (0) of the power generation subsystem occurs since the total power generated by the subsystem is 1500 MW. On the contrary, if the wind power plant is operating in Degraded state (1), a Partial Outage (1) occurs, since the total subsystem power is now 1600 MW.
TABLE I. POWER PLANT CHARACTERISTICS
State Coal Hydro Wind
Output Probability Output Probability Output Probability
(2) Operational 1000 0.98 2000 0.99 200 0.6
(1) Degraded 600 0.018 1500 0.009 100 0.3
(0) Offline 0 0.002 0 0.001 0 0.1
TABLE II. POWER OUTAGE CONDITION
Outage State Power (MW)
(2) No Outage >= 2400
(1) Partial Outage 1600 - 2399
(0) Complete Outage <1600
Since the cyber threat tree is based on a Multiple-Valued Logic (MVL) algebra, the symbols that are commonly used to represent logical OR (disjunction) and AND (conjunction) are still used as a matter of convention; however, the corresponding algebraic operations are generalized. The binary conjunction operator represents the MIN function while disjunction represents the MAX function. The MIN function yields the numerical minimal logic value among all function variables while the MAX function yields the numerical maximum value among all inputs. The truth table of these functions is shown in TABLE III. MIN and MAX are not sufficient to represent all possible multiple-valued switching functions; however, the inclusion of the three literal-selection gates allow for a functionally complete MVL algebra to be formed [6].

TABLE III. TRUTH TABLE OF 3-VALUED 2-VARIABLS MIN AND MAX
x1 x2 MIN(x1, x2) MAX(x1, x2) 0 0 0 0
0 1 0 1
0 2 0 2
1 0 0 1
1 1 1 1
1 2 1 2
2 0 0 2
2 1 1 2
2 2 2 2
The literal selection-gate, denoted as Ji, is a unary operation whose output is 0 if the input logic value is not i and the output is the maximum logic value (in this case “2” for 3-valued logic) when the input is value i. The truth table of the literal selection function for 3-valued logic is shown in TABLE IV.
TABLE IV. TRUTH TABLE OF 3-VALUED LITERAL SELECTION
x J0(x) J1(x) J2(x)
0 2 0 0
1 0 2 0
2 0 0 2
In order to determine the relationship among the power generation plants, a risk assessment phase is utilized where a series of questions is answered by a system expert. The answers to these questions are processed and ultimately result in the specification of the MVL switching function relating the effects of the various generation plants. While this relationship will be captured and expressed as a switching function in graphical form, we show the results here as a truth table in TABLE V for illustration. It is then synthesized into a network of MIN, MAX, and J-gates resulting in the tree shown in Fig. 3.
Once the state of each power generation plant propagates through the MVL logic network, the output will result in the overall status of the power network according to the characteristic of each power plant.
IV. DECISION DIAGRAMS
There are a large number of cyber threats present in the large distributed systems of interest, thus the cyber threat tree structure becomes unwieldy to manipulate due to its large size. Decision diagrams are rooted directed acyclic graphs that can be used to represent large switching functions in an efficient manner. For binary-valued logic, the binary decision diagram (BDD) is a well-known structure [2] that has been applied to many areas including the representation of fault trees [7]. Furthermore, efficient software is readily available to manipulate BDDs.
BDD is a directed acyclic graph (DAG) with two distinct types of
vertices, terminal and non-terminal, and initial node. The terminal vertex is a vertex with no outgoing edge and carrying an attribute of 0 or 1. The non-terminal vertex is a vertex with two outgoing edges. The vertex is annotated with a Boolean variable and two edges are annotated with Boolean constant 0 or 1. An initial node is the root
vertex. For example, function 11011101 fxfxfxfxf
can be represented by the BDD in Fig. 4.
Min
Max
TX Line1 TX Line2
Max
Min MinMin
Max
J1J0 J2
Coal
Plant
City’s Power Condition
Max Max
Min
1
J1J2
Hydro
Plant
Min
1
Min
Min
1
Max
J2J1
Wind
Plant
Fig. 3 MVL Synthesized Cyber Threat Tree
x1
f0 f1
0 1
f
Fig. 4 BDD represents function 11011101 fxfxfxfxf
In the case of MVL, an extension to the BDD construct has been developed and implemented called the Multiple-Valued Decision Diagram (MDD) [5]. An experimental MDD software package has been implemented and is used and modified according to our application of cyber threat trees in this project. Because the cyber threat tree is initially specified as an interconnection of MVL gate operations, it is necessary to automatically transform the structure to the MDD without explicitly building the cyber threat tree. Methods similar to those described in [4] are employed for this purpose.
The MDD is desirable due to the compact representation of the switching function it represents. Additionally, the structure is highly beneficial for our application here since efficient algorithms have been developed to compute overall probabilities and related spectral transforms of the switching function [10][11][12]. While MDDs have been suggested in the past for use in dependability analysis of classical fault tolerant systems [16], this is the first time they have been applied to the new concept of a cyber threat tree. The approach in [16] limited the MDD to be strictly 3-valued and did not consider the underlying specific switching algebra. Here, we allow any arbitrary radix to be used, we associate logic values with reliability or other probabilistic values, and we allow for the use of mixed-radix algebraic operations within the same cyber threat tree. We also have formulated cyber threat trees in conjunction with a specific MVL switching algebra often referred to as the Post algebra [6].
TABLE V. FUNCTION f REPRESENTING POWER PLANT INTERACTION
Coal Hydro Wind f
0 0 0 0
0 0 1 0
0 0 2 0
0 1 0 0
0 1 1 1
0 1 2 1
0 2 0 1
0 2 1 1
0 2 2 1
1 0 0 0
1 0 1 0
1 0 2 0
1 1 0 1
1 1 1 1
1 1 2 1
1 2 0 2
1 2 1 2
1 2 2 2
2 0 0 0
2 0 1 0
2 0 2 0
2 1 0 2
2 1 1 2
2 1 2 2
2 2 0 2
2 2 1 2
2 2 2 2
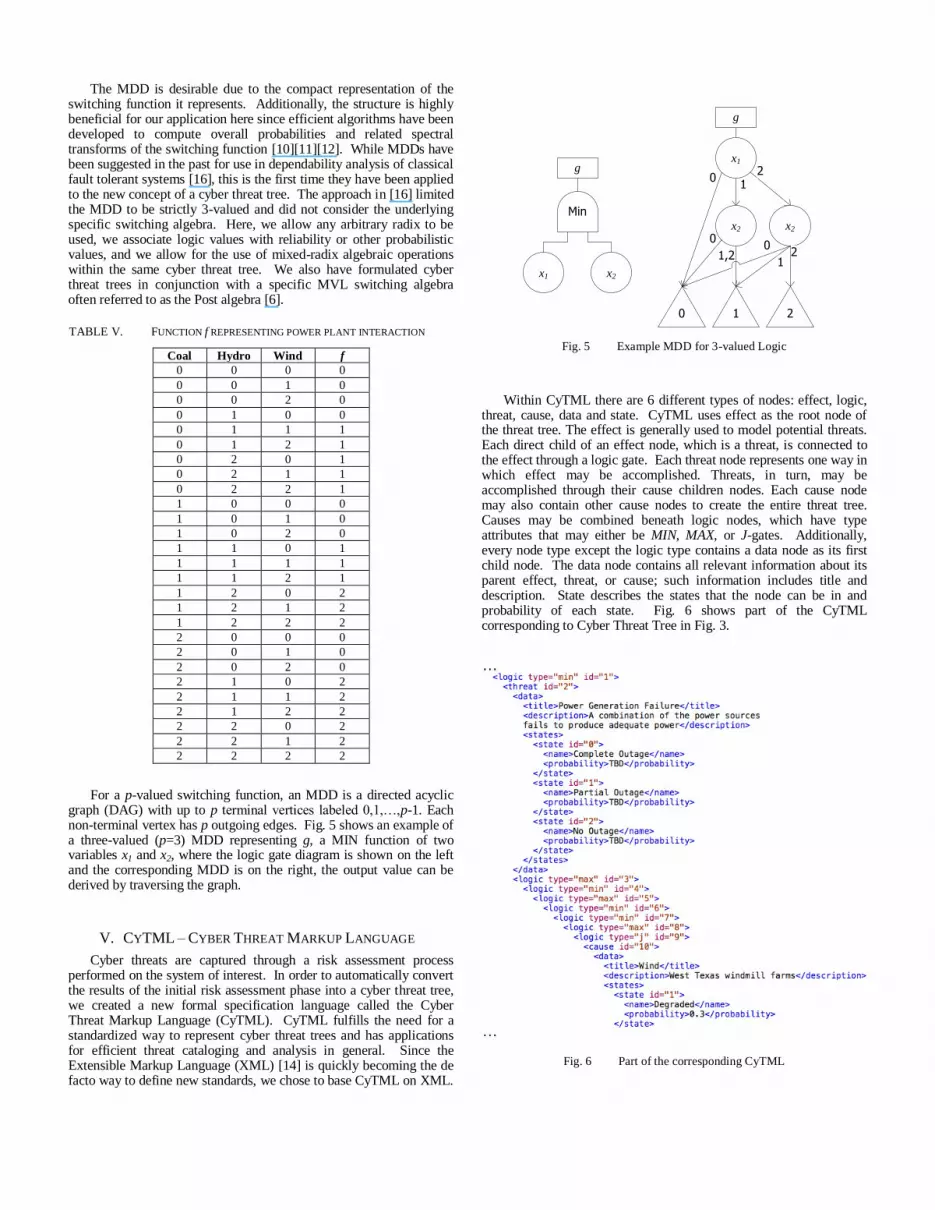
For a p-valued switching function, an MDD is a directed acyclic graph (DAG) with up to p terminal vertices labeled 0,1,…,p-1. Each non-terminal vertex has p outgoing edges. Fig. 5 shows an example of a three-valued (p=3) MDD representing g, a MIN function of two variables x1 and x2, where the logic gate diagram is shown on the left and the corresponding MDD is on the right, the output value can be derived by traversing the graph.
V. CYTML – CYBER THREAT MARKUP LANGUAGE
Cyber threats are captured through a risk assessment process performed on the system of interest. In order to automatically convert the results of the initial risk assessment phase into a cyber threat tree, we created a new formal specification language called the Cyber Threat Markup Language (CyTML). CyTML fulfills the need for a standardized way to represent cyber threat trees and has applications for efficient threat cataloging and analysis in general. Since the Extensible Markup Language (XML) [14] is quickly becoming the de facto way to define new standards, we chose to base CyTML on XML.
0 1
01
2
2x1
x2
1,2
x2
00
21
Min
x1 x2
g
g
Fig. 5 Example MDD for 3-valued Logic
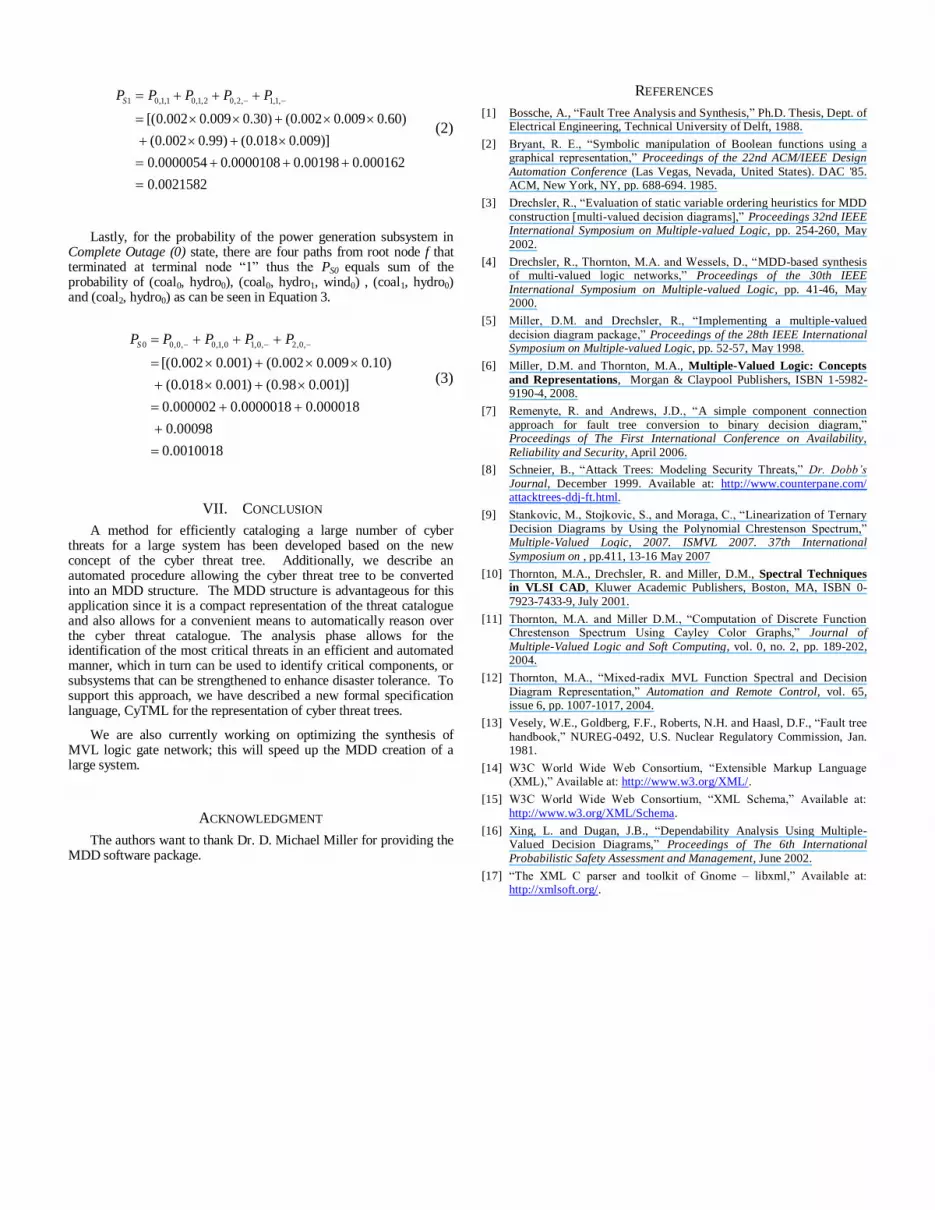
Within CyTML there are 6 different types of nodes: effect, logic, threat, cause, data and state. CyTML uses effect as the root node of the threat tree. The effect is generally used to model potential threats. Each direct child of an effect node, which is a threat, is connected to the effect through a logic gate. Each threat node represents one way in which effect may be accomplished. Threats, in turn, may be accomplished through their cause children nodes. Each cause node may also contain other cause nodes to create the entire threat tree. Causes may be combined beneath logic nodes, which have type attributes that may either be MIN, MAX, or J-gates. Additionally, every node type except the logic type contains a data node as its first child node. The data node contains all relevant information about its parent effect, threat, or cause; such information includes title and description. State describes the states that the node can be in and probability of each state. Fig. 6 shows part of the CyTML corresponding to Cyber Threat Tree in Fig. 3.
Fig. 6 Part of the corresponding CyTML

Since CyTML is XML based, there are a variety of tools available to create and manipulate it. This wide availability allows for easy collaboration between separate groups and platforms. Additionally, CyTML is very dynamic in the aspect that teams that are experts on different systems may develop specific threat trees within their expertise and then combine these threats to make one unified cyber threat tree.
VI. CYBER THREAT ANALYSIS USING MDDS
Initially, the risk assessment phase is performed that ultimately results in the creation of the MDD representing the cyber threat tree. Next, the tree is analyzed to determine the most critical threats. This knowledge can then be used by system designers to add redundancy to key components or subsystems to counter the threat. This approach also allows for a tradeoff between system cost and degree of disaster tolerance. Repeated iterations of the approach increase disaster tolerance, but also increase cost due to additional system components being added. Because the overall probability of system failure is easily computed from the MDD, thresholds can be established that determine when the system has reached the desired level of disaster tolerance.
Methods developed in [11] that map the MVL switching function of the MDD to Cayley graphs can be used to generate the Chrestenson spectrum. In turn, the Chrestenson spectrum can then be used to compute various probability values [10] as well as direct computation of probabilities through MDD traversal algorithms. The Chrestenson spectrum is a generalization of the set of orthogonal Walsh Hadamard functions over the binary fields which is commonly use for binary switching function analysis. These functions can be used as a basis for the discrete orthogonal transform of a p-valued function. With MDD we can use these techniques to automatically detect correlations and common characteristics among a set of threats. The general flow diagram for this process is shown in Fig. 7.
Start
Threat assesment
Build MDDs
Perform MDD Analysis
End
CyTML Representation
Report critical threats
Satisfied with the result?
Add redundancy, Increase DT
No
Yes
Fig. 7 Cyber Threat Analysis Loop using Cyber Threat Trees
Fig. 8 MDD of Shaded Part of Fig. 3
The risk assessment phase allows for system experts to answer a series of questions that are used to build the CyTML specification of the cyber threat tree. To build the MDD, the CyTML is parsed in
using libxml [17], and then an automated synthesis process adapted from [4] is employed.
Once the MDD has been created, we can calculate the probability of each state by traversing the MDD and calculating the sum of the probability of all the paths from root to each terminal state. [10] This can be accomplished through direct traversals or through the employment of spectral methods based on the Chrestenson transform as described previously. In the following example, we use the more intuitive approach of direct MDD traversal methods for the sake of clarity in describing the methodology.
Fig. 8 shows the MDD of the shaded part of the cyber threat tree in Fig. 3, we can see the calculation of the probability of power plant subsystem in Operational (2) state in Equation 1. The probability of the power plant subsystem operates in Degraded (1) state can be calculated as seen in Equation 2, while the probability of system in Offline (0) state is calculated in Equation 3. The notion PSw in the equations means probability of system operating in state w, while Px,y,z denotes probabilities of coal power plant in state x, hydrodynamic power plant in state y and wind power plant in state z. Take PS2 as an example, the probability of the power generation subsystem in No Outage (2) state can be calculated by traversing the MDD in Fig. 8, there are three paths from root node f that terminated at terminal node “2” thus the PS2 equals sum of the probability of (coal1, hydro2), (coal2, hydro1) and (coal2, hydro2) as can be seen in Equation 1.
99684.0
9702.000882.001782.0
)]99.098.0()009.098.0()99.0018.0[(
,2,2,1,2,2,12
PPPPS
(1)
As for the probability of the power generation subsystem in
Partial Outage (1) state, there are four paths from root node f that terminated at terminal node “1” thus the PS1 equals sum of the probability of (coal0, hydro1, wind1), (coal0, hydro1, wind2) , (coal0, hydro2) and (coal1, hydro1) as can be seen in Equation 2.
0021582.0
000162.000198.00000108.00000054.0
)]009.0018.0()99.0002.0(
)60.0009.0002.0()30.0009.0002.0[(
,1,1,2,02,1,01,1,01
PPPPPS
(2)
Lastly, for the probability of the power generation subsystem in Complete Outage (0) state, there are four paths from root node f that terminated at terminal node “1” thus the PS0 equals sum of the probability of (coal0, hydro0), (coal0, hydro1, wind0) , (coal1, hydro0) and (coal2, hydro0) as can be seen in Equation 3.
0010018.0
00098.0
000018.00000018.0000002.0
)]001.098.0()001.0018.0(
)10.0009.0002.0()001.0002.0[(
,0,2,0,10,1,0,0,00
PPPPPS
(3)
VII. CONCLUSION
A method for efficiently cataloging a large number of cyber threats for a large system has been developed based on the new concept of the cyber threat tree. Additionally, we describe an automated procedure allowing the cyber threat tree to be converted into an MDD structure. The MDD structure is advantageous for this application since it is a compact representation of the threat catalogue and also allows for a convenient means to automatically reason over the cyber threat catalogue. The analysis phase allows for the identification of the most critical threats in an efficient and automated manner, which in turn can be used to identify critical components, or subsystems that can be strengthened to enhance disaster tolerance. To support this approach, we have described a new formal specification language, CyTML for the representation of cyber threat trees.
We are also currently working on optimizing the synthesis of MVL logic gate network; this will speed up the MDD creation of a large system.
ACKNOWLEDGMENT
The authors want to thank Dr. D. Michael Miller for providing the MDD software package.
REFERENCES
[1] Bossche, A., “Fault Tree Analysis and Synthesis,” Ph.D. Thesis, Dept. of Electrical Engineering, Technical University of Delft, 1988.
[2] Bryant, R. E., “Symbolic manipulation of Boolean functions using a graphical representation,” Proceedings of the 22nd ACM/IEEE Design
Automation Conference (Las Vegas, Nevada, United States). DAC '85. ACM, New York, NY, pp. 688-694. 1985.
[3] Drechsler, R., “Evaluation of static variable ordering heuristics for MDD
construction [multi-valued decision diagrams],” Proceedings 32nd IEEE International Symposium on Multiple-valued Logic, pp. 254-260, May
2002.
[4] Drechsler, R., Thornton, M.A. and Wessels, D., “MDD-based synthesis of multi-valued logic networks,” Proceedings of the 30th IEEE
International Symposium on Multiple-valued Logic, pp. 41-46, May 2000.
[5] Miller, D.M. and Drechsler, R., “Implementing a multiple-valued
decision diagram package,” Proceedings of the 28th IEEE International Symposium on Multiple-valued Logic, pp. 52-57, May 1998.
[6] Miller, D.M. and Thornton, M.A., Multiple-Valued Logic: Concepts
and Representations, Morgan & Claypool Publishers, ISBN 1-5982-9190-4, 2008.
[7] Remenyte, R. and Andrews, J.D., “A simple component connection
approach for fault tree conversion to binary decision diagram,” Proceedings of The First International Conference on Availability,
Reliability and Security, April 2006.
[8] Schneier, B., “Attack Trees: Modeling Security Threats,” Dr. Dobb’s
Journal, December 1999. Available at: http://www.counterpane.com/ attacktrees-ddj-ft.html.
[9] Stankovic, M., Stojkovic, S., and Moraga, C., “Linearization of Ternary
Decision Diagrams by Using the Polynomial Chrestenson Spectrum,” Multiple-Valued Logic, 2007. ISMVL 2007. 37th International
Symposium on , pp.411, 13-16 May 2007
[10] Thornton, M.A., Drechsler, R. and Miller, D.M., Spectral Techniques
in VLSI CAD, Kluwer Academic Publishers, Boston, MA, ISBN 0-
7923-7433-9, July 2001.
[11] Thornton, M.A. and Miller D.M., “Computation of Discrete Function Chrestenson Spectrum Using Cayley Color Graphs,” Journal of
Multiple-Valued Logic and Soft Computing, vol. 0, no. 2, pp. 189-202, 2004.
[12] Thornton, M.A., “Mixed-radix MVL Function Spectral and Decision
Diagram Representation,” Automation and Remote Control, vol. 65, issue 6, pp. 1007-1017, 2004.
[13] Vesely, W.E., Goldberg, F.F., Roberts, N.H. and Haasl, D.F., “Fault tree
handbook,” NUREG-0492, U.S. Nuclear Regulatory Commission, Jan. 1981.
[14] W3C World Wide Web Consortium, “Extensible Markup Language (XML),” Available at: http://www.w3.org/XML/.
[15] W3C World Wide Web Consortium, “XML Schema,” Available at:
http://www.w3.org/XML/Schema.
[16] Xing, L. and Dugan, J.B., “Dependability Analysis Using Multiple-Valued Decision Diagrams,” Proceedings of The 6th International
Probabilistic Safety Assessment and Management, June 2002.
[17] “The XML C parser and toolkit of Gnome – libxml,” Available at: http://xmlsoft.org/.


