Embed Size (px)
Citation preview


FEDERICO ALBERINI, MARK J.H. SIMMONS, ANDY INGRAM*, E. HUGH STITT**1
A COMBINED CRITERION TO IDENTIFY MIXING PERFORMANCE FOR THE BLENDING OF NON-NEWTONIAN FLUIDS USING
A KENICS KM STATIC MIXER
ZŁOŻONE KRYTERIUM DO OKREŚLANIA SKUTECZNOŚCI MIESZANIA PŁYNÓW
NIENEWTONOWSKICH ZA POMOCĄ MIESZALNIKA STATYCZNEGO KM KENICS
A b s t r a c tPlanar Laser Induced Fluorescence (PLIF) has been used to determine the mixing performance of KM static mixers for the blending of Newtonian fluids (aqueous glycerol solutions) and time-independent non-Newtonian fluids (aqueous carbopol 940 solutions), whose rheology shows Herschel-Bulkley behaviour. The effect of number of mixing elements, fluid rhe-ology and apparent viscosity ratio for two-fluid blending have been investigated at constant mixture velocity of 0.3 m s-1. For two-fluid blending, the addition of a high viscosity stream into the lower viscosity main flow causes very poor mixing performance, with unmixed spots visible on the PLIF image. Determination of log variance and average striation thickness revealed conflicting trends. A combined area based method allows presentation of a criterion which combines aspects of both scale and intensity of segregation, which can be used in combination with conventional approaches.Keywords: scale and intensity of segregation, mixing performance, PLIF, non-Newtonian fluid blending, static mixer
S t r e s z c z e n i eFluorescencja wyzwalana promieniem lasera planarnego (PLIF) jest wykorzystywana do określania poziomu skuteczności mieszania przez mieszalniki statyczne KM łączące płyny newtonowskie (wodne roztwory gliceryny) i niezależne od czasu płyny nienewtonowskie (wodne roztwory carbopolu 940), których reologia wykazuje zachowanie Herschel – Bulkleya. Zbadano wpływ liczby elementów mieszajacych, reologii płynu i stosunku lepkości pozornej dla mieszaniny dwu-płyno-wej przy stałej prędkości mieszaniny wynoszącej 0,3 m s-1. W przypadku mieszaniny dwu-płynowej dodanie strugi o wy-sokiej lepkości do głównego strumienia charakteryzującego się niską lepkością, powoduje niską skuteczność mieszania i występowanie widocznych w obrazie PLIF niejednorodnych plam. Określenie wariancji log i średniej grubości bruzdo-wania wykazało sprzeczne trendy. Metoda połączona pozwala na zaprezentowanie kryterium łączącego aspekty zarówno skali, jak i intensywności segregacji i może być używana wraz z metodami konwencjonalnymi.Słowa kluczowe: skala i intensywność segregacji, skuteczność mieszania, fluorescencja wyzwalana promieniem lasera planarnego (PLIF), mieszanie płynu nienewtonowskiego, mieszalnik statyczny
* Federico Alberini, Prof. Mark J.H. Simmons, PhD. Andy Ingram, School of Chemical Engineering, University of Birmingham.
** Prof. E. Hugh Stitt, Johnson Matthey Technology Centre, Billingham.
4
1. Introduction
Laminar mixing, in particular for the blending of non-Newtonian fluids, is ubiquitous in many industries including food, home and personal care, catalyst and plastic manufacture. Applications include the blending of concentrated solid-liquid slurries, polymerizations and the dissolution of solids or surfactants into liquids to form gels or complex surfactant/fluid phases. Within the industrial context, mechanistic understanding of laminar mixing has in-itially focused on stirred vessels. This is a challenging research topic due to the complexity of the resultant flow fields and combination of mixing mechanisms present, including cha-otic mixing. With the ultimate aim of being able to determine mixing quality a priori, re-searchers have performed a combination of experimental and numerical studies on chaotic mixing in stirred tanks [1]. Experimental work has focused on the use of optical flow di-agnostic methods such as particle image velocimetry (PIV) or (planar) laser induced fluo-rescence (PLIF) [2] on transparent systems, whilst modeling has involved direct numerical simulations (DNS) of the Navier-Stokes equations, as well as other forms of Computational Fluid Dynamics (CFD) [3]. Recent work has investigated different aspects of non-Newto-nian blending in stirred vessels, focusing on yield stress fluids [4]. Whilst this approach has raised understanding from an empirical to a semi qualitative level, it has highlighted major differences in the mixing behaviour between Newtonian and non-Newtonian fluids.
Whilst stirred vessels remain the workhorse of the chemical industry, the drive towards continuous processing, with consequent sustainability improvements due to reductions in inventory and plant footprint, requires equivalent understanding of non-Newtonian blend-ing within inline static (motionless) mixers. These have been used in industry since the 1950s and design information for the blending of Newtonian fluids is in the public domain e.g. [5]. However, the blending of non-Newtonian fluids is complicated by a non-linear rela-tionship between the applied shear stress and the measured shear rate within the fluid. New-tonian design equations rely on a linear coupling between these quantities, expressing mix-ing quality relationships in terms of a pipe-averaged shear rate, which is related to the pres-sure drop per unit length, a measure of the energy input to the fluid to obtain the required mixing [5]. Clearly, this approach is potentially flawed for non-Newtonian systems and must be carefully checked before it is used on real industrial systems. Lagrangian methods have been employed to determine the mixing quality in laminar flow, yet work on non-Newtonian systems has generally focused on pressure drop measurements e.g. [6], with only a few re-cent studies examining them in more detail [7].
Most work on static mixers has expressed mixing performance in terms of a co-efficient of variance, CoV, (or the log-variance) which is measure of the concentration variance (in-tensity of segregation) in the final product. Recent work has challenged this approach, con-sidering it necessary to consider the scale of segregation in the mixing process, in terms of the thickness of the striations at the mixer outlet [8]. In certain circumstances this may be a more appropriate measure, or considered in tandem with the CoV.
In this paper, a PLIF based method is described which is used to characterise blending of non-Newtonian fluids in a KM mixer to determine the scale and intensity of segregation as function of number of mixer elements, fluid rheology and apparent viscosity ratio. The method proposed combines scale and intensity of segregation in a single combined criterion which is complementary to existing criteria such as the log variance and striation thickness
5
[8]. As in previous work [2], the method is based on analysis of images taken from a trans-verse section across the outlet of mixer, with one fluid phase doped with fluorescent dye.
2. Materials and Methods
2.1. Experimental Rig and PLIF Setup
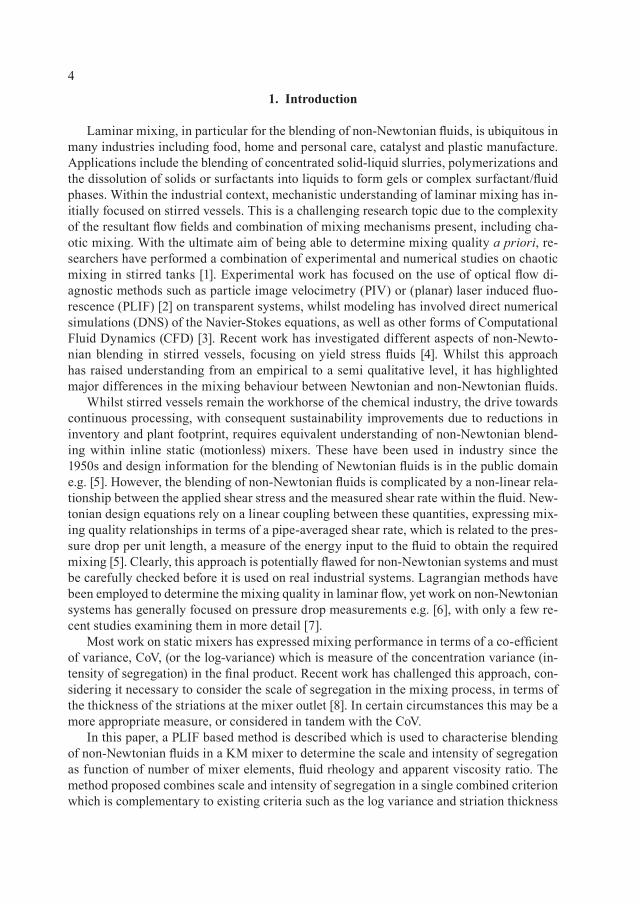
Fig. 1 shows a schematic of the experimental rig. A KM static mixer of diameter 12.7 mm (0.5”) with either 6 or 12 elements is used. The working fluids are aqueous solutions of glycerol or carbopol 940. The main flow is delivered by a Liquiflo gear pump at Q =160 L hr-
1, controlled using a motor drive (Excal Meliamex Ltd). A minor secondary flow, doped with fluorescent dye (Rhodamine 6G) is injected using a Cole-Palmer Micropump (GB-P35) at Q = 24 L hr-1. The flow rate is monitored using an electromagnetic flow meter (Krohne). To ena-ble flow measurements to be made using PLIF, which requires optically transparent materials, a T-piece is placed at the end of the pipe which has a glass window inserted perpendicular to the axis of the main pipe. A glass pipe section upstream of the T-piece provides optical ac-cess for the laser sheet, provided using a 532 nm Nd-Yag laser (New Wave Solo III). The la-ser pulses (operating at 7 Hz) are synchronized to the camera (TSI Powerview 4MP 12 bit CCD camera) using a synchronizer (TSI 610035) attached to a personal computer. The cam-era is equipped with a 545 nm cut-off filter to eliminate reflected laser light, with only the fluorescent light (λ = 560 nm) being captured. The concentration of the minor flow is calcu-lated to obtain an overall concentration in the system ~0.5 mg L-1 of Rhodamine 6G, within the linear range [9]. Three different fully mixed dye concentrations were used to calibrate the system and confirm linearity, providing a set of linear equations to relate dye concentra-tion to grayscale value on a pixel by pixel basis using MATLAB. The spatial resolution of the measurements was 10 μm pixel-1.
2.2. Fluids characterisation
The rheology of the fluids was obtained using a cone and plate rheometer (TA AR1000, TA Instruments) equipped with a 40 mm diameter 2° steel cone. The aqueous carbopol 940 solutions were found to be well represented by the Herschel-Bulkley model (eq. 1) over
Fig. 1. Schematic of the static mixer rig used for the PLIF experiments
6
a range of shear rates, , from 0.1 – 1000 s-1, where the shear stress, τ, is related to , the yield stress, τ0, consistency index, K and the power law exponent, n. The fluid properties are given in Table 1 below.
T a b l e 1
Physical properties of the aqueous solutions used in the experiments
Densityρ
[kg m-3]
Yield stressτ0
[Pa]
P. law exp. n[-]
Consistency IndexK
[Pa sn-1]
ViscosityηA (Pa s)
(at γ = 750 s-1)
pH [-]
Fluid 1: 80% wt Glycerol 1200 - - - 0.05 -
Fluid 2: 0.1% wt Carbopol 940 1000 3.7 0.7 0.26 (0.05) 4.5
Fluid 3: 0.2% wt Carbopol 940 1000 25.2 0.42 6.74 (0.25) 5
2.3. Experimental conditions
The common range of operational superficial velocities for static mixers is between 0.1-1 m s-1. In this work a constant superficial velocity of 0.3 m s-1 is chosen, determined by practical limitations on the fluid storage volume. Six different experimental conditions have been chosen as shown in Table 2. In addition, for the non-Newtonian experiments, a differ-ent fluid (Fluid 3) has been used for the minor (doped) flow than for the main flow (Fluid 2) to examine the mixing of fluids with different rheologies. The apparent viscosity (ηA) ratio of these fluids is 5 at = 750 s-1 (Table 1).
T a b l e 2
Experimental conditions
No. mixing elements #1: Newtonian #2: Non-Newtonian #3 Non-Newtonian
6 or 12 Main Flow: Fluid 1Minor Flow: Fluid 1
Main Flow: Fluid 2Minor Flow: Fluid 2
Main Flow: Fluid 2Minor Flow: Fluid 3
0 0 for (1)τ = τ + γ τ > τ
nK
γ γ
7
3. Results
3.1. Raw PLIF images
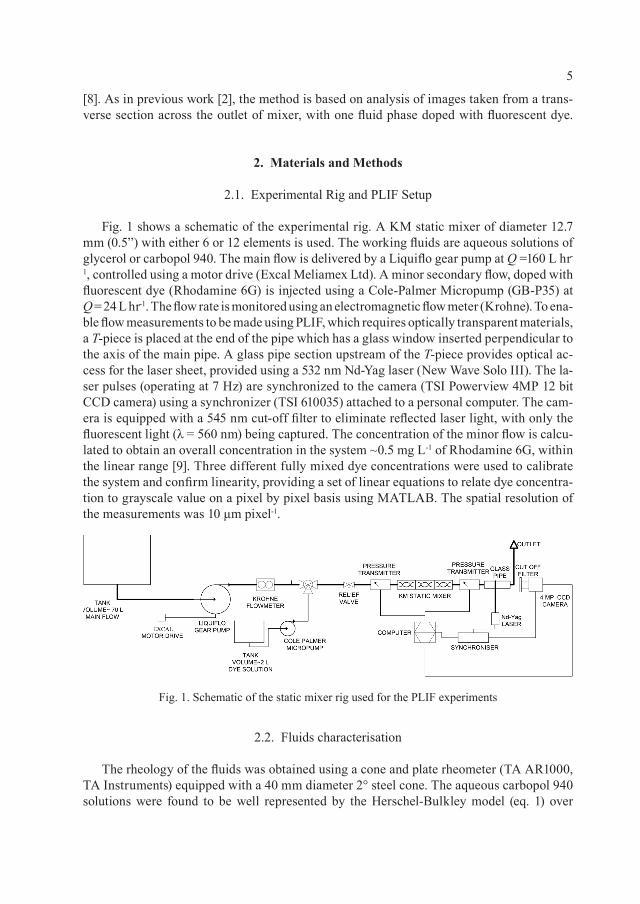
Figure 2 shows a selection of the raw images obtained from the PLIF technique. For the Newtonian blending case (#1), there is a notable reduction in the observed striation thickness when the number of elements is increased (Fig. 2a and 2b), with the overall mix-ing pattern showing evidence of stretching and folding which is typical for KM static mix-ers [8]. This is also evident for the non-Newtonian case where both mixed fluids have the same rheology (#2). In both sets of figures, there is a bright region in the bottom right cor-ner of the image when 6 elements are used (Figure 2a, 2c), which suggests some bypass-ing of the dye stream past the mixer inlet. This phenomenon is exacerbated when the mi-nor flow has a higher apparent viscosity than the main flow in #3. No mixing is observed after 6 elements (Fig. 2e) and the dye remains as a central bright spot. After 12 elements (Fig. 2f), the dye stream has ‘shattered’ into a series of bright spots with some additional evidence of stretching and folding observable.
3.2. Intensity and scale of segregation
Kukukova et al. [8] proposed an approach which defines segregation as being composed of three separate dimensions. The first dimension is the intensity of segregation quantified by the normalised concentration variance (CoV) or log variance of concentration (LogVa); the second dimension is the scale of segregation or clustering (striation thickness) and the last dimension is the exposure or the potential to reduce segregation. The first dimension fo-cuses on the instantaneous concentration variance, the second on the instantaneous length scales in the mixing field and the third on the driving force for change or the instantaneous rate of reduction in segregation, but this is more important for batch processing. In this work scale and intensity of segregation have been considered. LogVa is determined from the in-stantaneous concentration variance and is defined in (eq. 2) below, where Ci is the concen-tration of the ith pixel, C0 is the concentration in the background and C∞ is the concentration assuming perfect mixing across the cross-section:
Fig. 2. Raw PLIF images: (a) and (b) show #1 for 6 and 12 elements; (c) and (d) show #2 for 6 and 12 elements
and (e) and (f) show #3 for 6 and 12 elements respectively
2
2 0
1 0
1log 1 (2)1 = ∞
−σ = − − −
∑N
i
i
C CN C C
(a) (b) (c) (d) (e) (f)
8
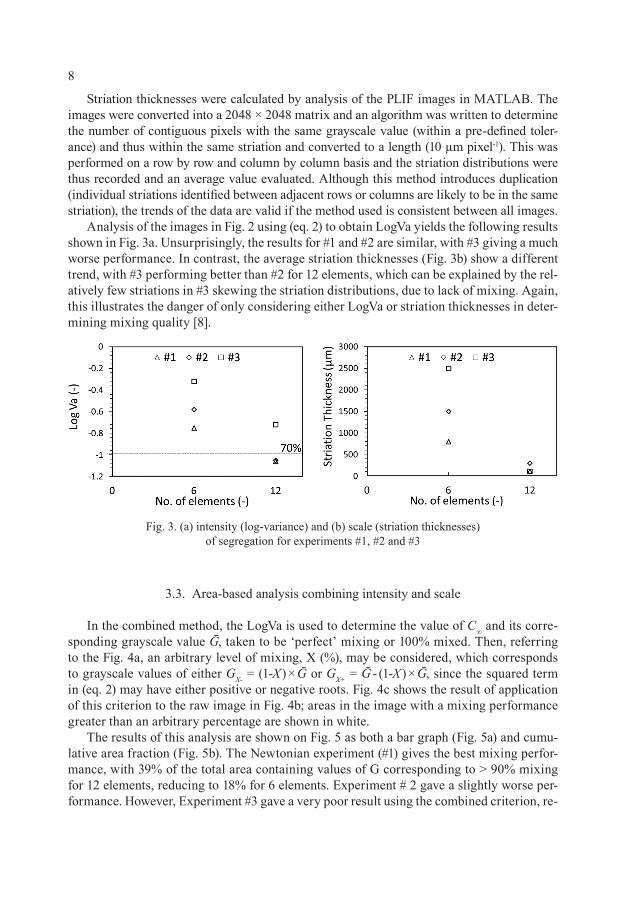
Striation thicknesses were calculated by analysis of the PLIF images in MATLAB. The images were converted into a 2048 × 2048 matrix and an algorithm was written to determine the number of contiguous pixels with the same grayscale value (within a pre-defined toler-ance) and thus within the same striation and converted to a length (10 µm pixel-1). This was performed on a row by row and column by column basis and the striation distributions were thus recorded and an average value evaluated. Although this method introduces duplication (individual striations identified between adjacent rows or columns are likely to be in the same striation), the trends of the data are valid if the method used is consistent between all images.
Analysis of the images in Fig. 2 using (eq. 2) to obtain LogVa yields the following results shown in Fig. 3a. Unsurprisingly, the results for #1 and #2 are similar, with #3 giving a much worse performance. In contrast, the average striation thicknesses (Fig. 3b) show a different trend, with #3 performing better than #2 for 12 elements, which can be explained by the rel-atively few striations in #3 skewing the striation distributions, due to lack of mixing. Again, this illustrates the danger of only considering either LogVa or striation thicknesses in deter-mining mixing quality [8].
3.3. Area-based analysis combining intensity and scale
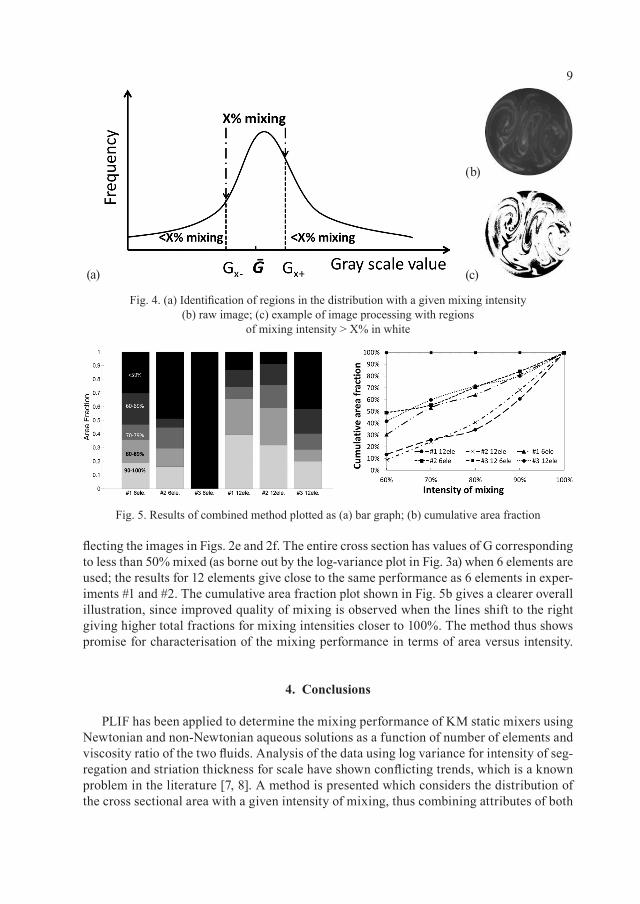
In the combined method, the LogVa is used to determine the value of C∞ and its corre-sponding grayscale value Ḡ, taken to be ‘perfect’ mixing or 100% mixed. Then, referring to the Fig. 4a, an arbitrary level of mixing, X (%), may be considered, which corresponds to grayscale values of either GX- = (1-X) × Ḡ or GX+ = Ḡ - (1-X) × Ḡ, since the squared term in (eq. 2) may have either positive or negative roots. Fig. 4c shows the result of application of this criterion to the raw image in Fig. 4b; areas in the image with a mixing performance greater than an arbitrary percentage are shown in white.
The results of this analysis are shown on Fig. 5 as both a bar graph (Fig. 5a) and cumu-lative area fraction (Fig. 5b). The Newtonian experiment (#1) gives the best mixing perfor-mance, with 39% of the total area containing values of G corresponding to > 90% mixing for 12 elements, reducing to 18% for 6 elements. Experiment # 2 gave a slightly worse per-formance. However, Experiment #3 gave a very poor result using the combined criterion, re-
Fig. 3. (a) intensity (log-variance) and (b) scale (striation thicknesses) of segregation for experiments #1, #2 and #3
9
flecting the images in Figs. 2e and 2f. The entire cross section has values of G corresponding to less than 50% mixed (as borne out by the log-variance plot in Fig. 3a) when 6 elements are used; the results for 12 elements give close to the same performance as 6 elements in exper-iments #1 and #2. The cumulative area fraction plot shown in Fig. 5b gives a clearer overall illustration, since improved quality of mixing is observed when the lines shift to the right giving higher total fractions for mixing intensities closer to 100%. The method thus shows promise for characterisation of the mixing performance in terms of area versus intensity.
4. Conclusions
PLIF has been applied to determine the mixing performance of KM static mixers using Newtonian and non-Newtonian aqueous solutions as a function of number of elements and viscosity ratio of the two fluids. Analysis of the data using log variance for intensity of seg-regation and striation thickness for scale have shown conflicting trends, which is a known problem in the literature [7, 8]. A method is presented which considers the distribution of the cross sectional area with a given intensity of mixing, thus combining attributes of both
Fig. 4. (a) Identification of regions in the distribution with a given mixing intensity (b) raw image; (c) example of image processing with regions
of mixing intensity > X% in white
Fig. 5. Results of combined method plotted as (a) bar graph; (b) cumulative area fraction
(b)
(a) (c)
10
intensity and scale enabling them to be considered together. The method shows promise for the evaluation of mixing performance and can be considered as an addition to conven-tional approaches. Future work will consider the distribution of the size of individual re-gions with a given mixing intensity, to elucidate the scale of segregation as a function of intensity more precisely.
FA is funded by an EPSRC DTA studentship and Johnson Matthey.
R e f e r e n c e s
[1] Alvarez M.M., Zalc J .M. et al., Mechanisms of mixing and creation of structure in laminar stirred tanks, AIChE J. 48, 2002, 2135-2148.
[2] Arrat ia P.E. , Muzzio F.J . , Planar laser-induced fluorescence method for analysis of mixing in laminar flows, Ind. Eng. Chem. Res. 43, 2004, 6557-6568.
[3] Zalc J .M., Szalai E.S. et al., Using CFD to understand chaotic mixing in laminar stirred tanks, AIChE. J., 48, 2002, 2124-2134.
[4] Patel D. , Ein-Mozaffar i F. et al., Dynamic Performance of Continuous-Flow Mix-ing of Pseudoplastic Fluids Exhibiting Yield Stress in Stirred Reactors, Ind. Eng. Chem. Res., 50, 2002, 9377-9389.
[5] Paul E.L. , Atiemo-Obeng V.A. , Kresta S.M., Handbook of Industrial Mixing, Science and Practice, John Wiley & Sons Inc., New Jersey 2004.
[6] Shah N.F. , Kale D.D. , Pressure drop for laminar flow of non-Newtonian fluids in static mixers, Chem. Eng. Sci., 46, 1991, 2159-2161.
[7] Adamiak I . , Jaworski Z. , An experimental investigation of the non-Newtonian liq-uid flow in a Kenics static mixer, Inz. Chem. I Proc, 22, 2001, 175-180.
[8] Kukukova A. , Aubin J . , Kresta S.M., Measuring the scale of segregation in mix-ing data, Can. J. Chem. Engng., 89, 2011, 1122-1138.
[9] Hall J .F. , Barigou M., Simmons M.J .H. , St i t t E.H. , Mixing in unbaffled high throughput experimentation reactors, Ind. Eng. Chem. Res., 43, 2004, 4149-4158.
JERZY BAŁDYGA, MAGDALENA JASIŃSKA, JUSTYNA TRENDOWSKA, WIKTORIA TADEUSIAK*, MIKE COOKE**, ADAM KOWALSKI***1
APPLICATION OF TEST REACTIONS TO STUDY MICROMIXING AND MASS TRANSFER
IN CHEMICAL APPARATUS
WYKORZYSTANIE REAKCJI TESTOWYCH DO BADAŃ MIKROMIESZANIA I TRANSPORTU MASY
W APARATURZE CHEMICZNEJ
A b s t r a c t
Chemical parallel test reactions are used to investigated micromixing efficiency in homogeneous systems and effects of mass transfer on selectivity of complex reactions in two-phase liquid-liquid systems. Mixing phenomena in stirred tanks, rotor-stator mixers and microreactors are investigated.Keywords: mass transfer, micromixing, test reaction
S t r e s z c z e n i e
Równoległe, testowe reakcje chemiczne zastosowano do badań efektywności mikromieszania w układach jednofazowych oraz badań wpływu transportu masy na selektywność przebiegu reakcji złożonych w ukła-dach dwufazowych ciecz-ciecz. Badania prowadzono w reaktorach zbiornikowych, mieszalnikach typu ro-tor-stator i mikroreaktorach.Słowa kluczowe: mikromieszanie, transport masy, reakcje testowe
* Prof. PhD. Eng. Jerzy Bałdyga, PhD. Eng. Magdalena Jasińska, MSc. Eng. Justyna Trendowska, MSc. Eng. Wiktoria Tadeusiak, Faculty of Chemical and Process Engineering, Warsaw University of Technology.
** PhD. Mike Cooke, The University of Manchester.*** Prof. Adam Kowalski, Unilever Research & Development Port Sunlight.
12
1. Introduction
Chemical test reactions are usually applied in experiments designed either to validate models of mixing on the molecular scale (micromixing) or models of mass transfer in the case of the liquid-liquid two-phase systems. Once the models are validated they can be used together with test reactions to characterize local mixing conditions, energetic efficiency of mixing and mass transfer coefficients by experimental identification of the product distribu-tion. This means that they can be used to characterize reactors and mixing equipment from the point of view of interactions between mass transfer and chemical reactions. In this work we are interested in both: new test reactions to be applied in homogeneous and two-phase systems, and application of test reactions to study methodology for identification of process conditions that minimize creation of by-products.
The criteria for test reactions are presented in detail by Bałdyga and Bourne [1]. Such criteria were applied in present work to choose the new systems of 2 parallel, competitive test reactions.
In what follows we use several test reactions to study mixing. We start from systems of 2 parallel reactions in homogeneous systems to study mixing in the stirred tank, to discuss the rules of choosing such reactions, and validate the new system of test reactions by comparing their performance with performance of the old, validated system. Then the test reactions are applied to study mixing in microreactors and the rotor-stator mixers, and to characterize their energetic efficiency. Finally, a possibility to apply similar idea to study mass transfer in the two-phase liquid-liquid system is presented by using experiments.
2. Test reactions in a single phase system
2.1. Method for choosing test reactions and their application to study micromixing in the semibatch stirred tank reactor
There are many complex schemes of multiple reactions that can be used to character-ize mixing performance. They are usually made up of combination of two primary reaction types: competing or parallel, eq. (1) , and consecutive or series eq.(2):
The first reaction from both schemes of elementary test reactions should be fast enough to be controlled by mixing, the second one should be slower, so that there would be compe-tition between the mixing process controlling the first reaction and chemical kinetics con-trolling the second one. This can be checked using the time constant analysis [1]. Amount of the product of the second reaction that for ideal mixing on the molecular scale would be close to zero, stores the history of mixing and can be used to determine energetic efficiency of mixing. Such applications will be shown in what follows.
1 2, (1)k kA B R C B S+ → + →
1 2, (2)k kA B R R B S+ → + →
13
When choosing test reactions for homogeneous systems one should remember that all reactants and products should be soluble, the reactions should be irreversible and species concentrations easy to measure. Finally, the mechanisms and kinetics of test reactions must be fully known. A good example of such reacting system is competitive neutrali-zation of hydrochloric acid and alkaline hydrolysis of monochloroacetate methyl or ethyl esters of monochloroacetic acid [1]. Hence, in what follows in this section we use as ref-erence system the one given by eq. (1) with A = HCl, B = NaOH, C = CH2ClCOOC2H5, R = H2O or NaCl, S = C2H5OH or CH2ClCOONa and propose a new one, with C replaced by CHCl2COOC2H5 and thus S represented this time by CHCl2COONa. To compare both test systems and show possibilities of application of the new one, both experiments and simulations have been performed.
Experiments were carried out using the semibatch stirred tank reactor of diameter T = 145 mm, equipped with the Rushton type impeller of diameter D = 50 mm and 4 baf-fles of a width equal to 15 mm. The process was carried out in a semibatch manner with the base solution (B) fed to the tank containing initially the premixture of acid (A) and ester (C). The volume ratio of both solutions, a = VAC/VB, was equal either 10 or 50. The feeding time was long enough to eliminate effects of feeding rate (15 minutes). Diameter of feeding pipe was equal to 1mm and two feeding positions were used: the first one on the level of impel-ler z = 0, for the radial position r = 0.45 ∙ T/2 (position I close to the impeller), the second one was close to the liquid surface z = 1.3 ∙ T/2, r = 0.5 ∙ T/2 (position far from the impeller). The product distribution was represented by the ratio of number of reacted moles of the ester to the number of moles of the base (B), for NA = NB = NC.
Concentrations of esters before and after reaction were measured using HPLC (Perkin Elmer Series 200).
Simulations were carried out using the model of engulfment (E-model) of Bałdyga and Bourne [1] and the multi-zone model of the flow and dissipation of kinetic energy of turbulence (see pages 700-703 in [1] and [2]).
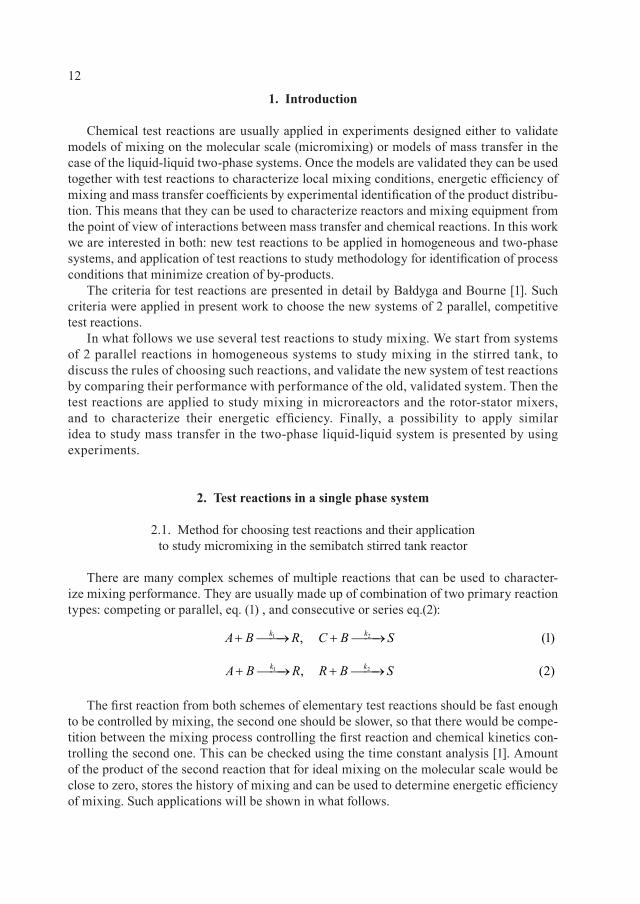
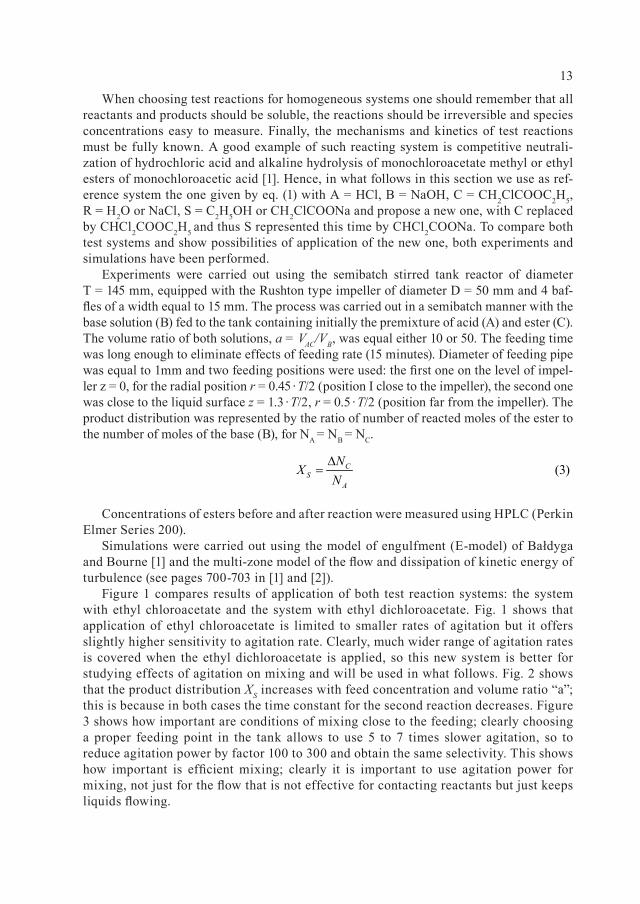
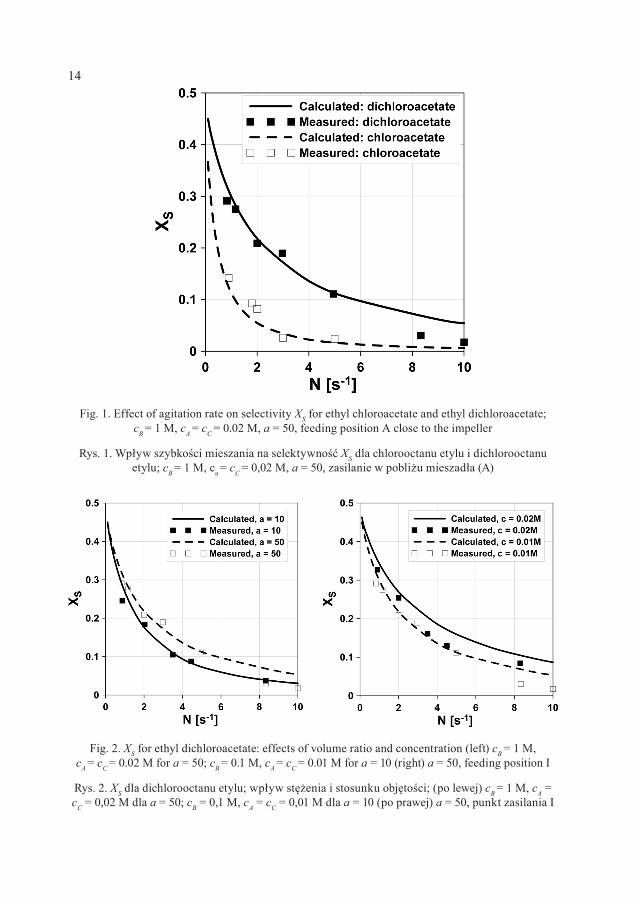
Figure 1 compares results of application of both test reaction systems: the system with ethyl chloroacetate and the system with ethyl dichloroacetate. Fig. 1 shows that application of ethyl chloroacetate is limited to smaller rates of agitation but it offers slightly higher sensitivity to agitation rate. Clearly, much wider range of agitation rates is covered when the ethyl dichloroacetate is applied, so this new system is better for studying effects of agitation on mixing and will be used in what follows. Fig. 2 shows that the product distribution XS increases with feed concentration and volume ratio “a”; this is because in both cases the time constant for the second reaction decreases. Figure 3 shows how important are conditions of mixing close to the feeding; clearly choosing a proper feeding point in the tank allows to use 5 to 7 times slower agitation, so to reduce agitation power by factor 100 to 300 and obtain the same selectivity. This shows how important is efficient mixing; clearly it is important to use agitation power for mixing, not just for the flow that is not effective for contacting reactants but just keeps liquids flowing.
(3)CS
A
NX
N∆
=
14
Fig. 1. Effect of agitation rate on selectivity XS for ethyl chloroacetate and ethyl dichloroacetate; cB = 1 M, cA = cC = 0.02 M, a = 50, feeding position A close to the impeller
Rys. 1. Wpływ szybkości mieszania na selektywność XS dla chlorooctanu etylu i dichlorooctanu etylu; cB = 1 M, ca = cC = 0,02 M, a = 50, zasilanie w pobliżu mieszadła (A)
Fig. 2. XS for ethyl dichloroacetate: effects of volume ratio and concentration (left) cB = 1 M, cA = cC = 0.02 M for a = 50; cB = 0.1 M, cA = cC = 0.01 M for a = 10 (right) a = 50, feeding position I
Rys. 2. XS dla dichlorooctanu etylu; wpływ stężenia i stosunku objętości; (po lewej) cB = 1 M, cA = cC = 0,02 M dla a = 50; cB = 0,1 M, cA = cC = 0,01 M dla a = 10 (po prawej) a = 50, punkt zasilania I
15
2.2. Efficiency of mixing in micoreactors and rotor-stator mixers
The problem of effective mixing on micro-scale and related problem of construction of micro-mixers have been considered in recent publication [4]. Consider the process of mix-ing between elongated slabs. Extent of mixing can be represented by the rate of creation of the intermaterial area per unit volume, av [m
2 / m3], and expressed using the local value of de-formation tensor D and efficiency of mixing eff (t) [3]:
Eq.(4) shows directly that orientation of the intermaterial area with respect to the princi-ple axes of deformation determines effectiveness of mixing. Indirectly it represents the root square of the ratio of energy that is really necessary to increase intermaterial area to the to-tal energy dissipated during the flow. Substituting for (D : D)1/2 = (ɛT/(3v))1/2
[4] we get:
where ɛT represents the total energy used in the process, and av-1 ∙ dav/dt can be expressed
using the minimum value of energy that can be used to obtain the same effect of mixing. To this end we will use the E-model and related rate of energy dissipation. This method we have used to compare performance of serpentine and meander micromixers. More strict
Fig. 3. XS for ethyl ethyl dichloroacetate; cB = 0.5 M, cA = cC = 0.01 M, a = 50, effect of feeding position
Rys. 3. XS dla dichlorooctanu etylu; cB = 0,5 M, cA = cC = 0,01 M, a = 50, wpływ miejsca zasilania
(3)CS
A
NX
N∆
=
1/21( ) (5)3
v T
v
daeff t
a dt v
−ε =
16
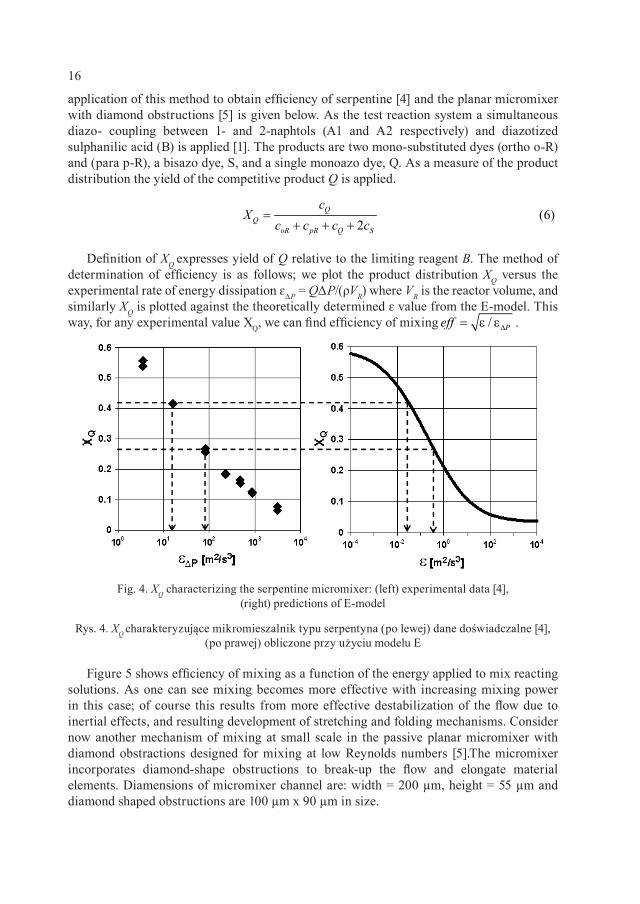
application of this method to obtain efficiency of serpentine [4] and the planar micromixer with diamond obstructions [5] is given below. As the test reaction system a simultaneous diazo- coupling between 1- and 2-naphtols (A1 and A2 respectively) and diazotized sulphanilic acid (B) is applied [1]. The products are two mono-substituted dyes (ortho o-R) and (para p-R), a bisazo dye, S, and a single monoazo dye, Q. As a measure of the product distribution the yield of the competitive product Q is applied.
Definition of XQ expresses yield of Q relative to the limiting reagent B. The method of determination of efficiency is as follows; we plot the product distribution XQ versus the experimental rate of energy dissipation ɛΔP = QΔP/(ρVR) where VR is the reactor volume, and similarly XQ is plotted against the theoretically determined ɛ value from the E-model. This way, for any experimental value XQ, we can find efficiency of mixing .
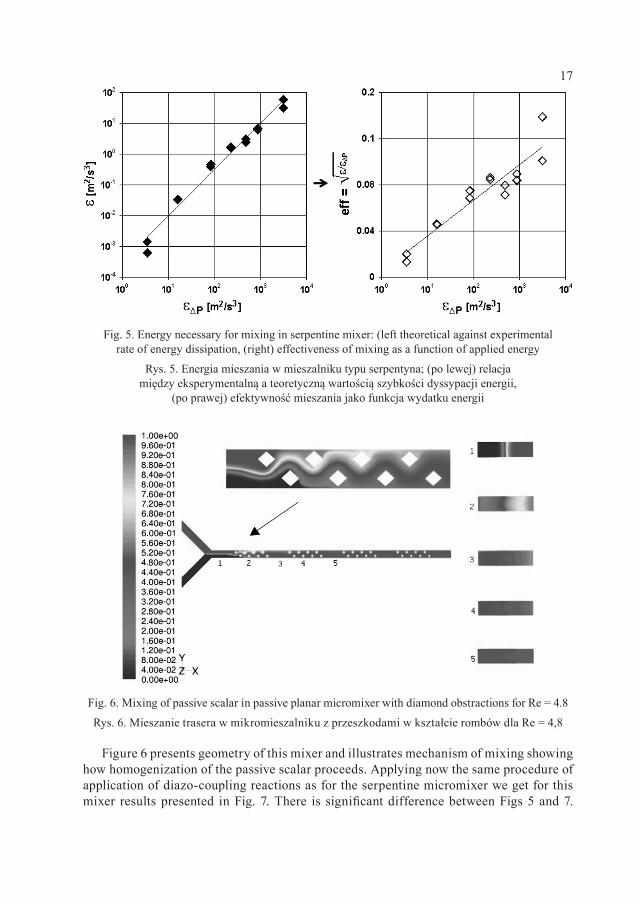
Figure 5 shows efficiency of mixing as a function of the energy applied to mix reacting solutions. As one can see mixing becomes more effective with increasing mixing power in this case; of course this results from more effective destabilization of the flow due to inertial effects, and resulting development of stretching and folding mechanisms. Consider now another mechanism of mixing at small scale in the passive planar micromixer with diamond obstractions designed for mixing at low Reynolds numbers [5].The micromixer incorporates diamond-shape obstructions to break-up the flow and elongate material elements. Diamensions of micromixer channel are: width = 200 µm, height = 55 µm and diamond shaped obstructions are 100 µm x 90 µm in size.
(6)2
oR pR Q S
cX
c c c c=
+ + +
/ Peff ∆= ε ε
Fig. 4. XQ characterizing the serpentine micromixer: (left) experimental data [4], (right) predictions of E-model
Rys. 4. XQ charakteryzujące mikromieszalnik typu serpentyna (po lewej) dane doświadczalne [4], (po prawej) obliczone przy użyciu modelu E
17
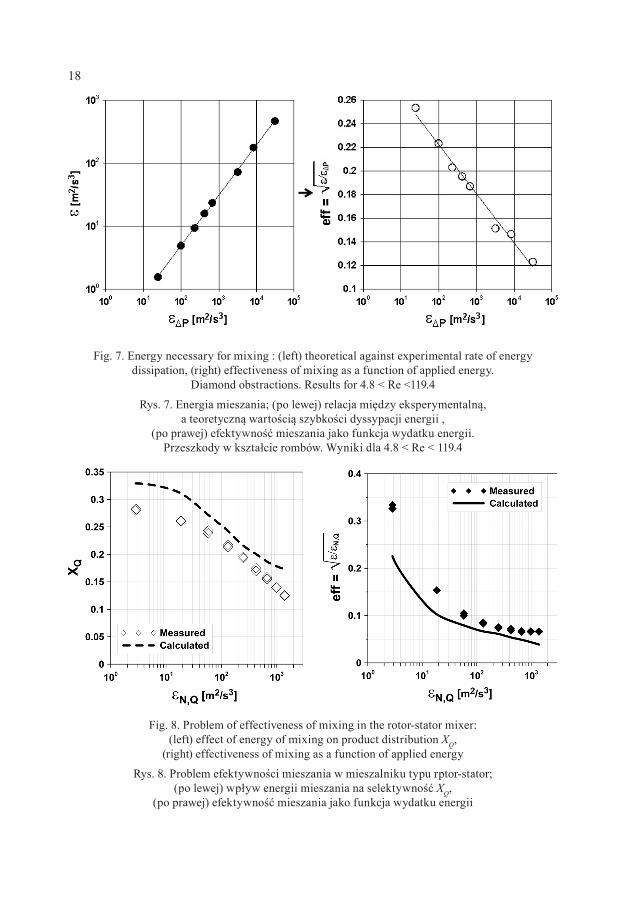
Figure 6 presents geometry of this mixer and illustrates mechanism of mixing showing how homogenization of the passive scalar proceeds. Applying now the same procedure of application of diazo-coupling reactions as for the serpentine micromixer we get for this mixer results presented in Fig. 7. There is significant difference between Figs 5 and 7.
Fig. 5. Energy necessary for mixing in serpentine mixer: (left theoretical against experimental rate of energy dissipation, (right) effectiveness of mixing as a function of applied energy
Rys. 5. Energia mieszania w mieszalniku typu serpentyna; (po lewej) relacja między eksperymentalną a teoretyczną wartością szybkości dyssypacji energii,
(po prawej) efektywność mieszania jako funkcja wydatku energii
Fig. 6. Mixing of passive scalar in passive planar micromixer with diamond obstractions for Re = 4.8
Rys. 6. Mieszanie trasera w mikromieszalniku z przeszkodami w kształcie rombów dla Re = 4,8
18
Fig. 7. Energy necessary for mixing : (left) theoretical against experimental rate of energy dissipation, (right) effectiveness of mixing as a function of applied energy.
Diamond obstractions. Results for 4.8 < Re <119.4
Rys. 7. Energia mieszania; (po lewej) relacja między eksperymentalną, a teoretyczną wartością szybkości dyssypacji energii ,
(po prawej) efektywność mieszania jako funkcja wydatku energii. Przeszkody w kształcie rombów. Wyniki dla 4.8 < Re < 119.4
Fig. 8. Problem of effectiveness of mixing in the rotor-stator mixer: (left) effect of energy of mixing on product distribution XQ,
(right) effectiveness of mixing as a function of applied energy
Rys. 8. Problem efektywności mieszania w mieszalniku typu rptor-stator; (po lewej) wpływ energii mieszania na selektywność XQ,
(po prawej) efektywność mieszania jako funkcja wydatku energii
19
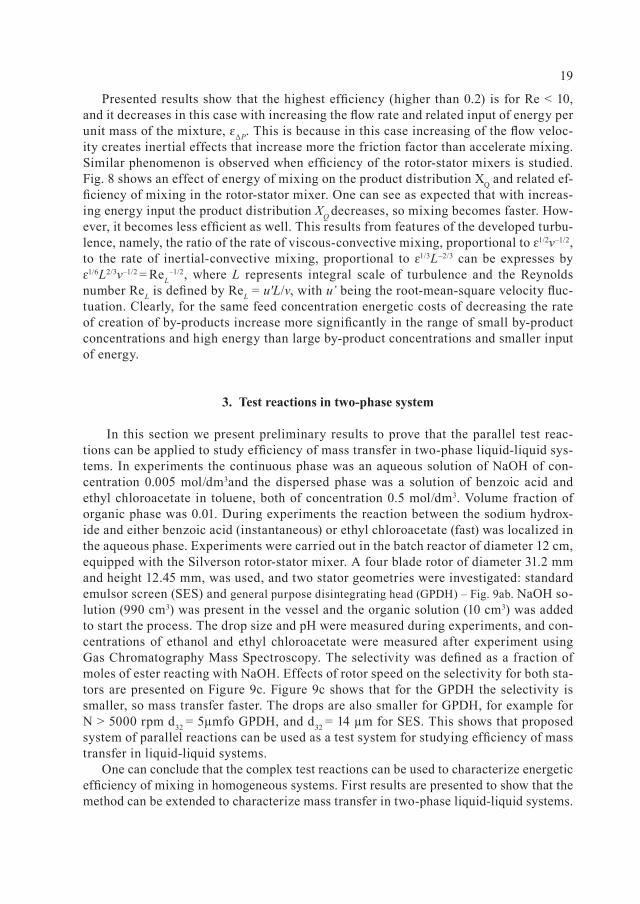
Presented results show that the highest efficiency (higher than 0.2) is for Re < 10, and it decreases in this case with increasing the flow rate and related input of energy per unit mass of the mixture, ɛΔP. This is because in this case increasing of the flow veloc-ity creates inertial effects that increase more the friction factor than accelerate mixing. Similar phenomenon is observed when efficiency of the rotor-stator mixers is studied. Fig. 8 shows an effect of energy of mixing on the product distribution XQ and related ef-ficiency of mixing in the rotor-stator mixer. One can see as expected that with increas-ing energy input the product distribution XQ decreases, so mixing becomes faster. How-ever, it becomes less efficient as well. This results from features of the developed turbu-lence, namely, the ratio of the rate of viscous-convective mixing, proportional to ɛ1/2v–1/2, to the rate of inertial-convective mixing, proportional to ɛ1/3L–2/3 can be expresses by ɛ1/6L2/3v–1/2 = ReL
–1/2, where L represents integral scale of turbulence and the Reynolds number ReL is defined by ReL = u'L/v, with u’ being the root-mean-square velocity fluc-tuation. Clearly, for the same feed concentration energetic costs of decreasing the rate of creation of by-products increase more significantly in the range of small by-product concentrations and high energy than large by-product concentrations and smaller input of energy.
3. Test reactions in two-phase system
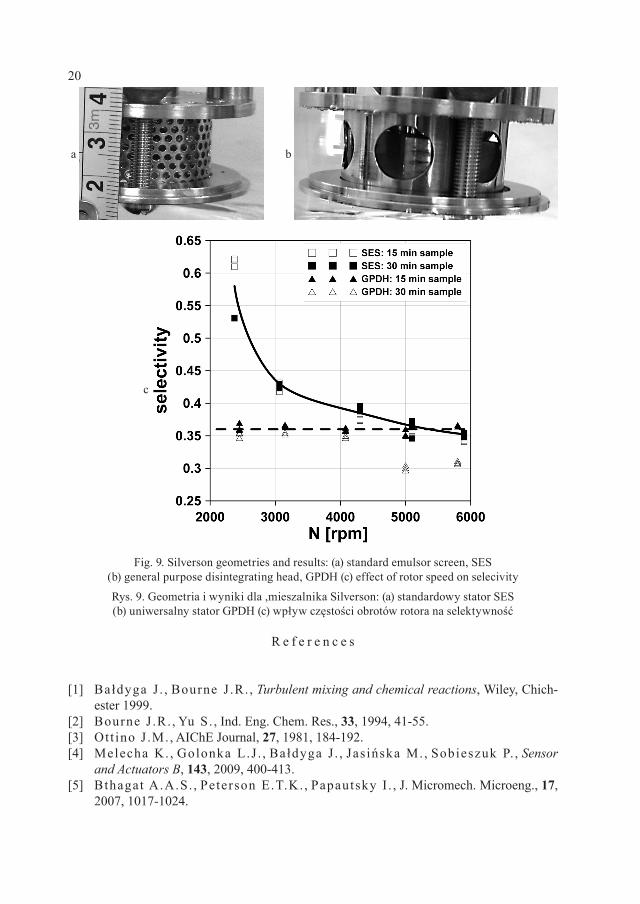
In this section we present preliminary results to prove that the parallel test reac-tions can be applied to study efficiency of mass transfer in two-phase liquid-liquid sys-tems. In experiments the continuous phase was an aqueous solution of NaOH of con-centration 0.005 mol/dm3and the dispersed phase was a solution of benzoic acid and ethyl chloroacetate in toluene, both of concentration 0.5 mol/dm3. Volume fraction of organic phase was 0.01. During experiments the reaction between the sodium hydrox-ide and either benzoic acid (instantaneous) or ethyl chloroacetate (fast) was localized in the aqueous phase. Experiments were carried out in the batch reactor of diameter 12 cm, equipped with the Silverson rotor-stator mixer. A four blade rotor of diameter 31.2 mm and height 12.45 mm, was used, and two stator geometries were investigated: standard emulsor screen (SES) and general purpose disintegrating head (GPDH) – Fig. 9ab. NaOH so-lution (990 cm3) was present in the vessel and the organic solution (10 cm3) was added to start the process. The drop size and pH were measured during experiments, and con-centrations of ethanol and ethyl chloroacetate were measured after experiment using Gas Chromatography Mass Spectroscopy. The selectivity was defined as a fraction of moles of ester reacting with NaOH. Effects of rotor speed on the selectivity for both sta-tors are presented on Figure 9c. Figure 9c shows that for the GPDH the selectivity is smaller, so mass transfer faster. The drops are also smaller for GPDH, for example for N > 5000 rpm d32 = 5µmfo GPDH, and d32 = 14 µm for SES. This shows that proposed system of parallel reactions can be used as a test system for studying efficiency of mass transfer in liquid-liquid systems.
One can conclude that the complex test reactions can be used to characterize energetic efficiency of mixing in homogeneous systems. First results are presented to show that the method can be extended to characterize mass transfer in two-phase liquid-liquid systems.
20
R e f e r e n c e s
[1] Bałdyga J . , Bourne J .R. , Turbulent mixing and chemical reactions, Wiley, Chich-
ester 1999.[2] Bourne J .R. , Yu S. , Ind. Eng. Chem. Res., 33, 1994, 41-55.[3] Ottino J .M., AIChE Journal, 27, 1981, 184-192.[4] Melecha K. , Golonka L.J . , Bałdyga J . , Jas ińska M., Sobieszuk P. , Sensor
and Actuators B, 143, 2009, 400-413.[5] Bthagat A.A.S. , Peterson E.T.K. , Papautsky I . , J. Micromech. Microeng., 17,
2007, 1017-1024.
Fig. 9. Silverson geometries and results: (a) standard emulsor screen, SES (b) general purpose disintegrating head, GPDH (c) effect of rotor speed on selecivity
Rys. 9. Geometria i wyniki dla ,mieszalnika Silverson: (a) standardowy stator SES (b) uniwersalny stator GPDH (c) wpływ częstości obrotów rotora na selektywność
a b
c

LUTZ BÖHM, MATTHIAS KRAUME*,1
HYDRODYNAMIC INVESTIGATION OF SINGLE BUBBLES
HYDRODYNAMICZNE BADANIE POJEDYNCZYCH PĘCHERZYKÓW
A b s t r a c t
The presented work shows the results of fundamental fluid dynamical investigations of the rise of single bub-bles in a rectangular channel with a channel depth in the range of the equivalent bubble diameter. A fully au-tomatized experimental rig was built so that for each parameter combination, (parameters: channel depth, the bubble size and the liquid velocity) at least 1000 single bubble rises were realized. The Electrodiffusion Me-thod (EDM) was used to measure the shear stress on the wall. The maximum shear stress and the range of she-ar stress fluctuations are analyzed. Additionally fundamental investigations of the bubble behavior were per-formed with Particle Image Velocimetry (PIV). A comparison to CFD results from literature is done.Keywords: bubble, Electrodiffusion Method, Particle Image Velocimetry, shear stress
S t r e s z c z e n i e
Artykuł niniejszy prezentuje wyniki podstawowych badań nad dynamiką płynów przy wzroście pojedynczych pęcherzyków w kanale prostokątnym z głębokością kanału w zakresie równoważnej średnicy pęcherzyka. W pełni zautomatyzowany sprzęt doświadczalny zbudowano w taki sposób, by dla każdej kombinacji parametrów (parametry: głębokość kanału, wielkość pęcherzyka i prędkość cieczy) powstało co najmniej tysiąc pojedynczych pęcherzyków. Do pomiaru naprężenia stycznego na ściance zastosowano metodę elektrodyfuzyjna (EDM). Przeanalizowano maksymalne naprężenie styczne i zakres jego wahań. Dodatkowo przeprowadzono podstawowe badania nad zachowaniem pęcherzyków z pomiarem prędkości obrazu cząsteczki (PIV). Porównano też znane z literatury wyniki CFD.Słowa kluczowe: pęcherzyk, metoda elektrodyfuzyjna, pomiar prędkości obrazu cząsteczki, naprężenie styczne
* Lutz Böhm, Prof. PhD. Eng. Matthias Kraume, Chair of Chemical and Process Engineering, TU Berlin.
22
1. Introduction
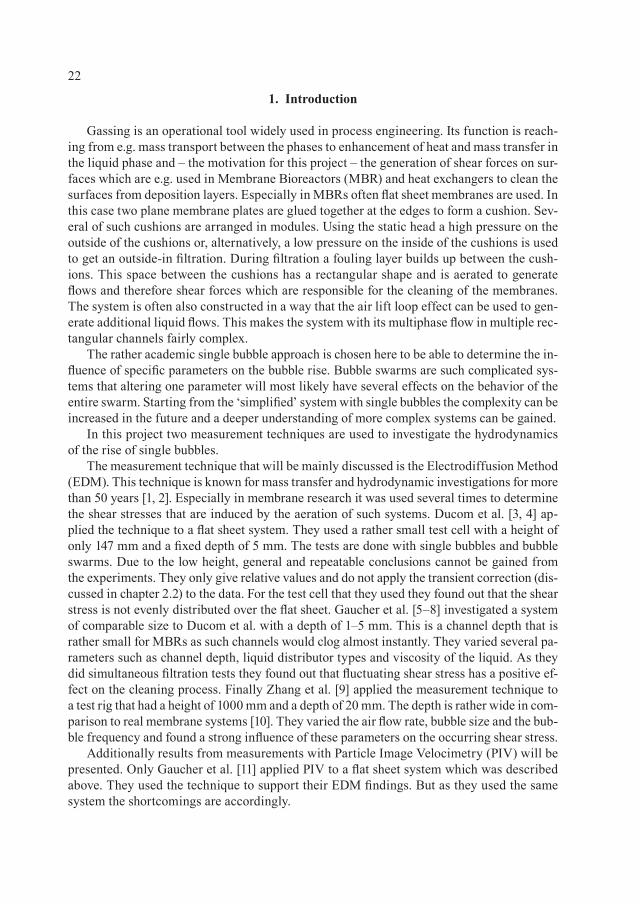
Gassing is an operational tool widely used in process engineering. Its function is reach-ing from e.g. mass transport between the phases to enhancement of heat and mass transfer in the liquid phase and – the motivation for this project – the generation of shear forces on sur-faces which are e.g. used in Membrane Bioreactors (MBR) and heat exchangers to clean the surfaces from deposition layers. Especially in MBRs often flat sheet membranes are used. In this case two plane membrane plates are glued together at the edges to form a cushion. Sev-eral of such cushions are arranged in modules. Using the static head a high pressure on the outside of the cushions or, alternatively, a low pressure on the inside of the cushions is used to get an outside-in filtration. During filtration a fouling layer builds up between the cush-ions. This space between the cushions has a rectangular shape and is aerated to generate flows and therefore shear forces which are responsible for the cleaning of the membranes. The system is often also constructed in a way that the air lift loop effect can be used to gen-erate additional liquid flows. This makes the system with its multiphase flow in multiple rec-tangular channels fairly complex.
The rather academic single bubble approach is chosen here to be able to determine the in-fluence of specific parameters on the bubble rise. Bubble swarms are such complicated sys-tems that altering one parameter will most likely have several effects on the behavior of the entire swarm. Starting from the ‘simplified’ system with single bubbles the complexity can be increased in the future and a deeper understanding of more complex systems can be gained.
In this project two measurement techniques are used to investigate the hydrodynamics of the rise of single bubbles.
The measurement technique that will be mainly discussed is the Electrodiffusion Method (EDM). This technique is known for mass transfer and hydrodynamic investigations for more than 50 years [1, 2]. Especially in membrane research it was used several times to determine the shear stresses that are induced by the aeration of such systems. Ducom et al. [3, 4] ap-plied the technique to a flat sheet system. They used a rather small test cell with a height of only 147 mm and a fixed depth of 5 mm. The tests are done with single bubbles and bubble swarms. Due to the low height, general and repeatable conclusions cannot be gained from the experiments. They only give relative values and do not apply the transient correction (dis-cussed in chapter 2.2) to the data. For the test cell that they used they found out that the shear stress is not evenly distributed over the flat sheet. Gaucher et al. [5–8] investigated a system of comparable size to Ducom et al. with a depth of 1–5 mm. This is a channel depth that is rather small for MBRs as such channels would clog almost instantly. They varied several pa-rameters such as channel depth, liquid distributor types and viscosity of the liquid. As they did simultaneous filtration tests they found out that fluctuating shear stress has a positive ef-fect on the cleaning process. Finally Zhang et al. [9] applied the measurement technique to a test rig that had a height of 1000 mm and a depth of 20 mm. The depth is rather wide in com-parison to real membrane systems [10]. They varied the air flow rate, bubble size and the bub-ble frequency and found a strong influence of these parameters on the occurring shear stress.
Additionally results from measurements with Particle Image Velocimetry (PIV) will be presented. Only Gaucher et al. [11] applied PIV to a flat sheet system which was described above. They used the technique to support their EDM findings. But as they used the same system the shortcomings are accordingly.
23
Although numerous investigations about single bubble and bubble swarm behavior are apparent in the literature as shown above, to the knowledge of the author, no fundamental investigation can be found for single bubbles rising in rectangular channels with a channel height that ensures steady conditions, a channel depth of 3–10 mm and an equivalent bubble diameter in the same range which both is the case in flat sheet membrane modules.
2. Materials and Methods
2.1. Apparatus
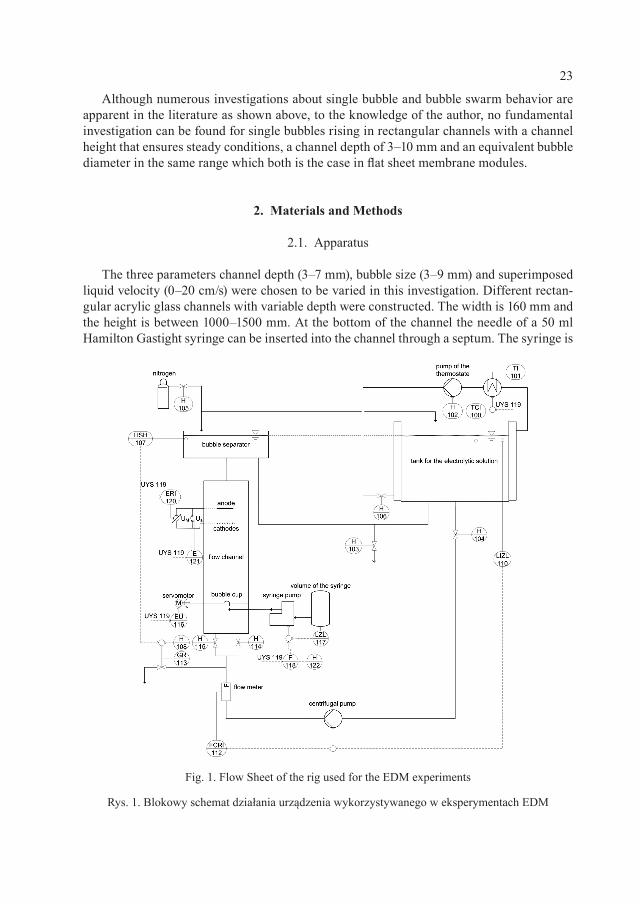
The three parameters channel depth (3–7 mm), bubble size (3–9 mm) and superimposed liquid velocity (0–20 cm/s) were chosen to be varied in this investigation. Different rectan-gular acrylic glass channels with variable depth were constructed. The width is 160 mm and the height is between 1000–1500 mm. At the bottom of the channel the needle of a 50 ml Hamilton Gastight syringe can be inserted into the channel through a septum. The syringe is
Fig. 1. Flow Sheet of the rig used for the EDM experiments
Rys. 1. Blokowy schemat działania urządzenia wykorzystywanego w eksperymentach EDM
24
operated with a Harvard Apparatus Pump 11 Elite syringe pump which injects a specific vol-ume of gas into a small cup which is fixed on a rotatable rod. This rotatable rod can be turned with a servo motor which again is located outside of the channel. Additionally inlets are lo-cated at the bottom of the channel through which liquid can be pumped with a defined vol-ume flow. The system is automated with LabView so that the whole process of establishing a defined liquid volume flow, inserting a bubble, releasing a bubble and recording the meas-urement data works autonomic (Fig. 1). The automation is necessary to generate the amount of data necessary for the statistical analysis. Especially for the EDM approximately 1000 sin-gle bubble rises were recorded for each parameter combination to get statistically relevant re-sults. For the PIV measurement not such a high number of single bubble rises are necessary but the automation allows a high-level repeatability which simplifies the analysis of the data. It is worth mentioning that the PIV experiments were done in new channels with fixed depths of 5 and 7 mm. These channels have a much better optical accessibility in comparison to the channels used for the EDM tests. Besides this the systems are basically the same.
2.2. Electrodiffusion Method
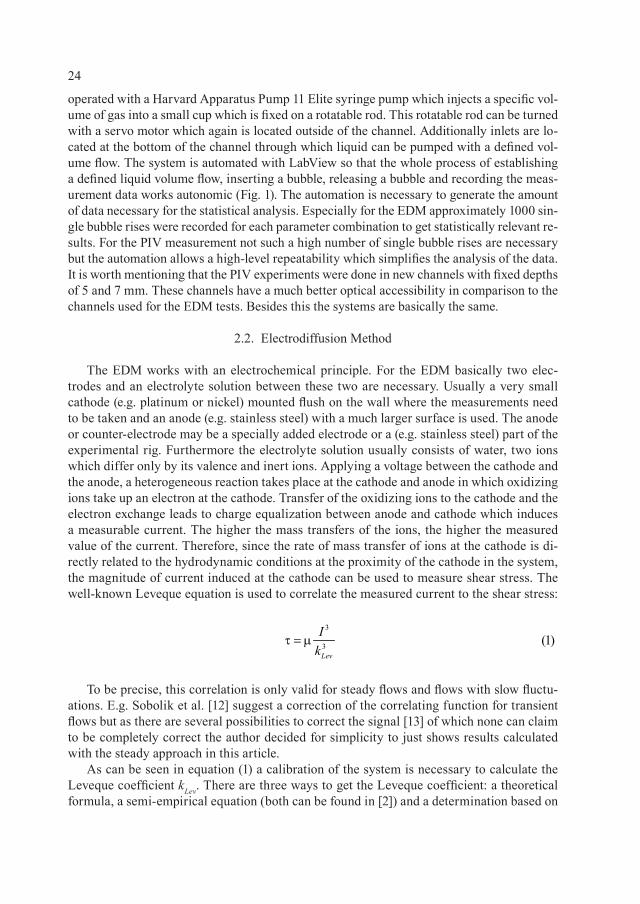
The EDM works with an electrochemical principle. For the EDM basically two elec-trodes and an electrolyte solution between these two are necessary. Usually a very small cathode (e.g. platinum or nickel) mounted flush on the wall where the measurements need to be taken and an anode (e.g. stainless steel) with a much larger surface is used. The anode or counter-electrode may be a specially added electrode or a (e.g. stainless steel) part of the experimental rig. Furthermore the electrolyte solution usually consists of water, two ions which differ only by its valence and inert ions. Applying a voltage between the cathode and the anode, a heterogeneous reaction takes place at the cathode and anode in which oxidizing ions take up an electron at the cathode. Transfer of the oxidizing ions to the cathode and the electron exchange leads to charge equalization between anode and cathode which induces a measurable current. The higher the mass transfers of the ions, the higher the measured value of the current. Therefore, since the rate of mass transfer of ions at the cathode is di-rectly related to the hydrodynamic conditions at the proximity of the cathode in the system, the magnitude of current induced at the cathode can be used to measure shear stress. The well-known Leveque equation is used to correlate the measured current to the shear stress:
To be precise, this correlation is only valid for steady flows and flows with slow fluctu-ations. E.g. Sobolik et al. [12] suggest a correction of the correlating function for transient flows but as there are several possibilities to correct the signal [13] of which none can claim to be completely correct the author decided for simplicity to just shows results calculated with the steady approach in this article.
As can be seen in equation (1) a calibration of the system is necessary to calculate the Leveque coefficient kLev. There are three ways to get the Leveque coefficient: a theoretical formula, a semi-empirical equation (both can be found in [2]) and a determination based on
3
3 (1)Lev
Ik
τ = µ
25
an experimental calibration. The first two are both rather unreliable as system parameters such as electrode size and ion concentration are part of the equations which can’t be deter-mined precisely. For the experimental calibration a known shear rate needs to be established at the electrodes which can be correlated to the measured current with the help of equa-tion (1). As the Leveque coefficient changes over time due to e.g. temperature or ion con-centration changes in the electrolyte solution, if possible this should be done consecutively. For the parameter combinations with liquid velocity this was included in the analysis of the data. For every single bubble rise event data was recorded when the bubble didn’t influence the flow and the Leveque coefficient for every single run and every single electrode (there are 8 electrodes in the system arranged horizontally in the channel) was calculated and used for the analysis of the data that was influenced by the bubble. For the parameter combina-tions without liquid velocity this ongoing calibration was not possible. Therefore averaged values of experiments with liquid velocity were used as Leveque coefficients as the values were fairly constant over the duration of the parameter study.
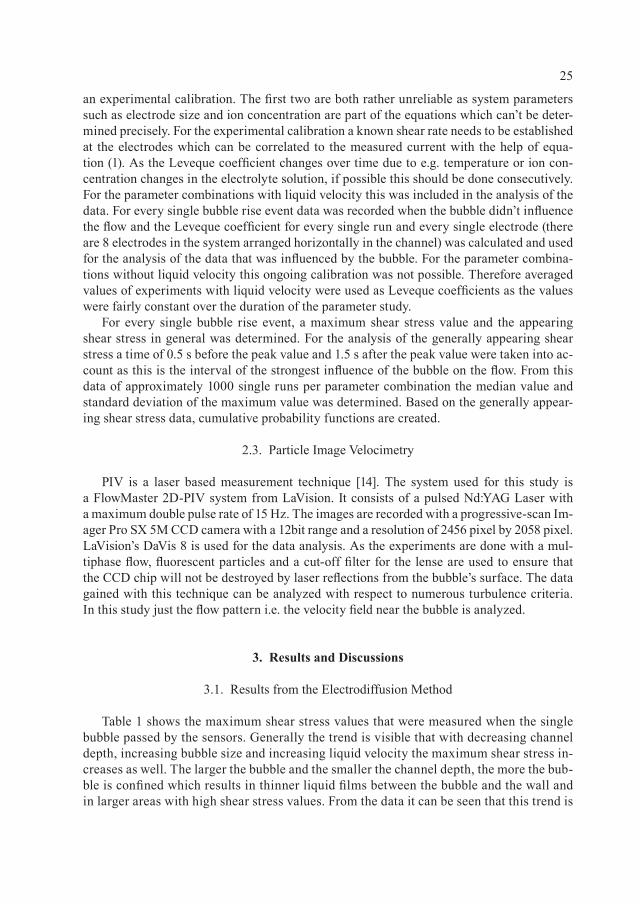
For every single bubble rise event, a maximum shear stress value and the appearing shear stress in general was determined. For the analysis of the generally appearing shear stress a time of 0.5 s before the peak value and 1.5 s after the peak value were taken into ac-count as this is the interval of the strongest influence of the bubble on the flow. From this data of approximately 1000 single runs per parameter combination the median value and standard deviation of the maximum value was determined. Based on the generally appear-ing shear stress data, cumulative probability functions are created.
2.3. Particle Image Velocimetry
PIV is a laser based measurement technique [14]. The system used for this study is a FlowMaster 2D-PIV system from LaVision. It consists of a pulsed Nd:YAG Laser with a maximum double pulse rate of 15 Hz. The images are recorded with a progressive-scan Im-ager Pro SX 5M CCD camera with a 12bit range and a resolution of 2456 pixel by 2058 pixel. LaVision’s DaVis 8 is used for the data analysis. As the experiments are done with a mul-tiphase flow, fluorescent particles and a cut-off filter for the lense are used to ensure that the CCD chip will not be destroyed by laser reflections from the bubble’s surface. The data gained with this technique can be analyzed with respect to numerous turbulence criteria. In this study just the flow pattern i.e. the velocity field near the bubble is analyzed.
3. Results and Discussions
3.1. Results from the Electrodiffusion Method
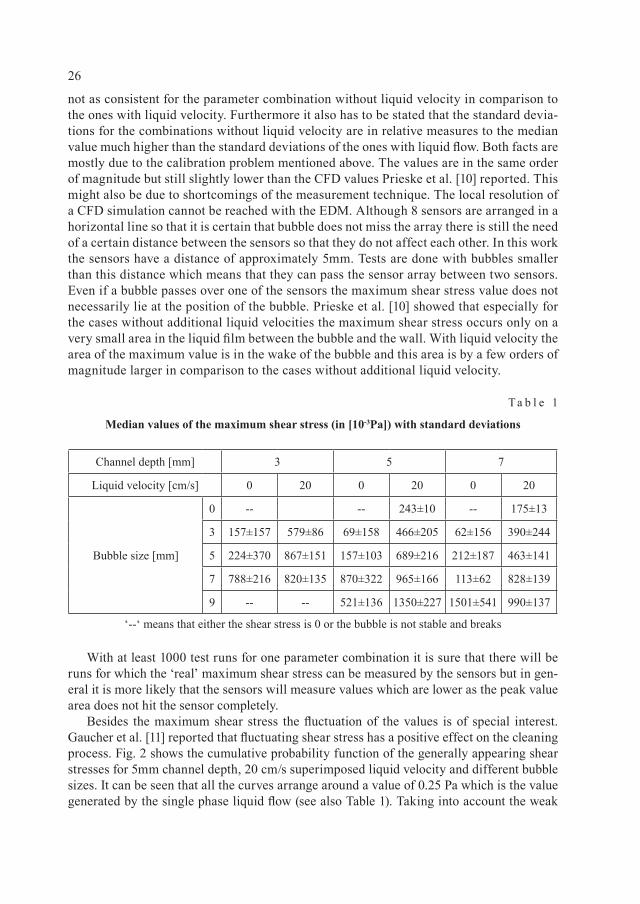
Table 1 shows the maximum shear stress values that were measured when the single bubble passed by the sensors. Generally the trend is visible that with decreasing channel depth, increasing bubble size and increasing liquid velocity the maximum shear stress in-creases as well. The larger the bubble and the smaller the channel depth, the more the bub-ble is confined which results in thinner liquid films between the bubble and the wall and in larger areas with high shear stress values. From the data it can be seen that this trend is
26
not as consistent for the parameter combination without liquid velocity in comparison to the ones with liquid velocity. Furthermore it also has to be stated that the standard devia-tions for the combinations without liquid velocity are in relative measures to the median value much higher than the standard deviations of the ones with liquid flow. Both facts are mostly due to the calibration problem mentioned above. The values are in the same order of magnitude but still slightly lower than the CFD values Prieske et al. [10] reported. This might also be due to shortcomings of the measurement technique. The local resolution of a CFD simulation cannot be reached with the EDM. Although 8 sensors are arranged in a horizontal line so that it is certain that bubble does not miss the array there is still the need of a certain distance between the sensors so that they do not affect each other. In this work the sensors have a distance of approximately 5mm. Tests are done with bubbles smaller than this distance which means that they can pass the sensor array between two sensors. Even if a bubble passes over one of the sensors the maximum shear stress value does not necessarily lie at the position of the bubble. Prieske et al. [10] showed that especially for the cases without additional liquid velocities the maximum shear stress occurs only on a very small area in the liquid film between the bubble and the wall. With liquid velocity the area of the maximum value is in the wake of the bubble and this area is by a few orders of magnitude larger in comparison to the cases without additional liquid velocity.
T a b l e 1
Median values of the maximum shear stress (in [10-3Pa]) with standard deviations
Channel depth [mm] 3 5 7
Liquid velocity [cm/s] 0 20 0 20 0 20
Bubble size [mm]
0 -- -- 243±10 -- 175±13
3 157±157 579±86 69±158 466±205 62±156 390±244
5 224±370 867±151 157±103 689±216 212±187 463±141
7 788±216 820±135 870±322 965±166 113±62 828±139
9 -- -- 521±136 1350±227 1501±541 990±137
‘--‘ means that either the shear stress is 0 or the bubble is not stable and breaks
With at least 1000 test runs for one parameter combination it is sure that there will be runs for which the ‘real’ maximum shear stress can be measured by the sensors but in gen-eral it is more likely that the sensors will measure values which are lower as the peak value area does not hit the sensor completely.
Besides the maximum shear stress the fluctuation of the values is of special interest. Gaucher et al. [11] reported that fluctuating shear stress has a positive effect on the cleaning process. Fig. 2 shows the cumulative probability function of the generally appearing shear stresses for 5mm channel depth, 20 cm/s superimposed liquid velocity and different bubble sizes. It can be seen that all the curves arrange around a value of 0.25 Pa which is the value generated by the single phase liquid flow (see also Table 1). Taking into account the weak
27
fluctuation of 0.01 Pa for single phase flows, basically all shear stress values outside of the range of 0.25±0.01 Pa are due to the flows generated by the bubble. As expected, the diagram illustrates that with increasing bubble size the shear stress range increases. Taking 10% and 90% as the probability limits, the range increases from 0.23–0.26 Pa for a 3 mm bub-ble to 0.23–0.30 Pa for a 5mm bubble to 0.23–0.38 Pa for a 7 mm bubble and 0.23–0.45 Pa for a 9 mm bubble. As mentioned before, this can be explained by the simple fact that the larger the bubble, the larger the area that is affected by its generated pseudo-turbulence.
3.2. Results from Particle Image Velocimetry
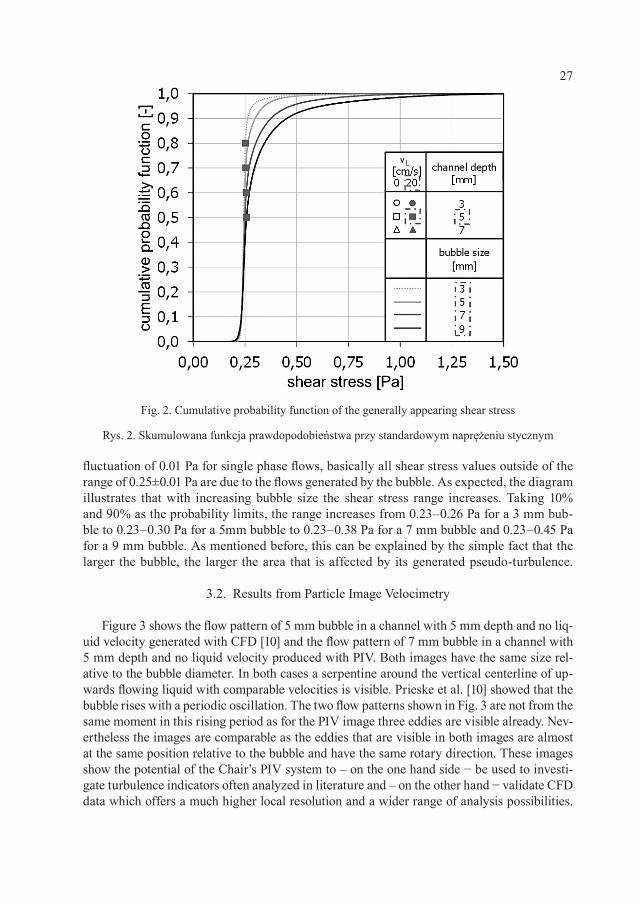
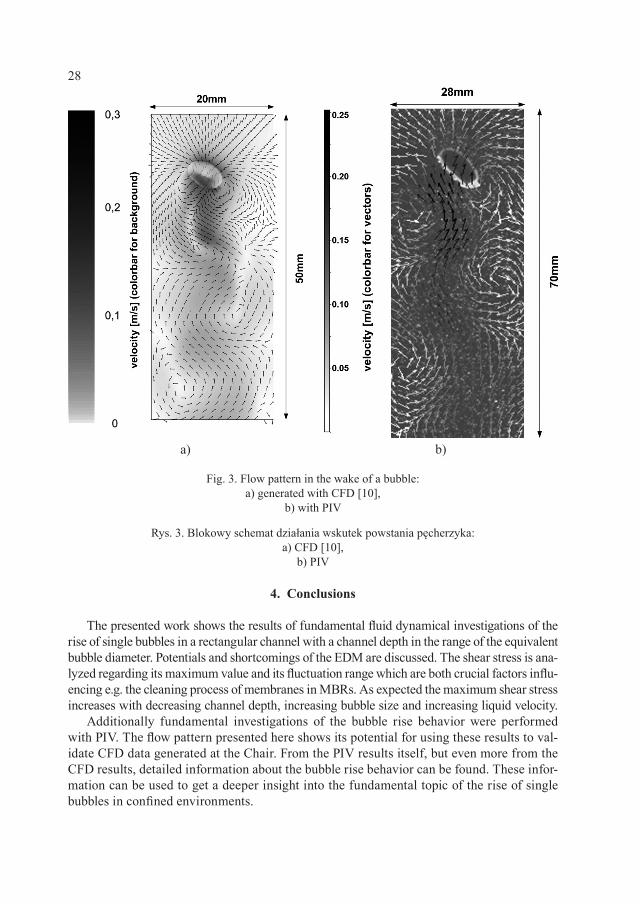
Figure 3 shows the flow pattern of 5 mm bubble in a channel with 5 mm depth and no liq-uid velocity generated with CFD [10] and the flow pattern of 7 mm bubble in a channel with 5 mm depth and no liquid velocity produced with PIV. Both images have the same size rel-ative to the bubble diameter. In both cases a serpentine around the vertical centerline of up-wards flowing liquid with comparable velocities is visible. Prieske et al. [10] showed that the bubble rises with a periodic oscillation. The two flow patterns shown in Fig. 3 are not from the same moment in this rising period as for the PIV image three eddies are visible already. Nev-ertheless the images are comparable as the eddies that are visible in both images are almost at the same position relative to the bubble and have the same rotary direction. These images show the potential of the Chair’s PIV system to – on the one hand side − be used to investi-gate turbulence indicators often analyzed in literature and – on the other hand − validate CFD data which offers a much higher local resolution and a wider range of analysis possibilities.
Fig. 2. Cumulative probability function of the generally appearing shear stress
Rys. 2. Skumulowana funkcja prawdopodobieństwa przy standardowym naprężeniu stycznym
28
4. Conclusions
The presented work shows the results of fundamental fluid dynamical investigations of the rise of single bubbles in a rectangular channel with a channel depth in the range of the equivalent bubble diameter. Potentials and shortcomings of the EDM are discussed. The shear stress is ana-lyzed regarding its maximum value and its fluctuation range which are both crucial factors influ-encing e.g. the cleaning process of membranes in MBRs. As expected the maximum shear stress increases with decreasing channel depth, increasing bubble size and increasing liquid velocity.
Additionally fundamental investigations of the bubble rise behavior were performed with PIV. The flow pattern presented here shows its potential for using these results to val-idate CFD data generated at the Chair. From the PIV results itself, but even more from the CFD results, detailed information about the bubble rise behavior can be found. These infor-mation can be used to get a deeper insight into the fundamental topic of the rise of single bubbles in confined environments.
Fig. 3. Flow pattern in the wake of a bubble: a) generated with CFD [10],
b) with PIV
Rys. 3. Blokowy schemat działania wskutek powstania pęcherzyka: a) CFD [10],
b) PIV
a) b)
29
S y m b o l s
I − current [A]kLev − Leveque coefficient [s-1A-3]
– dynamic viscosity [Pa s] – shear stress [Pa]
This work was financially supported by DAAD D/10/46059, DFG KR 1639/18-1 and DFG SFB/TR63 inPROMPT. During the experiments I was supported by Alexander Fleck, Tim Karsten, Nikolay Kolev, Jan-Paul Ruiken and Eva Lenhart.
R e f e r e n c e s
[1] Reiss L.P. , Hanrat ty T.J . , AIChE J., 8, 1962, 245-247.[2] Sobol ik V. , Tihon J . , Wein O. , Wichter le K. , J. Appl. Electrochem., 28, 1998,
329-335.[3] Ducom G., Puech F.-P. , Cabassud C. , Desalination, 145, 2002, 97-102.[4] Ducom G., Puech F.-P. , Cabassud C. , Can. J. Chem. Eng., 81, 2003, 771-775.[5] Gaucher C. , Jaouen P. , Comit i J . , Legent i lhomme P. , J. Membr. Sci., 210,
2002, 245-258.[6] Gaucher C. , Legent i lhomme P. , Jaouen P. , Comit i J . , Chem. Eng. Res. Des.,
80, 2002, 111-120.[7] Gaucher C. , Jaouen P. , Legent i lhomme P. , Comiti J., Sep. Sci. Technol., 37,
2002, 2251-2270.[8] Gaucher C. , Jaouen P. , Legent i lhomme P. , Comit i J . , Sep. Sci. Technol., 38,
2003, 1949-1962.[9] Zhang K. , Cui Z. , Field R.W., J. Membr. Sci., 332, 2009, 30-37.[10] Pr ieske H. , Böhm L. , Drews A. , Kraume M., Desalin. Water Treat., 8, 2010,
270-276.[11] Gaucher C. , Legent i lhomme P. , Jaouen P. , Comit i J . , Pruvost J . , Exp. Flu-
ids, 32, 2002, 283-293.[12] Sobol ik V. , Wein O. , Cermak J . , Collect. Czech. Chem. Commun., 52, 1987, 913-
-928.[13] Wein O. , Tovcigrecko V.V. , Sobol ik V. , Int. J. Heat Mass Transfer, 49, 2006,
4596-4607.[14] Raffel M., Wil ler t C. , Kompenhans J . , Particle image velocimetry: a practical
guide, Springer, Berlin Heidelberg 2007.
µτ

PIOTR CYKLIS, RYSZARD KANTOR*1
CONCEPT OF ECOLOGICAL HYBRID COMPRESSION-SORPTION REFRIGERATING SYSTEMS
KONCEPCJA EKOLOGICZNEGO HYBRYDOWEGO SORPCYJNO-SPRĘŻARKOWEGO
SYSTEMU CHŁODNICZEGO
A b s t r a c t
The CO2 application for refrigerating cycles is a growing market due to its environmental friendly characte-ristics. However, using CO2 as a refrigerant has some disadvantages due to relatively low critical tempera-ture. For this reason usually two stage compressor cascades are used. But there are alternatives. In this pa-per the theoretical analysis of the cascade with an adsorption or absorption system as the upper cycle with water as working fluid will be shown.Keywords: two-stage refrigeration cascade, absorption cycle, adsorption cycle, CO2 cycle
S t r e s z c z e n i e
Instalacje chłodnicze wykorzystujące CO2 są coraz popularniejsze. Jednak CO2 jako czynnik chłodniczy ma także wady. Główną wadą jest niska temperatura punktu krytycznego. Z tego powodu stosuje się dwustopniowe kaskady sprężarkowe. Istnieją jednak inne możliwości. Artykuł zawiera teoretyczną analizę systemu dwustopniowego z obiegiem absorpcyjnym oraz adsorpcyjnym będącym górnym stopniem kaskady chłodniczej.Słowa kluczowe: dwustopniowa kaskada, obieg absorpcyjny, obieg adsorpcyjny, obieg CO2
* Prof. PhD. Piotr Cyklis, PhD. Ryszard Kantor, Institute of Thermal and Power Engineering, Faculty of Mechanical Engineering, Cracow University of Technology.
32
1. Introduction
In nowadays refrigeration systems there is a strong need for environmental friendly and efficient refrigerants. Most friendly are natural refrigerants: water and CO2. Using CO2 as refrigerant one has to take into account its very low critical point which limits the COP, and very high pressure requirement in the discharge side of the compressor.
The common way to deal with the problem is to use the CO2 cycle as a low temperature stage for two stage refrigeration, and another refrigerant for the high temperature stage. This gives reasonable COP for the CO2 cycle working below critical point and easy to control two stage compressor refrigeration systems. However in this case the environmental friendly CO2 refrigeration has the addition of another refrigerant in the high temperature stage, and another compressor using electric power.
Water as a working fluid has the temperature limit. It can be used in the air condition-ing systems with either absorption or adsorption cycle chillers, having the lowest tempera-ture about 5°C. For the refrigeration purposes this may only be used at the high temperature stage of the cascade, assuming that the condensation in the second (low) stage compression cycle is about 10–15°C. This is below the critical point for CO2. Therefore combining CO2 LT (Low Temperature) stage with absorption or adsorption systems as a HT (High Temper-ature) stage may lead to the environmentally friendly solution.
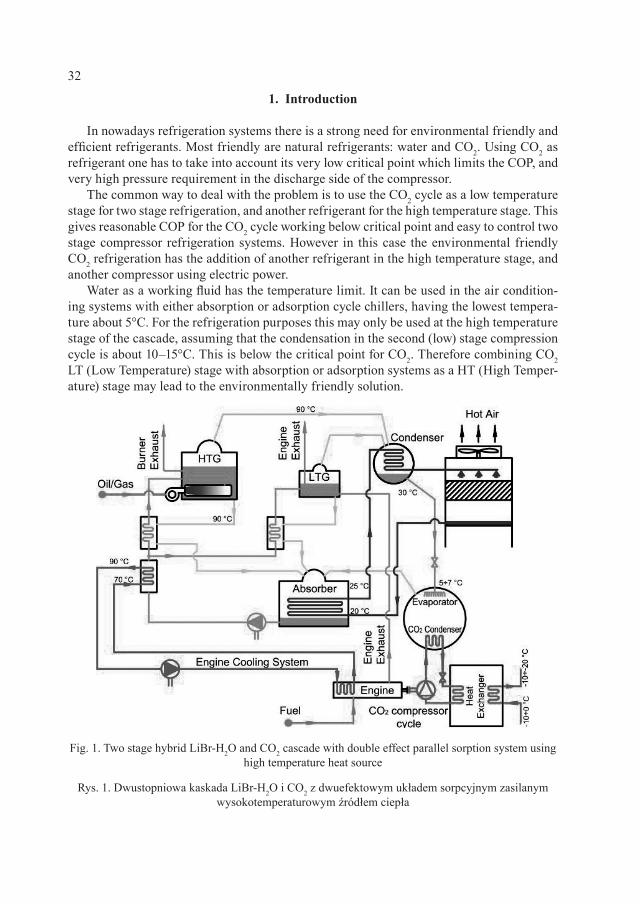
Fig. 1. Two stage hybrid LiBr-H2O and CO2 cascade with double effect parallel sorption system using high temperature heat source
Rys. 1. Dwustopniowa kaskada LiBr-H2O i CO2 z dwuefektowym układem sorpcyjnym zasilanym wysokotemperaturowym źródłem ciepła
33
2. Absorption-compression system description
In the Fig. 1 the hybrid system with double effect parallel absorption system is shown. This cycle requires high temperature heat source (about 200°C) (HTG). If the combustion engine driven CO2 compressor is used the heat generated by engine cooling and combustion gases may be used as shown on the Fig. 1. The engine waste heat is not sufficient for the ab-sorption cycle. So additional gas burner has to be added for HTG (High Temperature Gen-erator) heating. The combustion gases from the engine may be diluted to heat the LTG (Low Temperature Generator) or added to the burning gases for HTG. The cooling water from the engine is used for initial heat up of the solution pumped from the absorber.
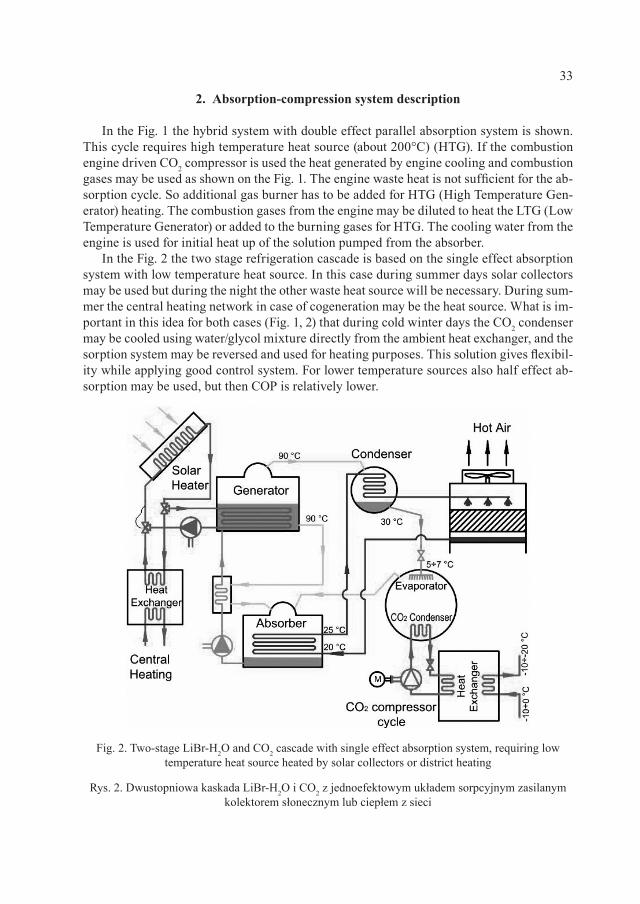
In the Fig. 2 the two stage refrigeration cascade is based on the single effect absorption system with low temperature heat source. In this case during summer days solar collectors may be used but during the night the other waste heat source will be necessary. During sum-mer the central heating network in case of cogeneration may be the heat source. What is im-portant in this idea for both cases (Fig. 1, 2) that during cold winter days the CO2 condenser may be cooled using water/glycol mixture directly from the ambient heat exchanger, and the sorption system may be reversed and used for heating purposes. This solution gives flexibil-ity while applying good control system. For lower temperature sources also half effect ab-sorption may be used, but then COP is relatively lower.
Fig. 2. Two-stage LiBr-H2O and CO2 cascade with single effect absorption system, requiring low temperature heat source heated by solar collectors or district heating
Rys. 2. Dwustopniowa kaskada LiBr-H2O i CO2 z jednoefektowym układem sorpcyjnym zasilanym kolektorem słonecznym lub ciepłem z sieci
34
3. Absorption-compression system simulation
3.1. The compression system simulation
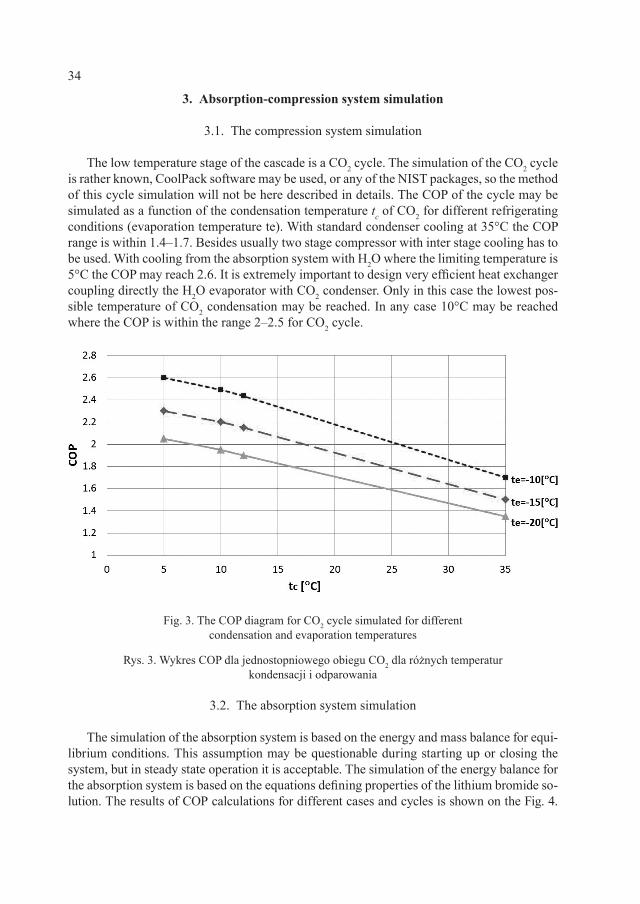
The low temperature stage of the cascade is a CO2 cycle. The simulation of the CO2 cycle is rather known, CoolPack software may be used, or any of the NIST packages, so the method of this cycle simulation will not be here described in details. The COP of the cycle may be simulated as a function of the condensation temperature tc of CO2 for different refrigerating conditions (evaporation temperature te). With standard condenser cooling at 35°C the COP range is within 1.4–1.7. Besides usually two stage compressor with inter stage cooling has to be used. With cooling from the absorption system with H2O where the limiting temperature is 5°C the COP may reach 2.6. It is extremely important to design very efficient heat exchanger coupling directly the H2O evaporator with CO2 condenser. Only in this case the lowest pos-sible temperature of CO2 condensation may be reached. In any case 10°C may be reached where the COP is within the range 2–2.5 for CO2 cycle.
3.2. The absorption system simulation
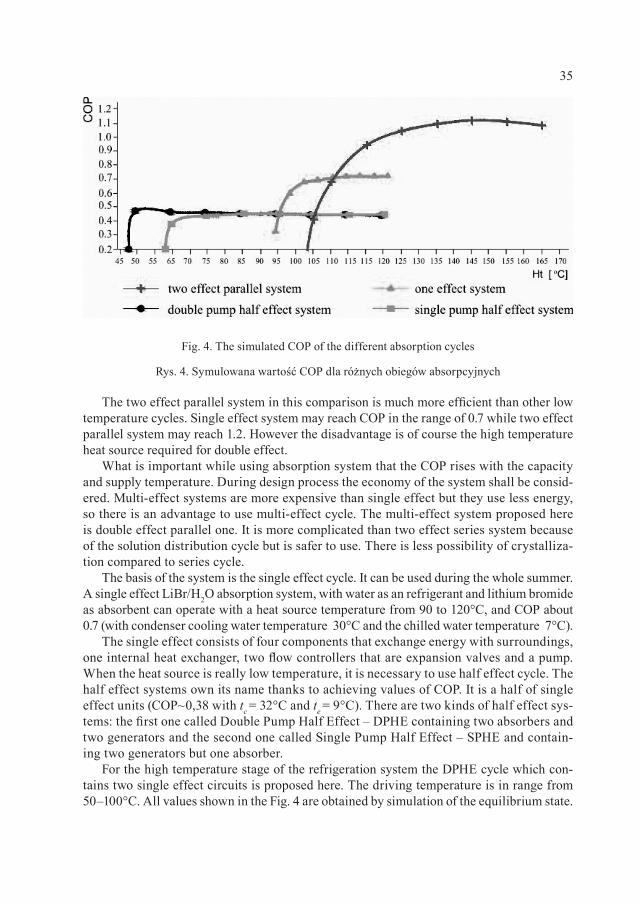
The simulation of the absorption system is based on the energy and mass balance for equi-librium conditions. This assumption may be questionable during starting up or closing the system, but in steady state operation it is acceptable. The simulation of the energy balance for the absorption system is based on the equations defining properties of the lithium bromide so-lution. The results of COP calculations for different cases and cycles is shown on the Fig. 4.
Fig. 3. The COP diagram for CO2 cycle simulated for different condensation and evaporation temperatures
Rys. 3. Wykres COP dla jednostopniowego obiegu CO2 dla różnych temperatur kondensacji i odparowania
35
The two effect parallel system in this comparison is much more efficient than other low temperature cycles. Single effect system may reach COP in the range of 0.7 while two effect parallel system may reach 1.2. However the disadvantage is of course the high temperature heat source required for double effect.
What is important while using absorption system that the COP rises with the capacity and supply temperature. During design process the economy of the system shall be consid-ered. Multi-effect systems are more expensive than single effect but they use less energy, so there is an advantage to use multi-effect cycle. The multi-effect system proposed here is double effect parallel one. It is more complicated than two effect series system because of the solution distribution cycle but is safer to use. There is less possibility of crystalliza-tion compared to series cycle.
The basis of the system is the single effect cycle. It can be used during the whole summer. A single effect LiBr/H2O absorption system, with water as an refrigerant and lithium bromide as absorbent can operate with a heat source temperature from 90 to 120°C, and COP about 0.7 (with condenser cooling water temperature 30°C and the chilled water temperature 7°C).
The single effect consists of four components that exchange energy with surroundings, one internal heat exchanger, two flow controllers that are expansion valves and a pump. When the heat source is really low temperature, it is necessary to use half effect cycle. The half effect systems own its name thanks to achieving values of COP. It is a half of single effect units (COP~0,38 with tc = 32°C and te = 9°C). There are two kinds of half effect sys-tems: the first one called Double Pump Half Effect – DPHE containing two absorbers and two generators and the second one called Single Pump Half Effect – SPHE and contain-ing two generators but one absorber.
For the high temperature stage of the refrigeration system the DPHE cycle which con-tains two single effect circuits is proposed here. The driving temperature is in range from 50–100°C. All values shown in the Fig. 4 are obtained by simulation of the equilibrium state.
Fig. 4. The simulated COP of the different absorption cycles
Rys. 4. Symulowana wartość COP dla różnych obiegów absorpcyjnych
36
4. Adsorption-compression system description
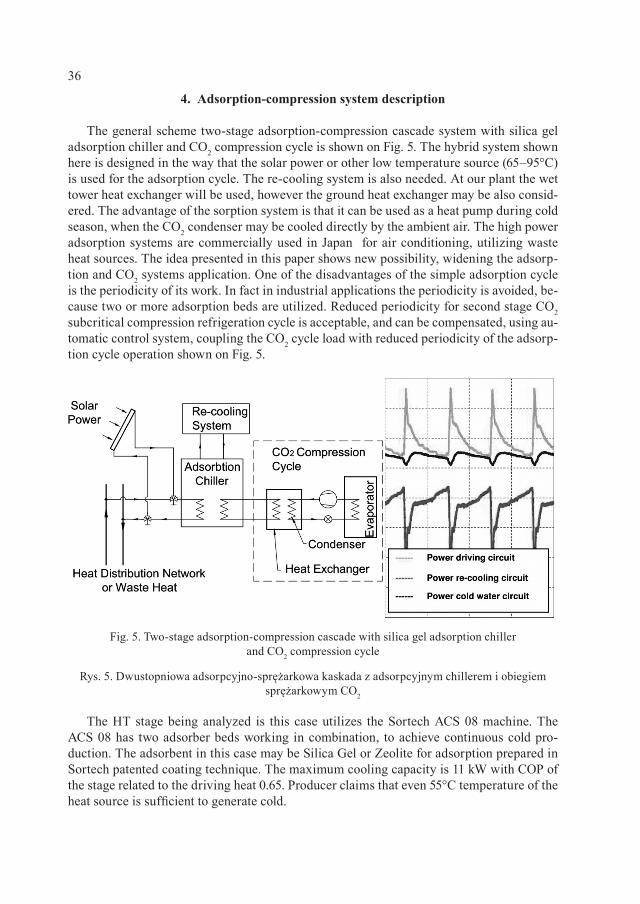
The general scheme two-stage adsorption-compression cascade system with silica gel adsorption chiller and CO2 compression cycle is shown on Fig. 5. The hybrid system shown here is designed in the way that the solar power or other low temperature source (65–95°C) is used for the adsorption cycle. The re-cooling system is also needed. At our plant the wet tower heat exchanger will be used, however the ground heat exchanger may be also consid-ered. The advantage of the sorption system is that it can be used as a heat pump during cold season, when the CO2 condenser may be cooled directly by the ambient air. The high power adsorption systems are commercially used in Japan for air conditioning, utilizing waste heat sources. The idea presented in this paper shows new possibility, widening the adsorp-tion and CO2 systems application. One of the disadvantages of the simple adsorption cycle is the periodicity of its work. In fact in industrial applications the periodicity is avoided, be-cause two or more adsorption beds are utilized. Reduced periodicity for second stage CO2 subcritical compression refrigeration cycle is acceptable, and can be compensated, using au-tomatic control system, coupling the CO2 cycle load with reduced periodicity of the adsorp-tion cycle operation shown on Fig. 5.
The HT stage being analyzed is this case utilizes the Sortech ACS 08 machine. The ACS 08 has two adsorber beds working in combination, to achieve continuous cold pro-duction. The adsorbent in this case may be Silica Gel or Zeolite for adsorption prepared in Sortech patented coating technique. The maximum cooling capacity is 11 kW with COP of the stage related to the driving heat 0.65. Producer claims that even 55°C temperature of the heat source is sufficient to generate cold.
Fig. 5. Two-stage adsorption-compression cascade with silica gel adsorption chiller and CO2 compression cycle
Rys. 5. Dwustopniowa adsorpcyjno-sprężarkowa kaskada z adsorpcyjnym chillerem i obiegiem sprężarkowym CO2
37
An important advantage of adsorption chillers, compared to absorption chillers, is their ability to generate cooling power at very low driving temperatures – starting at 55°C up to 95°C. Seen from this aspect, the adsorption cycle may be powered by low tem-perature renewable energy or waste energy generated by many industrial processes. It is of-ten the case in the food processing plants that this kind of waste energy is present and free to use. The cold water circuit operates within temperature range of 5 to 20°C. At tempera-tures below 5°C both the cooling power and the COP are reduced significantly. The adsorp-tion chiller requires re-cooling. The heat that is generated has to be released to the surround-ing area at the MT (middle temperature) level. The re-cooling water temperature shall be at 20–35°C. This can be achieved by e.g. a wet tower. There are also other possibilities: for ex-ample, to use heat exchangers in swimming pool for water heating, working as MT cooler. A ground heat exchanger may also be used, having two functions as re-cooler in summer or a heat source for a heat pump, since the adsorption cycle is easily reversible and may be used as a heat pump in winter time.
The total system has potential also for refrigerating purposes using the city central heat distribution system in summer. This is one of the possibility to increase total efficiency of the CHP (Combined Heat and Power) working in Rankine cycle in summer time.
5. Adsorption-compression system description
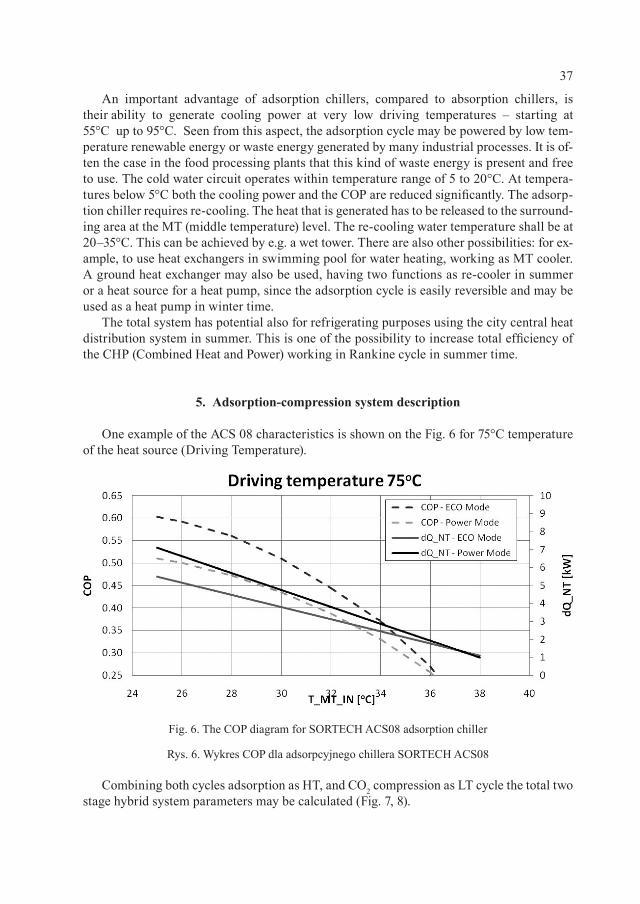
One example of the ACS 08 characteristics is shown on the Fig. 6 for 75°C temperature of the heat source (Driving Temperature).
Combining both cycles adsorption as HT, and CO2 compression as LT cycle the total two stage hybrid system parameters may be calculated (Fig. 7, 8).
Fig. 6. The COP diagram for SORTECH ACS08 adsorption chiller
Rys. 6. Wykres COP dla adsorpcyjnego chillera SORTECH ACS08
38
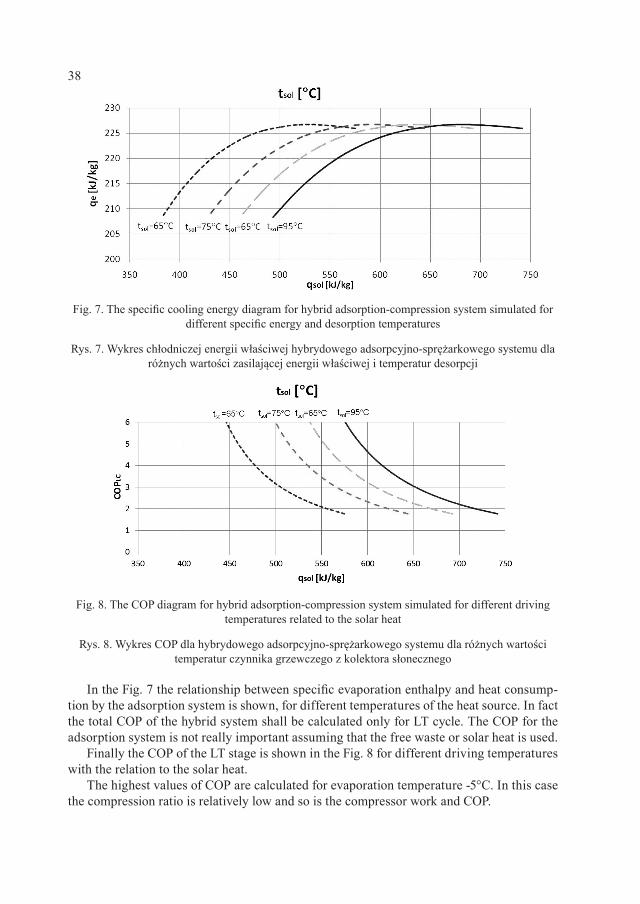
In the Fig. 7 the relationship between specific evaporation enthalpy and heat consump-tion by the adsorption system is shown, for different temperatures of the heat source. In fact the total COP of the hybrid system shall be calculated only for LT cycle. The COP for the adsorption system is not really important assuming that the free waste or solar heat is used.
Finally the COP of the LT stage is shown in the Fig. 8 for different driving temperatures with the relation to the solar heat.
The highest values of COP are calculated for evaporation temperature -5°C. In this case the compression ratio is relatively low and so is the compressor work and COP.
Fig. 7. The specific cooling energy diagram for hybrid adsorption-compression system simulated for different specific energy and desorption temperatures
Rys. 7. Wykres chłodniczej energii właściwej hybrydowego adsorpcyjno-sprężarkowego systemu dla różnych wartości zasilającej energii właściwej i temperatur desorpcji
Fig. 8. The COP diagram for hybrid adsorption-compression system simulated for different driving temperatures related to the solar heat
Rys. 8. Wykres COP dla hybrydowego adsorpcyjno-sprężarkowego systemu dla różnych wartości temperatur czynnika grzewczego z kolektora słonecznego
39
6. Conclusions
6.1. Absorption-compression system
The low COP of the one stage CO2 refrigerating system working with the condensation temperature above the critical point was the basis of the idea of hybrid system presented in this paper. The LiBr/H2O absorption gains nowadays a lot of applications. There are several papers on the simulation and experimental analysis of the use of solar heated lithium-bromide air conditioning and heat pump systems. There are no experimental or theoretical analysis of such a hybrid system as presented here in the published articles. In this paper the extension of the application of the lithium bromide absorption system for two stage hybrid refrigeration use is presented. The total COP of the presented hybrid system is relatively low. For the high temperature heat source of desorber the total COP for the hybrid system is within 2–2.5. With low temperature waste heat source total achievable COP is within the range 1–1.4.
This idea may be useful on two conditions: – the waste or renewable heat source is available, the temperature in the lowest case may
be above 55°C when applying half effect system for absorption with COP 0.3–0.4, – the evaporator H2O/condenser CO2 is designed individually for maximum perfor-
mance.Although there are disadvantages of the hybrid system, there is a possibility to use it
as a part of a complete heating/air conditioning/refrigerating system, utilizing waste heat or solar collectors, with ground heat exchanger. In this case this would be energy friendly and efficient solution.
6.2. Adsorption-compression system
The idea of hybrid two stage (H2O adsorption)-(CO2 compression) system is new. The designed system is currently under construction in the Laboratory of Thermodynamics and Thermal Machines Measurements at the Cracow University of Technology. The simulated results of the system work will be the basis of the real system analysis. The results shown in the paper are based on the simulation and producer’s data.
The reduction of the compressor work comparing to the conventional one-stage or two-stage compression refrigeration system using CO2 as a working fluid is significant. There is also significant reduction of the discharge pressure in the system.
The idea of coupling two systems is also interesting because of the future development possibilities. The source heat used here: solar collectors may be easily substituted by the en-gine and compressor cooling heat, when using engine driven compressor.
During cold seasons or in the nights the direct cooling circuit for CO2 condenser using ambient conditions may be used, and then the adsorption cycle may be reversed and used for heating. The re-cooling system can be used for swimming pool heating.
The system shown here, as it is, is very expensive, but the possibilities of the total inte-gration: refrigeration, air conditioning, heating in one system will reduce unitary costs and increase the system usage time.
This paper is a part of development project N R06 0002 10 0936/R/T02/2010/10.

40
R e f e r e n c e s
[1] Florides G.A. , I Design and construction of a LiBr – water absorption machine, En-ergy Conversion and Management, 44, 2003, 2483-2508.
[2] Mandani F. , Et touney H. , El-Dessouky H. , LiBr-H2O absorption heat for sin-gle-effect evaporation desalination process, International Compressor Desalination, 128, 2000, 161-176.
[3] Grzebielec A. , Experimental study on adsorption heat pump, Archives of thermody-namics, Vol. 30, Wydawnictwo IMP, Gdańsk 2009, 189-200.
[4] SorTech Adsorption Chiller ACS 08/ACS 15, Design manual, Version 2.2, July 2009.
PAVEL DITL, MICHAL NETUŠIL*1
DEHYDRATION OF NATURAL GAS STORED IN UNDERGROUND GAS STORAGES
ODWADNIANIE GAZU NATURALNEGO PRZECHOWYWANEGO
W MAGAZYNACH PODZIEMNYCH
A b s t r a c t
Due to national strategic reserves and to smooth seasonal and short-term peaks of natural gas consumption it is stored in underground reservoirs. During storage it is being saturated by water vapor from the reposi-tory. Before the further distribution gas must be dehydrated to meet the transportation parameters specified by the gas distributors. The paper describes a new energy saving gas-drying technology that uses a superso-nic passage of the gas through a nozzle. The goal of this paper is to formulate mathematical-physical model of gas flow in the nozzle. Technical design which solves the problem of unsteady inlet parameters is propo-sed. Basic geometry and industrial applications are discussed.Keywords: natural gas, dehydratation, supersonic separation
S t r e s z c z e n i e
Dla potrzeb narodowych rezerw strategicznych, służących wyrównaniu sezonowych i krótkoterminowych wzrostów zużycia, gaz ziemny jest przechowywany w podziemnych zbiornikach. W trakcie przechowywania następuje nasycenie gazu parą wodną ze zbiornika. W celu dostosowania gazu do parametrów transportu określonych przez dystrybutorów, konieczne jest przeprowadzenie dehydracji gazu przed jego dalszym przesyłem. W niniejszym artykule przedstawiono nową, energooszczędną technikę osuszania gazu polegającą na ponaddźwiękowym przepuszczeniu gazu przez dyszę. Celem artykułu jest sformułowanie matematyczno-fizycznego modelu przepływu gazu przez dyszę. Zaproponowano projekt techniczny rozwiązujący problem niestabilności parametrów wlotowych. Omówiono podstawową geometrię i zastosowanie w przemyśle.Słowa kluczowe: gaz naturalny, odwadnianie, oddzielanie naddźwiękowe
* Prof. DSc. Eng. Pavel Ditl, PhD. Eng. Michal Netušil, Faculty of Mechanical Engineering, Czech Technical University in Prague.
42
1. Introduction
There are two basic reasons for storing NG. Firstly, it can decrease dependency on supply. With this in mind national strategic reserves are created. Secondly, by NG storing the maximum capacity of distribution lines can be exploited. Underground Gas Storages (UGS) are the most advantageous option for storing large volumes of gas. Nowadays there are approximately 135 UGSs inside the European Union. Their total maximum technical storage capacity is around 100 bcm. According to the latest update, over 70 bcm of additional storage capacity will come on stream in Europe till 2020 [1]. Next table shows UGS capacities in Poland, Germany and Czech Republic. Capacities of shale gas (SG) in Poland and Czech Republic are not covered in this summary table. Some problems accompanied with SG fracking might be discussed in the lecture.
T a b l e 1
UGS capacities in Poland, Germany and Czech Republic
UGS present capacities
UGS capatities projected
Present withdrawal rate from
UGS
Future projects
NG feeding rate into UGS
Future projects
106 m3 106 m3 106 m3/d 106 m3/d 106 m3/d 106 m3/d
Czech republic 3277 335 56 0 40 0
Germany 20 301 10 526 437 145 226 74
Poland 1828 1662 40 23 21 10
There are three types of UGSs: (1) Aquifers, (2) Depleted oil/gas fields and (3) Cavern reservoirs (salt or hard rock). Each of these types possesses distinct physical characteristics. The important parameters describing the appropriateness of UGS use are storing capacity, maximal injecting/withdrawing performance and gas contamination during storage. Gen-erally, the allowable pressure of stored gas inside a UGS is up to 20 MPa. The pressure in-side increases as the gas is being injected and decreases when gas is withdrawn. The output gas pressure depends on further distribution. Distribution sites from UGS normally begin at 7 MPa. The temperature of the gas usually ranges from 20–35°C. The exact temperature varies with the location of the UGS and with the time of year.
During storage the gas becomes saturated by water vapors. In the case of depleted oil field UGSs, vapors of higher hydrocarbons also contaminate the stored gas. The distribution specification sets the allowable water concentration and higher hydrocarbons. In Europe the concentration of water and higher hydrocarbons is specified by their dew point temperature (Tdew). Tdew for water is –7°C for NG at 4 MPa and the Tdew for hydrocarbons is 0°C for NG at the operating pressures [3].
The water content of NG at saturation is dependent on the temperature and pressure. With increasing pressure of gas the water content decreases and with increasing tempera-ture water content in gas increases.
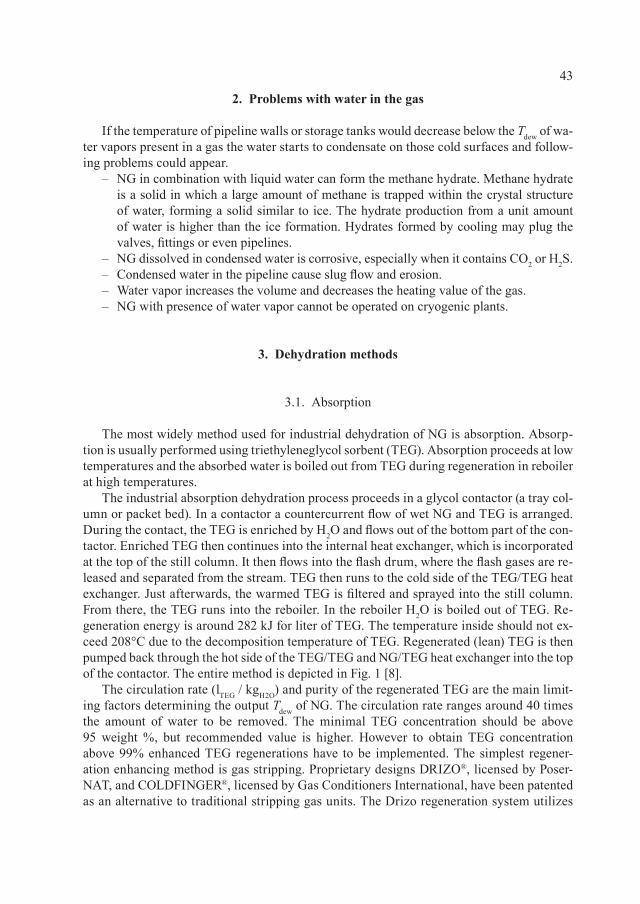
43
2. Problems with water in the gas
If the temperature of pipeline walls or storage tanks would decrease below the Tdew of wa-ter vapors present in a gas the water starts to condensate on those cold surfaces and follow-ing problems could appear.
– NG in combination with liquid water can form the methane hydrate. Methane hydrate is a solid in which a large amount of methane is trapped within the crystal structure of water, forming a solid similar to ice. The hydrate production from a unit amount of water is higher than the ice formation. Hydrates formed by cooling may plug the valves, fittings or even pipelines.
– NG dissolved in condensed water is corrosive, especially when it contains CO2 or H2S. – Condensed water in the pipeline cause slug flow and erosion. – Water vapor increases the volume and decreases the heating value of the gas. – NG with presence of water vapor cannot be operated on cryogenic plants.
3. Dehydration methods
3.1. Absorption
The most widely method used for industrial dehydration of NG is absorption. Absorp-tion is usually performed using triethyleneglycol sorbent (TEG). Absorption proceeds at low temperatures and the absorbed water is boiled out from TEG during regeneration in reboiler at high temperatures.
The industrial absorption dehydration process proceeds in a glycol contactor (a tray col-umn or packet bed). In a contactor a countercurrent flow of wet NG and TEG is arranged. During the contact, the TEG is enriched by H2O and flows out of the bottom part of the con-tactor. Enriched TEG then continues into the internal heat exchanger, which is incorporated at the top of the still column. It then flows into the flash drum, where the flash gases are re-leased and separated from the stream. TEG then runs to the cold side of the TEG/TEG heat exchanger. Just afterwards, the warmed TEG is filtered and sprayed into the still column. From there, the TEG runs into the reboiler. In the reboiler H2O is boiled out of TEG. Re-generation energy is around 282 kJ for liter of TEG. The temperature inside should not ex-ceed 208°C due to the decomposition temperature of TEG. Regenerated (lean) TEG is then pumped back through the hot side of the TEG/TEG and NG/TEG heat exchanger into the top of the contactor. The entire method is depicted in Fig. 1 [8].
The circulation rate (lTEG / kgH2O) and purity of the regenerated TEG are the main limit-ing factors determining the output Tdew of NG. The circulation rate ranges around 40 times the amount of water to be removed. The minimal TEG concentration should be above 95 weight %, but recommended value is higher. However to obtain TEG concentration above 99% enhanced TEG regenerations have to be implemented. The simplest regener-ation enhancing method is gas stripping. Proprietary designs DRIZO®, licensed by Poser-NAT, and COLDFINGER®, licensed by Gas Conditioners International, have been patented as an alternative to traditional stripping gas units. The Drizo regeneration system utilizes
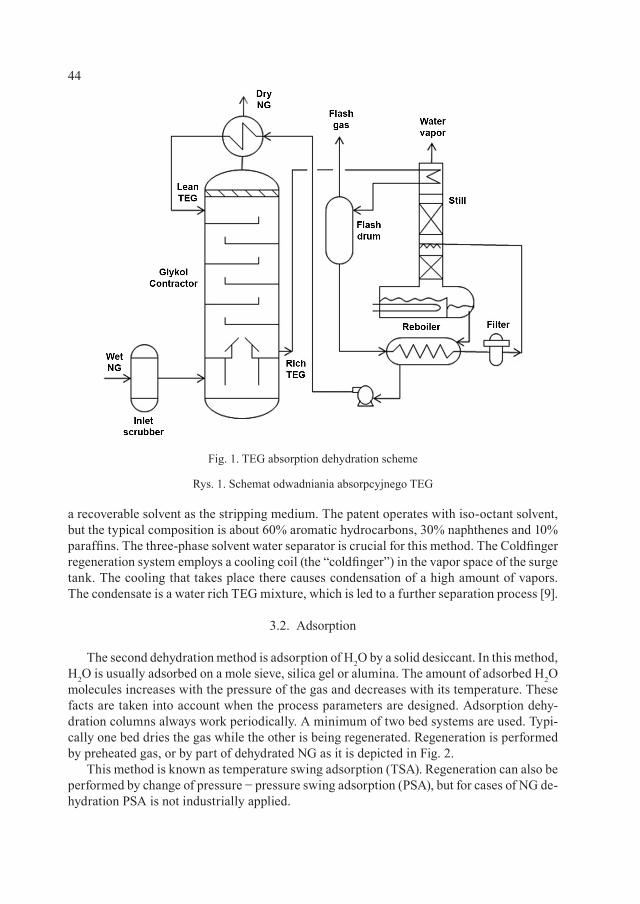
44
a recoverable solvent as the stripping medium. The patent operates with iso-octant solvent, but the typical composition is about 60% aromatic hydrocarbons, 30% naphthenes and 10% paraffins. The three-phase solvent water separator is crucial for this method. The Coldfinger regeneration system employs a cooling coil (the “coldfinger”) in the vapor space of the surge tank. The cooling that takes place there causes condensation of a high amount of vapors. The condensate is a water rich TEG mixture, which is led to a further separation process [9].
3.2. Adsorption
The second dehydration method is adsorption of H2O by a solid desiccant. In this method, H2O is usually adsorbed on a mole sieve, silica gel or alumina. The amount of adsorbed H2O molecules increases with the pressure of the gas and decreases with its temperature. These facts are taken into account when the process parameters are designed. Adsorption dehy-dration columns always work periodically. A minimum of two bed systems are used. Typi-cally one bed dries the gas while the other is being regenerated. Regeneration is performed by preheated gas, or by part of dehydrated NG as it is depicted in Fig. 2.
This method is known as temperature swing adsorption (TSA). Regeneration can also be performed by change of pressure − pressure swing adsorption (PSA), but for cases of NG de-hydration PSA is not industrially applied.
Fig. 1. TEG absorption dehydration scheme
Rys. 1. Schemat odwadniania absorpcyjnego TEG
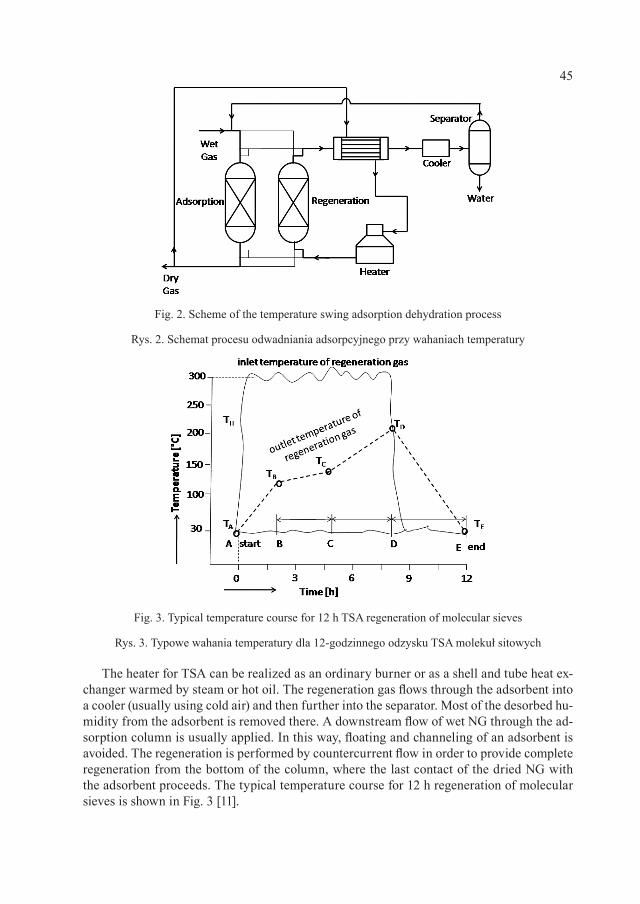
45
The heater for TSA can be realized as an ordinary burner or as a shell and tube heat ex-changer warmed by steam or hot oil. The regeneration gas flows through the adsorbent into a cooler (usually using cold air) and then further into the separator. Most of the desorbed hu-midity from the adsorbent is removed there. A downstream flow of wet NG through the ad-sorption column is usually applied. In this way, floating and channeling of an adsorbent is avoided. The regeneration is performed by countercurrent flow in order to provide complete regeneration from the bottom of the column, where the last contact of the dried NG with the adsorbent proceeds. The typical temperature course for 12 h regeneration of molecular sieves is shown in Fig. 3 [11].
Fig. 2. Scheme of the temperature swing adsorption dehydration process
Rys. 2. Schemat procesu odwadniania adsorpcyjnego przy wahaniach temperatury
Fig. 3. Typical temperature course for 12 h TSA regeneration of molecular sieves
Rys. 3. Typowe wahania temperatury dla 12-godzinnego odzysku TSA molekuł sitowych
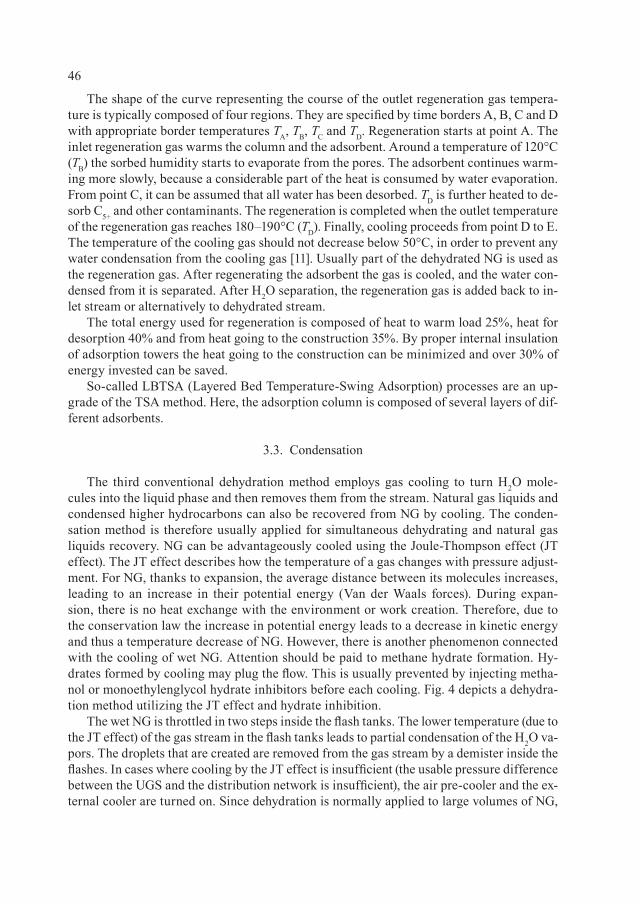
46
The shape of the curve representing the course of the outlet regeneration gas tempera-ture is typically composed of four regions. They are specified by time borders A, B, C and D with appropriate border temperatures TA, TB, TC and TD. Regeneration starts at point A. The inlet regeneration gas warms the column and the adsorbent. Around a temperature of 120°C (TB) the sorbed humidity starts to evaporate from the pores. The adsorbent continues warm-ing more slowly, because a considerable part of the heat is consumed by water evaporation. From point C, it can be assumed that all water has been desorbed. TD is further heated to de-sorb C5+ and other contaminants. The regeneration is completed when the outlet temperature of the regeneration gas reaches 180–190°C (TD). Finally, cooling proceeds from point D to E. The temperature of the cooling gas should not decrease below 50°C, in order to prevent any water condensation from the cooling gas [11]. Usually part of the dehydrated NG is used as the regeneration gas. After regenerating the adsorbent the gas is cooled, and the water con-densed from it is separated. After H2O separation, the regeneration gas is added back to in-let stream or alternatively to dehydrated stream.
The total energy used for regeneration is composed of heat to warm load 25%, heat for desorption 40% and from heat going to the construction 35%. By proper internal insulation of adsorption towers the heat going to the construction can be minimized and over 30% of energy invested can be saved.
So-called LBTSA (Layered Bed Temperature-Swing Adsorption) processes are an up-grade of the TSA method. Here, the adsorption column is composed of several layers of dif-ferent adsorbents.
3.3. Condensation
The third conventional dehydration method employs gas cooling to turn H2O mole-cules into the liquid phase and then removes them from the stream. Natural gas liquids and condensed higher hydrocarbons can also be recovered from NG by cooling. The conden-sation method is therefore usually applied for simultaneous dehydrating and natural gas liquids recovery. NG can be advantageously cooled using the Joule-Thompson effect (JT effect). The JT effect describes how the temperature of a gas changes with pressure adjust-ment. For NG, thanks to expansion, the average distance between its molecules increases, leading to an increase in their potential energy (Van der Waals forces). During expan-sion, there is no heat exchange with the environment or work creation. Therefore, due to the conservation law the increase in potential energy leads to a decrease in kinetic energy and thus a temperature decrease of NG. However, there is another phenomenon connected with the cooling of wet NG. Attention should be paid to methane hydrate formation. Hy-drates formed by cooling may plug the flow. This is usually prevented by injecting metha-nol or monoethylenglycol hydrate inhibitors before each cooling. Fig. 4 depicts a dehydra-tion method utilizing the JT effect and hydrate inhibition.
The wet NG is throttled in two steps inside the flash tanks. The lower temperature (due to the JT effect) of the gas stream in the flash tanks leads to partial condensation of the H2O va-pors. The droplets that are created are removed from the gas stream by a demister inside the flashes. In cases where cooling by the JT effect is insufficient (the usable pressure difference between the UGS and the distribution network is insufficient), the air pre-cooler and the ex-ternal cooler are turned on. Since dehydration is normally applied to large volumes of NG,
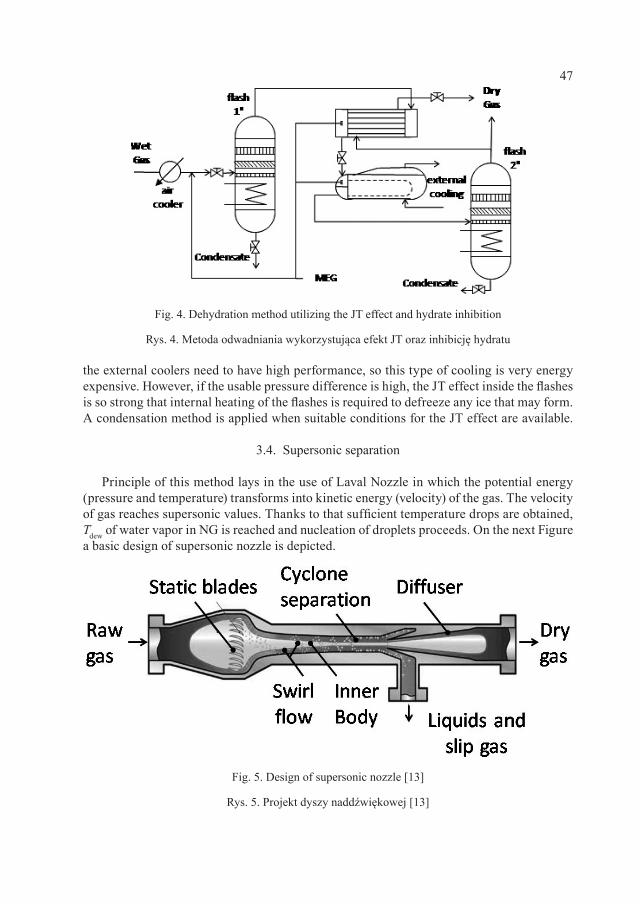
47
the external coolers need to have high performance, so this type of cooling is very energy expensive. However, if the usable pressure difference is high, the JT effect inside the flashes is so strong that internal heating of the flashes is required to defreeze any ice that may form. A condensation method is applied when suitable conditions for the JT effect are available.
3.4. Supersonic separation
Principle of this method lays in the use of Laval Nozzle in which the potential energy (pressure and temperature) transforms into kinetic energy (velocity) of the gas. The velocity of gas reaches supersonic values. Thanks to that sufficient temperature drops are obtained, Tdew of water vapor in NG is reached and nucleation of droplets proceeds. On the next Figure a basic design of supersonic nozzle is depicted.
Fig. 4. Dehydration method utilizing the JT effect and hydrate inhibition
Rys. 4. Metoda odwadniania wykorzystująca efekt JT oraz inhibicję hydratu
Fig. 5. Design of supersonic nozzle [13]
Rys. 5. Projekt dyszy naddźwiękowej [13]
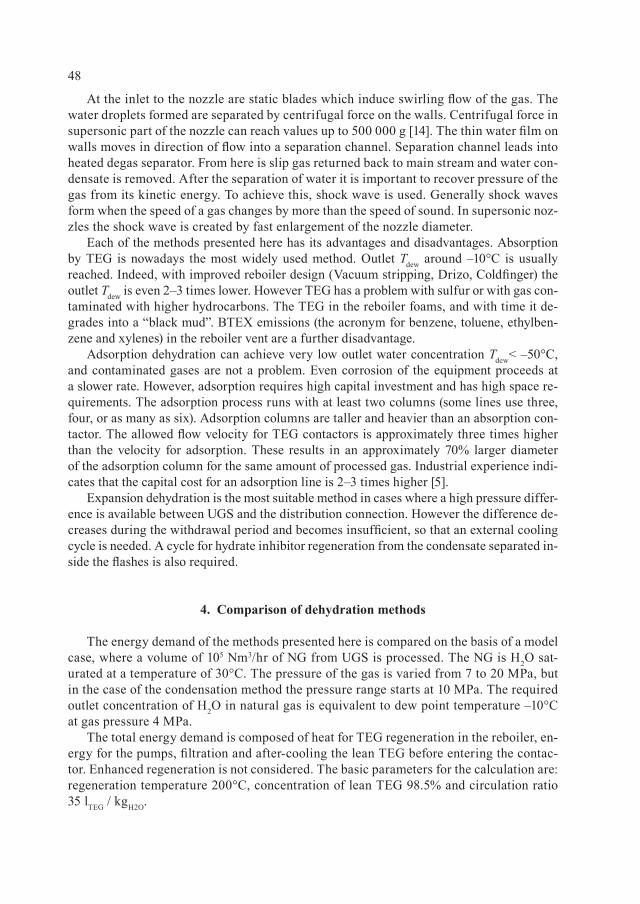
48
At the inlet to the nozzle are static blades which induce swirling flow of the gas. The water droplets formed are separated by centrifugal force on the walls. Centrifugal force in supersonic part of the nozzle can reach values up to 500 000 g [14]. The thin water film on walls moves in direction of flow into a separation channel. Separation channel leads into heated degas separator. From here is slip gas returned back to main stream and water con-densate is removed. After the separation of water it is important to recover pressure of the gas from its kinetic energy. To achieve this, shock wave is used. Generally shock waves form when the speed of a gas changes by more than the speed of sound. In supersonic noz-zles the shock wave is created by fast enlargement of the nozzle diameter.
Each of the methods presented here has its advantages and disadvantages. Absorption by TEG is nowadays the most widely used method. Outlet Tdew around –10°C is usually reached. Indeed, with improved reboiler design (Vacuum stripping, Drizo, Coldfinger) the outlet Tdew is even 2–3 times lower. However TEG has a problem with sulfur or with gas con-taminated with higher hydrocarbons. The TEG in the reboiler foams, and with time it de-grades into a “black mud”. BTEX emissions (the acronym for benzene, toluene, ethylben-zene and xylenes) in the reboiler vent are a further disadvantage.
Adsorption dehydration can achieve very low outlet water concentration Tdew< –50°C, and contaminated gases are not a problem. Even corrosion of the equipment proceeds at a slower rate. However, adsorption requires high capital investment and has high space re-quirements. The adsorption process runs with at least two columns (some lines use three, four, or as many as six). Adsorption columns are taller and heavier than an absorption con-tactor. The allowed flow velocity for TEG contactors is approximately three times higher than the velocity for adsorption. These results in an approximately 70% larger diameter of the adsorption column for the same amount of processed gas. Industrial experience indi-cates that the capital cost for an adsorption line is 2–3 times higher [5].
Expansion dehydration is the most suitable method in cases where a high pressure differ-ence is available between UGS and the distribution connection. However the difference de-creases during the withdrawal period and becomes insufficient, so that an external cooling cycle is needed. A cycle for hydrate inhibitor regeneration from the condensate separated in-side the flashes is also required.
4. Comparison of dehydration methods
The energy demand of the methods presented here is compared on the basis of a model case, where a volume of 105 Nm3/hr of NG from UGS is processed. The NG is H2O sat-urated at a temperature of 30°C. The pressure of the gas is varied from 7 to 20 MPa, but in the case of the condensation method the pressure range starts at 10 MPa. The required outlet concentration of H2O in natural gas is equivalent to dew point temperature –10°C at gas pressure 4 MPa.
The total energy demand is composed of heat for TEG regeneration in the reboiler, en-ergy for the pumps, filtration and after-cooling the lean TEG before entering the contac-tor. Enhanced regeneration is not considered. The basic parameters for the calculation are: regeneration temperature 200°C, concentration of lean TEG 98.5% and circulation ratio 35 lTEG / kgH2O.
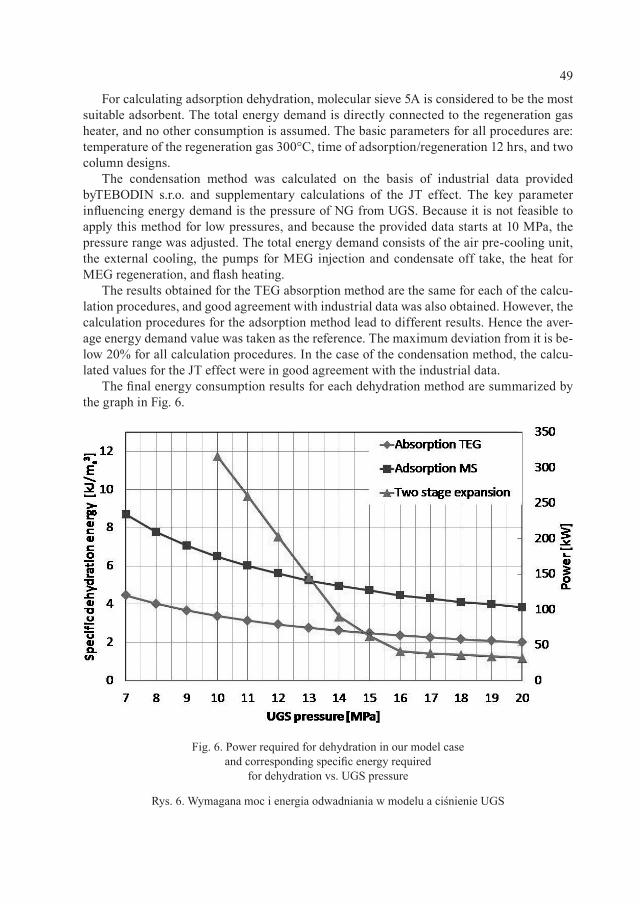
49
For calculating adsorption dehydration, molecular sieve 5A is considered to be the most suitable adsorbent. The total energy demand is directly connected to the regeneration gas heater, and no other consumption is assumed. The basic parameters for all procedures are: temperature of the regeneration gas 300°C, time of adsorption/regeneration 12 hrs, and two column designs.
The condensation method was calculated on the basis of industrial data provided byTEBODIN s.r.o. and supplementary calculations of the JT effect. The key parameter influencing energy demand is the pressure of NG from UGS. Because it is not feasible to apply this method for low pressures, and because the provided data starts at 10 MPa, the pressure range was adjusted. The total energy demand consists of the air pre-cooling unit, the external cooling, the pumps for MEG injection and condensate off take, the heat for MEG regeneration, and flash heating.
The results obtained for the TEG absorption method are the same for each of the calcu-lation procedures, and good agreement with industrial data was also obtained. However, the calculation procedures for the adsorption method lead to different results. Hence the aver-age energy demand value was taken as the reference. The maximum deviation from it is be-low 20% for all calculation procedures. In the case of the condensation method, the calcu-lated values for the JT effect were in good agreement with the industrial data.
The final energy consumption results for each dehydration method are summarized by the graph in Fig. 6.
Fig. 6. Power required for dehydration in our model case and corresponding specific energy required
for dehydration vs. UGS pressure
Rys. 6. Wymagana moc i energia odwadniania w modelu a ciśnienie UGS
50
For low pressures (pressure of NG from UGS < 13 MPa), the condensation method is the most demanding. Its demand decreases linearly with pressure to a value of 145 kW for 13 MPa. At this point, the energy demand for the condensation method is roughly the same as for the adsorption method. When the NG pressure is further increased from 13 MPa to 16 MPa, the energy demand for the condensation method still decreases, but with a lower-ing tendency. For a high pressure of NG (> 16 MPa), the energy demand of the condensation method is at its lowest, and it remains nearly constant with an average value around 36 kW.
The course of the energy demand for the adsorption and absorption methods is quite similar: with increasing pressure of dehydrated NG the energy demand slowly decreases. The absorption method is less demanding on the whole pressure scale, and begins with con-sumption of 120 kW at 7MPa. The adsorption method starts with 234 kW at 7 MPa, but the energy demand decreases slightly more as the pressure of NG in UGS rises. This leads to a gradual decrease in the difference between these methods, and the energy demand at the final pressure value of 20 MPa is equal to 54 kW for absorption and 103 kW for adsorption.
5. Discussion
By far the highest energy demand of the condensation method at low pressures of NG from UGS is due to the pressure being close to the distribution pressure, so that pressure cannot be used for the JT effect in flashes. Cooling is then compensated by the air pre-cooler and the external cooling device, which are unsuitable for large volumes of processed NG. However, as the pressure difference between UGS and the distribution site increases, the space for expansion rises and the JT effect proceeds with increasing impact. This is projected into a linear decrease in the energy demand of the air pre-cooler and the external cooling device. From the point where there is a pressure of NG > 14 MPa, flash heating is gradually turned on to prevent any freezing caused by the strong JT effect. The energy demand of flash heating is reflected in the total energy consumption. Finally, for pressures of NG > 16 MPa, total cooling and subsequent condensation is achieved by the JT effect. The total energy demand remains constant, and consists of flash heating and inhibitor injection and regeneration.
In case of adsorption and absorption dehydration method, the similar falling course of the energy demand with increasing pressure of NG can be explained by the fact that with increas-ing pressure within a UDG the amount of H2O present in the NG decreases. The absorption method generally consumes less energy, because the regeneration of TEG is less demanding than adsorbent regeneration. The composition of the total energy demand of the adsorption method can be divided into three parts. The heat for H2O desorption is approximately 55%, for warming the adsorbent it is 31%, and for warming the column it is 14%. It also has to be assumed that just part of the heat in the regeneration gas transfers to the adsorbent, the col-umn and heat loss leaves to the atmosphere, and the balance leaves with the hot gas.
In brief, in cases of high pressure the most appropriate dehydration method from the en-ergy demand point of view is the stored NG condensation method. This holds for NG from UGS with pressure > 15 MPa and distribution pressure requirements 7 MPa. For lower pres-sures, the condensation method is used if the objective is to recover NGL and remove water simultaneously. However, this is usually not the case when storing NG in a UGS. In cases
51
where insufficient pressure difference is available, the absorption method is therefore fa-vored over the adsorption method in terms of energy demand. TEG absorption is nearly twice less demanding. However, if a gas contaminated with sulfur or higher hydrocarbons is being processed, the TEG in the reboiler foams and degrades with time. This can occur when a depleted oil field is used as a UGS. Adsorption is preferred in cases where very low Tdew (H2O concentration lower than 1 ppm can be achieved) of NG is required, for example when NG is liquefied.
It is worth to note that the power comparison can be used as a measure of the technical excellence. From power data the specific energy consumption was calculated and its values indicate that the energy cost is much lower than the investment cost (depreciations). On the other hand the energy cost represents more than 60% of the total operating cost.
A b b r e v i a t i o n s
NG − natural gasSG – shale gasUGS − underground gas storageTEG − triethyleneglycolTSA − temperature swing adsorptionLBTSA − layered bed temperature swing adsorptionJT effect − Joule-Thompson effectBTEX − benzene, toluene, ethylbenzene and xylenesmS
3 – standard cubic meters of gas (293,15 K; 101,325 kPa)
S y m b o l s
T − temperature, K, °CTdew − dew point temperature, K, °Cp − pressure of NG, MPaP – power, energy consumption to dehydrated NG, kW, W
The authors are grateful for the financial support provided by Ministry of Industry and Trade of the Czech Republic (program TIP nr. FR-TI1/173).
R e f e r e n c e s
[1] Gas infrastructure Europe, Map Dataset in Excel-format Storage map. Available at: http://www.gie.eu/maps_data/storage.html. Accessed 08.03.2011.
[2] Foss M., Interstate Natural Gas Quality Specifications and Interchangeability, Cent-er for Energy Economics, 2004.
[3] NET4GAS, Gas quality parameters. Available at: http://extranet.transgas.cz/caloricity_spec.aspx − accessed 08.03.2011.
52
[4] Gandhidasan P. , Al-Farayedhi A. , Al-Mubarak A. , Dehydration of natural gas using solid desiccants, Energy, 26, 2001, 855-868.
[5] Gandhidasan P. , Parametric Analysis of Natural Gas Dehydration by Triethylene Glycol Solution, Energy Sources, 25, 2003, 189-201.
[6] CHEM Group, Inc., Triethylene Glycol – Liquid Density Data. Available at: http://www.chem-group.com/services/teg-density.tpl. Accessed 06.03.2012.
[7] CHEM Group, Inc., Triethylene Glycol − Kinematic Viscosity Data. Available at: http://www.chem-group.com/services/teg-viscosity.tpl. Accessed 06.03.2012.
[8] Bahadori A. , Vuthaluru H.B. , Simple methodology for sizing of absorbers for TEG gas dehydration systems, Energy, 34, 2009, 1910-1916.
[9] Hubbard R.A. , Campbel l J .M., An appraisal of gas dehydration processes, Hydrocarbon Engineering, 5, 2000, 71-74.
[10] Tagl iabue M., Farrusseng D. , Valencia S. , Aguado S. , Ravon U. , Rizzo C., Natural gas treating by selective adsorption: Material science and chemical engi-neering interplay, Chemical Engineering Journal, 155, 2009, 553-566.
[11] Kumar S. , Gas Production Engineering, Houston, Gulf Professional Publishing, 1987.[12] Jochem G. , Axens Multibed Systems for the Dehydration of Natural Gas, PETEM,
2002.[13] Schinkelshoek P. , Epsom H.D. , Supersonic gas conditioning – commercialization
of twister technology, 87th Annual Convention, Grapevine, Texas 2008.[14] Wen C. , Cao X. , Zhang J . , Wu L. , Three-dimensional Numerical Simulation of the
Supersonic Swirling Separator, Twentieth International Offshore and Polar Engineering Conference, Beijing 2010.
[15] Ma Q. , Hu D. , J iang J . , Qiu Z. , Numerical study of the spontaneous nucleation of self-rotational moist gas in a converging-diverging nozzle, International Journal of Computational Fluid Dynamics, 2010, 29-36.
[16] Karimi A. , Abdi M.A. , Selective dehydration of high-pressure natural gas using su-personic nozzles, Chemical Engineering and Processing, 48, 2006, 560-568.
[17] Twister B.V. , Twister supersonic separator – Experience. Available at: http://twisterbv.com/products-services/twister-supersonic-separator/experience/.Accessed 07.03.2012.
[18] Bett ing M., Epsom H. , High velocities make a unique separator and dewpointer, World Oil, 2007, 197-200.
[19] GPSA, Engineering Data Book, 12th ed. Tulsa: GPSA Press, 2004[20] Netuši l M., Dit l P. , Comparison of methods for dehydration of natural gas stored in
underground reservoirs, Inżynieria i Aparatura Chemiczna, vol. 49, no. 2, 2010, 87-88. [21] Netuši l M., Dit l P. , Stoček P. , Energy comparison of conventional methods of nat-
ural gas dehydration and presentation of a new method, Rynek Gazu, 2011, 153-165 (in Polish).
[22] Netusi l M., Dit l P. , Comparison of three methods for natural gas dehydration, Jour-nal of Natural Gas Chemistry, Volume 20, Issue 5, September 2011, 471-476.
ERIK ESCHE, DAVID MÜLLER, MICHAEL MÜLLER, GÜNTER WOZNY*,
1 JAN SCHÖNEBERGER, HOLGER THIELERT**
INNOVATIVE PRODUCT AND PROCESS DEVELOPMENT WITH MOBILE AND MODULAR
MINI-PLANT-TECHNIQUES
NOWATORSKIE PRACE ROZWOJOWE NAD PRODUKTAMI I PROCESAMI Z WYKORZYSTANIEM MOBILNYCH
I MODULARNYCH TECHNIK MINI-APARATURYA b s t r a c t
For coke oven gas purification the removal of aromatic hydrocarbons is of great economic interest. In this contri-bution, feasibility and experimental studies on the applicability of biodiesel as an alternative absorbent to genera-te crude benzene under industrial conditions are presented. A flexible, modular, and transportable mini-plant was designed and built at Berlin Institute of Technology. The mini-plant mainly consists of an absorption and a desorp-tion column allowing for the continuous loading and regeneration of the scrubbing fluid. After preliminary test runs, the whole mini-plant was connected to a coking plan. Subsequently, the modular mini-plant is modified and expanded for a more general application of an absorption and desorption process as CO2 separation from vario-us gases of the chemical industry or power plants is of interest. Especially with regards to flexibility, general de-sign aspects are discussed.
Keywords: CO2 separation, absorption, process design, modular constructions
S t r e s z c z e n i eUsuwanie węglowodorów aromatycznych ma ogromne znaczenie ekonomiczne dla oczyszczania gazu koksowniczego. W artykule niniejszym przedstawiono wdrożeniowe i doświadczalne badania nad zastosowaniem biologicznego oleju napędowego jako alternatywnego absorbentu przy wytwarzaniu surowego benzenu w warunkach przemysłowych. W Berlińskim Instytucie Technologicznym zaprojektowano i zbudowano wielofunkcyjną przewoźną mini-aparaturę modularną złożoną przede wszystkim z kolumny absorpcji i desorpcji, co umożliwia ciągłe ładowanie i regenerowanie płynu przemywającego. Po przeprowadzeniu testu wstępnego mini-aparaturę podłączono do koksowni. W konsekwencji mini-aparaturę modularną zmodyfikowano i przeznaczono do szerszego zastosowania w procesie absorpcji i desorpcji, jako że oddzielanie CO2 od różnego rodzaju gazów w przemyśle chemicznym lub elektrowniach budzi dziś spore zainteresowanie. Omówione zostają ogólne aspekty projektu, zwłaszcza w odniesieniu do jego wielofunkcyjności.Słowa kluczowe: oddzielanie CO2, absorpcja, projektowanie procesowe, konstrukcje modularne
* MSc. Erik Esche, MSc. David Müller, Dipl. Eng. Michael Müller, Prof. PhD. Eng. h.c. Günter Wozny Chair of Process Dynamics and Operation, TU Berlin.
** PhD. Eng. Jan Schöneberger, PhD. Eng. Holger Thielert, Uhde GmbH, Gas Treatment Plants, Dortmund.
54
1. Introduction
The removal of hydrocarbons from coke oven gas and the separation of carbon dioxide (CO2) from various gases in power plants or chemical industry represent two of many appli-cations for gas scrubbing processes, which are of scientific and economic interest. An appli-cation to investigate these two goals is discussed in this contribution.
Firstly, recent basic research under lab conditions at Berlin Institute of Technology has shown, that biodiesel is deemed to be an efficient alternative absorbent to generate crude benzene from coke oven gas. Compared to traditional absorbents (e.g. CTO: coal tar oil), biodiesel was found to increase the absorption capability by up to 30%. Moreover, by using biodiesel from rapeseed oil (rapeseed methyl ester), it is possible to further reduce invest-ment and operating costs [2, 5, 6].
Secondly, CO2 needs to be removed from various gas streams for a host of reasons: power plants need to limit their emissions, chemical plants want to further process a product gas stream and need to remove CO2 beforehand, or want to extract it as a product itself. The state-of-the-art removal process for CO2 from gas streams is an absorption using for exam-ple MEA or MDEA [7]. However, several other amine-based scrubbing liquids are being de-veloped, which have been tested in lab environments, but not in many industrial applications.
The application of both considered processes requires the implementation of a com-bined absorption-desorption process for continually loading and regenerating the scrub-bing fluid. In addition, some supporting pre- and post-processing steps are required for the continuous operation.
2. Challenge and solution approach
As all gas compositions in power or chemical plants may be subject to stronger fluc-tuations or contaminations and as it is difficult to simulate those in any lab environment, a mini-plant is required to test the operability and to prepare the next step towards the in-dustrial application. The afore-mentioned variety of applications demands the transportabil-ity of the mini-plant, which needs to be considered during the construction of the plant. The subject of this contribution is the design of a mobile, modular mini-plant and its operation for extracting crude benzene from coke oven gas and the subsequent redesign of the same module into a flexible mini-plant for removing CO2 from gas streams. Apart from the actual plant design various issues have to be faced, namely: operability, process, control, cost effi-ciency, safety, and hazard management; not all of which are discussed herein. With respect to cost efficiency the reusability of mini-plant process units is to be considered.
3. Design and application
By constructing mobile mini-plants the lack of operational experience before the actual in-dustrial application can be rectified [7]. Ideally, a mobile mini-plant can be transported without any greater constructional efforts and connected via standardized interfaces to any industrial site. The lengthiest part of the set-up is reconnecting all cables to the process control system.
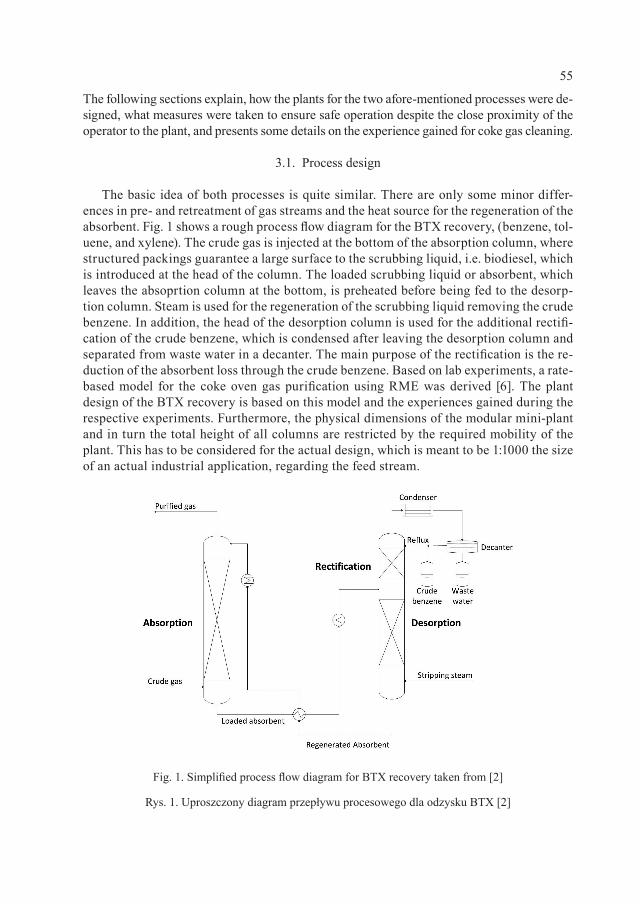
55
The following sections explain, how the plants for the two afore-mentioned processes were de-signed, what measures were taken to ensure safe operation despite the close proximity of the operator to the plant, and presents some details on the experience gained for coke gas cleaning.
3.1. Process design
The basic idea of both processes is quite similar. There are only some minor differ-ences in pre- and retreatment of gas streams and the heat source for the regeneration of the absorbent. Fig. 1 shows a rough process flow diagram for the BTX recovery, (benzene, tol-uene, and xylene). The crude gas is injected at the bottom of the absorption column, where structured packings guarantee a large surface to the scrubbing liquid, i.e. biodiesel, which is introduced at the head of the column. The loaded scrubbing liquid or absorbent, which leaves the absoprtion column at the bottom, is preheated before being fed to the desorp-tion column. Steam is used for the regeneration of the scrubbing liquid removing the crude benzene. In addition, the head of the desorption column is used for the additional rectifi-cation of the crude benzene, which is condensed after leaving the desorption column and separated from waste water in a decanter. The main purpose of the rectification is the re-duction of the absorbent loss through the crude benzene. Based on lab experiments, a rate-based model for the coke oven gas purification using RME was derived [6]. The plant design of the BTX recovery is based on this model and the experiences gained during the respective experiments. Furthermore, the physical dimensions of the modular mini-plant and in turn the total height of all columns are restricted by the required mobility of the plant. This has to be considered for the actual design, which is meant to be 1:1000 the size of an actual industrial application, regarding the feed stream.
Fig. 1. Simplified process flow diagram for BTX recovery taken from [2]
Rys. 1. Uproszczony diagram przepływu procesowego dla odzysku BTX [2]
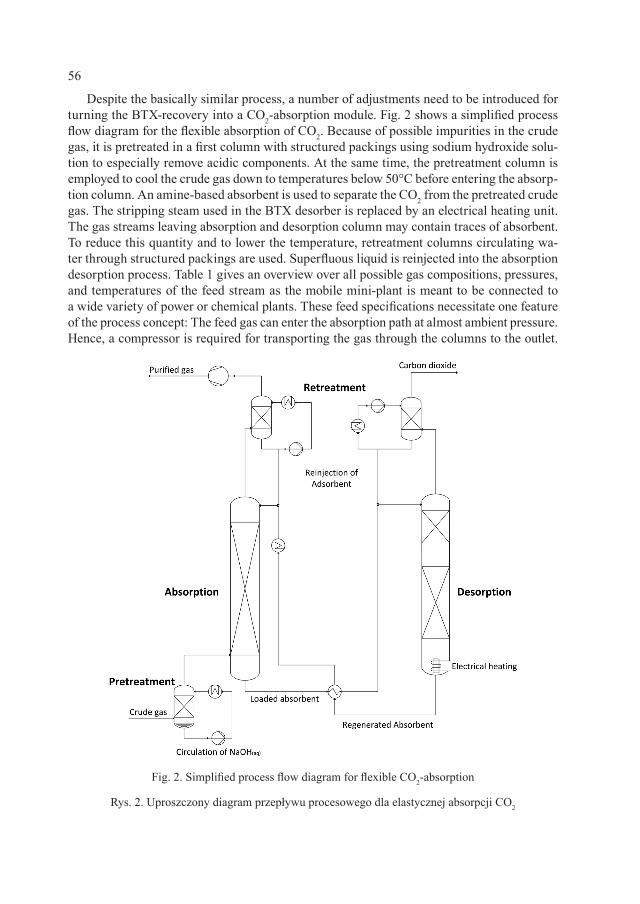
56
Despite the basically similar process, a number of adjustments need to be introduced for turning the BTX-recovery into a CO2-absorption module. Fig. 2 shows a simplified process flow diagram for the flexible absorption of CO2. Because of possible impurities in the crude gas, it is pretreated in a first column with structured packings using sodium hydroxide solu-tion to especially remove acidic components. At the same time, the pretreatment column is employed to cool the crude gas down to temperatures below 50°C before entering the absorp-tion column. An amine-based absorbent is used to separate the CO2 from the pretreated crude gas. The stripping steam used in the BTX desorber is replaced by an electrical heating unit. The gas streams leaving absorption and desorption column may contain traces of absorbent. To reduce this quantity and to lower the temperature, retreatment columns circulating wa-ter through structured packings are used. Superfluous liquid is reinjected into the absorption desorption process. Table 1 gives an overview over all possible gas compositions, pressures, and temperatures of the feed stream as the mobile mini-plant is meant to be connected to a wide variety of power or chemical plants. These feed specifications necessitate one feature of the process concept: The feed gas can enter the absorption path at almost ambient pressure. Hence, a compressor is required for transporting the gas through the columns to the outlet.
Fig. 2. Simplified process flow diagram for flexible CO2-absorption
Rys. 2. Uproszczony diagram przepływu procesowego dla elastycznej absorpcji CO2
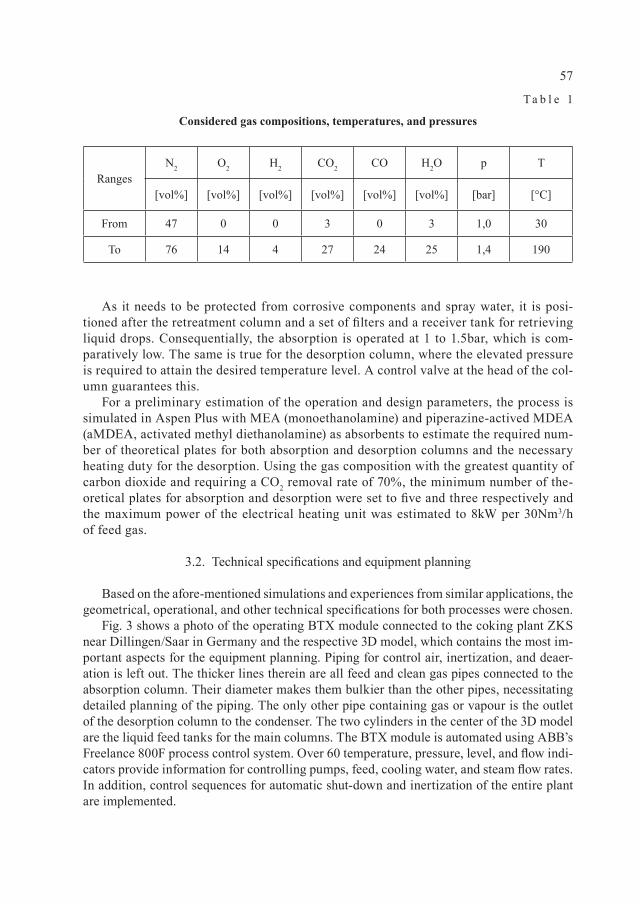
57
T a b l e 1
Considered gas compositions, temperatures, and pressures
RangesN2 O2 H2 CO2 CO H2O p T
[vol%] [vol%] [vol%] [vol%] [vol%] [vol%] [bar] [°C]
From 47 0 0 3 0 3 1,0 30
To 76 14 4 27 24 25 1,4 190
As it needs to be protected from corrosive components and spray water, it is posi-tioned after the retreatment column and a set of filters and a receiver tank for retrieving liquid drops. Consequentially, the absorption is operated at 1 to 1.5bar, which is com-paratively low. The same is true for the desorption column, where the elevated pressure is required to attain the desired temperature level. A control valve at the head of the col-umn guarantees this.
For a preliminary estimation of the operation and design parameters, the process is simulated in Aspen Plus with MEA (monoethanolamine) and piperazine-actived MDEA (aMDEA, activated methyl diethanolamine) as absorbents to estimate the required num-ber of theoretical plates for both absorption and desorption columns and the necessary heating duty for the desorption. Using the gas composition with the greatest quantity of carbon dioxide and requiring a CO2 removal rate of 70%, the minimum number of the-oretical plates for absorption and desorption were set to five and three respectively and the maximum power of the electrical heating unit was estimated to 8kW per 30Nm3/h of feed gas.
3.2. Technical specifications and equipment planning
Based on the afore-mentioned simulations and experiences from similar applications, the geometrical, operational, and other technical specifications for both processes were chosen.
Fig. 3 shows a photo of the operating BTX module connected to the coking plant ZKS near Dillingen/Saar in Germany and the respective 3D model, which contains the most im-portant aspects for the equipment planning. Piping for control air, inertization, and deaer-ation is left out. The thicker lines therein are all feed and clean gas pipes connected to the absorption column. Their diameter makes them bulkier than the other pipes, necessitating detailed planning of the piping. The only other pipe containing gas or vapour is the outlet of the desorption column to the condenser. The two cylinders in the center of the 3D model are the liquid feed tanks for the main columns. The BTX module is automated using ABB’s Freelance 800F process control system. Over 60 temperature, pressure, level, and flow indi-cators provide information for controlling pumps, feed, cooling water, and steam flow rates. In addition, control sequences for automatic shut-down and inertization of the entire plant are implemented.
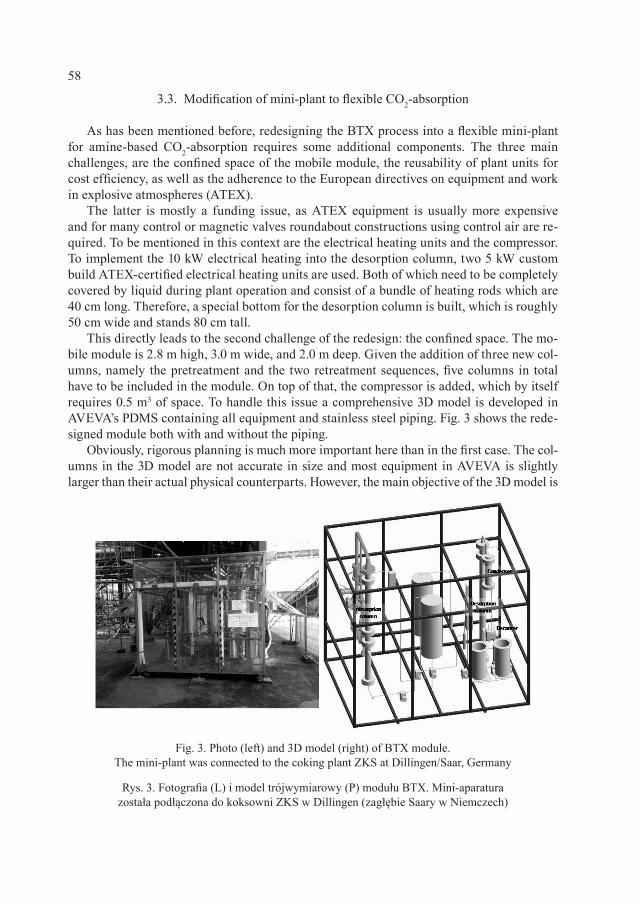
58
3.3. Modification of mini-plant to flexible CO2-absorption
As has been mentioned before, redesigning the BTX process into a flexible mini-plant for amine-based CO2-absorption requires some additional components. The three main challenges, are the confined space of the mobile module, the reusability of plant units for cost efficiency, as well as the adherence to the European directives on equipment and work in explosive atmospheres (ATEX).
The latter is mostly a funding issue, as ATEX equipment is usually more expensive and for many control or magnetic valves roundabout constructions using control air are re-quired. To be mentioned in this context are the electrical heating units and the compressor. To implement the 10 kW electrical heating into the desorption column, two 5 kW custom build ATEX-certified electrical heating units are used. Both of which need to be completely covered by liquid during plant operation and consist of a bundle of heating rods which are 40 cm long. Therefore, a special bottom for the desorption column is built, which is roughly 50 cm wide and stands 80 cm tall.
This directly leads to the second challenge of the redesign: the confined space. The mo-bile module is 2.8 m high, 3.0 m wide, and 2.0 m deep. Given the addition of three new col-umns, namely the pretreatment and the two retreatment sequences, five columns in total have to be included in the module. On top of that, the compressor is added, which by itself requires 0.5 m3 of space. To handle this issue a comprehensive 3D model is developed in AVEVA’s PDMS containing all equipment and stainless steel piping. Fig. 3 shows the rede-signed module both with and without the piping.
Obviously, rigorous planning is much more important here than in the first case. The col-umns in the 3D model are not accurate in size and most equipment in AVEVA is slightly larger than their actual physical counterparts. However, the main objective of the 3D model is
Fig. 3. Photo (left) and 3D model (right) of BTX module. The mini-plant was connected to the coking plant ZKS at Dillingen/Saar, Germany
Rys. 3. Fotografia (L) i model trójwymiarowy (P) modułu BTX. Mini-aparatura została podłączona do koksowni ZKS w Dillingen (zagłębie Saary w Niemczech)
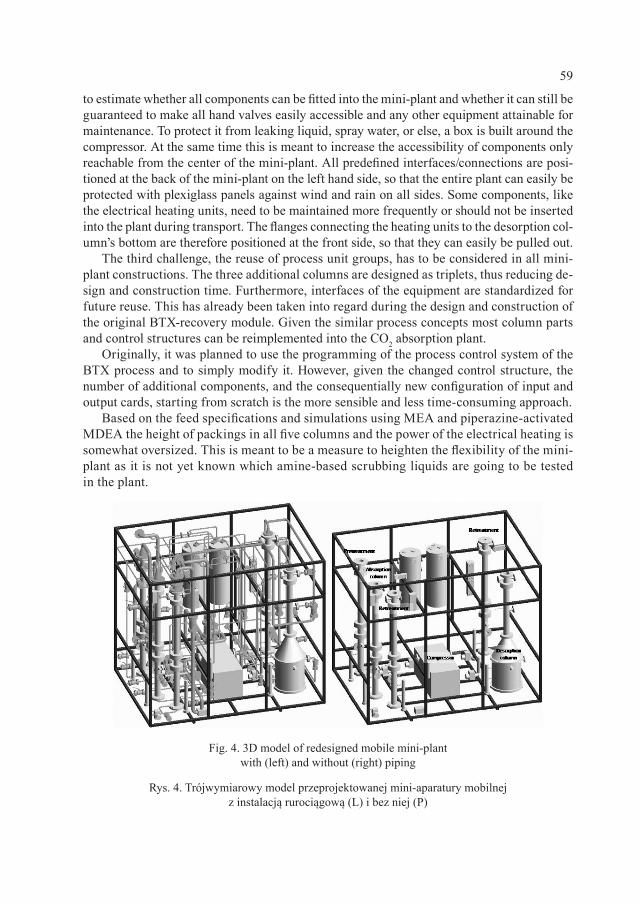
59
to estimate whether all components can be fitted into the mini-plant and whether it can still be guaranteed to make all hand valves easily accessible and any other equipment attainable for maintenance. To protect it from leaking liquid, spray water, or else, a box is built around the compressor. At the same time this is meant to increase the accessibility of components only reachable from the center of the mini-plant. All predefined interfaces/connections are posi-tioned at the back of the mini-plant on the left hand side, so that the entire plant can easily be protected with plexiglass panels against wind and rain on all sides. Some components, like the electrical heating units, need to be maintained more frequently or should not be inserted into the plant during transport. The flanges connecting the heating units to the desorption col-umn’s bottom are therefore positioned at the front side, so that they can easily be pulled out.
The third challenge, the reuse of process unit groups, has to be considered in all mini-plant constructions. The three additional columns are designed as triplets, thus reducing de-sign and construction time. Furthermore, interfaces of the equipment are standardized for future reuse. This has already been taken into regard during the design and construction of the original BTX-recovery module. Given the similar process concepts most column parts and control structures can be reimplemented into the CO2 absorption plant.
Originally, it was planned to use the programming of the process control system of the BTX process and to simply modify it. However, given the changed control structure, the number of additional components, and the consequentially new configuration of input and output cards, starting from scratch is the more sensible and less time-consuming approach.
Based on the feed specifications and simulations using MEA and piperazine-activated MDEA the height of packings in all five columns and the power of the electrical heating is somewhat oversized. This is meant to be a measure to heighten the flexibility of the mini-plant as it is not yet known which amine-based scrubbing liquids are going to be tested in the plant.
Fig. 4. 3D model of redesigned mobile mini-plant with (left) and without (right) piping
Rys. 4. Trójwymiarowy model przeprojektowanej mini-aparatury mobilnej z instalacją rurociągową (L) i bez niej (P)
60
3.4. Experience of coke oven gas cleaning
As the experimental studies on the coke oven gas purification have already been pub-lished elsewhere [2-6], the main findings will only briefly be revisited here.
During more than 440 operating hours, with a maximum of 90 hours between start-up and shutdown, coke oven gas of flow rates between 50 and 65 Nm3/h was treated with RME circulating at 45 to 65 l/h. The steam flow rate was varied between 0.8 and 2.2 kg/h and the head temperature of the rectification part between 98 and 110°C. According to [2] this amounts to 1100 hours in an industrial size application.
Through stripping the RME with steam, the accumulation of naphthalene can be avoided and the regeneration improved. At liquid-to-gas ratios of roughly 1 l/Nm3 up to 70% of the crude benzene contained in the feed gas can be recovered. At the same time, less than 0.05 wt% of crude benzene remains in the regenerated RME at the bottom of the desorption col-umn. The desired product purity of 91 to 95 wt% can be achieved for head temperatures of 110°C and less. Using CTO as an absorbent this temperature was limited to 90°C, imply-ing a higher reflux ratio. At the same time almost constant thermodynamic behavior is ob-served for RME, which shows a stark contrast to CTO, from which lighter components dis-appear with the crude benzene.
In total, the application of RME instead of CTO for the coke oven gas purification allows for both lower operating and investment costs as fewer separation steps are required. The stable operation in the mobile modular-mini-plant shows the industrial applicability of the process concept. Experience for the CO2 removal has yet to be gained.
4. Conclusions
Through the construction of mobile, modular mini-plants, the void between lab exper-iments and the actual industrial application may be bridged. The deliberations in this con-tribution show this for the removal of aromatic hydrocarbons from coke oven gas and the CO2 separation from various gas streams, which are both of economic interest for a possi-ble industrial application. During the various stages of the plant design, operability and con-structability have to be taken more into consideration than for any full-scale plant as the confined space, flexibility and uniqueness of the plant does not allow for full automation.
Hence, rigorous 3D planning of the equipment is required, especially with respect to the safety of the operator and ease of maintenance. The industrial viability of the BTX-recov-ery has already been successfully proven using the herein described mini-plant and shows promising potential for a large-scale application. Despite their uniqueness, modularization of applied equipment can help reduce design effort, construction time, and costs.
A b b r e v i a t i o n s
ATEX – European directives on equipment and work in explosive atmospheres BTX – benzene, toluene, and xyleneCO2 – carbon dioxide
61
CTO – coal tar oil aMDEA – piperazine-activated MDEA MDEA – methyl diethanolamine MEA – monoethanolamineRME – rapeseed methyl ester
R e f e r e n c e s
[1] Hady Ł. , Wozny G. , Reuse-Atlas for know-how and quality-assurance in modular plant design, Proceedings: 8th World Congress of Chemical Engineering, August 23-27, Montréal, Québec, Canada 2009.
[2] Müller M., Experimental investigations on Biodiesel as an alternative absorbent for the recovery of aromatic hydrocarbons under industrial conditions, Distillation Absorp-tion 2010.
[3] Müller M., Innovative Produkt- und Prozessentwicklung mittels mobiler und modu-larer Mini-plant-Technik, Jahrestreffen der Fachgemeinschaft Prozess-, Apparate- und Anlagentechnik, Fulda 2011.
[4] Müller M., On the applicability of Biodiesel as Absorbent for the Improvement of Aromatic Hydrocarbons Removal: An Industrial Application, 2010.
[5] Richter D. , Absorption of aromatic hydrocarbons in multicomponent mixtures: A comparison of simulations and measurements in a pilot plant, 18th European Sympo-sium on Computer Aided Process Engineering – ESCAPE 18.
[6] Richter D. , Rate-Based and Equilibrium Model Approach for the Absorption of Aromatic Hydrocarbons in Multicomponent Mixtures, AIChE Annual Meeting, Nov. 4-9, 2007, Salt Lake City 2007.
[7] Stünkel S. , Simultaneous Synthesis of the Downstream Process and the Reactor Con-cept for the Oxidative Coupling of Methane (OCM), 10th International Symposium on Process Systems Engineering, PSE 2009.

HAMID REZA GODINI, STANISLAV JASO, WALTER MARTINI, STEFFEN STÜNKEL, DANIEL SALERNO, SON NGHIEM XUAN,
SHANKUI SONG, SETAREHALSADAT SADJADI, HARSHIL TRIVEDI, HARVEY ARELLANO-GARCIA, GÜNTER WOZNY*1
CONCURRENT REACTOR ENGINEERING, SEPARATION ENHANCEMENT AND PROCESS INTENSIFICATION;
COMPREHENSIVE UNICAT1 APPROACH FOR OXIDATIVE COUPLING OF METHANE (OCM)
INŻYNIERIA ZBIEŻNA APARATU REAKCYJNEGO I DOSKONALENIE ORAZ INTENSYFIKACJA PROCESU ODDZIELANIA; KOMPLEKSOWE PODEJŚCIE GRUPY
UNICAT1 DO OKSYDACYJNEGO SPRZĘŻENIA METANU (OCM)
A b s t r a c tFor more than three decades Oxidative Coupling of Methane (OCM) process has been investigated as an attractive alternative for cracking tech-nologies for ethylene production and exploiting the huge resources of natural gas. Developing a uitable catalyst and analyzing proper reactor feeding policy, reviewing and deploying the efficient methods in separation and purification of the undesired and desired products, possible energy saving and process intensification in each section, each has been the subject of many researches in the past. In this paper, these aspects will be addressed simultaneously in a general overview of the main research activities performed in the chair of process dynamics and opera-tion at Berlin Institute of Technology under the context of Unifying Concepts in Catalysis (UniCat) project. Moreover, a cost estimation of the industrial scale OCM process guiding the analysis method to address the potentials and disadvantageous of each OCM scenario structure, hi-ghlighted the possible process intensifications potentials in case of energy and equipment.Keywords: concurrent engineering, reactor engineering, process synthesis, Oxidative Coupling of Methane (OCM), mini-plant scale experimentation
S t r e s z c z e n i eProces oksydacyjnego sprzężenia metanu (OCM) był przez ponad trzy dekady rozpatrywany jako atrakcyjna alternatywa dla błyskawicznych tech-nologii wytwarzania etylenu oraz eksploatacji ogromnych zasobów gazu naturalnego. Przedmiotem licznych badań prowadzonych w przeszło-ści były: opracowywanie właściwego katalizatora i analizowanie odpowiednich metod napędzania aparatu reakcyjnego, poznawanie i stosowanie skutecznych metod oddzielania i oczyszczania produktów pożądanych i niepożądanych, możliwości oszczędzania energii i intensyfikacji procesu na każdym z jego etapów. W artykule niniejszym aspekty te będą omawiane jednocześnie w ramach ogólnego przeglądu najważniejszych działań badawczych podejmowanych w Katedrze Dynamiki Działań Procesowych Berlińskiego Instytutu Technologicznego w kontekście projektu Uni-Cat (ujednolicone koncepcje katalizy). Wyciągnięto wnioski konceptualne i podjęto decyzje z wykorzystaniem danych doświadczalnych dostar-czonych przez mini-aparaturę grupy UniCat. Ponadto szacowany koszt procesu oksydacyjnego sprzężenia metanu w skali przemysłowej, odnoszą-cego metodę analizy do zalet i wad każdego ze scenariuszy OCM, uwydatnił możliwość intensyfikacji procesu w zakresie energii oraz aparatury.Keywords: inżynieria zbieżna, inżynieria aparatu reakcyjnego, synteza procesowa, oksydacyjne sprzężenie metanu (OCM), eksperymenty w skali mini-aparatury
* PhD. Hamid Reza Godini, Chair of Process Dynamics and Operations, TU Berlin.1 UniCat: Unifying Concepts in Catalysis, a research group coordinated by Technische Universi-
tät Berlin and funded by the German Research Foundation – Deutsche Forschungsgemeinschaft.
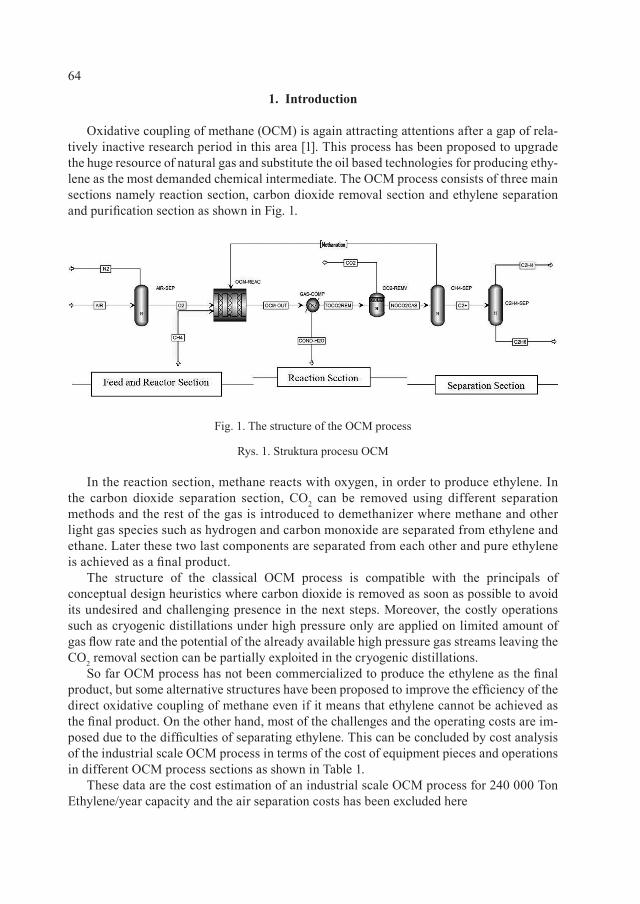
64
1. Introduction
Oxidative coupling of methane (OCM) is again attracting attentions after a gap of rela-tively inactive research period in this area [1]. This process has been proposed to upgrade the huge resource of natural gas and substitute the oil based technologies for producing ethy-lene as the most demanded chemical intermediate. The OCM process consists of three main sections namely reaction section, carbon dioxide removal section and ethylene separation and purification section as shown in Fig. 1.
In the reaction section, methane reacts with oxygen, in order to produce ethylene. In the carbon dioxide separation section, CO2 can be removed using different separation methods and the rest of the gas is introduced to demethanizer where methane and other light gas species such as hydrogen and carbon monoxide are separated from ethylene and ethane. Later these two last components are separated from each other and pure ethylene is achieved as a final product.
The structure of the classical OCM process is compatible with the principals of conceptual design heuristics where carbon dioxide is removed as soon as possible to avoid its undesired and challenging presence in the next steps. Moreover, the costly operations such as cryogenic distillations under high pressure only are applied on limited amount of gas flow rate and the potential of the already available high pressure gas streams leaving the CO2 removal section can be partially exploited in the cryogenic distillations.
So far OCM process has not been commercialized to produce the ethylene as the final product, but some alternative structures have been proposed to improve the efficiency of the direct oxidative coupling of methane even if it means that ethylene cannot be achieved as the final product. On the other hand, most of the challenges and the operating costs are im-posed due to the difficulties of separating ethylene. This can be concluded by cost analysis of the industrial scale OCM process in terms of the cost of equipment pieces and operations in different OCM process sections as shown in Table 1.
These data are the cost estimation of an industrial scale OCM process for 240 000 Ton Ethylene/year capacity and the air separation costs has been excluded here
Fig. 1. The structure of the OCM process
Rys. 1. Struktura procesu OCM
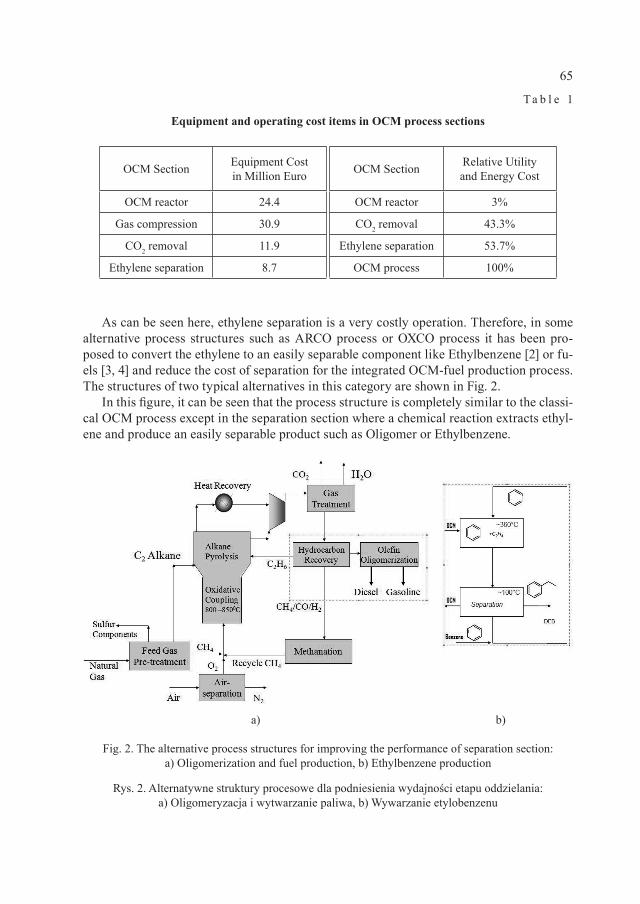
65
T a b l e 1
Equipment and operating cost items in OCM process sections
OCM Section Equipment Cost in Million Euro OCM Section Relative Utility
and Energy Cost
OCM reactor 24.4 OCM reactor 3%
Gas compression 30.9 CO2 removal 43.3%
CO2 removal 11.9 Ethylene separation 53.7%
Ethylene separation 8.7 OCM process 100%
As can be seen here, ethylene separation is a very costly operation. Therefore, in some alternative process structures such as ARCO process or OXCO process it has been pro-posed to convert the ethylene to an easily separable component like Ethylbenzene [2] or fu-els [3, 4] and reduce the cost of separation for the integrated OCM-fuel production process. The structures of two typical alternatives in this category are shown in Fig. 2.
In this figure, it can be seen that the process structure is completely similar to the classi-cal OCM process except in the separation section where a chemical reaction extracts ethyl-ene and produce an easily separable product such as Oligomer or Ethylbenzene.
Fig. 2. The alternative process structures for improving the performance of separation section: a) Oligomerization and fuel production, b) Ethylbenzene production
Rys. 2. Alternatywne struktury procesowe dla podniesienia wydajności etapu oddzielania: a) Oligomeryzacja i wytwarzanie paliwa, b) Wywarzanie etylobenzenu
a) b)
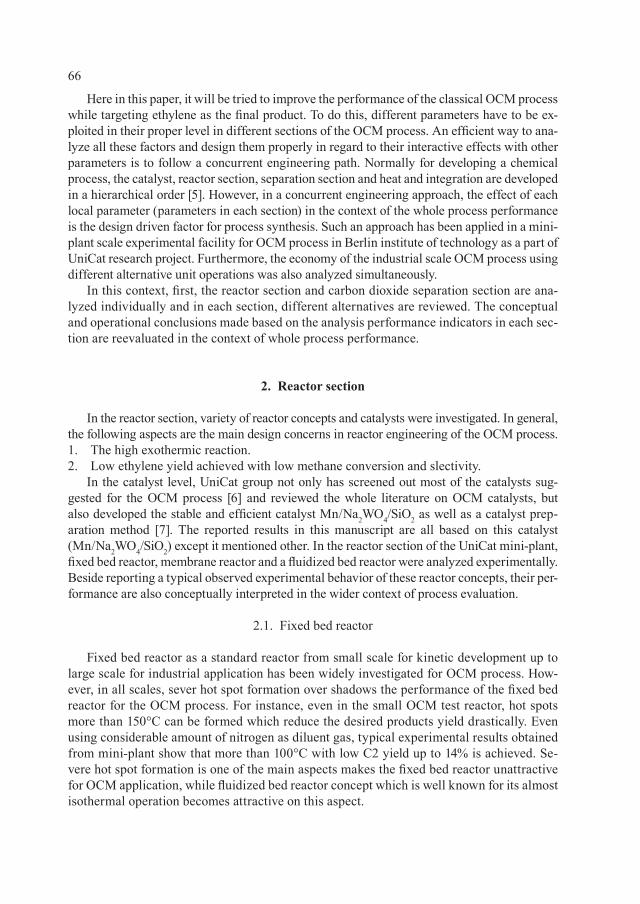
66
Here in this paper, it will be tried to improve the performance of the classical OCM process while targeting ethylene as the final product. To do this, different parameters have to be ex-ploited in their proper level in different sections of the OCM process. An efficient way to ana-lyze all these factors and design them properly in regard to their interactive effects with other parameters is to follow a concurrent engineering path. Normally for developing a chemical process, the catalyst, reactor section, separation section and heat and integration are developed in a hierarchical order [5]. However, in a concurrent engineering approach, the effect of each local parameter (parameters in each section) in the context of the whole process performance is the design driven factor for process synthesis. Such an approach has been applied in a mini-plant scale experimental facility for OCM process in Berlin institute of technology as a part of UniCat research project. Furthermore, the economy of the industrial scale OCM process using different alternative unit operations was also analyzed simultaneously.
In this context, first, the reactor section and carbon dioxide separation section are ana-lyzed individually and in each section, different alternatives are reviewed. The conceptual and operational conclusions made based on the analysis performance indicators in each sec-tion are reevaluated in the context of whole process performance.
2. Reactor section
In the reactor section, variety of reactor concepts and catalysts were investigated. In general, the following aspects are the main design concerns in reactor engineering of the OCM process.1. The high exothermic reaction.2. Low ethylene yield achieved with low methane conversion and slectivity.
In the catalyst level, UniCat group not only has screened out most of the catalysts sug-gested for the OCM process [6] and reviewed the whole literature on OCM catalysts, but also developed the stable and efficient catalyst Mn/Na2WO4/SiO2 as well as a catalyst prep-aration method [7]. The reported results in this manuscript are all based on this catalyst (Mn/Na2WO4/SiO2) except it mentioned other. In the reactor section of the UniCat mini-plant, fixed bed reactor, membrane reactor and a fluidized bed reactor were analyzed experimentally. Beside reporting a typical observed experimental behavior of these reactor concepts, their per-formance are also conceptually interpreted in the wider context of process evaluation.
2.1. Fixed bed reactor
Fixed bed reactor as a standard reactor from small scale for kinetic development up to large scale for industrial application has been widely investigated for OCM process. How-ever, in all scales, sever hot spot formation over shadows the performance of the fixed bed reactor for the OCM process. For instance, even in the small OCM test reactor, hot spots more than 150°C can be formed which reduce the desired products yield drastically. Even using considerable amount of nitrogen as diluent gas, typical experimental results obtained from mini-plant show that more than 100°C with low C2 yield up to 14% is achieved. Se-vere hot spot formation is one of the main aspects makes the fixed bed reactor unattractive for OCM application, while fluidized bed reactor concept which is well known for its almost isothermal operation becomes attractive on this aspect.
67
2.2. Fluidized bed reactor
Fluidized bed reactor has been investigated for OCM reactions often because of its capa-bility to address the hot spots formation [8] even in an industrial scale application [3].
In the UniCat mini-plant, a fluidized bed reactor made of quartz glass with an internal diameter of 40 mm was used under the reaction temperature of 750–850°C. An electrical tube furnace and a multipoint thermocouple in 10 points along the reactor supplies the heat and measures the temperature respectively. Outlet gas composition was analyzed by on-line infra-red gas analyzer and time to time with an offline gas chromatograph. The whole sys-tem was automatically controlled using process Siemence-7 system as shown in Fig. 3 and the value of all parameters and performance indicators were recorded on-line.
In Fig. 3a, the picture of the heating zone of the reactor, catalyst bed and the multipoint thermocouple are shown. Fig. 3b shows how the reactor set-up is controlled and the reactor performance indicators are monitored continually.
Typical performance of the fluidized bed shows that almost an isothermal performance with less than 20ºC temperature gradient along the reactor is achievable while a typical se-lectivity toward C2 production is equal to the selectivity toward carbon dioxide production. Moreover, depending on the catalyst type, the ethylene to ethane production ratio are var-ied. Furthermore, proper choosing the operating reaction temperature not only affects the amounts of desired products yield, but also the selectivity and methane conversion which are extremely important on the performance of the separation sections. Fig. 4 enables to simul-taneously consider such an effect on different performance indicators.
Therefore, parallel to cost-benefit analysis performed based on the amount of the reactant consumption-Ethylene production in the reactor section, the consequences of achieving these levels of performance indicators on the whole process performance should be also analyzed.
Fig. 3. The picture of: a) reactor set-up; b) the control room and recording the parameters
Rys. 3. a) Układ aparatu reakcyjnego b) pokój aparatury z zapisem parametrów
a) b)
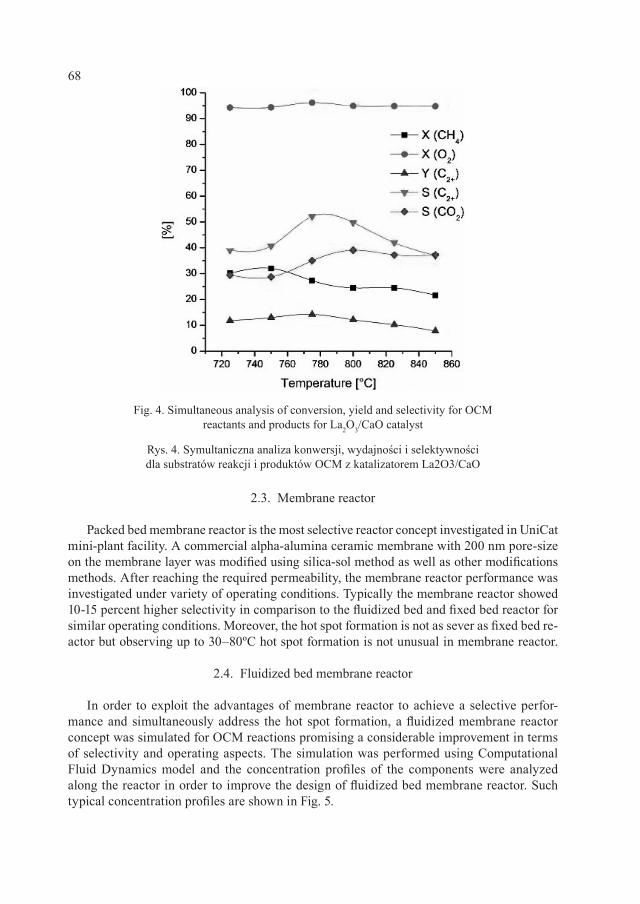
68
2.3. Membrane reactor
Packed bed membrane reactor is the most selective reactor concept investigated in UniCat mini-plant facility. A commercial alpha-alumina ceramic membrane with 200 nm pore-size on the membrane layer was modified using silica-sol method as well as other modifications methods. After reaching the required permeability, the membrane reactor performance was investigated under variety of operating conditions. Typically the membrane reactor showed 10-15 percent higher selectivity in comparison to the fluidized bed and fixed bed reactor for similar operating conditions. Moreover, the hot spot formation is not as sever as fixed bed re-actor but observing up to 30–80ºC hot spot formation is not unusual in membrane reactor.
2.4. Fluidized bed membrane reactor
In order to exploit the advantages of membrane reactor to achieve a selective perfor-mance and simultaneously address the hot spot formation, a fluidized membrane reactor concept was simulated for OCM reactions promising a considerable improvement in terms of selectivity and operating aspects. The simulation was performed using Computational Fluid Dynamics model and the concentration profiles of the components were analyzed along the reactor in order to improve the design of fluidized bed membrane reactor. Such typical concentration profiles are shown in Fig. 5.
Fig. 4. Simultaneous analysis of conversion, yield and selectivity for OCM reactants and products for La2O3/CaO catalyst
Rys. 4. Symultaniczna analiza konwersji, wydajności i selektywności dla substratów reakcji i produktów OCM z katalizatorem La2O3/CaO
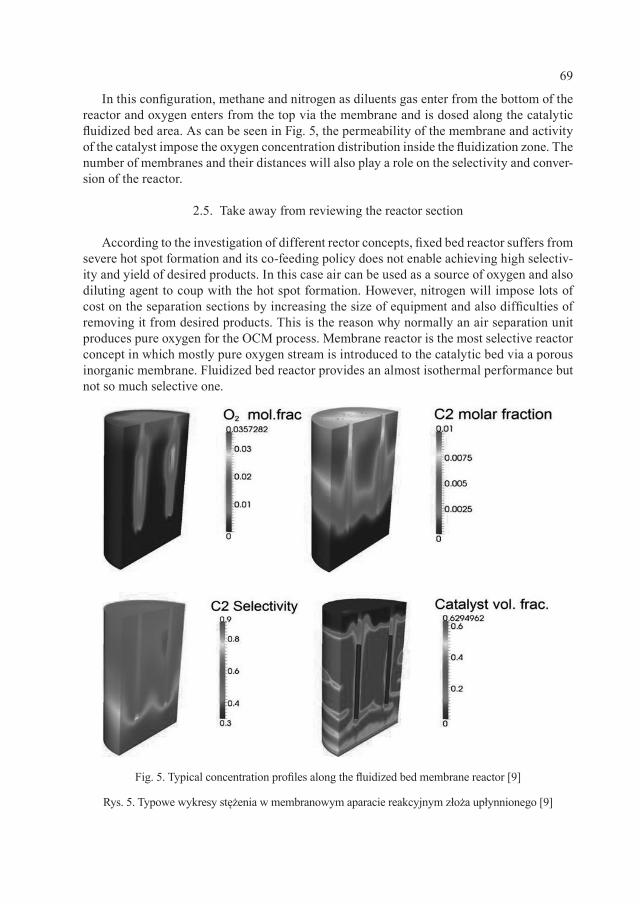
69
In this configuration, methane and nitrogen as diluents gas enter from the bottom of the reactor and oxygen enters from the top via the membrane and is dosed along the catalytic fluidized bed area. As can be seen in Fig. 5, the permeability of the membrane and activity of the catalyst impose the oxygen concentration distribution inside the fluidization zone. The number of membranes and their distances will also play a role on the selectivity and conver-sion of the reactor.
2.5. Take away from reviewing the reactor section
According to the investigation of different rector concepts, fixed bed reactor suffers from severe hot spot formation and its co-feeding policy does not enable achieving high selectiv-ity and yield of desired products. In this case air can be used as a source of oxygen and also diluting agent to coup with the hot spot formation. However, nitrogen will impose lots of cost on the separation sections by increasing the size of equipment and also difficulties of removing it from desired products. This is the reason why normally an air separation unit produces pure oxygen for the OCM process. Membrane reactor is the most selective reactor concept in which mostly pure oxygen stream is introduced to the catalytic bed via a porous inorganic membrane. Fluidized bed reactor provides an almost isothermal performance but not so much selective one.
Fig. 5. Typical concentration profiles along the fluidized bed membrane reactor [9]
Rys. 5. Typowe wykresy stężenia w membranowym aparacie reakcyjnym złoża upłynnionego [9]
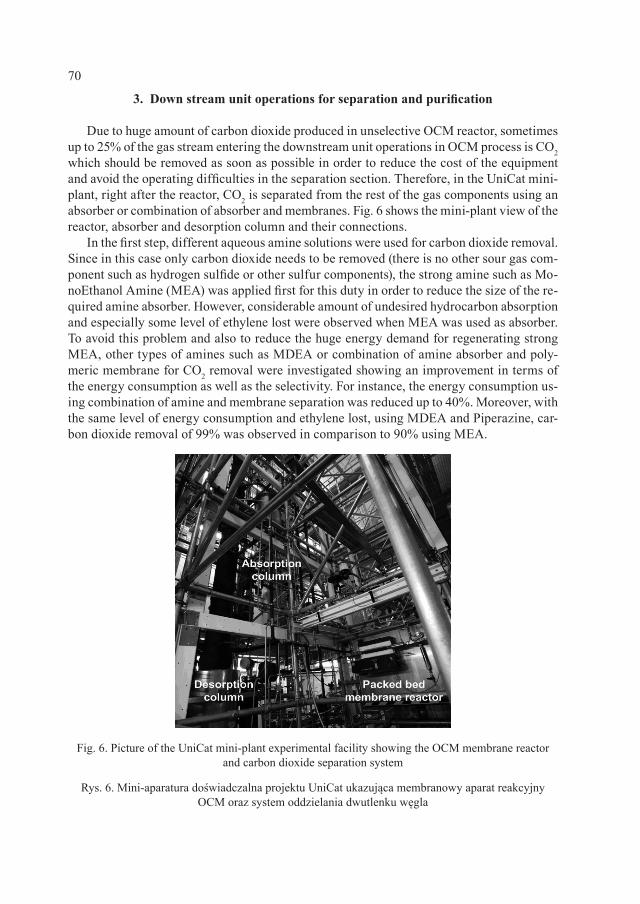
70
3. Down stream unit operations for separation and purification
Due to huge amount of carbon dioxide produced in unselective OCM reactor, sometimes up to 25% of the gas stream entering the downstream unit operations in OCM process is CO2 which should be removed as soon as possible in order to reduce the cost of the equipment and avoid the operating difficulties in the separation section. Therefore, in the UniCat mini-plant, right after the reactor, CO2 is separated from the rest of the gas components using an absorber or combination of absorber and membranes. Fig. 6 shows the mini-plant view of the reactor, absorber and desorption column and their connections.
In the first step, different aqueous amine solutions were used for carbon dioxide removal. Since in this case only carbon dioxide needs to be removed (there is no other sour gas com-ponent such as hydrogen sulfide or other sulfur components), the strong amine such as Mo-noEthanol Amine (MEA) was applied first for this duty in order to reduce the size of the re-quired amine absorber. However, considerable amount of undesired hydrocarbon absorption and especially some level of ethylene lost were observed when MEA was used as absorber. To avoid this problem and also to reduce the huge energy demand for regenerating strong MEA, other types of amines such as MDEA or combination of amine absorber and poly-meric membrane for CO2 removal were investigated showing an improvement in terms of the energy consumption as well as the selectivity. For instance, the energy consumption us-ing combination of amine and membrane separation was reduced up to 40%. Moreover, with the same level of energy consumption and ethylene lost, using MDEA and Piperazine, car-bon dioxide removal of 99% was observed in comparison to 90% using MEA.
Fig. 6. Picture of the UniCat mini-plant experimental facility showing the OCM membrane reactor and carbon dioxide separation system
Rys. 6. Mini-aparatura doświadczalna projektu UniCat ukazująca membranowy aparat reakcyjny OCM oraz system oddzielania dwutlenku węgla
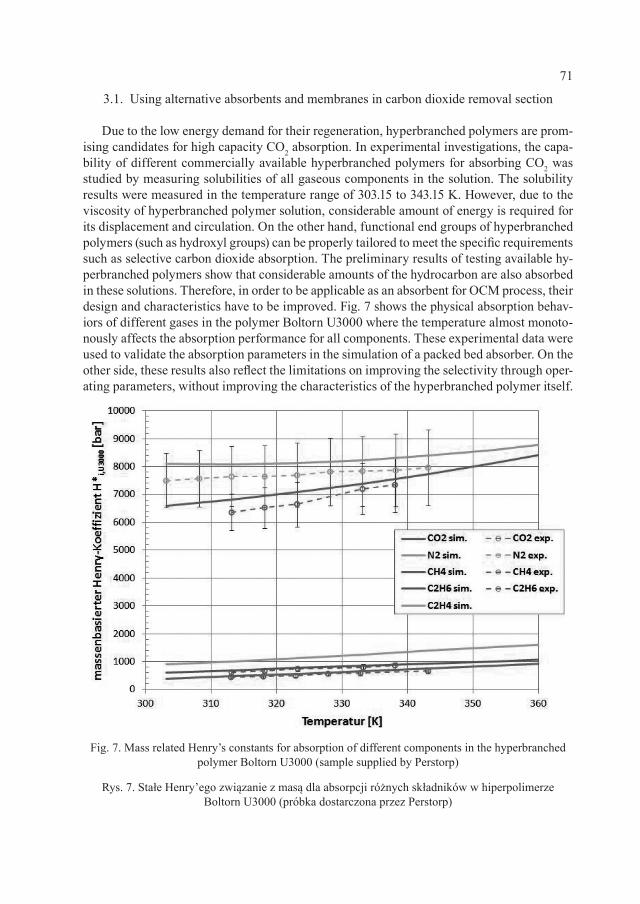
71
3.1. Using alternative absorbents and membranes in carbon dioxide removal section
Due to the low energy demand for their regeneration, hyperbranched polymers are prom-ising candidates for high capacity CO2 absorption. In experimental investigations, the capa-bility of different commercially available hyperbranched polymers for absorbing CO2 was studied by measuring solubilities of all gaseous components in the solution. The solubility results were measured in the temperature range of 303.15 to 343.15 K. However, due to the viscosity of hyperbranched polymer solution, considerable amount of energy is required for its displacement and circulation. On the other hand, functional end groups of hyperbranched polymers (such as hydroxyl groups) can be properly tailored to meet the specific requirements such as selective carbon dioxide absorption. The preliminary results of testing available hy-perbranched polymers show that considerable amounts of the hydrocarbon are also absorbed in these solutions. Therefore, in order to be applicable as an absorbent for OCM process, their design and characteristics have to be improved. Fig. 7 shows the physical absorption behav-iors of different gases in the polymer Boltorn U3000 where the temperature almost monoto-nously affects the absorption performance for all components. These experimental data were used to validate the absorption parameters in the simulation of a packed bed absorber. On the other side, these results also reflect the limitations on improving the selectivity through oper-ating parameters, without improving the characteristics of the hyperbranched polymer itself.
Fig. 7. Mass related Henry’s constants for absorption of different components in the hyperbranched polymer Boltorn U3000 (sample supplied by Perstorp)
Rys. 7. Stałe Henry’ego związanie z masą dla absorpcji różnych składników w hiperpolimerze Boltorn U3000 (próbka dostarczona przez Perstorp)
72
Hereby, methane, ethane and ethylene showed high relative absorption selectivity in com-parison to carbon dioxide. For instance ethane and nitrogen showed 17 times less relative ab-sorption potential in comparison to carbon dioxide while methane is less capable to be ab-sorbed by scoring 42 of relative absorption potential. As with any physical absorbent, selec-tivity strongly depends on partial pressures and therefore, combining this absorption method with another separation method for fine purification of the gas stream can be suggested.
On the other side, using membrane is always an option for separating the gas component due to its low energy demand. In UniCat mini-plant a polyimide membrane was used mostly for preliminarily removing CO2 from product gas mixture prior to the absorption section. This has been done both experimentally and using simulation model enabling further im-proving the design and optimization of the dimensions and operating conditions.
The model for membrane unit was validated via experiments and showed that it is dif-ficult to achieve less than 5% loss of C2H4 with 50% CO2 removal or more in a single mem-brane module. Therefore, a two-stage membrane system was developed and proposed in order to improve the efficiency of the membrane system in which in the first less permea-ble module, more selective performance is achieved due to high carbon dioxide concentra-tion gradient in the early stage of the separation and in the second stage, a quick removal of carbon dioxide is performed and the permeate stream is recycled back to the first step to increase the performance of the first membrane stage. This system has been modeled us-ing Aspen Custom Modeler® where design parameters in one stage membrane module are feed flow rate, operating pressure and membrane area of the module. In the two stage sys-tem, changing the membrane area in different modules as a structural parameter enables to improve the permeability in each module and thereby the selectivity of the whole two stage membrane system. This comes surely with the cost of more complex system and bigger duty of the compressor due to bigger recycled stream.
Pore selectivity of polyimide membrane to separate the CO2 from the gaseous mixture containing ethylene is because of the fact that carbon dioxide and ethylene both are double bound non-polar molecules favored to interact with the membrane material. Unfortunately also for the hyperbranched polymer, ethylene is the closest competitor in absorption.
3.2. Adsorption as an alternative separation system
According to the known criterion for selecting the separation methods for given feed and operating conditions [10], adsorption is not a prior choice for this OCM gas composition with predefined duty of removing carbon dioxide or ethylene. However, by analyzing the se-quence of the required separation systems and the composition of the OCM reactor outlet stream, adsorption can become a promising separation method for OCM process.
The best place for using an adsorber is right after OCM reactor and the best scenario would be to use it instead of demethanizer. Demethanizer imposes huge cost on the classi-cal OCM structure and any effort to substitute it with an efficient unit operation would con-tribute fundamentally to the whole OCM process economy. On the other hand, using ad-sorption enables to intensify the process where some part of the carbon dioxide is separated along with light gas components form ethylene and ethane. These two last components will be separated later using a proper separation method and the remaining carbon dioxide can be removed using an absorber or membrane system.
73
A model based analysis has been performed to analyze the performance of the adsorp-tion system in OCM process. In this simulation, the characteristics of zeolite 4A was used as an adsorbent and detailed modeling of the process enabled to determine the required di-mensions of the adsorption system and its performance.
Although using the available sorbents, Pressure Swing Adsorption (PSA) have not shown a promising results for general ethylene-ethane separation tasks in other applica-tions, but achieving high level of purity and recovery for the OCM process in simulation study is encouraging.
In industrial application, the cycle of adsorption, switching, regeneration (with TSA heating or PSA pressure release) and cooling (TSA) will be completed with different time schedule. Beside, a by-pass adsorber is considered in the set of parallel absorber desorber systems in order to guaranty the continual operation of the system. Some ethylene is lost but in general by assuming ideal carbon dioxide separation, ethylene is finally achieved with 99.9% purity and 99.5% recovery.
4. Process scale analysis and process intensification
Beside the best C2 yield, the impact of some other aspects such as C2 selectivity and ethylene/ethane ratio have to be considered on developing the down-stream units. For example, if the best C2 yield is achieved for highly nitrogen diluted feed stream, it will impose extra cost on the down streaming processes due to the bigger equipment size and processing cost. Lower ethylene/ethane ratio can also cause extra cost in cryogenic distillation for separating them in the purification section. In general, following factors have process wide effects:
– The amount of the non-reacted methane, – The amount of side products especially carbon dioxide, – Using nitrogen diluents.
Even the type of gas diluents in the reactor, the type of the separation system should be taken into consideration. For instance, by using nitrogen as diluents the chance of losing selectivity in the polyimide membrane separation section becomes higher in comparison to using extra methane and working with lower methane to oxygen ratio in the reactor.
As another example, the duty of demethanizer in OCM process is really high since al-most 40% of the gas composition is methane and there is a huge amount of energy needed in demethanizer for such a big scale treatment.
Ethane can be even used in the adsorption as a carrier gas if the adsorption system is preferred for separating the products from the light gas components.
5. Conclusions
A concurrent engineering approach to simultaneously analyze the effects of parameters in the performance of all process sections were technically applied in mini-plant scale OCM process and economically in industrial scale.
74
Several aspects such as effect of hot spot formation restrict the yield of the reactor and diluents gas for instance was considered to meet this challenge in the reactor section. How-ever, it creates another challenge in the separation section and considering another measure such as higher methane to oxygen ratio in the reactor to tackle the original hot spot forma-tion leads to better performance in some alternative separation parts but it imposes huge op-erating costs on the others such as demethanizer. The experimental results of the mini-plant facility enabled to investigate these interactive behaviors technically and the model based economic analysis performed on the industrial scale allowed to analyze the consequence of the design and operating decisions in terms of the fixed and operating cost. Using this pro-cess synthesis and analysis method enables to shorten the analysis procedure and make it more efficient in comparison to the step wise process synthesis approach.
The authors gratefully acknowledge the financial support within the framework of “Unifying Concepts in Catalysis” coordinated by the Technische Universität Berlin and funded by the German Research Foundation - Deutsche Forschungsgemeinschaft.
R e f e r e n c e s
[1] Zavyalova U. , Holena M., Schlögl R. , Baerns M., Statistical Analysis of Past
Catalytic Data on Oxidative Methane Coupling for New Insights into the Composition of High-Performance Catalysts, Chem. Cat. Chem., 3, 2011, 1935-1947.
[2] Graf P.O. , Leffer ts L. , Reactive separation of ethylene from the effluent gas of methane oxidative coupling via alkylation of benzene to ethylbenzene on ZSM-5, Chem. Eng. Sci., 64, 2009, 2773-2780.
[3] Jones C. , Leonard J . , Sofranko J . , Fuels for future: Remote gas conversion, Energy & Fuels, 1, 1987, 12-16.
[4] Edwards J . , Do K. , Tyler R. , The Oxco process. A new concept for the production of olefins from natural gas, Fuel, 71, 1992, 525-334.
[5] Linhhoff B. , A user guide on process integration for the efficient use of energy. Rug-by, Inst. Chem. Engnrs., England 1982.
[6] Arndt S. , Laugel G. , Levchenko S. , Horn R. , Baerns M., Scheff ler M., Schlögl R. , Schomäcker R. , A Critical Assessment of Li/MgO-Based Catalysts for the Oxidative Coupling of Methane, Cat. Rev., Sci. and Eng., 53, 2011, 424-514.
[7] Simon U. , Görke O. , Berthold A. , Arndt S. , Schomäcker R. , Schubert H. , Fluidized bed processing of sodium tungsten manganese catalysts for the oxidative cou-pling of methane, Chem. Eng. Journal, 168, 2011, 1352-1359.
[8] Mleczko L. , Baerns M., Catalytic oxidative coupling of methane reaction engineer-ing aspects and process schemes, Fuel Proc. Tech., 42, 1995, 217-248.
[9] Jaso S. , Arel lano-Garcia H. , Wozny G. , Oxidative coupling of methane in a flu-idized bed reactor: Influence of feeding policy, hydrodynamics, and reactor geometry, Chem. Eng. Journal, 171, 2011, 255-271.
[10] Perry R.H. , Green D.W., Perry’s Chemical Engineers’ Handbook, McGraw-Hill 1999.

TORRES GONZÁLEZ, MICHAL NETUŠIL, PAVEL DITL*1
RAW GAS DEHYDRATION ON SUPERSONIC SWIRLING SEPARATOR
ODWADNIANIE GAZU NATURALNEGO W NADDŹWIĘKOWYM ODDZIELACZU MIESZAJĄCYM
A b s t r a c t
The supersonic separation is a promising new technology. The main advantage of the method is the small size of the supersonic nozzle. A program was designed to select the nozzle combination for an interval of inlet volumetric flow. Industrial application of supersonic separation was tested on a production facility of-fshore Malaysia.Keywords: gas dehydratation, supersonic separator, raw gas
S t r e s z c z e n i e
Oddzielanie naddźwiękowe jest nową, obiecującą technologią. Główną zaletą tej metody jest niewielki rozmiar dyszy naddźwiękowej. Opracowano specjalny program w celu dobrania odpowiedniej dyszy do przedziału objętości przepływu w otworze wlotowym. Zastosowanie oddzielania naddźwiękowego na potrzeby przemysłu było testowane w zakładzie produkcyjnym znajdującym się w strefie przybrzeżnej Malezji.Słowa kluczowe: odwadnianie gazu, oddzielacz naddźwiękowy, gaz naturalny
* Torres González, PhD. Eng. Michal Netušil, Prof. DSc. Eng. Pavel Ditl, Department of Process Engi-neering, Czech Technical University in Prague.
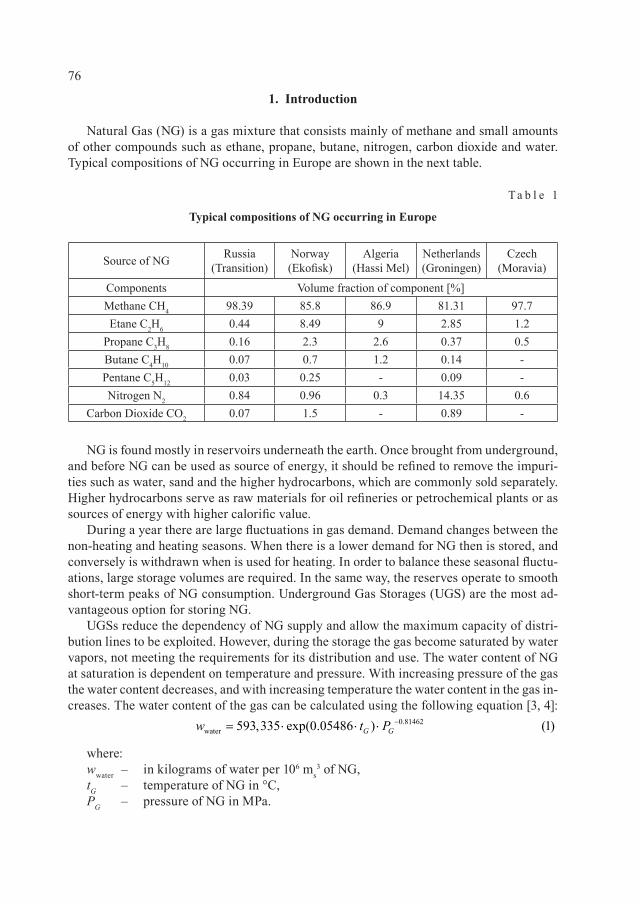
76
1. Introduction
Natural Gas (NG) is a gas mixture that consists mainly of methane and small amounts of other compounds such as ethane, propane, butane, nitrogen, carbon dioxide and water. Typical compositions of NG occurring in Europe are shown in the next table.
T a b l e 1
Typical compositions of NG occurring in Europe
Source of NG Russia (Transition)
Norway (Ekofisk)
Algeria (Hassi Mel)
Netherlands (Groningen)
Czech (Moravia)
Components Volume fraction of component [%]Methane CH4 98.39 85.8 86.9 81.31 97.7Etane C2H6 0.44 8.49 9 2.85 1.2
Propane C3H8 0.16 2.3 2.6 0.37 0.5Butane C4H10 0.07 0.7 1.2 0.14 -Pentane C5H12 0.03 0.25 - 0.09 -Nitrogen N2 0.84 0.96 0.3 14.35 0.6
Carbon Dioxide CO2 0.07 1.5 - 0.89 -
NG is found mostly in reservoirs underneath the earth. Once brought from underground, and before NG can be used as source of energy, it should be refined to remove the impuri-ties such as water, sand and the higher hydrocarbons, which are commonly sold separately. Higher hydrocarbons serve as raw materials for oil refineries or petrochemical plants or as sources of energy with higher calorific value.
During a year there are large fluctuations in gas demand. Demand changes between the non-heating and heating seasons. When there is a lower demand for NG then is stored, and conversely is withdrawn when is used for heating. In order to balance these seasonal fluctu-ations, large storage volumes are required. In the same way, the reserves operate to smooth short-term peaks of NG consumption. Underground Gas Storages (UGS) are the most ad-vantageous option for storing NG.
UGSs reduce the dependency of NG supply and allow the maximum capacity of distri-bution lines to be exploited. However, during the storage the gas become saturated by water vapors, not meeting the requirements for its distribution and use. The water content of NG at saturation is dependent on temperature and pressure. With increasing pressure of the gas the water content decreases, and with increasing temperature the water content in the gas in-creases. The water content of the gas can be calculated using the following equation [3, 4]:
where:wwater – in kilograms of water per 106 ms
3 of NG,tG – temperature of NG in °C,PG – pressure of NG in MPa.
0.81462water 593,335 exp(0.05486 ) (1)G Gw t P −= ⋅ ⋅ ⋅
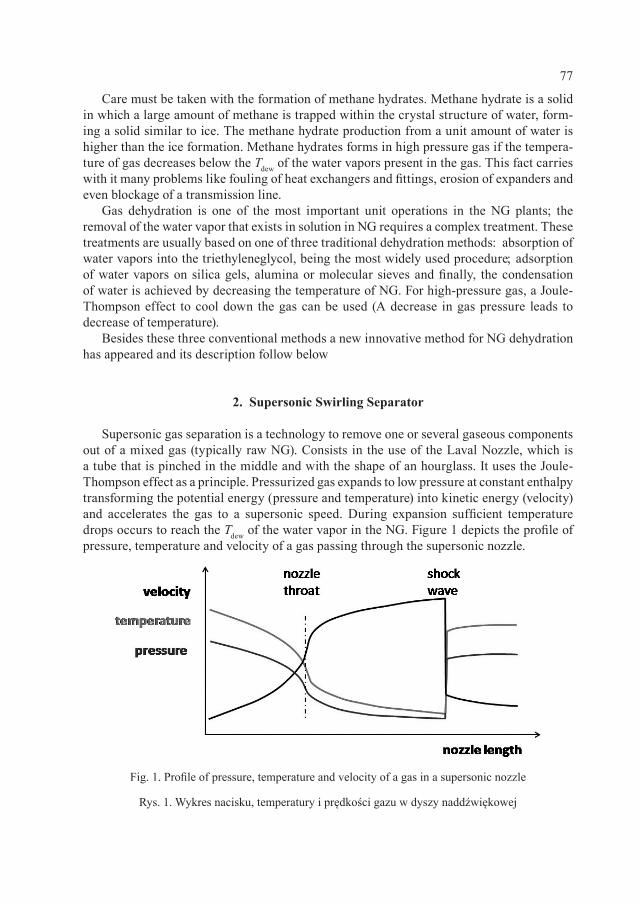
77
Care must be taken with the formation of methane hydrates. Methane hydrate is a solid in which a large amount of methane is trapped within the crystal structure of water, form-ing a solid similar to ice. The methane hydrate production from a unit amount of water is higher than the ice formation. Methane hydrates forms in high pressure gas if the tempera-ture of gas decreases below the Tdew of the water vapors present in the gas. This fact carries with it many problems like fouling of heat exchangers and fittings, erosion of expanders and even blockage of a transmission line.
Gas dehydration is one of the most important unit operations in the NG plants; the removal of the water vapor that exists in solution in NG requires a complex treatment. These treatments are usually based on one of three traditional dehydration methods: absorption of water vapors into the triethyleneglycol, being the most widely used procedure; adsorption of water vapors on silica gels, alumina or molecular sieves and finally, the condensation of water is achieved by decreasing the temperature of NG. For high-pressure gas, a Joule-Thompson effect to cool down the gas can be used (A decrease in gas pressure leads to decrease of temperature).
Besides these three conventional methods a new innovative method for NG dehydration has appeared and its description follow below
2. Supersonic Swirling Separator
Supersonic gas separation is a technology to remove one or several gaseous components out of a mixed gas (typically raw NG). Consists in the use of the Laval Nozzle, which is a tube that is pinched in the middle and with the shape of an hourglass. It uses the Joule-Thompson effect as a principle. Pressurized gas expands to low pressure at constant enthalpy transforming the potential energy (pressure and temperature) into kinetic energy (velocity) and accelerates the gas to a supersonic speed. During expansion sufficient temperature drops occurs to reach the Tdew of the water vapor in the NG. Figure 1 depicts the profile of pressure, temperature and velocity of a gas passing through the supersonic nozzle.
Fig. 1. Profile of pressure, temperature and velocity of a gas in a supersonic nozzle
Rys. 1. Wykres nacisku, temperatury i prędkości gazu w dyszy naddźwiękowej
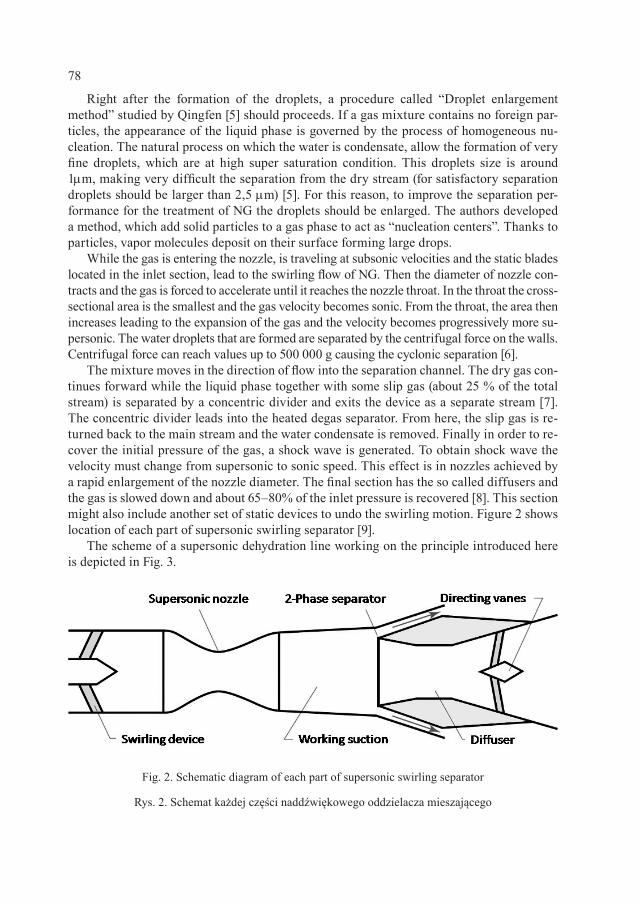
78
Right after the formation of the droplets, a procedure called “Droplet enlargement method” studied by Qingfen [5] should proceeds. If a gas mixture contains no foreign par-ticles, the appearance of the liquid phase is governed by the process of homogeneous nu-cleation. The natural process on which the water is condensate, allow the formation of very fine droplets, which are at high super saturation condition. This droplets size is around 1µm, making very difficult the separation from the dry stream (for satisfactory separation droplets should be larger than 2,5 µm) [5]. For this reason, to improve the separation per-formance for the treatment of NG the droplets should be enlarged. The authors developed a method, which add solid particles to a gas phase to act as “nucleation centers”. Thanks to particles, vapor molecules deposit on their surface forming large drops.
While the gas is entering the nozzle, is traveling at subsonic velocities and the static blades located in the inlet section, lead to the swirling flow of NG. Then the diameter of nozzle con-tracts and the gas is forced to accelerate until it reaches the nozzle throat. In the throat the cross-sectional area is the smallest and the gas velocity becomes sonic. From the throat, the area then increases leading to the expansion of the gas and the velocity becomes progressively more su-personic. The water droplets that are formed are separated by the centrifugal force on the walls. Centrifugal force can reach values up to 500 000 g causing the cyclonic separation [6].
The mixture moves in the direction of flow into the separation channel. The dry gas con-tinues forward while the liquid phase together with some slip gas (about 25 % of the total stream) is separated by a concentric divider and exits the device as a separate stream [7]. The concentric divider leads into the heated degas separator. From here, the slip gas is re-turned back to the main stream and the water condensate is removed. Finally in order to re-cover the initial pressure of the gas, a shock wave is generated. To obtain shock wave the velocity must change from supersonic to sonic speed. This effect is in nozzles achieved by a rapid enlargement of the nozzle diameter. The final section has the so called diffusers and the gas is slowed down and about 65–80% of the inlet pressure is recovered [8]. This section might also include another set of static devices to undo the swirling motion. Figure 2 shows location of each part of supersonic swirling separator [9].
The scheme of a supersonic dehydration line working on the principle introduced here is depicted in Fig. 3.
Fig. 2. Schematic diagram of each part of supersonic swirling separator
Rys. 2. Schemat każdej części naddźwiękowego oddzielacza mieszającego
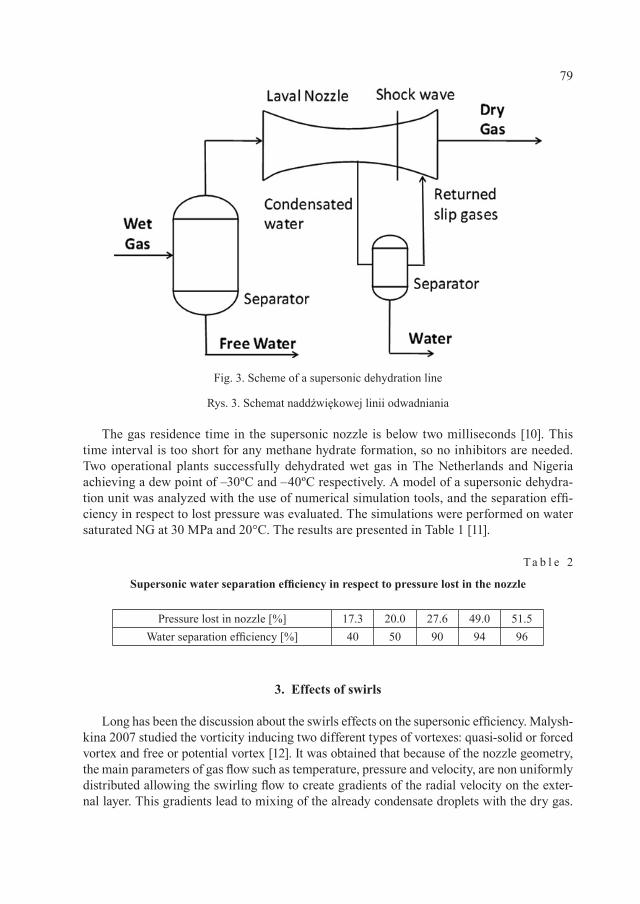
79
The gas residence time in the supersonic nozzle is below two milliseconds [10]. This time interval is too short for any methane hydrate formation, so no inhibitors are needed. Two operational plants successfully dehydrated wet gas in The Netherlands and Nigeria achieving a dew point of –30ºC and –40ºC respectively. A model of a supersonic dehydra-tion unit was analyzed with the use of numerical simulation tools, and the separation effi-ciency in respect to lost pressure was evaluated. The simulations were performed on water saturated NG at 30 MPa and 20°C. The results are presented in Table 1 [11].
T a b l e 2
Supersonic water separation efficiency in respect to pressure lost in the nozzle
Pressure lost in nozzle [%] 17.3 20.0 27.6 49.0 51.5Water separation efficiency [%] 40 50 90 94 96
3. Effects of swirls
Long has been the discussion about the swirls effects on the supersonic efficiency. Malysh-kina 2007 studied the vorticity inducing two different types of vortexes: quasi-solid or forced vortex and free or potential vortex [12]. It was obtained that because of the nozzle geometry, the main parameters of gas flow such as temperature, pressure and velocity, are non uniformly distributed allowing the swirling flow to create gradients of the radial velocity on the exter-nal layer. This gradients lead to mixing of the already condensate droplets with the dry gas.
Fig. 3. Scheme of a supersonic dehydration line
Rys. 3. Schemat naddźwiękowej linii odwadniania
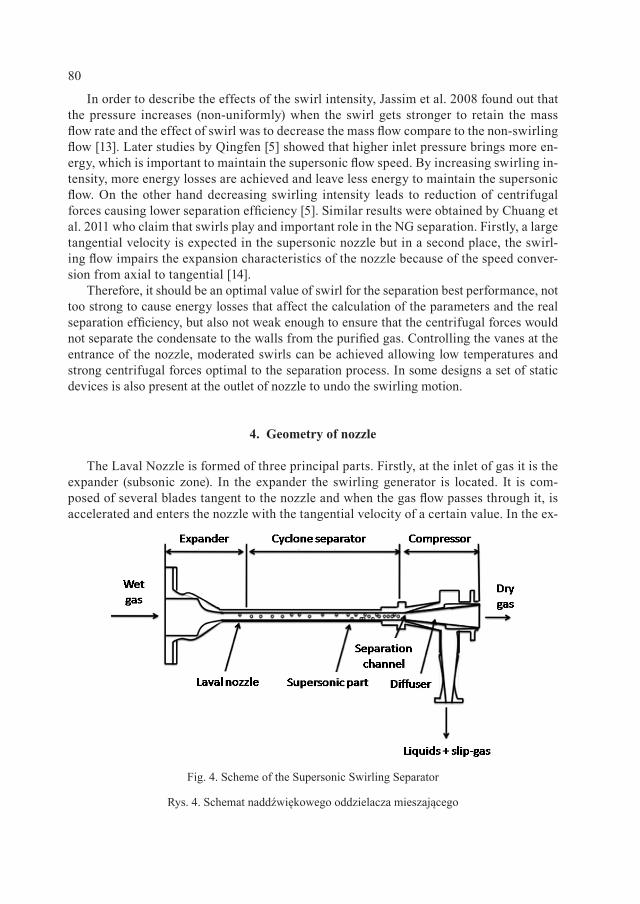
80
In order to describe the effects of the swirl intensity, Jassim et al. 2008 found out that the pressure increases (non-uniformly) when the swirl gets stronger to retain the mass flow rate and the effect of swirl was to decrease the mass flow compare to the non-swirling flow [13]. Later studies by Qingfen [5] showed that higher inlet pressure brings more en-ergy, which is important to maintain the supersonic flow speed. By increasing swirling in-tensity, more energy losses are achieved and leave less energy to maintain the supersonic flow. On the other hand decreasing swirling intensity leads to reduction of centrifugal forces causing lower separation efficiency [5]. Similar results were obtained by Chuang et al. 2011 who claim that swirls play and important role in the NG separation. Firstly, a large tangential velocity is expected in the supersonic nozzle but in a second place, the swirl-ing flow impairs the expansion characteristics of the nozzle because of the speed conver-sion from axial to tangential [14].
Therefore, it should be an optimal value of swirl for the separation best performance, not too strong to cause energy losses that affect the calculation of the parameters and the real separation efficiency, but also not weak enough to ensure that the centrifugal forces would not separate the condensate to the walls from the purified gas. Controlling the vanes at the entrance of the nozzle, moderated swirls can be achieved allowing low temperatures and strong centrifugal forces optimal to the separation process. In some designs a set of static devices is also present at the outlet of nozzle to undo the swirling motion.
4. Geometry of nozzle
The Laval Nozzle is formed of three principal parts. Firstly, at the inlet of gas it is the expander (subsonic zone). In the expander the swirling generator is located. It is com-posed of several blades tangent to the nozzle and when the gas flow passes through it, is accelerated and enters the nozzle with the tangential velocity of a certain value. In the ex-
Fig. 4. Scheme of the Supersonic Swirling Separator
Rys. 4. Schemat naddźwiękowego oddzielacza mieszającego
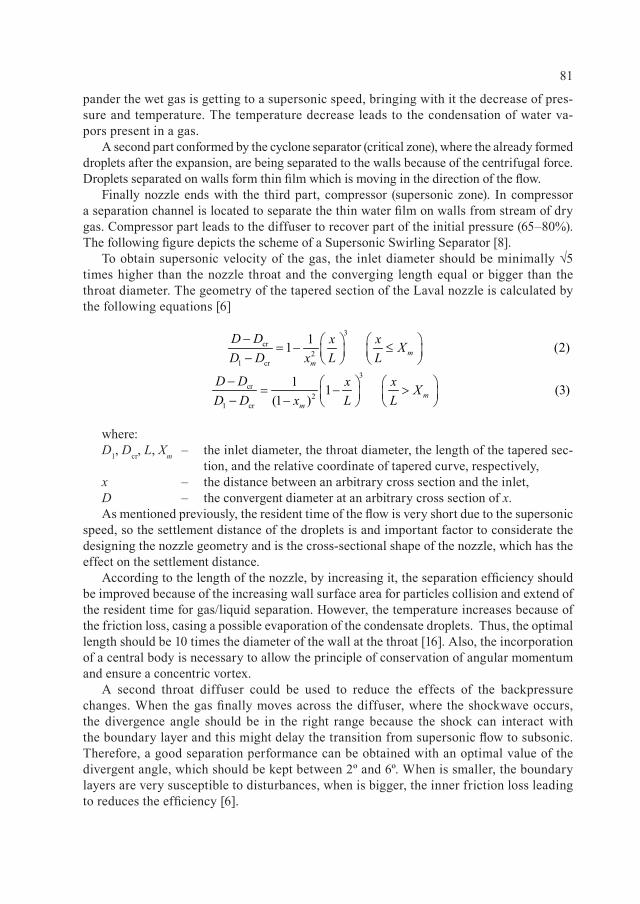
81
pander the wet gas is getting to a supersonic speed, bringing with it the decrease of pres-sure and temperature. The temperature decrease leads to the condensation of water va-pors present in a gas.
A second part conformed by the cyclone separator (critical zone), where the already formed droplets after the expansion, are being separated to the walls because of the centrifugal force. Droplets separated on walls form thin film which is moving in the direction of the flow.
Finally nozzle ends with the third part, compressor (supersonic zone). In compressor a separation channel is located to separate the thin water film on walls from stream of dry gas. Compressor part leads to the diffuser to recover part of the initial pressure (65–80%). The following figure depicts the scheme of a Supersonic Swirling Separator [8].
To obtain supersonic velocity of the gas, the inlet diameter should be minimally √5 times higher than the nozzle throat and the converging length equal or bigger than the throat diameter. The geometry of the tapered section of the Laval nozzle is calculated by the following equations [6]
where:D1, Dcr, L, Xm – the inlet diameter, the throat diameter, the length of the tapered sec-
tion, and the relative coordinate of tapered curve, respectively,x – the distance between an arbitrary cross section and the inlet,D – the convergent diameter at an arbitrary cross section of x.As mentioned previously, the resident time of the flow is very short due to the supersonic
speed, so the settlement distance of the droplets is and important factor to considerate the designing the nozzle geometry and is the cross-sectional shape of the nozzle, which has the effect on the settlement distance.
According to the length of the nozzle, by increasing it, the separation efficiency should be improved because of the increasing wall surface area for particles collision and extend of the resident time for gas/liquid separation. However, the temperature increases because of the friction loss, casing a possible evaporation of the condensate droplets. Thus, the optimal length should be 10 times the diameter of the wall at the throat [16]. Also, the incorporation of a central body is necessary to allow the principle of conservation of angular momentum and ensure a concentric vortex.
A second throat diffuser could be used to reduce the effects of the backpressure changes. When the gas finally moves across the diffuser, where the shockwave occurs, the divergence angle should be in the right range because the shock can interact with the boundary layer and this might delay the transition from supersonic flow to subsonic. Therefore, a good separation performance can be obtained with an optimal value of the divergent angle, which should be kept between 2º and 6º. When is smaller, the boundary layers are very susceptible to disturbances, when is bigger, the inner friction loss leading to reduces the efficiency [6].
3cr
21 cr
11 (2)mm
D D x x XD D L Lx− = − ≤ −
3cr
21 cr
1 1 (3)(1 ) m
m
D D x x XD D L Lx− = − > − −
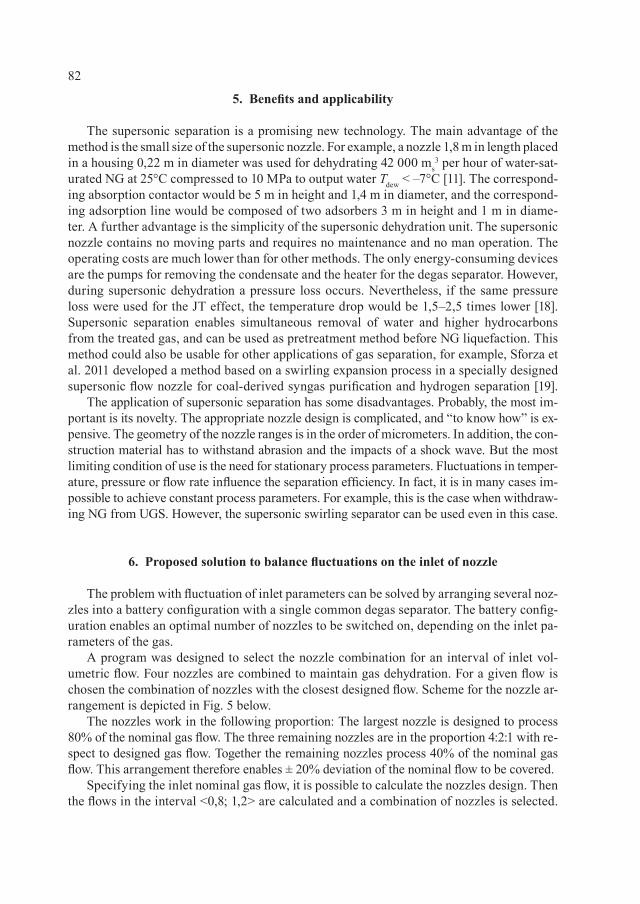
82
5. Benefits and applicability
The supersonic separation is a promising new technology. The main advantage of the method is the small size of the supersonic nozzle. For example, a nozzle 1,8 m in length placed in a housing 0,22 m in diameter was used for dehydrating 42 000 ms
3 per hour of water-sat-urated NG at 25°C compressed to 10 MPa to output water Tdew < –7°C [11]. The correspond-ing absorption contactor would be 5 m in height and 1,4 m in diameter, and the correspond-ing adsorption line would be composed of two adsorbers 3 m in height and 1 m in diame-ter. A further advantage is the simplicity of the supersonic dehydration unit. The supersonic nozzle contains no moving parts and requires no maintenance and no man operation. The operating costs are much lower than for other methods. The only energy-consuming devices are the pumps for removing the condensate and the heater for the degas separator. However, during supersonic dehydration a pressure loss occurs. Nevertheless, if the same pressure loss were used for the JT effect, the temperature drop would be 1,5–2,5 times lower [18]. Supersonic separation enables simultaneous removal of water and higher hydrocarbons from the treated gas, and can be used as pretreatment method before NG liquefaction. This method could also be usable for other applications of gas separation, for example, Sforza et al. 2011 developed a method based on a swirling expansion process in a specially designed supersonic flow nozzle for coal-derived syngas purification and hydrogen separation [19].
The application of supersonic separation has some disadvantages. Probably, the most im-portant is its novelty. The appropriate nozzle design is complicated, and “to know how” is ex-pensive. The geometry of the nozzle ranges is in the order of micrometers. In addition, the con-struction material has to withstand abrasion and the impacts of a shock wave. But the most limiting condition of use is the need for stationary process parameters. Fluctuations in temper-ature, pressure or flow rate influence the separation efficiency. In fact, it is in many cases im-possible to achieve constant process parameters. For example, this is the case when withdraw-ing NG from UGS. However, the supersonic swirling separator can be used even in this case.
6. Proposed solution to balance fluctuations on the inlet of nozzle
The problem with fluctuation of inlet parameters can be solved by arranging several noz-zles into a battery configuration with a single common degas separator. The battery config-uration enables an optimal number of nozzles to be switched on, depending on the inlet pa-rameters of the gas.
A program was designed to select the nozzle combination for an interval of inlet vol-umetric flow. Four nozzles are combined to maintain gas dehydration. For a given flow is chosen the combination of nozzles with the closest designed flow. Scheme for the nozzle ar-rangement is depicted in Fig. 5 below.
The nozzles work in the following proportion: The largest nozzle is designed to process 80% of the nominal gas flow. The three remaining nozzles are in the proportion 4:2:1 with re-spect to designed gas flow. Together the remaining nozzles process 40% of the nominal gas flow. This arrangement therefore enables ± 20% deviation of the nominal flow to be covered.
Specifying the inlet nominal gas flow, it is possible to calculate the nozzles design. Then the flows in the interval <0,8; 1,2> are calculated and a combination of nozzles is selected.
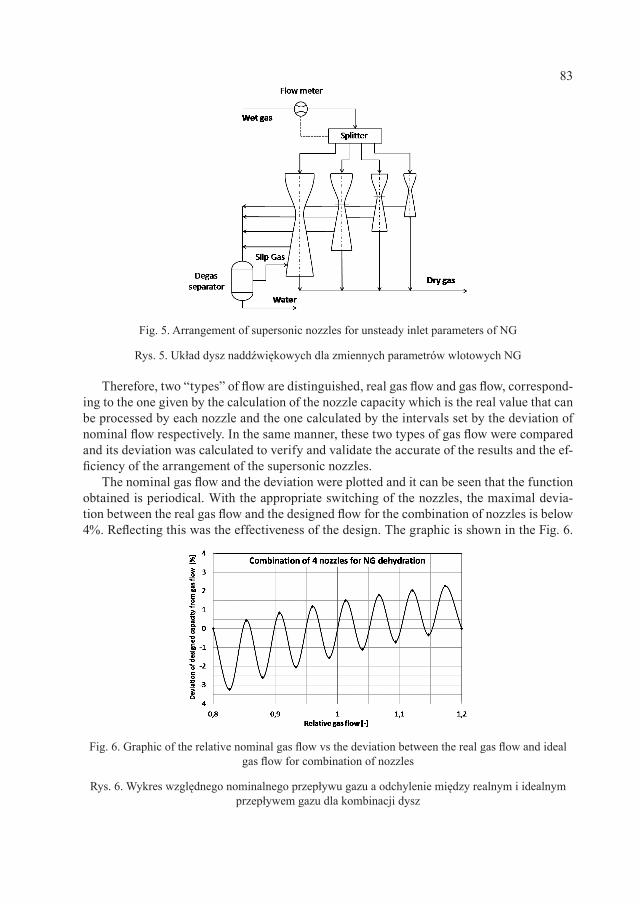
83
Therefore, two “types” of flow are distinguished, real gas flow and gas flow, correspond-ing to the one given by the calculation of the nozzle capacity which is the real value that can be processed by each nozzle and the one calculated by the intervals set by the deviation of nominal flow respectively. In the same manner, these two types of gas flow were compared and its deviation was calculated to verify and validate the accurate of the results and the ef-ficiency of the arrangement of the supersonic nozzles.
The nominal gas flow and the deviation were plotted and it can be seen that the function obtained is periodical. With the appropriate switching of the nozzles, the maximal devia-tion between the real gas flow and the designed flow for the combination of nozzles is below 4%. Reflecting this was the effectiveness of the design. The graphic is shown in the Fig. 6.
Fig. 5. Arrangement of supersonic nozzles for unsteady inlet parameters of NG
Rys. 5. Układ dysz naddźwiękowych dla zmiennych parametrów wlotowych NG
Fig. 6. Graphic of the relative nominal gas flow vs the deviation between the real gas flow and ideal gas flow for combination of nozzles
Rys. 6. Wykres względnego nominalnego przepływu gazu a odchylenie między realnym i idealnym przepływem gazu dla kombinacji dysz
84
7. Conclusions
Supersonic swirling separation is very promising method. In the field of NG dehydration has many advantages over the conventional dehydration methods. The main benefit lays in low capital cost of dehydration line. Moreover the operation costs are in comparison with conventional methods negligible. Finally an important advantage is the size of the line. Area requirements are lower which makes the supersonic dehydration very suitable for offshore applications. The limiting factor, which is the necessity of stable inlet parameters, can be solved by appropriate battery configuration of nozzles. As it is seen from the calculations shown, if varying inlet volumetric flow in interval <0,8; 1,2> the combination of 4 nozzles will customize with deviation below 4%.
Industrial application of supersonic separation was tested on a production facility off-shore Malaysia. The first commercial application was in 2006 for Shell Nigeria (condition-ing of wellhead gas for feed to a gas-fired power station). Next projects are operating in Co-lombia and Brazil [11].
The authors are grateful for the financial support provided by Ministry of Industry and Trade of the Czech Republic (program TIP nr. FR-TI1/173).
R e f e r e n c e s
[1] Gas infrastructure Europe (2011) Map Dataset in Excel-format Storage map. Available: http://www.gie.eu/maps_data/storage.html. Accessed 08.03.2011.
[2] NET4GAS (2011) Gas quality parameters. Available at: http://extranet.transgas.cz/calo-ricity_spec.aspx. Accessed 08.03.2011.
[3] Gandhidasan P. , Al-Farayedhi A. , Al-Mubarak A. , Dehydration of natural gas using solid desiccants, Energy, 26, 2001, 855-868.
[4] Gandhidasan P. , Parametric Analysis of Natural Gas Dehydration by Triethylene Glycol Solution, Energy Sources, 25, 2003, 189-201.
[5] Qingfen M., Dapeng H. et al., Performance of Inner-core Supersonic Gas Separa-tion Device with Droplet Enlargement Method, Chinese Journal of Chemical Engineer-ing, Department of Mechanical Engineering, Hainan University, Haikou, China 2009.
[6] Wen C. , Cao X. , Zhang J . , Wu L. , Three-dimensional Numerical Simulation of the Supersonic Swirling Separator, Twentieth International Offshore and Polar Engineering Conference, Beijing, China 2010.
[7] Horseman S. , Evans D. et al., Underground gas storage. Available: www.bgs.ac.uk/downloads/start.cfm?id=346. Accessed 01.2012.
[8] Okimoto F. , Brouwer J .M., Supersonic gas conditioning, World Oil, 34, 89-91, 2002.[9] Alfyorov V. , Bagirov L. e t a l . , Supersonic nozzle efficiently separates natural gas
components, Oil & Gas Journal, TransLang Technologies Ltd., Moscow, Russia 2005.[10] Karimi A. , Abdi M.A. , Selective dehydration of high-pressure natural gas using su-
personic nozzles, Chemical Engineering and Processing, 48, 560–568, 2006.[11] Twister B.V. , Twister supersonic separator – Experience. Available: http://twisterbv.
com/products-services/twister-supersonic-separator/experience/. Accessed 07.03.2012.
85
[12] Malyshkina M.M., The Structure of Gasdynamic Flow in a Supersonic Separator of Natural Gas, Vol. 46, 1, 69-76, Heat and Mass Transfer and physical Gasdynamics, Moscow Institute of Physics and Technology, Dolgoprudnyi, Moscow, Russia 2008.
[13] Jassim E. , Abdi M.A. e t a l . , Computational Fluid Dynamics Study for Flow of Natural Gas through High-Pressure Supersonic Nozzles: Part 1. Real Gas Effects and Shockwave, Petroleum Science and Technology, Memorial University of Newfound-land, St. John´s, Canada 2008.
[14] Wen C. , Cao X. e t a l . , Swirling Effects on the Performance of Supersonic Separa-tors for Natural Gas Separation, Chemical Engineering Technology, College of pipeline and Civil Engineering, China University of Petroleum, Quingdao, China 2011.
[15] Schinkelshoek P. , Epsom H.D. , Supersonic gas conditioning – commercialization of twister technology, 87th Annual Convention. Grapevine, Texas 2008.
[16] Wen C. , Cao X. e t a l . , Evaluation of natural gas dehydration in supersonic swirling separators applying the Discrete Particle Method, 66, Advanced Powder Technology, Department of Oil and Gas Engineering, China University of Petroleum, Qingdao, China 2011.
[17] Wen C. , Cao X. e t a l . , Optimization design of diffusers for supersonic separators, 44-47, 1913-1917, Applied Mechanics and Materials, Department of Oil and Gas Engi-neering, China University of Petroleum, Qingdao, China 2011.
[18] Bett ing M., Epsom H. , High velocities make a unique separator and dewpointer, World Oil, 197-200.
[19] Sforza P.M., Castrogiovanni A. e t a l . , Coal-derived syngas purification and hy-drogen separation in a supersonic swirl tube, Applied Thermal Engineering, University of Florida, Gainesville, USA 2011.


MONIKA GWADERA, KRZYSZTOF KUPIEC, JAN RAKOCZY*1
INVESTIGATION OF THERMAL EFFECTS OF WATER VAPOR ADSORPTION ON ZEOLITES
BADANIE EFEKTÓW TERMICZNYCH PODCZAS ADSORPCJI WODY NA ZEOLITACH
A b s t r a c t
Temporal variations of temperatures in an adsorbent bed have been studied in this paper. Separation of an ethanol-water vapor mixture on zeolites has been considered. Temperature of the bed was determined both experimentally and numerically on the basis of a mathematical model of the process. The conformity be-tween experimental and numerical values was satisfactory. It was found that maximum temperature in the bed depends mainly on water content in the raw material.Keywords: adsorption, thermal effects, ethanol dehydration, zeolites
S t r e s z c z e n i e
W artykule podano badania czasowych zmian temperatur w złożu adsorbentu. Pomiary dotyczyły rozdzielania parowej mieszaniny etanol-woda na zeolitach. Przebiegi temperatur złoża zostały określone zarówno eksperymentalnie, jak i obliczeniowo w oparciu o model matematyczny procesu. Zgodność wyników doświadczalnych i obliczeniowych była zadowalająca. Stwierdzono, że maksymalna temperatura w złożu zależy głównie od zawartości wody w odwadnianym surowcu.Słowa kluczowe: adsorpcja, efekty cieplne, odwadnianie etanolu, zeolity
* MSc. Eng. Monika Gwadera, PhD. Eng. Associate Professor Krzysztof Kupiec, PhD. Eng. Asso-ciate Professor Jan Rakoczy, Faculty of Chemical Engineering and Technology, Cracow Univer-sity of Technology.
88
1. Introduction
Zeolites belong to adsorbents which strongly adsorb water. Due to that fact, zeolite beds are often used for adsorptive drying of organic substances. Drying of fuel ethanol [1–14] is a typical example of such a process. This process is conducted in a gas phase. Adsorbent is regenerated by pressure reduction (Pressure Swing Adsorption process). The 3A-type zeolites, which selectively adsorb water from ethanol-water mixture, are used.
Adsorption causes heat production. Duration of each step of a cyclic adsorption-des-orption process is the same. For this reason in initial cycles (conducted on fresh adsorbent) the bed is only slightly regenerated after a desorption step. Therefore, in initial cycles the bed adsorbs more water in adsorption steps than loses in regeneration steps. Only after a certain number of adsorption-desorption cycles the cyclic steady state is reached. Be-fore that state is reached, especially in several or dozen or so initial cycles, temperature of the bed strongly increases in adsorption steps, and insufficiently decreases in desorption steps. This can cause severe local overheating of adsorbent pellets (bed). High temper-atures are very disadvantageous because of the possibility of zeolites structure destruc-tion what can lead to adsorptive properties breakage. What is more, under the influence of high temperature and catalytic properties of zeolites, carbon deposit which reduces sorp-tion capacity of pellets forms.
In the case of ethanol dehydration the problem is of high practical importance and was described in literature [1]. In industrial practice, when adsorbent is fresh, the column is firstly fed with partially dehydrated raw material in order to reduce the effect of bed tem-perature increase. Only after some time water content in the raw material is being in-creased gradually until it reaches the target value.
In order to predict the maximum values of temperatures that can be reached during ad-sorption-desorption cycles on fresh adsorbent, it is convenient to conduct process simula-tion based on a mathematical model. Such a model should be firstly checked for its com-patibility with reality. Such verification can be conducted e.g. for adsorption step under laboratory conditions.
The aim of this work is to present results of studies on temperatures of the bed for eth-anol dehydration on zeolites under laboratory conditions and to compare these tempera-tures with values obtained on the basis of a mathematical model of the process.
2. Mathematical model of the process
The model of the process was based on the following assumptions: – The mixture is composed of an inert component (ethanol) and adsorptively active com-
ponent (water), – The mixture behavior is governed by the ideal gas laws, – The gas phase is flowing with the plug flow model, – Physical properties of gas and solid phases do not depend on temperature, – Gas-phase temperature and pellets temperature are the same in a given cross-section
of the bed, – Mass transfer resistance in the gas phase can be neglected,
89
– Mass transfer rate can be described with the LDF equation using concentration of a component in a pellet,
– Pressure drop of gas flowing through the adsorbent bed is low, – Heat of adsorption is constant.
When the above assumptions are made, the general balance equation takes the form:
The balance equation for water has the form:
while the heat balance equation:
The Dubinin-Raduschkevich relationship was used as an equation of adsorption equilibrium
Adsorption kinetics was described with the LDF equation
Initial conditions refer to the system that does not contain the adsorptively active component (water) before the process starts:
Boundary conditions are determined by the values for the system feed:
The model equations were solved using the finite difference method.
( ) 010 (1)p m
w
RT quz M P t
ρ − ε ∂∂+ ⋅ =
∂ ∂
uyz
yt
RTM P
qt
p
w
m∂∂
+∂∂
+−( )
⋅∂∂
=mol mol (2)ερ ε1
00
u Tz
c RTC P
Tt
Q RTC M P
p p p st
w
∂∂
+ +−( )
∂∂
−−( )
ερ ε ρ ε1 10 0
mol mol
⋅⋅∂∂
+
+ −( ) =
qt
hRTd C P
T T
m
cw
400
mol
(3)
2* sat
mol
exp ln (4)m msP
q q b TPy
= − ⋅
( )( )* (5)ms m m
dqk a q q
dt= −
mol 00 , 0; 0, 0, (6)mz L t q y T T≤ ≤ = = = =
mol mol0 0 00, 0; , , (7)z t y y T T u u= ≥ = = =
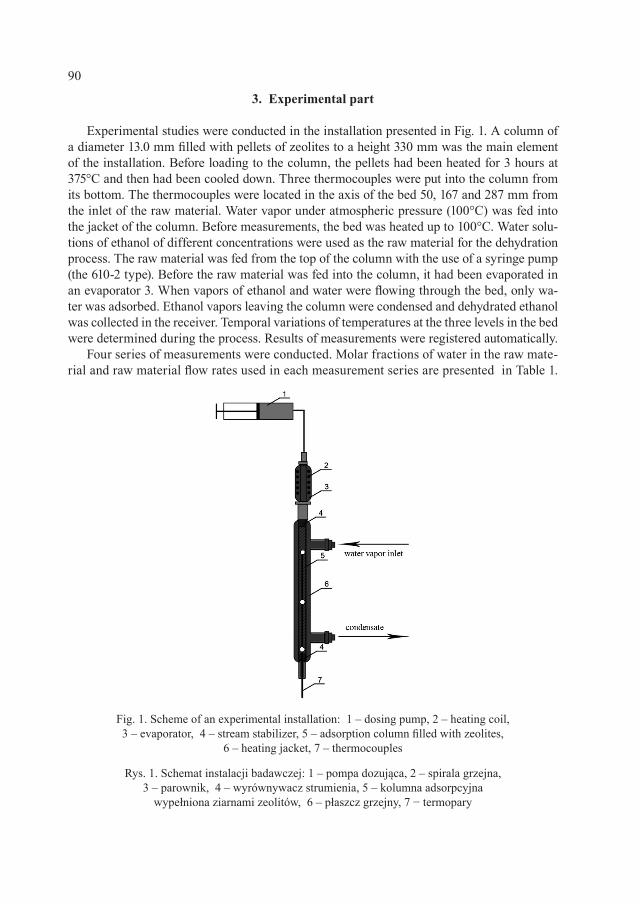
90
3. Experimental part
Experimental studies were conducted in the installation presented in Fig. 1. A column of a diameter 13.0 mm filled with pellets of zeolites to a height 330 mm was the main element of the installation. Before loading to the column, the pellets had been heated for 3 hours at 375°C and then had been cooled down. Three thermocouples were put into the column from its bottom. The thermocouples were located in the axis of the bed 50, 167 and 287 mm from the inlet of the raw material. Water vapor under atmospheric pressure (100°C) was fed into the jacket of the column. Before measurements, the bed was heated up to 100°C. Water solu-tions of ethanol of different concentrations were used as the raw material for the dehydration process. The raw material was fed from the top of the column with the use of a syringe pump (the 610-2 type). Before the raw material was fed into the column, it had been evaporated in an evaporator 3. When vapors of ethanol and water were flowing through the bed, only wa-ter was adsorbed. Ethanol vapors leaving the column were condensed and dehydrated ethanol was collected in the receiver. Temporal variations of temperatures at the three levels in the bed were determined during the process. Results of measurements were registered automatically.
Four series of measurements were conducted. Molar fractions of water in the raw mate-rial and raw material flow rates used in each measurement series are presented in Table 1.
Fig. 1. Scheme of an experimental installation: 1 – dosing pump, 2 – heating coil, 3 – evaporator, 4 – stream stabilizer, 5 – adsorption column filled with zeolites,
6 – heating jacket, 7 – thermocouples
Rys. 1. Schemat instalacji badawczej: 1 – pompa dozująca, 2 – spirala grzejna, 3 – parownik, 4 – wyrównywacz strumienia, 5 – kolumna adsorpcyjna
wypełniona ziarnami zeolitów, 6 – płaszcz grzejny, 7 − termopary
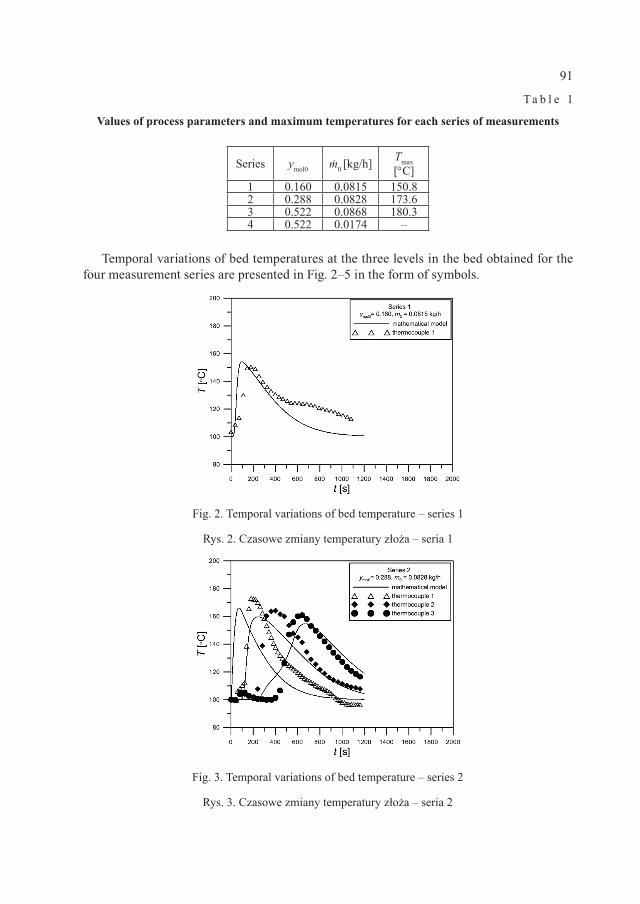
91
T a b l e 1
Values of process parameters and maximum temperatures for each series of measurements
Series ymol0 ṁ0 [kg/h] Tmax[°C]
1 0.160 0.0815 150.82 0.288 0.0828 173.63 0.522 0.0868 180.34 0.522 0.0174 –
Temporal variations of bed temperatures at the three levels in the bed obtained for the four measurement series are presented in Fig. 2–5 in the form of symbols.
Fig. 2. Temporal variations of bed temperature – series 1
Rys. 2. Czasowe zmiany temperatury złoża – seria 1
Fig. 3. Temporal variations of bed temperature – series 2
Rys. 3. Czasowe zmiany temperatury złoża – seria 2
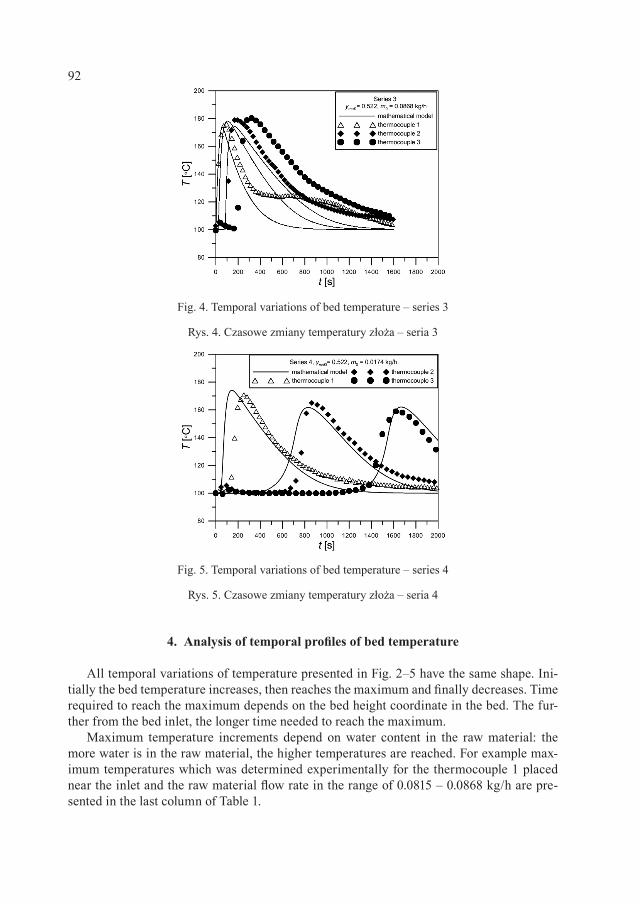
92
4. Analysis of temporal profiles of bed temperature
All temporal variations of temperature presented in Fig. 2–5 have the same shape. Ini-tially the bed temperature increases, then reaches the maximum and finally decreases. Time required to reach the maximum depends on the bed height coordinate in the bed. The fur-ther from the bed inlet, the longer time needed to reach the maximum.
Maximum temperature increments depend on water content in the raw material: the more water is in the raw material, the higher temperatures are reached. For example max-imum temperatures which was determined experimentally for the thermocouple 1 placed near the inlet and the raw material flow rate in the range of 0.0815 – 0.0868 kg/h are pre-sented in the last column of Table 1.
Fig. 4. Temporal variations of bed temperature – series 3
Rys. 4. Czasowe zmiany temperatury złoża – seria 3
Fig. 5. Temporal variations of bed temperature – series 4
Rys. 5. Czasowe zmiany temperatury złoża – seria 4
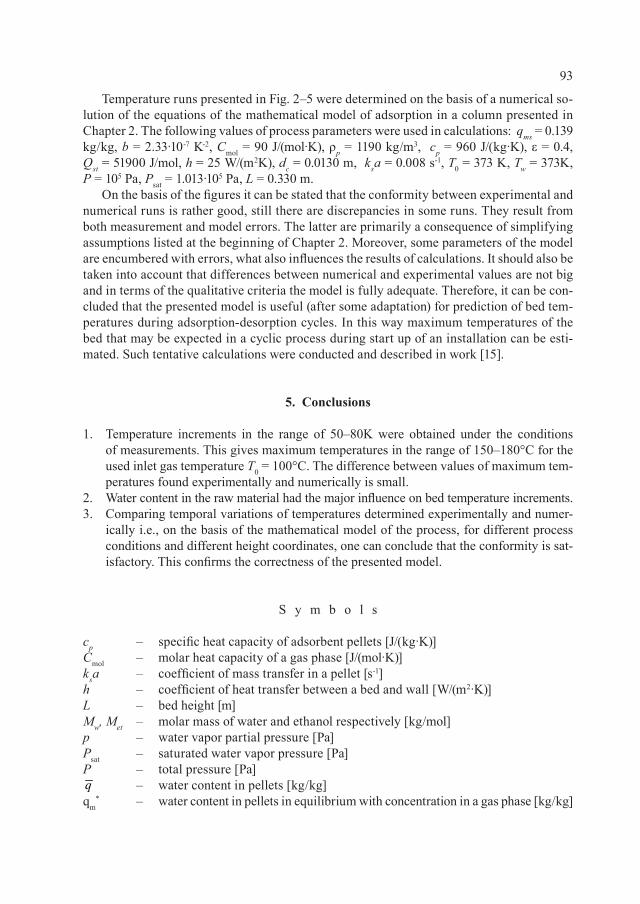
93
Temperature runs presented in Fig. 2–5 were determined on the basis of a numerical so-lution of the equations of the mathematical model of adsorption in a column presented in Chapter 2. The following values of process parameters were used in calculations: qms = 0.139 kg/kg, b = 2.33·10-7 K-2, Cmol = 90 J/(mol·K), ρp = 1190 kg/m3, cp = 960 J/(kg·K), ε = 0.4, Qst = 51900 J/mol, h = 25 W/(m2K), dc = 0.0130 m, ksa = 0.008 s-1, T0 = 373 K, Tw = 373K, P = 105 Pa, Psat = 1.013·105 Pa, L = 0.330 m.
On the basis of the figures it can be stated that the conformity between experimental and numerical runs is rather good, still there are discrepancies in some runs. They result from both measurement and model errors. The latter are primarily a consequence of simplifying assumptions listed at the beginning of Chapter 2. Moreover, some parameters of the model are encumbered with errors, what also influences the results of calculations. It should also be taken into account that differences between numerical and experimental values are not big and in terms of the qualitative criteria the model is fully adequate. Therefore, it can be con-cluded that the presented model is useful (after some adaptation) for prediction of bed tem-peratures during adsorption-desorption cycles. In this way maximum temperatures of the bed that may be expected in a cyclic process during start up of an installation can be esti-mated. Such tentative calculations were conducted and described in work [15].
5. Conclusions
1. Temperature increments in the range of 50–80K were obtained under the conditions of measurements. This gives maximum temperatures in the range of 150–180°C for the used inlet gas temperature T0 = 100°C. The difference between values of maximum tem-peratures found experimentally and numerically is small.
2. Water content in the raw material had the major influence on bed temperature increments.3. Comparing temporal variations of temperatures determined experimentally and numer-
ically i.e., on the basis of the mathematical model of the process, for different process conditions and different height coordinates, one can conclude that the conformity is sat-isfactory. This confirms the correctness of the presented model.
S y m b o l s
cp – specific heat capacity of adsorbent pellets [J/(kg·K)]Cmol – molar heat capacity of a gas phase [J/(mol·K)]ksa – coefficient of mass transfer in a pellet [s-1]h – coefficient of heat transfer between a bed and wall [W/(m2·K)]L – bed height [m]Mw, Met – molar mass of water and ethanol respectively [kg/mol]p – water vapor partial pressure [Pa]Psat – saturated water vapor pressure [Pa]P – total pressure [Pa]
– water content in pellets [kg/kg]qm
* – water content in pellets in equilibrium with concentration in a gas phase [kg/kg]q
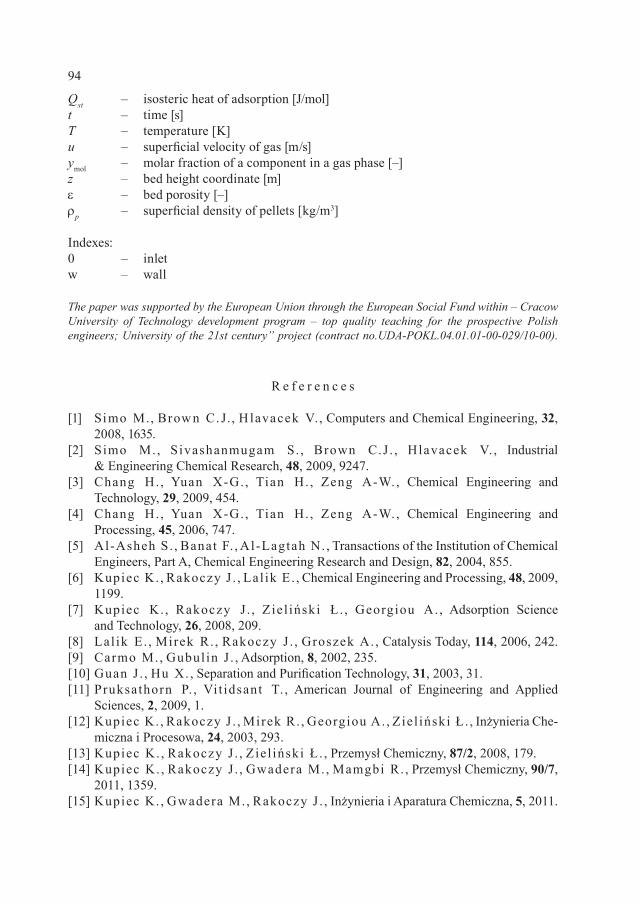
94
Qst – isosteric heat of adsorption [J/mol]t – time [s]T – temperature [K]u – superficial velocity of gas [m/s]ymol – molar fraction of a component in a gas phase [–]z – bed height coordinate [m]ε – bed porosity [–]ρp – superficial density of pellets [kg/m3]
Indexes:0 – inletw – wall
The paper was supported by the European Union through the European Social Fund within – Cracow University of Technology development program – top quality teaching for the prospective Polish engineers; University of the 21st century” project (contract no.UDA-POKL.04.01.01-00-029/10-00).
R e f e r e n c e s
[1] Simo M., Brow n C. J., H lavacek V., Computers and Chemical Engineering, 32, 2008, 1635.
[2] Simo M., Sivashanmugam S. , Brown C.J . , Hlavacek V. , Industrial & Engineering Chemical Research, 48, 2009, 9247.
[3] Chang H. , Yuan X-G. , Tian H. , Zeng A-W., Chemical Engineering and Technology, 29, 2009, 454.
[4] Chang H. , Yuan X-G. , Tian H. , Zeng A-W., Chemical Engineering and Processing, 45, 2006, 747.
[5] Al-Asheh S. , Banat F. , Al-Lagtah N. , Transactions of the Institution of Chemical Engineers, Part A, Chemical Engineering Research and Design, 82, 2004, 855.
[6] Kupiec K. , Rakoczy J . , Lal ik E. , Chemical Engineering and Processing, 48, 2009, 1199.
[7] Kupiec K. , Rakoczy J . , Ziel iński Ł. , Georgiou A. , Adsorption Science and Technology, 26, 2008, 209.
[8] Lal ik E. , Mirek R. , Rakoczy J . , Groszek A. , Catalysis Today, 114, 2006, 242.[9] Carmo M., Gubulin J . , Adsorption, 8, 2002, 235.[10] Guan J . , Hu X. , Separation and Purification Technology, 31, 2003, 31.[11] Pruksathorn P. , Vit idsant T. , American Journal of Engineering and Applied
Sciences, 2, 2009, 1.[12] Kupiec K. , Rakoczy J . , Mirek R. , Georgiou A. , Ziel iński Ł. , Inżynieria Che-
miczna i Procesowa, 24, 2003, 293.[13] Kupiec K. , Rakoczy J . , Ziel iński Ł. , Przemysł Chemiczny, 87/2, 2008, 179.[14] Kupiec K. , Rakoczy J . , Gwadera M., Mamgbi R. , Przemysł Chemiczny, 90/7,
2011, 1359.[15] Kupiec K. , Gwadera M., Rakoczy J . , Inżynieria i Aparatura Chemiczna, 5, 2011.

DENIZ HÜLAGÜ, VERENA KRAMER, MATTHIAS KRAUME*1
PREPARATION AND CHARACTERIZATION OF MIXED-MATRIX-MEMBRANES
PRZYGOTOWANIE I CHARAKTERYSTYKA MEMBRAN WIELOMATRYCOWYCH
A b s t r a c t
In the concept of mixed-matrix-membrane (MMM) producing, rubbery polymer PDMS and a micro porous carbon adsorbent have been chosen as membrane components. Transport properties of MMMs strongly de-pend on the polymer and filler interface. Blockage of the carbon pores by polymer chains eliminates the ne-cessary mass transfer. As a fundamental step in preparation pore blockage was investigated for different car-bon treatments. Polymer penetration into the pores was analysed by Scanning Electron Microscopy (SEM) and Energy-Dispersive X-ray Spectroscopy (EDX). By using saturation method of carbon particles with a so-lvent pore blockage with silicon chains was hindered partly.Keywords: mixed-matrix-membranes, PDMS, pore blockage, EDX
S t r e s z c z e n i e
Jako składniki membrany w koncepcji wytwarzania membran wielomatrycowych (MMM) wybrano polimer gumy PDMS oraz mikroporowaty adsorbent węgla. Właściwości MMM w zakresie przenoszenia zależą w dużej mierze od obszaru wzajemnego oddziaływania polimeru i materiału wypełniającego. Blokada porów węgla za pomocą łańcuchów polimerowych eliminuje konieczność przenoszenia masy. Blokada porów została potraktowana jako najważniejszy etap przygotowań pod kątem poddawania węgla działaniu różnych środków. Przenikanie polimerów do porów przeanalizowano w ramach mikroskopii elektronowej skaningowej (SEM) oraz rentgenowskiej spektroskopii energii dyspersyjnej (EDX). Zastosowanie metody saturacji cząsteczek węgla z rozpuszczalnikiem pozwoliło częściowo powstrzymać blokadę porów z łańcuchami krzemu.Słowa kluczowe: membrany wielomatrycowe, PDMS, blokada porów, EDX
* Deniz Hülagü, Verena Kramer, Prof. PhD. Eng. Matthias Kraume, Fachgebiet Verfahrenstechnik, TU Berlin.
96
1. Introduction
Gas separation has become a major industrial application of membrane technology since past 25 years. As energy costs rise, it has been playing an increasingly important role in re-ducing the environmental impact and costs of industrial processes [1, 2]. Gas separation membranes offer a number of benefits over other gas separation technologies since they do not require a phase change in the separation process which means additional significant energy costs. Additionally, gas separation membrane units are smaller than other types of plants; therefore they have relatively small footprints. Currently, gas separation membranes are most widely used in industry for oxygen and nitrogen enrichment, hydrogen-hydrocar-bon separation, nitrogen separation from air, CO2 removal from natural gas, organic vapor removal from air or nitrogen streams [3].
The most widely used membrane materials for gas separation are polymers [4]. They are attractive as membranes because they can be processed into hollow fibers with high specific surface areas. Ideally, membranes should exhibit high selectivity and high permeability. In some cases, the membrane materials, membrane configuration, and preparation routes are inadequate to fully exploit new industrial fields. In 1991 Robeson plotted selectivity versus permeability for many polymeric membranes with respect to a specific gas pair. He report-ed that a general trade-off exists between permeability and selectivity [5]. The trade-off is one of the biggest problems faced by pure polymeric membranes which mostly limits their economical applications in industries [6]. In view of this situation, a new approach is need-ed to enhance separation properties of membranes and to produce cost-effective and defect-free membranes above the upper bound.
2. Mixed Matrix Membranes (MMMs)
The latest membrane morphology is mixed-matrix-membranes (MMMs) consisting of organic polymer and inorganic particle phases [3]. The continuous phase is typically a pol-ymer and the dispersed phase consists of inorganic particles; like zeolite, carbon molecu-lar sieves, or nano-size particles (Fig. 1). MMMs have the potential to achieve higher se-
Fig. 1. Schematic of MMM
Rys. 1. Schemat MMM
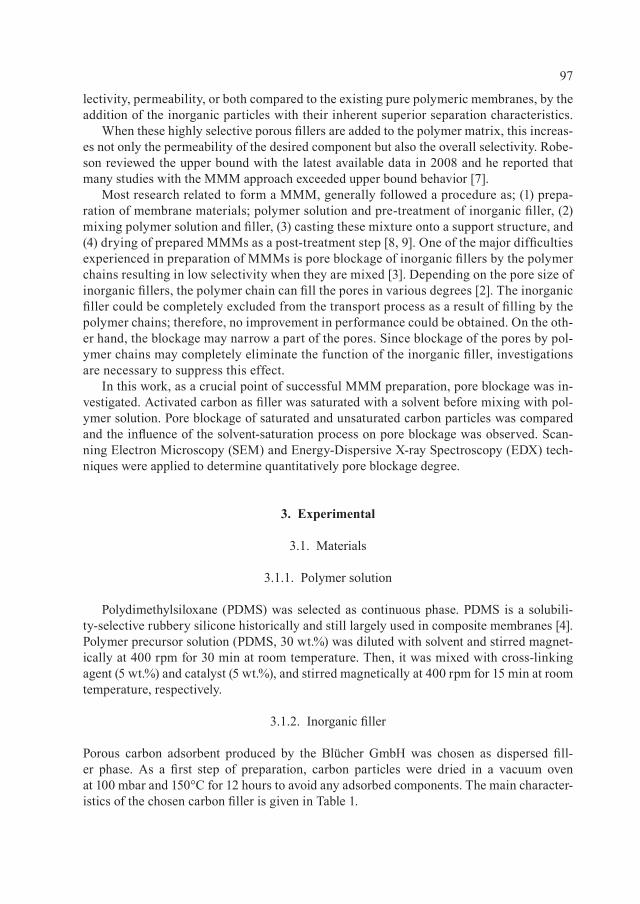
97
lectivity, permeability, or both compared to the existing pure polymeric membranes, by the addition of the inorganic particles with their inherent superior separation characteristics.
When these highly selective porous fillers are added to the polymer matrix, this increas-es not only the permeability of the desired component but also the overall selectivity. Robe-son reviewed the upper bound with the latest available data in 2008 and he reported that many studies with the MMM approach exceeded upper bound behavior [7].
Most research related to form a MMM, generally followed a procedure as; (1) prepa-ration of membrane materials; polymer solution and pre-treatment of inorganic filler, (2) mixing polymer solution and filler, (3) casting these mixture onto a support structure, and (4) drying of prepared MMMs as a post-treatment step [8, 9]. One of the major difficulties experienced in preparation of MMMs is pore blockage of inorganic fillers by the polymer chains resulting in low selectivity when they are mixed [3]. Depending on the pore size of inorganic fillers, the polymer chain can fill the pores in various degrees [2]. The inorganic filler could be completely excluded from the transport process as a result of filling by the polymer chains; therefore, no improvement in performance could be obtained. On the oth-er hand, the blockage may narrow a part of the pores. Since blockage of the pores by pol-ymer chains may completely eliminate the function of the inorganic filler, investigations are necessary to suppress this effect.
In this work, as a crucial point of successful MMM preparation, pore blockage was in-vestigated. Activated carbon as filler was saturated with a solvent before mixing with pol-ymer solution. Pore blockage of saturated and unsaturated carbon particles was compared and the influence of the solvent-saturation process on pore blockage was observed. Scan-ning Electron Microscopy (SEM) and Energy-Dispersive X-ray Spectroscopy (EDX) tech-niques were applied to determine quantitatively pore blockage degree.
3. Experimental
3.1. Materials
3.1.1. Polymer solution
Polydimethylsiloxane (PDMS) was selected as continuous phase. PDMS is a solubili-ty-selective rubbery silicone historically and still largely used in composite membranes [4]. Polymer precursor solution (PDMS, 30 wt.%) was diluted with solvent and stirred magnet-ically at 400 rpm for 30 min at room temperature. Then, it was mixed with cross-linking agent (5 wt.%) and catalyst (5 wt.%), and stirred magnetically at 400 rpm for 15 min at room temperature, respectively.
3.1.2. Inorganic filler
Porous carbon adsorbent produced by the Blücher GmbH was chosen as dispersed fill-er phase. As a first step of preparation, carbon particles were dried in a vacuum oven at 100 mbar and 150°C for 12 hours to avoid any adsorbed components. The main character-istics of the chosen carbon filler is given in Table 1.
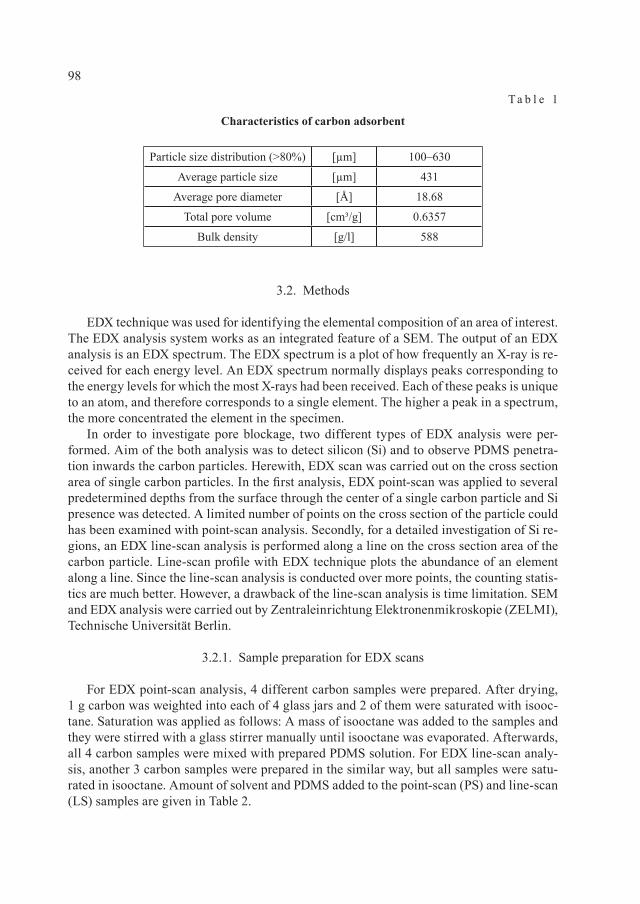
98
T a b l e 1
Characteristics of carbon adsorbent
Particle size distribution (>80%) [µm] 100–630
Average particle size [µm] 431
Average pore diameter [Å] 18.68
Total pore volume [cm³/g] 0.6357
Bulk density [g/l] 588
3.2. Methods
EDX technique was used for identifying the elemental composition of an area of interest. The EDX analysis system works as an integrated feature of a SEM. The output of an EDX analysis is an EDX spectrum. The EDX spectrum is a plot of how frequently an X-ray is re-ceived for each energy level. An EDX spectrum normally displays peaks corresponding to the energy levels for which the most X-rays had been received. Each of these peaks is unique to an atom, and therefore corresponds to a single element. The higher a peak in a spectrum, the more concentrated the element in the specimen.
In order to investigate pore blockage, two different types of EDX analysis were per-formed. Aim of the both analysis was to detect silicon (Si) and to observe PDMS penetra-tion inwards the carbon particles. Herewith, EDX scan was carried out on the cross section area of single carbon particles. In the first analysis, EDX point-scan was applied to several predetermined depths from the surface through the center of a single carbon particle and Si presence was detected. A limited number of points on the cross section of the particle could has been examined with point-scan analysis. Secondly, for a detailed investigation of Si re-gions, an EDX line-scan analysis is performed along a line on the cross section area of the carbon particle. Line-scan profile with EDX technique plots the abundance of an element along a line. Since the line-scan analysis is conducted over more points, the counting statis-tics are much better. However, a drawback of the line-scan analysis is time limitation. SEM and EDX analysis were carried out by Zentraleinrichtung Elektronenmikroskopie (ZELMI), Technische Universität Berlin.
3.2.1. Sample preparation for EDX scans
For EDX point-scan analysis, 4 different carbon samples were prepared. After drying, 1 g carbon was weighted into each of 4 glass jars and 2 of them were saturated with isooc-tane. Saturation was applied as follows: A mass of isooctane was added to the samples and they were stirred with a glass stirrer manually until isooctane was evaporated. Afterwards, all 4 carbon samples were mixed with prepared PDMS solution. For EDX line-scan analy-sis, another 3 carbon samples were prepared in the similar way, but all samples were satu-rated in isooctane. Amount of solvent and PDMS added to the point-scan (PS) and line-scan (LS) samples are given in Table 2.
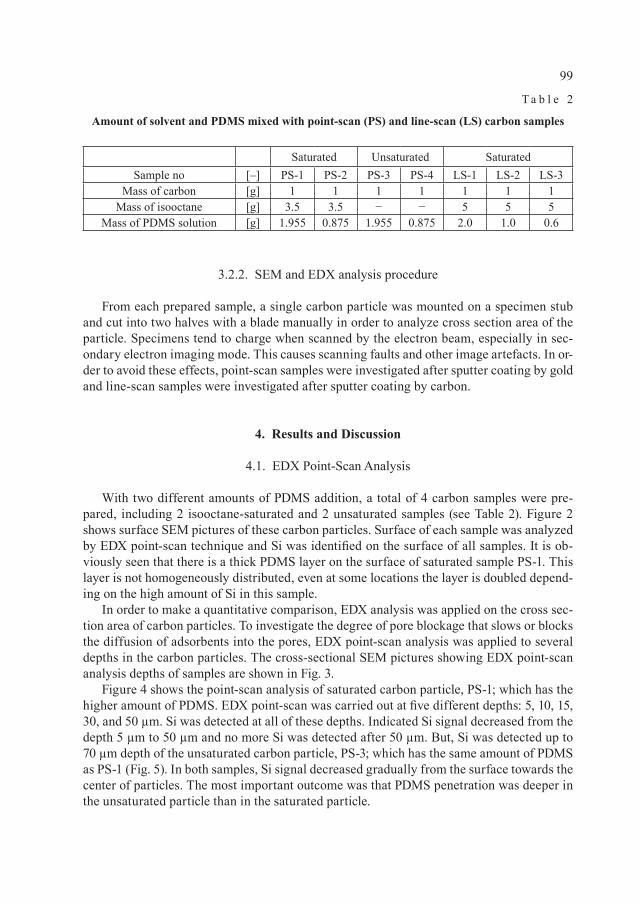
99
T a b l e 2
Amount of solvent and PDMS mixed with point-scan (PS) and line-scan (LS) carbon samples
Saturated Unsaturated SaturatedSample no [–] PS-1 PS-2 PS-3 PS-4 LS-1 LS-2 LS-3
Mass of carbon [g] 1 1 1 1 1 1 1Mass of isooctane [g] 3.5 3.5 − − 5 5 5
Mass of PDMS solution [g] 1.955 0.875 1.955 0.875 2.0 1.0 0.6
3.2.2. SEM and EDX analysis procedure
From each prepared sample, a single carbon particle was mounted on a specimen stub and cut into two halves with a blade manually in order to analyze cross section area of the particle. Specimens tend to charge when scanned by the electron beam, especially in sec-ondary electron imaging mode. This causes scanning faults and other image artefacts. In or-der to avoid these effects, point-scan samples were investigated after sputter coating by gold and line-scan samples were investigated after sputter coating by carbon.
4. Results and Discussion
4.1. EDX Point-Scan Analysis
With two different amounts of PDMS addition, a total of 4 carbon samples were pre-pared, including 2 isooctane-saturated and 2 unsaturated samples (see Table 2). Figure 2 shows surface SEM pictures of these carbon particles. Surface of each sample was analyzed by EDX point-scan technique and Si was identified on the surface of all samples. It is ob-viously seen that there is a thick PDMS layer on the surface of saturated sample PS-1. This layer is not homogeneously distributed, even at some locations the layer is doubled depend-ing on the high amount of Si in this sample.
In order to make a quantitative comparison, EDX analysis was applied on the cross sec-tion area of carbon particles. To investigate the degree of pore blockage that slows or blocks the diffusion of adsorbents into the pores, EDX point-scan analysis was applied to several depths in the carbon particles. The cross-sectional SEM pictures showing EDX point-scan analysis depths of samples are shown in Fig. 3.
Figure 4 shows the point-scan analysis of saturated carbon particle, PS-1; which has the higher amount of PDMS. EDX point-scan was carried out at five different depths: 5, 10, 15, 30, and 50 µm. Si was detected at all of these depths. Indicated Si signal decreased from the depth 5 µm to 50 µm and no more Si was detected after 50 µm. But, Si was detected up to 70 µm depth of the unsaturated carbon particle, PS-3; which has the same amount of PDMS as PS-1 (Fig. 5). In both samples, Si signal decreased gradually from the surface towards the center of particles. The most important outcome was that PDMS penetration was deeper in the unsaturated particle than in the saturated particle.
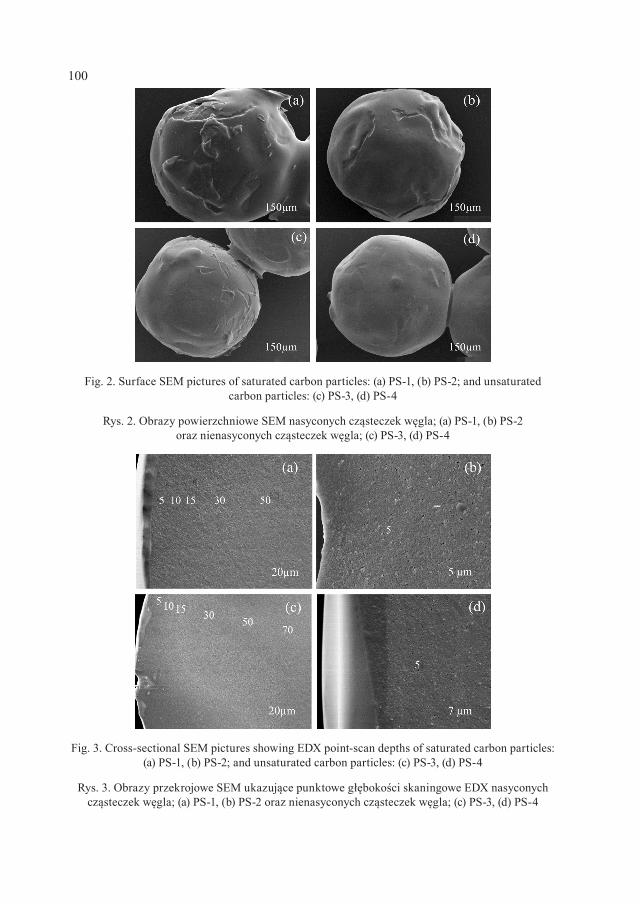
100
Fig. 2. Surface SEM pictures of saturated carbon particles: (a) PS-1, (b) PS-2; and unsaturated carbon particles: (c) PS-3, (d) PS-4
Rys. 2. Obrazy powierzchniowe SEM nasyconych cząsteczek węgla; (a) PS-1, (b) PS-2 oraz nienasyconych cząsteczek węgla; (c) PS-3, (d) PS-4
Fig. 3. Cross-sectional SEM pictures showing EDX point-scan depths of saturated carbon particles: (a) PS-1, (b) PS-2; and unsaturated carbon particles: (c) PS-3, (d) PS-4
Rys. 3. Obrazy przekrojowe SEM ukazujące punktowe głębokości skaningowe EDX nasyconych cząsteczek węgla; (a) PS-1, (b) PS-2 oraz nienasyconych cząsteczek węgla; (c) PS-3, (d) PS-4
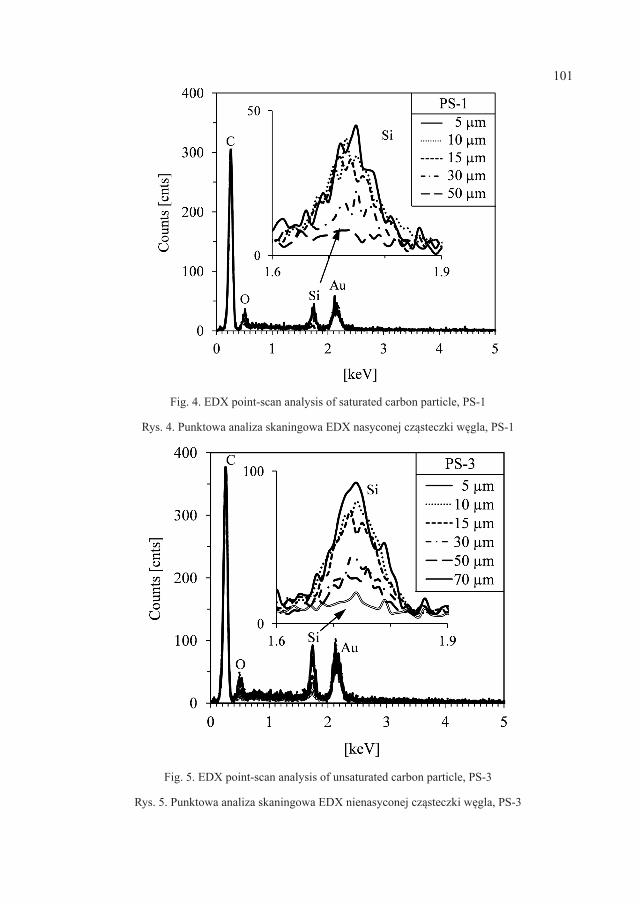
101
Fig. 4. EDX point-scan analysis of saturated carbon particle, PS-1
Rys. 4. Punktowa analiza skaningowa EDX nasyconej cząsteczki węgla, PS-1
Fig. 5. EDX point-scan analysis of unsaturated carbon particle, PS-3
Rys. 5. Punktowa analiza skaningowa EDX nienasyconej cząsteczki węgla, PS-3
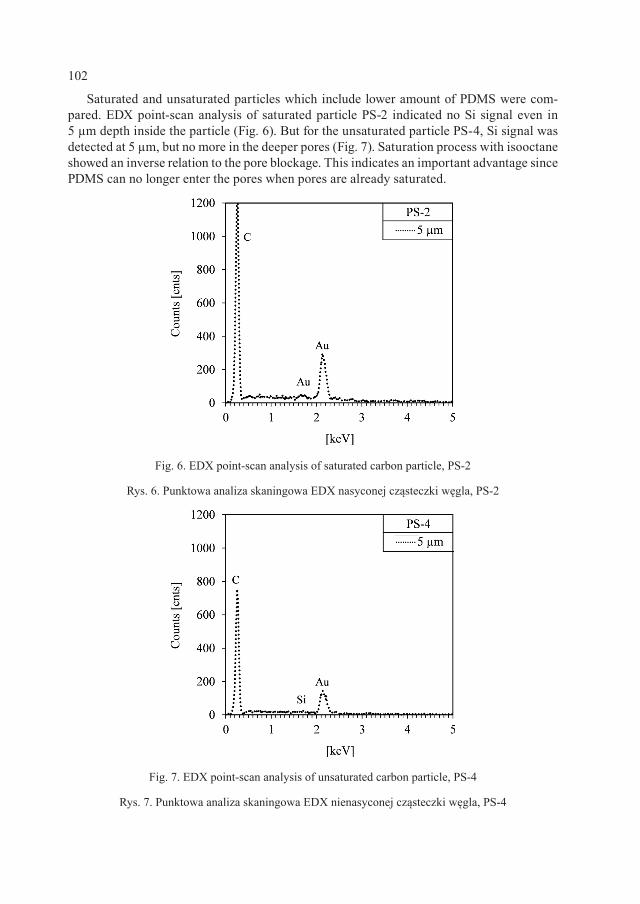
102
Saturated and unsaturated particles which include lower amount of PDMS were com-pared. EDX point-scan analysis of saturated particle PS-2 indicated no Si signal even in 5 µm depth inside the particle (Fig. 6). But for the unsaturated particle PS-4, Si signal was detected at 5 µm, but no more in the deeper pores (Fig. 7). Saturation process with isooctane showed an inverse relation to the pore blockage. This indicates an important advantage since PDMS can no longer enter the pores when pores are already saturated.
Fig. 6. EDX point-scan analysis of saturated carbon particle, PS-2
Rys. 6. Punktowa analiza skaningowa EDX nasyconej cząsteczki węgla, PS-2
Fig. 7. EDX point-scan analysis of unsaturated carbon particle, PS-4
Rys. 7. Punktowa analiza skaningowa EDX nienasyconej cząsteczki węgla, PS-4
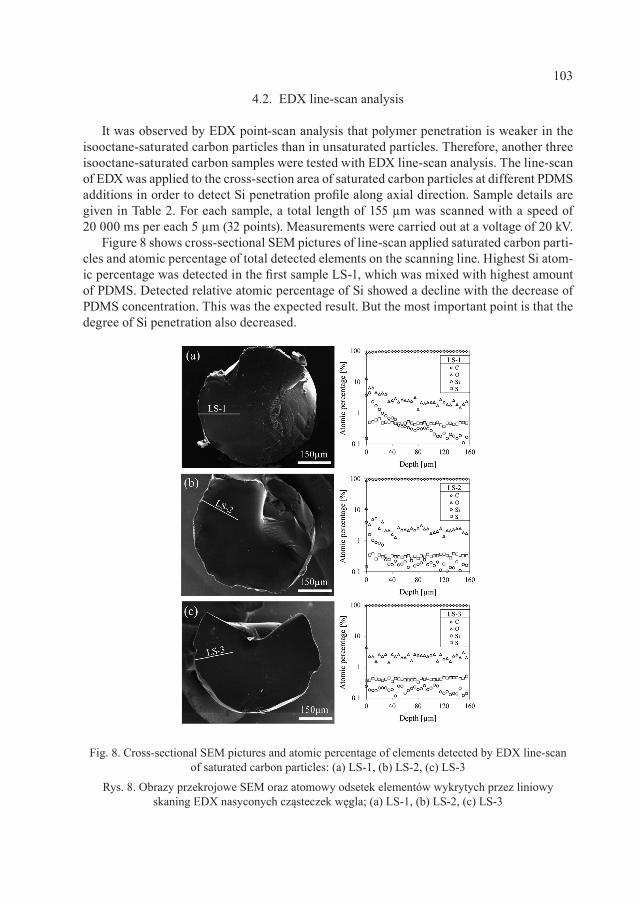
103
4.2. EDX line-scan analysis
It was observed by EDX point-scan analysis that polymer penetration is weaker in the isooctane-saturated carbon particles than in unsaturated particles. Therefore, another three isooctane-saturated carbon samples were tested with EDX line-scan analysis. The line-scan of EDX was applied to the cross-section area of saturated carbon particles at different PDMS additions in order to detect Si penetration profile along axial direction. Sample details are given in Table 2. For each sample, a total length of 155 µm was scanned with a speed of 20 000 ms per each 5 µm (32 points). Measurements were carried out at a voltage of 20 kV.
Figure 8 shows cross-sectional SEM pictures of line-scan applied saturated carbon parti-cles and atomic percentage of total detected elements on the scanning line. Highest Si atom-ic percentage was detected in the first sample LS-1, which was mixed with highest amount of PDMS. Detected relative atomic percentage of Si showed a decline with the decrease of PDMS concentration. This was the expected result. But the most important point is that the degree of Si penetration also decreased.
Fig. 8. Cross-sectional SEM pictures and atomic percentage of elements detected by EDX line-scan of saturated carbon particles: (a) LS-1, (b) LS-2, (c) LS-3
Rys. 8. Obrazy przekrojowe SEM oraz atomowy odsetek elementów wykrytych przez liniowy skaning EDX nasyconych cząsteczek węgla; (a) LS-1, (b) LS-2, (c) LS-3
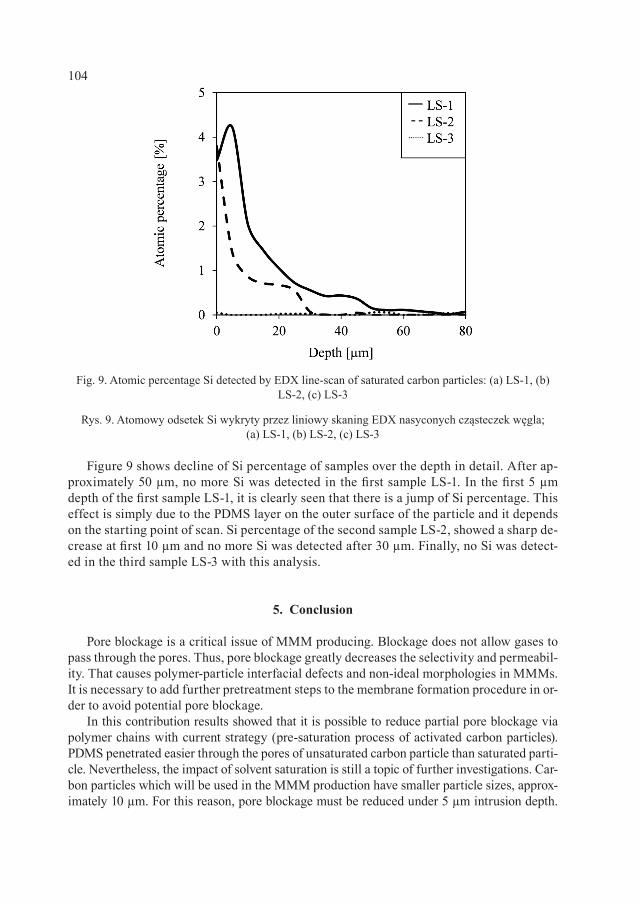
104
Figure 9 shows decline of Si percentage of samples over the depth in detail. After ap-proximately 50 µm, no more Si was detected in the first sample LS-1. In the first 5 µm depth of the first sample LS-1, it is clearly seen that there is a jump of Si percentage. This effect is simply due to the PDMS layer on the outer surface of the particle and it depends on the starting point of scan. Si percentage of the second sample LS-2, showed a sharp de-crease at first 10 µm and no more Si was detected after 30 µm. Finally, no Si was detect-ed in the third sample LS-3 with this analysis.
5. Conclusion
Pore blockage is a critical issue of MMM producing. Blockage does not allow gases to pass through the pores. Thus, pore blockage greatly decreases the selectivity and permeabil-ity. That causes polymer-particle interfacial defects and non-ideal morphologies in MMMs. It is necessary to add further pretreatment steps to the membrane formation procedure in or-der to avoid potential pore blockage.
In this contribution results showed that it is possible to reduce partial pore blockage via polymer chains with current strategy (pre-saturation process of activated carbon particles).PDMS penetrated easier through the pores of unsaturated carbon particle than saturated parti-cle. Nevertheless, the impact of solvent saturation is still a topic of further investigations. Car-bon particles which will be used in the MMM production have smaller particle sizes, approx-imately 10 µm. For this reason, pore blockage must be reduced under 5 µm intrusion depth.
Fig. 9. Atomic percentage Si detected by EDX line-scan of saturated carbon particles: (a) LS-1, (b) LS-2, (c) LS-3
Rys. 9. Atomowy odsetek Si wykryty przez liniowy skaning EDX nasyconych cząsteczek węgla; (a) LS-1, (b) LS-2, (c) LS-3
105
Future work includes investigating of performance of different solvents and secondly, testing of permeation properties (permeability and selectivity) of produced membranes in-cluding a pre-saturation process.
The authors gratefully acknowledge the financial support of the BundesministeriumfürBildung und Forschung (BMBF) and thank their cooperation partners Blücher GmbH, Helmholtz-ZentrumGeesthacht and Sterling SIHI.
R e f e r e n c e s
[1] Bernardo P. , Driol i E. , Golemme G. , Industrial & Engineering Chemistry Re-search, 48, 2009, 4638-4663.
[2] Aroon M.A. , Ismail A.F. , Matsuura T. , Montazer-Rahmati M.M., Separa-tion and Purification Technology, 75, 2010, 229-242.
[3] Chung T.S. , J iang L.Y. , Li Y. , Kulprathipanja S. , Progress in Polymer Sci-ence, 32, 2007, 483-507.
[4] Clar iz ia G. , Algier i C. , Driol i E. , Polymer, 45, 2004, 5671-5681.[5] Robeson L.M., Journal of Membrane Science, 62, 1991, 165-185.[6] Bakht iar i O. , Mosleh S. , Khosravi T. , Mohammadi T. , Journal of Membrane
Science, 1, 2011, 1-8.[7] Robeson L.M., Journal of Membrane Science, 320, 2008, 390-400.[8] Vu D.Q. , Koros W.J . , Mil ler S.J . , Journal of Membrane Science, 211, 2003, 311-
-334.[9] Sadrzadeh M., Sal joughi E. , Shahidi K. , Mohammadi T. , Polymers for
Advanced Technologies, 21, 2010, 568-577.

ZDZISŁAW JAWORSKI*, IGNACY SARZYŃSKI**,1 MICHAŁ DYLĄG***
A CONCEPT OF PILOT PLANT FOR INNOVATIVE PRODUCTION OF AMMONIUM FERTILIZERS
KONCEPCJA INSTALACJI PILOTAŻOWEJ DO INNOWACYJNEJ PRODUKCJI
NAWOZÓW AMONOWYCH
A b s t r a c t
Basic features of a novel concept for production of ammonium fertilizers was presented in the paper. The key elements of a pilot plant and their roles in testing the concept were briefly described. Important aims of implementation of the pilot plant were also outlined. Six main units constituting the pilot installation were presented along with four basic stages of the project. The project targets were divided into six work packa-ges and 15 individual tasks to be finalized within two years.Keywords: novel production method, ammonium fertilizers, pilot plant
S t r e s z c z e n i e
Basic features of a novel concept for production of ammonium fertilizers was presented in the paper. The key elements of a pilot plant and their roles in testing the concept were briefly described. Important aims of implementation of the pilot plant were also outlined. Six main units constituting the pilot installation were presented along with four basic stages of the project. The project targets were divided into six work packages and 15 individual tasks to be finalized within two years.Słowa kluczowe: nowa metoda produkcji, nawozy amonowe, instalacja pilotażowa
* Prof. PhD. Eng. inż. Zdzisław Jaworski, Institute of Chemical Engineering and Environmental Protections Processes, West Pomeranian University of Technology, Szczecin.
** MSc. Eng. Ignacy Szarzyński, Retired design engineer.*** Prof. PhD. Eng. Michał Dyląg, Institute of Advanced Manufacturing Technologies, Cracow.
108
1. Introduction
Inorganic fertilizers typically contain three basic elements, which are important macro-nu-trients for crops. Those elements are nitrogen N, phosphorus P and potassium K. Especially valuable are those fertilizers that contain high amount of active components and little ballast – inactive compounds. One of the fertilizers rich in active components is DAP, which main-ly consists of diammonium phosphate, (NH4)2PO4. The standard industrial grade of DAP is 18-46-0 counted as N-P2O5-K2O weight percentage. The fertilizer is usually manufactured by ammonization of ortophosphoric acid derived in wet-process of extraction from phosphorus containing ores. Several technologies of industrial DAP production are used in Europe ranging from classical Dorr-Oliver method to modern processes of Uhde GmbH or Norsk Hydro [1].
The formation reaction of the diammonium phosphate occurs in two stages presented in eqs. (1) and (2).
The total enthalpy of the exothermal reactions (1) and (2) equals to ∆h = –193 kJ/mol [1].The published methods of DAP manufacturing employ various reactors fed with phos-
phoric acid and a necessary excess of ammonia to achieve full di-ammonium salt. That ex-cess is usually recovered in an absorption unit. However, according to current Best Availa-ble Technologies (BAT) the losses of ammonia in typical DAP installations in Europe range from 5 to 30 mgNH3/ Nm3 in exit gases [2]. The high reaction enthalpy is utilised for auto-thermal evaporation of water included in extracted phosphoric acid. The developed steam contains the excess of ammonia and the vapour stream is usually delivered to absorption unit.
2. Essence of the method
The innovative method for manufacturing of DAP and DAS (diammonium sulphate) consists in a two-stage, counter-current contacting of the basic substrates, i.e. ammonia and a relevant acid, be it phosphoric or sulphuric acid or a mixture of both. The flow scheme of a production plant is presented in Fig. 1 [3]. Results of a survey of patents and other open lit-erature indicate novel features of the two-stage production method.
The innovative method of manufacturing the di-ammonium salt fertilizers distinguish-es by the following characteristics from the existing methods: (i) significantly lower acidity than mono-ammonium salts and a high content of nitrogen in the fertilizer, (ii) possibility of utilization of the exothermic reaction heat for generating steam of about 0.6 kg/kg of ferti-lizer, (iii) decreasing losses of ammonia and water, (iv) lowering energy demand for product granulation, (v) essentially wasteless production. The features signify a considerable pro-gress as compared with the classical methods, however it requires application of pressure equipment that operates at elevated temperature and in corrosive environment. In particular, the reaction liquid/suspension mixture from Stage 1 has to be compressed by pump, P, from the pressure level of Stage 1 to that of Stage 2. The main product exiting Stage 2 can be ei-ther directly sprayed over a granulation bed or solidified by cooling the product suspension.
3 3 4 4 2 4NH H PO NH H PO (1)+ =
3 4 2 4 4 2 4NH +NH H PO =(NH ) HPO (2)
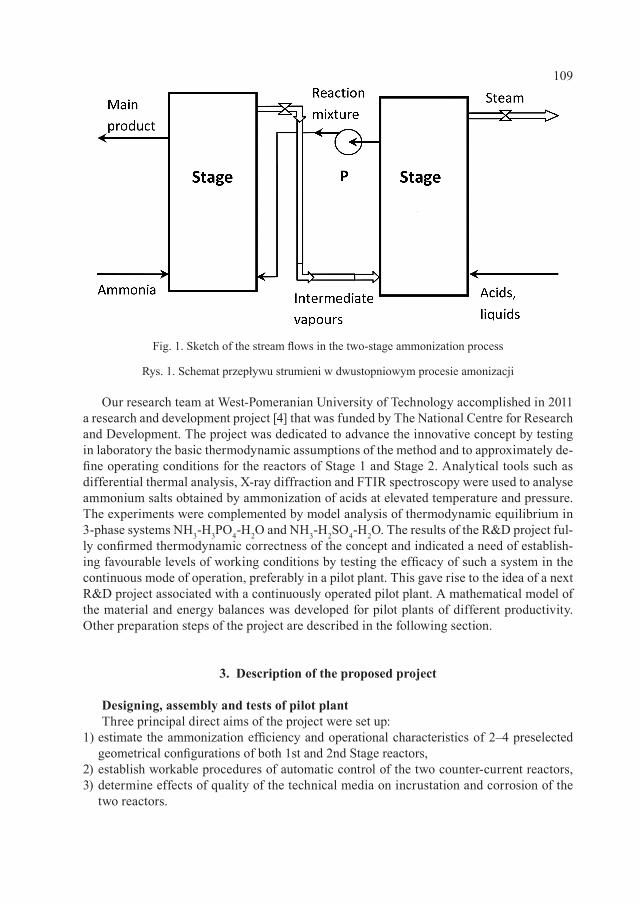
109
Our research team at West-Pomeranian University of Technology accomplished in 2011 a research and development project [4] that was funded by The National Centre for Research and Development. The project was dedicated to advance the innovative concept by testing in laboratory the basic thermodynamic assumptions of the method and to approximately de-fine operating conditions for the reactors of Stage 1 and Stage 2. Analytical tools such as differential thermal analysis, X-ray diffraction and FTIR spectroscopy were used to analyse ammonium salts obtained by ammonization of acids at elevated temperature and pressure. The experiments were complemented by model analysis of thermodynamic equilibrium in 3-phase systems NH3-H3PO4-H2O and NH3-H2SO4-H2O. The results of the R&D project ful-ly confirmed thermodynamic correctness of the concept and indicated a need of establish-ing favourable levels of working conditions by testing the efficacy of such a system in the continuous mode of operation, preferably in a pilot plant. This gave rise to the idea of a next R&D project associated with a continuously operated pilot plant. A mathematical model of the material and energy balances was developed for pilot plants of different productivity. Other preparation steps of the project are described in the following section.
3. Description of the proposed project
Designing, assembly and tests of pilot plantThree principal direct aims of the project were set up:
1) estimate the ammonization efficiency and operational characteristics of 2–4 preselected geometrical configurations of both 1st and 2nd Stage reactors,
2) establish workable procedures of automatic control of the two counter-current reactors,3) determine effects of quality of the technical media on incrustation and corrosion of the
two reactors.
Fig. 1. Sketch of the stream flows in the two-stage ammonization process
Rys. 1. Schemat przepływu strumieni w dwustopniowym procesie amonizacji
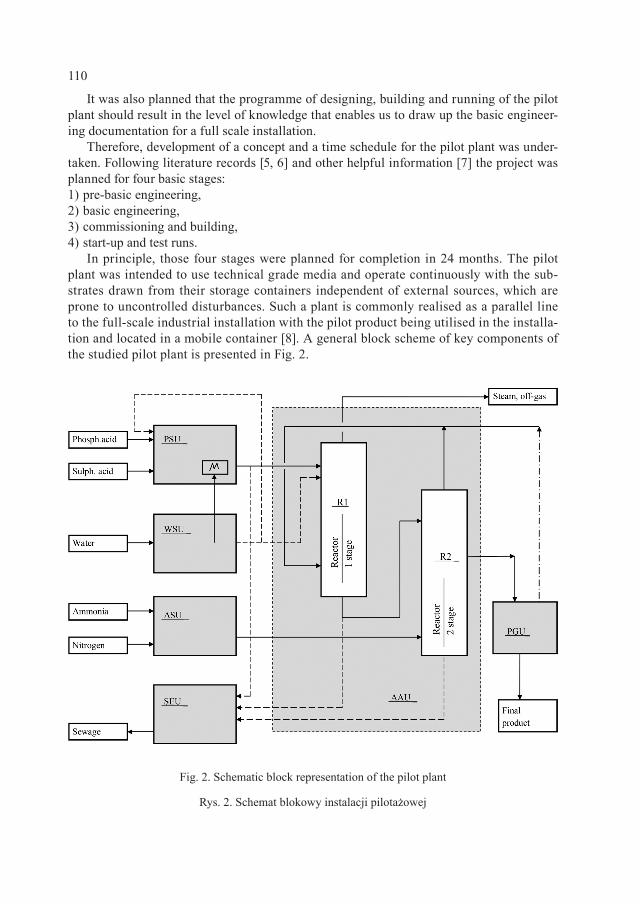
110
It was also planned that the programme of designing, building and running of the pilot plant should result in the level of knowledge that enables us to draw up the basic engineer-ing documentation for a full scale installation.
Therefore, development of a concept and a time schedule for the pilot plant was under-taken. Following literature records [5, 6] and other helpful information [7] the project was planned for four basic stages: 1) pre-basic engineering, 2) basic engineering, 3) commissioning and building, 4) start-up and test runs.
In principle, those four stages were planned for completion in 24 months. The pilot plant was intended to use technical grade media and operate continuously with the sub-strates drawn from their storage containers independent of external sources, which are prone to uncontrolled disturbances. Such a plant is commonly realised as a parallel line to the full-scale industrial installation with the pilot product being utilised in the installa-tion and located in a mobile container [8]. A general block scheme of key components of the studied pilot plant is presented in Fig. 2.
Fig. 2. Schematic block representation of the pilot plant
Rys. 2. Schemat blokowy instalacji pilotażowej
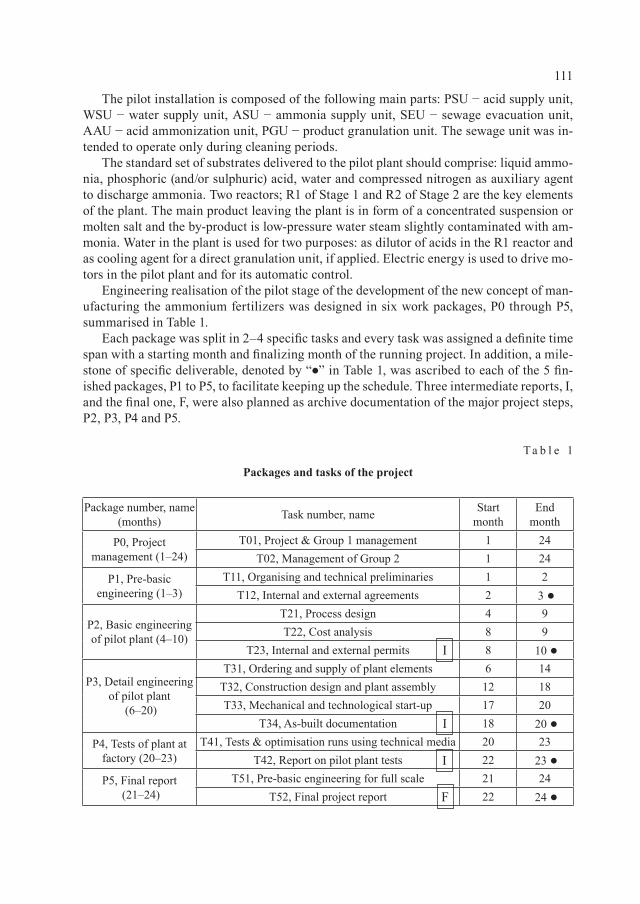
111
The pilot installation is composed of the following main parts: PSU − acid supply unit, WSU − water supply unit, ASU − ammonia supply unit, SEU − sewage evacuation unit, AAU − acid ammonization unit, PGU − product granulation unit. The sewage unit was in-tended to operate only during cleaning periods.
The standard set of substrates delivered to the pilot plant should comprise: liquid ammo-nia, phosphoric (and/or sulphuric) acid, water and compressed nitrogen as auxiliary agent to discharge ammonia. Two reactors; R1 of Stage 1 and R2 of Stage 2 are the key elements of the plant. The main product leaving the plant is in form of a concentrated suspension or molten salt and the by-product is low-pressure water steam slightly contaminated with am-monia. Water in the plant is used for two purposes: as dilutor of acids in the R1 reactor and as cooling agent for a direct granulation unit, if applied. Electric energy is used to drive mo-tors in the pilot plant and for its automatic control.
Engineering realisation of the pilot stage of the development of the new concept of man-ufacturing the ammonium fertilizers was designed in six work packages, P0 through P5, summarised in Table 1.
Each package was split in 2–4 specific tasks and every task was assigned a definite time span with a starting month and finalizing month of the running project. In addition, a mile-stone of specific deliverable, denoted by “” in Table 1, was ascribed to each of the 5 fin-ished packages, P1 to P5, to facilitate keeping up the schedule. Three intermediate reports, I, and the final one, F, were also planned as archive documentation of the major project steps, P2, P3, P4 and P5.
T a b l e 1
Packages and tasks of the project
Package number, name (months) Task number, name Start
monthEnd
month
P0, Project management (1–24)
T01, Project & Group 1 management 1 24 T02, Management of Group 2 1 24
P1, Pre-basic engineering (1–3)
T11, Organising and technical preliminaries 1 2T12, Internal and external agreements 2 3
P2, Basic engineering of pilot plant (4–10)
T21, Process design 4 9T22, Cost analysis 8 9
T23, Internal and external permits 8 10
P3, Detail engineering of pilot plant
(6–20)
T31, Ordering and supply of plant elements 6 14T32, Construction design and plant assembly 12 18T33, Mechanical and technological start-up 17 20
T34, As-built documentation 18 20 P4, Tests of plant at
factory (20–23)T41, Tests & optimisation runs using technical media 20 23
T42, Report on pilot plant tests 22 23 P5, Final report
(21–24)T51, Pre-basic engineering for full scale 21 24
T52, Final project report 22 24
I
I
I
F
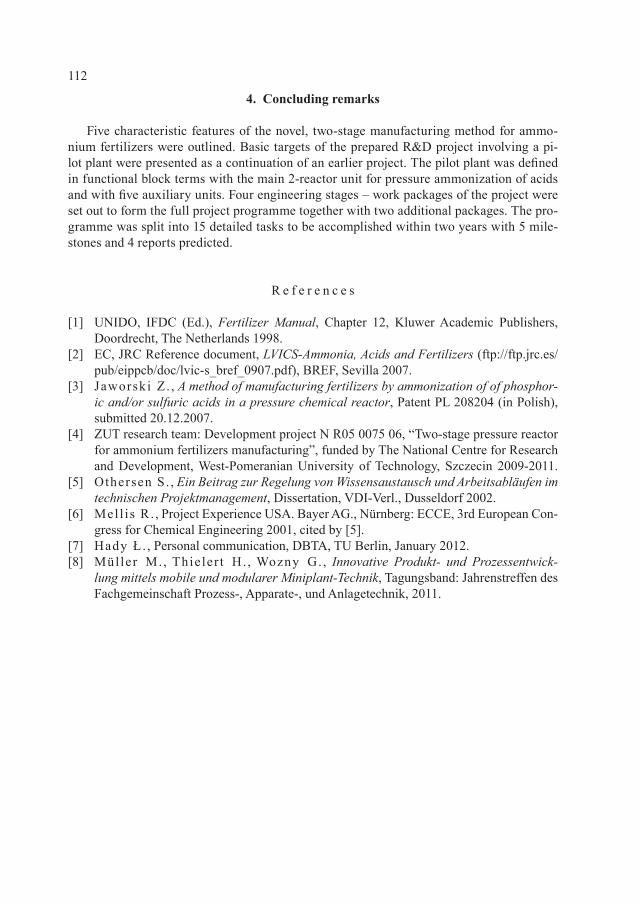
112
4. Concluding remarks
Five characteristic features of the novel, two-stage manufacturing method for ammo-nium fertilizers were outlined. Basic targets of the prepared R&D project involving a pi-lot plant were presented as a continuation of an earlier project. The pilot plant was defined in functional block terms with the main 2-reactor unit for pressure ammonization of acids and with five auxiliary units. Four engineering stages – work packages of the project were set out to form the full project programme together with two additional packages. The pro-gramme was split into 15 detailed tasks to be accomplished within two years with 5 mile-stones and 4 reports predicted.
R e f e r e n c e s
[1] UNIDO, IFDC (Ed.), Fertilizer Manual, Chapter 12, Kluwer Academic Publishers, Doordrecht, The Netherlands 1998.
[2] EC, JRC Reference document, LVICS-Ammonia, Acids and Fertilizers (ftp://ftp.jrc.es/pub/eippcb/doc/lvic-s_bref_0907.pdf), BREF, Sevilla 2007.
[3] Jaworski Z. , A method of manufacturing fertilizers by ammonization of of phosphor-ic and/or sulfuric acids in a pressure chemical reactor, Patent PL 208204 (in Polish), submitted 20.12.2007.
[4] ZUT research team: Development project N R05 0075 06, “Two-stage pressure reactor for ammonium fertilizers manufacturing”, funded by The National Centre for Research and Development, West-Pomeranian University of Technology, Szczecin 2009-2011.
[5] Othersen S. , Ein Beitrag zur Regelung von Wissensaustausch und Arbeitsabläufen im technischen Projektmanagement, Dissertation, VDI-Verl., Dusseldorf 2002.
[6] Mell is R. , Project Experience USA. Bayer AG., Nürnberg: ECCE, 3rd European Con-gress for Chemical Engineering 2001, cited by [5].
[7] Hady Ł. , Personal communication, DBTA, TU Berlin, January 2012.[8] Müller M., Thieler t H. , Wozny G. , Innovative Produkt- und Prozessentwick-
lung mittels mobile und modularer Miniplant-Technik, Tagungsband: Jahrenstreffen des Fachgemeinschaft Prozess-, Apparate-, und Anlagetechnik, 2011.
JOHANNES KAMP, STEPHANIE NACHTIGALL, SEBASTIAN MAAß, MATTHIAS KRAUME*1
MODELLING OF COALESCENCE IN TURBULENT LIQUID/LIQUID DISPERSIONS CONSIDERING
DROPLET CHARGE
WZORY KOALESCENCJI W TURBULENTNYCH DYSPERSJACH MIĘDZY PŁYNAMI W ODNIESIENIU
DO ŁADUNKU KROPELKI
A b s t r a c t
Drop size distributions in liquid/liquid systems within a turbulent flow, being an integral part of many tech-nical applications, can be simulated solving population balance equations. Experimental investigations in stirred toluene/water systems at constant ionic strength of 0.1 mol/L showed that with pH values higher than 11, coalescence is hindered considerably due to electrostatic effects. Within this work, two designated models are used to simulate the transient drop size distributions in a stirred tank, showing that the influen-ce of droplet charge due to a change in pH value or ion concentration cannot be predicted satisfactorily by existing models. This finding motivates a new modelling approach implementing the DLVO theory into the population balance framework.Keywords: population balance equation, coalescence, electrostatic force, droplet charge
S t r e s z c z e n i e
Nierównomierne rozmieszczenie w przepływie turbulentnym w układach między płynami, stanowiących integralną część wielu urządzeń technicznych, można symulować przez rozwiązywanie równań równowagi populacji. Badania doświadczalne w zakresie mieszanych układów toluen/woda przy stałej sile jonowej 0,1 mol/L pokazały, że przy wartościach pH przekraczających 11 koalescencja jest znacznie utrudniona ze względu na efekty elektrostatyczne. W pracy niniejszej wykorzystano dwa przydzielone modele symulujące nierównomierne rozmieszczenie przejściowe w mieszanym zbiorniku. Za pomocą istniejących modeli nie można wiarygodnie prognozować wpływu ładunku kropelki po zmianie wartości pH lub stężenia jonu. Odkrycie to stanowi motywację dla nowej taktyki realizowania teorii DLVO w zakresie równowagi populacji.Słowa kluczowe: równanie równowagi populacji, koalescencja, siła elektrostatyczna, ładunek kropelki
* Dipl. Eng. Johannes Kamp, Dipl. Eng. Stephanie Nachtigall, PhD. Eng. Sebastian Maaß, Prof. PhD. Eng. Matthias Kraume, Chair of Chemical and Process Engineering, TU Berlin.
114
1. Introduction
Dispersions of two immiscible fluids in a turbulent flow are part of many technical pro-cesses, like i.e. the liquid/liquid (l/l) extraction or suspension polymerization, and therefore of great interest for the industry. Although, these processes are used frequently, they are by no means completely understood. Thus, the modelling and dimensioning of these are caus-ing serious difficulties. A significant part of the efficiency of these processes is based on the drop size distribution (DSD) within the devices, which is the result of the competing dy-namic phenomena of drop breakage and coalescence. A widely used modelling approach of solving population balance equations (PBE) has been used to predict DSD for several appli-cations [1]. Up to now, a reliable prediction of the DSD, depending on chemical, geometri-cal and process parameters, fails. Existing models include influencing factors of the chemi-cal composition like density, viscosity and interfacial tension, but also electrostatic interac-tions and mass transfer influence the DSD significantly.
A short overview of existing experimental investigations of DSD in technical devices and an introduction into population balances will be given. Furthermore, existing models in literature will be used to describe the coalescence inhibition at high pH values observed in experiments. Due to insufficient prediction of these models the need for a new modelling approach will be illustrated.
2. State of the Art
2.1. Experimental investigations
Due to the major importance of DSD for the technical application of l/l systems, a lot of experimental research has been accomplished until now. For example, the investigations for different devices like extraction columns [2], mixer settler [3], separators [4] and stirred tanks [5] should be mentioned here. Major interest has been the influence of parameters like phase fraction, energy dissipation rate, density, viscosity and interfacial tension.
The coalescence of drops can be influenced massively by the addition of surfactants or electrochemical effects [6, 7] and might even lead to a complete inhibition of coalescence. Electrochemical effects result from a surface charge of a drop induced by i.e. raising the pH value of the system. The surface charge again is dampened by the presence of ions in the con-tinuous phase [8, 9]. In total a repulsing electrostatic force results between two approaching drops. Additionally, in the close-up range of two droplets, the attractive van der Waals force comes into account. The interaction between repulsing electrostatic and attractive van der Waals force is commonly known as DLVO theory, developed independently from each oth-er by Derjaguin and Landau [10] and Verwey and Overbeek [11]. Investigations of Tobin and Ramkrishna [12] show the influence of the drop surface charge in l/l systems. Due to the inhi-bition of coalescence, the raise of pH value leads to smaller drops in the stirred tank. In con-trast, with addition of sodium chloride the coalescence inhibition was reduced, resulting in an increase of the drop size. The decrease of drop size in a stirred tank at pH values higher than 11 has also been described by Gäbler et al. [5] and Kraume et al. [13] and was also explained by the inhibition of coalescence. Furthermore, Kraume et al. [13] investigated the dependen-
115
cy of coalescence inhibition by NaCl-concentration in shaken flask experiments. It was shown that the settling time, hence the time in which a disperse system separates into two clear phas-es, tends to decrease with raising salt concentration.
Within this work the considered models will be used to simulate the experimental results from Wegener [14] (shown partially in [5]). The sauter mean diameter has been observed by Wegener at constant ionic strength (I = 0.1 mol/L) leading to a sharp decrease of about 40% at pH 13 in comparison to other pH values.
2.2. Population Balance Equation
The population balance equation, a partial differential equation, describes the time depend-ent density function ),( tdf P of particles within a defined volume of the continuous phase. In a batch reactor containing a l/l system, the PBE can be expressed considering only the size change of the particles (in this case drops):
where iB and iD are the death and birth terms of breakage and coalescence, respectively. Each of these terms is expressed by submodels, describing the particular phenomena in de-tail. For drop breakage the terms can be written as:
containing the drop breakage rate )( Pdg , the daughter drop size distribution ),( PP dd ′b and the number of daughter droplets created by drop breakup )( Pdν .
The terms of coalescence are developed using the definition 3133 )( PPP ddd ′−=′′ :
with the coalescence rate ),( PP ddF ′ . A detailed discussion of PBE in general can be found in Ramkrishna [1] and Liao and Lucas [15, 16] who reviewed breakage and coalescence models for l/l systems.
For all simulations showed here a Gaussian daughter drop size distribution ),( PP dd ′b and binary drop breakup ( 2)( =ν Pd ) is assumed. In this work the commonly used model for l/l systems from Coulaloglou and Tavlarides [17] will be compared with the only model in lit-erature including electrostatic effects from Tobin and Ramkrishna [18]. These two models will be presented shortly, for detailed information see corresponding literature.
2.2.1. Model of Coulaloglou & Tavlarides
Coulaloglou and Tavlarides [17] proposed a phenomenological model for l/l systems using PBE, in which the breakage rate )( Pdg is assumed to be a product of the fraction of
( , )Pb b c c
f d t B D B Dt
∂= − + −
∂
( ) ( , ) ( ) ( , ) ( ) ( , )P
b b P P P P P P P Pd
B D d d d g d f d t dd g d f d t∞
′ ′ ′ ′ ′− = ν ⋅b ⋅ ⋅ − ⋅∫
0 0
1 ( , ) ( , ) ( , ) d ( , ) ( , ) ( , ) d2
Pd
c c P P P P P P P P P PB D F d d f d t f d t d f d t F d d f d t d∞
′′ ′ ′ ′′ ′ ′ ′ ′− = ⋅ ⋅ − ⋅ ⋅∫ ∫
116
breaking drops and the reciprocal time needed for the drop breakup to occur, which re-sults in the following:
The factor 1)1( −ϕ+ was introduced subsequently by Coulaloglou and Tavlarides [17] to ac-count for the damping effect of droplets on local turbulent intensities.
The coalescence rate ),( PP ddF ′ is defined as the product of the collision frequency ),( PP dd ′ξ and the coalescence efficiency ),( PP dd ′l :
The collision frequency expresses how often drops in the system collide and interact with each other. Assuming an analogy between collisions of drops in a locally isotropic flow field and collisions of molecules as in the kinetic theory of gases, yields
This collision frequency is a modified version of the original one, published by Tsouris and Tavlarides [19].
The coalescence efficiency corresponds to the probability that two collided drops coa-lesce. Having a closer look at the collision of drops, the coalescence efficiency is described by relating the contact time of two drops to the time required for the drainage of the thin film of continuous phase between these drops:
With this work Coulaloglou and Tavlarides achieved a mechanistic model for l/l systems which is still frequently used nowadays. To fit experimental data, the model contains four numerical parameters.
2.2.2. Model of Tobin & Ramkrishna
The PBE model proposed by Tobin and Ramkrishna [18] was motivated by earlier in-vestigations in a stirred tank by the same authors in which an influence of ionic strength and pH on the coalescence rate was observed [12]. It is the only model known to the au-thor taking electrostatic interactions into account. As the investigators only study the droplet coalescence rate in a stirred tank by reducing the impeller frequency abruptly, the developed model does not include breakage terms in the PBE. The overall coales-
1 23
1, 2,2 523 3 3
(1 )( ) exp(1 )
P b b
P d P
g d c cd d
ε γ + ϕ = − + ϕ ρ ε
( , ) ( , ) ( , )P P P P P PF d d d d d dξ l′ ′ ′= ⋅
13 2 2 12 3 3 3
1,( , ) ( ) ( )1P P c P P P Pd d c d d d dε′ ′ ′ξ = + ++ ϕ
4
C&T 2, 2 3( , ) exp(1 )
c c P PP P c
P P
d dd d cd d
′ h ρ ε ⋅ ′l = − ′+γ + ϕ
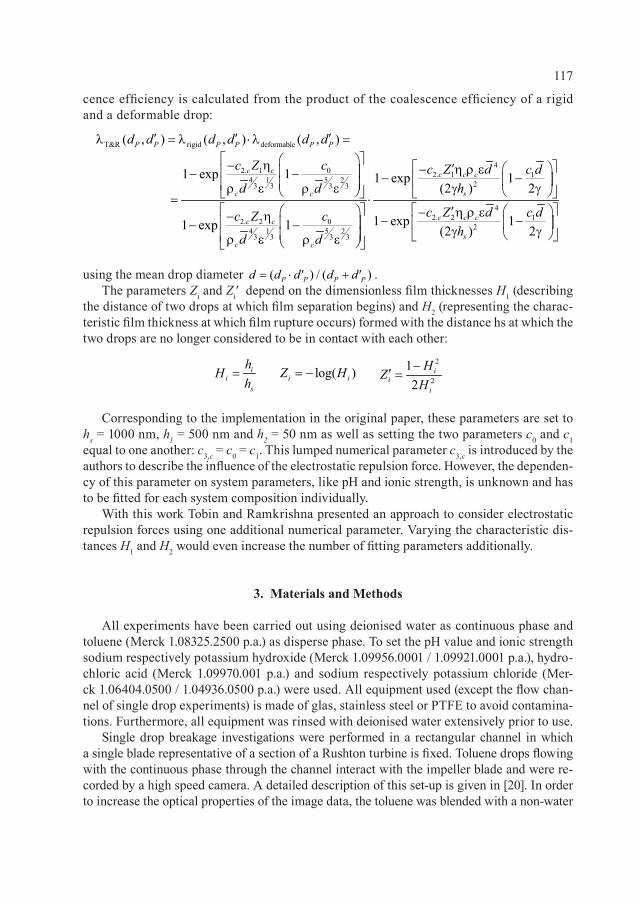
117
cence efficiency is calculated from the product of the coalescence efficiency of a rigid and a deformable drop:
using the mean drop diameter ( ) / ( )P P P Pd d d' d d'= ⋅ + .The parameters Zi and Zi′ depend on the dimensionless film thicknesses H1 (describing
the distance of two drops at which film separation begins) and H2 (representing the charac-teristic film thickness at which film rupture occurs) formed with the distance hs at which the two drops are no longer considered to be in contact with each other:
Corresponding to the implementation in the original paper, these parameters are set to hs = 1000 nm, h1 = 500 nm and h2 = 50 nm as well as setting the two parameters c0 and c1 equal to one another: c3,c = c0 = c1. This lumped numerical parameter c3,c is introduced by the authors to describe the influence of the electrostatic repulsion force. However, the dependen-cy of this parameter on system parameters, like pH and ionic strength, is unknown and has to be fitted for each system composition individually.
With this work Tobin and Ramkrishna presented an approach to consider electrostatic repulsion forces using one additional numerical parameter. Varying the characteristic dis-tances H1 and H2 would even increase the number of fitting parameters additionally.
3. Materials and Methods
All experiments have been carried out using deionised water as continuous phase and toluene (Merck 1.08325.2500 p.a.) as disperse phase. To set the pH value and ionic strength sodium respectively potassium hydroxide (Merck 1.09956.0001 / 1.09921.0001 p.a.), hydro-chloric acid (Merck 1.09970.001 p.a.) and sodium respectively potassium chloride (Mer-ck 1.06404.0500 / 1.04936.0500 p.a.) were used. All equipment used (except the flow chan-nel of single drop experiments) is made of glas, stainless steel or PTFE to avoid contamina-tions. Furthermore, all equipment was rinsed with deionised water extensively prior to use.
Single drop breakage investigations were performed in a rectangular channel in which a single blade representative of a section of a Rushton turbine is fixed. Toluene drops flowing with the continuous phase through the channel interact with the impeller blade and were re-corded by a high speed camera. A detailed description of this set-up is given in [20]. In order to increase the optical properties of the image data, the toluene was blended with a non-water
T&R rigid deformable
42. 1 0 2. 1 1
4 1 5 2 23 3 3 3
2. 2 04 1 5 2
3 3 3 3
( , ) ( , ) ( , )
1 exp 1 1 exp 12(2 )
1 ex1 exp 1
P P P P P P
c c c c c
c sc
c c
c c
d d d d d d
c Z c c Z d c dd hd
c Z c
d d
′ ′ ′l = l ⋅l = − h ′ − h ρ ε − − − − γρ ε γρ ε = ⋅ − h − − −
ρ ε ρ ε
42. 2 1
2p 12(2 )
c c c
s
c Z d c dh
′ − h ρ ε− γγ
ii
s
hH
h= log( )i iZ H= −
2
2
12
ii
i
HZ
H−′ =
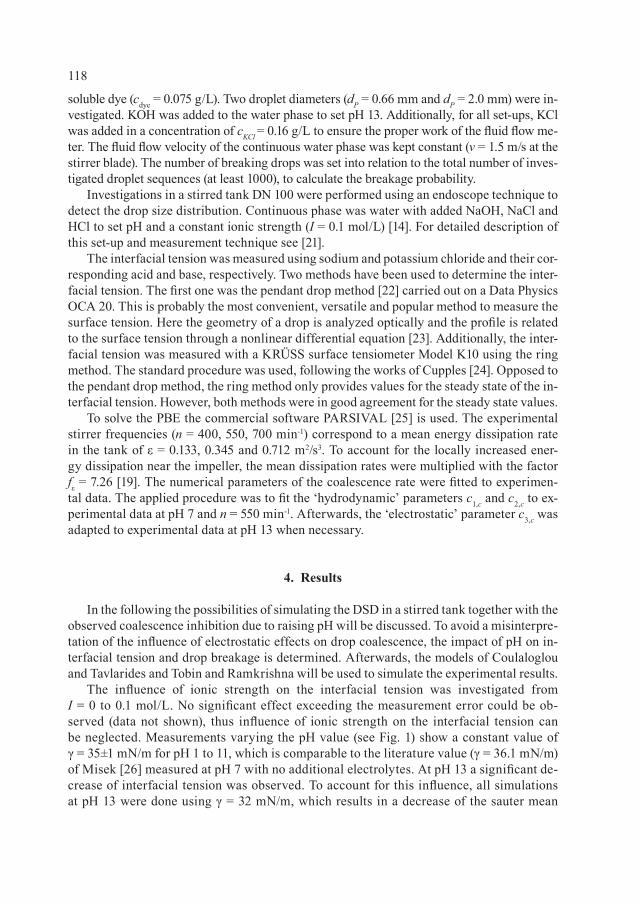
118
soluble dye (cdye = 0.075 g/L). Two droplet diameters (dP = 0.66 mm and dP = 2.0 mm) were in-vestigated. KOH was added to the water phase to set pH 13. Additionally, for all set-ups, KCl was added in a concentration of cKCl = 0.16 g/L to ensure the proper work of the fluid flow me-ter. The fluid flow velocity of the continuous water phase was kept constant (v = 1.5 m/s at the stirrer blade). The number of breaking drops was set into relation to the total number of inves-tigated droplet sequences (at least 1000), to calculate the breakage probability.
Investigations in a stirred tank DN 100 were performed using an endoscope technique to detect the drop size distribution. Continuous phase was water with added NaOH, NaCl and HCl to set pH and a constant ionic strength (I = 0.1 mol/L) [14]. For detailed description of this set-up and measurement technique see [21].
The interfacial tension was measured using sodium and potassium chloride and their cor-responding acid and base, respectively. Two methods have been used to determine the inter-facial tension. The first one was the pendant drop method [22] carried out on a Data Physics OCA 20. This is probably the most convenient, versatile and popular method to measure the surface tension. Here the geometry of a drop is analyzed optically and the profile is related to the surface tension through a nonlinear differential equation [23]. Additionally, the inter-facial tension was measured with a KRÜSS surface tensiometer Model K10 using the ring method. The standard procedure was used, following the works of Cupples [24]. Opposed to the pendant drop method, the ring method only provides values for the steady state of the in-terfacial tension. However, both methods were in good agreement for the steady state values.
To solve the PBE the commercial software PARSIVAL [25] is used. The experimental stirrer frequencies (n = 400, 550, 700 min-1) correspond to a mean energy dissipation rate in the tank of ε = 0.133, 0.345 and 0.712 m2/s3. To account for the locally increased ener-gy dissipation near the impeller, the mean dissipation rates were multiplied with the factor fε = 7.26 [19]. The numerical parameters of the coalescence rate were fitted to experimen-tal data. The applied procedure was to fit the ‘hydrodynamic’ parameters c1,c and c2,c to ex-perimental data at pH 7 and n = 550 min-1. Afterwards, the ‘electrostatic’ parameter c3,c was adapted to experimental data at pH 13 when necessary.
4. Results
In the following the possibilities of simulating the DSD in a stirred tank together with the observed coalescence inhibition due to raising pH will be discussed. To avoid a misinterpre-tation of the influence of electrostatic effects on drop coalescence, the impact of pH on in-terfacial tension and drop breakage is determined. Afterwards, the models of Coulaloglou and Tavlarides and Tobin and Ramkrishna will be used to simulate the experimental results.
The influence of ionic strength on the interfacial tension was investigated from I = 0 to 0.1 mol/L. No significant effect exceeding the measurement error could be ob-served (data not shown), thus influence of ionic strength on the interfacial tension can be neglected. Measurements varying the pH value (see Fig. 1) show a constant value of γ = 35±1 mN/m for pH 1 to 11, which is comparable to the literature value (γ = 36.1 mN/m) of Misek [26] measured at pH 7 with no additional electrolytes. At pH 13 a significant de-crease of interfacial tension was observed. To account for this influence, all simulations at pH 13 were done using γ = 32 mN/m, which results in a decrease of the sauter mean
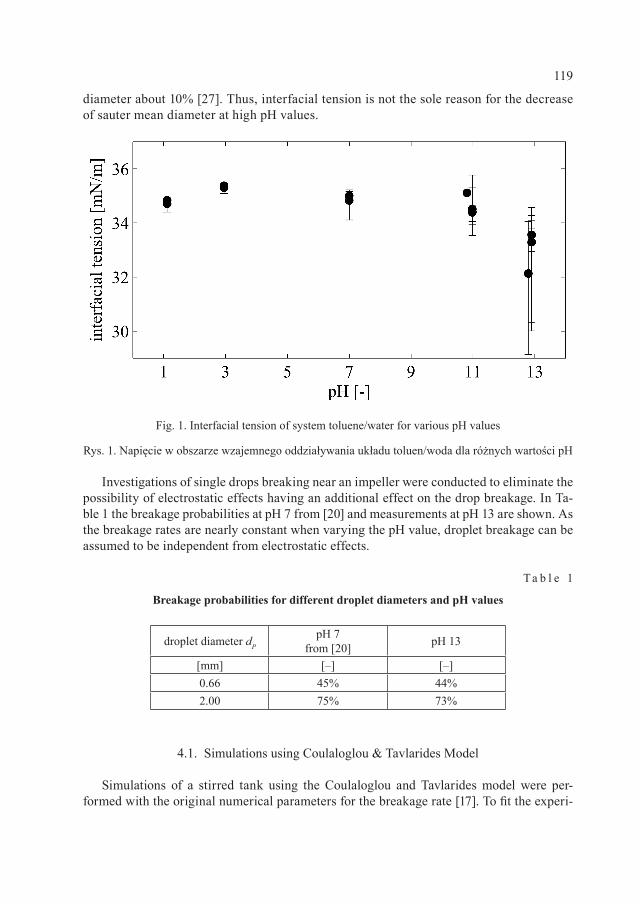
119
diameter about 10% [27]. Thus, interfacial tension is not the sole reason for the decrease of sauter mean diameter at high pH values.
Investigations of single drops breaking near an impeller were conducted to eliminate the possibility of electrostatic effects having an additional effect on the drop breakage. In Ta-ble 1 the breakage probabilities at pH 7 from [20] and measurements at pH 13 are shown. As the breakage rates are nearly constant when varying the pH value, droplet breakage can be assumed to be independent from electrostatic effects.
T a b l e 1
Breakage probabilities for different droplet diameters and pH values
droplet diameter dPpH 7
from [20] pH 13
[mm] [–] [–]0.66 45% 44%2.00 75% 73%
4.1. Simulations using Coulaloglou & Tavlarides Model
Simulations of a stirred tank using the Coulaloglou and Tavlarides model were per-formed with the original numerical parameters for the breakage rate [17]. To fit the experi-
Fig. 1. Interfacial tension of system toluene/water for various pH values
Rys. 1. Napięcie w obszarze wzajemnego oddziaływania układu toluen/woda dla różnych wartości pH
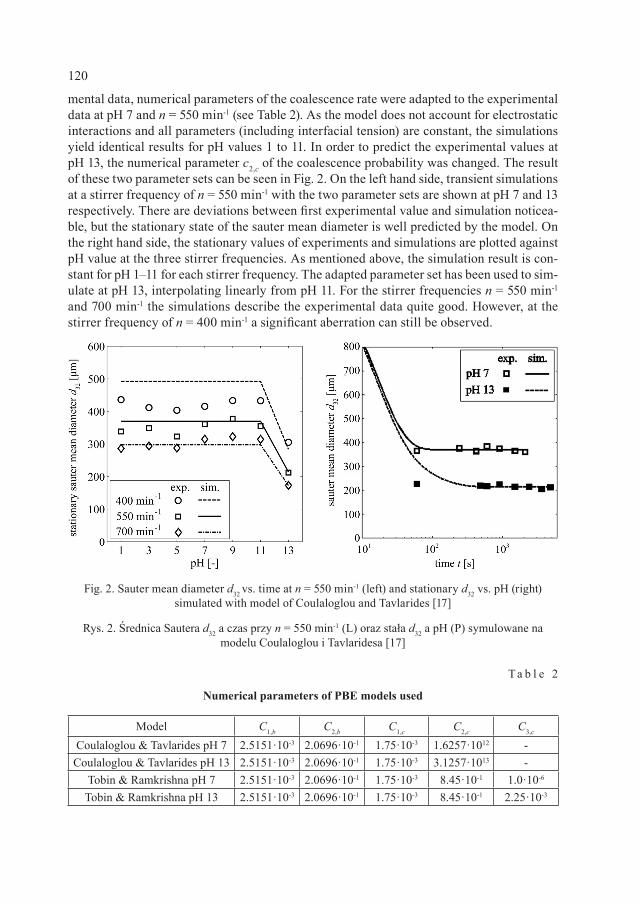
120
mental data, numerical parameters of the coalescence rate were adapted to the experimental data at pH 7 and n = 550 min-1 (see Table 2). As the model does not account for electrostatic interactions and all parameters (including interfacial tension) are constant, the simulations yield identical results for pH values 1 to 11. In order to predict the experimental values at pH 13, the numerical parameter c2,c of the coalescence probability was changed. The result of these two parameter sets can be seen in Fig. 2. On the left hand side, transient simulations at a stirrer frequency of n = 550 min-1 with the two parameter sets are shown at pH 7 and 13 respectively. There are deviations between first experimental value and simulation noticea-ble, but the stationary state of the sauter mean diameter is well predicted by the model. On the right hand side, the stationary values of experiments and simulations are plotted against pH value at the three stirrer frequencies. As mentioned above, the simulation result is con-stant for pH 1–11 for each stirrer frequency. The adapted parameter set has been used to sim-ulate at pH 13, interpolating linearly from pH 11. For the stirrer frequencies n = 550 min-1 and 700 min-1 the simulations describe the experimental data quite good. However, at the stirrer frequency of n = 400 min-1 a significant aberration can still be observed.
T a b l e 2
Numerical parameters of PBE models used
Model C1,b C2,b C1,c C2,c C3,c
Coulaloglou & Tavlarides pH 7 2.5151·10-3 2.0696·10-1 1.75·10-3 1.6257·1012 -Coulaloglou & Tavlarides pH 13 2.5151·10-3 2.0696·10-1 1.75·10-3 3.1257·1013 -
Tobin & Ramkrishna pH 7 2.5151·10-3 2.0696·10-1 1.75·10-3 8.45·10-1 1.0·10-6
Tobin & Ramkrishna pH 13 2.5151·10-3 2.0696·10-1 1.75·10-3 8.45·10-1 2.25·10-3
Fig. 2. Sauter mean diameter d32 vs. time at n = 550 min-1 (left) and stationary d32 vs. pH (right) simulated with model of Coulaloglou and Tavlarides [17]
Rys. 2. Średnica Sautera d32 a czas przy n = 550 min-1 (L) oraz stała d32 a pH (P) symulowane na modelu Coulaloglou i Tavlaridesa [17]
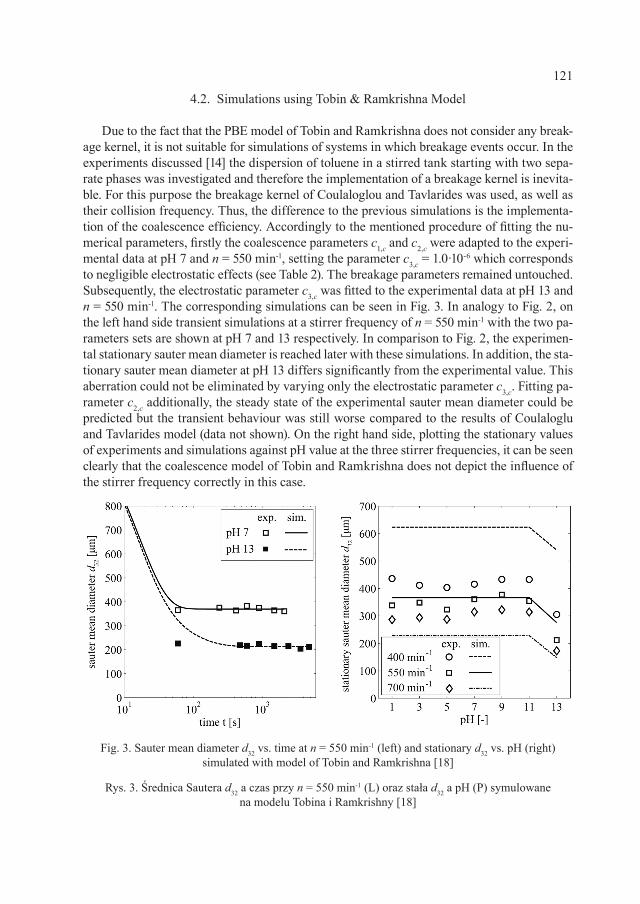
121
4.2. Simulations using Tobin & Ramkrishna Model
Due to the fact that the PBE model of Tobin and Ramkrishna does not consider any break-age kernel, it is not suitable for simulations of systems in which breakage events occur. In the experiments discussed [14] the dispersion of toluene in a stirred tank starting with two sepa-rate phases was investigated and therefore the implementation of a breakage kernel is inevita-ble. For this purpose the breakage kernel of Coulaloglou and Tavlarides was used, as well as their collision frequency. Thus, the difference to the previous simulations is the implementa-tion of the coalescence efficiency. Accordingly to the mentioned procedure of fitting the nu-merical parameters, firstly the coalescence parameters c1,c and c2,c were adapted to the experi-mental data at pH 7 and n = 550 min-1, setting the parameter c3,c = 1.0·10-6 which corresponds to negligible electrostatic effects (see Table 2). The breakage parameters remained untouched. Subsequently, the electrostatic parameter c3,c was fitted to the experimental data at pH 13 and n = 550 min-1. The corresponding simulations can be seen in Fig. 3. In analogy to Fig. 2, on the left hand side transient simulations at a stirrer frequency of n = 550 min-1 with the two pa-rameters sets are shown at pH 7 and 13 respectively. In comparison to Fig. 2, the experimen-tal stationary sauter mean diameter is reached later with these simulations. In addition, the sta-tionary sauter mean diameter at pH 13 differs significantly from the experimental value. This aberration could not be eliminated by varying only the electrostatic parameter c3,c. Fitting pa-rameter c2,c additionally, the steady state of the experimental sauter mean diameter could be predicted but the transient behaviour was still worse compared to the results of Coulaloglu and Tavlarides model (data not shown). On the right hand side, plotting the stationary values of experiments and simulations against pH value at the three stirrer frequencies, it can be seen clearly that the coalescence model of Tobin and Ramkrishna does not depict the influence of the stirrer frequency correctly in this case.
Fig. 3. Sauter mean diameter d32 vs. time at n = 550 min-1 (left) and stationary d32 vs. pH (right) simulated with model of Tobin and Ramkrishna [18]
Rys. 3. Średnica Sautera d32 a czas przy n = 550 min-1 (L) oraz stała d32 a pH (P) symulowane na modelu Tobina i Ramkrishny [18]
122
Comparing the two simulation approaches, it can be concluded that the model of Cou-laloglou and Tavlarides is able to predict the experimental data better than the one of Tobin and Ramkrishna. This is especially the case considering the dependency of the stirrer fre-quency and therefore the power input. Since the Coulaloglou and Tavlarides model does not account for electrostatic effects, it is quite interesting that it performs better than the mod-el of Tobin and Ramkrishna. For both models one numerical parameter has to be varied to describe the coalescence inhibition at high pH values. For this purpose, the model of Tobin and Ramkrishna even needs one extra numerical parameter which has to be fitted addition-ally for every application. Varying the representative distances h1 and h2 may improve simu-lating results, but also increases the number of adapting parameters by two. Furthermore, it is questionable to define a constant critical distance h2 = 50 nm at which coalescence occurs, knowing that the resulting repulsion force strongly depends on ionic strength [10, 11] and only reaches significant values at a distance of a few (about 2–20) nanometers in l/l systems [28]. Varying the factor fε, which accounts for locally increased energy dissipation, shifts the numerical parameters but does not change the shown characteristics of the models in this single zone modelling approach. This effect can be seen directly in the Coulaloglou and Tav-larides model, but also accounts for the model of Tobin and Ramkrishna (data not shown).
5. Summary and Outlook
It could be shown that the experimental finding of smaller drop sizes with increasing pH is not only determined by a decrease of interfacial tension but also depends on the electrostat-ic interaction of droplets. As the electrostatic effect does not influence the drop breakage, as shown in experimental investigations of single drop breakup, it can only result in an inhibition of coalescence. Trying to simulate this coalescence inhibition, it is shown that the standard model of Coulaloglou and Tavlarides is able to describe the experimental data better with var-ying one coalescence parameter than the model of Tobin and Ramkrishna. Although, the latter accounts for electrostatic repulsion in model development also using one varying parameter.
To include electrostatic effects, i.e. induced by a pH shift within a reactor, the PBE mod-elling has to be extended by a physically based model with a constant numerical parameter. To maintain the model kit system of PBE, this new model should be combinable with exist-ing models of electrostatic efficiency. A model fulfilling these demands has been developed by the author successfully. For this purpose, the surface charge of droplets have been quan-tified and implemented into PBE framework using the DLVO theory. This modelling ap-proach will be presented on 19th International Conference Process Engineering and Chemi-cal Plant Design and published forthcoming.
S y m b o l s
– birth rate [1/s]ci,b ci,c – numerical parameters for breakage & coalescence [various]c – concentration [g/L]d32 – sauter mean diameter [m]dp – particle diameter [m]
iB
123
– mean particle diameter [m] – death rate [1/s]
ε – energy dissipation rate [m²/s³]fε – factor accounting for increase of ε near impeller [–]f – density function [m-3]F – coalescence rate [m3/s]g – breakage rate [s-1]γ – interfacial tension [N/m]hi – characteristic distances [m]Hi – dimensionless characteristic distances [–]I – ionic strength [mol/L]λ – coalescence efficiency [–]n – stirrer rotational frequency [min-1]ηc – dynamic viscosity of continuous phase [Pa s]φ – volume fraction [–]ξ – collision frequency [m3/s]ρc ρd – density of continuous & disperse phase [kg/m³]t – time [s]v – velocity [m/s]Zi ci – parameters in Tobin & Ramkrishna model [various]
R e f e r e n c e s
[1] Ramkrishna D. , Population balance, Academic Press, San Diego 2000.[2] Gomes L.N. , Guimaraes M.L. , Lopes J .C. , Madureira C.N. , St ichlmair
J . , Cruz-Pinto J .J . , Reproducibility of the Hydrodynamic Performance and Mea-surements in a Liquid-Liquid Kühni Extraction Column-Relevance to Theoretical Mod-el Evaluation, Industrial & Engineering Chemistry Research, 43(4), 2004, 1061-1070.
[3] Davies G.A. , Jeffreys G.V. , Smith D.V. , Rate of coalescence of the dispersed phase in a laboratory mixer settler unit. II. Analysis of coalescence in a continuous mix-er settler system by a differential model, AIChE J., 16, 1970, 827–831.
[4] Fr is ing T. , Noik C. , Dalmazzone C. , The liquid-liquid sedimentation process: From droplet coalescence to technologically enhanced water-oil emulsion gravity se-parators: A review, Journal of Dispersion Science and Technology, 27, 2006, 1035-1057.
[5] Gäbler A. , Wegener M., Paschedag A. , Kraume M., The effect of pH on exper-imental and simulation results of transient drop size distributions in stirred liquid-liquid dispersions, Chemical Engineering Science, 61(9), 2006, 3018-3024.
[6] Rambhau D. , Phadke D.S. , Dorle A.K. , Evaluation of o/w emulsion stability through zeta potential, I, J. Soc. Cosmet. Chem, 28, 1977, 183-196.
[7] Watanabe A. , Electrochemistry of oil-water interfaces, [in:] Matijevic E.: Surface and Colloid Science, 13, Plenum Press, New York 1984, 1-70.
[8] Lyklema J . , van Leeuwen H.P. , Minor M., DLVO-theory, a dynamic re-interpre-tation, Advances in Colloid and Interface Science, 83(1-3), 1999, 33-69.
[9] Lyklema J . , Fundamentals of Interface and Colloid Science: Liquid-fluid interfaces, Academic Press, London 2000.
diD
124[10] Derjaguin B.V. , Landau E.M., Theory of the stability of strongly charged lyopho-
bic sols and of the adhesion of strongly charged particles in solutions of electrolytes, Acta Physicochitnica U.R.S.S, 14, 1941, 633-662.
[11] Verwey E.J .W., Overbeek J .T.G. , Theory of the Stability of Lyophobic Colloids, Elsevier 1948.
[12] Tobin T. , Ramkrishna D. , Coalescence of charged droplets in agitated liquid-liquid dispersions, AIChE Journal, 38(8), 1992, 1199-1205.
[13] Kraume M., Gäbler A. , Schulze K. , Influence of physical properties on drop size distributions of stirred liquid-liquid dispersions, Chemical Engineering & Technology, 27(3), 2004, 330-334.
[14] Wegener M., Experimentelle Untersuchungen und Modellierung von transienten Tropfengrößenverteilungen in gerührten Flüssig-flüssig-Systemen, Master thesis, Chair of Chemical and process Engineering, TU Berlin, Germany 2004.
[15] Liao Y. , Lucas D. , A literature review of theoretical models for drop and bubble breakup in turbulent dispersions, Chemical Engineering Science, 64(15), 2009, 3389-3406.
[16] Liao Y. , Lucas D. , A literature review on mechanisms and models for the coales-cence process of fluid particles, Chemical Engineering Science, 65, 2010, 2851-2864.
[17] Coulaloglou C.A. , Tavlar ides L.L. , Description of interaction processes in agitated liquid-liquid dispersions, Chemical Engineering Science, 32, 1977, 1289-1297.
[18] Tobin T. , Ramkrishna D.: Modeling the effect of drop charge on coalescence in tur-bulent liquid-liquid dispersions, The Canadian Journal of Chemical Engineering, 77(6), 1999, 1090-1104.
[19] Tsouris C. , Tavlar ides L.L. , Breakage and Coalescence Models for Drops in Tur-bulent Dispersions, AIChE Journal, 40(3), 1994, 395-406.
[20] Maaß S. , Kraume M.: Determination of breakage rates using single drop experi-ments, Chemical Engineering Science, 70, 2012, 146-164.
[21] Maaß S. , Wollny S. , Voigt A. , Kraume M., Experimental comparison of measurement techniques for drop size distributions in liquid/liquid dispersions, Experiments in Fluids, 50(2), 2011, 259-269.
[22] Jon D.I . , Rosano H.L. , Cummins H.Z. , Toluene Water/1-Propanol Interfacial-Tension Measurements by Means of Pendant Drop, Spinning Drop, and Laser Light-Scattering Methods, J. Colloid Interface Science, 114, 1986, 330-341.
[23] Arashiro E.Y. , Demarquet te N.R. , Use of the Pendant Drop Method to Mea-sure Interfacial Tension between Molten Polymers, Materials Research, 2, 1999, 23-32.
[24] Cupples H.L. , Interfacial Tension by the Ring Method - the Benzene-Water Interface, Journal of Physical and Colloid Chemistry, 51, 1947, 1341-1345.
[25] Wulkow M., Gerst lauer A. , Nieken U. , Modeling and simulation of crystalliza-tion processes using parsival, Chemical Engineering Science, 56(7), 2001, 2575-2588.
[26] Misek T. , Berger R. , Schröter J . , Standard Test Systems for Liquid Extraction, 2nd edn. EFCE Publication Series 46, European Federation of Chemical Engineering, Warwickshire 1985.
[27] Maaß S. , Paschedag A.R. , Kraume M., Influence of Electrolytes and Turbulence Parameters on Drop Breakage and Drop Size Distributions in Stirred Liquid/Liquid Dis-persion, Proceedings of 6th International Conference on Multiphase Flow, Leipzig 2007.
[28] Pfennig A. , Schwerin A. , Influence of Electrolytes on Liquid-Liquid Extraction, In-dustrial & Engineering Chemistry Research, 37(8), 1998, 3180-3188.
VERENA KRAMER, DENIZ HÜLAGÜ, MATHIAS KRAUME*1
DEVELOPMENT OF A MECHNISTIC MODEL FOR SORPTION SELECTIVE MIXED-MATRIX
MEMBRANES FOR GAS SEPARATION
OPRACOWANIE MODELU MECHANICZNEGO DLA WIELOMATRYCOWYCH SELEKTYWNYCH MEMBRAN SORPCYJNYCH SŁUŻĄCYCH DO ODDZIELANIA GAZU
A b s t r a c t
In this article a new, mechanistic model for mass transport in mixed-matrix membranes (MMM) is introduced. It was developed for sorption selective MMMs taking into account sorption cha-racteristics, morphological parameters and operation conditions. Model structure, equations and input parameters are discussed. Investigations of different determining factors on perme-ability are shown for permeation of n-butane through mixed-matrix membranes made of PDMS and activated carbon. The results are compared with the Maxwell model to prove plausibility of the new concept.Keywords: gaspermeation, mixed-matrix membranes, modeling, n-butane
S t r e s z c z e n i e
W artykule niniejszym wprowadzono nowy, mechaniczny model przenoszenia masy w membra-nach wielomatrycowych (MMM). Został on opracowany dla selektywnych MMM sorpcyjnych z uwzględnieniem charakterystyki sorpcji, parametrów morfologicznych oraz warunków pracy. W artykule omówiono strukturę modelu, równania i parametry wejściowe, a także przedstawiono badanie różnego rodzaju czynników decydujących o przenikalności w zakresie przenikania n-bu-tanu przez membrany wielomatrycowe wykonane z PDMS i węgla aktywowanego. Aby udowod-nić wykonalność nowej koncepcji, wyniki porównano z modelem Maxwella.Słowa kluczowe: przenikanie gazu, membrany wielomatrycowe, model, n-butan
* Verena Kamer, Deniz Hülgaü, Prof. PhD. Eng. Matthias Kraume, Chair of Chemical and Process Engineering, TU Berlin.
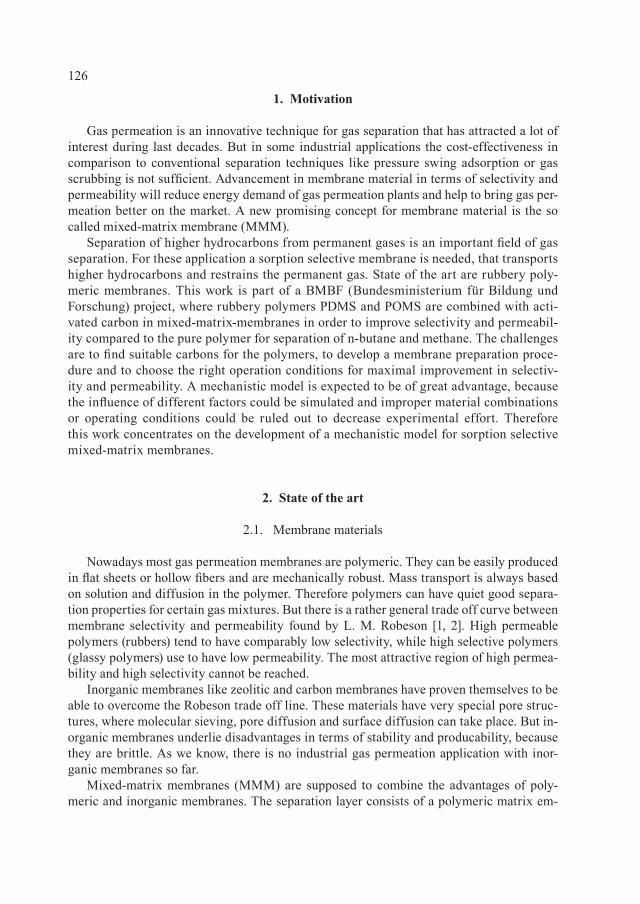
126
1. Motivation
Gas permeation is an innovative technique for gas separation that has attracted a lot of interest during last decades. But in some industrial applications the cost-effectiveness in comparison to conventional separation techniques like pressure swing adsorption or gas scrubbing is not sufficient. Advancement in membrane material in terms of selectivity and permeability will reduce energy demand of gas permeation plants and help to bring gas per-meation better on the market. A new promising concept for membrane material is the so called mixed-matrix membrane (MMM).
Separation of higher hydrocarbons from permanent gases is an important field of gas separation. For these application a sorption selective membrane is needed, that transports higher hydrocarbons and restrains the permanent gas. State of the art are rubbery poly-meric membranes. This work is part of a BMBF (Bundesministerium für Bildung und Forschung) project, where rubbery polymers PDMS and POMS are combined with acti-vated carbon in mixed-matrix-membranes in order to improve selectivity and permeabil-ity compared to the pure polymer for separation of n-butane and methane. The challenges are to find suitable carbons for the polymers, to develop a membrane preparation proce-dure and to choose the right operation conditions for maximal improvement in selectiv-ity and permeability. A mechanistic model is expected to be of great advantage, because the influence of different factors could be simulated and improper material combinations or operating conditions could be ruled out to decrease experimental effort. Therefore this work concentrates on the development of a mechanistic model for sorption selective mixed-matrix membranes.
2. State of the art
2.1. Membrane materials
Nowadays most gas permeation membranes are polymeric. They can be easily produced in flat sheets or hollow fibers and are mechanically robust. Mass transport is always based on solution and diffusion in the polymer. Therefore polymers can have quiet good separa-tion properties for certain gas mixtures. But there is a rather general trade off curve between membrane selectivity and permeability found by L. M. Robeson [1, 2]. High permeable poly mers (rubbers) tend to have comparably low selectivity, while high selective poly mers (glassy polymers) use to have low permeability. The most attractive region of high permea-bility and high selectivity cannot be reached.
Inorganic membranes like zeolitic and carbon membranes have proven themselves to be able to overcome the Robeson trade off line. These materials have very special pore struc-tures, where molecular sieving, pore diffusion and surface diffusion can take place. But in-organic membranes underlie disadvantages in terms of stability and producability, because they are brittle. As we know, there is no industrial gas permeation application with inor-ganic membranes so far.
Mixed-matrix membranes (MMM) are supposed to combine the advantages of poly-meric and inorganic membranes. The separation layer consists of a polymeric matrix em-
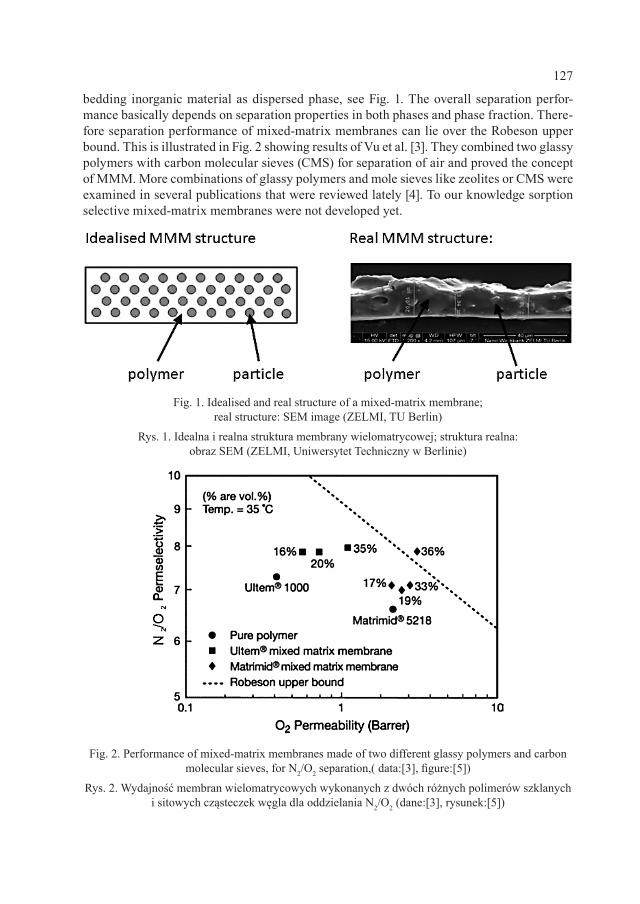
127
bedding inorganic material as dispersed phase, see Fig. 1. The overall separation perfor-mance basically depends on separation properties in both phases and phase fraction. There-fore separation performance of mixed-matrix membranes can lie over the Robeson upper bound. This is illustrated in Fig. 2 showing results of Vu et al. [3]. They combined two glassy polymers with carbon molecular sieves (CMS) for separation of air and proved the concept of MMM. More combinations of glassy polymers and mole sieves like zeolites or CMS were examined in several publications that were reviewed lately [4]. To our knowledge sorption selective mixed-matrix membranes were not developed yet.
Fig. 1. Idealised and real structure of a mixed-matrix membrane; real structure: SEM image (ZELMI, TU Berlin)
Rys. 1. Idealna i realna struktura membrany wielomatrycowej; struktura realna: obraz SEM (ZELMI, Uniwersytet Techniczny w Berlinie)
Fig. 2. Performance of mixed-matrix membranes made of two different glassy polymers and carbon molecular sieves, for N2/O2 separation,( data:[3], figure:[5])
Rys. 2. Wydajność membran wielomatrycowych wykonanych z dwóch różnych polimerów szklanych i sitowych cząsteczek węgla dla oddzielania N2/O2 (dane:[3], rysunek:[5])
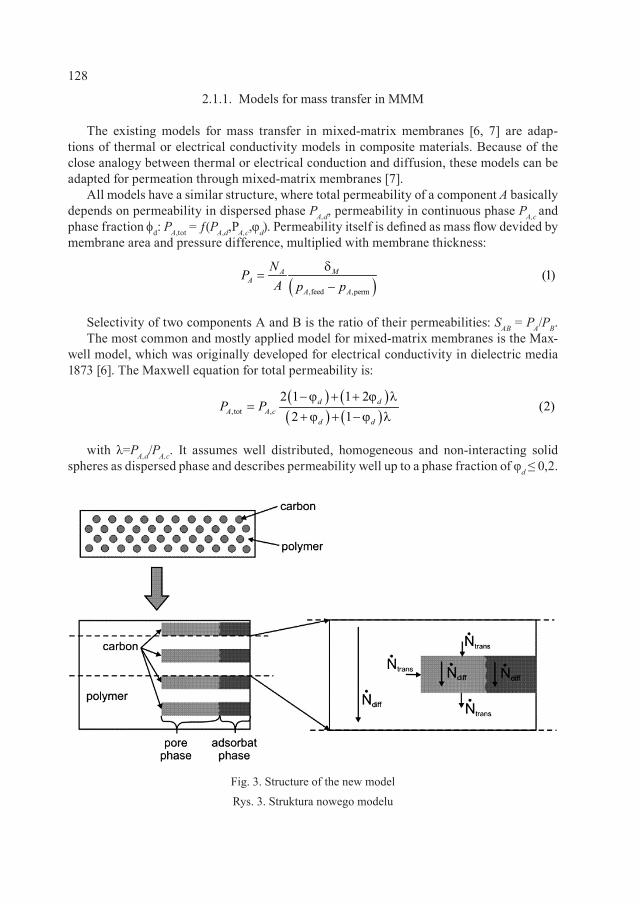
128
2.1.1. Models for mass transfer in MMM
The existing models for mass transfer in mixed-matrix membranes [6, 7] are adap-tions of thermal or electrical conductivity models in composite materials. Because of the close analo gy between thermal or electrical conduction and diffusion, these models can be adapted for permeation through mixed-matrix membranes [7].
All models have a similar structure, where total permeability of a component A basically depends on permeability in dispersed phase PA,d, permeability in continuous phase PA,c and phase fraction fd: PA,tot = ƒ(PA,d,PA,c,φd). Permeability itself is defined as mass flow devided by membrane area and pressure difference, multiplied with membrane thickness:
Selectivity of two components A and B is the ratio of their permeabilities: SAB = PA/PB.The most common and mostly applied model for mixed-matrix membranes is the Max-
well model, which was originally developed for electrical conductivity in dielectric media 1873 [6]. The Maxwell equation for total permeability is:
with λ=PA,d/PA,c. It assumes well distributed, homogeneous and non-interacting solid spheres as dispersed phase and describes permeability well up to a phase fraction of φd ≤ 0,2.
( ),feed ,perm
(1)A MA
A A
NPA p p
d=
−
( ) ( )( ) ( ), tot ,
2 1 1 2(2)
2 1d d
A A cd d
P P−ϕ + + ϕ l
=+ ϕ + −ϕ l
Fig. 3. Structure of the new model
Rys. 3. Struktura nowego modelu
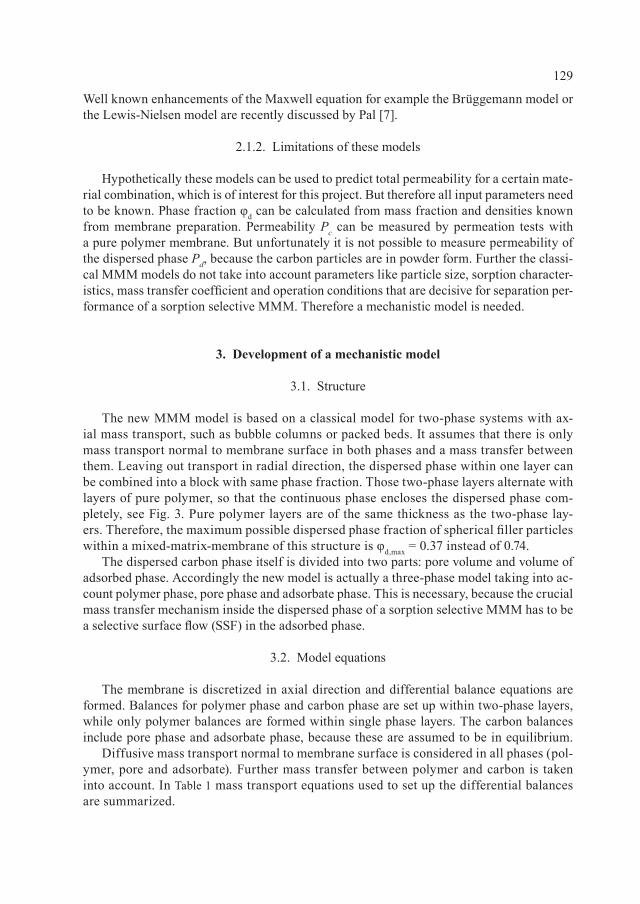
129
Well known enhancements of the Maxwell equation for example the Brüggemann model or the Lewis-Nielsen model are recently discussed by Pal [7].
2.1.2. Limitations of these models
Hypothetically these models can be used to predict total permeability for a certain mate-rial combination, which is of interest for this project. But therefore all input parameters need to be known. Phase fraction φd can be calculated from mass fraction and densities known from membrane preparation. Permeability Pc can be measured by permeation tests with a pure polymer membrane. But unfortunately it is not possible to measure permeability of the dispersed phase Pd, because the carbon particles are in powder form. Further the classi-cal MMM models do not take into account parameters like particle size, sorption character-istics, mass transfer coefficient and operation conditions that are decisive for separation per-formance of a sorption selective MMM. Therefore a mechanistic model is needed.
3. Development of a mechanistic model
3.1. Structure
The new MMM model is based on a classical model for two-phase systems with ax-ial mass transport, such as bubble columns or packed beds. It assumes that there is only mass transport normal to membrane surface in both phases and a mass transfer between them. Leaving out transport in radial direction, the dispersed phase within one layer can be combined into a block with same phase fraction. Those two-phase layers alternate with layers of pure polymer, so that the continuous phase encloses the dispersed phase com-pletely, see Fig. 3. Pure polymer layers are of the same thickness as the two-phase lay-ers. Therefore, the maximum possible dispersed phase fraction of spherical filler particles within a mixed-matrix-membrane of this structure is φd,max = 0.37 instead of 0.74.
The dispersed carbon phase itself is divided into two parts: pore volume and volume of adsorbed phase. Accordingly the new model is actually a three-phase model taking into ac-count polymer phase, pore phase and adsorbate phase. This is necessary, because the crucial mass transfer mechanism inside the dispersed phase of a sorption selective MMM has to be a selective surface flow (SSF) in the adsorbed phase.
3.2. Model equations
The membrane is discretized in axial direction and differential balance equations are formed. Balances for polymer phase and carbon phase are set up within two-phase layers, while only polymer balances are formed within single phase layers. The carbon balances include pore phase and adsorbate phase, because these are assumed to be in equilibrium.
Diffusive mass transport normal to membrane surface is considered in all phases (pol-ymer, pore and adsorbate). Further mass transfer between polymer and carbon is taken into account. In Table 1 mass transport equations used to set up the differential balances are summarized.
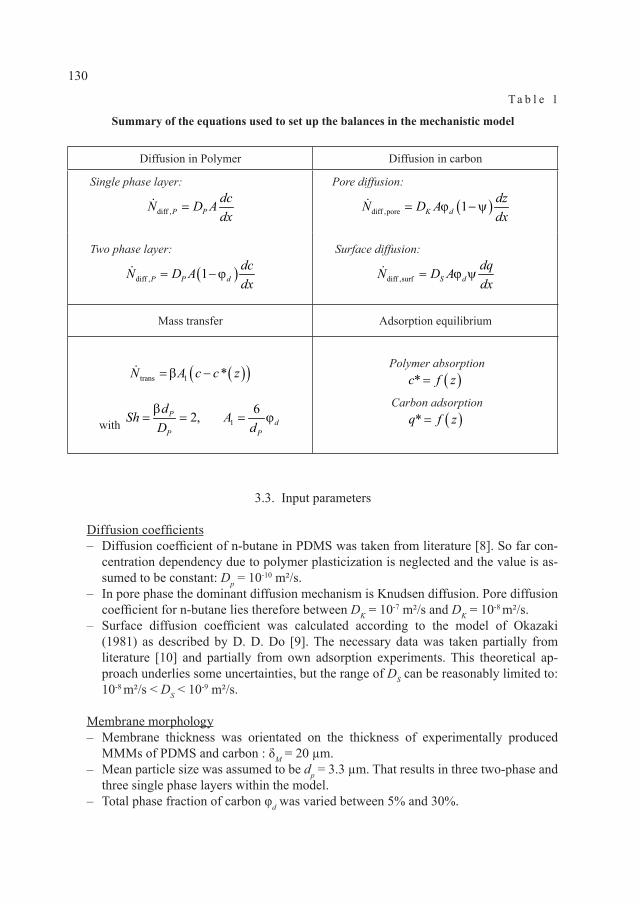
130
T a b l e 1
Summary of the equations used to set up the balances in the mechanistic model
Diffusion in Polymer Diffusion in carbon
Single phase layer:
diff ,P PdcN D Adx
=
Pore diffusion:
( )diff ,pore 1K ddzN D Adx
= ϕ −y
Two phase layer:
( )diff , 1P P ddcN D Adx
= −ϕ
Surface diffusion:
diff ,surf S ddqN D Adx
= ϕ y
Mass transfer Adsorption equilibrium
( )( )trans 1 *N A c c z= b −
with
162,P
dP P
dSh AD db
= = = ϕ
Polymer absorption( )*c f z=
Carbon adsorption( )*q f z=
3.3. Input parameters
Diffusion coefficients – Diffusion coefficient of n-butane in PDMS was taken from literature [8]. So far con-
centration dependency due to polymer plasticization is neglected and the value is as-sumed to be constant: Dp = 10-10 m²/s.
– In pore phase the dominant diffusion mechanism is Knudsen diffusion. Pore diffusion coefficient for n-butane lies therefore between DK = 10-7 m²/s and DK = 10-8 m²/s.
– Surface diffusion coefficient was calculated according to the model of Okazaki (1981) as described by D. D. Do [9]. The necessary data was taken partially from literature [10] and partially from own adsorption experiments. This theoretical ap-proach underlies some uncertainties, but the range of DS can be reasonably limited to: 10-8 m²/s < DS < 10-9 m²/s.
Membrane morphology – Membrane thickness was orientated on the thickness of experimentally produced
MMMs of PDMS and carbon : δM = 20 µm. – Mean particle size was assumed to be dp = 3.3 µm. That results in three two-phase and
three single phase layers within the model. – Total phase fraction of carbon φd was varied between 5% and 30%.
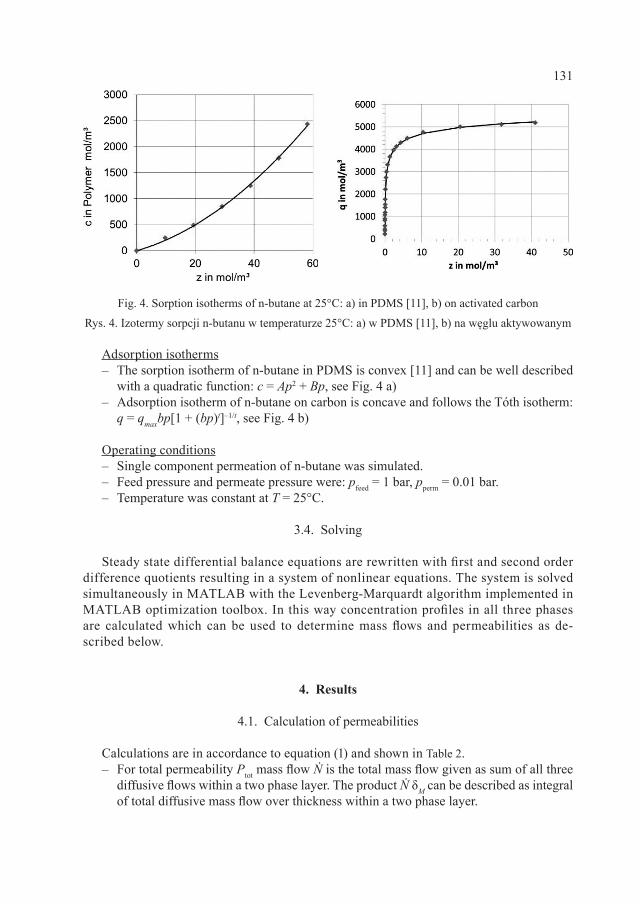
131
Adsorption isotherms – The sorption isotherm of n-butane in PDMS is convex [11] and can be well described
with a quadratic function: c = Ap2 + Bp, see Fig. 4 a) – Adsorption isotherm of n-butane on carbon is concave and follows the Tóth isotherm:
q = qmaxbp[1 + (bp)t]–1/t, see Fig. 4 b)
Operating conditions – Single component permeation of n-butane was simulated. – Feed pressure and permeate pressure were: pfeed = 1 bar, pperm = 0.01 bar. – Temperature was constant at T = 25°C.
3.4. Solving
Steady state differential balance equations are rewritten with first and second order difference quotients resulting in a system of nonlinear equations. The system is solved simultaneously in MATLAB with the Levenberg-Marquardt algorithm implemented in MATLAB optimization toolbox. In this way concentration profiles in all three phases are calculated which can be used to determine mass flows and permeabilities as de-scribed below.
4. Results
4.1. Calculation of permeabilities
Calculations are in accordance to equation (1) and shown in Table 2. – For total permeability Ptot mass flow Ṅ is the total mass flow given as sum of all three
diffusive flows within a two phase layer. The product Ṅ δM can be described as integral of total diffusive mass flow over thickness within a two phase layer.
Fig. 4. Sorption isotherms of n-butane at 25°C: a) in PDMS [11], b) on activated carbon
Rys. 4. Izotermy sorpcji n-butanu w temperaturze 25°C: a) w PDMS [11], b) na węglu aktywowanym
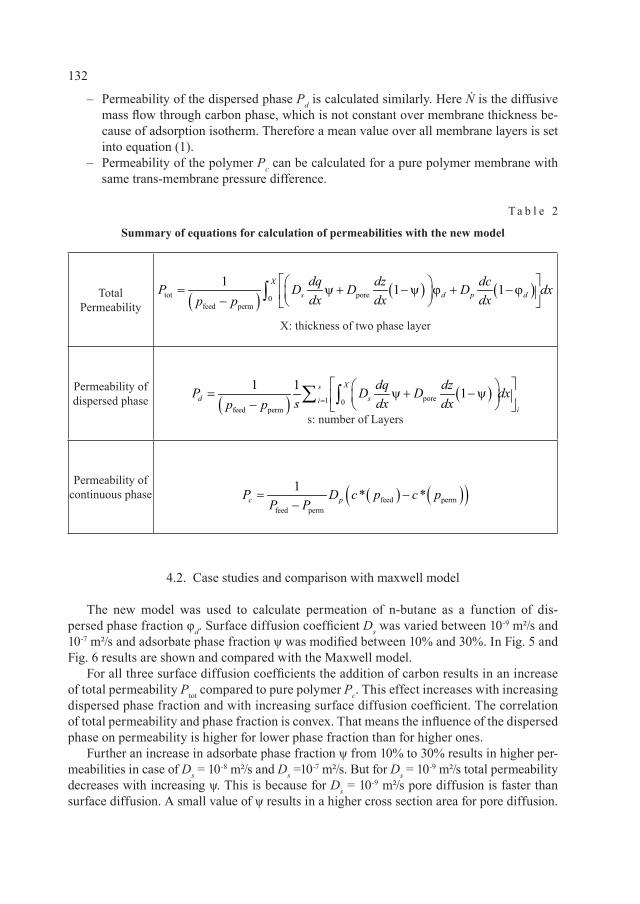
132
– Permeability of the dispersed phase Pd is calculated similarly. Here Ṅ is the diffusive mass flow through carbon phase, which is not constant over membrane thickness be-cause of adsorption isotherm. Therefore a mean value over all membrane layers is set into equation (1).
– Permeability of the polymer Pc can be calculated for a pure polymer membrane with same trans-membrane pressure difference.
T a b l e 2
Summary of equations for calculation of permeabilities with the new model
Total Permeability ( ) ( ) ( )tot pore0
feed perm
1 1 1X
s d p ddq dz dcP D D D dxdx dx dxp p
= y + −y ϕ + −ϕ − ∫
X: thickness of two phase layer
Permeability of dispersed phase ( ) ( )pore1 0
feed perm
1 1 1Xs
d sii
dq dzP D D dxs dx dxp p =
= y + −y − ∑ ∫s: number of Layers
Permeability of continuous phase ( ) ( )( )feed perm
feed perm
1 * *c pP D c p c pP P
= −−
4.2. Case studies and comparison with maxwell model
The new model was used to calculate permeation of n-butane as a function of dis-persed phase fraction φd. Surface diffusion coefficient Ds was varied between 10-9 m²/s and 10-7 m²/s and adsorbate phase fraction ψ was modified between 10% and 30%. In Fig. 5 and Fig. 6 results are shown and compared with the Maxwell model.
For all three surface diffusion coefficients the addition of carbon results in an increase of total permeability Ptot compared to pure polymer Pc. This effect increases with increasing dispersed phase fraction and with increasing surface diffusion coefficient. The correlation of total permeability and phase fraction is convex. That means the influence of the dispersed phase on permeability is higher for lower phase fraction than for higher ones.
Further an increase in adsorbate phase fraction ψ from 10% to 30% results in higher per-meabilities in case of Ds = 10-8 m²/s and Ds =10-7 m²/s. But for Ds = 10-9 m²/s total permeabili ty decreases with increasing ψ. This is because for Ds = 10-9 m²/s pore diffusion is faster than surface diffusion. A small value of ψ results in a higher cross section area for pore diffusion.
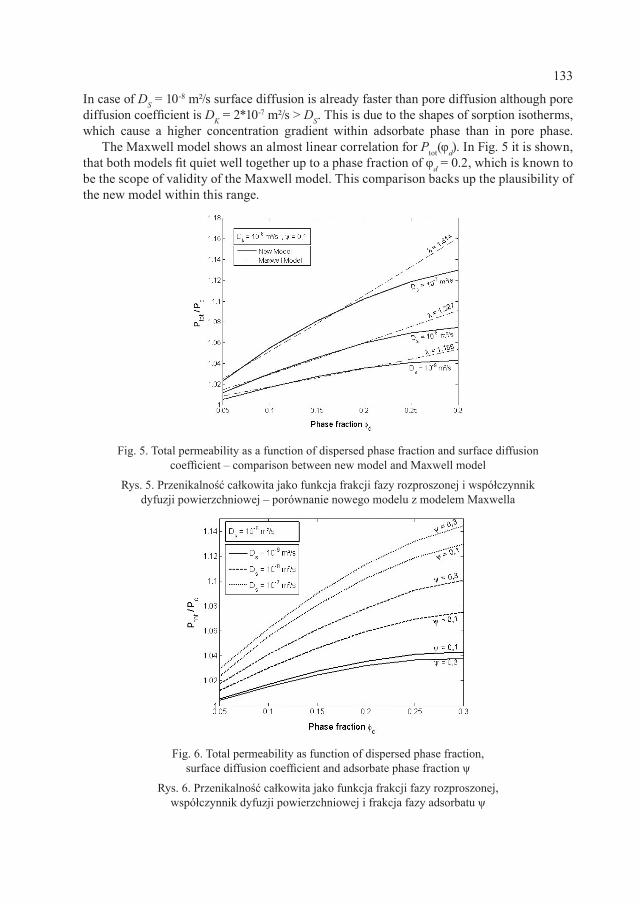
133
In case of DS = 10-8 m²/s surface diffusion is already faster than pore diffusion although pore diffusion coefficient is DK = 2*10-7 m²/s > DS. This is due to the shapes of sorption isotherms, which cause a higher concentration gradient within adsorbate phase than in pore phase.
The Maxwell model shows an almost linear correlation for Ptot(φd). In Fig. 5 it is shown, that both models fit quiet well together up to a phase fraction of φd = 0.2, which is known to be the scope of validity of the Maxwell model. This comparison backs up the plausibility of the new model within this range.
Fig. 5. Total permeability as a function of dispersed phase fraction and surface diffusion coefficient – comparison between new model and Maxwell model
Rys. 5. Przenikalność całkowita jako funkcja frakcji fazy rozproszonej i współczynnik dyfuzji powierzchniowej – porównanie nowego modelu z modelem Maxwella
Fig. 6. Total permeability as function of dispersed phase fraction, surface diffusion coefficient and adsorbate phase fraction ψ
Rys. 6. Przenikalność całkowita jako funkcja frakcji fazy rozproszonej, współczynnik dyfuzji powierzchniowej i frakcja fazy adsorbatu ψ
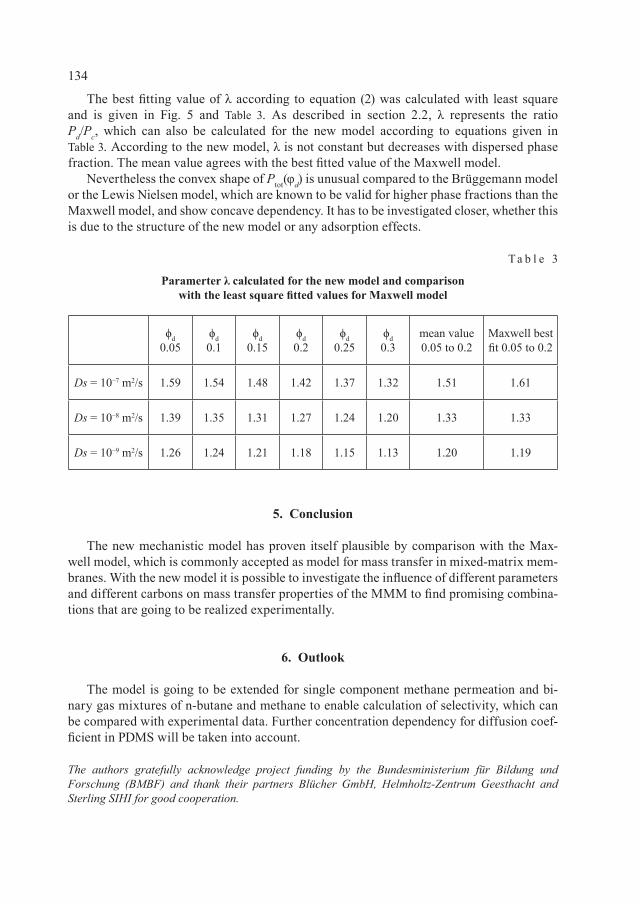
134
The best fitting value of λ according to equation (2) was calculated with least square and is given in Fig. 5 and Table 3. As described in section 2.2, λ represents the ratio Pd/Pc, which can also be calculated for the new model according to equations given in Table 3. According to the new model, λ is not constant but decreases with dispersed phase fraction. The mean value agrees with the best fitted value of the Maxwell model.
Nevertheless the convex shape of Ptot(φd) is unusual compared to the Brüggemann model or the Lewis Nielsen model, which are known to be valid for higher phase fractions than the Maxwell model, and show concave dependency. It has to be investigated closer, whether this is due to the structure of the new model or any adsorption effects.
T a b l e 3
Paramerter λ calculated for the new model and comparison with the least square fitted values for Maxwell model
ϕd0.05
ϕd0.1
ϕd0.15
ϕd0.2
ϕd0.25
ϕd0.3
mean value 0.05 to 0.2
Maxwell best fit 0.05 to 0.2
Ds = 10–7 m2/s 1.59 1.54 1.48 1.42 1.37 1.32 1.51 1.61
Ds = 10–8 m2/s 1.39 1.35 1.31 1.27 1.24 1.20 1.33 1.33
Ds = 10–9 m2/s 1.26 1.24 1.21 1.18 1.15 1.13 1.20 1.19
5. Conclusion
The new mechanistic model has proven itself plausible by comparison with the Max-well model, which is commonly accepted as model for mass transfer in mixed-matrix mem-branes. With the new model it is possible to investigate the influence of different parameters and different carbons on mass transfer properties of the MMM to find promising combina-tions that are going to be realized experimentally.
6. Outlook
The model is going to be extended for single component methane permeation and bi-nary gas mixtures of n-butane and methane to enable calculation of selectivity, which can be compared with experimental data. Further concentration dependency for diffusion coef-ficient in PDMS will be taken into account.
The authors gratefully acknowledge project funding by the Bundesministerium für Bildung und Forschung (BMBF) and thank their partners Blücher GmbH, Helmholtz-Zentrum Geesthacht and Sterling SIHI for good cooperation.
135
S y m b o l s
A – Membrane area [m²]AI – Interfacial area between polymer and carbon [m²]c – Concentration in polymerphase [mol/m³]DP – diffusion coefficient in polymer [m²/s]DK – diffusion coefficient in carbon pores [m²/s]DS – surface diffusion coefficient in adsorbate phase [m²/s]z – Concentration in pore phase [mol/m³]Ṅ – mass flow [mol/s]P – Permeability [mol/(s m bar)]p – Pressure [Pa]q – Concentration in adsorbate phase [mol/m³]S – Selectivity [–]x – Length coordinate [m]b – Mass transfer coefficient [m/s]dM – thickness [m]l – Parameter of Maxwell model [–]fd – Dispersed phase volume fraction [–]y – adsorbate phase fraction inside the pores [–]
R e f e r e n c e s
[1] Robeson L.M., Journal of Membrane Science, 62, (1991), 165-185.[2] Robeson L.M., Journal of Membrane Science, 320, (2008), 390-400.[3] Vu D.Q. , Koros W.J . , Mil ler S.J . , Journal of Membrane Science, 211, (2003),
335-348.[4] Aroon M.A. , Ismail A.F. , Matsuura T. , Montazer-Rahmati M.M., Separation
and purification Technology, 75, (2010), 229-242.[5] Ismail A.F. , Rana D. , Matsuura T. , Foley H.C. , Carbon based Membranes for
Separation processes; 1 ed.; Springer New York, 2011.[6] Gonzo E.E. , Parent is M.L. , Gott i f redi J .C. , Journal of Membrane Science,
277, (2006), 46-54.[7] Pal R. , Journal of Colloid and Interface Science, 317, (2008), 191-198.[8] Raharjo R.D. , Freeman B.D. , Paul D.R. , Sar t i G.C. , Sanders E.S. , Journal
of Membrane Science, 306, (2007), 75-92.[9] Do D.D. , Adsorption Analysis: Equilibria and Kinetics; Imperial College Press:
London, 1998.[10] VDI Wärmeatlas; 6. ed.; GVC, V. G. V. u. C., Ed.; VDI Verlag: Düsseldorf, 1991.[11] Raharjo R.D. , Freeman B.D. , Sanders E.S. , Journal of Membrane Science, 292,
(2007), 45-61.


DIANA LÓPEZ, TILMAN BARZ, HARVEY ARELLANO-GARCIA, GÜNTER WOZNY*, ADRIANA VILLEGAS, SILVIA OCHOA**1
SUBSET SELECTION FOR IMPROVED PARAMETER IDENTIFICATION IN A BIO-ETHANOL
PRODUCTION PROCESS
PODZBIÓR SŁUŻĄCY DO PRECYZYJNIEJSZEGO OKREŚLANIA PARAMETRÓW W PROCESIE
WYTWARZANIA BIOETANOLU
A b s t r a c tA systematic approach for system identification is applied to experimental data of ethanol production from cellulo-se. Special attention is given to the identification of model parameters, which can be reliably estimated from availa-ble measurements. For this purpose, an identifiable parameter subset selection algorithm for nonlinear least squares parameter estimation is used. The procedure determines the parameters whose effects are unique and have a strong effect on the predicted (measurement variables) output variables. The system is described by a generic process mo-del for the simultaneous saccharification and fermentation including three enzyme-catalyzed reactions. The process model is clearly over-parameterized. By applying the subset selection approach the parameter space is reduced to a reasonable subset, whose estimated parameters are still able to predict the experimental data accurately.Keywords: identifiability analysis, subset selection, least squares, bio-ethanol, bagasse, SSF
S t r e s z c z e n i eSystematyczne podejście do identyfikacji systemu stosowane jest wraz z doświadczalnymi danymi dotyczącymi wytwarzania etanolu z celulozy. Szczególną uwagę zwraca się na określanie parametrów modelu, które można wiarygodnie oszacować na podstawie ogólnodostępnych pomiarów. W tym celu zastosowano algorytm podzbioru parametru identyfikowalnego służący do nieliniowego szacowania parametrów metodą najmniejszych kwadratów. Procedura ta określa parametry, które dają niepowtarzalne efekty i wywierają silny wpływ na przewidywane zmienne zdolności produkcyjnej (zmienne pomiarów). System ten opisywany jest przez rodzajowy model procesu jednoczesnego scukrzania i fermentacji, wliczając w to trzy reakcje katalizowane enzymowo. Model procesowy jest nadmiernie sparametryzowany. Przy zastosowaniu opisywanego podejścia dana przestrzeń zostaje ograniczona do uzasadnionego podzbioru, którego szacowane parametry pozwalają nadal celnie przewidywać dane doświadczalne.Słowa kluczowe: analiza identyfikowalności, podzbiór, metoda najmniejszych kwadratów, bioetanol, pozostałość, scukrzanie i fermentacja
* MSc. Diana López, PhD. Eng. Tilman Barz, PhD. Eng. Harvey Arellano-Garcia, prof. PhD. Eng.Günter Wozny Chair of Process Dynamics and Operation, TU Berlin.
** MSc. Adriana Villegas, PhD. Eng. Silvia Ochoa, Research Group in Process Simulation, Design, Control and Optimization (SIDCOP), University of Antioquia, Medellín, Colombia.
138
1. Introduction
Parameter estimation in biochemical models often means the determination of a rela-tively high number of kinetic parameters compared to the number of measured process var-iables. Moreover, due to the nonlinearity of kinetic models the parameter estimation prob-lem most likely contains multiple local minima. The solution of interest is the global mini-mum, which hopefully also provides the biologically most reasonable parameters. However, due to the existence of multiple minima good initial estimates of the parameters are crucial to ensure that the obtained solution is close to a physiologically reasonable minimum. When a solution is found for the estimation problem it should be checked how robust the minimum is by re-running the estimation routine with the new parameter set as initial guesses. Fur-thermore the robustness may be evaluated by starting from different but also physiologically reasonable initial values. However, correlation between model parameters constitutes an ob-stacle to determining a unique minimizing parameter set [1].
In this paper, a methodology for identifying kinetic parameters in structured growth models is presented. The methodology is applied to a case study where kinetic parame-ters of a bio-ethanol production process are estimated. The focus lies on the identifiabi-lity analysis for the determination of model parameters, θ∈ RNp, which can be reliably es-timated from available measurements. For this purpose, an identifiable parameter Subset Selection (SsS) algorithm for nonlinear least squares parameter estimation is used, which is based on the ill-conditioned parameter selection [2, 3]. By fixing the ill-conditioned pa-rameters at prior estimates, a reduced-order and well-conditioned parameter estimation problem is then solved where the remaining parameters are determined. In the subset se-lection algorithm, the sensitivity matrix (S) of the least squares problem is considered and a Singular Value Decomposition (SVD) is applied as rank-revealing factorization [4] within the algorithm of [2, 3]. The procedure permits to determine the parameters whose effects are unique (linear independent parameter sensitivities) and have a strong effect on the predicted measurement variables.
2. Case study – bio-ethanol production
Experimental data used in this case study was taken from bio-ethanol production in a saccharification and fermentation (SSF) process (see [5]). Experiments were carried out in a two-liter fermentor with a working volume of 0.6 l. The initial suspension contained dry weight solid content of 20% (w/w) considering a content of cellulose of 67% (w/w). Prior to the SSF process, an enzymatic pre-hydrolysis of 12 h at 47°C was realized to allow for the build-up of fermentable glucose. A commercial cellulase preparation was used with an en-zymatic load of 26 FPU/ gram of solid of GC 220 – Genencor and 17 UI/ gram of solid of β-glucosidase with activities of 104 FPU/ml and 439 IU/ml, respectively. The concentration of protein per ml of GC 220 was 109 mg/ml and 127 mg/ml of ß-glucosidase. After 12 h, 6 g of microorganism/l was added and the process was continued at 37°C until completing 50 h. The micro-organism was a commercially available Saccharomyces cerevisiae.
The SSF is described by a generic model taken from [6–8] which considers the four main influencing factors for the kinetics of SSF: cellulosic substrate, cellulase and b-glucosidase
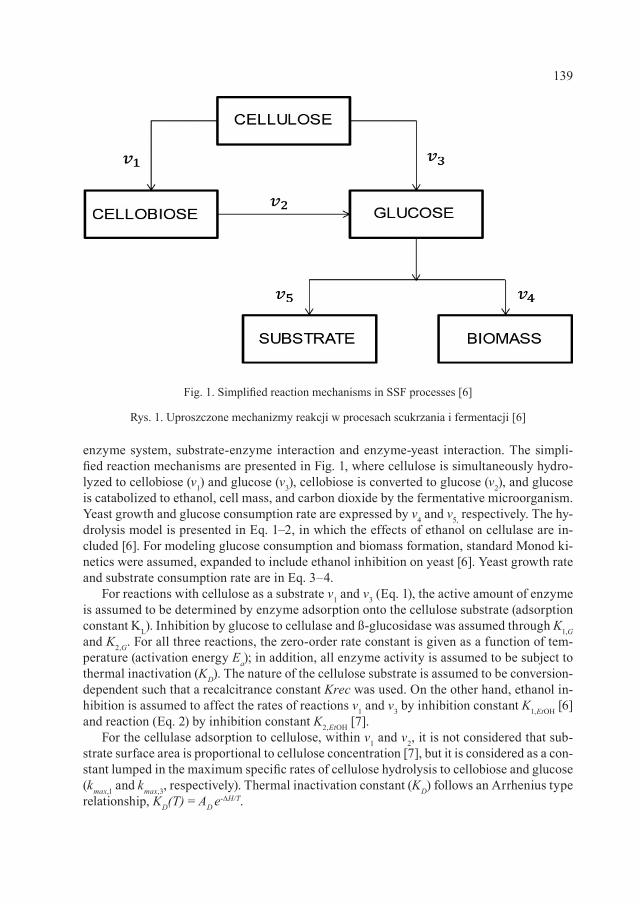
139
enzyme system, substrate-enzyme interaction and enzyme-yeast interaction. The simpli-fied reaction mechanisms are presented in Fig. 1, where cellulose is simultaneously hydro-lyzed to cellobiose (v1) and glucose (v3), cellobiose is converted to glucose (v2), and glucose is catabolized to ethanol, cell mass, and carbon dioxide by the fermentative microorganism. Yeast growth and glucose consumption rate are expressed by v4 and v5, respectively. The hy-drolysis model is presented in Eq. 1–2, in which the effects of ethanol on cellulase are in-cluded [6]. For modeling glucose consumption and biomass formation, standard Monod ki-netics were assumed, expanded to include ethanol inhibition on yeast [6]. Yeast growth rate and substrate consumption rate are in Eq. 3–4.
For reactions with cellulose as a substrate v1 and v3 (Eq. 1), the active amount of enzyme is assumed to be determined by enzyme adsorption onto the cellulose substrate (adsorption constant KL). Inhibition by glucose to cellulase and ß-glucosidase was assumed through K1,G and K2,G. For all three reactions, the zero-order rate constant is given as a function of tem-perature (activation energy Ea); in addition, all enzyme activity is assumed to be subject to thermal inactivation (KD). The nature of the cellulose substrate is assumed to be conversion- dependent such that a recalcitrance constant Krec was used. On the other hand, ethanol in-hibition is assumed to affect the rates of reactions v1 and v3 by inhibition constant K1,EtOH [6] and reaction (Eq. 2) by inhibition constant K2,EtOH [7].
For the cellulase adsorption to cellulose, within v1 and v2, it is not considered that sub-strate surface area is proportional to cellulose concentration [7], but it is considered as a con-stant lumped in the maximum specific rates of cellulose hydrolysis to cellobiose and glucose (kmax,1 and kmax,3, respectively). Thermal inactivation constant (KD) follows an Arrhenius type relationship, KD(T) = AD e-∆H/T.
Fig. 1. Simplified reaction mechanisms in SSF processes [6]
Rys. 1. Uproszczone mechanizmy reakcji w procesach scukrzania i fermentacji [6]
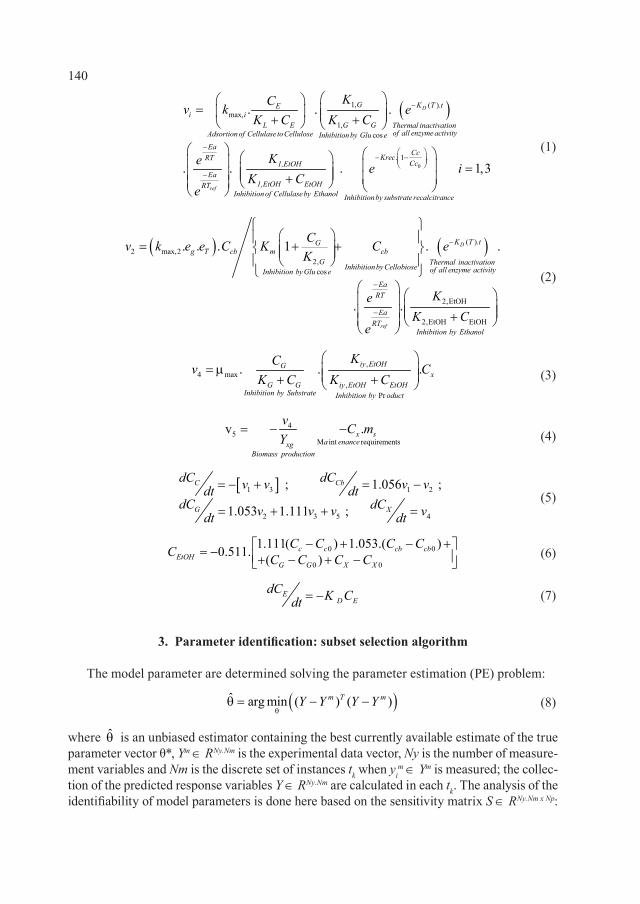
140
3. Parameter identification: subset selection algorithm
The model parameter are determined solving the parameter estimation (PE) problem:
where is an unbiased estimator containing the best currently available estimate of the true parameter vector θ*, Ym ∈ RNy.Nm is the experimental data vector, Ny is the number of measure-ment variables and Nm is the discrete set of instances tk when yi
m ∈Ym is measured; the collec-tion of the predicted response variables Y ∈ RNy.Nm are calculated in each tk. The analysis of the identifiability of model parameters is done here based on the sensitivity matrix S ∈ RNy.Nm x Np:
( )1, ( ).max,
1,cos
. . .
. .
D
ref
G K T tEi i
L E G G Thermal inactivationof all enzyme activityAdsortion of Cellulase toCellulose Inhibitionby Glu e
EaRT
1,EtOHEa
1,EtOH EtOHRTInhi
KCv k eK C K C
KeK C
e
−
−
−
= + +
+
0. 1 .
. 1,3CcKrecCc
bition of Cellulaseby Ethanol Inhibitionby substrate recalcitrance
e i
− −
=
(1)
(2)
(3)
(4)
(5)
(6)
(7)
(8)
( ) ( )( ).2 max,2
2,cos
2,EtOH
2,EtOH EtOH
. . . 1 . .
. .
D
ref
K T tGg T cb m cb
G Thermal inactivationInhibitionby Cellobiose of all enzyme activityInhibition by Glu eEa
RT
EaRT
Inhi
Cv k e e C K C eK
KeK C
e
−
−
−
= + +
+ bition by Ethanol
,4 max
,Pr
. . .iy EtOHGx
G G iy EtOH EtOHInhibition by Substrate Inhibition by oduct
KCv C
K C K C
= µ + +
45
M int requirementsv .x s
a enancexgBiomass production
v C mY
= − −
[ ]1 3 1 2
2 3 5 4
; 1.056 ;
1.053 1.111 ;
C Cb
G X
dC dCv v v vdt dtdC dCv v v vdt dt
= − + = −
= + + =
0 0
0 0
1.111( ) 1.053.( )0.511. ( )c c cb cb
EtOHG G X X
C C C CC C C C C− + − + = − + − + −
ED E
dC K Cdt = −
( )ˆ arg min ( ) ( )m T mY Y Y Yθ
θ = − −
θ
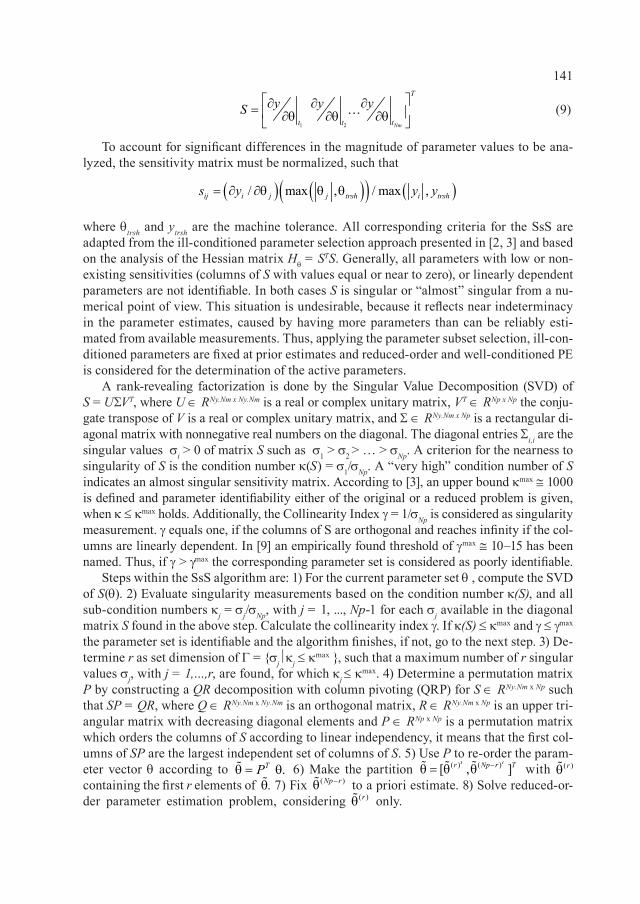
141
To account for significant differences in the magnitude of parameter values to be ana-lyzed, the sensitivity matrix must be normalized, such that
where θtrsh and ytrsh are the machine tolerance. All corresponding criteria for the SsS are adapted from the ill-conditioned parameter selection approach presented in [2, 3] and based on the analysis of the Hessian matrix Hθ = STS. Generally, all parameters with low or non-existing sensitivities (columns of S with values equal or near to zero), or linearly dependent parameters are not identifiable. In both cases S is singular or “almost” singular from a nu-merical point of view. This situation is undesirable, because it reflects near indeterminacy in the parameter estimates, caused by having more parameters than can be reliably esti-mated from available measurements. Thus, applying the parameter subset selection, ill-con-ditioned parameters are fixed at prior estimates and reduced-order and well-conditioned PE is considered for the determination of the active parameters.
A rank-revealing factorization is done by the Singular Value Decomposition (SVD) of S = UΣVT, where U ∈ RNy.Nm x Ny.Nm is a real or complex unitary matrix, VT ∈ RNp x Np the conju-gate transpose of V is a real or complex unitary matrix, and Σ ∈ RNy.Nm x Np is a rectangular di-agonal matrix with nonnegative real numbers on the diagonal. The diagonal entries Σi,i are the singular values σi > 0 of matrix S such as σ1 > σ2 > … > σNp. A criterion for the nearness to singularity of S is the condition number κ(S) = σ1/σNp. A “very high” condition number of S indicates an almost singular sensitivity matrix. According to [3], an upper bound κmax ≅ 1000 is defined and parameter identifiability either of the original or a reduced problem is given, when κ ≤ κmax holds. Additionally, the Collinearity Index γ = 1/σNp is considered as singularity measurement. γ equals one, if the columns of S are orthogonal and reaches infinity if the col-umns are linearly dependent. In [9] an empirically found threshold of γmax ≅ 10–15 has been named. Thus, if γ > γmax the corresponding parameter set is considered as poorly identifiable.
Steps within the SsS algorithm are: 1) For the current parameter set θ, compute the SVD of S(θ). 2) Evaluate singularity measurements based on the condition number κ(S), and all sub-condition numbers κj = σj/σNp, with j = 1, ..., Np-1 for each σj available in the diagonal matrix S found in the above step. Calculate the collinearity index γ. If κ(S) ≤ κmax and γ ≤ γmax the parameter set is identifiable and the algorithm finishes, if not, go to the next step. 3) De-termine r as set dimension of Γ= σj κj ≤ κmax , such that a maximum number of r singular values σj, with j = 1,…,r, are found, for which κj ≤ κmax. 4) Determine a permutation matrix P by constructing a QR decomposition with column pivoting (QRP) for S ∈ RNy.Nm x Np such that SP = QR, where Q ∈ RNy.Nm x Ny.Nm is an orthogonal matrix, R ∈ RNy.Nm x Np is an upper tri-angular matrix with decreasing diagonal elements and P ∈ RNp x Np is a permutation matrix which orders the columns of S according to linear independency, it means that the first col-umns of SP are the largest independent set of columns of S. 5) Use P to re-order the param-eter vector θ according to .TPθ = θ 6) Make the partition with containing the first r elements of . 7) Fix to a priori estimate. 8) Solve reduced-or-der parameter estimation problem, considering only.
(9)1 2 Nm
T
t t t
y y yS ∂ ∂ ∂= ∂θ ∂θ ∂θ
( ) ( )( ) ( )/ max , / max ,ij i j j trsh i trshs y y y= ∂ ∂θ θ θ
( ) ( )[ , ]T Tr Np r T−θ = θ θ
( )rθθ ( )Np r−θ
( )rθ
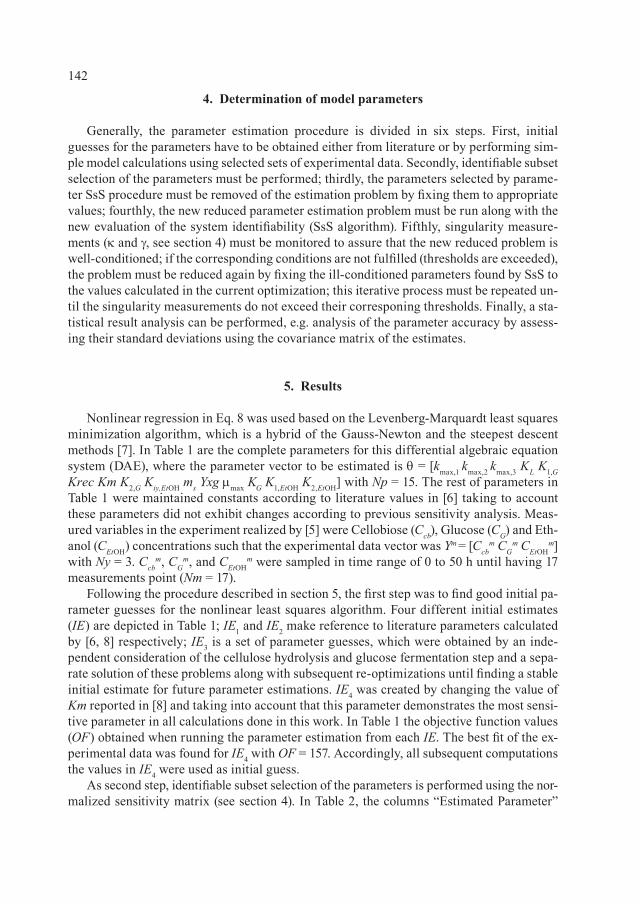
142
4. Determination of model parameters
Generally, the parameter estimation procedure is divided in six steps. First, initial guesses for the parameters have to be obtained either from literature or by performing sim-ple model calculations using selected sets of experimental data. Secondly, identifiable subset selection of the parameters must be performed; thirdly, the parameters selected by parame-ter SsS procedure must be removed of the estimation problem by fixing them to appropriate values; fourthly, the new reduced parameter estimation problem must be run along with the new evaluation of the system identifiability (SsS algorithm). Fifthly, singularity measure-ments (κ and γ, see section 4) must be monitored to assure that the new reduced problem is well-conditioned; if the corresponding conditions are not fulfilled (thresholds are exceeded), the problem must be reduced again by fixing the ill-conditioned parameters found by SsS to the values calculated in the current optimization; this iterative process must be repeated un-til the singularity measurements do not exceed their corresponing thresholds. Finally, a sta-tistical result analysis can be performed, e.g. analysis of the parameter accuracy by assess-ing their standard deviations using the covariance matrix of the estimates.
5. Results
Nonlinear regression in Eq. 8 was used based on the Levenberg-Marquardt least squares minimization algorithm, which is a hybrid of the Gauss-Newton and the steepest descent methods [7]. In Table 1 are the complete parameters for this differential algebraic equation system (DAE), where the parameter vector to be estimated is θ = [kmax,1 kmax,2 kmax,3 KL K1,G Krec Km K2,G Kiy,EtOH ms Yxg µmax KG K1,EtOH K2,EtOH] with Np = 15. The rest of parameters in Table 1 were maintained constants according to literature values in [6] taking to account these parameters did not exhibit changes according to previous sensitivity analysis. Meas-ured variables in the experiment realized by [5] were Cellobiose (Ccb), Glucose (CG) and Eth-anol (CEtOH) concentrations such that the experimental data vector was Ym = [Ccb
m CGm CEtOH
m] with Ny = 3. Ccb
m, CGm, and CEtOH
m were sampled in time range of 0 to 50 h until having 17 measurements point (Nm = 17).
Following the procedure described in section 5, the first step was to find good initial pa-rameter guesses for the nonlinear least squares algorithm. Four different initial estimates (IE) are depicted in Table 1; IE1 and IE2 make reference to literature parameters calculated by [6, 8] respectively; IE3 is a set of parameter guesses, which were obtained by an inde-pendent consideration of the cellulose hydrolysis and glucose fermentation step and a sepa-rate solution of these problems along with subsequent re-optimizations until finding a stable initial estimate for future parameter estimations. IE4 was created by changing the value of Km reported in [8] and taking into account that this parameter demonstrates the most sensi-tive parameter in all calculations done in this work. In Table 1 the objective function values (OF) obtained when running the parameter estimation from each IE. The best fit of the ex-perimental data was found for IE4 with OF = 157. Accordingly, all subsequent computations the values in IE4 were used as initial guess.
As second step, identifiable subset selection of the parameters is performed using the nor-malized sensitivity matrix (see section 4). In Table 2, the columns “Estimated Parameter”
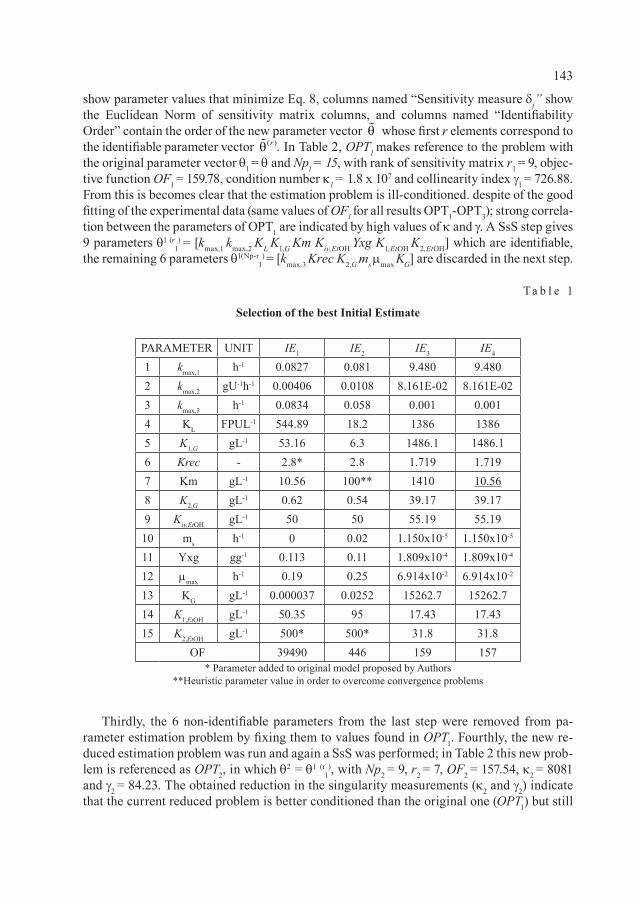
143
show parameter values that minimize Eq. 8, columns named “Sensitivity measure dj” show the Euclidean Norm of sensitivity matrix columns, and columns named “Identifiability Order” contain the order of the new parameter vector whose first r elements correspond to the identifiable parameter vector . In Table 2, OPT1 makes reference to the problem with the original parameter vector θ1 = θ and Np1 = 15, with rank of sensitivity matrix r1 = 9, objec-tive function OF1 = 159.78, condition number κ1 = 1.8 x 10⁷ and collinearity index γ1 = 726.88. From this is becomes clear that the estimation problem is ill-conditioned. despite of the good fitting of the experimental data (same values of OF1 for all results OPT1-OPT3); strong correla-tion between the parameters of OPT1 are indicated by high values of κ and γ. A SsS step gives 9 parameters θ1(r
1) = [kmax,1 kmax,2 KL K1,G Km Kiy,EtOH Yxg K1,EtOH K2,EtOH] which are identifiable,
the remaining 6 parameters θ1(Np-r1) = [kmax,3 Krec K2,G ms µmax KG] are discarded in the next step.
T a b l e 1
Selection of the best Initial Estimate
PARAMETER UNIT IE1 IE2 IE3 IE4
1 kmax,1 h-1 0.0827 0.081 9.480 9.4802 kmax,2 gU-1h-1 0.00406 0.0108 8.161E-02 8.161E-023 kmax,3 h-1 0.0834 0.058 0.001 0.0014 KL FPUL-1 544.89 18.2 1386 13865 K1,G gL-1 53.16 6.3 1486.1 1486.16 Krec - 2.8* 2.8 1.719 1.7197 Km gL-1 10.56 100** 1410 10.568 K2,G gL-1 0.62 0.54 39.17 39.179 Kiy,EtOH gL-1 50 50 55.19 55.1910 ms h-1 0 0.02 1.150x10⁻⁵ 1.150x10⁻⁵
11 Yxg gg-1 0.113 0.11 1.809x10⁻⁴ 1.809x10⁻⁴
12 µmax h-1 0.19 0.25 6.914x10⁻² 6.914x10⁻²
13 KG gL-1 0.000037 0.0252 15262.7 15262.714 K1,EtOH gL-1 50.35 95 17.43 17.4315 K2,EtOH gL-1 500* 500* 31.8 31.8
OF 39490 446 159 157* Parameter added to original model proposed by Authors
**Heuristic parameter value in order to overcome convergence problems
Thirdly, the 6 non-identifiable parameters from the last step were removed from pa-rameter estimation problem by fixing them to values found in OPT1. Fourthly, the new re-duced estimation problem was run and again a SsS was performed; in Table 2 this new prob-lem is referenced as OPT2, in which θ2 = θ1(r1
), with Np2 = 9, r2 = 7, OF2 = 157.54, κ2 = 8081 and γ2 = 84.23. The obtained reduction in the singularity measurements (κ2 and γ2) indicate that the current reduced problem is better conditioned than the original one (OPT1) but still
θ( )rθ
144
there are two parameters which are not identifiable, indicated by the rank of the sensitivity matrix r2 = 7 and since κ2 > κmax and γ2 > γmax. The identifiable parameter vector for OPT2 was θ2(r
2) = [kmax,1 kmax,2 Km Kiy,EtOH Yxg K1,EtOH K2,EtOH], and the vector of parameters to fix was
θ2(Np-r2) = [KLK1,G]. The last reduced estimation problem and SsS is OPT3, in which θ3 = θ2(r
2),
with Np3 = 7, r3 = 7, OF3 = 157.51, κ3 = 560 and γ3 = 9.03. For this estimation, the condition number and the collinearity index do not exceed the defined thresholds, with κ3 < 1000 and γ3 < 10 and all parameters in θ3
were identified r3 = Np3. At this point, the parameter estima-tion has been stopped and the obtained parameters were statistically analyzed by calculat-ing confidence intervals using the covariance matrix of the estimates.
T a b l e 2
Application of Subset Selection Algorithm
θj
Estimated Parameter Sensitivity measure dj Identifiability Order
OPT1 OPT2 OPT3 OPT4 OPT1 OPT2 OPT3 OPT1 OPT2 OPT3
kmax,1 9.51 11.07 11.08 11.08 1.19 1.13 34.38 1 7 7
kmax,2 0.2479 0.0773 0.0498 0.033 2.56 1.20 0.68 7 2 2
kmax,3 0.3218 F F F 0.09 - - 15 - -
KL 5915 8121 F F 0.36 0.43 - 5 8 -
K1,G 386.2 286.9 F F 0.12 0.15 - 8 9 -
Krec 0.1687 F F F 0.05 - - 14 - -
Km 895.7 286.7 184.4 111.5 8.02 26.43 12.81 6 1 4
K2,G 5.389 F F F 0.54 - - 13 - -
Kiy,EtOH 72.37 74.09 74.26 74.31 0.23 0.22 0.22 4 6 3
ms 5.5x10⁻⁶ F F F 0.00 - - 11 - -
Yxg 4x10⁻⁴ 4x10⁻⁴ 4x10⁻⁴ 4x10⁻⁴ 0.70 0.69 0.69 9 3 1
µmax 0.0533 F F F 0.71 - - 12 - -
KG 5722 F F F 0.70 - - 10 - -
K1,EtOH 14.66 14.92 14.92 14.93 0.51 0.47 27.35 2 4 6
K2,EtOH 23.14 25.72 25.75 25.74 0.34 0.33 0.33 3 5 5F Parameter fixed to previous optimum which was not estimated
in current reduced parameter estimation problem
From the comparison with the results from the original problem (OPT1) with Np = 15 parameters with the first and second reduced problems (OPT2 and OPT3) with Np = 9 and Np = 7, respectively, enormous improvements in the parameter accuracy, validated by re-ductions in confidence intervals, were observed. For further improvements of the esti-mation in OPT3 (further reduction in StDev for each parameter), a last optimization run
ˆjθ
145
(OPT4) was performed, which used kmax,2 = 4x10⁻⁶ and Km = 124 as initial estimates along with the other values of IE4. The parameters obtained from OPT4 are considered to be the most accurate parameter estimates in this research, with an improvement in the maximum relative standard deviation of the most uncertain problem parameter kmax,2 and Km from 400% to 14%.
6. Conclucions
A systematic approach to parameter identifiable subset selection based on the sensitivity matrix, Singular Value Decomposition (SVD) as a rank-revealing factorization and QR de-composition with column pivoting (QRP) has been successfully applied to a biological sys-tem within a least square parameter estimation problems.
Besides the proper normalization of the sensitivity matrix, it is of importance to gener-ate an appropriate initial parameter guess for estimation, which is sufficiently close to the optimal parameter set in order to provide a subset selection that does not differ significantly from the one based on the sensitivity matrix evaluated at the optimal estimate. If this is not possible, an iterative proceeding as discussed in this paper should be followed.
S y m b o l s
AD – Type Arrhenius constant [h-1]Cc – Cellulose Concentration [gL-1]Ccb – Cellobiose Concentration [gL-1]CE – Enzyme Concentration [FPUL-1]CEtOH – Ethanol Concentration [gL-1]CG – Glucose Concentration [gL-1]Cx – Yeast Concentration [gL-1]eT – Total protein (cellulase and b-glucosidase) concentration per liter reaction
volume [gL-1]eg – b-glucosidase activity per g of protein in the enzyme preparation [IUg-1]Ea – Activation Energy for enzymatic activity [Jmol-1]KD – Specific rate of cellulose [h-1]KG – Glucose saturation constant for yeast [gL-1]K1,EtOH – Inhibition constant of cellulase by ethanol [gL-1]K2,EtOH – Inhibition constant of ß-glucosidase by ethanol [gL-1]Kiy,EtOH – Inhibition constant of ethanol on yeast [gL-1]KL – Langmuir adsorption constant (cellulase adsorption saturation constant
[FPUL-1]K1,G – Inhibition constants of cellulase by glucose [gL-1]K2,G – Inhibition constants of b-glucosidase by glucose [gL-1]kmax,1 – Maximum specific rate of cellulose hydrolysis to cellobiose [h-1]kmax,2 – Specific rate of cellobiose hydrolysis to glucose [gU-1h-1]kmax,3 – Maximum specific rate of cellulose hydrolysis to glucose [h-1]
146
Km – Michaelis constant for b-glucosidase for cellobiose [gL-1]Krec – Recalcitrance constant [-]ms – Maintenance requirement for yeast [h-1]OF – Objective Function value of parameter estimation v1 – Production rate of cellobiose from cellulose by cellulase [gL-1h-1]v2 – Production rate of glucose from cellobiose by b-glucosidase [gL-1h-1]v3 – Production rate of glucose from cellulose by cellulase [gL-1h-1]v4 – Production rate of biomass [gL-1h-1]v5 – Consumption rate of glucose by yeast [gL-1h-1]Yxg – Anaerobic yield of cell mass on glucose (yield coefficient of cell mass from
glucose) [gg-1]∆H – Deactivation Enthalpy [Jmol-1]µmax – Maximum growth rate (maximum specific growth rate of the microorganism
[h-1]Ym – Experimental data vector Y – Predicted response variables by model Nm – Number of sample times Np – Number of parameters Ny – Number of measurement variables S – Sensitivity matrix Hθ – Hessian matrix U – Real or complex unitary matrix of SVD V – Real or complex unitary matrix of SVD Σ – Rectangular diagonal matrix with nonnegative real numbers on the diagonal of SVD r – Rank of the sensitivity matrix Q – Orthogonal matrix of QR decomposition with column pivoting (QRP) R – Upper triangular matrix with decreasing diagonal elements of QRP P – Permutation matrix of QRP σj – Singular value j dj – Sensitivity measure of column j of sensitivity matrix κ – Condition number of parameter estimation problem κmax – Condition number threshold to guarantee nonlinear dependence between parameters γ – Collinearity index γmax – Collinearity index threshold to guarantee nonlinear dependence between parameters Γ – Set of singular values j with κj≤ κmax
θ – Parameter vector θ(Np-r) – Unidentifiable parameter vector after SsS algorithm θ(r) – Identifiable parameter vector after SsS algorithm
The authors express their gratitude to Ph.D. Mariana Peñuela, who provided the experimental information for the development of this study. Diana López acknowledges the generous support of German Academic Interchange Service for funding her Ph.D. research.
147
R e f e r e n c e s
[1] Lei F. , Jorgensen S.B. , Estimation of kinetic parameters in a structured yeast mo-del using regularisation, Journal of Biotechnology, 88 (3), 2001, 223-237.
[2] Vélez-Reyes M., Verghese G.C. , Subset selection in identification, and applica-tion to speed and parameter estimation for induction machines, Proceedings of the 4th IEEE Conference on Control Applications, 1995, 991-997.
[3] Burth M., Verghese G.C. , Vélez-Reyes M., Subset selection for improved para-meter estimation in on-line identification of a synchronous generator, Power Systems, IEEE Transactions, 14, 1999, 218-225.
[4] Grah A. , Entwicklung und Anwendung modularer Software zur Simulation und Para-meterschätzung in gaskatalytischen Festbettreaktoren, Ph.D. thesis, Martin Luther Uni-versity Halle-Wittenberg 2004.
[5] Vásquez M.P. , Desenvolvimento de processo de hidrolise enzimática e fermentação simultâneas para a produção de etanol a partir de bagaço de cana-de-açúcar, Ph.D. the-sis, Universidade Federal Do Rio De Janeiro, Brazil 2007.
[6] Drissen R.E.T. , Maas R.H.W., Tramper J . , Beeft ink H.H. , Modelling ethanol production from cellulose: separate hydrolysis and fermentation versus simultaneous saccharification and fermentation, Biocatalysis and Biotransformation, 27 (1), 2008, 27-35.
[7] Phi l ippidis G.P. , Spindler D.D. , Wyman C.E. , Mathematical modeling of cel-lulose conversion to ethanol by the simultaneous saccharification and fermentation pro-cess, Applied Biochemistry and Biotechnology, 34 (1), 1992, 543-556.
[8] Phil ippidis G.P. , Hatzis C. , Biochemical Engineering Analysis of Critical Process Factors in the Biomass-to-Ethanol Technology, Biotechnology Progress, 13 (3), 1997, 222-231.
[9] Brun R. , Kühni M., Siegris t H. , Gujer W., Reichert P. , Practical identifiabi-lity of ASM2D parameters – systematic selection and tuning of parameter subsets, Wa-ter Research, 36, 2002, 411-412.

EVGENIJ LYAGIN*, ANJA DREWS**, MATTHIAS KRAUME*1
PARALLEL REACTOR SYSTEM FOR SCREENING AND CHARACTERISATION OF BIOCATALYSTS
UKŁAD RÓWNOLEGŁYCH APARATÓW REAKCYJNYCH W KONTROLI
I CHARAKTERYSTYCE BIOKATALIZATORÓW
A b s t r a c t
Screening, characterisation and estimation of reliable kinetic parameters of biocatalysts is a complex and time consuming task in bioprocess development. The commercially available screening and characterisation systems are mostly operated in (fed-)batch mode, so the data ob-tained from such systems do not offer the possibility to describe/design a continuous process in e.g. a membrane reactor. Thus, the primary goal of this project is the development of a mem-brane-based screening and characterisation system that enables physical immobilisation of the dissolved catalyst in the reactor volume while at the same time, products can be removed and so the system can be operated continuously.Keywords: screening system, miniaturized membrane reactor, process development
S t r e s z c z e n i e
Kontrolowanie, charakteryzowanie oraz szacowanie wiarygodnych parametrów kinetycznych biokatalizatorów to złożone i czasochłonne zadanie w ramach rozwoju bioprocesowego. Dostępne na rynku systemy kontroli i charakterystyki działają zazwyczaj w trybie pakietowym, co powoduje, że uzyskane dane nie dają możliwości opisania czy zaprojektowania procesu ciągłego, np. w membranowym aparacie reakcyjnym. Tak więc zasadniczym celem niniejszego projektu jest opracowanie systemu kontroli membranowej i charakterystyki, który umożliwi fizyczne unieruchomienie rozpuszczonego katalizatora w pojemności aparatu reakcyjnego przy jednoczesnym usuwaniu produktów, co zapewni ciągłe działanie systemu.Słowa kluczowe: system kontroli, zminiaturyzowany membranowy aparat reakcyjny, rozwój procesów
* Eng. Evgenij Lyagin, Prof. PhD. Eng. Matthias Kraume, TU Berlin.** Prof. PhD. Eng. Anja Drews, Hochschule für Technik und Wirtschaft Berlin.
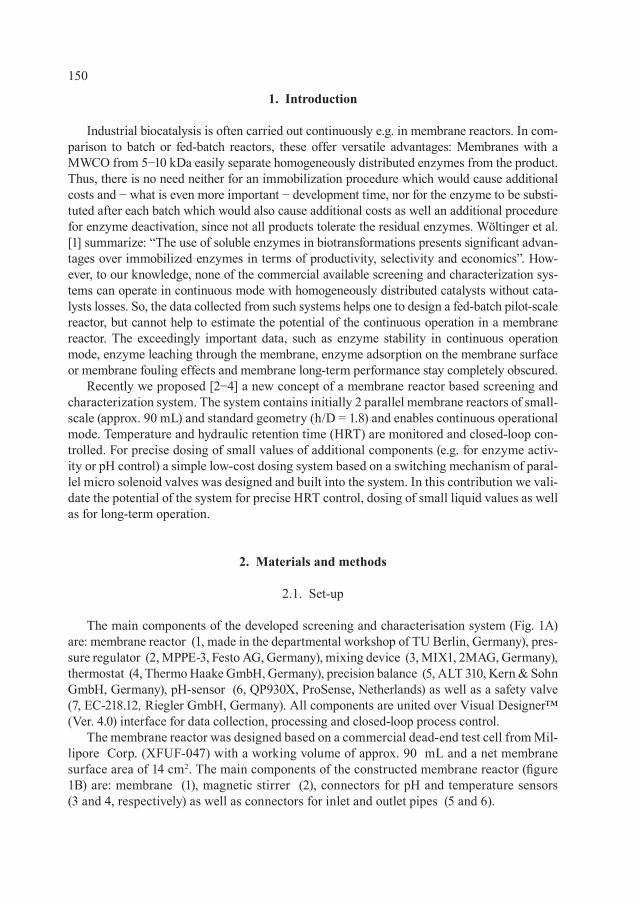
150
1. Introduction
Industrial biocatalysis is often carried out continuously e.g. in membrane reactors. In com-parison to batch or fed-batch reactors, these offer versatile advantages: Membranes with a MWCO from 5−10 kDa easily separate homogeneously distributed enzymes from the product. Thus, there is no need neither for an immobilization procedure which would cause additional costs and − what is even more important − development time, nor for the enzyme to be substi-tuted after each batch which would also cause additional costs as well an additional procedure for enzyme deactivation, since not all products tolerate the residual enzymes. Wöltinger et al. [1] summarize: “The use of soluble enzymes in biotransformations presents significant advan-tages over immobilized enzymes in terms of productivity, selectivity and economics”. How-ever, to our knowledge, none of the commercial available screening and characterization sys-tems can operate in continuous mode with homogeneously distributed catalysts without cata-lysts losses. So, the data collected from such systems helps one to design a fed-batch pilot-scale reactor, but cannot help to estimate the potential of the continuous operation in a membrane reactor. The exceedingly important data, such as enzyme stability in continuous operation mode, enzyme leaching through the membrane, enzyme adsorption on the membrane surface or membrane fouling effects and membrane long-term performance stay completely obscured.
Recently we proposed [2−4] a new concept of a membrane reactor based screening and characterization system. The system contains initially 2 parallel membrane reactors of small-scale (approx. 90 mL) and standard geometry (h/D = 1.8) and enables continuous operational mode. Temperature and hydraulic retention time (HRT) are monitored and closed-loop con-trolled. For precise dosing of small values of additional components (e.g. for enzyme activ-ity or pH control) a simple low-cost dosing system based on a switching mechanism of paral-lel micro solenoid valves was designed and built into the system. In this contribution we vali-date the potential of the system for precise HRT control, dosing of small liquid values as well as for long-term operation.
2. Materials and methods
2.1. Set-up
The main components of the developed screening and characterisation system (Fig. 1A) are: membrane reactor (1, made in the departmental workshop of TU Berlin, Germany), pres-sure regulator (2, MPPE-3, Festo AG, Germany), mixing device (3, MIX1, 2MAG, Germany), thermostat (4, Thermo Haake GmbH, Germany), precision balance (5, ALT 310, Kern & Sohn GmbH, Germany), pH-sensor (6, QP930X, ProSense, Netherlands) as well as a safety valve (7, EC-218.12, Riegler GmbH, Germany). All components are united over Visual Designer™ (Ver. 4.0) interface for data collection, processing and closed-loop process control.
The membrane reactor was designed based on a commercial dead-end test cell from Mil-lipore Corp. (XFUF-047) with a working volume of approx. 90 mL and a net membrane surface area of 14 cm2. The main components of the constructed membrane reactor (figure 1B) are: membrane (1), magnetic stirrer (2), connectors for pH and temperature sensors (3 and 4, respectively) as well as connectors for inlet and outlet pipes (5 and 6).
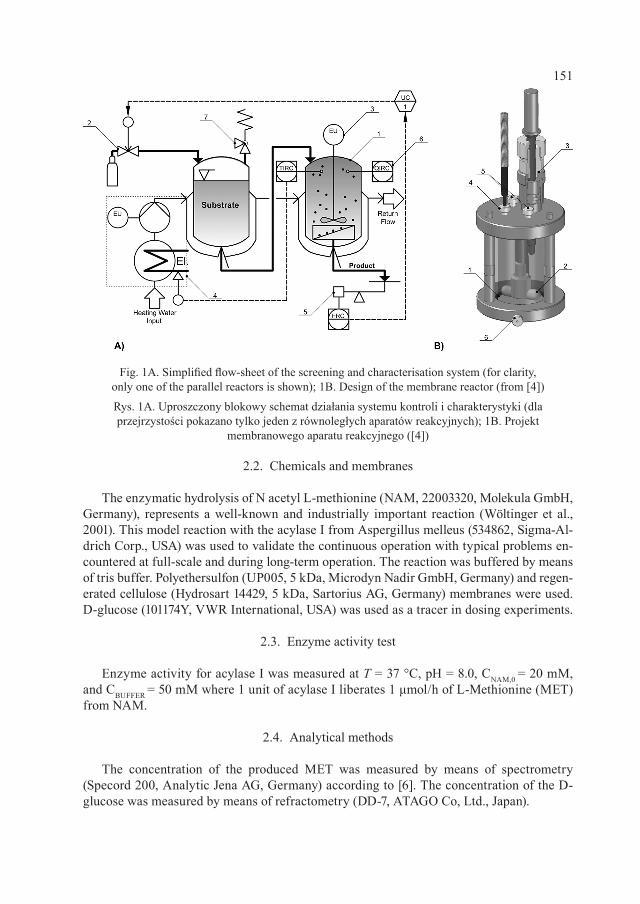
151
2.2. Chemicals and membranes
The enzymatic hydrolysis of N acetyl L-methionine (NAM, 22003320, Molekula GmbH, Germany), represents a well-known and industrially important reaction (Wöltinger et al., 2001). This model reaction with the acylase I from Aspergillus melleus (534862, Sigma-Al-drich Corp., USA) was used to validate the continuous operation with typical problems en-countered at full-scale and during long-term operation. The reaction was buffered by means of tris buffer. Polyethersulfon (UP005, 5 kDa, Microdyn Nadir GmbH, Germany) and regen-erated cellulose (Hydrosart 14429, 5 kDa, Sartorius AG, Germany) membranes were used. D-glucose (101174Y, VWR International, USA) was used as a tracer in dosing experiments.
2.3. Enzyme activity test
Enzyme activity for acylase I was measured at T = 37 °C, pH = 8.0, CNAM,0 = 20 mM, and CBUFFER = 50 mM where 1 unit of acylase I liberates 1 μmol/h of L-Methionine (MET) from NAM.
2.4. Analytical methods
The concentration of the produced MET was measured by means of spectrometry (Specord 200, Analytic Jena AG, Germany) according to [6]. The concentration of the D-glucose was measured by means of refractometry (DD-7, ATAGO Co, Ltd., Japan).
Fig. 1A. Simplified flow-sheet of the screening and characterisation system (for clarity, only one of the parallel reactors is shown); 1B. Design of the membrane reactor (from [4])
Rys. 1A. Uproszczony blokowy schemat działania systemu kontroli i charakterystyki (dla przejrzystości pokazano tylko jeden z równoległych aparatów reakcyjnych); 1B. Projekt
membranowego aparatu reakcyjnego ([4])
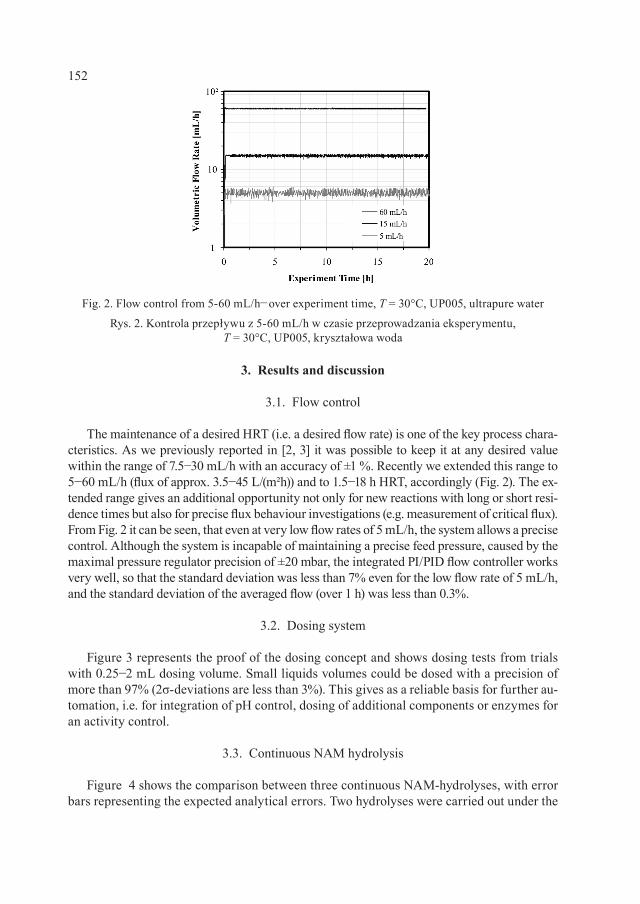
152
3. Results and discussion
3.1. Flow control
The maintenance of a desired HRT (i.e. a desired flow rate) is one of the key process chara-cteristics. As we previously reported in [2, 3] it was possible to keep it at any desired value within the range of 7.5−30 mL/h with an accuracy of ±1 %. Recently we extended this range to 5−60 mL/h (flux of approx. 3.5−45 L/(m²h)) and to 1.5−18 h HRT, accordingly (Fig. 2). The ex-tended range gives an additional opportunity not only for new reactions with long or short resi-dence times but also for precise flux behaviour investigations (e.g. measurement of critical flux). From Fig. 2 it can be seen, that even at very low flow rates of 5 mL/h, the system allows a precise control. Although the system is incapable of maintaining a precise feed pressure, caused by the maximal pressure regulator precision of ±20 mbar, the integrated PI/PID flow controller works very well, so that the standard deviation was less than 7% even for the low flow rate of 5 mL/h, and the standard deviation of the averaged flow (over 1 h) was less than 0.3%.
3.2. Dosing system
Figure 3 represents the proof of the dosing concept and shows dosing tests from trials with 0.25−2 mL dosing volume. Small liquids volumes could be dosed with a precision of more than 97% (2σ-deviations are less than 3%). This gives as a reliable basis for further au-tomation, i.e. for integration of pH control, dosing of additional components or enzymes for an activity control.
3.3. Continuous NAM hydrolysis
Figure 4 shows the comparison between three continuous NAM-hydrolyses, with error bars representing the expected analytical errors. Two hydrolyses were carried out under the
Fig. 2. Flow control from 5-60 mL/h−over experiment time, T = 30°C, UP005, ultrapure water
Rys. 2. Kontrola przepływu z 5-60 mL/h w czasie przeprowadzania eksperymentu, T = 30°C, UP005, kryształowa woda
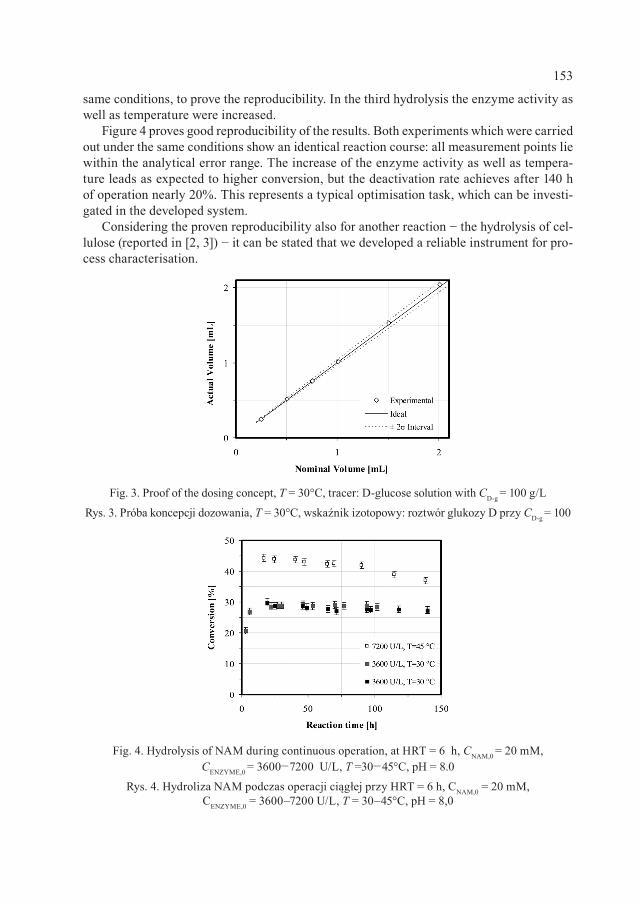
153
same conditions, to prove the reproducibility. In the third hydrolysis the enzyme activity as well as temperature were increased.
Figure 4 proves good reproducibility of the results. Both experiments which were carried out under the same conditions show an identical reaction course: all measurement points lie within the analytical error range. The increase of the enzyme activity as well as tempera-ture leads as expected to higher conversion, but the deactivation rate achieves after 140 h of operation nearly 20%. This represents a typical optimisation task, which can be investi-gated in the developed system.
Considering the proven reproducibility also for another reaction − the hydrolysis of cel-lulose (reported in [2, 3]) − it can be stated that we developed a reliable instrument for pro-cess characterisation.
Fig. 3. Proof of the dosing concept, T = 30°C, tracer: D-glucose solution with CD-g = 100 g/L
Rys. 3. Próba koncepcji dozowania, T = 30°C, wskaźnik izotopowy: roztwór glukozy D przy CD-g = 100
Fig. 4. Hydrolysis of NAM during continuous operation, at HRT = 6 h, CNAM,0 = 20 mM, CENZYME,0 = 3600−7200 U/L, T =30−45°C, pH = 8.0
Rys. 4. Hydroliza NAM podczas operacji ciągłej przy HRT = 6 h, CNAM,0 = 20 mM, CENZYME,0 = 3600–7200 U/L, T = 30–45°C, pH = 8,0
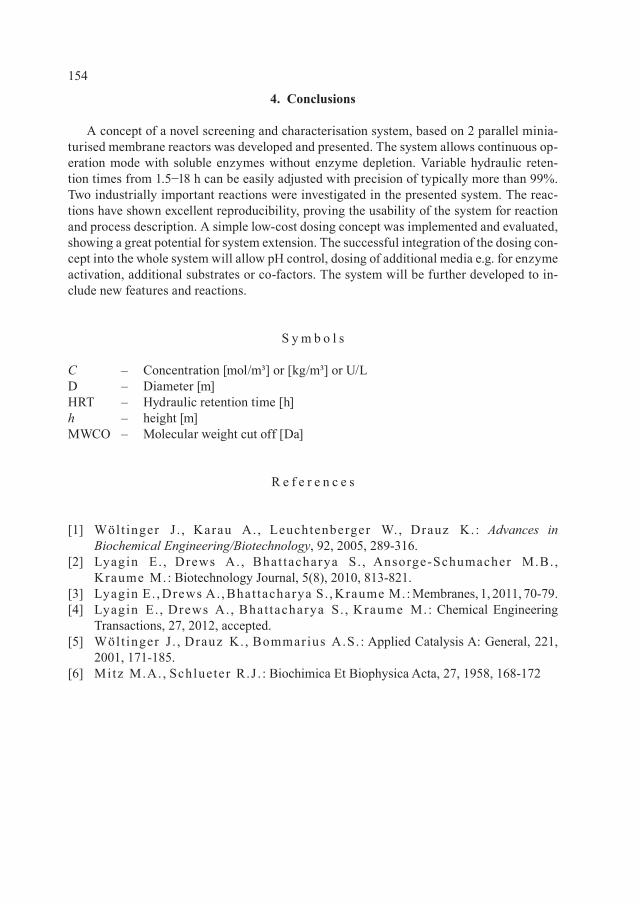
154
4. Conclusions
A concept of a novel screening and characterisation system, based on 2 parallel minia-turised membrane reactors was developed and presented. The system allows continuous op-eration mode with soluble enzymes without enzyme depletion. Variable hydraulic reten-tion times from 1.5−18 h can be easily adjusted with precision of typically more than 99%. Two industrially important reactions were investigated in the presented system. The reac-tions have shown excellent reproducibility, proving the usability of the system for reaction and process description. A simple low-cost dosing concept was implemented and evaluated, showing a great potential for system extension. The successful integration of the dosing con-cept into the whole system will allow pH control, dosing of additional media e.g. for enzyme activation, additional substrates or co-factors. The system will be further developed to in-clude new features and reactions.
S y m b o l s
C – Concentration [mol/m³] or [kg/m³] or U/LD – Diameter [m]HRT – Hydraulic retention time [h]h – height [m]MWCO – Molecular weight cut off [Da]
R e f e r e n c e s
[1] Wöltinger J . , Karau A. , Leuchtenberger W., Drauz K.: Advances in
Biochemical Engineering/Biotechnology, 92, 2005, 289-316.[2] Lyagin E. , Drews A. , Bhat tacharya S. , Ansorge-Schumacher M.B. ,
Kraume M.: Biotechnology Journal, 5(8), 2010, 813-821.[3] Lyagin E. , Drews A. , Bhat tacharya S. , Kraume M.: Membranes, 1, 2011, 70-79.[4] Lyagin E. , Drews A. , Bhat tacharya S. , Kraume M.: Chemical Engineering
Transactions, 27, 2012, accepted.[5] Wölt inger J . , Drauz K. , Bommarius A.S. : Applied Catalysis A: General, 221,
2001, 171-185.[6] Mitz M.A. , Schlueter R.J . : Biochimica Et Biophysica Acta, 27, 1958, 168-172
ZBIGNIEW MATRAS, BARTOSZ KOPICZAK*1
TIME-AVERAGED VELOCITY PROFILE MODEL OF DRAG REDUCING POLYMER SOLUTIONS
IN THE TURBULENT PIPE FLOW
MODEL UŚREDNIONEGO W CZASIE PROFILU PRĘDKOŚCI ROZTWORÓW POLIMEROWYCH
WYKAZUJĄCYCH REDUKCJĘ OPORÓW W TURBULENTNYM PRZEPŁYWIE W RURACH
A b s t r a c t
The qualitative, theoretical analysis of macromolecular polymer additive effect on abnormal deformation of the velocity profile of the polymer solution flowing in turbulent motion in smooth pipes of circular cross section is presented. Comparison of the substitutive velocity profiles built in the work shows that for the la-minar flow polymer additives do not affect its shape. For the turbulent flow time-average, dimensional ve-locity profile is always more extended comparing to its Newtonian or purely-viscous equivalent at the same Reynolds numbers. The results suggest that this phenomenon increases with increasing values of the cha-racteristic time constant λ, representing viscoelastic properties of the solution, and with decrease in the dia-meter of the pipe where the flow is performed.
Keywords: velocity profile, pipe flow, drag reduction
S t r e s z c z e n i e
Przedstawiono jakościową, teoretyczną analizę wpływu dodatków wielkocząsteczkowych polimerów na anormalną deformację profilu prędkości roztworu polimerowego przepływającego ruchem turbulentnym w gładkich rurach o przekroju kołowym. Z porównania zbudowanych modeli zastępczych profili prędkości wynika, że w zakresie laminarnym dodatek polimeru nie wpływa na jego kształt. W zakresie turbulentnym uśredniony w czasie wymiarowy profil prędkości jest zawsze bardziej wydłużony od jego newtonowskie-go lub czystolepkiego nienewtonowskiego odpowiednika przy takich samych liczbach Reynoldsa. Wyka-zano ponadto, że zjawisko to nasila się wraz ze wzrostem wartości charakterystycznej stałej czasowej λ, reprezentującej własności lepkosprężyste roztworu oraz w miarę zmniejszania się średnicy rury, w której realizowany jest przepływ.Słowa kluczowe: profil prędkości, przepływ w rurze, redukcja oporów
* Prof. PhD. Eng. Zbigniew Matras, MSc. Eng. Bartosz Kopiczak, Division of Fluid Mechanics, Cracow University of Technology.
156
1. Introduction
One of the characteristic and also less known effects associated with drag reduction phenomenon caused by very small amounts of high-molecular-weight polymer additives is abnormal deformation and elongation of time-averaged velocity profile in flow direction within the turbulent flow range [1, 2, 4, 5].
A full explanation and examination of real structure of such solution, sometimes called “Toms liquid”, in turbulent flow by the strictly theoretical considerations is impossible.
The studies in this field are based mainly on the Prandtl’s “mixing length” hypothesis [3], introducing merely various modifications on formula defining its relationship on the dis-tance of a fluid element from the wall [2, 4, 6] or expression describing the additional “tur-bulent viscosity” [5].
In this approach the flow in the pipe is treated as axisymmetric turbulent boundary layer. For its entire cross-section the shear rate is constant τ = τw.
Thus, it boils down to assumption of the gradientless flow, i.e. dp/dx = 0 which is obviously not true. Moreover, the disadvantage of proposed in scientific literature modifications of univer-sal velocity profile is fact that derivative of velocity in the tube axis (dv’/dy’) is not equal to zero.
Under the Matras hypothesis [7], introduction of high-molecular-weight polymer addi-tives to visco-elastic liquid causes that flow curve of polymer solution obtained from rheo-metric methods is indeed deformed - due to the occurrence of additional tangential stress during the shear – pseudonewtonian liquid curve.
The fictional pseudo Newtonian liquid with a viscosity η, which flows in fictional pipe with diameter D with mean velocity vm, satisfies the conditions of the hydrodynamic ana-logy [7] and can be treated as a Newtonian substitute for the non-Newtonian liquid in pipe flow but following dependencies are valid:
(1)dvdr
τ = h −
( )1 1-2 22 1
(2)3 1
nnn r r
n R+ = +
r
81 (3)
n
mvD
= + l τ
τ
-12 8 83 1 2( 1) 1 (4)4 3 1
n nn
m mv vn nKn n D D
+ + = + l + h
122( 1) (5)
3 1n Rn+ = +
R
12( 1) (6)3 1 m
n vn
−+ = +
mv
157
The theoretical analyses carried out in [7] showed that in pseudonewtonian dimension-less quantities system
drag reduction of viscoelastic polymer solutions flow in pipes can be described in the lami-nar flow using the modified Fanning equation:
while in the turbulent flow using the modified Blasius equation:
In case of the power-law fluid λ = 1, and therefore:
It is shown that abnormally elongated velocity profile in range of turbulent flow is caused by viscoelastic properties of liquid, defined in fluid model by the characteristic time constant λ.
2. Time-averahed velocity profile
Consider first a pseudonewtonian model of drag reducing fluid flow in the pipe. Define the following dimensionless variables and expressions:
2 81 (7)
n
mvD
ρ = = + l h
mf fM
Rvc c
1
81 (8)
n
mvpL D
− ∆ = = + l ρ
Re fM
R c2mv
64 (9)=Refc
0.250.079 (10)−= Refc
( ) 2.5
2
2 1(11)
3 1m
nR pL v n
+ ∆= = ρ + f fMc c
(12)ρ
= mrvr'
h
(13)ρ
=' mRvR
h
ñ' (14)L = m
çLv
*2 2
(15)∆∆∆ = =
ρ ρ'
m m
pppv v
158
Taking into account expressions (12)-(16) in equation (1), it can be transformed to fol-lowing dimensionless form:
In the turbulent range of flow the above equations is no longer valid.Assume the turbulent, quasi-stationary, pseudonewtonian fluid flow. The time-aver-
aged, dimensionless velocity distribution law – at constant Reynolds number Re = const – takes general form:
while the relationship between the dimensionless shear stress and velocity gradient takes general form:
or after the separation of variables:
Forms of functional operators f in equation (19) and φ in equation (20) depend only on Reynolds number value:
In order to simplify the notation, the overline of time-averaged quantities on further con-siderations is neglected.
Considering the balance of forces acting on a isolated, cylindrical fluid element with radius r’ and length dx’ (x’ = (xvmρ)/η), it follows that in the analysed case of the fully developed, ax-isymmetric and time-averaged, steady turbulent flow in smooth pipe the total dimensionless shear stress is-as in case of laminar flow – a linear function of the dimensionless radius r’, i.e.:
and for r’ = R’:
' (16)v=
m
vv
' (17)dd
= −''
vr
τ
( ) (18)f=' 'v r
(19)dd
= ϕ −
'''
vr
τ
( )1 (20)d d−= −ϕ' ' 'v rτ
' (21)2
=Re R
(22)2 'L∆
=' '' r p
τ
(23)2 'L∆
=' ''τw
R p
159
thus,
Present the dimensionless, averaged flow velocity (vm’ = 1) in form of definite integral:
Assuming no slip of fluid elements at the wall (v’|r’=R’ = 0) and using dependencies (20) and (24) following equation is obtained after the successive transformations:
where:
The dimensionless variable s, defined by the equations (27) can be interpreted as expo-nent of curve
tangential at arbitrary point to curve
Thus in general, the value of dimensionless parameters s and C depend on the value of expression 1/R’ on curve (29), drawn in the wall boundary condition. After transformation of the equation (26) with the respect to 1/R’ and further after substitution received expres-sion to equation (28), it is obtained:
Equation (30) defines exponential dependence of dimensionless velocity profile at the wall and is a special case of function (19). A comparison of formulas (24) and (7), and more-over (14) and (8) indicates obvious identities:
(24)=' ' ''
τ τw
rR
( )( )
( )2'2
20
11 (25)R
d= ∫ ' ''
v rR
3 1 1 (26)w
d sd s
+ − =
'' '
vr R
( ) ln '(27)
1 ln
wds
d
τ=
'R
1' (28)s
w C τ = 'R
' (29)ww
dd
τ = ϕ −
vr
' (30)3 1
s s
ww
s dCs d
τ = − +
''
vr
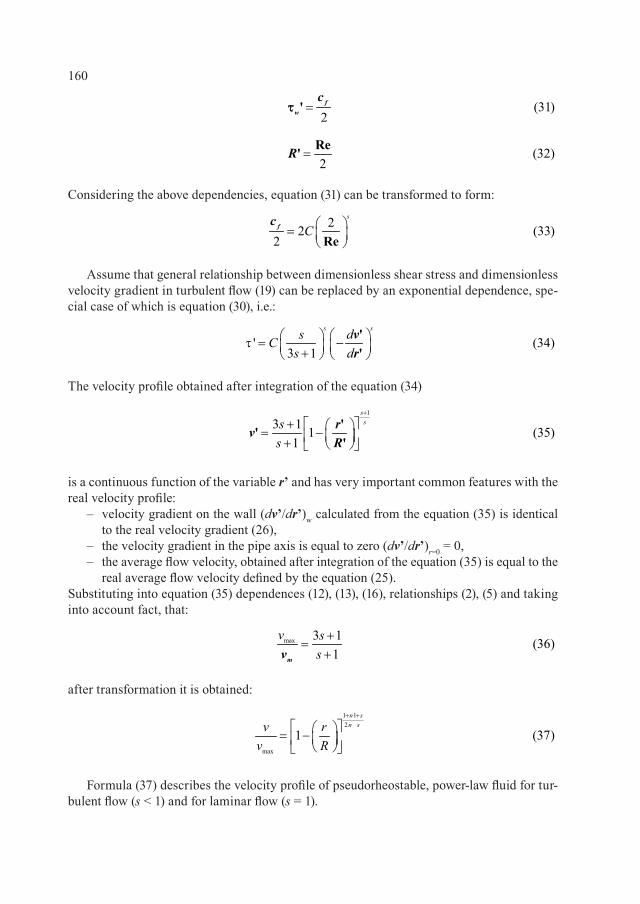
160
Considering the above dependencies, equation (31) can be transformed to form:
Assume that general relationship between dimensionless shear stress and dimensionless velocity gradient in turbulent flow (19) can be replaced by an exponential dependence, spe-cial case of which is equation (30), i.e.:
The velocity profile obtained after integration of the equation (34)
is a continuous function of the variable r’ and has very important common features with the real velocity profile:
– velocity gradient on the wall (dv’/dr’)w calculated from the equation (35) is identical to the real velocity gradient (26),
– the velocity gradient in the pipe axis is equal to zero (dv’/dr’)r=0 = 0, – the average flow velocity, obtained after integration of the equation (35) is equal to the
real average flow velocity defined by the equation (25).Substituting into equation (35) dependences (12), (13), (16), relationships (2), (5) and taking into account fact, that:
after transformation it is obtained:
Formula (37) describes the velocity profile of pseudorheostable, power-law fluid for tur-bulent flow (s < 1) and for laminar flow (s = 1).
(31)2
='τ fw
c
(32)2
=Re'R
22 (33)2
s
C = Re
fc
' (34)3 1
s ss dCs d
τ = − +
''
vr
1
3 1 1 (35)1
sss
s
+
+ = − +
'''
rvR
max 3 1 (36)1
v ss+
=+mv
1 12
max
1 (37)
n sn sv r
v R
+ +
= −
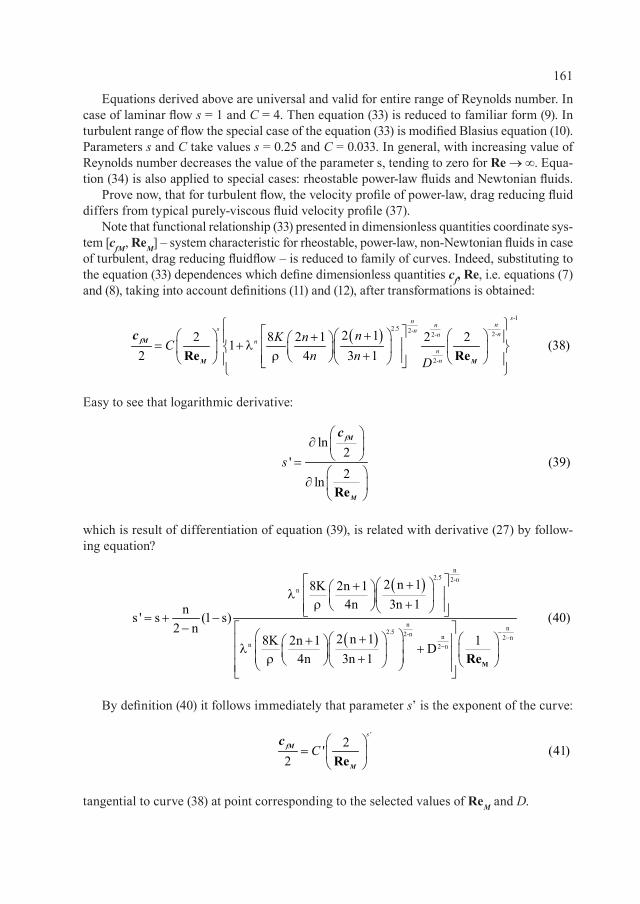
161
Equations derived above are universal and valid for entire range of Reynolds number. In case of laminar flow s = 1 and C = 4. Then equation (33) is reduced to familiar form (9). In turbulent range of flow the special case of the equation (33) is modified Blasius equation (10). Parameters s and C take values s = 0.25 and C = 0.033. In general, with increasing value of Reynolds number decreases the value of the parameter s, tending to zero for Re →∞. Equa-tion (34) is also applied to special cases: rheostable power-law fluids and Newtonian fluids.
Prove now, that for turbulent flow, the velocity profile of power-law, drag reducing fluid differs from typical purely-viscous fluid velocity profile (37).
Note that functional relationship (33) presented in dimensionless quantities coordinate sys-tem [cfM, ReM] – system characteristic for rheostable, power-law, non-Newtonian fluids in case of turbulent, drag reducing fluidflow – is reduced to family of curves. Indeed, substituting to the equation (33) dependences which define dimensionless quantities cf, Re, i.e. equations (7) and (8), taking into account definitions (11) and (12), after transformations is obtained:
Easy to see that logarithmic derivative:
which is result of differentiation of equation (39), is related with derivative (27) by follow-ing equation?
By definition (40) it follows immediately that parameter s’ is the exponent of the curve:
tangential to curve (38) at point corresponding to the selected values of ReM and D.
( )-1
2.5 2- 2-2-
2-
2 12 8 2 1 2 21 (38)2 4 3 1
sn nns n nnn
nn
nK nCn n D
− + + = + l ρ + Re Re
fM
M M
c
ln2
' (39)2ln
s
∂
=
∂ Re
fM
M
c
( )
( )
n2.5 2-n
n
n n2.5 2-n n 2 nn 2 n
2 n 18K 2n 14n 3n 1ns ' s (1 s) (40)
2 n2 n 18K 2n 1 1D
4n 3n 1
−−
−
+ + l ρ + = + −− + + l + ρ +
MRe
'2' (41)
2
s
C
= Re
fM
M
c
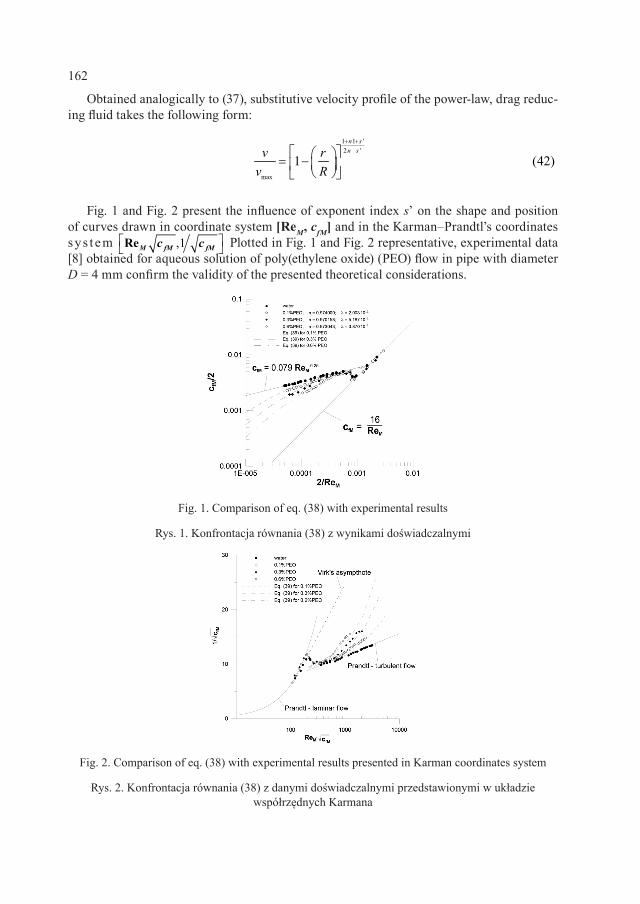
162
Obtained analogically to (37), substitutive velocity profile of the power-law, drag reduc-ing fluid takes the following form:
Fig. 1 and Fig. 2 present the influence of exponent index s’ on the shape and position of curves drawn in coordinate system [ReM, cfM] and in the Karman–Prandtl’s coordinates sys t em Plotted in Fig. 1 and Fig. 2 representative, experimental data [8] obtained for aqueous solution of poly(ethylene oxide) (PEO) flow in pipe with diameter D = 4 mm confirm the validity of the presented theoretical considerations.
1 1 '2 '
max
1 (42)
n sn sv r
v R
+ +
= −
,1 ReM fM fMc c
Fig. 1. Comparison of eq. (38) with experimental results
Rys. 1. Konfrontacja równania (38) z wynikami doświadczalnymi
Fig. 2. Comparison of eq. (38) with experimental results presented in Karman coordinates system
Rys. 2. Konfrontacja równania (38) z danymi doświadczalnymi przedstawionymi w układzie współrzędnych Karmana
163
3. Conclusions
An analysis of the equation (40) and curves presented in Fig. 1 indicates, that for the laminar flow (s’ = s = 1) velocity profile of the power-law, drag reducing fluid is identical to the velocity profile of power-law, pseudo-rheostable fluid. For the turbulent flow constant s’, which characterize the viscoelastic, power-law, Toms fluid, is always greater than the con-stant s determined for its pseudorheostable, not having elastic properties analogue (s’ > s). This inequality shows that (1 + s’)/s’ < (1 + s)/s. This means that the power-law, drag reduc-ing fluid velocity profile (42) for turbulent flow is always steeper than velocity profile of rhe-ostable, power-law fluid (37) with the same flow index n.
S y m b o l s
cf – Fanning friction coefficient [–]K – flow consistency constant [kg sn-2/m]L – length of the pipe or capillary [m]n – flow index [–]Δp – pressure drop [kg/(s2m)]r – radial variable [m]R – inner radius of the pipe or capillary [m]Re – Reynolds number [–]v – local velocity (for turbulent flow – time-averaged local velocity) [m/s]vm – mean velocity [m/s]x – axial variable [m]λ – characteristic time constant in equation (39) taking into account the viscoelastic properties of fluid [s]η – Pseudo-Newtonian coefficient of dynamic viscosity [kg/(m s)]ρ – Fluid density [kg/m3]τ – total shear stress [kg/(s2m)]' – denotes dimensionless variable – – denotes time-averaged quantity M – subscript – related with pseudorheostable flow w – subscript – concern to the boundary condition (r = R)
REMARK: all bolted symbols concern to the pseudo-Newtonian fluid flow
R e f e r e n c e s
[1] Toms B.A. , Proceedings of the First International Congress in Rheology Amsterdam, Vol. 2, North-Holland, Amsterdam 1948, 135.
[2] Bogue D.C. , Metzner A.B. , Velocity profiles in turbulent pipe flow: Newtonian and non-newtonian fluids, Industrial & Engineering Chemistry Fundamentals 2, 2, 1963, 143-149.

164
[3] Prandt l L. , ZAMM, 1, 1921, 431.[4] Virk P.S. , Drag reduction fundamentals, AIChE J., 21, 1975, 625.[5] Gyr A. , Bewersdorff H.W., Drag Reduction of Turbulent Flows by Additives, Klu-
wer, London 1995.[6] Amarouchene Y. , Bonn D. , Kel lay H. , Lo T. , L’vov V.S. , Procaccia I . ,
Reynolds number dependence of drag reduction by rodlike polymers, Physics of Fluids, 20, No. 6, 2008.
[7] Matras Z. , Przepływ cieczy Tomsa w przewodach kołowych, Wydawnictwo PK, Kraków 1985.
[8] Matras Z. , Przepływ nienewtonowskich roztworów polimerowo-micelarnych w ru-rach, Grant KBN, nr 3 T09C 041 27, 2007.

DAVID MÜLLER, MICHAEL MÜLLER*, LE ANH THU NGUYEN**, JOHANNA LUDWIG*, ANJA DREWS***, MATTHIAS KRAUME**,
REINHARD SCHOMÄCKER****, GÜNTER WOZNY*1
DEVELOPMENT OF SEPARATION METHODS FOR A CONTINUOUS HYDROFORMYLATION PROCESS
IN A MINI-PLANT SCALE
OPRACOWYWANIE METOD ODDZIELANIA DLA CIĄGŁEGO PROCESU HYDROFORMYLACJI
W SKALI MINI-APARATURY
A b s t r a c tIn this contribution a novel process concept for the continuous hydroformylation of long chained alkenes to aldehydes in micro emul-sion mixtures with the aid of a hydrophilic rhodium−ligand−complex catalyst is discussed. The challenging aspects with regards to the technical and economic feasibility of the process concept are the separation steps to recycle the expensive catalyst. To investigate and optimize the described process concept, a mini-plant is built at the Berlin Institute of Technology. Due to the lack of thermodynamic data, the design of the crucial separation steps, decanter and micellar enhanced ultrafiltration (MEUF), strongly depend on experimental data. Therefore, “small scale” experiments are designed with adequate similarity to the actual units in the plant. The information gained therein leads to improvements for the separation steps and helps to determine operating parameters for the mini-plant.Keywords: hydroformylation, phase separation, micellar enhanced ultrafiltration
S t r e s z c z e n i eW artykule niniejszym omówiona zostaje nowatorska koncepcja procesowa dotycząca ciągłej hydroformylacji alkenów łańcuchowych do aldehydów w mieszaninach mikroemulsyjnych za pomocą wodochłonnego katalizatora typu rod-ligand. Wyzwanie w odniesieniu do technicznej i ekonomicznej wykonalności koncepcji procesowej stanowią stopnie oddzielania prowadzące do odzyskania kosztownego katalizatora. W Berlińskim Instytucie Technologicznym zbudowano mini-aparaturę służącą do badania i optymizowania opisanej koncepcji procesowej. Ze względu na brak danych termodynamicznych projekt najważniejszych etapów oddzielania – wzmożonej ultrafiltracji dekanterowej i micelarnej (MEUF) – zależy w znacznym stopniu od danych doświadczalnych. Dlatego też eksperymenty prowadzone na „niedużą skalę” przygotowywane są z zachowaniem właściwego podobieństwie do rzeczywistych elementów aparatury. Zebrane informacje prowadzą do ulepszeń w zakresie stopni oddzielania, pomagając określać operacyjne parametry mini-aparatury.Słowa kluczowe: hydroformylacja, oddzielanie fazowe, wzmożona ultrafiltracja micelarna
* MSc. David Müller, Dipl. Eng. Michael Müller, Johanna Ludwig, Prof. PhD. Eng. Günter Wozny, Chair of Process Dynamics and Operation, TU Berlin.** Dipl. Eng. Le Anh Thu Nguyen, Prof. PhD. Eng. Matthias Kraume, Chair of Chemical Engineering, TU Berlin.*** Prof. PhD. Eng. Anja Drews, Chair of Life Science Engineering, HTW Berlin.**** Prof. PhD. Eng. Reinhard Schomäcker, Department of Chemistry, TU Berlin.
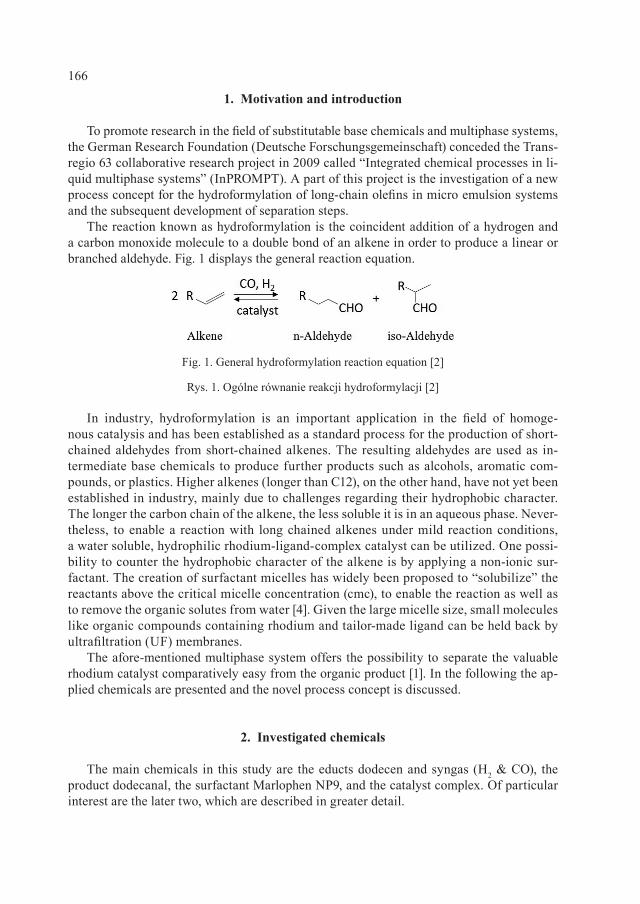
166
1. Motivation and introduction
To promote research in the field of substitutable base chemicals and multiphase systems, the German Research Foundation (Deutsche Forschungsgemeinschaft) conceded the Trans-regio 63 collaborative research project in 2009 called “Integrated chemical processes in li-quid multiphase systems” (InPROMPT). A part of this project is the investigation of a new process concept for the hydroformylation of long-chain olefins in micro emulsion systems and the subsequent development of separation steps.
The reaction known as hydroformylation is the coincident addition of a hydrogen and a carbon monoxide molecule to a double bond of an alkene in order to produce a linear or branched aldehyde. Fig. 1 displays the general reaction equation.
In industry, hydroformylation is an important application in the field of homoge-nous catalysis and has been established as a standard process for the production of short-chained aldehydes from short-chained alkenes. The resulting aldehydes are used as in-termediate base chemicals to produce further products such as alcohols, aromatic com-pounds, or plastics. Higher alkenes (longer than C12), on the other hand, have not yet been established in industry, mainly due to challenges regarding their hydrophobic character. The longer the carbon chain of the alkene, the less soluble it is in an aqueous phase. Never-theless, to enable a reaction with long chained alkenes under mild reaction conditions, a water soluble, hydrophilic rhodium-ligand-complex catalyst can be utilized. One possi-bility to counter the hydrophobic character of the alkene is by applying a non-ionic sur-factant. The creation of surfactant micelles has widely been proposed to “solubilize” the reactants above the critical micelle concentration (cmc), to enable the reaction as well as to remove the organic solutes from water [4]. Given the large micelle size, small molecules like organic compounds containing rhodium and tailor-made ligand can be held back by ultrafiltration (UF) membranes.
The afore-mentioned multiphase system offers the possibility to separate the valuable rhodium catalyst comparatively easy from the organic product [1]. In the following the ap-plied chemicals are presented and the novel process concept is discussed.
2. Investigated chemicals
The main chemicals in this study are the educts dodecen and syngas (H2 & CO), the product dodecanal, the surfactant Marlophen NP9, and the catalyst complex. Of particular interest are the later two, which are described in greater detail.
Fig. 1. General hydroformylation reaction equation [2]
Rys. 1. Ogólne równanie reakcji hydroformylacji [2]
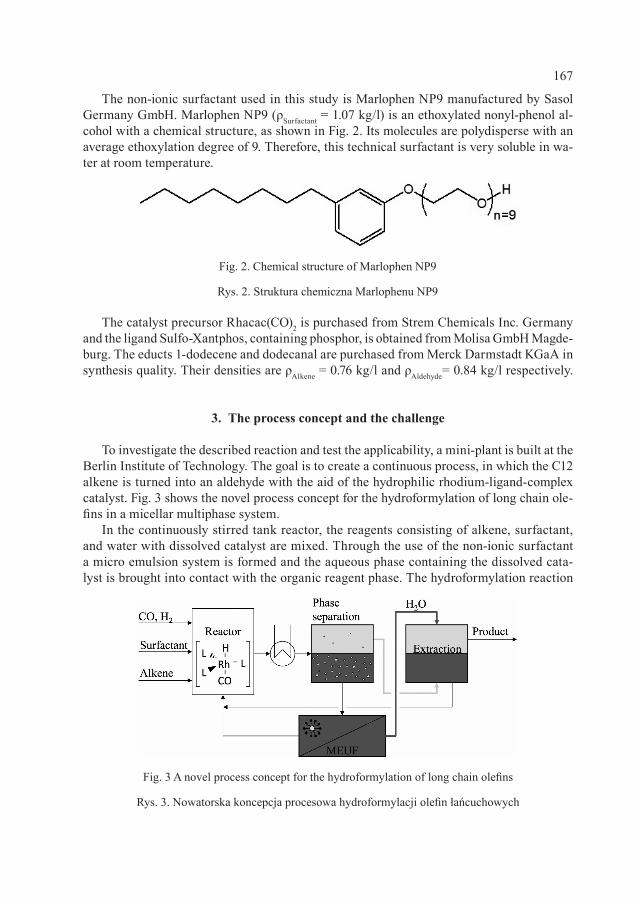
167
The non-ionic surfactant used in this study is Marlophen NP9 manufactured by Sasol Germany GmbH. Marlophen NP9 (ρSurfactant = 1.07 kg/l) is an ethoxylated nonyl-phenol al-cohol with a chemical structure, as shown in Fig. 2. Its molecules are polydisperse with an average ethoxylation degree of 9. Therefore, this technical surfactant is very soluble in wa-ter at room temperature.
The catalyst precursor Rhacac(CO)2 is purchased from Strem Chemicals Inc. Germany and the ligand Sulfo-Xantphos, containing phosphor, is obtained from Molisa GmbH Magde-burg. The educts 1-dodecene and dodecanal are purchased from Merck Darmstadt KGaA in synthesis quality. Their densities are ρAlkene = 0.76 kg/l and ρAldehyde= 0.84 kg/l respectively.
3. The process concept and the challenge
To investigate the described reaction and test the applicability, a mini-plant is built at the Berlin Institute of Technology. The goal is to create a continuous process, in which the C12 alkene is turned into an aldehyde with the aid of the hydrophilic rhodium-ligand-complex catalyst. Fig. 3 shows the novel process concept for the hydroformylation of long chain ole-fins in a micellar multiphase system.
In the continuously stirred tank reactor, the reagents consisting of alkene, surfactant, and water with dissolved catalyst are mixed. Through the use of the non-ionic surfactant a micro emulsion system is formed and the aqueous phase containing the dissolved cata-lyst is brought into contact with the organic reagent phase. The hydroformylation reaction
Fig. 2. Chemical structure of Marlophen NP9
Rys. 2. Struktura chemiczna Marlophenu NP9
Fig. 3 A novel process concept for the hydroformylation of long chain olefins
Rys. 3. Nowatorska koncepcja procesowa hydroformylacji olefin łańcuchowych
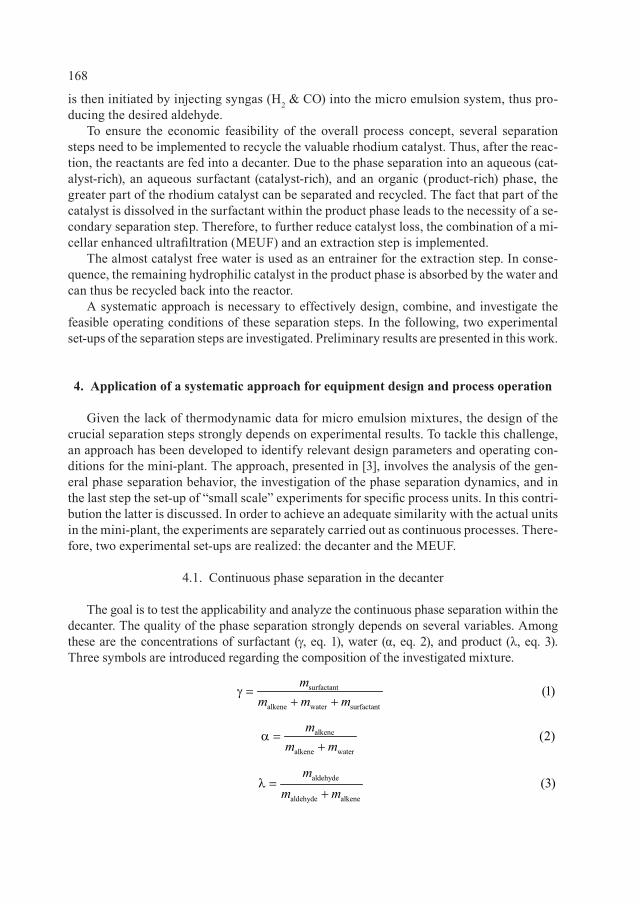
168
is then initiated by injecting syngas (H2 & CO) into the micro emulsion system, thus pro-ducing the desired aldehyde.
To ensure the economic feasibility of the overall process concept, several separation steps need to be implemented to recycle the valuable rhodium catalyst. Thus, after the reac-tion, the reactants are fed into a decanter. Due to the phase separation into an aqueous (cat-alyst-rich), an aqueous surfactant (catalyst-rich), and an organic (product-rich) phase, the greater part of the rhodium catalyst can be separated and recycled. The fact that part of the catalyst is dissolved in the surfactant within the product phase leads to the necessity of a se-condary separation step. Therefore, to further reduce catalyst loss, the combination of a mi-cellar enhanced ultrafiltration (MEUF) and an extraction step is implemented.
The almost catalyst free water is used as an entrainer for the extraction step. In conse-quence, the remaining hydrophilic catalyst in the product phase is absorbed by the water and can thus be recycled back into the reactor.
A systematic approach is necessary to effectively design, combine, and investigate the feasible operating conditions of these separation steps. In the following, two experimental set-ups of the separation steps are investigated. Preliminary results are presented in this work.
4. Application of a systematic approach for equipment design and process operation
Given the lack of thermodynamic data for micro emulsion mixtures, the design of the crucial separation steps strongly depends on experimental results. To tackle this challenge, an approach has been developed to identify relevant design parameters and operating con-ditions for the mini-plant. The approach, presented in [3], involves the analysis of the gen-eral phase separation behavior, the investigation of the phase separation dynamics, and in the last step the set-up of “small scale” experiments for specific process units. In this contri-bution the latter is discussed. In order to achieve an adequate similarity with the actual units in the mini-plant, the experiments are separately carried out as continuous processes. There-fore, two experimental set-ups are realized: the decanter and the MEUF.
4.1. Continuous phase separation in the decanter
The goal is to test the applicability and analyze the continuous phase separation within the decanter. The quality of the phase separation strongly depends on several variables. Among these are the concentrations of surfactant (γ, eq. 1), water (α, eq. 2), and product (λ, eq. 3). Three symbols are introduced regarding the composition of the investigated mixture.
surfactant
alkene water surfactant
(1)m
m m mγ =
+ +
alkene
alkene water
(2)m
m mα =
+
aldehyde
aldehyde alkene
(3)m
m ml =
+
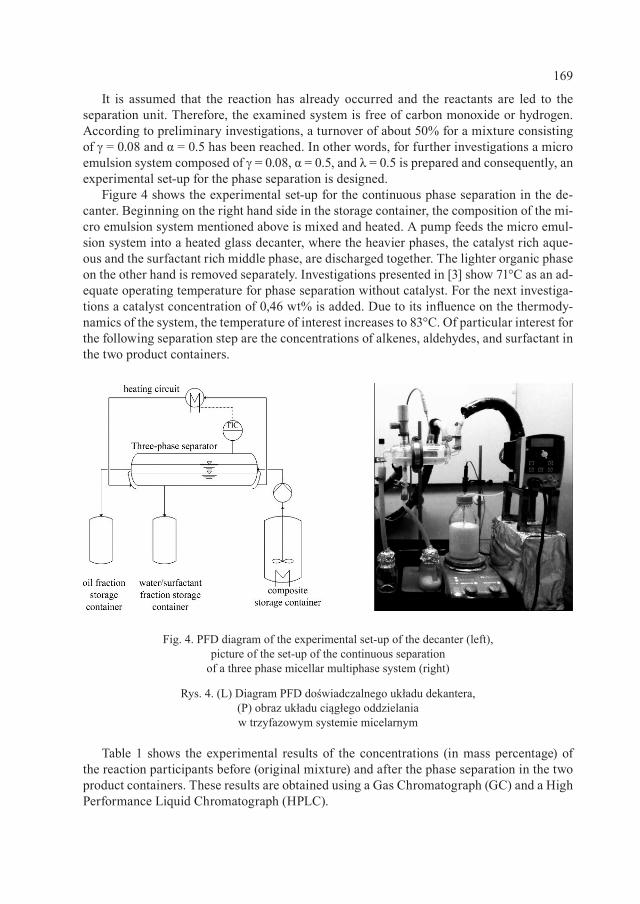
169
It is assumed that the reaction has already occurred and the reactants are led to the separation unit. Therefore, the examined system is free of carbon monoxide or hydrogen. According to preliminary investigations, a turnover of about 50% for a mixture consisting of γ = 0.08 and α = 0.5 has been reached. In other words, for further investigations a micro emulsion system composed of γ = 0.08, α = 0.5, and λ = 0.5 is prepared and consequently, an experimental set-up for the phase separation is designed.
Figure 4 shows the experimental set-up for the continuous phase separation in the de-canter. Beginning on the right hand side in the storage container, the composition of the mi-cro emulsion system mentioned above is mixed and heated. A pump feeds the micro emul-sion system into a heated glass decanter, where the heavier phases, the catalyst rich aque-ous and the surfactant rich middle phase, are discharged together. The lighter organic phase on the other hand is removed separately. Investigations presented in [3] show 71°C as an ad-equate operating temperature for phase separation without catalyst. For the next investiga-tions a catalyst concentration of 0,46 wt% is added. Due to its influence on the thermody-namics of the system, the temperature of interest increases to 83°C. Of particular interest for the following separation step are the concentrations of alkenes, aldehydes, and surfactant in the two product containers.
Table 1 shows the experimental results of the concentrations (in mass percentage) of the reaction participants before (original mixture) and after the phase separation in the two product containers. These results are obtained using a Gas Chromatograph (GC) and a High Performance Liquid Chromatograph (HPLC).
Fig. 4. PFD diagram of the experimental set-up of the decanter (left), picture of the set-up of the continuous separation
of a three phase micellar multiphase system (right)
Rys. 4. (L) Diagram PFD doświadczalnego układu dekantera, (P) obraz układu ciągłego oddzielania w trzyfazowym systemie micelarnym
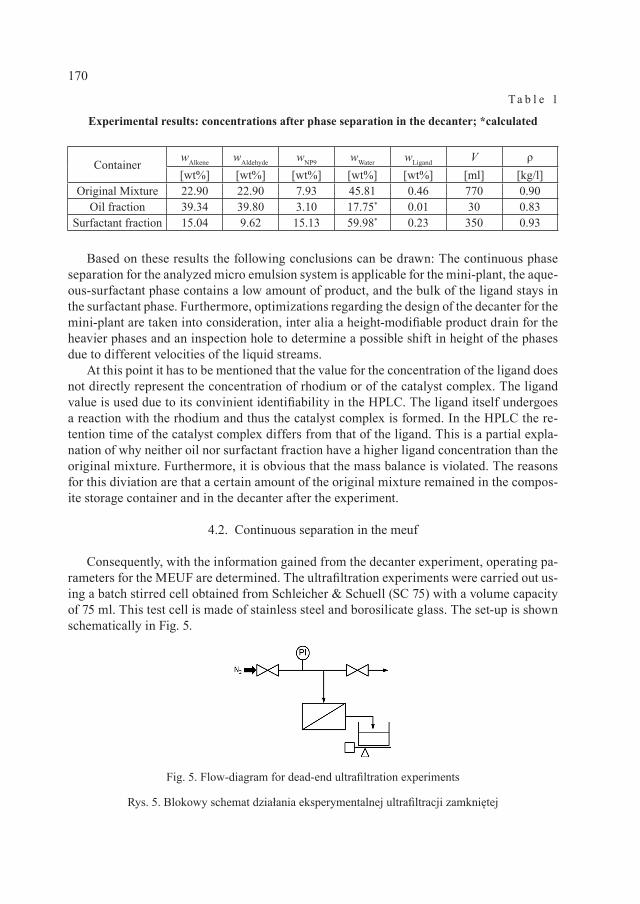
170
T a b l e 1
Experimental results: concentrations after phase separation in the decanter; *calculated
ContainerwAlkene wAldehyde wNP9 wWater wLigand V ρ[wt%] [wt%] [wt%] [wt%] [wt%] [ml] [kg/l]
Original Mixture 22.90 22.90 7.93 45.81 0.46 770 0.90Oil fraction 39.34 39.80 3.10 17.75* 0.01 30 0.83
Surfactant fraction 15.04 9.62 15.13 59.98* 0.23 350 0.93
Based on these results the following conclusions can be drawn: The continuous phase separation for the analyzed micro emulsion system is applicable for the mini-plant, the aque-ous-surfactant phase contains a low amount of product, and the bulk of the ligand stays in the surfactant phase. Furthermore, optimizations regarding the design of the decanter for the mini-plant are taken into consideration, inter alia a height-modifiable product drain for the heavier phases and an inspection hole to determine a possible shift in height of the phases due to different velocities of the liquid streams.
At this point it has to be mentioned that the value for the concentration of the ligand does not directly represent the concentration of rhodium or of the catalyst complex. The ligand value is used due to its convinient identifiability in the HPLC. The ligand itself undergoes a reaction with the rhodium and thus the catalyst complex is formed. In the HPLC the re-tention time of the catalyst complex differs from that of the ligand. This is a partial expla-nation of why neither oil nor surfactant fraction have a higher ligand concentration than the original mixture. Furthermore, it is obvious that the mass balance is violated. The reasons for this diviation are that a certain amount of the original mixture remained in the compos-ite storage container and in the decanter after the experiment.
4.2. Continuous separation in the meuf
Consequently, with the information gained from the decanter experiment, operating pa-rameters for the MEUF are determined. The ultrafiltration experiments were carried out us-ing a batch stirred cell obtained from Schleicher & Schuell (SC 75) with a volume capacity of 75 ml. This test cell is made of stainless steel and borosilicate glass. The set-up is shown schematically in Fig. 5.
Fig. 5. Flow-diagram for dead-end ultrafiltration experiments
Rys. 5. Blokowy schemat działania eksperymentalnej ultrafiltracji zamkniętej
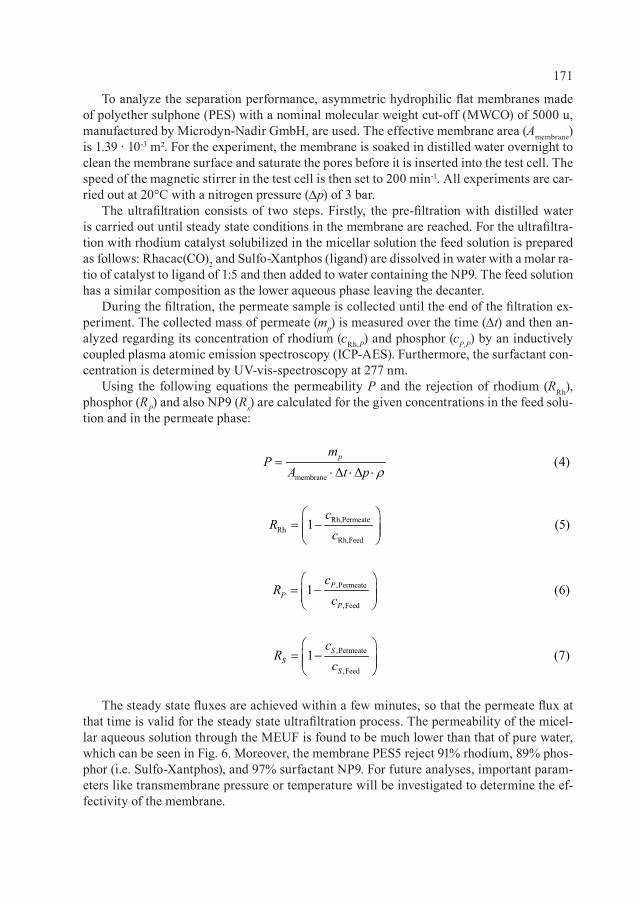
171
To analyze the separation performance, asymmetric hydrophilic flat membranes made of polyether sulphone (PES) with a nominal molecular weight cut-off (MWCO) of 5000 u, manufactured by Microdyn-Nadir GmbH, are used. The effective membrane area (Amembrane) is 1.39 ∙ 10-3 m². For the experiment, the membrane is soaked in distilled water overnight to clean the membrane surface and saturate the pores before it is inserted into the test cell. The speed of the magnetic stirrer in the test cell is then set to 200 min-1. All experiments are car-ried out at 20°C with a nitrogen pressure (∆p) of 3 bar.
The ultrafiltration consists of two steps. Firstly, the pre-filtration with distilled water is carried out until steady state conditions in the membrane are reached. For the ultrafiltra-tion with rhodium catalyst solubilized in the micellar solution the feed solution is prepared as follows: Rhacac(CO)2 and Sulfo-Xantphos (ligand) are dissolved in water with a molar ra-tio of catalyst to ligand of 1:5 and then added to water containing the NP9. The feed solution has a similar composition as the lower aqueous phase leaving the decanter.
During the filtration, the permeate sample is collected until the end of the filtration ex-periment. The collected mass of permeate (mp) is measured over the time (∆t) and then an-alyzed regarding its concentration of rhodium (cRh,P) and phosphor (cP,P) by an inductively coupled plasma atomic emission spectroscopy (ICP-AES). Furthermore, the surfactant con-centration is determined by UV-vis-spectroscopy at 277 nm.
Using the following equations the permeability P and the rejection of rhodium (RRh), phosphor (RP) and also NP9 (Rs) are calculated for the given concentrations in the feed solu-tion and in the permeate phase:
The steady state fluxes are achieved within a few minutes, so that the permeate flux at that time is valid for the steady state ultrafiltration process. The permeability of the micel-lar aqueous solution through the MEUF is found to be much lower than that of pure water, which can be seen in Fig. 6. Moreover, the membrane PES5 reject 91% rhodium, 89% phos-phor (i.e. Sulfo-Xantphos), and 97% surfactant NP9. For future analyses, important param-eters like transmembrane pressure or temperature will be investigated to determine the ef-fectivity of the membrane.
membrane
(4)pmP
A t p=
⋅∆ ⋅∆ ⋅ ρ
Rh,PermeateRh
Rh,Feed
1 (5)c
Rc
= −
,Permeate
,Feed
1 (6)PP
P
cR
c
= −
,Permeate
,Feed
1 (7)SS
S
cR
c
= −
172
Fig. 6. Separation performance of the membrane polyether sulfone with MWCO 5 x 10³ u
Rys. 6. Szybkość oddzielania sulfonu polieteru membranowego przy MWCO 5 x 10³ u
Fig. 7. Mini-plant at the Chair of Process Dynamics and Operation
Rys. 7. Mini-aparatura w Katedrze Dynamiki i Działania Procesowego
173
4.3. Implementation in the mini-plant
With the gained information, the mini-plant at the Chair for Process Dynamics and Op-eration at the Berlin Institute of Technology is designed and modified. Fig. 7 shows a 3D im-age and two pictures of the actual plant. In the top photo the reactor and the decanter are dis-played. The MEUF is yet to be implemented. The bottom photo shows the three reagent con-tainers containing the alkene, the surfactant, and the catalyst.
5. Conclusion
Recycling the valuable rhodium catalyst is the challenging aspect of the hydroformyla-tion of long chain alkenes with regards to the technical and economic feasibility. Next to proving the general applicability of the combination of decanter and MEUF, the experi-mental set-ups help to determine feasible conditions for an integration of both steps into the whole hydroformylation process. The preliminary results show that a high recovery of the rhodium complex could be reached at the investigated conditions.
S y m b o l s
α – olefin–water–proportion [–]γ – surfactant−water−proportion [–]λ – aldehyde−olefin−proportion [–]ρ – density [kg/l]A – area [m²]c – concentration [g/l]m – mass [kg]p – pressure [bar]P – permeability [L/(m²h bar)]t – time [s]R – rejection [–]V – volume [l]
The authors gratefully acknowledge the support of the Collaborative Research Center SFB/TR 63 InPROMPT “Integrated Chemical Processes in Liquid Multiphase Systems” coordinated by the Berlin Institute of Technology and funded by the German Research (Deutsche Forschungsgemeinschaft).
R e f e r e n c e s
[1] Bode G. , Lade M., Schomäcker R. , The Kinetics of an Interfacial Reaction in Mi-cro-emulsions with Excess Phases, Chem. Eng. Technol., 23, 2000, 405-409.
[2] Kupka J .A. , Hydroformylierung von 1-Octen in Mikroemulsion, Fakultät für Lebens-wissenschaften der Technischen Universität Carolo-Wilhelmina zu Braunschweig, Dis-sertation, 2006.

174
[3] Müller M., Kasaka Y. , Müller D. , Schomäcker R. , Wozny G. , A Continu-ous Hydroformylation Process in a Mini-Plant Scale: Equipment Design for the Sepa-ration of Three Liquid Phases, Proceedings: Process Systems Engineering, Singapore 2012, in Press.
[4] Schwarze M., Rost A. , Weigel T. , Schomäcker R. , Selection of systems for catalyst recovery by micellar enhanced ultrafiltration, Chem. Eng. Process, 48, 2009, 356-363.
SEBASTIAN PATER, JANUSZ MAGIERA*1
ENERGETIC AND ECOLOGICAL BALANCING HYBRID HEATING SYSTEM
WITH RENEWABLE ENERGY SOURCES
BILANSOWANIE ENERGETYCZNE I EKOLOGICZNE HYBRYDOWEGO SYSTEMU GRZEWCZEGO
Z ODNAWIALNYMI ŹRÓDŁAMI ENERGII
A b s t r a c t
This paper deals with hybrid heating installation for house heating and domestic warm water production used in private house in Batowice (near Kraków). The system consist of four heat sources, including three renewable energy sources: brine-water heat pump with three vertical boreholes, a fireplace with a water jac-ket and heat exchanger, heat pipe vacuum-tube solar collectors and gas condensing boiler. The integration of all heat sources takes place through a novel, advanced cascade combination of two DigiENERGY con-trol systems, which by registration large number of system parameters and compilation of statistics plays important role in energetic and ecological installation balancing. The operational installation results from September 2011 were presented and analyzed.Keywords: heat pump, tube solar collectors, fireplace, control system, RES, condensing boiler
S t r e s z c z e n i e
Artykuł niniejszy dotyczy hybrydowej instalacji służącej do ogrzewania pomieszczeń oraz wytwarzania ciepłej wody użytkowej zastosowanej w prywatnym domu w Batowicach (Kraków). System ten składa się z czterech źródeł ciepła, w tym trzech odnawialnych źródeł energii: solankowej pompy ciepła z trzema odwiertami pionowymi, kominka z płaszczem wodnym i wymiennikiem ciepła, próżniowych kolektorów słonecznych oraz kotła kondensującego gaz. Integracja wszystkich źródeł ciepła odbywa się poprzez nowatorską, zaawansowaną kaskadową kombinację dwóch systemów kontroli DigiENERGY, co odgrywa istotną rolę w energetycznym i ekologicznym bilansowaniu instalacji poprzez zapis dużej liczby parametrów systemowych oraz zestawienie danych statystycznych. Zaprezentowano i zanalizowano wyniki działania instalacji z września 2011 roku.Słowa kluczowe: pompa ciepła, rurowe kolektory słoneczne, kominek, system kontroli, RES, kocioł kondensujący
* MSc. Eng. Sebastian Pater, Prof. PhD. Eng. Janusz Magiera, Institute of Chemical and Process Engi-neering, Cracow University of Technology.
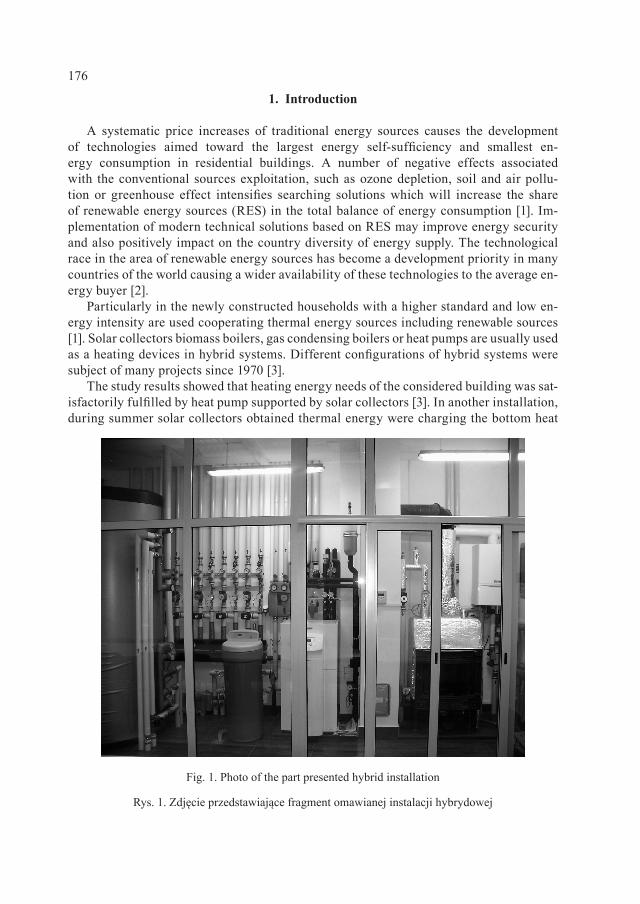
176
1. Introduction
A systematic price increases of traditional energy sources causes the development of technologies aimed toward the largest energy self-sufficiency and smallest en-ergy consumption in residential buildings. A number of negative effects associated with the conventional sources exploitation, such as ozone depletion, soil and air pollu-tion or greenhouse effect intensifies searching solutions which will increase the share of renewable energy sources (RES) in the total balance of energy consumption [1]. Im-plementation of modern technical solutions based on RES may improve energy security and also positively impact on the country diversity of energy supply. The technological race in the area of renewable energy sources has become a development priority in many countries of the world causing a wider availability of these technologies to the average en-ergy buyer [2].
Particularly in the newly constructed households with a higher standard and low en-ergy intensity are used cooperating thermal energy sources including renewable sources [1]. Solar collectors biomass boilers, gas condensing boilers or heat pumps are usually used as a heating devices in hybrid systems. Different configurations of hybrid systems were subject of many projects since 1970 [3].
The study results showed that heating energy needs of the considered building was sat-isfactorily fulfilled by heat pump supported by solar collectors [3]. In another installation, during summer solar collectors obtained thermal energy were charging the bottom heat
Fig. 1. Photo of the part presented hybrid installation
Rys. 1. Zdjęcie przedstawiające fragment omawianej instalacji hybrydowej
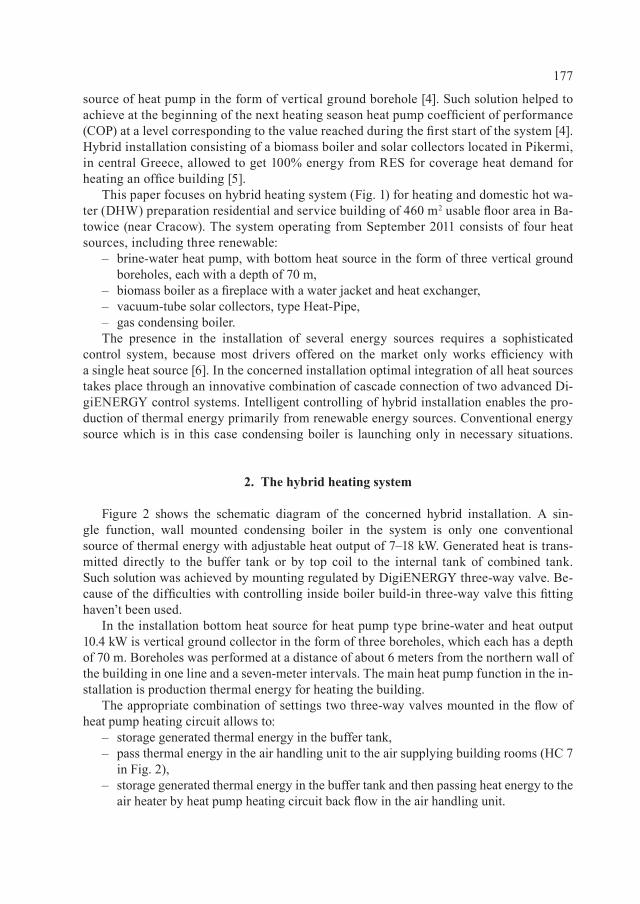
177
source of heat pump in the form of vertical ground borehole [4]. Such solution helped to achieve at the beginning of the next heating season heat pump coefficient of performance (COP) at a level corresponding to the value reached during the first start of the system [4]. Hybrid installation consisting of a biomass boiler and solar collectors located in Pikermi, in central Greece, allowed to get 100% energy from RES for coverage heat demand for heating an office building [5].
This paper focuses on hybrid heating system (Fig. 1) for heating and domestic hot wa-ter (DHW) preparation residential and service building of 460 m2 usable floor area in Ba-towice (near Cracow). The system operating from September 2011 consists of four heat sources, including three renewable:
– brine-water heat pump, with bottom heat source in the form of three vertical ground boreholes, each with a depth of 70 m,
– biomass boiler as a fireplace with a water jacket and heat exchanger, – vacuum-tube solar collectors, type Heat-Pipe, – gas condensing boiler.
The presence in the installation of several energy sources requires a sophisticated control system, because most drivers offered on the market only works efficiency with a single heat source [6]. In the concerned installation optimal integration of all heat sources takes place through an innovative combination of cascade connection of two advanced Di-giENERGY control systems. Intelligent controlling of hybrid installation enables the pro-duction of thermal energy primarily from renewable energy sources. Conventional energy source which is in this case condensing boiler is launching only in necessary situations.
2. The hybrid heating system
Figure 2 shows the schematic diagram of the concerned hybrid installation. A sin-gle function, wall mounted condensing boiler in the system is only one conventional source of thermal energy with adjustable heat output of 7–18 kW. Generated heat is trans-mitted directly to the buffer tank or by top coil to the internal tank of combined tank. Such solution was achieved by mounting regulated by DigiENERGY three-way valve. Be-cause of the difficulties with controlling inside boiler build-in three-way valve this fitting haven’t been used.
In the installation bottom heat source for heat pump type brine-water and heat output 10.4 kW is vertical ground collector in the form of three boreholes, which each has a depth of 70 m. Boreholes was performed at a distance of about 6 meters from the northern wall of the building in one line and a seven-meter intervals. The main heat pump function in the in-stallation is production thermal energy for heating the building.
The appropriate combination of settings two three-way valves mounted in the flow of heat pump heating circuit allows to:
– storage generated thermal energy in the buffer tank, – pass thermal energy in the air handling unit to the air supplying building rooms (HC 7
in Fig. 2), – storage generated thermal energy in the buffer tank and then passing heat energy to the
air heater by heat pump heating circuit back flow in the air handling unit.
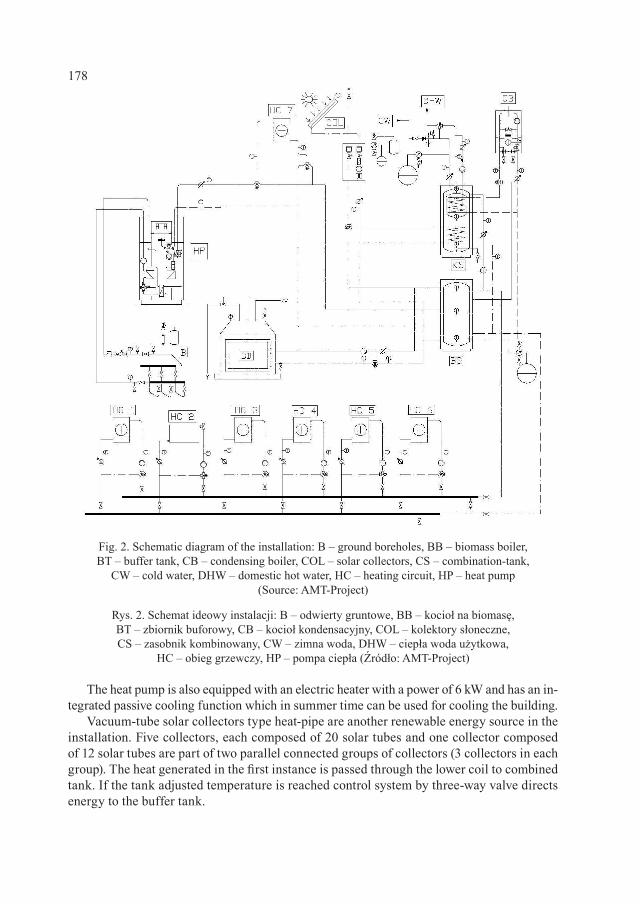
178
The heat pump is also equipped with an electric heater with a power of 6 kW and has an in-tegrated passive cooling function which in summer time can be used for cooling the building.
Vacuum-tube solar collectors type heat-pipe are another renewable energy source in the installation. Five collectors, each composed of 20 solar tubes and one collector composed of 12 solar tubes are part of two parallel connected groups of collectors (3 collectors in each group). The heat generated in the first instance is passed through the lower coil to combined tank. If the tank adjusted temperature is reached control system by three-way valve directs energy to the buffer tank.
Fig. 2. Schematic diagram of the installation: B – ground boreholes, BB – biomass boiler, BT – buffer tank, CB – condensing boiler, COL – solar collectors, CS – combination-tank,
CW – cold water, DHW – domestic hot water, HC – heating circuit, HP – heat pump (Source: AMT-Project)
Rys. 2. Schemat ideowy instalacji: B – odwierty gruntowe, BB – kocioł na biomasę, BT – zbiornik buforowy, CB – kocioł kondensacyjny, COL – kolektory słoneczne, CS – zasobnik kombinowany, CW – zimna woda, DHW – ciepła woda użytkowa,
HC – obieg grzewczy, HP – pompa ciepła (Źródło: AMT-Project)
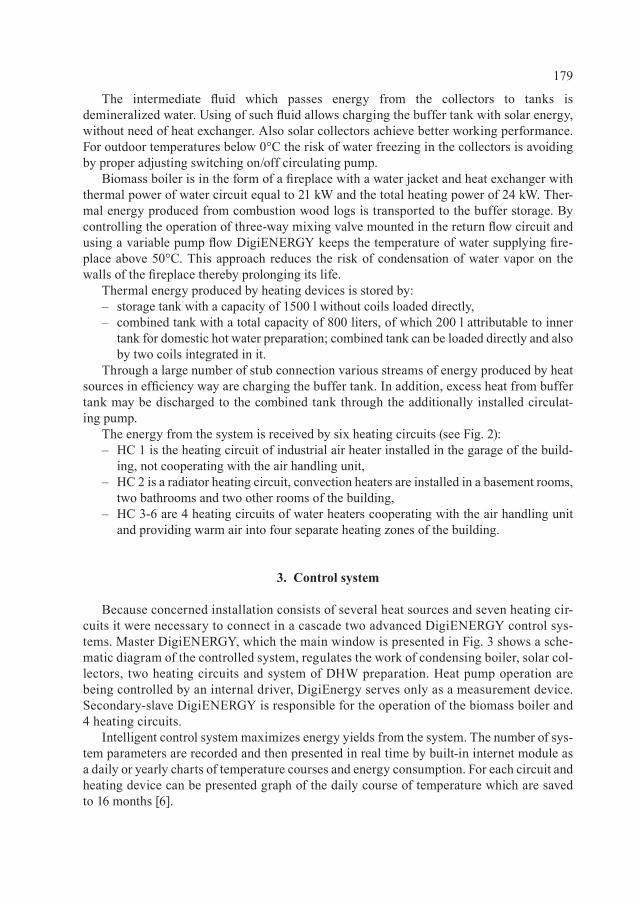
179
The intermediate fluid which passes energy from the collectors to tanks is demineralized water. Using of such fluid allows charging the buffer tank with solar energy, without need of heat exchanger. Also solar collectors achieve better working performance. For outdoor temperatures below 0°C the risk of water freezing in the collectors is avoiding by proper adjusting switching on/off circulating pump.
Biomass boiler is in the form of a fireplace with a water jacket and heat exchanger with thermal power of water circuit equal to 21 kW and the total heating power of 24 kW. Ther-mal energy produced from combustion wood logs is transported to the buffer storage. By controlling the operation of three-way mixing valve mounted in the return flow circuit and using a variable pump flow DigiENERGY keeps the temperature of water supplying fire-place above 50°C. This approach reduces the risk of condensation of water vapor on the walls of the fireplace thereby prolonging its life.
Thermal energy produced by heating devices is stored by: – storage tank with a capacity of 1500 l without coils loaded directly, – combined tank with a total capacity of 800 liters, of which 200 l attributable to inner
tank for domestic hot water preparation; combined tank can be loaded directly and also by two coils integrated in it.
Through a large number of stub connection various streams of energy produced by heat sources in efficiency way are charging the buffer tank. In addition, excess heat from buffer tank may be discharged to the combined tank through the additionally installed circulat-ing pump.
The energy from the system is received by six heating circuits (see Fig. 2): – HC 1 is the heating circuit of industrial air heater installed in the garage of the build-
ing, not cooperating with the air handling unit, – HC 2 is a radiator heating circuit, convection heaters are installed in a basement rooms,
two bathrooms and two other rooms of the building, – HC 3-6 are 4 heating circuits of water heaters cooperating with the air handling unit
and providing warm air into four separate heating zones of the building.
3. Control system
Because concerned installation consists of several heat sources and seven heating cir-cuits it were necessary to connect in a cascade two advanced DigiENERGY control sys-tems. Master DigiENERGY, which the main window is presented in Fig. 3 shows a sche-matic diagram of the controlled system, regulates the work of condensing boiler, solar col-lectors, two heating circuits and system of DHW preparation. Heat pump operation are being controlled by an internal driver, DigiEnergy serves only as a measurement device. Secondary-slave DigiENERGY is responsible for the operation of the biomass boiler and 4 heating circuits.
Intelligent control system maximizes energy yields from the system. The number of sys-tem parameters are recorded and then presented in real time by built-in internet module as a daily or yearly charts of temperature courses and energy consumption. For each circuit and heating device can be presented graph of the daily course of temperature which are saved to 16 months [6].
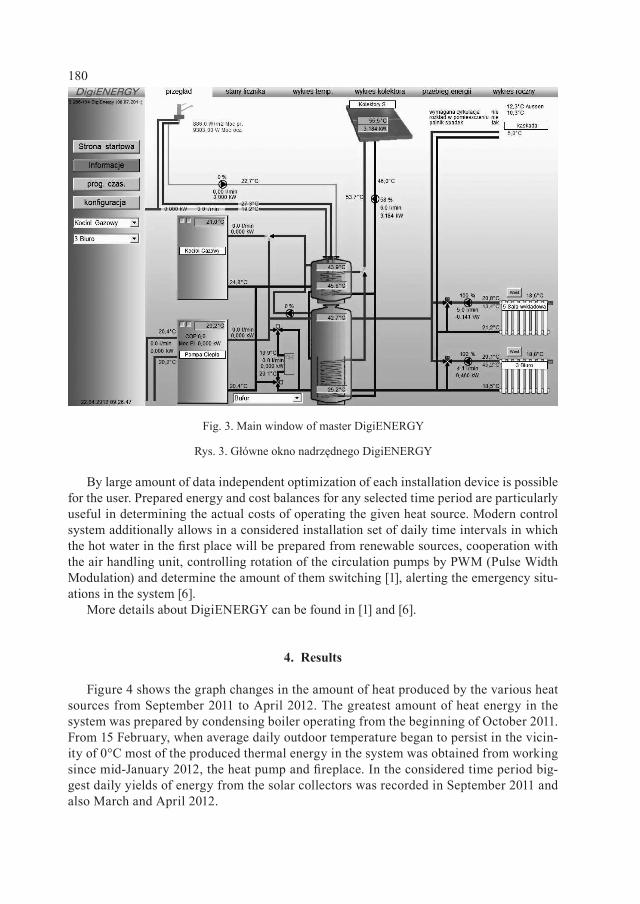
180
By large amount of data independent optimization of each installation device is possible for the user. Prepared energy and cost balances for any selected time period are particularly useful in determining the actual costs of operating the given heat source. Modern control system additionally allows in a considered installation set of daily time intervals in which the hot water in the first place will be prepared from renewable sources, cooperation with the air handling unit, controlling rotation of the circulation pumps by PWM (Pulse Width Modulation) and determine the amount of them switching [1], alerting the emergency situ-ations in the system [6].
More details about DigiENERGY can be found in [1] and [6].
4. Results
Figure 4 shows the graph changes in the amount of heat produced by the various heat sources from September 2011 to April 2012. The greatest amount of heat energy in the system was prepared by condensing boiler operating from the beginning of October 2011. From 15 February, when average daily outdoor temperature began to persist in the vicin-ity of 0°C most of the produced thermal energy in the system was obtained from working since mid-January 2012, the heat pump and fireplace. In the considered time period big-gest daily yields of energy from the solar collectors was recorded in September 2011 and also March and April 2012.
Fig. 3. Main window of master DigiENERGY
Rys. 3. Główne okno nadrzędnego DigiENERGY
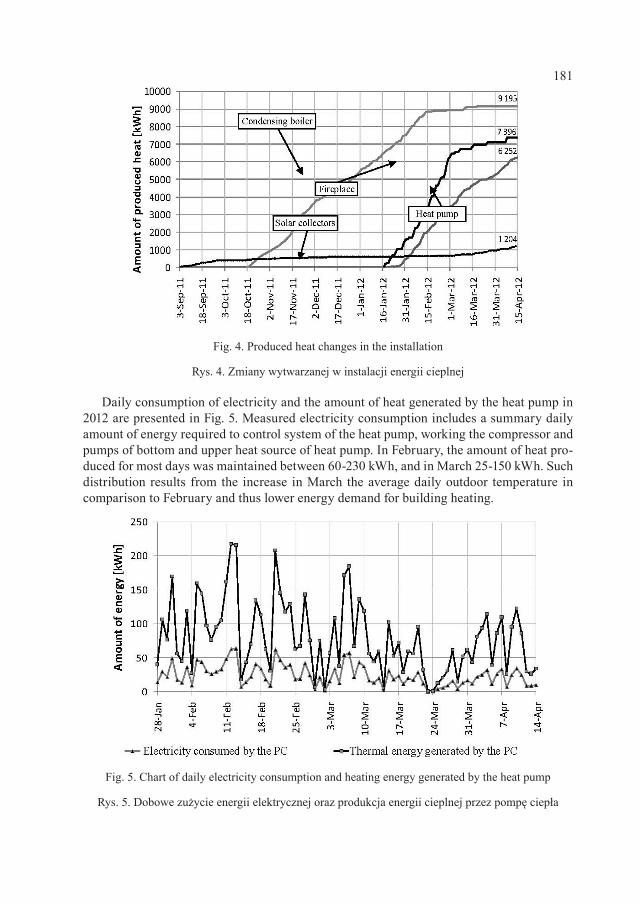
181
Daily consumption of electricity and the amount of heat generated by the heat pump in 2012 are presented in Fig. 5. Measured electricity consumption includes a summary daily amount of energy required to control system of the heat pump, working the compressor and pumps of bottom and upper heat source of heat pump. In February, the amount of heat pro-duced for most days was maintained between 60-230 kWh, and in March 25-150 kWh. Such distribution results from the increase in March the average daily outdoor temperature in comparison to February and thus lower energy demand for building heating.
Fig. 4. Produced heat changes in the installation
Rys. 4. Zmiany wytwarzanej w instalacji energii cieplnej
Fig. 5. Chart of daily electricity consumption and heating energy generated by the heat pump
Rys. 5. Dobowe zużycie energii elektrycznej oraz produkcja energii cieplnej przez pompę ciepła
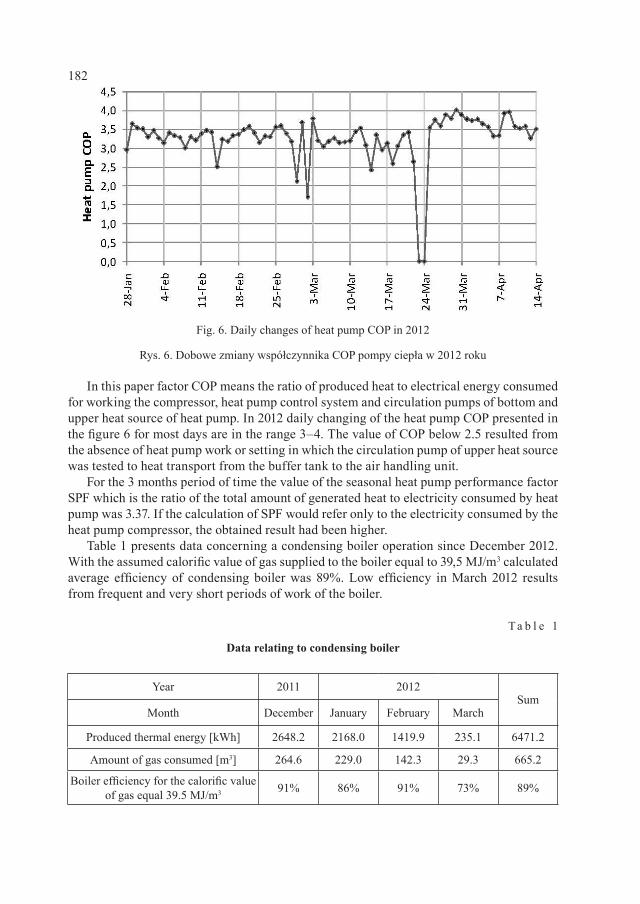
182
In this paper factor COP means the ratio of produced heat to electrical energy consumed for working the compressor, heat pump control system and circulation pumps of bottom and upper heat source of heat pump. In 2012 daily changing of the heat pump COP presented in the figure 6 for most days are in the range 3–4. The value of COP below 2.5 resulted from the absence of heat pump work or setting in which the circulation pump of upper heat source was tested to heat transport from the buffer tank to the air handling unit.
For the 3 months period of time the value of the seasonal heat pump performance factor SPF which is the ratio of the total amount of generated heat to electricity consumed by heat pump was 3.37. If the calculation of SPF would refer only to the electricity consumed by the heat pump compressor, the obtained result had been higher.
Table 1 presents data concerning a condensing boiler operation since December 2012. With the assumed calorific value of gas supplied to the boiler equal to 39,5 MJ/m3 calculated average efficiency of condensing boiler was 89%. Low efficiency in March 2012 results from frequent and very short periods of work of the boiler.
T a b l e 1
Data relating to condensing boiler
Year 2011 2012Sum
Month December January February March
Produced thermal energy [kWh] 2648.2 2168.0 1419.9 235.1 6471.2
Amount of gas consumed [m3] 264.6 229.0 142.3 29.3 665.2
Boiler efficiency for the calorific value of gas equal 39.5 MJ/m3 91% 86% 91% 73% 89%
Fig. 6. Daily changes of heat pump COP in 2012
Rys. 6. Dobowe zmiany współczynnika COP pompy ciepła w 2012 roku
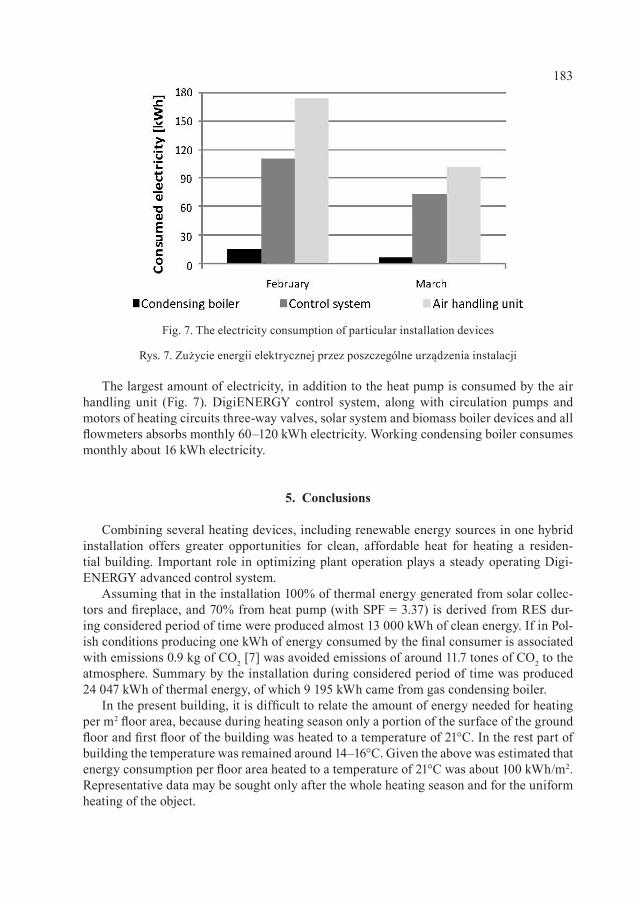
183
The largest amount of electricity, in addition to the heat pump is consumed by the air handling unit (Fig. 7). DigiENERGY control system, along with circulation pumps and motors of heating circuits three-way valves, solar system and biomass boiler devices and all flowmeters absorbs monthly 60–120 kWh electricity. Working condensing boiler consumes monthly about 16 kWh electricity.
5. Conclusions
Combining several heating devices, including renewable energy sources in one hybrid installation offers greater opportunities for clean, affordable heat for heating a residen-tial building. Important role in optimizing plant operation plays a steady operating Digi-ENERGY advanced control system.
Assuming that in the installation 100% of thermal energy generated from solar collec-tors and fireplace, and 70% from heat pump (with SPF = 3.37) is derived from RES dur-ing considered period of time were produced almost 13 000 kWh of clean energy. If in Pol-ish conditions producing one kWh of energy consumed by the final consumer is associated with emissions 0.9 kg of CO2 [7] was avoided emissions of around 11.7 tones of CO2 to the atmosphere. Summary by the installation during considered period of time was produced 24 047 kWh of thermal energy, of which 9 195 kWh came from gas condensing boiler.
In the present building, it is difficult to relate the amount of energy needed for heating per m2 floor area, because during heating season only a portion of the surface of the ground floor and first floor of the building was heated to a temperature of 21°C. In the rest part of building the temperature was remained around 14–16°C. Given the above was estimated that energy consumption per floor area heated to a temperature of 21°C was about 100 kWh/m2. Representative data may be sought only after the whole heating season and for the uniform heating of the object.
Fig. 7. The electricity consumption of particular installation devices
Rys. 7. Zużycie energii elektrycznej przez poszczególne urządzenia instalacji
184
S y m b o l s
COP – coefficient of performanceDHW – domestic hot waterSPF – seasonal performance factorRES – renewable energy sources
R e f e r e n c e s
[1] Knapczyk P. , Neupauer K. , Turoń M., GLOBEnergia, 6, 2011, 26-29.[2] Zimny J . , Odnawialne źródła energii w budownictwie niskoenergetycznym,
Wydawnictwa Naukowo-Techniczne, Kraków-Warszawa 2010.[3] Stojanović B. , Akander J . , Applied Thermal Engineering, 30, 2010, 188-195.[4] Tri l la t -Berdal V. , Souyri B. , Fraisse G. , Energy and Buildings, 38, 2006, 1477-
-1484.[5] Chasapis D. e t a l . , Renewable Energy, 33, 2008, 1759-1767.[6] Neupauer K. , Głuszek A. , Magiera J . , Inżynieria i Aparatura Chemiczna, 3,
2010, 87-88.[7] Winkler T. , Czysta Energia, 7-8, 2010, 12-13.
NIKLAS PAUL, MATTHIAS KRAUME*1
INFLUENCE OF NON-IONIC SURFACTANTS ON LIQUID-LIQUID MASS TRANSFER
OF SINGLE DROPLETS
WPŁYW NIEJONOWYCH ŚRODKÓW POWIERZCHNIOWO CZYNNYCH NA MASOWE PRZENOSZENIE
POJEDYNCZYCH KROPELEK MIĘDZY PŁYNAMI
A b s t r a c t
One of the main goals of “green chemistry” is: using water as a solvent. Many substances are hardly so-luble in water; hence multiphase reactions will not proceed, for instance. By using surfactants the water solubility of such substances can be increased which ends up in an increase of the reaction rate. Due to their amphiphilic structure surfactants adsorb at interfaces. This is the place where the important trans-port processes occur. Therefore, an interference of the mass transport by the surfactants is obvious. In previous works a reduction of the mass transfer in the presence of surfactants was observed. Also, in this work the experimental results show a decrease of the mass the transfer, but describing this reduction of the mass transfer with the known phenomena from literature is not enough. Additionally, the phase be-haviour has to be taken in account.
Keywords: surfactants, fluid dynamics mass transfer, micellar liquid-lquid systems
S t r e s z c z e n i e
Jednym z podstawowych celów “chemii proekologicznej” jest stosowanie wody w roli rozpuszczalnika. Wielu substancji praktycznie nie da się rozpuścić w wodzie, przez co niemożliwe stają się np. reakcje wielofazowe. Stosowanie środków powierzchniowo czynnych może zwiększyć rozpuszczalność takich substancji w wodzie, a w rezultacie przyspieszyć tempo reakcji. Ze względu na swą tolerancyjną struk-turę środki powierzchniowo czynne adsorbują na granicy faz. Jest to miejsce, w którym występują istot-ne procesy przenoszenia, co wyjaśnia interferencję przenoszenia masy za pomocą środków powierzch-niowo czynnych. We wcześniejszych pracach zaobserwowano redukcję przenoszenia masy w obecności środków powierzchniowo czynnych. Wyniki eksperymentów zaprezentowanych w niniejszym artyku-le wykazują spadek przenoszenia masy. Nie wystarczy jednak opisać go, wykorzystując zjawiska znane z literatury – należy też wziąć pod uwagę zachowania fazowe.Słowa kluczowe: środki powierzchniowo czynne, masowe przenoszenie dynamiki płynu, systemy micelarne między płynami
* Eng. Niklas Paul, Prof. PhD. Eng. Matthias Kraume, Chair of Chemical and Process Engineering, TU Berlin.
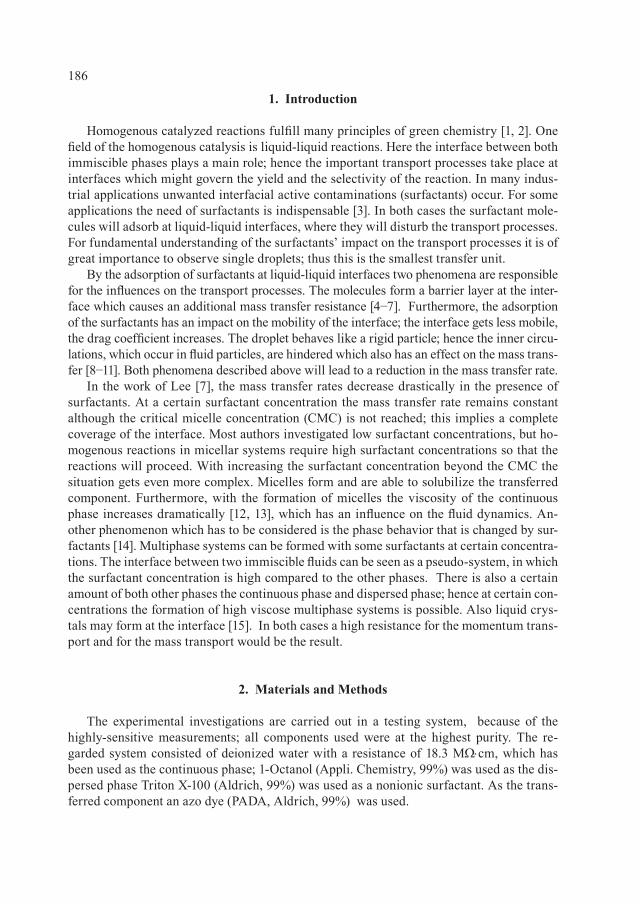
186
1. Introduction
Homogenous catalyzed reactions fulfill many principles of green chemistry [1, 2]. One field of the homogenous catalysis is liquid-liquid reactions. Here the interface between both immiscible phases plays a main role; hence the important transport processes take place at interfaces which might govern the yield and the selectivity of the reaction. In many indus-trial applications unwanted interfacial active contaminations (surfactants) occur. For some applications the need of surfactants is indispensable [3]. In both cases the surfactant mole-cules will adsorb at liquid-liquid interfaces, where they will disturb the transport processes. For fundamental understanding of the surfactants’ impact on the transport processes it is of great importance to observe single droplets; thus this is the smallest transfer unit.
By the adsorption of surfactants at liquid-liquid interfaces two phenomena are responsible for the influences on the transport processes. The molecules form a barrier layer at the inter-face which causes an additional mass transfer resistance [4−7]. Furthermore, the adsorption of the surfactants has an impact on the mobility of the interface; the interface gets less mobile, the drag coefficient increases. The droplet behaves like a rigid particle; hence the inner circu-lations, which occur in fluid particles, are hindered which also has an effect on the mass trans-fer [8−11]. Both phenomena described above will lead to a reduction in the mass transfer rate.
In the work of Lee [7], the mass transfer rates decrease drastically in the presence of surfactants. At a certain surfactant concentration the mass transfer rate remains constant although the critical micelle concentration (CMC) is not reached; this implies a complete coverage of the interface. Most authors investigated low surfactant concentrations, but ho-mogenous reactions in micellar systems require high surfactant concentrations so that the reactions will proceed. With increasing the surfactant concentration beyond the CMC the situation gets even more complex. Micelles form and are able to solubilize the transferred component. Furthermore, with the formation of micelles the viscosity of the continuous phase increases dramatically [12, 13], which has an influence on the fluid dynamics. An-other phenomenon which has to be considered is the phase behavior that is changed by sur-factants [14]. Multiphase systems can be formed with some surfactants at certain concentra-tions. The interface between two immiscible fluids can be seen as a pseudo-system, in which the surfactant concentration is high compared to the other phases. There is also a certain amount of both other phases the continuous phase and dispersed phase; hence at certain con-centrations the formation of high viscose multiphase systems is possible. Also liquid crys-tals may form at the interface [15]. In both cases a high resistance for the momentum trans-port and for the mass transport would be the result.
2. Materials and Methods
The experimental investigations are carried out in a testing system, because of the highly-sensitive measurements; all components used were at the highest purity. The re-garded system consisted of deionized water with a resistance of 18.3 MΩ⋅cm, which has been used as the continuous phase; 1-Octanol (Appli. Chemistry, 99%) was used as the dis-persed phase Triton X-100 (Aldrich, 99%) was used as a nonionic surfactant. As the trans-ferred component an azo dye (PADA, Aldrich, 99%) was used.
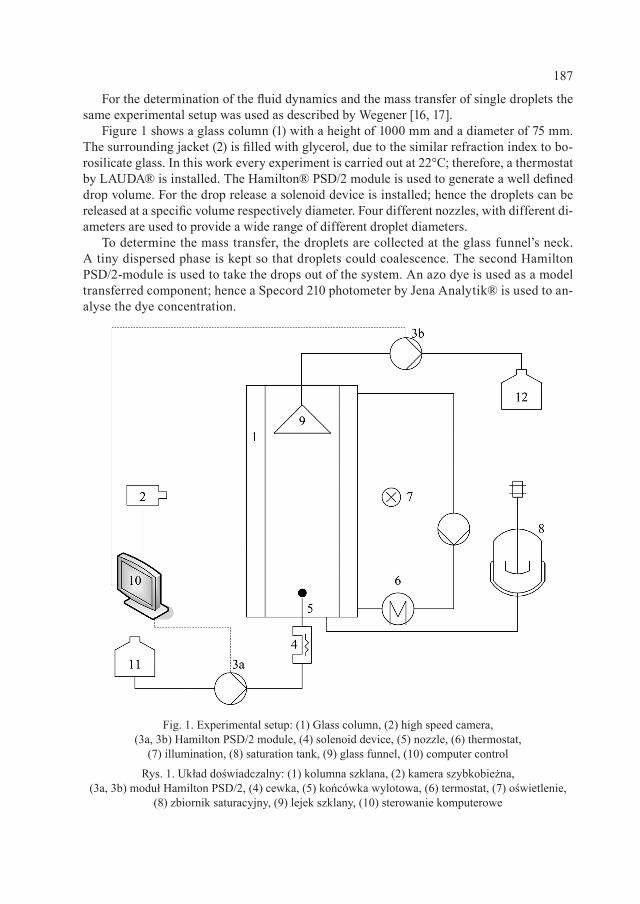
187
For the determination of the fluid dynamics and the mass transfer of single droplets the same experimental setup was used as described by Wegener [16, 17].
Figure 1 shows a glass column (1) with a height of 1000 mm and a diameter of 75 mm. The surrounding jacket (2) is filled with glycerol, due to the similar refraction index to bo-rosilicate glass. In this work every experiment is carried out at 22°C; therefore, a thermostat by LAUDA® is installed. The Hamilton® PSD/2 module is used to generate a well defined drop volume. For the drop release a solenoid device is installed; hence the droplets can be released at a specific volume respectively diameter. Four different nozzles, with different di-ameters are used to provide a wide range of different droplet diameters.
To determine the mass transfer, the droplets are collected at the glass funnel’s neck. A tiny dispersed phase is kept so that droplets could coalescence. The second Hamilton PSD/2-module is used to take the drops out of the system. An azo dye is used as a model transferred component; hence a Specord 210 photometer by Jena Analytik® is used to an-alyse the dye concentration.
Fig. 1. Experimental setup: (1) Glass column, (2) high speed camera, (3a, 3b) Hamilton PSD/2 module, (4) solenoid device, (5) nozzle, (6) thermostat,
(7) illumination, (8) saturation tank, (9) glass funnel, (10) computer control
Rys. 1. Układ doświadczalny: (1) kolumna szklana, (2) kamera szybkobieżna, (3a, 3b) moduł Hamilton PSD/2, (4) cewka, (5) końcówka wylotowa, (6) termostat, (7) oświetlenie,
(8) zbiornik saturacyjny, (9) lejek szklany, (10) sterowanie komputerowe
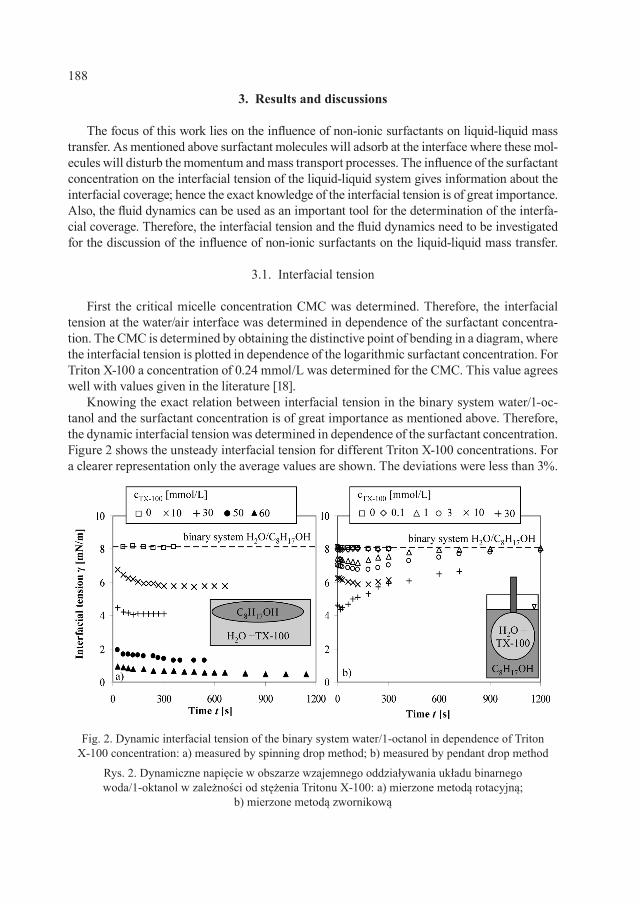
188
3. Results and discussions
The focus of this work lies on the influence of non-ionic surfactants on liquid-liquid mass transfer. As mentioned above surfactant molecules will adsorb at the interface where these mol-ecules will disturb the momentum and mass transport processes. The influence of the surfactant concentration on the interfacial tension of the liquid-liquid system gives information about the interfacial coverage; hence the exact knowledge of the interfacial tension is of great importance. Also, the fluid dynamics can be used as an important tool for the determination of the interfa-cial coverage. Therefore, the interfacial tension and the fluid dynamics need to be investigated for the discussion of the influence of non-ionic surfactants on the liquid-liquid mass transfer.
3.1. Interfacial tension
First the critical micelle concentration CMC was determined. Therefore, the interfacial tension at the water/air interface was determined in dependence of the surfactant concentra-tion. The CMC is determined by obtaining the distinctive point of bending in a diagram, where the interfacial tension is plotted in dependence of the logarithmic surfactant concentration. For Triton X-100 a concentration of 0.24 mmol/L was determined for the CMC. This value agrees well with values given in the literature [18].
Knowing the exact relation between interfacial tension in the binary system water/1-oc-tanol and the surfactant concentration is of great importance as mentioned above. Therefore, the dynamic interfacial tension was determined in dependence of the surfactant concentration. Figure 2 shows the unsteady interfacial tension for different Triton X-100 concentrations. For a clearer representation only the average values are shown. The deviations were less than 3%.
Fig. 2. Dynamic interfacial tension of the binary system water/1-octanol in dependence of Triton X-100 concentration: a) measured by spinning drop method; b) measured by pendant drop method
Rys. 2. Dynamiczne napięcie w obszarze wzajemnego oddziaływania układu binarnego woda/1-oktanol w zależności od stężenia Tritonu X-100: a) mierzone metodą rotacyjną;
b) mierzone metodą zwornikową
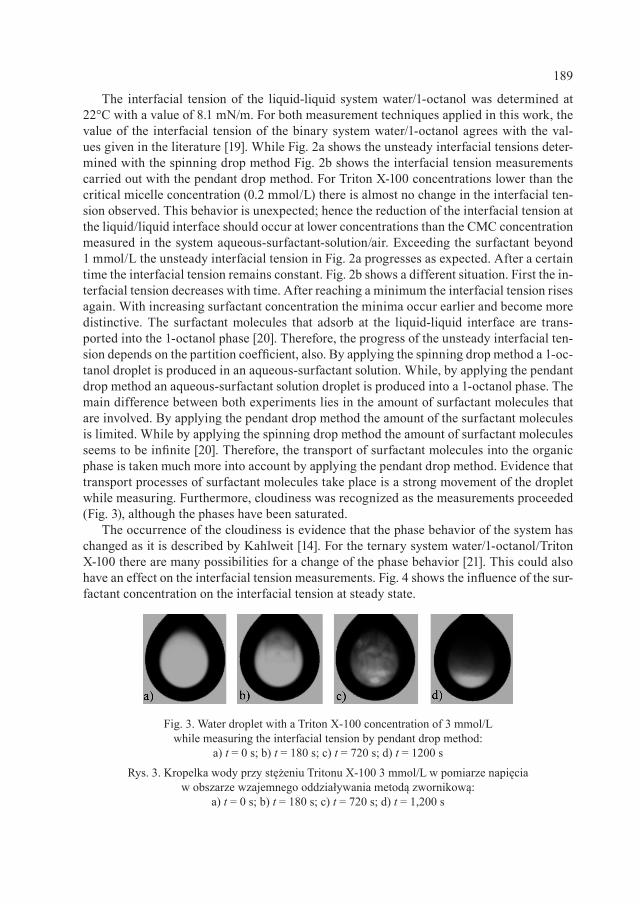
189
The interfacial tension of the liquid-liquid system water/1-octanol was determined at 22°C with a value of 8.1 mN/m. For both measurement techniques applied in this work, the value of the interfacial tension of the binary system water/1-octanol agrees with the val-ues given in the literature [19]. While Fig. 2a shows the unsteady interfacial tensions deter-mined with the spinning drop method Fig. 2b shows the interfacial tension measurements carried out with the pendant drop method. For Triton X-100 concentrations lower than the critical micelle concentration (0.2 mmol/L) there is almost no change in the interfacial ten-sion observed. This behavior is unexpected; hence the reduction of the interfacial tension at the liquid/liquid interface should occur at lower concentrations than the CMC concentration measured in the system aqueous-surfactant-solution/air. Exceeding the surfactant beyond 1 mmol/L the unsteady interfacial tension in Fig. 2a progresses as expected. After a certain time the interfacial tension remains constant. Fig. 2b shows a different situation. First the in-terfacial tension decreases with time. After reaching a minimum the interfacial tension rises again. With increasing surfactant concentration the minima occur earlier and become more distinctive. The surfactant molecules that adsorb at the liquid-liquid interface are trans-ported into the 1-octanol phase [20]. Therefore, the progress of the unsteady interfacial ten-sion depends on the partition coefficient, also. By applying the spinning drop method a 1-oc-tanol droplet is produced in an aqueous-surfactant solution. While, by applying the pendant drop method an aqueous-surfactant solution droplet is produced into a 1-octanol phase. The main difference between both experiments lies in the amount of surfactant molecules that are involved. By applying the pendant drop method the amount of the surfactant molecules is limited. While by applying the spinning drop method the amount of surfactant molecules seems to be infinite [20]. Therefore, the transport of surfactant molecules into the organic phase is taken much more into account by applying the pendant drop method. Evidence that transport processes of surfactant molecules take place is a strong movement of the droplet while measuring. Furthermore, cloudiness was recognized as the measurements proceeded (Fig. 3), although the phases have been saturated.
The occurrence of the cloudiness is evidence that the phase behavior of the system has changed as it is described by Kahlweit [14]. For the ternary system water/1-octanol/Triton X-100 there are many possibilities for a change of the phase behavior [21]. This could also have an effect on the interfacial tension measurements. Fig. 4 shows the influence of the sur-factant concentration on the interfacial tension at steady state.
Fig. 3. Water droplet with a Triton X-100 concentration of 3 mmol/L while measuring the interfacial tension by pendant drop method:
a) t = 0 s; b) t = 180 s; c) t = 720 s; d) t = 1200 s
Rys. 3. Kropelka wody przy stężeniu Tritonu X-100 3 mmol/L w pomiarze napięcia w obszarze wzajemnego oddziaływania metodą zwornikową:
a) t = 0 s; b) t = 180 s; c) t = 720 s; d) t = 1,200 s
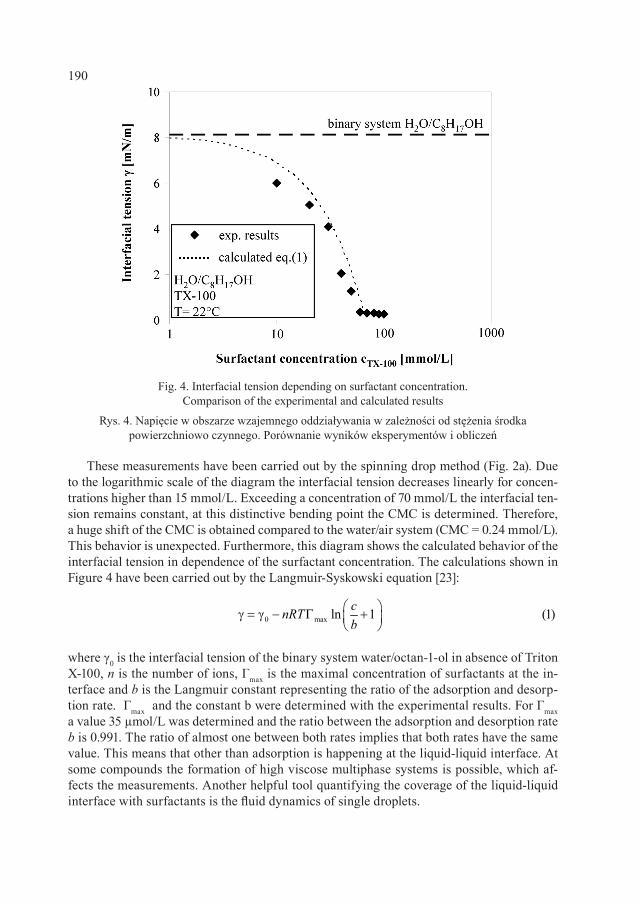
190
These measurements have been carried out by the spinning drop method (Fig. 2a). Due to the logarithmic scale of the diagram the interfacial tension decreases linearly for concen-trations higher than 15 mmol/L. Exceeding a concentration of 70 mmol/L the interfacial ten-sion remains constant, at this distinctive bending point the CMC is determined. Therefore, a huge shift of the CMC is obtained compared to the water/air system (CMC = 0.24 mmol/L). This behavior is unexpected. Furthermore, this diagram shows the calculated behavior of the interfacial tension in dependence of the surfactant concentration. The calculations shown in Figure 4 have been carried out by the Langmuir-Syskowski equation [23]:
where γ0 is the interfacial tension of the binary system water/octan-1-ol in absence of Triton X-100, n is the number of ions, Γmax is the maximal concentration of surfactants at the in-terface and b is the Langmuir constant representing the ratio of the adsorption and desorp-tion rate. Γmax and the constant b were determined with the experimental results. For Γmax a value 35 µmol/L was determined and the ratio between the adsorption and desorption rate b is 0.991. The ratio of almost one between both rates implies that both rates have the same value. This means that other than adsorption is happening at the liquid-liquid interface. At some compounds the formation of high viscose multiphase systems is possible, which af-fects the measurements. Another helpful tool quantifying the coverage of the liquid-liquid interface with surfactants is the fluid dynamics of single droplets.
Fig. 4. Interfacial tension depending on surfactant concentration. Comparison of the experimental and calculated results
Rys. 4. Napięcie w obszarze wzajemnego oddziaływania w zależności od stężenia środka powierzchniowo czynnego. Porównanie wyników eksperymentów i obliczeń
0 max ln 1 (1) γ = γ − Γ +
cnRTb
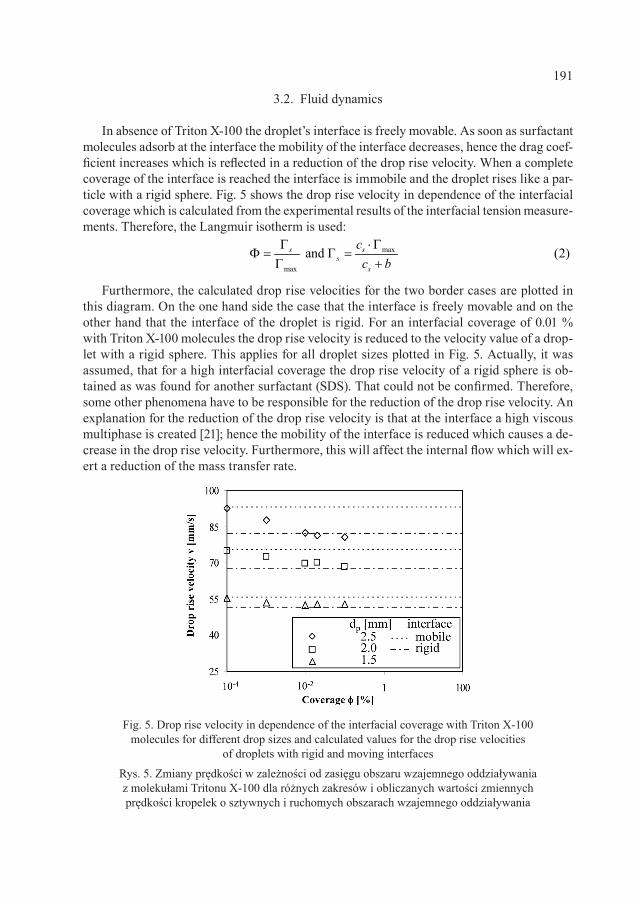
191
3.2. Fluid dynamics
In absence of Triton X-100 the droplet’s interface is freely movable. As soon as surfactant molecules adsorb at the interface the mobility of the interface decreases, hence the drag coef-ficient increases which is reflected in a reduction of the drop rise velocity. When a complete coverage of the interface is reached the interface is immobile and the droplet rises like a par-ticle with a rigid sphere. Fig. 5 shows the drop rise velocity in dependence of the interfacial coverage which is calculated from the experimental results of the interfacial tension measure-ments. Therefore, the Langmuir isotherm is used:
Furthermore, the calculated drop rise velocities for the two border cases are plotted in this diagram. On the one hand side the case that the interface is freely movable and on the other hand that the interface of the droplet is rigid. For an interfacial coverage of 0.01 % with Triton X-100 molecules the drop rise velocity is reduced to the velocity value of a drop-let with a rigid sphere. This applies for all droplet sizes plotted in Fig. 5. Actually, it was assumed, that for a high interfacial coverage the drop rise velocity of a rigid sphere is ob-tained as was found for another surfactant (SDS). That could not be confirmed. Therefore, some other phenomena have to be responsible for the reduction of the drop rise velocity. An explanation for the reduction of the drop rise velocity is that at the interface a high viscous multiphase is created [21]; hence the mobility of the interface is reduced which causes a de-crease in the drop rise velocity. Furthermore, this will affect the internal flow which will ex-ert a reduction of the mass transfer rate.
Fig. 5. Drop rise velocity in dependence of the interfacial coverage with Triton X-100 molecules for different drop sizes and calculated values for the drop rise velocities
of droplets with rigid and moving interfaces
Rys. 5. Zmiany prędkości w zależności od zasięgu obszaru wzajemnego oddziaływania z molekułami Tritonu X-100 dla różnych zakresów i obliczanych wartości zmiennych prędkości kropelek o sztywnych i ruchomych obszarach wzajemnego oddziaływania
max
max
and (2)s ss
s
cc b
Γ ⋅ΓΦ = Γ =
Γ +
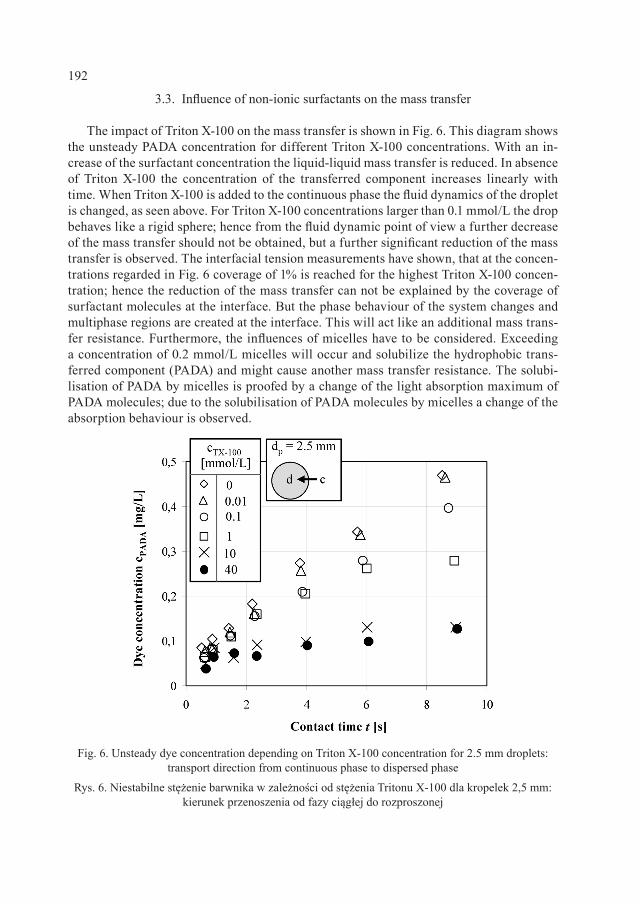
192
3.3. Influence of non-ionic surfactants on the mass transfer
The impact of Triton X-100 on the mass transfer is shown in Fig. 6. This diagram shows the unsteady PADA concentration for different Triton X-100 concentrations. With an in-crease of the surfactant concentration the liquid-liquid mass transfer is reduced. In absence of Triton X-100 the concentration of the transferred component increases linearly with time. When Triton X-100 is added to the continuous phase the fluid dynamics of the droplet is changed, as seen above. For Triton X-100 concentrations larger than 0.1 mmol/L the drop behaves like a rigid sphere; hence from the fluid dynamic point of view a further decrease of the mass transfer should not be obtained, but a further significant reduction of the mass transfer is observed. The interfacial tension measurements have shown, that at the concen-trations regarded in Fig. 6 coverage of 1% is reached for the highest Triton X-100 concen-tration; hence the reduction of the mass transfer can not be explained by the coverage of surfactant molecules at the interface. But the phase behaviour of the system changes and multiphase regions are created at the interface. This will act like an additional mass trans-fer resistance. Furthermore, the influences of micelles have to be considered. Exceeding a concentration of 0.2 mmol/L micelles will occur and solubilize the hydrophobic trans-ferred component (PADA) and might cause another mass transfer resistance. The solubi-lisation of PADA by micelles is proofed by a change of the light absorption maximum of PADA molecules; due to the solubilisation of PADA molecules by micelles a change of the absorption behaviour is observed.
Fig. 6. Unsteady dye concentration depending on Triton X-100 concentration for 2.5 mm droplets: transport direction from continuous phase to dispersed phase
Rys. 6. Niestabilne stężenie barwnika w zależności od stężenia Tritonu X-100 dla kropelek 2,5 mm: kierunek przenoszenia od fazy ciągłej do rozproszonej
193
4. Summary and conclusion
The goal of this work was identifying the influences of non-ionic surfactants on the liquid-liquid mass transfer of single droplets. There are many influences exerted by sur-factants which have to be regarded. By adsorbing at the interface surfactants reduce the interfacial tension. Furthermore, these molecules increase the stiffness of the interface which decreases the drop rise velocity. Besides the adsorption of surfactants at the inter-face another transport resistance was identified. There were compositions reached at the interface that form a high viscose multiphase interface. These conditions change the fluid dynamics drastically and create an additional mass transfer resistance, which leads to a reduction of liquid-liquid mass transfer.
S y m b o l s
c – concentration [mol/L] or [mg/L]d – diameter [mm]ID – inner diameter [mm]n – number of ions [–]N – NozzleOD – outer diameter [mm]R – Gas constantt – time [s]T – temperature [°C]V – drop rise velocity [mm/s]γ – interfacial tension [mN/m]Φ – coverage at the interface [%]ρ – densityζ – drag coefficient0 – no surfactants – surfactantcs – surfactant concetrationMax – maximalp – particle
R e f e r e n c e s
[1] Anastas P. , Warner J . , Green Chemistry: Theory and Practice, Oxford University Press, New York 1998.
[2] Rothenberg G. ,The best of both worlds, Nature Chem., 2, 2010, 9-10.[3] Oehme G. e t a l ., Reaktionen in mizellaren Sytsemen, Angewandte Chemie, 117,
2005, 7338– 7364 (in German).[4] West F.B. et Addition Agents and Interfacial Barriers in Liquid-Liquid Extraction,
Ind. Eng. Chem., 44, 1952, 625.
194
[5] Lindland K.P. , Ter jesen S.G. , The Effect of a Surface-Active Agent on Mass Trans-fer in Falling Drop, Chem. Eng. Sci., 5, 1956, 1-12.
[6] Chen L.H. , Lee Y.-L. , Adsorption Behavior of Surfactants and Mass Transfer in Single-Drop Extraction, AIChE J., 46, 2000, 160-168.
[7] Lee Y.-L. , Surfactants on Mass Transfer During Drop-Formation and Drop Falling Stages, AIChE J., 49, 2003, 1859-1869.
[8] Gibbons J .H. , Houghton G. , Coul l J . , Effect of a Surface Active Agent on the Ve-locity of Rise of Benzene Drops in Water, AIChE J., 8, 1962, 274–276.
[9] Griff i th R.M., The effect of surfactants on the terminal velocity of drops and Bubbles, Chem. Eng. Sci., 17, 1962, 1057–1070.
[10] Beitel A. , Heideger W.J . , Surfactant effects on mass transfer from drops subject to interfacial instability, Chem. Eng. Sci., 26, 1971, 711–717.
[11] Wegener M., Paschedag A.R. , The effect of soluble anionic surfactants on rise ve-locity and Mass Transfer at Single Droplets in Systems with Marangoni instabilities, In-ternational Journal of Heat and Mass Transfer, 55, 2012, 1561-1573.
[12] Kern F. et al, Dynamical Properties of Salt-Free Viscoelastic Micellar solutions, Lang-muir, 10, 1994, 1714-1723.
[13] Pictuel l L. , Ergermayer M., Sjöström J . , Rheology of Mixed Solutions of an As-sociating Polymer with a Surfactant. Why Are Different Surfactants Different?, Lang-muir, 19, 2003, 3643-3649.
[14] Kahlwei t M., Strey R. , Phasenverhalten ternärer Systeme des Typs H2O-Öl-nichti-onisches Tensid, Angewandte Chemie, 97, 1997, 655-669 (in German).
[15] Horvath-Szabo G. et al, Sandwich Structures at Oil-Water Interfaces under Alkaline Conditions, Jorunal of Colloid and Interface Science, 253, 2002, 427-434.
[16] Wegener M. et al., Transient rise velocity and mass transfer of a single drop with in-terfacial instabilities – experimental investigations, Chem. Eng. Sci., 2007, 2067-2078.
[17] Wegener M., Kraume M., Paschedag A.R. , Terminal and Transient Drop Rise Velocity of Single Toluene Droplets in Water, AIChE J., 56, 2-10.
[18] Saien J . , Asadabadi S. , Adsorption and Interfacial Properties of Individual and Mixtures of Cationic/Nonionic Surfactants in Toluene + Water Chemical Systems, J. Chem. Eng. Data, June 2010, 3817-3824.
[19] Vil lers D. , Plat ten J .K. , Temperature Dependence of the Interfacial Tension be-tween Water and Long-Chain Alcohols, J. Phys. Chem., March 1988, 4023-4024.
[20] Miller R. et al., Messungen der dynamischen Grenzflächenspannung im System wässrige Tensidlösung/ organisches Lösungsmittel, Chemie Ingenieur Technik, 70, 1998, 89-99.
[21] Guo R. et al., The Phase Behaviour and the Structural Properties of Triton X-100/ n-C8H17OH/PEG1000aq Systems, Journal of Dispersion Science and Technology, 22, 2001, 443-451.
[22] Atkins P. W., de Paula J . , Physical Chemistry, Oxford University Press, New York 2006.
[23] Schwurger M., Findenegg G. et al: Lehrbuch der Grenzflächenchemie, Georg Thieme Verlag, Stuttgart 1996 (in German).
FRANTIŠEK RIEGER, TOMÁŠ JIROUT, DORIN CERES*1
SCALE-UP OF MIXING EQUIPMENT FOR SUSPENSIONS
POWIĘKSZANIE MIESZALNIKÓW ZAWIESIN
A b s t r a c t
The most of mixing experiments are carried out in laboratory scale with geometrically similar models. To be able to use the results for design of industrial mixing equipment, knowledge of scale-up rules is necessa-ry. Therefore, this contribution is aiming to experimentally verify scale-up rules. The visual method of de-termination of just suspended impeller speed was used in order to determinate suspension measurements. This method is generally defined as the state at which no particle remains in contact with the vessel bottom for longer than a certain time (approximatelly 1 s). Glass particles with four equivalent diameters dp in ran-ge 0.16 and 1.19 mm and volumetric concentration c from 2.5% to 20% were used as solid phase.Keywords: mixing of suspensions, scale-up rules, industrial mixing equipment, power consumption, impeller speed
S t r e s z c z e n i e
Większość eksperymentów związanych z mieszaniem przeprowadza się w skali laboratoryjnej na modelach podobnych pod względem geometrycznym. Aby ich wyniki mogły być wykorzystywane do projektowania mieszalników przemysłowych, niezbędna jest znajomość zasad powiększania. Dlatego właśnie celem niniejszego artykułu jest weryfikacja tychże drogą eksperymentów. W celu dokonania pomiarów zawiesin zastosowano wizualną metodę określania szybkości wirnika napędzanego. Ogólnie rzecz biorąc, chodzi o stan, w którym żadna cząsteczka nie pozostaje w kontakcie z dnem naczynia dłużej niż przez określony czas (ok. 1 sek.). W fazie stałej wykorzystano cząsteczki szkła o czterech równoważnych średnicach dp w przedziale 0,16–1,19 mm oraz stężenie objętościowe c w przedziale 2,5%–20%.Słowa kluczowe: mieszanie zawiesin, zasady powiększania, mieszalnik przemysłowy, zużycie energii, szybkość wirnika napędzanego
* PhD. Eng. Professor František Rieger, PhD. Eng. Associate Professor Tomaš Jirout, PhD. Eng. Dorin Ceres, Department of Process Engineering, Faculty of Mechanical Engineering, Czech Technical University in Prague.
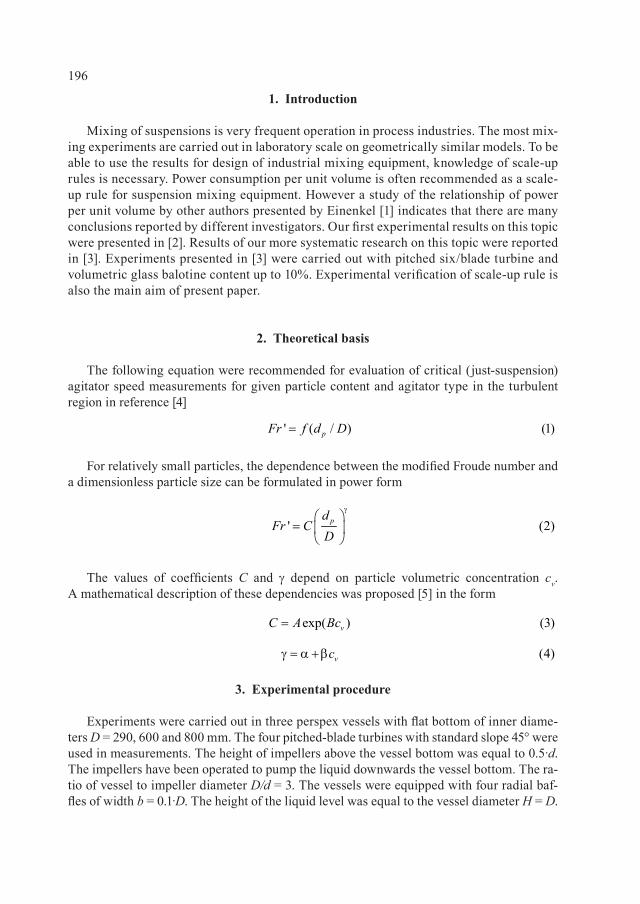
196
1. Introduction
Mixing of suspensions is very frequent operation in process industries. The most mix-ing experiments are carried out in laboratory scale on geometrically similar models. To be able to use the results for design of industrial mixing equipment, knowledge of scale-up rules is necessary. Power consumption per unit volume is often recommended as a scale-up rule for suspension mixing equipment. However a study of the relationship of power per unit volume by other authors presented by Einenkel [1] indicates that there are many conclusions reported by different investigators. Our first experimental results on this topic were presented in [2]. Results of our more systematic research on this topic were reported in [3]. Experiments presented in [3] were carried out with pitched six/blade turbine and volumetric glass balotine content up to 10%. Experimental verification of scale-up rule is also the main aim of present paper.
2. Theoretical basis
The following equation were recommended for evaluation of critical (just-suspension) agitator speed measurements for given particle content and agitator type in the turbulent region in reference [4]
For relatively small particles, the dependence between the modified Froude number and a dimensionless particle size can be formulated in power form
The values of coefficients C and γ depend on particle volumetric concentration cv. A mathematical description of these dependencies was proposed [5] in the form
3. Experimental procedure
Experiments were carried out in three perspex vessels with flat bottom of inner diame-ters D = 290, 600 and 800 mm. The four pitched-blade turbines with standard slope 45° were used in measurements. The height of impellers above the vessel bottom was equal to 0.5·d. The impellers have been operated to pump the liquid downwards the vessel bottom. The ra-tio of vessel to impeller diameter D/d = 3. The vessels were equipped with four radial baf-fles of width b = 0.1·D. The height of the liquid level was equal to the vessel diameter H = D.
' ( / ) (1)pFr f d D=
' (2)pdFr C
D
γ
=
exp( ) (3)vC A Bc=
(4)vcγ = α +b
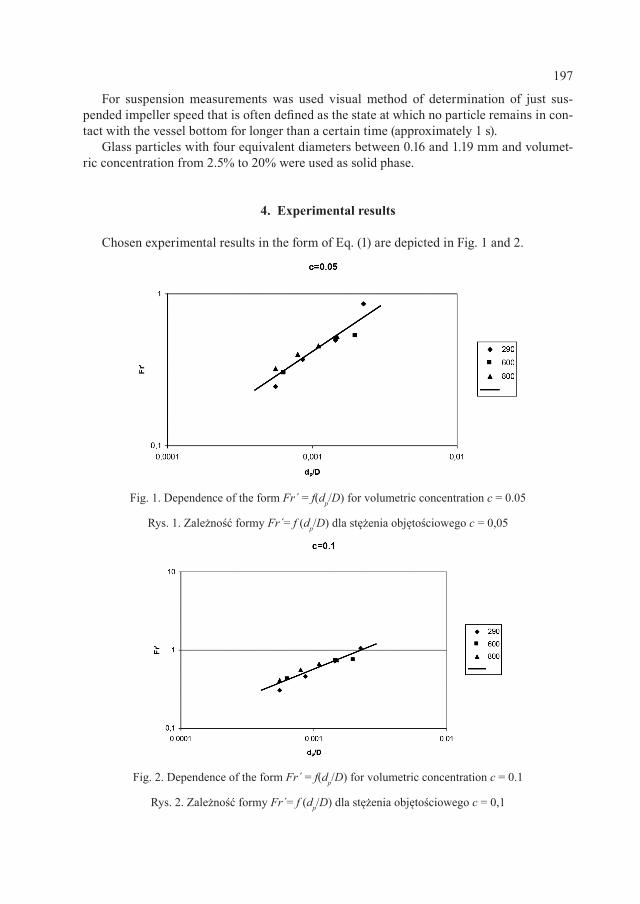
197
For suspension measurements was used visual method of determination of just sus-pended impeller speed that is often defined as the state at which no particle remains in con-tact with the vessel bottom for longer than a certain time (approximately 1 s).
Glass particles with four equivalent diameters between 0.16 and 1.19 mm and volumet-ric concentration from 2.5% to 20% were used as solid phase.
4. Experimental results
Chosen experimental results in the form of Eq. (1) are depicted in Fig. 1 and 2.
Fig. 2. Dependence of the form Fr´ = f(dp/D) for volumetric concentration c = 0.1
Rys. 2. Zależność formy Fr´= f (dp/D) dla stężenia objętościowego c = 0,1
Fig. 1. Dependence of the form Fr´ = f(dp/D) for volumetric concentration c = 0.05
Rys. 1. Zależność formy Fr´= f (dp/D) dla stężenia objętościowego c = 0,05
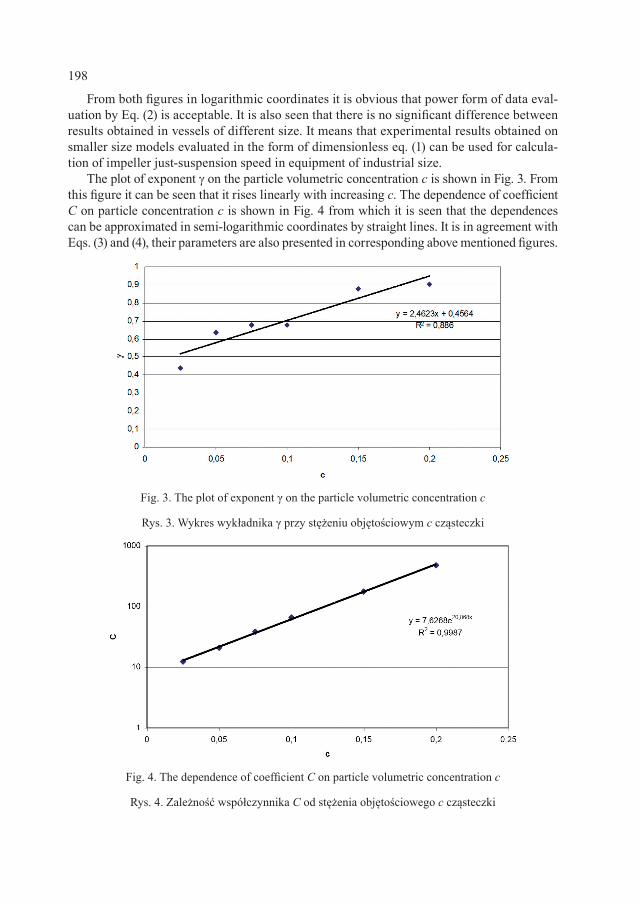
198
From both figures in logarithmic coordinates it is obvious that power form of data eval-uation by Eq. (2) is acceptable. It is also seen that there is no significant difference between results obtained in vessels of different size. It means that experimental results obtained on smaller size models evaluated in the form of dimensionless eq. (1) can be used for calcula-tion of impeller just-suspension speed in equipment of industrial size.
The plot of exponent γ on the particle volumetric concentration c is shown in Fig. 3. From this figure it can be seen that it rises linearly with increasing c. The dependence of coefficient C on particle concentration c is shown in Fig. 4 from which it is seen that the dependences can be approximated in semi-logarithmic coordinates by straight lines. It is in agreement with Eqs. (3) and (4), their parameters are also presented in corresponding above mentioned figures.
Fig. 3. The plot of exponent γ on the particle volumetric concentration c
Rys. 3. Wykres wykładnika γ przy stężeniu objętościowym c cząsteczki
Fig. 4. The dependence of coefficient C on particle volumetric concentration c
Rys. 4. Zależność współczynnika C od stężenia objętościowego c cząsteczki
199
5. Conclusions
From the results presented it follows that just-suspension speed calculation of industrial agitator from dimensionless dependence of modified Froude number Fr on relative parti-cle size dp/D and volumetric particle content c measured on geometrically similar model of laboratory scale is acceptable. At geometrical similarity and given suspension we can ex-press the dependence of critical impeller speed on equipment size in the form n~Dκ. From Eq. (2) it follows that
From the above equation and equation presented in Fig. 3 it follows that exponent κ changes in the range from -0.73 to -0.97 when particle content c changes from 0 to 20%. It means that critical agitator speed decreases with increasing equipment s ize. For mixing equipment for suspensions the scale-up based on constant specific power consumption is frequently recommended, it corresponds to exponent κ = -2/3. From the range of exponent κ presented above it follows that scale-up on the basis constant specific power consumption is on the safe side. On the other hand scale-up on the basis of constant impeller tip speed that corresponds to κ = -1 can be recommended for highly concentrated suspensions only.
S y m b o l s
A, B – constants in Eq. (3) c – volumetric concentration of particles [1]C – coefficient in Eq. (2) d – agitator diameter [mm]dp – particle diameter [mm]D – vessel diameter [mm]
Fr – modified Froude number, [1]
g – gravity acceleration [m/s2]n – agitator speed [s-1]P – power [W]
Po – power number, [1]
Re – Reynolds number, [1]
α, β – constants in Eq. (4) γ – exponent in Eq. (2) κ – scale-up exponent
1 (5)2+ γ
κ = −
2
' n dFrg
ρ=
∆ρ
3 5
PPon d
=ρ
2
Re nd ρ=
µ
200
μ – viscosity [Pa∙s]ρ – liquid density [kg/m3]Δρ – solid-liquid density difference [kg/m3]
This project was realised with financial support from the Ministry of Industry and Trade of the Czech Republic (project number FR-TI1/005).
R e f e r e n c e s
[1] Einenkel W.D. , Ger. Chem. Eng., 3, 1980, 118.[2] Rieger F. , Sinevič V. , Colect. Czech. Chem. Commun., 95, 1980, 966.[3] J i rout T. , Rieger F. , Conference CHISA, 1997 (in Czech).[4] Rieger F. , Dit l P. , Chem. Eng. Sci., 49, 1994, 2219.[5] Rieger F. , Chem. Eng. J., 79, 2000, 171.
JOZEF SEDLIAK*1
PROPANE AS REAL ALTERNATIVE TO R404A REFRIGERANT IN LIGHT COMMERCIAL
REFRIGERATION
PROPAN JAKO REALNA ALTERNATYWA DLA CZYNNIKA CHŁODNICZEGO R404A W LEKKIM CHŁODZENIU HANDLOWYM
A b s t r a c t
The future and sustainability of refrigeration industry is in high efficiency, low noise and operation with low environmental impact refrigerants. Continuously trend of HCFC and HFC refrigerants phase out ope-ned research of other refrigerants alternatives to fulfill market requirements. Propane as natural refrigerant has high potential to succeed in the field of light commercial refrigeration by replacement of R404A. Ther-modynamic properties of propane allow improving compressor performance comparing with R404A alter-native. The study presented in this paper is focused on the proper design of discharge valve system of R290 compressors which primarily have been designed for R404A operation. The paper shows noise and efficien-cy improvements of light commercial compressor using propane that makes this refrigerant very attractive.Keywords: propane compressor, efficiency, noise
S t r e s z c z e n i e
Zrównoważony rozwój przemysłu chłodniczego w przyszłości oparty jest na takich priorytetach, jak wysoka wydajność, niski poziom hałasu oraz wykorzystywanie czynników chłodniczych o słabym wpływie na środowisko. Popularność czynników chłodniczych HCFC i HFC ogranicza możliwości badań nad innymi alternatywami mogącymi spełnić wymagania rynku. Zastępujący R404A propan jako naturalny czynnik chłodniczy charakteryzuje się dużym potencjałem w zakresie lekkiego chłodzenia handlowego. Termodynamiczne właściwości propanu pozwalają podnosić wydajność sprężarek w porównaniu z R404A. Badania przedstawione w niniejszym artykule koncentrują się na właściwym projektowaniu systemu zaworów odpływowych w sprężarkach R290 opracowywanych w pierwszym rzędzie dla funkcjonowania R404A. W artykule zaprezentowano ulepszenia w zakresie poziomu głośności i wydajności lekkiej sprężarki handlowej wykorzystującej propan, które znacznie zwiększają atrakcyjność tego właśnie czynnika chłodniczego.Słowa kluczowe: sprężarka propanowa, sprawność, hałas
* PhD. Eng. Professor František Rieger, PhD. Eng. Associate Professor Tomaš Jirout, PhD. Eng. Dorin Ceres, Department of Process Engineering, Faculty of Mechanical Engineering, Czech Technical University in Prague.
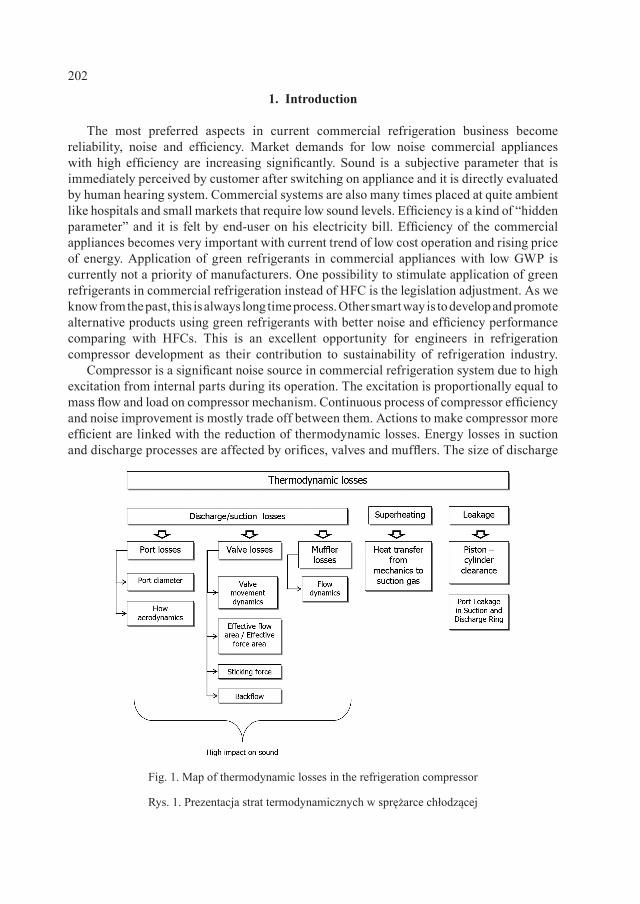
202
1. Introduction
The most preferred aspects in current commercial refrigeration business become reliability, noise and efficiency. Market demands for low noise commercial appliances with high efficiency are increasing significantly. Sound is a subjective parameter that is immediately perceived by customer after switching on appliance and it is directly evaluated by human hearing system. Commercial systems are also many times placed at quite ambient like hospitals and small markets that require low sound levels. Efficiency is a kind of “hidden parameter” and it is felt by end-user on his electricity bill. Efficiency of the commercial appliances becomes very important with current trend of low cost operation and rising price of energy. Application of green refrigerants in commercial appliances with low GWP is currently not a priority of manufacturers. One possibility to stimulate application of green refrigerants in commercial refrigeration instead of HFC is the legislation adjustment. As we know from the past, this is always long time process. Other smart way is to develop and promote alternative products using green refrigerants with better noise and efficiency performance comparing with HFCs. This is an excellent opportunity for engineers in refrigeration compressor development as their contribution to sustainability of refrigeration industry.
Compressor is a significant noise source in commercial refrigeration system due to high excitation from internal parts during its operation. The excitation is proportionally equal to mass flow and load on compressor mechanism. Continuous process of compressor efficiency and noise improvement is mostly trade off between them. Actions to make compressor more efficient are linked with the reduction of thermodynamic losses. Energy losses in suction and discharge processes are affected by orifices, valves and mufflers. The size of discharge
Fig. 1. Map of thermodynamic losses in the refrigeration compressor
Rys. 1. Prezentacja strat termodynamicznych w sprężarce chłodzącej
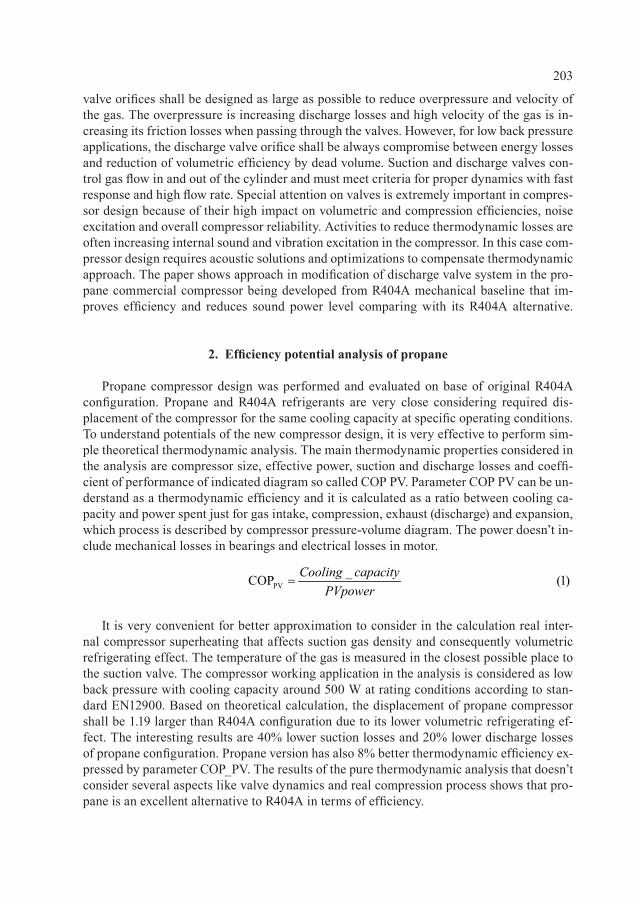
203
valve orifices shall be designed as large as possible to reduce overpressure and velocity of the gas. The overpressure is increasing discharge losses and high velocity of the gas is in-creasing its friction losses when passing through the valves. However, for low back pressure applications, the discharge valve orifice shall be always compromise between energy losses and reduction of volumetric efficiency by dead volume. Suction and discharge valves con-trol gas flow in and out of the cylinder and must meet criteria for proper dynamics with fast response and high flow rate. Special attention on valves is extremely important in compres-sor design because of their high impact on volumetric and compression efficiencies, noise excitation and overall compressor reliability. Activities to reduce thermodynamic losses are often increasing internal sound and vibration excitation in the compressor. In this case com-pressor design requires acoustic solutions and optimizations to compensate thermodynamic approach. The paper shows approach in modification of discharge valve system in the pro-pane commercial compressor being developed from R404A mechanical baseline that im-proves efficiency and reduces sound power level comparing with its R404A alternative.
2. Efficiency potential analysis of propane
Propane compressor design was performed and evaluated on base of original R404A configuration. Propane and R404A refrigerants are very close considering required dis-placement of the compressor for the same cooling capacity at specific operating conditions. To understand potentials of the new compressor design, it is very effective to perform sim-ple theoretical thermodynamic analysis. The main thermodynamic properties considered in the analysis are compressor size, effective power, suction and discharge losses and coeffi-cient of performance of indicated diagram so called COP PV. Parameter COP PV can be un-derstand as a thermodynamic efficiency and it is calculated as a ratio between cooling ca-pacity and power spent just for gas intake, compression, exhaust (discharge) and expansion, which process is described by compressor pressure-volume diagram. The power doesn’t in-clude mechanical losses in bearings and electrical losses in motor.
It is very convenient for better approximation to consider in the calculation real inter-nal compressor superheating that affects suction gas density and consequently volumetric refrigerating effect. The temperature of the gas is measured in the closest possible place to the suction valve. The compressor working application in the analysis is considered as low back pressure with cooling capacity around 500 W at rating conditions according to stan-dard EN12900. Based on theoretical calculation, the displacement of propane compressor shall be 1.19 larger than R404A configuration due to its lower volumetric refrigerating ef-fect. The interesting results are 40% lower suction losses and 20% lower discharge losses of propane configuration. Propane version has also 8% better thermodynamic efficiency ex-pressed by parameter COP_PV. The results of the pure thermodynamic analysis that doesn’t consider several aspects like valve dynamics and real compression process shows that pro-pane is an excellent alternative to R404A in terms of efficiency.
PV_COP (1)Cooling capacity
PVpower=
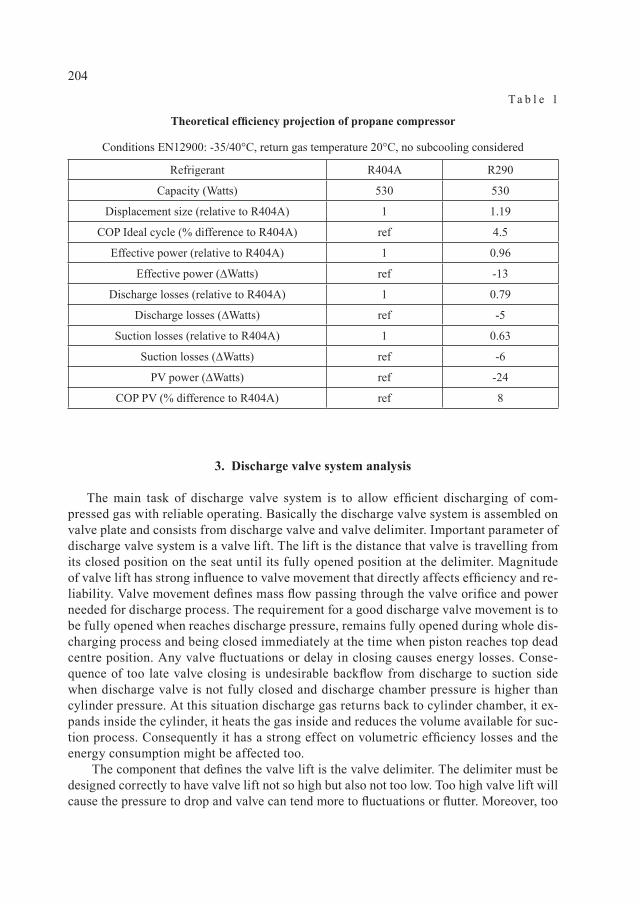
204
T a b l e 1
Theoretical efficiency projection of propane compressor
Conditions EN12900: -35/40°C, return gas temperature 20°C, no subcooling considered
Refrigerant R404A R290
Capacity (Watts) 530 530
Displacement size (relative to R404A) 1 1.19
COP Ideal cycle (% difference to R404A) ref 4.5
Effective power (relative to R404A) 1 0.96
Effective power (∆Watts) ref -13
Discharge losses (relative to R404A) 1 0.79
Discharge losses (∆Watts) ref -5
Suction losses (relative to R404A) 1 0.63
Suction losses (∆Watts) ref -6
PV power (∆Watts) ref -24
COP PV (% difference to R404A) ref 8
3. Discharge valve system analysis
The main task of discharge valve system is to allow efficient discharging of com-pressed gas with reliable operating. Basically the discharge valve system is assembled on valve plate and consists from discharge valve and valve delimiter. Important parameter of discharge valve system is a valve lift. The lift is the distance that valve is travelling from its closed position on the seat until its fully opened position at the delimiter. Magnitude of valve lift has strong influence to valve movement that directly affects efficiency and re-liability. Valve movement defines mass flow passing through the valve orifice and power needed for discharge process. The requirement for a good discharge valve movement is to be fully opened when reaches discharge pressure, remains fully opened during whole dis-charging process and being closed immediately at the time when piston reaches top dead centre position. Any valve fluctuations or delay in closing causes energy losses. Conse-quence of too late valve closing is undesirable backflow from discharge to suction side when discharge valve is not fully closed and discharge chamber pressure is higher than cylinder pressure. At this situation discharge gas returns back to cylinder chamber, it ex-pands inside the cylinder, it heats the gas inside and reduces the volume available for suc-tion process. Consequently it has a strong effect on volumetric efficiency losses and the energy consumption might be affected too.
The component that defines the valve lift is the valve delimiter. The delimiter must be designed correctly to have valve lift not so high but also not too low. Too high valve lift will cause the pressure to drop and valve can tend more to fluctuations or flutter. Moreover, too
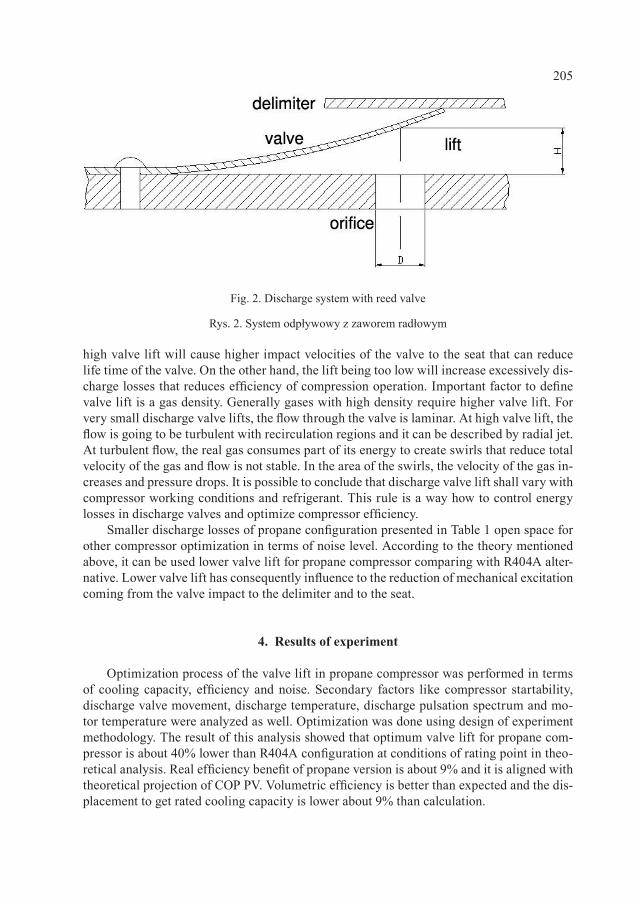
205
high valve lift will cause higher impact velocities of the valve to the seat that can reduce life time of the valve. On the other hand, the lift being too low will increase excessively dis-charge losses that reduces efficiency of compression operation. Important factor to define valve lift is a gas density. Generally gases with high density require higher valve lift. For very small discharge valve lifts, the flow through the valve is laminar. At high valve lift, the flow is going to be turbulent with recirculation regions and it can be described by radial jet. At turbulent flow, the real gas consumes part of its energy to create swirls that reduce total velocity of the gas and flow is not stable. In the area of the swirls, the velocity of the gas in-creases and pressure drops. It is possible to conclude that discharge valve lift shall vary with compressor working conditions and refrigerant. This rule is a way how to control energy losses in discharge valves and optimize compressor efficiency.
Smaller discharge losses of propane configuration presented in Table 1 open space for other compressor optimization in terms of noise level. According to the theory mentioned above, it can be used lower valve lift for propane compressor comparing with R404A alter-native. Lower valve lift has consequently influence to the reduction of mechanical excitation coming from the valve impact to the delimiter and to the seat.
4. Results of experiment
Optimization process of the valve lift in propane compressor was performed in terms of cooling capacity, efficiency and noise. Secondary factors like compressor startability, discharge valve movement, discharge temperature, discharge pulsation spectrum and mo-tor temperature were analyzed as well. Optimization was done using design of experiment methodology. The result of this analysis showed that optimum valve lift for propane com-pressor is about 40% lower than R404A configuration at conditions of rating point in theo-retical analysis. Real efficiency benefit of propane version is about 9% and it is aligned with theoretical projection of COP PV. Volumetric efficiency is better than expected and the dis-placement to get rated cooling capacity is lower about 9% than calculation.
Fig. 2. Discharge system with reed valve
Rys. 2. System odpływowy z zaworem radłowym
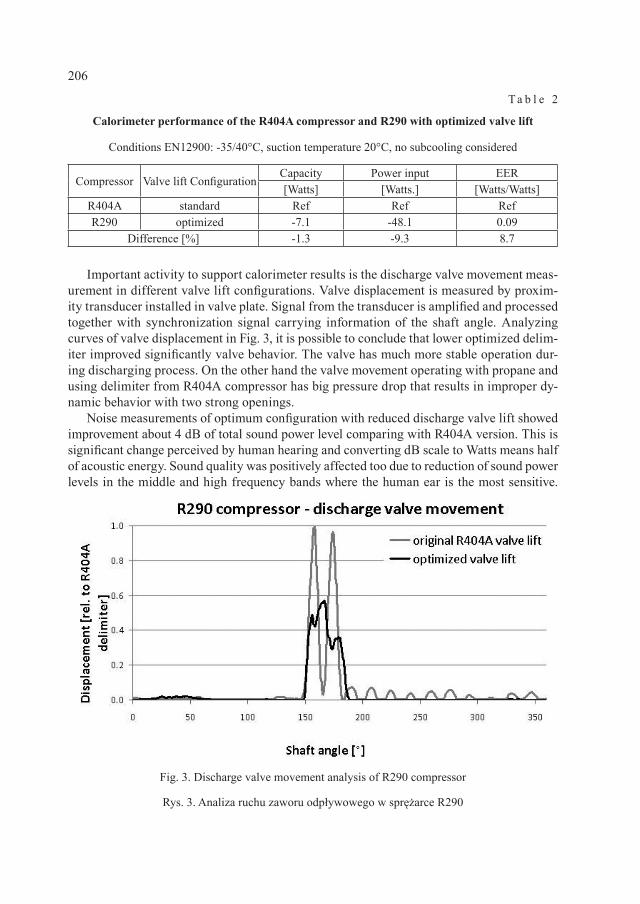
206
T a b l e 2
Calorimeter performance of the R404A compressor and R290 with optimized valve lift
Conditions EN12900: -35/40°C, suction temperature 20°C, no subcooling considered
Compressor Valve lift ConfigurationCapacity Power input EER[Watts] [Watts.] [Watts/Watts]
R404A standard Ref Ref RefR290 optimized -7.1 -48.1 0.09
Difference [%] -1.3 -9.3 8.7
Important activity to support calorimeter results is the discharge valve movement meas-urement in different valve lift configurations. Valve displacement is measured by proxim-ity transducer installed in valve plate. Signal from the transducer is amplified and processed together with synchronization signal carrying information of the shaft angle. Analyzing curves of valve displacement in Fig. 3, it is possible to conclude that lower optimized delim-iter improved significantly valve behavior. The valve has much more stable operation dur-ing discharging process. On the other hand the valve movement operating with propane and using delimiter from R404A compressor has big pressure drop that results in improper dy-namic behavior with two strong openings.
Noise measurements of optimum configuration with reduced discharge valve lift showed improvement about 4 dB of total sound power level comparing with R404A version. This is significant change perceived by human hearing and converting dB scale to Watts means half of acoustic energy. Sound quality was positively affected too due to reduction of sound power levels in the middle and high frequency bands where the human ear is the most sensitive.
Fig. 3. Discharge valve movement analysis of R290 compressor
Rys. 3. Analiza ruchu zaworu odpływowego w sprężarce R290
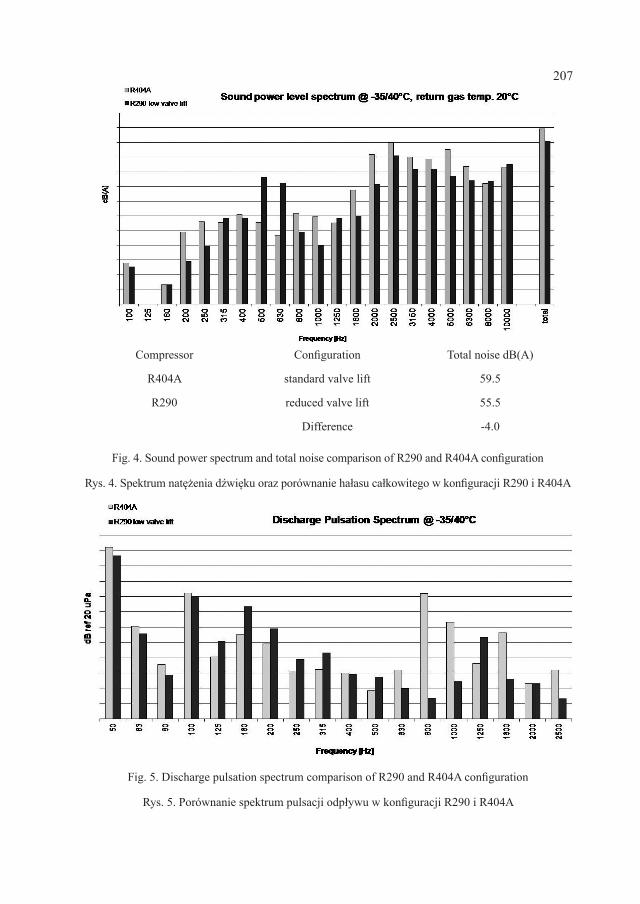
207
Compressor Configuration Total noise dB(A)
R404A standard valve lift 59.5
R290 reduced valve lift 55.5
Difference -4.0
Fig. 4. Sound power spectrum and total noise comparison of R290 and R404A configuration
Rys. 4. Spektrum natężenia dźwięku oraz porównanie hałasu całkowitego w konfiguracji R290 i R404A
Fig. 5. Discharge pulsation spectrum comparison of R290 and R404A configuration
Rys. 5. Porównanie spektrum pulsacji odpływu w konfiguracji R290 i R404A
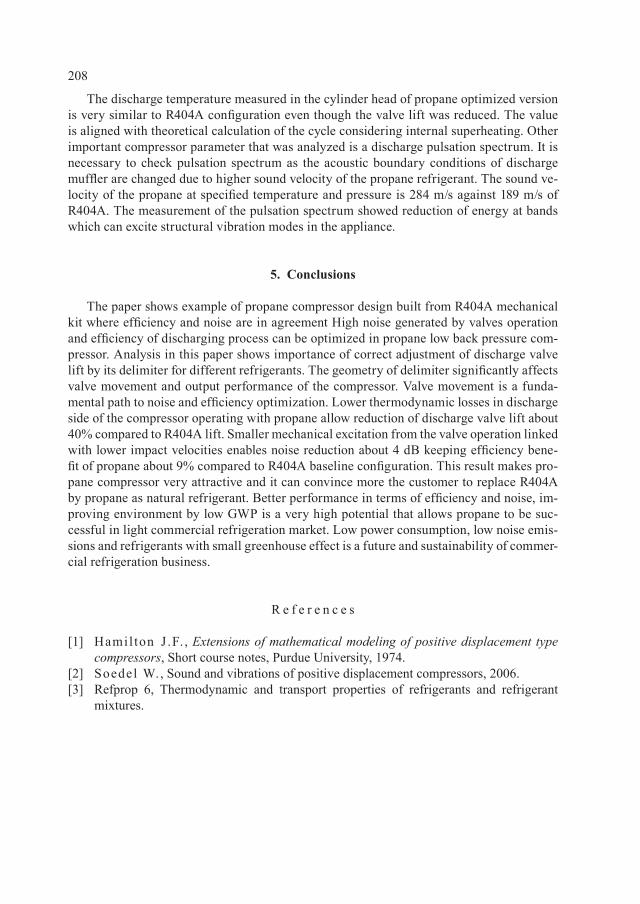
208
The discharge temperature measured in the cylinder head of propane optimized version is very similar to R404A configuration even though the valve lift was reduced. The value is aligned with theoretical calculation of the cycle considering internal superheating. Other important compressor parameter that was analyzed is a discharge pulsation spectrum. It is necessary to check pulsation spectrum as the acoustic boundary conditions of discharge muffler are changed due to higher sound velocity of the propane refrigerant. The sound ve-locity of the propane at specified temperature and pressure is 284 m/s against 189 m/s of R404A. The measurement of the pulsation spectrum showed reduction of energy at bands which can excite structural vibration modes in the appliance.
5. Conclusions
The paper shows example of propane compressor design built from R404A mechanical kit where efficiency and noise are in agreement High noise generated by valves operation and efficiency of discharging process can be optimized in propane low back pressure com-pressor. Analysis in this paper shows importance of correct adjustment of discharge valve lift by its delimiter for different refrigerants. The geometry of delimiter significantly affects valve movement and output performance of the compressor. Valve movement is a funda-mental path to noise and efficiency optimization. Lower thermodynamic losses in discharge side of the compressor operating with propane allow reduction of discharge valve lift about 40% compared to R404A lift. Smaller mechanical excitation from the valve operation linked with lower impact velocities enables noise reduction about 4 dB keeping efficiency bene-fit of propane about 9% compared to R404A baseline configuration. This result makes pro-pane compressor very attractive and it can convince more the customer to replace R404A by propane as natural refrigerant. Better performance in terms of efficiency and noise, im-proving environment by low GWP is a very high potential that allows propane to be suc-cessful in light commercial refrigeration market. Low power consumption, low noise emis-sions and refrigerants with small greenhouse effect is a future and sustainability of commer-cial refrigeration business.
R e f e r e n c e s
[1] Hamil ton J .F. , Extensions of mathematical modeling of positive displacement type compressors, Short course notes, Purdue University, 1974.
[2] Soedel W., Sound and vibrations of positive displacement compressors, 2006.[3] Refprop 6, Thermodynamic and transport properties of refrigerants and refrigerant
mixtures.
GERRIT SENGER, GÜNTER WOZNY*1
IMPACT OF FOAM TO COLUMN OPERATION
WPŁYW PIANY NA DZIAŁANIA KOLUMNOWE
A b s t r a c t
Foam in process engineering can cause severe problems in distillation and absorption towers which may result in heavy operation problems, reduced capacity and reduced separation effi-ciency. Foaming behavior cannot be described yet analytically or thermodynamically based on physical properties (density, viscosity, etc.). The dimensioning of packed columns for foaming media in chemical industry or flue gas scrubbing (coking plants, carbon dioxide capture, etc.) in the past was afflicted with oversizing by unfounded safety factors. The invented new foam test device is capable to identify the qualitative foam behavior and intensity in packed columns by two experimental tests - based on systematic results of a pilot plant. The packed column ada-pted test device will help to identify a potential foam problem and allows prematurely taking respective steps in account.Keywords: foam, distillation, fluid dynamics, mass transfer columns
S t r e s z c z e n i e
W inżynierii procesowej piana może powodować poważne problemy w wieżach destylacji i absorp-cji, czego skutkiem bywają komplikacje natury operacyjnej, ograniczona pojemność oraz zmniej-szona wydajność procesu oddzielania. Zachowań piany nie można jak na razie opisywać metodą analityczną lub termodynamiczną na podstawie jej właściwości fizycznych (gęstość, lepkość itp.). Wymiarowanie kolumn wypełnionych dla nośników pianowych w przemyśle chemicznym bądź przemywaniu gazu spalinowego (koksownie, zatrzymywanie dwutlenku węgla itd.) było w prze-szłości zawyżone ze względu na bezpodstawne kwestie bezpieczeństwa. Nowo wynaleziona apara-tura służąca do testowania piany potrafi określać jakościowe zachowanie piany oraz intensywność w wypełnionych kolumnach drogą dwóch eksperymentów opartych na systematycznych wynikach pracy aparatury pilotażowej. Aparatura kolumny wypełnionej pomoże wykryć potencjalne proble-my związane z pianą, pozwalając na podjęcie odpowiednich kroków prewencyjnych.Słowa kluczowe: piana, destylacja, dynamika płynów, kolumny przeniesienia masowego
* PhD. Eng. Gerrit Senger, Prof. PhD. Eng. Günter Wozny, Chair of Process Dynamics and Opera-tions, TU Berlin.
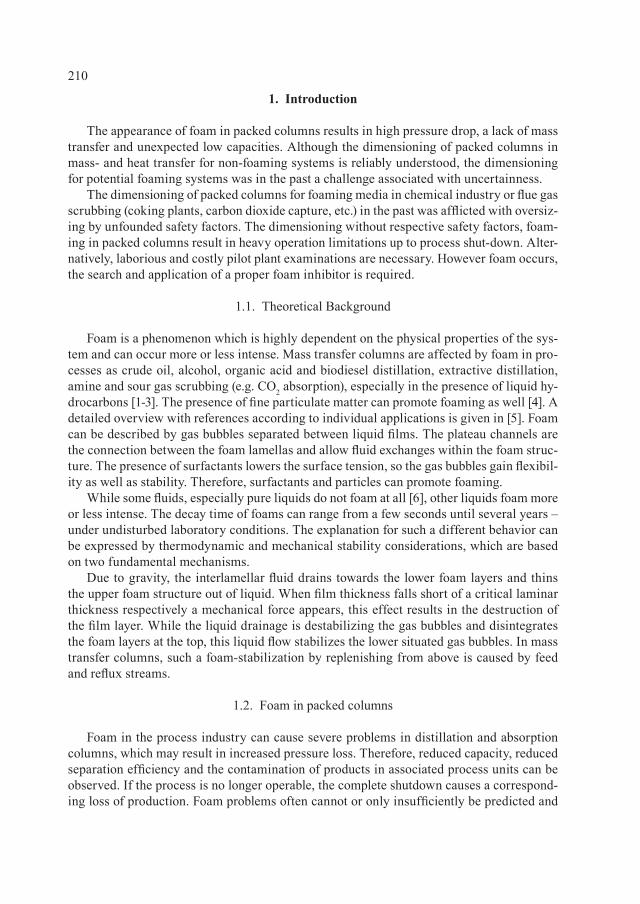
210
1. Introduction
The appearance of foam in packed columns results in high pressure drop, a lack of mass transfer and unexpected low capacities. Although the dimensioning of packed columns in mass- and heat transfer for non-foaming systems is reliably understood, the dimensioning for potential foaming systems was in the past a challenge associated with uncertainness.
The dimensioning of packed columns for foaming media in chemical industry or flue gas scrubbing (coking plants, carbon dioxide capture, etc.) in the past was afflicted with oversiz-ing by unfounded safety factors. The dimensioning without respective safety factors, foam-ing in packed columns result in heavy operation limitations up to process shut-down. Alter-natively, laborious and costly pilot plant examinations are necessary. However foam occurs, the search and application of a proper foam inhibitor is required.
1.1. Theoretical Background
Foam is a phenomenon which is highly dependent on the physical properties of the sys-tem and can occur more or less intense. Mass transfer columns are affected by foam in pro-cesses as crude oil, alcohol, organic acid and biodiesel distillation, extractive distillation, amine and sour gas scrubbing (e.g. CO2 absorption), especially in the presence of liquid hy-drocarbons [1-3]. The presence of fine particulate matter can promote foaming as well [4]. A detailed overview with references according to individual applications is given in [5]. Foam can be described by gas bubbles separated between liquid films. The plateau channels are the connection between the foam lamellas and allow fluid exchanges within the foam struc-ture. The presence of surfactants lowers the surface tension, so the gas bubbles gain flexibil-ity as well as stability. Therefore, surfactants and particles can promote foaming.
While some fluids, especially pure liquids do not foam at all [6], other liquids foam more or less intense. The decay time of foams can range from a few seconds until several years – under undisturbed laboratory conditions. The explanation for such a different behavior can be expressed by thermodynamic and mechanical stability considerations, which are based on two fundamental mechanisms.
Due to gravity, the interlamellar fluid drains towards the lower foam layers and thins the upper foam structure out of liquid. When film thickness falls short of a critical laminar thickness respectively a mechanical force appears, this effect results in the destruction of the film layer. While the liquid drainage is destabilizing the gas bubbles and disintegrates the foam layers at the top, this liquid flow stabilizes the lower situated gas bubbles. In mass transfer columns, such a foam-stabilization by replenishing from above is caused by feed and reflux streams.
1.2. Foam in packed columns
Foam in the process industry can cause severe problems in distillation and absorption columns, which may result in increased pressure loss. Therefore, reduced capacity, reduced separation efficiency and the contamination of products in associated process units can be observed. If the process is no longer operable, the complete shutdown causes a correspond-ing loss of production. Foam problems often cannot or only insufficiently be predicted and
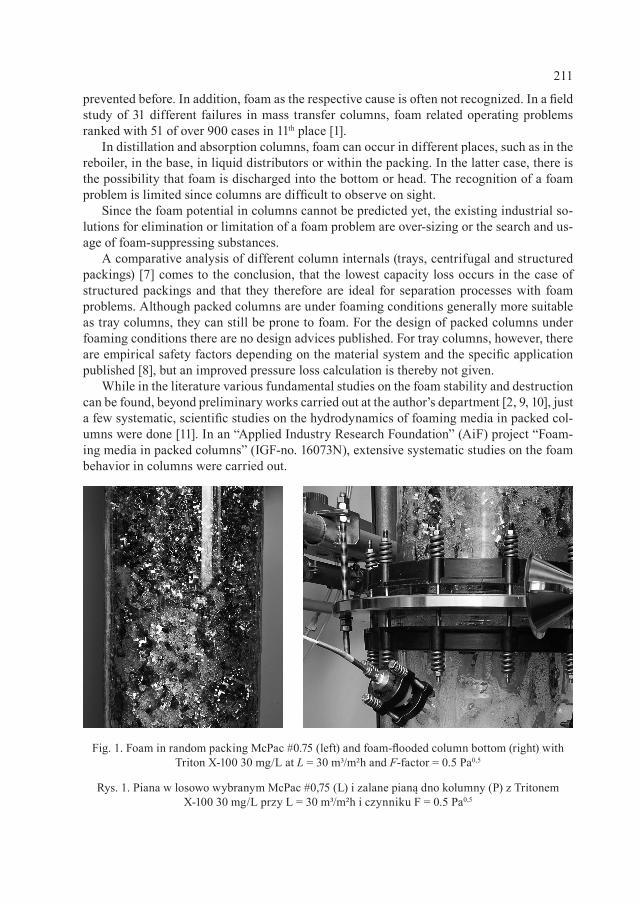
211
prevented before. In addition, foam as the respective cause is often not recognized. In a field study of 31 different failures in mass transfer columns, foam related operating problems ranked with 51 of over 900 cases in 11th place [1].
In distillation and absorption columns, foam can occur in different places, such as in the reboiler, in the base, in liquid distributors or within the packing. In the latter case, there is the possibility that foam is discharged into the bottom or head. The recognition of a foam problem is limited since columns are difficult to observe on sight.
Since the foam potential in columns cannot be predicted yet, the existing industrial so-lutions for elimination or limitation of a foam problem are over-sizing or the search and us-age of foam-suppressing substances.
A comparative analysis of different column internals (trays, centrifugal and structured packings) [7] comes to the conclusion, that the lowest capacity loss occurs in the case of structured packings and that they therefore are ideal for separation processes with foam problems. Although packed columns are under foaming conditions generally more suitable as tray columns, they can still be prone to foam. For the design of packed columns under foaming conditions there are no design advices published. For tray columns, however, there are empirical safety factors depending on the material system and the specific application published [8], but an improved pressure loss calculation is thereby not given.
While in the literature various fundamental studies on the foam stability and destruction can be found, beyond preliminary works carried out at the author’s department [2, 9, 10], just a few systematic, scientific studies on the hydrodynamics of foaming media in packed col-umns were done [11]. In an “Applied Industry Research Foundation” (AiF) project “Foam-ing media in packed columns” (IGF-no. 16073N), extensive systematic studies on the foam behavior in columns were carried out.
Fig. 1. Foam in random packing McPac #0.75 (left) and foam-flooded column bottom (right) with Triton X-100 30 mg/L at L = 30 m³/m²h and F-factor = 0.5 Pa0,5
Rys. 1. Piana w losowo wybranym McPac #0,75 (L) i zalane pianą dno kolumny (P) z Tritonem X-100 30 mg/L przy L = 30 m³/m²h i czynniku F = 0.5 Pa0,5
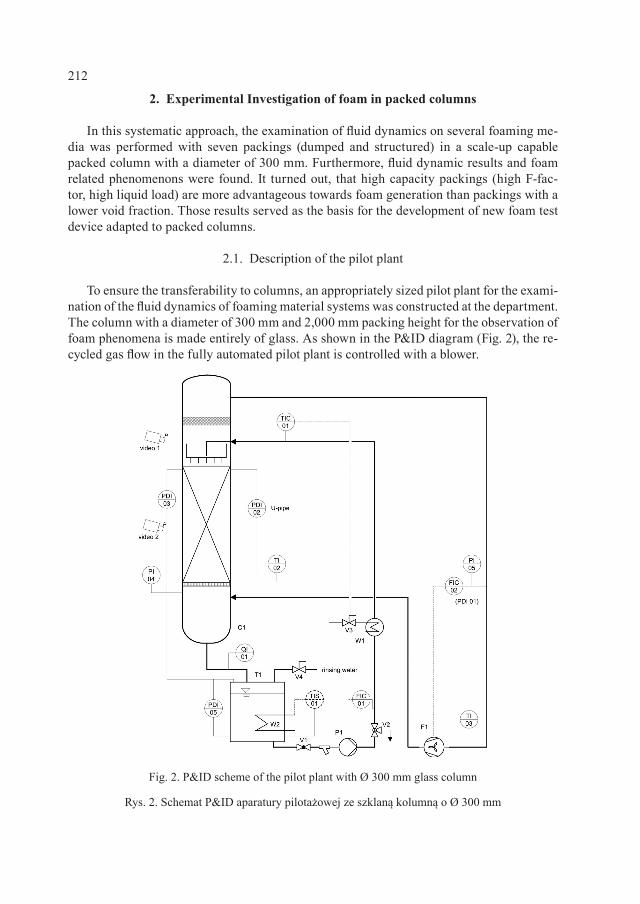
212
2. Experimental Investigation of foam in packed columns
In this systematic approach, the examination of fluid dynamics on several foaming me-dia was performed with seven packings (dumped and structured) in a scale-up capable packed column with a diameter of 300 mm. Furthermore, fluid dynamic results and foam related phenomenons were found. It turned out, that high capacity packings (high F-fac-tor, high liquid load) are more advantageous towards foam generation than packings with a lower void fraction. Those results served as the basis for the development of new foam test device adapted to packed columns.
2.1. Description of the pilot plant
To ensure the transferability to columns, an appropriately sized pilot plant for the exami-nation of the fluid dynamics of foaming material systems was constructed at the department. The column with a diameter of 300 mm and 2,000 mm packing height for the observation of foam phenomena is made entirely of glass. As shown in the P&ID diagram (Fig. 2), the re-cycled gas flow in the fully automated pilot plant is controlled with a blower.
Fig. 2. P&ID scheme of the pilot plant with Ø 300 mm glass column
Rys. 2. Schemat P&ID aparatury pilotażowej ze szklaną kolumną o Ø 300 mm
213
Seven commercial packings (random and structured, Table 1) are compared according to their respective sensitivity to foaming with several foaming material systems. The opera-tion experiences should provide hints concerning advantageous packing parameters and are used for the upscale of the measurement results of the adapted foam test cell.
The fluid dynamic of various aqueous foaming systems (Table 2) was examined for all packings at liquid loads of L = 0; 10; 30 and 50 m³/m²h. The solutions were prepared with de-salinated water (reverse osmosis). It has been found, that some systems weren’t foaming in the column at all, although conventional foam test cells predicted a foaming behavior. The aqueous sour gas scrubbing solvent 40 wt.-% (fresh) methyl diethanolamine (MDEA), for example, was been predicted a heavy foaming tendency in the Bikerman-testcell [14] where a liquid sample is aerated by a glass filter. However, column operation wasn’t affected by a foam problem at all. Obviously, the conventional testcell leads to false alarms in case of systems with higher viscosity, because the phase separation takes some time.
T a b l e 1
Specification data of the examined packings
packing type a [m²/m³] material eMontz-Pak B1-350M structured packing 350 stainless steel 0.98
Rauschert Hiflow-Ring 15-7closed random packing
313 polypropylene 0.91Rauschert Hiflow-Ring 20-4 280 ceramic 0.71
Envimac Mc-Pac #0,75
open random packing
220
stainless steel
0.97Raschig Super-Ring #0,3 315 0.96Raschig Super-Ring #1 160 0.98Raschig Super-Ring #2 98 0.98
T a b l e 2
Examined aqueous material systems
water MDEA butanol Tego Surten W133 [mg/L] Triton X-100 [mg/L]
40 wt.-% 2 wt.-% 2,5 55 110 550 10 30
r [kg/m³] 998 1039 993 998 998 998 998 998 998
h [mPa s] 1.0 8.6 1.0 1.0 1.0 1.0 1.0 1.0 1.0
s [mN/m] 72.5 55.4 46.2 60.0 45.5 41.7 31.0 58.0 46.0
2.2. Foam Impact on fluid dynamics
It has been found, that even at low specific packing pressure losses flooding phenomena appeared far below reference load limits. Furthermore, by monitoring the process, places of foam formation were identified. As a non-foaming reference system, the results are com-pared with the system water/air.
214
For the very low liquid load L = 10 m³/m²h there were no operation limitations with the foaming systems for any packaging at all. The specific pressure drop profiles as a function of the F-factor (equation (1)) are for low gas loads similar to non-foaming systems. At higher liquid loads (L = 30 and 50 m³/m²h) the operation is problematic because of an increase of occurring foam. Especially for packings with a void fraction ε (equation (2)) below 0.97 (in this case the random packings Hiflow-Ring 15-7 and 20-4), a high foam generation was observed which influenced the specific pressure drop over the packing height dramatically.
For packings with void fractions up from 0.97, an increase of the gas load was getting a problem for the operating conditions.
Interestingly, there were different behaviors concerning the fluid dynamics observed. At the higher liquid loads, L= 30 and 50 m³/m²h, foam often accumulates with this experi-mental set-up mainly in the column bottom and leads to flooding of the gas inlet (Fig. 1). The continuous liquid flow stabilizes the foam in the bottom. In addition, foam is generated by the reflux impact to the liquid level. The liquid load seems to have a greater impact on foaming than the gas load.
This effect seems to be related on high shear forces at low gas loads (F-factor ca. 0.5 – 1 Pa0.5). With an increase of the gas load could be observed, that foaming was of-ten reduced. The pressure drop characteristics in relation to the F-factor of three packings are shown in Fig. 3-4 for non-foaming and foaming conditions. While the specific pres-sure loss for low liquid loads as L = 10 m³/m²h is for foaming compared to a non-foaming system for the examined packings nearly identical, the pressure loss under foaming con-ditions increases strong for the liquid loads. As shown in Fig. 3 (left) the random pack-ing Super-Ring #1 is affected by foam, which results in a higher pressure drop, but the pressure drop characteristic is still comparable to non-foaming conditions. In this case it could be observed, that foam occurred predominantly at the column wall. Inside the pack-ing there was only a little bit of foam visible which could be related to a foam-phase sep-aration. Regarding Fig. 3 (right) for the McPac #0.75 random packing, a quite high foam related pressure drop can be observed even at low F-factors. Maybe, the geometric de-sign causes higher shear forces which introduce gas into the liquid phase. Fig. 4 shows the pressure drop characteristic for the structured packing B1-350M. Particular remarkable is the high pressure drop due to a high foam generation rate for low gas loads. For an in-creasing gas load, this high pressure drop is relative on the decline. It could be observed, that the foam is even disappearing for F-factors from 1-2 Pa0.5. In this case, the struc-tured packing metal sheets don’t provide a phase exchange possibility if a packing chan-nel is blocked by foam. For higher gas loads from F-factor 2 Pa0.5 there is an increase of shear forces which leads to an increase of the pressure drop. From this gas load, the pres-sure drop behavior is comparable to the Super-Ring #1, which means that the foam related pressure is only slightly higher than for non-foaming conditions. In this case, even the ca-pacity isn’t reduced extraordinary.
F-factor (1)Gas Gasw= ρ
(2)total Packing
total
V VV−
ε =
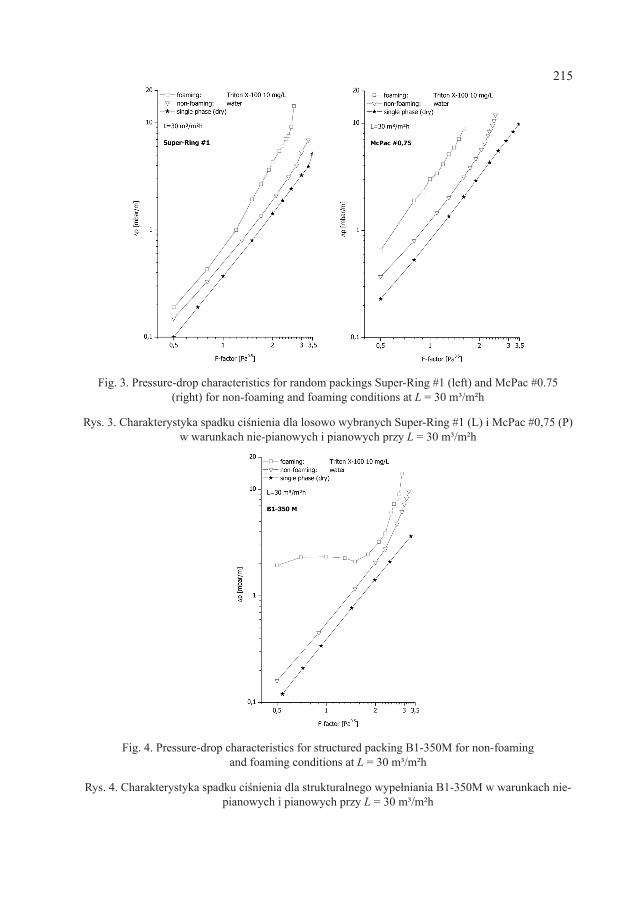
215
Fig. 3. Pressure-drop characteristics for random packings Super-Ring #1 (left) and McPac #0.75 (right) for non-foaming and foaming conditions at L = 30 m³/m²h
Rys. 3. Charakterystyka spadku ciśnienia dla losowo wybranych Super-Ring #1 (L) i McPac #0,75 (P) w warunkach nie-pianowych i pianowych przy L = 30 m³/m²h
Fig. 4. Pressure-drop characteristics for structured packing B1-350M for non-foaming and foaming conditions at L = 30 m³/m²h
Rys. 4. Charakterystyka spadku ciśnienia dla strukturalnego wypełniania B1-350M w warunkach nie-pianowych i pianowych przy L = 30 m³/m²h
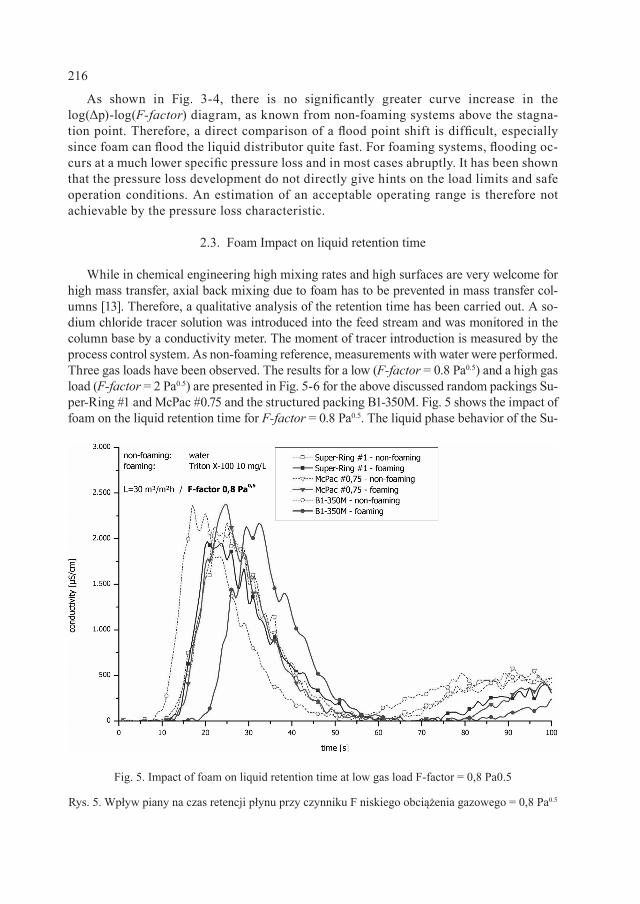
216
As shown in Fig. 3-4, there is no significantly greater curve increase in the log(Δp)-log(F-factor) diagram, as known from non-foaming systems above the stagna-tion point. Therefore, a direct comparison of a flood point shift is difficult, especially since foam can flood the liquid distributor quite fast. For foaming systems, flooding oc-curs at a much lower specific pressure loss and in most cases abruptly. It has been shown that the pressure loss development do not directly give hints on the load limits and safe operation conditions. An estimation of an acceptable operating range is therefore not achievable by the pressure loss characteristic.
2.3. Foam Impact on liquid retention time
While in chemical engineering high mixing rates and high surfaces are very welcome for high mass transfer, axial back mixing due to foam has to be prevented in mass transfer col-umns [13]. Therefore, a qualitative analysis of the retention time has been carried out. A so-dium chloride tracer solution was introduced into the feed stream and was monitored in the column base by a conductivity meter. The moment of tracer introduction is measured by the process control system. As non-foaming reference, measurements with water were performed. Three gas loads have been observed. The results for a low (F-factor = 0.8 Pa0.5) and a high gas load (F-factor = 2 Pa0.5) are presented in Fig. 5-6 for the above discussed random packings Su-per-Ring #1 and McPac #0.75 and the structured packing B1-350M. Fig. 5 shows the impact of foam on the liquid retention time for F-factor = 0.8 Pa0.5. The liquid phase behavior of the Su-
Fig. 5. Impact of foam on liquid retention time at low gas load F-factor = 0,8 Pa0.5
Rys. 5. Wpływ piany na czas retencji płynu przy czynniku F niskiego obciążenia gazowego = 0,8 Pa0.5
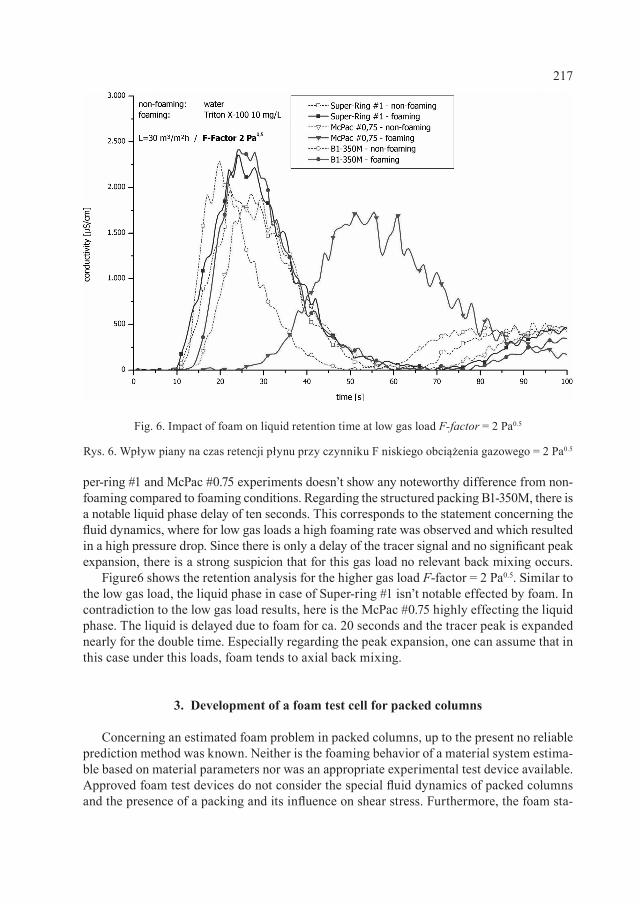
217
per-ring #1 and McPac #0.75 experiments doesn’t show any noteworthy difference from non-foaming compared to foaming conditions. Regarding the structured packing B1-350M, there is a notable liquid phase delay of ten seconds. This corresponds to the statement concerning the fluid dynamics, where for low gas loads a high foaming rate was observed and which resulted in a high pressure drop. Since there is only a delay of the tracer signal and no significant peak expansion, there is a strong suspicion that for this gas load no relevant back mixing occurs.
Figure6 shows the retention analysis for the higher gas load F-factor = 2 Pa0.5. Similar to the low gas load, the liquid phase in case of Super-ring #1 isn’t notable effected by foam. In contradiction to the low gas load results, here is the McPac #0.75 highly effecting the liquid phase. The liquid is delayed due to foam for ca. 20 seconds and the tracer peak is expanded nearly for the double time. Especially regarding the peak expansion, one can assume that in this case under this loads, foam tends to axial back mixing.
3. Development of a foam test cell for packed columns
Concerning an estimated foam problem in packed columns, up to the present no reliable prediction method was known. Neither is the foaming behavior of a material system estima-ble based on material parameters nor was an appropriate experimental test device available. Approved foam test devices do not consider the special fluid dynamics of packed columns and the presence of a packing and its influence on shear stress. Furthermore, the foam sta-
Fig. 6. Impact of foam on liquid retention time at low gas load F-factor = 2 Pa0.5
Rys. 6. Wpływ piany na czas retencji płynu przy czynniku F niskiego obciążenia gazowego = 2 Pa0.5
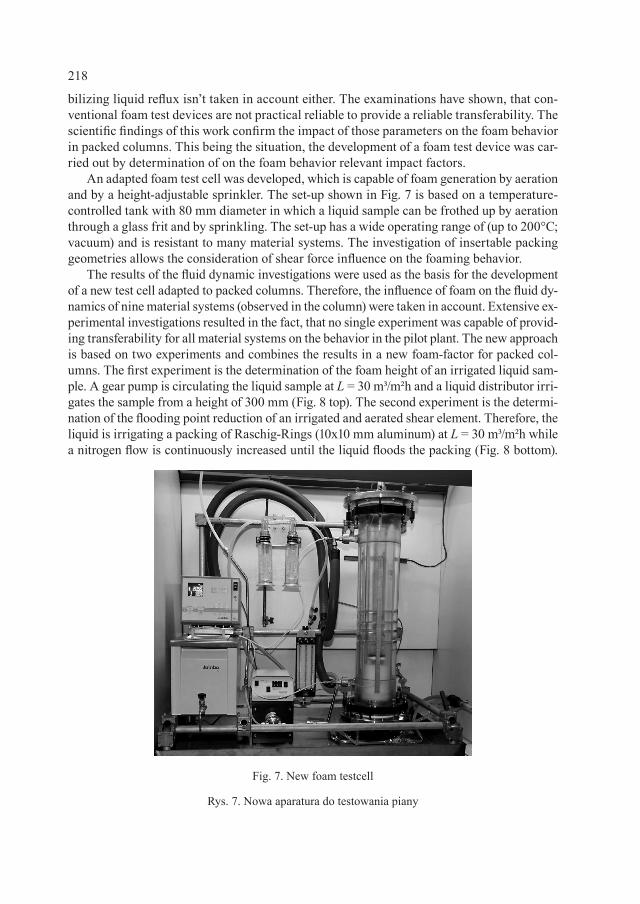
218
bilizing liquid reflux isn’t taken in account either. The examinations have shown, that con-ventional foam test devices are not practical reliable to provide a reliable transferability. The scientific findings of this work confirm the impact of those parameters on the foam behavior in packed columns. This being the situation, the development of a foam test device was car-ried out by determination of on the foam behavior relevant impact factors.
An adapted foam test cell was developed, which is capable of foam generation by aeration and by a height-adjustable sprinkler. The set-up shown in Fig. 7 is based on a temperature-controlled tank with 80 mm diameter in which a liquid sample can be frothed up by aeration through a glass frit and by sprinkling. The set-up has a wide operating range of (up to 200°C; vacuum) and is resistant to many material systems. The investigation of insertable packing geometries allows the consideration of shear force influence on the foaming behavior.
The results of the fluid dynamic investigations were used as the basis for the development of a new test cell adapted to packed columns. Therefore, the influence of foam on the fluid dy-namics of nine material systems (observed in the column) were taken in account. Extensive ex-perimental investigations resulted in the fact, that no single experiment was capable of provid-ing transferability for all material systems on the behavior in the pilot plant. The new approach is based on two experiments and combines the results in a new foam-factor for packed col-umns. The first experiment is the determination of the foam height of an irrigated liquid sam-ple. A gear pump is circulating the liquid sample at L = 30 m³/m²h and a liquid distributor irri-gates the sample from a height of 300 mm (Fig. 8 top). The second experiment is the determi-nation of the flooding point reduction of an irrigated and aerated shear element. Therefore, the liquid is irrigating a packing of Raschig-Rings (10x10 mm aluminum) at L = 30 m³/m²h while a nitrogen flow is continuously increased until the liquid floods the packing (Fig. 8 bottom).
Fig. 7. New foam testcell
Rys. 7. Nowa aparatura do testowania piany
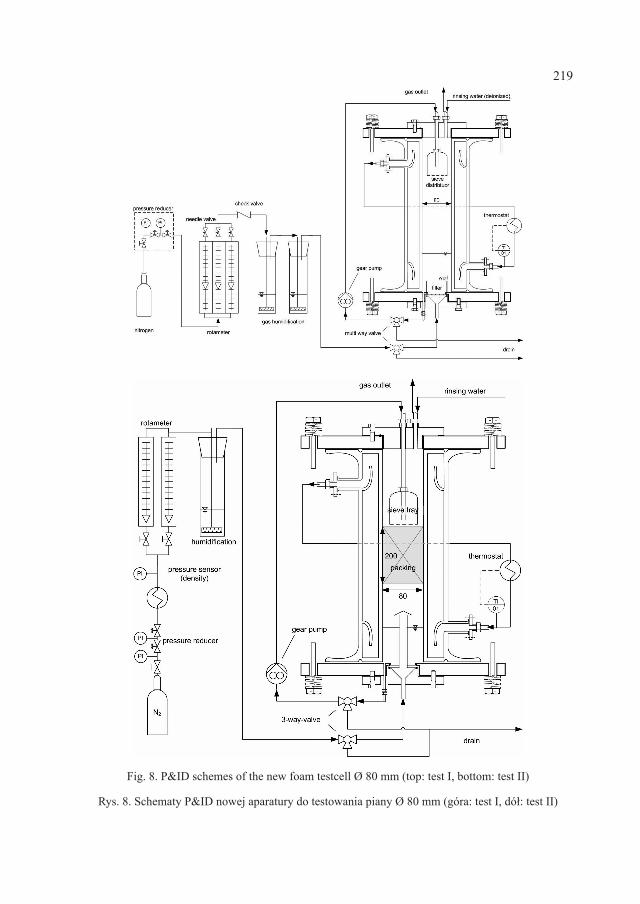
219
Fig. 8. P&ID schemes of the new foam testcell Ø 80 mm (top: test I, bottom: test II)
Rys. 8. Schematy P&ID nowej aparatury do testowania piany Ø 80 mm (góra: test I, dół: test II)
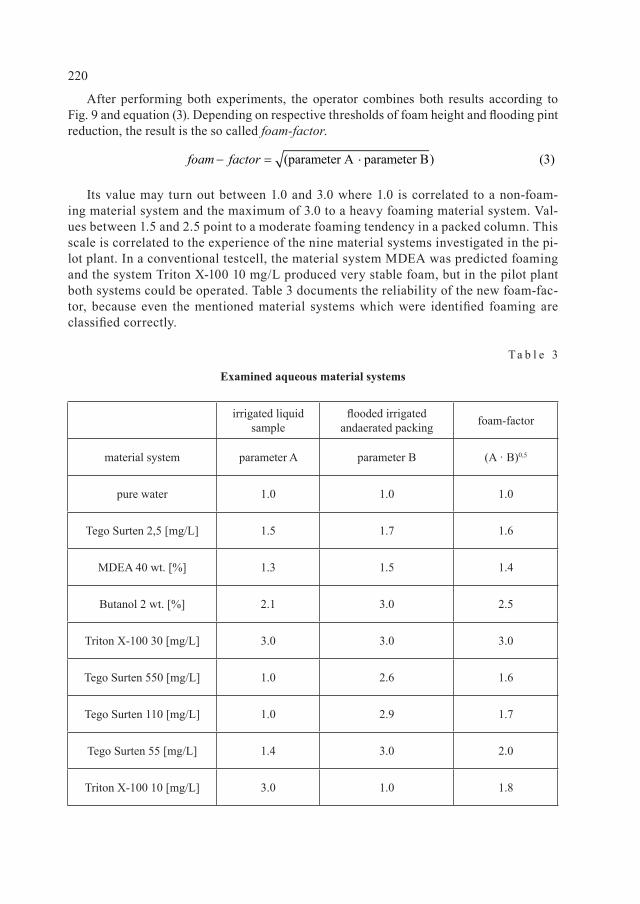
220
After performing both experiments, the operator combines both results according to Fig. 9 and equation (3). Depending on respective thresholds of foam height and flooding pint reduction, the result is the so called foam-factor.
Its value may turn out between 1.0 and 3.0 where 1.0 is correlated to a non-foam-ing material system and the maximum of 3.0 to a heavy foaming material system. Val-ues between 1.5 and 2.5 point to a moderate foaming tendency in a packed column. This scale is correlated to the experience of the nine material systems investigated in the pi-lot plant. In a conventional testcell, the material system MDEA was predicted foaming and the system Triton X-100 10 mg/L produced very stable foam, but in the pilot plant both systems could be operated. Table 3 documents the reliability of the new foam-fac-tor, because even the mentioned material systems which were identified foaming are classified correctly.
T a b l e 3
Examined aqueous material systems
irrigated liquid sample
flooded irrigated andaerated packing foam-factor
material system parameter A parameter B (A · B)0,5
pure water 1.0 1.0 1.0
Tego Surten 2,5 [mg/L] 1.5 1.7 1.6
MDEA 40 wt. [%] 1.3 1.5 1.4
Butanol 2 wt. [%] 2.1 3.0 2.5
Triton X-100 30 [mg/L] 3.0 3.0 3.0
Tego Surten 550 [mg/L] 1.0 2.6 1.6
Tego Surten 110 [mg/L] 1.0 2.9 1.7
Tego Surten 55 [mg/L] 1.4 3.0 2.0
Triton X-100 10 [mg/L] 3.0 1.0 1.8
(parameter A parameter B) (3)foam factor− = ⋅
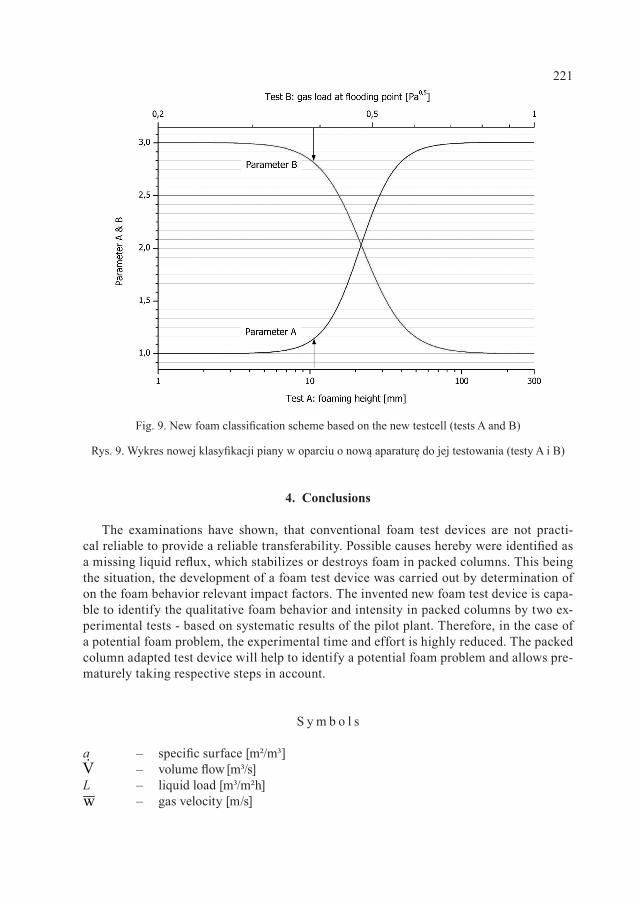
221
4. Conclusions
The examinations have shown, that conventional foam test devices are not practi-cal reliable to provide a reliable transferability. Possible causes hereby were identified as a missing liquid reflux, which stabilizes or destroys foam in packed columns. This being the situation, the development of a foam test device was carried out by determination of on the foam behavior relevant impact factors. The invented new foam test device is capa-ble to identify the qualitative foam behavior and intensity in packed columns by two ex-perimental tests - based on systematic results of the pilot plant. Therefore, in the case of a potential foam problem, the experimental time and effort is highly reduced. The packed column adapted test device will help to identify a potential foam problem and allows pre-maturely taking respective steps in account.
S y m b o l s
a – specific surface [m²/m³] – volume flow [m³/s]
L – liquid load [m³/m²h] – gas velocity [m/s]
Fig. 9. New foam classification scheme based on the new testcell (tests A and B)
Rys. 9. Wykres nowej klasyfikacji piany w oparciu o nową aparaturę do jej testowania (testy A i B)
V
w
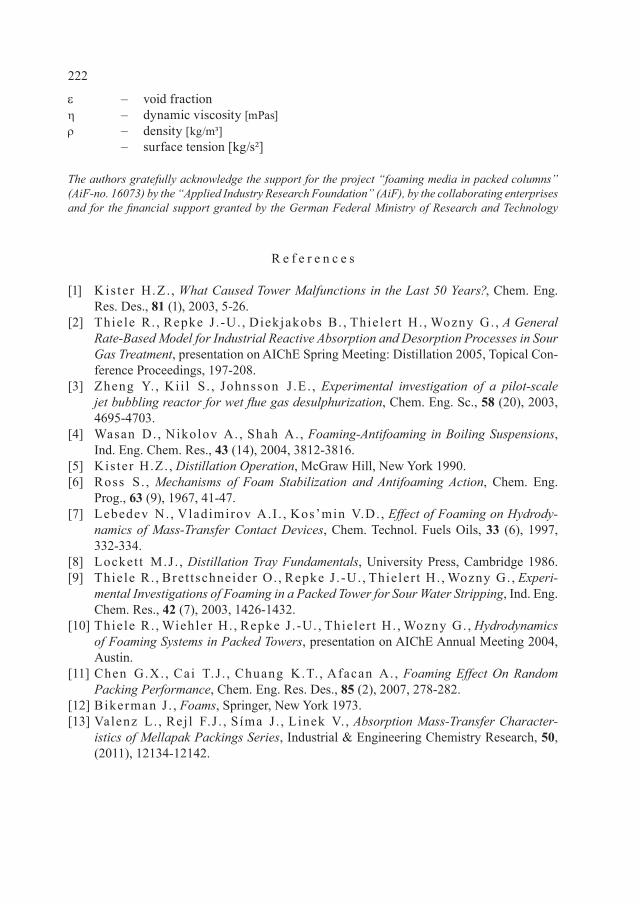
222
ε – void fraction h – dynamic viscosity [mPas]ρ – density [kg/m³]
– surface tension [kg/s²]
The authors gratefully acknowledge the support for the project “foaming media in packed columns” (AiF-no. 16073) by the “Applied Industry Research Foundation” (AiF), by the collaborating enterprises and for the financial support granted by the German Federal Ministry of Research and Technology
R e f e r e n c e s
[1] K iste r H.Z ., What Caused Tower Malfunctions in the Last 50 Years?, Chem. Eng. Res. Des., 81 (1), 2003, 5-26.
[2] Thiele R. , Repke J . -U. , Diekjakobs B. , Thieler t H. , Wozny G. , A General Rate-Based Model for Industrial Reactive Absorption and Desorption Processes in Sour Gas Treatment, presentation on AIChE Spring Meeting: Distillation 2005, Topical Con-ference Proceedings, 197-208.
[3] Zheng Y. , Kii l S. , Johnsson J .E. , Experimental investigation of a pilot-scale jet bubbling reactor for wet flue gas desulphurization, Chem. Eng. Sc., 58 (20), 2003, 4695-4703.
[4] Wasan D. , Nikolov A. , Shah A. , Foaming-Antifoaming in Boiling Suspensions, Ind. Eng. Chem. Res., 43 (14), 2004, 3812-3816.
[5] Kister H.Z. , Distillation Operation, McGraw Hill, New York 1990.[6] Ross S. , Mechanisms of Foam Stabilization and Antifoaming Action, Chem. Eng.
Prog., 63 (9), 1967, 41-47.[7] Lebedev N. , Vladimirov A.I . , Kos’min V.D. , Effect of Foaming on Hydrody-
namics of Mass-Transfer Contact Devices, Chem. Technol. Fuels Oils, 33 (6), 1997, 332-334.
[8] Locket t M.J . , Distillation Tray Fundamentals, University Press, Cambridge 1986.[9] Thiele R. , Bret tschneider O. , Repke J . -U. , Thieler t H. , Wozny G. , Experi-
mental Investigations of Foaming in a Packed Tower for Sour Water Stripping, Ind. Eng. Chem. Res., 42 (7), 2003, 1426-1432.
[10] Thiele R. , Wiehler H. , Repke J . -U. , Thieler t H. , Wozny G. , Hydrodynamics of Foaming Systems in Packed Towers, presentation on AIChE Annual Meeting 2004, Austin.
[11] Chen G.X. , Cai T.J . , Chuang K.T. , Afacan A. , Foaming Effect On Random Packing Performance, Chem. Eng. Res. Des., 85 (2), 2007, 278-282.
[12] Bikerman J . , Foams, Springer, New York 1973.[13] Valenz L. , Rej l F.J . , Síma J . , Linek V. , Absorption Mass-Transfer Character-
istics of Mellapak Packings Series, Industrial & Engineering Chemistry Research, 50, (2011), 12134-12142.

SHANKUI SONG, STEFFEN STÜNKEL, HAMID REZA GODINI, XUAN NGHIEM SON, GÜNTER WOZNY*, JINGQI YUAN**1
INVESTIGATION ON MEMBRANE-ASSISTED CO2 REMOVAL PROCESS FOR OXIDATIVE COUPLING
OF METHANE IN MINI-PLANT SCALE
BADANIE MEMBRANOWEGO PROCESU USUWANIA CO2 DLA OKSYDACYJNEGO SPRZĘŻENIA METANU
W SKALI MINI-APARATURY
A b s t r a c tIn this paper the application and the performance of a membrane unit for preliminarily removing CO2 from the product gas mixture in the Oxidative Coupling of Methane (OCM) process based on a mini-plant scale experimen-tal facility are presented and discussed. The model for the membrane unit is validated via experiments based on the comparison of concentrations and recoveries, respectively, with a brilliant agreement <5% under operating pres-sure up to 5 and 10 bar. It is found that the C2H4 loss rate could not be reduced less than 5% with the CO2 removal rate of 50% in a given membrane module. Since ethylene (C2H4) is the target product in OCM process, a two-stage membrane system is therefore proposed to enhance the C2H4 recovery. This configuration could further reduce the product loss rate while keeping the same CO2 removal rate as that of the single stage process.Keywords: membrane-assisted separation, CO2 removal, oxidative coupling of methane, aspen customer modele
S t r e s z c z e n i eW artykule niniejszym zaprezentowano i omówiono zastosowanie oraz wydajność pojedynczej membrany dla wstępnego usuwania CO2 z mieszaniny gazowej w procesie oksydacyjnego sprzężenia metanu (OCM) w oparciu o skalę mini-aparatury doświadczalnej. Model pojedynczej membrany weryfikowany jest drogą eksperymentów opartych odpowiednio na porównaniu stężeń i odzysków przy bardzo dobrą zgodności <5% i ciśnieniu operacyj-nym do 5 i 10 barów. Ustalono, że tempa strat C2H4 nie można ograniczyć o mniej niż 5% przy tempie usuwania CO2 wynoszącym 50% w danym module membrany. Ponieważ docelowym produktem procesu OCM jest etylen (C2H4), zaproponowano dwuetapowy system membranowy, który ma zwiększyć jego odzysk. Konfiguracja taka mogłaby w dalszej perspektywie zmniejszyć tempo strat produktu przy niezmienionym tempie usuwania CO2, właściwym dla procesu jednoetapowego.Słowa kluczowe: rozdzielanie membranowe, usuwanie CO2, oksydacyjne sprzężenie metanu, wibrujący model odbiorczy
* MSc. Shankui Song, Dipl. Eng. Steffen Stünkel, PhD. Hamid Reza Godini, MSc. Xuan Nghiem Son, Prof. PhD. Eng. Günter Wozny, Chair of Process Dynamics and Operations, TU Berlin.
** Prof. PhD. Jingqi Yuan, Department of Automation, and the key Laboratory of System Control and Information Processing, Ministry of Education of China, Shanghai Jiao Tong University.
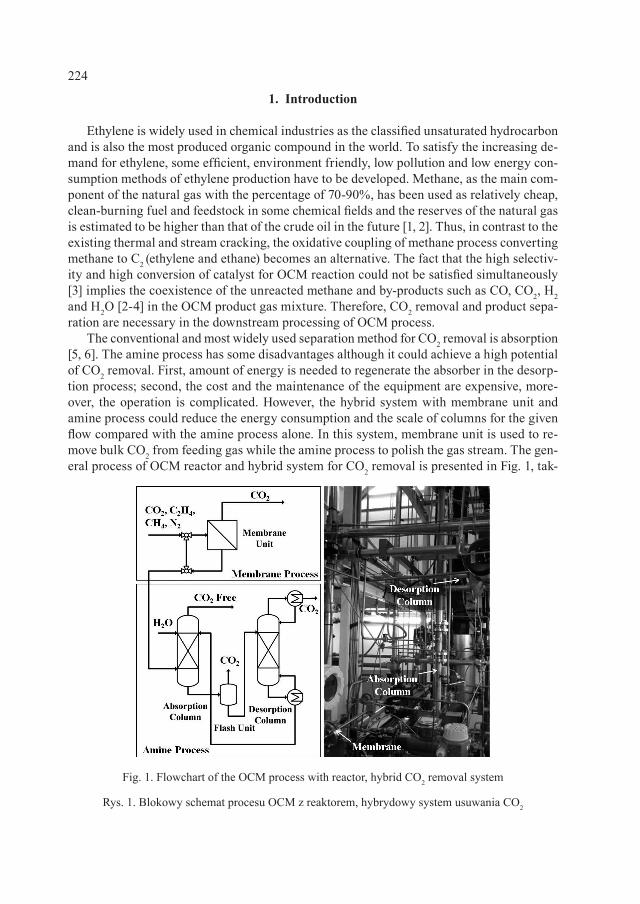
224
1. Introduction
Ethylene is widely used in chemical industries as the classified unsaturated hydrocarbon and is also the most produced organic compound in the world. To satisfy the increasing de-mand for ethylene, some efficient, environment friendly, low pollution and low energy con-sumption methods of ethylene production have to be developed. Methane, as the main com-ponent of the natural gas with the percentage of 70-90%, has been used as relatively cheap, clean-burning fuel and feedstock in some chemical fields and the reserves of the natural gas is estimated to be higher than that of the crude oil in the future [1, 2]. Thus, in contrast to the existing thermal and stream cracking, the oxidative coupling of methane process converting methane to C2 (ethylene and ethane) becomes an alternative. The fact that the high selectiv-ity and high conversion of catalyst for OCM reaction could not be satisfied simultaneously [3] implies the coexistence of the unreacted methane and by-products such as CO, CO2, H2 and H2O [2-4] in the OCM product gas mixture. Therefore, CO2 removal and product sepa-ration are necessary in the downstream processing of OCM process.
The conventional and most widely used separation method for CO2 removal is absorption [5, 6]. The amine process has some disadvantages although it could achieve a high potential of CO2 removal. First, amount of energy is needed to regenerate the absorber in the desorp-tion process; second, the cost and the maintenance of the equipment are expensive, more-over, the operation is complicated. However, the hybrid system with membrane unit and amine process could reduce the energy consumption and the scale of columns for the given flow compared with the amine process alone. In this system, membrane unit is used to re-move bulk CO2 from feeding gas while the amine process to polish the gas stream. The gen-eral process of OCM reactor and hybrid system for CO2 removal is presented in Fig. 1, tak-
Fig. 1. Flowchart of the OCM process with reactor, hybrid CO2 removal system
Rys. 1. Blokowy schemat procesu OCM z reaktorem, hybrydowy system usuwania CO2
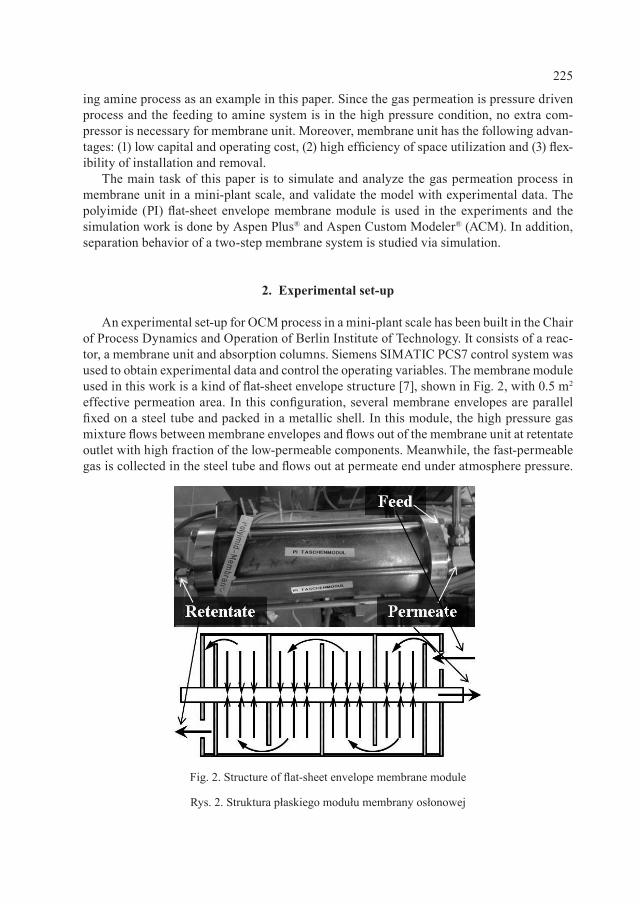
225
ing amine process as an example in this paper. Since the gas permeation is pressure driven process and the feeding to amine system is in the high pressure condition, no extra com-pressor is necessary for membrane unit. Moreover, membrane unit has the following advan-tages: (1) low capital and operating cost, (2) high efficiency of space utilization and (3) flex-ibility of installation and removal.
The main task of this paper is to simulate and analyze the gas permeation process in membrane unit in a mini-plant scale, and validate the model with experimental data. The polyimide (PI) flat-sheet envelope membrane module is used in the experiments and the simulation work is done by Aspen Plus® and Aspen Custom Modeler® (ACM). In addition, separation behavior of a two-step membrane system is studied via simulation.
2. Experimental set-up
An experimental set-up for OCM process in a mini-plant scale has been built in the Chair of Process Dynamics and Operation of Berlin Institute of Technology. It consists of a reac-tor, a membrane unit and absorption columns. Siemens SIMATIC PCS7 control system was used to obtain experimental data and control the operating variables. The membrane module used in this work is a kind of flat-sheet envelope structure [7], shown in Fig. 2, with 0.5 m2 effective permeation area. In this configuration, several membrane envelopes are parallel fixed on a steel tube and packed in a metallic shell. In this module, the high pressure gas mixture flows between membrane envelopes and flows out of the membrane unit at retentate outlet with high fraction of the low-permeable components. Meanwhile, the fast-permeable gas is collected in the steel tube and flows out at permeate end under atmosphere pressure.
Fig. 2. Structure of flat-sheet envelope membrane module
Rys. 2. Struktura płaskiego modułu membrany osłonowej
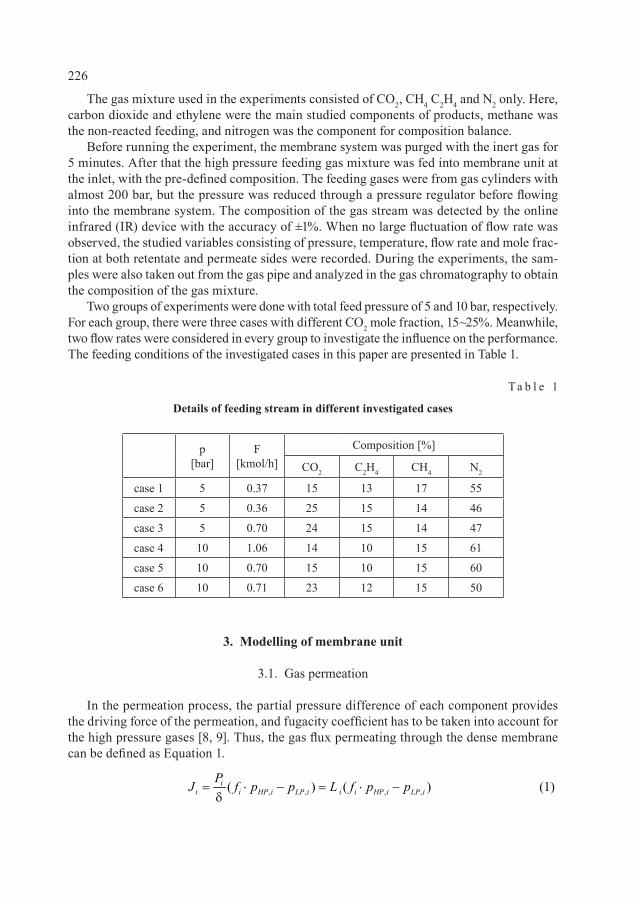
226
The gas mixture used in the experiments consisted of CO2, CH4 C2H4 and N2 only. Here, carbon dioxide and ethylene were the main studied components of products, methane was the non-reacted feeding, and nitrogen was the component for composition balance.
Before running the experiment, the membrane system was purged with the inert gas for 5 minutes. After that the high pressure feeding gas mixture was fed into membrane unit at the inlet, with the pre-defined composition. The feeding gases were from gas cylinders with almost 200 bar, but the pressure was reduced through a pressure regulator before flowing into the membrane system. The composition of the gas stream was detected by the online infrared (IR) device with the accuracy of ±1%. When no large fluctuation of flow rate was observed, the studied variables consisting of pressure, temperature, flow rate and mole frac-tion at both retentate and permeate sides were recorded. During the experiments, the sam-ples were also taken out from the gas pipe and analyzed in the gas chromatography to obtain the composition of the gas mixture.
Two groups of experiments were done with total feed pressure of 5 and 10 bar, respectively. For each group, there were three cases with different CO2 mole fraction, 15~25%. Meanwhile, two flow rates were considered in every group to investigate the influence on the performance. The feeding conditions of the investigated cases in this paper are presented in Table 1.
T a b l e 1
Details of feeding stream in different investigated cases
p[bar]
F[kmol/h]
Composition [%]
CO2 C2H4 CH4 N2
case 1 5 0.37 15 13 17 55
case 2 5 0.36 25 15 14 46
case 3 5 0.70 24 15 14 47
case 4 10 1.06 14 10 15 61
case 5 10 0.70 15 10 15 60
case 6 10 0.71 23 12 15 50
3. Modelling of membrane unit
3.1. Gas permeation
In the permeation process, the partial pressure difference of each component provides the driving force of the permeation, and fugacity coefficient has to be taken into account for the high pressure gases [8, 9]. Thus, the gas flux permeating through the dense membrane can be defined as Equation 1.
, , , ,( ) ( ) (1)ii i HP i LP i i i HP i LP i
PJ f p p L f p p= ⋅ − = ⋅ −
d
227
Permeability coefficient P, i.e., affecting the gas flow rate through the membrane, is a com-plicated membrane parameter. P is dependent on the membrane materials and the operating con-ditions such as temperature, pressure and etc. Permeance, the ratio of permeability coefficient and the thickness of the dense membrane is often used in the simulation. Permeability is the crucially important parameter for simulation and usually obtained through experiments.
3.2. Modelling of membrane unit
In this work, the following characteristics and assumptions are made in this work: one-dimensional plug flow, isothermal flow, flawless membrane, fixed permeability in the whole zone, permeate-free flow pattern and steady-state simulation. Here, the permeate-free flow pattern means the concentration of gases at permeate side is determined by local fluxes, with no influence of upstream and downstream flows. In each control element, the total mass bal-ance is written as Equations 2 and 3,
According to Dalton’s law of partial pressure and Equations 1-3, the mass balance used in the model can be written as Equation 4. And the physical properties, such as the fugacity coefficient, are calculated by Aspen Plus based on Peng-Robbins equation of state. Based on the beforehand assumption of permeate free flow pattern, the mole fraction of each compo-nent at permeate side can be defined as Equation 5.
The pressure drop occurring along the flow direction inside the module is taken into ac-count with the assumption that the shape of membrane module shell causes no pressure drop for flowing gases. The total pressure drop is shown as following [9].
4. Flowsheeting
Aspen Plus® as one of the widely used commercial software for simulating and designing the given chemical processes does not provide the simulation model of membrane process. However, Aspen Custom Modeler® provides a choice to develop user’s models to complete the simulation of the whole process in some situation. The flowchart of simulation task is
Re tentate Feed Permeate (2)F F F= −
Permeate1
(3)n
i Ei
F J A=
= ∑
Re tentate Feed1
( ) (4)n
i HP i LP i Ei
F F f p x p y A=
= − −∑
1(5)
n
i i jj
y J J=
= ∑
Re tentate Feed 232 (6)h
l vp pdh
= −
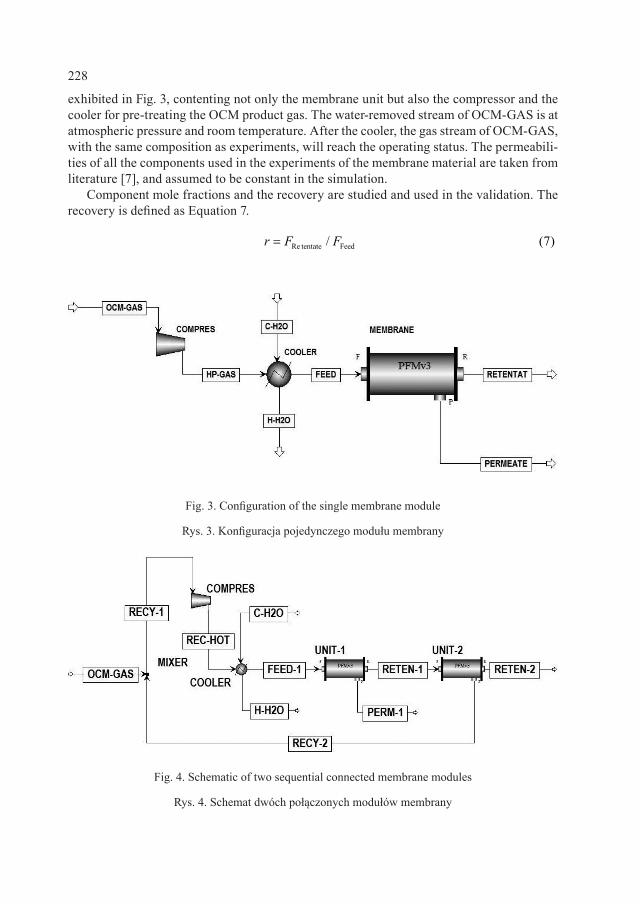
228
exhibited in Fig. 3, contenting not only the membrane unit but also the compressor and the cooler for pre-treating the OCM product gas. The water-removed stream of OCM-GAS is at atmospheric pressure and room temperature. After the cooler, the gas stream of OCM-GAS, with the same composition as experiments, will reach the operating status. The permeabili-ties of all the components used in the experiments of the membrane material are taken from literature [7], and assumed to be constant in the simulation.
Component mole fractions and the recovery are studied and used in the validation. The recovery is defined as Equation 7.
Fig. 3. Configuration of the single membrane module
Rys. 3. Konfiguracja pojedynczego modułu membrany
Fig. 4. Schematic of two sequential connected membrane modules
Rys. 4. Schemat dwóch połączonych modułów membrany
Re tentate Feed/ (7)r F F=
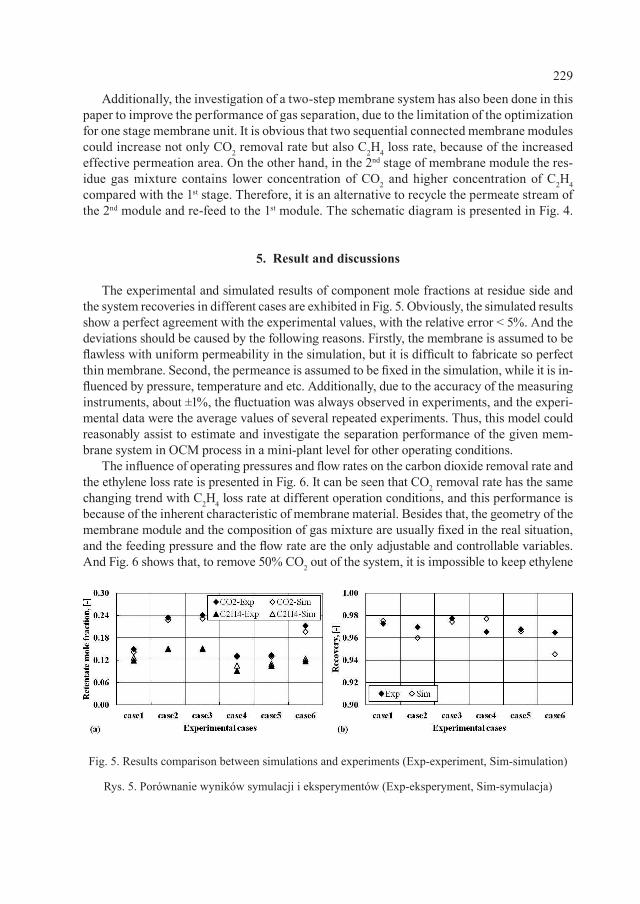
229
Additionally, the investigation of a two-step membrane system has also been done in this paper to improve the performance of gas separation, due to the limitation of the optimization for one stage membrane unit. It is obvious that two sequential connected membrane modules could increase not only CO2 removal rate but also C2H4 loss rate, because of the increased effective permeation area. On the other hand, in the 2nd stage of membrane module the res-idue gas mixture contains lower concentration of CO2 and higher concentration of C2H4 compared with the 1st stage. Therefore, it is an alternative to recycle the permeate stream of the 2nd module and re-feed to the 1st module. The schematic diagram is presented in Fig. 4.
5. Result and discussions
The experimental and simulated results of component mole fractions at residue side and the system recoveries in different cases are exhibited in Fig. 5. Obviously, the simulated results show a perfect agreement with the experimental values, with the relative error < 5%. And the deviations should be caused by the following reasons. Firstly, the membrane is assumed to be flawless with uniform permeability in the simulation, but it is difficult to fabricate so perfect thin membrane. Second, the permeance is assumed to be fixed in the simulation, while it is in-fluenced by pressure, temperature and etc. Additionally, due to the accuracy of the measuring instruments, about ±1%, the fluctuation was always observed in experiments, and the experi-mental data were the average values of several repeated experiments. Thus, this model could reasonably assist to estimate and investigate the separation performance of the given mem-brane system in OCM process in a mini-plant level for other operating conditions.
The influence of operating pressures and flow rates on the carbon dioxide removal rate and the ethylene loss rate is presented in Fig. 6. It can be seen that CO2 removal rate has the same changing trend with C2H4 loss rate at different operation conditions, and this performance is because of the inherent characteristic of membrane material. Besides that, the geometry of the membrane module and the composition of gas mixture are usually fixed in the real situation, and the feeding pressure and the flow rate are the only adjustable and controllable variables. And Fig. 6 shows that, to remove 50% CO2 out of the system, it is impossible to keep ethylene
Fig. 5. Results comparison between simulations and experiments (Exp-experiment, Sim-simulation)
Rys. 5. Porównanie wyników symulacji i eksperymentów (Exp-eksperyment, Sim-symulacja)
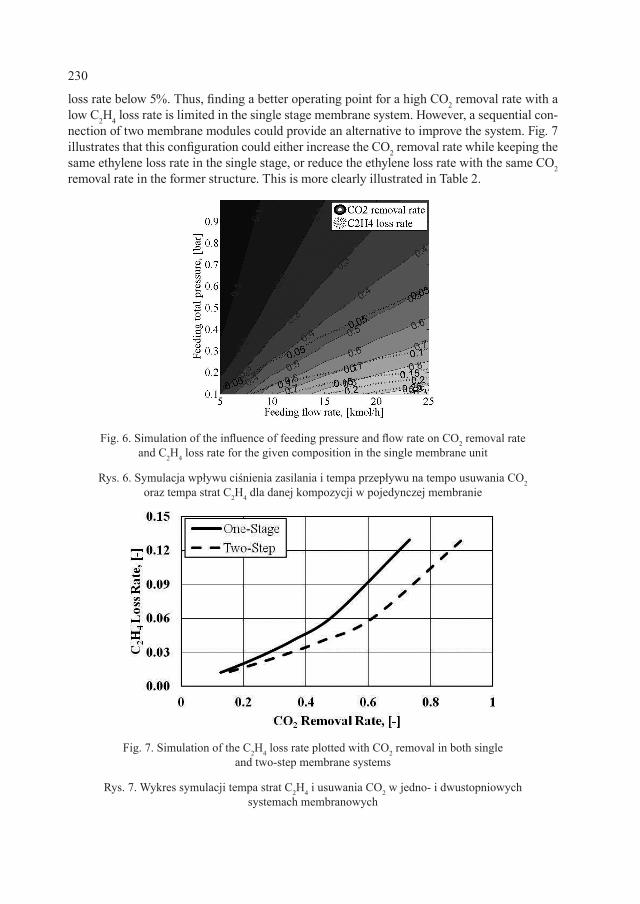
230
loss rate below 5%. Thus, finding a better operating point for a high CO2 removal rate with a low C2H4 loss rate is limited in the single stage membrane system. However, a sequential con-nection of two membrane modules could provide an alternative to improve the system. Fig. 7 illustrates that this configuration could either increase the CO2 removal rate while keeping the same ethylene loss rate in the single stage, or reduce the ethylene loss rate with the same CO2 removal rate in the former structure. This is more clearly illustrated in Table 2.
Fig. 6. Simulation of the influence of feeding pressure and flow rate on CO2 removal rate and C2H4 loss rate for the given composition in the single membrane unit
Rys. 6. Symulacja wpływu ciśnienia zasilania i tempa przepływu na tempo usuwania CO2 oraz tempa strat C2H4 dla danej kompozycji w pojedynczej membranie
Fig. 7. Simulation of the C2H4 loss rate plotted with CO2 removal in both single and two-step membrane systems
Rys. 7. Wykres symulacji tempa strat C2H4 i usuwania CO2 w jedno- i dwustopniowych systemach membranowych
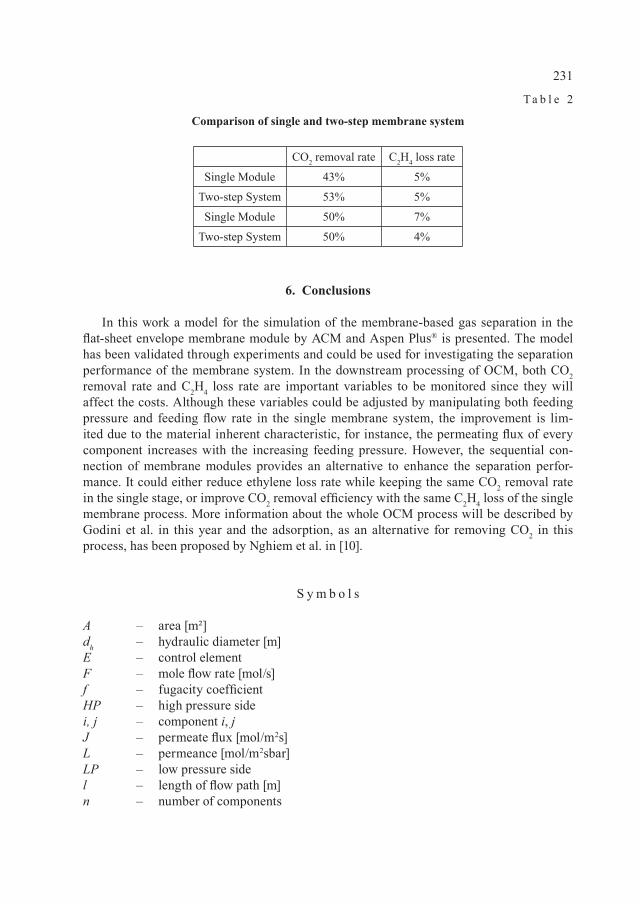
231
T a b l e 2
Comparison of single and two-step membrane system
CO2 removal rate C2H4 loss rate
Single Module 43% 5%
Two-step System 53% 5%
Single Module 50% 7%
Two-step System 50% 4%
6. Conclusions
In this work a model for the simulation of the membrane-based gas separation in the flat-sheet envelope membrane module by ACM and Aspen Plus® is presented. The model has been validated through experiments and could be used for investigating the separation performance of the membrane system. In the downstream processing of OCM, both CO2 removal rate and C2H4 loss rate are important variables to be monitored since they will affect the costs. Although these variables could be adjusted by manipulating both feeding pressure and feeding flow rate in the single membrane system, the improvement is lim-ited due to the material inherent characteristic, for instance, the permeating flux of every component increases with the increasing feeding pressure. However, the sequential con-nection of membrane modules provides an alternative to enhance the separation perfor-mance. It could either reduce ethylene loss rate while keeping the same CO2 removal rate in the single stage, or improve CO2 removal efficiency with the same C2H4 loss of the single membrane process. More information about the whole OCM process will be described by Godini et al. in this year and the adsorption, as an alternative for removing CO2 in this process, has been proposed by Nghiem et al. in [10].
S y m b o l s
A – area [m²]dh – hydraulic diameter [m]E – control element F – mole flow rate [mol/s]f – fugacity coefficient HP – high pressure side i, j – component i, j J – permeate flux [mol/m2s]L – permeance [mol/m2sbar]LP – low pressure side l – length of flow path [m]n – number of components
232
P – permeability coefficient [mol m/m2sbar]p – total pressure [bar]pi – partial pressure of component i [bar]r – recovery v – average velocity [m/s]x – mole fraction at high pressure side y – mole fraction at low pressure side δ – thickness of membrane selective layer [m]η – viscosity [bar·s]
The authors acknowledge support from the Cluster of Excellence “Unifying Concepts in Catalysis” coordinated by the Technische Universität Berlin and funded by the German Research Foundation - Deutsche Forschungsgemeinschaft.
R e f e r e n c e s
[1] Baker R. , Lokhandwala K. , Natural Gas Processing with Membranes: An Over-view, Ind. Eng. Chem., 47, 2008, 2109-2121.
[2] Kondratenko E. , Baerns M., Oxidative Coupling of Methane, Handbook of Hetero-geneous Catalysis, 2008, 3010-3023.
[3] Jaso S. , Godini H. , Arel lano-Garcia H. , Wozny G. , Oxidative Coupling of methane: Reactor Performance and Operating Conditions, Computer Aided Chemical Engineering, 28, 2010, 781-786.
[4] Lunsford J . , The catalytic Oxidative Coupling of Methane, Angew. Chem. Int. Ed. Engl., 34, 1995, 970-980.
[5] Baker R. , Future Directions of Membrane Gas Separation Technology, Ind. Eng. Chem., 41, 2002, 1393-1411.
[6] Brunet t i A. , Scura F. , Barbietr i G. , Driol i E. , Membrane technologies for CO2 separation, Journal of Membrane Science, 359, 2010, 115-125.
[7] Abertz V. , Brinkmann T. e t a l . , Developments in Membrane Research: from Ma-terial via Process Design to Industrial Application, Advanced Engineering Materials, 8, 2006, 328-357.
[8] Wijmans J . , Baker R. , The solution-diffusion model: a review, Journal of Membrane Science, 107, 1995, 1-21.
[9] Ohlrogge K. , Ebert K. , Membranen: Grundlagen, Verfahren und industrielle Anwendungen, WILEY-VCH, 2006.
[10] Nghiem X. , Arel lano-Garcia H. , Wozny G. , Adsorptive Separation In the Downstream of the Oxidative Methane Coupling Process, AIChE Annual Meeting, 2011.
XUAN NGHIEM SON, ARELLANO-GARCIA HARVEY, GÜNTER WOZNY*, TRUNG KIEN TRAN**1
OXIDATIVE COUPLING OF METHANE: A NEW PROCESS CONCEPT FOR THE IMPROVEMENT OF THE DOWNSTREAM PROCESSING BY USING ADSORPTION
OKSYDACYJNE SPRZĘŻENIE METANU: NOWA PROCESOWA KONCEPCJA DOSKONALENIA
PÓŹNIEJSZYCH ETAPÓW PRZETWARZANIA ROPY Z ZASTOSOWANIEM ADSORPCJI
A b s t r a c t
This paper, inspired by the success of adsorptive air separation in big scale (up to 250 tons/day), looks into the possibility of replacing cryogenic distillation with adsorptive separation, and thus improving the do-wnstream processing of OCM. This results in a new process concept. For this purpose, a plug flow mo-del of fixed-bed adsorber was developed and several separation schemes were investigated via simulation. Among them, the simultaneously separation of ethylene and carbon dioxide using zeolite 4A is found re-alizable. The results show that by switching from cryogenic distillation to adsorption, separation cost can be significantly reduced.
Keywords: OCM, adsorption, ethylene separation, carbon dioxide removal
S t r e s z c z e n i e
W artykule niniejszym, zainspirowany sukcesem adsorpcyjnego oddzielania powietrza na wielką skalę (do 250 ton dziennie), rozważa się możliwość zastępowania destylacji kriogenicznej oddzielaniem adsorpcyjnym i – co za tym idzie – doskonalenia końcowych etapów procesu OCM. W rezultacie powstaje nowa koncepcja proceso-wa. W związku z tym opracowano nowy model adsorbera oraz zbadano symulacyjnie kilka schematów oddzie-lania. Spośród nich za możliwy do zrealizowania uznano symultaniczne oddzielanie etylenu i dwutlenku węgla z zastosowaniem zeolitu 4A. Wyniki eksperymentów udowadniają, że dzięki przejściu od destylacji kriogenicz-nej do adsorpcji koszt oddzielania może ulec znacznemu ograniczeniu.Słowa kluczowe: OCM, adsorpcja, oddzielanie etylenu, usuwanie dwutlenku węgla
* MSc. Xuan Nghiem Son, PhD. Eng. Arellano-Garcia Harvey, Prof. PhD. Eng. Günter Wozny, Chair of Process Dynamics and Operations, TU Berlin.
** Prof. PhD. Eng. Trung Kien Tran, School of Chemical Engineering, Hanoi University of Science and Technology.
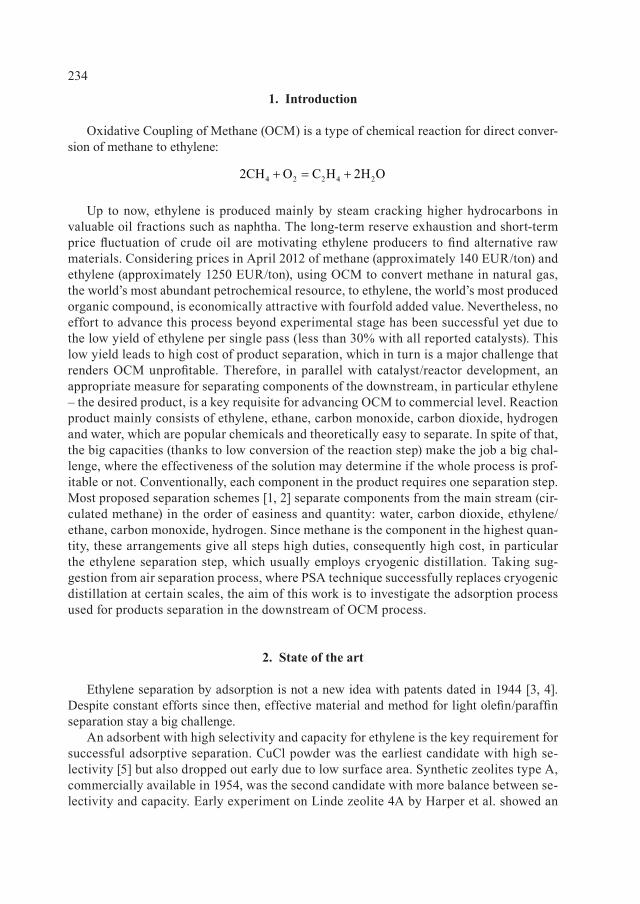
234
1. Introduction
Oxidative Coupling of Methane (OCM) is a type of chemical reaction for direct conver-sion of methane to ethylene:
Up to now, ethylene is produced mainly by steam cracking higher hydrocarbons in valuable oil fractions such as naphtha. The long-term reserve exhaustion and short-term price fluctuation of crude oil are motivating ethylene producers to find alternative raw materials. Considering prices in April 2012 of methane (approximately 140 EUR/ton) and ethylene (approximately 1250 EUR/ton), using OCM to convert methane in natural gas, the world’s most abundant petrochemical resource, to ethylene, the world’s most produced organic compound, is economically attractive with fourfold added value. Nevertheless, no effort to advance this process beyond experimental stage has been successful yet due to the low yield of ethylene per single pass (less than 30% with all reported catalysts). This low yield leads to high cost of product separation, which in turn is a major challenge that renders OCM unprofitable. Therefore, in parallel with catalyst/reactor development, an appropriate measure for separating components of the downstream, in particular ethylene – the desired product, is a key requisite for advancing OCM to commercial level. Reaction product mainly consists of ethylene, ethane, carbon monoxide, carbon dioxide, hydrogen and water, which are popular chemicals and theoretically easy to separate. In spite of that, the big capacities (thanks to low conversion of the reaction step) make the job a big chal-lenge, where the effectiveness of the solution may determine if the whole process is prof-itable or not. Conventionally, each component in the product requires one separation step. Most proposed separation schemes [1, 2] separate components from the main stream (cir-culated methane) in the order of easiness and quantity: water, carbon dioxide, ethylene/ethane, carbon monoxide, hydrogen. Since methane is the component in the highest quan-tity, these arrangements give all steps high duties, consequently high cost, in particular the ethylene separation step, which usually employs cryogenic distillation. Taking sug-gestion from air separation process, where PSA technique successfully replaces cryogenic distillation at certain scales, the aim of this work is to investigate the adsorption process used for products separation in the downstream of OCM process.
2. State of the art
Ethylene separation by adsorption is not a new idea with patents dated in 1944 [3, 4]. Despite constant efforts since then, effective material and method for light olefin/paraffin separation stay a big challenge.
An adsorbent with high selectivity and capacity for ethylene is the key requirement for successful adsorptive separation. CuCl powder was the earliest candidate with high se-lectivity [5] but also dropped out early due to low surface area. Synthetic zeolites type A, commercially available in 1954, was the second candidate with more balance between se-lectivity and capacity. Early experiment on Linde zeolite 4A by Harper et al. showed an
4 2 2 4 22CH O C H 2H O+ = +
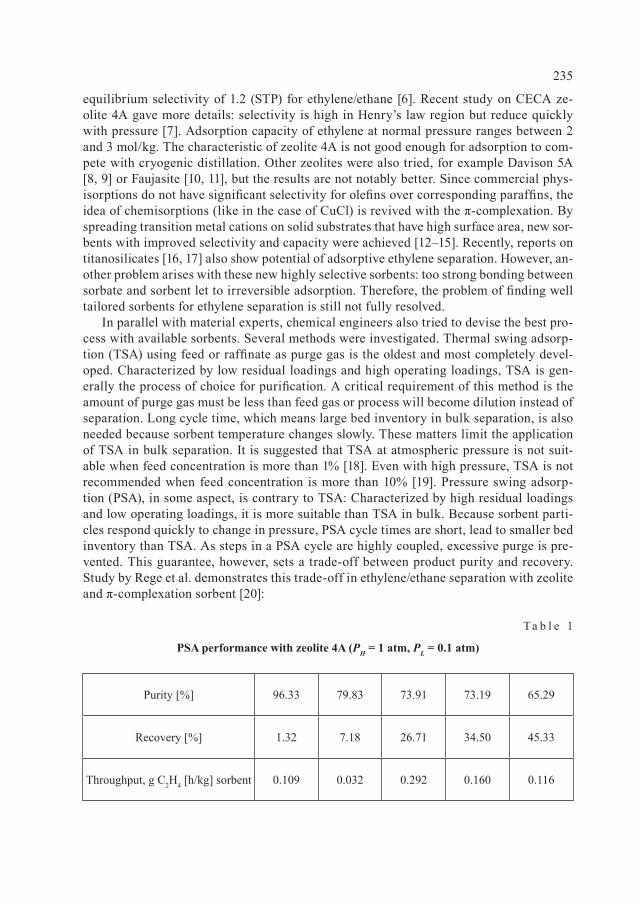
235
equilibrium selectivity of 1.2 (STP) for ethylene/ethane [6]. Recent study on CECA ze-olite 4A gave more details: selectivity is high in Henry’s law region but reduce quickly with pressure [7]. Adsorption capacity of ethylene at normal pressure ranges between 2 and 3 mol/kg. The characteristic of zeolite 4A is not good enough for adsorption to com-pete with cryogenic distillation. Other zeolites were also tried, for example Davison 5A [8, 9] or Faujasite [10, 11], but the results are not notably better. Since commercial phys-isorptions do not have significant selectivity for olefins over corresponding paraffins, the idea of chemisorptions (like in the case of CuCl) is revived with the π-complexation. By spreading transition metal cations on solid substrates that have high surface area, new sor-bents with improved selectivity and capacity were achieved [12–15]. Recently, reports on titanosilicates [16, 17] also show potential of adsorptive ethylene separation. However, an-other problem arises with these new highly selective sorbents: too strong bonding between sorbate and sorbent let to irreversible adsorption. Therefore, the problem of finding well tailored sorbents for ethylene separation is still not fully resolved.
In parallel with material experts, chemical engineers also tried to devise the best pro-cess with available sorbents. Several methods were investigated. Thermal swing adsorp-tion (TSA) using feed or raffinate as purge gas is the oldest and most completely devel-oped. Characterized by low residual loadings and high operating loadings, TSA is gen-erally the process of choice for purification. A critical requirement of this method is the amount of purge gas must be less than feed gas or process will become dilution instead of separation. Long cycle time, which means large bed inventory in bulk separation, is also needed because sorbent temperature changes slowly. These matters limit the application of TSA in bulk separation. It is suggested that TSA at atmospheric pressure is not suit-able when feed concentration is more than 1% [18]. Even with high pressure, TSA is not recommended when feed concentration is more than 10% [19]. Pressure swing adsorp-tion (PSA), in some aspect, is contrary to TSA: Characterized by high residual loadings and low operating loadings, it is more suitable than TSA in bulk. Because sorbent parti-cles respond quickly to change in pressure, PSA cycle times are short, lead to smaller bed inventory than TSA. As steps in a PSA cycle are highly coupled, excessive purge is pre-vented. This guarantee, however, sets a trade-off between product purity and recovery. Study by Rege et al. demonstrates this trade-off in ethylene/ethane separation with zeolite and π-complexation sorbent [20]:
T a b l e 1
PSA performance with zeolite 4A (PH = 1 atm, PL = 0.1 atm)
Purity [%] 96.33 79.83 73.91 73.19 65.29
Recovery [%] 1.32 7.18 26.71 34.50 45.33
Throughput, g C2H4 [h/kg] sorbent 0.109 0.032 0.292 0.160 0.116
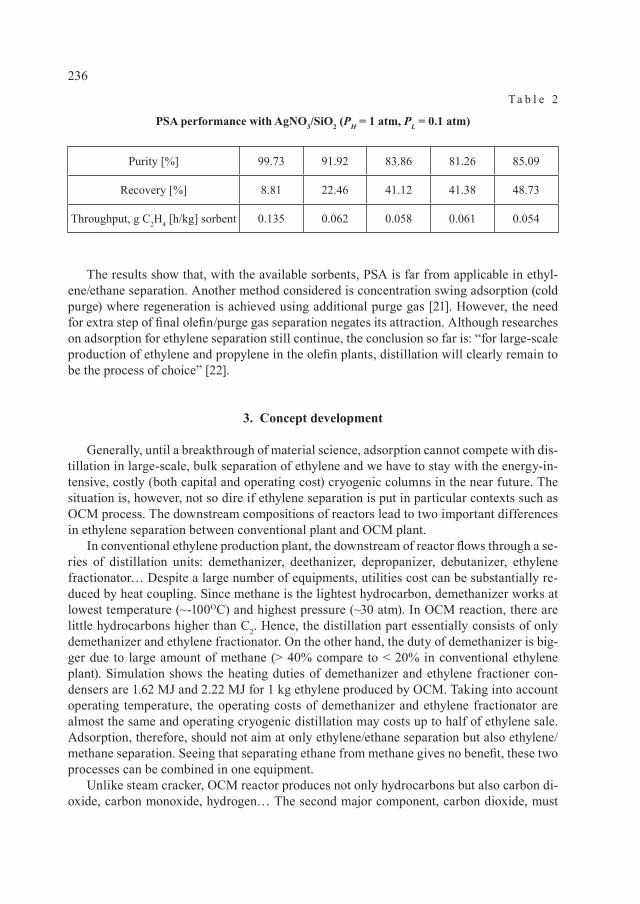
236
T a b l e 2
PSA performance with AgNO3/SiO2 (PH = 1 atm, PL = 0.1 atm)
Purity [%] 99.73 91.92 83.86 81.26 85.09
Recovery [%] 8.81 22.46 41.12 41.38 48.73
Throughput, g C2H4 [h/kg] sorbent 0.135 0.062 0.058 0.061 0.054
The results show that, with the available sorbents, PSA is far from applicable in ethyl-ene/ethane separation. Another method considered is concentration swing adsorption (cold purge) where regeneration is achieved using additional purge gas [21]. However, the need for extra step of final olefin/purge gas separation negates its attraction. Although researches on adsorption for ethylene separation still continue, the conclusion so far is: “for large-scale production of ethylene and propylene in the olefin plants, distillation will clearly remain to be the process of choice” [22].
3. Concept development
Generally, until a breakthrough of material science, adsorption cannot compete with dis-tillation in large-scale, bulk separation of ethylene and we have to stay with the energy-in-tensive, costly (both capital and operating cost) cryogenic columns in the near future. The situation is, however, not so dire if ethylene separation is put in particular contexts such as OCM process. The downstream compositions of reactors lead to two important differences in ethylene separation between conventional plant and OCM plant.
In conventional ethylene production plant, the downstream of reactor flows through a se-ries of distillation units: demethanizer, deethanizer, depropanizer, debutanizer, ethylene fractionator… Despite a large number of equipments, utilities cost can be substantially re-duced by heat coupling. Since methane is the lightest hydrocarbon, demethanizer works at lowest temperature (~-100OC) and highest pressure (~30 atm). In OCM reaction, there are little hydrocarbons higher than C2. Hence, the distillation part essentially consists of only demethanizer and ethylene fractionator. On the other hand, the duty of demethanizer is big-ger due to large amount of methane (> 40% compare to < 20% in conventional ethylene plant). Simulation shows the heating duties of demethanizer and ethylene fractioner con-densers are 1.62 MJ and 2.22 MJ for 1 kg ethylene produced by OCM. Taking into account operating temperature, the operating costs of demethanizer and ethylene fractionator are almost the same and operating cryogenic distillation may costs up to half of ethylene sale. Adsorption, therefore, should not aim at only ethylene/ethane separation but also ethylene/methane separation. Seeing that separating ethane from methane gives no benefit, these two processes can be combined in one equipment.
Unlike steam cracker, OCM reactor produces not only hydrocarbons but also carbon di-oxide, carbon monoxide, hydrogen… The second major component, carbon dioxide, must
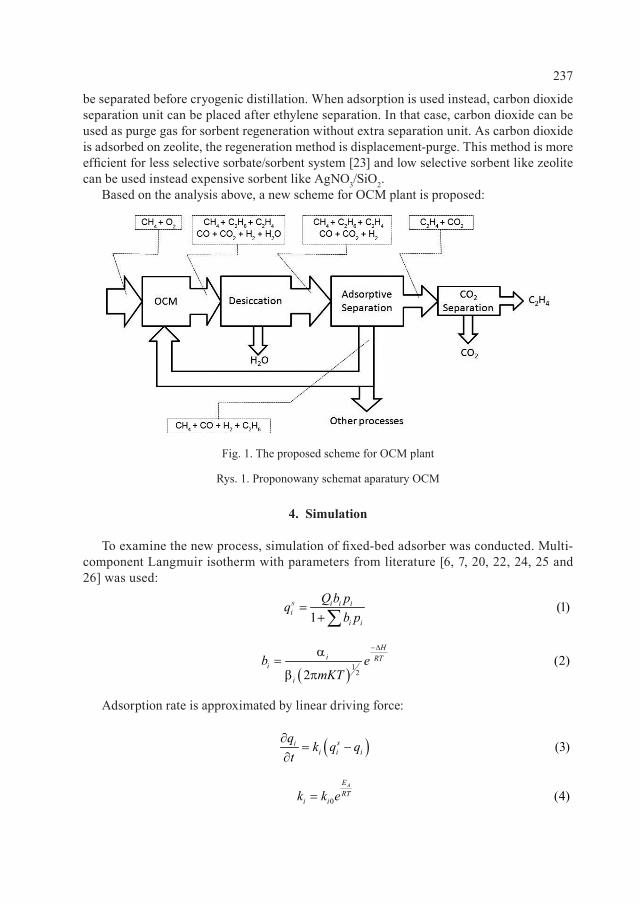
237
be separated before cryogenic distillation. When adsorption is used instead, carbon dioxide separation unit can be placed after ethylene separation. In that case, carbon dioxide can be used as purge gas for sorbent regeneration without extra separation unit. As carbon dioxide is adsorbed on zeolite, the regeneration method is displacement-purge. This method is more efficient for less selective sorbate/sorbent system [23] and low selective sorbent like zeolite can be used instead expensive sorbent like AgNO3/SiO2.
Based on the analysis above, a new scheme for OCM plant is proposed:
4. Simulation
To examine the new process, simulation of fixed-bed adsorber was conducted. Multi-component Langmuir isotherm with parameters from literature [6, 7, 20, 22, 24, 25 and 26] was used:
Adsorption rate is approximated by linear driving force:
Fig. 1. The proposed scheme for OCM plant
Rys. 1. Proponowany schemat aparatury OCM
(1)1
s i i ii
i i
Q b pq
b p=
+∑
( )1
2(2)
2
Hi RT
i
i
b emKT
−∆α=b π
( ) (3)sii i i
qk q q
t∂
= −∂
0 (4)AE
RTi ik k e=
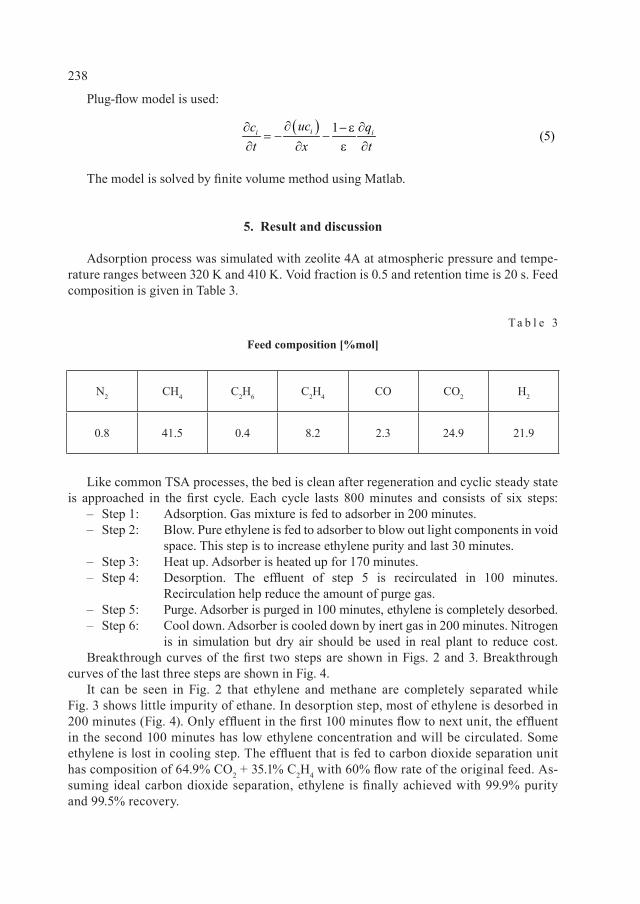
238
Plug-flow model is used:
The model is solved by finite volume method using Matlab.
5. Result and discussion
Adsorption process was simulated with zeolite 4A at atmospheric pressure and tempe-rature ranges between 320 K and 410 K. Void fraction is 0.5 and retention time is 20 s. Feed composition is given in Table 3.
T a b l e 3
Feed composition [%mol]
N2 CH4 C2H6 C2H4 CO CO2 H2
0.8 41.5 0.4 8.2 2.3 24.9 21.9
Like common TSA processes, the bed is clean after regeneration and cyclic steady state is approached in the first cycle. Each cycle lasts 800 minutes and consists of six steps:
– Step 1: Adsorption. Gas mixture is fed to adsorber in 200 minutes. – Step 2: Blow. Pure ethylene is fed to adsorber to blow out light components in void
space. This step is to increase ethylene purity and last 30 minutes. – Step 3: Heat up. Adsorber is heated up for 170 minutes. – Step 4: Desorption. The effluent of step 5 is recirculated in 100 minutes.
Recirculation help reduce the amount of purge gas. – Step 5: Purge. Adsorber is purged in 100 minutes, ethylene is completely desorbed. – Step 6: Cool down. Adsorber is cooled down by inert gas in 200 minutes. Nitrogen
is in simulation but dry air should be used in real plant to reduce cost.Breakthrough curves of the first two steps are shown in Figs. 2 and 3. Breakthrough
curves of the last three steps are shown in Fig. 4.It can be seen in Fig. 2 that ethylene and methane are completely separated while
Fig. 3 shows little impurity of ethane. In desorption step, most of ethylene is desorbed in 200 minutes (Fig. 4). Only effluent in the first 100 minutes flow to next unit, the effluent in the second 100 minutes has low ethylene concentration and will be circulated. Some ethylene is lost in cooling step. The effluent that is fed to carbon dioxide separation unit has composition of 64.9% CO2 + 35.1% C2H4 with 60% flow rate of the original feed. As-suming ideal carbon dioxide separation, ethylene is finally achieved with 99.9% purity and 99.5% recovery.
( ) 1 (5)ii iucc qt x t
∂∂ ∂− ε= − −
∂ ∂ ε ∂
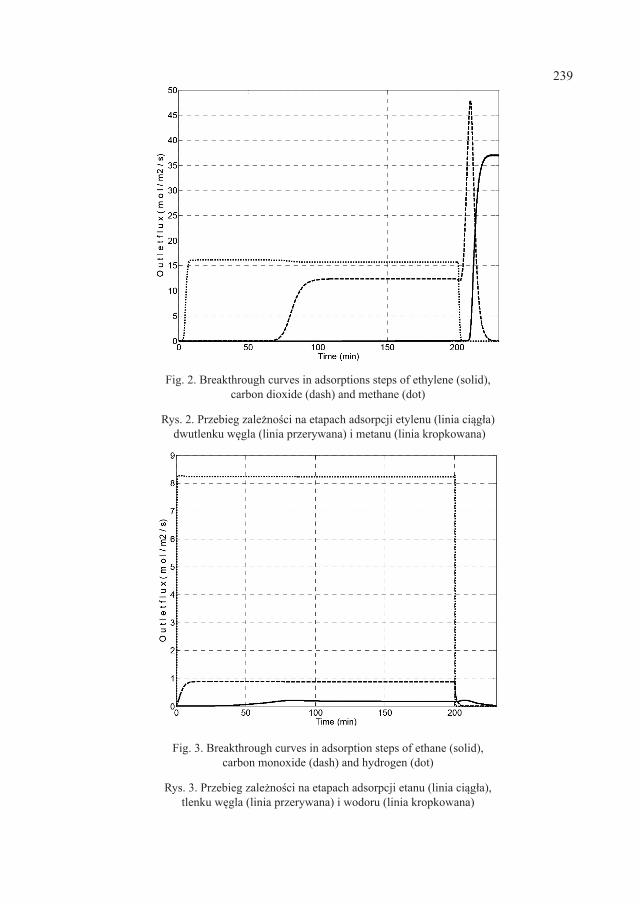
239
Fig. 2. Breakthrough curves in adsorptions steps of ethylene (solid), carbon dioxide (dash) and methane (dot)
Rys. 2. Przebieg zależności na etapach adsorpcji etylenu (linia ciągła) dwutlenku węgla (linia przerywana) i metanu (linia kropkowana)
Fig. 3. Breakthrough curves in adsorption steps of ethane (solid), carbon monoxide (dash) and hydrogen (dot)
Rys. 3. Przebieg zależności na etapach adsorpcji etanu (linia ciągła), tlenku węgla (linia przerywana) i wodoru (linia kropkowana)
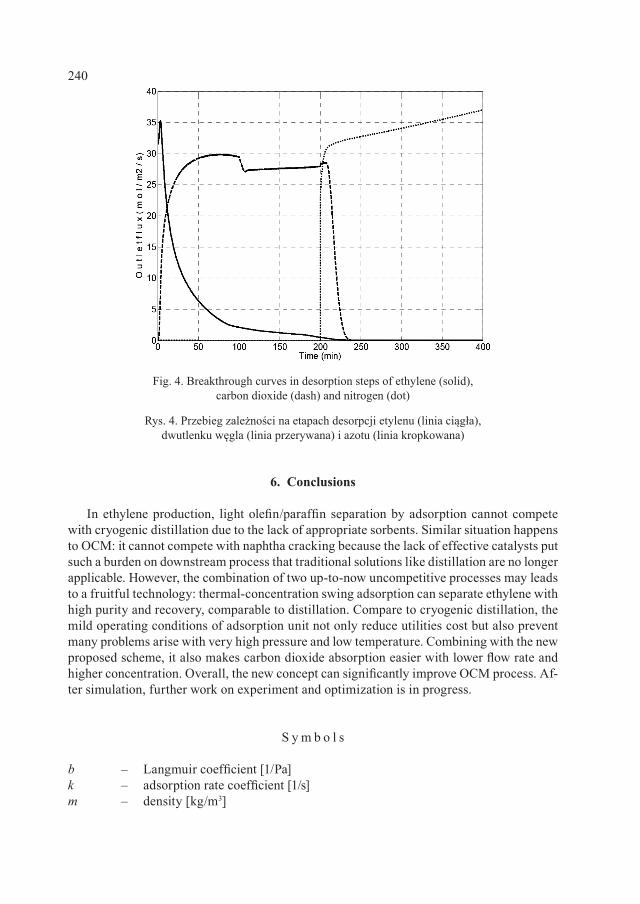
240
6. Conclusions
In ethylene production, light olefin/paraffin separation by adsorption cannot compete with cryogenic distillation due to the lack of appropriate sorbents. Similar situation happens to OCM: it cannot compete with naphtha cracking because the lack of effective catalysts put such a burden on downstream process that traditional solutions like distillation are no longer applicable. However, the combination of two up-to-now uncompetitive processes may leads to a fruitful technology: thermal-concentration swing adsorption can separate ethylene with high purity and recovery, comparable to distillation. Compare to cryogenic distillation, the mild operating conditions of adsorption unit not only reduce utilities cost but also prevent many problems arise with very high pressure and low temperature. Combining with the new proposed scheme, it also makes carbon dioxide absorption easier with lower flow rate and higher concentration. Overall, the new concept can significantly improve OCM process. Af-ter simulation, further work on experiment and optimization is in progress.
S y m b o l s
b – Langmuir coefficient [1/Pa]k – adsorption rate coefficient [1/s]m – density [kg/m3]
Fig. 4. Breakthrough curves in desorption steps of ethylene (solid), carbon dioxide (dash) and nitrogen (dot)
Rys. 4. Przebieg zależności na etapach desorpcji etylenu (linia ciągła), dwutlenku węgla (linia przerywana) i azotu (linia kropkowana)
241
q – adsorbed phase concentration [mol/kg]qs – saturated adsorbed phase concentration [mol/kg]t – time [s]x – axial coordinate [m]EA – activation energy [J/mol]K – Boltzman constant [J/K]R – gas constant [J/K.mol]Q – maximum adsorbed phase concentration [mol/kg]T – absolute temperature [K]α – sticking probability β – desorption constant [1/s]ε – void fraction ΔH – adsorption heat [J/mol]i – component index (subscript) OCM – Oxidative Coupling of Methan PSA – Pressure Swing Adsorption STP – Standard Temperature and Pressure TSA – Thermal Swing Adsorption
R e f e r e n c e s
[1] Vereshchagin S.N. , Gupalov V.K. , Ansimov L.N. , Terekhin N.A. , Kovri-gin L.A. , Kir ik N.P. , Kondratenko E.V. , Anhits A.G. , Catalysis Today, 42, 1998, 361-365.
[2] Stünkel S. , Li tzman O. , Repke J .U. , Wozny G. , Modelling and Simulation of a Hybrid Separation Process for the Carbon Dioxide Removal of the Oxidative Cou-pling of Methane Process, ESCAPE 19, 2009.
[3] Kiesskal t S. , Process of Adsorbing Gases and Vapors, US Patent, US2354383, 1944.[4] Kiesskal t S. , Kruta E. , Quednau H. , Patat F. , Process of Adsorbing Gases and
Vapors, US Patent, US2349098, 1944.[5] Gil l i land E.R. , Bl iss H.L. , Kip C.E. , Journal of the American Chemical Society,
63, 1941, 2088-2090.[6] Harper R.J . , St i fe l G.R. , Anderson R.B. , Canadian Journal of Chemistry, 47,
1969, 4661-4670.[7] Romero-Pérez A. , Aguilar-Armenta G. , Journal of Chemical and Engineering
Data, 55, 2010, 3625-3630.[8] Youngquis t G.R. , Allen J .L. , Eisenberg J . , Industrial and Engineering Chemis-
try Product Research and Development, 10, 1971, 308-314.[9] Ruthven D.M., Derrah R.I . , Canadian Journal of Chemistry, 50, 1972, 743-747.[10] Hyun S.H. , Danner R.P. , Journal of Chemical and Engineering Data, 27, 1982, 196-
200.[11] Sue-aok N. , Sr i thanratana T. , Rangsr iwatananon K. , Hengrasmee S. ,
Applied Surface Science, 256, 2010, 3997-4002.[12] Cheng L.S. , Yang R.T. , Adsorption, 1, 1995, 61-75.
242
[13] Yang R.T. , Kikkinides E.S. , AIChE Journal, 41, 1995, 509-517.[14] Wu Z. , Han S.S. , Cho S.H. , Kim J .N. , Chue K.T. , Yang R.T. , Industrial and
Engineering Chemistry Research, 36, 1997, 2749-2756.[15] Net tem V. Choudary, Prakash Kumar, Thirumaleshwara, Bhat S.G. , Soon
H. Cho, Sang S. Han, Jong N.K. , Industrial and Engineering Chemistry Research, 41, 2002, 2728-2734.
[16] Al-Baghli N.A. , Loughlin K.F. , Journal of Chemical and Engineering Data, 51, 2006, 248-254.
[17] Anson A. , Wang Y. , Lin C.C.H. , Kuznicki T.M., Kuznicki S.M., Chemical Engineering Science, 63, 2008, 4171-4175.
[18] Basmadjian D. , Ha K.D. , Industrial and Engineering Chemistry Process Design and Development, 14, 1975, 328-347.
[19] Keller G.E. , Anderson R.A. , Yon C.M., Handbook of Separation Technology, Adsorption, Wiley-Interscience, New York 1987.
[20] Rege S.U. , Padin J . , Yang R.T. , AIChE Journal, 44, 1998, 799-809.[21] Thomas W.J. , Cri t tenden B. , Adsorption Technology and Design, Butterworth-
Heinemann, Oxford 1998.[22] Yang R.T. , Adsorbent: Fundamentals and Applications, Wiley-Interscience, 2003.[23] Sircar S. , Kumar R. , Industrial and Engineering Chemistry Process Design and De-
velopment, 24, 1985, 358-364.[24] Triebe R.W., Tezel F.H. , Gas Separation and Purification, 9, 1995, 223-230.[25] Moore T.T. , Koros W.J . , Journal of Applied Polymer Science, 104, 2007, 4053-4059.[26] Meng H. , Sorption Equilibria and Kinetics of Sequential Sorption in Zeolite Molecu-
lar Sieve, Doctor Thesis, McMaster University, Ontario 1984.
BARBARA TAL-FIGIEL, MAGDALENA KWIECIEŃ, WIESŁAW FIGIEL*1
THE INFLUENCE OF PRODUCTION PROCESS CONDITIONS ON THE
RHEOLOGICAL PROPERTIES OF PASTES
WPŁYW WARUNKÓW PROCESOWYCH, W TOKU WYTWARZANIA, NA PARAMETRY
REOLOGICZNE MATERIAŁÓW PASTOWATYCH
A b s t r a c t
Pastes are multiphase systems which are frequently encountered in the food, cosmetics and pharmaceutical industries. Their production is a difficult process, due to their non-newtonian character and also because of limited stability of many active substances which have to be in-cluded in the commercial product. Therefore highly intensive and prolonged mixing is not re-commended for their production. In this work investigation of process condition influence on the rheological parameters of final product have been carried on. The results obtained using pharmaceutical ointment bases as a test fluids, show importance of the preparation method.Keywords: pastes, pharmaceutical mixer, rheology
S t r e s z c z e n i e
Pasty są wielofazowymi układami często spotykanymi w przemysłach spożywczym, kosme-tycznym i farmaceutycznym. Ich wytwarzanie jest trudnym procesem, wynikającym z ich nie-netonowskiego charakteru, jak również z ograniczonej stabilności wielu substancji aktywnych, które wchodzą w skład handlowego produktu. W związku z tym długotrwałe i intensywne mie-szanie powinno być ograniczane podczas ich wytwarzania. W niniejszym artykule przeprowa-dzono badania wpływu warunków procesowych na parametry reologiczne końcowego produk-tu, maści farmaceutycznych wykonanych za pomocą miksera recepturowego. Wyniki uzyskane z wykorzystaniem baz maściowych wskazują na duże znaczenie metody ich przygotowania.Słowa kluczowe: pasty, mikser recepturowy, reologia
* Prof. PhD. Eng. Barbara Tal-Figiel, Magdalena Kwiecień, PhD. Eng. Wiesław Figiel, Faculty of Chemical Engineering and Technology, Cracow University of Technology.
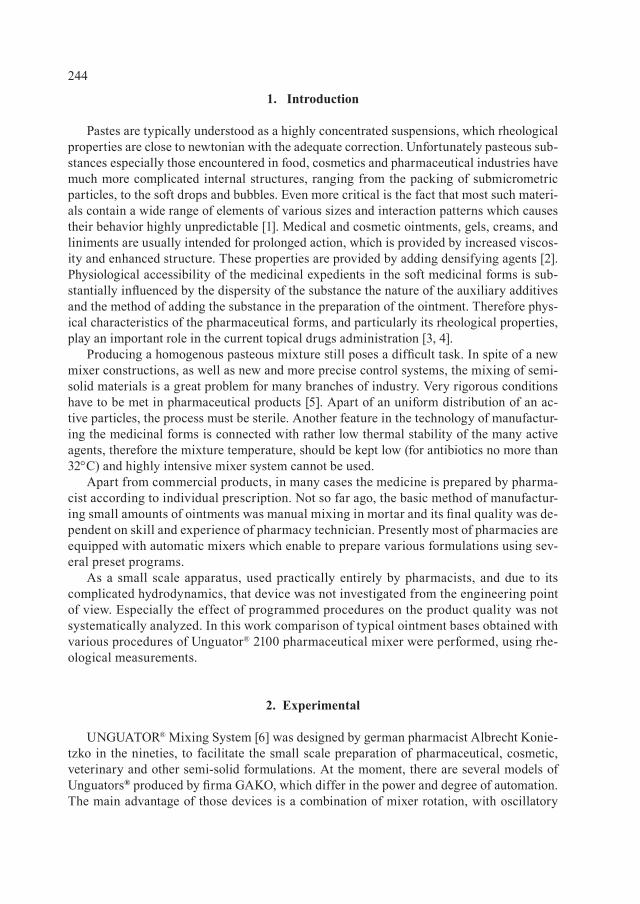
244
1. Introduction
Pastes are typically understood as a highly concentrated suspensions, which rheological properties are close to newtonian with the adequate correction. Unfortunately pasteous sub-stances especially those encountered in food, cosmetics and pharmaceutical industries have much more complicated internal structures, ranging from the packing of submicrometric particles, to the soft drops and bubbles. Even more critical is the fact that most such materi-als contain a wide range of elements of various sizes and interaction patterns which causes their behavior highly unpredictable [1]. Medical and cosmetic ointments, gels, creams, and liniments are usually intended for prolonged action, which is provided by increased viscos-ity and enhanced structure. These properties are provided by adding densifying agents [2]. Physiological accessibility of the medicinal expedients in the soft medicinal forms is sub-stantially influenced by the dispersity of the substance the nature of the auxiliary additives and the method of adding the substance in the preparation of the ointment. Therefore phys-ical characteristics of the pharmaceutical forms, and particularly its rheological properties, play an important role in the current topical drugs administration [3, 4].
Producing a homogenous pasteous mixture still poses a difficult task. In spite of a new mixer constructions, as well as new and more precise control systems, the mixing of semi-solid materials is a great problem for many branches of industry. Very rigorous conditions have to be met in pharmaceutical products [5]. Apart of an uniform distribution of an ac-tive particles, the process must be sterile. Another feature in the technology of manufactur-ing the medicinal forms is connected with rather low thermal stability of the many active agents, therefore the mixture temperature, should be kept low (for antibiotics no more than 32°C) and highly intensive mixer system cannot be used.
Apart from commercial products, in many cases the medicine is prepared by pharma-cist according to individual prescription. Not so far ago, the basic method of manufactur-ing small amounts of ointments was manual mixing in mortar and its final quality was de-pendent on skill and experience of pharmacy technician. Presently most of pharmacies are equipped with automatic mixers which enable to prepare various formulations using sev-eral preset programs.
As a small scale apparatus, used practically entirely by pharmacists, and due to its complicated hydrodynamics, that device was not investigated from the engineering point of view. Especially the effect of programmed procedures on the product quality was not systematically analyzed. In this work comparison of typical ointment bases obtained with various procedures of Unguator® 2100 pharmaceutical mixer were performed, using rhe-ological measurements.
2. Experimental
UNGUATOR® Mixing System [6] was designed by german pharmacist Albrecht Konie-tzko in the nineties, to facilitate the small scale preparation of pharmaceutical, cosmetic, veterinary and other semi-solid formulations. At the moment, there are several models of Unguators® produced by firma GAKO, which differ in the power and degree of automation. The main advantage of those devices is a combination of mixer rotation, with oscillatory
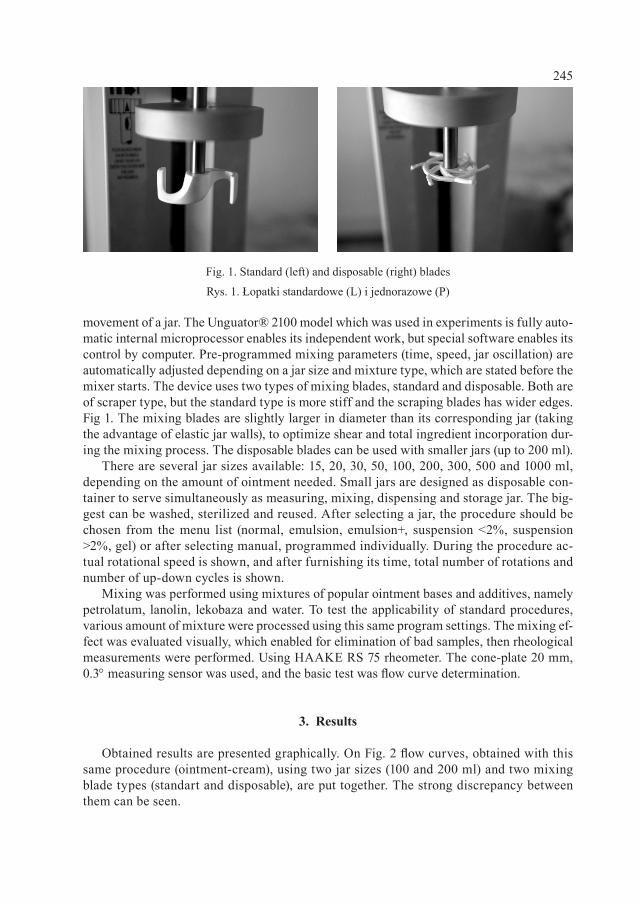
245
movement of a jar. The Unguator® 2100 model which was used in experiments is fully auto-matic internal microprocessor enables its independent work, but special software enables its control by computer. Pre-programmed mixing parameters (time, speed, jar oscillation) are automatically adjusted depending on a jar size and mixture type, which are stated before the mixer starts. The device uses two types of mixing blades, standard and disposable. Both are of scraper type, but the standard type is more stiff and the scraping blades has wider edges. Fig 1. The mixing blades are slightly larger in diameter than its corresponding jar (taking the advantage of elastic jar walls), to optimize shear and total ingredient incorporation dur-ing the mixing process. The disposable blades can be used with smaller jars (up to 200 ml).
There are several jar sizes available: 15, 20, 30, 50, 100, 200, 300, 500 and 1000 ml, depending on the amount of ointment needed. Small jars are designed as disposable con-tainer to serve simultaneously as measuring, mixing, dispensing and storage jar. The big-gest can be washed, sterilized and reused. After selecting a jar, the procedure should be chosen from the menu list (normal, emulsion, emulsion+, suspension <2%, suspension >2%, gel) or after selecting manual, programmed individually. During the procedure ac-tual rotational speed is shown, and after furnishing its time, total number of rotations and number of up-down cycles is shown.
Mixing was performed using mixtures of popular ointment bases and additives, namely petrolatum, lanolin, lekobaza and water. To test the applicability of standard procedures, various amount of mixture were processed using this same program settings. The mixing ef-fect was evaluated visually, which enabled for elimination of bad samples, then rheological measurements were performed. Using HAAKE RS 75 rheometer. The cone-plate 20 mm, 0.3° measuring sensor was used, and the basic test was flow curve determination.
3. Results
Obtained results are presented graphically. On Fig. 2 flow curves, obtained with this same procedure (ointment-cream), using two jar sizes (100 and 200 ml) and two mixing blade types (standart and disposable), are put together. The strong discrepancy between them can be seen.
Fig. 1. Standard (left) and disposable (right) blades
Rys. 1. Łopatki standardowe (L) i jednorazowe (P)
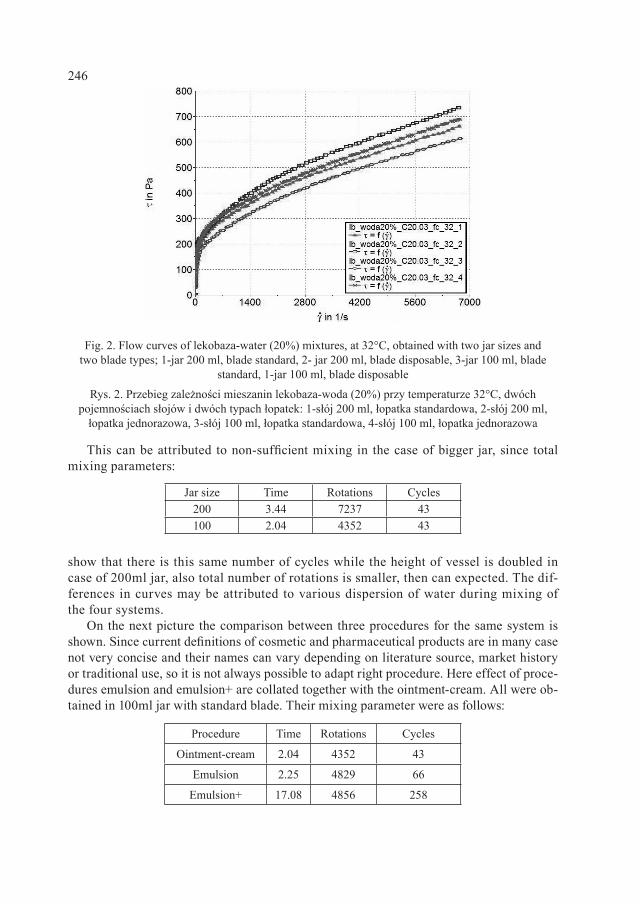
246
This can be attributed to non-sufficient mixing in the case of bigger jar, since total mixing parameters:
Jar size Time Rotations Cycles200 3.44 7237 43100 2.04 4352 43
show that there is this same number of cycles while the height of vessel is doubled in case of 200ml jar, also total number of rotations is smaller, then can expected. The dif-ferences in curves may be attributed to various dispersion of water during mixing of the four systems.
On the next picture the comparison between three procedures for the same system is shown. Since current definitions of cosmetic and pharmaceutical products are in many case not very concise and their names can vary depending on literature source, market history or traditional use, so it is not always possible to adapt right procedure. Here effect of proce-dures emulsion and emulsion+ are collated together with the ointment-cream. All were ob-tained in 100ml jar with standard blade. Their mixing parameter were as follows:
Procedure Time Rotations Cycles
Ointment-cream 2.04 4352 43
Emulsion 2.25 4829 66
Emulsion+ 17.08 4856 258
Fig. 2. Flow curves of lekobaza-water (20%) mixtures, at 32°C, obtained with two jar sizes and two blade types; 1-jar 200 ml, blade standard, 2- jar 200 ml, blade disposable, 3-jar 100 ml, blade
standard, 1-jar 100 ml, blade disposable
Rys. 2. Przebieg zależności mieszanin lekobaza-woda (20%) przy temperaturze 32°C, dwóch pojemnościach słojów i dwóch typach łopatek: 1-słój 200 ml, łopatka standardowa, 2-słój 200 ml,
łopatka jednorazowa, 3-słój 100 ml, łopatka standardowa, 4-słój 100 ml, łopatka jednorazowa
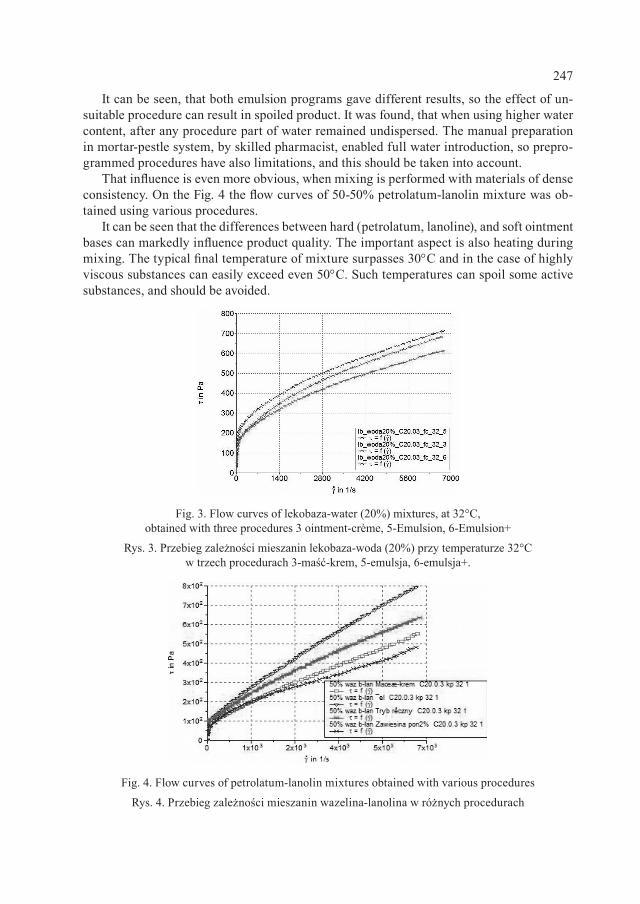
247
It can be seen, that both emulsion programs gave different results, so the effect of un-suitable procedure can result in spoiled product. It was found, that when using higher water content, after any procedure part of water remained undispersed. The manual preparation in mortar-pestle system, by skilled pharmacist, enabled full water introduction, so prepro-grammed procedures have also limitations, and this should be taken into account.
That influence is even more obvious, when mixing is performed with materials of dense consistency. On the Fig. 4 the flow curves of 50-50% petrolatum-lanolin mixture was ob-tained using various procedures.
It can be seen that the differences between hard (petrolatum, lanoline), and soft ointment bases can markedly influence product quality. The important aspect is also heating during mixing. The typical final temperature of mixture surpasses 30°C and in the case of highly viscous substances can easily exceed even 50°C. Such temperatures can spoil some active substances, and should be avoided.
Fig. 3. Flow curves of lekobaza-water (20%) mixtures, at 32°C, obtained with three procedures 3 ointment-crème, 5-Emulsion, 6-Emulsion+
Rys. 3. Przebieg zależności mieszanin lekobaza-woda (20%) przy temperaturze 32°C w trzech procedurach 3-maść-krem, 5-emulsja, 6-emulsja+.
Fig. 4. Flow curves of petrolatum-lanolin mixtures obtained with various procedures
Rys. 4. Przebieg zależności mieszanin wazelina-lanolina w różnych procedurach
248
4. Conclusions
In general pharmaceutical mixer provides good homogenization of pastes, suspension and emulsions. The factory preprogrammed procedures have certain limitation, which may be of minor importance for the pharmacists, nevertheless, some modifications may be needed, anyway there is also manual setting option, in case of simpler models as a basic one. Unfortunately it requires certain experience, and obeying of producers instructions. Rheo-logical tests are important tools in comparing performance of semisolids.
R e f e r e n c e s
[1] Cussot Ph. , Rheometry of Pastes, Suspensions and Granular Materials, John Wiley &Sons Inc., Hoboken 2005.
[2] Semkina O.A. , et al, Drug Synthesis Methods and Manufacturing Technology; Auxiliary Substances Used in Technology of Soft Medicinal Forms: Ointments, Gels, Liniments and Creams (A Review), Pharmaceutical Chemistry Journal Vol. 39, No. 9, 2005, 497-499.
[3] Buhse L. et al, Topical drug classification, Int. J. of Pharmaceutics, 295, 2005, 101 112.[4] Figiel W., Kwiecień M., Właściwości reologiczne komponentów maści farmaceu-
tycznych, Czasopismo Techniczne, 1-Ch/2010, Wydawnictwo Politechniki Krakow-skiej, Kraków 2003, 73-81.
[5] Nash R.A. , Wachter A.H. , Pharmaceutical Process Validation, Marcel Dekker AG, New York 2003.
[6] Unguator®-Technology, operations manual, GAKO International AG, Zurich 2005.
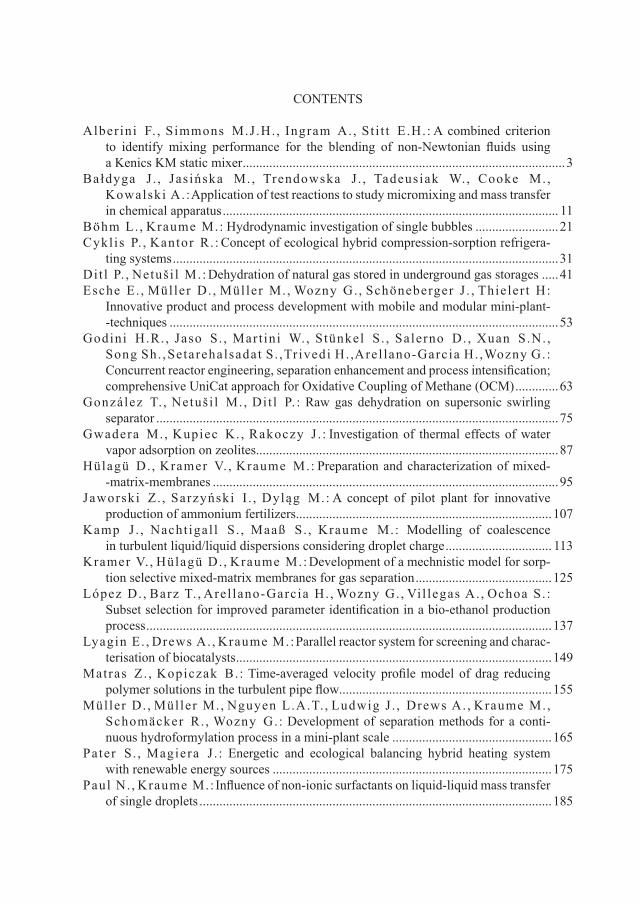
CONTENTS
Alberini F. , Simmons M.J .H. , Ingram A. , St i t t E.H.: A combined criterion to identify mixing performance for the blending of non-Newtonian fluids using a Kenics KM static mixer .................................................................................................3
Bałdyga J . , Jas ińska M., Trendowska J . , Tadeusiak W., Cooke M., Kowalski A. : Application of test reactions to study micromixing and mass transfer in chemical apparatus ..................................................................................................... 11
Böhm L. , Kraume M.: Hydrodynamic investigation of single bubbles .........................21Cyklis P. , Kantor R. : Concept of ecological hybrid compression-sorption refrigera-
ting systems ....................................................................................................................31Dit l P. , Netuši l M.: Dehydration of natural gas stored in underground gas storages .....41Esche E. , Müller D. , Müller M., Wozny G. , Schöneberger J . , Thieler t H:
Innovative product and process development with mobile and modular mini-plant--techniques .....................................................................................................................53
Godini H.R. , Jaso S. , Mart ini W., Stünkel S. , Salerno D. , Xuan S.N. , Song Sh. , Setarehalsadat S. , Tr ivedi H. , Arel lano-Garcia H. , Wozny G.:
Concurrent reactor engineering, separation enhancement and process intensification; comprehensive UniCat approach for Oxidative Coupling of Methane (OCM) .............63
González T. , Netuši l M., Dit l P. : Raw gas dehydration on supersonic swirling separator .........................................................................................................................75
Gwadera M., Kupiec K. , Rakoczy J . : Investigation of thermal effects of water vapor adsorption on zeolites...........................................................................................87
Hülagü D. , Kramer V. , Kraume M.: Preparation and characterization of mixed--matrix-membranes ........................................................................................................95
Jaworski Z. , Sarzyński I . , Dyląg M.: A concept of pilot plant for innovative production of ammonium fertilizers.............................................................................107
Kamp J . , Nacht igal l S. , Maaß S. , Kraume M.: Modelling of coalescence in turbulent liquid/liquid dispersions considering droplet charge ................................ 113
Kramer V. , Hülagü D. , Kraume M.: Development of a mechnistic model for sorp-tion selective mixed-matrix membranes for gas separation .........................................125
López D. , Barz T. , Arel lano-Garcia H. , Wozny G. , Vil legas A. , Ochoa S. :
Subset selection for improved parameter identification in a bio-ethanol production process ..........................................................................................................................137
Lyagin E. , Drews A. , Kraume M.: Parallel reactor system for screening and charac-terisation of biocatalysts ...............................................................................................149
Matras Z. , Kopiczak B. : Time-averaged velocity profile model of drag reducing polymer solutions in the turbulent pipe flow................................................................155
Müller D. , Müller M., Nguyen L.A.T. , Ludwig J . , Drews A. , Kraume M., Schomäcker R. , Wozny G.: Development of separation methods for a conti-nuous hydroformylation process in a mini-plant scale ................................................165
Pater S. , Magiera J . : Energetic and ecological balancing hybrid heating system with renewable energy sources ....................................................................................175
Paul N. , Kraume M.: Influence of non-ionic surfactants on liquid-liquid mass transfer of single droplets ..........................................................................................................185
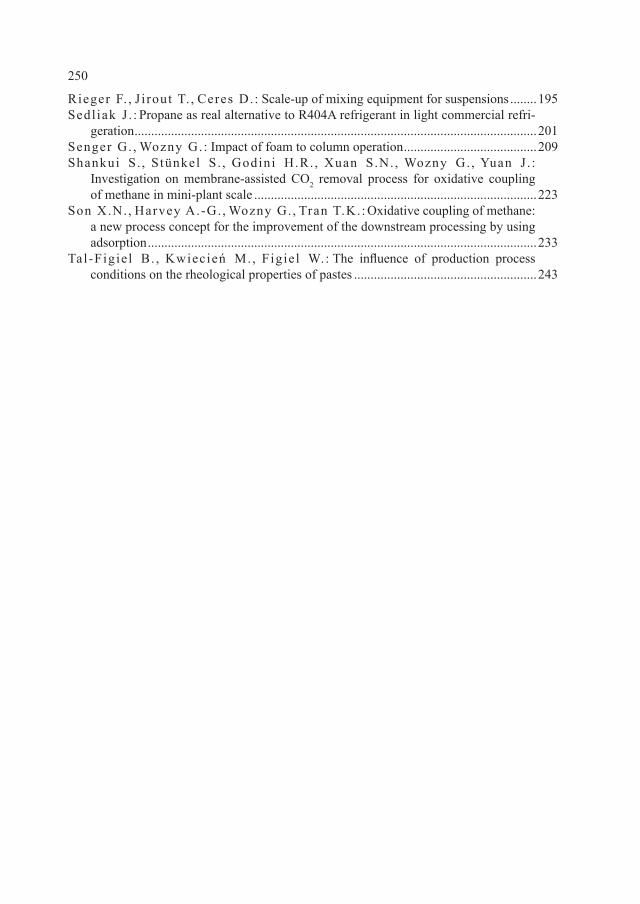
250
Rieger F. , J i rout T. , Ceres D. : Scale-up of mixing equipment for suspensions ........195Sedliak J . : Propane as real alternative to R404A refrigerant in light commercial refri-
geration .........................................................................................................................201Senger G. , Wozny G.: Impact of foam to column operation ........................................209Shankui S. , Stünkel S. , Godini H.R. , Xuan S.N. , Wozny G. , Yuan J . :
Investigation on membrane-assisted CO2 removal process for oxidative coupling of methane in mini-plant scale .....................................................................................223
Son X.N. , Harvey A.-G. , Wozny G. , Tran T.K.: Oxidative coupling of methane: a new process concept for the improvement of the downstream processing by using adsorption .....................................................................................................................233
Tal-Figiel B. , Kwiecień M., Figiel W.: The influence of production process conditions on the rheological properties of pastes .......................................................243
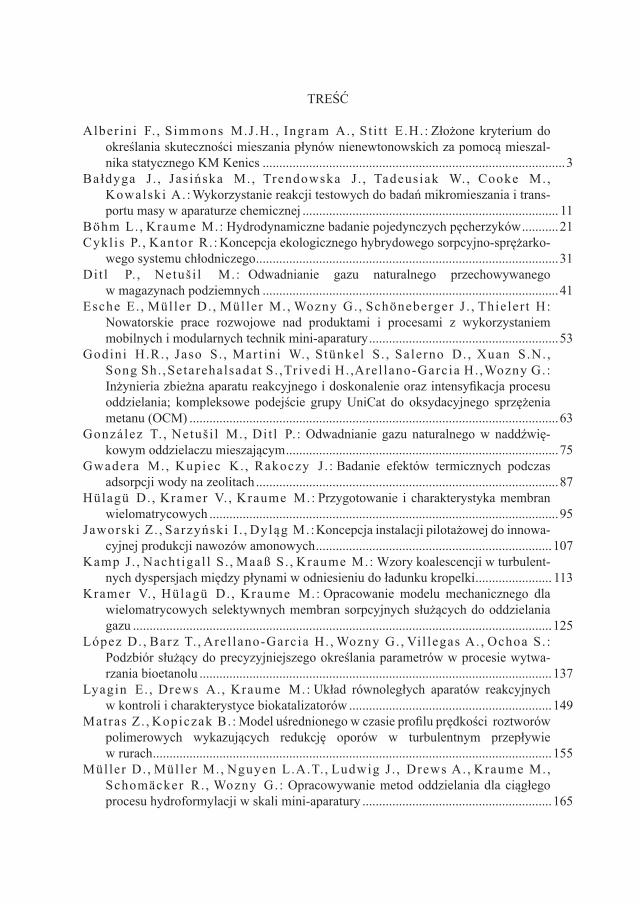
TREŚĆ
Alberini F. , Simmons M.J .H. , Ingram A. , St i t t E.H.: Złożone kryterium do określania skuteczności mieszania płynów nienewtonowskich za pomocą mieszal-nika statycznego KM Kenics ...........................................................................................3
Bałdyga J . , Jas ińska M., Trendowska J . , Tadeusiak W., Cooke M., Kowalski A. : Wykorzystanie reakcji testowych do badań mikromieszania i trans-portu masy w aparaturze chemicznej ............................................................................. 11
Böhm L. , Kraume M.: Hydrodynamiczne badanie pojedynczych pęcherzyków ...........21Cyklis P. , Kantor R. : Koncepcja ekologicznego hybrydowego sorpcyjno-sprężarko-
wego systemu chłodniczego ...........................................................................................31Dit l P. , Netuši l M.: Odwadnianie gazu naturalnego przechowywanego
w magazynach podziemnych .........................................................................................41Esche E. , Müller D. , Müller M., Wozny G. , Schöneberger J . , Thieler t H:
Nowatorskie prace rozwojowe nad produktami i procesami z wykorzystaniem mobilnych i modularnych technik mini-aparatury .........................................................53
Godini H.R. , Jaso S. , Mart ini W., Stünkel S. , Salerno D. , Xuan S.N. , Song Sh. , Setarehalsadat S. , Tr ivedi H. , Arel lano-Garcia H. , Wozny G.:
Inżynieria zbieżna aparatu reakcyjnego i doskonalenie oraz intensyfikacja procesu oddzielania; kompleksowe podejście grupy UniCat do oksydacyjnego sprzężenia metanu (OCM) ...............................................................................................................63
González T. , Netuši l M., Dit l P. : Odwadnianie gazu naturalnego w naddźwię-kowym oddzielaczu mieszającym ..................................................................................75
Gwadera M., Kupiec K. , Rakoczy J . : Badanie efektów termicznych podczas adsorpcji wody na zeolitach ...........................................................................................87
Hülagü D. , Kramer V. , Kraume M.: Przygotowanie i charakterystyka membran wielomatrycowych .........................................................................................................95
Jaworski Z. , Sarzyński I . , Dyląg M.: Koncepcja instalacji pilotażowej do innowa-cyjnej produkcji nawozów amonowych .......................................................................107
Kamp J . , Nacht igal l S. , Maaß S. , Kraume M.: Wzory koalescencji w turbulent-nych dyspersjach między płynami w odniesieniu do ładunku kropelki ....................... 113
Kramer V. , Hülagü D. , Kraume M.: Opracowanie modelu mechanicznego dla wielomatrycowych selektywnych membran sorpcyjnych służących do oddzielania gazu ..............................................................................................................................125
López D. , Barz T. , Arel lano-Garcia H. , Wozny G. , Vil legas A. , Ochoa S. :
Podzbiór służący do precyzyjniejszego określania parametrów w procesie wytwa-rzania bioetanolu ..........................................................................................................137
Lyagin E. , Drews A. , Kraume M.: Układ równoległych aparatów reakcyjnych w kontroli i charakterystyce biokatalizatorów .............................................................149
Matras Z. , Kopiczak B. : Model uśrednionego w czasie profilu prędkości roztworów polimerowych wykazujących redukcję oporów w turbulentnym przepływie w rurach ........................................................................................................................155
Müller D. , Müller M., Nguyen L.A.T. , Ludwig J . , Drews A. , Kraume M., Schomäcker R. , Wozny G.: Opracowywanie metod oddzielania dla ciągłego procesu hydroformylacji w skali mini-aparatury .........................................................165
252
Pater S. , Magiera J . : Bilansowanie energetyczne i ekologiczne hybrydowego systemu grzewczego z odnawialnymi źródłami energii ...............................................175
Paul N. , Kraume M.: Wpływ niejonowych środków powierzchniowo czynnych na masowe przenoszenie pojedynczych kropelek między płynami ..................................185
Rieger F. , J i rout T. , Ceres D. : Powiększanie mieszalników zawiesin ......................195Sedliak J . : Propan jako realna alternatywa dla czynnika chłodniczego R404A
w lekkim chłodzeniu handlowym ................................................................................201Senger G. , Wozny G.: Wpływ piany na działania kolumnowe ....................................209Shankui S. , Stünkel S. , Godini H.R. , Xuan S.N. , Wozny G. , Yuan J . :
Badanie membranowego procesu usuwania CO2 dla oksydacyjnego sprzężenia metanu w skali mini-aparatury .....................................................................................223
Son X.N. , Harvey A.-G. , Wozny G. , Tran T.K.: Oksydacyjne sprzężenie metanu: nowa procesowa koncepcja doskonalenia późniejszych etapów przetwarzania ropy z zastosowaniem adsorpcji ...........................................................................................233
Tal-Figiel B. , Kwiecień M., Figiel W.: Wpływ warunków procesowych, w toku wytwarzania, na parametry reologiczne materiałów pastowatych ...............................243


