Embed Size (px)
Citation preview
a YUNIBESITI YA BOKONE-BOPHIRIMA
D NORTH WEST UNIVERSITYNOORDWES UNIVERSITEIT
DEVELOPMENT OF A FUNCTIONAL BEVERAGE
FROM THE KEI APPLE FRUIT
DOVYALIS CAFFRA .
M-J. GORE HONS.
(Hons. B.Sc. Nutrition)
Thesis submitted for the degree Magister Scientae inthe School of Physiology, Nutrition and Consumer Sciences
at the North-West University, Potchefstroom
Supervisor: Prof. J. Jerling
Co-supervisor: Dr. S.C. Scholz
Potchefstroom
November 2005
I
-- -
- Acknowledgements
ACKNOWLEDGEMENTS
I would like to thank the following people for their help and support in writing this thesis and all the supporting practical work.
Prof. Johann Jerling for his help in focusing the project and keeping positive at all times
Dr. Carien Scholz for her invaluable input with the consumer testing, queshonnaires and attention to detail.
Dr. du Toit Loots for his assistance in all the chemical analysis
Cori Ham for his assistance in sourcing the Kei apples in the Western Cape, and allowing me access to his previous work at the University of Stellenbosch, and advice.
Dolf Swanepoel and Clive Webster for sourcing the Kei apples in the Eastern Cape
To Annamarie Kruger, who introduced the Kei apple project as part of the Flagh-Project (Farm Labourers and General Health).
Particular thanks to Granor Passi (Ply) Ltd for their help in providing me with the premises and equipment for the formulatory and processing work.
To Louis Grey, Rikie van der Mewe. Theresa Els, Willie Coetzee and Niel van Rensburg of Granor Passi (Pty) Ltd.
Elize Pienaar. Xania Botes and Sonna Visser for their assistance in recruiting people for the consumer testing.
To all of the consumers who took part so willingly in the testing,
Anna Nquongolo and Emily Zkeke for their assistance in helping me with the consumer testing.
Angela, Cindy and Leslye, for their shoulders.
Prof. Suria Ellis for her patience and assistance in interpreting the statistical data
Sonja van der Westhuizen and the staff at Potchefstroom Campus Library, for assistance in helping me with the articles.
Kerry, Kristy and Guy for entertaining my little ones.
Keny, for her proof-reading,
To Lauren, for her assistance in typing this thesis (and keeping me sane)
Catherine Ramaila, for her loyalty.
To my family, last but not least, especially my husband Alastair. What next, dear?
Opsornming
DIE ONTWIKKELING VAN 'N FUNKSIONELE DRANKIE VAN DIE KEIAPPEL VRUG
(DOWAUS CAFFRA)
Aaterarond en Motivering
Oor die afgelope lwef? dekades het die belangstelling in die gesondheidsvoordele van
polifenole, spesifiek met betrekking tot chroniese siekte, gegroei. Die Keiappel (Dovyalis
caffra) is 'n inheernse plant aan Suid-Afrika en is bes moontlik 'n ryk bron van polifenole.
Hierdie studie het dii ten doel gehad om 'n funksionele drankie te ontwikkel van die Keiappel
met 'n aantoonbare voordeel in terme van voedingswaarde, wat ter selfde tyd ook deur
verbruikers op grond van sintuiglike kwaliieite aanvaar sou word. Die langertermyn doel van
die projek is ook om die inkomste van kleinboere in landelike gebiede, sowel as stedelinge
te verbeter deur die verbouing van Keiappels aan te moedig om uiteindelik ekonorniese
voordeel daawit te haal. 'n Deeglike literatuurstudi is ondemeem en sluit onderwerpe soas
funksionele voedsel, neigings in die ontwikkeling van drankies, wetgewing, polifenole as
funksionele bestanddele met 'n fokus op vrugte en die lot van polifenole in die liggaarn in. 'n
Oorsig oor vrugteprosesserings- en preserveringstegnieke, asook wetgewing word gevolg
deur 'n oorsig oor die ontwikkeling van nuwe produkte en die so& verbruikers wat in
funksionele voedsels behng sou stel. Daar is ook gekyk na die rol van sintuiglike evaluering
en verbruikersnavorsing in herdie proses.
Metodes
Keiappels is in lwee areas in Suid-Afrika versamel, naamlik tydens die 200212003 seisoen ,
in Bloemhof, Noordwes Provinsie, en tydens die 200412005 seisoen in die 00s- en
Weskaap. Die eerste Keiappels is gebruik om 'n prototipe funksionele drankie te ontwikkel
w a a ~ i t verdere ontwikkeling sou spruit. Die tweede oes van Keiappels is op industriele
skaal verpulp, waama daar op kleinskaal 'n kornmersiele Keiappelsap vir verbruikerstoetse
ontwikkel is. Verskeie geure is g e b ~ i k om die sterk kenmerkende smaak en aroma van die
Keiappel te masker, waama die moontlike opsies tot appel, vanielje en kruisementhranielje
verminder is. Verbruikerspaneeltoeste is deur 152 verbruikers, met behulp van 'n vooraf-
getoetsde vraelys en hedoniese skaal vir algemene aanvaarbaafiid, volgorde van
vwrkeur, sowel as 'n reaksieskattingskaal vir voorneme om te verbruik en 'n rangorde toets
vir vwmerne om aan te koop, gedoen. Alle evaluerings is onder streng gekontrolleerde
sintuiglike evalueringsvereistes I omstandighede uitgevoer en respondente van die
Potchefstroom kampus. Noordwes-Universiteit, is gevra om anonierne vraelyste te voltooi.
Opsornrning
Resultate en Bes~reking
Statistiese ontledings is gedoen deur gebruik te rnaak van Statistic&, sewende weergawe.
Ter samevatting van al die verbruikerstoetse, is daar bevind dat verbruikers die appelgeur
statisties beduidend meer aanvaarbaar as die ander geure beskou het. Die appelgeur het in
terme van smaak, algemene aanvaarbaarheid en voorneme om aan te koop en te verbruik.
ook prakties betekenisvol beter gevaar as die ander twee geure. Daar was egter geen
betekenisvolle verskille ten opsigte van enige van die veranderlikes, of gegvalueerde
voomeme van verb~ik of aankope tussen die vanielje en vanieljelkruisement geure nie. Die
konsentrasie van totale polifenole is spektrofotometries gemeet en uitgedruk as galaatsuur
ekwivalente per liter (GAEJL). Die konsentrasie van totale polifenole was effens laer as wat
verwag is, waar die appel- en vanieljelkruisementgeur soortgelyke vlakke gehad het (101.7
en 106.1 GAEIL. onderskeidelik), terwyl die vanieljegeur 'n konsentrasie van 143.0 GAEIL
gehad het. Hierdie verskil kan moontlik toegeskryf word aan die struktuur van die
vanieljegeur wat ook 'n fenolstruktuur het. Die effe laer as vewagte polifenolvlakke sou ook
die resultaat van afbraak gedurende prosessering kon wees. Daar was 'n duidelike verskil in
die polifenolinhoud tussen die twee oeste uit verskillende areas. Die eerste oes was suurder
gemeet in vergelyking met die tweede, soos bepaal deur die totale sitroensuurinhoud
(4.81%w/w teenoor 2.54%w/w) en het 'n hoBr suikerinhoud gehad (16.3"B teenoor 8.4%).
Hierdie verskil mag toegeskryf word aan verskeie faktore soos klimaat, grondtoestande en
rypheid. 'n Kommersble produk van die VSA, Ocean Spray@ Cranberry, wat vir
vergelykende doeleindes gebruik is, het meer polifenole en vry- en gebonde askorbiensuur
as die ontwikkelde Keiappel produk. Redes vir die verlies aan vitamien C inhoud van die
Keiappelsap is moontlik die hitte behandeling tydens pasteurisasie, asook die blootstelling
aan oksidasie tydens die verpulpingsproses.
Gevolatrekkina en Aanbevelinas
Die ontwikkeling van 'n funksionele drankie uit Keiappels is moontlik. Soos met meeste
nuwe produkte word verdere, onoorkoomlike formule aanpassings benodig. Die
verbruikerspaneel was positief oor die appelgeur drankie en verdere ontwikkeling behoort
dus op hierdie geur te konsentreer. Die grootste struikelblok in die weg van sukses in
hierdie projek is die afwesigheid van 'n effektiewe organiserende liggaam wat met die
verbouers kan skakel ten einde 'n kooperasie te v o n en dus 'n volgehoue voorraad van
Keiappels kan lewer. Die effek van variasies in oestyd, grondtoestande en klimaat moet ook
beoordeel word. Die toenarne in inkomste vir boere kan slegs 'n moontlikheid word indien
alle rolspelers saarnwerk en 'n Keiappel-verbouerskoijperasie gevestg kan word.
Opsomming
Sleutelterme: Keiappel (Dovyalk caffra), funksionele drankie, polifenole.
produkontwikkeling, sintuiglike evaluering deur verbruikers
Summary
SUMMARY
Backqround and Motivation
Interest has grown over the last two decades in the health benefns of polyphenols, with
parlicular relation to degenerative diseases. The Kei apple (Dovyalis caffra) is an indigenous
plant to South Africa, thought to be rich in polyphenols. This study aimed to produce a
functional beverage from the Kei apple, with demonstrable nutritional benefits, which should
also be found acceptable by consumers due to its sensory attributes. A long term aim of the
study is to assist in improving income of farmers in rural and urban areas by encouraging the
participation of small holders in growing the Kei apple for subsequent economic benefit. A
thorough literature review was conducted on functional foods, trends for beverages, legislation
and on polyphenols as a class of functional ingredients, specifically focusing on fruits and the
fate of polyphenols in the body. A review of fruit processing procedures, preservation
techniques and legislation, followed by new product development (NPD) and the types of
consumers desiring functional foods were investigated as well as the role of sensory evaluation
and consumer research were examined.
Methods
Kei apples were collected from two areas of South Africa, namely Bloemhof in the North West
Province in the 200212003 growing season and from the Eastem and Westem Cape in the
200412005 growing season. The first set of Kei apples were used to produce a prototype
functional beverage, from which future development would take place. The second set of Kei
apples were used for pulping on an industrial scale and then a small-scale commercial
production batch of the Kei apple beverages for consumer panel testing was produced.
Various flavours were used to mask the strong characteristic taste and aroma of the Kei apple
for the beverage and these were narrowed down to apple, vanilla and mint 8. vanilla.
Consumer panel testing was undertaken with 152 consumers with a pre-tested questionnaire
using hedonic scales for overall acceptance, ranking for preference, a F w d Action Rating
Scale (FACT) for consumption intent, and a ranking test for purchase intent. All evaluations
were carried out under strictly controlled sensory evaluation requirement and respondents were
asked to fill in anonymous questionnaires at North West Universrty, Potchefstroom Campus.
Summary
Results and Discussion
Statistical analysis of the results were determined by the Statistic* programme, version 7. In
summary for all of the consumer testing, it was found that consumers regarded the apple
flavoured Kei apple beverage statistically significantly more acceptable than the other flavours.
The apple flavoured beverage was found to be rated practically significantly higher for the
attributes of taste and overall acceptance, as well as for consumption intent, purchase intent
and preference. There was, however, no signifcant differences in any of the attributes or
evaluated consumption and purchase intent between the vanilla and mint & vanilla. The total
polyphenols, determined by UV spectophotometry as gallic acid equivalents per litre (GAEII),
were found to be slightly less then expected, with the apple and mint & vanilla showing similar
results (as GAEII) 101.7 versus 106.1 for the latter two, whilst vanilla was 143.0 which may
have been attributed to the vanillic acid molecule itself which also has a phenolic structure.
This lower-than-expected level of total polyphenols may have been due to degradation during
processing. There was a clear difference in the polyphenol content between the different
harvests from the two regions. The former showed greater acidity as determined by total citric
acid 4.81% wlw and sugar 16.3% versus 2.54% wlw and 8.4% This may be due to various
factors of climate, soil and ripeness. For comparison purposes, a commercial product from the
USA, Ocean Spra* Cranberry, was also found to have more polyphenols present than the Kei
apple beverage. This was also demonstrated by the amount of ascorbic acid, free and bound.
The Kei apple beverage subjected to pasteurization probably lost most of its vitamin C content
due to the heat treatment and the exposure to oxygen during pulping.
Conclusion and Recommendations
The development of a functional beverage from the Kei apple is feasible. As with most new
product developments, further formulation modifications which are not insurmountable are
required. The consumer panel was positive towards the apple flavoured beverage and this
flavour should be taken fonvard for future development. The key stumbling block to the
success of this project is the lack of an effective organizing body that could liaise with the
growers to form a cooperative and provide a consistent supply of Kei apples. The effect of
variations in harvesting time, soil conditions and climate must also be evaluated. The
improvement of income of farmers may only be achieved by the involvement of other stake
holders and the formation of a Kei apple grower's co-operative
Kev words: Kei apple (Dovyalis caffra), functional beverage, polyphenols, product
development, consumer sensory testing.

Contents
TABLE OF CONTENTS
ACKNOWLEDGEMENTS
OPSOMMING & SLEUTELTERME
SUMMARY & KEYWORDS
ABBREVIATIONS
Chapter 1
Chapter 2
Chapter 3
Chapter 4
Chapter 5
Chapter 6
Introduction and Aims
Literature Review
Methods and Materials
Results and Discussion
Conclusion and Recommendations
References
APPENDICES
Appendix 1 Evaluation Form
Appendix 2 Instructions to Participants
Appendix 3 Questionnaire and Sensory Evaluation Form
Appendix 4 Comments from Participants
Abbreviations
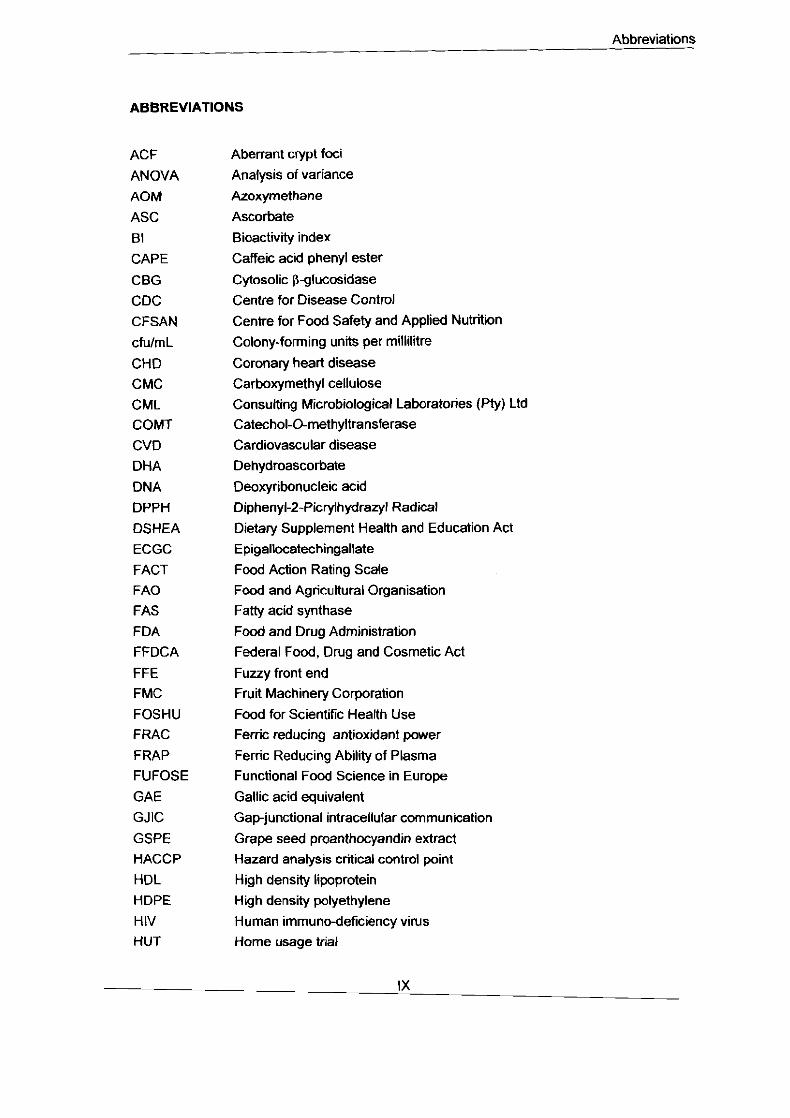
ABBREVIATIONS
ACF
ANOVA
AOM
ASC
BI
CAPE
CBG
CDC
CFSAN
cfulmL
CHD
CMC
CML COMT
CVD
DH A
DNA DPPH
DSHEA
ECGC
FACT FA0
FAS
FDA FFDCA
FFE FMC
FOSHU FRAC
FRAP FUFOSE
G AE
GJlC
GSPE HACCP
HDL HDPE
H IV HUT
Aberrant crypt foci
Analysis of variance
Azoxymethane
Ascorbate
Bioactivity index
Caffeic acid phenyl ester
Cytosolic !3glucosidase
Centre for Disease Control
Centre for Food Safety and Applied Nutrition
Colony-forming units per millilitre
Coronary heart disease
Carboxymethyl cellulose
Consulting Microbiological Laboratories (Pty) Ltd Catechol-0-methyltransferase
Cardiovascular disease
Dehydroascorbate
Deoxyribonucleic acid
Diphenyl-2-Picrylhydraql Radical
Dietary Supplement Heaith and Education Act
Epigallocatechingallate
Food Action Rating Scale Food and Agricultural Organisation
Fatty acid synthase
Food and Drug Administration Federal Food. Drug and Cosmetic Act
Fuzzy front end Fruit Machinery Corporation
Food for Scientific Health Use Ferric reducing antioxidant power
Ferric Reducing Ability of Plasma Functional Food Science in Europe
Gallic acid equivalent
Gapjunctional intracellular communication
Grape seed proanthocyandin extract Hazard analysis critical control point
High denslty lipoprotein High density polyethylene
Human immuno-deficiency virus Home usage trial
- Abbreviations
IFAVA lLSl
LDL
LPH
MMP NLEA NO
NPD NRF
NRF
NW NWU
ORAC OTC PAA PASSCLAIM
PET PROP PRP
PVC
RDI ROI ROS S A
SULT
T A TAA TEAC TOSC
UDPGT USA uv wlw
WHO
International Fruit and Vegetable Alliance International Life Sciences lnstiitute
Low density lipoprotein Lactase phlorizin hydrolase
Matrix methalloproteinase
Nutrition Labeling and Education Act
Nitric oxide
New Product Development
National Research Fund
National Research Fund
North West
North West University Oxygen Radical Absorbance Capacity
Over the counter Dihydroxy-phenylacetic acid
Process for the Assessments of Scientific Support for Claims on Foods Polyethylene terephthalate
Propylthiouracil Prolinerich proteins Polyvinyl chloride
Recommended dietary intake Return on investment Reactive Oxygen Species South Africa
Phenol sulfotransferases
Total acidity Total antioxidant activity
Trolex Equivalent Antioxidant Capaicty
Total oxyradical scavenging capacity Glucuronosyltransferase United Stated of America
Ultraviolet
WeigM for weight World Health Organization

Chapter 1
CHAPTER 1
INTRODUCTION
Chapter 1
DEVELOPMENT OF A FUNCTIONAL BEVERAGE FROM THE KEI APPLE FRUIT
DOVYALIS CAFFRA)
CHAPTER 1
INTRODUCTION AND AIMS
Currently, there are searches for indigenous fruits that have previously been ignored by the
food industry and nutritionists as a whole. These include sources that have not necessarily
previously been thought of outside their local community. For example, mocan seeds in the
Canary Islands of Spain (Duetias et a/., 2003); seabuckthorn in Europe and Asia (Geetha et
al., 2003); winery by-products (Gonzalez-Paramas et a/., 2004); pomegranate pith (which is
considered a holy fruit in the Quran) (Kulkarni et a/., 2004); sea algae in Japan (Nagai &
Yukimoto. 2003); oak acorn in Spain and Italy (Rakic et a/.. 2005); prickly pear in Mexico,
Latin America. South Africa and the Mediterranean (Ramadan & Morsel, 2003); peanut
skins in the USA (Yu etal., 2004).
South Africa is considered to be a 'hotspot" for biodiversity and more than 22,000 plants
species occur within its boundaries. This represents 10% of the world's species, although
the land surface of South Africa is less than 1% of the Earth. Despite the enormous richness
in plant species, relatively few of these plants are economically utilized. Business ventures
that have developed from the use of indigenous plants is the trade in medicinal and cultural
plants, food crops and ornamental plants (Coetzee et a/.. 1999). The Kei apple falls into the
category of a food crop, although until now this has been limited to jams, jellies or eaten with
large amounts of sugar. This has all been focused in small areas, close to where the Kei
apple grows. When under-ripe, pickles may be made.
The Kei apple is one of eight species of Dovyalis found in Southern Africa, the others being
Dovyalis hispadula (Bristly Sourbeny) found in northern Mozambique, Dovyalis longispina
(Coastal Kei Apple) found in northem Natal and Mozambique, Dovyalis lucida (Glossy
Sourberry) found at medium altitudes in evergreen forests and at sea level in the Eastern
Cape, Dovyalis macrocaIyx (Shaggy Sourbeny) found in Mozambique and Zimbabwean
borders, Dovyalis mamnoides (Sourberry) found near the coast in forested areas and inland
in mountain evergreen forests. Dovyalis rotundifolia (Dune Sourberry) found in coastal scrub
and dune forests, Dovyalis zeyheri (Apricot Sourbeny) found in open woodland bushveld or
Chapter l
at the margins of evergreen forests. The fruits from all of the species are edible (Coates
Palgrave, 2002:761-766).
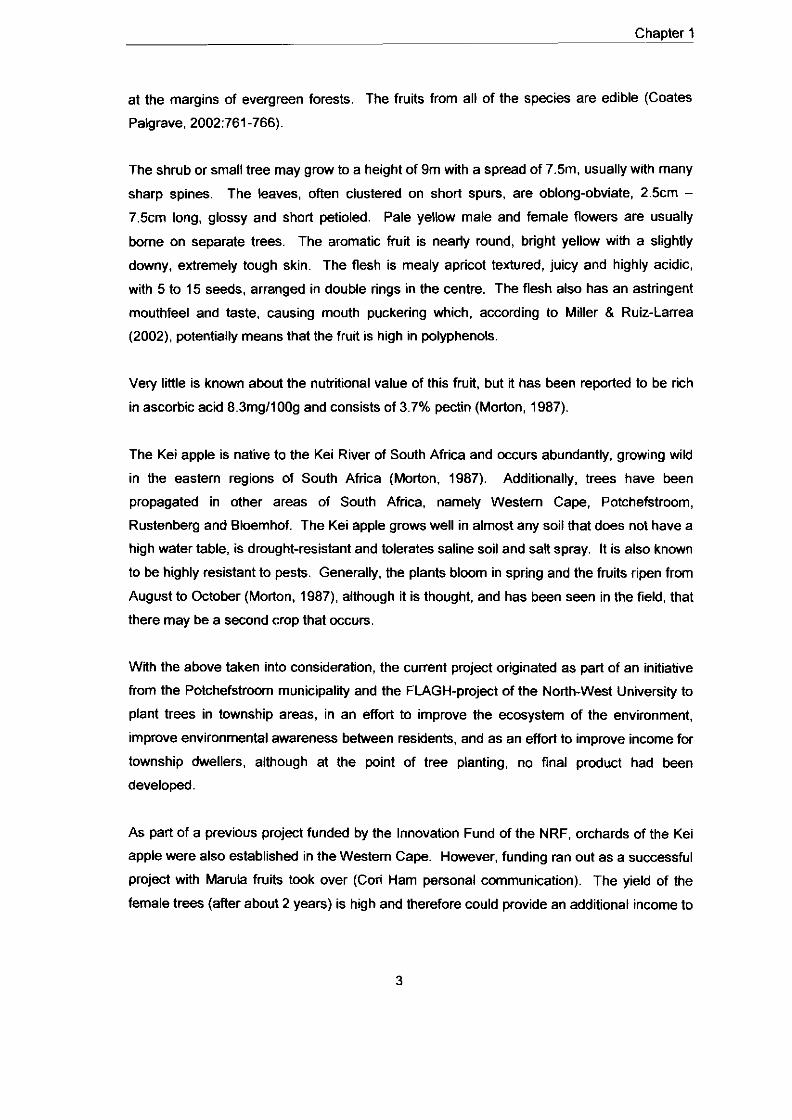
The shrub or small tree may grow to a height of 9m with a spread of 7.5m, usually with many
sharp spines. The leaves, often clustered on short spurs, are oblong-obviate, 2.5cm -
7.5cm long, glossy and short petioled. Pale yellow male and female flowers are usually
borne on separate trees. The aromatic fruit is nearly round, bright yellow with a slightly
downy, extremely tough skin. The flesh is mealy apricot textured, juicy and highly acidic,
with 5 to 15 seeds, arranged in double rings in the centre. The flesh also has an astringent
mouthfeel and taste, causing mouth puckering which, according to Miller 8 Ruiz-Larrea
(2002), potentially means that the fruit is high in polyphenols.
Very little is known about the nutritional value of this fruit, but it has been reported to be rich
in ascorbic acid 8.3mg1100g and consists of 3.7% pectin (Morton, 1987).
The Kei apple is native to the Kei River of South Africa and occurs abundantly, growing wild
in the eastern regions of South Africa (Morton. 1987). Additionally, trees have been
propagated in other areas of South Africa, namely Western Cape, Potchefstroom,
Rustenberg and Bloemhof. The Kei apple grows well in almost any soil that does not have a
high water table, is drought-resistant and tolerates saline soil and salt spray. It is also known
to be highly resistant to pests. Generally, the plants bloom in spring and the fruits ripen from
August to October (Morton. 1987), although it is thought, and has been seen in the field, that
there may be a second crop that occurs.
Wlh the above taken into consideration, the current project originated as part of an initiative
from the Potchefstroom municipality and the FLAGH-project of the North-West University to
plant trees in township areas, in an effort to improve the ecosystem of the environment,
improve environmental awareness belween residents, and as an effort to improve income for
township dwellers, although at the point of tree planting, no final product had been
developed.
As part of a previous project funded by the Innovation Fund of the NRF, orchards of the Kei
apple were also established in the Western Cape. However, funding ran out as a successful
project with Marula fruits took over (Cori Ham personal communication). The yield of the
female trees (after about 2 years) is high and therefore could provide an additional income to
Chapter 1
a family, or even income for a family currently obtaining no income, if the fruit could be made
into a commercially viable product.
There is currently no literature or research about the Kei apple consumed for specific health
reasons or for its inherent health benefits. This also encouraged the present study.
The aims of this study are therefore:
1. Develop (and confirm by panel testing) a product that is preferred by consumers and will
be purchased due to its sensory attributes.
2. Develop a product that could increase consumption of fruit juice as part of improving
overall diet and thereby increasing consumption of fruit.
3. Identify and quantify the constituents that are key to the success of the developed
product's functionality by measuring the polyphenols and as ascorbic acid, using gas
chromatography I mass spectophotometry.
4. Develop a product that has provable functional benefh that will assist in alleviating
degenerative diseases.
Chapter 2
CHAPTER 2
LITERATURE REVIEW
Chapter 2
CHAPTER 2
LITERATURE REVIEW
INTRODUCTION
The scope of this project is wide, as it is concerned with the development of a functional
beverage from the Kei apple (Dovyalis caffra). In order for the development of this product
to be successful, it is necessary to have knowledge of several areas which are not
necessarily seemingly connected, in a pure academic, nutritional andlor scientific arena.
A basic knowledge of functional foods and beverages is required and an understanding of
where the consumer market is going. What are the future trends for beverages in particular?
What are the types of consumers that desire these products and what are their needs? If
the developed product is to be successful, it must sell. To sell, it must be desired by the
consumer and taste acceptable. Additionally, the consumer must not be 'duped. The
product claim must be valid and legislation is therefore important, not just within South Afr ia
but globally, as perhaps the product developed has potential outside these borders.
Sensory and consumer testing therefore form a major role in the development of this
proposed product.
Additionally, when formulating a functional product, it is imperative that the active ingredients
that perform a clinical function and possess the nutritional value are known, thus a review of
the literature has been performed, pertaining specifically to polyphenols in fruits and related
products. The product development process and how it f ts into bringing a product into the
market place is an integral part of the development of products and will thus be discussed.
Furthermore, the fruit juice manufacturing process and packaging thereof will also receive
some attention in this review.
(NB: throughout this document, the use of page numbers in the references have been made
when text books only have been used.)
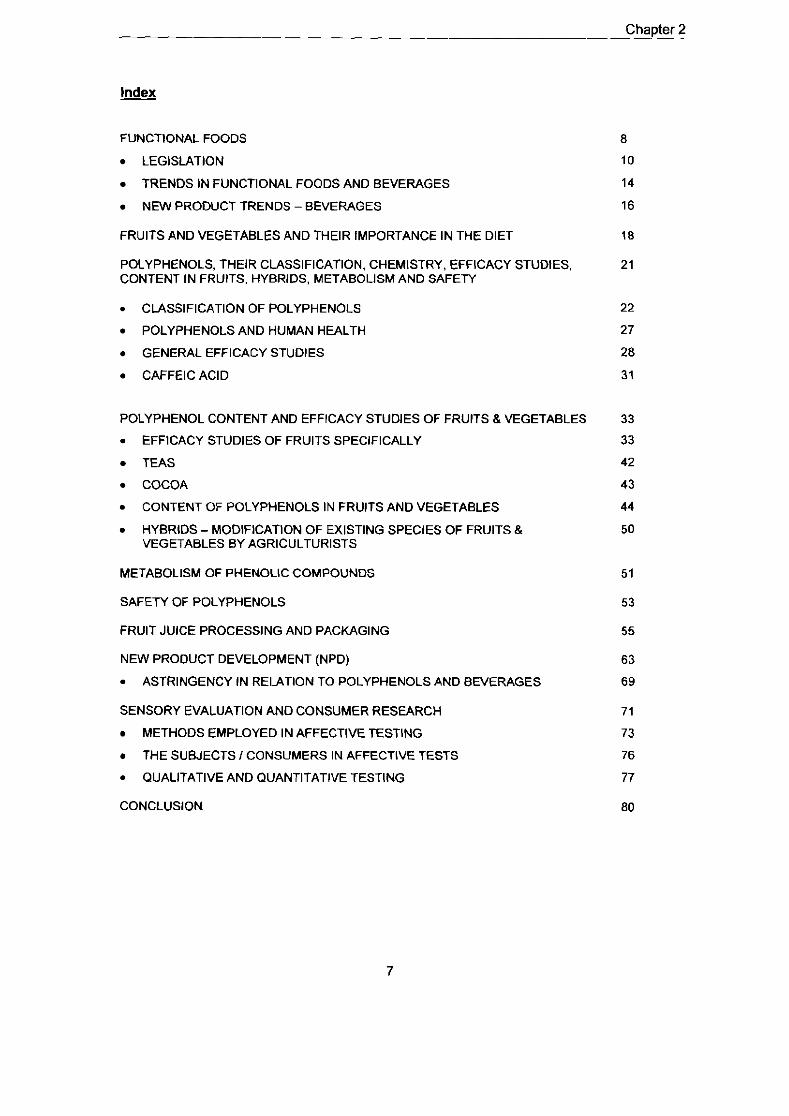
The outline of the literature review is therefore as follows in the index.
Chapter 2
FUNCTIONAL FOODS
LEGISLATION
TRENDS IN FUNCTIONAL FOODS AND BEVERAGES
NEW PRODUCT TRENDS -BEVERAGES
FRUITS AND VEGETABLES AND THEIR IMPORTANCE IN THE DIET
POLYPHENOLS, THEIR CLASSIFICATION. CHEMISTRY, EFFICACY STUDIES. CONTENT IN FRUITS. HYBRIDS, METABOLISM AND SAFETY
CLASSIFICATION OF POLYPHENOLS
POLYPHENOLS AND HUMAN HEALTH
GENERAL EFFICACY STUDIES
CAFFEIC ACID
POLYPHENOL CONTENT AND EFFICACY STUDIES OF FRUITS & VEGETABLES
EFFICACY STUDIES OF FRUITS SPECIFICALLY
TEAS
COCOA
CONTENT OF POLYPHENOLS IN FRUITS AND VEGETABLES
HYBRIDS - MODIFICATION OF EXISTING SPECIES OF FRUITS & VEGETABLES BY AGRICULTURISTS
METABOLISM OF PHENOLIC COMPOUNDS
SAFETY OF POLYPHENOLS
FRUIT JUICE PROCESSING AND PACKAGING
NEW PRODUCT DEVELOPMENT (NPD)
ASTRINGENCY IN RELATION TO POLYPHENOLS AND BEVERAGES
SENSORY EVALUATION AND CONSUMER RESEARCH
METHODS EMPLOYED IN AFFECTIVE TESTING
THE SUBJECTS I CONSUMERS IN AFFECTIVE TESTS
QUALITATIVE AND QUANTITATIVE TESTING
CONCLUSION
Chapter 2
FUNCTIONAL FOODS
The primary role of diet is to provide sufticient nutrients to meet the metabolic requirements
of an individual and to give the consumer a feeling of satisfaction and well being through
hedonic attributes such as taste (Diplock et a/., 1999). However, nutritional science in the
developed world is changing significantly, where there is a progression from adequate
nutrition to optimal nutrition. As a result of this, functional foods (also sometimes termed
nutraceuticals, medical foods or nutritional foods) are one of the major trends in the food
industry in this new millennium (Sloan. 2000).
Whilst the East has been using foods to maintain the correct functioning of the body, the
latest trend in Westem nutrition is that of functional foods. Medical costs are rising globally
and now the consumer is looking towards food (and nutritional supplements) to assist them
in maintaining health and in self medication (Sloan, 2000). A similar philosophy was
adopted by the Greek philosopher Hippocrates, who said 2,500 years ago 'Let food be thy
medicine and medicine be thy food" (Milner, 1998). People living in the East have always
believed certain foods to be benefcial to health. Malaspina (1996) states that these beliefs
are primarily anecdotal, based on centuries of tradition and largely under-documented by
solid scientif~ research.
Now the West is catching up with these beliefs, and the key to success for food
manufacturers is to develop products that are accepted by consumers and are consistent
with the consumer's understanding and appreciation of functional foods within the existing
culture. Because the state of the person's health may range from optimal to a state of
disease, it is believed that functional foods have a major role to play in all states of health,
including maintaining health and preventing disease (Verschuren. 2002).
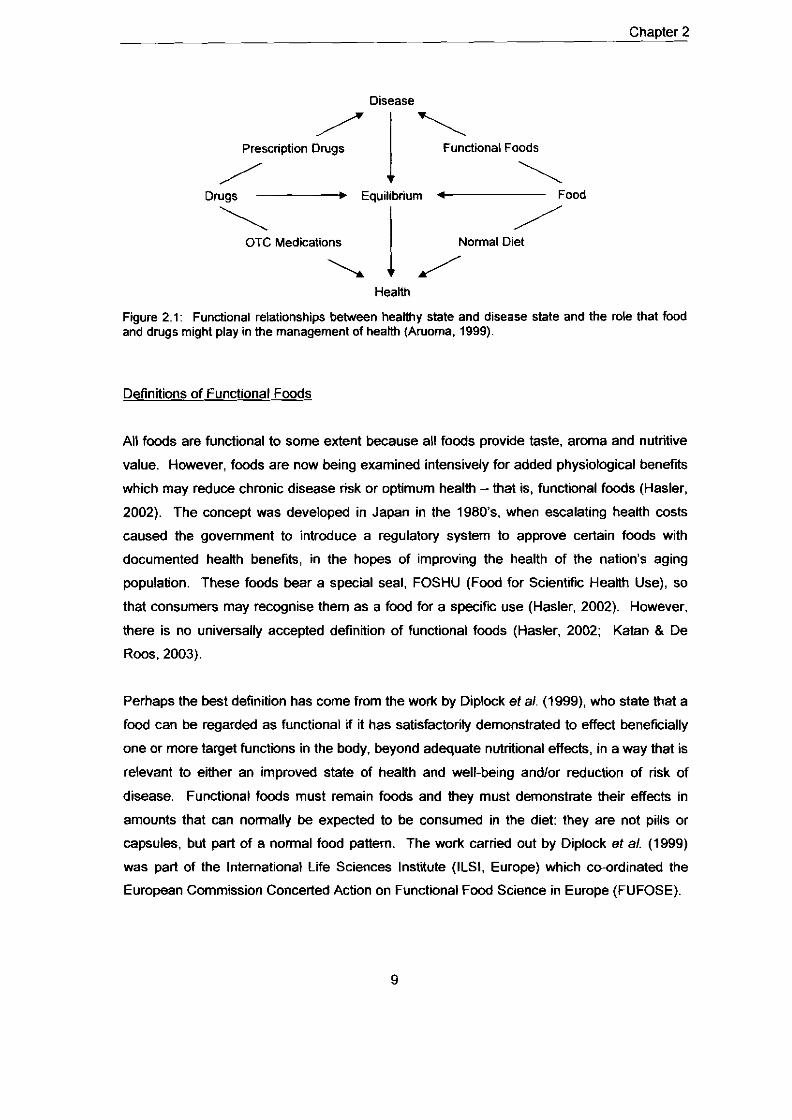
Aruoma's model, as shown in figure 2.1 suggests that increasing the role of functional foods
in the state between disease and health, may reduce the role of prescription and OTC (over
the counter) medication drugs.
Chaoter 2
Disease
Prescription Drugs 1 Functional Foods
Drugs Equilibrium * Food
\ I / OTC Medications Normal Diet
\ I / Health
Figure 2.1: Functional relationships between healthy state and disease state and the role that food and drugs might play in the management of health (Aruoma. 1999).
Definitions of Functional Foods
All foods are functional to some extent because all foods provide taste, aroma and nutritive
value. However, foods are now being examined intensively for added physiological benefis
which may reduce chronic disease risk or optimum health -that is, functional foods (Hasler,
2002). The concept was developed in Japan in the 1980's, when escalating health costs
caused the government to introduce a regulatory system to approve certain foods with
documented health benefits, in the hopes of improving the health of the nation's aging
population. These foods bear a special seal, FOSHU (Food for Scientific Health Use), so
that consumers may recognise them as a food for a spec if^ use (Hasler, 2002). However.
there is no universally accepted definition of functional foods (Hasler, 2002; Katan 8 De
Roos. 2003).
Perhaps the best definition has come from the work by Diplock et a/. (1999), who state that a
food can be regarded as functional if it has satisfactorily demonstrated to effect beneficially
one or more target functiins in the body, beyond adequate nutritional effects, in a way that is
relevant to either an improved state of health and well-being andlor reduction of risk of
disease. Functional foods must remain foods and they must demonstrate their effects in
amounts that can normally be expected to be consumed in the diet: they are not pills or
capsules, but part of a normal food pattern. The work carried out by Diplock et a/. (1999)
was part of the International Life Sciences lnstiiute (ILSI, Europe) which co-ordinated the
European Commission Concerted Action on Functional Food Science in Europe (FUFOSE).
Chapter 2
Taking into account the many definitions (not mentioned here for simplicity), there may be
many misunderstandings regarding whether a food is functimal or not, and can lead to an
increasingty permeable interface between food and drugs (Andlauer 8 Furst, 2002).
For the purposes of this review, a functional food will be accepted as being, mording to
Diplock et al. (1999), a natural food, a food to which a component has been added or
removed by technological or biotechnological means. It can also be a food where the nature
of one or more components has been modified or in which the binavailability of one or more
components has been modified, or a combination of all of these. A functional food might be
functional for all members of a population or for particular groups of the population, which
might be defmed, for example, by age or genetic constitution.
Legislation
Three US legislative acts of the 1990's have had a significant effect on the promotion of the
concept of functional foods. These are firstly the Nutritional Labelling and Education Act
passed in 1990, which mandated that the Food and Drug Administration establish
regulations requiring most foods to have a uniform nutriiion label and also established
circumstances under which claims about content and disease prevention could be made
about nutrients in foods. Secondly, the Dietary Supplement Health and Education Act
(DSHEA) of 1994 defined dietary supplements as any products that contain one or more
dietary ingredients and it created a mechanism for dealing with safety issues, regulation and
health claims, labelling of dietary supplements, provided for good manufacturing practices
and encouraged research on dietary supplements. Lastly, the FDA (Food 8 Drugs
Associatiin) Modemisation Act of 1997 amended the Federal Food, Drug and Cosmetics Act
by allowing health claims that are not pre-authorised by the FDA if the clams are based on
"authoritative statements" of government agencies such as the Nutritional Academy of
Sciences or the Nutritional lnstiiute of Health (Milner, 2000).
The Federal Food, Drug and Cosmetics Act as amended, does not provide a statutory
definition of functional foods. Thus, the FDA has no authority to establish a formal regulatory
category for such foods. In marketing such foods, manufacturers are responsible for safety
requirements, labelling requirements and the appropriate petiiion or notification procedures
for ingredients in their products (Ross. 2000). The onus, therefore, is on the manufacturer to
be responsible, which opens many loopholes for misleading claims from manufacturers and
Chapter 2
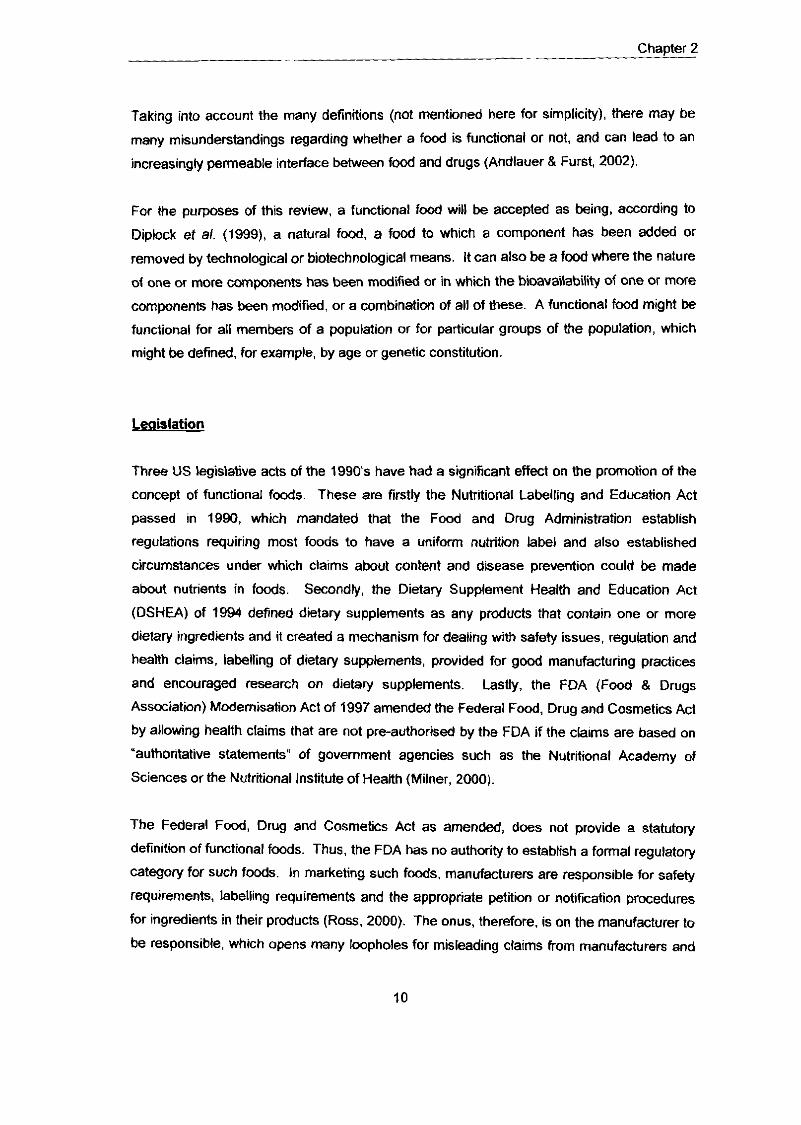
adds no value to the consumer. Table 2.1, extracted from the FDA website and Centre for
Food Safety and Applied Nutrition, shows the allowable health claims passed by the FDA.
Table 2.1: Summary of health claims in labelling a food (or dietary supplement) in the Unned States (http:/~.cfsan.fdagovlcgi, visited 07/07/05).
- - - -
nDproved Claims
Caldum and osteoporosis Sodium and hypertension Dietary fat and cancer Dietary saturated fat and cholesterol and risk of coronary heart disease (CUD) Fibrecontaining grain products, h i i s and vegetables and cancer F ~ i t s , vegetables and grain products that contain fibre, partiwlarly soluble fibre and risk Of CHD FN& and vegetables and cancer Folate and neural tube defects Dietary sugar alcohol and dental caries Soluble fibre and certain foods and risk of CHD Soy protein and risk of CHD Plant stemUstanol esters and risk of CHD
C&&m&thorised Based On Authoritative Statements Bv Federal Scientilic Bodies
Whole grain foods and risk of heart disease and M a i n cancers Potassium and the risk of high blood pressure and stroke
Qualfied Claims
Cancer: Selenium Antioxidant vitamins
Cardiovascular disease: Nuts and heart disease Walnuts and heart disease Omega-3 fatty acids and CHD B vitamins and vascular health Mono-unsaturated fatty acidsfrom olive oil and CHD
Cognitive function: Phosphatidylserine and cognaive dysfunction and dementia
Neural tube defects: 0.8mg folic acid per day -
A health cbim is an explicit or implied characterisation of a relationship between a substance
and a disease or a health related condition. This type of claim requires significant scientific
evidence and must be authorised by the FDA. A health claim d i e m from a structurel
function claim, which does not require pre-approval by the FDA. A strudurelfunction claim
describes the role of a substance intended to maintain the structure or function of the body
(FDA, 2005). A qualified health claim is supported by less scientific evidence than an
authorised health claim. FDA requires that qual i fd claims be accompanied by a disclaimer
that explains the level of the scientific evidence supporting the relationship. Unlike
authorised health claims, no regulations for quallfied health claims are issued by the FDA
Chapter 2
The legislation for functional foods and foods in general is not globally consistent. Several
countries, including the USA (United States of America) and Europe, have developed a
coherent body of food related legislation. They have also attempted to agree on common
rules at an international level. Codex Committees are established by the Food and
Agricultural Organisation (FAO) and World Health Organisation (WHO), for example, the
Codex Committee on Food Labelling of Pre-packaged Foods. The commonly defined rules
can then be implemented in the participating countries on a voluntary basis. The main
mission of Codex Alimentarius is to protect consumer's health and to ensure fair practices in
international food trade. Overall, the Codex activities have strongly influenced the patterns
of national food laws (Cheftel, 2005). With regard to health claims, the General Guidelines
on Claims of the Codex Alimentarius establish the principle that food should not be
presented in a manner that is false, misleading or deceptive; nutritional claims have
guidelines, but health claims guidelines remain in draft (Hawkes, 2004:~).
In Europe (as opposed to the United Stales of America), labeling requiring the nutritional
content of the product is not compulsory unless a nutrition (or health) claim is made on the
label or in the presentation or advertising material of a food (Cheftel, 2005). One of the most
general rules of European (and other) legishtions can be stated as "no misleading of the
consume? - the protection of the consumer's interests being one of the principles in food
laws. The PASSCLAIM project (Process for the Assessments of Scientific Support for
Claims on Foods) is intended to provide industry, academics, consumer groups and
regulators with the means to evaluate the scientif~ basis for health claims (Verschuren,
2002). In Japan, a scientific regulatory framework concerning FOSHU made it possible to
make limited health claims after receiving approval from the Ministry of Health in 1991.
Legislation is lacking in Latin America, but this is done on an ad hoc basis (Verschuren.
2002).
Currently, legislation in South Africa is sketchy, falling under the Department of Health's
Foodstuffs, Cosmetics and Disinfectants Act 1972 (Act No. 54 of 1972), Regulations
Relating to Labelling and Advertising of Foodstuffs. These regulations are in the process of
being updated and revised to take into account global trends and ensure that claims are
correctly substantiated and nutrition labelling is correct. The South African draft regulations
have been published for comment. However, the final regulations are eagerly awaited. It is
thought that these will be modekd on the USA and European guidelines, with strict
requirements for efficacy data to avoid loopholes that have been seen in the USA. Table 2.2
outlines the global overview of national regulation and health claims.
Chapter - - 2
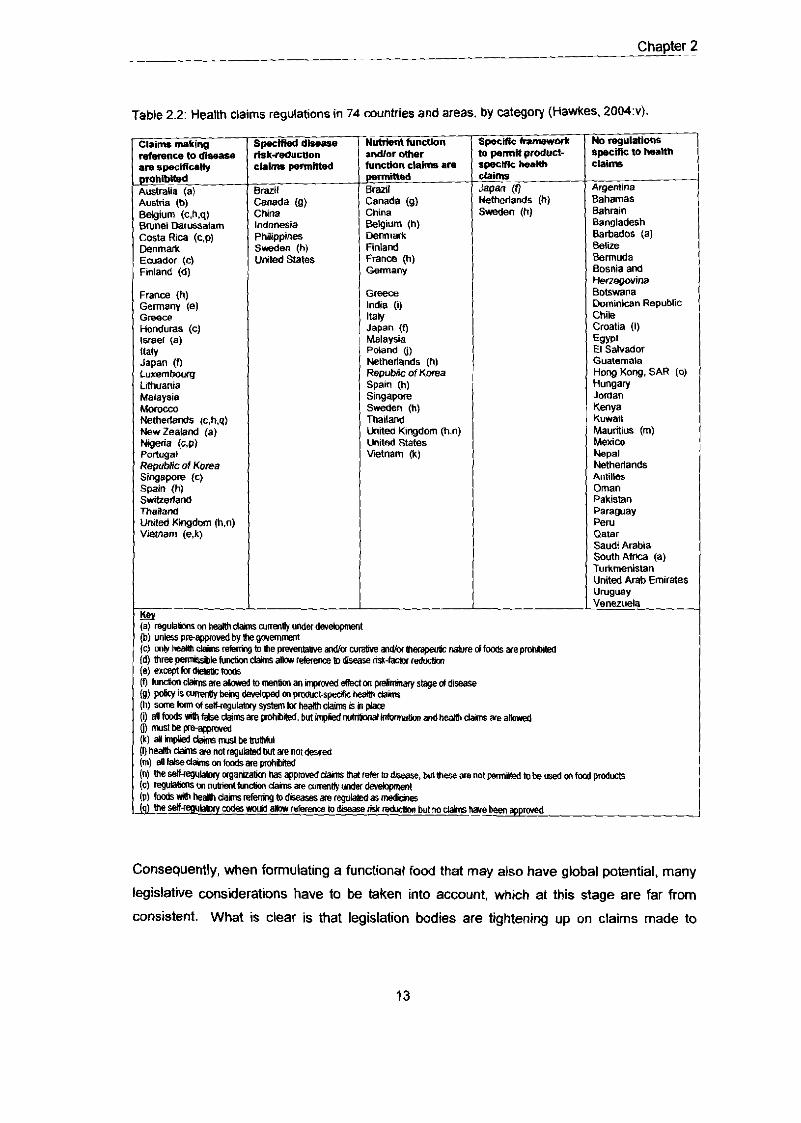
Table 2.2: Health claims regulations in 74 countries and areas, by category (Hawkes, 2004:~).
Claim. making
a n spnlfiulhl
C aelgium @.ha) c Brunel Danasalam 11 Costa Rim (c.p) F Denmark . Ecuador (c) 1 Finland (d)
France (h) Germany (e) Greece Honduras (c) Israel (a) Italy Japan (9 Luxembourn Lmuania Malaysia
R+ of Korea Singapare (c) Spain (h) Switredand maaand Uniled Kingdom 1h.n) Vletnarn (e.k)
Im i l :anada (9) :Mna donesia 'hlppines i d " (h) lrited States
i i n t tundon ~ndlor other unction claims a n mined Iran1 :anada (g) :hina klgium (h) )emnark 'inland 'ran= (h) >emany
;reece ndia (1) tahl lapan (9 dalaysia Wand (j) UetheIiands (h) 3epepuMic of Korea ;pain (h) ;ingapore Sweden (h) rhailand Jnlted Ktngdom (h.n) hited States Jetnam (k)
No regulations &peeirk to health c l a i m
RrgeMina Bahamas Bahrain Bangladesh Barbados (a) Belike Bermuda Bosnia and Herzegovina Botswana Dominican Republic Chih Croatia (I) ESYP~ El Salvador Guatemala Hang Kong. SAR la Hungary Jordan Kenya Kuwail Mauritius (m) Mexicn Nepal Netherlands Antilles Oman Pakistan Paraguay Peru Qatar Saudi Arabia South Afnca (a) Turkmenistan United Arab Emirate Uruguay Venezuela
Consequently, when formulating a functional food that may also have global potential, many
legislative considerations have to be taken into account, which at this stage are far from
consistent. What is clear is that legislation bodies are t'ihtening up on claims made to
- Chapter 2
-
consumers, to ensure that they are truly valid. Therefore, when formulating a new beverage,
this must all be accounted for.
Trends In Functional Foods and Beveraaes
Development of functional food products will continue throughout the 21'' century, as
consumer demand for healthy pr0duch grows (Milner, 2000). Factors contributing to the
increase of functional foods in the supply chain include: 1) an aging population; 2)
increasing health costs; 3) self-efficacy, autonomy in healthcare and an awareness and
desire to enhance personal health; 4) advancing scientific evidence that diet can alter
disease prevalence and progression and 5) changes in food regulations.
Sloan (2004) summarises the top 10 functional food trends, including global and US trends.
The key points arising from this article (relevant to this review) are purchases of functional
foods have increased from 31.0% in 2000 to 57.2% (2001) and 57.7% (2002 and 2003),
whilst 'fat-free' and 'low fat' foods have remained stagnant. Fortified food sales have
increased. Healh consciousness is increasing, for example fruit and vegetable consumption
has increased, but not sufficiently. The consumption of carbohydrates has declined with the
re-awakened popularity of the Atkins diet (which has impacted on sales of fruit juice, as the
carbohydrate content of a glass of fruit juice contains more than is recommended by this
regime, although the Atkins Company has recentty filed for bankruptcy protection
(hnpl~.nutraingredients-u8sa.comlne/ng.asp?id=61666, 09/08/05). There is an
increased focus on healthier foods for kids and the snacks they are consuming are
becoming more nutriiious and products aimed at reducing chronic lifestyle diseases are
being demanded by consumers. The beverage market, especially those products offering
functional benefits, is growing on the energy products and especialiy energy drinks are
becoming more popular, with flavour variations becoming more adventurous and innovative.
Restaurants (including fast food chains) are becoming more health conscious and less meat
is being consumed, whilst gourmet and organic trends are emerging. Focus on reducing
heart disease is increasing, and greater numbers of probiotic products such as Europe's
Actimel and Dan Active are being introduced (compared with Wwhvorths SA introduction of
probiotic orange juice with HOWARUTH probiotic cultures, and their range of cultured
yoghurts and Danone's Actimel yoghurt).
-._ n._u _._____
Chapter 2
Soy beverages
22%
Organic beverages of any type
Water fortified with herbals
Dinkable yoghurts
Juice fortified with herbals
25%
26%
26%
27%
Bottled I canned srroothies
Flavoured water
56%
Tea fortified w ith vitarrins I merals
Tea fortified with herbals
Water fortified with vitarrins I marais
Juice fortified with vitarrins I marais
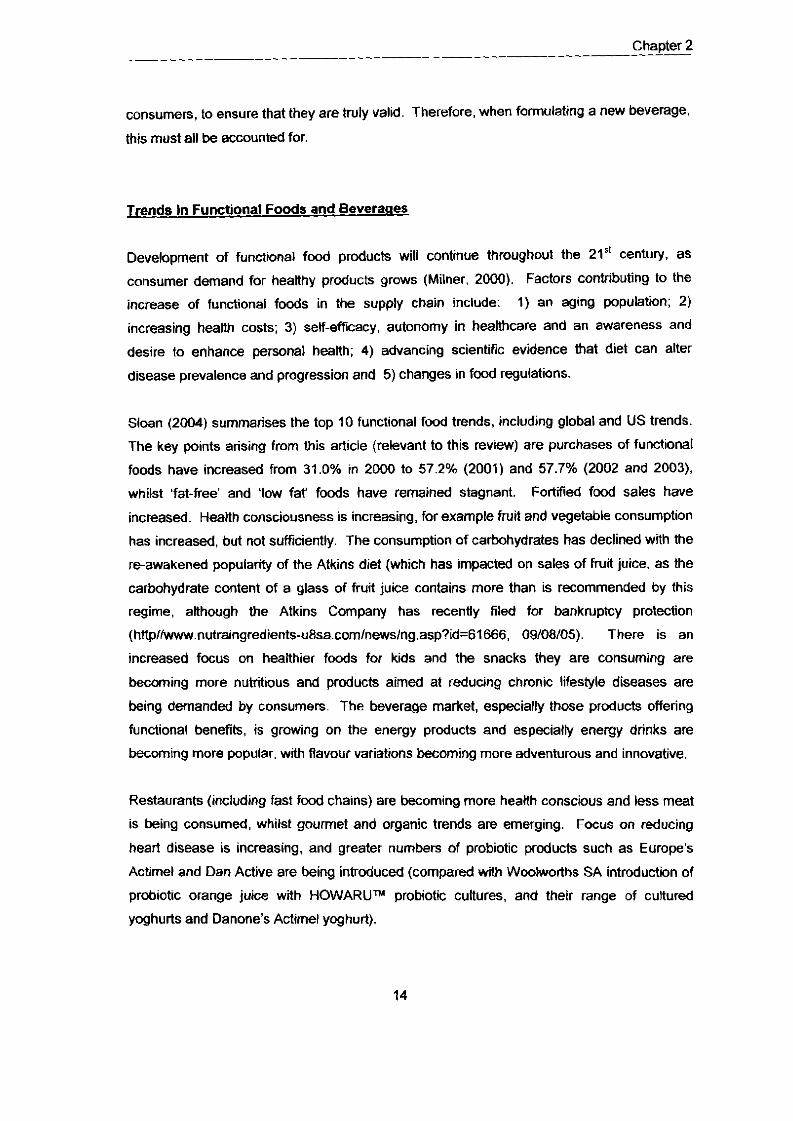
Figure 2.2: Research undertaken with wellness consumers who would consider purchasing variousbeverages (Hartman, 2003, adapted by Sloan, 2004).
Itry to eat soy foods I beveragesregularly
. is inlXJr1antfor ny store to have foodsthat contain soy isoflavones
. is iTportant for ny store to have soy-based foods &beverages
12.1%
16.0%
Iconsider nyself an ocassionalvegetarian
. is inlXJr1ant for ny store to have foods
that are vegetarian
I maka an effort regularly to have ameatless rreal
21.4%
27.3%
29.4%
Figure 2.3: Interest in vegetarian products (consumer research undertaken by NMI, 2003, quoted bySloan, 2004).
Figures 2.2 and 2.3 show examples of research undertaken in 2003 in the USA with
consumers. Figure 2.2 clearly indicates that the consumer is ready to adopt more
interesting, functional, fortified beverages. Figure 2.3 shows research undertaken with
consumers, not retailers, which indicates that consumers are interested in moving away from
meat and improve their efforts to eat "meatless" on a more regular basis (Sloan, 2004). It
seems as if the consumer is therefore ready to adopt new concepts and is likely to adopt
innovative new products. However, it is clear from the aforementioned research and the
discussed legislation that the foods I beverages must have a provable nutritional benefit.
Katan and De Roos (2003) point out that if there are clear and strict standards for efficacy
and safety of functional foods, then the market has a long-term future. Westrate et a/. (2002)
explain that the following factors need to be taken into consideration in the development of
15
Chapter 2
such functional foods: 1) consumer understanding: what kind of health benefns are
required? 2) bioinformatics: what molecules could do the function? 3) in vitro and in vwo
testing, 4) bioavailabili; 5) functional food technology: can the ingredients be sourced
easily and made attractive food? 6) biomarken: can relevant effects be measured in man?
7) human interventin studies: does it really work? 8) communication: how do we explain
the beneffls?
Perhaps, most importantly, it shwld be remembered that if functional foods are to be
successful, they should be desired by the consumer (that is, they should taste good). Drugs
will sell, whatever they look and taste like, but foods need taste, convenience and appeal or
else they will not be consumed (Katan 8 De Roos, 2004). They must also provide sufficient
consumer value to sustain long-term consumption (Walzem, 2004). In addition, it must be
emphasised that these focds are not magic bullets or panaceas for poor health habits. Diet
is only one part of a comprehensive approach to good health.
The focus of this project is functional beverages. therefore it is worthwhile discussing briefly
the current state of the market and the types of products that make up this market.
New Product Trends - Beverages
Mellentin in 2003 estimated that US sales of functional foods exceeded $18.2 billion in 2001,
growing at more than 8% yearly (representing 3.5% of the total food market). Front-line
strategic management predicted sales in excess of $327 billion by 2005. Sales of fortified
beverages more than tripled between 1997 and 2001. Functional beverages represent
another $7 billion and growth rates are upwards of 12% per annum.
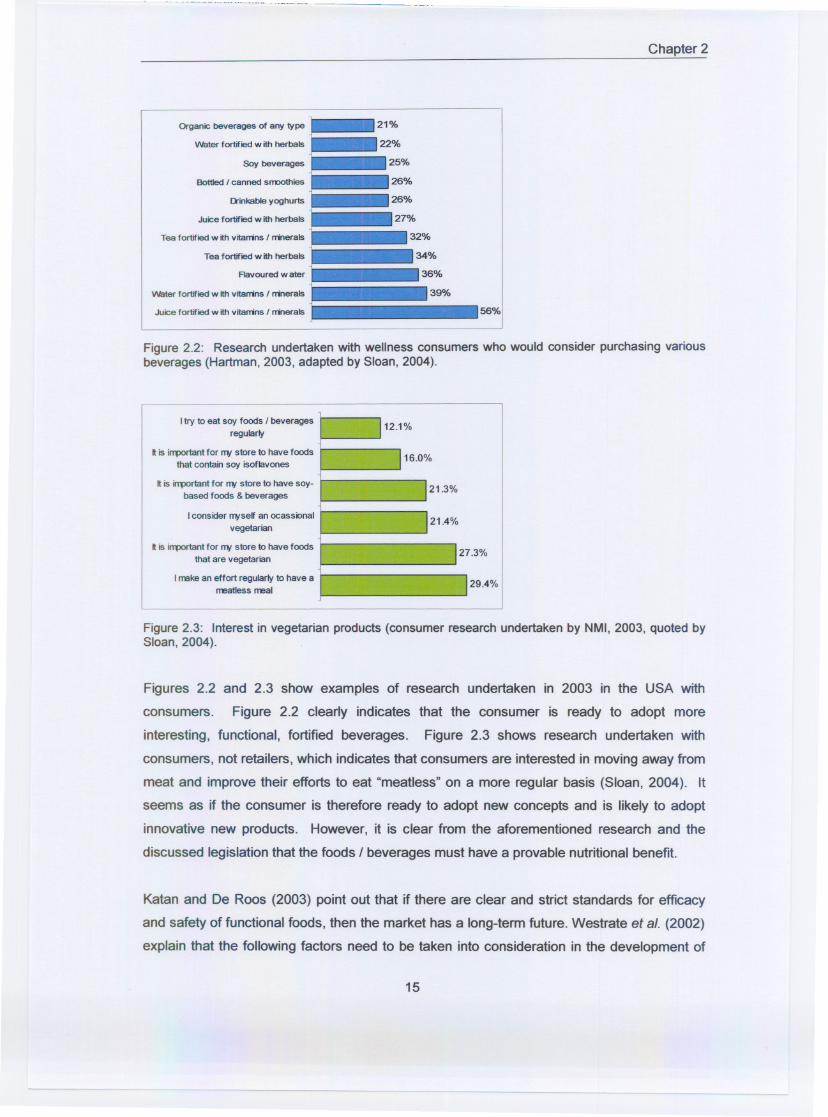
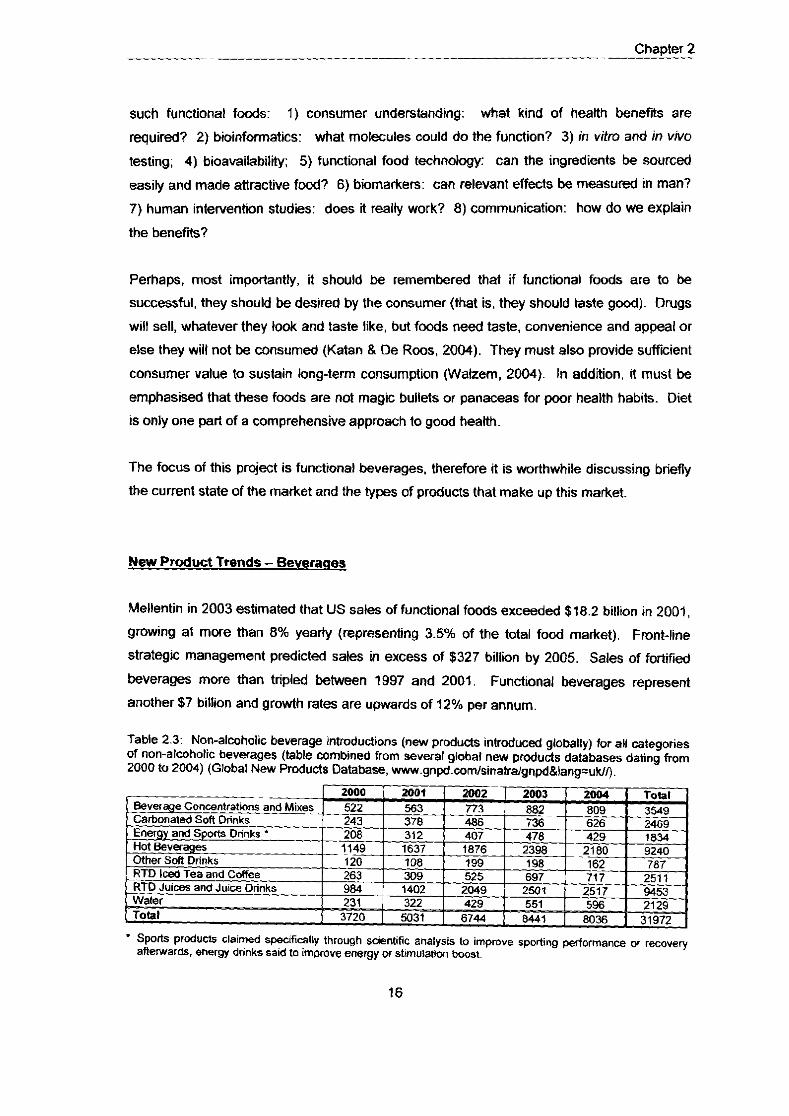
Table 2 3 Non-alcohols beverage mtroduct~ons (new produds introduced globally) lor all categor~es of non-alcohol~c beverages (table comblned from several global new products databases datlng from 2000 to 2004) (Global New Products Database, www gnpd com/smahagnpd&lang=ukl~
Spolts products claimed specifically through scientific analysis to improve sporting performance or recovery afterwards, energy drinks said to improve energy or stmulation boost.
Chapter 2
Beverages are split in consumer marketing terms into several categories. These are water,
carbonated soft drinks, energy and sports drinks, beverage concentrates and mixes, ready-
to-drink (RTD) juices, and juice drinks. Common trends are apparent within these categories
and these include the fortification with vitamins and minerals, flavours and reduced calorie
drinks. Ingredients also include ginseng, guarana, echinacea, kava roots and ginko biloba
extract. Smoothies (a thickened beverage) are becoming popular globally as a meal
replacement, often with the addition of soy. Carbonated soft drinks are becoming less
popular and being replaced by water, and their consumption has even been banned in
Edinburgh (Anonymous, 2004a) and California (Foreyt, 2005). This is presumably a trend
that will spread as the global concern for increased obesity continues and the effort to
reduce it. Cranberry is increasing in popularity, and organic products are emerging.
Marketing gimmicks and characters such as Winnie the Pooh, are common to attract
children's sales by encouraging their parents to purchase these products.
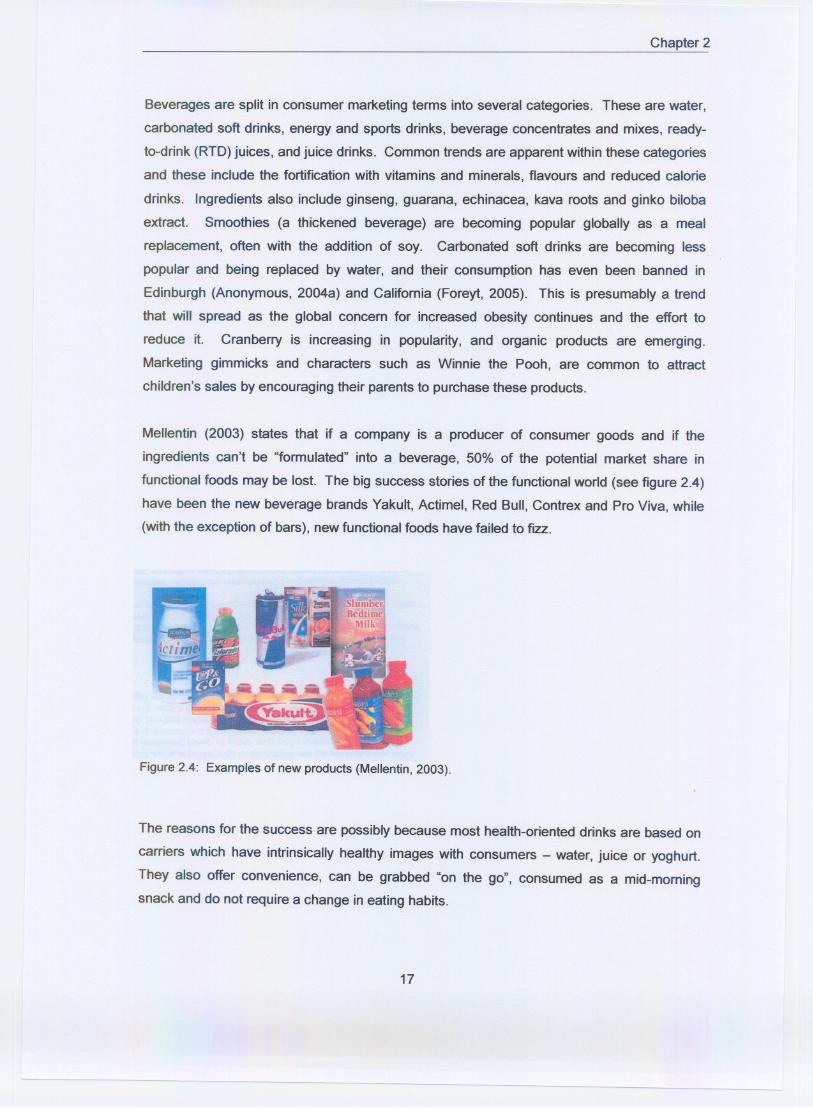
Mellentin (2003) states that if a company is a producer of consumer goods and if the
ingredients can't be "formulated" into a beverage, 50% of the potential market share in
functional foods may be lost. The big success stories of the functional world (see figure 2.4)
have been the new beverage brands Yakult, Actimel, Red Bull, Contrex and Pro Viva, while
(with the exception of bars), new functional foods have failed to fIZZ.
Figure 2.4: Examples of new products (Mellentin, 2003).
The reasons for the success are possibly because most health-oriented drinks are based on
carriers which have intrinsically healthy images with consumers - water, juice or yoghurt.
They also offer convenience, can be grabbed "on the go", consumed as a mid-morning
snack and do not require a change in eating habits.
17
- --- - -- -
- Chapter 2
There is potential for beverages to grow in other directions: 1) liquid breakfasts - providing
all nutrients (20-30% of consumers give traditional breakfast a miss - and this figure could
be consemtive), 2) enhanced waters, and 3) liquid dietary supplements (as discussed
previously). The potentials are huge for the food manufacturer. However, the question
remains - how many of these beverages are t& functional. How many would pass the
necessary PASSCLAIM legislation if they were required to? How many of these products
are actually good marketing and advertising? How many provide definitive, evidence-based
nutritional benefts? The trends shown by Sloan (2004) are encouraging in that there is a
definite steer away from meat (figure 2.3) and a trend to vegetarian products with these
consumers who are heath conscious, but is the food industry negatively capitalising on this
trend?
It is clear that the market is extremely active and has huge potential. However, looming
legislation (as previously described) may result in the downscaling or even removal of some
of these claims. There is a proliferation of products in the market place and a great deal of
confusion is being placed in the mind of the consumer due to indiscriminate marketing.
Even the consumer who has generally a greater disposable income is confused.
Therefore, there is a huge opporfun~ty for the development of a truly functional fruit juice,
with sustainable health claims, that will be able to fit into this market, which has already been
primed to readily accept new product introductions. Key to the long-term success of the
product is the truly provable evidence-based functional claims.
In this project, the researchers are dealing Wth a fruit that is indigenous to South Africa, has
potential nutritional benefits and has been underutilized in the past for the small-scale
production of jam and jellies. The following section on fruits and vegetables deals with their
importance in the d i i as a result of its functional ingredient contents, as well as why it is
important to include them (and thus potentially the Kei apple) at greater quantities in the diet
than we currently consume.
The aim of this section of the review is to show that fruits and vegetables are important in the
diet and, though far from exhaustive, studies have revealed that the inclusion of fruits and
vegetables in the diet will reduce the risk of chronic disease. It is estimated that, if just
Chapter 2
dietary guidelines were met, globally 2.7 million deaths per annum would be avoided (Tohill,
2005).
The effect of fruit and vegetable intake on risk for coronary heart disease in The Nurses
Health Study and the Health Professionals Follow-up Study as reported by Joshipura et a/.
(2001). showed that consumption of fruits and vegetables had a protective effect against
coronary heart disease (CHD). This study followed up 84.257 women. 34 to 59 years of
age, for 14 years: and 2,148 men, 40 to 75 years of age, for 8 years. Hu and Willen (2002)
recommend that a diet containing an abundance of fruit and vegetables (plus non-
hydrogenated unsaturated fats, whole grains and adequate omega9 fatty acids) offers
protection against CHD. A diet rich in plant foods has long been recommended to supply a
large source of phylochemicals, preventing coronary heart disease (Craig. 1997. Visioli et
a/. , 2000).
In addition to numerous in viva and in vitro studies, many organizations such as the British
Heart Foundation (2004), the United States Department of Health and Human Services and
the United States Department of Agriculture in their jointly published Dietaw Guidelines for
Americans (Anonymous 2005). British Nutrition Foundation (2004) and Department of
Health, Republic of South Africa (2003), supported by Association of Dietetics in South
Africa and the Nutrition Society of South Africa, to name a few, recommend the increased
intake of fruit and vegetables in the diet (at least 5 portions per day). It is fair to say that
most government food policies contain a phrase that relates to the consumption of at least
five or more portions of fruit or vegetables per day.
Nel and Steyn, 2001 (http:llwww.mrc.ac.za.chronic/foodstudies.hl) report that the
consumption of fruit and vegetables in South Africa is low. These authors analysed data
from studies performed from 1983 to 2000 and showed that the only fruit and vegetables
consumed were grapes, apples, orange juice, peaches, bananas, carrots, pumpkin,
tomatoes and onions, and only at very low levels.
Ruel. M.T., eta/. (2005) report that fruit and vegetable consumption in SubSaharan Africa is
low and that this low fruit and vegetable consumptiin is the main contributor to micro-
nutrient deficiencies in the developing world.
Chapter 2
Househdd cornpoitbn, educafion and skills, auzss to land, equipment, social capital, location, wage rales, and farm
bansport and cukrd beliefs and norms, and biolaglcal aspeds
agco-dimimc of hunger conditions, institutbns, price
policy, and FandV research
labour wailabilii, FandV seed. fertilizer, production and marketing informdon, and agroclimabc
Gender aspects of pmpetty rights, diwrce law, legal inhast~cture,
educabbn, and cultural norms
4 Frul aml vegetak consumptan
4 + 4 4 -
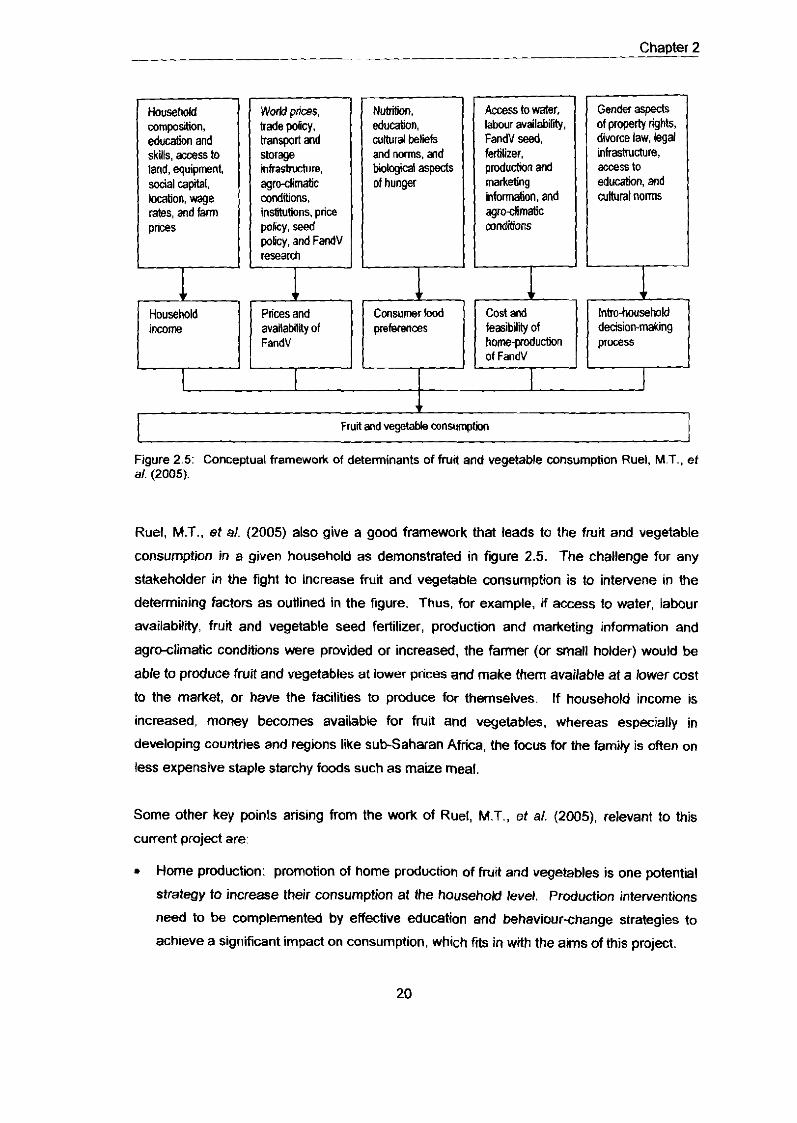
Figure 2.5: Conceptual framewolk of determinants of fruit and vegetable consumption Ruel, M.T.. ef a/. (2005).
Household income
L
Ruel, M.T., et a/. (2005) also give a good framework that leads to the fruit and vegetable
consumption in a given household as demonstrated in figure 2.5. The challenge for any
stakeholder in the fight to increase frua and vegetable consumption is to intervene in the
determining factors as outlined in the figure. Thus, for example, if access to water, labour
availability, fruit and vegetable seed fertilizer, production and marketing information and
agro-climatii conditions were provided or increased, the farmer (or small holder) would be
able to produce fruit and vegetables at lower prices and make them available at a lower cost
to the market, or have the facilities to produce for themselves. If household income is
increased, money becomes available for fruit and vegetables, whereas especially in
developing countries and regions like sub-Saharan Africa, the focus for the family is often on
less expensive staple starchy foods such as maize meal.
Some other key points arising from the Work of Ruel, M.T., et a/. (2005), relevant to this
current project are:
1 p-
Prices and availability of FandV
0 Home production: promotion of home production of fruit and vegetables is one potential
strategy to increase their consumption at the househokl level. Production interventins
need to be complemented by effective education and behaviour-change strategies to
achieve a significant impact on consumption, which fits in with the aims of this project.
Consumer food preferences
Cost and feasibility of homepmduction of FandV
Into-household decisiokrnaking process
- Chapter 2
The consumption of fruit and vegetables in the 10 sub-Saharan African countries studied
ranges from 27kg to 114kg per person per year, far below the recommended 146kg per
person per year. Thus, again, the project could increase fruit consumption per capita.
The demand for fruit and vegetables rises with increasing income, although at a slower
rate than income. The income elasticities for fruit and vegetables range from 0.60 to
0.97 and are generally higher for fruit than vegetables. Thus, as people become richer,
their demand for fruit increases before vegetables, another motivating factor for this
project.
0 In most of the countries studied, female-headed households spend signiftantly more on
fruit and vegetables, particularly on vegetables, than male-headed househokls.
The recent World Health Organisation (WHO) report on Chronic Life style Diseases issued
on 5m October 2005 (http:llwww.who/int/chp/chronic-disease) advocates that one of the
ways to decrease the increasing global epidemic of chronic disease deaths is to increase
fruk and vegetable intake (h~p:l~.wholinVchp/chronicdisease,reporVpart4:37-137)
through initiatives such as the "5-a-day" programme, including more fruits and vegetables in
school meals. At the recent International Nutriiional Conference in Durban (September
2005), the International Fruit and Vegetable Alliance (IFAVA) was launched (ifava.org) which
aims to encourage and foster efforts to increase the consumption of fruit and vegetables
globally for better health by supporting national initiatives, promoting effiencies, facilitating
collaboration and shared aims and providing global leadership, all of which is based on well
documented and scientific publication.
The above only emphasizes the importance of producing a beverage that can form part of
one of the recommended portions to increase fruit and vegetable intake daily and that will
entice its consumption yet add nutritional benefits as a scientifically proven functional
beverage.
POLYPHENOLS, THEIR CLASSIFICATION. CHEMISTRY. EFFICACY STUDIES,
%
As stated before, fruits and vegetables are very important in the diet, but what is it hat
makes them so important? This section of the review aims to identify the biologically active
components that make fruits and vegetables so vital in the daily diet.
- Chapter 2 --
There are many actives that can provide functionality in fruits and vegetables, for example,
vitamins, some minerals and fibre. However, of main concern for this thesis are the
polyphenols, and for that reason the main area of focus of this review will be the
classification of pdyphenols, their function and efficacy studies, specificaHy concentrating on
fruits as it is thought that the Kei apple is rich in polyphenols. The advantages and
disadvantages of polyphenols are covered, through an assessment of the literature available
since the 1980's, which consists of a mixture of reviews and effcacy studies. Although by
no means exhaustive, this literature review attempts to assess polyphenols through the
results of well designed trials, epidemiology studies or clinical trials and reviews. It aims to
show that they are beneficial to human healh.
Classification of Polv~henols
Phenol is an important component of all plants. It is synthesized from L-tyrosine or
L-phenylalanine via the shikimate acid pathway (Robards 8 Antolovich. 1997). The
enzymes for th~s pathway are not found in animal cells and, therefore, animals do not
manufacture phenol nor break it down. However, they may accumulate phenols in their
tissues. Plantderived phenols in the diet include simple phenols (hydroxybenzoic acids),
phenylpropanoids (hydroxycinnamic acids) and flavono~ds. Phenols impart an astringent
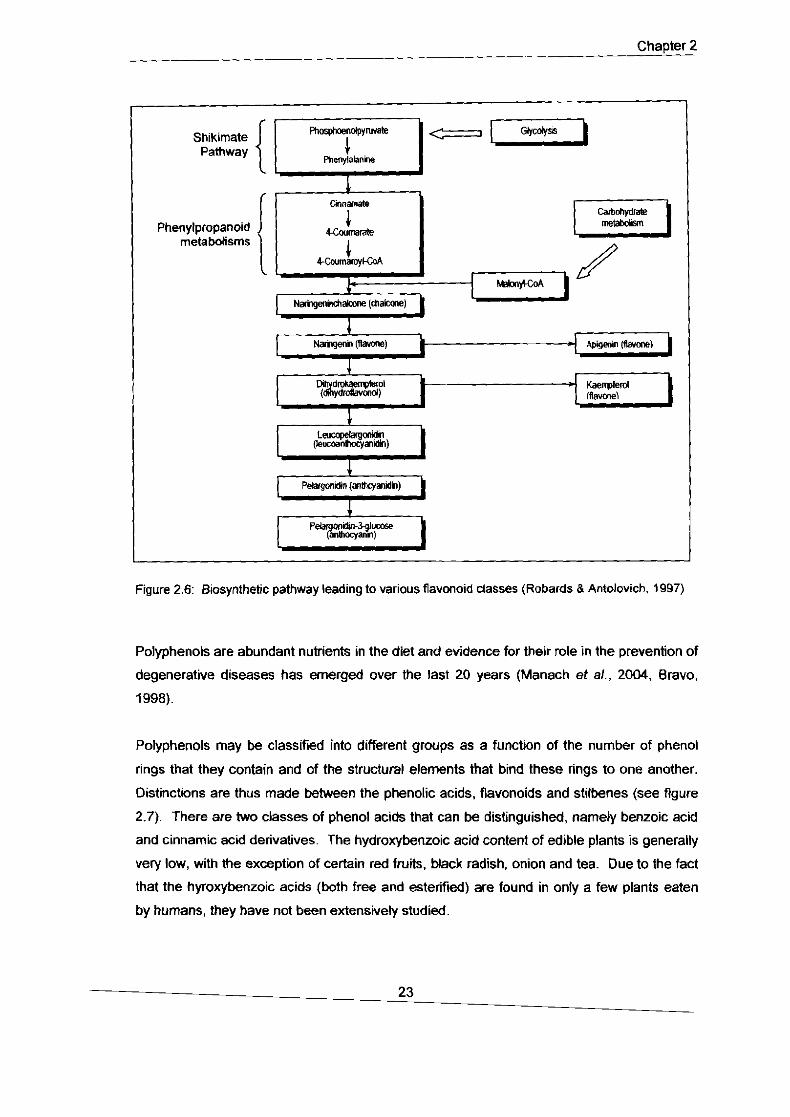
taste to fresh food (Miller & Ruiz-Larrea, 2002). Figure 2.6 demonstrates the bisynthetic
pathway leading to various flavanoid classes that occur in plants.
Phenols are produced by plants for a variety of reasons, such as UV protectants, pigments
and hormones. They play a signifcant role in how the phnts interact with other organisms in
the environment (Miller & Ruiz-Larrea, 2002, Wildman. 2001:23, and Robards 8 Antolovich,
1997). Phenols produced by a number of plants appear to play a defensive role, providing
anti-feeding activity against insect pests, or act as fungicides (Straney ef a/. 2002, Woo et
a / , 2002). It has also been hypothesiseu Mat some flavonoids may be essential for the
symbiosis existing in plant root systems, protecting against root growth deterioration
(Vierheilig & Piche, 2002:23). Taylor and Miller, 2002 indicate that specific flavonols are
required to induce pollen germination and tube growth in plants. Examples of these include
kaempferol and quercetin in petunias. A variety of proteins may be labelled with a flavonol
affinity probe including receptors, transport proteins and flavonol bisynthetic enzymes.
- Chapter 2
Shikimate Pathway
Phenylpropanoid metabolisms
Figure 2.6: Biosynthetic pathway leading to various flavcnoid classes (Robards 8 Antolovich, 1997)
Polyphenols are abundant nutrients in the diet and evidence for their role in the prevention of
degenerative diseases has emerged over the last 20 years (Manach et al., 2004, Bravo,
1998).
Polyphenols may be classified into different groups as a function of the number of phenol
rings that they contain and of the structural elements that bind these rings to one another.
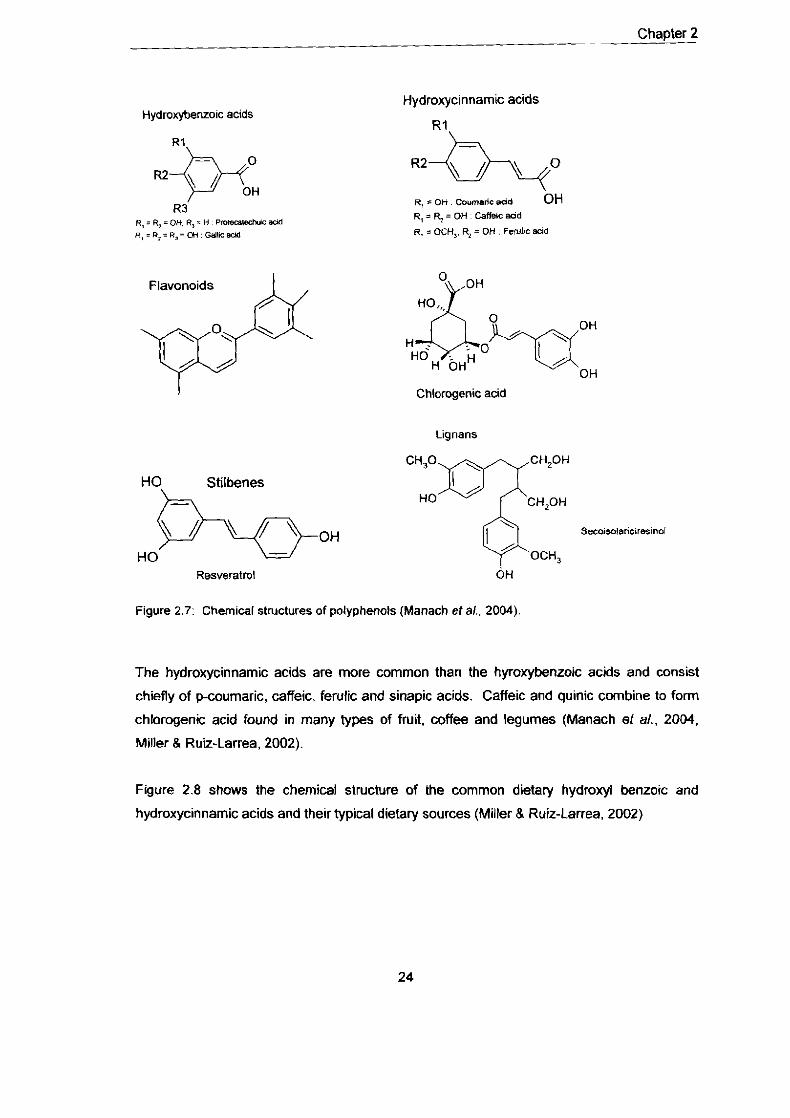
Distinctions are thus made between the phenolic acids, flavonoids and stilbenes (see figure
2.7). There are two classes of phenol acids that can be distinguished, namely benzoic acid
and cinnamic acid derivatives. The hydroxybenzoic acid content of edible plants is generally
very low, with the exception of certain red fruits, black radish, onion and tea. Due to the fact
that the hyroxybenzoic acids (both free and esterified) are found in only a few plants eaten
by humans, they have not been extensively studied.
Chapter 2
Hydroxybenzoic acids Hydroxycinnamic acids
R, i OH Coummc aad OH R,=f l=OH CaffRcaod
R. i OCH,, q =OH Ferullc k l d
H OH OH Chlorogenic add
Lignans
HO Stilbenes
Secolsola"ciresinol
HO OCH,
Resveratrol OH
Figure 2.7: Chemical structures of polyphenols (Manach eta/ . 2004).
The hydroxycinnamic acids are more common than the hyroxybenzoic acids and consist
chiefly of p-coumaric, caffeic, ferulic and sinapic acids. Caffeic and quinic combine to form
chlorogenic acid found in many types of fruit, coffee and legumes (Manach et a/., 2004.
Miller 8 Ruiz-Larrea, 2002).
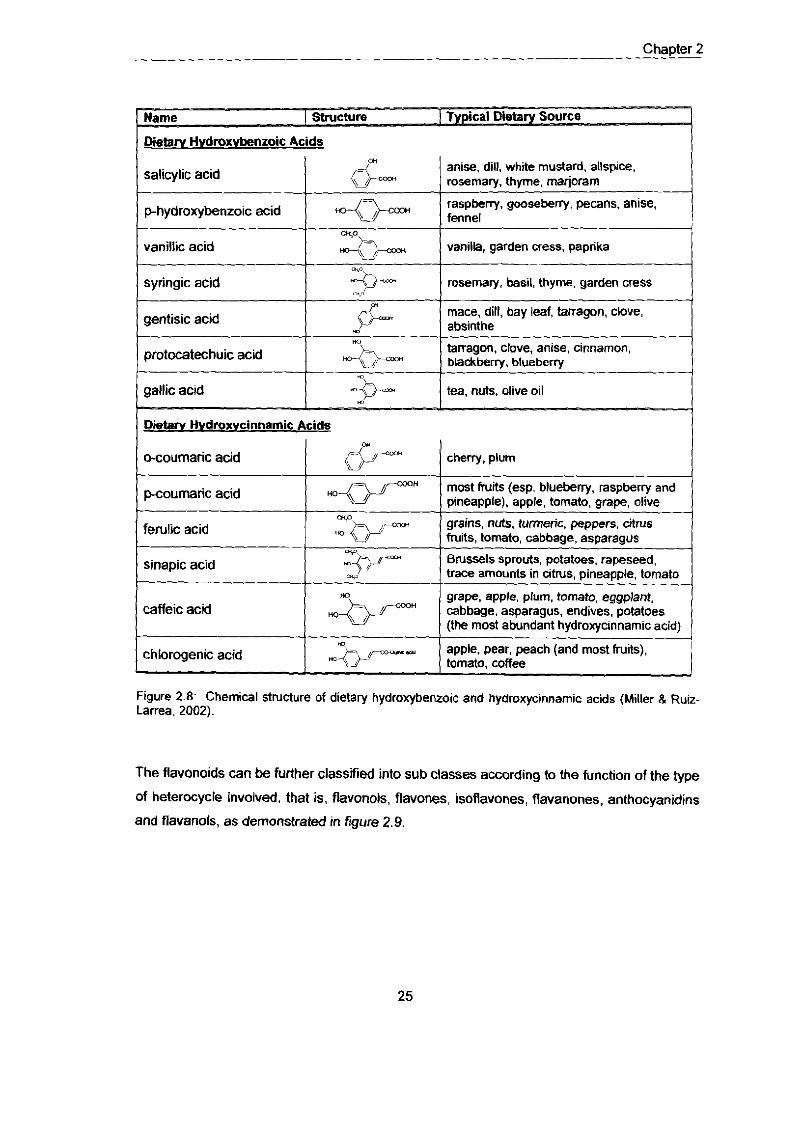
Figure 2.8 shows the chemical structure of the common dietary hydroxyl benzoic and
hydroxycinnamic acids and their typical dietary sources (Miller & Ruiz-Larrea, 2002)
Chapter 2
- Name -ICY- Source‘ - Dietarv Hvdmxvbenzoic Acids
anise, dill, white mustard, allspice. salicylic acid rosemaw. thyme. marioram
raspberry, gooseberry, pecans, anise, phydroxybenzoic acid I I fennel
vanillic acid I vanilla, garden cress, paprika
syringic acid rosemary, basil, thyme. garden cress
gentisic acid mace, dill, bay leaf, tarragon, clove. absinthe
protocatechuic acid I I tarragon, clove, anise, cinnamon. blackberw, blueberw
gallic acid I -0- I tea, nuts, olive oil
Dietaw Hvdroxvcinnamic Acids OI
o-coumaric acid I cherry, plum
Figure 2.8- Chemical structure of dietary hydroxybenzoic and hydroxycinnamic acids (Miller 8 Ruiz- Larrea. 2002).
pcoumaric acid
ferulic acid
sinapic acid -.
caffeic acid
chlorogenic acid
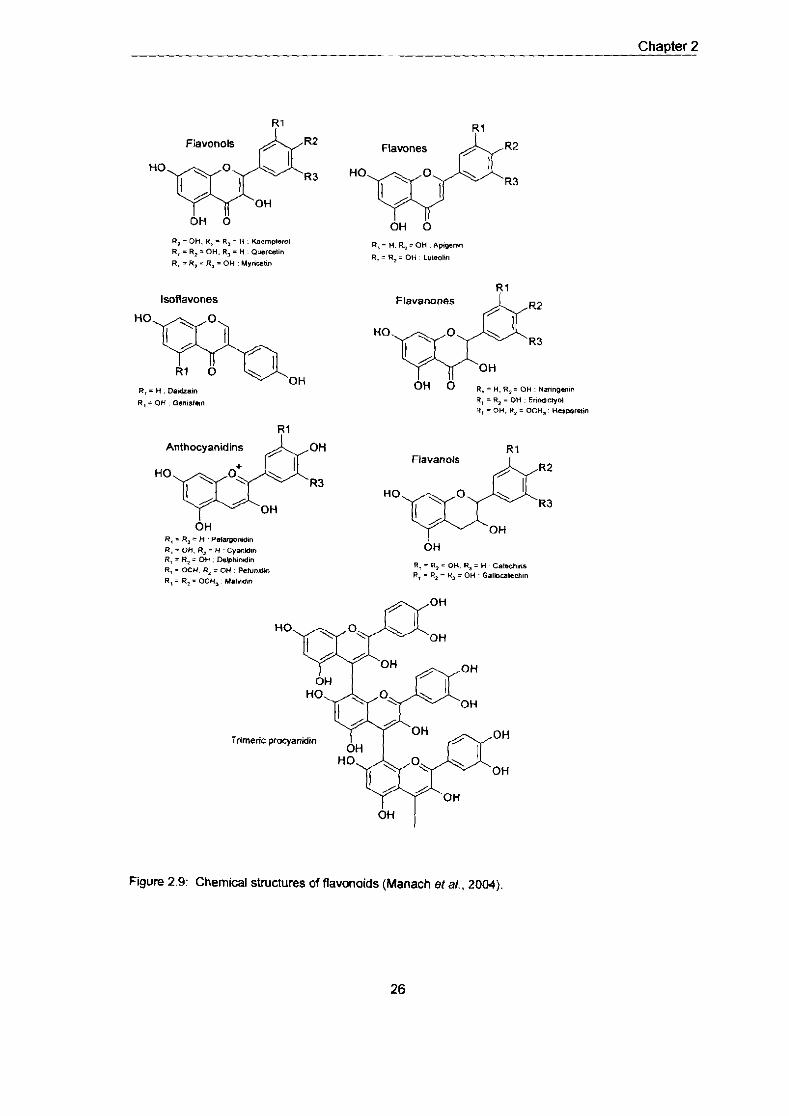
The flavonoids can be further classified into sub classes according to the function of the type
of heterocycle involved, that is, flavonols, flavones, isoflavones, flavanones, anthocyanidins
and flavanols, as demonstrated in figure 2.9.
uoq=JyH \ / - *-- \ I
- ap+~ UY
m*m \ /
most h i ts (esp. bluebeny, raspberry and pineapple), apple, tomato, grape, olive
grains, nuts, turmeric, peppers, citrus fruits, tomato, cabbage, asparagus
Brussels sprouts, potatoes, rapeseed. trace amounts in citrus, pineapple, tomato -- grape, apple, plum, tomato, eggplant, cabbage, asparagus, endives, potatoes (the most abundant hydroxycinnamic acid)
-
apple. pear, peach (and most huib). tomato, coffee
Chapter 2
R,= OH. R, = R, = H i(.ampf.mi R. = R, = OH. R, = H Quoroll" R , = R, = R, = OH Uyncef,"
lsoflavones
Anthocyanidins
HO
OH
Figure 2.9:
Flavones
HO &R2 / R3
OH 0
Flavanolr
HO
OH
d~ I
Chemical structures of flavonoids (Manach e t a / , 2004).
- Chapter 2
Flavonols are the most ubiquitous flavonoids in foods and the main representatives are
quercetin and kaempferol, generally present in the glycosylated form. They accumuhte in
the skin and leaves of the plant. Flavones are less common, and usually exist as glycosides
of luteolin and apigenin. Flavones are found mainly in citrus fruits, most commonly as
hesperetin and naringenin. lsoflavones have similar structures to estrogen and have
pseudohormonal properties, including the ability to bind to estrogens. They are thus
classified as phytoestrogens. Flavonoids exist in the monomer form (catechins) and polymer
form (proanthocyanidins), with the former being found in many types of fruit, red wines,
green tea and chocolate. Proanthocyanidins (also known as tannins) are dimers, oligomers
or polymers of catechins, and are known to impart an astringent taste to food. Anthocyanins
have pigments imparting colour to a fruit or vegetable (Manach etal.. 2004).
Lignans (see figure 2.7) are formed of 2 phenyl-propane units and are found mainly in
linseed and to a smaller extent in other foods, primarily pears and prunes (Manach et a/.,
2004). Stilbenes, another form of poMphenols, are found in low quantities in the diet but
resveratrol, found in wine, has shown to have anti-carcinogenic effects and anti-thrombotic
effects (Zbikowska et al.. 1999, Manach etal., 2004).
P o l ~ ~ h e n o k and Human Health
Usually, new associatons are discovered by epidemiological studies, either cross-sectional
or prospective. To establish a causal relationship, further testing is then required, which
often includes in vitro and in VIVO testing with human cells andlor animals, based on a
specific isolated chemical constituent. Human clinical intewention trials, which may be large
(with several hundred individuals) or small (less than 100 individuals), are also undertaken to
determine the effect of the active ingredient under investigation and yields important
information in terns of the causal relationship between the dietary component and the risk of
articular disease.
This experimental process leads to the creation of a body of evidence, which then enables
scientists and regulators to draw a conclusion about a dietary component, for example,
flavonoid and its ability to affect human health. The conclusion reached must be based on
sound scientific evidence that may be duplicated at any time i f required, statistically sound
and free from bias. If all these criteria are met, then the concluding body of evidence (at that
time) may result in a statement, for example "polyphenols are beneficial to human health and
Chapter 2 --
their inclusion in the diet in the form of increased intake of fruit and vegetables should be
encouraged".
It was with the aforementioned in mind that a review of the literature relating to polyphenols
and their impact on human health was undertaken. A full review of the topic falls outside the
scope of this thesis but the evidence provided should be viewed as parts of the picture
forming the body of evidence showing the role of polyphenols in human health. The reader
is encouraged to refer to the original publication if further details of a particular study are
required.
General Efficacy Studies
Recently, there has been an exponential increase in the interest in polyphenols and health
and for this reason only a few recent reviews have been studied, which give an overall
picture of flyphenols and health.
Hertog (1996) pioneered much of the work on polyphenols in the last decade. In this review,
he studied various polyphenols, mainly quercetin, in epidemiological (human) tests and
found that the epidemiological evidence on potential health properties of flavonoids in high
levels could reduce the risk of cardiovascular disease but was not an important determinant
of cancer risk. Arts & Hollman (2005) in their review on polyphenols and disease risk in
epidemiological studies suggest that there are beneficial effects of flavonoids on
cardiovascular disease but not cancer (with the exception of lung cancer) and there is a
need for more research.
Dietary polyphenols and the prevention of disease have been reviewed by Scalbert et al.
(2005). In summaly, these authors conclude that polyphenols support a role in the
prevention of cardiovascular disease, cancer, neurodegenerative disease, diabetes or
osteoporosis. In cardiovascular disease, they are thought to exert anti-thrombotic effects.
inhibit platelet aggregation and modify lipid metabolism by reducing LDL (low density
lipoprotein) and improving endothelial dysfunction. Polyphenols have been well documented
in animals as having anticarcinogenic effects, through various mechanisms, and have been
muted as useful adjuncts in Chemotherapy or radiotherapy treatments. There is an inverse
association between the intake of polyphenols and neurodegenerative diseases, although
this is not strong, whilst the evidence of the effects of polyphenols on glycaemic or diabetes
risk is still very little Prevention of or lowering of osteopwosis has been found to be
Chapter 2
positively associated with polyphenol intakes, especially with those polyphenols related to
soy beans, already a high source of calcium. Scalbert et a/. (2005) go on to conclude that.
whilst these health benefits have positive associations, studies have often been undertaken
at higher levels than those normally documented in humans and caution should be taken
when interpreting the results. More work on further epidemiological and clinical intervention
trials is required.
A meta-analysis of tea consumption in relation to stroke, myocardial infarction and all
coronary heart diseases based on 10 cohort studies and 7 casecontrol studies was
conducted by Peters et a/. (2001). Myocardial infarction rates were found to decrease (1 1%)
with an increase in tea consumption of 3 cups per day, but there appeared to be some bias
in reporting and variation in geographic areas which may be related to the type of tea and
strength brewed. Less conclusive, although positively associated results were achieved with
the meta-analysis for stroke and other coronary heart diseases.
Some specific studies, although far from exhaustive, are mentioned below.
Epidemioloaical Studies
Polyphenols and the prevention of cardiovascular diseases has been reviewed by Manach &
Williams (2005). They conclude that a reduction in risk of cardiovascular disease is
associated with consumption of polyphenols, which is mainly observed by endothelial
function and haemostatic response. However, the exact nature of the most active
compounds remains largely unknown. Absorption, metabolism and elimination vary widely
between the polyphenols and data on bioavailability must be taken into account to improve
experimental design and the interpretation of the observed effects.
Flavonoids in all sources of diet (tea, soy, fruit and vegetables) were studied by Le
Marchand (2002) who found that they have a protective effect but more work was required.
Biomarker studies were required and more human clinical, not just epidemiological, trials
were also required. Peterson et a/. (2003) studied flavonoids utilising a food frequency
questionnaire and found that hvonoid intake and breast cancer risk in a case control study
in Greece had a statistically strong significant inverse association with flavone intake for
breast cancer, but there was no association for the rest of the classes of flavonoids. The
flavonoids quercetin, kaempferol, myricetin, apigenin and luteolin were studied by Sesso et
- Chapter 2
al. (2003) as part of a Women's Health Study. The authors found that there was a non-
significant positively reduced risk of cardiovascular disease in women, for broccoli, apples
and tea, but no association with any specifc flavonols. Knekt et al. (2002), as part of a
Finnish Mobile Clinic Heatth Examination Survey conducted during 1966-1972, studied
quercetin, kaempferol, myricetin, naringenin and hesperitm. They found that chronic disease
risk may be lower at higher dietary flavonoids intakes (for example, ischaemic heart disease,
cerebrovascular disease, lung and prostate cancer, type 2 diabetes and asthma). Quercetin
was found to be most effective.
Intervention Studies
It is clear that there are insufficient of these, however, Winkler et al. (2004) studied German
commercially available fruit or fruitlvegetable juices supplemented in the diet for 16 weeks in
vivo and found lymphocyte proliferation and apoptosis in HIV-seropositive and healthy
subjects. The study concludes that the supplementation with fruit and vegetables could be
favourable to HIV positive patients. Manach & Williams (2005) reviewed 24 intervention
studies and found the antioxidant status of plasma (vitamin E B C. @-carotene) was raised by
ingestion of polyphenols over 12 weeks, but contrasting results were found with other
studies. Six studies over 1-13 weeks showed improvements in blood lipids (decrease in total
cholesterol, increase in high-densty lipoprotein (HDL) and apoplipoprotein A-I), with the
ingestion of tea, virgin olive oil, cocoa, soybean or red clover, but six studies showed no
effects on lipids. These authors conclude that further intervention studies should include a
detailed assessment of the bioavailability of polyphenols. Besides clinical trials carried out
with polyphenol-rich food, more studies with pure polyphenols are also needed to establish
their role in the prevention of disease. Further intervention studies will be discussed under
the fruits section of this literature review.
Mechanistic
The examples that follow, whilst showing only a handful of the studies available, can only
give an indication of how the specific polyphenol under investigation may act, and can
therefore not be taken in isolation but rather as the starting point for future work.
- Chapter 2
Examples of mechanistic studies include Alexandrakis et a/. (2003), who studied the
flavones kaempferol, morin, myricetin and quercetin in vitro with human leukemic mast cells
and found that flavones inhibit proliferation and increased mediator content in human
leukemic mast cells. The order of highest effect (in decending order) was flavone.
kaempferol, quercetin, myricetin, morin, showing that the structure of the flavonoid clearly
has an influence. Epigallocatechingallate (ECGC), luteolin, quercetin, kaempferol, apigenin,
taxifolin, along with other polyphenols were studied by Brusselmans et a/. (2005) for their
ability to inhibit cancer cell lipogenesis. These polyphenols were found to be particularly
effective and it is thought that their abilily to inhibit fatty acid synthase (FAS) is the key to
induce apoptosis in cancer cells. The flavonoids quercetin, myricetin, fisetin. luteolin were
studied in vitm by Dajas et a/. (2003), who found that these flavonoids showed potential to
protect against strokes. Virgili et a1 (2004) studied the flavonoids naringenin and quercetin
and found they blocked cancer cell growth by antiestrogenic activity.
Okuda (2005) attempted to study many traditional medicinal plants and investigated the
tannin content of these plants. This researcher found that the tannin structures were often
very specifc in their function and health benefit. This vast piece of research covered
medicinal plants globally and re-emphasises the continuing interest in polyphenols globally.
Structurally related flavonoids were studied in vitro by Rusak et a/. (2005). These authors
found that cell cycle progressional apoptosis of human acute leukemia cells was affected by
the structure of flavonoids C2-C3 double bond and 6-hyroxyl group important structural
requirements for cystostatic effects 6-hyroxyl group unfavourable.
Overall, the body of evidence suggests that there are positive health beneffis to consuming
polyphenols in the diet. However, what was clear from reviewing this part of the literature
was that there was a lack of integration of results and few intervention trials. Due to the
complex nature of foods itself, it is difficult to isolate any one component from another. Then
the question must be asked - does one component act on its own or in synergy with others?
What was the base health state of the population being studied? In vifro and in vivo
experimentation cannot always be compared (Haenen et a/., 2005), due to the metabolism
products produced during in vivo and the unnatural situation of in vitro experimentation.
Both types of experimentation, however, have their role to play.
- Chapter 2
Caffeic Acid
Caffeic acid is the most common hydroxycinnamic acid in fruits (chapter 2:24). Thii
constituent has been the subject of several studies that have been found to be positively
associated with chronic disease improvement. The studies reviewed below are examples of
mechanistic studies which give indications as to how caffeic acid may work in the body.
Most of the studies are lacking in vivo, and there is a clear need for well designed clinical
intervention studies. However, it is critical to mention these studies here as the main
constituent of Kei apple is thought to be caffeic acid, and caffeic acid, if present in sufficient
quantities and with or without the presence of other flavonoids may have potential health
beneMs, which was one of the motivating factors for investigating the Kei apple.
Caffeic acid was studied in vitro by Ahn et a/. (1997), who concluded that it may be effective
as a chemosensitiing agent in md t i - d~g resistant MCF-7IDox human breast carcinoma
cells. Caffeic acid was studied in vitro by Bassil et a/. (2004) who found that caffeic acid, in
the presence of Lcysteine, potentiates antiradical activlty but that the reducing capacity is
lowered. The effect of caffeic acid and caffeic acid phenyl ester (CAPE) on
hepatocarcinoma cells was investigated by Chung et a1 (2004). Caffeic acid and caffeic
acid phenyl ester were found to successfully suppress the growth of HepG2 tumour
xenographs in nude mice in vivo. Subcutaneous and oral administrations of caffeic acid and
caffeic acid phenyl ester significantly reduced liver metastasis, and it is postulated that this is
through the selective suppression of the angiogenic enzyme matrix methalloproteinase
MMP-219.
Frank et a1 (2003) studied hydroxycinnamic caffeic acid and chlorogenic acid in vivo and
found that vitamin E and cholesterol concentrations were elevated in Sprague-Dawley rats.
Protocatechuic, p-coumaric, caffeic, feruli, sinapic, vanillic, methoxycinnamic acids and
tricin were studied in vitro by Hudson ef a/. (2000). who concluded that extracts of brown rice
were shown to inhibit the growth of human breast and colon cancer cells. Tricin was found
to be most effective. Kampa ef a/. (2004) studied caffeic, ferulic, protocatechuic, 3,4-
dihydroxy-phenylacetic acid (PAA), sinapic acid and syringic acid in vitro. Inhibition of T47D
human cancer cells was found with acids studied in the order effect listed. Caffeic and 3,4-
dihydroxy-phenylacetic acid induced apoptosis. 3.4-dihydroxy-phenylacetic acid induced an
inhibition of nitric oxide synthase. Caffeic acid competes for binding and results in an
inhibition of aryl hydrocarbon-induced CYPIAI enzyme. There was a dose dependant result
-the higher the dose, the higher the level of inhibition
- Chapter 2
Park et a/. (2005) studied caffeic acid in vitro and found that MMP-9 was inhibited by caffeic
acid -one of the enzymes known to degrade type IV collagen, the major constituent of the
basement membrane in cancer invasion and metastasis. Sodium caffeate was studied in
vitro by Xu et a/. (ZOO!), who concluded that it inhibited tumour monostasis and had anti-
angiogenic effects.
POLYPHENOL CONTENT AND EFFICACY STUDIES OF FRUITS AND VEGETABLES
Efficacv Studies of Fruits Saecifically
This project is aimed specifically at the formulation of the Kei apple into a beverage.
Therefore. it was essential that research concerning the polyphenol content and efficacy of
the polyphenol constituents of fruits specifically be investigated and included in this review.
Wherever possible, literature was sought that focused on a specific named fruit. A short
historical background has been given on the origin of the fruit, indicating how it was
cultivated and spread globally from an agricultural perspective, which is possible if the
ecosystem and climate is correct for any species, providing that it does not become an
invasive species. If the Kei apple project were to be successful, potential for cultivation
outside South Africa may be possible.
With the exception of the grapefruit (Citrus paradisr), citrus fruits originated from Asia.
Orange (Citrus sinensis) and tangerine (Citrus reticulata) originated in China and were
brought to Rome by Arab traders. The Romans and Greeks only knew of the bitter orange
(Citrus aurantium). Sweet oranges were brought to Europe from lndia in the 17"' century.
Lemons (Citrus lirnon) originated in Malaysia or lndia. They were introduced into Assyria
where they were discovered by the soldiers of Alexander the Great, who took them back to
Greece. The crusaders introduced them into Europe. Limes (C~trus aurantifolia) originated
in lndia and were introduced as a crop into the West Indies. The original grapefruit was
discovered in Polynesia and introduced into the West lndies where it was developed and
brought to Europe in the 17m century (Saltmarsh, eta/., 2003:125).
Chapter 2 -- --
Breinholt et al. (2004) studied naringenin in vivo and concluded that citrus-derived
naringenin exerts uterotropic effects in female mice. Narigenin in citrus fruit was found by
Frydoonfar et a1 (2003) to significantly inhibit cell proliferation in HT29 colon cancer cells
exposed to naringenin at levels greater than 0.71 mmol (in vitro). This research suggests
that citrus fruiis may reduce the risk of colon cancer in humans. Kurowska et a1 (2000) fed
orange juice to 25 healthy volunteers and found that 750ml orange juice improved blood lipid
profiles in hypercholesterolemic subjects. Citrus flavonoids were studied in vivo and in vitro
by Manthey et al. (2001). who found that they reduce inflammatory response and have anti-
cancer properties, influencing hepatic phase I and II enzymes. They postulated in their
review that citrus flavonoids impact on blood leukocytes and microvascular endothelial cells,
and stated that the pharmacological actions of citrus flavonoids may be linked to the abiliies
of these compounds to inhibit enzymes involved in cell activation, interacting with the
nucleotide binding sites of phosphodiesterases, kinases, topoisomerases and other
regulatory enzymes. They are also potent antioxidants and thus interfere with, and
suppress, many of the events of cancer.
Fresh orange juices were examined for their antioxidant effectiieness as influenced by their
phenolic content by Rapisarda et al. (1999). Several tests were used to assess this 'in vitro"
- bleaching of DPPH (Diphenyl-2-Picrylhydrazyl Radical), linoleate peroxidation, scavenging
against nitric oxide (NO), total antioxidant and antioxidant profile, and total antioxidant status
(TAA). The findings of this study indicated that the antioxidant efficiency of orange juices
may be attributed to their total phenol content, with ascorbic acid playing a minor role. The
antioxidant activity is related not only to structural features of the phytochemicals in them,
but to their ability to bind to biomembranes and is influenced by their anthocyanin level.
Antioxidant activity is not related to a single phytochemical compound but widely distributed
among the phenolic constituents. These researchers also postulate that the
supplementation of natural antioxidants contained in the orange juice through a balanced
diet could be more effective and economical than the supplementation of an individual
antioxidant against oxidative damage under different conditions. The anti-cancer and health
properties of citrus fruit components were reviewed by Silalahi (2002). who concluded that
the citrus flavonoids nobiletin and tangretin, in conjunction with other polyphenols, posses
anti-cancer activrry in vivo and in vitro. It was stated that it was not just the consumption of
the flavonoids in isolation that have health benefts, but rather the combination of other
nutrients in citrus fruits such as vitamin C, pcarotene, limonoids, folic acid and dietary fibre,
and that flavonoids should not be judged in isolation.
Chapter 2 --
Proteggente et a1 (2003) measured the phenolic compositions, the ascorbic acid contents
and the antioxidant activities of fresh Sicilian orange juices from pigmented and non-
pigmented orange varieties The pigmented variety Tarocco showed higher levels Of
hesperitin. All pigmented varieties showed higher levels of cyaniden-3-glucoside and
cyanidin-3-(6"malonyI)-glycoside, especially Moro. The authors conclude that the oranges
are a food source of flavonoids, but pigmented oranges are better.
A wide range of berries are consumed by humans globally. Most are cultivated but some
are picked from the wild. The range includes strawberry (Fragaria x ananassa), raspberry
(Rubus idaeus), blackberry (Rubus spp.), blueberry (Vacciniurn corymbosum), elderberry
(Sambucus nigra), cranberry (Vaccinium oxycoccus), gooseberry (Ribes grossularia), black
currants (Ribes nigrum), red currants (Ribes I Z I ~ N ~ ) and white currants. The modem
strawberry is the descendent of the tiny woodland strawberry that was grown by the
Romans. Modem cultivated strawberries derive from cross between an American and a
Chilean variety that occurred around 1750. Raspberries are native to Europe and have been
cultivated since the Middle Ages. Blackberries have been eaten since Neolithic times and
the Greeks prized them for the medicinal value of their leaves. Cranberries grow wild in both
northern Europe and northem USA. Native Americans prized them for both their nutritional
and medicinal properties and are said to have introduced the first Europeans to cranberries
to help them prevent scurvy. The cranbeny is Vaccinium oxycoccus, while Vaccinium
macrocarpon is the large or American cranberry which is grown commercially in both
America and Europe (Saltmarsh et a/., 2003:128).
Strawberries have been shown to have high antioxidative properties due to their flavonoid
content rather than their vitamin C content (Aaby et a/., 2005). These authors focused on
the by-products of strawberry producing juice and puree and found that there was merit in
using the waste (chelenes or insides of the strawbeny) for isolating and extracting flavonoids
that may be useful in the neutraceutical industry. Wild blueberry and berry mix (OptiBeny)
were found in vivo testing with mice to possess anti-antienic properties (Atalay et a/.,
2003). Endothelioma cells pre-treated with berry powders showed diminished ability to form
hemangiomas, common in premature infants (these lesions occur 1:100 in normal newborns,
but 1 5 in premature babies with clkg weight) and can be life threatening. It is concluded
that the berries inhibit chemokine monoycte chemotactic protein 1 expression, responsible
-- Chapter 2 --
for recruiting macrophages to sites of infectimn or inflammation. Hannum (2004) examined
the impact of strawberries on the diet and concluded that strawberries are rich in a variety of
phytochemicals that have been shown to be bioactive, namely ellagic acids, anthocyanin,
catechin, quercetin and kaempferol. Thus, a diet rich in strawberries may have anti-cancer.
anti-inflammatory (lower heart disease) and antiaging properties, although no clear
consumption level is indicated.
Whole black raspberries (lycophilized or finely pulveriued) were found to inhibit multiple
parameters of azoxymethane-induced colon cancer in rats, a tumour process similar to
human colon cancer in which aberrant crypt foci progress to adenomas and then to
adenocarcinoma. The aberrant crypt foci reduction across all categories after the
administration of the carcinogen indicated that the black raspberries may inhibit proliferation
of induce apoptosis in the rat's colon even afler the process of carcinogenesis had been
stated (Harris etal., 2001).
Henig and Leahy (2000) reviewed the science supporting the folklore around cranberries
and urinary-tract health and concluded that results from intervention. epidemiological and
mechanistic studies support a beneficial effect of cranberry juice in maintaining urinaly-tract
health. The studies indicate that cranberry juice inhibits bacteria adhering to mucosal
surfaces, mainly due to the presence of fructose and proanthocyanins (the authors make
note that not all cranberry juices marketed are 100% juice). Hu etal. (2005) found potential
for Saskatoon berries to possess free radial scavenging powers and inhibit intracellular
oxidation. Supplementation with blueberries (1509 in a milkshake) was found to be
marginally better than supplementation with 1250mg Vitamin C owing to F2-isoprostanes,
lipid hydroperoxides. FRAC (ferric reducing antioxidant power) potential and urate in males
subjected to exercise in hot (35'C 70% relative humidity) conditions (McAnulty eta!., 2004).
A small study was carried out by Netzel et al (2005) on elderberries in 8 healthy human
volunteers. It was found that their total antioxidant status improved after ingestion of 400ml
of elderberry juice. Pedersen et a/. (2000) examined the effects of blueberry and cranberry
juice consumption (500ml) on plasma antioxidant capacity of healthy female volunteers. The
blueberry juice was an organic product and the cranberry juice was a vitamin C-fortified,
more widely available commercial product. These researchers found that the cranberry
juice, but not the blueberry, resulted in an increase in antioxidant capacity of plasma as
measured by its ability to reduce Fe3' and Fremy's salt (a synthetic free radical, potassium
nitrodisulphonate). This was mainly attributable to an increase in plasma concentrations of
- Chapter 2
--
vitamin C and not total phenolics. Furthermore, it was suggested that the phenolics in the
blueberry juice were not totally bioavailable.
Reed (2002) reviewed cranberry flavonoids and expbined that cranberries contain both
hydroxycinnamic acids and flavonoids - the latter belonging to three groups - anthocyanins,
flavonols and proanthocyanidins. The review postulated that monomeric and oligomerii
flavonoids may be absorbed and metabolised and have post absorptive effects on the
development of atherosclerosis and cardiovascular disease (CVD), such as 1) protection of
LDL from oxidation by arlerial endothelial cells, arterial smooth muscle cells and intimal
macrophages, 2) inhibition of the inflammatory response of these cells to modified LOL and
direct effects on immune cells involved in the inflammatory process, 3) vasodilation and
improved blood flow, 4) inhibition of platelet aggregation and thrombosis, and 5) reverse
cholesterol transpolt and clearance of cholesterol. It was concluded that cranberries have
health benefits as a function of food, due to its complex mixture of polyphenols, but that
more research on potential synergistic effects among flavonoids and other food constituents
was rewired.
Roy et at. (2002) studied six berry extracts, namely wild blueberry, bilberry, cranbeny,
elderberry, raspberry seed and strawberly (plus a grape seed proanthocyanidin extract).
The findings of this paper were that edible berries may assist in decreasing the risk of
angiogenesis-related diseases such as cancer and inflammation. Interestingly, using
oxygen radical absorbance capaclty (ORAC) as a measurement, strawberry powder and
grape seed proanthocyandin extract (GSPE) were higher than cranberry, elderberry or
raspberry, and wild bilberry and blueberry extracts possessed the highest ORAC values.
Ruel, G., et a/. (2005) studied the effects of cranberry consumption with one 14day
intervention trial in 21 men. It was found that cranberry juice reduced LDL levels in
circulating blood. It was concluded that antioxidant-rich food had a potential role in
maintaining health and preventing CVD. Seeram et al. (2004) showed that enhanced
antiproliferative effects against human tumours were obtained when cranberry extract was
enriched with polyphenolic content by removing f m l sugars and organic and phenolic acids.
There were also additive or synergistic antiproliferative effects resulting from the combination
of anthocyanins, proanthocyanins, and flavonol glycosides compared to individual pur i fd
phytochemicals. These results suggested that there was some potential for cranberry
extracts to be used in appropriite animal models of cancer studies and human cancer
prevention trials.
Chapter 2
Pomearanate
The pomegranate tree is native from Iran to the Himalayas in northern India and has been
cultivated since ancient times throughout the Mediterranean regions of Asia, Africa and
Europe. The fruit was used in many ways as it is today, and was featured in Egyptian
mythology and art, praised in the Old Testament of the Bible and in the Babylonian Talmud,
and it was carried by desert caravans for the sake of its thirst-quenching juice. The most
important Qrowing regions are Egypt. China, Afghanistan, Pakistan. Bangladesh, Iran, Iraq.
India, Burnla and Saudi Arabia. There are some commercial orchards in Israel on the
coastal plain and in the Jordan Valley. Production declined from lack of demand in the
1930's, but new plantings were made when demand increased in the 1960's (Morton.
1987:3521.
A small study of 10 people was carried out by Aviram et a/. (2004) over 3 years with
pomegranate juice, which indicated that 50ml of juice consumed over 3 years, daily, reduced
systolic blood pressure and serum LDL. Maximum effects were seen after 1 year of
pomegranate juice consumption. Li et a/. (2005) stated that the pomegranate is well-known
to contain high levels of phenolics but that the peels were particularly rich in antioxidants as
determined by the FRAP (ferric reducing antioxidant power) assay, confirming the results of
a previous study undertaken by the authors. Pomegranate peel extracts were studied by
Negi et a1 (2003), who found that the pomegranate peel extracts contained ellagic tannins,
ellagic acid and gallic acid and that there was potential for this fruit by-product to be used
commercially, as a biopreservative in food applications and neutraceuticals. The Ames test
for mutagenicity showed that there were antimutagenic properties, and the stucly indicated
that antioxidant properties were evident.
Mango (Mangifera indica) has been eaten for over 6000 years in Indian and Malaysia and
was introduced to South America and the West lndies in the lam century. Mango is a good
source of fkarotene and vitamin C and is a major contributor of these nutrients, especially
in developing countries (Saltmarsh et al., 2003:126).
In vivo testing (rats) with mango kernel Mangifera indica and Embica officinalis (gooseberry)
showed reductions in the activities of oxidative free radical scavenging enzymes superoxide
Chapter 2
dismutase and catalase were significantly elevated, and levels of lipid peroxides were
reduced, although the specific flavonoids responsible were not identified (Anila &
Vijayalakshmi. 2003). Singh et a/. (2004) studied the different phenolics in Indian mango
cultivars. What was interesting in this study was that different cultivars, although from the
same species, varied in their absolute content phenolics and their make up of phenolics.
The main phenolics identified were tannic, gallic, vanillic, caffeic, ferulic, chlorogenic and
cinnamic acids. In raw fruits, the tannic acid was fairly low compared with ripe fruits.
Schieber et a/. (2000) examined mango puree concentrate (although it is not stated which
variety or if it is mixture of varieties) and found a broad pattern of polyphenols including
quercetin, mangiferin, and phenolic acid gallic acid. Coupled with its high carotenoid
content, the researchers concluded that mango is a rich source of antioxidants.
Small, bitter crab apples are very widely distributed throughout the world and have been
eaten since prehistoric times. However, the first apples resembling modern apples (Malus x
domestica) probably grew on the slopes of the Tien Shan between China and Kazakhstan.
The Romans first cultivated the fruit, grew at least a dozen varieties and are believed to have
introduced it to northern Europe including Britain. The Pilgrim fathers took pips to America.
Cox's Orange Pippin was first grown in England in 1826 and later that century Granny Smith
was grown in Australia. More than 7000 named varieties are know known worldwide
(Saltmarsh eta/., 2003:121-122).
Apples are well known for their quercetin content (refer to table 2.8 on flavonoid content of
common foods). Hertog et a/. (1993) and Hertog et a/. (1994) noted that apples were also
high in quercetin (as were onions), and thus would potentially be beneficial to health. This
research stimulated much further work on the health benefits of flavonoids. These groups
were amongst the first to describe the relationship between flavonoids or flavonoid-
containing foods and disease.
Kang et al. (2004) studied apples (Empire) and found that these apples showed protective
effects on hydrogen peroxide (H202) induced inhibition of gapjunctional intracellular
communication (GJIC). The promotional phase of carcinogens is closely linked to epigenetic
Chapter 2
events involving inhibition of gapjunctional intracellular communication, which could be
mediated by reactive oxygen species (ROS).
Graoes and Grape Extracts
Grapes were among the earliest cultivated crops. The Egyptians. Greeks and Romans all
made wine and the Romans bred many new varieties. Concord grapes (Vitis labrosca) are
characterized by a red-coloured flesh and skin. They are grown in America and are a
different species from the European grape Vttis vtnifera. Fresh red Vitis vinifera grapes
contain in the region of 4mg/kg of phenolic material, mainly in the skin and seeds, including
gallic acid, caftarii acid, anthocyanins, monomeric flavan-3-01s and oligomeric
proanthocyanidins. Some of this phenolic material is carried into the grape juice, which is
either sold as such or fermented. However, red wine fermented over skins and seeds tend
to have a higher phenolic content, as additional phenolics are extracted in the presence of
alcohol. Table grapes are picked earlier and do not ripen to the same extent as grapes used
to make wines. They are therefore likely to contain much lower levels of polyphenols.
Nowadays, red grapes for table use are usually seedless varieties and so will contain much
lower levels of flavan-3-01s and their oligomers than grapes used to make red wine
(Saltmarsh et el., 2003:130-131).
Bagchi et a/. (2000) assessed grape seed proanthocyandin extract (GSPE) for its
importance in human health and disease prevention. It was found that GSPE was superior
to vitamins C. E and p-carotene in its protection against free radicals and free radical-
induced lipid peroxidation and DNA (deoxyribonucleic acid) damage. GSPE also showed
cytotoxicity towards human breast, lung and gastric adenocarcinoma cells, whilst enhancing
the growth and viability of normal human gastric mucosal cells. GSPE was subjected to a
complex study by Bagchi et al. (2003) in which its cardioprotective properties were examined
in rat, mice, hamsters and humans for a variety of mechanisms. These researchers
concluded that GSPE had potential as a therapeutic tool to reduce cardiovascular disease.
In vitro testing with grape juice by Chen et al. (1998) showed that red and white grape juice
was most effective in modulating the action of aromatase and estrogen receptors in breast
cancer cells, leading to a suppression of the breast cancer cell growth. In vivo testing with
mice showed a reduction in the size of chemically-induced tumours. Grape juice and red
wine were shown to have anti-thrombotic effects by Foks (1998), confirming the French
Chapter 2
paradox although it seems unclear which polyphenols were responsible and red wine and
red grape juice were more effective than white wine. The French paradox was discovered
when it was realized that, despite a higher intake of fat in their diet, the French nation had
lower CVD events than countries with similar diets. This was attributed to their intake of red
wine (FerriBres, 2004, Gueguen, 1998, Kopp, 1998).
The phenolic compounds in grapes and grape juices and their antioxidant effects were
reviewed by Frankel and Meyer (1998). It was concluded that LDL oxidation was reduced by
consumption of grapes, juices and their extracts, and offer protection against atherosclerosis
and coronary heart disease (CHD). Dried grape seeds obtained as a by-product in the
process of wine-making afler colour oxidation and alcohol distillation were shown to possess
a high source of flavonols, even if submitted to high temperatures, thus provided a potential,
cheap dietary supplement (Gondlez-Paramas et a/., 2004). The antioxidant effects of
Concord grape juice flavonoids were found to be more effective than a-tocopherol on
markers of oxidative stress in healthy adults by O'Byme et a/. (2002).
Mixed Juices
Arendt et a/. (2001) studied German commercially available fruit or fruitlvegetable juices
supplemented in the diet for 16 weeks in vivo and found that the plasma antioxidant capacrty
of HIV (human immuno-deficiency virus)-seropositive and heakhy subjects can be increased
by the consumption of these juices. Breinhok et al. (2003) examined apple juice and
blackcurrant juice on the redox status and anticancer biomarkers in female rats. Grapefruit
juice and orange juice were included in the study as they contained the highest flavonoids in
comparison with other juices analyzed. It was found that the total flavonoid content varied
from brand to brand, and within brand and type of juice (and thus batch of juice). The
authors hypothesised that the obsewed differences reflected variations in the quality of the
fruits, cultivars, manufacturing processes, storage, duration as well as the presence of other
antioxidants in the juice that may function to stabilize the flavonoids. The results of the study
were inconclusive as to whether fruit juice has anti-cancer properties in humans, and further
work was required. F ~ i t juices (varying in their composition and not commercially available)
were given to 27 male volunteers, and a randomized crossaver study was carried out by
Bub et a/. (2003). Both juices contained approximately the same amount of polyphenols but
varied in their contents, but both showed enhanced antioxidant status, reduced oxidant DNA
damage and stimulated immune cell functions.
Chapter 2
A review of polyphenols would not be complete if it did not briefly mention tea and cocoa,
two of the most widely consumed beverages in the world.
Tea (Camellia sinensis) is the most consumed beverage in the world (Rietveld 8 Wiseman,
2003). Tea is consumed daily by individuals worldwide. Tea arrived in Europe in the 18'
century, having been drunk elsewhere for centuries, for example by the Chinese for probably
5000 years. Tea was initially sold in coffee houses, but became more popular than coffee.
The popularity of tea was such that from the latter part of the 18' to the beginning of the lgm
century, a transition took place in the drink of the labouring class, as tea replaced beer and
gin (Duthie 8 Crozier. 2003:150).
Several reviews and studies have shown that tea consumption leads to a significant increase
in the antioxidant capacty of the blood (with either oolong black or green tea) (Anonymous.
2004(b), Lambert 8 Yang, 2003. Rietveld 8 Wiseman. 2003. Anderson 8 Polanksy, 2002.
Dufresne B Famworth, 2001, Langley-Evans. 2000). A review by Trevisanato and Kim
(2000) links the consumption of tea with moderate protective effects against cancer,
cardiovascular disease, formation of kidney stones, bacterial infections and dental caries,
and suggests that this is due to the rich source of dietary flavonoids in the tea. According to
Vita (2003), human tea consumption has a beneficial effect on the vascular endothelium and
thus the author concludes that tea consumption is positively associated with reduced
cardiovascular disease risk.
A considerable amount of investigative work has been done on tea, and less on fruit and
vegetables (Buttriss, 2004). Green tea is derived from drying and steaming the fresh tea
leaves directly afler plucking, when no fermentation occurs. Oxidation (for fermentation)
occurs naturally when tea polyphenols are complexed by contact with oxygen. Oolong tea is
derived by partial oxidation stage before drying and steaming. Black tea undergoes a full
oxidation stage before drying and steaming. Tea extract has anti-bacterial, anti-fungal,
antioxidative, anti-tumour and anti-mutative activities which are largely due to the powerful
scavenging and antioxidative properties of high concentrations of unpolymerised catechins
and their gallates (Geetha et a/., 2004). Tea flavonols in green tea, black tea and green tea
Chapter 2
extract were studied in vivo human tests by Henning et a/. (2004), who found that all showed
strong antioxidant activity.
Interest has also been shown in herbal teas. Joubert et a/. (2003) have shown rooibos tea
Aspalanthus linearis to possess significant levels of flavonoids. Ramirez-Mares et al. (2004)
studied 2 herbal teas and green tea and found the herbal teas ardisia (Ardisia compressia)
from Mexico and mate tea (Ilex paraguariensis) from Argentina to potentially possess similar
in vitro properties to traditional tea.
Cocoa was consumed by the Mayas before 1000 AD and the pods were used for their sweet
pulp as much as 2000 years before that. The tree was cultivated in central America for over
2000 years and cocoa was a major item of commerce for the Aztecs and their predecessors.
The origin of the wild cocoa tree is believed to be the upper regions of the Orinoco and
Amazon River systems but here the crop was never valued as it was by the Aztecs (Duthie &
Crozier, 2OO3:?62).
The impact of cocoa in the diet was first noticed with the Kuna Amerinds in Panama who,
despite their high intake of salt, showed lower levels of hypertension for their age compared
to similar populations who consumed a westernised diet. This was due to their large
consumption of homemade cocoa, the tropical fruit Thesbmrna cacoa, which is consumed in
large quantities and is a similar paradox to the well known French wine paradox (Ferrieres,
2004, Gueguen, 1998, Kopp, 1998). Cocoa has subsequently been found to contain large
quantities of polyphenols especially flavonols (Pearson et a/., 2005). Several studies have
been performed and these include, though far from exhaustive, a study by Mursu et a/., in
2004. It was found that cocoa polyphenols may increase the concentration of high-denslty
lipoprotein (HDL) cholesterol, whereas chocolate fatty acids may modify the fatty acid and
composition of low-density lipoprotein (LDL) and make it more resistant to oxidative damage.
However, these researchers were skeptical about the long-term effect of chocolate due to its
negative impact on weight gain. The effects of flavanols and procyanidins from cocoa
extracts were examined on colon cancer cells by Carnesecchi et a/. (2002). The effects of
cocoa powder and extract on Cacc-2 cell growth, a human colon cancer, and on polyamine
biosynthesis was examined. It was found that there was a potent anti-proliferative effect of
the cocoa flavanols and procyanidins on human colon cancer cells. They also cause non
Chapter 2
apoptopic cell death and affected the cell cycle by causing a blocked G2/M phase of the cell
cycle. Inhibition of polyamine biosynthesis may be one of the several targets of the anti-
proliferative effect of the cocoa flavanols and procyanidins.
Keen et a/. (2005) reviewed cocoa antioxidants and cardiovascular health and found that
there is now a large body of information that supports the idea that cocoa flavonols and
procyanidins have the ability to act as in vivo antioxidants. Several in vivo studies have
provided strong support for the hypothesis that the consumption of flavonol-rich foods such
as certain cocoas and chocolates may be associated with reduced risk for vascular disease.
However, as with all the flavonoids, there is little information on the extent to which
flavonoids interact with other nutrients in the diet before and afler absorption, on the
intracellular metabolism of these compounds and on the bioactivlty of the different
metabolites.
Content of Polvphenols in Fruits and Vegetables
To understand how fruit and vegetables may be useful in the diet and potential benefits of
one fruit or vegetable over another, the actual content of the phenolics is useful. This
section of the review attempts to give an indication of the work done recently in quantifying
the content of polyphenols of fruit and vegetables consumed.
Sun et a/. (2002) explain that the total phenolic content of fruits and their antioxidant
activities were underestimated in the literature because bound phenolics were not included.
Thus, these researchers set about to determine 1) the profiles of total phenolics including
both soluble, free and bound forms in common fruits. 2) total antioxidant activities of
common fruits. 3) anti-proliferative activities of these fruits on liver cancer call growth, and 4)
to estimate the bioactivity index (01) of these fruits for preventing cancer. Tables 2.5 and 2.6
show the distribution profile of phenolics and bioactivlty index of selected fruits.
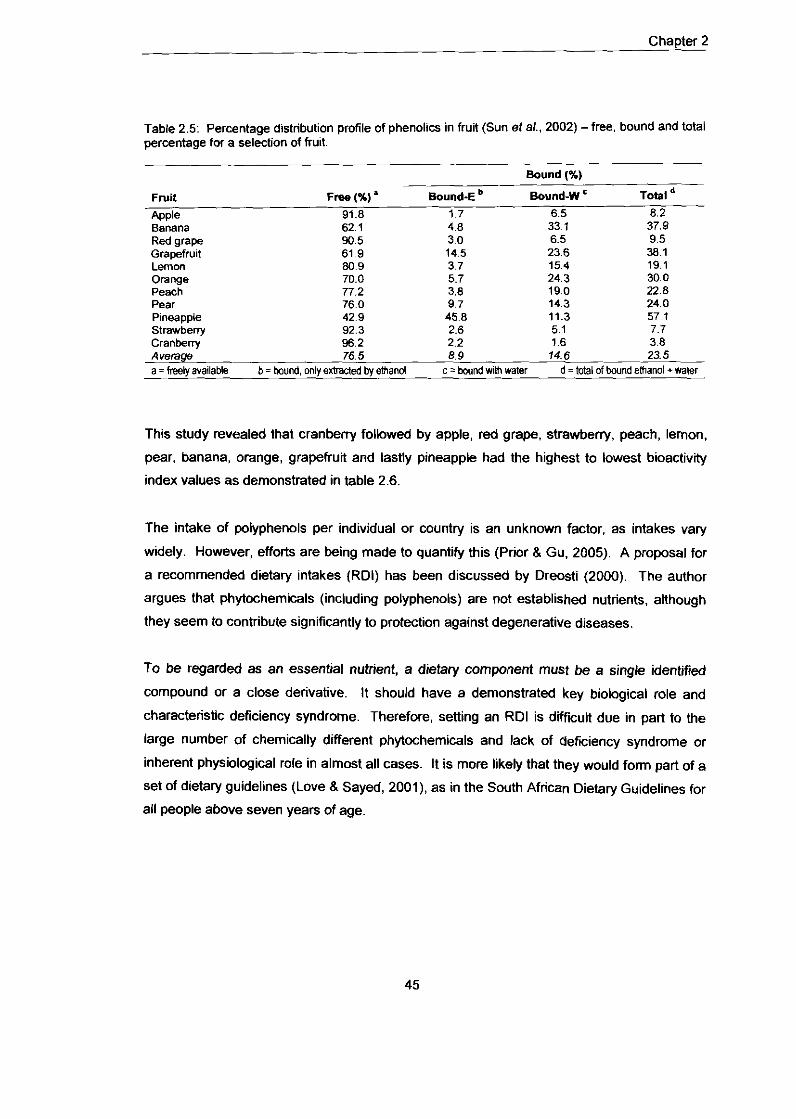
Chapter 2
Table 2.5: Percentage distribution profile of phenolics in fruit (Sun et al.. 2002) -free, bound and total percentage for a selection of fruit. --
Bound (%)
Fruit Free (%) a Bound-E Bound-W Total Apple 91.8 1.7 6.5 8.2 Banana 62.1 4.8 33.1 37.9 Red grape 90.5 3.0 6.5 9.5 Grapefruit 61 9 14.5 23.6 38.1 Lemon 80.9 3.7 15.4 19.1 Orange 70.0 5.7 24.3 30.0 Peach 77.2 3.8 19.0 22.8 Pear 76.0 9.7 14.3 24.0 Pineapple 42 9 45.8 11.3 57 1 Strawberry 92.3 2.6 5.1 7.7 Cranberry 96.2 2.2 1.6 3.8 Average - 76.5 8.9 14.6 23.5 a = freelyavailable b = bound, only exbacted by ethanol c = bound with water d = total of bound ethanol +water
This study revealed that cranberry followed by apple, red grape, strawbefly, peach, lemon.
pear, banana, orange, grapefruit and lastly pineapple had the highest to lowest bioactivlty
index values as demonstrated in table 2.6.
The intake of polyphenols per individual or country is an unknown factor, as intakes vary
widely. However, efforts are being made to quantify this (Priir 8 Gu. 2005). A proposal for
a recommended dietary intakes (RDI) has been discussed by Dreosti (2000). The author
argues that phytochemicals (including polyphenols) are not established nutrients, although
they seem to contribute significantly to protection against degenerative diseases.
To be regarded as an essential nutrient, a dietary component must be a single identified
compound or a close derivative. It should have a demonstrated key biological role and
characteristic deficiency syndrome. Therefore, setting an RDI is difficult due in part to the
large number of chemically different phytochemicals and lack of Uefciency syndrome or
inherent physiological role in almost all cases. It is more likely that they would form part of a
set of dietary guidelines (Love 8 Sayed, 2001), as in the South African Dietary Guidelines for
all people above seven years of age.

Chapter 2
Table 2.6: Bioactivity Index (61) of selected fruits for dietary cancer prevention (adapted from Sun et a/. , 2002).
Total Antioxidant *ct ivq TOSC !,moI of VItC qulvlg) R.nk =core - -
Cranberrv 176 98 1.00 1 Apple 98.56 0.55 2 Lemon 42.75 0.24 6 S-W 64.37 0.36 4 Red grape 6470 0.36 3 Peach 49.45 0.28 5 Banam 32.80 0.19 8 Grapefruit 24.66 0.14 10 Pear 34.24 0.19 7 Orange 31.48 0.18 9 PineapMe 16.93 0.10 11 Y.".
The total phenol and vitamin C contents of a wide range of fruit and vegetables were
determined by Proteggente et a/. (2002). Results are summarised in table 2.7 below. The
antioxidant capacities of aqueous I methanolic extracts were comparatively assessed, using
the trolex equivalent antioxidant capacity (TEAC), ferric reducing ability of plasma (FRAP)
and oxygen radical absorbance capacity (ORAC) assays, which comprise contributions from
polyphenols, simple phenols and ascorbate component (Proteggente et a/. , 2002). The
order of antioxidant activlty is shown in the table. Additionally, the specific phenols for each
fruit or vegetable were determined but, for simplicrty, are not reported here.
Table 2.7: Total vitamin C (mean of two samples), total phenolics (GAE = gallic acid equivalents), TEAC. FRAP and ORAC (mean t SEM of a minimum of three samples) in fruit and vegetable extracts (adapted from Proteggente eta/.. 2002).
F ~ H l V e @ b k Tob l Phnolkr Tobl Wnin C FR*P (1Mol -A$& F,,,, m c (runol
(Wc*Ell@%m bwfWm) T m l ~ d l 0 TmbxnmpFW)o, Strawberry a 330M 61 259168 3352f38 2437*95 Raspberry ' 2286 26 1846f10 2325f53 1849f232 Red plum ' 320612 5 1825t28 2057525 2564f 185 Grapefry1 150f4 52 861253 8296 1447f67 Orange 1266 46 8 4 W 5 11816 1904t259 Red cab!age 158*4 37 1377f49 1870f 18 2124f68 Brmoh 128f4 45 Met25 833i16 1335fi2 On~on 8821 6 532f29 369f13 988f30 Green grape Mi4 2 594f72 5 1 M 8 872f48 Spmach 72fl 7 757i54 1009f35 1655f115 Green cabbage Sf1 28 492f18 694f14 1 1 8 M 8 Pea 32+1 22 44M18 251i9 70462 Caul~flower 30f1 15 295i16 259i5 425i44 Leek 22+1 16 24M11 160fl 413f15 Letlu$ 14fl <2 171212 124*7 31 9f37 Pear 60t3 3 282+19 315f24 587*50 Apple 48f1 6 343r13 394f8 560t18 Peach a 38f I 6 244f 9 336f4 76449 Banana 38f4 10 181f39 1Mf32 331f59 Tomato 30f1 18 255f14 344f7- 420*39 - anthocvarnn-nch " -~avon&ich O TEAC = Tmlex Equivalent Antioxidant Capacity ' - fiavonaCM O FRAP Ferric Reducing Ability of Plasma - hydroxycinnarnat.%ich D ORAC = Oxygen Radical Absorbance Capauty
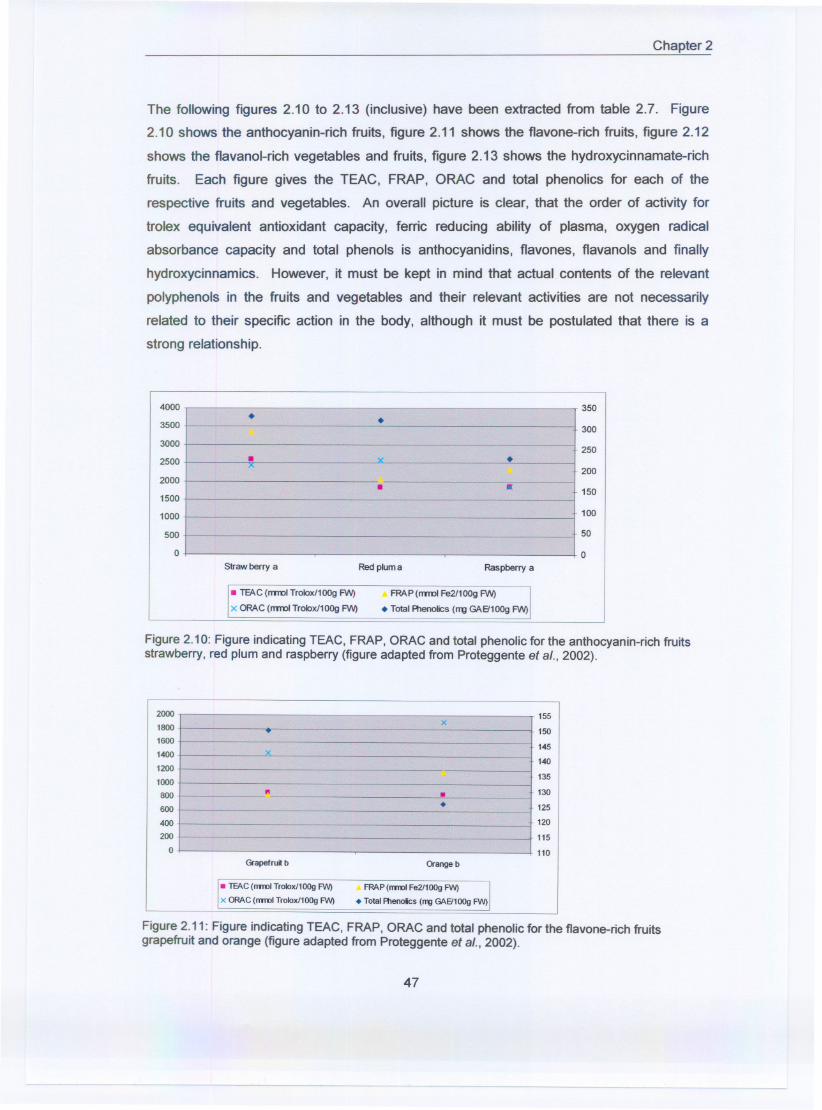
Chapter 2
The following figures 2.10 to 2.13 (inclusive) have been extracted from table 2.7. Figure
2.10 shows the anthocyanin-rich fruits, figure 2.11 shows the flavone-rich fruits, figure 2.12
shows the flavanol-rich vegetables and fruits, figure 2.13 shows the hydroxycinnamate-rich
fruits. Each figure gives the TEAC, FRAP, ORAC and total phenolics for each of the
respective fruits and vegetables. An overall picture is clear, that the order of activity for
trolex equivalent antioxidant capacity, ferric reducing ability of plasma, oxygen radical
absorbance capacity and total phenols is anthocyanidins, flavones, flavanols and finally
hydroxycinnamics. However, it must be kept in mind that actual contents of the relevant
polyphenols in the fruits and vegetables and their relevant activities are not necessarily
related to their specific action in the body, although it must be postulated that there is a
strong relationship.
Figure2.10: Figure indicating TEAC, FRAP, ORAC and total phenolic for the anthocyanin-rich fruitsstrawberry, red plum and raspberry (figure adapted from Proteggente et a/., 2002).
Figure 2.11: Figure indicating TEAC, FRAP, ORAC and total phenolic for the flavone-rich fruitsgrapefruit and orange (figure adapted from Proteggente et a/., 2002).
47
4000 350, . .3500 .
r3003000t250
2500 . v .--x-
+2002000 .
. .150
1500
1000 100
500 _u 50
Or -"..,<. .- . .,....,- , 10
Strawberry a Red plum a Raspberry a
. TEAC(ITITYJITrolox/100gFW) FRAP(ITITYJIFe2f100g FW)
x ORAC (ITITYJITrolox/100g FW) . Total R1enoIics (m! GA6'100g FW)
2000 155x1800 - 1501600
1451400 x
1401200
1351000" . 130800 . 125600
400 120
200 1150 110
Grapefrul b Orange b
I. lEAC(mmi Trolox/l00gFW) FRAP(mmiFe2fI00gFW) )!x ORAC(mmi Trolox/l00gFW) . TotalR1enoics (rrg GA9100g FW)
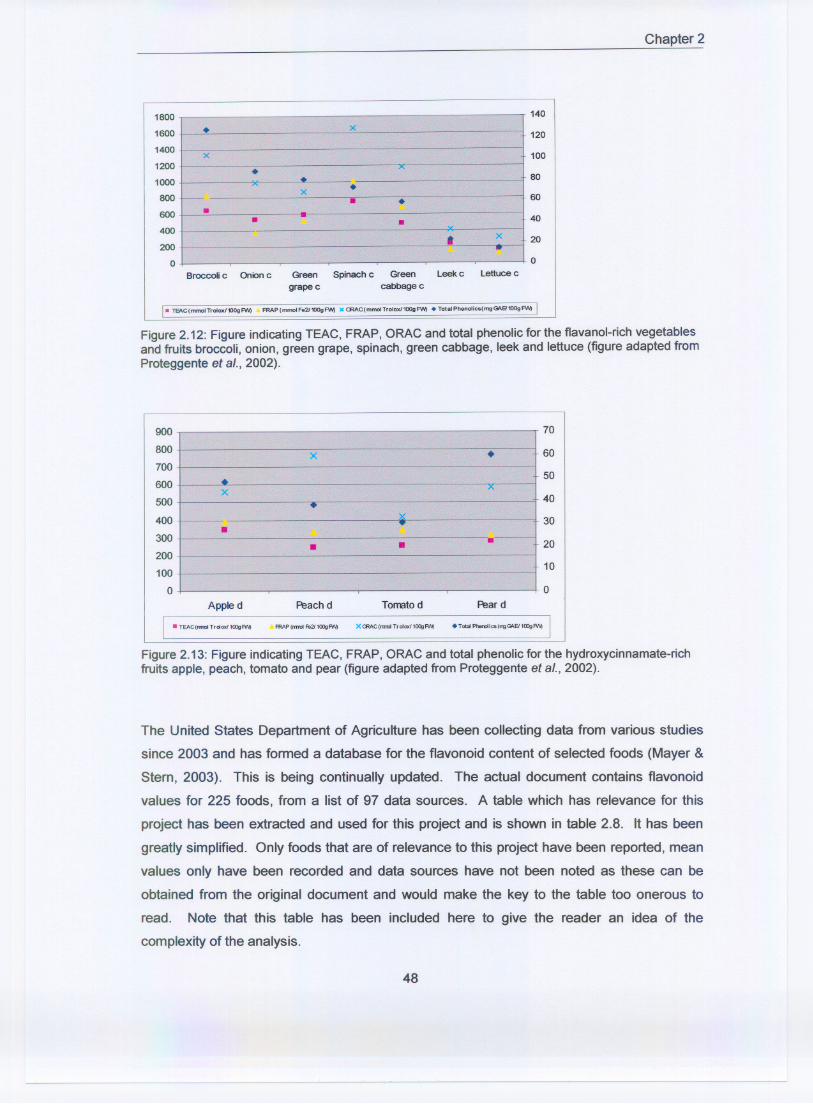
Chapter2
Figure2.12: Figure indicating TEAC, FRAP, DRAC and totalphenolic for the flavanol-rich vegetablesand fruits broccoli, onion, green grape, spinach, green cabbage, leek and lettuce (figure adapted fromProteggente et a/., 2002).
Figure 2.13: Figure indicating TEAC, FRAP, DRAC and total phenolic for the hydroxycinnamate-richfruits apple, peach, tomato and pear (figure adapted from Proteggente et a/., 2002).
The United States Department of Agriculture has been collecting data from various studies
since 2003 and has formed a database for the flavonoid content of selected foods (Mayer &
Stern, 2003). This is being continually updated. The actual document contains flavonoid
values for 225 foods, from a list of 97 data sources. A table which has relevance for this
project has been extracted and used for this project and is shown in table 2.8. It has been
greatly simplified. Only foods that are of relevance to this project have been reported, mean
values only have been recorded and data sources have not been noted as these can be
obtained from the original document and would make the key to the table too onerous to
read. Note that this table has been included here to give the reader an idea of the
complexityof the analysis.
48
1800 140
1600 . x120
1400 x 1001200 '".1000 80
x .800 f-- . . 60
600 . . . 40400
t x 20200 -
0 0
Broccolic Onionc Green Spinachc Green Leekc Lettucecgrape c cabbage c
I_ TEAC(mmoITrolox/'l)OgfW) FRAP(mmoIFe2/1OOgFW) X C(mmoITroloxl1OOgFW) . Tot8lPhenoliC8(mgMB''IJOgFW) I
900 . . 70
800 x . t 60700 .. 4-50600
x] 40500
400 i 4-30.300 . 4-20. .200
+ 10100
I 00
Apple d Peach d Tormto d Pear d
. TEAC(rmdTrdow/1lX1gfYlt FRAP (mmi Fe2l11X1gw., XCRAC(nnd Troloxl100gPJ\t .T Pt..aics(ngG6.E1100gP/14
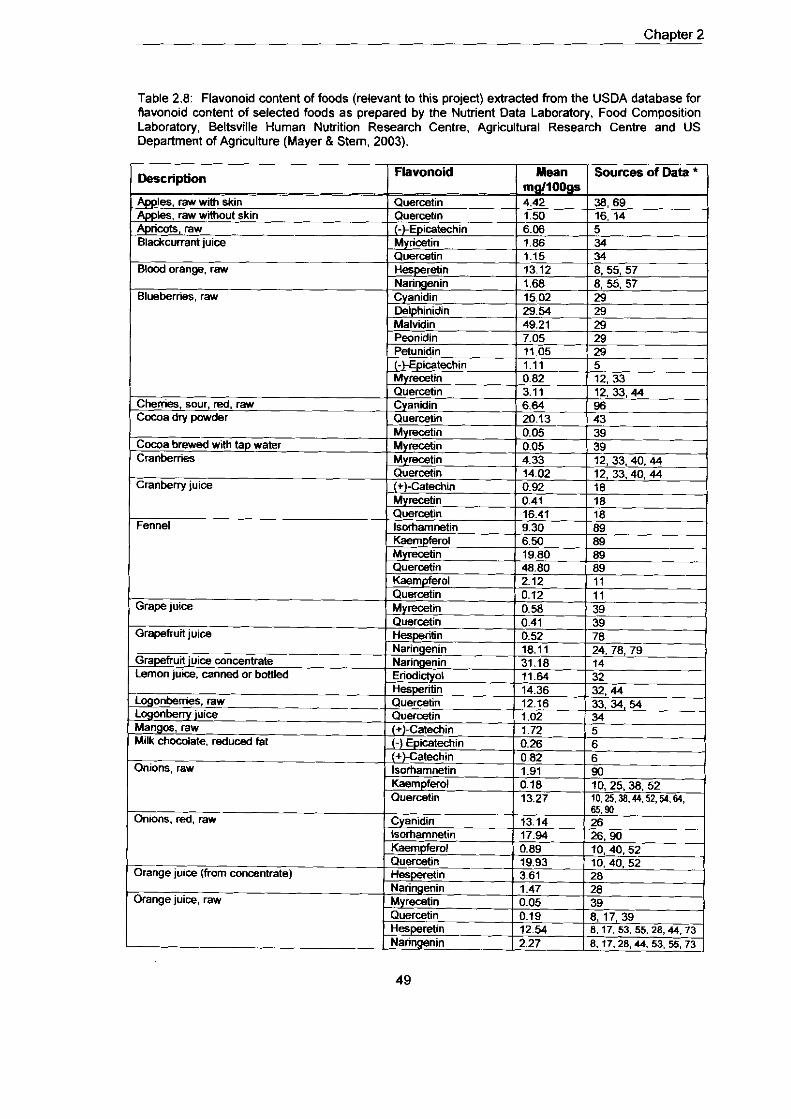
Chapter 2
Table 2.8: Flavonoid content of foods (relevant to this project) extracted from the USDA database for flavonoid content of selected foods as prepared by the Nutrient Data Laboratory, Food Composition Laboratory. Beltsville Human Nutrition Research Centre. Agricultural Research Centre and US Department of Agriculture (Mayer 8 Stem, 2003).
65.90 Cyanidin 13.14 26 Isorhamnetin 17.94 26.90 Kaernpferol . 0.89 10, 40. 52 Quercetin 19.93 10. 40, 52 Hesperetin 3.61 28 Naringenin 1.47 28 Myrecetin 0.05 39 Quercetin 0.19 8. 17. 39 Hesperetin 12.54 8.17. 53. 55.28.44, 73 Naringenin 2.27 8, 17.28.44. 53. 55. 73
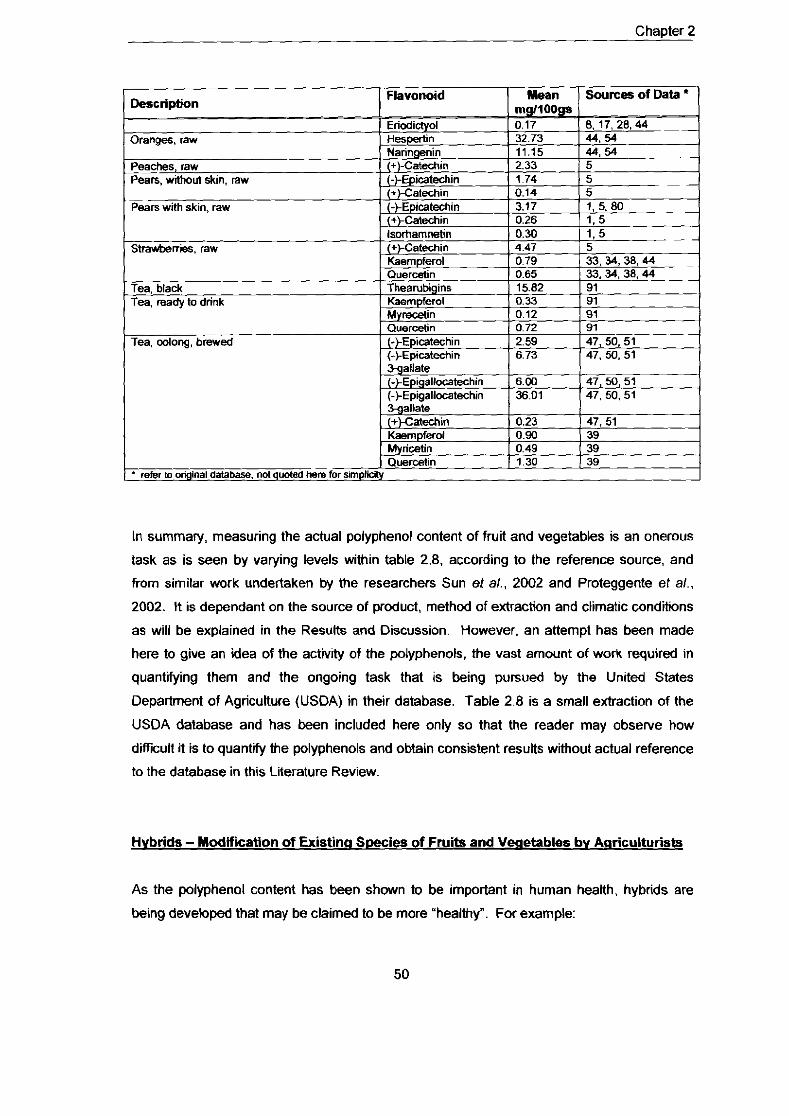
Chapter 2
In summary, measuring the actual polyphenol content of fruit and vegetables is an onerous
task as is seen by varying levels within table 2.8, according to the reference source, and
from similar work undertaken by the researchers Sun eta/., 2002 and Proteggente et a/.,
2002. It is dependant on the source of product, method of extraction and climatic conditions
as will be explained in the Results and Discussion. However, an attempt has been made
here to give an idea of the activtty of the polyphenols, the vast amount of work required in
quantifying them and the ongoing task that is being pursued by the United States
Department of Agriculture (USDA) in their database. Table 2.8 is a small extraction of the
USDA database and has been included here only so that the reader may observe how
diff~ult it is to quantify the polyphenols and obtain consistent results without actual reference
to the database in this Literature Review.
Hybrids - Modification of Existina Swcies of Fruits and Veaetables by Apriculturists
As the polyphenol content has been shown to be important in human health, hybrids are
being developed that may be claimed to be more "healthy". For example:
Chapter 2
Gorinstein et a/. (2004) demonstrated that the hybrid of Jaffa sweeties (white grapefruit)
showed more antioxidant activity due to its greater content of trans-hydroxycinnamic acids
(caffeic, p-coumaric, ferulic and sinapic). Rapisarda et a/. (2003) studied a hybrid Omc-31
and its parents clementine cv. Oroval and found the hybrid to be higher in total
anthocyannins, flavones and hydroxycinnamic acids and thus of greater nutritional benefit.
The level of antioxidants in tomatoes has been increased by genetically modifying the
flavonoid biosynthetic pathway (up to 78 times the total flavonoid content) (Verhoeyen et a / ,
2002).
It is interesting to note, therefore, how agricuituralists are tlying to increase the value of their
crops by modifit ion (not necessarily genetically) to attract consumers as ultimately they will
be trying to make a marketing claim along the lines of With extra antioxidants" or similar.
Once ingested, it is important that the fate of the phenolic compounds is known. The
absorption and subsequent distribution, metabolism and excretion thereof in humans has not
been well studied. Absorption of flavonoids from the diet was long considered to be
negligible, as most flavonoids are present in foods bound to sugars as P-glycoids. The
aglycones were considered to be able to pass the gut wall and no enzymes that can uplift
these predominantly P-glycosidic bonds are secreted into the gut or present in the intestinal
wall (Hollman 8 Katan. 1997 and 1999).
However, this was not confirmed by Day et a/. (2000), who studied the enzyme lactase
phlorizin hydrolase (LPH), a membrane-bound, family 1 P-glycosidase found on the brush
border of the mammalian small intestine. Lactase phloriiin hydrolase was found to be active
in deglycosylating dietary isoflavonoid glycosides and thus assisting in their metabolism.
A model (as shown in figure 2.14) has been proposed by Scalbert el a/. (2005) that shows
the prediction of the uptake of phenolics from the diet.
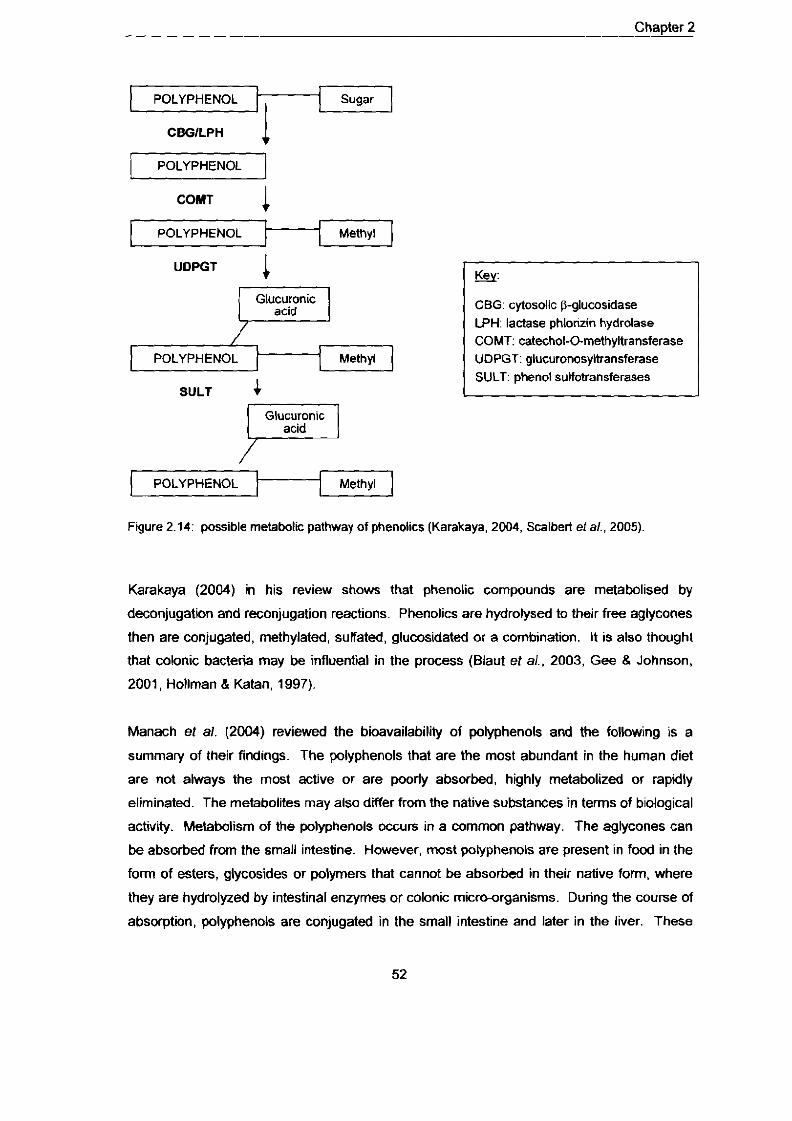
Chapter 2
POLYPHENOL I
Sugar
C " 1 POLYPHENOL
COMT 1 Methyl
Glucuronic CBG: cytosolic p-gluwsidase LPH: lactase phlorizin hydrolase COMT: catechol-Ornethyltransferase
POLYPHENOL Methyl UDPGT: glucuronosyltransferase SULT: phenol sulfotransferases
Glucuronic acid t
Figure 2.14: possible metabolic pathway of phenolics (Karakaya. 2004, Scalbert eta/., 2005)
POLYPHENOL
Karakaya (2004) in his review shows that phenolic compounds are metabolised by
deconjugation and reconjugation reactions Phenolics are hydrolysed to their free aglycones
then are conjugated, methylated, sulfated, glucosidated or a combination. It is also thought
that colonic bacteria may be influential in the process (Blaut et al . 2003, Gee & Johnson,
2001, Hollman & Katan, 1997).
Methyl
Manach et a/. (2004) reviewed the bioavailability of polyphenols and the following is a
summary of their findings. The polyphenols that are the most abundant in the human diet
are not always the most active or are poorly absorbed, highly metabolized or rapidly
eliminated. The metabolites may also differ from the native substances in terms of biological
activity. Metabolism of the polyphenols occurs in a common pathway. The aglycones can
be absorbed from the small intestine. However, most polyphenols are present in food in the
form of esters, glycosides or polymers that cannot be absorbed in their native form, where
they are hydrolyzed by intestinal enzymes or colonic micr&organisms. During the course of
absorption, polyphenols are conjugated in the small intestine and later in the liver. These
- Chapter 2
mechanisms are highly effcient and aglycones are generally erther absent in blood or
present in low concentrations after consumption of nutritional doses. Polyphenols are able
to penetrate tissues, particularly those in which they are metabolized, but their ability to
accumulate within specific target tissues needs to be further investigated. Polyphenols and
their derivatives are eliminated chiefly in urine and bile. They are secreted via the biliary
tract into the duodenum, where they are subjected to the action of bacterial enzymes,
especially P-glucoronidase, in the distal segments of the intestine, after which they may be
re-absorbed. This entempathic recycling may led to a larger presence of polyphenols within
the body and therefore some limited storqe of polyphenols is thought possible. The
absorption of the simple hydroxycinnamic and hydroxybenzoic acids is fairly simple though - they are rapidly absorbed from the small intestine but, because these compounds are
naturally esterified in plant products, their absorption may be impaired and 1 is thought that
colonic bacteria are helpful here in increasing absorption. However, Manach et al. (2005), in
their review of 97 bioavailabiity studies, indicates that the least well absorbed polyphenols
are the proanthocyanidins, the galloylated tea catechins and the anthocyanins. These
authors postulate that data is still too limited for assessment of hydroxycinnamic acids and
other polyphenols.
Overall, absorption of the polyphenols is not simplistic and cannot be viewed as being
attributable to one biochemical pathway. There are many factors involved, which only
emphasizes the importance of established strongly-designed human when evaluating the
efficacy of any of the polyphenols.
SAFETY OF POLYPHENOLS
Dosage of phenolics and flavonoids has been raised by Galati and O'Brien (2004) and
Skibola and Smith (2000) as cause for concern. Whilst there are definite health benefits of
these compounds, both these reviews urge caution in over-dosing, for example, by
consuming large quantiiies of fruits and vegetables and taking many supplements. In
summary, these reviews state that there is too much that is unknown about the effects of
phenolics and flavonoids in the body and, in high doses, their effect may outweigh the
beneffls in the body. Galati and O'Brien (2004) state further that whilst most flavonoids have
been found to be safe, there have been reports of toxic flavonoid-drug interactions, liver
failure, contact dermatitis, hemolytic anaemia, male sterility concerns and breast cancer.
This is an issue when potential "over-dosing" is reached, either through diet or
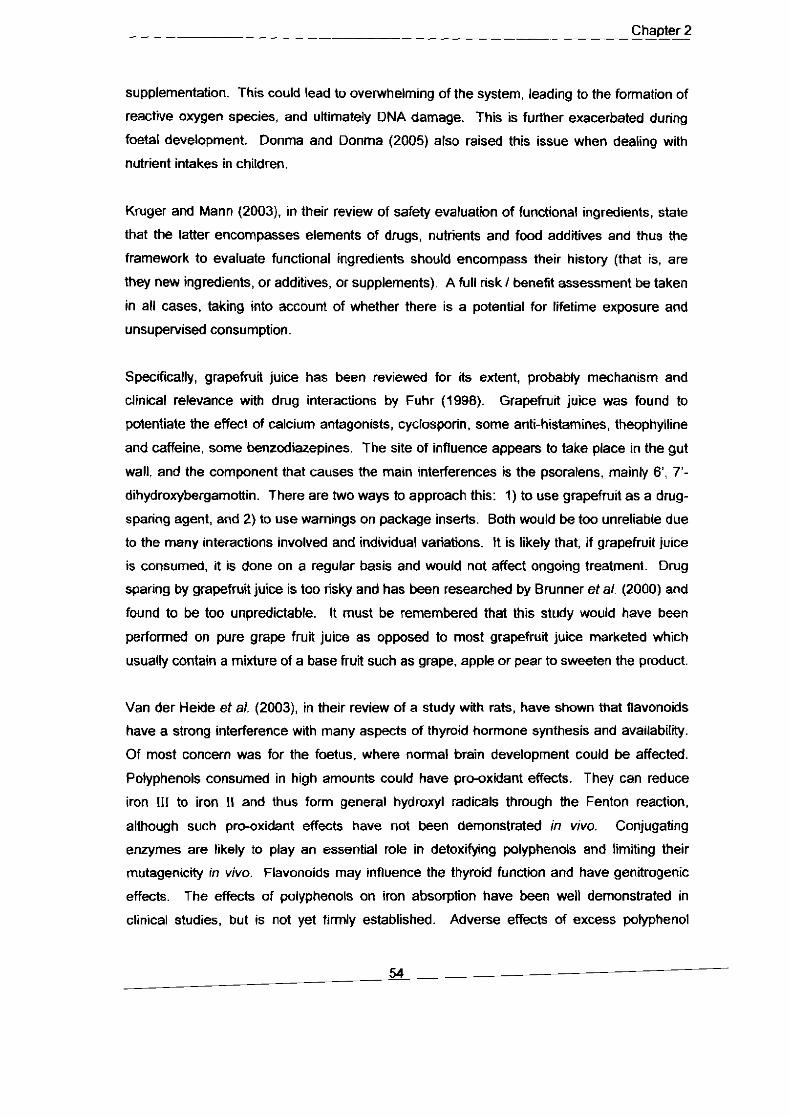
- Chapter 2
supplementation. This could lead to overwhelming of the system, leading to the formation of
reactive oxygen species, and ultimately DNA damage. This is further exacerbated during
foetal development. Donma and Donma (2005) also raised this issue when dealing with
nutrient intakes in children.
Knrger and Mann (2003), in their review of safety evaluation of functional ingredients, state
that the latter encompasses elements of drugs, nutrients and food additives and thus the
framework to evaluate functional ingredients should encompass their history (that is, are
they new ingredients, or additives, or supplements). A full risk I benefit assessment be taken
in all cases, taking into account of whether there is a potential for lifetime exposure and
unsupervised consumption.
Specifically, grapefruit juice has been reviewed for its extent, probably mechanism and
clinical relevance with drug interactions by Fuhr (1998). Grapefruit juice was found to
potentiate the effect of calcium antagonists, cyclosporin. some anti-histamines, theophylline
and caffeine, some benzodiazepines. The site of influence appears to take place in the gut
wall, and the component that causes the main interferences is the psoralens, mainly 6', 7'-
dihydroxybergamottin. There are two ways to approach this: 1) to use grapefruit as a drug-
sparing agent, and 2) to use warnings on package inserts. Both would be too unreliable due
to the many interactions involved and individual variations. It is likely that, if grapefruit juice
is consumed, it is done on a regular basis and would not affect ongoing treatment. Dnrg
sparing by grapefruit juice is too risky and has been researched by Brunner et a1 (2000) and
found to be too unpredictable. It must be remembered that this study would have been
performed on pure grape fruit juice as opposed to most grapefruit juice marketed which
usually contain a mixture of a base fruit such as grape, apple or pear to sweeten the product.
Van der Heide et a/. (2003), in their review of a study with rats, have shown that flavonoids
have a strong interference with many aspects of thyroid hormone synthesis and availability.
Of most concern was for the foetus. where normal brain development could be affected.
Polyphenols consumed in high amounts could have prmxidant effects. They can reduce
iron I11 to iron II and thus form general hydroxyl radicals through the Fenton reaction,
although such pro-oxidant effects have not been demonstrated in vivo. Conjugating
enzymes are likely to play an essential role in detoxifying polyphenols and limiting their
mutagenicity in vivo. Flavonoids may influence the thyroid function and have genitrogenic
effects. The effects of palyphenols on iron absorption have been well demonstrated in
clinical studies, but is not yet firmly established. Adverse effects of excess polyphenol
Chapter 2
consumption on cardiovascular diseases have been recently suggested due to their effect on
raising levels of homocysteine in the blood, a known risk factor for coronary heart disease
(Scalbert et a/.. 2005).
In summary, given the nature of the nutraceutical industry to produce supplements with high
levels of polyphenols, and the individual potential to overdose on over-the-counter
supplements, care should be taken in recommending supplements at the risk of overdosing.
All in all, the positive evidence for the health benefits of polyphenols seems to outweigh the
negative effects, but as in all cases with human health and nutrition, care must be taken and
the individual looked at specifically before carteblanche advice is given to include as many
polyphenols in the diet as possible. Prudent dietaly guidelines are always advisable.
FRUIT JUICE PROCESSING AND PACKAGING
In order to produce a beverage from the Kei apple, it is necessary to understand what fruit
juice processing is about. The following provides a summary.
The term 'fruit" is the structure that encloses, protects or harbours seeds until they are ripe.
a critical stage in the reproduction stage of botanical species, and they can be categorised
into two groups according to their condition when ripe: dry fruits, and succulent or fleshy
fruits (Taylor, 200536).
The conversion of fruits into fruit juice was originally developed as a method for making use
of a suppliers surplus to the fresh fruit market (Pollard 8 Timberlake, 1971573). Fruits used
for juice manufacture are often those rejected because of the high specification for the fresh
market, or they may be off-cuts from other fruit processes, or fruits which are specifically
grown for juicing (Rutledge, 1996:70). The manufacture of juices from fruits and vegetables
is as old as (or older than) agriculture. During the ripening process, most fruits soften to the
point where simply holding or transporting them yields more juice than flesh, albeit often
patially fermented. Through trial and error, humans learned practical ways of extracting
juice from various sources, and most importantly which attractive but toxic fruits to avoid
(Bates et al.. 2001 :4).
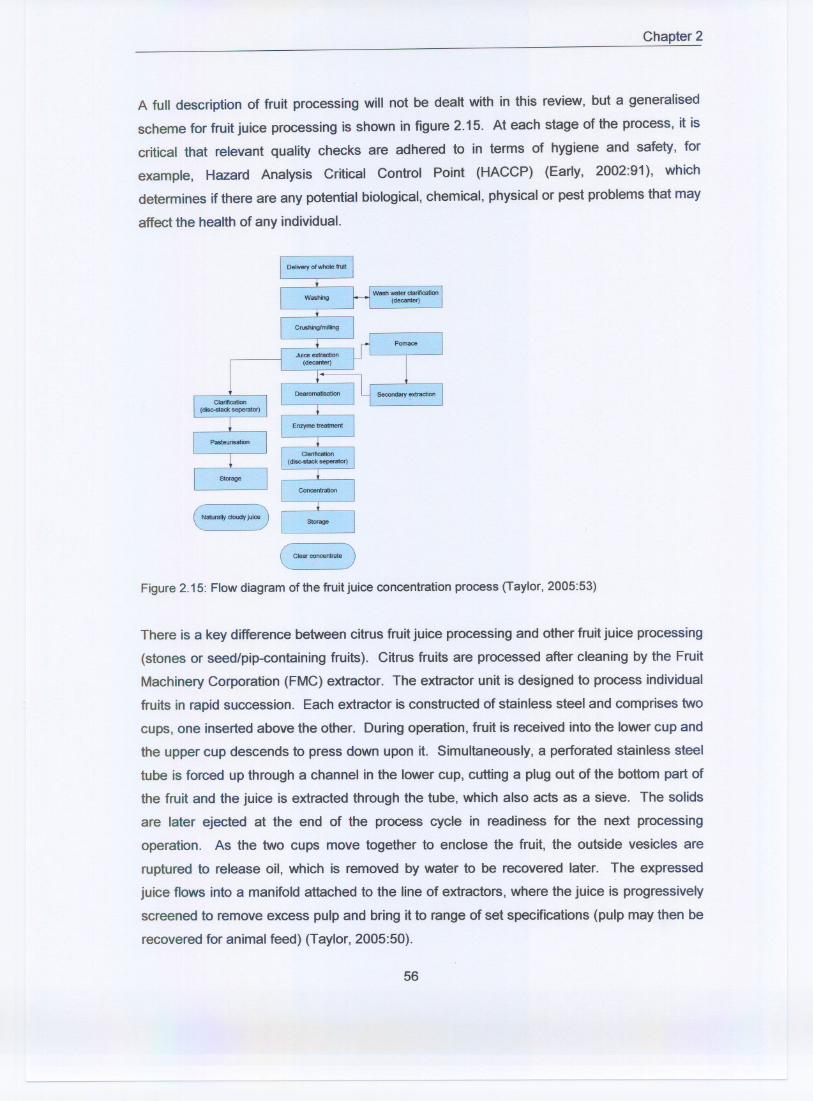
Chapter 2
A full description of fruit processing will not be dealt with in this review, but a generalised
scheme for fruit juice processing is shown in figure 2.15. At each stage of the process, it is
critical that relevant quality checks are adhered to in terms of hygiene and safety, for
example, Hazard Analysis Critical Control Point (HACCP) (Early, 2002:91), which
determines if there are any potential biological, chemical, physical or pest problems that may
affect the health of any individual.
Figure2.15: Flow diagram of the fruit juice concentration process (Taylor, 2005:53)
There is a key difference between citrus fruit juice processing and other fruit juice processing
(stones or seed/pip-containing fruits). Citrus fruits are processed after cleaning by the Fruit
Machinery Corporation (FMC) extractor. The extractor unit is designed to process individual
fruits in rapid succession. Each extractor is constructed of stainless steel and comprises two
cups, one inserted above the other. During operation, fruit is received into the lower cup and
the upper cup descends to press down upon it. Simultaneously, a perforated stainless steel
tube is forced up through a channel in the lower cup, cutting a plug out of the bottom part of
the fruit and the juice is extracted through the tube, which also acts as a sieve. The solids
are later ejected at the end of the process cycle in readiness for the next processing
operation. As the two cups move together to enclose the fruit, the outside vesicles are
ruptured to release oil, which is removed by water to be recovered later. The expressed
juice flows into a manifold attached to the line of extractors, where the juice is progressively
screened to remove excess pulp and bring it to range of set specifications (pulp may then be
recovered for animal feed) (Taylor, 2005:50).
56
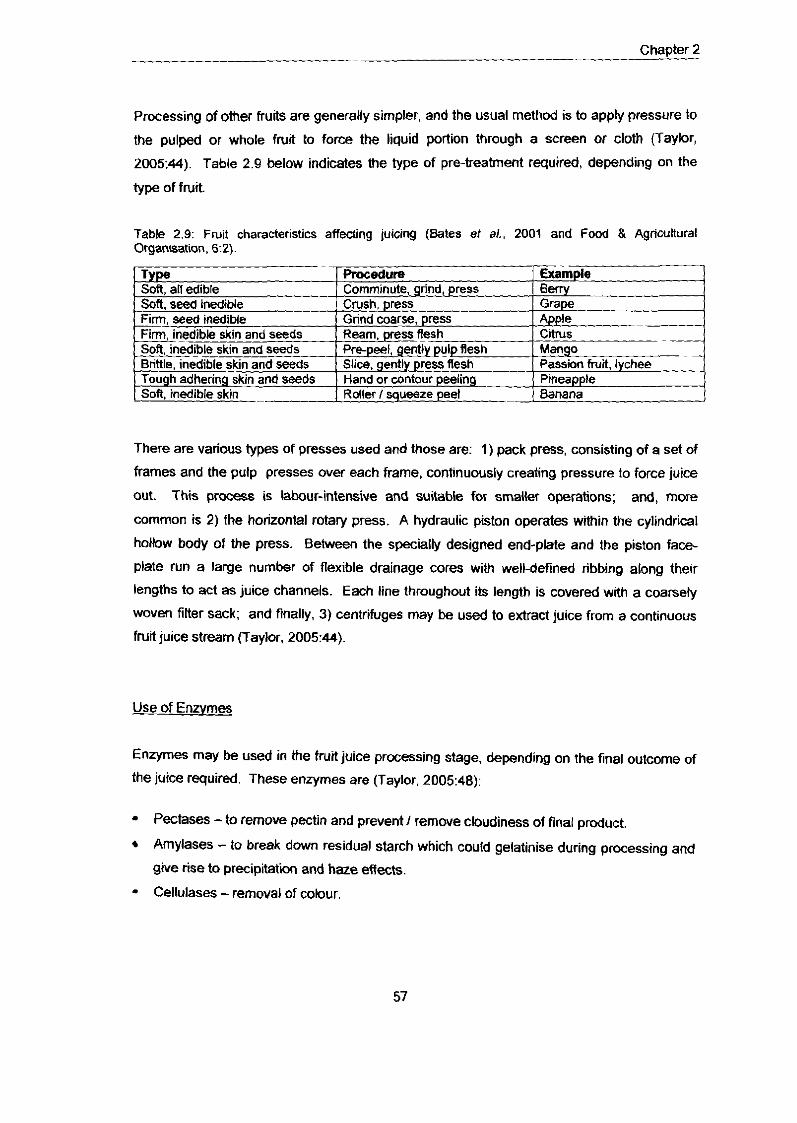
Processing of other fruits are generally simpler, and the usual method is to apply pressure to
the pulped or whole fruit to force the liquid portion through a screen or cloth (Taylor,
2005:44). Table 2.9 below indicates the type of pre-treatment required, depending on the
type of fruit
Table 2.9: Fluit characteristics affecting juicing (Bates et a!.. 2001 and Food & AgriCUitural Organsation, 62).
Type I Procedure Soft, all edible Soft, seed inedible 1 CN!
Em, seed inedible I Grin
I Sol?, inedible skin _ I Roller I squeeze peel _ 1 banana I
- Firm, inedible skin and seeds Soft, inedible skin and seeds Brittle, inedible skin and seeds Tough adhering skin and seeds
There are various types of presses used and those are: 1) pack press, consisting of a set of
frames and the pulp presses over each frame, continuously creating pressure to force juice
out. This process is labour-intensive and suitable for smaller operations; and, more
common is 2) the horizontal rotaly press. A hydraulic piston operates within the cylindrical
hollow body of the press. Between the specially designed end-plate and the piston face-
plate run a large number of flexible drainage cores with well-defined ribbing along their
lengths to act as juice channels. Each line throughout its length is covered with a coarsely
woven filter sack; and finally, 3) centrifuges may be used to extract juice from a continuous
fruit juice stream (Taylor, 200544).
Rea -gently pulp flesh I manyo Slice, gently press flesh I Passion fruii, lychee Hand or contour peeling _ 1
Use of Enzvmes
Enzymes may be used in the fruit juice processing stage, depending on the final outcome of
the juice required. These enzymes are (Taylor, 2005:48):
Pectases -to remove pectin and prevent I remove cloudiness of final product.
Amylases - to break down residual starch which could gelatinise during processing and
give rise to precipitation and haze effects.
Cellulases -removal of colour.
Chapter 2
Food Safetv and Stability
The importance of safe food for the consumer cannot be overemphasized. There are many
cases of food-borne diseases (poisoning) and these can be costly, in terms of discomfort or
even lives, to the consumer, that is, days lost from work and lost to a company in temS of
loss of sales and good faith. Some specific examples are in 2000, Snow Brand milk.
containing Staphlococcus aureus, caused an 80% drop in sales volume. An excess of
14,M)O cases of illness were caused by Escherichia Coli (0157:H7) in 1997. In 1998, the
Sara Lee company was forced to withdraw 13.5 million kilograms of contaminated hot dogs
and deli meats in the USA, after 82 cases of serious illness were reported and 21 official
deaths in 22 states, due to Listena m y t o g e n e s . In South Africa, deaths h 2002 from
Clostridium botulinum were reported, and in October 1999, there were cases of food
poisoning from fruit juice at the All Africa Games (Von Holy B Marais, 2001 :14-16).
Fwds begin to lose their quality the moment they are harvested through changes resulting
from physical, chemical, enzymatic or microbiological reactions. Fwd preservation prevents
these deteriorative reactions, extending a food's shelf life and assuring its safety. Micrc-
organisms and enzymes are the main agents responsible for food spoilage and therefore the
targets of preservation techniques. The main microorganisms that are problematic within
fruit juices are yeasts. Lactobacillis, Clostridium, EcoC (especially E.cdi 0157:H7) and
Salmonella. Sources of contamination are many - from the fruit itself, to ingredients,
processing, operators, distribution, and at the retail outlet. Any method of manufacture must
minimise the risk pathogenic bacteria ultimately present, namely the risk to human health
(Wareing B Davenport, 2005:279).
Escherichfa coli (E.co11) are a group of four enterovirulant bacterium that cause
gastroenterlis in humans, these being enterotoxigenic Eschenchia coli, enteropathogenic
E.coli, enteroinvasive E.coli and Escherichia cdi 0157:H7 or enterohemorrhagic Ecoli.
E.coli is the dominant species found in faeces. E.c01;0157:H7 has recently been associated
as having a presence in fruit juice - particularly apple juice, in addition to meat. Other
strains of Ecoli present in the intestines normally form a useful function in the body by
suppressing the growth of harmful bacterial species and by synthesizing vitamins (FDA.
2005, http:Nwww.cfsan.Ma.gov/-mowlchap13-16.ht 27/09/05). As the Ecoli is indicative
of faecal contamination and the strain E.coli 0157.H7, its presence in fruit juice is
concerning and therefore must always be included in any testing methodology.
- - Chapter 2
Spoilage in fruit juices is often due to yeasts (especially Zygosaccharomyces bail;/) and their
resulant fermentation process - resulting in the formation of carbon dioxide and alcohol and
off odours from the fruit sugars (Waring & Davenport. 2005:278).
Mould problems can be divided into two types: again due to poor hygiene, or slow growVl of
the mould within the processed product. The former type can cause tainting, discolouration,
and other general problems associated with gross mould growth. The latter type can result
in slow growth of the mould with the processed product. There is some overlap between the
two groups. Xerophili (highly sugar-tolerant) fungi are likely contaminants if hygiene is poor
(Waring & Davenport, 2005:284).
In addition to the bacteria found on fruit, moulds and yeasts often comprise the majority of
microflora on raw fruits largely due to the acidic pH of fruit tissue (Burnett & Beuchat, 2000).
Yeasts and moulds are not necessarily pathogenic in nature but are spoilage agents which
will affect the taste and qualdy of the product. Yeasts in general, and Zygosaccharomyces
bailii in particular, remain the key spoilage organisms because of their overall physiology and
resistance to organic acid preservatives (Waring & Davenpott, 2005).
Another spoilage organism (bacteria) that has been isolated over the last 23 years is
Alicylobacillus, first isolated in 1982, which is of particular interest in the fruit juice industry.
as it has been identified as a major spoilage organism in the fruit juice industty (especially
pasteurised apple juice) as the organism can tolerate acidic conditions. The organism
results in undesirable off odours, which are off putting to consumers (Chang & Kang, 2004).
As time goes on, more and more bacteria are being discovered that are responsible for food
poisoning and therefore the issue of food safety cannot be overemphasised.
Contamination typically occurs eady in the production process rather than just before
consumption (Tauxe, 1997) and thus it is only under unusual conditions that the consumer is
at fault. It is the responsibility of the harvester, manufacturer, distributor and retailer to
ensure that the product arrives in good condition, that is, fd for human consumption.
The US Centre for Disease Control and Prevention (CDC) has linked a variety of pathogens
to fresh fruids and vegetables harvested in the United States and elsewhere. Those
specifically applicable to the production of fruit juice are shown in table 2.10.
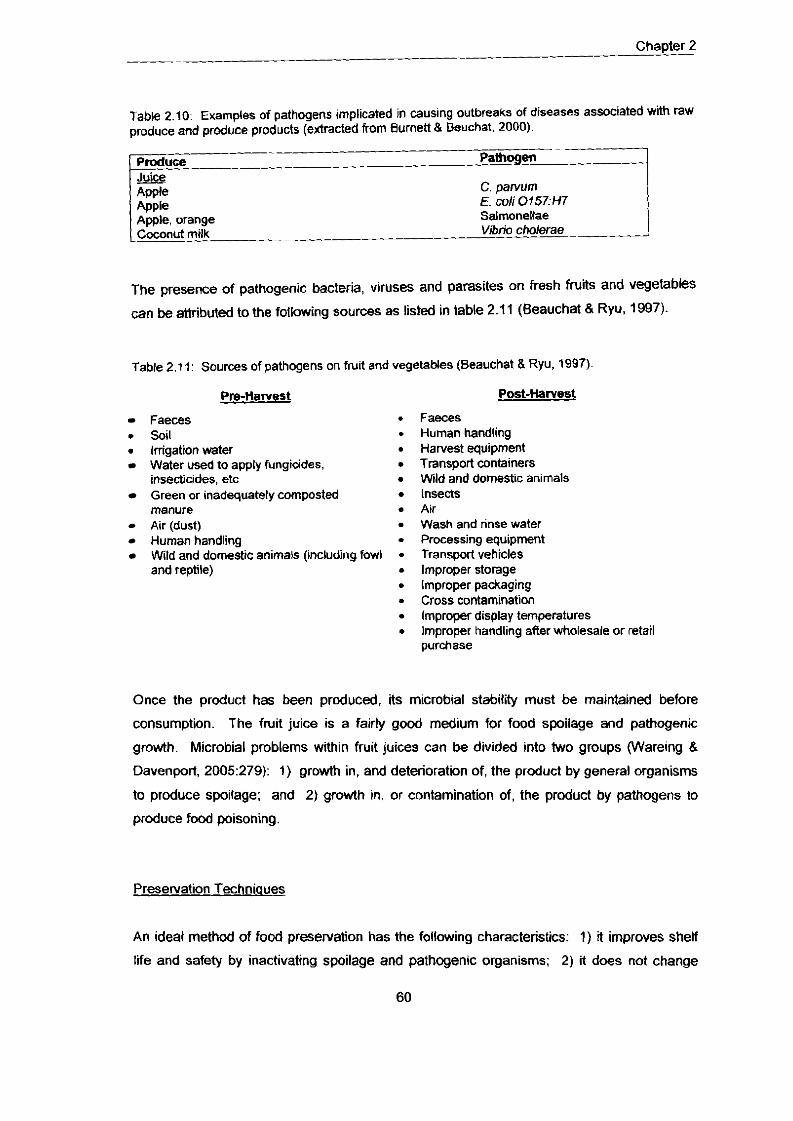
Chapter 2 --
-
Table 2.10: Examples of pathogens implicated in causing outbreaks of diseases associated with raw produce and produce products (extracted from Burnett 8 Beuchat. 2000).
,--- I ,,,I, ,,,,, Salmonellae I
The presence of pathogenic bacteria, viruses and parasites on fresh fruits and vegetables
can be attributed to the following sources as listed in table 2.11 (Beauchat 8 Ryu, 1997).
Table 2.1 1: Sources of pathogens on fruit and vegetables (Beauchat 8 Ryu, 1997).
Pre-Harvest
Faeces . Soil . Irrigation water Water used to apply fungicides. insectiudes, etc Green or inadequately cornposted manure Air (dust) Human handling Wild and domestic animals (including fowl and reptile)
Post-Harvest
Faeces Human handling Harvest equipment Transport containers Wild and domestic animals Insects Air Wash and rinse water Processing equipment Transporf vehicles lmproper storage lmproper packaging Cross contamination lmproper display temperatures lmproper handling affer wholesale or retail purchase
Once the product has been produced, its microbial stability must be maintained before
consumption. The fruit juice is a fairly good medium for food spoilage and pathogenic
growth. Microbial problems within fruit juices can be divided into two groups (Wareing &
Davenport, 2005:279): 1) growth in, and deterioration of, the product by general organisms
to produce spoilage; and 2) growth in, or contamination of, the product by pathogens to
produce food poisoning.
Preservation Techniaues
An ideal method of food preservation has the following characteristics: 1) it improves shet
life and safety by inactivating spoilage and pathogenic organisms; 2) it does not change
- Chapter 2
organolepic and nutritional attributes; 3) it does not leave residues; 4) it is cheap and
convenient to apply; 5) it encounters no objections from consumers and legislations (Raso &
Barbosa-Canovas. 2003).
The principle of maintaining product integrity of the fruit juice is either by heat prese~ation,
chemical preservation or a combination of both. Briefly, there are five main processes for
juice: 1) flash pasteurisation; 2) hot filling; 3) in pack pasteurisation; 4) aseptic filling; 5)
chilled distribution. Each process either involves heating the product to destroy microbes (l-
4) or ensuring that microbial growth cannot occur (5) (Lea, 2005:185190).
There are four preservatives currently used by the son drinks and fruit juice industry. These
are: 1) Sulphur dioxide, which acts as an antioxidant, preventing browning. It is a most
effective and wide-acting preservative. However, it can be detected by some tasters. 2)
Benzoic acid or sodium benzoate. which is effective against most yeasts and moulds. It can
be difficult to dissolve and has a tendency to precipitate out and can impart a slight flavour at
higher levels. 3) Sorbic acid or potassium sorbate, whiih is more effective at lower acidities
than Sodium Benzoate. It is less effectiie against some bacteria, less soluble in cold
temperatures and can precipitate out. 4) Dimethyl dicarbonate, which acts as a sterilant,
killing microoganisms. It hydrolyses in contact with water and so is not present when the
consumer opens the container (http://www.brilishsoftdrinks.cmIhtmlqualAdditives
Ingredientslprese~ativesl ... htm. 15/10/05). The first three preservatives are often used in
combination with one another to make them more effective, whilst the latter preservative is
used on its own. Due to the total breakdown of dimethyl dicarbonate, a presewative-Free
claim may be made, as there is no residue left after 24 hours. This latter preservative.
although being widely used in Europe, has only recently been introduced into South Africa
under the trade name of Velcorin (Bayer personal communication).
Packaaing
There are Several forms of packing for fruit juices and, far from bang mere containers, they
must be considered in many lights. They are the carriers of branding, manufacturer's
information, legal and nutritional information, and must have product 1 pack integrity, must
not leak, match up to manufacturing processes, protect the product in the distribution
channel and yet be cheap enough for the consumer to purchase the product.
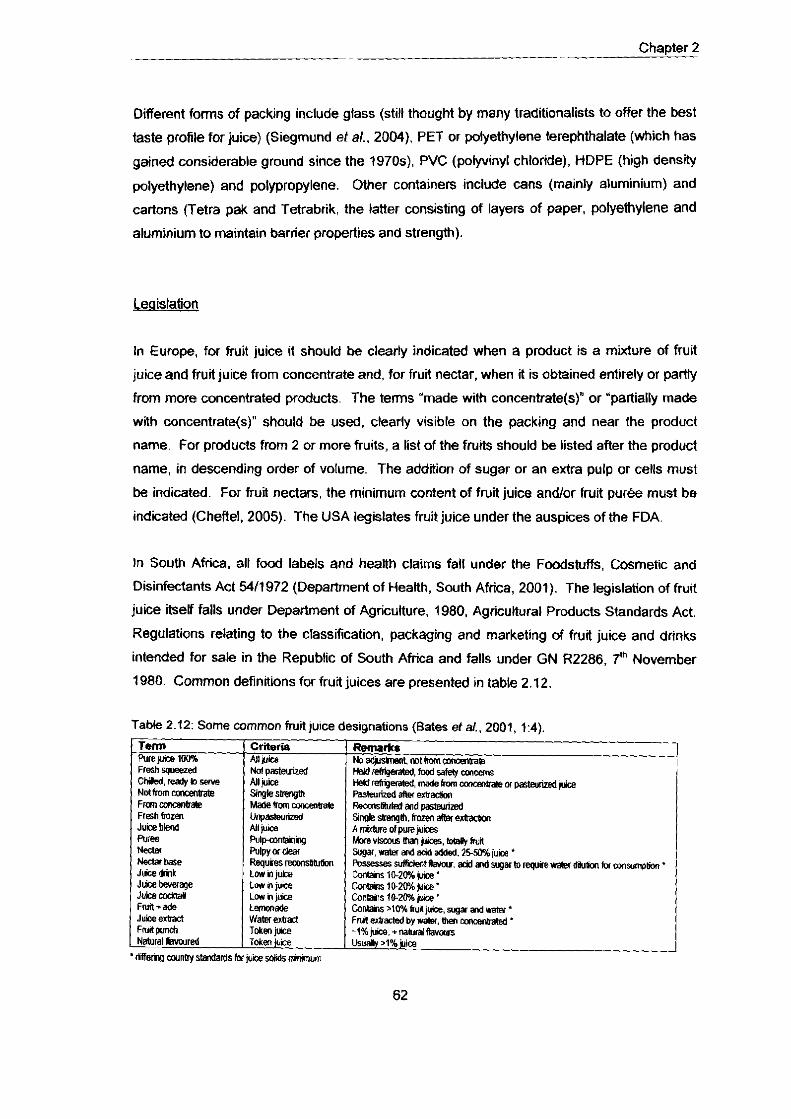
Chapter 2
Different forms of packing include glass (still thought by many traditionalists to offer the best
taste profile for juice) (Siegmund eta/.. 2004), PET or polyethylene terephthalate (which has
gained considerable ground since the 1970s), PVC (polyvinyl chloride), HDPE (high densrty
polyethylene) and polypropylene. Other containers include cans (mainly aluminium) and
cartons (Tetra pak and Tetrabrik, the latter consisting of layers of paper, polyethylene and
aluminium to maintain bar~ier properties and strength).
I eqislation
In Europe, for fruit juice it should be clearly indicated when a product is a mixture of fruit
juice and fruit juice from concentrate and, for fruit nectar, when fl is obtained entirely or partly
from more concentrated products. The terms "made with concentrate(@" or "paltially made
with concentrate(s)" should be used, clearly visible on the packing and near the product
name. For products from 2 or more fruits, a list of the fruits should be listed after the product
name, in descending order of volume. The addition of sugar or an extra pulp or cells must
be indicated. For fruit nectars, the minimum content of fruit juice andlor h i t puree must be
indicated (Cheftel. 2005). The USA legislates fruit juice under the auspices of the FDA.
In South Africa, all food labels and heaith claims fall under the Foodstuffs, Cosmetic and
Disinfectants Act 5411972 (Department of Health, South Africa, 2001). The legislation of fruit
juice itset falls under Department of Agriculture, 1980, Agricultural Products Standards Act.
Regulations relating to the classification, packaging and marketing of fruit juice and drinks
intended for sale in the Republic of South Africa and falls under GN R2286. 7m November
1980. Common definitions for fruit juices are presented in table 2.12
Table 2.12: Some common fruit juice designations (Bates et a/.. 2001. 1:4).
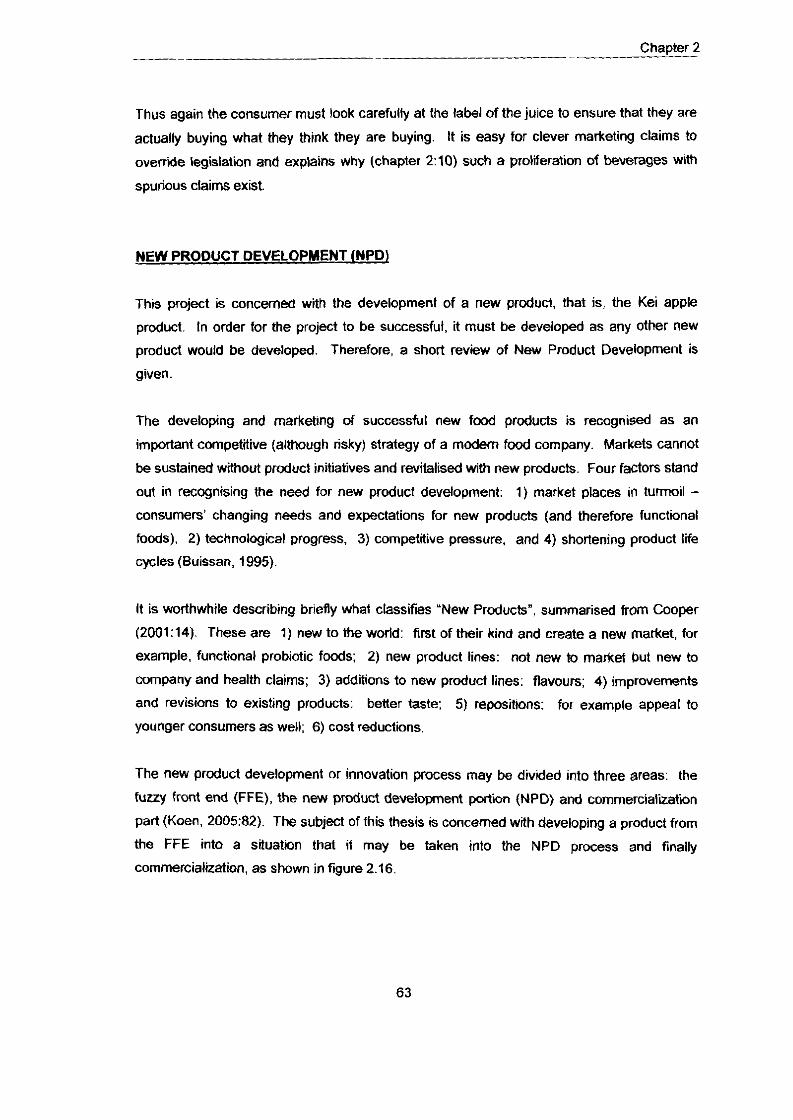
-- Chapter 2
Thus again the consumer must look carefulty at the label of the juice to ensure that they are
actually buying what they think they are buying. It is easy for clever marketing claims to
override legislation and explains why (chapter 2:10) such a proliferation of beverages with
spurious claims exist.
NEW PRODUCT DEVELOPMENT lNPD)
This project is concerned with the development of a new product, that is, the Kei apple
product. In order for the project to be successful, it must be developed as any other new
product would be developed. Therefore, a short review of New Product Development is
given.
The developing and marketing of successful new food products is recognised as an
important competitive (although risky) strategy of a modem food company. Markets cannot
be sustained without product initiatives and revitalised with new products. Four factors stand
out in recognising the need for new product development: 1) market places in turmoil - consumers' changing needs and expectations for new products (and therefore functional
foods), 2) technological progress, 3) competitive pressure, and 4) shortening product life
cycles (Buissan, 1995).
It is worthwhile describing br~efly what classifies "New Products", summarised from Cooper
(2001:14). These are 1) new to the world: first of their kind and create a new market, for
example, functional probiotic foods; 2) new product lines: not new to market but new to
company and health claims; 3) additions to new product lines: flavours; 4) improvements
and revisions to existing products: better taste; 5) reposittons: for example appeal to
younger consumers as well; 6) cost reductions.
The new product development or innovation process may be divided into three areas: the
fuzzy front end (FFE), the new product development @ion (NPD) and commercialization
part (Koen, 200582). The subject of this thesis is concerned with developing a product from
the FFE into a situation that it may be taken into the NPD process and finally
commercialization, as shown in figure 2.16.
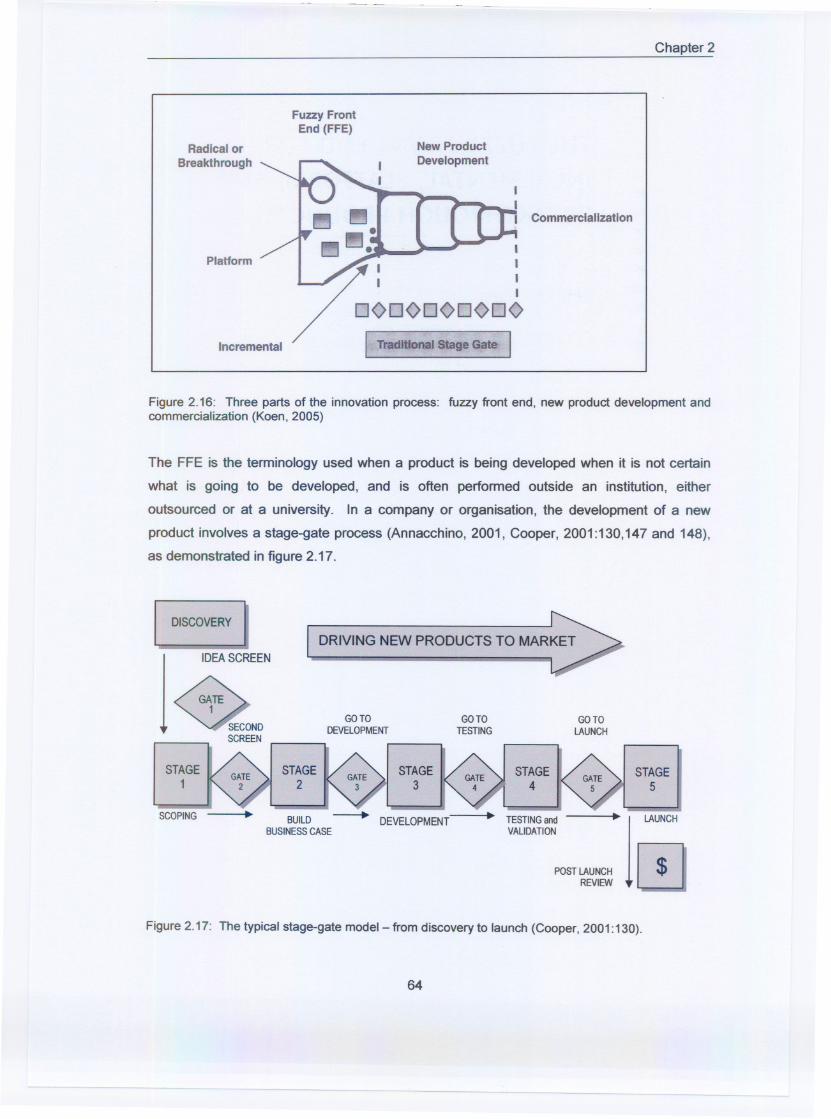
Chapter 2
Fuzzy FrontEnd (FFE)
Platform
New ProductDevelopment
Radical orBreakthrough
Commercialization
Incremental
Figure 2.16: Three parts of the innovation process: fuzzy front end, new product development andcommercialization (Koen, 2005)
The FFE is the terminology used when a product is being developed when it is not certain
what is going to be developed, and is often performed outside an institution, either
outsourced or at a university. In a company or organisation, the development of a new
product involves a stage-gate process (Annacchino, 2001, Cooper, 2001:130,147 and 148),
as demonstrated in figure 2.17.
DRIVING NEW PRODUCTS TO MARKET
DISCOVERY
j
IDEA SCREEN
~~OND
SCREENGOTO GOTO
DEVElOPMENT TESTINGGOTO
LAUNCH
STAGE1 ST~GEIk'~TE ~ ST~GE
STAGE5
SCOPING DEVELOPMENT TESTINGand "
1
LAUNCHVAliDATION
POSTLAUNCH I$lREVIEW L::J
Figure 2.17: The typical stage-gate model - from discovery to launch (Cooper, 2001:130).
64
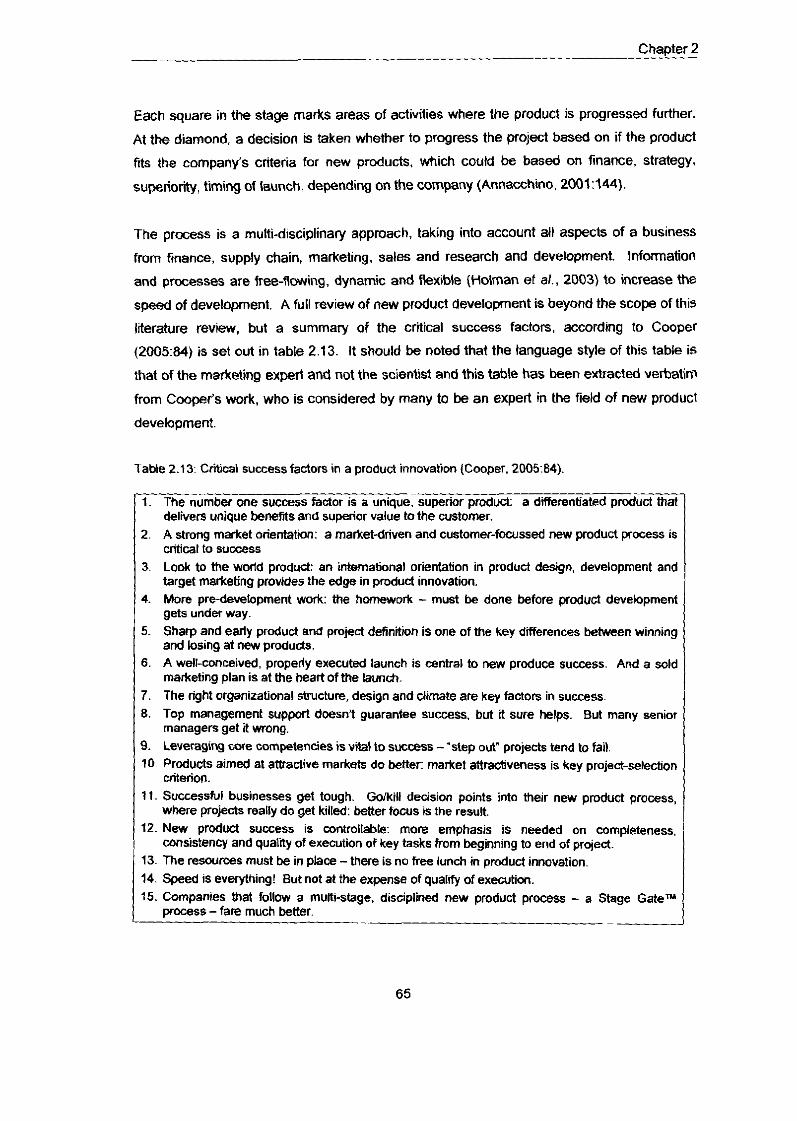
-- Chapter 2
Each square in the stage marks areas of activities where the product is progressed further.
At the diamond, a decision is taken whether to progress the project based on if the product
fits the company's criteria for new products, which could be based on finance, strategy,
superiority, timing of launch, depending on the company (Annacchino. 2001:244).
The process is a multidisciplinary approach, taking into account all aspects of a business
from finance, supply chain, marketing, sales and research and development. Information
and processes are free-flowing, dynamic and flexible (Holman et al., 2003) to increase the
speed of development. A full review of new product development is beyond the scope of this
literature review, but a summary of the critical success factors, according to Cooper
(200534) is set out in table 2.13. It should be noted that the language style of this table is
that of the marketing expert and not the scientist and this table has been extracted verbatim
from Cooper's work, who is considered by many to be an expert in the fieM of new product
development.
Table 2.13: Critkal success factors in a product innovation (Cooper. 2005:84).
-- 1. The "umber one success factor is a uniquelsuperior produd: a differentiated product that
delivers unique benems and superior value to the customer. 2. A strong market orientatii: a market-driven and customer-focussed new product process is
critical to success 3. Look to the world pmduct: an international orientation in product design, development and
target marketing provides the edge in product innovation. 4. More pre-development work: the homework - must be done before product development
gets under way. 5. Shwp and early product and project definition is one of the key differences between winning
and losing at new products. 6. A well-conceived, properly executed launch is central to new produce success. And a sold
marketing plan is at the heart of the launch. 7. The tight organizational structure, design and climate are key factors in success. 8. Top management support dwsn't guarantee success. but if sure helps. But many senior
managers get it mong. 9. Leveraging m e competencies is vital to success -'step out" projects tend to fail. 10. Products aimed at attradive markets do better: market attractiveness is key project-selection
criterion. 11 . Successful businesses get tough. Gokill decision points into their new product process,
where projeds really do get killed: better focus is the result 12. New product success is mntrollable: more emphasis is needed on completeness.
consistency and quality of execution of key tasks from beginning to end of project. 13. The resources must be in place - there is no free lunch in pmduct innovation. 14. Speed is everything! But not at the expense of qualrfy of execution. 15. Companies that follow a multi-stage, disciplined new product process - a Stage Gatem
process - fare much better.
Chapter 2
Typically, a company takes a standard procedure and adopts and evolves it to suit their own
organisation (Rudder et a/. , 2001).
All NPD must be consumer-driven (Jaeger et a/., 2003) and it is important that customer
needs are taken into account (Griiln, 2005:213). The main reasons why new products fail
have been identified by Cooper (2001 :23-26) as being inadequate marketing analysis: 24%;
product problems or defects: 16%; lack of effective marketing effort: 14%; higher costs Man
anticipated: 10%; competitive strength or reaction: 9%; poor timing of introduction, technical
or production problems: 6%; all other causes 13%. Other reasons for failure include poor
planning, which incorporates issues such as developing a product that doesn't fit a
company's strategy, competencies andlor distribution strength; poor management, which
does not support product development, is a primary cause of new product development
failure; as is a poor product concept which lacks a compelling consumer belief (a "me too"
product for example). To be successful, in essence, a new product must deliver on the
concept promises, have advantages in terms of quantity and quality matters, competitive
advantages, correct distribution to drive sales, and long-term support (Lord, 2000:52-65).
It is critical to develop a product with the end consumer in mind, and that consumer research
is critical at many stages of the FFE and NPD stages (van Kleef eta/., 2005(a), van Kleef et
a/., 2005(b)). As a result, whilst developing food products either at the FFE or during the
NPD stage, if the product passes into commercialization, sensory evaluation is a necessrty
to determine if it is acceptable to consumers and whether they would consider purchasing
the product (Hollingsworth, 1998). Stewart-Knox and Mitchell (2003) summarise that in
addition to the aforementioned processes and procedures, key issues to successful product
development are market, consumer and retailer involvement. This is especially important for
development of functional product where neophobia (fear of trying new products) may hinder
product trials, and it is urged that more emphasis be placed on a consumer-driven product
development process.
Various studies have been performed on consumer perceptions of functional foods, as
shown in table 2.14. These perceptions and insights must be taken into consideration when
formulating new products on functional focds. In essence, the end consumer must ahvays
be front of mind when developing a product.
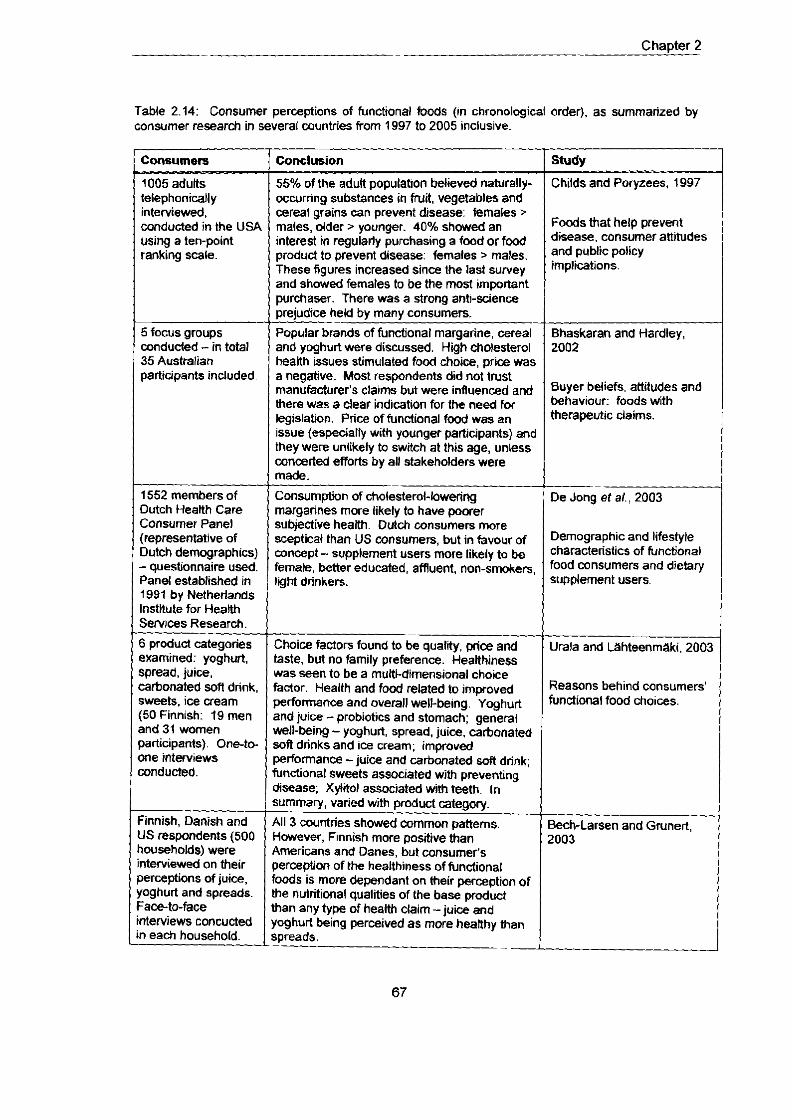
- Chapter 2
Table 2.14: Consumer perceptions of functional foods (In chronological order). as summarized by consumer research in several countries from 1997 to 2005 inclus~ve.
I Consumers
I 005 adults telephonically interviewed, conducted in the USP using a ten-point ranking scale.
5 focus groups conducted - in total 35 Australian participants included.
1552 members of Dutch Health Care Consumer Panel (representative of Dutch demographics) - questionnaire used. Panel established in 1991 by Netherlands Institute for Heatth
6 product cateaories examined: yoihurt, spread, juice, carbonated sofl drink. sweets, ice cream (50 Finnish: 19 men and 31 women participants). One-to- one interviews conducted.
US respondents (500 households) were interviewed on their perceptions of juice, yoghurt and spreads. Faceto-face interviews concucted
Conclusion
55% of the adult population believed naturally- ocwrring substances in frul, vegetables and cereal grains can prevent disease: females males, older > younger. 40% showed an interest in regulally purchasing a food or food product to prevent disease: females > males. These figures increased since the last survey and showed females to be the most important purchaser. There was a strong antt-science ~reiudice held bv manv consumers.
Popular brands of functional margarine, cereal and yoghurt were discussed. High cholesterol health issues stimulated food choice, price was a negative. Most respondents did not trust manufacturer's cla& but were influenced and (here was a clear lndlcatlon for the need for legislation. Price of functional food was an issue (especially with younger participants) anc they were unlikely to switch at this age, unless concerted efforts by all stakeholders were made.
-
Consumption of cholesterol-lowerina margarines more likely to have subiective heanh. Dutch consumers more sciptical than US consumers, but in favour of concept - supplement users more likely to be female, better educated, amuent, non-smokers, light drinkers.
Choice factors found to be quality, plice and M e , but no family preference. Healthiness Nas seen to be a multCdimensioml choice hctor. Health and food related to improved xrformance and overall wekbeing. Yoghurt end jutce - probiotics and stomach; general ell-being - yoghurt, spread, juice, carbonated soft drinks and ice cream; improved 3erformance - juice and carbonated sofl drink; unctional sweets associated with preventing lisease; Xyliol associated with teeth. In iummary, varied with product category. -- -- 111 3 countries showed common patterns. iowever, Finnish more positive than Vnericans and Danes, but consumer's perception of the healthiness of functional oods is more dependant on their perception of he nutritional qualities of the base product han any type of heaith claim - juice and foghurl being perceived as more healthy than ipreads.
--
Study - Childs and Poryzees, 1997
Foods that help prevent disease, consumer attitudes and public policy implications.
Bhaskaran and Hardley, 2002
Buyer beliefs, attitudes and behaviour: foods with therapeutic claims.
--
De Jong et aL, ZOO3
Demographic and lifestyle characteristics of functional food consumers and dietary supplement users.
Urala and ~ahteenmaki. 200:
Reasons behind consumers' i unc t io~ l food choices.
3ech-Larsen and Grunert. ,003
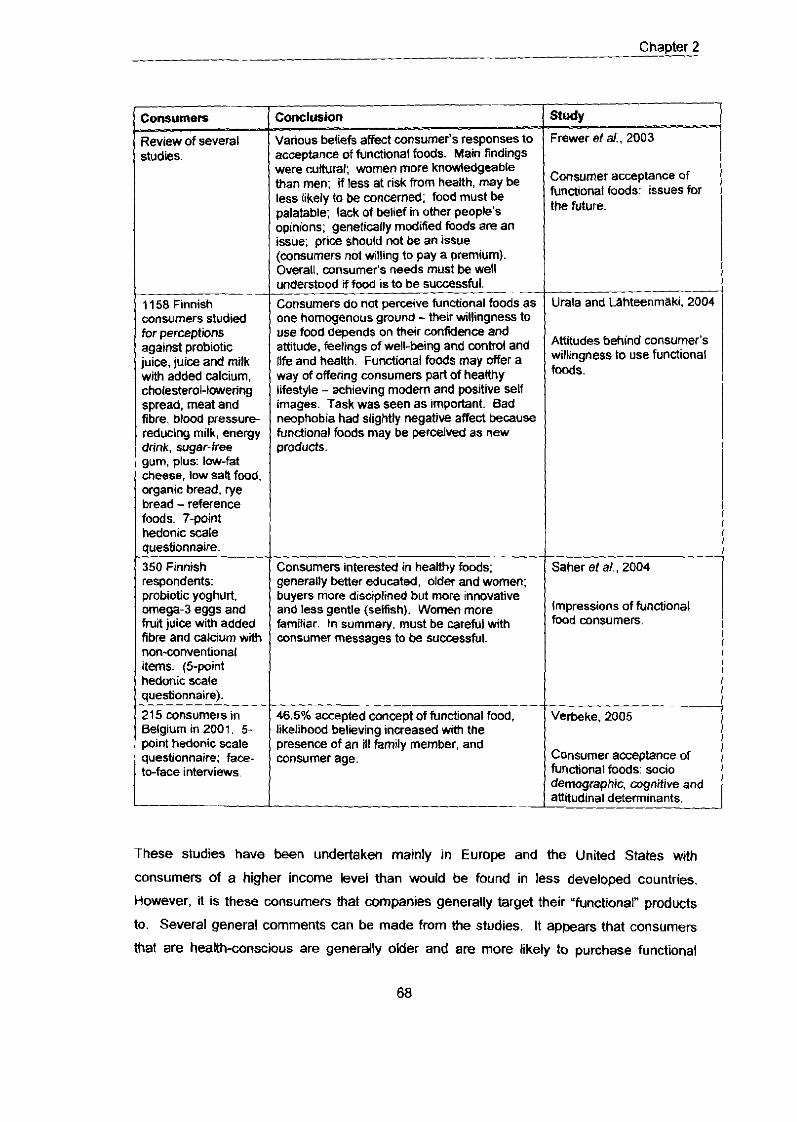
Chapter 2
Consumers
Review of several studies.
- ~
11 58 Finnish wnsumers studied for perceptions against probiotic juice, juice and milk with added calcium. cholesterol-lowering spread, meat and fibre, blood pressure reducing milk, energ! drink, sugar-free gum, plus: low-fat cheese, low sat fooa organic bread, rye bread - reference foods. 7-point hedonic scale questionnaire.
350 Finnish respondents: probiotic yoghurt. omega-3 eggs and fruit juice with added fibre and calcium wit1 non-conventional items. (5-point hedonic scale questionnaire).
215 wnsumers in Belgium in 2001. 5- point hedonic scale questionnaire; face- to-face interviews.
--
Conclusion
Various beliefs affect consumer's responses to acceptance of functional foods. Main findings were witural; women more knowledgeable than men; if less at risk from health, may be less likely to be wncemed; food must be palatable; lack of belief in other people's opinions; genetically modified foods are an issue; price should not be an issue (consumers not willing to pay a premium). Overall, consumer's needs must be well understood food is to be successful. . - Consumers do not perceive functional foods as one homwenous oround -their willinaness to use food dependson their confidence-and attitude, feelings of well-being and control and life and health. Functional foods may offer a way of offering consumers part of healthy lifestyle - achieving modern and positive self images. Task was seen as important. Bad neophobia had slightly negative affect because functional foods may be perceived as new Droducts.
Consumers interested in healthy foods; generally better educated, older and women: buyers more disciplined but more innovative and less gentle (selfish). Women more familiar. i n sumtiat). must be careful with consumer messages to be successful.
46.5% acceptedconcept of functional food, likelihood believing increased with the presence of an ill family member, and consumer age.
study Frewer et a/.. 2003
Consumer acceptance of functional foods: issues for the future.
Urala and Lahteenmaki, 2001
Attitudes behind consumer's willingness to use functional foods.
Saher et a / , 2004
Impressions of functional food consumers.
- Verbeke. 2005
Consumer acceDtance of functional foods ~ c i o demographic, cognitive and attitudinal determinants. -
These studies have been undertaken mainly in Europe and the United States with
consumers of a higher income level than would be found in less developed countries.
However, it is these consumers that companies generally target their 'functional" products
to. Several general comments can be made from the studies. It appeam that consumers
that are health-conscious are generally older and are more likely to purchase functional
Chapter 2 --
foods. Once a member of the family is ill, or the person themselves falls ill, they are more
likely to become more healh conscious. Taste must not be compromised at the expense of
a product "good for you". There was some skepticism of the claims made by companies, as
to whether they were really believable, and therefore a need for legislation. Women were
seen as being the major role players in the choice of food consumed and were therefore
more knowledgeable about the science I nuirition regarding the food.
Astrinoencv in Relation to Polv~henok and Beveraqes
Before proceeding with the rest of this review, it is relevant to comment on the astringency
related to some fruits as mentioned by Miller and Ruiz-Larrea (2002). The word astringency,
from the Latin ad sfringere, meaning "to bind" reflects what is believed to be the primary
chemical process that gives rise to the sensation. Simply put, compounds that have the
ability to bind with and cross-link proteins, are considered to be astringents. The most
common of these are the polyphenols, which, because of their use in the tanning processing,
are also known as Tannins".
Astringency and high levels of acidity make it difficult to formulate a palatable product
(Drewnowski 8 Gomez-Carneros, 2000), as the human palate is very sensitive to low levels
of acidity and astringency, compared to preference for sweet and salty products (Jellinek,
1985:40-50). Thus high levels of acidrty and astringency are difficuit to mask. The
perceptions of the four basic tastes, that is, sweet, salty, sour and bitter, are explained in the
textbooks Jellinek (1985), Meilgaard et a/. (1999), Stone and S i e l (1985) and others
mentioned previously. It is known that tannins have a profound astringent effect, that is a
puckering or a drying effect on the palate (Prinz & Lucas, 2000). Fukui et aL (2002) state that
the wine components responsible for binerness and astringency are primarily phenolic
compounds, especially flavonoid phenols which originate from grape seeds, skins and
stems.
Vidal et a/. (2003) state that bitterness and astringency are two sensory terms of critical
importance for describing the sensoty properties of wine. Whereas bitterness is a taste
mediated by sensory receptors, astringency is considered to be a tactile sensation resulting
from the precipitation of salivary proteins and leading to a loss of mouth lubrication.
However, the same definitions may be applied to fruits. It can be deduced that if a product is
t m astringent, it may therefore not be acceptable to the consumer and purchased
- Chapter 2
(Drewnowski & Gomez-Carneros, 2000). However, the astringency of the product gives a
clear indication that the product or food is potentially rich in polyphenols (it was for this
reason that it was decided to further study the Kei apple).
Valentova et al., (2002) studied astringency on a time-intensity basis, as the astringency of a
product lasts long after swallowing. It was concluded that astringency can be counteracted
in wine and orange juice more than a in control water solution when tannic acid and catechin
were tested alone, and sugar decreased the astringency of wine. However, the D-fructose
and D-glucose already present in orange juice contributed to decreased perception of
astringency. Prinz and Lucas (2000) studied saliva-tannin interactions and concluded that
tannic acid significantly reduces the lubricating qualilies of human saliva, both by decreasing
its viscosity and increasing friction, and its effect depends on the presence of salivary
proline-rich proteins (PRP). This may explain cross cultural preferences for tannin-rich
beverages Such as tea, coffee and red wine and may be explained by reduction in adhesion
of food particles to the oral mucosa, allowing their rapld oral clearance (that is, the particles
of food left behind in the mouth and oral cavities are loosened by the tannin-PRP reaction).
Certain individuals have the ability to taste the chemical 6-n-propylthiouracil (PROP), which
is an extremely b i e r compound (Fox, 1931 as quoted by Pickering et al., 2004). The
researchers lshikawa and Noble, 1995, found that PROP tastes are more sensitive to
astringency sensations in red wines. This obviously would affect consumer's perceptions of
a product, depending on the proportion of PROP tastes in the consumer palate. Mennelb et
al., 2005, discovered that variations in a taste receptor gene accounted for a major
proportion of individual differences in PROP bitterness perception in both children and
adults, as well as a portion of individual differences in preferences for sweet flavours in
children but not in adults.
Thus, for some individuals, perception of bitterness and astringency is lower than for others,
making astringent products more acceptable to them. However, for very astringent and
bitter products, the challenge for a new product is to formulate it in such a way that the
majority of the population accepts it.
Chapter 2
SENSORY EVALUATION AND CONSUMER RESEARCH
During and after a product or prototype has been developed, it is necessary to evaluate it
with h e target consumers, and this is where the realms of sensory evaluation and consumer
research prove to be of utmost importance.
There is great debate as to when sensory evaluation turns into market research or consumer
testing but, in essence, market research is concerned with consumers and sensory
evaluation is applicable inside a company or institution. Currently there are several
definitions for sensory evaluation, which will subsequently be given.
Sensory evaluation is a science that concerns itself with measuring the responses of people
to products in terms of its appearance, aroma, taste, texture and aftertaste as a reaction to
the different senses, without benefit of a label, pricing or either image~y (Stone, 1999, Stone
& Sidel, 1995). Thus evaluation of products without the label, price and branding differs from
market research, where the latter is performed using branded products. It is usually used to
answer three broad categories of questions: What is the product in terms of its perceived
characteristii?". "Is the product different from another?" and 'How acceptable or preferred
is the product'?"
The methods employed in sensory evaluation vary from simple (difference testing) to
complex panel testing, where individuals are trained in terms of the language of the
consumer. It is important that, when perfomling sensory evaluation, the method applied Ms
the end objective of the test (O'Mahony, 1995).
This is demonstrated by a supplier's failure to perform adequate sensory testing when it
launched its new beverage product in Japan. The product had a sediment which, in the rest
of the world, was perceived as a "natural" product but was disliked by the Japanese
(Hollingsworth. 1998).
Testina Methodoloay
There are two basic types of sensory methods tests - analytfcal and affective. The
aforementioned (analytical method) encompasses discriminative tests (a few examples are
shown in table 2.15) to evaluate whether the products are perceived as being different; and
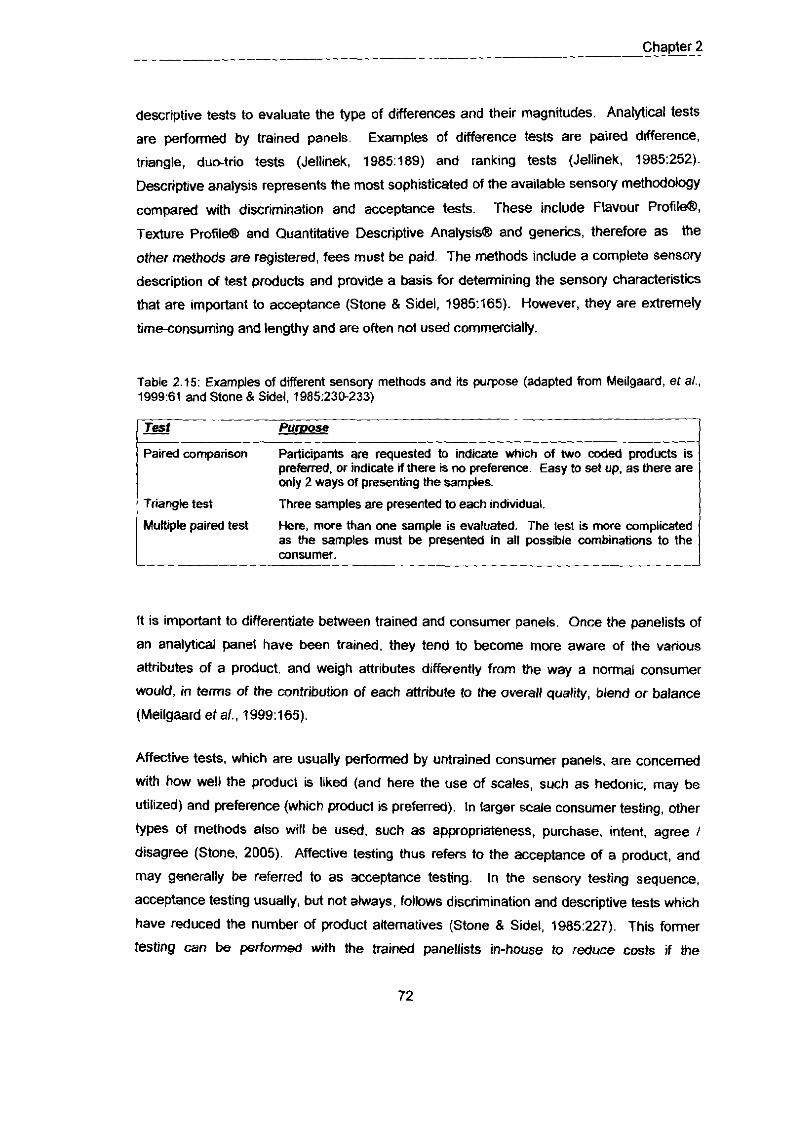
- - Chapter - 2 -
descriptive tests to evaluate the type of differences and their magnitudes. Analytical tests
are performed by trained panels. Examples of difference tests are paired difference,
triangle, duo-trio tests (Jellinek, 1985:189) and ranking tests (Jellinek, 1985:252).
Descriptive analysis represents the most sophisticated of the available sensoy methodology
compared with discrimination and acceptance tests. These include Flavour Profile@,
Texture Profile@ and Quantitative Descriptive Analysis@ and generics, therefore as the
other methods are registered, fees must be paid. The methods include a complete sensory
description of test products and provide a basis for determining the sensory characteristics
that are important to acceptance (Stone 8 Sidel, 1985:165). However, they are extremely
time-consuming and lengthy and are often not used commercially.
Table 2.15: Examples of diierent sensory methods and its purpose (adapted from Meilgaard, et al.. 1999:61 and Stone & Sidel, 1985:230.233)
Paired comparison Participants are requested to indicate which of two coded products is prefwred, or indicate if there is no preference Easy to set up, as there are only 2 ways of presenting the samples.
/ Triangle test Three samples are presented to each individual. 1 Multiple paired test Here, more than one sample is evaluated. The test is more complicated
as the samples must be presented in all possible combinations to the consumer.
It is important to differentiate between trained and consumer panels. Once the panelists of
an analytical panel have been trained, they tend to become rnwe aware of the various
attributes of a product, and weigh attributes differently from the way a normal consumer
would, in terms of the contribution of each attribute to the overall quality, blend or balance
(Meilgaard et a/., 1999:165).
Affective tests, which are usually performed by untrained consumer panels, are concerned
with how well the product is liked (and here the use of scales, such as hedonic, may be
utilized) and preference (which product is preferred). In larger scale consumer testing, other
types of methods also will be used, such as appropriateness, purchase, intent, agree /
disagree (Stone. 2005). Affective testing thus refers to the acceptance of a product, and
may generally be referred to as acceptance testing. In the sensory testing sequence,
acceptance testing usually, but not always, follows discrimination and descriptive tests which
have reduced the number of product alternatives (Stone & Sidel, 1985:227). This former
testing can be performed with the trained panellists in-house to reduce costs if the
Chapter 2
development of a product is being undertaken by a company. Often, companies have their
own trained panels for such purposes before the consumer research (more costly) is
performed.
Preference can be measured directly by the comparison of two or more products with each
other. that is, which of two or more products is preferred (Stone 8 Sidel. 1985:227).
Preference testing is extremely important in determining the success of a product, especially
food. This is borne out by Hess (1997) who states, "From a nutritional perspective, if a food
does not taste good, neither health professionals nor those they counsel are likely to eat it.
Medications, chronic disorders and radiation therapy can alter taste perception, resulting in
loss of appetite. lndividualising nutritional advice with consideration to taste, health needs,
and personal preference, is a 'signature dish' of quality dietetics practice". Each consumer
has their own specific likes and dislikes which, for a company selling food products, is
ultimately related to sales. These preferences are determined by cultural influences and
psychological factors. There is evidence that these likesldislikes start to develop in the
womb and are further influenced by breast feeding - directly related to those foods
consumed by the mother (Mennella, 1998).
The primary purpose of affective tests is to assess the personal response (preference and/or
acceptance) by current or potential consumers of a product, a product Idea or specific
product characteristics. For the average company's products, the amount of testing
generated by intended and unavoidable variations in process and raw materials far exceeds
the demand of consumer panel testing and thus there is little choice but to use in-house
panels for the latter (Meilgaard et al., 1999233).
For the purpose of this study, affective tests were used and will thus be discussed in more
detail.
Methods EmDl0ved in Affective Testing
Paired Com~arison Tests
These are generally less informative than the direct scaling methods such as the hedonic
scale. This is because the former test gives no magnitude estimation of the level of
preference. For example, both products may be disliked. This may be overcome by the use
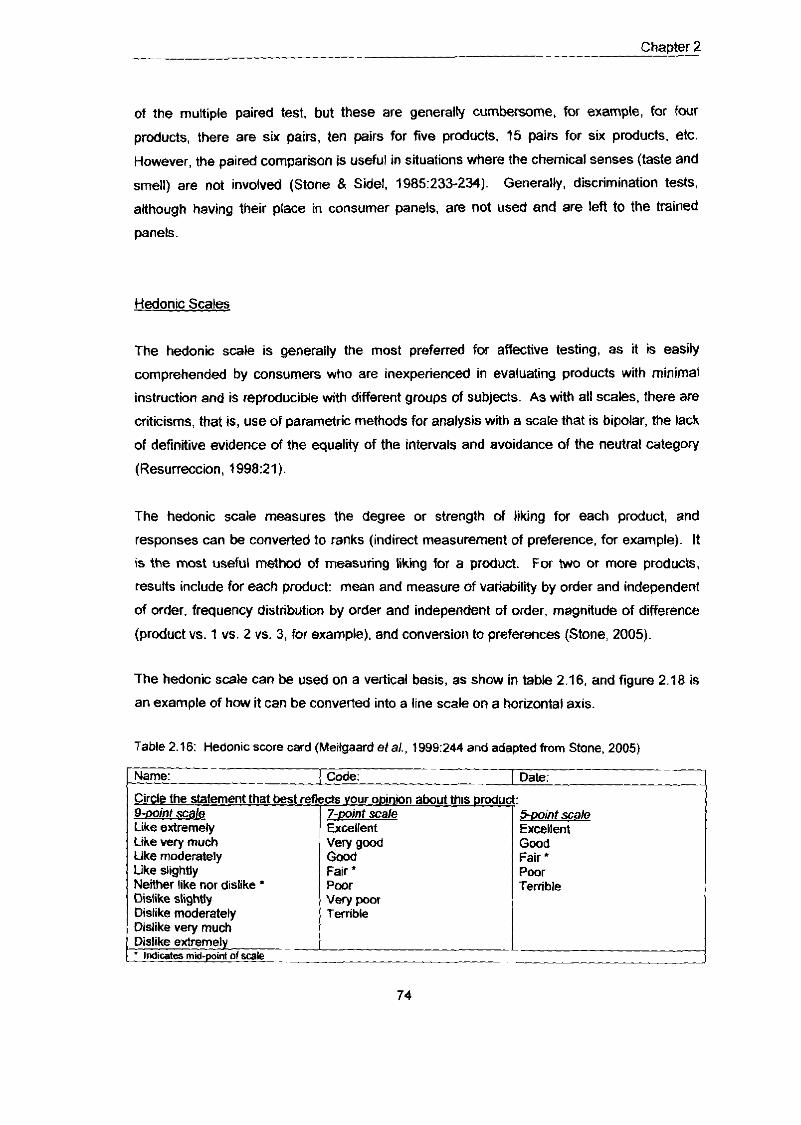
-- Chapter 2
of the multiple paired test, but these are generally cumbersome, for exampte, for four
products, there are six pairs, ten pairs for five products, 15 pairs for six products, etc.
However, the paired comparison is useful in situations where the chemical senses (taste and
smell) are not involved (Stone 8 Sidel. 1985:233-234). Generally. discrimination tests.
although having their place in consumer panels, are not used and are left to the trained
panels.
Hedonic Scales
The hedonic scale is generally the most preferred for affective testing, as it is easily
comprehended by consumers who are inexperienced in evaluating products with minimal
instructin and is reproducible with different groups of subjects. As with all scales, there are
criticisms, that is, use of parametric methods for analysis with a scale that is bipolar, the lack
of definitive evidence of the equality of the intervals and avoidance of the neutral category
(Resurreccion, 1998:21).
The hedonic scale measures the degree or strength of liking for each product, and
responses can be converted to ranks (indirect measurement of preference, for example). It
is the most useful method of measuring likmg for a product. For two or more products.
results include for each product: mean and measure of variability by order and independent
of order, frequency distribution by order and independent of order, magnitude of difference
(product vs. 1 vs. 2 vs. 3, for example), and conversion to preferences (Stone, 2005).
The hedonic scale can be used on a vertical basis, as show in table 2.16, and figure 2.18 is
an example of how it can be converted into a line scale on a horizontal axis.
Table 2.16: Hedonic swre card (Meilgaard eta/., 1999:244 and adapted from Stone. 2005)
[Name: - I Code: 1 Date:
Dislike ext&mely Indicates mid-point of Scale L
I ; Circle the statement that best reileds your oDinion about this DrOdu, M i n t scale Excellent Good Fair ' PDor Tenible
9-mint scale Like extremely
1 Like very much Like moderately Like slightly Neither like nor dislike ' , Dislike slightly Dislike moderately Dislike very much
7-point scale Excellent very 9 0 ~ ' Good Fair ' Pmr Very poor Terrible
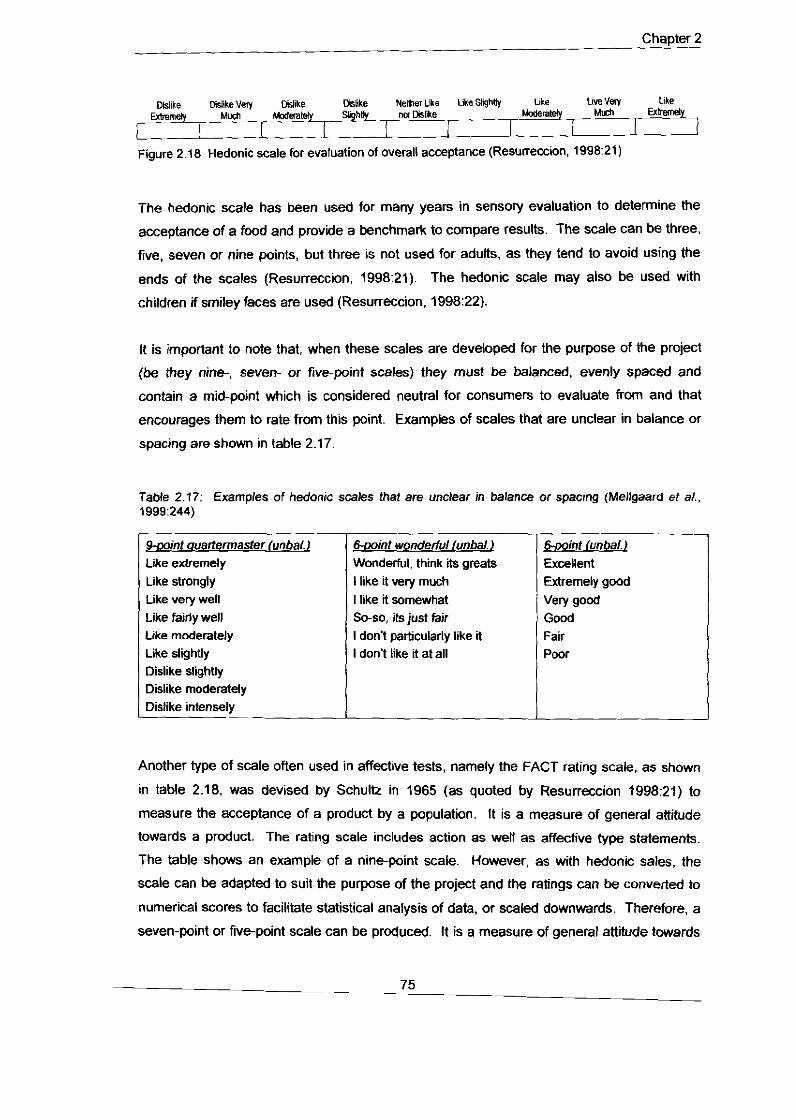
Chapter 2
Dislike GidikeVe~y Bl ike Wlike Neher Like Like ShghW Lite L N ~ very Like Exbwnehl Much MmW SJighW nw Dirke Moderaleiy Mujl Ext'miy
1 1 I I I -1 I I I I I I
Figure 2.18 Hedonic scale for evaluation of overall acceptance (Resurreccion, 1998:21)
The hedonic scale has been used for many years in sensory evaluation to determine the
acceptance of a food and provide a benchmark to compare results. The scale can be three.
five, seven or nine points, but three is not used for adults, as they tend to avoid using the
ends of the scales (Resurreccion, 1998:21). The hedonic scale may also be used with
children if smiley faces are used (Resurreccion. 1998:22).
It is important to note that, when these scales are developed for the purpose of the project
(be they nine-, seven- or five-point scales) they must be balanced, evenly spaced and
contain a mid-point which is considered neutral for consumers to evaluate from and that
encourages them to rate from this point. Examples of scales that are unclear in balance or
spacing are shown in table 2.17.
Table 2.17: Exam~les of hedonic scates that are unclear in balance or spacing (Meilgaard et at.,
%mint auartermaster (unbal.1 Like extremely Like strongly Like very well Like fairly well Like moderately Like slightly Dislike slightly Dislike moderately Dislike intensely
6wint wonderful h M . ) Wonderful, think its greats I like it very much I like it somewhat Soso, its just fair I don't particularly like it I don't like it at all
int (unbal. Excellent Extremely good Very good
Fair
hother type of scale oflen used in affective tests, namely the FACT rating scale, as shown
in table 2.18. was devised by Schub in 1965 (as quoted by Resurreccion 1998:Zl) to
measure the acceptance of a product by a population. It is a measure of general attitude
towards a product. The rating scale includes action as well as affective type statements.
The table shows an example of a nine-point scale. However, as with hedonic sales, the
scale can be adapted to suit the purpose of the project and Me ratings can be converted to
numerical scores to facilitate statistical analysis of data, or scaled downwards. Therefore, a
seven-point or five-point scale can be produced. It is a measure of general attitude towards
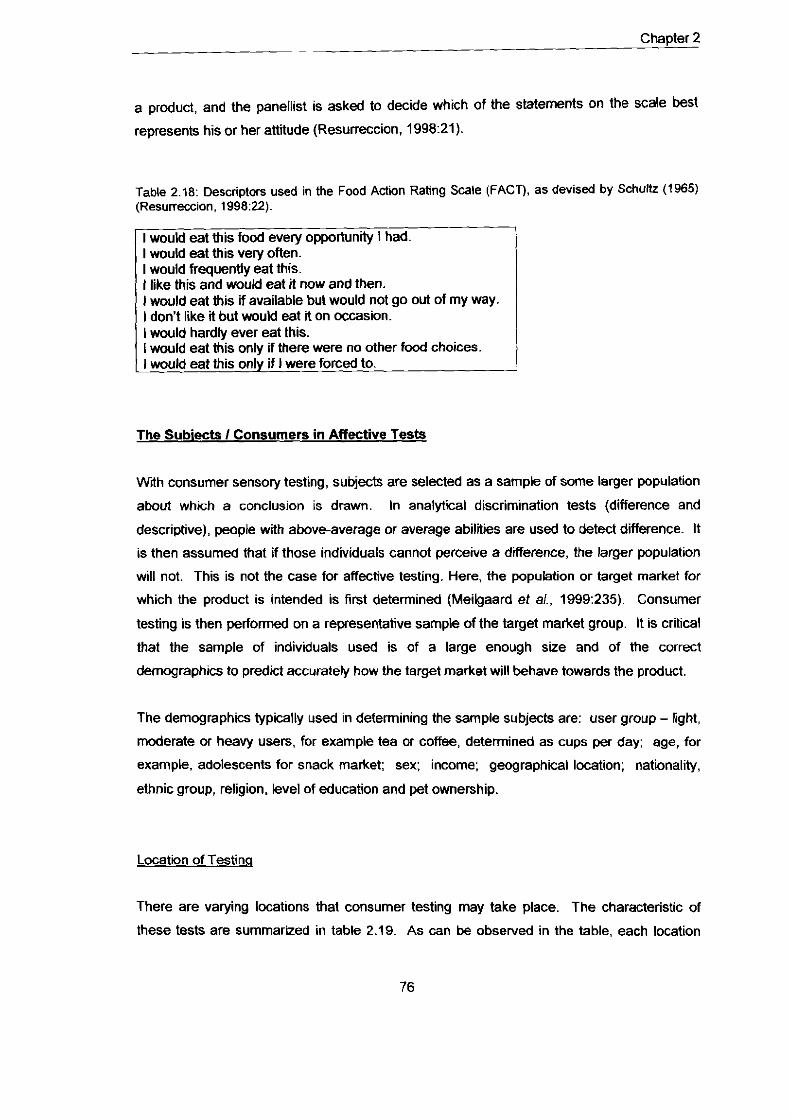
-
Chapter 2
a product, and the panellist is asked to decide which of the statements on the scale best
represents his or her attitude (Resurreccion. 1998:21).
Table 2.18: Descriptors used in the Food Action Rating Scale (FACT), as devised by Schultz (1965) (Resurreccion, 1998:22).
I would frequently eat this. I like this and would eat it now and then. I would eat this if available but would not go out of my way. I don't like it but would eat it on occasion. I would hardly ever eat this. I would eat this only if there were no other food choices. I would eat this only if I were forced to.
The Subiects I Consumers in Affective Tests
With consumer sensory testing, subjects are selected as a sample of some larger population
about which a conclusion is drawn. In analytical discrimination tests (difference and
descriptive), people with above-average or average abilities are used to detect difference. It
is then assumed that if those individuals cannot perceive a difference, the larger population
will not. This is not the case for affectwe testing. Here, the population or target market for
which the product is intended is first determined (Meilgaard et a/., 1999:235). Consumer
testing is then pelformed on a representative sample of the target market group. It is critical
that the sample of individuals used is of a large enough size and of the correct
demographics to predict accurately how the target market will behave towards the product.
The demographics typically used in determining the sample subjects are: user group - light,
moderate or heavy users, for example tea or coffee, determined as cups per day; age, for
example, adolescents for snack market; sex; income: geographical location; nationality,
ethnic group, religion, level of education and pet ownership.
Location of Testing
There are varying locations that consumer testing may take place. The characteristic of
these tests are summarized in table 2.19. As can be observed in the table. each location
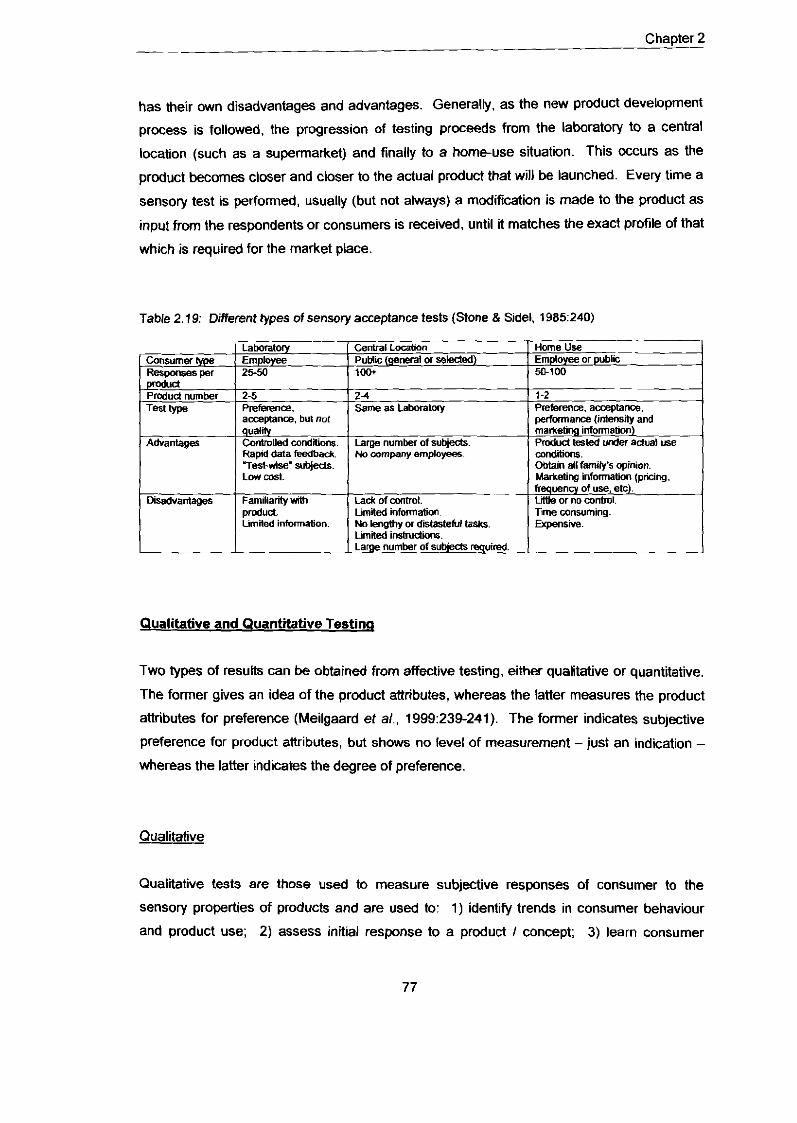
Chapter 2 --
has their own disadvantages and advantages. Generally, as the new product development
process is followed, the progression of testing proceeds from the laboratory to a central
location (such as a supermarket) and finally to a home-use situation. This occurs as the
product becomes closer and closer to the actual product that will be launched. Every time a
sensory test is performed, usually (but not always) a moditicatin is made to the product as
input from the respondents or consumers is received, until it matches the exact profile of that
which is required for the market place.
Table 2.19: Different types of sensory acceptance tests (Stone 8 Sidel, 1985:240)
Pmdud number -- Disadvantages
Laboratq I Central L a a b n Home Use Employee I PuMic W w a l or seleded) 25-50 loot 5c-100
2 5 2 4 1-2 Preferenm. Same as Latnratw Preference, a a z p t a m . acceptance, bm no1 perfmnance (intensity and qualw marketing infonnationl Canlmlled c o n d i i . Large number of subjectr. Pmdud taled under adual use Rapd data feedback No mmpany employees mndiiom. Ted-r*ise- subjeds. Obtain all family's opinion. Low mst. Marketinn infonnabn londnn.
Little or no contml. Limited infwmation. Tune mnsuming.
Expensive. L i m M insmdkms. ~~~ I Large number of subiecfs required. [
Qualitative and Quantitative Testing
Two types of results can be obtained from affective testing, either qualitative or quantitative.
The former gives an idea of the product attributes, whereas the latter measures the product
attributes for preference (Meilgaard et aL. 1999:239-241). The former indicates subjective
preference for product attributes, but shows no level of measurement -just an indication - whereas the latter indicates the degree of preference.
Qualitative
Qualitative tests are those used to measure subjective responses of consumer to the
sensory properties of products and are used to: 1) identify trends in consumer behaviour
and product use; 2) assess initial response to a product 1 concept; 3) learn consumer
Chapter 2 --
terminology to describe the sensory attributes of a concept, prototype or product category.
This is critical if a larger questionnaire for quantitative evaluation is to be developed at a later
stage, where it is empirical that consumer language is used. Thus, product attributes in
qualitative tests are discussed in the consumers own words; 4) consumer behaviour
regarding a particular product. These types of tests are usually groupbased discussion
"focus groups" (Boike eta/., 2005:197) or questionnaires that are undertaken by facetc-face
intewiews (Alam, 2005:252), telephone or email (Resurrection 1998:27).
Quantitative
Quantitative tests are used to determine: 1) overall preference or liking of a specific product,
2) to determine preference or liking for broad aspects, 3) to measure consumer responses to
specific sensory attributes. Hedonic scales are often utilised here.
These are then classified into two main categories:
Questions
Preference Choice Which sample do you prefer?
Which sample do you like better?
Acceptance Rating How much do you like the product?
How acceptable is the product?
Popper et a/. (2004) studied the effect of asking attribute questions about a product first, that
is before questioning participants about which product is preferred, because attribute
questions may make a respondent more critical and aware of the several ways a product
falls short of perfection. Obviously, there needs to be careful consideration to be adhered to
when considering drawing up of questionnaires.
Whilst sensory evaluation has its place in new product development, it is important to
recognise that this must be performed with consumers in mind, otherwise taste tests on food
to predict the market performance of the products, such as Burger King's new irench fries
and the classic example of new Coke. For food scientists to perform tests that accurately
predict consumer behaviour at the point of purchase, 1 is necessary to include in the
experimental design, marketing personnel and insights to assure that consumers are
responding to the product as they would in an actual food setting. Suggestions to improve
Chapter 2
predictions are: 1) define target market correctly; 2) choice of subjects; 3) identification of a
subset of trends when the choice is wide, for example, soft drinks; 4) correct choice of
evaluation method (as discussed previously); 5) possible inclusion of competitor brands: 6)
inclusion of total marketing mix - price, promotion. advertising, product design and branding,
claims (Garber et al. 2003).
In summary. Garber et a/. (2003) recommend that, due to the heightened sensitivity of
consumers to food products in particular and to the complex nature of such food
characteristics as taste, smell, flavour, texture, colour, packaging and other visual elements,
more sensory research integrating these variables is needed. Wansink (2003) continues the
above recommendations and states that in testing with brand names with consumers, extra
care must be taken when considering setting up questionnaires and sensory consumer
testing. It is critical to include a control in the experimentation, and the use of expanded
questions is useful, with probing questions for consumers that ask them to compare against
similar products. Marshall (2003) states that the world of the consumer is far from the
laboratory and there must remain serious questions about the reliability of sensory tests to
predict market place performance. It is therefore recommended that sensory scientists
should consider and include marketing variables (as in their consumer response experience)
and thus obtain more relevance for performance in the market place.
Grunert (2003) is clear in his thinking. Food choice is an area which has attracted
researchers from different disciplines and two major camps (the sensory scientist and
consumer marketer) have developed considerably over the last 12 years. Both disciplines
should learn more about each other's fields. If it is required to increase the external validity
of testing studies, they need to be approximated to real world environment and not just their
own disciplines. This is often where the new product development process can fail, if there
is a lack of communication between the sensory scientist and that of the other functions
involved in the development and commercialization of the product Moskowitz (2003) backs
up the opinion of Grunart. 2003, and goes on to say that for a product to succeed from a
sensory science and therefore consumer science perspective, the following are critical
success factors: 1) market researchers and sensory researchers should work together (that
is, the whole team must work together effectively in order to product a produce that will be
successful); 2) everyone must take responsibility for their roles; 3) the team must be
constant and not suffer changes in personnel; 4) must have top management commitment.
Chapter 2
The above fits in with the discussion on NPD in this review, and only emphasizes the fact
that the success of this project to develop a Kei apple functional beverage, involves
commitment from all stakeholders in the project.
CONCLUSION
This literature review attempts to relay the complexity of the project. Functional foods have
been discussed, as well as their legislation, trends and emphasis on beverages. The key
active ingredients that are found in fruit were discussed as well as the importance of fruit and
vegetables in the diet. New product development and the role of the consumer was
discussed. Subsequently, a discussion on fruit juice processing followed.
The purpose of this project is to produce a new product. This chapter, therefore, also covers
what is needed as background for the development of similar products, the chemistry behind
them, the constituents (the polyphenols), how they may benefit health and the levels of
polyphenols expected from the product.
None of this can help with the actual development of the product. Subsequently, a
discussion on new product development, consumers and sensory evaluation took place.
Without knowledge of these, it is not possible to bring such products to the marketplace, nor
get to the position where a product may be evaluated for its potential health benefit.

- Chapter 3
CHAPTER 3
METHODS AND MATERIALS
- Chapter 3
CHAPTER 3
METHODS AND MATERIALS
Granor Passi (Pty) Ltd was involved as the commercial partner in the formulatory work. This
company is the largest producer of fruit juice concentrates and fruit juice blends in South
Africa, and regularly exports fruit juice to Europe. The storage facilities, laboratories, and
processing plant were used throughout the formulatory work of this project, apart from the
pilot feasibility study which was not undertaken under formal laboratoty conditions.
Granor Passi (Pty) Ltd became interested in the project as they recognized its potential to
promote the idea of indigenous fruit and the potential health benefits of the Kei apple fruit.
Their plant in Polokwane specialises in processing citrus fruit and exotic fruits such as
guava, peach, apricot and litchi. A plant in the Eastem Cape specialises in apples, pears
and grapes which often form the basis of 100% fruit juice, as the natural sweetener, as
discussed in the literature review. Granor Passi (Pty) Ltd is also a partner in the Marula
project mentioned in the introduction of this study. Therefore, by using the company as
partners, access to all equipment required and processing equipment was facilitated.
3.1 Collection of Kei A D D ~ ~ S
The first batch of Kei apples were obtained from a farm in Bloemhof in the North
West (NW) reglon of South Africa. These were used for the preliminary
investigations in formulating a Kei apple beverage. Whilst Bloemhof is situated in
Gauteng, it is on the border of the Orange Free State and thus is subjected to a
climate of hot summer months with moderate rainfall and winters that experience
frost.
The second batch of Kei apples were collected from the Eastern and Western Cape
and amalgamated into one batch. Ha~esting took place from the third week of
January until the first week of February 2005. Approximately two hundred kilograms
(200kg) of Kei apples were obtained from the N1 highway between Cape Town and
Stellenbosch, and one hundred and twenty kilograms (120kgs) from outlying districts
approximately 20 kilometers west of East London towards the Kei river. Both sets of
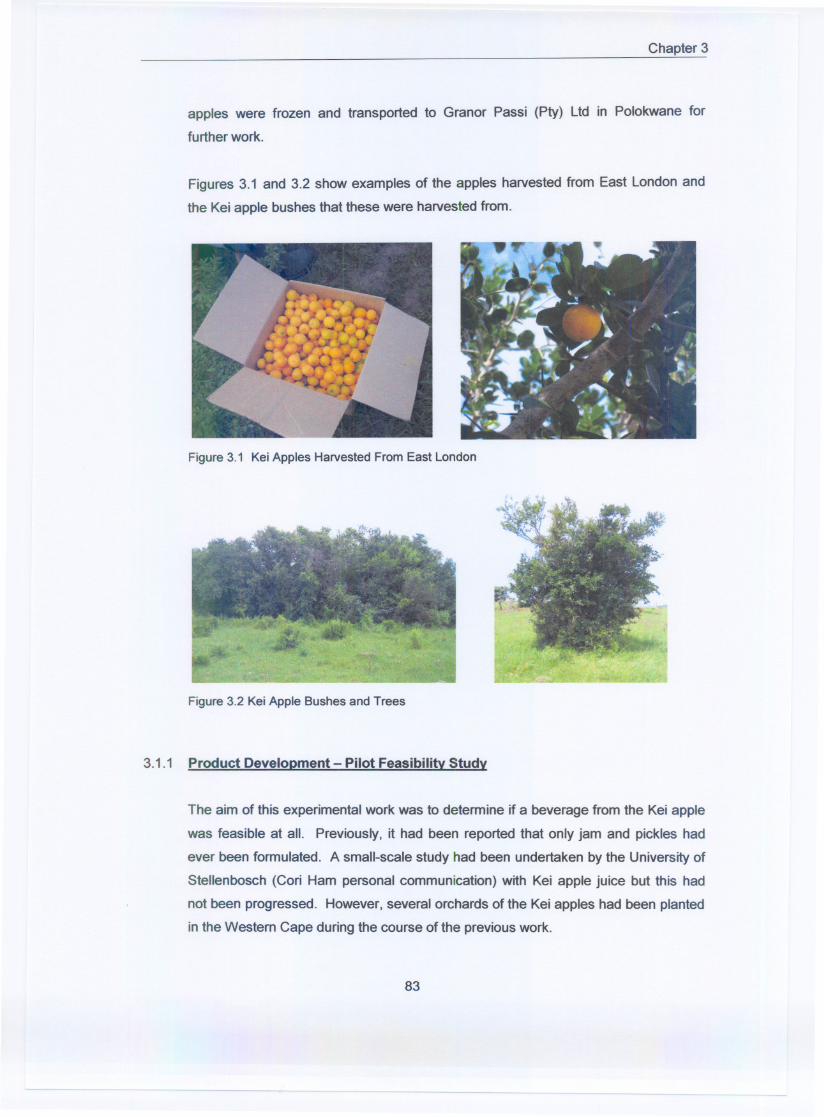
Chapter 3
apples were frozen and transported to Granor Passi (Pty) Ltd in Polokwane for
further work.
Figures 3.1 and 3.2 show examples of the apples harvested from East London and
the Kei apple bushes that these were harvested from.
Figure 3.1 Kei Apples Harvested From East London
Figure 3.2 Kei Apple Bushes and Trees
3.1.1 Product DeveloDment- Pilot Feasibilitv Study
The aim of this experimental work was to determine if a beverage from the Kei apple
was feasible at all. Previously, it had been reported that only jam and pickles had
ever been formulated. A small-scale study had been undertaken by the University of
Stellenbosch (Cori Ham personal communication) with Kei apple juice but this had
not been progressed. However, several orchards of the Kei apples had been planted
in the Westem Cape during the course of the previous work.
83
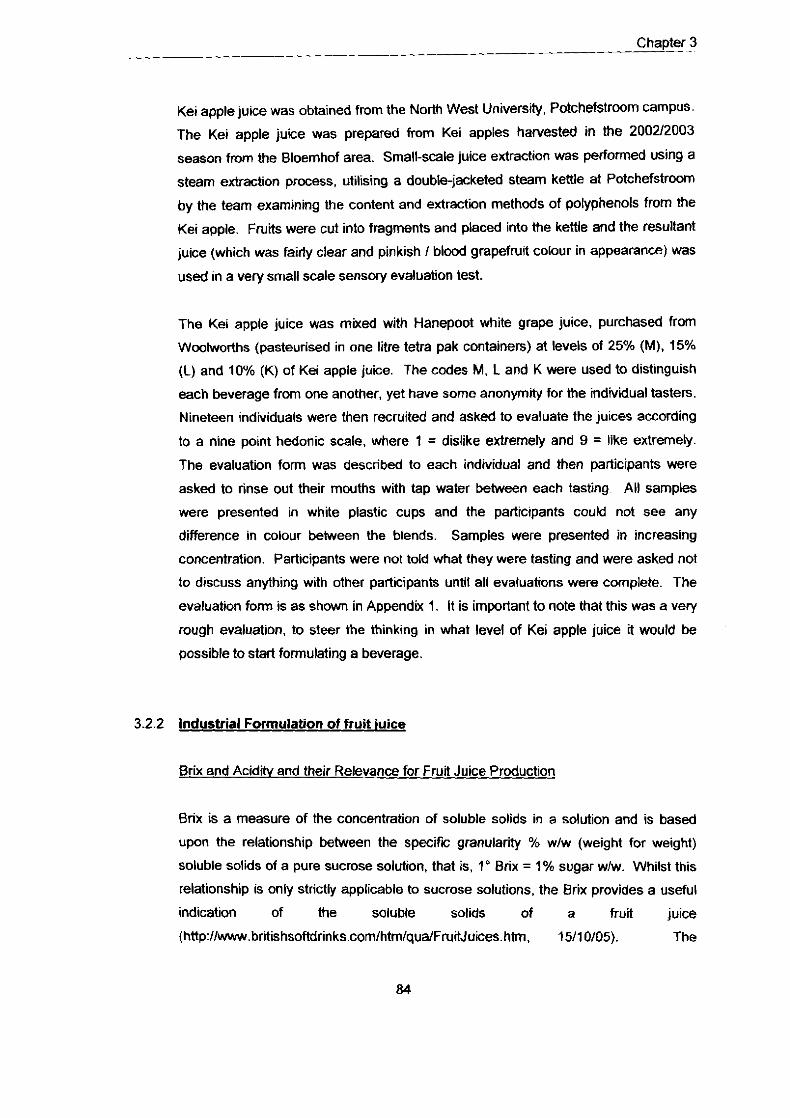
- Chapter - 3
Kei apple juice was obtained from the North West Universw, Pdchefstrwm campus.
The Kei apple juice was prepared from Kei apples hawested in the 200212003
season from the Bloemhof area. Small-scale juice extraction was performed using a
steam extraction process, utilising a double-jacketed steam kettle at Potchefstroom
by the team examining the content and extraction methods of polyphenols from the
Kei apple. Fruits were cut into fragments and placed into the kettle and the resultant
juice (which was fairly clear and pinkish I blood grapefruit colour in appearance) was
used in a very small scale sensory evaluation test.
The Kei apple juice was mixed with Hanepoot white grape juice, purchased from
Wwlworths (pasteurised in one litre tetra pak containers) at levels of 25% (M). 15%
(L) and 10% (K) of Kei apple juice. The codes M. L and K were used to dist~nguish
each beverage from one another, yet have some anonymity for the individual tasters.
Nineteen individuals were then recruited and asked to evaluate the juices according
to a nine point hedonic scale, where 1 = dislike extremely and 9 = like extremely.
The evaluation form was described to each individual and then participants were
asked to rinse out their mouths with tap water between each tasting All samples
were presented in white plastic cups and the participants could not see any
difference in colour between the blends. Samples were presented in increasing
concentration. Participants were not told what they were tasting and were asked not
to discuss anyihing with other participants until all evaluations were complete. The
evaluation form is as shown in Appendk 1. It is important to note that this was a very
rough evaluation, to steer the thinking in what level of Kei apple juice it would be
possible to start formulating a beverage.
3.2.2 Industrial Formulation of fruit iuice
Brix and Acidih, and their Relevance for Fruit Juice Production
Brix is a measure of the concentration of soluble solids in a solution and is based
upon the relationship between the specifc granularity % wlw (weight for weight)
soluble solids of a pure sucrose solution, that is, 1" Brix = 1% sugar wlw. Whilst this
relationship is only strictly applicable to sucrose solutions, the Brix provides a useful
indication of the soluble solids of a fruit juice
(http:11w.brit i ihsofldrinks.cornlhtm/quFJuh, 15110105). The
Chapter 3 --
concentration of most fruit ju~ces is conveniently measured in degrees Brix ("Brk,
'Bx, "B), although the strict interpretation of this measure refers to pure solutions of
sucrose in water. For juices with a high proportion of sugars to acids such as
orange, pineapple and apple, this is a useful and convenient means of measuring
concentration. In some instances, a correction factor may be introduced to take
account of the acidity (although in this project, the acidity was not taken into
account). Brix measurement is simply related to refractive index and there is a
slightly different relationship between the refractive index and concentration of citric
or malic acids and that of simple sugars (Ashurst. 2005:131). The Department of
Agriculture of South Africa, in the Agricultural Products Standards Act GN R2286,
laid down set Brix standards for fruit juices according to their lype, to protect the
consumer from being sdd diluted products or adulterated products, for example, by
substituting non-nutritive sweeteners for sugar in a fruit juice nectar, which by law
may contain part fruit juice and part sugar. Set Brix values are laid down for apple
(10.5 " B), apricot (11.0 " B), grape (12.5 " B), granadilla (9.0 " B), guava (8.0 " B),
orange (8.6 ' B), naartjie (8.0 " B), pear (12.0 " B), peach (12.0 ' B), grapefruit (8.0 "
B), pineapple (9.5 " B), lemon (7.5 ' B) and mixed juice (" B is equivalent to
weighted average of the juices).
Generally, the ' B is determined by the use of a refractometer. The sample to be
measured is placed on the viewing plate and the amount or degree to which light is
refracted through the sample measured and is directly proportional to the
concentration of sugar in the sample. The temperature at which the reading is taken
must be constant; or taken into account in the test method. As with all
instrumentation. Brix refractometers vary in their make and sophistication. If the juice
or concentrate being measured does have a high acidlty level, this must be
measured and compensated for. A set of calibration tables accompanies
instrumentation to assist in this.
The acid character of a juice contributes to its flavour type and is taken into
consideration when assessing the value of the juice for inclusion into a new beverage
formulation. Acid content % wlw (weight for weight) is determined using a pH meter
by direct titration against standarised alkali solution (for example, O.lm sodium
hydroxide) to an end point of pH 8.1 (Taylor, 2005:62). The use of a pH meter,
phenolphthalein, an indicator or an auto-titrator incorporating the pH meter may be
used to determine the end point.
Chapter - . 3
Generally, acidrty is recorded in terms of citric acid both for citrus fruits and most
other fruits, although other acids (for example oxalic, isocitric, tartaric) may be
present. Where apple and other pome fruits are concerned, the major organic acids
are malic and citric acid and thus acid is usually quoted as % w/w malic acid. As a
general rule, the acidity of juices will decrease with increasing maturity or with
increasing levels of sugars in the resulting juice. The Brix I acid ratio is frequently
used to establish sensory or taste qualities for incoming juice supplies to minimize
the effects of seasonal variations. The higher the Brix value in relation to the acid
content of the juice, the higher the ratio, and the 'sweetef the taste (Taylor,
200562).
The pilot feasibildy work undertaken in 3.2.1 indicated that the Kei apple juice could
be added at levels between 10-15% to give a palatable drink. Thus, the aim of this
part of the experimental work was to determine if a more acceptable drink using a
method that was more precise, likened to an industrial process could be formulated.
The quantity of Kei apples available from Bloernhof were limited as none had been
harvested in the 200312004 season, and thus it was critical at this stage that a
formulation be developed that could be used once the 200412005 hawest be
obtained, otherwise the project would cease.
Samples of the frozen Kei apples. harvested at Bloemhof in the 200212003 season.
were transported to the Granor Passi (Pty) Ltd plant at Polokwane. The fruit was
defrosted, rinsed and skinned by hand. It was then placed in an industrial strength
(Waring) blender. The resultant juice was sieved through a normal kitchen sieve (20
mesh size). In order to deactivate the enzymes, the juice was microwaved (LG
Multiwave), 4 litres at a time, until such a time that it was just bubbling.
The resultant total acidity of this juice was 4.81% wlw (weight for weight), calculated
as citric acid (Granor Passi (Pty) Ltd laboratory method, 2003a) and the Brix was
16.3" (Granor Passi (Pty) Ltd method, 2003b). The juice yield of the fruit was 87%.
This was determined by weighing the fruit before juiced and weighing the amount of
juice obtained afterwards, and determining the resultant percentage.
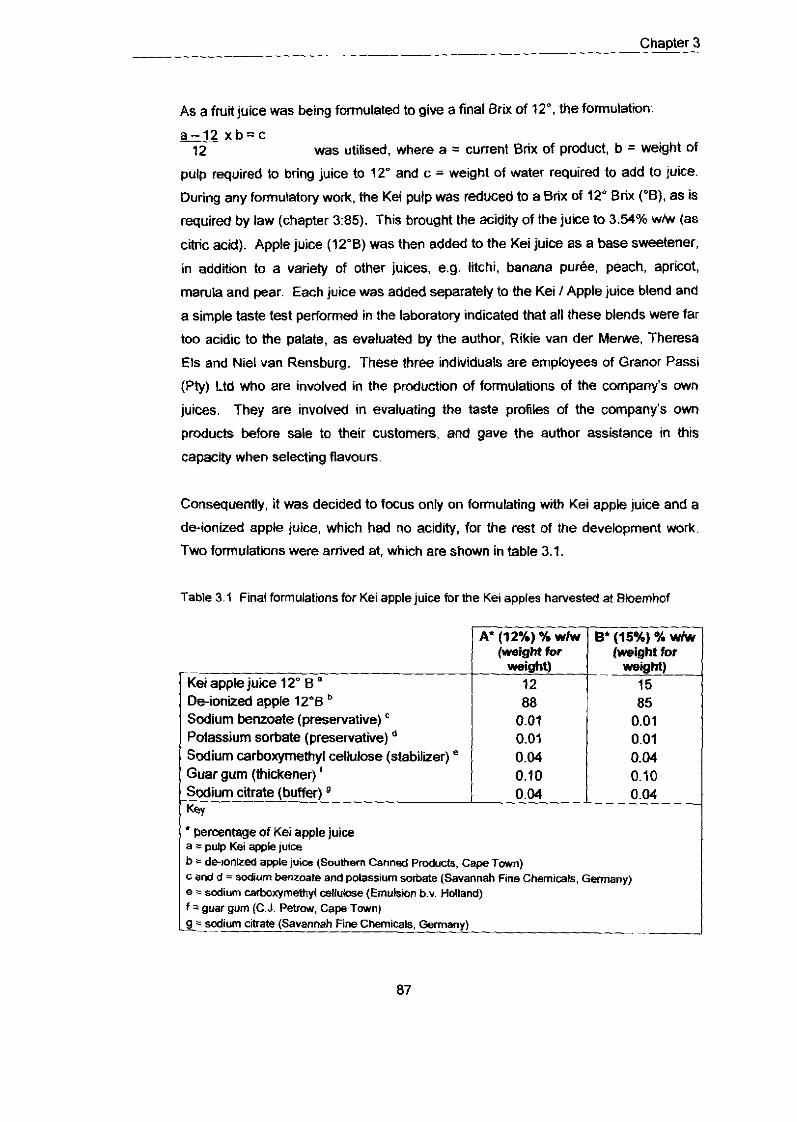
Chapter 3 --
AS a fruit juice was being formulated to give a final Brix of 12", the formulation
a x b = c 12 was utilised, where a = current Brix of product, b = weight of
pulp required to bring juice to 12' and c = weight of water required to add to juice.
During any formulatory work, the Kei pulp was reduced to a Brix of 12" Brix ("B), as is
required by law (chapter 3:85). This brought the acidlty of the juice to 3.54% whv (as
citric acid). Apple juice (12'8) was then added to the Kei juice as a base sweetener,
in addition to a variety of other juices, e.g. litchi, banana p u r k peach, apricot,
marula and pear. Each juice was added separately to the Kei I Apple juice blend and
a simple taste test performed in the laboratory indicated that all these blends were far
too acidic to the palate, as evaluated by the author. Rikie van der Merwe. Theresa
Els and Niel van Rensburg. These three individuals are employees of Granor Passi
(Pty) Ltd who are involved in the production of formulations of the company's own
juices. They are involved in evaluating the taste profiles of the company's own
products before sale to their customers, and gave the author assistance in this
capacrty when selecting flavours.
Consequently, it was decided to focus only on formulating with Kei apple juice and a
de-ionized apple juice, which had no acidity, for the rest of the development work.
Two formulations were arrived at, which are shown in table 3.1.
Table 3.1 Final formulatiins for Kei apple juice for he Kei apples harvested at Bloernhof
--
Kei apple juice 12" B " De-ionized apple 12"B Sodium benzoate (preservative) Potassium sorbate (preservative) Sodium carboxymethyl cellulose (stabilizer) Guar gum (thickener) ' Sodium citrate (buffer) . - K@Y
(weigm for (weight for weight)
0.01 0.01 0.01
0.04 0.04 0.10 0.10 0.04 0.04
aercentage of Kei apple juice a = pulp Kei apple juice b r deionized apple juice (Southern Canned Products, Cape Town) c and d =sodium benzoate and potassium sorbate (Savannah Fine Chemicals. Germany) e - sodium carboxymethyl oellulcse (Emulsion b.v. Holland) f 2 guar gum (C.J. Petrow, Cape Town) g = sodium cltrate (Savannah Fine Chemicah, Germany) --- --
Chapter 3 --
Throughout the formulatory work, the following additives were used: de-ionized
apple juice, sodium benzoate, potassium sorbate, sodium carboxymethyl cellulose,
guar gum and sodium citrate. De-ionized apple is a concentrated apple juice that
has been through an ion-exchanger, reduced in acidity and therefore contains very
little malic acid. It is supplied by Southern Canned Products, Cape Town, South
Africa. Sodium benzoate and potassium sorbate are preservatives (chapter 2:59).
supplied by Savannah Fine Chemicals, Germany. Sodium carboxymethyl cellulose
is used as a stabilizer to prevent the juice from separating and is supplied by
Emulsion b.v. Holland. Guar gum is a thickener obtained from C.J. Petrow. Cape
Town, South Africa. Sodium citrate is a buffer obtained from Savannah Fine
Chemicals, Germany. Therefore, for simplicdy's sake, the use of the chemical name
only will be made in the rest of this section of the formulatory work.
Two litres of product were made up at a time in the laboratory. De-ionized apple
juice was added to a 5 lire plastic beaker (with a small amount retained for later use)
and the guar gum thickener (pre-mixed with a small amount of sucrose) was added
into the vortex of a high speed stirrer (Heidolph 048H. Germany) to prevent the
formation of lumps. Sodium carboxymethyl cellulose, sodium citrate, potassium
sorbate and sodium benzoate were pre-mixed in the retained de-ionized apple juice,
added to the beaker and stirred until homogenous. Finally, the Kei apple juice was
added. A final Brix level of 12.0' was achieved. A Mettkr Toledo PB3002
(Switzerland) laboratory balance was used to perform any weighings through the
experiment.
The natural flavour and aroma of the Kei apple juice was palatable but was improved
by the addition of manufactured flavours (artif~ial and natural). All these flavours
were from internationally recognized flavour houses, globally represented, who have
expertise in flavouring all types of foods. However, they wee not approached
individually at this stage in the development work. The flavours were those used in
Granor Passi (Pty) Ltd formulations or were flavours that had been presented to
Granor Passi (Ply) Ltd for potential use in the development work. For proprietary
reasons, it is not possible to disclose which of these flavours, if any, are currently
being used commercially by Granor Passi (Pty) Ltd in their commercial formulations.
Several flavours were tried in the laboratory, i.e. ki, grapefruit, passion fruit, violet,
plum, mixed fruit and pear. Finally, three flavours were chosen - Apple (mixture of
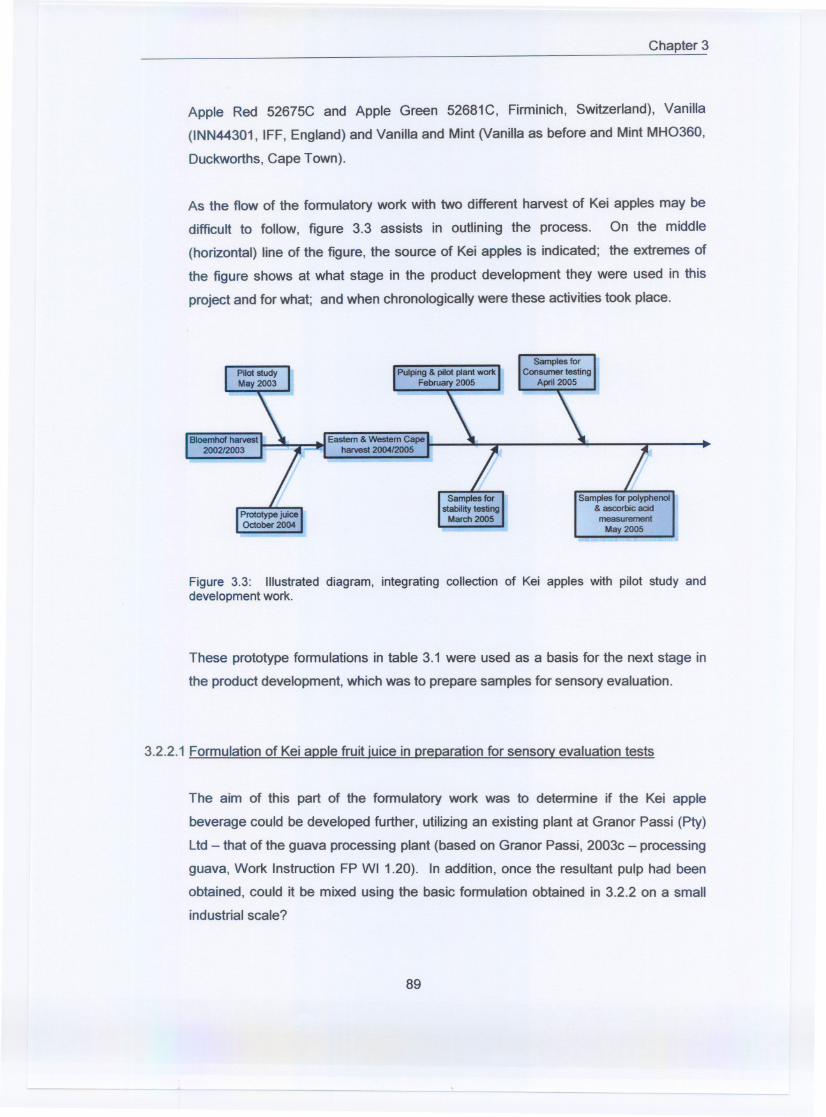
Chapter 3
Apple Red 52675C and Apple Green 52681C, Firminich, Switzerland), Vanilla
(INN44301, IFF, England) and Vanilla and Mint (Vanilla as before and Mint MH0360,
Duckworths, Cape Town).
As the flow of the formulatory work with two different harvest of Kei apples may be
difficult to follow, figure 3.3 assists in outlining the process. On the middle
(horizontal) line of the figure, the source of Kei apples is indicated; the extremes of
the figure shows at what stage in the product development they were used in this
project and for what; and when chronologically were these activities took place.
Eastern & Western Capeh8lWst 2004/2005
Samples for poIyphenol& ascorbic acid
measurement
May 2005
Figure 3.3: Illustrated diagram, integrating collection of Kei apples with pilot study anddevelopment work.
These prototype formulations in table 3.1 were used as a basis for the next stage in
the product development, which was to prepare samples for sensory evaluation.
3.2.2.1 Formulation of Kei aDDlefruit iuice in DreDarationfor sensory evaluation tests
The aim of this part of the formulatory work was to determine if the Kei apple
beverage could be developed further, utilizing an existing plant at Granor Passi (Pty)
Ltd - that of the guava processing plant (based on Granor Passi, 2003c - processing
guava, Work Instruction FP WI 1.20). In addition, once the resultant pulp had been
obtained, could it be mixed using the basic formulation obtained in 3.2.2 on a small
industrial scale?
89
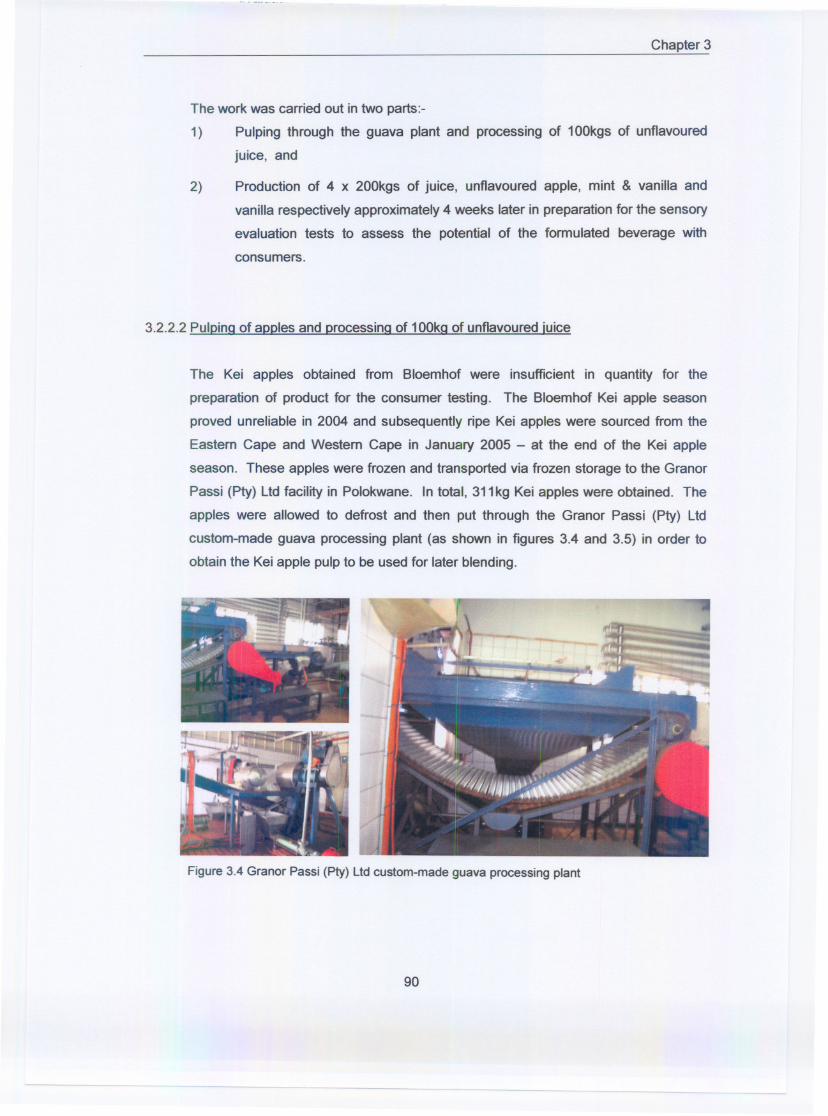
Chapter 3
The work was carried out in two parts:-
1) Pulping through the guava plant and processing of 100kgs of unflavoured
juice, and
2) Production of 4 x 200kgs of juice, unflavoured apple, mint & vanilla and
vanilla respectively approximately 4 weeks later in preparation for the sensory
evaluation tests to assess the potential of the formulated beverage with
consumers.
3.2.2.2 PulDina of aDDlesand Drocessina of 100ka of unflavoured iuice
The Kei apples obtained from Bloemhof were insuffICient in quantity for the
preparation of product for the consumer testing. The Bloemhof Kei apple season
proved unreliable in 2004 and subsequently ripe Kei apples were sourced from the
Eastern Cape and Western Cape in January 2005 - at the end of the Kei apple
season. These apples were frozen and transported via frozen storage to the Granor
Passi (Pty) Ltd facility in Polokwane. In total, 311kg Kei apples were obtained. The
apples were allowed to defrost and then put through the Granor Passi (Pty) Ltd
custom-made guava processing plant (as shown in figures 3.4 and 3.5) in order to
obtain the Kei apple pulp to be used for later blending.
--~- .
... .. I~ . ;,,~,~
J~ ~....:... ..
--
"..
Figure 3.4 Granor Passi (Pty) Ltd custom-made guava processing plant
90
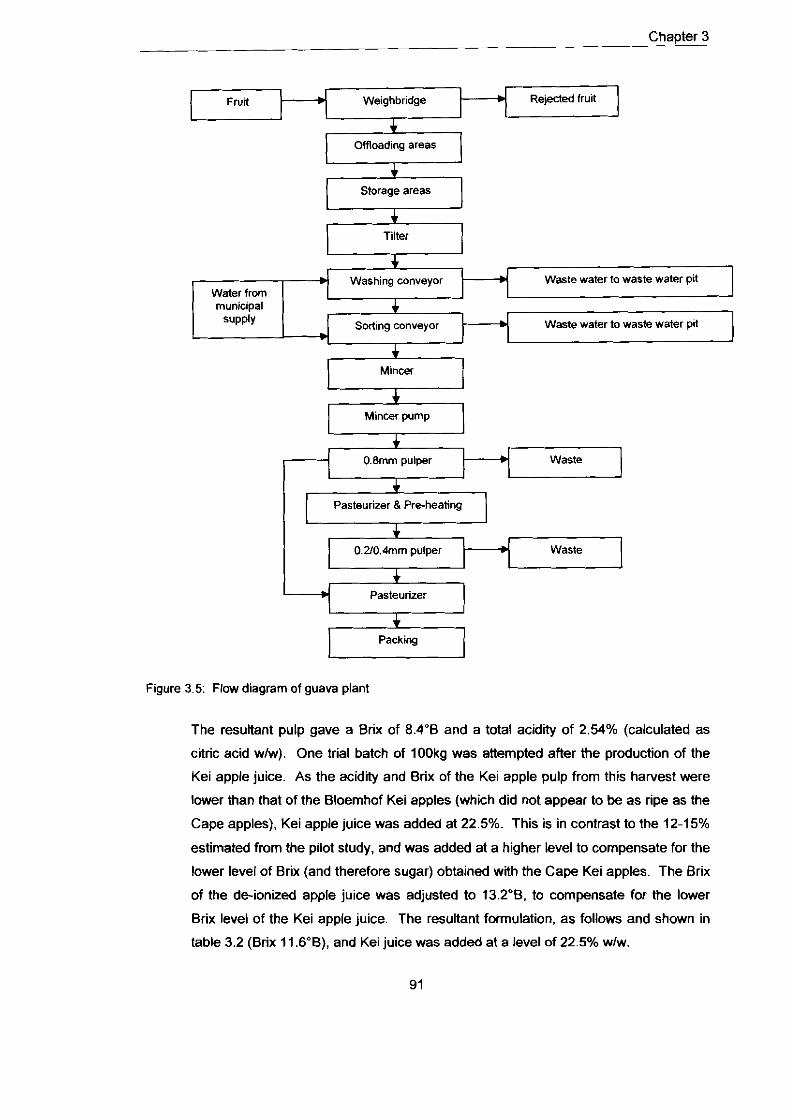
Chapter 3
ashmg conveyor
Figure 3.5: Flow diagram of guava plant
The resultant pulp gave a Brix of 8.4'6 and a total acidrty of 2.54% (calculated as
citric acid wM). One trial batch of lOOkg was attempted after the production of the
Kei apple juice. As the acidlty and Brix of the Kei apple pulp from this hawest were
lower than that of the Bloemhof Kei apples (which did not appear to be as ripe as the
Cape apples), Kei apple juice was added at 22.5%. This is in contrast to the 12.15%
estimated from the pilot study, and was added at a higher level to compensate for the
lower level of Brix (and therefore sugar) obtained with the Cape Kei apples. The Brix
of the de-ionized apple juice was adjusted to 13.2"B. to compensate for the lowel
Brix level of the Kei apple juice. The resultant formulation, as follows and shown in
table 3.2 (Brix 11.6%), and Kei juice was added at a level of 22.5% wlw.
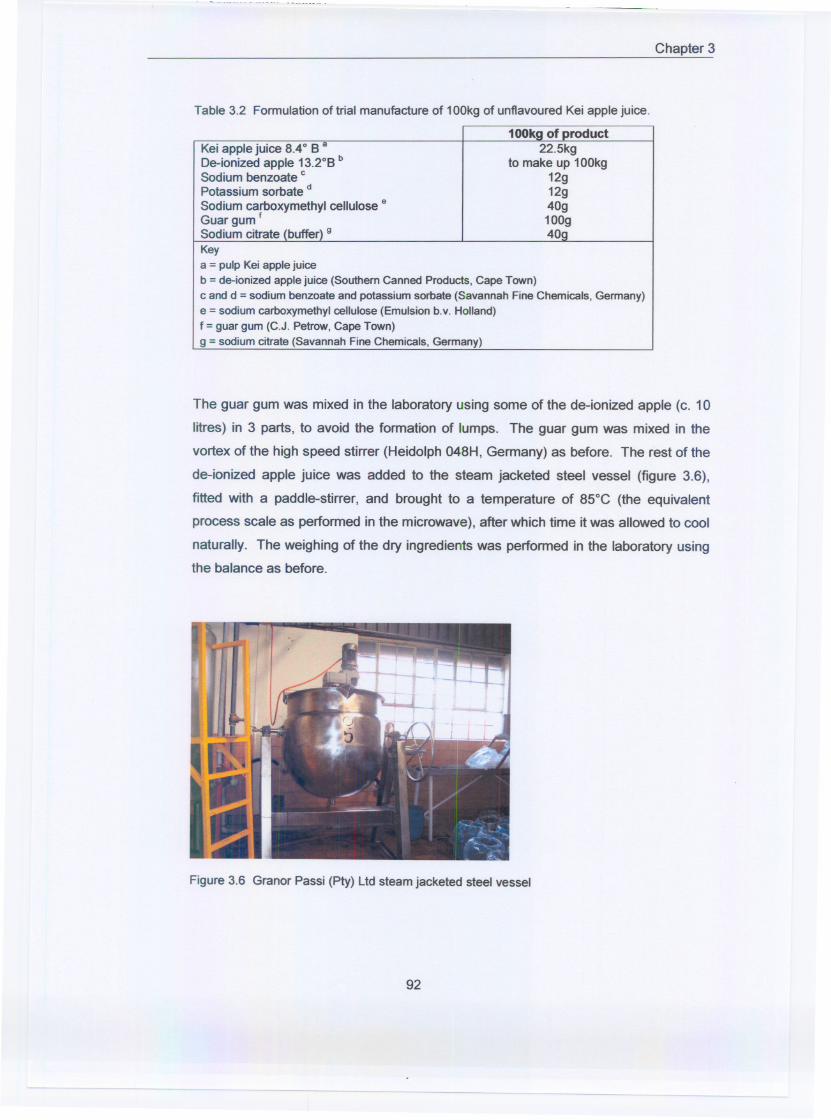
Chapter 3
Table 3.2 Formulation of trial manufacture of 100kg of unflavoured Kei apple juice.
100kg of product22.5kg
to make up 100kg12g12g40g100g40
Kei apple juice 8.4° B 1r
De-ionized apple 13.2°B b
SodiumbenzoateC
Potassium sorbate d
Sodiumcarboxymethylcellulosee
GuargumfSodiumcitrate(buffer\9
Key
a = pulp Kei apple juice
b = de-ionized apple juice (Southern Canned Products, Cape Town)
c and d = sodium benzoate and potassium sorbate (Savannah Fine Chemicals, Germany)
e = sodium carboxymethyl cellulose (Emulsion b.v. Holland)
f = guar gum (C.J. Petrow, Cape Town)
g = sodium citrate (Savannah Fine Chemicals, Germany)
The guar gum was mixed in the laboratory using some of the de-ionized apple (c. 10
litres) in 3 parts, to avoid the formation of lumps. The guar gum was mixed in the
vortex of the high speed stirrer (Heidolph 048H, Germany) as before. The rest of the
de-ionized apple juice was added to the steam jacketed steel vessel (figure 3.6),
fitted with a paddle-stirrer, and brought to a temperature of 85°C (the equivalent
process scale as performed in the microwave), after which time it was allowed to cool
naturally. The weighing of the dry ingredients was performed in the laboratory usingthe balance as before.
Figure 3.6 Granor Passi (Pty) Ltd steam jacketed steel vessel
92
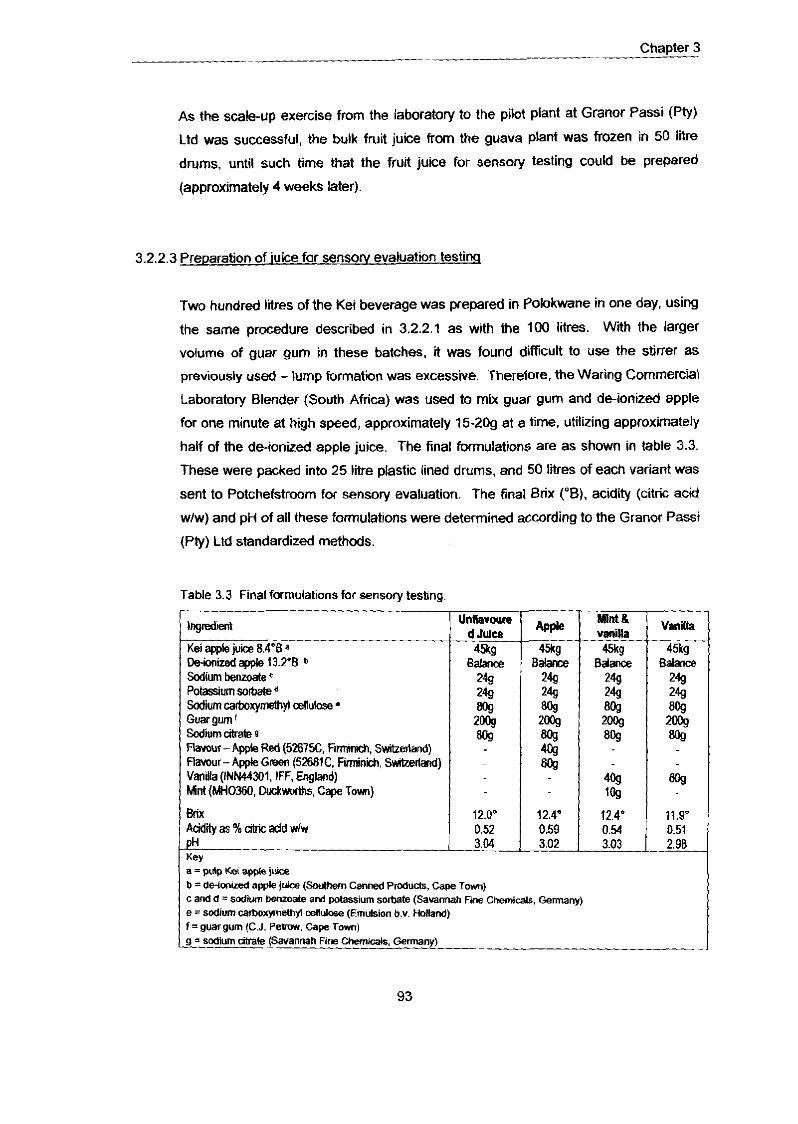
Chapter 3
As the scaleup exercise from the laboratory to the pilot plant at Granor Passi (b') Ltd was successful, the bulk fruit juice from the guava plant was frozen in 50 lire
drums, until such time that the fruit juice for sensory testing could be prepared
(approximately 4 weeks later).
3.2.2.3 Pre~aration of iuice for sensory evaluation testinq
Two hundred litres of the Kei beverage was prepared in Polokwane in one day, using
the same procedure described in 3.2.2.1 as with the 100 litres. Wih the larger
volume of guar gum in these batches, it was found difficult to use the stirrer as
previously used -lump formation was excessive. Therefore, the Waring Commercial
Laboratory Blender (South Africa) was used to mix guar gum and deionized apple
for one minute at high speed, approximately 15-209 at a time. utilizing approximately
half of the deionized apple juice. The final formulations are as shown in table 3.3.
These were packed into 25 litre plastic lined drums, and 50 lires of each variant was
sent to Potchefstroom for sensory evaluation. The final Brix ("B), acidity (citric acid
Wlw) and pH of all these formulations were determined according to the Granor Passi
(Pty) Ltd standardized methods.
Table 3.3 Final formulations for sensory testing
W i m carboxyrnethyi cellulase
Sodium &ale 9
Fbmur - Apple Red (52675C, Rmmd, Switzdand) Flavour- Apple Green (52681C. F i M e h , SWrlmd) Vanla (INW301. IFF, England) Mint (MHOW. Duckworths. Crpe Tow)
a=wnpWapplejeic4 b = deimind ap@e juks (SwVlem C a d PRxlucts, Cape T m ) C and d = sodium benzoate and potassium sorbate (Sauarmah F m Chemicals. Germany) e =sodium carbowethyl cellulase (EmuLsion b.v. HoNand) f = guargurn (C.J. P e h . Cap Town)
I g = sodium citrak (Savannah Fine Chemmls, Germany) 1
Chapter 3
3.3. Stab i l i Testing of Kei Fruit Beveraae
The aim of this part of the experimental work was to determine if the formulated
product would be able to attain a shelf life of four weeks at chilled storage 4-WC.
Samples of product were taken from the first factory scale up, as described in
3.2.2.1. Three separate litres of product were flavoured with 1) apple flavours, 2)
vanilla, 3) mint 8 vanilla respectively, at the levels given in the formulations in table
3.3. One litre of the beverage was left unflavoured. These were placed into 4 glass
bottles and submed to pasteurization at 85°C for 1 minute. The bottles were sealed
well, chilled to between 4°C and 8°C and then sent to Consulting Microbiological
Laboratories (Pty) Ltd (CML) for microbiological analysis, after 1, 7, 14, 21 and 28
days for total plate count, lactic acid bacteria, total coliforms, E.coli, moulds and
yeasts, using established microbiological tests.
All test methods used to determine the presence of and the quantity of micrcl.
organisms present as nationally and internally accepted test rnethods to determine
the presence of total microbial load and potential pathogenic and fruit juice spoilage
organisms. Discussion with CML and the author's previous experience resulted in
the test methods being adopted for a large food retail outlet in South Africa for 100%
fruit juice, namely Pick 'n Pay.
3.4. Consumer Testina of Kei Apple Beveraae
The aim of the consumer testing of the beverage was to determine the overall
acceptability of the product, preference, consumption intent and purchase intent. If
the results of this testing proved favourable, the beverage would have potential to be
taken further down the product development process.
3.4.1 Samples
The juice prepared at Granor Passi (Pty) Ltd in Polokwane as described in section
3.2.2.2. was transported via chilled transport to the Granor Passi (Pty) Ltd depot in
Kempton Park, in 25 litre containers Fifty (50) litres of each flavour (8 containers)
Chapter 3
were then transported by the author from Kempton Park to Potchefstroom for
consumer testing. It was decided, prior to the final consumer testing, that the
unflavoured juice would be excluded as this would increase the complexity of the
testing, and it was unlikely that the unflavoured juice would be progressed as a
commercial product as by itself as it was not thought to be palatable. At this stage, a
benchmark commercial prcduct was also excluded, as Were was very little on the
market locally or internationally that was similar, and the inclusion of another type of
functional drink like a probiotic orange juice, for example, would totally skew the
results.
3.4.2 Re~~ i tmen t of Participants
The participants for the consumer testing were recruited from the Potchefstroom
campus of the North West University. A notice was placed on the bulletin board of
the universtty's intranet, requesting volunteers. Volunteers were also sought from the
Administration, Physics, Consumer Science and Nutrition departments. Participants
were also asked to bring along as many individuals as possible. Participation was on
a strictly voluntary basis and it was requested that no smokers be involved. One
hundred and fifty volunteers took part in the test, of which forly one were men and
one hundred and eleven were women.
The participants were asked to fill in the Form A (Appendix 3) which gave
anonymous details of their age, gender, occupation, nutritional awareness and fruit
juice consumption. Fruit juice consumption figures, including nectars and blends,
were estimated at an average of 14 litres per person per annum (BMI Foodpack cc,
2002). This is equivalent to 270mls per week. Thus, a definition of a heavy user
(consumer) of fruii juice was taken as being light 2-3 months, moderate 1-2 weeks,
and heavy >3 times per week, given that a portion size is 250ml and fruit juice
consumption figures have risen since 2002 (chapter 2:16).
Chapter 3
3.4.4 Questionnaire
An adapted version of a pre-tested sensory evaluation questionnaire (Bosman. 1998)
was used, as shown in Form B of Appendix 3. This consisted of four questions.
Question 1 dean with overall acceptability, asking participants to rate, using a seven
point hedonic scale, the appearance, taste, texture and overall acceptance of the
beverages, where 1 = totally unacceptable and 7 =very acceptable.
Question 2 dealt with consumer preference regarding the samples and the
respondents were asked to make a choice indicating their order of preference.
Question 3 dealt with consumption intent for all three beverages and here a modified
Food Action Rating Scale (FACT) was used.
Question 4 was the final question which dealt with propenslty to purchase these
beverages. Again respondents were asked to ensure that they made a choice
between either yes or no.
3.4.5 Preparation of Samoles
All procedures were standardized and pre-tested on preparation, handling and
serving. In total, 12 tasting sessions were held for 5 days over a period of 2 weeks.
ranging from 1 participant to a maximum of 20 participants at any one time. One
hundred milli'ters of each coded beverage was served chilled at between 4°C and
S T , in a glass. Tap water at room temperature was sewed with each set of
beverages for participants to rinse their palates before and during the tasting
sessions.
3.4.6 Presentation of Samoles
The evaluation form (Appendix 3) was also explained in detail to each individual.
Participants were asked not to confer with one another during the evaluation or
afterwards, and to remain silent during the evaluations to avoid influencing other's
opinions. Participants were screened off from one another and were unable to view
Chapter 3
anyone else participating in the evaluation. The samples were presented to subjects
in balanced order so as to minimize order effects, being either 1) PTN, MLQ, then
VSH; 2) MLQ. VSH, then PTN: or 3) VSH. PTN, then MLQ; where PTN = apple;
MLQ = mint & vanilla; VSH = vanilla. Evaluation sessions lasted approximately 30
minutes each and were conducted under controlled conndiions in the taste panel
room and NWU, Potchefstmom. Each sample was evaluated once by each
partiipant. Each participant was thanked for their involvement and rewarded with
two small chocolates afterwards.
All consumers were welcomed upon arrival, seated and informed about the purpose
of the study. They were given the same instructions verbally (Appendix 2) before
commencing with the tasting. Before the evaluations commenced, all partiipants
were given background information on the beverage they were about to consume,
namely that it had been newly developed and may have some added nutritional
benefk. The beverages may aid in the reduction of degenerative diseases such as
heart disease and cancer and boost the immune system. They were asked to fill in
section A (Appendix 3), giving anonymous demographic details, and then complete
section B (Appendix 3) and evaluate the acceptability, preference, consumption and
purchase intent regarding the three samples. Participants were able to fill in sections
A and B in either Afrikaans or English, but all instructions were given in English. Five
individuals chose to complete the forms in English and 147 in Afrikaans.
3.4.8 Statistical Analvsis
Statisdiial analyses were performed with the Statistic& programme, version 7,
(w.statsoft.com). Demographic data of subjects were analysed using descriptive
statistics. Repeated measures ANOVA was used to determine if there were any
statistical differences between taste, appearance, texture and overall acceptance of
the different beverages for the different age, gender, occupation and fruit juice
consumption groups.
Chapter 3
Chi-square tests were done to determine if there was a statistical signifcant
relationship between preference and age, gender, occupation and fml juice
consumption. The same was done for purchase intent and age, gender, occupation
and fruit juice consumption.
Non-parametric tests were used for the variable consumption intent as evaluated on
a food actin rating scale, with unequal distances between categoiies. Mann-
Whiiney and KruskaN-Wallis tests were used to determine if age, gender, occupation
and fruit juice consumption had a statistical significant effect on consumption intent.
Practical significance was used to determine whether differences were large enough
to have an effect in practice. The practical significance (effect sue) for the following
questions was determined according to the following formulae.
Questions 1, 2 and 3 for the difference in average overall acceptance, preference
and consumption intent:
where T, - Z2 = difference in averages of respective samples and S,, is the maximum standard deviation between the two samples.
Question 4 - for the difference in proportions of consumers who intended to
purchase beverages:
I p ' where p, and p, are the respective proportions and d=mT, P = X' + X 2 , the average proportion with X, and X , the number of
n, + n2 respondees that intended to buy each beverage.
- Chapter 3
The following guidelines for the interpretation of the effect sizes are given (Ellis &
Steyn. 2003):
d = 0.2 = small effect; 0.5 = medium effect and 0.8 = large effect. Data with (I 2 0.8
are considered as practically significant, since ii is the result of a difference having a large effect.
When it is important to know whether a relationship between two variables are
practically signifcant, the effect size is given by w = &, where X 2 is the usual
Chi-square statistic for the contingency table and n is the sample size, see Ellis and
Steyn (2003). The following are guidelines for the interpretation of the above in the
current case:
(a) small effect: us = 0.1 . (b) medium effect: w = 0.3 , (c) large effect: w = 0.5
A rehtionship with w 2 0.5 is considered as practically significant.
3.5 Determination of Total Polvphenols
The concentration of total polyphenols in the Kei apple juice was measured by UV
spectrophotometry, based on a colorimetric oxidat'ion/reduction reaction. The
oxidizing agent used was FolinCiocalteu (Singleton 8. Rossi, 1965). The following
were analyzed: apple, mint plus vanilla and vanilla flavoured Kei apple juices, plus
unfiavoured and unpasteurized beverages. The Bloemhof pulp from 2003 and the
combined Eastern and Western Cape pulp from 2005 and a commercial product from
the United States, Cranberry Ocean Spray@, were also analyzed.
Ocean Spray@ is North America's leading producer of canned and bottled juices and
juice drinks, and has been the best selling brand name in this category since 1981
(http:llwww.oceanspray.com, 24/10/05). A product from Ocean Spray@ was chosen
as a benchmark to evaluate total polyphenols and ascorbic acid as this product is the
brand leader in 'functional beverages" as currently defined in the USA market. The
product is packed in a 500ml PET bottle and it is claimed by the manufacturer that "A
daily dose of Premium 100% Cranberry blend helps maintain urinary tract health.
There is no sugar added and one glass of Premium 100% juice counts as full serving
of fruit and provides 100% of the antioxidant vitamin C."
(hnp:lhrvww.oceanspray.com/ healthy-living/cranberryryhealth.asp, 23/10/05). The
Chapter 3
product is clear, astringent to the taste and was included in the evaluations for
comparison purposes. All the Kei apple products were centrifuged for 10 minutes at
1500rpm in a Hettich Universal 16R centrifuge and the supernatant used for analysis.
The Bloernhof pulp was diluted 200 times and the Cape 2005 pulp diluted 100 times
and the Ocean Spray@ product was diluted hvice.
Prior to analysis, a standard calibration curve was produced using gallic acid as a
standard to determine the concentration of total polyphenol (as gallic acid equivalent
GAEfl) in the samples.
Samples (200 microlitres) were introduced into test tubes followed by lml Folin-
Ciocalteu's reagent (Sigma, USA). This was allowed to stand for 8 minutes at room
temperature. Next, 0.8ml sodium carbonate (7,5%) was added, mixed and allowed
to stand for 30 minutes. Absorption was measured at 765nm (Shimadzu UV - 1601
Spectrophotometer, Japan). Total phenolic content was expressed as gallic acid
(Aldrich. USA) equivalents (GAE) in milligrams per litre (mgll). As total ascorbic acid
and sugars continue to respond to the Folin-Ciocalteu assay, corrections for these
were done (as described by Asami eta/.. 2003 and Slinkard 8 Singleton, 1977) and
total Brix analysis (Granor Passi (Pty) Ltd 2003). Mean values of polyphenol content
were expressed as gallic acid equivalents (WE) per litre standard deviation (n=3).
3.6 Determination of Ascorbic Acid
Ascorbate (ASC), dehydroascorbate (DHA), and total ascorbate (ASC + DHA)
concentrations were determined in the fruit juices spectrophotometrically at 578 nm
(UVIKON XX double beam spectrophotometer) using a method described by Beutler
(1984). These measurements are necessary for not only the nutritional evaluation of
the juice but the correction of the polyphenol concentrations determined by the Folin
-Coicalteu assay. Mean values of ascorbate content were expressed as milligrams
per litre mgll t standard deviation (n=3), Sugar analyses were determined by Brix
(Granor Passi (Pty) Ltd, 2003b).
The methods and materials used to obtain or harvest the Kei apples from Bloernhof in
200212003 and subsequently from the Eastern and Western Cape in 200412005 were
described. The development of a pilot formulation was described, bulk pulping of the Cape

Chapter 3
apples and the development of three flavoured beverages for consumer testing and stability
testing were also described. Methods and materials utilized to analyse these final products
and the different harvests for total polyphenols as Gallic acid equivalents per litre (GAEII),
and ascorbic acid were finally described.
The results of these methods are now presented and discussed in chapter 4

Chapter 4 - ~-
CHAPTER 4
RESULTS AND DISCUSSION
Chapter 4
CHAPTER 4
RESULTS AND DISCUSSION
The results of the experimental work undertaken in chapter 3 will now be discussed and
interpreted.
4.1 Collection and Harvesting of Apples
Kei apples were collected in 200212003 from Bloemhof and used in the first half of
the formulatory work, whilst those collected from the Western and Eastern Cape in
200412005 were used in the final formulatory work, bulk manufacturing, consumer
testing and chemical analysis for total polyphenols and ascorbic acid The Kei
apples from the Western and Eastem Cape were found to be much riper than those
from Bloemhof and could even be tolerated on their own, although still extremely tart
and astringent, which was not the case for the Bloemhof apples. The Brix and
percentage acidity, calculated as citric acid, of the pulped Kei apples from Bloemhof
were found to be 16.3"B and 4.81% weight to weight respectively. The Brix and
percentage acidity, calculated as citric acid, of the combined Kei apples from the
Westem and Eastern Cape were 8.4'8 and 2.54%mm respectively.
This may possibly be due to several reasons. The Bloemhof apples ha~ested in
200212003 were smaller and less ripe than the Cape apples and thus may have had
less sugar and water content, leading to a greater respective Brix and acidrty content.
Many changes take place when fruits ripen (Ozawa et a/., 1987), leading to a loss in
astringency and potentially polyphenols. These authors also state that variety,
maturity and climate are known to influence the astringency of fruit and present
evidence suggesting that each fruit must be considered as a separate case rather
than there being an all-embracing explanation for the loss of astringency on ripening.
Monomeric flavonoid phenols are primariiy bitter, but as the molecular weight
increases upon polymerisation, astringency increases more rapidly than bitterness
(this is why a young red wine is often very bitter and astringent, while bitterness and
then astringency decreases in older wines) (Noble. 1994). Thus, it may be
postulated that the astringency that may have been experienced with the Bloemhof
apples could have been attributable to bittemess, whilst the riper Cape apples were
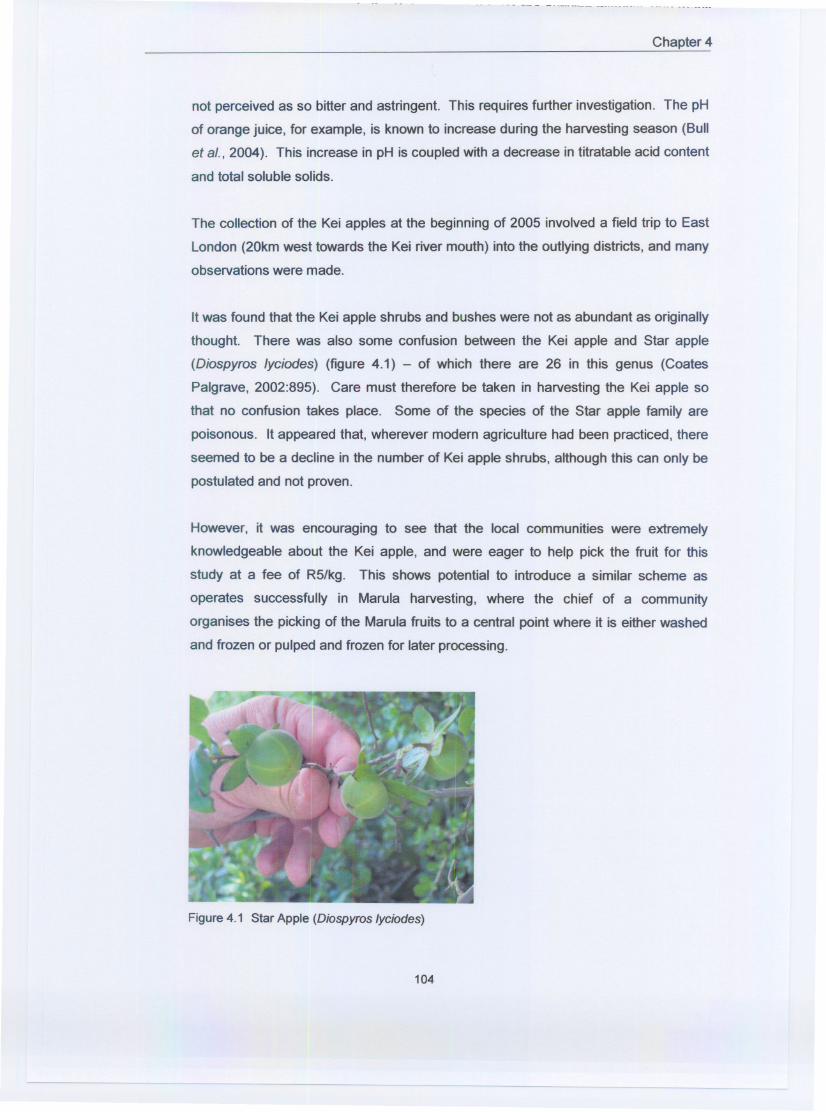
Chapter 4
not perceived as so bitter and astringent. This requires further investigation. The pH
of orange juice, for example, is known to increase during the harvesting season (Bull
et al., 2004). This increase in pH is coupled with a decrease in titratable acid content
and total soluble solids.
The collection of the Kei apples at the beginning of 2005 involved a field trip to East
London (20km west towards the Kei river mouth) into the outlying districts, and many
observations were made.
It was found that the Kei apple shrubs and bushes were not as abundant as originally
thought. There was also some confusion between the Kei apple and Star apple
(Diospyros Iyciodes) (figure 4.1) - of which there are 26 in this genus (Coates
Palgrave, 2002:895). Care must therefore be taken in harvesting the Kei apple so
that no confusion takes place. Some of the species of the Star apple family are
poisonous. It appeared that, wherever modern agriculture had been practiced, there
seemed to be a decline in the number of Kei apple shrubs, although this can only be
postulated and not proven.
However, it was encouraging to see that the local communities were extremely
knowledgeable about the Kei apple, and were eager to help pick the fruit for this
study at a fee of R5/kg. This shows potential to introduce a similar scheme as
operates successfully in Marula harvesting, where the chief of a community
organises the picking of the Marula fruits to a central point where it is either washed
and frozen or pulped and frozen for later processing.
104

Chapter 4
It was pointed out to the author by the locals that most of the Kei apples had already
passed their harvest time and that it was late to harvest fruit. Normally the shrubs
were abundant in their yield. It was also mentioned that there may be a second
(smaller) harvest of fruit after January, which has still to be established, although
Coates Palgrave (2002:763) indicate that fruit appears from November to January
only. It is possible that the exact timing of the harvest is unclear according to the
traditional text books and this would require further investigation.
The farming community seemed very optimistic towards planting Kei apple trees in
this, their natural habitat, if it were to provide proffi for them in the long run.
Table 4.1: Results of pilot preliminary tasting with Hanepoot white grape juice
I Average I Avenge I Average ' I
K = 10% Kei apple juice; L = 15% Kei apple juice; M = 25% Kei apple juice
averages are quoted only as questionnaires were misplaced and Standard Deviations could not be calculated
a 1 = dislike extremely; 9 = like extremely (refer to Appendix 1 for complete description)
I Extent of Acceptability. I Conrumption Intent b I PmpensitytoPurchax=
b 1 = would drink this every opportunity I had; 9 =would drink this only if I were forced to
K
c choice between definitely would purchase this product and definitely would not purchase this product ( I =would and 9 =would not)
The pilot sensory testing with the Kei apple juice as described in section 3.2,
indicated that levels of 15% juice using a steam distillation method could be tolerated
by consumers. However, the level of acid~ty in the Hanepoot white grape juice was
not taken into consideration and thus merely provided a simple stake in the ground to
start any formulatory work. After this, the idea of using the whole of the Kei apple
(pulped) was investigated and Granor Passi (Pty) Ltd became involved with the
project.
6.7 6.7 4.6
Chapter 4
The reason that pulped fruit was used as opposed to a steam distillation process was
that it would be much easier to utilise existing plant equipment. The distillation
process is more suitable for citrus fruit, whereas a pulping process is more suitable
for stoned fruits. Additionally, any polyphenols in the seeds of the Kei apple are
captured during the pulping process and are thus included in the fruit pulp.
The only Kei apples available were those from Bloemhof, ha~ested in 200212003
and these had been kept frozen and used in other experimental work at the North
West University (Potchefstrwm Campus). As stated in section 3.2.2, various other
juices were evaluated in combination with the Kei apple pulp. The % wlw (weight for
weight) acidrty of these juice concentrates by themselves is respectively (acidrty as
citric acid wlw) peach pulp ~4.0, banana pulp 0.3 - 0.5, apricot ~4 .5 , marula 0.4 - 0.8, and litchi 0.15 - 0.25. Apple juice concentrate has a maximum acidity of 1.4%
WIW as determined as malic acid (Granor Passi (Pty) Ltd, Polokwane). The South
African palate tolerates an acidrty level of not more than 0.5% wlw in a fruit juice
(Granor Passi (Pty) Ltd personal communication) if there is insufficient sugar.
Therefore it was felt, to gain the maximum benefit from any nutritional and economic
aspects of the Kei apple, that no other fruits should be included in the formulation as
the level of Kei apple added would have to be reduced to accommodate the acidity of
any other fruit added.
Further restrictions in formulating a fruit juice are placed by the South African
regulatins relating to the classification, packing and marking of fruit juices and drinks
intended for sale in the Republic of South Africa (GN R2286, 7 November 1980).
These regulations are very specific for the common fruits, for example, apple, apricot,
grape, granadilla, guava, pear, peach, pineapple and citrus. The contents of the
drink, be it a fresh juice, unsweetened, sweetened, a nectar or, if it is to be blended
with other fruits, should be specified precisely and must be declared on the label.
The goal of this formulatory work was to make this beverage as natural as feasible,
including as much of the Kei apple fruit as possible and achieving consumer
acceptance. Therefore, because the Kei apple is not a named fruit and falls under
the auspices of "other", the legislation was followed as tightly as possible to enable
the claim of a 100% fruit juice to be made. As stated, the acidity levels of the Kei
apple pulp and therefore the resultant ready-twlrink acidity levels in the juice are
high. It was necessary to sweeten the Kei apple with deionized apple juice. This is
-- --- Chapter 4 -
a product where most of the acidity (mainly malic) has been removed. However, the
claim that all the ingredients of the drink from fruii may be made, although it may be
argued that the formulated product could have been sweetened with sucrose. In
alignment with the regulations and the South African taste for sweeter products
(Givaudan presentation. 2004), the Brix of the final product was always taken to
12% The de-ionized apple is commonly used in the fruit processing industry when
the acidlty of the citrus fruits, e.g. orange, grapefruit, and naartjie 1 tangerine and
lemon is too high to be tolerated. This occurs when the acidity of the soil where the
citrus fruit is grown is high, or a shortage of water is experienced during the growing
seasons, and is a commonly accepted practice in the fruit juice industry globally
(Granor Passi (Pty) Ltd personal communication). It must be remembered that 100%
fruit juice rarely means 100% of the named fruits, as the base sweetener is usually
either deflavoured apple, pear or grape juice, and this has been accommodated for in
most global regulations including the South African ones.
To improve the acidity of the juice further, the addition of tri-sodium citrate at a level
of 0.1% wlw as a buffer was added. Informal taste testing in the laboratory (4
people, as mentioned in section 3.2.2, Methods and Materials) comparing the
product with and without tri-sodium citrate showed that the acidity levels were
reduced with the addition of the buffer. It was felt that because three of the tasters
(excluding the author) were experts in their fields, forrnulatoty work could proceed
with the tri-sodium citrate. Expert tasters are often used in their specific fields, for
example, wine (Solomon 1991:273), and tea, where an individual or groups of
individuals are so specialized in their field of expertise and have been trained in the
analytical tests and descriptive tests as described in chapter 2:71. Expert tasters are
used to eliminate (or narrow down the number of) products when there are too many
available for consumer testing.
To improve the stability of the formulation, sodium carboxymethyl cellulose was
added at 0.4% w h . This assisted in reducing the separation of the Kei apple pulp
from the resultant drink. The fruit juice was also thickened slightly by the addition of
guar gum. The idea of thickening the fruit juice was to give the consumer the feeling
of "fullness", improving their satiety. Mattes and Rothacker (2001) showed that
humans perceived drinks that were thicker to satisfy hunger better than drinks which
were thinner but of equal calories. This developed beverage is also aimed at
attracting consumers to drink one portion per day (no more) in an attempt to increase
Chapter 4 ---
their daily consumption of fruit and vegetables. It is therefore not necessarily aimed
at being "thirst quenching". McEwan and Cotwill (1996) found that viscosity was one
of the factors that were not associated with thirst quenching. lncreasing the level of
viscosrty of a solution has also been shown to decrease flavour and taste intensity,
and thus acidi i (Delwiche, 2004).
The additives used to improve the formulation have been confirmed by other
researchers. Peleg and Noble (1999) investigated the effect of viscosity,
temperature and pH on astringency in cranbeny juice. lncreasing pH of cranberry
juice had the largest effect of lowering astringency regardless of temperature or
viscosity. The role of viscosily in decreasing astringency has been speculated to
arise in part from the lubrication it contributes. As tannins precipitate salivary
proteins, lubrication effectiveness of saliva is diminished, resulting in the perception
of friction in the oral cavrty. Consistent with this, viscosrty of saliva has been shown
to decrease upon reaction with tannins. Perceived astringency is also reduced with
temperature, being due to either the decreased flow rate of saliva to cold solutions, or
the tannin protein interaction.
Lowering the level of acidity in the beverage also assists in consumer acceptability.
This was found by Jaeger et at. (2003) with research on the kiwifruit, who concluded
that consumer preference was determined primarily between the sugar-acid balance.
Siebert and Chassy (2003) found that the presence of acid in beverages affects the
perception of astringency as it was found that when acid was not present, the
interaction between salivary protein and salivary polyphenols is less intense and
therefore astringency was perceived to be less.
The aforementioned additives to the Kei juice pulp were made to give the resultant
ready-to-drink juice a perceived lower level of acidrty. However, the Kei apple itself
has a distinct smell of its own which requires either the consumer getting used to and
liking it for its uniqueness or masking it, using a masking agent such as a flavour I
aroma. The observations made during the trials with the Kei apple indicate that most
potential consumers found the aroma of the Kei apple strange and the researcher felt
that, if this product was to be marketed, initial purchase might be made but because
of the uniqueness of the aroma, repeat purchases may be difficult. It is well
documented that smell and taste are linked closely (Delwiche, 2004 and Meilgaard et
a / , 1999).
Chapter 4
Several flavours were considered for use, as discussed in section 3.2.2, but only the
apple, vanilla and mint 8 vanilla were found acceptable to be taken forward for final
testing with the consumer. Again, the tasting was performed in the laboratory with
the expert tasters to determine the flavours that were not found to be acceptable, or
mask the natural aroma of the Kei apple. Flavours play essential roles in the
production of a wider range of food products versatile in aroma to allow consumer
choices and to meet consumer needs. Therefore, flavour manufacturers require
expertise in flavour formulation, research and technical services, while the flavour
user need fundamental knowledge of flavour applications (Wu et al., 2002:233).
Consequently, at this stage of the development of the beverage (the fuzzy front end
of the new product development process), the use of existing flavours at Granor
Passi (Pty) Ltd were used and no help was sought from an external flavour house.
The next stage of the product development process is to fine-tune the flavour of the
beverage and would involve briefing a flavour company for assistance.
The fruit juice must also be fit for human consumption throughout its declared shelf
life. The product that was aimed for should be stable for 4 weeks under chilled
conditions. As mentioned in chapter 2:59, the principle of maintaining product
integrity is by heat preservation, chemical preservation or by a combination of both.
As this was a product of which there was no prior knowledge, it was decided to use a
mild pasteurization process (heat to 85°C and allow to cool slowly), combined with
the addition of the preservatives sodium benzoate and potassium sorbate at levels of
0.01% wlw, which is equivalent to IOOppm were made. Legislation - Food, Drugs
and Cosmetics Act of 1972 (Department of Health, South Africa. 2001) - allows
these preservatives to be present at levels not exceeding 300pprn.
4.3 Stabilitv of Kei Fruit Beveraae
Foods begin to lose their quality the moment they are harvested through changes
resulting from physical, chemical, enzymatic or microbiological reactions. Food
presewation prevents these deteriorative reactions, extending a food's shelf life and
assuring its safety. Micrc-organisms and enzymes are the main agents responsible
for fwd spoilage and therefore the targets of preservation techniques.
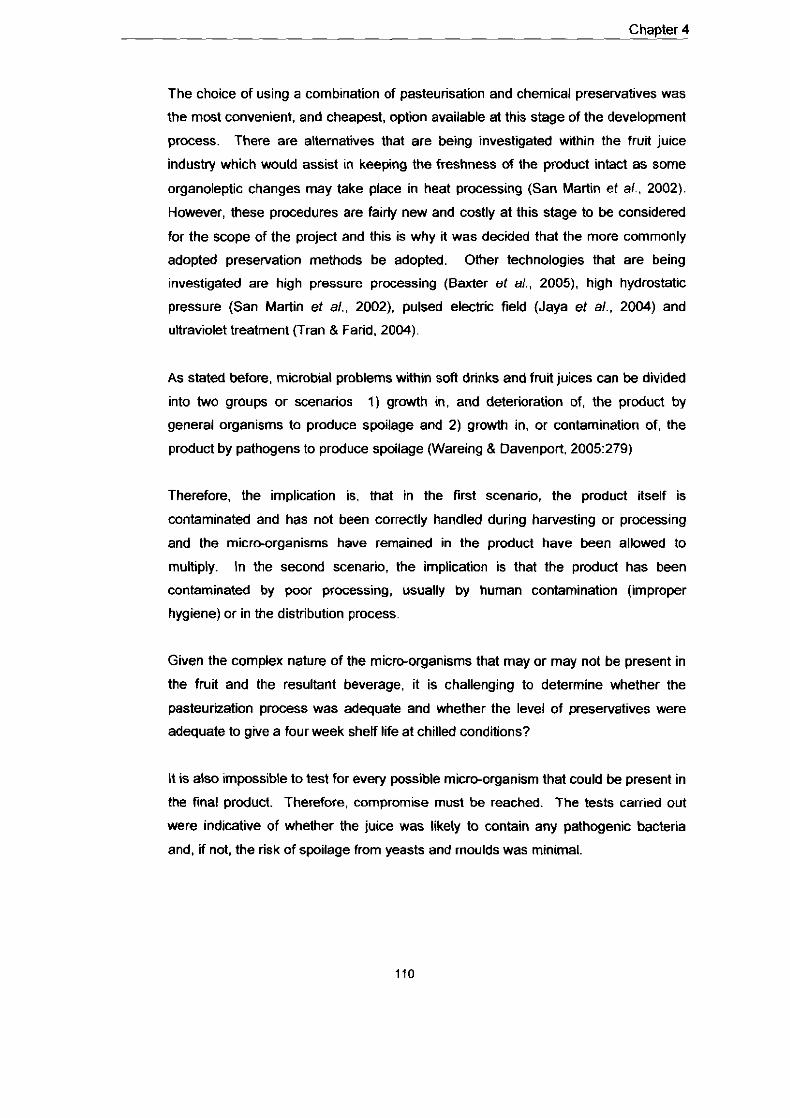
Chapter 4
The choice of using a combination of pasteurisation and chemical preservatives was
the most convenient, and cheapest, option available at this stage of the development
process. There are alternatives that are being investigated within the fruit juice
industry which would assist in keeping the freshness of the product intact as some
organoleptic changes may take place in heat processing (San Martin et a/.. 2002).
However, these procedures are fairly new and costly at this stage to be considered
for the scope of the project and this is why it was decided that the more commonly
adopted preservation methods be adopted. Other technologies that are being
investigated are high pressure processing (Baxter et al., 2005), high hydrostatic
pressure (San Martin et a/., 2002). pulsed electric field (Jaya et a/.. 2004) and
ultraviolet treatment (Tran & Farid, 2004).
As stated before, microbial problems within sofl drinks and fruit juices can be divided
into two groups or scenarios 1) growth in, and deterioration of, the product by
general organisms to produce spoilage and 2) growth in, or contamination of, the
product by pathogens to produce spoilage (Wareing & Davenport. 2005:279)
Therefore, the implication is, that in the first scenario, the product itself is
contaminated and has not been correctly handled during harvesting or processing
and the micro-organisms have remained in the product have been allowed to
multiply. In the second scenario, the implication is that the product has been
contaminated by poor processing, usually by human contamination (improper
hygiene) or in the distribution process.
Given the complex nature of the micro-organisms that may or may not be present in
the fruit and the resultant beverage, it is challenging to determine whether the
pasteurization process was adequate and whether the level of preservatives were
adequate to give a four week shelf life at chilled conditions?
It is also impossible to test for every possible micro-organism that could be present in
the final product. Therefore, compromise must be reached. The tests carried out
were indicative of whether the juice was likely to contain any pathogenic bacteria
and, if not, the risk of spoilage from yeasts and moulds was minimal.
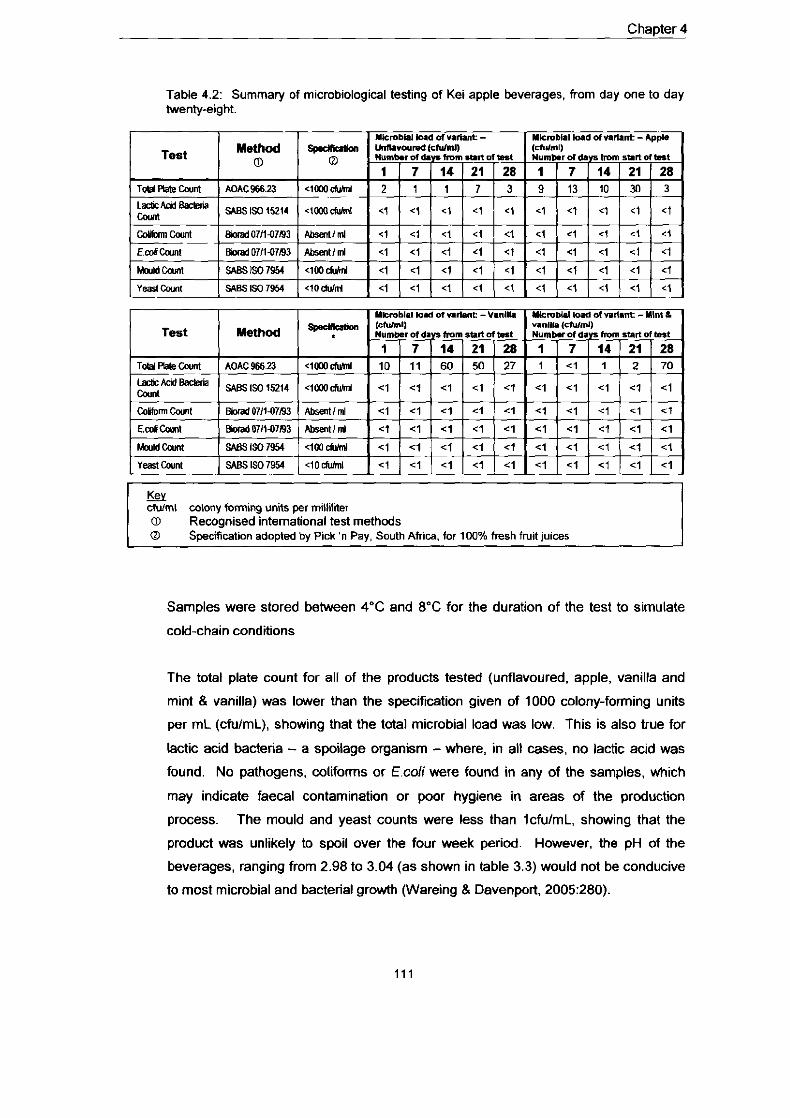
Chapter 4
Table 4.2: Summary of microbiological testing of Kei apple beverages, from day one to day twenty-eight.
I !kY cfulml colony forming units per milliliter
Test
T d d F ' d e h n l
Recognised ~nternatlonal test methods I O S~eclficaloon adoDted DV Pick n Pav South Ahlca. for 100% fresh fruit lums
Samples were stored between 4°C and 8°C for the duration of the test to simulate
cold-chain conditions
Method 0
AOAC966.23
The total plate count for all of the products tested (unflavoured, apple, vanilla and
mint 8 vanilla) was lower than the specification given of 1000 colony-forming units
per mL (cfulmL), showing that the total microbial load was low. This is also true for
lactic acid bacteria - a spoilage organism - where, in all cases, no lactic acid was
found. No pathogens, colifons or E.coli were found in any of the samples, which
may indicate faecal contamination or poor hygiene in areas of the productin
process. The mould and yeast counts were less than IcfulmL, showing that the
product was unlikely to spoil over the four week period. However, the pH of the
beverages. ranging from 2.98 to 3.04 (as shown in table 3.3) would not be conducive
to most microbial and bacterial growth (Wareing 8 Davenport, 2005:280).
. . @eakabm
@
aMO&dd
ulfi.rwndCNmll W m b . r m d r y s f m m . p l t m h . t
1 1 7 ( 1 4 ) 2 1 1 2 8 2 1 1 I 1 1 7 1 3
laurmll NumMroldryshDm smItmh.1
1 1 7 1 1 4 1 2 1 1 2 8 9 I 1 3 1 1 0 130 1 3
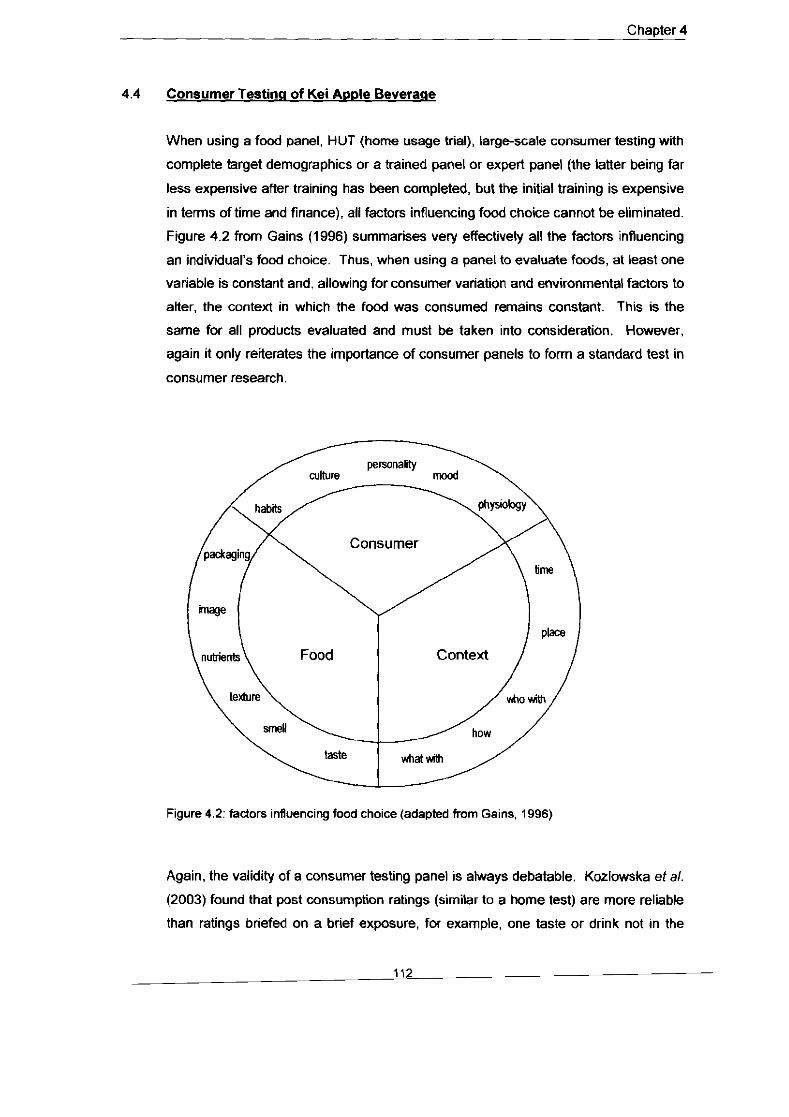
Chapter 4
4.4 Consumer Testing of Kei Apple Beveraqe
When using a food panel. HUT (home usage trial), large-scale consumer testing with
complete target demographics or a trained panel or expert panel (the latter being far
less expensive after training has been completed, but the initial training is expensive
in terms of time and finance), all factors influencing food choice cannot be eliminated.
Figure 4.2 from Gains (1996) summarises very effectively all the factors influencing
an individual's food choice. Thus, when using a panel to evaluate foods, at least one
variable is constant and, allowing for consumer variation and environmental factors to
alter, the context in which the food was consumed remains constant. This is the
same for all products evaluated and must be taken into consideration. However,
again it only reiterates the importance of consumer panels to form a standard test in
consumer research.
Figure 4.2: fadors influencing food choice (adapted from Gains. 1996)
Again, the validity of a consumer testing panel is ahvays debatable. Kozlowska et a/.
(2003) found that post consumption ratings (similar to a home test) are more reliable
than ratings briefed on a brief exposure, for example, one taste or drink not in the
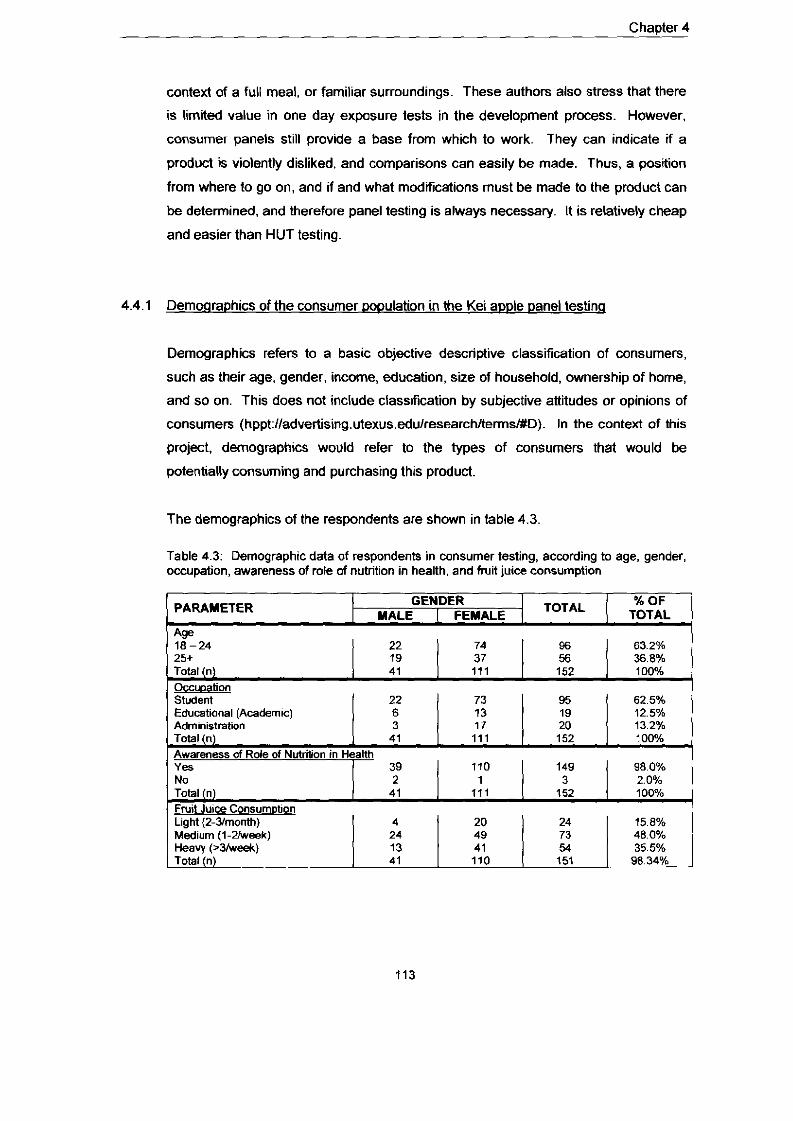
Chapter 4
context of a full meal, or familiar surroundings. These authors also stress that there
is limited value in one day exposure tests in the development process. However.
consumer panels still provide a base from which to work. They can indicate if a
product is violently disliked, and comparisons can easily be made. Thus, a position
from where to go on, and if and what modifications must be made to the product can
be determined, and therefore panel testing is always necessaly. It is relatively cheap
and easier than HUT testing.
4.4.1 Demwravhics of the consumer wpulation in the Kei a ~ ~ l e panel testinq
Demographics refers to a basic objective descriptive classification of consumers,
such as their age, gender, income, education, she of household, ownership of home,
and so on. This does not include classification by subjective attitudes or opinions of
consumers (hppt:lladvertising.utexus.edulresearch/D). In the context of this
project, demographics would refer to the types of consumers that would be
potentially consuming and purchasing this product.
The demographics of the respondents are shown in table 4.3
Table 4.3: Demographic data of respondents in consumer testing, according to age, gender, occupation, awareness of role of nutrition in health, and fruit juice consumption
PARAMETER
18-24 25+ Total (n)
A!ae
GENDER TOTAL YALE I FEMALE
I Heavy (~3keek ) Total (n)
% OF TOTAL
22 19 41
-tion Studen. - ~ ~ ~ -. .~~ - ~
13 41
74 37 111
Educational (Academic) Administration Total (n)
41 110
96 56 152
6 3 41
63.2% 36.8% 100%
Awareness of Role of NutriGion in Heanh
5.1 151
13 17 111
Yes No
35 5% 9834%
39 110 98.0% 2 1 1 1 l:9 1 2.0%
19 20 152
3 Fruit Juice Cc
12.5% 13.2% 100%
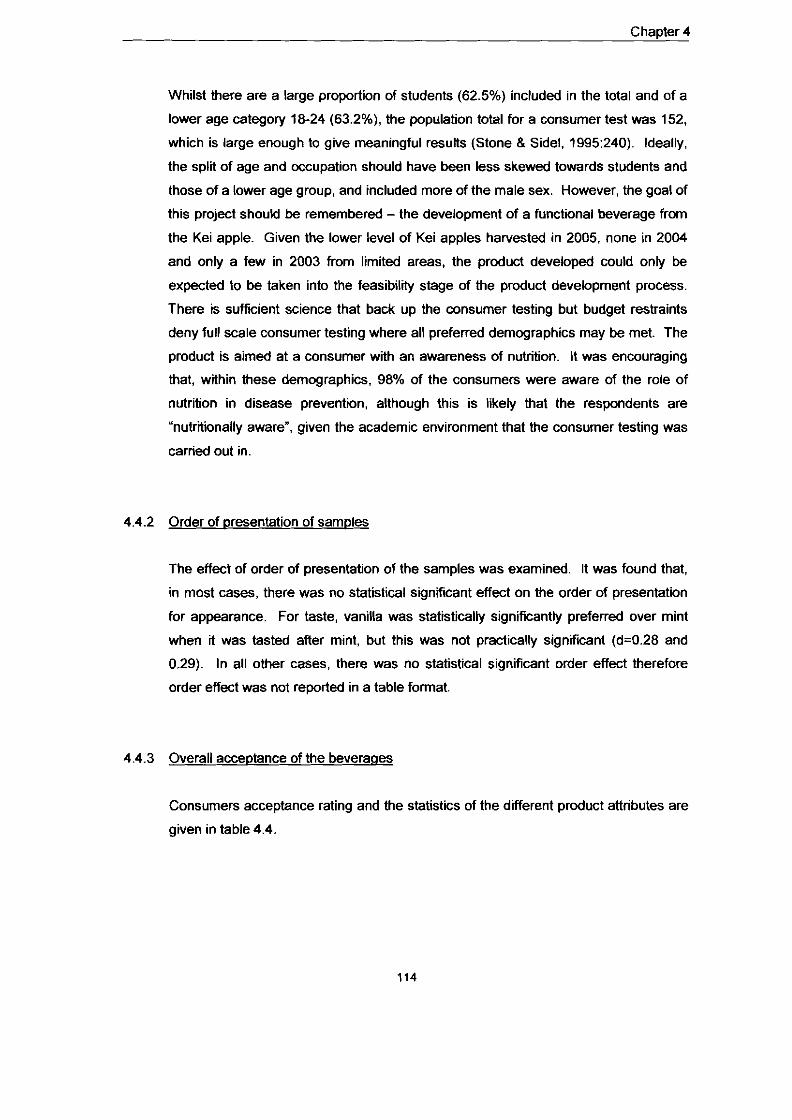
Chapter 4
Whilst there are a large proportion of students (62.5%) included in the total and of a
lower age category 18-24 (63.2%), the population total for a consumer test was 152.
which is large enough to give meaningful results (Stone & Sidel, 1995:240). Ideally,
the split of age and occupation should have been less skewed towards students and
those of a lower age group, and included more of the male sex. However, the goal of
this project should be remembered - the development of a functional beverage from
the Kei apple. Given the lower level of Kei apples harvested in 2005. none in 2004
and only a few in 2003 from limited areas, the product developed could only be
expected to be taken into the feasibility stage of the product development process.
There is sufficient science that back up the consumer testing but budget restraints
deny full scale consumer testing where all preferred demographics may be met. The
product is aimed at a consumer with an awareness of nutrition. It was encouraging
that, within these demographics. 98% of the consumers were aware of the role of
nutrition in disease prevention, although this is likely that the respondents are
"nutitiinally aware", given the academic environment that the consumer testing was
carried out in.
4.4.2 Order of presentation of samples
The effect of order of presentation of the samples was examined. It was found that.
in most cases, there was no statistical significant effect on the order of presentation
for appearance. For taste, vanilla was statistically significantly preferred over mint
when it was tasted afler mint, but this was not practically signifant (d=0.28 and
0.29). In all other cases, there was no statistical significant order effect therefore
order effect was not reported in a table format.
4.4.3 Overall acce~tance of the beveraoes
Consumers acceptance rating and the statistics of the different product attributes are
given in table 4.4.
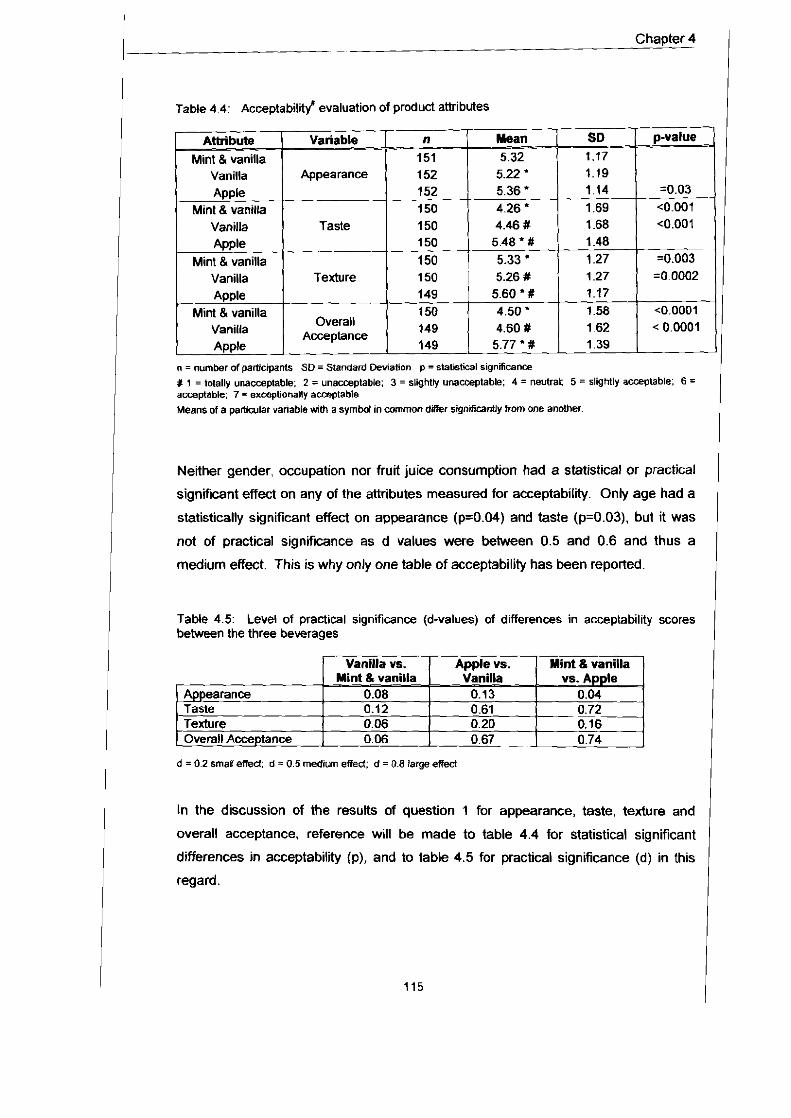
Chapter 4
Table 4 4- ~cce~tabilitf evaluation of product attributes
n = number of pamclpanls SO = Standard Deviation p = stat~siiil rignmcanoe t 1 =totally unacceptable; 2 = unacceptable: 3 = slightly unacceptable: 4 = neutral: 5 = slightly acceptable; 6 = I acceptable; 7 = exceptionally amptable Means of a palticular variable with a symbd in cnmmon diner signhntty hom one another.
Apple Mint & vanilla
Vanilla Apple
Mint & vanilla Vanilla Apple
Neither gender, occupation nor fruit juice consumption had a statistical or practical
significant effect on any of the attributes measured for acceptability. Only age had a
statistically significant effect on appearance (p=0.04) and taste (p=0.03), but it was
not of practical significance as d values were between 0.5 and 0.6 and thus a
medium effect. This is why only one table of acceptability has been reported.
Table 4.5: Level of practical significance (d-values) of differences in acceptability scores between the three beverages
Texture
-
Overall Acceptance
d = 0.2 smafl effed; d = 0.5 medium eWed: d = 0.8 large e m
In the discussion of the results of question 1 for appearance, taste, texture and
overall acceptance, reference will be made to table 4.4 for statistical significant
150
differences in acceptability (p), and to table 4.5 for practical significance (d) in this
regard.
5.48 ' 0 1.48 150 1 .27
1.27 1.17 1.56 1.62 1.39
5.33 ' =0.003 =00002
<0.0001 < 0.0001
150 1 5.26# 149 150 149 149
5.60 * x 4.50 ' 4.60 0
5.77 * #
Chapter 4
For appearance, there was a statistically significant difference in acceptability
between the apple and vanilla beverages (mean=5.36 and mean=5.22 respectively)
(p=0.03). However, this was not of practical significance (d=0.13).
For taste, there was a statistically signifmnt difference in acceptability (p<0.001)
between mint & vanilla (meaw4.26) and apple (mean=5.48). This difference was
also of a medium to large practical significance (d=0.72). There was also a
statistically significant difference (p<0.001) between vanilla (mean=4.46) and apple
(mean=5.48). This difference was of a medium practical significance (d=0.61).
There was no statistically signifcant difference between mint & vanilla and vanilla.
For texture, there was a statistically significant difference in acceptability (p=0.003)
between mint & vanilla (mean=5.33) and apple (mean 5.60), which was not of a
practical significance (d=0.16). There was a statistically significant difference
(p=0.0002) between vanilla (mean 5.26) and apple (mean=5.60), which was again
not of a practical significance (d=0.06). There was no statistically signifcant
difference between mint & vanilla and vanilla.
For overall acceptance, there was a statistically significant difference (p<0.0001)
between mint & vanilla (mean=4.50) and apple (mean=5.77). This difference was of
a medium to large practical significance (d=0.74). There was a statistically significant
difference (p<0.0001) between vanilla (mean=4.60) and apple (mean=5.77). This
difference was of a medium practical signifcance (d=0.67). There was no statistically
significant difference in overall acceptance between mint & vanilla and vanilla.
Overall, it can be concluded that there is no statistically significant difference
between the acceptabilrty or appearance or texture of the beverages, which is to be
expected as the only difference (unknown to the participants) was the flavour. The
difference in acceptability of taste and overall acceptance between apple and vanilla
was of statistically significant difference and of medium practical signifcance, while
the difference in acceptability of taste and overall acceptance between mint & vanilla
and apple, was of statistically significant difference, as well as of medium to large
practical significance.
Question 1 on acceptability demonstrates how the hedonic scales discussed in
chapter 2:74, can be used to translate consumers' perceptions about the product into
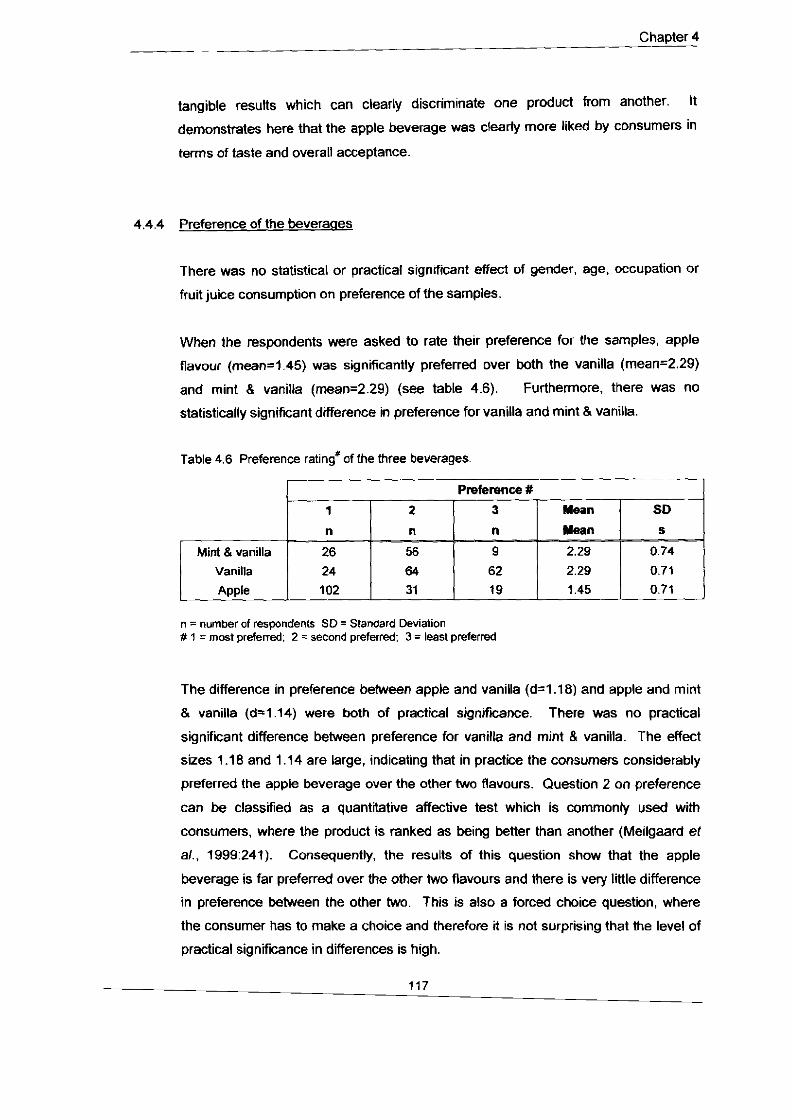
Chapter 4 -
tangible results which can clearly discriminate one product from another. It
demonstrates here that the apple beverage was clearly more liked by consurners in
terms of taste and overall acceptance.
4.4.4 Preference of the beveraaes
There was no statistical or practical signtcant effect of gender, age, occupation or
fruit juice consumption on preference of the samples.
When the respondents were asked to rate their preference for the samples, apple
flavour (mean=1.45) was significantly preferred over both the vanilla (mea~2.29)
and mint 8 vanilla (mean=2.29) (see table 4.6). Furthermore, there was no
statistically significant difference in preference for vanilla and mint 8 vanilla.
Table 4.6 Preference ratingX of the three beverages. -
n = number of respondents SD = Standard Deviation # 1 = most preferred; 2 = second preferred; 3 = least preferred
The difference in preference between apple and vanilla (64.18) and apple and mint
& vanilla (d-1.14) were both of practical signifmnce. There was no practical
significant difference between preference for vanilla and mint 8 vanilla. The effect
sizes 1 .I8 and 1.14 are large, indicating that in practice the consumers considerably
preferred the apple beverage over the other two flavours. Question 2 on preference
can be classified as a quantitative affective test which is commonly used with
consurners, where the product is ranked as being better than another (Meilgaard et
a/.. 1999241). Consequently, the results of this question show that the apple
beverage is far preferred over the other two flavours and there is very little difference
in preference between the other two. This is also a forced choice question, where
the consumer has to make a choice and therefore it is not surprising that the level of
practical signifmnce in differences is high.
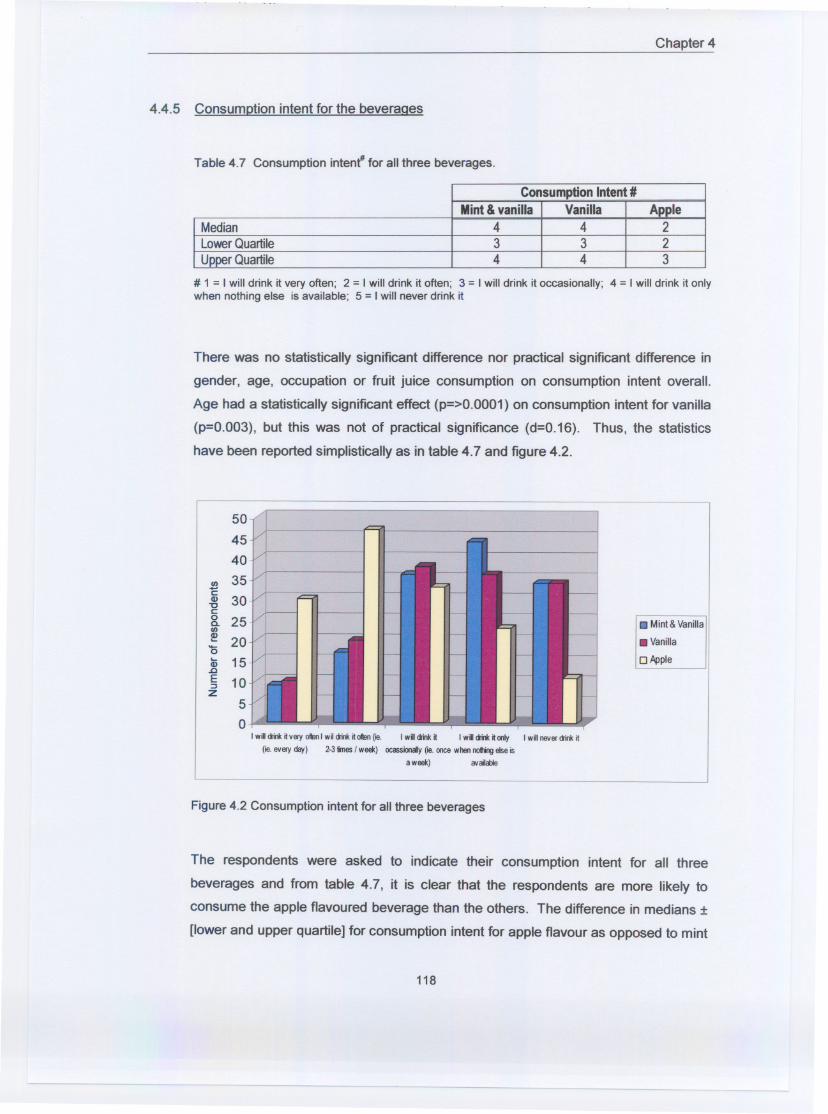
Chapter 4
4.4.5 ConsumDtion intent for the beveraaes
Table 4.7 Consumption intent' for all three beverages.
# 1 = I will drink it very often; 2 = I will drink it often; 3 = I will drink it occasionally; 4 = I will drink it onlywhen nothing else is available; 5 = I will never drink it
There was no statistically significant difference nor practical significant difference in
gender, age, occupation or fruit juice consumption on consumption intent overall.
Age had a statistically significant effect (p=>0.0001) on consumption intent for vanilla
(p=0.003), but this was not of practical significance (d=0.16). Thus, the statistics
have been reported simplistically as in table 4.7 and figure 4.2.
504540
f1I 35c~ 30.,c::8. 25f1I
~ 20'5Q) 15.c§ 10z
5
oIwi ctn<hery oIB1lwi ctn<itoIB1[18. I wi ctn<it Iwi ctn<itonly Iwi neverctn<it
(ie.fINeryday) 2-3imesI week) ocassionaly[18.oncewhennotirrdelseisa week) avaialile
. Mint& Vanilla
. VanillaO/>f>ple
Figure4.2 Consumptionintentfor all three beverages
The respondents were asked to indicate their consumption intent for all three
beverages and from table 4.7, it is clear that the respondents are more likely to
consume the apple flavoured beverage than the others. The difference in medians :f:
[lower and upper quartile] for consumption intent for apple flavour as opposed to mint
118
ConsumDtionlntent#Mint&vanilla Vanilla ADDie
Median 4 4 2LowerQuartile 3 3 2UDDerQuartile 4 4 3
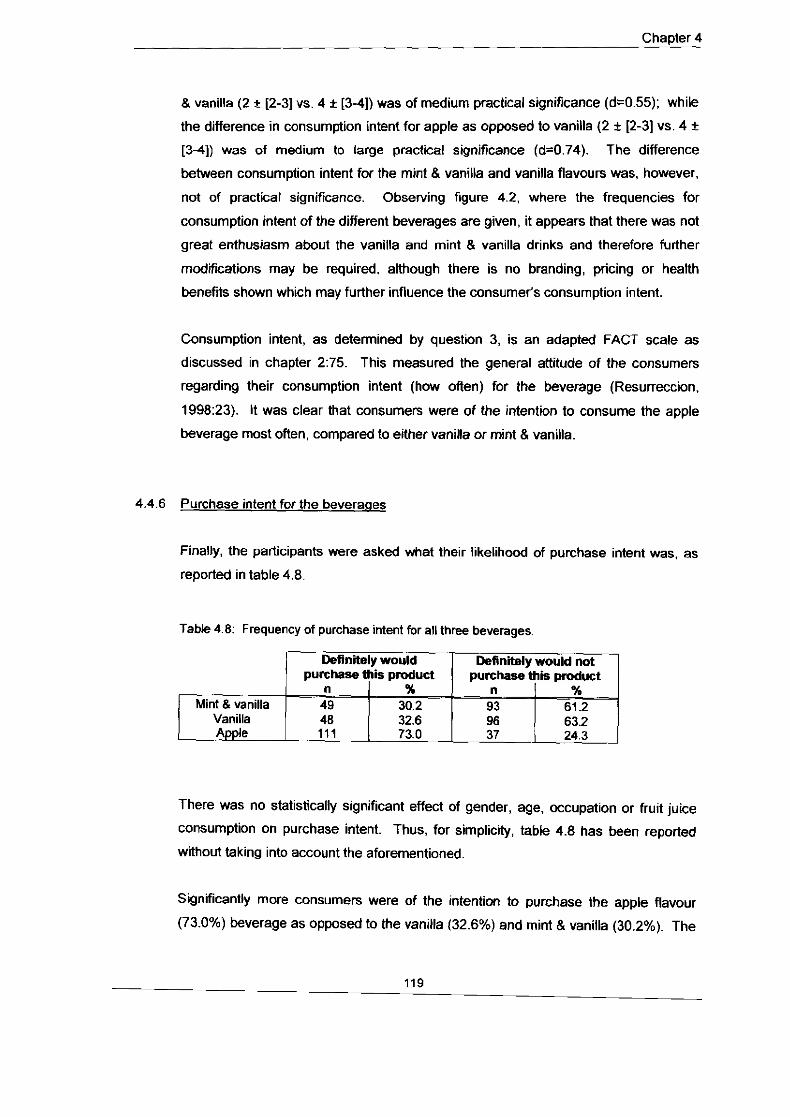
Chapter 4
8 vanilla (2 t [2-31 vs. 4 t [3-41) was of medium practical significance (d=0.55); while
the difference in consumption intent for apple as opposed to vanilla (2 f [2-31 vs. 4 f
[34]) was of medium to large practical significance (d=0.74). The difference
between consumption intent for the mint & vanilla and vanilla flavours was, however,
not of practical significance. Observing figure 4.2, where the frequencies for
consumption intent of the different beverages are given, it appears that there was not
great enthusiasm about the vanilla and mint 8 vanilla drinks and therefore further
modfiations may be required, although there is no branding, pricing or health
benefk shown which may further influence the consumer's consumption intent.
Consumption intent, as determined by question 3, is an adapted FACT scale as
discussed in chapter 2:75. This measured the general attitude of the consumers
regarding their consumption intent (how often) for the beverage (Resurreccion.
1998:23). It was clear that consumers were of the intention to consume the apple
beverage most often, compared to either vanilla or mint & vanilla.
4.4.6 Purchase intent for the beverages
Finally, the participants were asked what their likelihood of purchase intent was, as
reported in table 4.8.
Table 4.8: Frequency of purchase intent for all three beverages.
There was no statistically significant effect of gender, age, occupation or fruit juice
consumption on purchase intent. Thus, for sirnplictty, table 4.8 has been reported
without taking into account the aforementioned.
Significantly more consumers were of the intention to purchase the apple flavour
(73.0%) beverage as opposed to the vanilla (32.6%) and mint & vanilla (30.2%). The
Chapter 4
consumer's purchase intention was practically significantly higher for the apple when
compared to vanilla (d=0.81) and for the apple when compared to mint 8 vanilla
(d=0.86). The differences in purchase intent between vanilla and mint 8 vanilla was
very small (2.4%) and thus of no practical significance.
As with question 2 on preference for the beverages, this question is a forced choice
question which forces the respondent to make a choice. It is clear that there is an
overall skew towards the apple flavour and that this flavour has the most potential for
the future. Here, a clear indication from the respondents has been given that they
would purchase the apple beverage, and thus a correlation with liking the product
can obviously be made, although no other factors such as priiing and branding were
given, apart from the nutriitional benefits stated in the instructions in the panel testing.
The respondents were also requested to give their written opinions on the fruit juices.
These are shown in Appendix 4. Overall, the comments concur that the apple flavour
is preferred. However, there are some preferences for the mint 8 vanilla, and the
vanilla as first choice. The possibility of a polarized choice may exist, i.e. some
people show a real preference for the apple and intensely dislike the other two
flavours, whilst others show the reverse. Whilst formulating the product, it was
noticed that, if the product was served with ice, the preference for vanilla and mint 8
vanilla increased. However, this was on a very informal basis. What is clear is that
future work on the flavour and the flavour I product interactions would be necessary.
although at this stage it still seems that the apple flavour would be the direction to
follow. As with most commercial products, it may be possible to introduce several
flavours to the market at one time to see if one product flavour or "line" is successful
and then introduce other flavours as the product starts to be successful in the market
place.
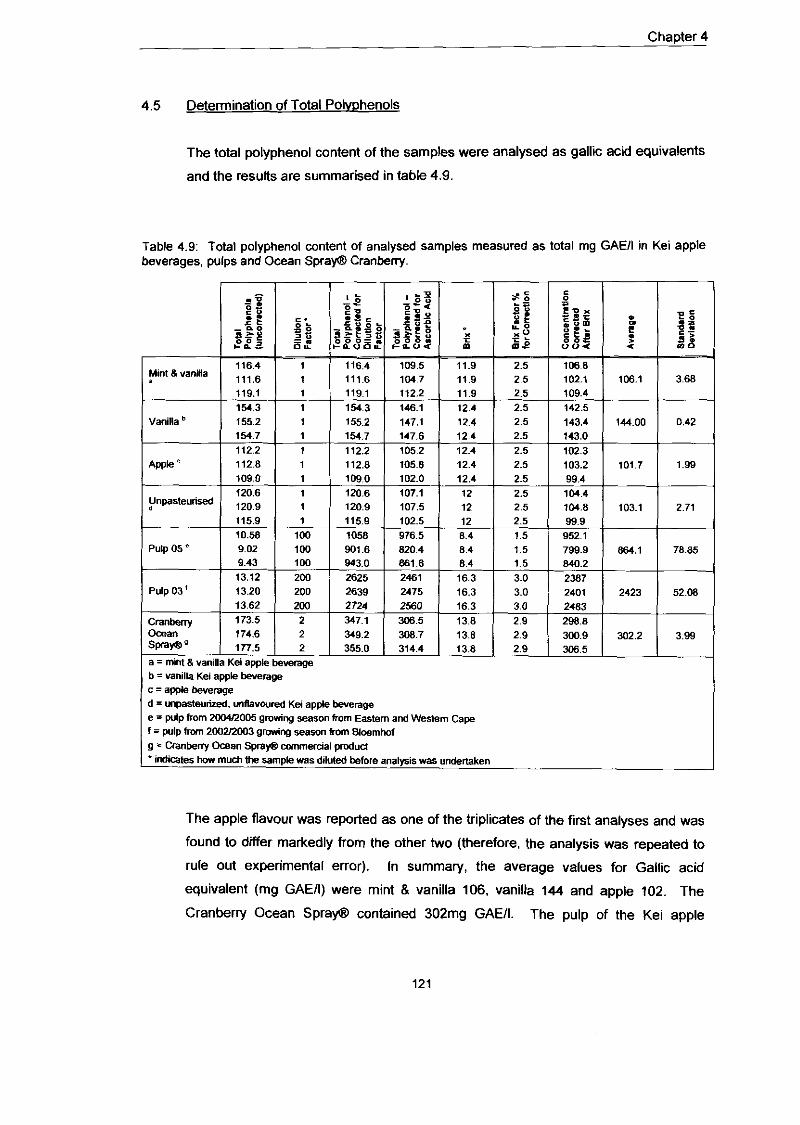
Chapter 4
4.5 Determination of Total P o l ~ ~ h e n o k
The total polyphenol content of the samples were analysed as gallic acid equivalents
and the resuits are summarised in table 4.9.
Table 4.9: Total polyphenol content of analysed samples measured as total mg GAEII in Kei apple beverages, pulps and Ocean Spray@ Cranberry.
Mint 8 vanla
Vanilla "
Apple '
Unpasteurised
Pulp 05 '
Pulp 03 '
Cranberry Ocean sprams a = mint 8 vani
. s z z : x = k - - 0 a r e t o p o l P
116.4 111.6 119.1 - 154.3 155.2 154.7 - 112.2 112.8 1090 - 120.6 120.9 115.9 - 10.58 9.02 9.43 - 13.12 13.20 13.62 - 173.5 174.6 1n.5 -
<ei appk b = vanilla Kei appk beverage c = apple beverage d = urpasteurired. unflavoured Kei apple beverage e = pulp from 20QU2005 gmmng season horn Eastern and Western C a p I = pllp horn 2WW2003 growing season kom Bloemhof 8 = Cranberry m a n Spra* mrnemal pmdud ' indicates how much Uw sample was diluted before analysis was undertaken
The apple flavour was reported as one of the triplicates of the first analyses and was
found to differ markedly from the other two (therefore, the analysis was repeated to
rule out experimental error). In summary, the average values for Gallic acid
equivalent (mg GAEII) were mint & vanilla 106. vanilla 144 and apple 102. The
Cranberry Ocean SprayfD contained 302mg GAEII. The pulp of the Kei apple
Chapter 4
harvested in 200412005 contained 864mg GAEII and the pulp of the 200212003
apples contained 2423mg GAEII.
It appears that the polyphenol content of the formulated Kei apple juice was greater
with the vanilla flavour. It is possible that the structure of the vanilla molecule (vanillic
acid) (Miller 8, Ruiz-Larrea, 2002) which contains a benzene ring, may have
interfered with the analysis causing an increase in the amount, although it is strange
that a pro-rata increase was not seen with the mint 8, vanilla (chapter 2:25). This
would need to be discussed with a flavour house if the development were to be taken
further. However, at this stage, as the vanilla was not liked by most of the
respondents in the consumer test, it would not be pursued as a flavour for the
beverage. The level of total polyphenols in the unpasteurized sample were 103mg
GAEII, indicating that pasteurisation of the juice did not appear to affect the level of
polyphenols.
There was a very large difference between the levels of polyphenols in the two pulps
which may be applicable to a variety of reasons. The fruits were of a different
ripeness, and this may have affected the astringency (and therefore total phenolics).
The fruits were grown in two different geographical areas, namely Bloemhof and the
Cape. The Eastern and Western Cape apples were combined before processing so
unfortunately no difference could be measured between these for total polyphenols.
However, both sets appeared ripe and juicier than those from Bloemhof. However, it
shouM be noted that this was an incidental observation and not the main aim of the
project, although at some stage variations in harvest should be investigated. Manach
et a/. (2004) state that environmental factors have a major effect on polyphenol
content. These factors may be pedro climatic (soil type, sun exposure, rainfall) or
agronomic (culture in greenhouses or fields, fruit yield per tree). They also state that
the degree of ripeness has a considerable effect on the flavonoids, and phenolic
acids generally decrease during ripening which ties in with the theory that the
astringency also decreases with ripening. Manach eta/. (2004) also state that there
can be marked differences in concentration of flavonoids between pieces of fruit on
the same tree because their biosynthesis is stimulated by sunlight.
Another key factor that would influence the content of the polyphenols in the pulp is
the processing of the fruit. In our particular situation, the Bloemhof apples were
Chapter 4
processed in the laboratory and sieved manually, whereas the Cape apples were
processed down the actual plant.
Wu el a/. (2004) indicate that sampling time during the year significantiy influenced
lipophilic andlor hydrophilic oxygen radical absorbance capaclty (ORAC) values in
some foods, and that to get an accurate total antioxidant capacity of a given food
both these values need to be taken into account. Food processing, such as cooking
and peeling also affects the values. Then again, it can be postulated that for total
polyphenol and ascorbic acid content of the Kei apple juices, a similar conclusion
may be reached. Yu eta/. (2004) compared wheat flours grown at different locations
for their antioxidant properties and found that the variety and growing location had a
significant influence on their free radical scavenging abilities against the stable 2.2-
diphenyl-I-picrylhyrazyl radical (DPPH) and 2,2-anino-di [3-ethyl-benz thiazoline
sulfonate] radical cation (ABTSt), and for Fez' chelating capacities and total phenolic
contents. If reference is made to table 2.8 (chapter2:49), the USDA database of
flavonoid content of foods, variations are apparent according to methodology, for
example, apples with and without skin. This is another factor leading to variability.
Studies with other fruits have demonstrated that processing has a huge influence on
the content of polyphenol and the total antioxidant activity (TAA) of the juice. The
use of an integrated membrane process to clarii and concentrate citrus and carrot
juices compared to the traditional thermal treatment by concentration via distillation
was investigated by Cassano et a/. (2003). It was found that TAA was lower with
thermal concentration than with membrane concentration technology (reverse
osmosis and uitra filtration) performed at room temperature. The juices concentrated
this way also retained their colour and a large part of their aroma.
Fruit juices on the market are generally constituted by two types of products: fresh
juices, obtained by simple squeezing and then submitted to mild pasteurization (with
the addition of preservatives), or juices reconstituted from concentrate. It is known
that the thermal treatment by pasteurization andlor thermal concentration produces
modifications of some components with consequent degeneration of taste and
chemical characteristics (Cassano et a/., 2003).
Eisele and Drake (2004) examined the partial compositional characteristics of apple
juice from 175 apple varieties, covering 12 countries and several USA geographical
Chapter 4
areas. Distribution of phenolics between the various varieties was highly variable,
with some juices containing little if any phenolic compounds. The mean values for
some of the attributes did not match existing compositional database value means
(malic acid and phenolics in particular), but some of the overall minimum and
maximum value for the various attributes ('B, pH, ash, total acidity (TA), sugars,
sodium and calcium) fitted in well with existing databases. This was a study carried
out with well known juice, namely apple, yet variability in the phenolics was found to
be either due to variety andlor climate, soil and growing conditions.
Shimoda et a/. (2003) investigated the influence of the thermal treatment on the
odours of appk juice by sensory evaluation. The odours of the apple juice changed
dramatically with the temperature and residence time during thermal treatment. Thus
it can be postulated that there are also chemical changes that are caused due to
changes in processing. Beecher (2003) states that the quercetin in onion is lost in
storage and this may be due to evaporation and the hydrophilic quercetin being lost
as the onion dries out. Marin et al. (2002) showed that the variety of lemon fruit
affects the level of flavonoids, while these researchers also examined different
extraction methods and found that an industr'ial extraction method with greater
pressure resulted in juices with higher levels of TAA.
It is not surprising that there are variabilities with the two ha~ests, given all the
variables of climate, time of hawesting, area grown, storage and processing.
The levels of polyphenols in the Ocean Spray@ Cranberry are nearly three times that
of the formulated Kei apple juice (302rng GAEII). However, in future formulatory
work, it may be possible to increase the level of the Kei apple in the base juice as the
resultant juice was not perceived by the respondents to be overly sour or astringent.
The briefing of an appropriate flavour house may also assist in helping mask the
aroma of the Kei apple more effectively. The viscosity of the beverage could further
be increased which may decrease any perceived increase in acidity further.
However, variations in hawest conditions must be ruled out in the long term.
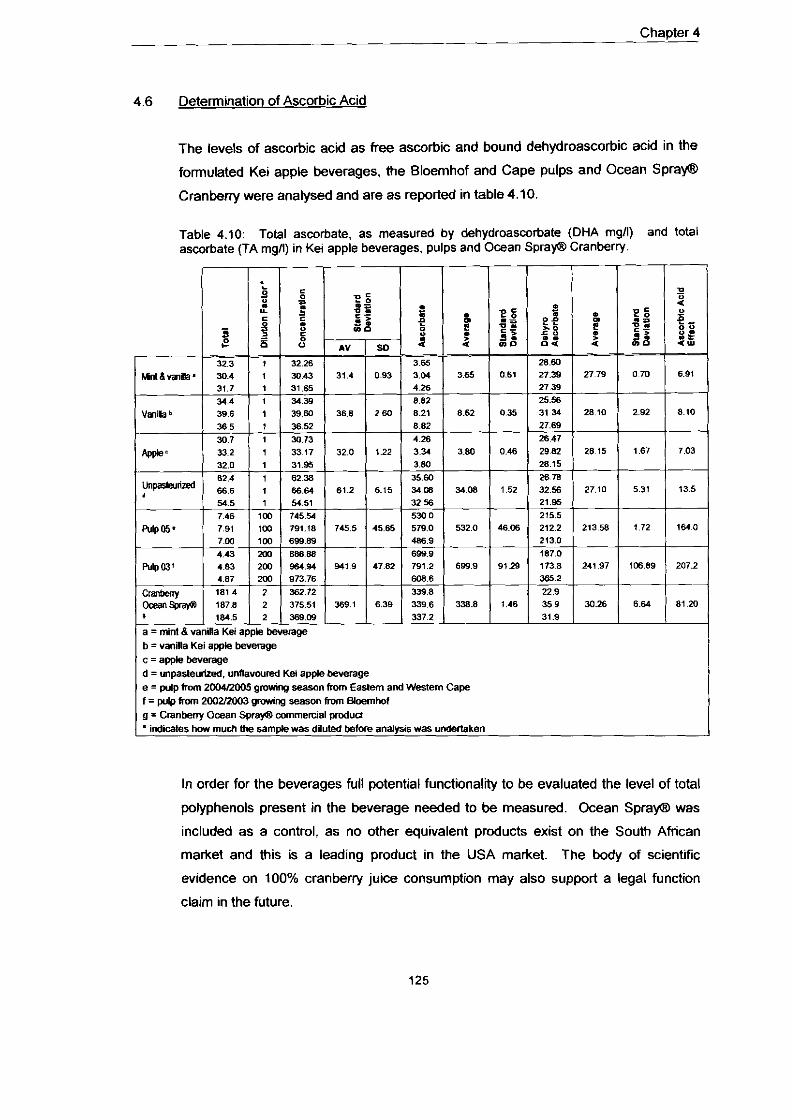
Chapter 4
4.6 Determination of Ascorbic Acid
The levels of ascorbic acid as free ascorbic and bound dehydroascorbic acid in the
formulated Kei apple beverages, the Bloemhof and Cape pulps and Ocean Sprap3
Cranbeny were analysed and are as reported in table 4.10.
b =vanilla Kei apple beverage c = appk beverage d = MpasteuBed, unflavwfed Kei am beverage e = pulp horn 2004RW5 growing season from Eastem and Western C a p f = pulp fmm 2W2/tW3 g m season horn Blaemhof g = Cranbeny Ocean Spra* commercial d u o
indicates how mudl the sampk was diluted before analysis was undertaken
In order for the beverages full potential functionality to be evaluated the level of total
polyphenols present in the beverage needed to be measured. Ocean Sprap3 was
included as a control, as no other equivalent products exist on the South African
market and this is a leading product in the USA market. The body of scientific
evidence on 100% cranberry juice consumption may also support a legal function
claim in the future.
Chapter 4
The total levels of ascorbic acid (mgll) for mint & vanilla, vanilla and apple were 31.4,
36.8 and 32.0 respectively; levels of free ascorbii acid (mgll) were 3.7, 8.6 and 3.8
respectively and levels of dehydroascorbic acid (mgll) were 27.8, 28.1 and 28.2
respectively. Little free ascorbic acid was available. The level of total ascorbii acid
in the unpasteurized sample was 62mg11, free ascorbic acid was 34mgll and
dehydroascorbic acid was 27mgll. It appears that the pasteurisation process had
destroyed some of the available ascorbic acid in the formulated beverage. The total
ascorbic acid in the Ocean Spray8 Cranbeny product was 369mgll, free ascorbic
acid was 339mgll and dehydroascorbic acid was 30mgll. It appears that there is
added free ascorbic acid in this commercial product which is a commonly adopted
practice in the food industry to prolong the shelf life of fruit juices (Taylor. 2005:103).
The total ascorbic acid of the pulps from the Cape and the Bloemhof apples were
746mgll and 942mgll respectively, free ascorbic acid 532mgA and 698mgll,
dehydroascorbic acid 314mgll and 242mgll. The differences in vitamin C levels are
not as apparent as the polyphenol levels, which suggest that the climate, ripeness
and other factors have had a larger influence on the levels of polyphenols. Ascorbic
acid loss as a result of blending and pasteurizing has been well documented (Kaur &
Kapoor, 2001), whilst the same authors state that it remains unclear whether
processing affects polyphenols or not. Sahari et a/. (2004) studied the effect of
freezing on the ascorbic acid content of frozen strawberries and found that the
ascorbic acid losses were greater after 15 days of storage and did not differ
dramatically with slow or quick freezing. Thus storage time appears to have an effect
on the ascorbic acid content of the product.
It has been found that, whilst titratable acidity levels in Hayward kiwifruit appeared
quite stable during storage at O'C, it is known that citric acid levels decline but malic
acid levels are maintained, and even increase with storage at 4"C, indicating that the
storage conditions of the kiwi storage are critical to maintain consistent quality of the
product (Marsh et a/.. 2004). Thus, storage conditiins are critical in maintaining the
level of actives in the product such as ascorbic acid and polyphenols, as well as
processing. This needs to be borne in mind for future work.
This loss of ascorbic acid is not surprising and when formulating the Kei apple
beverage again, must be taken into consideration as with all other fruit juices, and
ascorbic acid added back, as is common industrial practice.
-- Chapter 4
The results and discussion and all the forrnulatory, consumer panel testing work and
analytical work will now be evaluated in chapter 5 (Conclusions and
Recommendations) in an attempt to evaluate whether the original aims of the project
were met or not. If these aims were not met, what would be required in the future in
terms of further work or resources to meet them?

--- Chapter 5
CHAPTER 5
CONCLUSION AND RECOMMENDATIONS
Chapter 5
CONCLUSION AND RECOMMENDATIONS
Kei apples were taken from two areas of South Africa in two different seasons. The first
batch of apples were used to develop a prototype formulation and the second batch of Kei
apples were used to assess if this prototype formulation could be scaled up to an industrial
size plant and then subjected to evaluation by consumers and analytical chemistry for total
polyphenols and ascorbic acid.
At this point, the aims of the projed must be revisited and assessed as to whether they have
been met, giving specific reasons if they have not been met and what needs to be done to
ensure that they can be met in the future?
1) Develop (and confirm by panel testing) a product that is preferred by
consumers and will be purchased due to its sensory attributes.
The Kei apple beverage was developed as described. It was noted that the original
pilot study beverage was extremely acidic and astringent. In order to decrease this
perceived acidrty, a buffer (tri-sodium citrate) was added, and a thickener
(carboxymethyl cellulose) was added. Increasing viscosity with CMC (carboxymethyl
cellulose) also reduced perceived acidrty and astringency.
From the consumer panel testing, it was clear that a product had been developed
which met this aim of the project. For further product improvements, the same
guidelines as were used in the developmentary work, namely alteration of acidlsugar
ratio, addition of a buffering agent and the using of a thickening agent are the comect
guidelines to continue with.
2) Develop a product that could increase consumption of fruit juice as part of
improving overall diet and thereby increasing consumption of fruit.
Provided that the developed product can be marketed correctly, there is no reason
why this aim of the project cannot be met. In order to achieve this, a commercial
partner must be identified to market the product once it has been produced. This
product could easily form one of the portions of fruit and vegetables as
Chapter 5
recommended by the International Fruit and Vegetable Alliance (IFAVA), in the quest
to increase consumption of fruit and vegetables globally. Some of the fibre may be
lost during processing but this can be minimized if processing (especially with pulp
technology) is utilized, as was here.
The stakeholders involved in the Kei apple project must work together in order to
make it successful or provide more reliable frul. Elstein (2005) states the example of
some of the "minor fruits" (to the United States) that are being researched by
Agricultural Research Services of the United States for potential as major crops.
These researchers identifed the potential of these crops such as elderberries, black
raspbenies and then work to introduce them as potential for future growth into major
crops.
The same is true for the Kei apple fruit consumption to be increased - it must be
organised in a similar fashion to the Mawla Project, where everyone from the picker.
grower, processer, seller, producer to the marketer is involved. This project has
identified opportunities and has proved that there is a feasible product that is desired
by consumers. However, a leader in the community must be identified to form a co-
operative of Kei apple growers in order to take this forward in a similar fashion to the
Marula project.
Adding weight to the formation of co-operative and obtain financial backing.
Schieber et a1 (2001) examined the by-products of plant food processing as sources
of functional compounds, many common fruits such as apples, grapes, peaches.
apricots, citrus fruits, pineapples, bananas, guavas, papaya, passion fruit and kiwi
fruit offered valuable by-products in terms of their seeds or skins that may be useful
in terms of their value as potential food ingredients as antioxidants due to their
polyphenol content. This is encouraging as it means that there is a shifl in towards
thinking about what may be healthy for the individual and a more interdisciplinary
approach is being taken, in the fields of food technology, chemistry, nutrition and
toxicology. If a beverage is not feasible, perhaps polyphenol extraction from the Kei
apple should be examined, which could motivate increased production of the product,
and thus could contribute in meeting this objective.
Overall, there is no reason why this aim of the project cannot be met. The project
work clarly defines a consumer-preferred product. It is up to the other stakeholders
to play their part.
Chapter 5
3) Identify and quantify the constituents that are key to the success of the
developed product's functionality by measuring the polyphenols and ascorbic
acid mgll, using gas chromatography I mass spectophotometry.
The active ingredients that were identified as being present in the Kei apple were
polyphenols GAEA - thought to be caffeic acid and its derivatives, oligimers and
polymers (Du Toit Loots personal communication). A lower level of total polyphenols
was found in the 200412005 season's hawest of Kei apples, which may have been
due to a variety of reasons already discussed. The levels of total polyphenols as
GAEA in Ocean Spray@ Cranbeny juice, used as a benchmark for comparison, were
three times that of the formulated beverage and a functional claim allowable under
current USA legislations is being made on the first-mentioned product. If this would
be allowed in the future under SA regulations. is dubious. The level of polyphenols in
the final beverage may easily be increased by increasing the level of the Kei apple
pulp in the beverage and using the modifcations suggested on the previous page to
ensure that acceptance to the consumer is still maintained. Alternatively. the effects
of processing as well as the effects of different harvests, conditions of harvesting,
areas and growing conditions must be investigated.
The levels of ascorbic and dehydroascorbic acids found in the final beverage were
very low, and this was attributable to the processing. However, as seen with the
Ocean Spray@ Cranberry, ascorbic acid is added after processing and thus levels of
free ascorbic acid would be easily increased.
Overall, the aims of this part of the project have been met, but require further
investigation, which are largely related to agriculture. It must also be remembered
that the definition of a functional food is very vague globally and thus no finite
measures exist for functional beverages as to what the actual legal level of active
ingredient present needs to be, as with a drug.
4) Develop a product that has proven functional benefits that will assist in
alleviating degenerative diseases.
A product has been developed that is liked and accepted by consumers. However,
unless clinical human intervention trials are undertaken, it cannot be demonstrated
Chapter 5
that the product does have proven functional benefits and thus this aim of the project
has not been met. It is also recommended that, before this happens, the formulation
be increased to include more Kei apple and therefore more resultant polyphenols. It
is suggested that after all variables have been ironed out, a consistency in supply of
Kei apples is obtained and all stakeholders, growers, cooperative farm organizations,
processes, marketers and distributors have been identified and the correct financing
has been obtained, full-scale clinical testing be initiated.
In summary, the time is ripe for such a project to be funded and followed through.
The identification of the suitable stakeholders 1 partners is required for all phases of
the project - planting, ha~esting, processing, formulation I research and marketing
of the project. If the question is asked "was the project a success?", the answer
would be given as affirmative, provided that the following recommendations for
further development work and research are met:
Investigation of the variations in hawest and subsequent effects on product
characteristics.
Quantification of the amount of Kei apples shrubs and the yield nationally,
and potential resurrection of the Kei apple orchards planted in the Western
Cape when the NRF Innovation Project commenced, should be investigated.
Absolute definition of hawest time
The establishment of a Kei apple cooperative that will address the concern of
the growers and organize transport to a central location for storage before
processing.
Identification and commitment of the key stakeholders involved. In order for
any functional food to be successful, all the stakeholders involved must work
together efficiently. Those stakeholders are the agriculturists, the food
industry, consumers, health sectors and government (McConnon et a/.,
2002): 1) the food industry providing the product through research, either
through its own research or through outsourcing, 2) consumers by providing
insights into their needs and showing concerns about their health - taking
responsibility for their own health, especially with rising medical costs, 3) the
health sector, meaning all professionals, must carry health messages
forward, and 4) governments, being responsible for ensuring that fair
Chapter 5
legislation exists and that public health messages are supported from a
financial and priorrty basis.
Analysis of polyphenol content versus varying agricultural and climatic
conditions.
Identification of the precise actives involved - are they caffeic acids and their
derivatives and others, and how biologically active are these actives in the
body?
Fine tuning of the formulation to increase the level of total polyphenols as
GAEII, increase of ascorbic acid and improvement of aesthetic qualities to
capitalize further on the positive consumer panel results, with the offcial
involvement of flavour houses.
Key to all of this is to identify an industrial partner that would take interest and
further the project financially, as it passes along the NPD process and to
eventual market launch, where the initial return on investment (ROI) may be
paid back due to the success of the project, not forgetting what the actual
project has potentially achieved for the impoverished communities around the
country, especially in the Eastern Cape, the very origin of the Kei apple
(Dovyalis caffra).

Chapter 6
CHAPTER 6
REFERENCES
Chapter 6 --
AABY, K., SKREDE, G. & WROLSTAD, R.E., 2005. Phenolic composition and antioxidant activities in flesh and achenes of strawberries (Fragaria ananassa). Journal of Aqricultural and Food Chemistry. 53:40324040.
AHN, C.H., CHOI, W.C. & KONG, J.Y., 1997. Chemosensitising activity of caffeic acid in multidrug-resistant MCF-71Dox human breast carcinoma cells. Anticancer Research: 17(3C):1913-1917. May-June.
ALAM. I., 2005. Interacting with customers in the new product development process, in The PDMA Handbook Of New Product Development (ed K.B. Kahn), John Wiley 8 Sons Inc, Hoboken. New Jersey:249-262.
ALEXANDRAKIS, M., LETOURNEAU. R., KEMPURAJ, D., KANDERE- GRNBOWSKA, K.. HUANG, M., CHRISTODOULOU. S., BOUCHER, W., SERETAKIS, D. 8 THEOHARIDES, T.C., 2003. Flavones inhibit proliferation and increase mediator content in human leukemic mast cells (HMC-I). Eurooean Journal of Haematolwf, 71:448454.
AMERICAN ORGANISATION OF ANALYTICAL CHEMISTS (AOAC). 1989. Determination of total plate count. Official Method 966.23. Consultinq Microbiolwical Laboratory (Ptv) Ltd (CMLl. Good Laboratory Practice Test Method GLP023103.
ANDERSON, R.A. & POLANKSY, M.M., 2002. Tea enhances insulin activity. Journal of, 50:7182-7186.
ANDLAUER, W. 8 FORST, P., 2002. Nutraceuticals: a piece of history, present status and outlook. Food Research International, 35:171-176.
ANILA, L. & VIJAYALAKSHMI, N.R., 2003. Antioxidant action of flavonoids from Mangifera indica and Emblica officinab in hypercholesterolemic rats. Food Chemistry, article in press.
ANNACCHINO, M.A. & P.A., 2001. New product development: from initial idea to product management. Elsevier, pg 269.
ANONYMOUS, 2004(a). Edinburgh bans soft drinks in schools. World Drinks Report. 217:21. 24 June 2004.
ANONYMOUS, 2004(b). Health benefk of green tea, green tea extract and EGCG: a systematic review of scientific evidence from human studies from 1998-2004. Vitamin Information Centre, Medical Update 42. October.
ANONYMOUS, 2005. Dietary guidelines for Americans. US Department of Health and Human Sciences IHHS) and the US Department of Aoriculture IUSDA), htto:llwww.health .qovIdietarvquidelines/dqa2005IreDort.
AOAC - see AMERICAN ORGANISATION OF ANALYTIC CHEMISTS,
ARENDT, B.M., BOETZER. A.M., LEMOCH, H., WINKLER, P., ROCKSTROH, J.K., BERTHOLD, H.K., SPENGLER. U. 8 GOERLICH. R.. 2001. Plasma antioxidant capacity of HIV-seropositive and healthy subjects during long-term ingestion of fruit juices or a fruit-vegetableconcentrate containing antioxidant polyphenols. European Journal of Clinical Nutrition, 55:786-792.
Chapter 6
ARTS. I.C.W. 8 HOLLMAN, P.C.H., 2005. Polyphenols and disease risk in epidemiologic studies. American Journal of Clinical Nutrition, 81(Suppl.):317S-325s.
ARUOMA, O.I., 1999. Free radicals, antioxidants and international nutrition. Pacific Journal of Clinical Nutrition, 8(1):53-63.
ASAMI, D.K., HONG, Y., BARRETT, D M , MITCHELL, A.E., 2003. Comparison of the total phenolic and ascorbic acid content of freeze-dried and air-dried marionberry, strawberry and corn, grown using conventional, organic and sustainable agricultural practices. Journal of Aqricultural and Food Chemistry, 51 : 1237-1 241.
ASHURST, P.R. 2005. Non-carbonated beverages, in Chemistrv and Technoloav of Soft Drinks and Fruit Juices, second edition (ed P.R. Ashurst), Blackwell Publishing Ltd:129-149.
ATALAY, M., GORDILLO, G.. ROY, S., ROVIN, B.. BAGCHI. D., BAGCHI, M. &SEN, C.K., 2003. Anti-angiogenic property of edible berry in a model of hemangioma. m, 544:252-257.
AVIRAM, M., ROSENBLAT, M., GAITINI. D.. NIKECKI. S., HOFFMAN, A., DORNFELD, L., VOLKOVA., N., PRESSER, D., ATTIAS. J., LIKER, H. & HAYEK, T., 2004. Pomegranate juice consumption for 3 years by patients with carotid artery stenosis reduces common carotid intima-media thickness, blood pressure and LDL oxidation. Clinical Nutrition, 23:423433.
BAGCHI, D.. BAGCHI, M.. STOHS, S.J., DAS, D.K., RAY, S, D.. KUSZYNSKI, C.A.. JOSHI, S.S. 8 PRUESS, H.G.. 2000. Free radicals and grape seed proanthocyanidin extract: importance in human health and disease prevention. Toxicoloq~, 148387-197.
BAGCHI, D., SEN. C.K.. RAY, S.D., DAS, D.K., BAGCHI, M.. PREUSS, H.G. 8 VINSON. J.A.. 2003. Molecular mechanisms of carioprotection by a novel grape seed proanthocyanidin extract. Mutation Research, 523-524:87-97.
BASSIL, D., MAKRIS, D.P. 8 KEFALAS, P., 2004. Oxidation of caffeic acid in the presence of L-cysteine: isolation of 2-Scysteinylcaffeic acid and evaluation of its antioxidant properties. Food Research International, 38:395402.
BATES. R.P.. MORRIS, J.R. 8 CRANDALL, P.G.. 2001. Principles and practices of small- and medium-scale fruit juice processinq, FAO.
BAXTER, LA., EASTON, K., SCHNEEBELI, K. 8 WHITFIELD, F.B., 2005. High pressure processing of Australian navel orange juices: sensory analysis and volatile flavour profiling. Innovative Food Science and Ememinq Technoloaies, article in press.
BEAUCHAT, L.R. S RYU. J-ti, 1997. Produce handling and processing practices. Ememina Infectious Diseases, 3:4):459-465.
BECH-LARSEN, T. 8 GRUNERT, K.G., 2003. The perceived healthiness of functional foods: a conjoint study of Danish, Finnish and American consumers' perceptions of functional foods. Appetite, 40:9-14.
BEECHER, G.R., 2003. Overview of dietary flavonoids: nomenclature, occurrence and intake. The Journal of Nutrition. 133(Suppl.):3248S - 32543.
Chapter 6
BEUTLER, H.O., 1984. L-ascorbate and L-dehyroscorbate. In: Methods of Enzymatic Analysis. Bergmeier. H.U., ed.; Weinheim, Germany, 6:376-385.
BHASKARAN, S. & HARDLEY, F., 2002. Buyer beliefs, attitudes and behavior: foods with therapeutic claims. Journal of Consumer Marketing, 19(7):591-605.
BIORAD 0711-07/93, 1993. Rapid determination of coliforms and E.Coli. Consulting Microbiolwical Laboratory (Ptyj Ltd (CML). Good Laboratory Practice Test Method GLP-W030102.
BLAUT, M., SCHOEFER. L. & BRAUNE, A,, 2003. Transformation of flavonoids by intestinal microorganisms. International Journal Vitam. Nutritional Research. 73(2):79- 87.
BMI FOODPACK cc, 2002. Beverages in South Africa. Brand Market Information
BOIKE, D.G., BONIFANT, B. 8 SIESFELD, T., 2005. Market analysis and segmentation for new products, in The PDMA Handbook Of New Product Development (ed K.B. Kahn), John Wiley & Sons Inc, Hoboken. New Jersey:191-210.
BOSMAN, M.J.C., 1998. The development and evaluation of a low fat, high-fibre muftin using SimptesseB as a fat substitute. Potechefstroom, SA: Potchefstroom University for Christian Higher Education. PhD Thesis.
BRAVO. L., 1998. Polyphenols: chemistry, dietary sources, metabolism and nutr'iional signifcance. Nutrition Reviews, 56(11):317-333.
37. BREINHOLT, V.M., NIELSEN, S.E., KNUTHSEN. P.. LAURIDSEN. S.T., DANESHVAR. B. & SBRENSEN, A., 2003. Effects of commonly consumed fruit juices and carbohydrates on redox status and anticancer biomarkers in female rats. ~utrit ion & Cancer, 45(1):46-52.
38. BREINHOLT, V.M., SVENDSEN, G.W., DRAGSTED, L.O. & HOSSAINI, A,, 2004. The citrus-derived flavonoid naringenin exerts uterotrophic effects in female mice at human relevant doses. Basic & Clinical Pharmacolwv & Toxicolwy, 94:30-36.
39. BRITISH HEART FOUNDATION, 2004. Heart Health Magazine. 14 Fitzhardinge Street. London, WIH 6DH. htt~:llwww.bhf.orq.uk . April.
40. BRITISH NUTRITION FOUNDATION, 2004. Fruit and Vegetables. htt~:llwww.nutrition.ora.uk . visited 08/07/05.
41. BRITISH SOFT DRINKS ASSOCIATION, 2005. Additives and ingredients. h t t ~ : l l w w w . b r i t i s h s o f t d r i n k s . c o m l h t m l a a / v e s . 5110/05
42. BRITISH SOFT DRINKS ASSOCIATION. 2005. Fruit Juice htt~:llwww.britishsoftdrinks.mlhtm/aalFruitJuice. 15/10/05.
43. BRUNNER, L.J.. PAI, K-S.. MUNAR, M.Y., LANDE, M.B.. OLYAEI, A.J. & MOWRY, J.A., 2000. Effect of grapefruit juice on cyclosporin A pharmacokinetics in pediatric renal transplant patients. Pediatric Trans~lantation, 4:313-321.
44. BRUSSELMANS, K., VROLIX, R., VERHOEVEN, G. 8 SWINNEN, J.V., 2005. Induction of cancer cell apoptosis by flavonoids is associated with their ability to inhibit
Chapter 6 -
fatty acid synthase activity. The Journal of Bioloaical Chemistw, 280:5636-5645. February.
45. BUB, A,, WATZL, B., BLOCKHAUS, M., BRIVIBA, K., LIEGIBEL, U., MOLLER. H.. POOL-ZOBEL. B. & RECHKEMMER, G.. 2003. Fruit juice consumption modulates antioxidant status, immune status and DNA damage. The Journal of Nutritional Biochemist~y. 14(2):90-98. February.
46. BUISSAN, D., 1995. Developing new products for the consumer, chapter 8, page 182. Food Choice and the Consumer, edited by D.W. Marshall. Blackie Academic & Professional.
47. BULL, M.K., ZERDIN, K., HOWE, E., GOICOECHEA. D., PARAMANANDHAN, P.. STOCKMAN, R., SELLAHEWA. J., SZABO. EA., JOHNSON, R.L. &STEWART, C.M., 2004. The effect of high pressure processing on the microbial, physical and chemical properties of Valencia and Navel orange juice. Innovative Food Science and Emerging Technoloqies, article in press.
48. BURNETT, S.L. & BEUCHAT, L.R., 2000. Human pathogens associated with raw produce and unpasteurized juices, and difkultiis in decontamination. Journal of Industrial Microbioloav and Biotechnoloav. 25:281-287.
49. BUTTRISS, J., 2004. Demystiiing phytochemicals. Bioloaist, 51(2)
50. CARNESECCHI, S., SCHNEIDER, Y., LAZARUS, S.A., COEHLO, D., COSSE, F. & RAUL. F., 2002. Flavonols and procyanidins of cocoa and chocolate inhibit growth and polyamine biosynthesis of human colonic cancer cells. Cancer Letters, 175147-1 55.
51. CASSANO. A., DRIOLI. E.. GALAVERNA, G., MARCHELLI, R.. Dl SILVESTRO. G. & CAGNASSO. P.. 2003. Clarifcation and concentration of citrus and carrot juices by integrated membrane processes. Journal of Food Enoineerinq, 57:153-163.
52. CENTRE FOR FOOD SAFETY & APPLIED NUTRITION (CFSAN), 1992(a). Bad Bug Book: Enterotoxigenic Escherichia coli -, FDA http://www.cfsan.fda.gov/-mow/chapl3.html, 27/09/05.
53. CENTRE FOR FOOD SAFETY & APPLIED NUTRITION (CFSAN), 1992(b). Bad Bug Book: Enteropathogenic Escherichia coli. -. FDA http://www.cfsan.fda.gov/-mow/chapl4.htmI 27/09/05.
54. CENTRE FOR FOOD SAFETY & APPLIED NUTRITION (CFSAN). 1992(c). Bad Bug Book: Enteroinvasive Escherichia coli. -, FDA http://w.cfsan.fda.gov/-mow/chapl6.html, 27/09/05.
55. CENTRE FOR FOOD SAFETY & APPLIED NUTRITION (CFSAN), 2001(a). Bad Bug Book: Escherichia coli 0157:H7. FDA, http:l/www.cfsan.fda.govl-mow/chapl5.htl, 27/09/05.
56. CHANG, S-S 8 KANG, D-H., 2004. Alicylobaccilus spp. In the fruit juice industly: history, characteristics and current isolationldetection procedures. Critical Reviews in Microbioloay. 30:55-74.
57. CHEFTEL, J.C.. 2005. Food and nutrition labelling in the European Union. Chemistw, 93:531-550.
Chapter 6
58. CHEN, S., SUN, X.Z., KAO, Y-C., KWON, A,, ZHOU, D. & ENG, E., 1998. Suppression of breast cancer cell growth with grape juice. 36(Suppl):53-61.
59. CHILDS, N. & PORYZEES, G.H., 1997. Foods that help prevent disease: consumer attitudes and public policy implications. Journal of Consumer Marketing, 14(6):433- 447.
60. CHUNG, T-W., MOON, S-K., CHANG, Y-C., KO, J-H., LEE, Y-C., CHO, G., KIM, S-H.. KIM, J-G. & KIM, C-H., 2004. Novel and therapeutic effect of caffeic acid and caffeic acid phenyl ester on hepatocarcinma cells: complete regression of hepatoma growth and metastasis by dual mechanism. The FASEB Journal, Research Communication. 18:1670-1681.
61. COATES PALGRAVE, K., 2002. Trees of Southern Africa. 3d edition, revised and updated by Coates Palgrave, M. S t ~ i k Publishers (a division of New Holland Publishing. South Africa (Pty) Ltd).
62. COETZEE, C., JEFTHAS. E. & REINTEN, E., 1999. Indigenous ~ l a n t genetic resources of South Africa: 160-163. In: J. Janick (ed.) perspectives on new crops and new uses. ASHS Press, Alexandria. V.A.
63. COOPER, R.G., 2001. Winning at new products. Accelerating the process from idea to launch. Basic Books. Perseus Books Group, New York.
64. COOPER, R.G., 2005. New products - what separates the winners from the losers and what drives success, in The PDMA Handbook Of New Product Develo~ment (ed K.B. Kahn). John Wiley & Sons Inc, Hoboken. New Jersey:3-28.
65. CRAIG, W.J., 1997. Phytochernicals: guardians of our health. Journal of the American Dietetic Association, 97(10)(Suppl. 2):S199-5204. October.
66. DAJAS, F., RIVERA-MEGRET, F., BLASINA., F., ARREDONDO. F., ABIN- CARRIQUIRY, J.A., COSTA. G., ECHEVERRY, C., LAFON, L., HEIZEN. H., FERREIRA, M. 8 MORQUIO. F., 2003. Neuroprotection by flavonoids. Brazilian Journal of Medical & Biolwical Research, 36:1613-1620.
67. DAY. A.J., CANADA, F.J., DIAZ, J.C., KROON, P.A., McLAUCHLAN. R., FAULDS, C.B., PLUMB, G.W., MORGAN, M.R.A. &WILLIAMSON, G., 2000. Dietary flavonoid and isoflavone glycosides are hydrolysed by the lactase site of lactase phlorizin hydrolase. FEBS Letters, 468:166-170.
68. DE JONG, N., OCKC, M.C., BRANDERHORST, H.A.C. & FRIELE, R., 2003. Demographic and lifestyle characteristics of functional food consumers and dietary supplement users. British Journal of Nutrition, 89:273-281.
69. DELWICHE, J., 2004. The impact of perceptual interactions on perceived flavour. Food Qualitv & Preference, 15:137-146.
70. DEPARTMENT OF AGRICULTURE, SOUTH AFRICA, 1980. Regulations relating to the classification, packing and marking of fruit juice and drink intended for sale in the Republic of South Africa. Agricultural Products Standards Act, GN R2286.
Chapter 6
71. DEPARTMENT OF HEALTH, SOUTH AFRICA, 2001. Foodstuffs, Cosmetics B Disinfectants Act 54 of 1972. Requlations Relatinq To Labellinq And Advertisincl Of Foodstuffs. Pretoria.
72. DEPARTMENT OF HEALTH, SOUTH AFRICA. 2003. supported by Association for Dietetics in South Africa and Nutrition Society of South Africa. Food based dietary guidelines for healthy South Africans (over the age of seven years).
73. DIPLOCK, A.T.. AGGETT, A.T.. ASHWELL, M.. BORNET. F., BERN, E.B.. 8 ROBERFROID. M.B., 1999. Scientific concepts of functional foods in Europe: consensus document. British Journal of Nutrition, 81(Suppl. 1):Sl-527.
74. DONMA, M.M. 8 DONMA, O., 2005. Phytonutrients and children: the other side of the medallion. Food Research International, article in press.
75. DOOLEY, K. 8 JOHNSON, D., 2001. Changing the new product development process: re-engineering or continuous quality improvement? Measurinq Business Excellence, 5(4):32-38.
76. DREOSTI. E.I., 2000. Recommended dietary intake levels for phytochemicals: feasible or fanciful? Asia Pacific Journal of Clinical Nutrition, S119-322: 9(Suppl).
77. DREWNOWSKI, A. & GOMEZ-CARNEROS, C., 2000. Bitter taste, phytonutrients and the consumer: a review. American Journal of Clinical Nutrition, 72:1424-1435.
78. DUEQAS, M., HERNANDEZ, T., ESTRELLA, 1. & RABANAL, R., 2003. Phenolic composition and antioxidant activlty of mocan seeds (Visnea mocanera Lf). && Chemistq, 82:373-379.
79. DUFRESNE, C.J. & FARNWORTH, E.R., 2001. A review of latest research findings on the health promotion properties of tea. The Journal of Nutritional Biochemistq, 12:404- 421.
80. DUTHIE, G. 8 CROZIER, A,, 2003. Beverages, in Plants: Diet and Health (ed. G. Goldberg), Blackwell Publishing for the British Nutrition Foundation.
81. EARLY, R., 2002. Use of HACCP in fruit and vegetable production and post-harvest treatment, in m a n d Vegetable Process~nq (ed W . ~ongen). woodhead Publishing. Cambridge. England 1 CRC Press:gl-I18
82. EISELE, T.A. 8. DRAKE, S.R., 2004. The partial compositional characteristics of apple juice from 175 apple varieties. Journal of Food Composition and Analvsis, article in press.
83. ELLIS, S.M. B STEYN, H.S., 2003. Practical significance (effect sizes) versus or in combination with statistical significance (pvalues). Management Dvnamics, 12(4):51- 53.
84. ELSTEIN, D., 2005. Turning minor fruits into major crops. Aqricultural Research, January:l2-13.
85. FDA, 2005. Guidance for industry. A dietary supplement labelling guide. CFSAN / Office of Nutritional Products. Labellinq, and Dietaw Supplements. April. htt~:llwww.cfsan.fda.aovkai-bin , visited 7/07/05.
Chapter 6
86. FERRIERES, J., 2004. The French paradox: lessons for other countries. m, 90:107-111.
87. FOLTS, J.D., 1998. Antithrombotic potential of grape juice and red wine for preventing heart attacks. Pharmaceutical Biolwy. 36(Suppl.):21-27.
88. FOREYT, J.P.. 2005. Trends in the management of obesity. Paper at larn International Congress of Nutrition. 19-23 September, Durban, South Africa.
89. FRANK, J., KAMAL-ELDIN, A., RAZDAN, A., LUNDH, T. 8 VESSBY, B., 2003. The dietary hydroxycinnarnate caffeic acid and its conjugate chlorogenic acid increases vitamin E and cholesterol concentrations in Sprague-Dawley rats. Journal of AqricuMural and Food Chemistry, 51 :2526-2531.
90. FRANKEL, E.N. 8 MEYER, A.S., 1998. Antioxidants in grapes and grape juices and their potential health effects. Pharmaceutical Biolwy. 36(Suppl):14-20.
91. FREWER, L., SCHOLDERER, J. 8 LAMBERT, N., 2003. Consumer acceptance of functional foods: issues for the future. British Food Journal, 105(10):714-731.
92. FRYDOONFAR, H.R., McGRATH, D.R. 8 SPIGELMAN, AD., 2003. Colorectal Disease, 5:149-152.
93. FUHR, U., 1998. Drug interactions with grapefruit juice. Extent, probable mechanism and clinical relevance. Drug Safety, 18(4): 251-272, April.
94. FUKUI, M., YOKOTSUKA, K., ISHII, R., O'MAHONY, M. 8 ROUSSEAU, B., 2002. Investgation of potential taste reduction of catechin and gape seed dimeric phenols in water by wine proteins. Lebensm.-Wiss. u.-Technol., 35:355361.
95. GAINS, N., Ed. 1996. The Re~ertofv Grid Aooroach. Measurement of Food Preferences. London, Blackie Academic 8 Professional.
96. GALATI, G. 8 O'BRIEN, P.J., 2004. Potential toxicity of flavonoids and other dietary phenolics: significance for their chemopreventive and anticancer properties. Radical Bioloqv 8 Medicine, 37(3):287-303.
97. GARBER, J.R., L.L., HYATT, E.M. 8 STARR JR., R.G., 2003. Measuring consumer response to food products. Food Qualitv and Preference, 14:3-15.
98. GEE. J.M. 8 JOHNSON, I.T.. 2001. Polyphenolic compounds: interactions with the gut and implications for human health. Current Medicinal Chemistry, 8:12451255.
99. GEETHA, T., GARG, A , CHOPRA, K. 8 KAUR, I.P., 2004. Delineation of antimutagenic activity of catechin, epicatechin and green tea extract. Mutation Research, 556:p65-74.
100. GIVAUDAN SOUTH AFRICA ( P N ) LTD, 2004. Global beverages trends: juices 8 nectars. www.aivaudan.com.
101. ~0~2.4~~2-PARAMAS. A.M., ESTEBAN-RUANO, S., SANTOS-BUELGA. C., DE PASCUAL-TERESA, S. 8 RIVAS-GONZALO, J.C., 2004. Flavonol content and antioxidant activity in winery byproducts. Journal of Aaricultural Food Chemistry, 52:234-238.
Chapter 6
102. GORINSTEIN, S., CVIKROVA, M.. MACHACKOVA. I.. HARUENKIT, R., PARK, Y-S., JUNG. S-T.. YAMAMOTO, K., MARTINEZ AYALA, A.L., KATRICH, E. & TRAKHTENBERG. S., 2004. Characterisation of antioxidant compounds in Jaffa sweeties and white grapefruits. Food Chemistrv, 84503-510.
103. GRANOR P A W (PTY) LTD, 2003(a). Determination of percentage acid. Work lnstruction QA. W1, 6.6.
104. GRANOR PASSl (PTY) LTD. 2003(b). Determination of Brix - RFM 80. Work lnstruction QA, W l , 6.7.
105. GRANOR PASSl (PTY) LTD, 2003(c). Processing of guava. Work lnstruction FP WI 1.20.
106. GRIFFIN, A,, 2005. Obtaining customer needs for product development, in The PDMA Handbook Of New Product Develooment (ed K.B. Kahn), John Wiley & Sons Inc, Hoboken. New Jersey:211-227.
107. GRUNERT. K.G., 2003. Purchase and consumption: the interdisciplinary nature of analysing food choice. Food Qualitv and Preference, 14:3940.
108. GUEGUEN. R.S., 1998. The French paradox and wine drinking. Novartis Found Svmposium. 216:208-217.
109. HAENEN, G.R.M.M., ARTS, M.J.T.J., BAST, A. 8 COLEMAN, M.D., 2005. Structure and activlty in assessing antioxidant activity in vitro and in vivo: a critical appraisal illustrated with the flavonoids. Environmental Toxicoloav and Pharrnacolwy, article in press.
110. HANNUM, S.M., 2004. Potential impact of strawberries on human health: a review of the science. Critical Reviews in Food Science B Nutrition, 44:l-17.
111. HARRIS, G.K., GUPTA, A.. NINES, R.G., KRESN, L.A., HABIB, S.G., FRANKEL. W.L., LAPERLE, K., GALLAGER, D.D.. SCHWARTZ, S.J. & STONER, G.D., 2001. Effects of lyphilized black raspberries on azoxymethane-induced colon cancer and 8- hyroxy-2'-deoxyguanosine levels in the Fischer 344 rat. Nutriton and Cancer, 40(2):125-133.
112. HASLER. C.M., 2002. Functional foods: benefits, concerns and challenges - a position paper from the American Council on Science and Health. American SocieQ for Nutritional Sciences. 0022-3166102:3772-3781.
113. HAWKES, C., 2004. Nutrition Labels and Health Claims, -:v.
114. HENIG, Y.S. 8 LEAHY. M.M., 2000. Cranberly juice and urinary-tract health: science supports folklore. Nutrition, 16(718):684-687.
115. HENNING, S.M., NIU, Y.. LEE. N.H., THAMES, G.D. MINUlTI, R.R., WANG, H., GO, V.L.W. 8 HEBER, D., 2004. Bioavailability and antioxidant activity of tea flavanols after consumption of green tea, black tea, or a green tea extract supplement. American Journal of Clinical Nutrition, 80:1558-1564.
116. HERTOG, M.G.L., 1996. Epidemiological evidence on potential health properties of flavonoids. Proceedinas of the Nutrition Society, 55:385397.
- Chapter 6
117. HERTOG, M.G.L., FESKENS, E.J.M., HOLLMAN, P.C.H., KATAN, M.B. & KROMOUT. D., 1993. Dietary antioxidant flavonoids and risk of coronary heart disease: The Zutphen Elderley Study. The Lancet, 342:1007-1011.
118. HERTOG, M.G.L., FESKENS, E.J.M., HOLLMAN, P.C.H.. KATAN, M.B. & KROMOUT, D.. 1994. Dietary antioxidant flavonoids and cancer risk in The Zutphen Elderley Study. Nutriton and Cancer, 22:175-184.
119. HESS, M.A., 1997. Taste: the neglected nutritional factor. Journal of the American Dietetic Association, 97(Suppl.):S205-S207. October.
120. HOLLINGSWORTH, P., 1998. Sensory testing rediscovered as key to new product success. Food Technolwy. 52(4):2627. April.
121. HOLLMAN, P.C.H. & KATAN, M.B., 1997. Absorption, metabolism and health effects of dietary flavonoids in man. Biomed & Pharmacother, 51 L305310.
122. HOLLMAN, P.C.H. & KATAN, M.B., 1999. Health effects and bioavaibbility of dietary flavonols. Free Rad. Research., Vol31:S75-80.
123. HOLMAN, R., WAS, H-W. & KEELING, D., 2003. The future of product development. The McKinsey Quartedv. 3:28-39.
124. HU, C., KWOK, B.H.L. & KITTS, D.D., 2005. Saskatoon berries (Amelanchier alnifolia Nutt.) scavenge free radicals and inhibit intracellular oxidation. Food Research International, article in press.
125. HU, F.B. & WILLETT, W.C., 2002. Optimal diets for prevention of coronary heart disease. Journal of the American Medical Association lClinical Cadiolwy), 288(20):25692578. November.
126. HUDSON, E.A.. ANH DINH, P.. KOKUBUN, T., SIMMONDS, M.S.J. 8 GESCHER, A., 2000. Characterisation of potentially chemopreventive phenols in extracts of brown rice that inhibit growth of human breast and colon cancer cells. Cancer E~idemioloqv, Biomarkers & Prevention, Vol9:1163-1170. November.
127. IFAVA (International Fruit and Vegetable Alliance), http:l/www.ifava.org
128. ISHIKAWA, T. & NOBLE, A.C., 1995. Temporal perception of astringency and sweetness in red wine. Food Qualitv and Preference. 6:27-33.
129. JAEGER, S.R., ROSSITER, K.L., WISMER, W.V. & HARKER, F.R., 2003. Consumer- driven product development in the kiwifruit industry. Food Qualitv and Preference, 14:187-198.
130. JAYA, S., VARADHARAJU, N. & KENNEDY, Z.J., 2004. Inactivation of rnicrc- organisms in the fruit juice using pulsed electric field. Journal of Food Science and Technoloov- Mvsore, 41 (6):652-655.
131. JELLINEK. G.. 1985. Sensow Evaluation Of Food: T h e m and Practice. Published by Ellis Horwocd Lid, Chichester. England. UK.
132. JOSHIPURA, K.J., HU, F.B., MANSON, J.E., STAMPFER, M.J., RIMM, E.B.. SPEIZER, F.E.. COLDITZ, G.. ASCHERIO, A,, ROSNER, 6.. SPIEGELMAN, D. &
Chapter 6
WILLElT, W.C., 2001. The effect of fruit and vegetable intake on risk for coronary heart disease. Annual of Internal Medicine, 134:1106-1114.
133. JOUBERT, E., WINTERTON, P., BRITZ, T. 8 FERREIRA, D., 2003. Superoxide anion and a, a-diphenyl-p-picrylhydrazyl radical scavenging capacity of rooibos (Aspalanthus linearis) aqueous extracts, crude phenolic fractions, tannin and flavonoids. Research International, article in press.
134. KAMPA, M., ALEXAKI, V-I., NOTAS, G., NIFLI, A-P., NISTIKAKI, A.. HATZOGLOU, A., BAKOGEORGOU, E., KOUIMTZOGLOU, E.. BLEKAS, G.. BOSKOU, D.. GRAVANIS, A. & CASTANAS, E., 2004. Antiproliferative and apoptotic effects of selective phenolic acids on T47D human breast cancer cells: potential mechanisms of action. Cancer Research, 6:R63-R74.
135. KANG, N.J., LEE, K.W., LEE, S.J., LEE, C.Y. & LEE, H.J., 2004. Effects of phenolics in Empire apples on hydrogen peroxide-induced inhibition of gapjunctional intercellular communication. BioFactors. 21 :361-365.
136. KARAKAYA, S., 2004. Bioavailability of phenolic compounds. Critical reviews in Food Science and Nutrition. 44:453-464.
137. KATAN, M.B. & DE ROOS, N.M., 2003. Toward evidencebased health claims for foods. Science, 5604(299):206-207.
138. KATAN, M.B. & DE ROOS, N.M., 2004. Promises and problems of functional foods. Critical Reviews in Food Science and Nutrition. 44:369-377.
139. KAUR, C. & KAPOOR, H.C., 2001. Antioxidants in fruits and vegetables - the millennium's health. International Journal of Food Science and Jechnolwy, 36:703- 725.
140. KEEN, C.L.. HOLT. R.R.. OTEIZA. P.I.. FRAGA. C.G. & SCHMITZ. H.H.. 2005. Cocoa antioxidants and cardiovascular health. American Joumal of Clinical Nutrition, 81 (Suppl.):298S-303s.
141. KNEKT, P., KUMPULAINEN, J., JARVINEN, R., RISSANEN, H., HELIOVAARA, M., REUNANEN, A,, HAKULINEN, T. & AROMAA, A., 2002. Flavonoid intake and risk of chronic diseases. American Joumal of Clinical Nutrition. 76560-568.
142. KOEN, P A , 2005. The fuzzy front end for incremental, platform and breakthrough products, in The PDMA Handbook Of New Product Develooment (ed K.B. Kahn), John Wiley 8 Sons Inc, Hoboken, New Jersey:81-91.
143. KOPP, P., 1998. Resveratrol, a phytoestrogen found in red wine. A possible explanation for the conundrum of the "French paradox"? Eurooean Journal of Endocrinoloqy, 138:619-620.
144. KOZLOWSKA. K.. JERUSZKA, M., MATUSZEWSKA. I., ROSZKOWSKI. W., BARYLKO-PIKIELNA, N.. & BRZOZOWSKA. A., 2003. Hedonic tests in different locations as predictors of apple juice consumption at home in elderly and young subjects. Food Quality and Preference. 14:653-661.
145. KRUGER, C.L. & MANN, S.W., 2003. Safety evaluation of functional ingredients. Food and Chemical Toxicoloqy, 41 :793805.
Chapter 6
146. KULKARNI, A.P., ARADHYA, S.M. & DIVAKAR, S., 2004. Isolation and identification of radical scavenging antioxidant - punicalagin from pith and carpellary membrane of pomegranate fruit. FoodChemrstrv, 87:551-557.
147. KUROWSKA, E.M., SPENCE, J.D., JORDAN, J., WETMORE. S., FREEMAN, D.J., PICHE. L.A. 8 SERRATORE, P., 2000. HDL-cholesterol-raising effect of orange juice in subjects with hypercholesterolemia. American Journal of Clinical Nutrition. 72:1095- 1100.
148. LAMBERT, J.D. & YANG, C.S., 2003. Cancer chemopreventive activity and bioavailabilrty of tea and tea polyphenols. Mutation Research, 523-524:201-208.
149. LANGLEY-EVANS, S.C.. 2000. Consumption of black tea elicits and increase in plasma antioxidant potential in humans. International Journal of Food Sciences & Nutrition, 51:309-315.
150. LE MARCHAND, L., 2002. Cancer preventive effects of flavonoids - a review. Biomedicine & Pharmacotherap~. 56:296-301.
151. LEA, R.A.W., 2005. Processing and packaging, in Chemistry and Technolwv of Soff Drinks and Fruit Juices, second edition (ed P.R. Ashurst), Blackwell Publishing Ltd:182-198.
152. LI, Y., GUO, C., YANG, J., WEI, J., XU, J. & CHENG, S., 2005. Evaluation of antioxidant properties of pomegranate peel extract in comparison with pomegranate pulp extract. Food Chemistw, article in press.
153. LORD, J.B., 2000. New product failure and success, in De~el~p i f la new food oroducts for a chanqinq marketolace. (eds A.L. Brody & J.B. Lord) Bocan-RatanlCRC Press:55- 86.
154. LOVE, P. & SAYED, N., 2001. South African food-based dietary guidelines: eat plenty of vegetables and fruit everyday. South African Journal of Clinical Nutrition, 14(3):24- 32.
155. MALASPINA, A., 1996. Functional foods: overview and introduction. Nutrition Reviews, 54(11):54-55.
156. MANACH, C., MAZUR, A. & SCALBERT, A,, 2005. Polyphenols and prevention of cardiovascular diseases. Current O~inion ~n L i~ iddwv . Nutrition and Metbolism, 16:l-
157. MANACH, C., SCALBERT. A., MORAND, C., R~MESY, C. & JIMENEZ, L., 2004. Polyphenols: food sources and bioavailability. American Journal of Clinical Nutriton, 79:727-747.
158. MANACH, C., WILLIAMSON, G., MORAND, C., SCALBERT, A. & REMESY, C., 2005. Bioavailabilty and bioefficacy of polyphenols in human: review of 97 bioavailability studies. American Journal of Clinical Nutrition, 81 (Suppl.):230S-242s
159. MANTHEY, J.A., GUTHRIE, N. & GROHMANN. K., 2001. Biological properties of citrus flavonoids pertaining to cancer and inflammation. Current Medicinal Chemistry, 8:135153.
Chapter 6
160. MARIN, F.R.. MARTINEZ, M.. URIBESALGO, T., CASTILLO, S. 8 FRUTOS. M.J., 2002. Changes in nutraceutical composition of lemon juices according to different industrial extraction systems. Food Chemistw, 78:319-324.
161. MARSH, K., ATTANAYAKE, S., WALKER, S., GUNSON, A., BOLDINGH, H. 8 MACRAE, E., 2004. Acidity and taste in kiwifruit. Postharvest Biology and Technolwy, 32:154168.
162. MARSHALL, D., 2003. Commentary on Garber et a/., "Measuring consumer response to food products". Food Quality and Preference, 14: 17-2 1.
163. MATTES, R.D. & ROTHACKER, D., 2001. Beverage viscosity is inversely related to postprandial hunger in humans. Phvsiolwv & Behaviour, 74(4-5):551-557.
164. MAYER, J. 8 STERN, F., 2003. USDA database for the flavonoid content of selected foods. Prepared by the Nutrient Data Laboratory. Food Composition Laboratory, Beltsville Human Nutrition Research Centre, Agricultural Research Centre and US Depattment of Agriculture US Department of Agriculture. http:l~.nal.usda.gov/fnic/foodcomp.
165. McANULTY. S.R., McANULTY, L.S., NIEMAN. D.C., DUMKE, C.L., MORROW, J.D.. UTTER, A.C., HENSON, D.A.. PROUU, W.R. & GEORGE. G.L., 2004. Consumption of blueberry polyphenols reduces exercise-induced oxidative stress compared to vitamin C. Nutrition Research. 24:209-221
166. McCONNON, A., CADE, J. & PEARMAN, A,, 2002. Stakeholder interactions and the development of functional foods. Public Health Nutrition. 5(3):469477.
167. McEWAN, J.A. & COLWILL, J.S., 1996. The sensory assessment of the thirst- quenching characteristics of drinks. Food Quality & Preference, 7(2):101-111
168. MEILGAARD, M., CIVILLE, G.V. & CARR, B.T., 1999. Sensory Evaluation Techniques, third edition. Published by CRC Press LLC.
169. MELLENTIN, J.. 2003. Functional foods turn out to be a beverage business. New Nutrition Business. March. www.new-nutrition.com.
170. MENNELLA. J.A., 1998. Visions of the future in basic chemosensation. Technolwy, 52:5860. April.
171. MENNELLA, J.A., PEPINO, M.Y. & REED. D.A., 2005. Genetic and environmental determinants of bitter perception and sweet preferences. Pediatrics, 115(2):e216- e222.
172. MILLER, N.J. 8 RUIZ-LARREA, M.B., 2002. Flavonoids and other plant phenols in the diet: their signiticance as antioxidants. Jwmal of Nutritional and Environmental Medicine, 12:39-51.
173. MILNER, A.J.. 1998. Do "functional foods" offer opportunities to optimize nutrition and health? Food Technology, 52(11):24. July - December.
174. MILNER, A.J., 2000. Functional foods: the US perspective 1-3. American Journal of Clinical Nutrition, 71 (Suppl.):1654S-16598.
Chapter 6
175. MORTON, J., 1987. Pomegranate. In: Fruitsof warm climates, Julia F. Morton, Miami, Florida.
176. MOSKOWITZ, H.R., 2003. When bad data happen to good researchers: a contrarian's point of view regarding measuring consumer response to food products. Food Quality and Preference, 14:33-36.
177. MURSU, J.. VOUTILAINEN, S., NURMI, T., RISSANEN, T.H., VIRTANEN. J.K.. KAIKKONEN, J., NWSSONEN, K. 8 SALONEN, J.T., 2004. Dark chocolate consumption increases HDL cholesterol concentration and chocolate fatty acids may inhibit lipid peroxidation in healthy humans. Free Radical Biolwv & Medicine. 37(9):1351-1359.
178. NAGAI, T. 8 YUKIMOTO, T., 2003. Preparation and functional properties of beverages made from sea algae. FoodChemistrv, 81:327-332.
179. NEGI, P.S., JAYAPRUKASHA, G.K. & JENA, B.S., 2003. Antioxidant and antimutagenic activities of pomegranate peel extracts. Food Chemistrf, 80:393-397.
180. NEL, J.N. 8 STEYN, N.P., 2001. Report on South African food consumption studies undertaken against different population groups, 1983 - 2000. Medical Research Council of South Africa, http:/lwww.mrc.ac.za.chroniclfoodstudies.h~l.
181. NETZEL, M., STRASS, G., HERBST, M., DIETRICH. H., BITSCH, R., BITSCH. 1. 8 FRANK, T., 2005. The excretion and biological antioxidant activtty of elderberry antioxidants in healthy humans. Food Research International, article in press.
182. NOBLE. A.C.. 1994. Bitterness in wine. Phvsiolwv and Behavior, 56(6):1251-1255
183. O'BYRNE, D.J., DEVARAJ, S., GRUNDY, S.M. 8 JIALAL, I., 2002. Comparison of the antioxidant effects of Concord grape iuice flavonoids alpha-tocopherol on markers of . . oxidative stress in healthy adults. The American journal of Clinical Nutrition, 76(6):1367-1374. December.
184. O'MAHONY, M., 1995. Sensory measurement in food science: faing methods to goals. Food Technoloqy, 49:72-82. April.
185. OKUDA, T., 2005. Systematics and health effects of chemically distinct tannins in medicinal plants. Phvtochemistry, article in press.
186. OZAWA, T., LILLEY, T.H. 8 HASLAM, E., 1987. Polyphenol interactions: astringency and the loss of astringency in ripening fruit. Phvtochemist~, 26(11):2937-2942.
187. PARK, W-H., KIM, S-H. & KIM, C-H., 2005. A new matrix metalloproteinase-9 inhibitor 3,4dihydroxycinnamic acid (caffeic acid) from methanol extract of Euonymus alatus: isolation and structure determination. Toxicolwy, 207:383-390.
188. PEARSON. D.A.. HOLT. R.R.. REIN. D.. PAGLIERONA. T.. SCHMITZ. H.H. & KEEN. C.L., 2005.' ~ l a~ono l s and pktelet rkactivlty. Clinical & evel lop mental lmmunoloqy: 12(1):1-9. March.
189. PEDERSEN, C.B.. KYLE. J., JENKINSON, A.Mc.E, GARDNER, P.T.. McPHAIL, D.B. & DUTHIE, G.G.. 2000. Effects of blueberry and cranberry juice consumption on the plasma antioxidant capacity of healthy female volunteers. Eurooean Journal of Clinical Nutrition, 54405408.
-- Chapter 6 --
PELEG, H. & NOBLE, A.C., 1999. Effect of viscosity, temperature and pH on astringency in cranberry juice. Food Qualify and Preference, 10:343-347.
PETERS, U., POOLE, C. & ARAB, L., 2001. Does tea affect cardiovascular disease? A meta-analysis. American Journal of E ~ i d e m i ~ l ~ q y , 154(6):495503.
PETERSON, J., LAGIOU, P.. SAMOLI, E., KATSOUYANNI. K., LA VECCHIA, C., DWYER, J. 8 TRICHOPOULOS, D., 2003. Flavonoid intake and breast cancer risk: a case-control study in Greece. British Journal of Cancer, 89:1255-1259.
PICKERING, G.J., SIMUNKOVA, K. & DIBATTISTA. D., 2004. Intensity of taste and astringency sensations elicited by red wines is associated with sensitivity to PROP (6 n-propylthiouracil). Food Qualitv and Preference, 15:147-154.
POLLARD, R., & TIMBERLAKE, C.F., 1971. Fruit juices, in Fruit Processing. (eds D. Arthey & P.R. Ashurst) Blackie Academic 8 Professional, an imprint of Chapman 8 Hall, London:573-613.
POPPER, R.. ROSENSTOCK, W., SCHRAIDT, M. & KROLL, B.J.. 2004. The effect of attribute questions on overall liking ratings. Food Quality and Preference, 15:853-858.
PRINZ, J.F. & LUCAS, P.W., 2000. Saliva tannin interactions. Journal of Oral Rehabilitation, 27:991-994.
PRIOR, R.L. 8 GU, L., 2005. Occurrence and biological significance of proanthocyanidins in the American diet. -, article in press.
PROTEGGENTE, A.R.. PANNALA, AS.. PAGANGA, G.. VAN BUREN, L.. WAGNER, E., WISEMAN. S., VAN DE PUT, F., DACOMBE, C. & RICE-EVANS, C.A., 2002. The antioxidant activity of regularly consumed fruit and vegetables reflects their phenolic and vitamin C composition. Free Radical Research, 36(2):217-233.
PROTEGGENTE. A.R., SAIJA, A., DE PASQUALE, A. 8 RICE-EVANS, c.A., 20133. The compositional characterisation and antioxidant activity of fresh juices from Sicilian sweet orange (Citrus sinensis L. Osbeck) varieties. Free Radical Research, 37(6):681- 687.
RAKIC, S.. POVRENOVIC, D., TESEVIC. V.. SIMIC. M. & MALETIC. R.. 2005. Oak acorn, polyphenols and antioxidant activity in functional food. journal of Food Engineering, article in press.
RAMADAN, M.F. 8 MORSEL. J-T.. 2003. Recovered lipids from prickly per [Opuntia ficus-indica (L.) Mill] peel: a good source of polyunsaturated fatty acids, natural antioxidant vitamins and sterols. Food Chemistry. article in press.
RAMIREZ-MARES, M.V., CHANDRA, S. 8 GONZALEZ DE MEJIA, E., 2004. In vitro chemopreventive activity of Camellia sinensis, llex paraguariensis and Ardisia compressa tea extracts and selected polyphenols. Mutation Research, 554:53-65.
RAPISARDA, P., TOMAINO, A., CASCIO, R.L., BONINA, F.. DE PASQUALE, A. 8 SAIJA. A., 1999. Antioxidant effectiveness as influenced by phenolic content of fresh orange juices. Journal of A~ricultural Food Chemistry, 47:4718-4723.
Chapter 6
204. RAPISARDA, P., PANNUUO, P., ROMANO, G. & RUSSO, G., 2003. Juice components of a new pigmented citrus hybrid Citrus sinensis (L.) Osbeck x Citrus clementina Horl. ex Tan. Journal of A~ricultural& Food Chemistw, 51 : 161 1-1 61 6.
205. RASO, J. & BARBOSA-CANOVAS, G.V., 2003. Nonthermal preservation of foods using combined processing techniques. Critical Reviews in Food Science & Nutrition, 43(3):265-285.
206. REED. J., 2002. Cranberry flavonoids, atherosclerosis and cardiovascular health. Critical Reviews in Food Science & Nutrition, 42(Suppl.):301-316.
207. RESURRECCION, A.V.A., 1998. Consumer Sensorv Testinq For Product Develo~menf. Published by Aspen Publishers Inc., Gaithersburg, Maryland.
208. RIENELD, A. & WISEMAN, S., 2003. Antioxidant effects of tea: evidence from human clinical trials. American Society for Nutritional Sciences, 0022-3166103:3285S.
209. ROBARDS, K. & ANTOLOVICH, M., 1997. Analytical chemistry of fruit bioflavonoids: a review. A&, Vo1122(11R-34R). February.
210. ROSS. S., 2000. Functional foods: the Food and Drug Administration perspective. American Joumal of Clinical Nutrition. 71 (Suppl.):1735S-1738s.
211. ROY, S., KHANNA, S.. ALESSIO, H.M., VIDER, J., BAGCHI, D., BAGCHI, M. &SEN, C., 2002. Anti-angiogenic properly of edible berries. Free Radical Research, 36(9):1023-1031.
212. RUDDER, A., AINSWORTH, P. & HOLGATE, D., 2001. New food product development: strategies for success? British Food Journal, 103(9):657-670.
213. RUEL, G., POMERLEAU, S., COUTRE, P., LARARCHE, B. & COUILLARD, C., 2005. Changes in plasma antioxidant capacity and oxidised low-density lipoprotein levels in men after short-term cranberry juice consumption. Metabolism Clinical and E x p e ~ n t a l , 54:856861
214. RUEL, M.T., MINOT, N. & SMITH, L., 2005. Patterns and determinants of fruit and vegetable consumption in sub-Saharan Africa: a multicountry comparison. International Food Policy Research Institute. World Health Omanisation (WHO1, 1-45.
215. RUSAK, G., GUTZEIT, H.O. & MULLER, J.L., 2005. Structurally related flavonoids with antioxidant properties differentially affect cell cycle progression and apoptosis of human actute leukemia cells. Nutrition Research, 25141-153.
216. RUTLEDGE, P., 1996. Production of non-fermented fruit products, in Fruit Processinq. (eds D. Arthey & P.R. Ashurst) Blackie Academic & Professional, an imprint of Chapman & Hall, London:70-96.
217. SABS -see SOUTH AFRICAN BUREAU OF STANDARDS.
218. SAHARI, M.A., BOOSTANI, F.M. & HAMlDl E.Z., 2004. Effect of low temperature on the ascorbic acid content and quality characteristics of frozen strawbeny. Chemistrv, 86:357-363.
219. SAHER, M., ARVOLA, A,, LINDEMAN, M. & LiiHTEENMAKI, L., 2004. Impressions of functional food consumers. A~petite, 42:79-89.
Chapter 6
220. SALTMARSH, M., CROZIER, A. & RATCLIFFE, B., 2003. Fruits and vegetables, in Plants: Diet and Health (ed. G. Goldberg). Blackwell Publishing for the British Nutrition Foundation.
221. SAN MARTIN, M.F., BARBOSA-CANOVAS, G.V. & SWANSON, B.G., 2002. Food processing by high hydrostatic pressure. Critical Reviews in Food Science and Nutrition, 42(6):627-645.
222. SCALBERT. A., MANACH, C., MORAND, C. & REMESY, C., 2005. Dietaly polyphenols and the prevention of disease. Critical Reviews in Food Science and Nutrition, 45287-306.
223. SCHIEBER, A,, ULLRICH, W. & CARLE, R., 2000. Characterisation of polyphenols in mango puree concentrate by HPLC with diode and mass spectrometric detection. Innovative Food Science & Erneqfno Technolosies, 1 :161-166.
224. SCHIEBER, A., STINTZING, F.C. & CARLE, R., 2001. By-products of plant food processing as a source of functional compounds - recent developments. Trends in Food Science and Technolcqy, 12:401413.
225. SEERAM, N.P., ADAMS, L.S., HARDY, M.L. 8 HEBER, D., 2004. Total cranberry extract versus its phytochemical constituents: antiproliferative and synergistic effects against human tumor cell lines. Journal, 52:2512-2517.
226. SESSO, H.D., GAZIANO, J.M., LIU, S. & WRING, J.E., 2003. Flavonoid intake and the risk of cardiovascular disease in women. Arnerfcan Journal of Clinical Nutrition, 77:14001408.
227. SHIMODA, M., KATOH, T., SUZUKI, J.. KAWARAYA. A,, IGURA, N., HAYAKAWA, I., 2003. Changes in the odours of reconstituted apple juice during thermal processing. Food Research International. 36:439445.
228. SIEBERT , K.J. & CHASSY, A.W., 2003. An alternate mechanism for the astringent sensation of acids. Food Qualitv and Preference, 15:13-18.
229. SIEGMUND, 6.. DERLER, K. & PFANNHAUSER, W., 2004. Chemical and sensory effects of glass and laminated carton packages on fruit juice products - still a controversial topic. Lebensrn.-Wiss. U.-Technol.. 37:481-488.
230. SILALAHI, J., 2002. Anticancer and health protective properties of citrus fruit components. Asia Pacific Journal of Clinical Nutrition, 11(1):79-84.
231. SINGH, U.P., SINGH, D.P., SINGH, M.. MAURYA, S., SRIVASTAVA, J.S., SINGH, R.6 & SINGH, S.P.. 2004. Characterisation of phenolic compounds in some Indian mango cultivars. International Journal of Food Sciences & Nutrition, 55(2):163-169. March.
232. SINGLETON, V.L. & ROSSI, J.A., 1965. Colorimetly of total phenolics with phosphomolybdic - phosphotungistic acid reagents. American Journal En01 Vitic., 16:144-158.
233. SKIBOLA, C.F. & SMITH, M.T., 2000. Potential health impacts of excessive flavonoid intake. Free Radical Bioloav & Medicine, 29(3/4):375-383.
Chapter 6
234. SLINKARD, K & SINGLETON, V.L., 1977. Total phenol analysis. Am. J. En01 Vitic, 28:49-58.
235. SLOAN, A.E., 2000. The top ten functional f w d trends. Food Technolw, 54(4):33- 60.
236. SLOAN, A.E., 2004. The top 10 functional food trends 2004. Food Technolwv, 58(4):2851. April.
237. SOLOMON, G.E.A., 1991. Language and categorization in wine expertise, in Sensory Science Theorv and Aoolications in Foods (eds H.T. Lawless 8 B.P. Klein - Institute of Food Technologists). Marcel Dekker Inc., New York269-294.
238. SOUTH AFRICAN BUREAU OF STANDARDS (SABS), 1987. Microbiology -general guidance for enumeration of yeasts and moulds - colony counting technique at 25'C. Consultina Microbiolocrical Laboratow (Ply) Ltd (CML). Good Laboratory Practice GLP028102.
239. SOUTH AFRICAN BUREAU OF STANDARDS (SABS). 1998. Microbiology of food and animal stuffs - horizontal method for the enumeration of mesophilic lactic acid bacteria - colony counting technique at 30°C. Consufiinq Microbidwical Laboratory (Ph/) Ltd (CML). Good Laboratory Practice GLP029102.
240. STATSOFT, INC, 2005, http:/~.statsoft.com.
241. STEWART-KNOX, B. & MITCHELL, P., 2003. What separates the winners from the losers in new food product development? Trends in Food Science & Technoloqf, 14:58-64.
242. STONE, H. 8 SIDEL, J.L., 1985. Sensow Evaluation Practices. Published by New York Academic Press.
243. STONE, H. 8 SIDEL, J.L., 1995. Strategic applications for sensory evaluation in a global market. Food Technobay, 49:84-89. February.
244. STONE, H., 1999. Sensory evaluation: science and mythology. Food Technoloaf, 53:124. October.
245. STONE. H. 2005. Perceptins and products. Contemporary sensory practices. SAAFOST (South African Association of Scientists and Technologists) presentation at 18m Biennial Congress, Stellenbosch. 8m September. Copyright 2005 Tragon Corporation.
246. STRANEY, D., KHAN, R., TAN, R. 8 BOGGA, S., 2002. Host recognition by pathogenic fungi through plant flavonoids, in Flavonoids In Cell Function, (eds B.S. Buslig 8 J.A. Manthey), Klewer Academic / Plenum Publishers:9-22.
247. SUN, J., CHU, Y-F., WU, X. & LIU, R.H., 2002. Antioxidant and antiproliferative activities of common fruits. Joumal of Aaricultural Food Chemistry, 50:7449-7454.
248. TAUXE, R.V.. 1997. Emerging foodborne diseases: an evolving public health challenge. Emeraina Infectious Diseases, 3(4): 425434.
Chapter 6
249. TAYLOR. €3.. 2005. Fruit and juice processing, in Chemistw and Technolwv of Sot7 Drinks and Fruit Juices, second edition (ed P.R. Ashurst), Blackwell Publishing Ltd:35- 66.
250. TAYLOR, L.P. 8 MILLER, K.D., 2002. The use of a photoactivatable kaempferol analogue to probe the role of flavonol 3-Ogalactosyltransferase in pollen germination, in Flavonoids In Cell Function, (eds B.S. Buslig 8 J.A. Manthey), Klewer Academic I Plenum Publishers:41-50.
251. TOHILL, B.E., 2005. Health benefis of high fruit and vegetable consumption. International workshop on the consumption of fruit and vegetables for health and nutrition. Paper at 18" International Congress of Nutrition, 19-23 September, Durban, South Africa
252. TRAN. M.T.T. 8 FARID, M.. 2004. Ultraviolet treatment of orange juice. Innovative Food Science and EmeraInq Technolc~ies, article in press.
253. TREVISANATO, S.I. 8 KIM, Y-I., 2000. Tea and health. Nutrition Reviews, 58(1):1-10.
254. URALA. N. 8 IAHTEENMAKI, L., 2003. Reasons behind consumer's functional food choices. Nutrition and Food Science, 33(4):148158.
255. URALA, N. 8 IAHTEENMAKI, L., 2004. Attitudes behind customer's willingness to use functional foods. Food Qualitv and Preference, article in press.
256. VALENTOVA, H., SKROVANKOVA, S., PANOVSKA, Z. 8 POKORNY, J., 2002. Time- intensity studies of astringent taste. Food Chemistfy, 78:29-37.
257. VAN DER HEIDE, D., KASTELIJN, J. 8 SCHRODER-VAN DER ELST, J.P., 2003. Flavonoids and thyroid disease. BioFactors, 19:113-119.
258. VAN KLEEF. E.. VAN TRIJP. H.C.M. 8 LUNING. P., 2005(a). Consumer research in the early stages of new product development: a criiical review of methods and techniques. Food Qualitv and Preference. 16:181-201.
259. VAN KLEEF, E., VAN TRIJP, H.C.M. 8 LUNING, P., 2005(b). Reply to commentaries on: van Kleef, van Triip and Lunina. "Consumer research in the earlv staaes of new - product development: a critical review of methods and techniques". food Qualitv and Preference. 16:223-226.
260. VERBEKE, W.. 2005. Consumer acceptance of functional foods: socidemographic, cognitive and attitudinal determinants. Food Qualitv and Preference. 16:45-57.
261. VERHEILIG, H. 8 PICHE, Y., 2002. Signalling in arbuscular mycorrhiza: facts and hypotheses, in Flavonoids In Cell Function, (eds B.S. Buslig 8 J.A. Manthey), Klewer Academic I Plenum Publishers:2340.
262. VERHOEYEN, M.E., BOW, A., COLLINS, G.. MUIR. S., ROBINSON. S., DE VOS. C.H.R. 8 COLLIVER, S.. 2002. Increasing antioxidant levels in tomatoes through modifeation of the flavonoid biosynthetic pathway. Journal of Exoerimental Botan~, 53(377). Fruit Development and Ripening Special Issue: 2099-2106. October.
263. VERSCHUREN, P.M., 2002. Functional foods: scientific and global perspectives. British Joumal of Nutrition. 88(Supp1.2):S125-S130.
Chapter 6
264. VIDAL, S., FRANCIS, L., NOBLE, A., KWIATKOWSKI, M., CHEYNIER, V. & WATERS, E.. 2003. Taste and mouth-feel properties of different types of tannin-like polyphenolic compounds and anthocyanins in wine. Analvtica Chimica Acta, 51 3:57-65.
265. VIRGILI, F., ACCONCIA, F., AMBRA, R., RINNA, A,, TOTTA, P. & MARINO, M., 2004. Nutriiional flavonoids modulate estrogen receptor a signaling. Life, 56(3):145-151.
266. VISIOLI, F., BORSANI, L. & GALLI, C., 2000. Diet and prevention of coronary heart disease: the potential role of phytochemicals. Cardiovascular Research, 47:419425.
267. VITA. J.A.. 2003. Tea consumption and cardiovascular disease: effects on endothelial function. The American Societv for Nutritional Sciences, 133(Suppl.):3293S-32978.
268. VON HOLY, A. & MARAIS, J., 2001. How to document and manage PRP for HACCP and food safety systems: one day induction workshop, Von Holv Consulting. 1-80.
269. WALZEM. R.L., 2004. Functional foods. Trends in Fad Science and Technoloqy, 15:518.
270. WANSINK, B., 2003. Response to Garber et al., 'Measuring consumer response to food products". Sensory tests that predict consumer acceptance. Food Qualitv and Preference, 14:23-26.
271. WAREING. P. & DAVENPORT. R.R.. 2005. Microbiology of sofl drinks and fruit juices, in Chernistw and Technolwv of Soft Drinks and Frujt Juices, second edition (ed P.R. Ashurst). Blackwell Publishing Ltd:279-299.
272. WESTRATE, J.A., VAN POPPEL, G. & VERSCHUREN, P.M., 2002. Functional foods, trends and future. British Journal of Nutrition. 88(Supp1.2):S233-S235.
273. WHO (see World Health Organistion)
274. WILDMAN, R.E.C., 2001. Handbook of nutraceuticals & functional foods, chapter 1: classifying neutraceuticals. CRC Press, London.
275. WINKLER, P., ELLINGER. S., BOETZER, A.M., ARENDT, B.M., BERTHOLD, H.K., ROCKSTROH, J.K., SPENGLER, U. & GOERLICH, R., 2004. Lymphocyte proliferation and apoptosis in HIV-seropositive and healthy subjects during long-term ingestion of fruit juices or a fruit-vegetableconcentrate rich in polyphenols and antioxidant vitamins. Euro~ean Journal of Clinical Nutrition, 58:317-325.
276. WOO, H-H., KULLOCH, G., HIRSCH, A.M. & HALVES, M.C., 2002. Flavonoids: sianal molecules in plant development. In Flavonords In Cell Funct~on. (eds B S Busl~g & J.A. Manthey). Klewer Academ~c I Plenum Publ~shers 51-60
277. WORLD HEALTH ORGANISATION (WHO), 2005. Obesity and overweight. h l t ~ : / / w w w . w h o . i n t l d i e t ~ h v s i ~ a l a c t i v i t y / n t . h t l 18/10/05.
278. WU, C., KUO, J.M. & SUN PAN, B., 2002. Flavour compounds, in: thenmical and functional properties of food components series. Edited by Zolzislow E. Sikorski. 2"6 edition. CRC Press.
279. WU. X., GU, L., HOLDEN, J., HAMOWITZ. D.B., GEBHARDT, S.E., BEECHER, G. & PRIOR, R.L.. 2004. Development of a database for total antioxidant capaclty in foods: a preliminary study. Journal of Food Corn~osition and Analvsis, 17:407422.
Chapter 6
280. XU, F., SONG, D. & ZHEN, Y., 2004. Inhibition of tumor metastasis by sodium caffeate and its effect on angiogenesis. Oncolwv, 67(1):88-92.
281. YU, L., HALEY, S., PERRET, J. & HARRIS, M., 2004. Comparison of wheat flours grown at different locations for their antioxidant properties. Food Chemistry, 86:ll-16.
282. ZBIKOWSKA, H.M.. OMS, B., WACHOWICZ, 6. & KRAJEWSKI, T., 1999. Response of blood platelets to resveratrol. Platelets, 10:247-252.

Appendices
APPENDICES
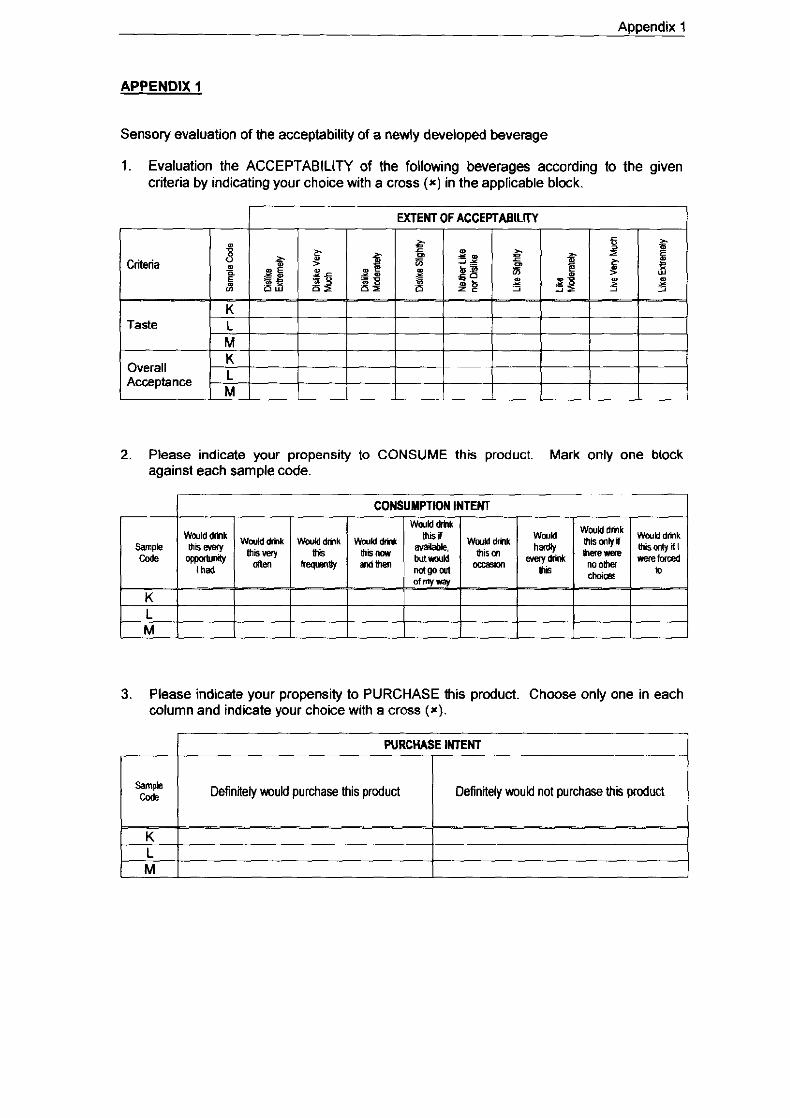
Appendix 1
APPENDIX I
Sensory evaluation of the acceptability of a newly developed beverage
1. Evaluation the ACCEPTABILITY of the following beverages according to the given criteria by indicating your choice with a cross (x) in the applicable block.
1 EXTENT OF ACCEPTABILITY I
2. Please indicate your propensity to CONSUME this product. Mark only one block against each sample code.
3. Please indicate your propensity to PURCHASE this product. Choose only one in each column and indicate your choice with a cross ( x ) .
PURCHASE WENT
Definitely would purchase this pmduct Definitely would not purchase this product
Appendix 2
APPENDIX 2
INSTRUCTIONS!
Thank you for coming here today.
We have developed fruit juices that have some added nutritional benefits. They may aid in the reduction of degenerative diseases such as heart disease & cancer and boost the immune system. We would like you to evaluate the sensory acceptability of these juices by completing Forms A and 0.
Form A is a simple questionnaire which gives some anonymous details as to your age & occupation and as to how often you normally drink fruit juice.
Form B is the sensory form which evaluates acceptability, preference, consumption intent and purchase intent.
We'll go over the forms to ensure you understand them completely. Please do not confer with anyone during the evaluation or make noises that would influence other people's opinion, nor discuss the results afterwards as we have several other sessions still to take place.
We are indebted for your co-operation. Thanks, once again.

Appendix 3
APPENDIX 3
CONSUMER QUESTIONNAIRE: STRICTLY CONFIDENTIAL
QUESTIONNAIRE NO.:
SECTION A: DEMOGRAPHIC INFORMATION
Mark the appropriate square with a cross X :
1. Gender
2 . Age
3. Occupation
Male
Female
Between: 18 g 25
26 & 39
Over 40
Student
Educational (Academic)
Professional
Administrative
4. Are you aware of the role Yes
of nutrition in health? No
5. How often do you drink Light user 2 - 3 I month lo fruit juice? Moderate user 1 - 2 1 week 17
Heavy user > 3 times a week 0
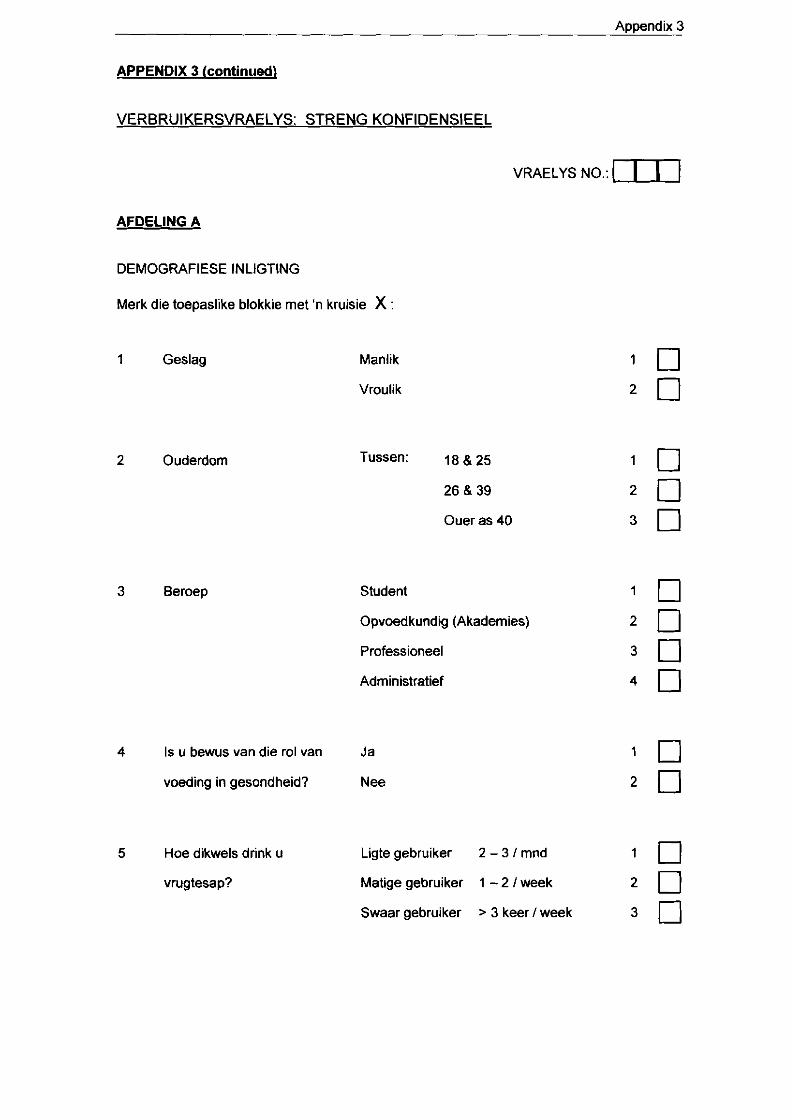
Appendix - 3
APPENDIX 3 (continued)
VERBRUIKERSVRAELYS: STRENG KONFIDENSIEEL
VRAELYS NO.:
DEMOGRAFIESE INLIGTING
Merk die toepaslike blokkie met 'n kruisie X :
1 Geslag
2 Ouderdom
3 Beroep
Manlik
Vroulik
Tussen: 18 g 25
26 39
Ouer as 40
Student
Opvoedkundig (Akademies)
Professioneel
Administratief
4 Is u bewus van die rol van Ja
voeding in gesondheid? Nee
5 Hoe dikwels drink u Ligte gebruiker 2 - 3 I mnd lo vrugtesap? Matige gebruiker 1 - 2 I week 0
Swaar gebruiker > 3 keer 1 week 0

Appendix 3
APPENDIX 3 (continued)
SECTION 6: SENSORY EVALUATION OF THE ACCEPTABILITY OF NEWLY DEVELOPED FRUIT JUICES WITH AN ADDED HEALTH BENEFIT
You are presented with 3 samples of juice. Please evaluate them in the specifed order. You may cleanse your palate with water in between tasting. You must finish of the samples by the end of the tasting session, however, you may re-taste during the evaluations.
1 Acceptability
Evaluate the acceptability of the following beverages according to the given criteria by indicating your choice with a cross in the appropriate block:
2. Preference
You have now evaluated all the samples for acceptability according to the above criteria. Please rank the samples in order of preference, starting with your most preferred sample first:
Please comment on the reasons for your choices:
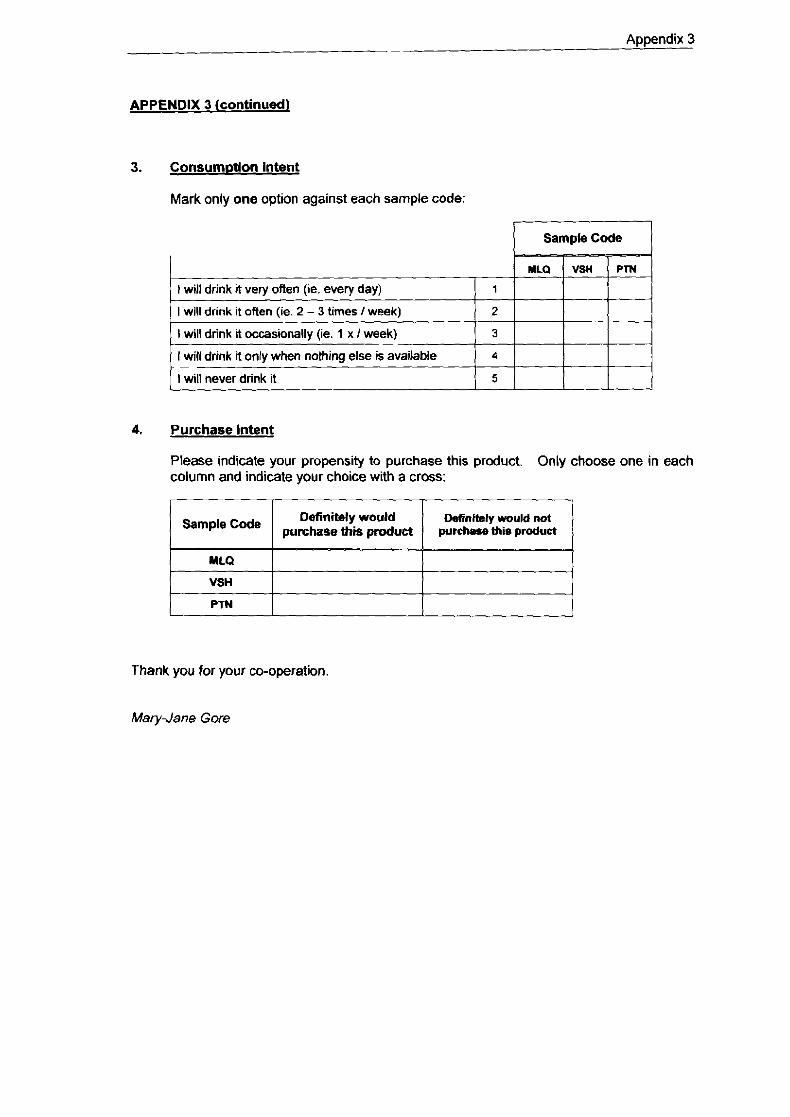
Appendix 3
APPENDIX 3 (continued)
3. Consumotion lntent
Mark only one option against each sample code:
4. Purchase lntent
Please indicate your propensity to purchase this product. Only choose one in each column and indicate your choice with a cross:
Definitely would DaCmikly wauld not purchase this product purchase fAis product
M LQ
VSH 1 I I I
PTN
Thank you for your co-operation
MaryJane Gore
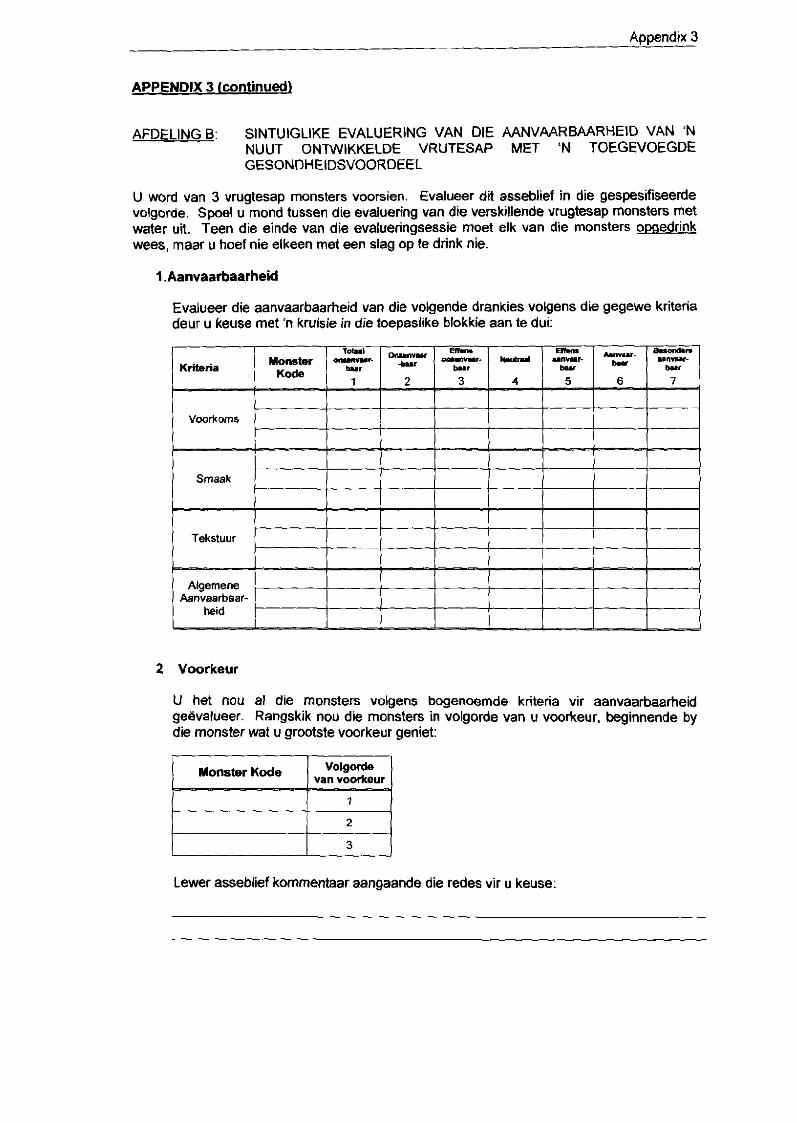
Appendix 3
APPENDIX 3 icontinuedl
AFDELING B: SlNTUlGLlKE EVALUERING VAN DIE AANVAARBAARHEID VAN 'N NUUT ONNVIKKELDE VRUTESAP MET 'N TOEGEVOEGDE GESONDHEIDSVOORDEEL
U word van 3 vrugtesap monsters voorsien. Evalueer dit asseblief in die gespesifiseerde volgorde. Spoel u mond tussen die evaluering van die verskillende vrugtesap monsters met water uit. Teen die einde van die evalueringsessie moet elk van die monsters opaedrink wees, maar u hoef nie elkeen met een slag op te drink nie.
Evalueer die aanvaarbaarheid van die volgende drankies volgens die gegewe kriteria deur u keuse met 'n kruisie in die toepaslike blokkie aan te dui:
Voorkeur
U het nou al die monsters volgens bogenoemde kriteria vir aanvaarbaarheid geevalueer. Rangskik nou die monsters in volgorde van u voorkeur, beginnende by die monster wat u grootste voorkeur geniet:
Lewer asseblief kommentaar aangaande die redes vir u keuse:
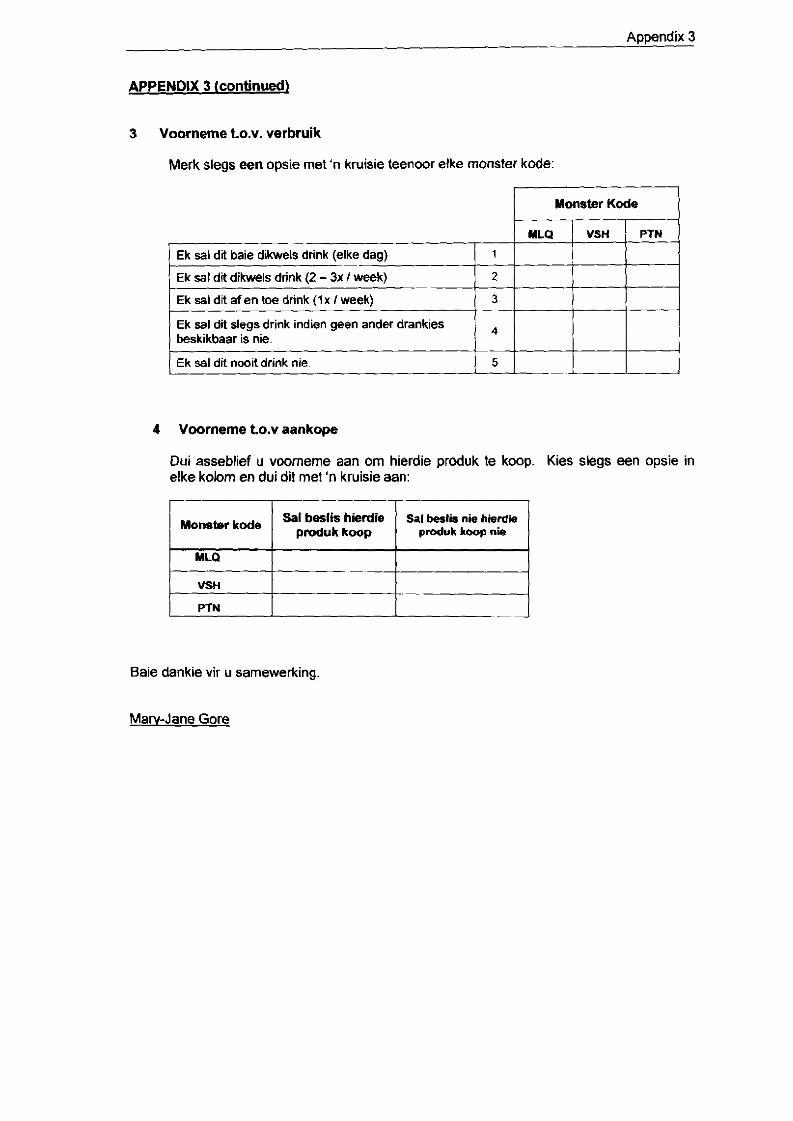
- Appendix 3
APPENDIX 3 lcontinued)
3 Voorneme t.0.v. verbruik
Merk slegs een opsie met 'n kruisie teenoor elke monster kode:
Monster Kode
Ek sal dit dikwels drink 12 - 3x / week)
I Ek sat dit nooil drink nie 1 5 1 I 1 1
Ek saI dit af en toe drink ( I x I week)
Ek sal dit slegs drink indien geen ander drankies beskikbaar is nie.
Voorneme to.v aankope
Dui asseblief u voomeme aan om hierdie produk te koop. Kies slegs een opsie in elke kolom en dui dit met 'n kruisie aan:
~ - 3
4
I I Sal beslis hierdie Sal beslis nie hierdie
Monster kode produk koop I produk ~ o o p nie
!
I
VSH
PTN - J
Baie dankie vir u samewerking.
Marv-Jane Gore
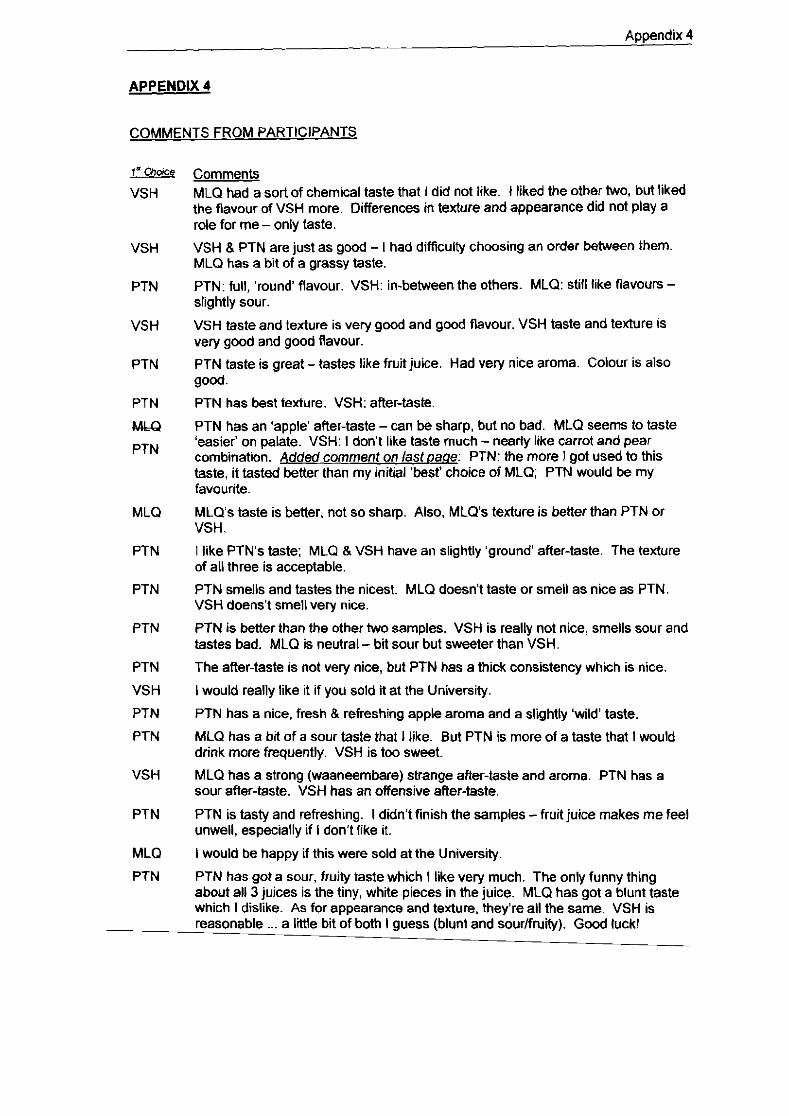
Appendix 4
APPENDIX 4
COMMENTS FROM PARTICIPANTS
VSH
VSH
PTN
VSH
PTN
PTN
M u
PTN
MLQ
PTN
PTN
PTN
PTN
VSH
PTN
PTN
VSH
PTN
MLQ
PTN
Comments MLQ had a sort of chemical taste that I did not like. I liked the other two. but liked the flavour of VSH more. Differences in texture and appearance did not play a role for me - only taste.
VSH & PTN are just as good - I had difficulty choosing an order between them. MLQ has a bit of a grassy taste.
PTN: full, 'round' flavour. VSH: in-between the others. MLQ: still like flavours - slightly sour.
VSH taste and texture is very good and good flavour. VSH taste and texture is very good and good flavour.
PTN taste is great - tastes like fruit juice. Had very nice aroma. Colour is also good.
PTN has best texture. VSH: after-taste.
PTN has an 'apple' after-taste - can be sharp, but no bad. MLQ seems to taste 'easier' on palate. VSH: I don't like taste much - nearly like carrot and pear combination. Added comment on last Rase: PTN: the more I got used to this taste, it tasted better than my initial 'best' choice of MLQ; PTN would be my favourite.
MLQ's taste is better, not so sharp. Also. MLQ's texture is better than PTN or VSH.
I like PTN's taste; MLQ & VSH have an slightly 'ground' afler-taste. The texture of all three is acceptable.
PTN smells and tastes the nicest. MLQ doesn't taste or smell as nice as PTN. VSH doens't smell very nice.
PTN is better than the other two samples. VSH is really not nice, smells sour and tastes bad. MLQ is neutral - bit sour but sweeter than VSH.
The after-taste is not very nice, but PTN has a thick consistency which is nice.
I would really like it if you sold it at the University.
PTN has a nice, fresh 8 refreshing apple aroma and a slightly 'wild' taste.
MLQ has a bit of a sour taste that I like. But PTN is more of a taste that I would drink more frequently. VSH is too sweet.
MLQ has a strong (waaneembare) strange after-taste and aroma. PTN has a sour after-taste. VSH has an offensive after-taste.
PTN is tasty and refreshing. I didn't finish the samples - fruit juice makes me feel unwell, especially if I don't like it.
I would be happy if this were sold at the University.
PTN has got a sour, fruity taste which I like very much. The only funny thing about all 3 juices is the tiny, white pieces in the juice. MLQ has got a blunt taste which I dislike. As for appearance and texture, they're all the same. VSH is reasonable ... a l i l e bit of both I guess (blunt and sourlfruity). Good luck!
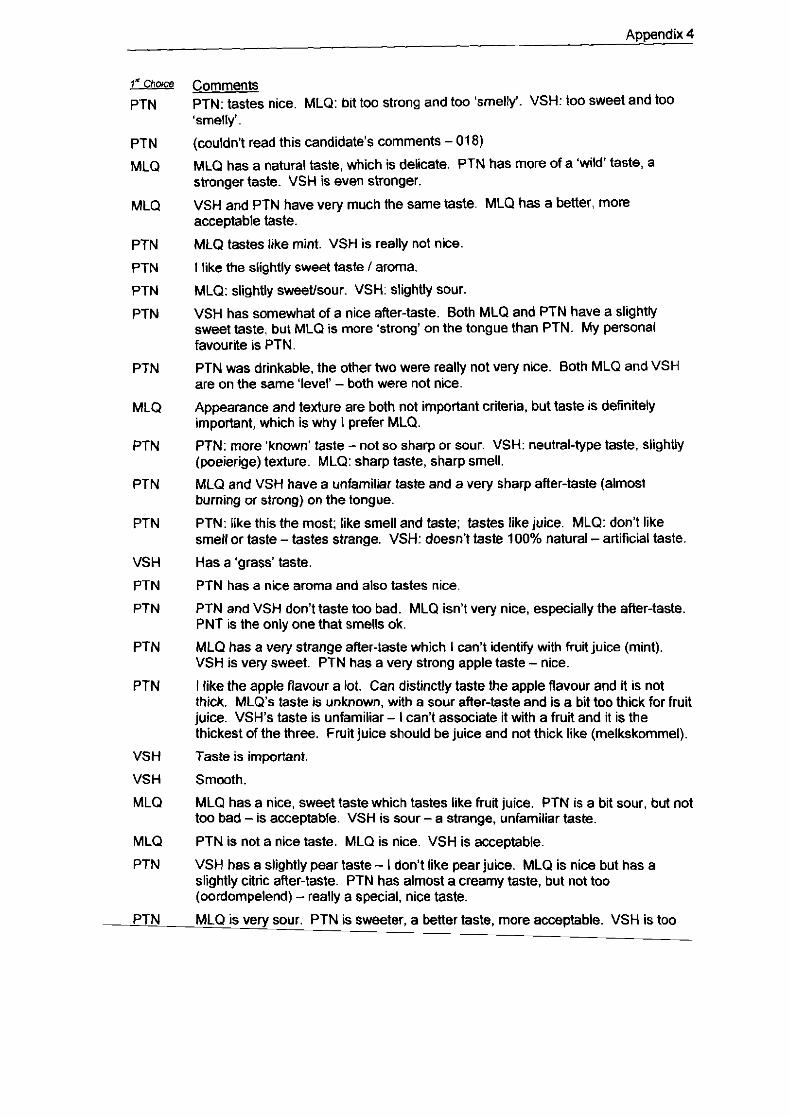
Appendix 4
P-c2J@@
PTN
PTN
MLQ
MLQ
PTN
PTN
PTN
PTN
PTN
MLQ
PTN
PTN
PTN
VSH
PTN
PTN
PTN
PTN
VSH
VSH
MLQ
MLQ
PTN
PTN
Comments PTN: tastes nice. MLQ: bit too strong and too 'smelly'. VSH: too sweet and too 'smelly'.
(couldn't read this candidate's comments - 018)
MLQ has a natural taste, which is delicate. PTN has more of a 'wild' taste, a stronger taste. VSH is even stronger.
VSH and PTN have very much the same taste. MLQ has a better, more acceptable taste.
MLQ tastes like mint. VSH is really not nice.
I like the slightly sweet taste 1 aroma.
MLQ: slightly sweeffsour. VSH: slightly sour.
VSH has somewhat of a nice afler-taste. Both MLQ and PTN have a slightw sweet taste, but MLQ is more 'strong' on the tongue than PTN. My personal favourite is PTN.
PTN was drinkable, the other two were really not very nice. Both MLQ and VSH are on the same 'level' - both were not nice.
Appearance and texture are both not important criteria, but taste is definitely important, which is why I prefer MLQ.
PTN: more 'known' taste - not so sharp or sour. VSH: neutral-type taste, slightly (poeierige) texture. MLQ: sharp taste, sharp smell.
MLQ and VSH have a unfamiliar taste and a very sharp after-taste (almost burning or strong) on the tongue.
PTN: like this the most; like smell and taste; tastes like juice. MLQ: don't like smell or taste - tastes strange. VSH: doesn't taste 100% natural - artificial taste.
Has a 'grass' taste.
PTN has a nice aroma and also tastes nice.
PTN and VSH don't taste too bad. MLQ isn't very nice, especially the after-taste. PNT is the only one that smells ok.
MLQ has a very strange after-taste which I can't identify with fruit juice (mint). VSH is very sweet. PTN has a vety strong apple taste - nice.
I like the apple flavour a lot. Can distinctly taste h e apple flavour and it is not thick. MLQ's taste is unknown, with a sour after-taste and is a bit too thick for fruit juice. VSH's taste is unfamiliar - I can't associate it with a fruit and it is the thickest of the three. Fruit juice should be juice and not thick like (melkskommel).
Taste is important.
Smooth.
MLQ has a nice, sweet taste which tastes like fruit juice. PTN is a bit sour, but not too bad - is acceptable. VSH is sour - a strange, unfamiliar taste.
PTN is not a nice taste. MLQ is nice. VSH is acceptable.
VSH has a slightly pear taste - I don't like pear juice. MLQ is nice but has a slightly citric afler-taste. PTN has almost a creamy taste, but not too (oordompelend) - really a special, nice taste.
MLQ is verv sour. PTN is sweeter. a better taste. more acce~table. VSH is too
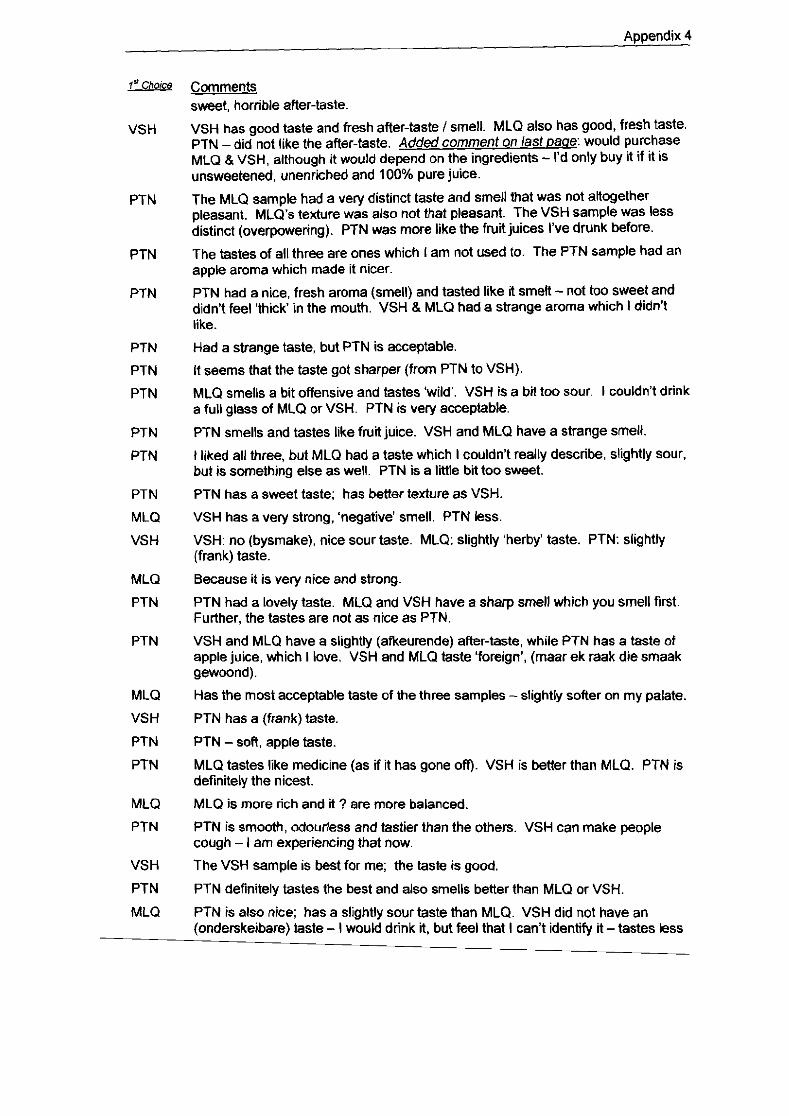
Appendix 4
Lma Comments sweet, horrible afler-taste.
VSH
PTN
PTN
PTN
PTN
PTN
PTN
PTN
PTN
PTN
MLQ
VS H
MLQ
PTN
PTN
MLQ
VS H
PTN
PTN
MLQ
PTN
VSH
PTN
MLQ
VSH has good taste and fresh afler-taste / smell. MLQ also has good, fresh taste. PTN -did not like the after-taste. Addedcomment on last Daae: would purchase MLQ & VSH, although it would depend on the ingredients - I'd only buy it if it is unsweetened, unenrkhed and 100% pure juice.
The MLQ sample had a very distinct taste and smell that was not altogether pleasant. MLQ's texture was also not that pleasant. The VSH sample was less distinct (overpowering). PTN was more like the fruit juices I've drunk before.
The tastes of all three are ones which I am not used to. The PTN sample had an apple aroma which made it nicer.
PTN had a nice, fresh aroma (smell) and tasted like it smelt - not too sweet and didn't feel 'thick' in the mouth. VSH 8 MLQ had a strange aroma which I didn't like.
Had a strange taste, but PTN is acceptable
It seems that the taste got sharper (from PTN to VSH).
MLQ smells a bit offensive and tastes 'wild'. VSH is a bit too sour. I couldn't drink a full glass of MLQ or VSH. PTN is very acceptable.
PTN smells and tastes like fruit juice. VSH and MLQ have a strange smell
I liked all three, but MLQ had a taste which I couldn't really describe, slightly sour. but is something else as well. PTN is a little bit too sweet.
PTN has a sweet taste; has better texture as VSH.
VSH has a very strong, 'negative' smell. PTN less
VSH: no (bysmake), nice sour taste. MLQ: slightly 'herby' taste. PTN: slightly (frank) taste.
Because it is very nice and strong
PTN had a lovely taste. MLQ and VSH have a sharp smell which you smell first. Further, the tastes are not as nice as PTN.
VSH and MLQ have a slightly (afkeurende) after-taste, while PTN has a taste of apple juice, which I love. VSH and MLQ taste 'foreign', (maar ek raak die smaak gewoond).
Has the most acceptable taste of the three samples - slightly softer on my palate.
PTN has a (frank) taste.
PTN -soft, apple taste
MLQ tastes like medicine (as if it has gone off). VSH is better than MLQ. PTN is definitely the nicest.
MLQ is more rich and it ? are more balanced
PTN is smooth, odourless and tastier than the others. VSH can make people cough - I am experiencing that now.
The VSH sample is best for me; Me taste is good.
PTN definitely tastes the best and also smells better than MLQ or VSH.
PTN is also nice; has a slightly sour taste than MLQ. VSH did not have an (onderskeibare) taste - I would drink it, but feel that I can't identify it - tastes less
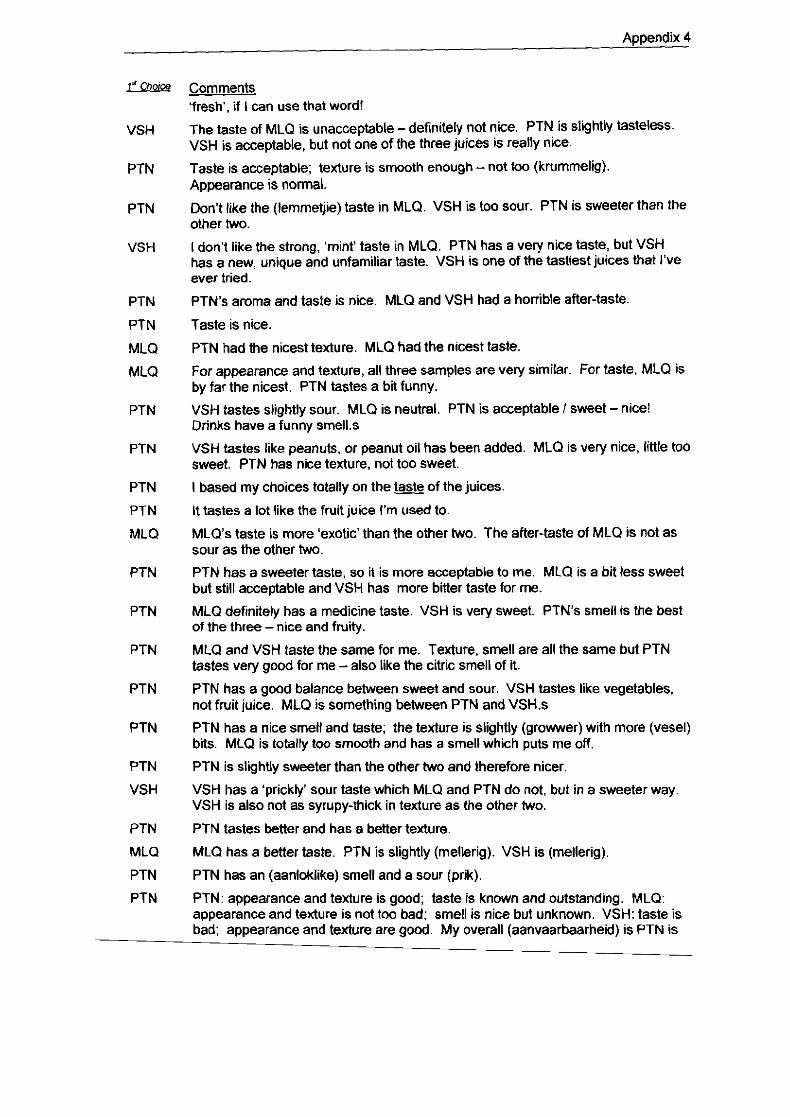
a
VSH
PTN
PTN
VSH
PTN
PTN
MLQ
MLQ
PTN
PTN
PTN
PTN
MLQ
PTN
PTN
PTN
PTN
PTN
PTN
VSH
PTN
MLQ
PTN
PTN
Appendix 4
-
Comments 'fresh', if I can use that word!
The taste of MLQ is unacceptable - definitely not nice. PTN is slightly tasteless VSH is acceptable, but not one of the three juices is really nice.
Taste is acceptable; texture is smooth enough - not too (krummel'i) Appearance is normal.
Don't like the (lemmetjie) taste in MLQ. VSH is too sour. PTN is sweeter than the other Wo.
I don't like the strong, 'mint' taste in MLQ. PTN has a very nice taste, but VSH has a new, unique and unfamiliar taste. VSH is one of the tastiest juices that I've ever tried.
PTN's aroma and taste is nice. MLQ and VSH had a horrible after-taste.
Taste is nice.
PTN had the nicest texture. MLQ had the nicest taste
For appearance and texture, all three samples are very similar. For taste. MLQ is by far the nicest. PTN tastes a bit funny.
VSH tastes slightly sour. MLQ is neutral. PTN is acceptable I sweet - nice! Drinks have a funny sme1l.s
VSH tastes like peanuts. or peanut oil has been added. MLQ is very nice, little too sweet. PTN has nice texture, not too sweet.
I based my choices totally on the && of the juices.
It tastes a lot like the fruit juice I'm used to
MLQ's taste is more 'exotic' than the other two. The after-taste of MLQ is not as sour as the other two.
PTN has a sweeter taste, so it is more acceptable to me. MLQ is a bit less sweet but still acceptable and VSH has more b ie r taste for me.
MLQ definitely has a medicine taste. VSH is very sweet. PTN's smell is the best of the three - nice and fruity.
MLQ and VSH taste the same for me. Texture, smell are all the same but PTN tastes very good for me - also like the citric smell of it.
PTN has a good balance between sweet and sour. VSH tastes like vegetables. not fruit juice. MLQ is something between PTN and VSH.s
PTN has a nice smell and taste; the texture is slightly (grower) with more (vesel) bits. MLQ is totally too smooth and has a smell which puts me off.
PTN is slightly sweeter than the other two and therefore nicer
VSH has a 'prickly' sour taste which MLQ and PTN do not, but in a sweeter way. VSH is also not as syrupy-thick in texture as the other two.
PTN tastes better and has a better texture
MLQ has a better taste. PTN is slightly (mellerig). VSH is (mellerig)
PTN has an (aanloklike) smell and a sour (prik)
PTN: appearance and texture is good; taste is known and outstanding. MLQ: appearance and texture is not too bad; smell is nice but unknown. VSH: taste is bad; appearance and texture are good. My overall (aanvaarbaarheid) is PTN is
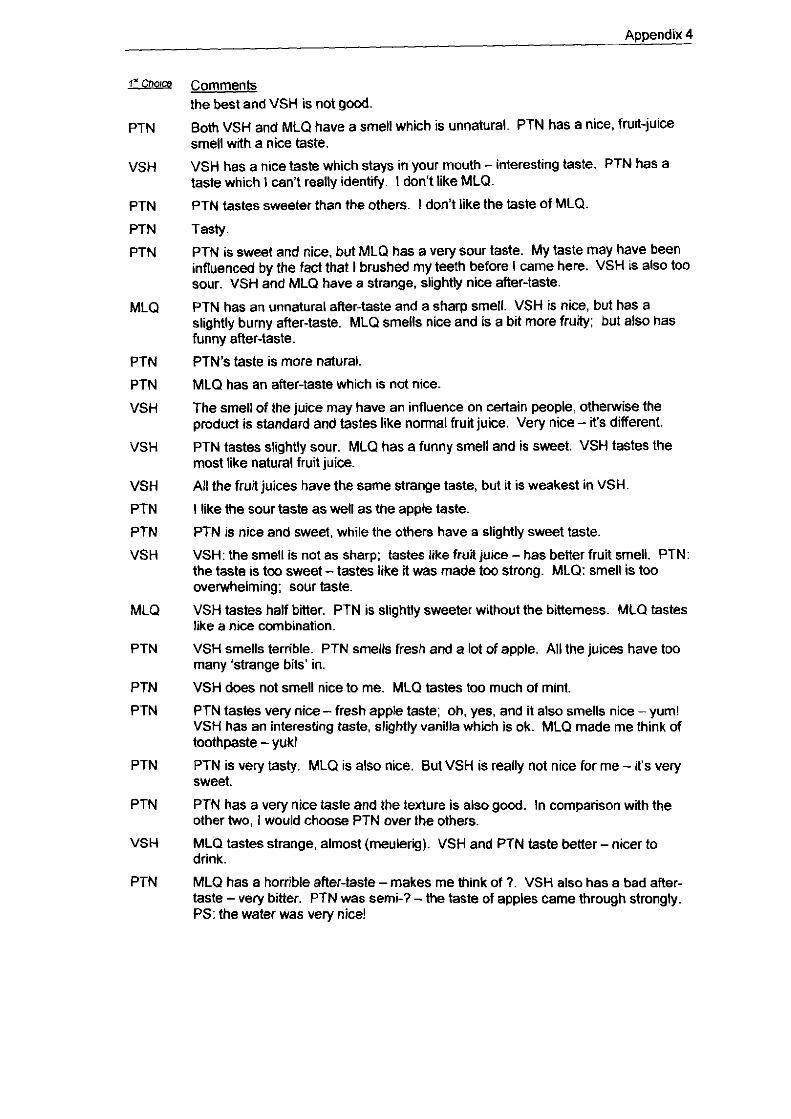
Appendix 4
PTN
VSH
PTN
PTN
PTN
MLQ
PTN
PTN
VSH
VSH
VSH
PTN
PTN
VSH
MLQ
PTN
PTN
PTN
PTN
PTN
VSH
PTN
Comments the best and VSH is not good.
Both VSH and MLQ have a smell which is unnatural. PTN has a nice, fruit-juice smell wth a nice taste.
VSH has a nice taste which stays in your mouth - interesting taste. PTN has a taste which I can't really identify. I don't like MLQ.
PTN tastes sweeter than the others. I don't like the taste of MLQ.
Tasty.
PTN is sweet and nice, but MLQ has a very sour taste. My taste may have been influenced by the fact that I brushed my teeth before I came here. VSH is also too sour. VSH and MLQ have a strange, slightly nice after-taste.
PTN has an unnatural afler-taste and a sharp smell. VSH is nice, but has a slightly bumy afler-taste. MLQ smells nice and is a bit more fruity; but also has funny afler-taste.
PTN's taste is more natural
MLQ has an afler-taste which is not nice.
The smell of the juice may have an influence on certain people, otherwise the product is standard and tastes like normal fruit juice. Very nice - it's different.
PTN tastes slightly sour. MLQ has a funny smell and is sweet. VSH tastes the most like natural fruit juice.
All the fruit juices have the same strange taste, but it is weakest in VSH.
I like the sour taste as well as the apple taste,
PTN is nice and sweet, while the others have a slightly sweet taste
VSH: the smell is not as sharp; tastes like fruit juice - has better fruit smell. PTN: the taste is too sweet - tastes like it was made too strong. MLQ: smell is too overwhelming; sour taste.
VSH tastes half bitter. PTN is slightly sweeter without the bitterness. MLQ tastes like a nice combination.
VSH smells terrible. PTN smells fresh and a lot of apple. All the juices have too many 'strange bits' in.
VSH does not smell nice to me. MLQ tastes too much of mint.
PTN tastes very nice - fresh apple taste; oh, yes, and it also smells nice - yum! VSH has an interesting taste, slightly vanilla which is ok. MLQ made me think of toothpaste - yuk!
PTN is very tasty. MLQ is also nice. But VSH is really not nice for me - it's very sweet.
PTN has a very nice taste and the texture is also good. In comparison with the other two, I would choose PTN over the others.
MLQ tastes strange, almost (meuler'g). VSH and PTN taste better - nicer to drink.
MLQ has a horrible after-taste -makes me think of ?. VSH also has a bad afler- taste - very bitter. PTN was semi-? - the taste of apples came through strongly. PS: the water was very nice!
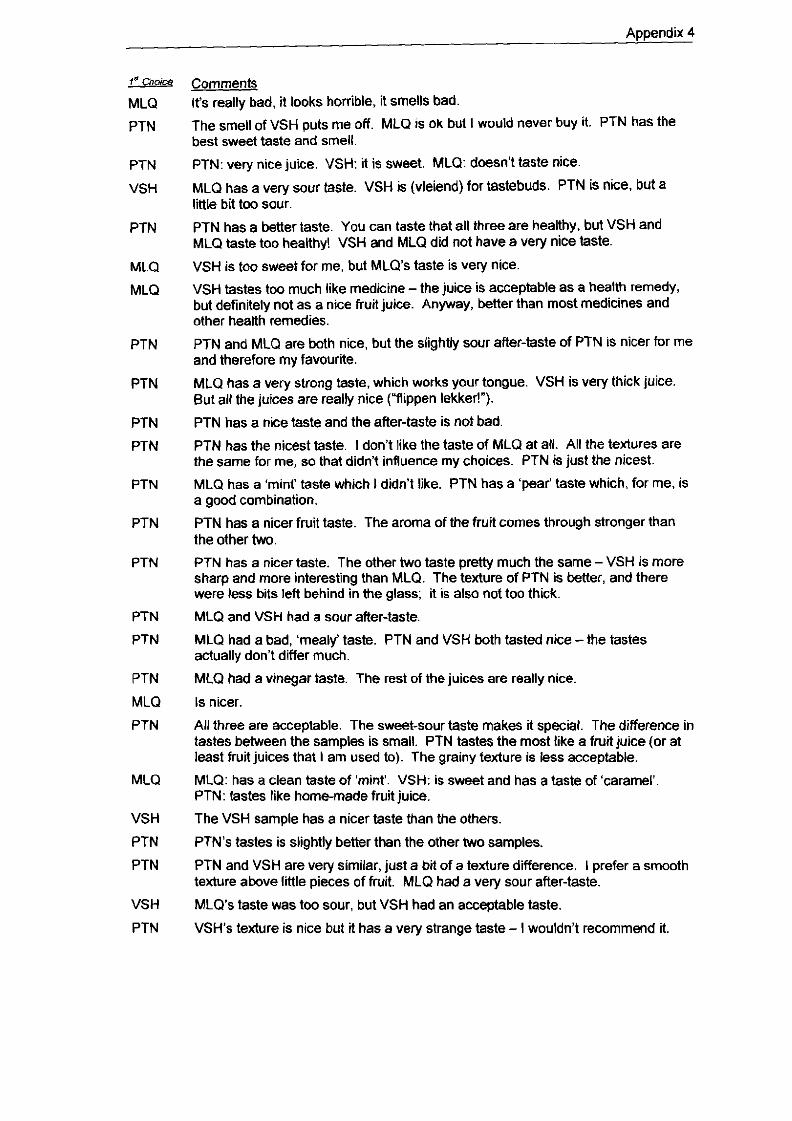
Appendix 4 - ~
MLQ
PTN
PTN
VSH
PTN
MLQ
MLQ
PTN
PTN
PTN
PTN
PTN
PTN
PTN
PTN
PTN
PTN
MLQ
PTN
MLQ
VSH
PTN
PTN
VSH
PTN
Comments It's really bad, it looks horrible, it smells bad.
The smell of VSH puts me off. MLQ is ok but I would never buy it. PTN has the best sweet taste and smell.
PTN: very nice juice. VSH: it is sweet. MLQ: doesn't taste nice.
MLQ has a very sour taste. VSH is (vleiend) for tastebuds. PTN is nice, but a little bit too sour.
PTN has a better taste. You can taste that all three are healthy, but VSH and MLQ taste too healthy! VSH and MLQ did not have a very nice taste.
VSH is too sweet for me, but MLQ's taste is very nice.
VSH tastes too much like medicine - the juice is acceptable as a health remedy, but definitely not as a nice fruit juice. Anyway, better than most medicines and other health remedies.
PTN and MLQ are both nice, but the slightly sour after-taste of PTN is nicer for me and therefore my favourite.
MLQ has a very strong taste, which works your tongue. VSH is very thick juice. But all the juices are really nice ("flippen lekker!").
PTN has a nice taste and the after-taste is not bad.
PTN has the nicest taste. I don't like the taste of MLQ at all. All the textures are the same for me, so that didn't influence my choices. PTN is just the nicest.
MLQ has a 'mint' taste which I didn't like. PTN has a 'peat taste which, for me, is a good combination.
PTN has a nicer fruit taste. The aroma of the fruit comes through stronger than the other two. PTN has a nicer taste. The other two taste pretty much the same - VSH is more sharp and more interesting than MLQ. The texture of PTN is better, and there were less bits left behind in the glass; it is also not too thick.
MLQ and VSH had a sour after-taste.
MLQ had a bad. 'mealy' taste. PTN and VSH both tasted nice - the tastes actually don't differ much.
MLQ had a vinegar taste. The rest of the juices are really nice.
Is nicer.
All three are acceptable. The sweet-sour taste makes it special. The difference in tastes between the samples is small. PTN tastes the most like a fruit juice (or at least fruit juices that I am used to). The grainy texture is less acceptable.
MLQ: has a clean taste of 'mint'. VSH: is sweet and has a taste of 'caramel'. PTN: tastes like home-made fruit juice.
The VSH sample has a nicer taste than the others.
PTN's tastes is slightly better than the other two samples.
PTN and VSH are very similar, just a bit of a texture difference. I prefer a smooth texture above little pieces of fruit. MLQ had a very sour after-taste.
MLQ's taste was too sour, but VSH had an acceptable taste.
VSH's texture is nice but it has a very strange taste - I wouldn't recommend it.

Appendix 4
ZZL@!E Comments PTN's taste comes through much better and is not such a strange taste.
PTN PTN has a special taste. MLQ is very nice. VSH: the smell put me off a bit.
PTN I must say that the taste is something else - PTN is a more acceptable taste. VSH is slightly sour tasting. MLQ tastes minty to me. All in all, it is acceptable and something new to try: Tastes also more (suiwer)
PTN PTN has a lovely taste. VSH is acceptable for an 'every day' fruit juice. MLQ is a bit b ier.
PTN PTN has a very nice taste. VSH had too many bits in. MLQ has an afler-taste,


