Embed Size (px)
Citation preview
Florence DE CARLANThierry GUIOT Jean-Christophe LEONARDGennaro CASTAGNA
Data CentersState-of-the-art report
January 2017
1.1 Definition of a Data Center1.1.1 Usefull figures1.1.2 Data Center types 1.1.3 TIER level 1.1.4 PUE (Power Usage Effectiveness)
1.2 Visits to Data Centers
1.3 Air conditioning technology 1.3.1 Water-cooled chiller1.3.2 Air-cooled chiller 1.3.3 Direct expansion system1.3.4 Free cooling system
1.4 Case study n°1: a corporate data center (15,500 m²) 1.4.1 Présentation of the Data Center 1.4.2 Surface areas and functionalities1.4.3 Server rooms 1.4.4 Technical installations 1.4.5 Consumption 1.4.6 Cooling system performance1.4.7 Recoverable energy
1.5 Case study n°2: a corporate data center (1,300 m²) with free cooling 1.5.1 Presentation of the data center 1.5.2 Principle of free cooling 1.5.3 Description of how free cooling works
1 DATA CENTERS, GENERAL REMARKS
2Table of contents
2 - Efficacity // Data centers - State-of-the-art report
Introduction
Conclusion
Outlook
References
Context Objectives
667789
1010111213
1415
151618192223
242425
26
4
46
50
52
Table of figures
48
2.1 Waste heat 2.1.1 Principle of recoverable energy from a cooling system 2.1.2 Characterization of waste heat 2.1.3 Breakdown of the principle of waste energy estimation 2.1.4 Algorithm for determining the recoverable energy potential of a data center 2.1.5 Increasing the recoverable energy potential
2.2 Waste energy recovery from a data center to district heating 2.2.1 NATIXIS Data Center 2.2.2 Aquatic complex 2.2.3 Business incubator 2.2.4 Dalkia boilerhouse 2.2.5 Principle of the system 2.2.6 Results
2.3 New generation waste energy 2.3.1 The digital radiator 2.3.2 Digital domestic hot water supply
3.1.1 GIS targeting of data center/district heating pairings in the Paris region3.1.2 Potential of the data center/ district heating pairing in the Paris region 3.1.3 GIS targeting of the data center/ swimming pool pairing in France 3.1.4 High-temperature (HT) heat pumps
2 3WASTE ENERGY RECOVERY
FEASIBILITY STUDY ON USE OF WASTE ENERGY RECOVERED FROM DATA CENTERS
28
2829
30
31
32
33333434343435363638
40
41
42
43
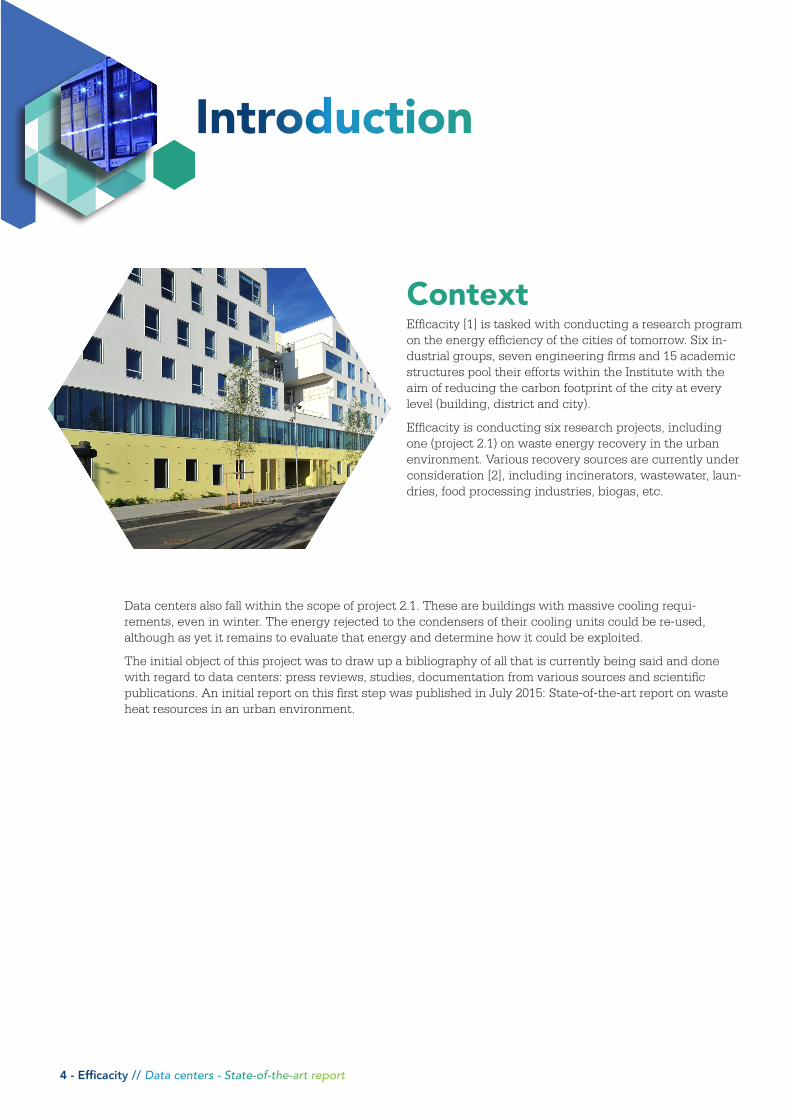
ContextEfficacity [1] is tasked with conducting a research program on the energy efficiency of the cities of tomorrow. Six in-dustrial groups, seven engineering firms and 15 academic structures pool their efforts within the Institute with the aim of reducing the carbon footprint of the city at every level (building, district and city).
Efficacity is conducting six research projects, including one (project 2.1) on waste energy recovery in the urban environment. Various recovery sources are currently under consideration [2], including incinerators, wastewater, laun-dries, food processing industries, biogas, etc.
Introduction
4 - Efficacity // Data centers - State-of-the-art report
2
Data centers also fall within the scope of project 2.1. These are buildings with massive cooling requi-rements, even in winter. The energy rejected to the condensers of their cooling units could be re-used, although as yet it remains to evaluate that energy and determine how it could be exploited.
The initial object of this project was to draw up a bibliography of all that is currently being said and done with regard to data centers: press reviews, studies, documentation from various sources and scientific publications. An initial report on this first step was published in July 2015: State-of-the-art report on waste heat resources in an urban environment.
Data centers - State-of-the-art report // Efficacity - 5
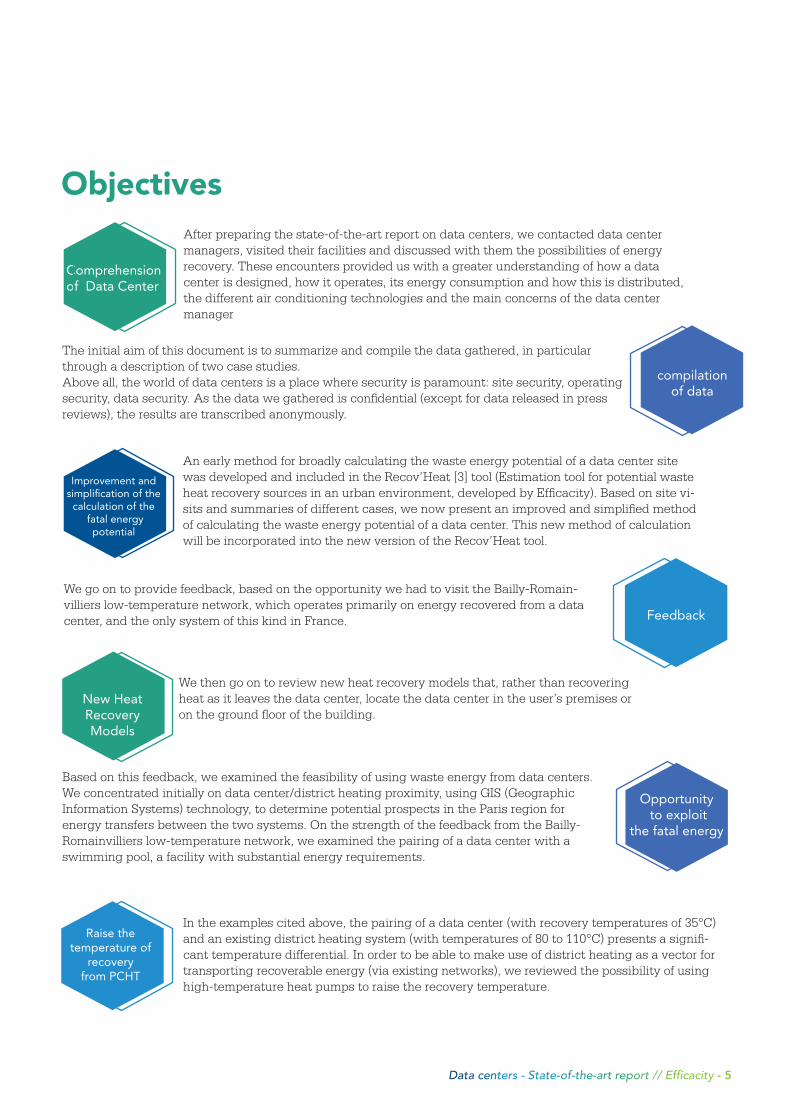
The initial aim of this document is to summarize and compile the data gathered, in particular through a description of two case studies. Above all, the world of data centers is a place where security is paramount: site security, operating security, data security. As the data we gathered is confidential (except for data released in press reviews), the results are transcribed anonymously.
An early method for broadly calculating the waste energy potential of a data center site was developed and included in the Recov’Heat [3] tool (Estimation tool for potential waste heat recovery sources in an urban environment, developed by Efficacity). Based on site vi-sits and summaries of different cases, we now present an improved and simplified method of calculating the waste energy potential of a data center. This new method of calculation will be incorporated into the new version of the Recov’Heat tool.
Objectives
We go on to provide feedback, based on the opportunity we had to visit the Bailly-Romain-villiers low-temperature network, which operates primarily on energy recovered from a data center, and the only system of this kind in France.
We then go on to review new heat recovery models that, rather than recovering heat as it leaves the data center, locate the data center in the user’s premises or on the ground floor of the building.
Based on this feedback, we examined the feasibility of using waste energy from data centers. We concentrated initially on data center/district heating proximity, using GIS (Geographic Information Systems) technology, to determine potential prospects in the Paris region for energy transfers between the two systems. On the strength of the feedback from the Bailly-Romainvilliers low-temperature network, we examined the pairing of a data center with a swimming pool, a facility with substantial energy requirements.
In the examples cited above, the pairing of a data center (with recovery temperatures of 35°C) and an existing district heating system (with temperatures of 80 to 110°C) presents a signifi-cant temperature differential. In order to be able to make use of district heating as a vector for transporting recoverable energy (via existing networks), we reviewed the possibility of using high-temperature heat pumps to raise the recovery temperature.
compilation of data
Comprehension of Data Center
After preparing the state-of-the-art report on data centers, we contacted data center managers, visited their facilities and discussed with them the possibilities of energy recovery. These encounters provided us with a greater understanding of how a data center is designed, how it operates, its energy consumption and how this is distributed, the different air conditioning technologies and the main concerns of the data center manager
Feedback
Improvement andsimplification of the calculation of the
fatal energy potential
New Heat Recovery Models
Opportunity to exploit
the fatal energy
Raise thetemperature of
recoveryfrom PCHT
Data Centers, general remarks
«A Data Center is a building that houses information technology (IT) equipment.»
42 Data Centerin Paris Region
182Data Centerin France
5MWfor Data Center
6 - Efficacity // Data centers - State-of-the-art report
211.1 Definition of a Data CenterA data center is a building or part of a building that houses information technology (IT) equipment. The equipment installed – servers, storage bays, network and telecommuni-cations systems – is used to process and store data, irrespective of its origin (personal or
corporate) or provenance (country of origin or global).
The aggregation of information, of data, in a single location with multiple clients makes this a highly sensitive site, hence the spe-cific nature of data center security, involving both site security and data security, and the sensitivity of availability and production.
Certain bodies have established data center certification proce-dures to assess the levels of security and availability.
As a general rule, a data center is typically a space occupied by or given over to servers. The terms used in the literature on the subject are varied and po-tentially confusing: computer room, server room, white room, IT room, etc. Throughout this document, we will use the term most often employed by IT professionals: the IT room.
1.1.1 Usefull figuresWhile the definition of a data center is fairly simple, mapping a data center in its enti-rety is highly complex, if not impossible. A large number of agents are involved in IT services, and can be divided into four families [4]: hosting providers, telecoms operators, digital services firms and cloud computing services. Added to this are the proprietary or dedicated corporate data centers and all IT rooms incorporated into a building.
In June 2016, 3,885 colocation data centers were identified in 117 countries [5], with 182 data centers in France (including 26 under construction) [6]. This list covers only one category of players, the colocation providers.
Data centers are famously energy-intensive due to their high concentration of servers, quoting power density requirements of 250 to 1,500 W/m²IT. Some even claim as much as 3,000 W/m²IT.
According to France’s national grid operator RTE, power consumption by French data centers [7] represented 1.4 TWh in 2014, equivalent to 1% of the tertiary sector (or 0.3% of total power consumption in France).
RTE is currently aware of 42 data centers connected to the power grid in the Paris region, all with high power consumption, for a power requirement of 210 MW [8]. This corresponds to an average power demand of 5 MW per data center, equivalent to an IT surface area of around 5,000 m². Referring to “Figure 1: IT room size distribution (m²)», this represents only 11% of the market (extrapolation from a US survey).
Looking ahead to 2025, RTE expects to see a further 36 data centers in the Paris region (known projects), an increase of +86% [8].
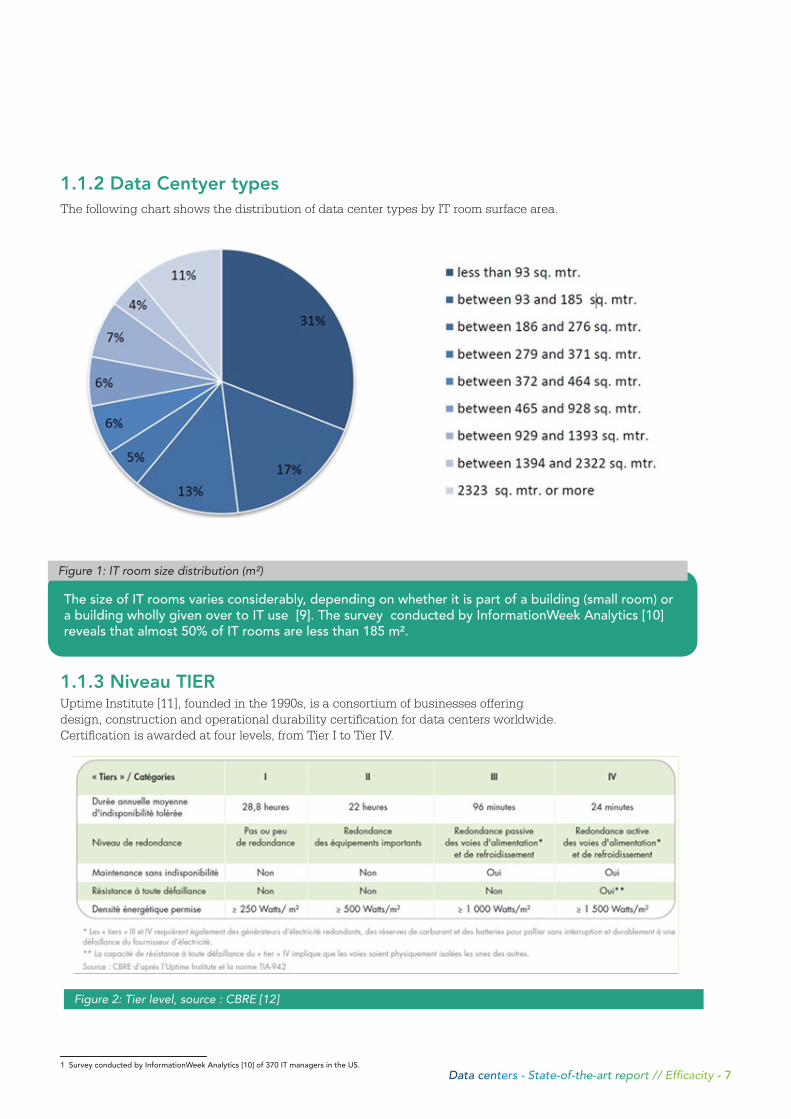
1.1.2 Data Centyer typesThe following chart shows the distribution of data center types by IT room surface area.
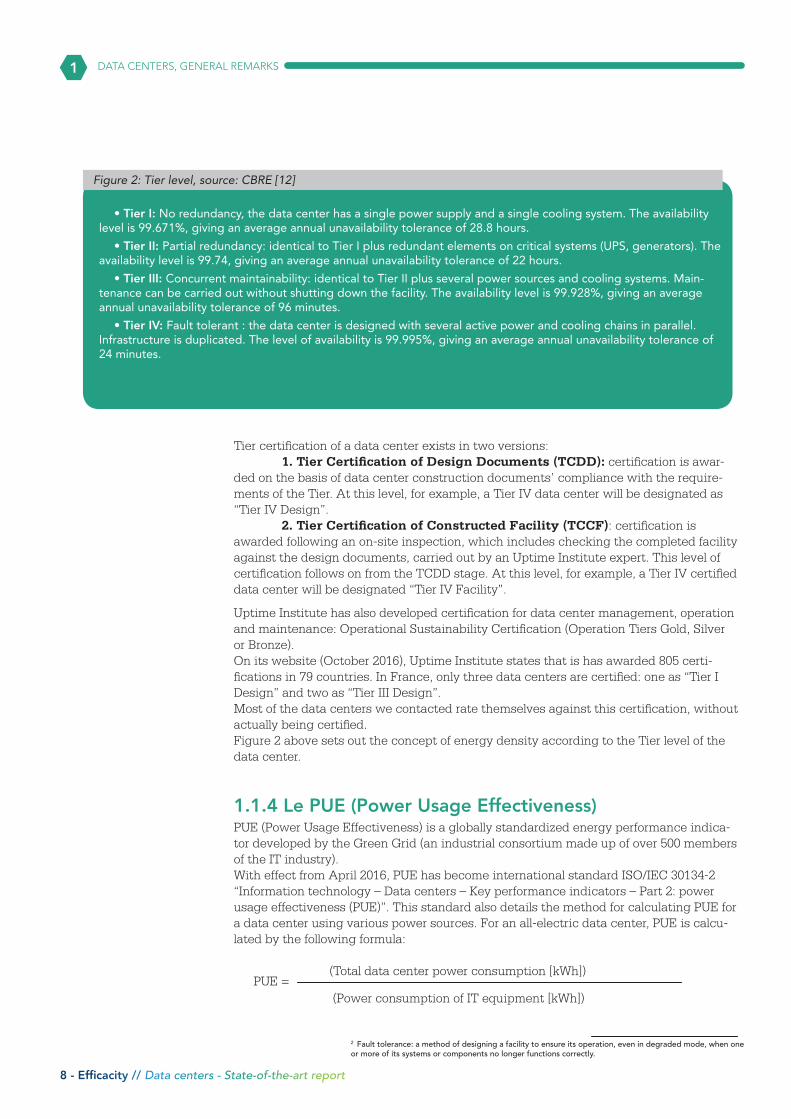
1.1.3 Niveau TIERUptime Institute [11], founded in the 1990s, is a consortium of businesses offering design, construction and operational durability certification for data centers worldwide. Certification is awarded at four levels, from Tier I to Tier IV.
Figure 1: IT room size distribution (m²)
The size of IT rooms varies considerably, depending on whether it is part of a building (small room) or a building wholly given over to IT use [9]. The survey conducted by InformationWeek Analytics [10] reveals that almost 50% of IT rooms are less than 185 m².
Figure 2: Tier level, source : CBRE [12]
1 Survey conducted by InformationWeek Analytics [10] of 370 IT managers in the US.Data centers - State-of-the-art report // Efficacity - 7
1 DATA CENTERS, GENERAL REMARKS
Tier certification of a data center exists in two versions: 1. Tier Certification of Design Documents (TCDD): certification is awar-ded on the basis of data center construction documents’ compliance with the require-ments of the Tier. At this level, for example, a Tier IV data center will be designated as “Tier IV Design”. 2. Tier Certification of Constructed Facility (TCCF): certification is awarded following an on-site inspection, which includes checking the completed facility against the design documents, carried out by an Uptime Institute expert. This level of certification follows on from the TCDD stage. At this level, for example, a Tier IV certified data center will be designated “Tier IV Facility”.
Uptime Institute has also developed certification for data center management, operation and maintenance: Operational Sustainability Certification (Operation Tiers Gold, Silver or Bronze).On its website (October 2016), Uptime Institute states that is has awarded 805 certi-fications in 79 countries. In France, only three data centers are certified: one as “Tier I Design” and two as “Tier III Design”. Most of the data centers we contacted rate themselves against this certification, without actually being certified.Figure 2 above sets out the concept of energy density according to the Tier level of the data center.
1.1.4 Le PUE (Power Usage Effectiveness)PUE (Power Usage Effectiveness) is a globally standardized energy performance indica-tor developed by the Green Grid (an industrial consortium made up of over 500 members of the IT industry).With effect from April 2016, PUE has become international standard ISO/IEC 30134-2 “Information technology – Data centers – Key performance indicators – Part 2: power usage effectiveness (PUE)”. This standard also details the method for calculating PUE for a data center using various power sources. For an all-electric data center, PUE is calcu-lated by the following formula:
(Total data center power consumption [kWh])
(Power consumption of IT equipment [kWh])
5MWpar Data Center
Figure 2: Tier level, source: CBRE [12]
• Tier I: No redundancy, the data center has a single power supply and a single cooling system. The availability level is 99.671%, giving an average annual unavailability tolerance of 28.8 hours.
• Tier II: Partial redundancy: identical to Tier I plus redundant elements on critical systems (UPS, generators). The availability level is 99.74, giving an average annual unavailability tolerance of 22 hours.
• Tier III: Concurrent maintainability: identical to Tier II plus several power sources and cooling systems. Main-tenance can be carried out without shutting down the facility. The availability level is 99.928%, giving an average annual unavailability tolerance of 96 minutes.
• Tier IV: Fault tolerant : the data center is designed with several active power and cooling chains in parallel. Infrastructure is duplicated. The level of availability is 99.995%, giving an average annual unavailability tolerance of 24 minutes.
PUE =
2 Fault tolerance: a method of designing a facility to ensure its operation, even in degraded mode, when one or more of its systems or components no longer functions correctly.
8 - Efficacity // Data centers - State-of-the-art report
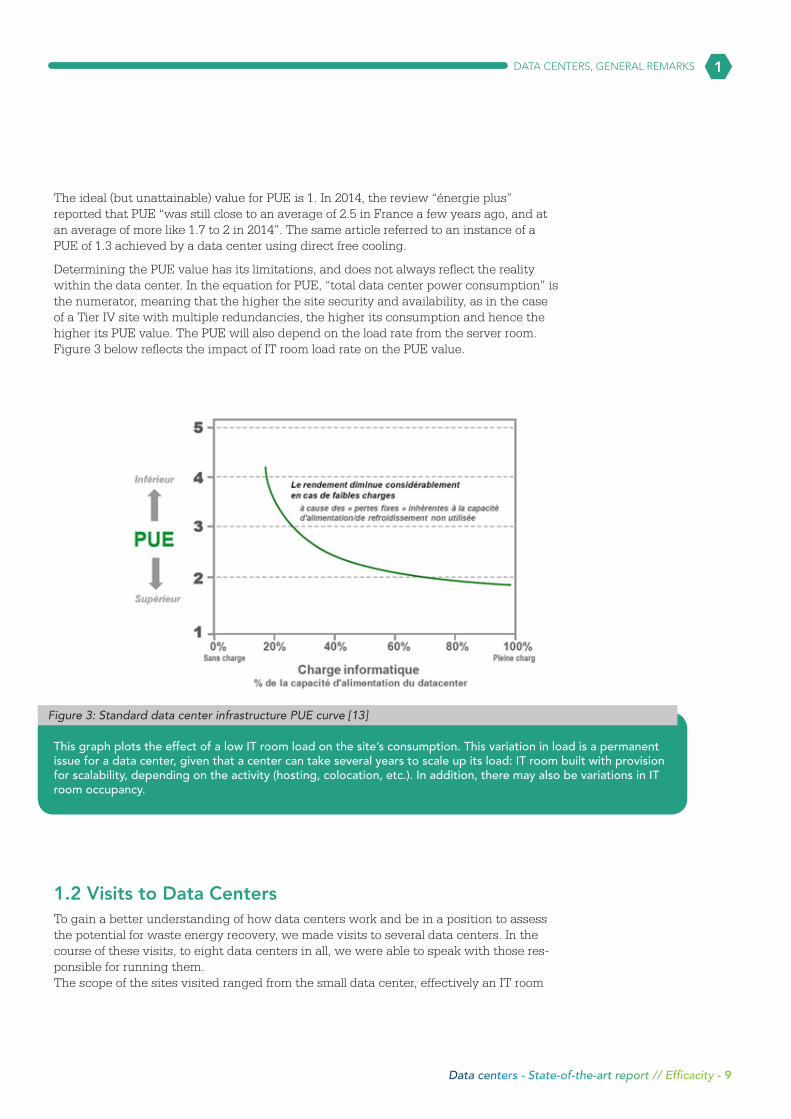
The ideal (but unattainable) value for PUE is 1. In 2014, the review “énergie plus” reported that PUE “was still close to an average of 2.5 in France a few years ago, and at an average of more like 1.7 to 2 in 2014”. The same article referred to an instance of a PUE of 1.3 achieved by a data center using direct free cooling.
Determining the PUE value has its limitations, and does not always reflect the reality within the data center. In the equation for PUE, “total data center power consumption” is the numerator, meaning that the higher the site security and availability, as in the case of a Tier IV site with multiple redundancies, the higher its consumption and hence the higher its PUE value. The PUE will also depend on the load rate from the server room. Figure 3 below reflects the impact of IT room load rate on the PUE value.
1.2 Visits to Data CentersTo gain a better understanding of how data centers work and be in a position to assess the potential for waste energy recovery, we made visits to several data centers. In the course of these visits, to eight data centers in all, we were able to speak with those res-ponsible for running them. The scope of the sites visited ranged from the small data center, effectively an IT room
Figure 3: Standard data center infrastructure PUE curve [13]
This graph plots the effect of a low IT room load on the site’s consumption. This variation in load is a permanent issue for a data center, given that a center can take several years to scale up its load: IT room built with provision for scalability, depending on the activity (hosting, colocation, etc.). In addition, there may also be variations in IT room occupancy.
1DATA CENTERS, GENERAL REMARKS
Data centers - State-of-the-art report // Efficacity - 9
(under 100 m²), to a large data center with IT rooms covering 13,000 m² in the case of the largest. Their features varied according to their field of activity : • In the case of the smallest sites, these were data centers used for research, laborato- ry or teaching purposes. They are used for data processing and are, essentially, com puting clusters.
• One of the data centers visited is a corporate data, i.e. with a single client. • For the most part, they are so-called colocation or hosting data centers. These sites
are multi-tenant and international. Of the eight sites visited, only one data center provided us with a full set of the data necessary (see § 2.4).These visits highlighted the importance of the data to be gathered in order to arrive at a reasonable estimate of the potential for waste energy recovery. One important point, in particular, is the distinction between an IT area and a server area, the definition of which varies according to the size of the data center in question. The data we gathered also highlighted the importance of the electrical power deployed, the distinction between installed power and electric useful power: power demand.
The final important point relates to the server cooling system used. The technology employed (see § 2.3. Air conditioning technology) is crucial to the feasibility or otherwise of waste energy recovery.
1.3 Air conditioning technologyCooling systems used to cool IT rooms in data centers rely essentially on electrical power. The main cooling systems encountered rely on cooling by means of water-cooled chiller, air-cooled chiller, direct expansion or free cooling systems.
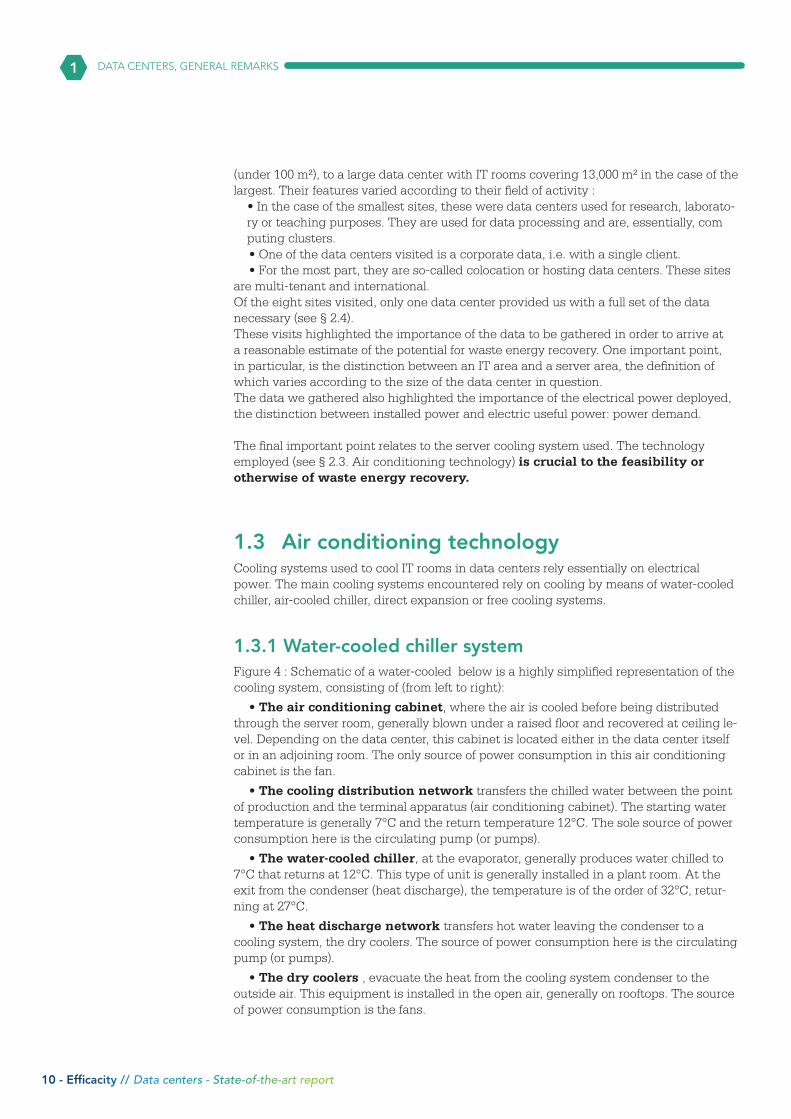
1.3.1 Water-cooled chiller systemFigure 4 : Schematic of a water-cooled below is a highly simplified representation of the cooling system, consisting of (from left to right):
• The air conditioning cabinet, where the air is cooled before being distributed through the server room, generally blown under a raised floor and recovered at ceiling le-vel. Depending on the data center, this cabinet is located either in the data center itself or in an adjoining room. The only source of power consumption in this air conditioning cabinet is the fan.
• The cooling distribution network transfers the chilled water between the point of production and the terminal apparatus (air conditioning cabinet). The starting water temperature is generally 7°C and the return temperature 12°C. The sole source of power consumption here is the circulating pump (or pumps).
• The water-cooled chiller, at the evaporator, generally produces water chilled to 7°C that returns at 12°C. This type of unit is generally installed in a plant room. At the exit from the condenser (heat discharge), the temperature is of the order of 32°C, retur-ning at 27°C.
• The heat discharge network transfers hot water leaving the condenser to a cooling system, the dry coolers. The source of power consumption here is the circulating pump (or pumps).
• The dry coolers , evacuate the heat from the cooling system condenser to the outside air. This equipment is installed in the open air, generally on rooftops. The source of power consumption is the fans.
1
10 - Efficacity // Data centers - State-of-the-art report
DATA CENTERS, GENERAL REMARKS
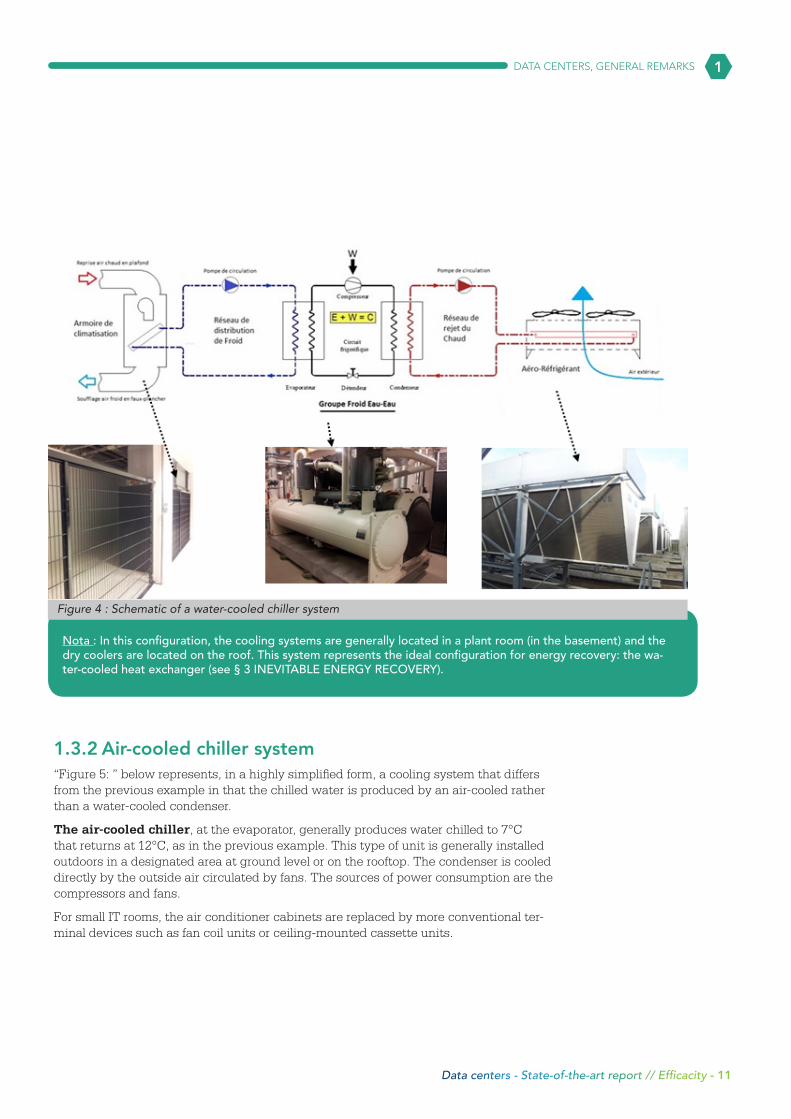
1.3.2 Air-cooled chiller system “Figure 5: ” below represents, in a highly simplified form, a cooling system that differs from the previous example in that the chilled water is produced by an air-cooled rather than a water-cooled condenser.
The air-cooled chiller, at the evaporator, generally produces water chilled to 7°C that returns at 12°C, as in the previous example. This type of unit is generally installed outdoors in a designated area at ground level or on the rooftop. The condenser is cooled directly by the outside air circulated by fans. The sources of power consumption are the compressors and fans.
For small IT rooms, the air conditioner cabinets are replaced by more conventional ter-minal devices such as fan coil units or ceiling-mounted cassette units.
Nota : In this configuration, the cooling systems are generally located in a plant room (in the basement) and the dry coolers are located on the roof. This system represents the ideal configuration for energy recovery: the wa-ter-cooled heat exchanger (see § 3 INEVITABLE ENERGY RECOVERY).
Figure 4 : Schematic of a water-cooled chiller system
1
Data centers - State-of-the-art report // Efficacity - 11
DATA CENTERS, GENERAL REMARKS
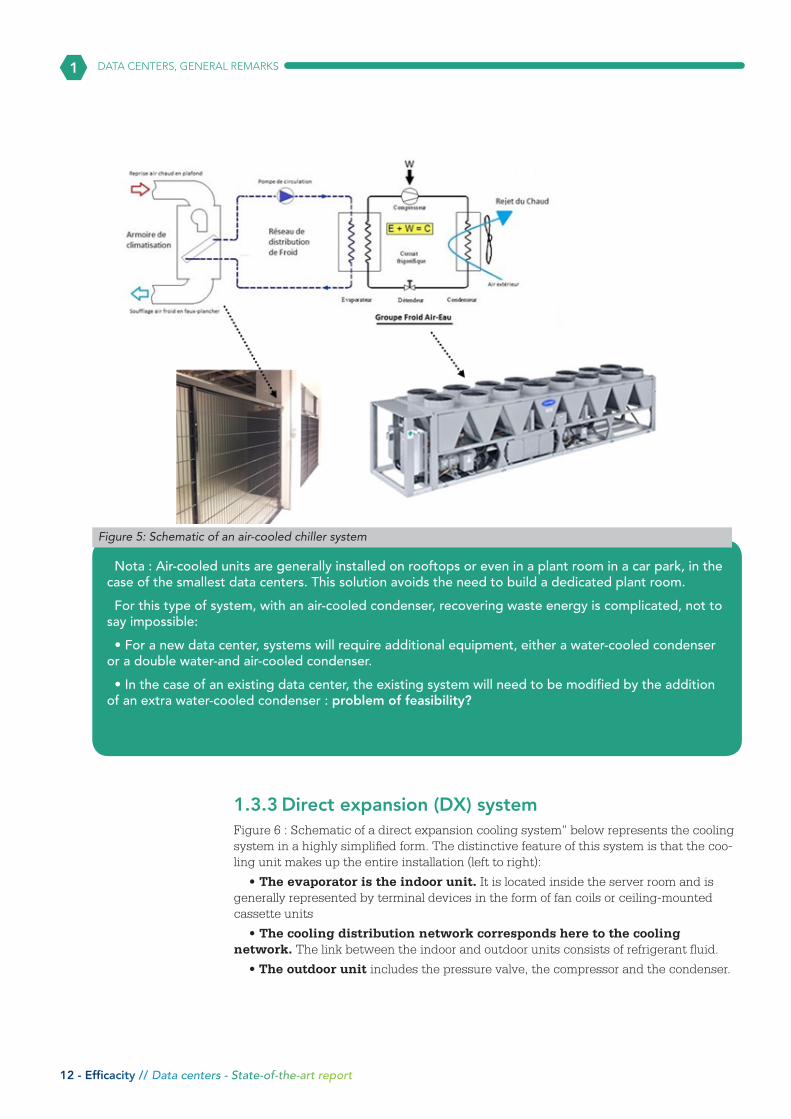
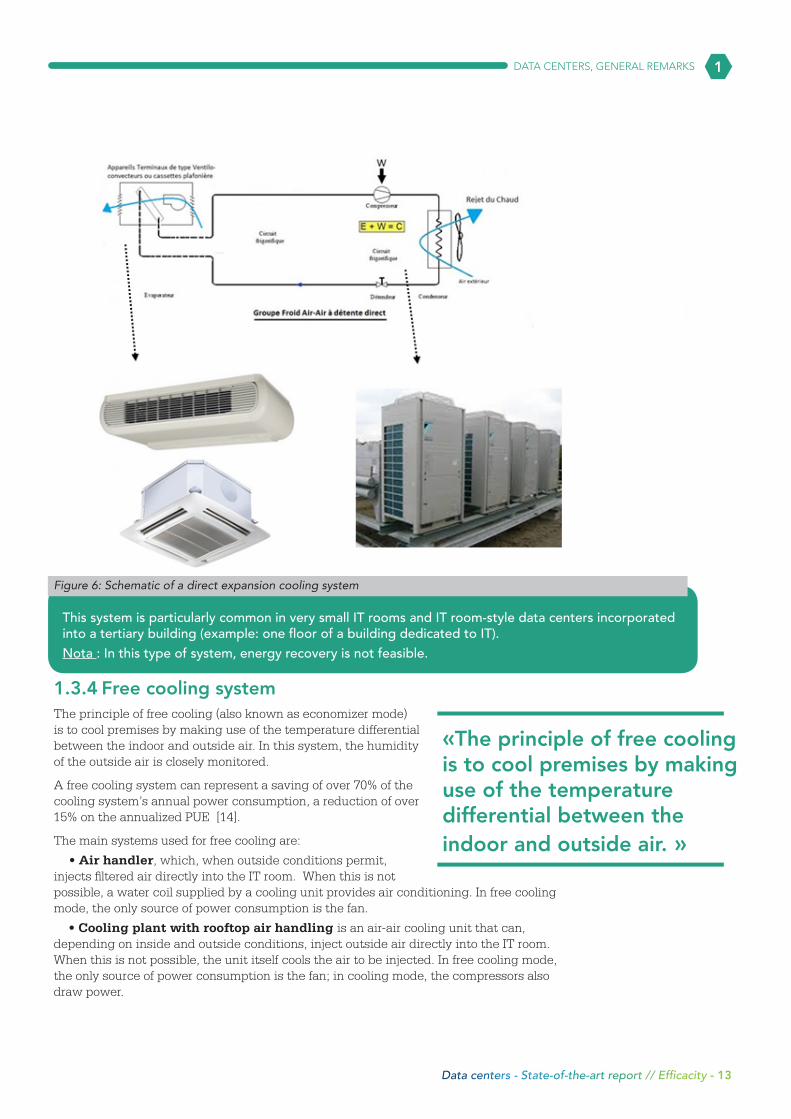
1.3.3 Direct expansion (DX) systemFigure 6 : Schematic of a direct expansion cooling system” below represents the cooling system in a highly simplified form. The distinctive feature of this system is that the coo-ling unit makes up the entire installation (left to right):
• The evaporator is the indoor unit. It is located inside the server room and is generally represented by terminal devices in the form of fan coils or ceiling-mounted cassette units
• The cooling distribution network corresponds here to the cooling network. The link between the indoor and outdoor units consists of refrigerant fluid.
• The outdoor unit includes the pressure valve, the compressor and the condenser.
Nota : Air-cooled units are generally installed on rooftops or even in a plant room in a car park, in the case of the smallest data centers. This solution avoids the need to build a dedicated plant room.
For this type of system, with an air-cooled condenser, recovering waste energy is complicated, not to say impossible:
• For a new data center, systems will require additional equipment, either a water-cooled condenser or a double water-and air-cooled condenser.
• In the case of an existing data center, the existing system will need to be modified by the addition of an extra water-cooled condenser : problem of feasibility?
Figure 5: Schematic of an air-cooled chiller system
1
12 - Efficacity // Data centers - State-of-the-art report
DATA CENTERS, GENERAL REMARKS
1.3.4 Free cooling systemThe principle of free cooling (also known as economizer mode) is to cool premises by making use of the temperature differential between the indoor and outside air. In this system, the humidity of the outside air is closely monitored.
A free cooling system can represent a saving of over 70% of the cooling system’s annual power consumption, a reduction of over 15% on the annualized PUE [14].
The main systems used for free cooling are:
• Air handler, which, when outside conditions permit, injects filtered air directly into the IT room. When this is not possible, a water coil supplied by a cooling unit provides air conditioning. In free cooling mode, the only source of power consumption is the fan.
• Cooling plant with rooftop air handling is an air-air cooling unit that can, depending on inside and outside conditions, inject outside air directly into the IT room. When this is not possible, the unit itself cools the air to be injected. In free cooling mode, the only source of power consumption is the fan; in cooling mode, the compressors also draw power.
This system is particularly common in very small IT rooms and IT room-style data centers incorporated into a tertiary building (example: one floor of a building dedicated to IT). Nota : In this type of system, energy recovery is not feasible.
Figure 6: Schematic of a direct expansion cooling system
«The principle of free cooling is to cool premises by making use of the temperature differential between the indoor and outside air. »
1
Data centers - State-of-the-art report // Efficacity - 13
DATA CENTERS, GENERAL REMARKS
Nota : Of the sites visited, two relied on free cooling using outside air. One of the sites was equipped with cooling units and air handlers (see § 2.5 Case study n°2: a corporate data center (1,300 m²) with free cooling), the other with rooftop units on the roof of a technical area outside and at the foot of the building. We were told that free cooling pro-vided savings on cooling of the order of 70 to 80% (no data supplied).
In a press review, Sigma (a software publisher also involved in hosting information sys-tems for health sector establishments, including sites selling prescription drugs online) published an article entitled “Free-Cooling; la ventilation Green des data centers de demain” (Free cooling: green ventilation for tomorrow’s data centers) [15], a year after bringing its 3rd data center into service.
Figures and data for data centers are hard to find, but this article provides some informa-tion; even if the figures are not confirmed, it does provide an order of magnitude:
• Total surface area (S_Total) of 2,000 m² with an IT surface area (S_IT) of 700 m² (pro-portion S_IT/S_Total = 35%),
• Total investment €7 million,
• Tier III+ data center (for information, certifying body Uptime Institute does not offer Tier III+ certification: see § Error! Reference source not found.),
• System of free cooling based on air handlers,
• 85% operation in free cooling mode, reducing the data center’s power consumption by 50% (in optimum conditions),
• An additional investment of 7.5% in air conditioning/power, with a payback period of four years.
The building design was tailored to operate in free cooling mode: very large air downpipes, high raised floors, fire extinguisher system, etc.
1.4 Case study n°1: a corporate data center (15,500 m²)The data center described below represents a corporate data center, exclusively for the use of the business concerned. The advantage of this case study is that we have access to a great deal of information ranging from construction of the site to its operation, which is rare indeed in a world where data is highly secured and sensitive. In the light of that fact, the data and results are presented anonymously.
The following data was provided:
• Billing over four years from 2011 to 2014, giving a picture of the site’s monthly energy consumption and power demand,
• The load curve for the site over two years, providing finer data of power demand every 10 minutes.
• The operator’s 2015 report and monitoring tables, providing details of consumption by item and by usage, and on a monthly basis.
1
14 - Efficacity // Data centers - State-of-the-art report
DATA CENTERS, GENERAL REMARKS
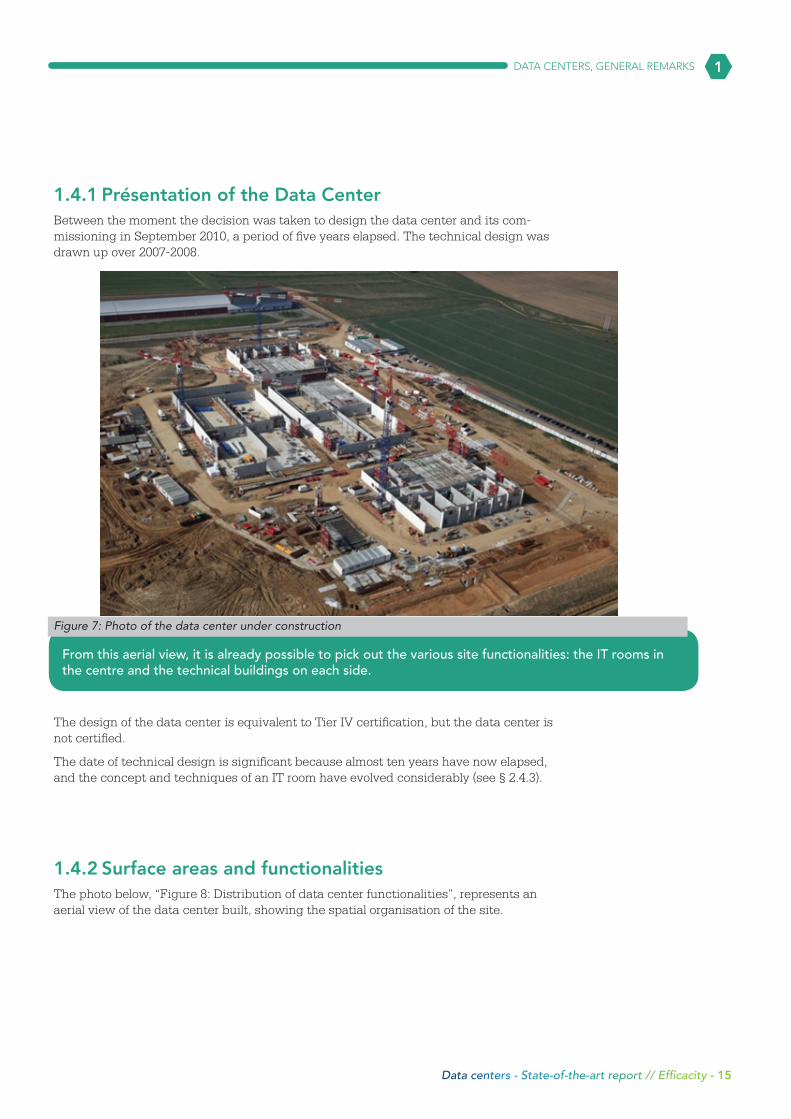
1.4.1 Présentation of the Data CenterBetween the moment the decision was taken to design the data center and its com-missioning in September 2010, a period of five years elapsed. The technical design was drawn up over 2007-2008.
The design of the data center is equivalent to Tier IV certification, but the data center is not certified.
The date of technical design is significant because almost ten years have now elapsed, and the concept and techniques of an IT room have evolved considerably (see § 2.4.3).
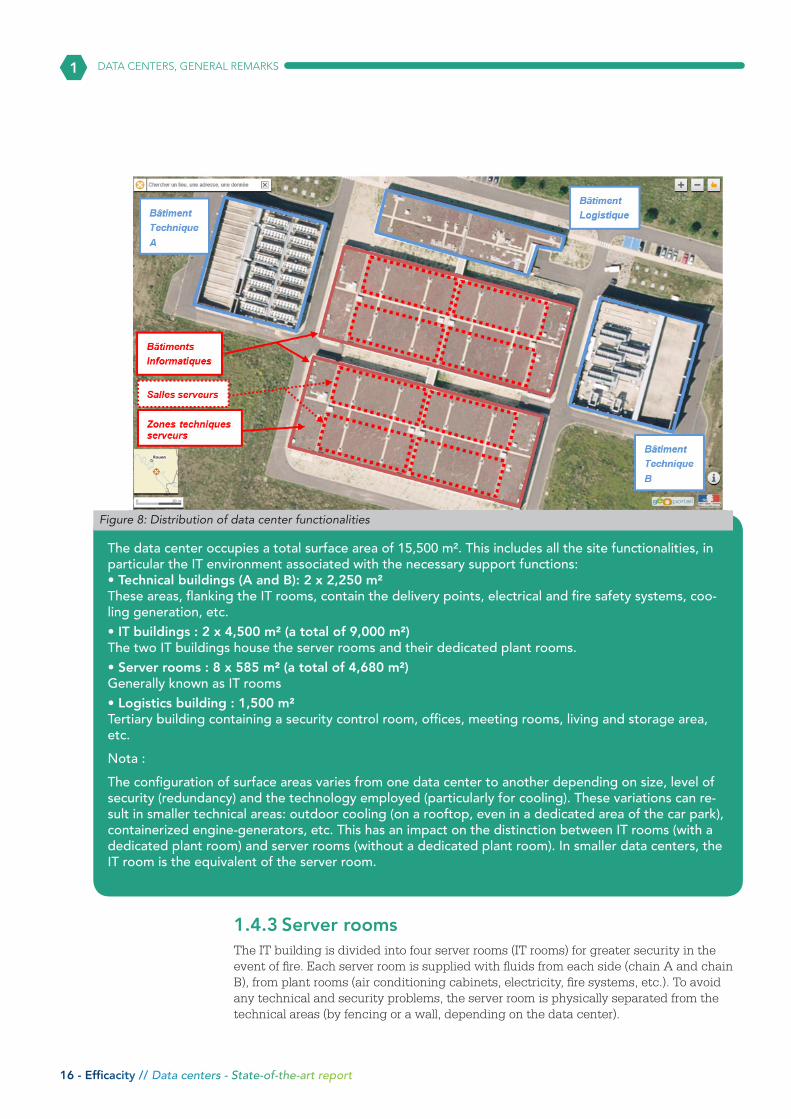
1.4.2 Surface areas and functionalitiesThe photo below, “Figure 8: Distribution of data center functionalities”, represents an aerial view of the data center built, showing the spatial organisation of the site.
Figure 7: Photo of the data center under construction
From this aerial view, it is already possible to pick out the various site functionalities: the IT rooms in the centre and the technical buildings on each side.
1
Data centers - State-of-the-art report // Efficacity - 15
DATA CENTERS, GENERAL REMARKS
1.4.3 Server roomsThe IT building is divided into four server rooms (IT rooms) for greater security in the event of fire. Each server room is supplied with fluids from each side (chain A and chain B), from plant rooms (air conditioning cabinets, electricity, fire systems, etc.). To avoid any technical and security problems, the server room is physically separated from the technical areas (by fencing or a wall, depending on the data center).
Figure 8: Distribution of data center functionalities
The data center occupies a total surface area of 15,500 m². This includes all the site functionalities, in particular the IT environment associated with the necessary support functions: • Technical buildings (A and B): 2 x 2,250 m²These areas, flanking the IT rooms, contain the delivery points, electrical and fire safety systems, coo-ling generation, etc.• IT buildings : 2 x 4,500 m² (a total of 9,000 m²)The two IT buildings house the server rooms and their dedicated plant rooms. • Server rooms : 8 x 585 m² (a total of 4,680 m²)Generally known as IT rooms• Logistics building : 1,500 m²Tertiary building containing a security control room, offices, meeting rooms, living and storage area, etc.
Nota :
The configuration of surface areas varies from one data center to another depending on size, level of security (redundancy) and the technology employed (particularly for cooling). These variations can re-sult in smaller technical areas: outdoor cooling (on a rooftop, even in a dedicated area of the car park), containerized engine-generators, etc. This has an impact on the distinction between IT rooms (with a dedicated plant room) and server rooms (without a dedicated plant room). In smaller data centers, the IT room is the equivalent of the server room.
1
16 - Efficacity // Data centers - State-of-the-art report
DATA CENTERS, GENERAL REMARKS
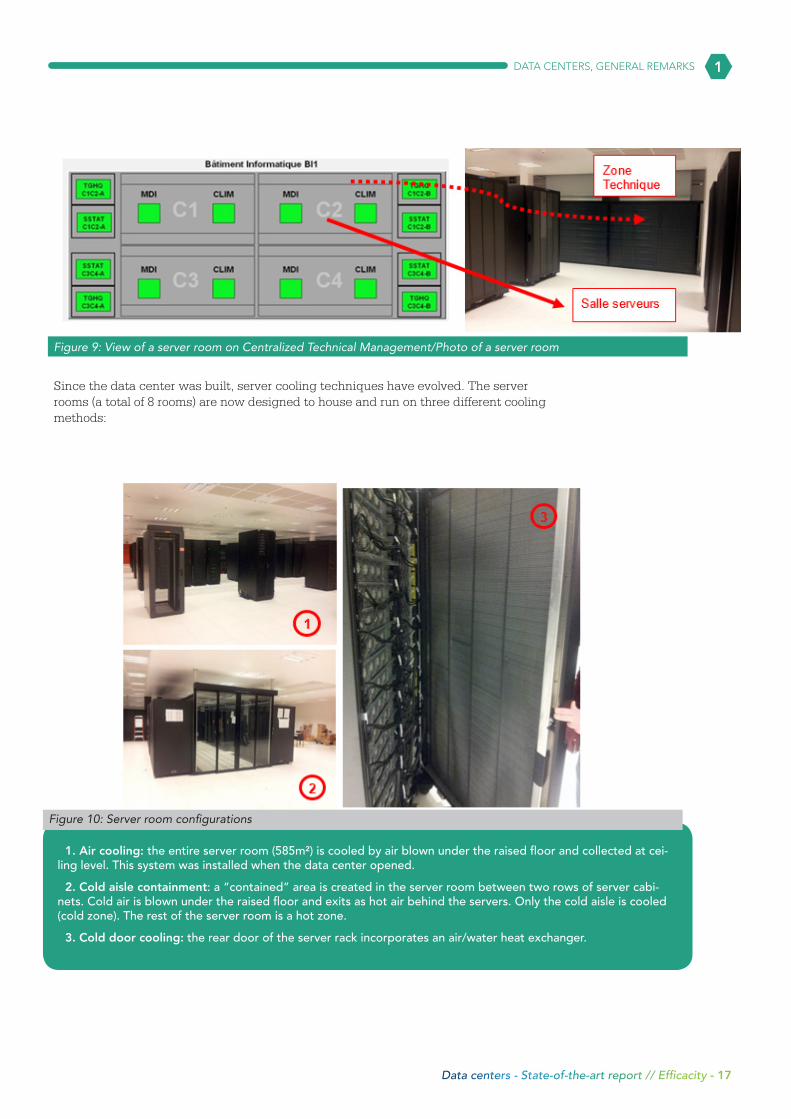
Since the data center was built, server cooling techniques have evolved. The server rooms (a total of 8 rooms) are now designed to house and run on three different cooling methods:
Figure 9: View of a server room on Centralized Technical Management/Photo of a server room
1. Air cooling: the entire server room (585m²) is cooled by air blown under the raised floor and collected at cei-ling level. This system was installed when the data center opened.
2. Cold aisle containment: a “contained” area is created in the server room between two rows of server cabi-nets. Cold air is blown under the raised floor and exits as hot air behind the servers. Only the cold aisle is cooled (cold zone). The rest of the server room is a hot zone.
3. Cold door cooling: the rear door of the server rack incorporates an air/water heat exchanger.
Figure 10: Server room configurations
1
Data centers - State-of-the-art report // Efficacity - 17
DATA CENTERS, GENERAL REMARKS
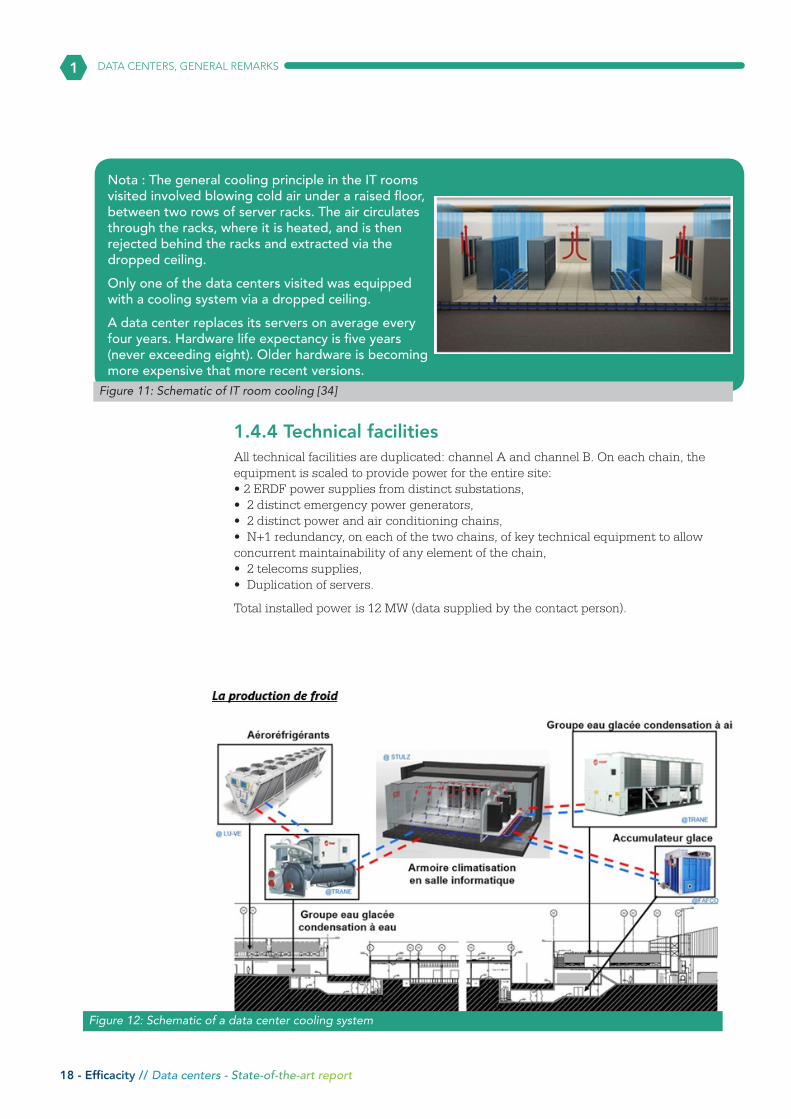
1.4.4 Technical facilitiesAll technical facilities are duplicated: channel A and channel B. On each chain, the equipment is scaled to provide power for the entire site:• 2 ERDF power supplies from distinct substations,• 2 distinct emergency power generators,• 2 distinct power and air conditioning chains,• N+1 redundancy, on each of the two chains, of key technical equipment to allow concurrent maintainability of any element of the chain,• 2 telecoms supplies,• Duplication of servers.
Total installed power is 12 MW (data supplied by the contact person).
Figure 11: Schematic of IT room cooling [34]
Nota : The general cooling principle in the IT rooms visited involved blowing cold air under a raised floor, between two rows of server racks. The air circulates through the racks, where it is heated, and is then rejected behind the racks and extracted via the dropped ceiling.
Only one of the data centers visited was equipped with a cooling system via a dropped ceiling.
A data center replaces its servers on average every four years. Hardware life expectancy is five years (never exceeding eight). Older hardware is becoming more expensive that more recent versions.
Figure 12: Schematic of a data center cooling system
1
18 - Efficacity // Data centers - State-of-the-art report
DATA CENTERS, GENERAL REMARKS
Cooling is by means of two distinct systems, representing a total cooling power of 18.8 MW of refrigeration. The installation is made up as follows:
• Chain A ; cooling is provided by eight Trane water-cooled chillers with unit cooling capacity of 1,000 kW of refrigeration , with 16 LU-VE dry coolers. This system is particularly well suited to conditions of extreme cold.
• Chain B; cooling is produced by nine Trane air-cooled chillers with unit cooling ca-pacity of 1,200 kW. This system is particularly well suited to conditions of extreme heat. Two of the nine units supply a 20,000-litre ice store, providing 15 minutes of emergency cooling.
IT room humidity is managed by air handlers (no data on the equipment provided).
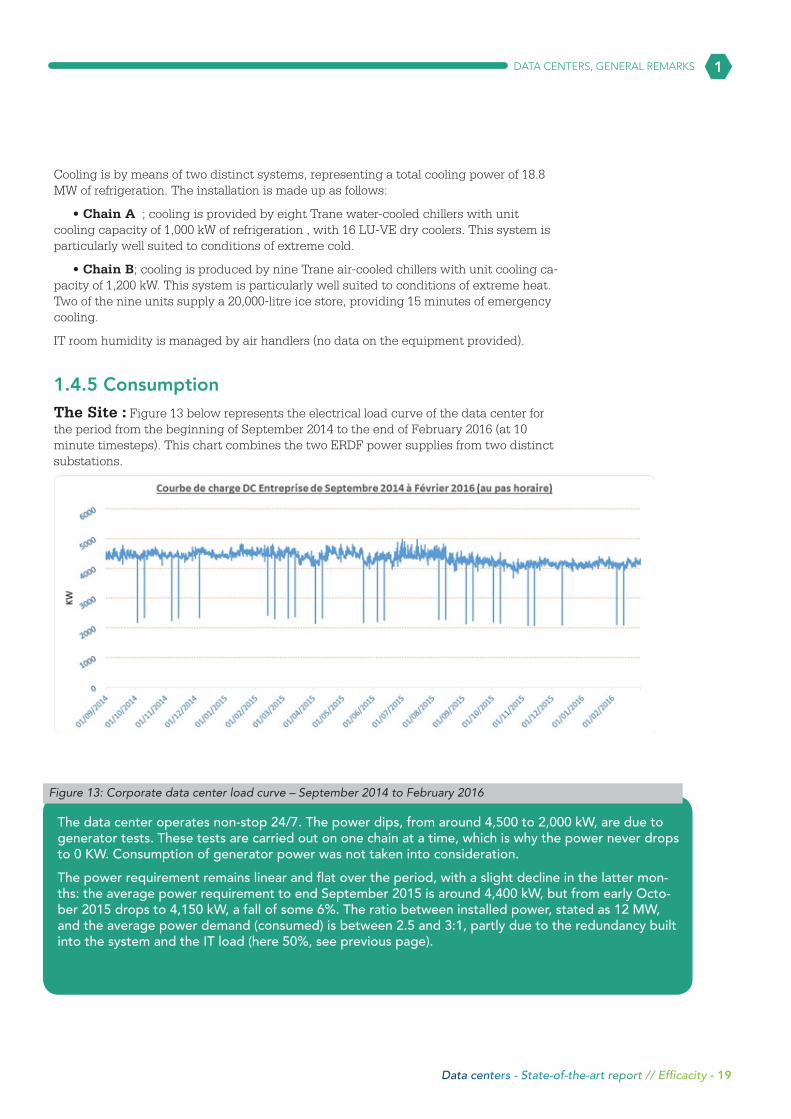
1.4.5 ConsumptionThe Site : Figure 13 below represents the electrical load curve of the data center for the period from the beginning of September 2014 to the end of February 2016 (at 10 minute timesteps). This chart combines the two ERDF power supplies from two distinct substations.
The data center operates non-stop 24/7. The power dips, from around 4,500 to 2,000 kW, are due to generator tests. These tests are carried out on one chain at a time, which is why the power never drops to 0 KW. Consumption of generator power was not taken into consideration.
The power requirement remains linear and flat over the period, with a slight decline in the latter mon-ths: the average power requirement to end September 2015 is around 4,400 kW, but from early Octo-ber 2015 drops to 4,150 kW, a fall of some 6%. The ratio between installed power, stated as 12 MW, and the average power demand (consumed) is between 2.5 and 3:1, partly due to the redundancy built into the system and the IT load (here 50%, see previous page).
Figure 13: Corporate data center load curve – September 2014 to February 2016
1
Data centers - State-of-the-art report // Efficacity - 19
DATA CENTERS, GENERAL REMARKS
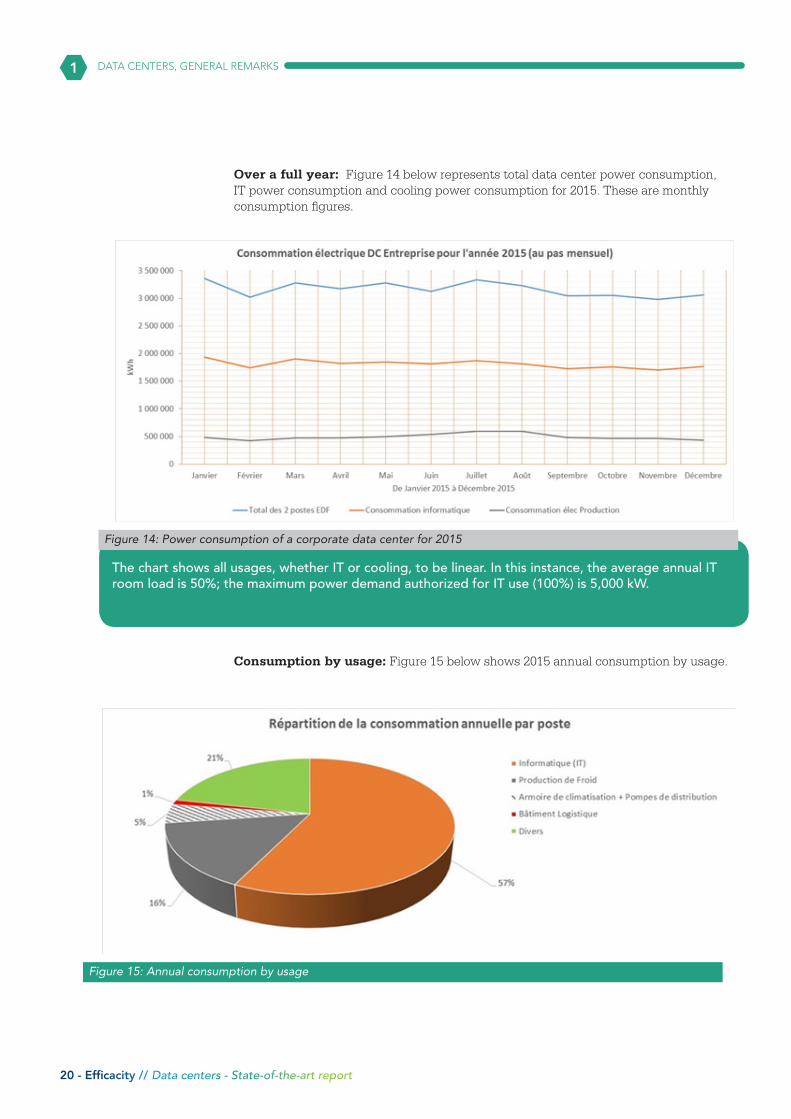
Over a full year: Figure 14 below represents total data center power consumption, IT power consumption and cooling power consumption for 2015. These are monthly consumption figures.
La puissance totale électrique installée est de 12 MW (donnée fournie par l’interlocu-teur).
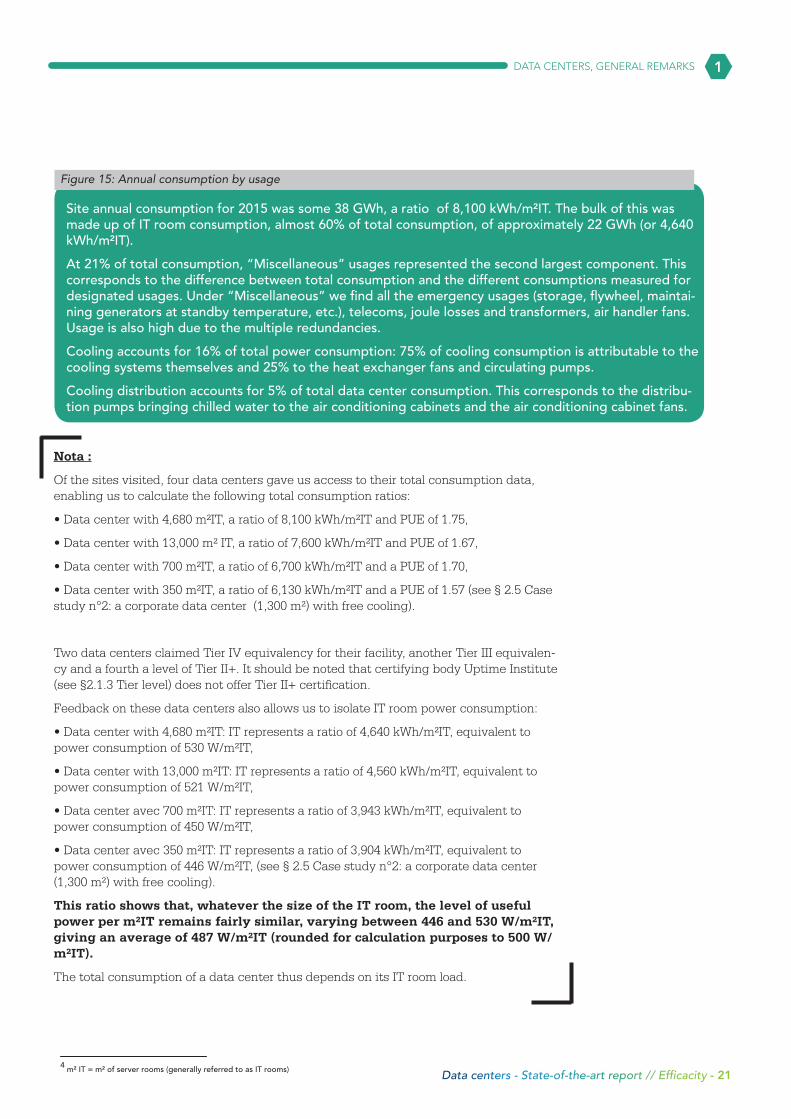
Consumption by usage: Figure 15 below shows 2015 annual consumption by usage.
Figure 15: Annual consumption by usage
Figure 14: Power consumption of a corporate data center for 2015
The chart shows all usages, whether IT or cooling, to be linear. In this instance, the average annual IT room load is 50%; the maximum power demand authorized for IT use (100%) is 5,000 kW.
1
20 - Efficacity // Data centers - State-of-the-art report
DATA CENTERS, GENERAL REMARKS
Nota :
Of the sites visited, four data centers gave us access to their total consumption data, enabling us to calculate the following total consumption ratios:
• Data center with 4,680 m²IT, a ratio of 8,100 kWh/m²IT and PUE of 1.75,
• Data center with 13,000 m² IT, a ratio of 7,600 kWh/m²IT and PUE of 1.67,
• Data center with 700 m²IT, a ratio of 6,700 kWh/m²IT and a PUE of 1.70,
• Data center with 350 m²IT, a ratio of 6,130 kWh/m²IT and a PUE of 1.57 (see § 2.5 Case study n°2: a corporate data center (1,300 m²) with free cooling).
Two data centers claimed Tier IV equivalency for their facility, another Tier III equivalen-cy and a fourth a level of Tier II+. It should be noted that certifying body Uptime Institute (see §2.1.3 Tier level) does not offer Tier II+ certification.
Feedback on these data centers also allows us to isolate IT room power consumption:
• Data center with 4,680 m²IT: IT represents a ratio of 4,640 kWh/m²IT, equivalent to power consumption of 530 W/m²IT,
• Data center with 13,000 m²IT: IT represents a ratio of 4,560 kWh/m²IT, equivalent to power consumption of 521 W/m²IT,
• Data center avec 700 m²IT: IT represents a ratio of 3,943 kWh/m²IT, equivalent to power consumption of 450 W/m²IT,
• Data center avec 350 m²IT: IT represents a ratio of 3,904 kWh/m²IT, equivalent to power consumption of 446 W/m²IT, (see § 2.5 Case study n°2: a corporate data center (1,300 m²) with free cooling).
This ratio shows that, whatever the size of the IT room, the level of useful power per m²IT remains fairly similar, varying between 446 and 530 W/m²IT, giving an average of 487 W/m²IT (rounded for calculation purposes to 500 W/m²IT).
The total consumption of a data center thus depends on its IT room load.
Site annual consumption for 2015 was some 38 GWh, a ratio of 8,100 kWh/m²IT. The bulk of this was made up of IT room consumption, almost 60% of total consumption, of approximately 22 GWh (or 4,640 kWh/m²IT).
At 21% of total consumption, “Miscellaneous” usages represented the second largest component. This corresponds to the difference between total consumption and the different consumptions measured for designated usages. Under “Miscellaneous” we find all the emergency usages (storage, flywheel, maintai-ning generators at standby temperature, etc.), telecoms, joule losses and transformers, air handler fans. Usage is also high due to the multiple redundancies.
Cooling accounts for 16% of total power consumption: 75% of cooling consumption is attributable to the cooling systems themselves and 25% to the heat exchanger fans and circulating pumps.
Cooling distribution accounts for 5% of total data center consumption. This corresponds to the distribu-tion pumps bringing chilled water to the air conditioning cabinets and the air conditioning cabinet fans.
Figure 15: Annual consumption by usage
1
4 m² IT = m² of server rooms (generally referred to as IT rooms) Data centers - State-of-the-art report // Efficacity - 21
DATA CENTERS, GENERAL REMARKS
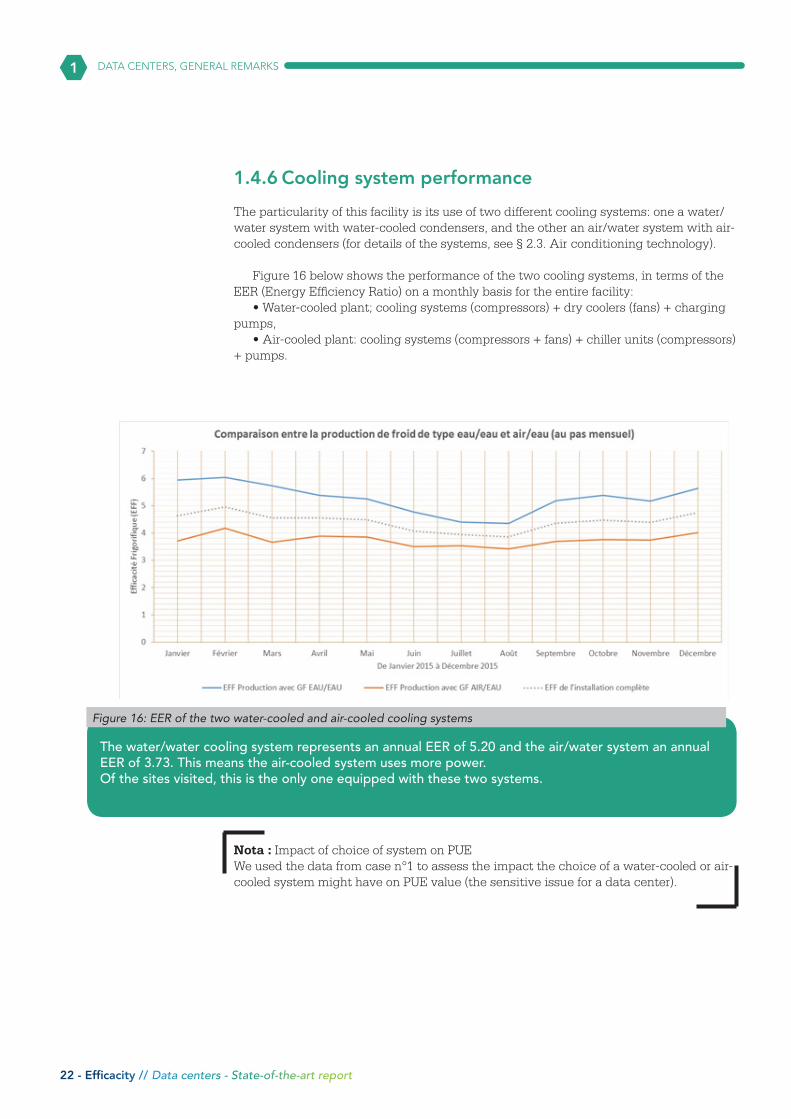
1.4.6 Cooling system performance
The particularity of this facility is its use of two different cooling systems: one a water/water system with water-cooled condensers, and the other an air/water system with air-cooled condensers (for details of the systems, see § 2.3. Air conditioning technology).
Figure 16 below shows the performance of the two cooling systems, in terms of the EER (Energy Efficiency Ratio) on a monthly basis for the entire facility:
• Water-cooled plant; cooling systems (compressors) + dry coolers (fans) + charging pumps,
• Air-cooled plant: cooling systems (compressors + fans) + chiller units (compressors) + pumps.
Nota : Impact of choice of system on PUEWe used the data from case n°1 to assess the impact the choice of a water-cooled or air-cooled system might have on PUE value (the sensitive issue for a data center).
Figure 16: EER of the two water-cooled and air-cooled cooling systems
The water/water cooling system represents an annual EER of 5.20 and the air/water system an annual EER of 3.73. This means the air-cooled system uses more power. Of the sites visited, this is the only one equipped with these two systems.
1
22 - Efficacity // Data centers - State-of-the-art report
DATA CENTERS, GENERAL REMARKS
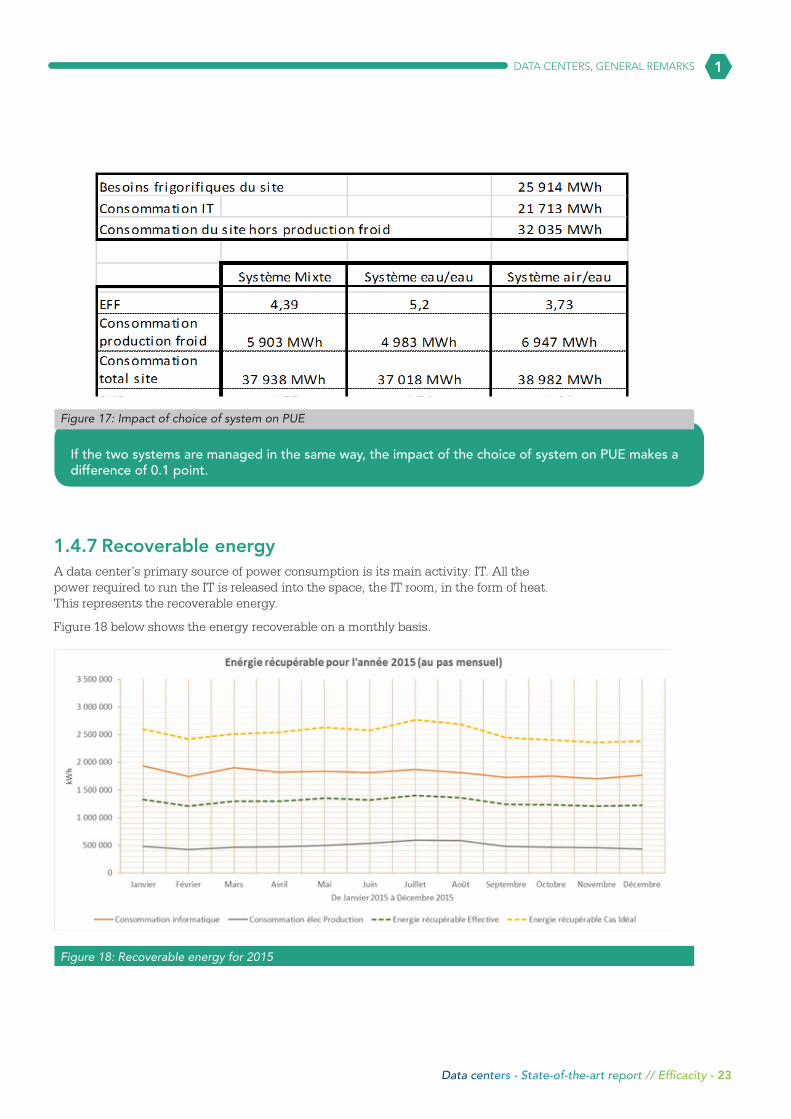
1.4.7 Recoverable energyA data center’s primary source of power consumption is its main activity: IT. All the power required to run the IT is released into the space, the IT room, in the form of heat. This represents the recoverable energy.
Figure 18 below shows the energy recoverable on a monthly basis.
Figure 17: Impact of choice of system on PUE
If the two systems are managed in the same way, the impact of the choice of system on PUE makes a difference of 0.1 point.
Figure 18: Recoverable energy for 2015
1
Data centers - State-of-the-art report // Efficacity - 23
DATA CENTERS, GENERAL REMARKS
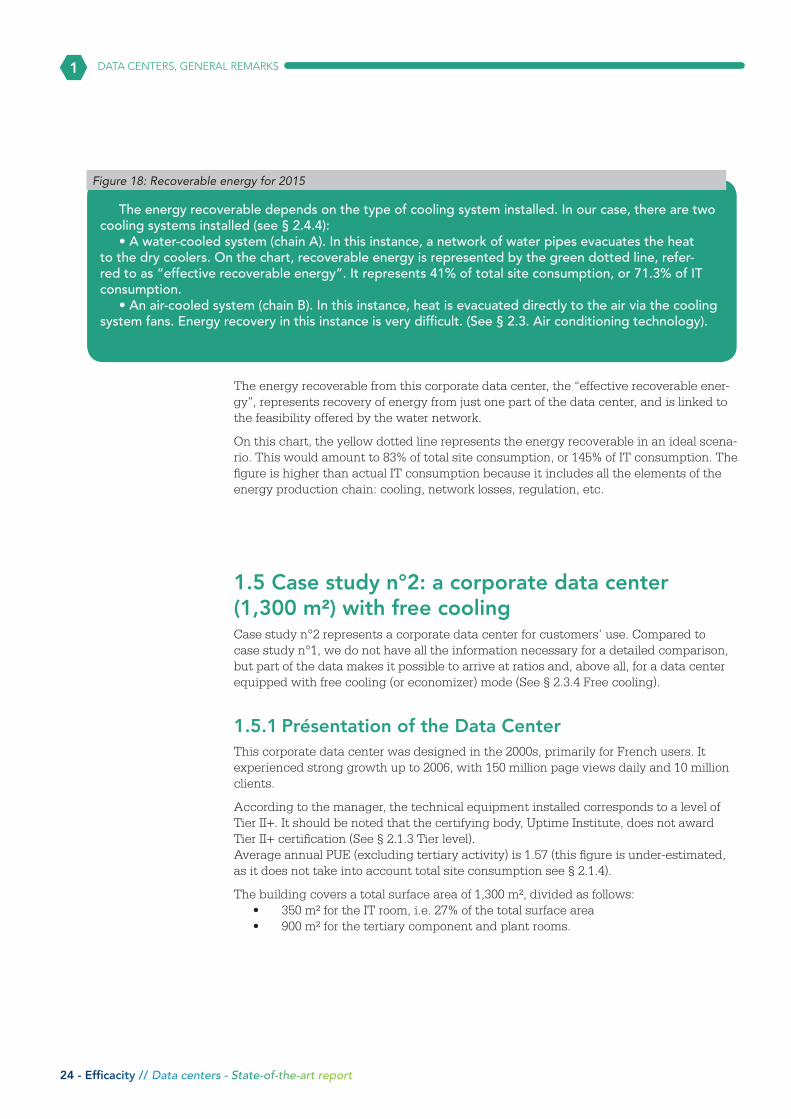
The energy recoverable from this corporate data center, the “effective recoverable ener-gy”, represents recovery of energy from just one part of the data center, and is linked to the feasibility offered by the water network.
On this chart, the yellow dotted line represents the energy recoverable in an ideal scena-rio. This would amount to 83% of total site consumption, or 145% of IT consumption. The figure is higher than actual IT consumption because it includes all the elements of the energy production chain: cooling, network losses, regulation, etc.
1.5 Case study n°2: a corporate data center (1,300 m²) with free coolingCase study n°2 represents a corporate data center for customers’ use. Compared to case study n°1, we do not have all the information necessary for a detailed comparison, but part of the data makes it possible to arrive at ratios and, above all, for a data center equipped with free cooling (or economizer) mode (See § 2.3.4 Free cooling).
1.5.1 Présentation of the Data CenterThis corporate data center was designed in the 2000s, primarily for French users. It experienced strong growth up to 2006, with 150 million page views daily and 10 million clients.
According to the manager, the technical equipment installed corresponds to a level of Tier II+. It should be noted that the certifying body, Uptime Institute, does not award Tier II+ certification (See § 2.1.3 Tier level). Average annual PUE (excluding tertiary activity) is 1.57 (this figure is under-estimated, as it does not take into account total site consumption see § 2.1.4).
The building covers a total surface area of 1,300 m², divided as follows:• 350 m² for the IT room, i.e. 27% of the total surface area• 900 m² for the tertiary component and plant rooms.
Figure 18: Recoverable energy for 2015
The energy recoverable depends on the type of cooling system installed. In our case, there are two cooling systems installed (see § 2.4.4):
• A water-cooled system (chain A). In this instance, a network of water pipes evacuates the heat to the dry coolers. On the chart, recoverable energy is represented by the green dotted line, refer-red to as “effective recoverable energy”. It represents 41% of total site consumption, or 71.3% of IT consumption.
• An air-cooled system (chain B). In this instance, heat is evacuated directly to the air via the cooling system fans. Energy recovery in this instance is very difficult. (See § 2.3. Air conditioning technology).
1
24 - Efficacity // Data centers - State-of-the-art report
DATA CENTERS, GENERAL REMARKS
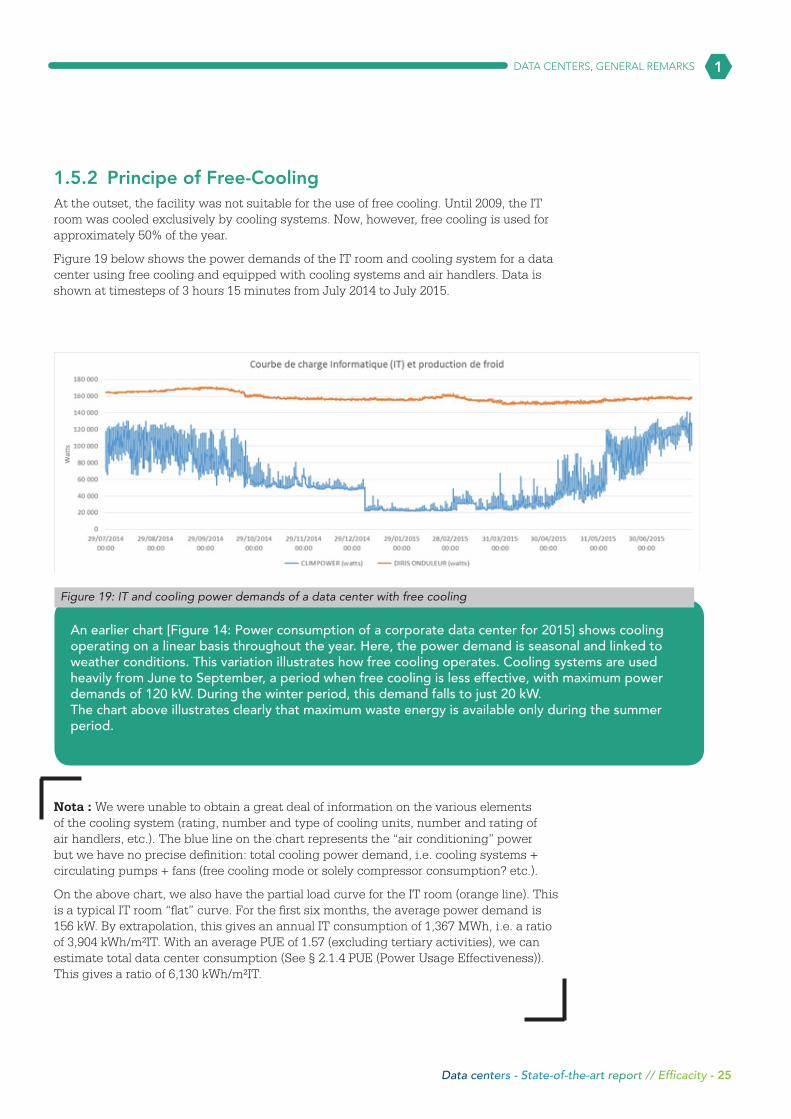
1.5.2 Principe of Free-CoolingAt the outset, the facility was not suitable for the use of free cooling. Until 2009, the IT room was cooled exclusively by cooling systems. Now, however, free cooling is used for approximately 50% of the year.
Figure 19 below shows the power demands of the IT room and cooling system for a data center using free cooling and equipped with cooling systems and air handlers. Data is shown at timesteps of 3 hours 15 minutes from July 2014 to July 2015.
Nota : We were unable to obtain a great deal of information on the various elements of the cooling system (rating, number and type of cooling units, number and rating of air handlers, etc.). The blue line on the chart represents the “air conditioning” power but we have no precise definition: total cooling power demand, i.e. cooling systems + circulating pumps + fans (free cooling mode or solely compressor consumption? etc.).
On the above chart, we also have the partial load curve for the IT room (orange line). This is a typical IT room “flat” curve. For the first six months, the average power demand is 156 kW. By extrapolation, this gives an annual IT consumption of 1,367 MWh, i.e. a ratio of 3,904 kWh/m²IT. With an average PUE of 1.57 (excluding tertiary activities), we can estimate total data center consumption (See § 2.1.4 PUE (Power Usage Effectiveness)). This gives a ratio of 6,130 kWh/m²IT.
Figure 19: IT and cooling power demands of a data center with free cooling
An earlier chart [Figure 14: Power consumption of a corporate data center for 2015] shows cooling operating on a linear basis throughout the year. Here, the power demand is seasonal and linked to weather conditions. This variation illustrates how free cooling operates. Cooling systems are used heavily from June to September, a period when free cooling is less effective, with maximum power demands of 120 kW. During the winter period, this demand falls to just 20 kW. The chart above illustrates clearly that maximum waste energy is available only during the summer period.
1
Data centers - State-of-the-art report // Efficacity - 25
DATA CENTERS, GENERAL REMARKS
1.5.3 Description of how free cooling worksFree cooling mode is used winter and summer alike. It is managed on the basis of out-door temperature, and humidity levels are monitored.
The setpoints in place are:• When the outdoor temperature is below 16°C, cooling is 100% by means of fresh air,• At outdoor temperatures of between 16 and 24°C, cooling is supplemented by one
or more cooling units, • At outdoor temperatures above 24°C, free cooling is no longer used and all cooling
is provided by cooling systems.
Nota : Free cooling works in various ways, depending on the operator (and the sys-tem?).One of the data centers visited uses free cooling by means of an all-air rooftop system. The free cooling plant was designed into the project from the outset and the building adapted accordingly. The description we were given presents a disparity in the choice of setpoints:• Below an outdoor temperature of 21.5°C, no compressor operates: pure free cooling with humidification if relative humidity is below 35% and dehumidification if relative humidity is above 65%. The free cooling system is operational 80% of the year. The air is systematically filtered. • Between 21.5 and 22.5°C, a rooftop unit (compressor) is brought into service for every 0.5°C increment. The rooftop supply air temperature is 15.5°C, with a return air temperature of 28°C.Since 2011, the most heavily used compressor has been in service for only 211 hours.
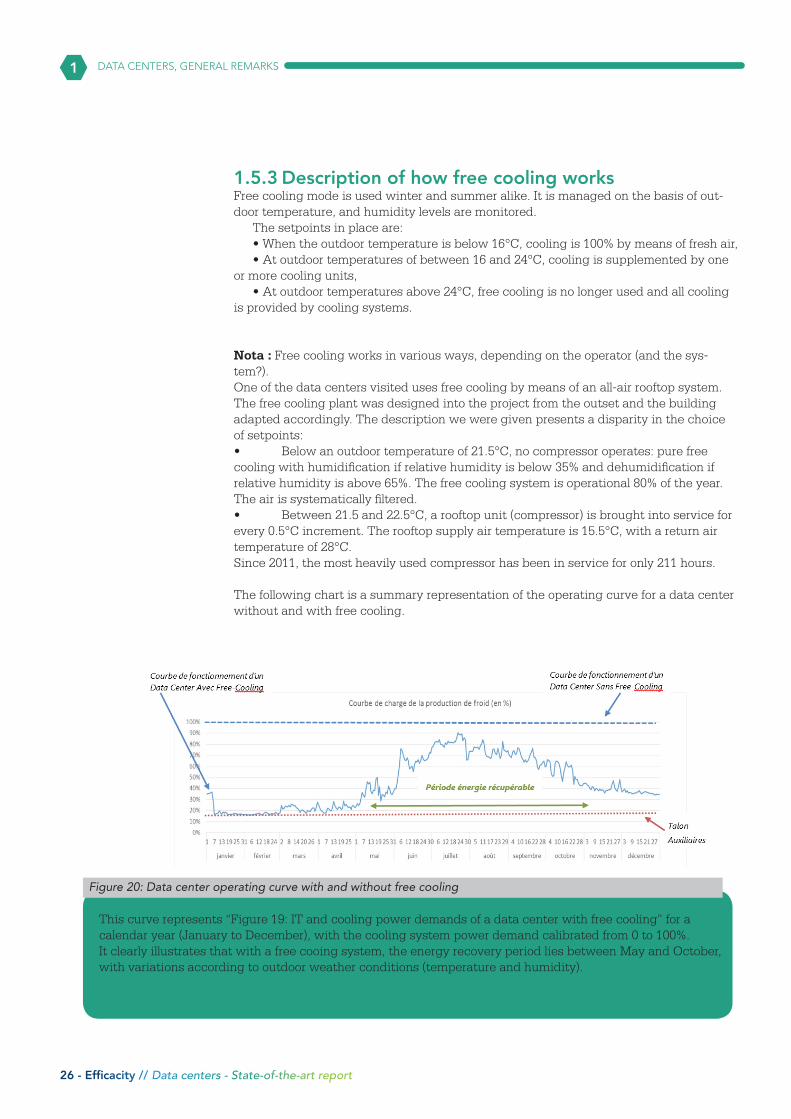
The following chart is a summary representation of the operating curve for a data center without and with free cooling.
Figure 20: Data center operating curve with and without free cooling
This curve represents “Figure 19: IT and cooling power demands of a data center with free cooling” for a calendar year (January to December), with the cooling system power demand calibrated from 0 to 100%. It clearly illustrates that with a free cooing system, the energy recovery period lies between May and October, with variations according to outdoor weather conditions (temperature and humidity).
1
26 - Efficacity // Data centers - State-of-the-art report
DATA CENTERS, GENERAL REMARKS

Data centers - State-of-the-art report // Efficacity - 27
2.1 Waste heatThe data obtained on the corporate data center (described in § 2.4 Case study n°1: a corporate data center (15,500 m²)) represents the baseline case for the description of heat recovery. The data is supplemented from the other site visits and meetings with technical managers.
In waste energy recovery, the key figures and data from a data center are:• Surface areas, distinguishing between total surface area and the IT surface area, • Electrical power used, IT power,• The cooling system, feasibility of recovery
On all our data center visits, the hardest data to obtain was IT installed power. This is vital information, because it will dictate the scaling of all the other systems.
On the other hand, it was relatively easy to obtain data from technical managers on their site’s Tier equivalency (Cf. § 2.1.3 Niveau TIER), since even when there is no intention to apply for certification, the site’s positioning against this standard is a consideration (commercial argument).
This data provides us with information on security level in terms of unavailability but, more importantly, on power density, from which we can estimate installed power. At Tier IV, for example, energy density is ≥ 1 500 W/m²IT.
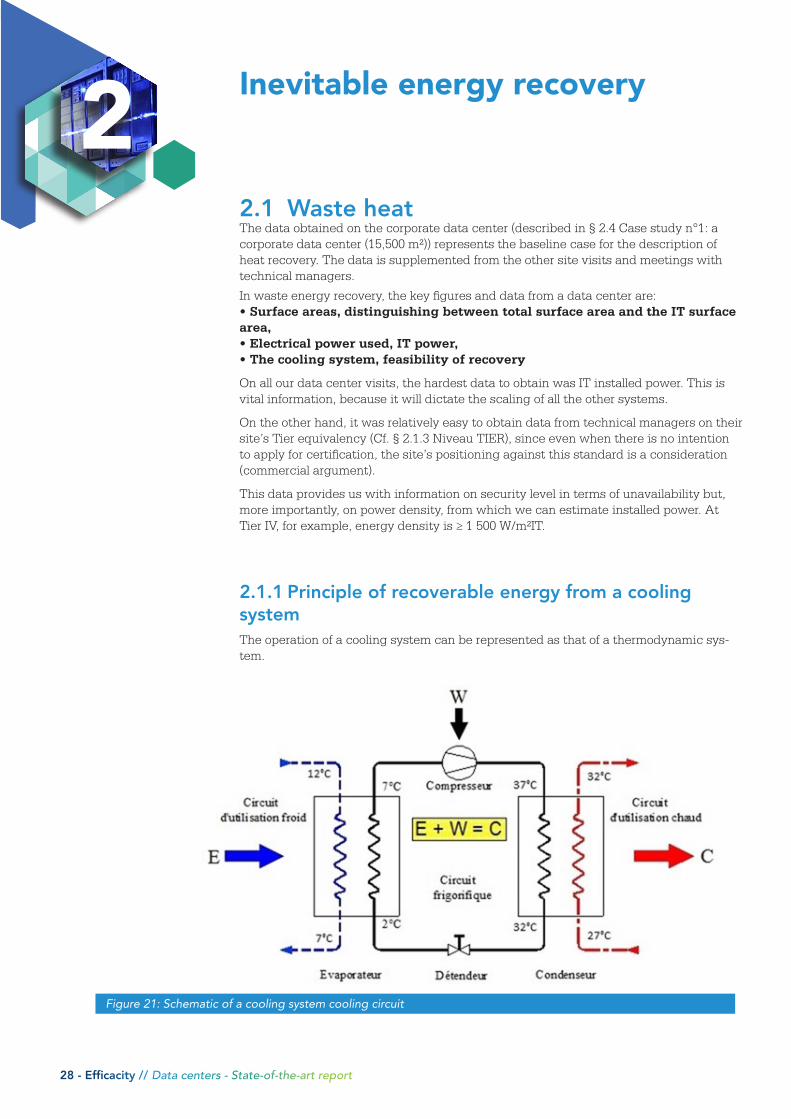
2.1.1 Principle of recoverable energy from a cooling systemThe operation of a cooling system can be represented as that of a thermodynamic sys-tem.
Figure 21: Schematic of a cooling system cooling circuit
2 Inevitable energy recovery
28 - Efficacity // Data centers - State-of-the-art report
2
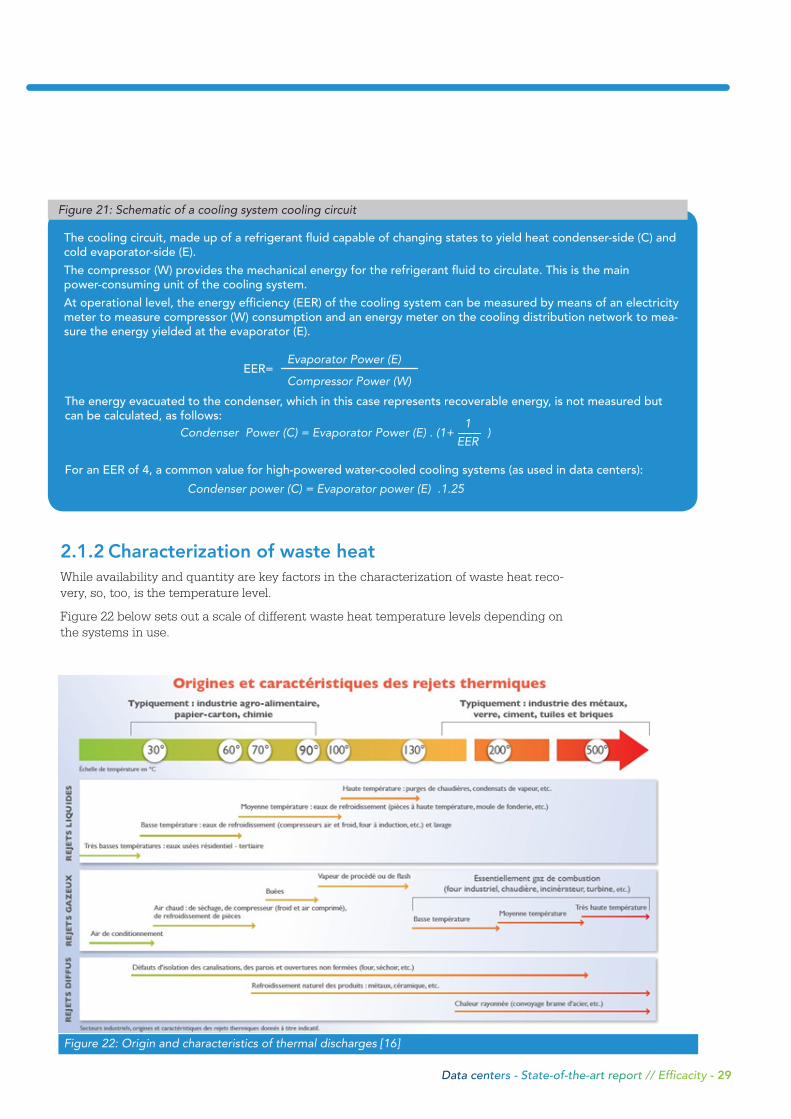
2.1.2 Characterization of waste heatWhile availability and quantity are key factors in the characterization of waste heat reco-very, so, too, is the temperature level.
Figure 22 below sets out a scale of different waste heat temperature levels depending on the systems in use.
Figure 21: Schematic of a cooling system cooling circuit
The cooling circuit, made up of a refrigerant fluid capable of changing states to yield heat condenser-side (C) and cold evaporator-side (E).
The compressor (W) provides the mechanical energy for the refrigerant fluid to circulate. This is the main power-consuming unit of the cooling system.
At operational level, the energy efficiency (EER) of the cooling system can be measured by means of an electricity meter to measure compressor (W) consumption and an energy meter on the cooling distribution network to mea-sure the energy yielded at the evaporator (E).
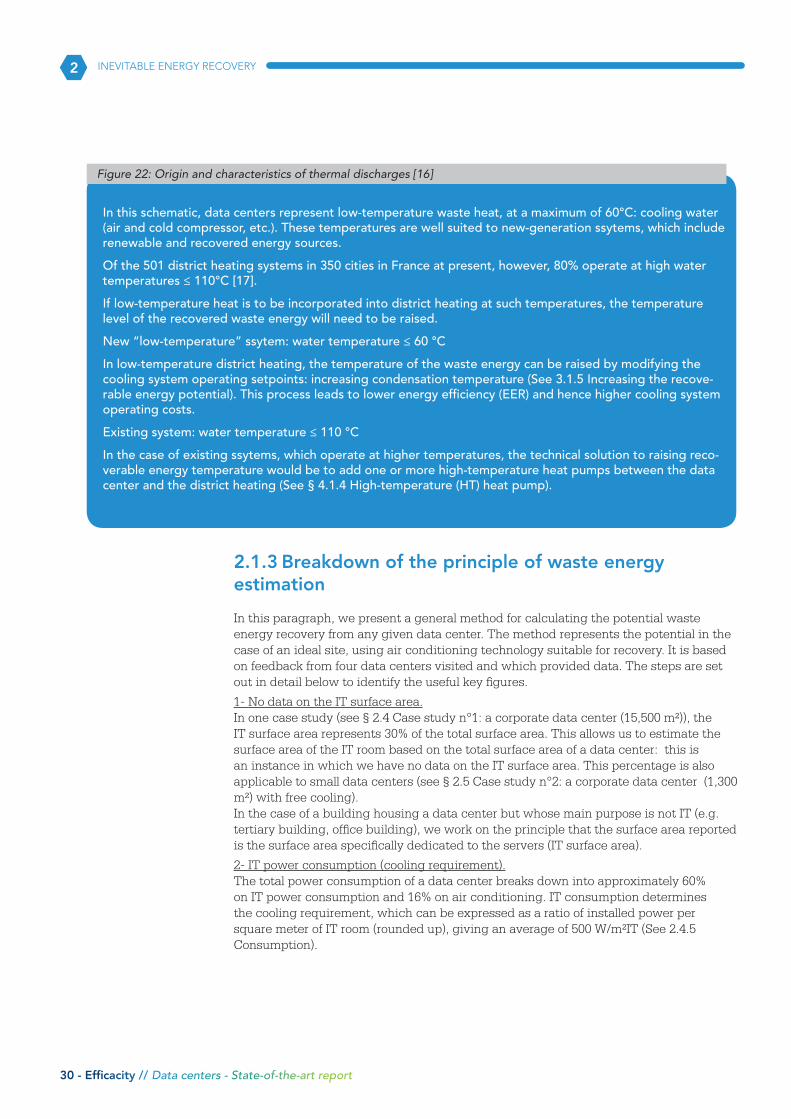
Figure 22: Origin and characteristics of thermal discharges [16]
Data centers - State-of-the-art report // Efficacity - 29
EER= Evaporator Power (E)
Compressor Power (W)
The energy evacuated to the condenser, which in this case represents recoverable energy, is not measured but can be calculated, as follows:
Condenser Power (C) = Evaporator Power (E) . (1+ )1
EER
For an EER of 4, a common value for high-powered water-cooled cooling systems (as used in data centers):
Condenser power (C) = Evaporator power (E) .1.25
2.1.3 Breakdown of the principle of waste energy estimation
In this paragraph, we present a general method for calculating the potential waste energy recovery from any given data center. The method represents the potential in the case of an ideal site, using air conditioning technology suitable for recovery. It is based on feedback from four data centers visited and which provided data. The steps are set out in detail below to identify the useful key figures.
1- No data on the IT surface area.In one case study (see § 2.4 Case study n°1: a corporate data center (15,500 m²)), the IT surface area represents 30% of the total surface area. This allows us to estimate the surface area of the IT room based on the total surface area of a data center: this is an instance in which we have no data on the IT surface area. This percentage is also applicable to small data centers (see § 2.5 Case study n°2: a corporate data center (1,300 m²) with free cooling).In the case of a building housing a data center but whose main purpose is not IT (e.g. tertiary building, office building), we work on the principle that the surface area reported is the surface area specifically dedicated to the servers (IT surface area).
2- IT power consumption (cooling requirement).The total power consumption of a data center breaks down into approximately 60% on IT power consumption and 16% on air conditioning. IT consumption determines the cooling requirement, which can be expressed as a ratio of installed power per square meter of IT room (rounded up), giving an average of 500 W/m²IT (See 2.4.5 Consumption).
Figure 22: Origin and characteristics of thermal discharges [16]
In this schematic, data centers represent low-temperature waste heat, at a maximum of 60°C: cooling water (air and cold compressor, etc.). These temperatures are well suited to new-generation ssytems, which include renewable and recovered energy sources.
Of the 501 district heating systems in 350 cities in France at present, however, 80% operate at high water temperatures ≤ 110°C [17].
If low-temperature heat is to be incorporated into district heating at such temperatures, the temperature level of the recovered waste energy will need to be raised.
New “low-temperature” ssytem: water temperature ≤ 60 °C
In low-temperature district heating, the temperature of the waste energy can be raised by modifying the cooling system operating setpoints: increasing condensation temperature (See 3.1.5 Increasing the recove-rable energy potential). This process leads to lower energy efficiency (EER) and hence higher cooling system operating costs.
Existing system: water temperature ≤ 110 °C
In the case of existing ssytems, which operate at higher temperatures, the technical solution to raising reco-verable energy temperature would be to add one or more high-temperature heat pumps between the data center and the district heating (See § 4.1.4 High-temperature (HT) heat pump).
2 INEVITABLE ENERGY RECOVERY
30 - Efficacity // Data centers - State-of-the-art report
3- - Recoverable energy potential.The recoverable energy potential is calculated from the IT consumption (cooling requirement) and taking into account the energy efficiency of the cooling system, with an average energy efficiency of four (EER = 4), as follows: recoverable requirement (at 35°C, the condensation temperature) = cooling requirement * 1.25 (See § 3.1.1 Principle of recoverable energy from a cooling system).
Comment: When estimating the potential for energy recovery, it is important to bear in mind that: • the scaling of the power supply includes a margin, • a data center is never at maximum load, • data center equipment is not necessarily at 100% capacity, • and, above all, the algorithm employed is highly sensitive to surface area data (type of surface area).
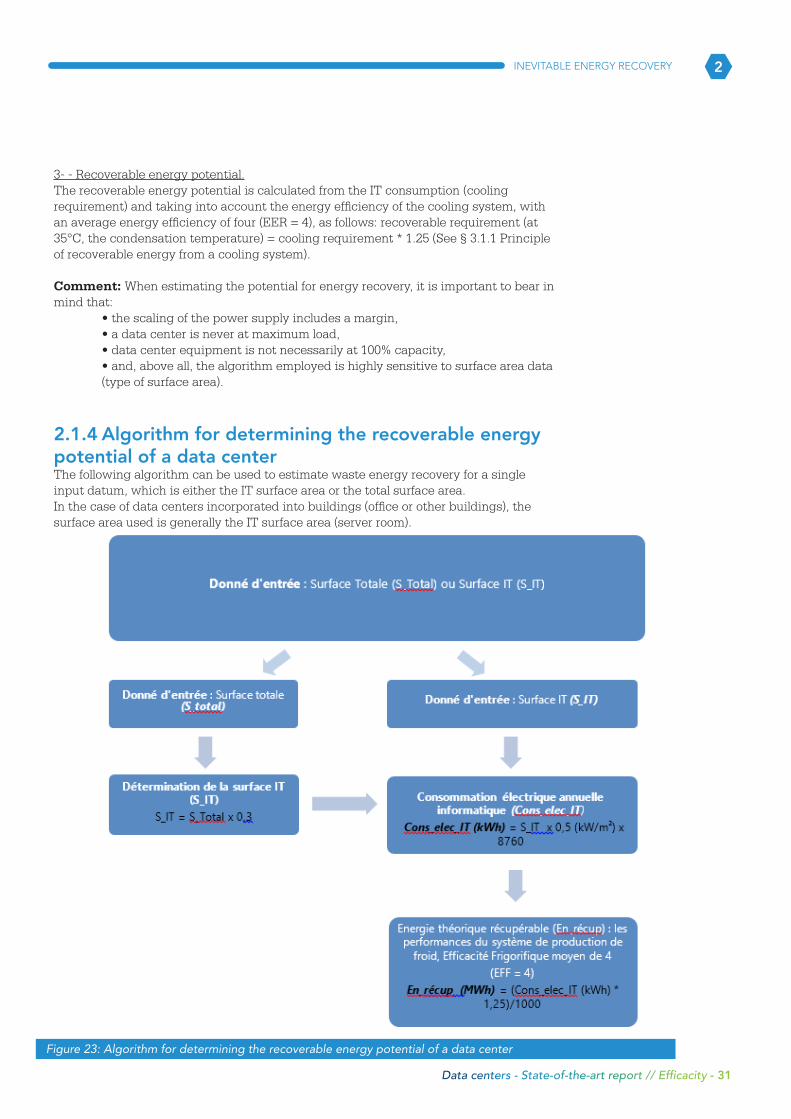
2.1.4 Algorithm for determining the recoverable energy potential of a data centerThe following algorithm can be used to estimate waste energy recovery for a single input datum, which is either the IT surface area or the total surface area. In the case of data centers incorporated into buildings (office or other buildings), the surface area used is generally the IT surface area (server room).
Figure 23: Algorithm for determining the recoverable energy potential of a data center
2INEVITABLE ENERGY RECOVERY
Data centers - State-of-the-art report // Efficacity - 31
The result obtained by this calculation gives an estimated recoverable energy potential at a temperature of approximately 35°C.
2.1.5 Increasing the recoverable energy potentialRecovering energy at a higher temperature enables this waste energy to be used as part of low-temperature district heating (when a new ssytem is being created), increases the recovery potential and provides good coverage of end-user heating needs.
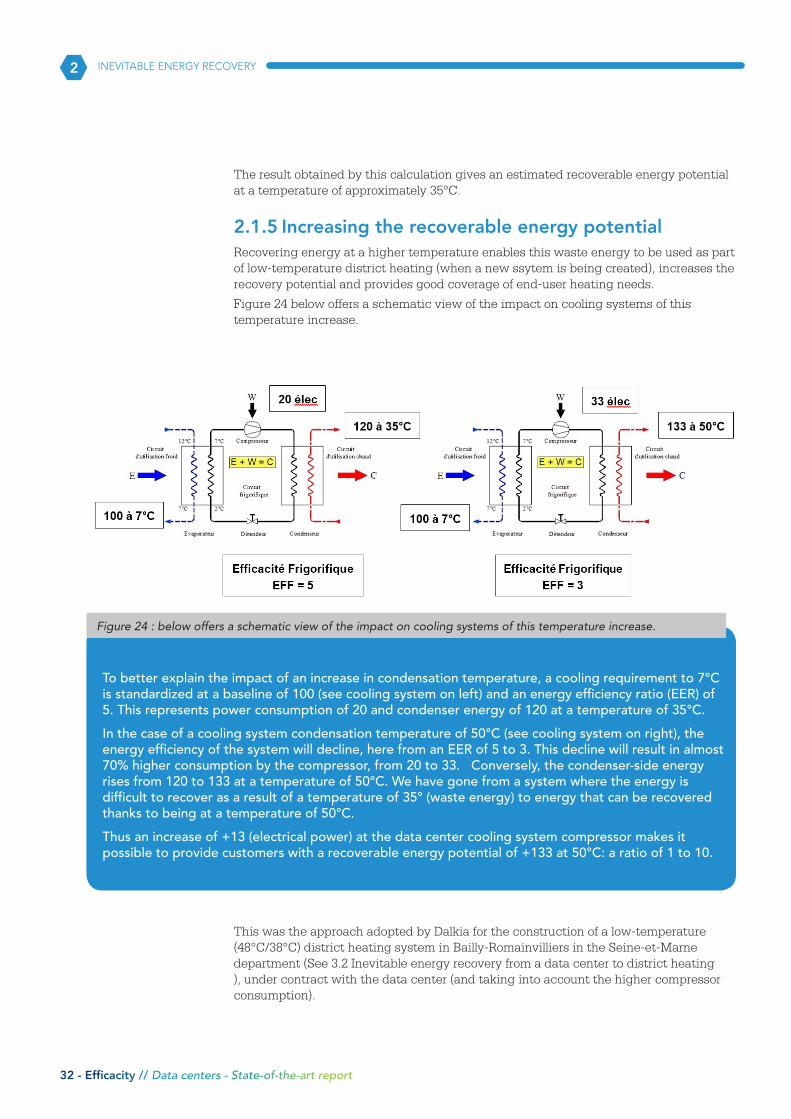
Figure 24 below offers a schematic view of the impact on cooling systems of this temperature increase.
This was the approach adopted by Dalkia for the construction of a low-temperature (48°C/38°C) district heating system in Bailly-Romainvilliers in the Seine-et-Marne department (See 3.2 Inevitable energy recovery from a data center to district heating ), under contract with the data center (and taking into account the higher compressor consumption).
Figure 24 : below offers a schematic view of the impact on cooling systems of this temperature increase.
To better explain the impact of an increase in condensation temperature, a cooling requirement to 7°C is standardized at a baseline of 100 (see cooling system on left) and an energy efficiency ratio (EER) of 5. This represents power consumption of 20 and condenser energy of 120 at a temperature of 35°C.
In the case of a cooling system condensation temperature of 50°C (see cooling system on right), the energy efficiency of the system will decline, here from an EER of 5 to 3. This decline will result in almost 70% higher consumption by the compressor, from 20 to 33. Conversely, the condenser-side energy rises from 120 to 133 at a temperature of 50°C. We have gone from a system where the energy is difficult to recover as a result of a temperature of 35° (waste energy) to energy that can be recovered thanks to being at a temperature of 50°C.
Thus an increase of +13 (electrical power) at the data center cooling system compressor makes it possible to provide customers with a recoverable energy potential of +133 at 50°C: a ratio of 1 to 10.
2
32 - Efficacity // Data centers - State-of-the-art report
INEVITABLE ENERGY RECOVERY
2.2 Waste energy recovery from a data center to district heating Press reviews frequently refer to the possibility of, or rather the potential for so-called recoverable waste energy from data centers.
Existing (or intended) operations that have put such ideas into action are few and far between, with realisation often falling short of expectations. A handful of operations have been implemented in France, to heat a greenhouse, an adjoining building or even the data center offices.
Between the initiation of a project (intentions) and its reality several years later, objectives do not always align.
In France, only one operation has actually used this energy to create a district heating system, and that is the Bailly-Romainvilliers low-temperature network recovering waste energy from the Natixis data center (see § 9.1 Appendix 1: CR1 - The Bailly-Romainvilliers low-temperature network and the Natixis data center + GIS target).
As with the other operations, there is plentiful communication on the project and its intentions, but published feedback is scarce.
We met the operator, Dalkia, but were unfortunately not able to visit the Natixis data center. The information gathered on the data center was obtained from the Internet, press reviews and annual reports by Natixis or its subsidiary.
2.2.1 Data Center NATIXISIn 2007, Natixis commissioned the construction of two data centers (Vega and Sirius) 30 km apart, one of which (Vega) is located in Bailly-Romainvilliers (Vega) and was delivered at the end of 2009 [18] [19].
The Bailly-Romainvilliers data center, with four IT rooms each of 750 m², applied for HQE® (high environmental quality) certification as part of a pilot scheme to develop HQE® standards applicable to data centers. It was in this context, involving optimal energy management, that the transfer of heat to a future aquatic complex was envisaged.
The data center occupies a total surface area of 12,000 m² (of which IT rooms make up 25%) and the equipment installed is of Tier IV equivalency [20].
Nota : In its Registration Document & Annual Financial Report for 2013 [21], Natixis reports energy consumption for 2011 of 50,626 MWh in connection with the operation of three data centers. Between 2011 and 2012, Natixis transferred two data centers, Sirius and Vega (the Bailly-Romainvilliers data center), to its subsidiary BPCE; this represents energy consumption of 40,692 MWh. As the Sirius and Vega data centers are identical, the following ratios can be deduced:
• Data center annual consumption of 20.3 GWh, equivalent to 6,782 kWh/m²IT,• IT share of consumption (60%) of 12.2 GWh, equivalent to 4,069 kWh/m²IT,• Installed power ratio of 465 W/m²IT,• Inevitable energy recoverable of 15.3 GWh, equivalent to 1,271 MWh/month.
Estimating recoverable energy using the algorithm (see § 3.1.4 Algorithm for determining the recoverable energy potential of a data center) gives annual recoverable energy (at 35°C) of 16.4 GWh, equivalent to 1,369 MWh/month.
2
Data centers - State-of-the-art report // Efficacity - 33
INEVITABLE ENERGY RECOVERY
2.2.2 Aquatic complexThe Val d’Europe aquatic complex, covering a total of 3,500 m² with a pool area of
775 m², was opened in September 2012 [22]. The site consists of [23]:• 1 25-meter eight-lane sports pool, 525 m²,• 1 leisure pool, 250 m²,• 1 25-metre outdoor pool (open all year round),• Sauna, steam bath, solarium…
2.2.3 Business incubatorThe business incubator consists of a building with a total surface area of 1,800 m², of which just over 1,500 m² is heated. The building is made up of 26 offices ranging in size from 12 to 40 m², two meeting rooms and seven workshops of between 70 and 100 m² [24] [25].The premises are fitted with ceiling-mounted radiant heat panels producing soft heat.
2.2.4 Dalkia boiler-houseThe plant room of the Dalkia boiler-house is equipped with a 3.5 MW heat exchanger to recover heat from the data center. An area has been set aside to add a second 3.5 MW heat exchanger should two new data centers be built [24].A backup 5 MW boiler is available for emergency use. The ssytem operates at 48°C/38°C: Dalkia is under contract with Natixis to raise the condensation temperature of the cooling systems to obtain a ssytem temperature of 48°C.
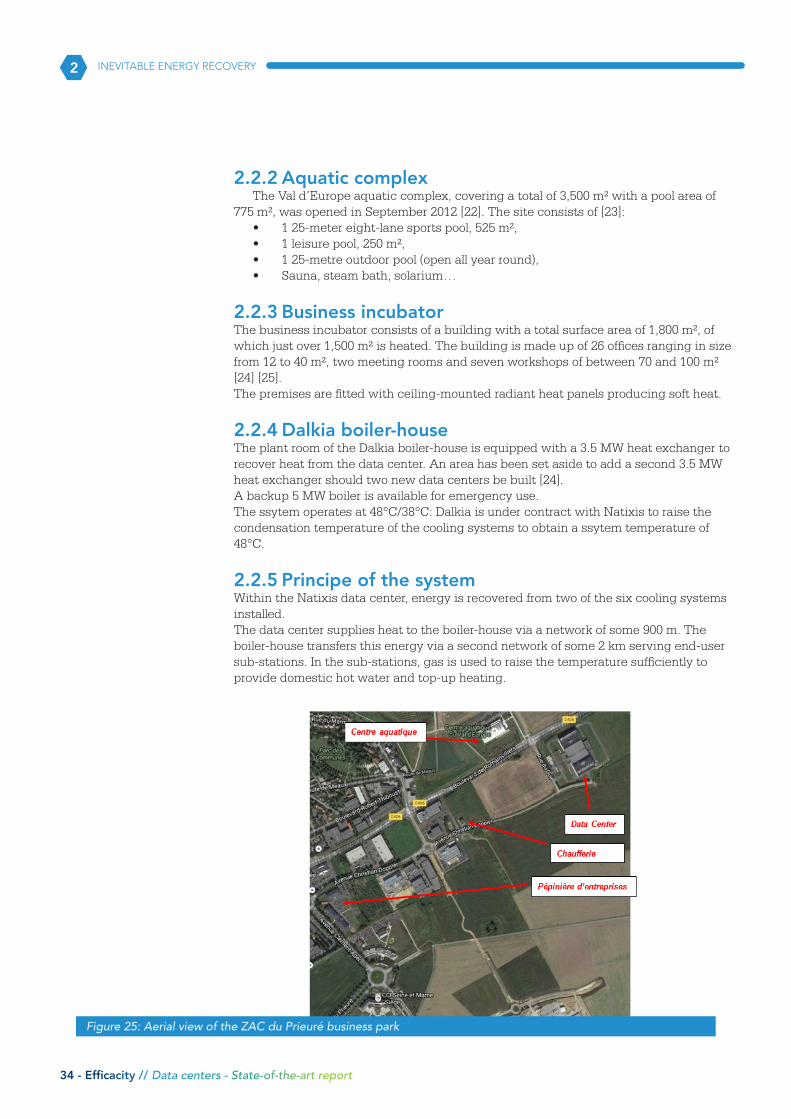
2.2.5 Principe of the systemWithin the Natixis data center, energy is recovered from two of the six cooling systems installed. The data center supplies heat to the boiler-house via a network of some 900 m. The boiler-house transfers this energy via a second network of some 2 km serving end-user sub-stations. In the sub-stations, gas is used to raise the temperature sufficiently to provide domestic hot water and top-up heating.
2
Figure 25: Aerial view of the ZAC du Prieuré business park
34 - Efficacity // Data centers - State-of-the-art report
INEVITABLE ENERGY RECOVERY
The district heating system for the ZAC du Prieuré business park was initially scaled for the recoverable energy from the Natixis data center and was supposed to be capable of heating up to 600,000 m². At present, only the aquatic complex and the business nursery are connected to the ssytem, and together represent 6,000 m² [24].
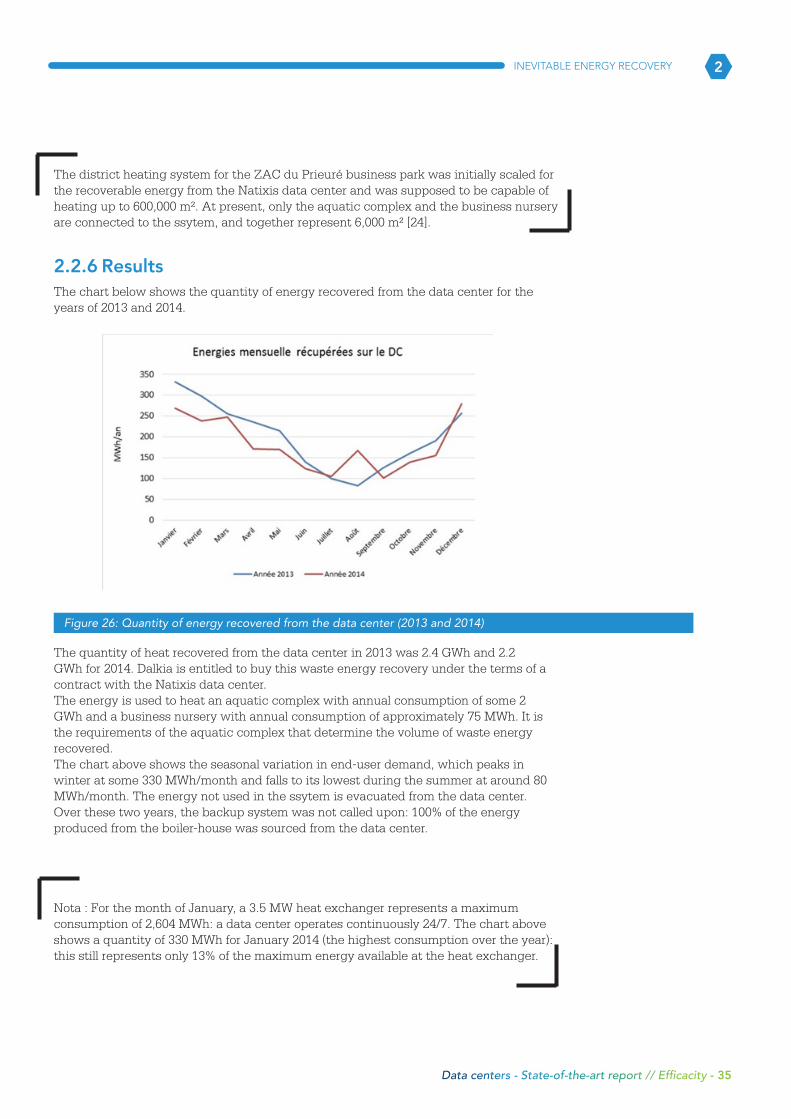
2.2.6 ResultsThe chart below shows the quantity of energy recovered from the data center for the years of 2013 and 2014.
The quantity of heat recovered from the data center in 2013 was 2.4 GWh and 2.2 GWh for 2014. Dalkia is entitled to buy this waste energy recovery under the terms of a contract with the Natixis data center. The energy is used to heat an aquatic complex with annual consumption of some 2 GWh and a business nursery with annual consumption of approximately 75 MWh. It is the requirements of the aquatic complex that determine the volume of waste energy recovered. The chart above shows the seasonal variation in end-user demand, which peaks in winter at some 330 MWh/month and falls to its lowest during the summer at around 80 MWh/month. The energy not used in the ssytem is evacuated from the data center. Over these two years, the backup system was not called upon: 100% of the energy produced from the boiler-house was sourced from the data center.
Nota : For the month of January, a 3.5 MW heat exchanger represents a maximum consumption of 2,604 MWh: a data center operates continuously 24/7. The chart above shows a quantity of 330 MWh for January 2014 (the highest consumption over the year): this still represents only 13% of the maximum energy available at the heat exchanger.
2
Figure 26: Quantity of energy recovered from the data center (2013 and 2014)
Data centers - State-of-the-art report // Efficacity - 35
INEVITABLE ENERGY RECOVERY
2.3 New generation waste energyAfter describing what a data center is, how it is structured, what cooling technologies may be deployed, the various sources of consumption, how to estimate “waste” recoverable energy, and the constraints on this recovery at low temperatures (with the HT heat pump as one solution), we obtained feedback from an ideal case study, the only operation in France to have created a new low-temperature system based on energy recovered from a data center. Until now, the various data center energy recovery approaches described have been of the “classic” kind, with energy produced in one location (operating IT equipment generates heat), then transported across a district or city (in the event of a new system used as such in a low-temperature ssytem, or a ssytem with the temperature raised by an HT heat pump in the event of an existing ssytem) to the end-user via terminal devices (radiators, etc.). Other models are now beginning to appear, inspired by new ways of thinking. Implicitly, when we think of heat recovery, we tend to think of heat exchangers, pipes, pumps, flow rates, temperatures, etc. Effectively, we think in terms of plumbing. These new models, on the other hand, adopt a highly innovative approach. For the costs of high-performance computing (HPC) to be competitive, the ideal solution would be to avoid the need to invest in a data center, and instead have a multitude of distributed servers linked by Internet. Furthermore, since the electricity consumed by these servers will ultimately be dissipated in the form of heat, why not install these servers in buildings that require heating? Rather than have servers consuming energy in a data center (that will then require air conditioning), why not simply dissipate this energy where it is needed? A number of startups have put into practice this innovative vision of waste energy recovery.
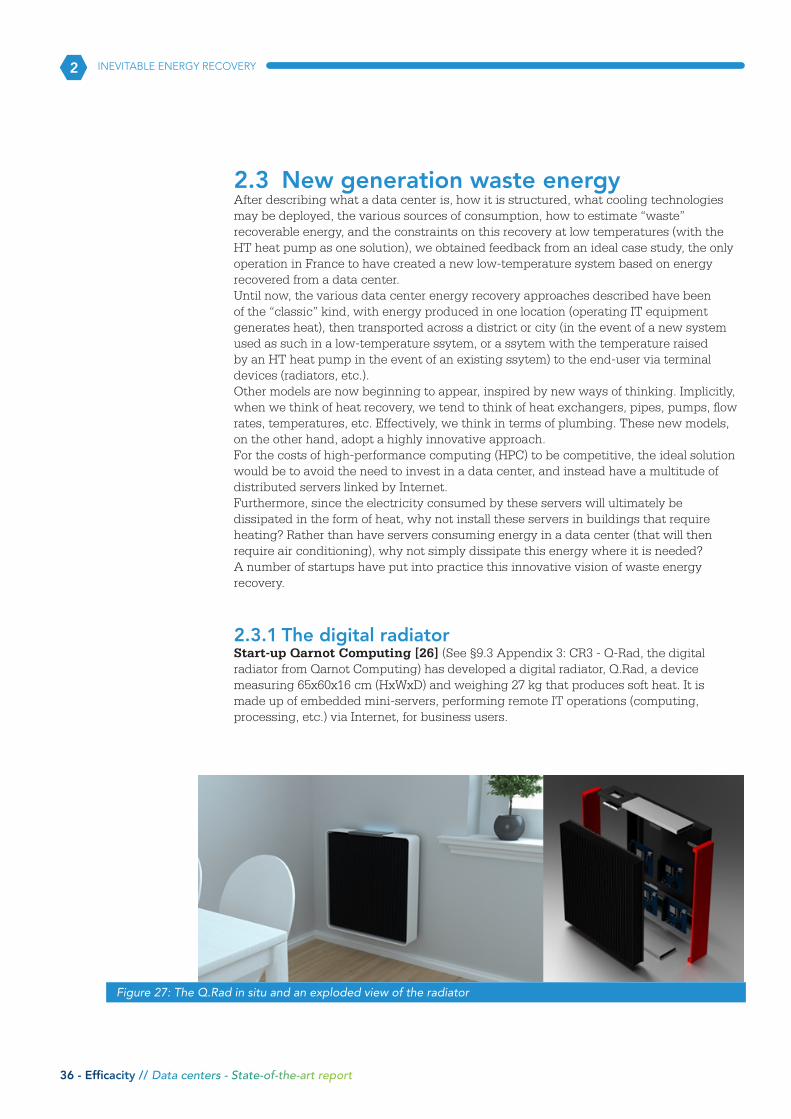
2.3.1 The digital radiatorStart-up Qarnot Computing [26] (See §9.3 Appendix 3: CR3 - Q-Rad, the digital radiator from Qarnot Computing) has developed a digital radiator, Q.Rad, a device measuring 65x60x16 cm (HxWxD) and weighing 27 kg that produces soft heat. It is made up of embedded mini-servers, performing remote IT operations (computing, processing, etc.) via Internet, for business users.
2
Figure 27: The Q.Rad in situ and an exploded view of the radiator
36 - Efficacity // Data centers - State-of-the-art report
INEVITABLE ENERGY RECOVERY
Q.Rad has a single dissipated power rating of 500 W. The user determines the setpoint and the regulation system adapts processor frequency to requirements, shutting down computation if necessary (in summer, for example).Software platform Q.ware handles secure dynamic distribution of computation, taking into account in particular: • adjustment of processor frequency (temperature regulation), • selection of the optimal compute node: Q.Rads, backup data centers or IaaS (Infrastructure as a Service), • the computation start, distribution and recovery sequence, • task management (progression, error recovery, etc.).The radiator is connected to Internet by an RJ45 connection and the site must be equipped with fibre (symmetric 100 Gb). In the event of failure or periods of extreme cold, the radiator is equipped with a backup electrical resistance.
Qarnot Computing covers the costs of electricity and maintenance for the digital radiator, in return for the client investing in Q.Rads at a cost of €2,500 plus VAT per unit. Qarnot Computing has installed over 300 Q.Rad radiators in social housing in Paris [27].
Qarnot Computing recently converted its Q.Rad radiator into a connected device, Smart Q.Rad. The development involves the addition of a kit consisting of close on 20 sensors and interfaces plus communication capacity:
In 2017, 347 Smart Q.Rad radiators are due to be installed in social housing in the Bordeaux area [28]. The investment cost of this new-generation digital radio is €3,500 + VAT per unit. In December 2016, Q.Rad radiators were installed in the BNP Paribas WAI (We Are Innovation) building in Paris (Qarnot Computing delivers HPC services to BNP) [29].
2
Sensors • Temperature,• CO2,• Humidity,• Noise level,• Stereo microphone,• Motion detector,• Light level,• Pressure,• Air quality, with VOC
measurement.
Interface• Touch screen,• Induction smartphone charger,• LED strip (for atmospheric lighting
or as a timed nightlight for children),• Stereo speaker,• Dual USB charger,• Proximity sensor.
Communication• Wifi (according to Qarnot, with a less
powerful signal than a classic Internet box; Wifi on/off can be coupled to the motion detection function),
• Bluetooth,• Symmetric 100 Mb Ethernet
connection,• EnOcean®, a compatible protocol for
battery-free/wireless home automation applications,
• USB extension
Data centers - State-of-the-art report // Efficacity - 37
INEVITABLE ENERGY RECOVERY
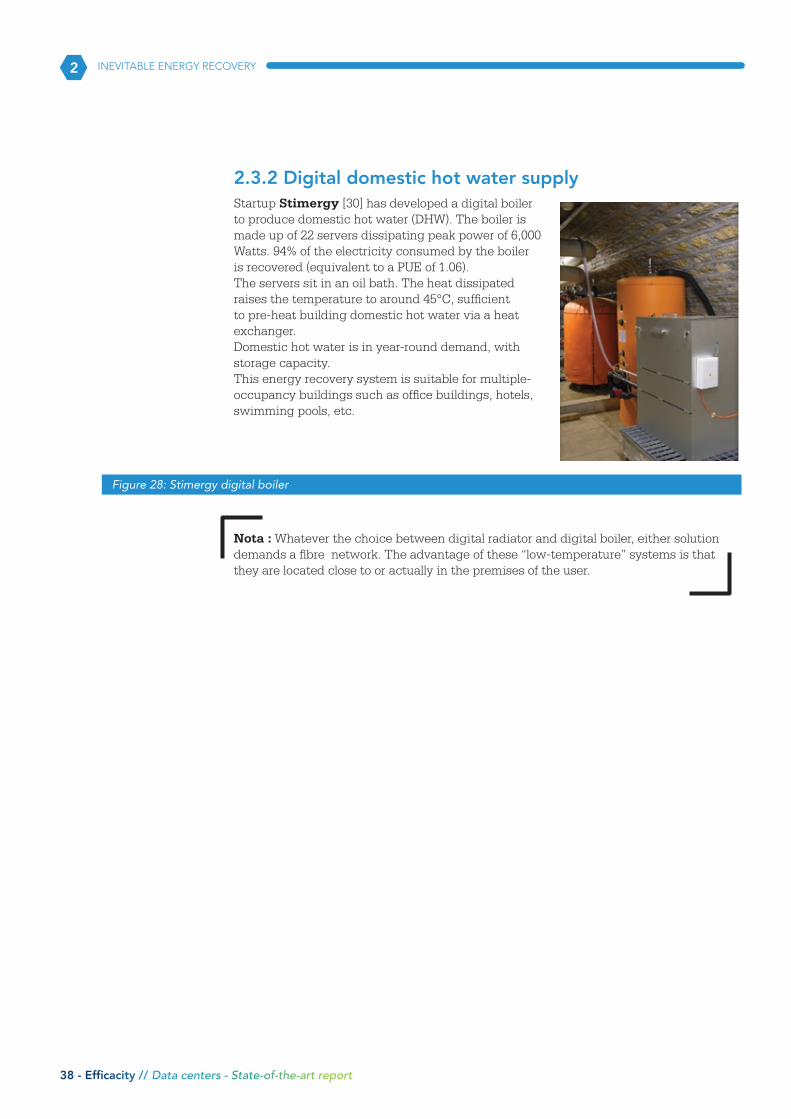
2.3.2 Digital domestic hot water supplyStartup Stimergy [30] has developed a digital boiler to produce domestic hot water (DHW). The boiler is made up of 22 servers dissipating peak power of 6,000 Watts. 94% of the electricity consumed by the boiler is recovered (equivalent to a PUE of 1.06).The servers sit in an oil bath. The heat dissipated raises the temperature to around 45°C, sufficient to pre-heat building domestic hot water via a heat exchanger.Domestic hot water is in year-round demand, with storage capacity. This energy recovery system is suitable for multiple-occupancy buildings such as office buildings, hotels, swimming pools, etc.
Nota : Whatever the choice between digital radiator and digital boiler, either solution demands a fibre network. The advantage of these “low-temperature” systems is that they are located close to or actually in the premises of the user.
2
Figure 28: Stimergy digital boiler
38 - Efficacity // Data centers - State-of-the-art report
INEVITABLE ENERGY RECOVERY

2
Data centers - State-of-the-art report // Efficacity - 39
INEVITABLE ENERGY RECOVERY
In the paragraphs above, we have examined what a data center is, how much so-called waste energy could be recovered, and the connection between this energy, the district heating system and the user.
A data center offers potential for the recovery of low-temperature energy. In order to be able to use that energy, it must first be transported. In the previous chapter (see § 3.2 Inevitable energy recovery from a data center to district heating ), we described an operation, the only one of its kind in France, for the creation of district heating based on the recovery of waste energy. This is the ideal case when setting up business parks (ZACs) with a data center recently established nearby.
3.1.1 GIS targeting of data center/district heating pai-rings in the Paris region In most cases, and particularly in the case of an existing data center in an urban area, if the recoverable energy is to be transported, it must be connected to existing district heating, which raises the first question: are there any data centers located close to district heating systems?
Most existing district heating systems (80%) operate at water temperatures of ≤ 110°C (See 3.1.2 Characterization ).
To avoid excessive investment costs, the need for a network between the data center and the district heating, and excessive heat losses, we will confine our search to a maximum district heating-data center distance of 2 km, raising the second question: what, if any, data centers are located less than 2 km (following the line of the roads) from district heating at a temperature of ≤ 110°C?
To find an answer to these questions, we called on the mapping skills of engineering consultants Setec using a Geographic Information System (GIS). This GIS targeting was carried out exclusively in the Paris region in order to estimate the potential in this area. The detailed report is included in the appendices (See § 9.1 Appendix 1: CR1 - The Bailly-Romainvilliers low-temperature network and the Natixis data center + GIS target and § 9.2 Appendix 2: CR2 – Energy potential in the Paris region for 3 operations targeted by GIS ).
The GIS request enabled us to identify three data centers providing a positive response to our two questions. The data can be summarized as follows (for full details of the data, see § 9.1 Appendix 2: CR2 – Energy potential in the Paris region for 3 operations targeted by GIS ):
• Alionis in Villebon-sur-Yvette,o Total surface area 1,100 m²o Data center /district heating distance: approximately 150 mo Estimated recoverable energy: between 1 and 2 GWh35°C annually (with an IT
surface area of 30% or 60%)o Special feature: high hypothesis of a water-cooled air conditioning system
Feasability study on use of inevitable energy recovered from Data Centers
40 - Efficacity // Data centers - State-of-the-art report
23
• Green Data Center in Suresnes,o Total surface area 1,850 m²o Data center /district heating distance: 0 m, the building is already supplied by the
heating ssytem o Estimated recoverable energy: between 1.8 and 3.6 GWh35°C annually (with an IT
surface area of 30% or 60%)o Special feature: data center incorporated into a seven-storey building with an
estimated surface area of 10,000 m
• Easynet in Nanterre,o Total surface area 1,300 m²o Data center /district heating distance: approximately 800 mo Estimated recoverable energy: between 1.25 and 2.5 GWh35°C annually (with
an IT surface area of 30% or 60%)o Special feature: data center incorporated into an office building with an
estimated surface area of 40,000 m²
In the three cases above, the principle adopted is to incorporate a high-temperature (HT) heat pump between the data center and the district heating system to raise the temperature of the energy recovered to match that of the ssytem, with a supply temperature of between 80 and 110°C (see § 4.1.4 High-temperature (HT) heat pump).
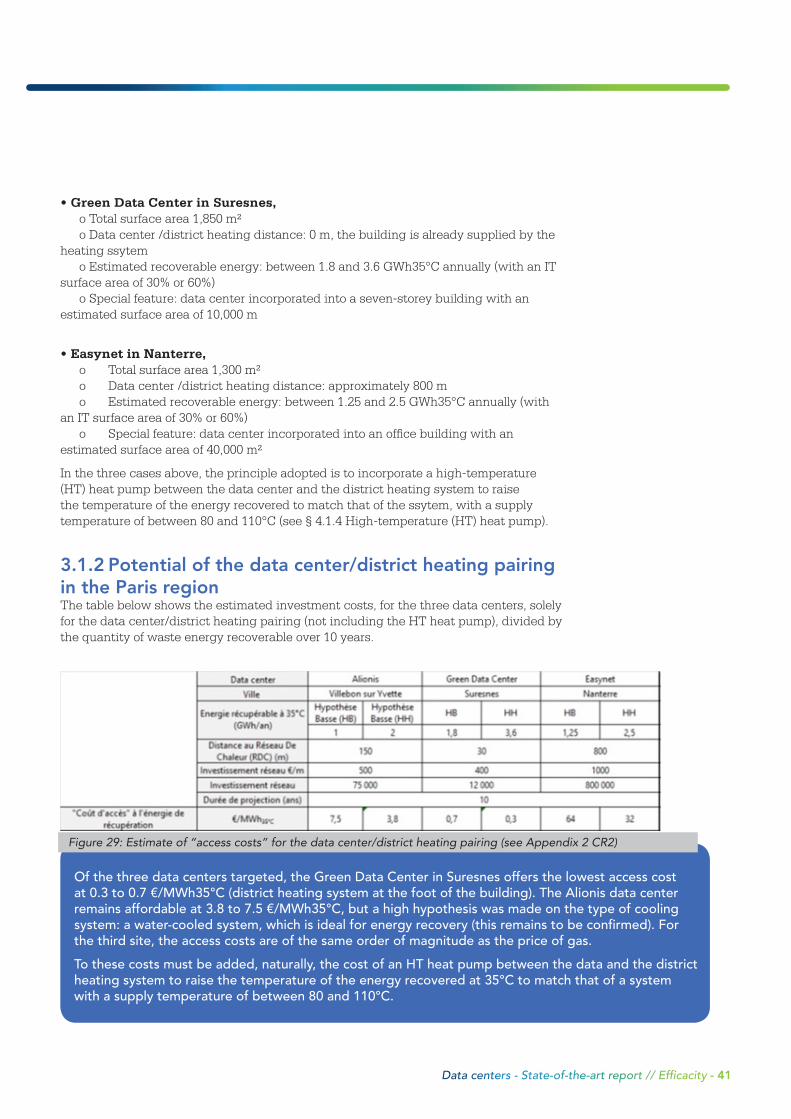
3.1.2 Potential of the data center/district heating pairing in the Paris regionThe table below shows the estimated investment costs, for the three data centers, solely for the data center/district heating pairing (not including the HT heat pump), divided by the quantity of waste energy recoverable over 10 years.
Figure 29: Estimate of “access costs” for the data center/district heating pairing (see Appendix 2 CR2)
Of the three data centers targeted, the Green Data Center in Suresnes offers the lowest access cost at 0.3 to 0.7 €/MWh35°C (district heating system at the foot of the building). The Alionis data center remains affordable at 3.8 to 7.5 €/MWh35°C, but a high hypothesis was made on the type of cooling system: a water-cooled system, which is ideal for energy recovery (this remains to be confirmed). For the third site, the access costs are of the same order of magnitude as the price of gas.
To these costs must be added, naturally, the cost of an HT heat pump between the data and the district heating system to raise the temperature of the energy recovered at 35°C to match that of a system with a supply temperature of between 80 and 110°C.
Data centers - State-of-the-art report // Efficacity - 41
Nota : The Suresnes and Nanterre data centers are incorporated into office buildings. For both sites, there is more to be gained by recovering the energy to heat the building itself rather than transferring it to district heating. These two case studies provide information on orders of magnitude: 1 m² of data center located in a building can heat approximately 8 m² of office space.All these results are dependent on the various hypotheses made, which have still to be confirmed.
3.1.3 GIS targeting of the data center/swimming pool pairing in FranceIn the case of the Bailly-Romainvilliers low-temperature network (See § 3.2), energy recovered from the data center is used to supply an aquatic complex with year-round energy demands, fluctuating in accordance with the seasons. The advantage in this case is that the aquatic complex is supplied directly via a heat exchanger without the need for a high-temperature heat pump. At sub-station level, gas is used to raise the temperature to provide domestic hot water. On the strength of this case, and again relying on the GIS skills of consultants Setec, the approach was followed as for the previous data center/district heating pairing. The following questions were addressed: What data center/swimming pool pairings exist at distances of less than 2 km? And then at distances of less than 500 m?
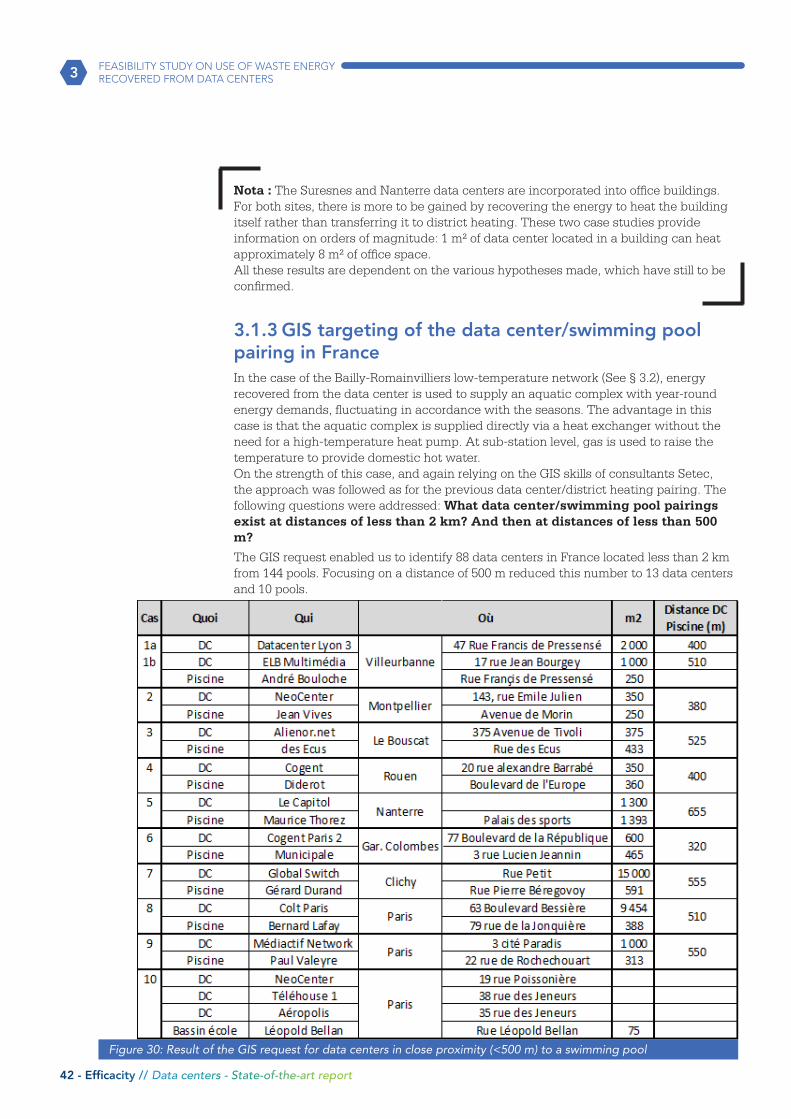
The GIS request enabled us to identify 88 data centers in France located less than 2 km from 144 pools. Focusing on a distance of 500 m reduced this number to 13 data centers and 10 pools.
3 FEASIBILITY STUDY ON USE OF WASTE ENERGY RECOVERED FROM DATA CENTERS
Figure 30: Result of the GIS request for data centers in close proximity (<500 m) to a swimming pool
42 - Efficacity // Data centers - State-of-the-art report
3.1.4 High-temperature (HT) heat pumpIn the previous paragraph, as soon as we addressed the data center/district heating pairing, we were faced with a difference in temperature levels: the data center with its recoverable energy at 36°C and district heating at temperatures of 80 to 110°C.
If the district heating vector is to be used to transport recoverable energy (in the context of existing ssytems), the temperature of that energy will need to be raised. One solution is to use high-temperature heat pumps.
A heat pump is a thermodynamic system that can be used to recover the energy contained in a low-temperature fluid and return it at a higher temperature (see § 3.1.1).
We saw in paragraph 3.1.5 Increasing the recoverable energy potential that it is possible to increase the condensation temperature of a cooling system, from a condensation temperature of 35°C to 50°C. At this level, this manipulation (altering the setpoint) results in a reduction in the system’s energy efficiency ratio (EER) (due to higher compressor consumption) and the increase in temperature is limited.
Manufacturers have developed high-temperature (HT) heat pumps designed to explore the calorific potential of the cold-side recovery source (at the evaporator) to heat buildings [31]. In general, recovery temperatures range from 13 to 20°C for wastewater, 30 to 35°C for energy evacuated from a data center by a cooling system, and can extend to much higher temperatures in industry.
So far, the HT heat pumps available have been available to deliver temperatures of the order of 65-70°C. To go beyond this would require installing a series of devices, with the resulting downgrading of facility performance (proliferation of auxiliaries).
Since the beginning of 2016, however, some manufacturers (including Carrier) have been offering HT heat pumps with water temperatures (condenser-side) of the order of 85°C.
3
Figure 30: Result of the GIS request for data centers in close proximity (<500 m) to a swimming pool
* In the table, the m² figures quoted for the swimming pools correspond to pool surface areas.
The table above lists the most favourable data center/pool pairings in terms of distance.
Of all these cases, only case n°5 presents an IRR > 15% and that only when based on very optimistic hypotheses. In addition, this case represents a data center incorporated into an office building, where recovery could take place within the building; this significantly restricts the initial potential.
Data centers - State-of-the-art report // Efficacity - 43
FEASIBILITY STUDY ON USE OF WASTE ENERGY RECOVERED FROM DATA CENTERS
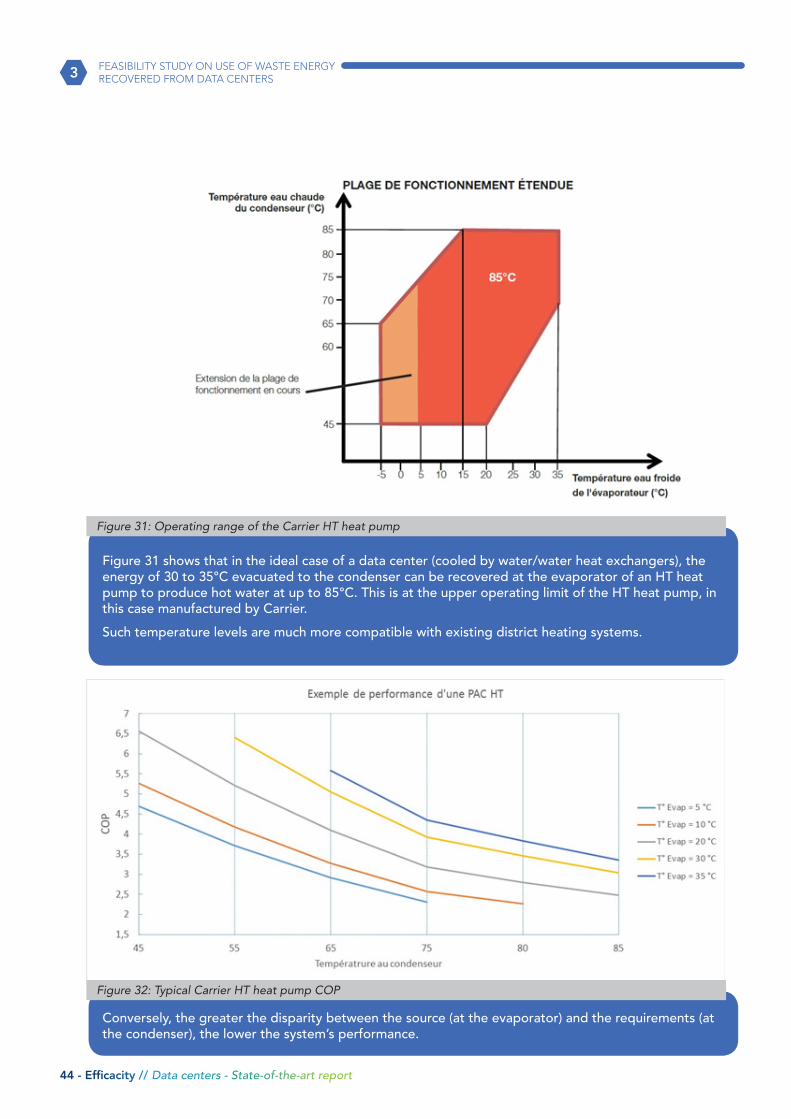
Figure 31: Operating range of the Carrier HT heat pump
Figure 31 shows that in the ideal case of a data center (cooled by water/water heat exchangers), the energy of 30 to 35°C evacuated to the condenser can be recovered at the evaporator of an HT heat pump to produce hot water at up to 85°C. This is at the upper operating limit of the HT heat pump, in this case manufactured by Carrier.
Such temperature levels are much more compatible with existing district heating systems.
Figure 32: Typical Carrier HT heat pump COP
Conversely, the greater the disparity between the source (at the evaporator) and the requirements (at the condenser), the lower the system’s performance.
44 - Efficacity // Data centers - State-of-the-art report
3 FEASIBILITY STUDY ON USE OF WASTE ENERGY RECOVERED FROM DATA CENTERS

Nota : At the beginning of 2016, Carrier brought this new type of HT heat pump into service in Switzerland, in a data center: on one side, the heat pump cools the data center and, on the other, hot water at 65°C is injected into district heating (for an industrial zone). An extension is scheduled for 2017 to provide heating for 3,000 homes [32].
A structure of this kind is well within Efficacity’s scope. One possibility would be to contact Carrier for further information on the actual performance of the machines, of the HT heat pump/data center pairing, and even of the system in place with end-users.
Data centers - State-of-the-art report // Efficacity - 45
3FEASIBILITY STUDY ON USE OF WASTE ENERGY RECOVERED FROM DATA CENTERS
Our visits to data centers and discussions with their managers gave us a more detailed view of what a digital building such as a data center consists of (how it operates, secu-rity, constraints, etc.). We made use of all the data we were able to obtain to devise an algorithm for determining the recovery energy potential of a data center. This quantity of energy is available at an average temperature of 35°C. The key figure to focus on in this estimation is 500 W/m²IT, a ratio representing the useful power of a server room, irrespective of size. This calculation of the potential recovery of waste energy remains only an estimate. The next step in the process is to ensure the feasibility of recovering this energy, which de-pends on the cooling technology used in the data center: the ideal case is a water-to-wa-ter system, the feasibility of other systems (water-to-air) being complex if not impossible (free cooling or other). When it comes to waste energy recovery, the key figures and data for a data center are:• Surface areas, distinguishing between total surface area and surface area given over to IT, • Electrical power required, IT power,• The cooling system and the feasibility of recovery.
The term data center covers two different categories of facility: a dedicated data center building, or an office building housing a data center. In the latter case, there is more to be gaine
d by recovering the energy to heat the actual building itself, rather than transferring it to district heating. A study of the two cases reveals an order of magnitude: 1 m² of data center located in a building can heat approximately 8 m² of office space.
In the case of dedicated data centers, many of the existing buildings are located in close proximity to power distribution and fibre networks, but very few are situated close to traditional district heating systems compatible with energy recovery: district heating operates at too high a temperature (> 80°C).
When installing a new data center, it is possible to create low-temperature district heating to make use of the waste energy potential, at recovery temperatures raised from 35°C to 50°C (by increasing the cooling system condensation temperature), but this requires synchronising the construction of the data center with the development of the area (users).
Many different approaches could exist on a one-off basis, with potential users of a heat supply – market gardeners, horticulturalists, etc. – making contact with the data center.
Since the beginning of 2016, some cooling system manufacturers (including Carrier) have been offering HT heat pumps with water temperatures (condenser-side) of the or-der of 85°C, offering a technical solution to raising the temperature of the waste energy (from 35°C to 85°C).
In conclusion, our view is that “traditional” energy recovery from data centers on an urban scale will concern only a handful of operations across the country, in highly spe-cific circumstances not necessarily reproducible on a generic basis, in the same way as projects for the recovery of energy from wastewater, for example.
Other models are now beginning to emerge, however, based on new ways of thinking. French startups are taking a disruptive approach to offer an innovative method of waste energy recovery: rather than have servers consuming energy in a data center (that will then require air conditioning), why not dissipate this energy directly within the buil-
Conclusion
46 - Efficacity // Data centers - State-of-the-art report
2

Data centers - State-of-the-art report // Efficacity - 47
The following note gives us a better understanding of data center design and a certain visibility over the different air conditioning technologies used, the feasibility of energy recovery and the estimation of waste energy.
Extending our knowledge of high-temperature heat pumps
One of the key factors in characterizing waste energy recovery is temperature: around 35°C on leaving the condenser. If low-temperature heat is to be incorporated into district heating, the temperature level of the recovered waste energy will need to be raised.
New HT heat pumps capable of delivering temperatures of the order of 85°C are appea-ring on the market.
The recent project in Switzerland illustrates the potential of these new devices: on one side, the heat pump cools the data center and, on the other, hot water at 65°C is injected into district heating (for an industrial zone). An extension is scheduled for 2017 to provi-de heating for 3,000 homes [32].
One initial prospect would to explore further and carry out additional work on HT heat pumps with the potential for such high temperatures (the same issue arises with energy recovery from wastewater).
On the basis of the Swedish project (see § 4.1.4), the next step would be to contact Car-rier for further information on the actual performance of their HT heat pump, of the HT heat pump/data center pairing, and even of the system in place with end-users.
Pursuing feedback from the field by means of agreements with key players
Continue background work on existing operations using waste energy recovery in dis-trict heating within the building: Dijon University and the Green Data Center [33], the future Titan data center in Mougins designed for recovery, etc.
Supplement feedback from the field on innovative approaches to waste energy recovery such as Quarnot Computing (300 Q.Rads installed in social housing in Paris [27]) and Sti-mergy (water heated by digital boilers at the Butte-aux-Cailles swimming pool in Paris).
Outlook
48 - Efficacity // Data centers - State-of-the-art report
2

Data centers - State-of-the-art report // Efficacity - 49
2List of figures
50 - Efficacity // Data centers - State-of-the-art report
Figure 1 : IP room size distribution IT (m²)Figure 2 : Tier level, source: CBRE [12] Figure 3 : Standard data center infrastructure PUE curve [13] Figure 4 : Schematic of a water-cooled chiller system Figure 5 : Schematic of an air-cooled chiller system Figure 6 : Schematic of a direct expansion cooling system Figure 7 : Photo of the data center under construction Figure 8 : Distribution of data center functionalities Figure 9 : View of a server room on Centralized Technical Management/Photo of a server rooomFigure 10 : Server room configurations Figure 11 : Schematic of IT room cooling [34] Figure 12 : Schematic of a data center cooling system Figure 13 : Corporate data center load curve – September 2014 to February 2016Figure 14 : Power consumption of a corporate data center for 2015Figure 15 : Annual consumption by usage Figure 16 : EER of the two water-cooled and air-cooled cooling systems Figure 17 : Impact of choice of system on PUE Figure 18 : Recoverable energy for 2015
Figure 19 : IT and cooling power demands of a data center with free coolingFigure 20 : Data center operating curve with and without free cooling Figure 21 : Schematic of a cooling system cooling circuitFigure 22 : Origin and characteristics of thermal discharges [16] Figure 23 : Algorithm for determining the recoverable energy potential of a data centerFigure 24 : Results for a cooling system with a condensation temperature of 35°C (left) and 50°C (right) Figure 25 : Aerial view of the ZAC du Prieuré business parkFigure 26 : Quantity of energy recovered from the data center (2013 and 2014) Figure 27 : The Q.Rad in situ and an exploded view of the radiatior Figure 28 : Stimergy digital boiler Figure 29 : Estimate of “access costs” for the data center/district heating pairing (see Appendix 2 CR2) Figure 30 : Resultat of the GIS request for data centers in close proximity (<500 m) to a swimming pool Figure 31 : Operating range of the Carrier HT heat pump Figure 32 : Typical Carrier heat pump COP
2References
52 - Efficacity // Data centers - State-of-the-art report
[1] Efficacity, http://www.efficacity.com/fr/.[2] Efficacity, Etat des lieux des ressources de chaleur fatale en milieu urbain, Juillet 2015.[3] Recov’Heat, http://tools.efficacity.com/recovheat-presentation-generale/.[4] Journal du net, Data center : la France, quatrième pays le mieux équipé au monde, http://www.journaldunet.com/solutions/cloud-computing/data-cen-ter-classement-des-pays-selon-xerfi.shtml.[5] Colocation Data Centers, http://www.datacentermap.com/datacenters.html.[6] Cartographie des Data Centers en France et au Luxembourg - édi-tion 2016, http://www.globalsecuritymag.fr/Cartographie-des-Data-Cen-ters-en,20160323,59739.html.[7] RTE, Bilan prévisionnel de l’équilibre offre-demande d’électricité en France - Edition 2015 (page 28), http://www.rte-france.com/sites/default/files/bp2015.pdf.[8] RTE, Dossier de presse « L’électricité en Ile-de-France » 8 avril 2016 (page 8), http://www.prefectures-regions.gouv.fr/ile-de-france/content/down-load/20777/143437/file/2016%20dossier%20presse%20electricite_08%2004%202016.pdf.[9] RenewIT Project, D7-1_Data Centres_Market Archetypes and cases studies, http://www.renewit-project.eu/d7-1-data-centres-market-archetypes-case-stu-dies/.[10] K. Miller, Analytics Gallery : 2010 Data Center Operational Trends Report, http://www.informationweek.com/analytics-gallery-2010-data-center-operatio-nal-trends-report/d/d-id/1090203?page_number=1.[11] Uptime Institute, https://uptimeinstitute.com/.[12] CBRE, Focus Data Centers, http://www.cbre.fr/fr_fr/etudes/focus/focus_content/focus_left/focus_datacenters.pdf, Juin 2010.[13] Schneider Electric, Livre Blanc 18 Revision 4 «Virtualisation et cloud Com-puting : optimisation de l’alimentation, du refroidissement et de la gestion pour une rentabilité maximale.[14] Schneider Electrique, Livre Blanc 132 Révision 0 «Modes économiseurs des systèmes de refroidissement des DataCenters».[15] SIGMA, https://www.sigma.fr/avis-experts/free-cooling-datacenter-green.[16] ADEME, Origine et caractérisation des rejets thermiques, http://www.ademe.fr/entreprises-monde-agricole/reduire-impacts/maitriser-lenergie-ate-lier-production/procedes/dossier/recuperation-valorisation-chaleur/conseils-agir.[17] SNCU, Enquête annuelle sur les réseaux de chaleur et de froid - Rapport 2014, http://www.sncu.fr/Espace-documentaire/Statistiques/Chiffres-cles-EAB.[18] GROUPE BPCE, Les temps fort de l’année 2011 (page32), www.groupe-bpce.fr/content/download/2848/49840/version/10/file/RA_2011.pdf.
[19] NATIXIS, Document de référence 2009 (pages 83 et 108), https://www.natixis.com/natixis/jcms/lpaz5_12214/fr/document-de-reference-2009.[20] enia architectes, Fiche technique Data Center, http://www.enia.fr/fr/projet/data-center-banque-de-france.[21] Natixis, Document de référence et rapport financier annuel 2013 (pages 44 et 60), https://www.natixis.com/natixis/upload/docs/application/pdf/2014-03/natixis_-_document_de_reference_2013_-_14_03_2014.pdf.[22] Inauguration du centre aquatique du Val d’Europe, http://www.epa-mar-nelavallee.fr/Actualites/Actualites-archivees/Inauguration-du-centre-aquatique-du-Val-d-Europe-le-1er-septembre.[23] Le complexe Aquatique Val d’Europe, http://www.ca-valdeurope.fr/fr/le-complexe.[24] Alliancy le mag, http://www.alliancy.fr/article/no-theme/2013/09/20/ag-glomeration-le-val-deurope-se-chauffe-au-datacenter.[25] La Forge 3.0, http://laforge3-0.eu/wp-content/uploads/2014/06/PLA-QUETTE-La-Forge-Hte-def.pdf.[26] Carnot Computing, http://www.qarnot-computing.com/fr/.[27] National Géographic, http://www.nationalgeographic.fr/19029-innover-pour-changer-le-monde-et-si-lon-se-chauffait-grace-aux-ordinateurs/.[28] Le Huffington Post, http://www.huffingtonpost.fr/2015/12/05/ob-jet-connecte-radiateur-calculateur_n_8719318.html.[29] BNP, QARNOT Computing, http://us9.campaign-archive1.com/?u=f2402decdaacf0bd2f863bde6&id=a31cf0d59c&e=dd725b2056#awe-someshare.[30] Greenit, Stimergy, https://www.greenit.fr/2014/03/14/stimergy-chauffe-l-eau-des-immeubles-avec-ses-chaudieres-numeriques/.[31] F. DE CARLAN (EDF), Pompes à chaleur industrielles, Etat de l’art, Offre et Sélection pour Récupération d’énergie fatale en milieu urbain, 2016.[32] Quand la climatisation redistribue la chaleur récupérée, http://lebatiment-performant.fr/actualites/quand-la-climatisation-redistribue-la-chaleur-recupe-ree/9/818.[33] Ça chauffe sur le campus !, http://www.bienpublic.com/edition-di-jon-ville/2015/02/12/ca-chauffe-sur-le-campus.[34] Top 12 Ways to Decrease the Energy Consumption of Your Data Center, https://www.energystar.gov/buildings/tools-and-resources/top-12-ways-de-crease-energy-consumption-your-data-center.
Efficacity is an R&D institute dedicated to energy tran-sition in urban territories. Since its launching in 2014, it brings together the skills of over 100 reseachers from industry and public research on a single site, to foster close collaboration between all the stakeholders. Effica-city develops innovative and scientifically robust solu-tions allowing urban actors to be more efficient at every stage of a sustainable urban development project.efficacity.com
BATIMENT BIENVENÜE14, BD ISAAC NEWTON77420 [email protected] : +33 (0)1 61 44 13 31www.efficacity.com


