Embed Size (px)
Citation preview

Data Mining For Dance Hit Prediction
Dorien Herremans, PhDhttp://antor.uantwerpen.be/dorienherremans
Data Mining course, Master in Computer ScienceUniversity of Antwerp21.04.2015
University of Antwerp
Operations Research Group
ANT/OR
Outline
Music Information Retrieval
Hit Prediction
Dance Hit PredictionDatasetModelsResults
Conclusion
Music Information Retrieval (MIR)
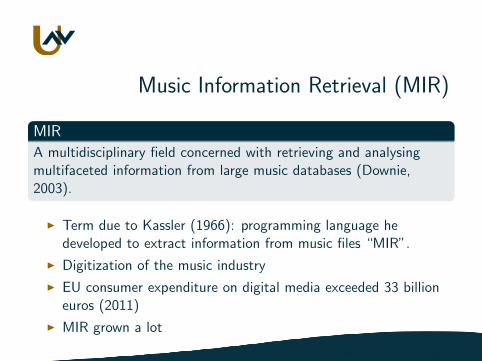
MIR
A multidisciplinary field concerned with retrieving and analysingmultifaceted information from large music databases (Downie,2003).
I Term due to Kassler (1966): programming language hedeveloped to extract information from music files “MIR”.
I Digitization of the music industry
I EU consumer expenditure on digital media exceeded 33 billioneuros (2011)
I MIR grown a lot
MIR applications
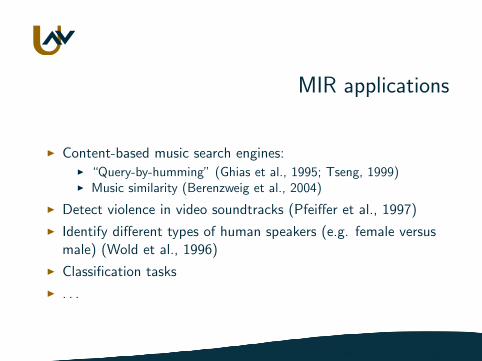
I Content-based music search engines:I “Query-by-humming” (Ghias et al., 1995; Tseng, 1999)I Music similarity (Berenzweig et al., 2004)
I Detect violence in video soundtracks (Pfeiffer et al., 1997)
I Identify different types of human speakers (e.g. female versusmale) (Wold et al., 1996)
I Classification tasks
I . . .
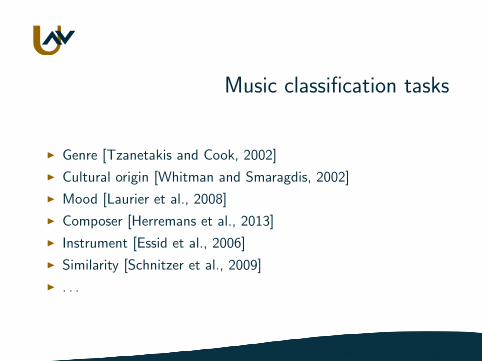
Music classification tasks
I Genre [Tzanetakis and Cook, 2002]
I Cultural origin [Whitman and Smaragdis, 2002]
I Mood [Laurier et al., 2008]
I Composer [Herremans et al., 2013]
I Instrument [Essid et al., 2006]
I Similarity [Schnitzer et al., 2009]
I . . .
Outline
Music Information Retrieval
Hit Prediction
Dance Hit PredictionDatasetModelsResults
Conclusion
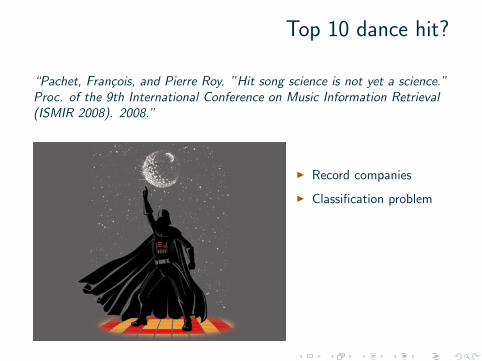
Top 10 dance hit?
“Pachet, Francois, and Pierre Roy. ”Hit song science is not yet a science.”Proc. of the 9th International Conference on Music Information Retrieval(ISMIR 2008). 2008.”
I Record companies
I Classification problem
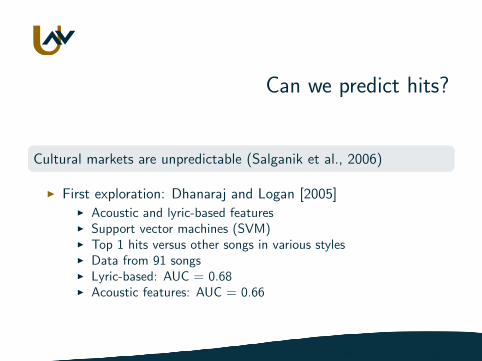
Can we predict hits?
Cultural markets are unpredictable (Salganik et al., 2006)
I First exploration: Dhanaraj and Logan [2005]I Acoustic and lyric-based featuresI Support vector machines (SVM)I Top 1 hits versus other songs in various stylesI Data from 91 songsI Lyric-based: AUC = 0.68I Acoustic features: AUC = 0.66
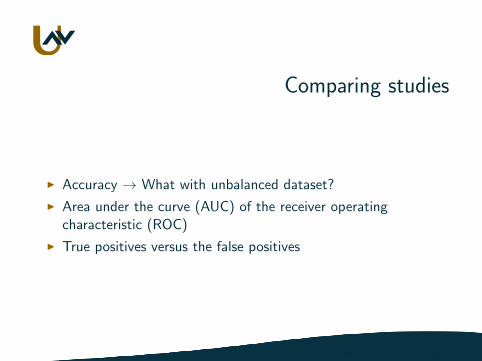
Comparing studies
I Accuracy → What with unbalanced dataset?
I Area under the curve (AUC) of the receiver operatingcharacteristic (ROC)
I True positives versus the false positives
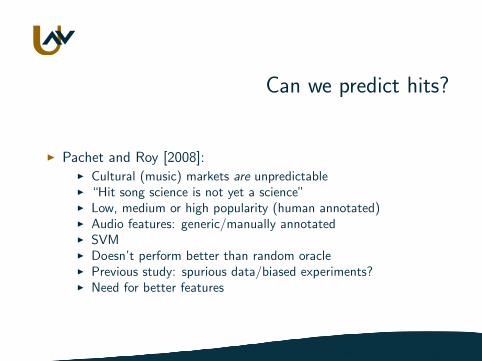
Can we predict hits?
I Pachet and Roy [2008]:I Cultural (music) markets are unpredictableI “Hit song science is not yet a science”I Low, medium or high popularity (human annotated)I Audio features: generic/manually annotatedI SVMI Doesn’t perform better than random oracleI Previous study: spurious data/biased experiments?I Need for better features
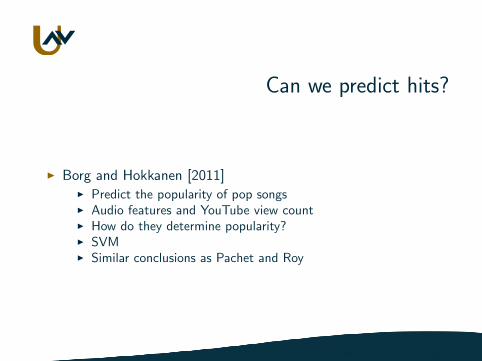
Can we predict hits?
I Borg and Hokkanen [2011]I Predict the popularity of pop songsI Audio features and YouTube view countI How do they determine popularity?I SVMI Similar conclusions as Pachet and Roy
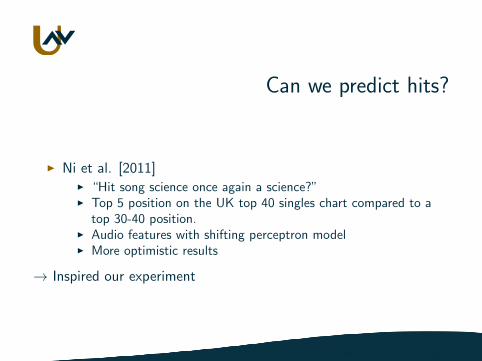
Can we predict hits?
I Ni et al. [2011]I “Hit song science once again a science?”I Top 5 position on the UK top 40 singles chart compared to a
top 30-40 position.I Audio features with shifting perceptron modelI More optimistic results
→ Inspired our experiment
Outline
Music Information Retrieval
Hit Prediction
Dance Hit PredictionDatasetModelsResults
Conclusion
Outline
Music Information Retrieval
Hit Prediction
Dance Hit PredictionDatasetModelsResults
Conclusion
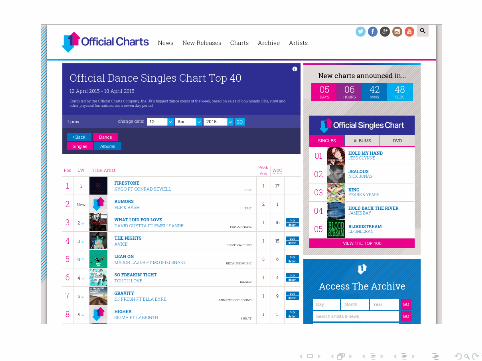
Data Sources
I Official Charts company (OCC) - officialcharts.com
I Weekly top 40 dance hitsI 10/2009 until 3/2013I 7159 hits (759 unique songs)I 7090 with data (697 unique songs)

Data Sources
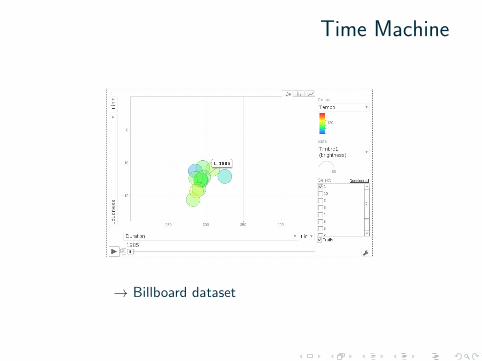
I Billboard (BB) - billboard.com
I Weekly top 10 dance hitsI 1/1985 until 3/2013I 14533 hits (3361 unique songs)I 12711 with data (2755 unique songs)
Extracting Hit Data
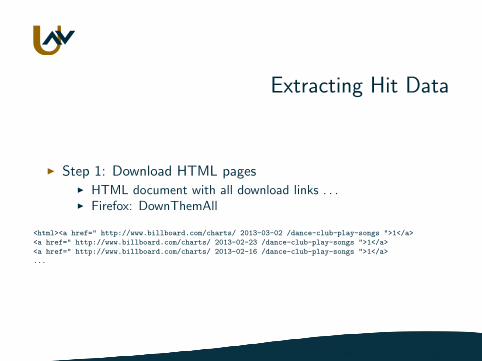
I Step 1: Download HTML pagesI HTML document with all download links . . .I Firefox: DownThemAll
<html><a href=" http://www.billboard.com/charts/ 2013-03-02 /dance-club-play-songs ">1</a>
<a href=" http://www.billboard.com/charts/ 2013-02-23 /dance-club-play-songs ">1</a>
<a href=" http://www.billboard.com/charts/ 2013-02-16 /dance-club-play-songs ">1</a>
...
Extracting Hit Data
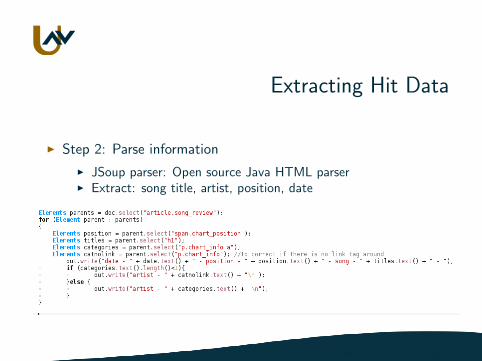
I Step 2: Parse information
I JSoup parser: Open source Java HTML parserI Extract: song title, artist, position, date
Getting Music Information
I The Echo Nest:
I World’s leading music intelligence companyI Largest repository of dynamic music data in the worldI Over a trillion data points on over 30 million songsI Clear Channel, EMI, eMusic, MOG, MTV, Nokia, Rdio, Spotify,
Twitter, . . .
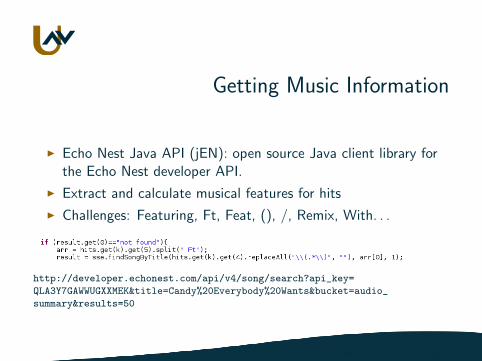
Getting Music Information
I Echo Nest Java API (jEN): open source Java client library forthe Echo Nest developer API.
I Extract and calculate musical features for hits
I Challenges: Featuring, Ft, Feat, (), /, Remix, With. . .
http://developer.echonest.com/api/v4/song/search?api_key=
QLA3Y7GAWWUGXXMEK&title=Candy%20Everybody%20Wants&bucket=audio_
summary&results=50
Extracted Features
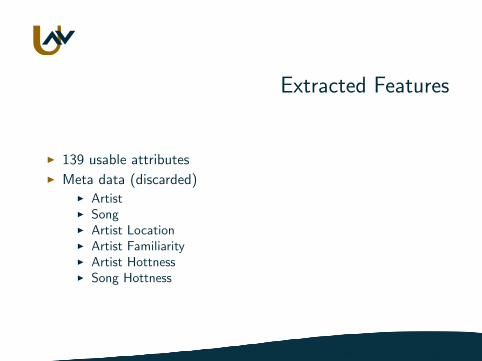
I 139 usable attributesI Meta data (discarded)
I ArtistI SongI Artist LocationI Artist FamiliarityI Artist HottnessI Song Hottness
Extracted Features
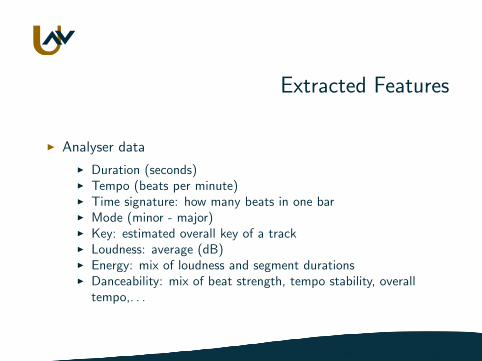
I Analyser data
I Duration (seconds)I Tempo (beats per minute)I Time signature: how many beats in one barI Mode (minor - major)I Key: estimated overall key of a trackI Loudness: average (dB)I Energy: mix of loudness and segment durationsI Danceability: mix of beat strength, tempo stability, overall
tempo,. . .
Extracted Features
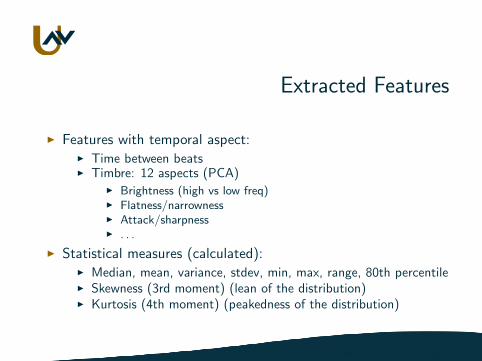
I Features with temporal aspect:I Time between beatsI Timbre: 12 aspects (PCA)
I Brightness (high vs low freq)I Flatness/narrownessI Attack/sharpnessI . . .
I Statistical measures (calculated):I Median, mean, variance, stdev, min, max, range, 80th percentileI Skewness (3rd moment) (lean of the distribution)I Kurtosis (4th moment) (peakedness of the distribution)
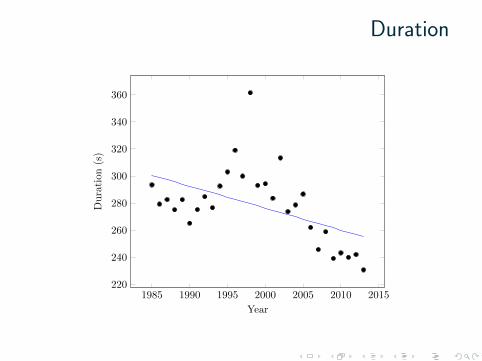
Duration
1985 1990 1995 2000 2005 2010 2015220
240
260
280
300
320
340
360
Year
Duration
(s)
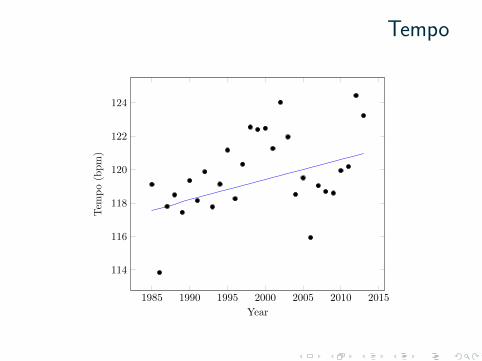
Tempo
1985 1990 1995 2000 2005 2010 2015
114
116
118
120
122
124
Year
Tem
po(bpm)
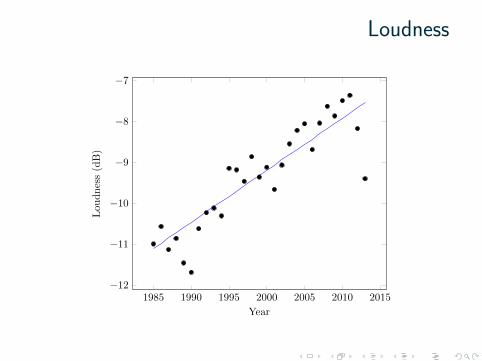
Loudness
1985 1990 1995 2000 2005 2010 2015−12
−11
−10
−9
−8
−7
Year
Lou
dness(dB)
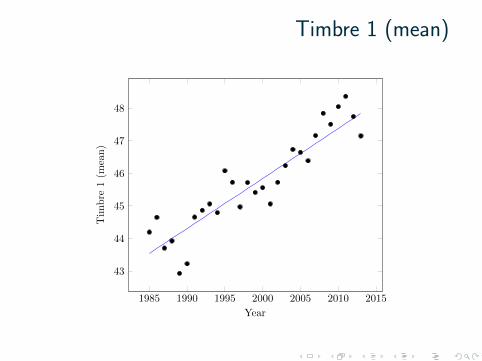
Timbre 1 (mean)
1985 1990 1995 2000 2005 2010 2015
43
44
45
46
47
48
Year
Tim
bre
1(m
ean)
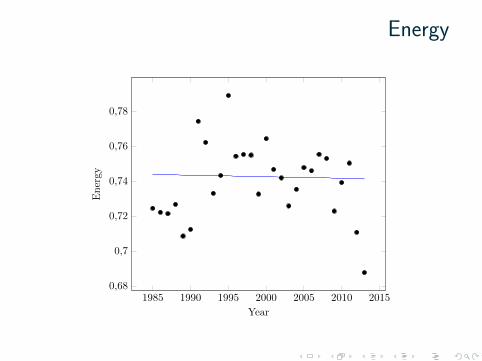
Energy
1985 1990 1995 2000 2005 2010 20150,68
0,7
0,72
0,74
0,76
0,78
Year
Energy
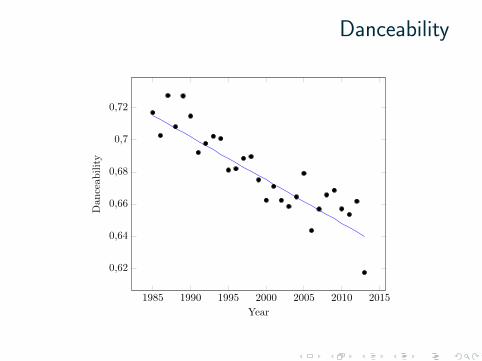
Danceability
1985 1990 1995 2000 2005 2010 2015
0,62
0,64
0,66
0,68
0,7
0,72
Year
Dan
ceab
ility
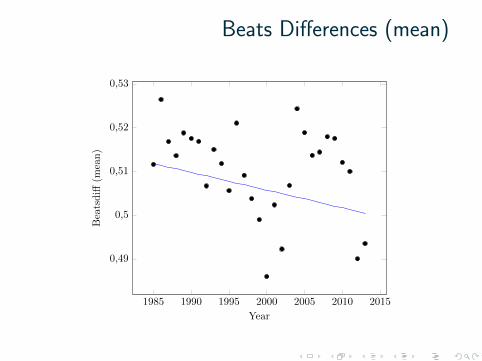
Beats Differences (mean)
1985 1990 1995 2000 2005 2010 2015
0,49
0,5
0,51
0,52
0,53
Year
Bea
tsd
iff(m
ean
)
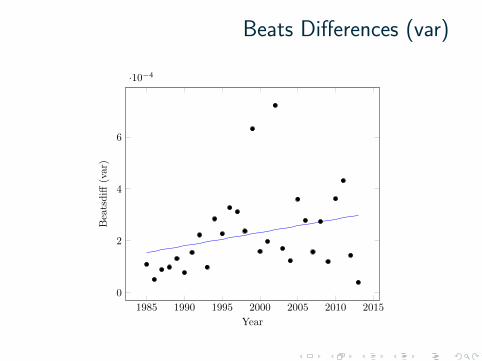
Beats Differences (var)
1985 1990 1995 2000 2005 2010 2015
0
2
4
6
·10−4
Year
Bea
tsd
iff(v
ar)
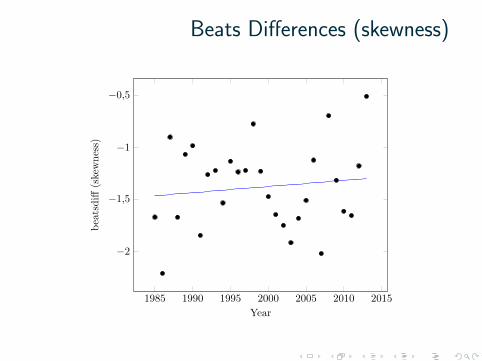
Beats Differences (skewness)
1985 1990 1995 2000 2005 2010 2015
−2
−1,5
−1
−0,5
Year
bea
tsd
iff(s
kew
nes
s)
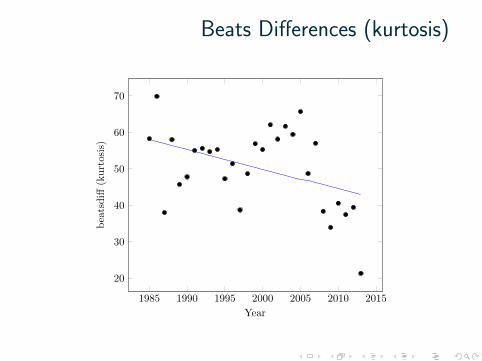
Beats Differences (kurtosis)
1985 1990 1995 2000 2005 2010 2015
20
30
40
50
60
70
Year
bea
tsd
iff(k
urt
osis
)
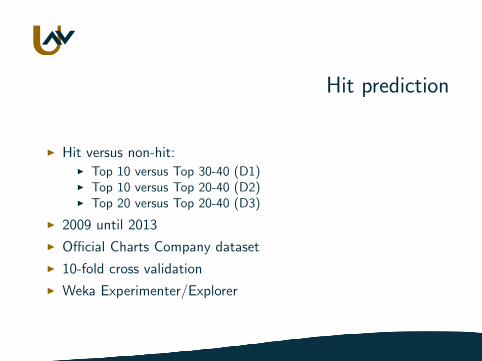
Hit prediction
I Hit versus non-hit:I Top 10 versus Top 30-40 (D1)I Top 10 versus Top 20-40 (D2)I Top 20 versus Top 20-40 (D3)
I 2009 until 2013
I Official Charts Company dataset
I 10-fold cross validation
I Weka Experimenter/Explorer
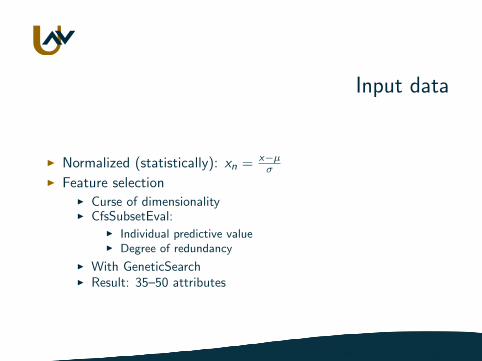
Input data
I Normalized (statistically): xn = x−µσ
I Feature selectionI Curse of dimensionalityI CfsSubsetEval:
I Individual predictive valueI Degree of redundancy
I With GeneticSearchI Result: 35–50 attributes
Outline
Music Information Retrieval
Hit Prediction
Dance Hit PredictionDatasetModelsResults
Conclusion
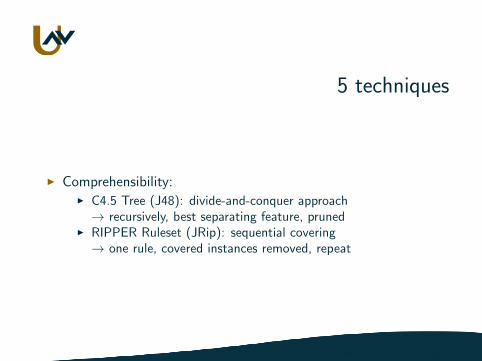
5 techniques
I Comprehensibility:I C4.5 Tree (J48): divide-and-conquer approach→ recursively, best separating feature, pruned
I RIPPER Ruleset (JRip): sequential covering→ one rule, covered instances removed, repeat
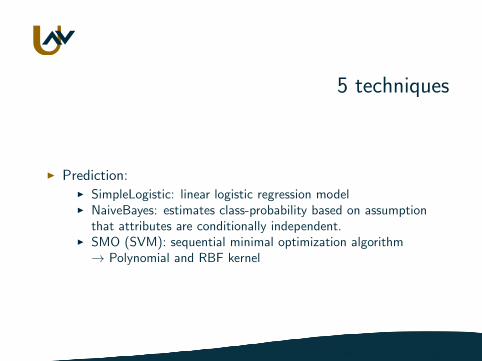
5 techniques
I Prediction:I SimpleLogistic: linear logistic regression modelI NaiveBayes: estimates class-probability based on assumption
that attributes are conditionally independent.I SMO (SVM): sequential minimal optimization algorithm→ Polynomial and RBF kernel
Outline
Music Information Retrieval
Hit Prediction
Dance Hit PredictionDatasetModelsResults
Conclusion
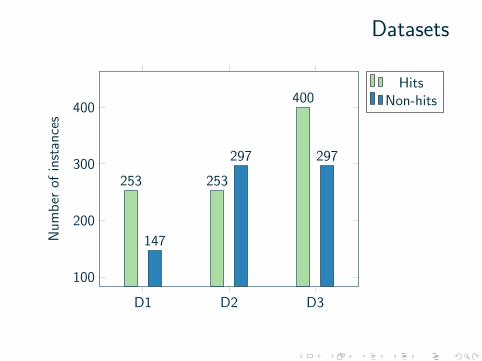
Datasets
D2D1 D3
100
200
300
400
253253
400
297
147
297
Nu
mb
erof
inst
ance
s
HitsNon-hits
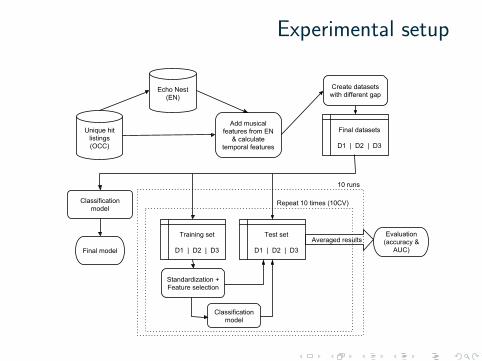
Experimental setup
Unique hit listings (OCC)
Echo Nest(EN)
Add musical features from EN
& calculate temporal features
Create datasets with different gap
Standardization + Feature selection
Final datasets
D1 | D2 | D3
Training set
D1 | D2 | D3
Test set
D1 | D2 | D3
Classification model
Averaged resultsEvaluation
(accuracy & AUC)
Classification model
Final model
Repeat 10 times (10CV)
10 runs
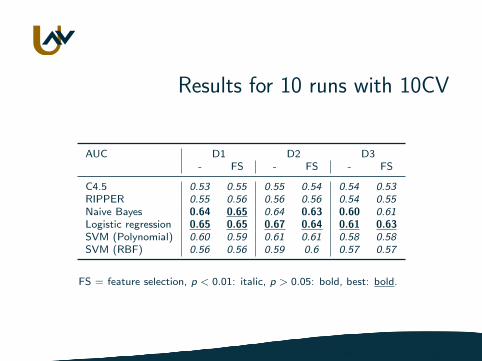
Results for 10 runs with 10CV
AUC D1 D2 D3- FS - FS - FS
C4.5 0.53 0.55 0.55 0.54 0.54 0.53RIPPER 0.55 0.56 0.56 0.56 0.54 0.55Naive Bayes 0.64 0.65 0.64 0.63 0.60 0.61Logistic regression 0.65 0.65 0.67 0.64 0.61 0.63SVM (Polynomial) 0.60 0.59 0.61 0.61 0.58 0.58SVM (RBF) 0.56 0.56 0.59 0.6 0.57 0.57
FS = feature selection, p < 0.01: italic, p > 0.05: bold, best: bold.
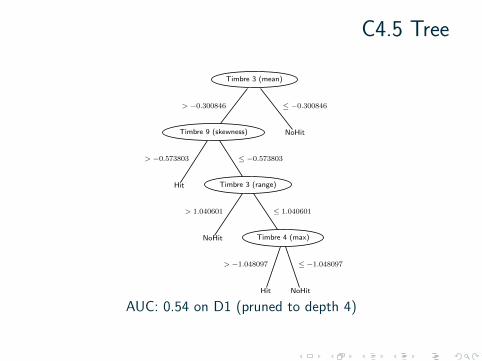
C4.5 Tree
Timbre 3 (mean)
Timbre 9 (skewness)
> −0.300846
Hit
> −0.573803
Timbre 3 (range)
≤ −0.573803
NoHit
> 1.040601
Timbre 4 (max)
≤ 1.040601
Hit
> −1.048097
NoHit
≤ −1.048097
NoHit
≤ −0.300846
AUC: 0.54 on D1 (pruned to depth 4)
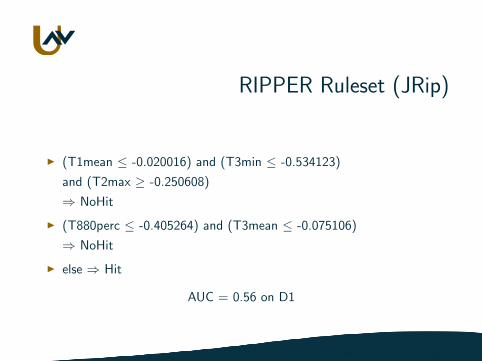
RIPPER Ruleset (JRip)
I (T1mean ≤ -0.020016) and (T3min ≤ -0.534123)
and (T2max ≥ -0.250608)
⇒ NoHit
I (T880perc ≤ -0.405264) and (T3mean ≤ -0.075106)
⇒ NoHit
I else ⇒ Hit
AUC = 0.56 on D1
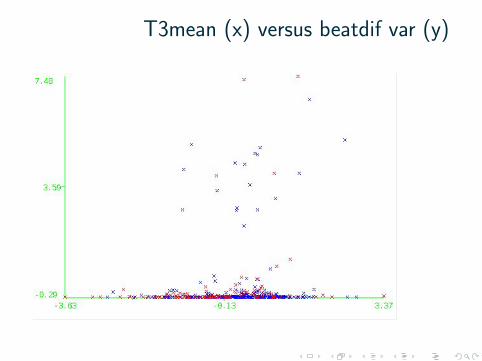
T3mean (x) versus beatdif var (y)
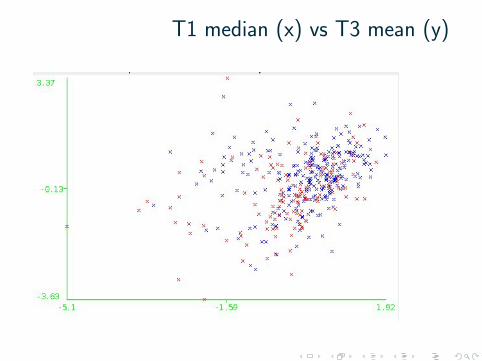
T1 median (x) vs T3 mean (y)
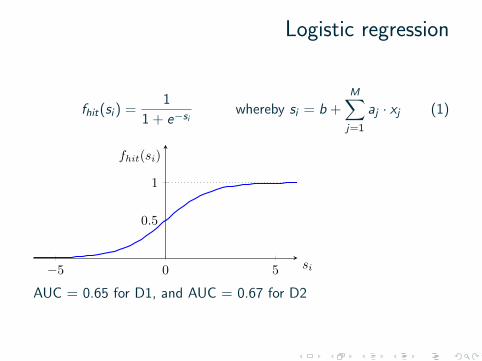
Logistic regression
fhit(si ) =1
1 + e−siwhereby si = b +
M∑j=1
aj · xj (1)
−5 0 5
0.5
1
si
fhit(si)
AUC = 0.65 for D1, and AUC = 0.67 for D2
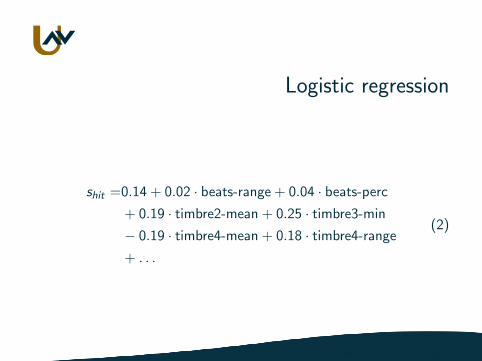
Logistic regression
shit =0.14 + 0.02 · beats-range + 0.04 · beats-perc
+ 0.19 · timbre2-mean + 0.25 · timbre3-min
− 0.19 · timbre4-mean + 0.18 · timbre4-range
+ . . .
(2)
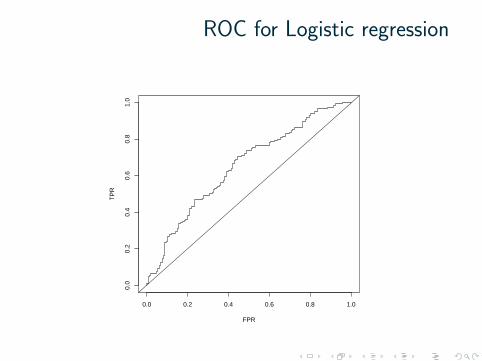
ROC for Logistic regression
0.0 0.2 0.4 0.6 0.8 1.0
0.0
0.2
0.4
0.6
0.8
1.0
FPR
TP
R
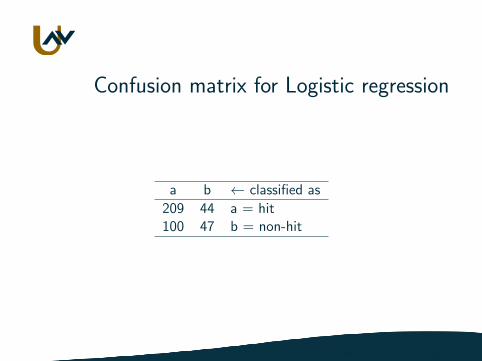
Confusion matrix for Logistic regression
a b ← classified as
209 44 a = hit100 47 b = non-hit
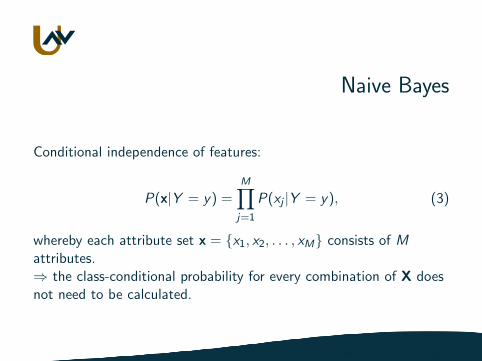
Naive Bayes
Conditional independence of features:
P(x|Y = y) =M∏j=1
P(xj |Y = y), (3)
whereby each attribute set x = {x1, x2, . . . , xM} consists of Mattributes.⇒ the class-conditional probability for every combination of X doesnot need to be calculated.
Naive Bayes
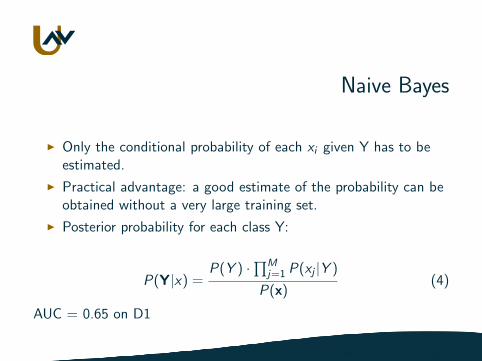
I Only the conditional probability of each xi given Y has to beestimated.
I Practical advantage: a good estimate of the probability can beobtained without a very large training set.
I Posterior probability for each class Y:
P(Y|x) =P(Y ) ·∏M
j=1 P(xj |Y )
P(x)(4)
AUC = 0.65 on D1
Support vector machines (SVM)
I A classifier derived from statistical learning theory by Vapnik, etal. in 1992
I Became famous when it performed as well as neural networkson the handwriting recognition task
I Widely used in:I Object detection & recognitionI Content-based image retrievalI Text recognitionI BiometricsI Speech recognitionI . . .
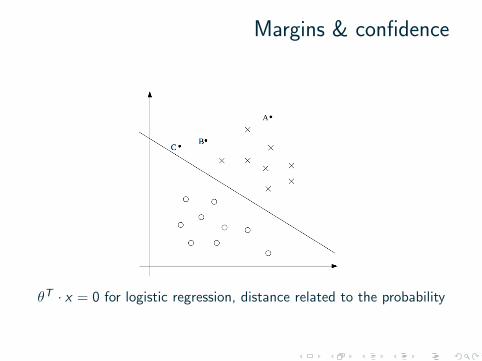
Margins & confidence
θT · x = 0 for logistic regression, distance related to the probability
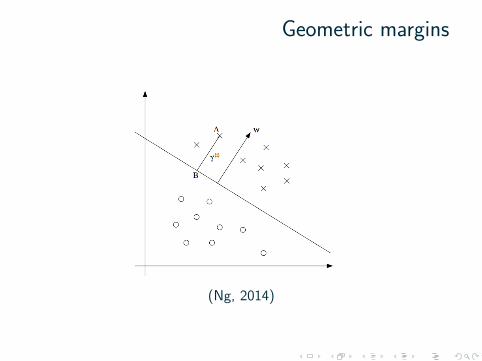
Geometric margins
(Ng, 2014)
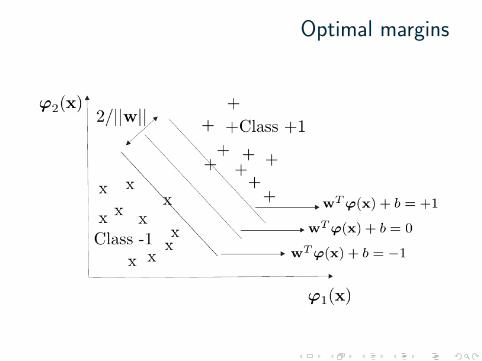
Optimal margins
SVM
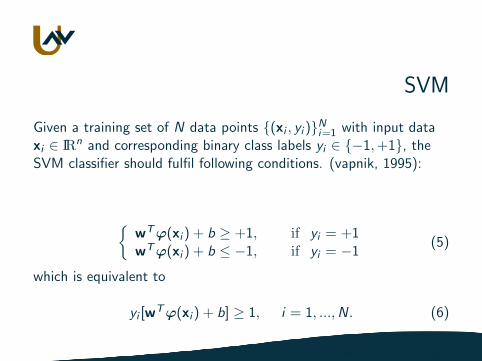
Given a training set of N data points {(xi , yi )}Ni=1 with input dataxi ∈ IRn and corresponding binary class labels yi ∈ {−1,+1}, theSVM classifier should fulfil following conditions. (vapnik, 1995):
{wTϕ(xi ) + b ≥ +1, if yi = +1wTϕ(xi ) + b ≤ −1, if yi = −1
(5)
which is equivalent to
yi [wTϕ(xi ) + b] ≥ 1, i = 1, ...,N. (6)
SVM
I What’s the ϕ(·)?
I What if data is non-linearly separable?
SVM
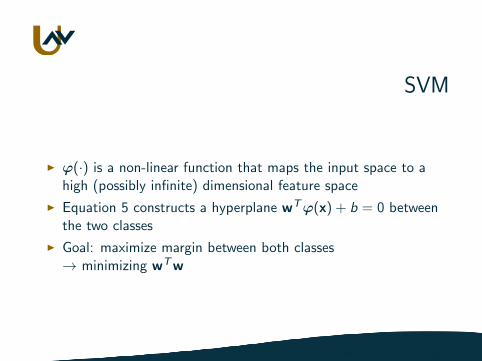
I ϕ(·) is a non-linear function that maps the input space to ahigh (possibly infinite) dimensional feature space
I Equation 5 constructs a hyperplane wTϕ(x) + b = 0 betweenthe two classes
I Goal: maximize margin between both classes→ minimizing wTw
SVM
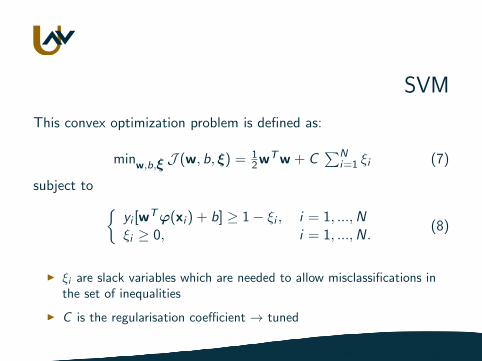
This convex optimization problem is defined as:
minw,b,ξ J (w, b, ξ) = 12w
Tw + C∑N
i=1 ξi (7)
subject to {yi [w
Tϕ(xi ) + b] ≥ 1− ξi , i = 1, ...,Nξi ≥ 0, i = 1, ...,N.
(8)
I ξi are slack variables which are needed to allow misclassifications inthe set of inequalities
I C is the regularisation coefficient → tuned
SVM
The objective function (Eq. 7):I First part:
I max. margin between both classes in the feature spaceI regularisation mechanism that penalizes large weights
I Second part:I min. the misclassification error
SVM
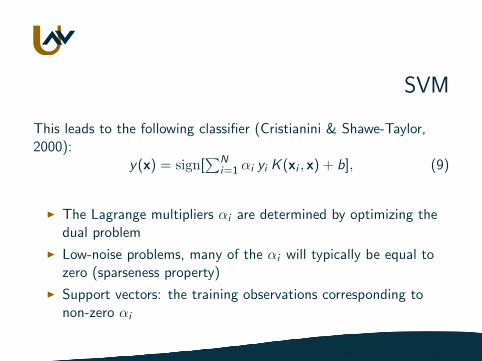
This leads to the following classifier (Cristianini & Shawe-Taylor,2000):
y(x) = sign[∑N
i=1 αi yi K (xi , x) + b], (9)
I The Lagrange multipliers αi are determined by optimizing thedual problem
I Low-noise problems, many of the αi will typically be equal tozero (sparseness property)
I Support vectors: the training observations corresponding tonon-zero αi
SVM
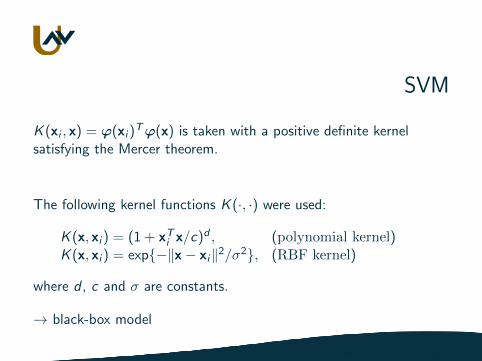
K (xi , x) = ϕ(xi )Tϕ(x) is taken with a positive definite kernel
satisfying the Mercer theorem.
The following kernel functions K (·, ·) were used:
K (x, xi ) = (1 + xTi x/c)d , (polynomial kernel)K (x, xi ) = exp{−‖x− xi‖2/σ2}, (RBF kernel)
where d , c and σ are constants.
→ black-box model
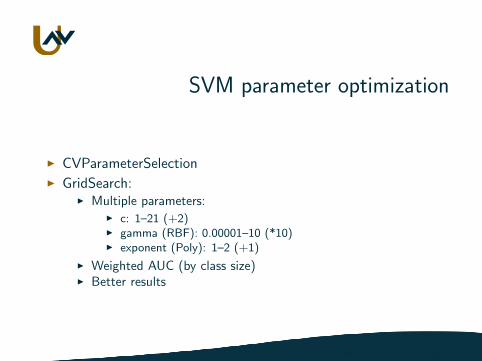
SVM parameter optimization
I CVParameterSelectionI GridSearch:
I Multiple parameters:I c: 1–21 (+2)I gamma (RBF): 0.00001–10 (*10)I exponent (Poly): 1–2 (+1)
I Weighted AUC (by class size)I Better results
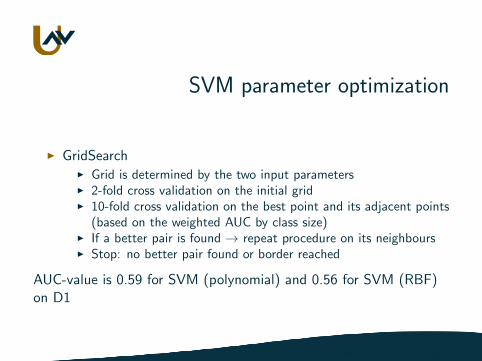
SVM parameter optimization
I GridSearchI Grid is determined by the two input parametersI 2-fold cross validation on the initial gridI 10-fold cross validation on the best point and its adjacent points
(based on the weighted AUC by class size)I If a better pair is found → repeat procedure on its neighboursI Stop: no better pair found or border reached
AUC-value is 0.59 for SVM (polynomial) and 0.56 for SVM (RBF)on D1
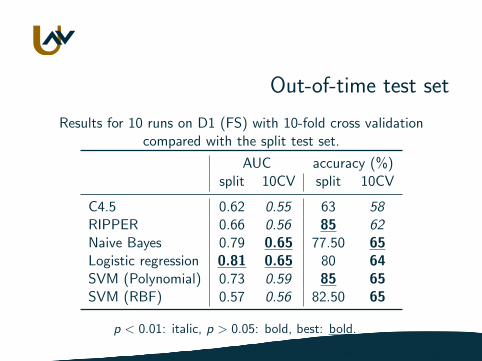
Out-of-time test set
Results for 10 runs on D1 (FS) with 10-fold cross validationcompared with the split test set.
AUC accuracy (%)split 10CV split 10CV
C4.5 0.62 0.55 63 58RIPPER 0.66 0.56 85 62Naive Bayes 0.79 0.65 77.50 65Logistic regression 0.81 0.65 80 64SVM (Polynomial) 0.73 0.59 85 65SVM (RBF) 0.57 0.56 82.50 65
p < 0.01: italic, p > 0.05: bold, best: bold.
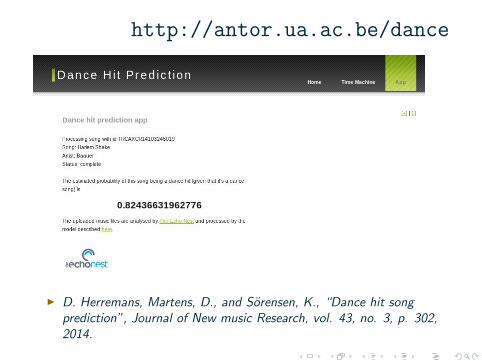
http://antor.ua.ac.be/dance
I D. Herremans, Martens, D., and Sorensen, K., “Dance hit songprediction”, Journal of New music Research, vol. 43, no. 3, p. 302,2014.
Outline
Music Information Retrieval
Hit Prediction
Dance Hit PredictionDatasetModelsResults
Conclusion
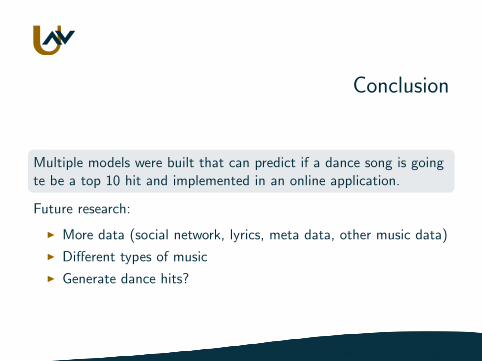
Conclusion
Multiple models were built that can predict if a dance song is goingte be a top 10 hit and implemented in an online application.
Future research:
I More data (social network, lyrics, meta data, other music data)
I Different types of music
I Generate dance hits?
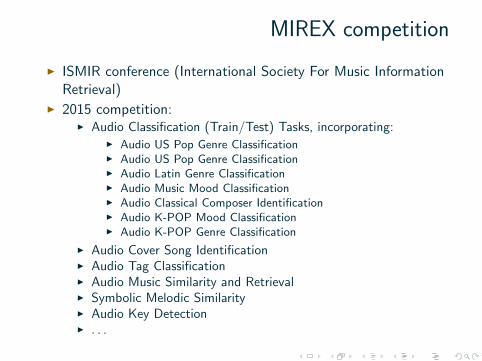
MIREX competition
I ISMIR conference (International Society For Music InformationRetrieval)
I 2015 competition:I Audio Classification (Train/Test) Tasks, incorporating:
I Audio US Pop Genre ClassificationI Audio US Pop Genre ClassificationI Audio Latin Genre ClassificationI Audio Music Mood ClassificationI Audio Classical Composer IdentificationI Audio K-POP Mood ClassificationI Audio K-POP Genre Classification
I Audio Cover Song IdentificationI Audio Tag ClassificationI Audio Music Similarity and RetrievalI Symbolic Melodic SimilarityI Audio Key DetectionI . . .

Data Mining For Dance Hit Prediction
Dorien Herremans, PhDhttp://antor.uantwerpen.be/dorienherremans
University of Antwerp21.04.2015
University of Antwerp
Operations Research Group
ANT/OR