Embed Size (px)
Citation preview

Teck Coal Environmental Office Bag Service 2000, 421 Pine Avenue Sparwood, B.C. Canada V0B 2G0
+1 250 425 3331 Tel www.teck.com
Technical Report Overview
Report: Data Report for the Tributary Evaluation Program
Overview: This report provides an inventory of all tributaries to the Elk and Fording Rivers that are
located within management units (MUs) 1, 2, 3, and 4 (as defined by the Elk Valley Water Quality Plan.
This report evaluates the ecological value of these tributaries to the Elk and Fording Rivers and helps to
identify tributaries that play a significant role in supporting the health of the ecosystem as a whole.
This report was prepared for Teck by Minnow Environmental Inc.
For More Information
If you have questions regarding this report, please:
• Phone toll-free to 1.855.806.6854
• Email [email protected]
Future studies will be made available at teck.com/elkvalley
Data Report for the Tributary Evaluation Program
Prepared For: Teck Coal Limited Sparwood, British Columbia Prepared By: Minnow Environmental Inc. Georgetown, Ontario June 2016
Teck Tributary Evaluation Program Data Report
Minnow Environmental Inc. i June 2016 Project 2563
TABLE OF CONTENTS
1 .0 INTRODUCTION ...................................................................................................... 1 1.1 Background ......................................................................................................... 1 1.2 Tributary Evaluation Program Requirements ...................................................... 1 1.3 Tributary Management Plan Requirements ......................................................... 3 1.4 Phased TEP Study Design .................................................................................. 4 1.5 Environmental Monitoring Committee Input ........................................................ 4
2 .0 APPROACH AND METHODS ................................................................................. 7 2.1 Review of Existing Information .......................................................................... 11 2.2 Data Management ............................................................................................. 11 2.3 Watershed Area and Catchment Disturbances ................................................. 11
pCatchment Area ....................................................................................................... 11 2.3.1 Teck Ownership Rights ................................................................................ 13 2.3.2 Mine-Related and Other Disturbances in Catchment .................................. 13 2.3.3 Additional Planned Mining Disturbances and Mitigation/Offsetting .............. 14
2.4 Environmental Quality Descriptors .................................................................... 14 2.4.1 Water Quality Monitoring Station ................................................................. 16 2.4.2 Water Quality Index ..................................................................................... 16 2.4.3 Concentrations of Selenium, Nitrate, Sulphate, Cadmium ........................... 17 2.4.4 Median Concentrations, Trends, and Loads ................................................ 19 2.4.5 Surface Water Acute Toxicity ....................................................................... 21 2.4.6 Sediment Quality .......................................................................................... 21 2.4.7 Calcite .......................................................................................................... 22 2.4.8 Benthic Invertebrate Community Structure .................................................. 23 2.4.9 Selenium in Periphyton or Invertebrate Tissue ............................................ 24
2.5 Fish and Aquatic Habitat Information ................................................................ 25 2.5.1 Annual Average Flow ................................................................................... 25 2.5.2 Ktunaxa Traditional Uses and Cultural Values ............................................ 25 2.5.3 Stream Length ............................................................................................. 25 2.5.4 Fish Species Present ................................................................................... 27 2.5.5 Unique Fish Habitat Features ...................................................................... 27 2.5.6 Anthropogenic and Natural Barriers Present ............................................... 27 2.5.7 Fish Habitat Lengths .................................................................................... 27 2.5.8 Riparian Habitat ........................................................................................... 28 2.5.9 Amphibians and Birds .................................................................................. 30 2.5.10 Written Habitat Descriptions ........................................................................ 31
2.6 Orthophoto Figures ........................................................................................... 33
3 .0 TRIBUTARIES TO UPPER FORDING RIVER (MU1) ............................................ 35 3.1 Upstream Fording River .................................................................................... 40 3.2 Henretta Creek .................................................................................................. 41 3.3 Fish Pond Creek ................................................................................................ 43 3.4 Clode Creek ...................................................................................................... 44 3.5 Lake Mountain Creek ........................................................................................ 46 3.6 Kilmarnock Creek .............................................................................................. 49 3.7 Swift Creek ........................................................................................................ 50 3.8 Cataract Creek .................................................................................................. 51 3.9 Porter Creek ...................................................................................................... 53 3.10 Chauncey Creek ................................................................................................ 53
Teck Tributary Evaluation Program Data Report
Minnow Environmental Inc. ii June 2016 Project 2563
3.11 Ewin Creek ........................................................................................................ 54 3.12 LCO Dry Creek .................................................................................................. 55 3.13 Greenhills Creek ................................................................................................ 57
4 .0 TRIBUTARIES TO LOWER FORDING RIVER (MU2) ........................................... 60 4.1 Grace Creek ...................................................................................................... 60 4.2 Line Creek ......................................................................................................... 65
5 .0 TRIBUTARIES TO UPPER ELK RIVER (MU3) ..................................................... 69 5.1 Branch F Creek ................................................................................................. 69 5.2 Wolf Creek ......................................................................................................... 74 5.3 Willow Creek ..................................................................................................... 75 5.4 Wade Creek ...................................................................................................... 77 5.5 Cougar Creek .................................................................................................... 78 5.6 No-Name Creek and Unnamed Tributary 14 ..................................................... 79 5.7 Mickelson Creek ................................................................................................ 80 5.8 Leask Creek ...................................................................................................... 81 5.9 Wolfram Creek .................................................................................................. 84 5.10 Thompson Creek ............................................................................................... 86
6 .0 TRIBUTARIES TO MICHEL CREEK (MU4) .......................................................... 88 6.1 Upstream Michel Creek ..................................................................................... 93 6.2 Corbin Creek ..................................................................................................... 93 6.3 Andy Good Creek .............................................................................................. 94 6.4 Leach Creek ...................................................................................................... 95 6.5 Carbon Creek .................................................................................................... 96 6.6 Snowslide Creek ............................................................................................... 98 6.7 Wheeler Creek ................................................................................................ 100 6.8 Unnamed Tributary to Michel Creek ................................................................ 101 6.9 Fir Creek .......................................................................................................... 104 6.10 Alexander Creek .............................................................................................. 104 6.11 Erickson Creek ................................................................................................ 106 6.12 South Pit Creek ............................................................................................... 108 6.13 Milligan Creek .................................................................................................. 109 6.14 Gate Creek ...................................................................................................... 109 6.15 Bodie Creek ..................................................................................................... 110 6.16 Aqueduct Creek ............................................................................................... 112
7 .0 TRIBUTARIES TO MIDDLE ELK RIVER (MU4/MU5) ......................................... 116 7.1 Grave Creek (including Harmer Creek and EVO Dry Creek) .......................... 116 7.2 Six-Mile Creek ................................................................................................. 124 7.3 Balmer Creek .................................................................................................. 126 7.4 Fennelon Creek ............................................................................................... 127 7.5 Goddard Creek ................................................................................................ 128 7.6 Otto Creek ....................................................................................................... 131 7.7 Transmission Creek ........................................................................................ 133 7.8 Mine Creek (Hosmer Creek) ........................................................................... 134
8 .0 REFERENCES ..................................................................................................... 137
Teck Tributary Evaluation Program Data Report
Minnow Environmental Inc. iii June 2016 Project 2563
LIST OF FIGURES
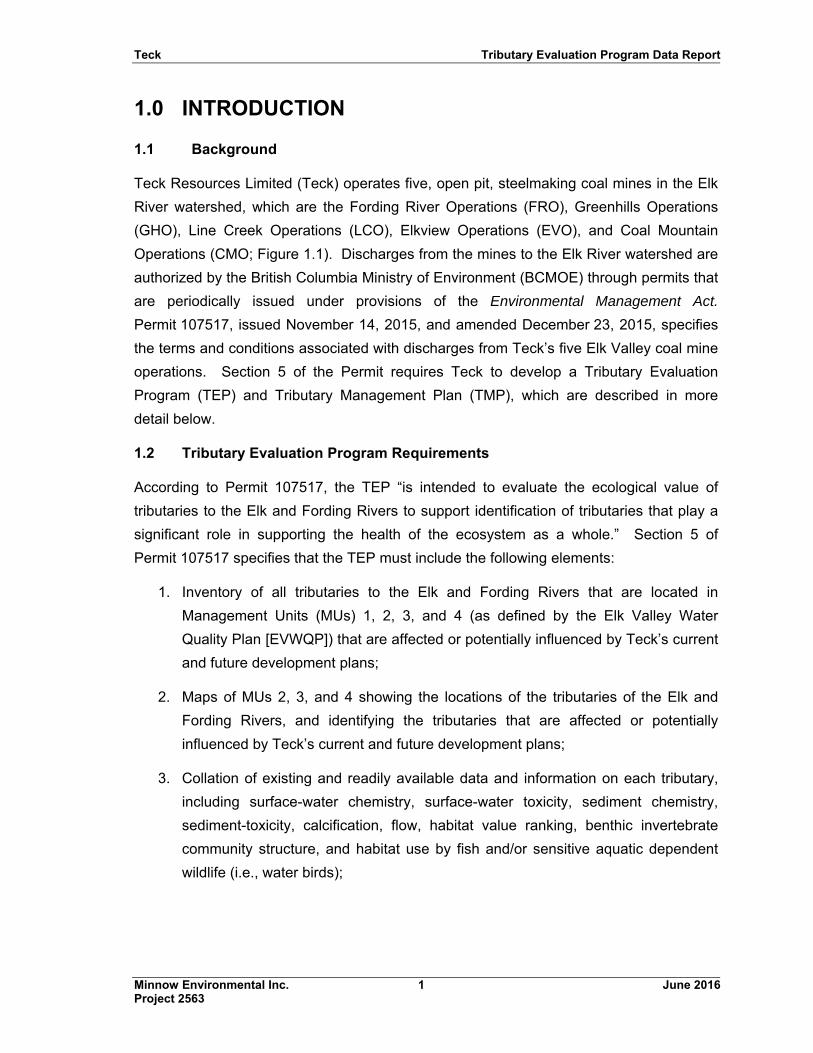
Figure 1.1: Location of Teck Coal Operations. ............................................................. 2
Figure 1.2: Flow chart for developing and updating the Tributary Evaluation Program. .................................................................................................... 5
Figure 2.1: Tributaries of Upper Fording and Upper Elk Rivers (MU1 to MU3). ........... 9
Figure 2.2: Tributaries of Michel Creek and Middle Elk River (MU4, MU5). ............... 10
Figure 3.1: Upper Fording River Watershed Boundary. ............................................. 36
Figure 3.2: Selenium concentration trend over time (2004-2013) in Henretta Creek at the confluence with the Fording River (FR__HC1). ................... 43
Figure 3.3: Selenium concentration trend over time (2004-2013) in Greenhills Creek at the confluence with the Fording River (GH_GH1). .................... 58
Figure 4.1: Lower Fording River Watershed Boundary. ............................................. 61
Figure 5.1: Upper Elk River Watershed Boundary. .................................................... 70
Figure 6.1: Michel Creek Watershed Boundary. ........................................................ 89
Figure 6.2: Selenium concentration trend over time (2004-2013) in Corbin Creek at the confluence with Michel Creek (CM_CC1)............................ 94
Figure 7.1: Middle Elk River Watershed Boundary. ................................................. 117
Figure 7.2: Selenium concentration trend over time (2004-2013) at the Harmer Pond outlet into Gate Creek (EV_HC1). ................................................ 121
Figure 7.3: Selenium concentration trend over time (2004-2013) in Goddard Creek at the confluence with the Elk River (EV_GC2). .......................... 129
LIST OF PHOTOS
Photo 3.1 Fording River upstream from Henretta Creek (Golder 2014a). ................ 41
Photo 3.2: Henretta Lake (Wright et al. 2005). .......................................................... 42
Photo 3.3: Clode Creek downstream from Clode Ponds (Golder 2014a). ................. 45
Photo 3.4: Culvert at Clode Pond access road in the lower section of Lake Mountain Creek (Golder 2014a). ............................................................. 48
Photo 3.5: Swift Creek at the Fording River post-flood 2013 (Golder 2014a). .......... 52
Photo 3.6: Paired culvert crossing under Fording Road in Dry Creek (Teck 2011b). ..................................................................................................... 56
Photo 4.1: Typical riffle-glide morphology in Grace Creek (Teck 2011b). ................. 65
Photo 4.2: Downstream end of the rock drain in Line Creek (Minnow unpublished). ........................................................................................... 66
Photo 6.1: Typical riffle habitat in Leach Creek (Golder 2015). ................................. 96
Photo 6.2: Carbon Creek cascade barrier (Golder 2015). ......................................... 98
Teck Tributary Evaluation Program Data Report
Minnow Environmental Inc. iv June 2016 Project 2563
Photo 6.3: Bedrock falls on Snowslide Creek (Golder 2015). ................................... 99
Photo 6.4: Example of steep-gradient cascade barrier in Wheeler Creek (Golder 2015). ........................................................................................ 101
Photo 6.5: First rock-fall barrier to fish movement on Unnamed Michel Creek Tributary (Golder 2015). ......................................................................... 103
Photo 6.6: Second rock fall barrier to fish movement on Unnamed Michel Creek Tributary (Golder 2015). .............................................................. 103
Photo 6.7: Gradient barrier defining upstream fish distribution limit in Fir Creek (Golder 2015). ........................................................................................ 105
Photo 6.8: Most downstream pond in Erickson Creek headwaters (Lotic 2015a). ................................................................................................... 107
Photo 6.9: Moss and calcified streambed in Erickson Creek (Lotic 2015a). ........... 108
Photo 6.10: Downstream view of the concrete culvert and flap valve for Gate Creek (Lotic 2015a). .............................................................................. 111
Photo 6.11: CPR double culverts in Bodie Creek (Lotic 2015a). ............................... 113
Photo 6.12: Wetland habitat in lower Aqueduct Creek (Lotic 2015a). ....................... 114
Photo 7.1: Upstream view of the 3 m high waterfall below the Grave Lake confluence in Grave Creek (Lotic 2015a)............................................... 122
Photo 7.2: Harmer Pond 0.5 km upstream of the confluence of Harmer Creek with Grave Creek (Lotic 2015a). ............................................................ 123
Photo 7.3: Channel habitat in lower Six-Mile Creek (Lotic 2015a). ......................... 126
Photo 7.4: View of 2 m tall waterfall at the confluence of Fennelon Creek with the Elk River (Lotic 2015a). .................................................................... 128
Photo 7.5: Goddard Marsh at the confluence of Goddard Creek and the Elk River (Lotic 2015a). ................................................................................ 130
Photo 7.6: Channelized section of Otto Creek between the rail line and the tailings lagoons (Lotic 2015a). ............................................................... 131
Photo 7.7: Typical large woody debris/sediment wedge acting as a temporary barrier on Transmission Creek (Golder 2015)........................................ 133
Photo 7.8: Lentic area in Mine Creek, upstream of the confluence with Hosmer Creek (Golder 2015). ............................................................................. 135
LIST OF TABLES
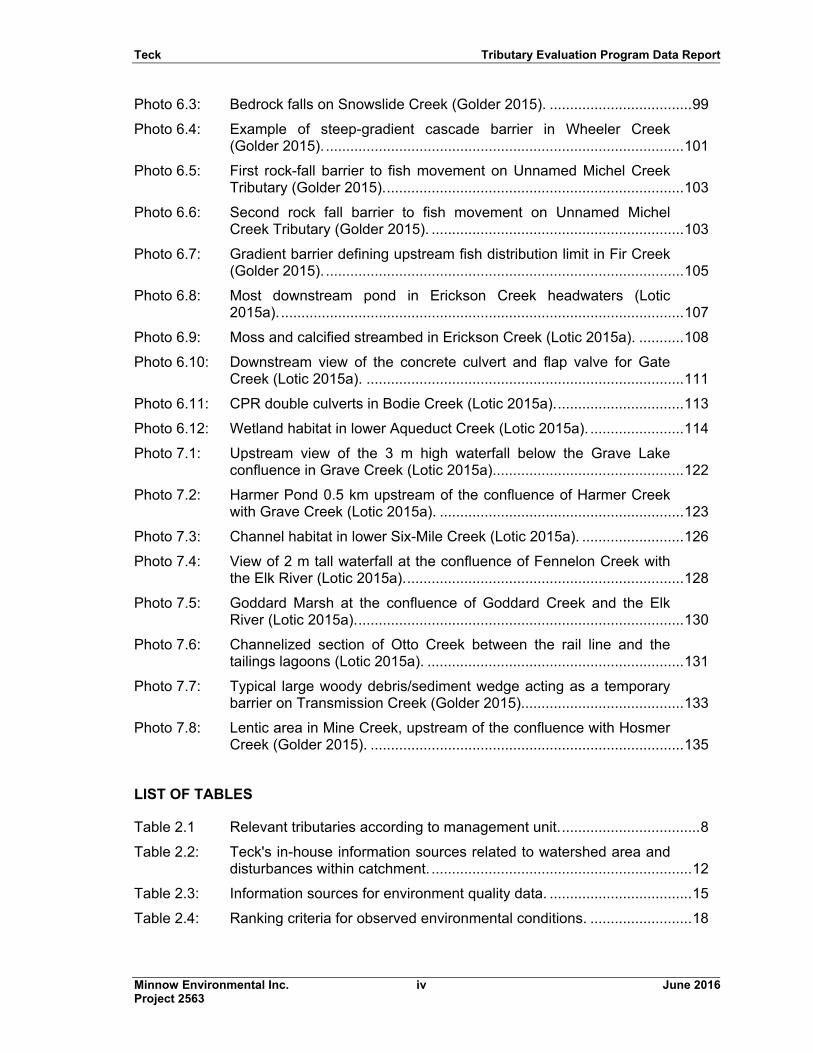
Table 2.1 Relevant tributaries according to management unit. .................................. 8
Table 2.2: Teck's in-house information sources related to watershed area and disturbances within catchment. ................................................................ 12
Table 2.3: Information sources for environment quality data. ................................... 15
Table 2.4: Ranking criteria for observed environmental conditions. ......................... 18
Teck Tributary Evaluation Program Data Report
Minnow Environmental Inc. v June 2016 Project 2563
Table 2.5: Level 1 (10%) effect benchmarks identified in the Elk Valley Water Quality Plan. ............................................................................................. 19
Table 2.6: Sources of aquatic habitat information. .................................................... 26
Table 2.7: Tributary features depicted in tributary orthophotos................................. 34
Table 3.1: Watershed area and disturbances for the Upper Fording River (MU1). ...................................................................................................... 37
Table 3.2: Environmental quality and descriptors for Upper Fording River (MU1). ...................................................................................................... 38
Table 3.3: Aquatic habitat of Upper Fording River (MU1). ........................................ 39
Table 4.1: Watershed area and disturbances for the Lower Fording River (MU2). ...................................................................................................... 62
Table 4.2: Environmental quality descriptors for Lower Fording River (MU2). .......... 63
Table 4.3: Aquatic habitat of Lower Fording River (MU2). ........................................ 64
Table 5.1: Watershed area and descriptors for tributaries to Upper Elk River (MU3). ...................................................................................................... 71
Table 5.2: Environmental quality descriptors for Upper Elk River (MU3). ................. 72
Table 5.3: Aquatic habitat of Upper Elk River (MU3). ............................................... 73
Table 6.1: Watershed area and disturbances for tributaries to Michel Creek (MU4). ...................................................................................................... 90
Table 6.2: Environmental quality descriptors for tributaries to Michel Creek (MU4). ...................................................................................................... 91
Table 6.3: Aquatic habitat of Michel Creek tributaries (MU4). ................................... 92
Table 7.1: Watershed area and disturbances for Middle Elk River (MU4 and MU5). ..................................................................................................... 118
Table 7.2: Environmental quality descriptors for Middle Elk River (MU4 and MU5). ..................................................................................................... 119
Table 7.3: Aquatic habitat of Middle Elk River (MU4 and MU5). ............................. 120
APPENDIX A TRIBUTARIES TO UPPER FORDING RIVER (MU1)
APPENDIX B TRIBUTARIES TO LOWER FORDING RIVER (MU2)
APPENDIX C TRIBUTARIES TO UPPER ELK RIVER (MU3)
APPENDIX D TRIBUTARIES TO MICHEL CREEK (MU4)
APPENDIX E TRIBUTARIES TO MIDDLE ELK RIVER (MU4/MU5)
APPENDIX F BIBLIOGRAPHIES
Teck Tributary Evaluation Program Data Report
Minnow Environmental Inc. 1 June 2016 Project 2563
1.0 INTRODUCTION
1.1 Background
Teck Resources Limited (Teck) operates five, open pit, steelmaking coal mines in the Elk
River watershed, which are the Fording River Operations (FRO), Greenhills Operations
(GHO), Line Creek Operations (LCO), Elkview Operations (EVO), and Coal Mountain
Operations (CMO; Figure 1.1). Discharges from the mines to the Elk River watershed are
authorized by the British Columbia Ministry of Environment (BCMOE) through permits that
are periodically issued under provisions of the Environmental Management Act.
Permit 107517, issued November 14, 2015, and amended December 23, 2015, specifies
the terms and conditions associated with discharges from Teck’s five Elk Valley coal mine
operations. Section 5 of the Permit requires Teck to develop a Tributary Evaluation
Program (TEP) and Tributary Management Plan (TMP), which are described in more
detail below.
1.2 Tributary Evaluation Program Requirements
According to Permit 107517, the TEP “is intended to evaluate the ecological value of
tributaries to the Elk and Fording Rivers to support identification of tributaries that play a
significant role in supporting the health of the ecosystem as a whole.” Section 5 of
Permit 107517 specifies that the TEP must include the following elements:
1. Inventory of all tributaries to the Elk and Fording Rivers that are located in
Management Units (MUs) 1, 2, 3, and 4 (as defined by the Elk Valley Water
Quality Plan [EVWQP]) that are affected or potentially influenced by Teck’s current
and future development plans;
2. Maps of MUs 2, 3, and 4 showing the locations of the tributaries of the Elk and
Fording Rivers, and identifying the tributaries that are affected or potentially
influenced by Teck’s current and future development plans;
3. Collation of existing and readily available data and information on each tributary,
including surface-water chemistry, surface-water toxicity, sediment chemistry,
sediment-toxicity, calcification, flow, habitat value ranking, benthic invertebrate
community structure, and habitat use by fish and/or sensitive aquatic dependent
wildlife (i.e., water birds);
E
E
E
!
!
!
!!
LakeKoocanusa
A L B E R T AA L B E R T A
Kootenay River
Elk Ri
ver
MoyieLake
B R I T I S HB R I T I S HC O L U M B I AC O L U M B I A
Coal MountainOperations
ElkviewOperations
Fording RiverOperations
Line CreekOperations
GreenhillsOperations
Cranbrook
Sparwood
Elkford
Elko
Fernie
580,000
580,000
600,000
600,000
620,000
620,000
640,000
640,000
660,000
660,000
680,000
680,000
5,440
,000
5,440
,000
5,460
,000
5,460
,000
5,480
,000
5,480
,000
5,500
,000
5,500
,000
5,520
,000
5,520
,000
5,540
,000
5,540
,000
5,560
,000
5,560
,000
5,580
,000
5,580
,000
Teck Coal Mine OperationsWaterbodyWetlandWatercourseInternational BoundaryProvincial / State BoundaryHighway
! Town
E Water Flow DirectionMAP INFORMATIONMap Projection: UTM Zone 11 NAD 1983Data Source: Reproduced under licence from HerMajesty the Queen in Right of Canada, Departmentof Natural Resources Canada, GeoBase and BCGov, GeoBC. All rights reserved.Creation Date: March 2016Project No.: 2563
Figure 1.1: Teck CoalLimited Operations withinthe Elk River Valley,Southeast BritishColumbia.
!
!
!
!
!
!
!
!EdmontonPrince George
KamloopsCalgary
Vancouver
B R I T I S HC O L U M B I A
Id a h oM on t a naWa s h i n g t o n
F
A L B E R T A
0 5 10 152.5Kilometers
²
2
Teck Tributary Evaluation Program Data Report
Minnow Environmental Inc. 3 June 2016 Project 2563
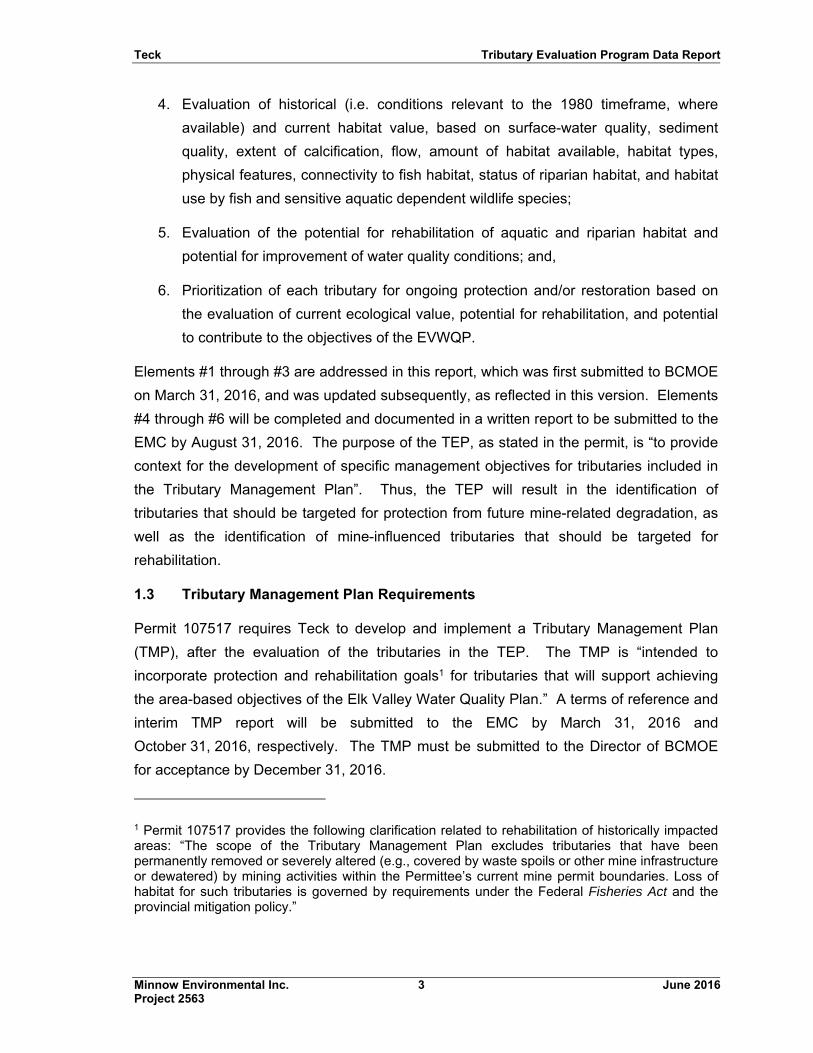
4. Evaluation of historical (i.e. conditions relevant to the 1980 timeframe, where
available) and current habitat value, based on surface-water quality, sediment
quality, extent of calcification, flow, amount of habitat available, habitat types,
physical features, connectivity to fish habitat, status of riparian habitat, and habitat
use by fish and sensitive aquatic dependent wildlife species;
5. Evaluation of the potential for rehabilitation of aquatic and riparian habitat and
potential for improvement of water quality conditions; and,
6. Prioritization of each tributary for ongoing protection and/or restoration based on
the evaluation of current ecological value, potential for rehabilitation, and potential
to contribute to the objectives of the EVWQP.
Elements #1 through #3 are addressed in this report, which was first submitted to BCMOE
on March 31, 2016, and was updated subsequently, as reflected in this version. Elements
#4 through #6 will be completed and documented in a written report to be submitted to the
EMC by August 31, 2016. The purpose of the TEP, as stated in the permit, is “to provide
context for the development of specific management objectives for tributaries included in
the Tributary Management Plan”. Thus, the TEP will result in the identification of
tributaries that should be targeted for protection from future mine-related degradation, as
well as the identification of mine-influenced tributaries that should be targeted for
rehabilitation.
1.3 Tributary Management Plan Requirements
Permit 107517 requires Teck to develop and implement a Tributary Management Plan
(TMP), after the evaluation of the tributaries in the TEP. The TMP is “intended to
incorporate protection and rehabilitation goals1 for tributaries that will support achieving
the area-based objectives of the Elk Valley Water Quality Plan.” A terms of reference and
interim TMP report will be submitted to the EMC by March 31, 2016 and
October 31, 2016, respectively. The TMP must be submitted to the Director of BCMOE
for acceptance by December 31, 2016.
1 Permit 107517 provides the following clarification related to rehabilitation of historically impacted areas: “The scope of the Tributary Management Plan excludes tributaries that have been permanently removed or severely altered (e.g., covered by waste spoils or other mine infrastructure or dewatered) by mining activities within the Permittee’s current mine permit boundaries. Loss of habitat for such tributaries is governed by requirements under the Federal Fisheries Act and the provincial mitigation policy.”
Teck Tributary Evaluation Program Data Report
Minnow Environmental Inc. 4 June 2016 Project 2563
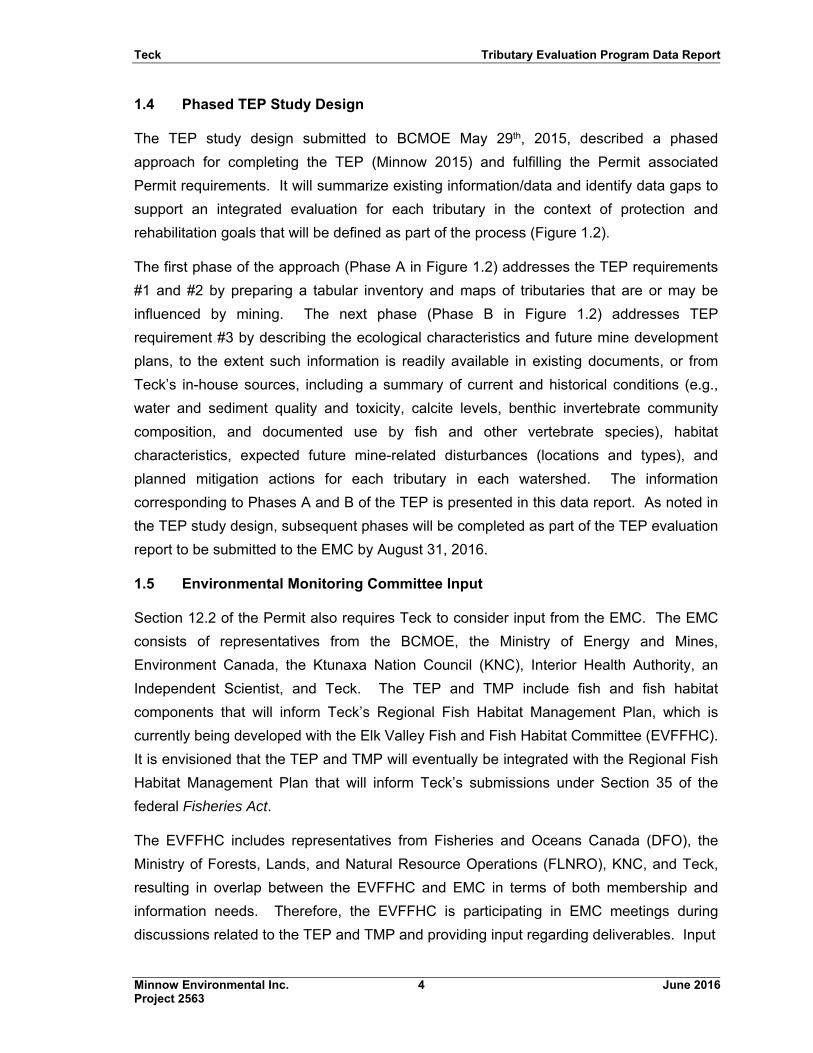
1.4 Phased TEP Study Design
The TEP study design submitted to BCMOE May 29th, 2015, described a phased
approach for completing the TEP (Minnow 2015) and fulfilling the Permit associated
Permit requirements. It will summarize existing information/data and identify data gaps to
support an integrated evaluation for each tributary in the context of protection and
rehabilitation goals that will be defined as part of the process (Figure 1.2).
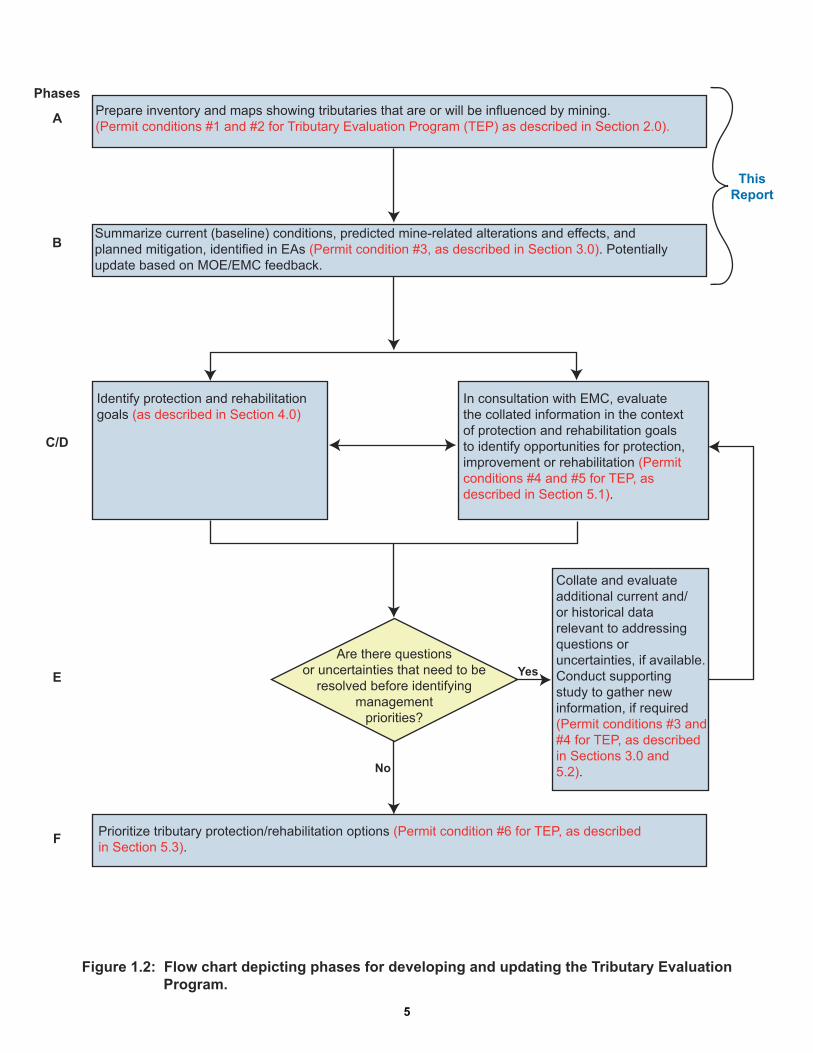
The first phase of the approach (Phase A in Figure 1.2) addresses the TEP requirements
#1 and #2 by preparing a tabular inventory and maps of tributaries that are or may be
influenced by mining. The next phase (Phase B in Figure 1.2) addresses TEP
requirement #3 by describing the ecological characteristics and future mine development
plans, to the extent such information is readily available in existing documents, or from
Teck’s in-house sources, including a summary of current and historical conditions (e.g.,
water and sediment quality and toxicity, calcite levels, benthic invertebrate community
composition, and documented use by fish and other vertebrate species), habitat
characteristics, expected future mine-related disturbances (locations and types), and
planned mitigation actions for each tributary in each watershed. The information
corresponding to Phases A and B of the TEP is presented in this data report. As noted in
the TEP study design, subsequent phases will be completed as part of the TEP evaluation
report to be submitted to the EMC by August 31, 2016.
1.5 Environmental Monitoring Committee Input
Section 12.2 of the Permit also requires Teck to consider input from the EMC. The EMC
consists of representatives from the BCMOE, the Ministry of Energy and Mines,
Environment Canada, the Ktunaxa Nation Council (KNC), Interior Health Authority, an
Independent Scientist, and Teck. The TEP and TMP include fish and fish habitat
components that will inform Teck’s Regional Fish Habitat Management Plan, which is
currently being developed with the Elk Valley Fish and Fish Habitat Committee (EVFFHC).
It is envisioned that the TEP and TMP will eventually be integrated with the Regional Fish
Habitat Management Plan that will inform Teck’s submissions under Section 35 of the
federal Fisheries Act.
The EVFFHC includes representatives from Fisheries and Oceans Canada (DFO), the
Ministry of Forests, Lands, and Natural Resource Operations (FLNRO), KNC, and Teck,
resulting in overlap between the EVFFHC and EMC in terms of both membership and
information needs. Therefore, the EVFFHC is participating in EMC meetings during
discussions related to the TEP and TMP and providing input regarding deliverables. Input
Prepare inventory and maps showing tributaries that are or will be influenced by mining.(Permit conditions #1 and #2 for Tributary Evaluation Program (TEP) as described in Section 2.0).
Summarize current (baseline) conditions, predicted mine-related alterations and effects, andplanned mitigation, identified in EAs (Permit condition #3, as described in Section 3.0). Potentiallyupdate based on MOE/EMC feedback.
Identify protection and rehabilitationgoals (as described in Section 4.0)
In consultation with EMC, evaluatethe collated information in the contextof protection and rehabilitation goalsto identify opportunities for protection,improvement or rehabilitation (Permitconditions #4 and #5 for TEP, asdescribed in Section 5.1).
Collate and evaluateadditional current and/or historical datarelevant to addressingquestions or uncertainties, if available.Conduct supportingstudy to gather newinformation, if required(Permit conditions #3 and#4 for TEP, as describedin Sections 3.0 and5.2).
Are there questionsor uncertainties that need to be
resolved before identifyingmanagement
priorities?
Prioritize tributary protection/rehabilitation options (Permit condition #6 for TEP, as describedin Section 5.3).
Figure 1.2: Flow chart depicting phases for developing and updating the Tributary Evaluation Program.
No
Yes
Phases
A
B
C/D
E
F
ThisReport
5
Teck Tributary Evaluation Program Data Report
Minnow Environmental Inc. 6 June 2016 Project 2563
received to date from both the EMC and EVFFHC has been considered in this data report.
The following key items have been addressed in response to input from the EMC
regarding the first draft TEP report submitted March 31, 2016:
Columns for the road density dataset from the Elk Valley Cumulative Effects
Management Framework (CEMF) have been added and populated with data
received from the Province.
A column for Ktunaxa traditional uses and cultural values has been added and will
be populated when information is received from KNC.
A column for riparian habitat has been added using the riparian analysis
completed for the Baldy Ridge Extension Project.
The catchment areas and stream lengths presented in the tables and on
orthophoto figures have also been updated based on the provincial Corporate
Watershed Base dataset, which uses the Fresh Water Atlas (FWA) (TRIM1) data.
Columns with fish habitat metrics have been added following methods similar to
the BCMOE Fish Passage GIS Analysis Methodology and Output Data
Specifications Version 2 (Norris and Mount in draft). Version 2 builds on Version 1
of the BC MOE GIS Modelling of Fish Habitat and Road Crossings for the
Prioritization of Culvert Assessment and Remediation Version 1 (Mount et al.
2011).
Teck Tributary Evaluation Program Data Report
Minnow Environmental Inc. 7 June 2016 Project 2563
2.0 APPROACH AND METHODS
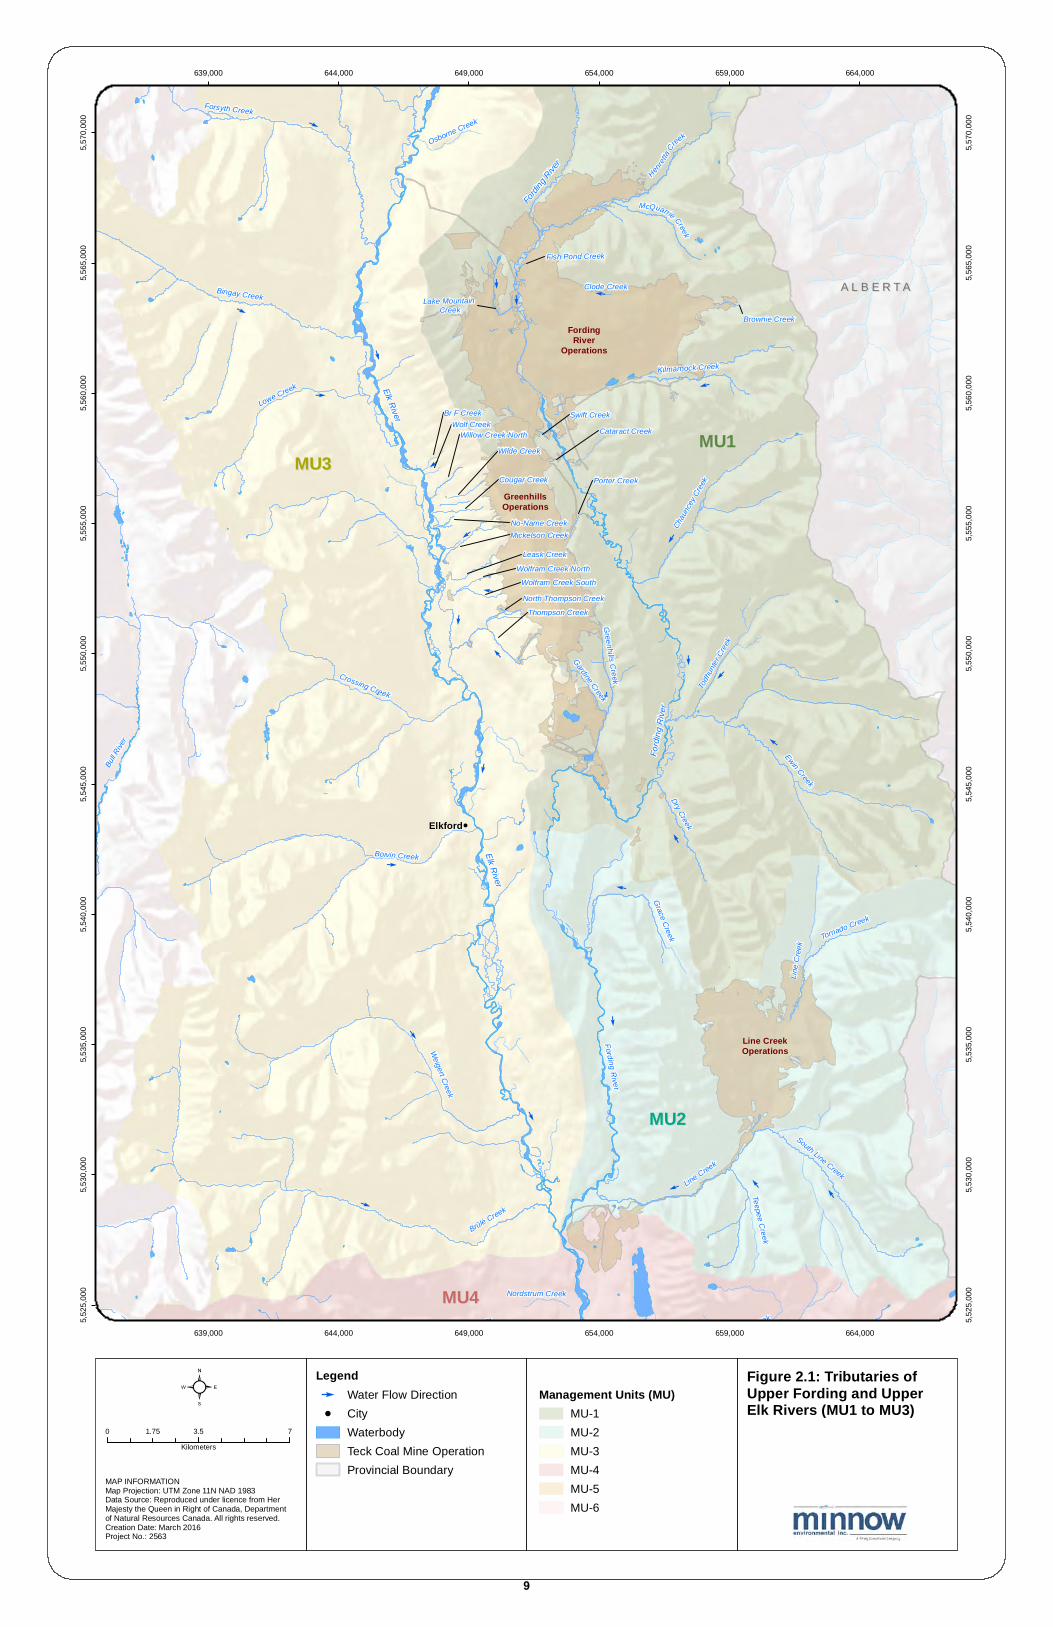
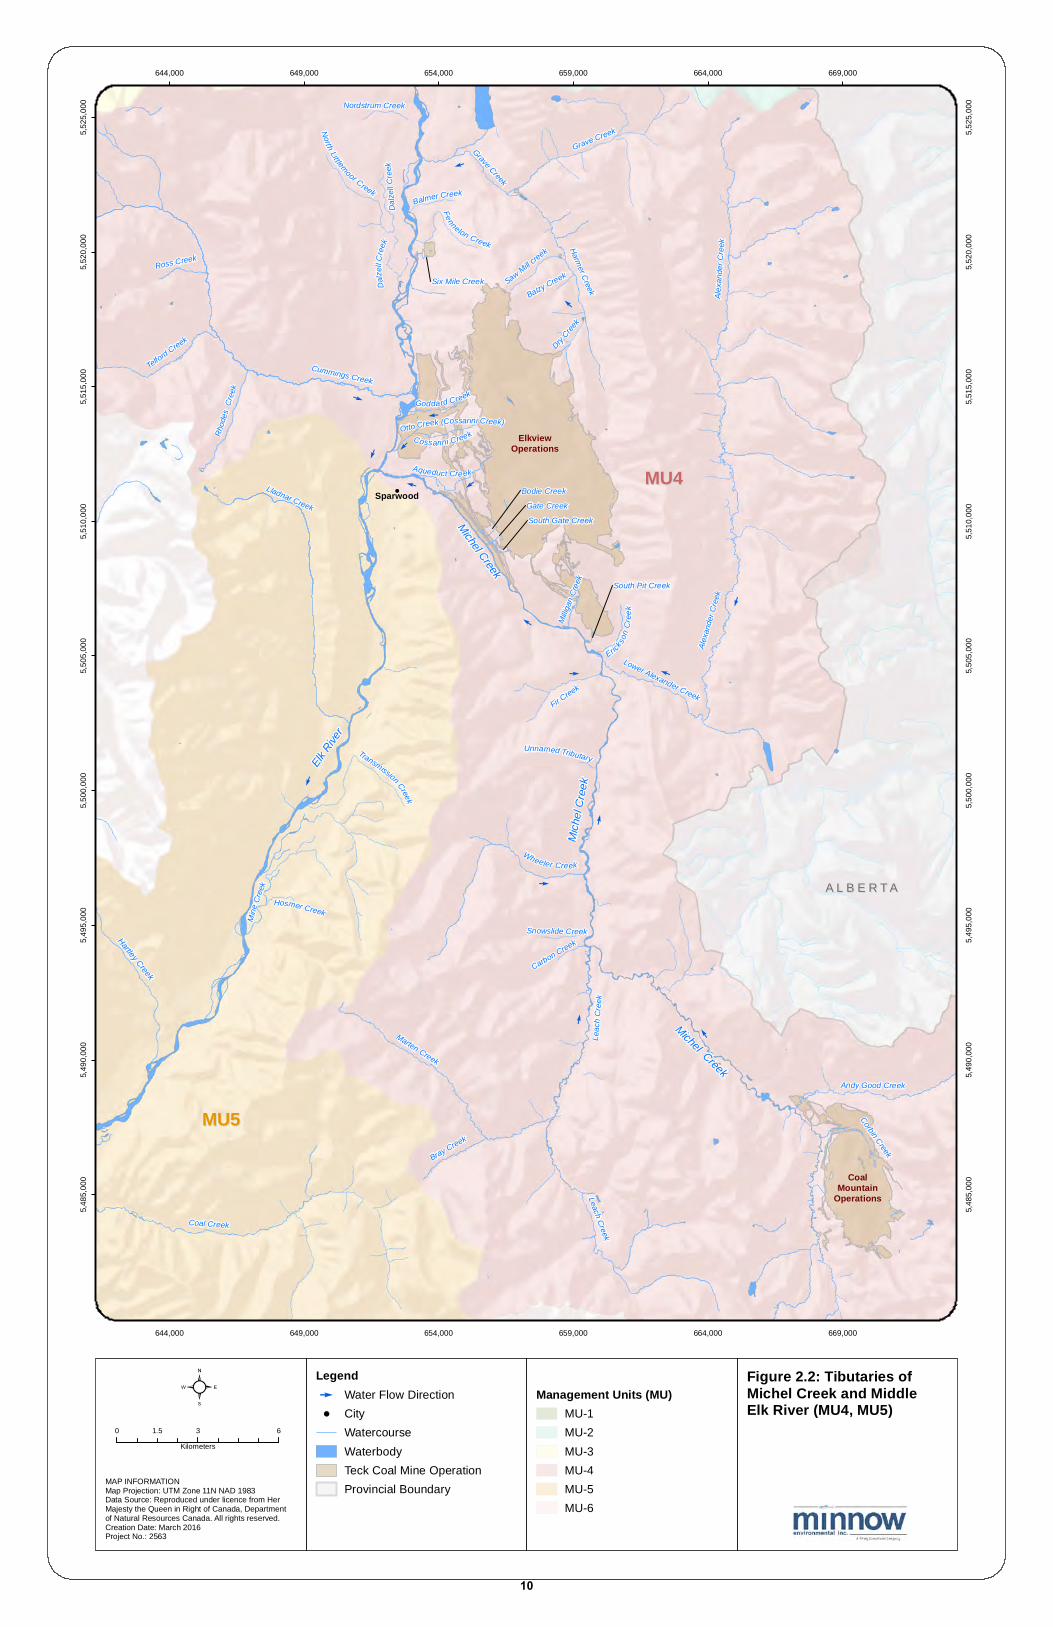
Information for tributaries is provided in Sections 3.0 to 7.0 of this report and organized
according to the Management Unit (MU) in which the tributaries are located. The MUs
included in this report are as follows: Upper Fording River Watershed (MU1); Lower
Fording River Watershed (MU2); Upper Elk River Watershed (MU3); Michel Creek
Watershed (MU4); and Middle Elk River Watershed (MU4/MU52). The tributaries
discussed in this report include all streams within these MUs that flow into the Fording
River, Michel Creek, or Elk River that are currently mine-influenced (i.e., the mine footprint
extends into a portion of the tributary's catchment) and streams that have not been
historically influenced by mining but for which Teck has ownership rights within the
catchment area (see Section 2.2.4). All tributaries considered in recent Environmental
Assessments (e.g., LCO Phase II, Fording-Swift, Baldy Ridge Extension, Cougar Pit
Extension and CMO Phase 2) are also included. The tributaries included in each MU are
listed in Table 2.1 and shown on Figures 2.1 and 2.2.
Three data matrices are presented for each group of tributaries (by MU), which
correspond to three categories of information: (1) total watershed area and mine-related
disturbances within the watershed; (2) environmental quality data (e.g., water, sediment,
calcite, and biological data); and (3) fish and aquatic habitat data. The methods and
sources associated with this tabulated information are described below. A text description
of each tributary is also presented for each tributary, which generally emphasizes
information that was available, but not amenable to a comparative data matrix format
(e.g., description of mining history, results of habitat surveys). Graphs and photographs
are also presented to illustrate selected data or habitat characteristics mentioned in tables
or text.
General overviews of information sources and data management practices are presented
below in Sections 2.1 and 2.2. The methods and sources of information used to populate
the three types of data matrices (listed above) for each MU are described in Sections 2.3
to 2.6.in an order that corresponds to the format of each table.
2 The only MU5 tributaries included in the TEP are those that were identified as part of the CMO Phase 2 baseline study (Golder 2015a). The CMO Phase 2 project is no longer proceeding.
Teck Tributary Evaluation Program Data Report
Minnow Environmental Inc. 8 June 2016 Project 2563
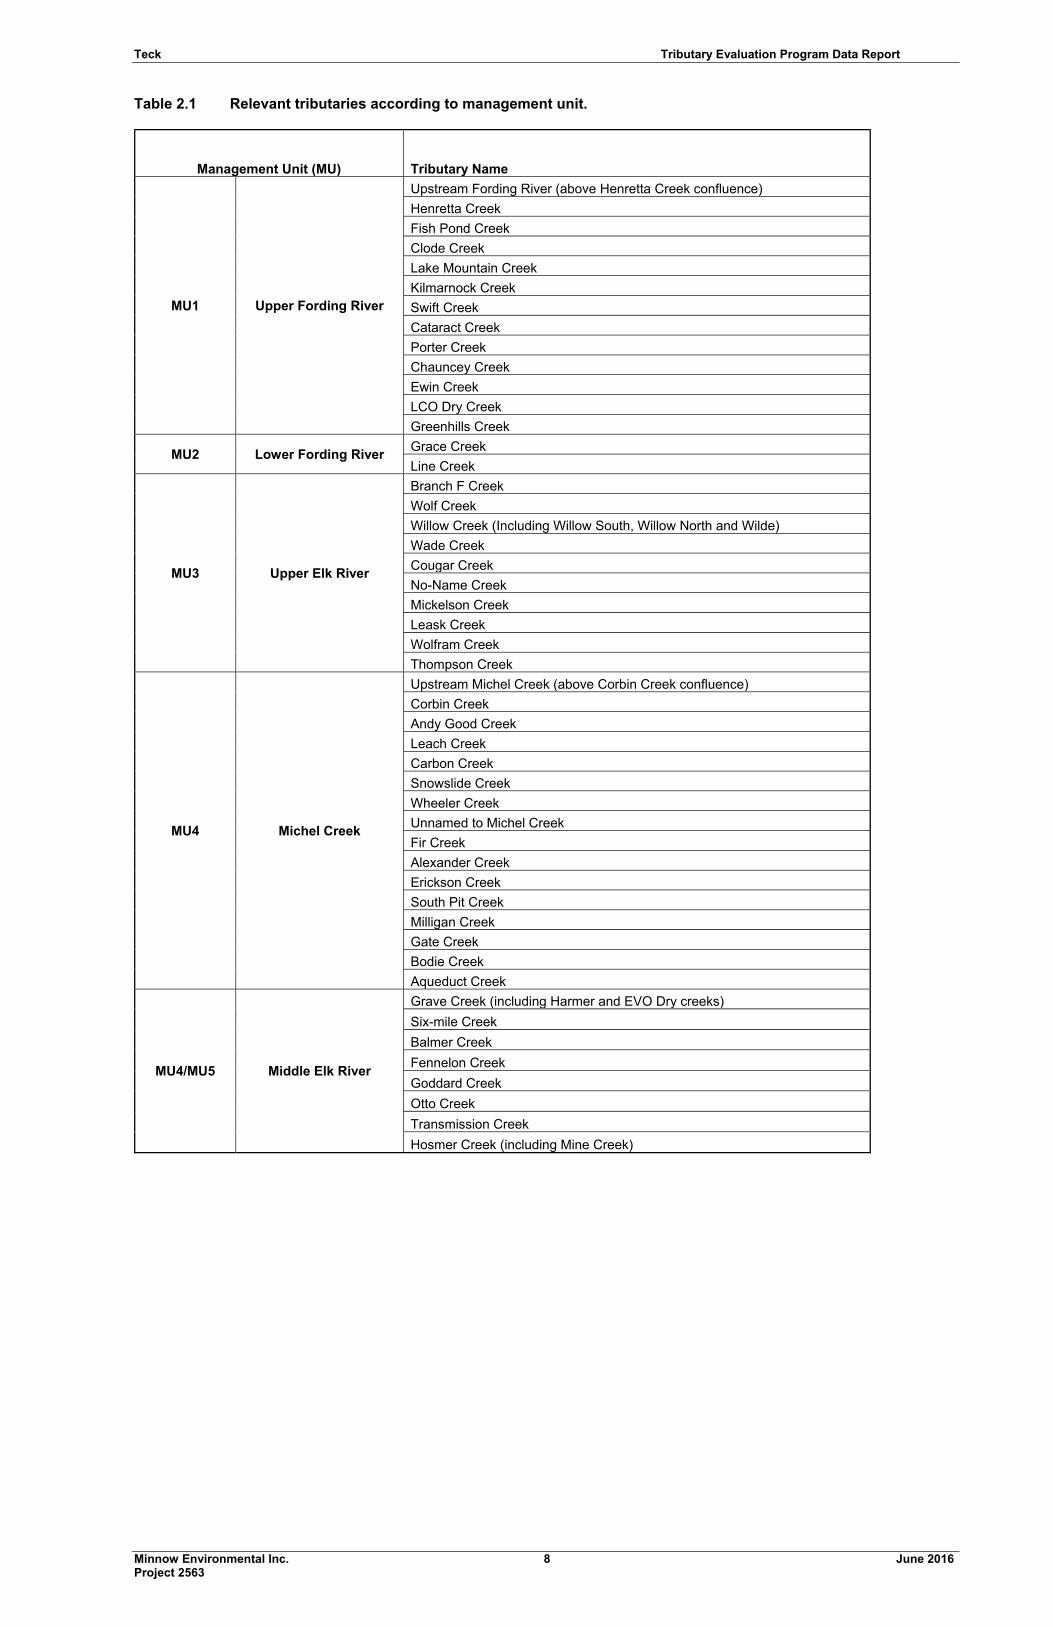
Table 2.1 Relevant tributaries according to management unit.
Management Unit (MU) Tributary Name
MU1 Upper Fording River
Upstream Fording River (above Henretta Creek confluence)
Henretta Creek
Fish Pond Creek
Clode Creek
Lake Mountain Creek
Kilmarnock Creek
Swift Creek
Cataract Creek
Porter Creek
Chauncey Creek
Ewin Creek
LCO Dry Creek
Greenhills Creek
MU2 Lower Fording River Grace Creek
Line Creek
MU3 Upper Elk River
Branch F Creek
Wolf Creek
Willow Creek (Including Willow South, Willow North and Wilde)
Wade Creek
Cougar Creek
No-Name Creek
Mickelson Creek
Leask Creek
Wolfram Creek
Thompson Creek
MU4 Michel Creek
Upstream Michel Creek (above Corbin Creek confluence)
Corbin Creek
Andy Good Creek
Leach Creek
Carbon Creek
Snowslide Creek
Wheeler Creek
Unnamed to Michel Creek
Fir Creek
Alexander Creek
Erickson Creek
South Pit Creek
Milligan Creek
Gate Creek
Bodie Creek
Aqueduct Creek
MU4/MU5 Middle Elk River
Grave Creek (including Harmer and EVO Dry creeks)
Six-mile Creek
Balmer Creek
Fennelon Creek
Goddard Creek
Otto Creek
Transmission Creek
Hosmer Creek (including Mine Creek)
!
E
E
E
E
E
E
E
E
E
E
E
E
E
E
E
E E
E
E
E
E
E
E
E
E
E
E
EE
E
NorboeCreek
Grave Creek
Teepee Creek
Line Creek
South Line Creek
Brûlé Creek
Fording River
Nordstrum Creek
Weigert Creek
Grace Creek
Boivin Creek Elk River
Tornado Creek
Line C
reek
Nort h Lit tlemoor Creek
Dry Creek
Ewin Creek
Todhu
nter C
reek
Crossing Creek
Fordi
ng R
iver
Greenhills Creek
Gardine Creek
Lowe Creek Elk RiverCh
aunce
y Cree
k
Fordin
g Rive
r
Bull R
iver
Forsyth Creek
Bingay Creek
Osborne Creek
Brownie Creek
Clode Creek
Porter Creek
Henrett
a Creek
McQuarrie CreekKilmarnock Creek
North Thompson CreekThompson Creek
Cataract CreekSwift Creek
Willow Creek NorthWolf Creek
Br F Creek
Leask Creek
Mickelson CreekNo-Name Creek
Wilde Creek
Cougar Creek
Wolfram Creek SouthWolfram Creek North
Lake Mountain Creek
Fish Pond Creek
A L B E R T AA L B E R T A
MU3MU3MU1MU1
MU2MU2
MU4MU4
FordingRiver
Operations
GreenhillsOperations
Line CreekOperations
Elkford
639,000
639,000
644,000
644,000
649,000
649,000
654,000
654,000
659,000
659,000
664,000
664,000
5,525
,000
5,525
,000
5,530
,000
5,530
,000
5,535
,000
5,535
,000
5,540
,000
5,540
,000
5,545
,000
5,545
,000
5,550
,000
5,550
,000
5,555
,000
5,555
,000
5,560
,000
5,560
,000
5,565
,000
5,565
,000
5,570
,000
5,570
,000
Figure 2.1: Tributaries of Upper Fording and Upper Elk Rivers (MU1 to MU3)
Legend
E Water Flow Direction! City
WaterbodyTeck Coal Mine OperationProvincial Boundary
Management Units (MU)MU-1MU-2MU-3MU-4MU-5MU-6
MAP INFORMATIONMap Projection: UTM Zone 11N NAD 1983Data Source: Reproduced under licence from HerMajesty the Queen in Right of Canada, Departmentof Natural Resources Canada. All rights reserved.Creation Date: March 2016Project No.: 2563
²0 3.5 71.75
Kilometers
9
!
!
E
E
E
E
E
E
E
E
E
E
E
E
E
EE
E
E
Cummings Creek
Rhod
es C
reek
Telford Creek
Ross Creek
Andy Good Creek
Michel Creek
Corbin Creek
Coal Creek
Marten Creek
Bray Creek
Hartley Creek
Lladnar Creek
Alexa
nder
Cree
kAle
xand
er Cr
eekHarmer Creek
Fir Creek
Lower Alexander Creek
Wheeler Creek
Leach Creek
Snowslide Creek
Carbon Creek
Leac
h Cree
k
Grave Creek
Grave Creek
Nordstrum Creek
Saw Mill creek
Balzy Creek
Dry Cree
k
Elk Rive
r
Michel CreekMi
chel
Cree
k
North Littlemoor Creek
Dalze
ll Cree
kDa
lzell C
reek
Millig
an Cr
eek
Gate CreekBodie Creek
Aqueduct Creek
Six Mile Creek
Cossarini Creek
Goddard Creek
South Gate Creek
Erickso
n Cre
e k
South Pit Creek
Otto Creek (Cossarini Creek)
Unnamed Tributary
Balmer Creek
Fennelon Creek
Transmission Creek
Mine
Cree
k
Hosmer Creek
A L B E R T AA L B E R T A
MU4MU4
MU5MU5
CoalMountain
Operations
ElkviewOperations
Sparwood
644,000
644,000
649,000
649,000
654,000
654,000
659,000
659,000
664,000
664,000
669,000
669,000
5,485
,000
5,485
,000
5,490
,000
5,490
,000
5,495
,000
5,495
,000
5,500
,000
5,500
,000
5,505
,000
5,505
,000
5,510
,000
5,510
,000
5,515
,000
5,515
,000
5,520
,000
5,520
,000
5,525
,000
5,525
,000
Figure 2.2: Tibutaries of Michel Creek and MiddleElk River (MU4, MU5)
Legend
E Water Flow Direction! City
WatercourseWaterbodyTeck Coal Mine OperationProvincial Boundary
Management Units (MU)MU-1MU-2MU-3MU-4MU-5MU-6
MAP INFORMATIONMap Projection: UTM Zone 11N NAD 1983Data Source: Reproduced under licence from HerMajesty the Queen in Right of Canada, Departmentof Natural Resources Canada. All rights reserved.Creation Date: March 2016Project No.: 2563
²0 3 61.5
Kilometers
10
Teck Tributary Evaluation Program Data Report
Minnow Environmental Inc. 11 June 2016 Project 2563
2.1 Review of Existing Information
Information about tributaries in the Elk River watershed was gathered from a variety of
sources and reviewed. The information reviewed included scientific literature, consultant
reports prepared for Teck and other organizations, government agency reports, and
electronic databases maintained by federal and provincial government agencies. Most of
the information was derived from sources internal to Teck, whereas the remainder was
summarized from recent and historical technical reports. An annotated bibliography of
technical reports with tributary information is provided in Appendix F of this report.
2.2 Data Management
Data for the TEP were generated from Teck’s ArcGIS and EQUIS databases, with output
provided in Excel spreadsheets.
2.3 Watershed Area and Catchment Disturbances
Strictly speaking, “watershed” refers to the high ground or ridge that divides separates
waters flowing to adjacent river systems, whereas terms such as “catchment”, “basin”, and
“drainage area” refer to the area bounded by the watershed. However, these terms are
often used interchangeably, as is usually the case when referring to the Elk River
watershed. Likewise, this document uses the word “watershed” interchangeably with
those referring to catchment area, so the term “watershed boundary” has been used to
refer to the line dividing adjacent catchments.
The first data matrix presented for each MU identifies the watershed area for each
tributary within the MU, the mine-related disturbance footprint (including a list of the types
of mine-related disturbances within the tributary catchment), and the area affected by
forestry, and roads. The methods and sources used to gather this information are
described below. Table 2.2 provides a brief summary of the same information for quick
reference.
pCatchment Area
The catchment area for each tributary was determined using the Corporate Watershed
Base (CWB) dataset provided by the Province. The CWB dataset, formerly known as the
TRIM Watershed Atlas, is a watershed atlas that defines watersheds and provides an
associated stream and lake network. The CWB dataset adds functionality to TRIM
1:20,000 digital topographic base map data by providing a connected feature-coded
stream network, hydrographic information, and associated watershed boundaries. The
CWB is derived from TRIM1 mapping. The total catchment area (km2) from the Province’s
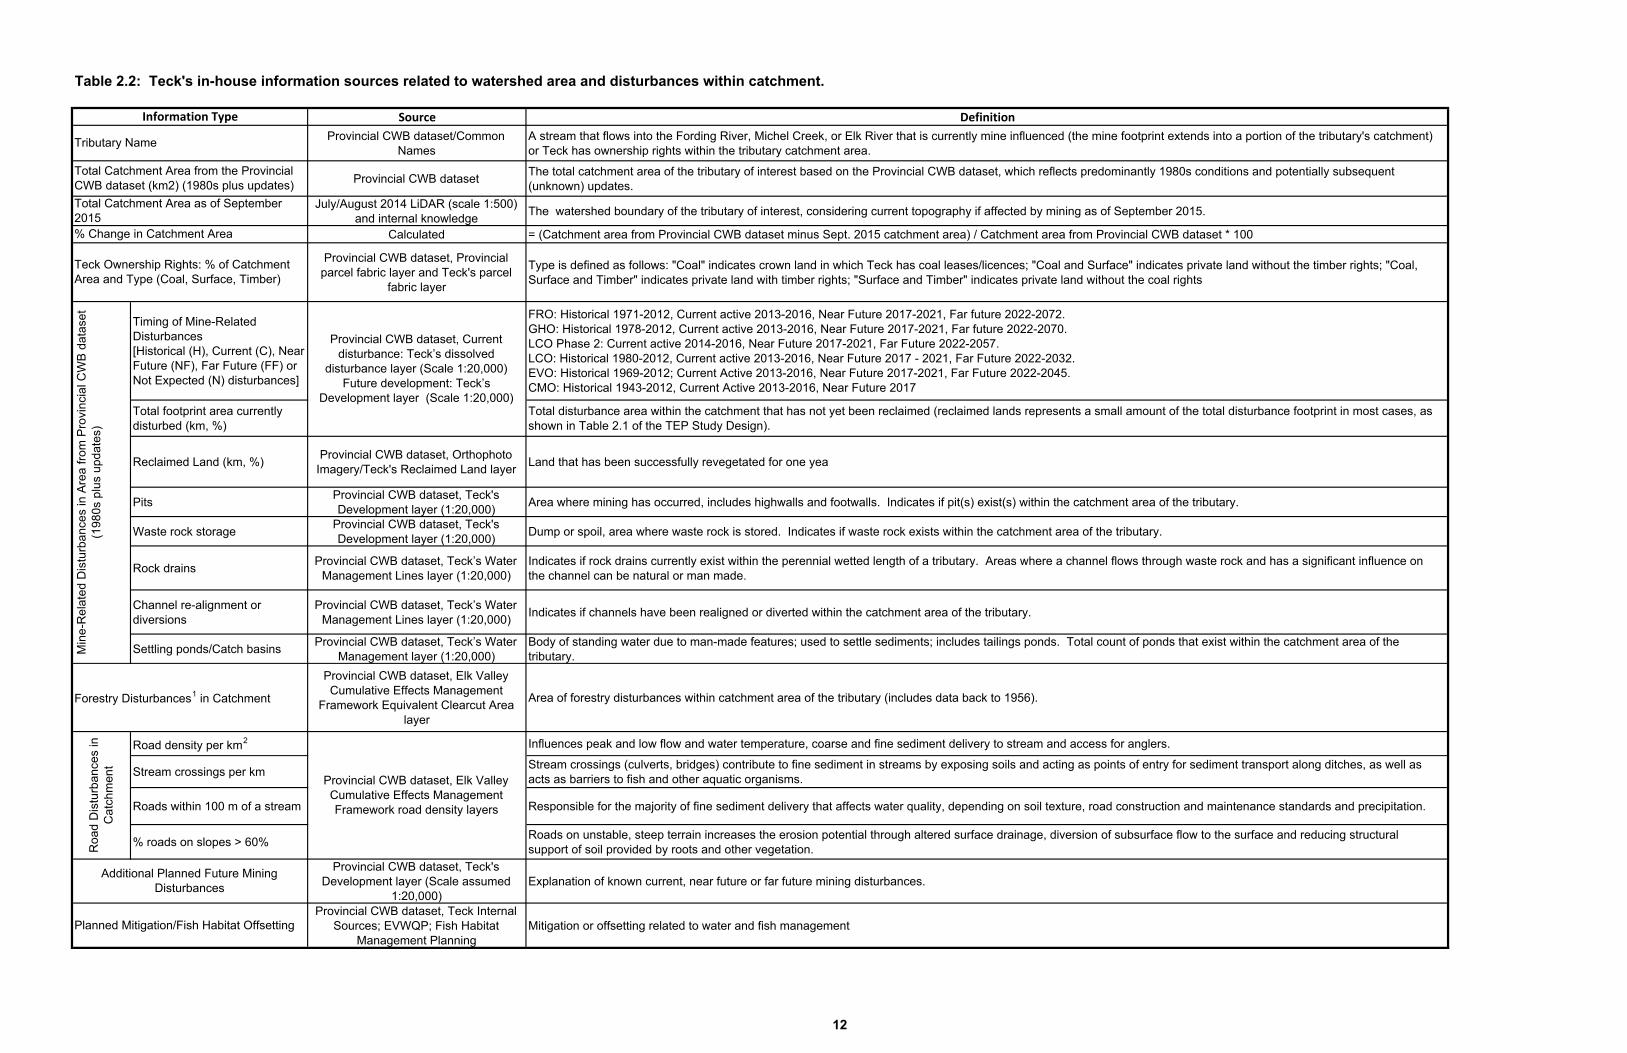
Table 2.2: Teck's in-house information sources related to watershed area and disturbances within catchment.
Source Definition
Provincial CWB dataset/Common Names
A stream that flows into the Fording River, Michel Creek, or Elk River that is currently mine influenced (the mine footprint extends into a portion of the tributary's catchment) or Teck has ownership rights within the tributary catchment area.
Provincial CWB datasetThe total catchment area of the tributary of interest based on the Provincial CWB dataset, which reflects predominantly 1980s conditions and potentially subsequent (unknown) updates.
July/August 2014 LiDAR (scale 1:500) and internal knowledge
The watershed boundary of the tributary of interest, considering current topography if affected by mining as of September 2015.
Calculated = (Catchment area from Provincial CWB dataset minus Sept. 2015 catchment area) / Catchment area from Provincial CWB dataset * 100
Provincial CWB dataset, Provincial parcel fabric layer and Teck's parcel
fabric layer
Type is defined as follows: "Coal" indicates crown land in which Teck has coal leases/licences; "Coal and Surface" indicates private land without the timber rights; "Coal, Surface and Timber" indicates private land with timber rights; "Surface and Timber" indicates private land without the coal rights
Timing of Mine-Related Disturbances [Historical (H), Current (C), Near Future (NF), Far Future (FF) or Not Expected (N) disturbances]
FRO: Historical 1971-2012, Current active 2013-2016, Near Future 2017-2021, Far future 2022-2072.GHO: Historical 1978-2012, Current active 2013-2016, Near Future 2017-2021, Far future 2022-2070.LCO Phase 2: Current active 2014-2016, Near Future 2017-2021, Far Future 2022-2057. LCO: Historical 1980-2012, Current active 2013-2016, Near Future 2017 - 2021, Far Future 2022-2032. EVO: Historical 1969-2012; Current Active 2013-2016, Near Future 2017-2021, Far Future 2022-2045. CMO: Historical 1943-2012, Current Active 2013-2016, Near Future 2017
Total footprint area currently disturbed (km, %)
Total disturbance area within the catchment that has not yet been reclaimed (reclaimed lands represents a small amount of the total disturbance footprint in most cases, as shown in Table 2.1 of the TEP Study Design).
Reclaimed Land (km, %)Provincial CWB dataset, Orthophoto
Imagery/Teck's Reclaimed Land layerLand that has been successfully revegetated for one yea
PitsProvincial CWB dataset, Teck's Development layer (1:20,000)
Area where mining has occurred, includes highwalls and footwalls. Indicates if pit(s) exist(s) within the catchment area of the tributary.
Waste rock storageProvincial CWB dataset, Teck's Development layer (1:20,000)
Dump or spoil, area where waste rock is stored. Indicates if waste rock exists within the catchment area of the tributary.
Rock drainsProvincial CWB dataset, Teck’s Water
Management Lines layer (1:20,000)Indicates if rock drains currently exist within the perennial wetted length of a tributary. Areas where a channel flows through waste rock and has a significant influence on the channel can be natural or man made.
Channel re-alignment or diversions
Provincial CWB dataset, Teck’s Water Management Lines layer (1:20,000)
Indicates if channels have been realigned or diverted within the catchment area of the tributary.
Settling ponds/Catch basinsProvincial CWB dataset, Teck’s Water
Management layer (1:20,000)Body of standing water due to man-made features; used to settle sediments; includes tailings ponds. Total count of ponds that exist within the catchment area of the tributary.
Provincial CWB dataset, Elk Valley Cumulative Effects Management
Framework Equivalent Clearcut Area layer
Area of forestry disturbances within catchment area of the tributary (includes data back to 1956).
Road density per km2 Influences peak and low flow and water temperature, coarse and fine sediment delivery to stream and access for anglers.
Stream crossings per kmStream crossings (culverts, bridges) contribute to fine sediment in streams by exposing soils and acting as points of entry for sediment transport along ditches, as well as acts as barriers to fish and other aquatic organisms.
Roads within 100 m of a stream Responsible for the majority of fine sediment delivery that affects water quality, depending on soil texture, road construction and maintenance standards and precipitation.
% roads on slopes > 60%Roads on unstable, steep terrain increases the erosion potential through altered surface drainage, diversion of subsurface flow to the surface and reducing structural support of soil provided by roots and other vegetation.
Provincial CWB dataset, Teck's Development layer (Scale assumed
1:20,000)Explanation of known current, near future or far future mining disturbances.
Provincial CWB dataset, Teck Internal Sources; EVWQP; Fish Habitat
Management PlanningMitigation or offsetting related to water and fish management
Additional Planned Future Mining Disturbances
Provincial CWB dataset, Elk Valley Cumulative Effects Management Framework road density layers
Planned Mitigation/Fish Habitat Offsetting
Information Type
Tributary Name
Total Catchment Area as of September 2015
Teck Ownership Rights: % of Catchment Area and Type (Coal, Surface, Timber)
Min
e-R
ela
ted
Dis
turb
an
ces
in A
rea
fro
m P
rovi
nci
al C
WB
da
tase
t (1
98
0s
plu
s u
pd
ate
s)
Forestry Disturbances1 in Catchment
Total Catchment Area from the Provincial CWB dataset (km2) (1980s plus updates)
% Change in Catchment Area
Ro
ad
Dis
turb
an
ces
in
Ca
tch
me
nt
Provincial CWB dataset, Current disturbance: Teck’s dissolved
disturbance layer (Scale 1:20,000)Future development: Teck’s
Development layer (Scale 1:20,000)
12
Teck Tributary Evaluation Program Data Report
Minnow Environmental Inc. 13 June 2016 Project 2563
CWB dataset is provided in the first matrix and is used for all calculations (i.e., ownership
and mine-related, forestry, and road disturbances). The total catchment area from the
Provincial CWB dataset is also delineated on the orthophoto figures of tributaries
(Appendices A-E). The catchment area for each tributary is based on the Provincial CWB
dataset and reflects predominantly 1980s conditions and potentially subsequent
(unknown) updates by the province.
The total current catchment area (km2 and % change from the Province’s CWB catchment
area) reflects the current watershed boundary of each tributary as of September 2015.
The total current catchment area considers the current topography in areas that have
been affected by mining. The total current catchment areas were defined using
July/August 2014 LiDAR (scale 1:500) and manually updated, if appropriate, based on
mining activities and internal knowledge on water management. The total current
catchment area is also delineated on the orthophoto figures (Appendices A to E).
2.3.1 Teck Ownership Rights
Teck has varying types of ownership rights among the tributary catchment areas, which
are as follows: "Coal" indicates crown land for which Teck has coal leases/licences; "Coal
and Surface" indicates private land without the timber rights; "Coal, Surface and Timber"
indicates private land with timber rights; "Surface and Timber" indicates private land
without the coal rights. The reference datasets are the provincial parcel fabric layer
provided by the BC government and Teck's parcel fabric layer, and were calculated based
on the provincial CWB dataset.
2.3.2 Mine-Related and Other Disturbances in Catchment
The timing of mine-related disturbances in each catchment (i.e., historical, current, near
future, far future) or, if not expected, were identified by appropriate Teck personnel and
are current to the time of reporting. Table 2.2 identifies the years that define historical,
current, near future, and far future for each operation.
The total footprint area of mine disturbance area (km2 and %) within the CWB catchment
area has been calculated from Teck’s dissolved disturbance layer (current to time of
reporting) and Provincial CWB catchment boundary reference dataset. The total mine
footprint area excludes reclaimed lands, which are presented separately in the matrices.
Reclaimed lands are defined as land that has been successfully revegetated for one year.
Teck’s Development Layer reference dataset (1:20,000) provided information on pits,
waste rock storage, rock drains, channel re-alignment/diversions and settling ponds/catch
Teck Tributary Evaluation Program Data Report
Minnow Environmental Inc. 14 June 2016 Project 2563
basins at the time of reporting. These mine-related disturbances are defined in Table 2.2.
The first matrix in each of Sections 3.0 to 7.0 of this report lists a “yes” or “no” to indicate if
the disturbance corresponding to the column header is present within the provincial CWB
catchment (or the number of such disturbances, such as settling ponds, where
appropriate).
The forestry disturbance area (km2) in the CWB catchment area were taken from the
Equivalent Clearcut Area (ECA) Data Layer which includes include any forestry
disturbance within the catchment area of the tributary dating back to 1955 and current to
2015. The data were divided into two timeframes (1955 to 2010 and 2011 to 2015) to
distinguish recent from longer-term disturbances. The ECA provincial dataset is from the
Province’s Cumulative Environmental Monitoring Framework (CEMF) dataset and
includes the area that has been harvested, cleared or burned.
The road disturbances (road density per km2, stream crossings per km, roads within
100 m of a stream, % roads on slopes greater than 60%) are taken from the Province’s
CEMF dataset and calculated based on the provincial CWB catchment area. Calculations
did not include data (i.e., roads and the catchment area) within mine disturbance areas.
2.3.3 Additional Planned Mining Disturbances and Mitigation/Offsetting
The matrices in Sections 3.0 to 7.0 of this report identify any additional near and far future
mining-related disturbances known at the time of reporting. The planned mitigation
describes the water quality and quantity and fish management strategies that are
expected to occur as a result of planned mine developments. This information is provided
by Teck and includes information on future mining development as it impacts the affected
tributaries. Management strategies include fish habitat offsetting, fish exclusion works,
fish salvage activities, water pumping activities, water redirection and calcite
management.
2.4 Environmental Quality Descriptors
The second data matrix presented for each MU in Sections 3.0 to 7.0 of this report
summarizes information about the environmental quality within each tributary. A
description of the information included in the matrix for each MU is presented in the
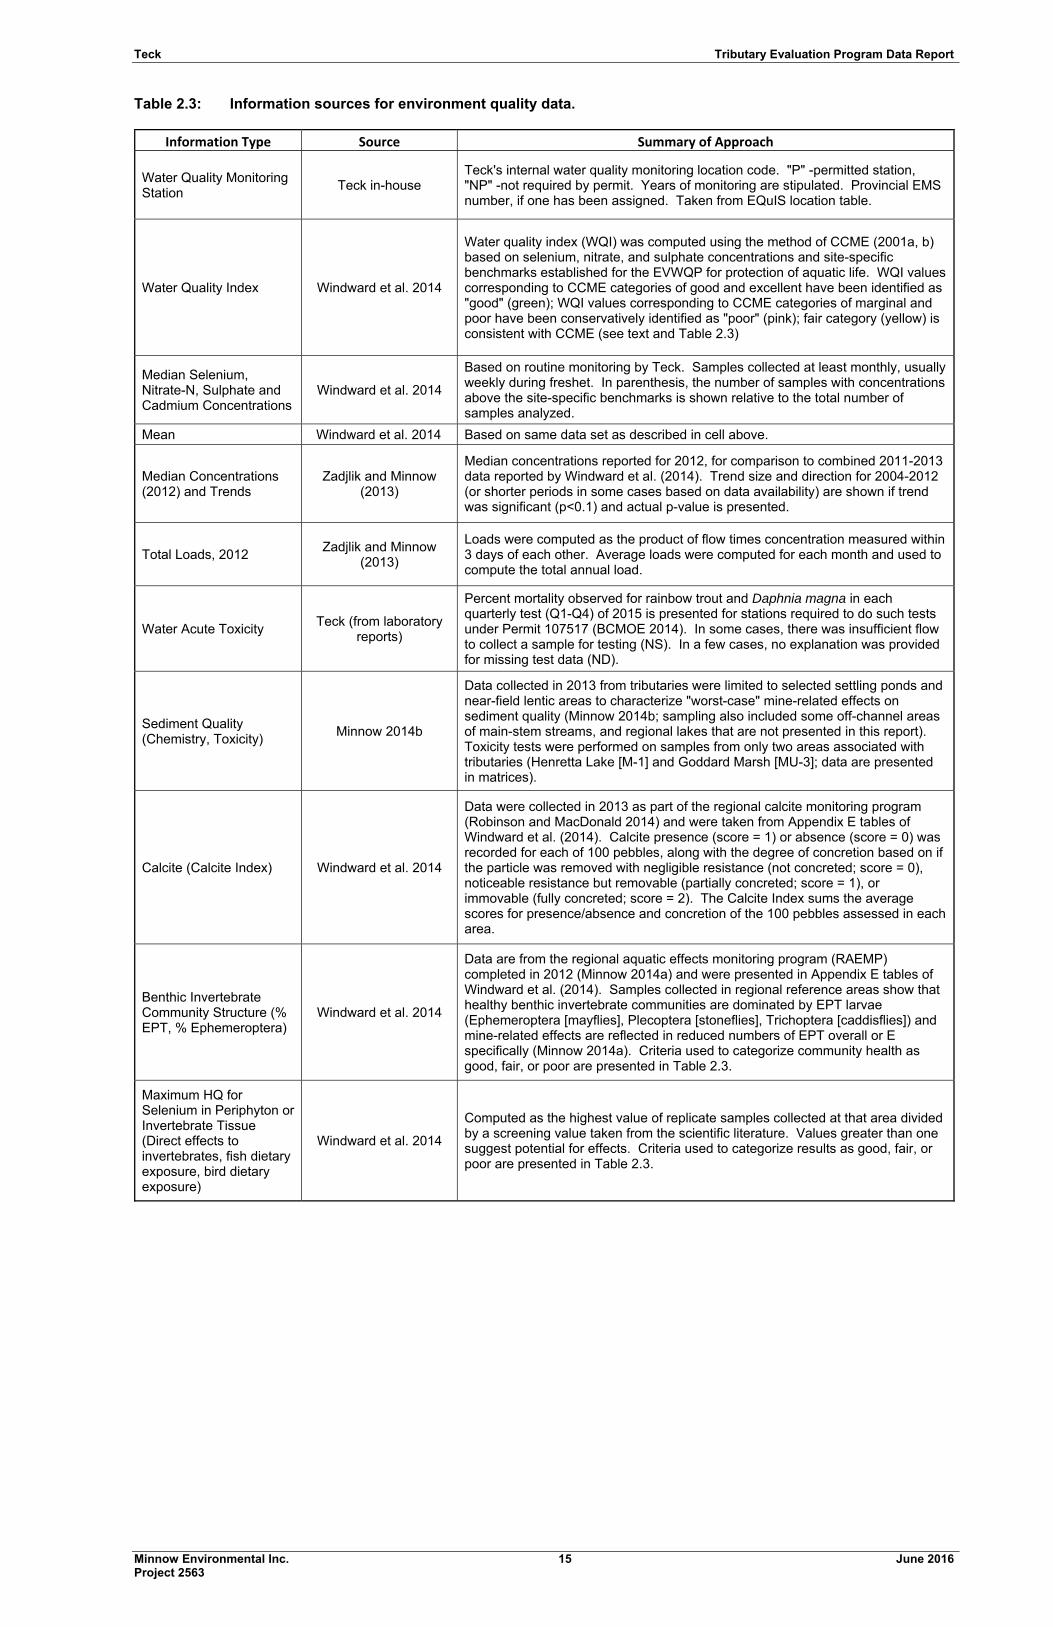
subsections below. Table 2.3 provides a brief summary of the same information for quick
reference.
Teck Tributary Evaluation Program Data Report
Minnow Environmental Inc. 15 June 2016 Project 2563
Table 2.3: Information sources for environment quality data.
Information Type Source Summary of Approach
Water Quality Monitoring Station
Teck in-house Teck's internal water quality monitoring location code. "P" -permitted station, "NP" -not required by permit. Years of monitoring are stipulated. Provincial EMS number, if one has been assigned. Taken from EQuIS location table.
Water Quality Index Windward et al. 2014
Water quality index (WQI) was computed using the method of CCME (2001a, b) based on selenium, nitrate, and sulphate concentrations and site-specific benchmarks established for the EVWQP for protection of aquatic life. WQI values corresponding to CCME categories of good and excellent have been identified as "good" (green); WQI values corresponding to CCME categories of marginal and poor have been conservatively identified as "poor" (pink); fair category (yellow) is consistent with CCME (see text and Table 2.3)
Median Selenium, Nitrate-N, Sulphate and Cadmium Concentrations
Windward et al. 2014
Based on routine monitoring by Teck. Samples collected at least monthly, usually weekly during freshet. In parenthesis, the number of samples with concentrations above the site-specific benchmarks is shown relative to the total number of samples analyzed.
Mean Windward et al. 2014 Based on same data set as described in cell above.
Median Concentrations (2012) and Trends
Zadjlik and Minnow (2013)
Median concentrations reported for 2012, for comparison to combined 2011-2013 data reported by Windward et al. (2014). Trend size and direction for 2004-2012 (or shorter periods in some cases based on data availability) are shown if trend was significant (p<0.1) and actual p-value is presented.
Total Loads, 2012 Zadjlik and Minnow
(2013)
Loads were computed as the product of flow times concentration measured within 3 days of each other. Average loads were computed for each month and used to compute the total annual load.
Water Acute Toxicity Teck (from laboratory
reports)
Percent mortality observed for rainbow trout and Daphnia magna in each quarterly test (Q1-Q4) of 2015 is presented for stations required to do such tests under Permit 107517 (BCMOE 2014). In some cases, there was insufficient flow to collect a sample for testing (NS). In a few cases, no explanation was provided for missing test data (ND).
Sediment Quality (Chemistry, Toxicity)
Minnow 2014b
Data collected in 2013 from tributaries were limited to selected settling ponds and near-field lentic areas to characterize "worst-case" mine-related effects on sediment quality (Minnow 2014b; sampling also included some off-channel areas of main-stem streams, and regional lakes that are not presented in this report). Toxicity tests were performed on samples from only two areas associated with tributaries (Henretta Lake [M-1] and Goddard Marsh [MU-3]; data are presented in matrices).
Calcite (Calcite Index) Windward et al. 2014
Data were collected in 2013 as part of the regional calcite monitoring program (Robinson and MacDonald 2014) and were taken from Appendix E tables of Windward et al. (2014). Calcite presence (score = 1) or absence (score = 0) was recorded for each of 100 pebbles, along with the degree of concretion based on if the particle was removed with negligible resistance (not concreted; score = 0), noticeable resistance but removable (partially concreted; score = 1), or immovable (fully concreted; score = 2). The Calcite Index sums the average scores for presence/absence and concretion of the 100 pebbles assessed in each area.
Benthic Invertebrate Community Structure (% EPT, % Ephemeroptera)
Windward et al. 2014
Data are from the regional aquatic effects monitoring program (RAEMP) completed in 2012 (Minnow 2014a) and were presented in Appendix E tables of Windward et al. (2014). Samples collected in regional reference areas show that healthy benthic invertebrate communities are dominated by EPT larvae (Ephemeroptera [mayflies], Plecoptera [stoneflies], Trichoptera [caddisflies]) and mine-related effects are reflected in reduced numbers of EPT overall or E specifically (Minnow 2014a). Criteria used to categorize community health as good, fair, or poor are presented in Table 2.3.
Maximum HQ for Selenium in Periphyton or Invertebrate Tissue (Direct effects to invertebrates, fish dietary exposure, bird dietary exposure)
Windward et al. 2014
Computed as the highest value of replicate samples collected at that area divided by a screening value taken from the scientific literature. Values greater than one suggest potential for effects. Criteria used to categorize results as good, fair, or poor are presented in Table 2.3.
Teck Tributary Evaluation Program Data Report
Minnow Environmental Inc. 16 June 2016 Project 2563
Surface water quality, sediment quality, calcite index, and biological data were taken from
existing reports and generally reflect sampling completed in 2013 or earlier. Additional
data were collected in 2014 and 2015 as part of the regular schedule of the regional and
local aquatic effects monitoring programs (RAEMP, LAEMPs) and various supporting
studies, but were not consistently available among the environmental quality indicators at
the time of reporting. It is desirable for the data presented in the matrices to be temporally
comparable among data types, so the newer data were not incorporated into the matrices
of this version of the data report. It is considered unlikely that conditions have changed
sufficiently among areas since those data were collected to affect relative rankings of
tributaries during the evaluation process.
2.4.1 Water Quality Monitoring Station
For many tributaries, water quality is monitored by Teck at a single station near the mouth,
and reflects the cumulative upstream mining influences. Therefore, the matrices
presenting environmental quality data usually represent conditions at this lower tributary
location. Some (typically longer, mine-disturbed) tributaries are monitored at more than
one location; and, if associated data were reported by Windward et al. (2014), they are
provided for more than one area along the tributary. The matrices present Teck’s internal
code for identifying water quality stations, followed by a “P” or “NP” to indicate if the
station is monitored as permit requirement or is a monitoring station that is not required by
permit. The historical period of monitoring is also listed, followed by the provincial
Environmental Monitoring System (EMS) number, if one has been assigned.
2.4.2 Water Quality Index
The Canadian Water Quality Index (WQI) results were taken from Appendix D of
Windward et al. (2014), with additional discussion provided in Appendix E of the same
document. The WQI was developed by the Canadian Council of Ministers of the
Environment (CCME 2001a, b) as a tool for simplifying the reporting of water quality data
and for providing a broad overview of environmental performance. It was based on an
approach used in British Columbia (Rocchini and Swain 1995) and is calculated using
three factors:
Scope – This factor represents the number of that exceed the applicable
guidelines.
Frequency – This factor represents the frequency with which (i.e., number of
times) variables are greater than the applicable guidelines.
Teck Tributary Evaluation Program Data Report
Minnow Environmental Inc. 17 June 2016 Project 2563
Amplitude – This factor represents the magnitude by which guidelines are
exceeded.
Details regarding the calculation of these factors and the calculation of the overall index
value are provided in the technical report and user’s manual (CCME 2001a,b).
Windward et al. (2014) used BCMOE water quality guidelines to compute the WQI, except
in the cases of selenium, nitrate, and sulphate (for which site-specific benchmarks were
used; see Section 2.4.3), and silver (for which the Canadian Council of Ministers of the
Environment [CCME] guideline was used). Site-specific benchmarks for selenium, nitrate,
and sulphate were the Level 1 (10% effect) benchmarks derived for the EVWQP (Teck
2014).
WQIs were computed by Windward et al. (2014) for different groups of constituents.
Generally, it was found that inclusion of variables that rarely exceed guidelines resulted in
a higher WQI than when only those exceeding guidelines more frequently were included.
Based on these findings, Windward et al. (2014) considered WQI results based on nitrate,
nitrite, sulphate, cobalt, selenium, and uranium to be a conservative approximation of
overall water quality at each station. This decision was consistent with WQI guidance
(CCME 2001b, a), which recommends that only relevant parameters should be included in
the evaluation. The same values are presented in the information matrices in Sections
3.0 to 7.0 of this report.
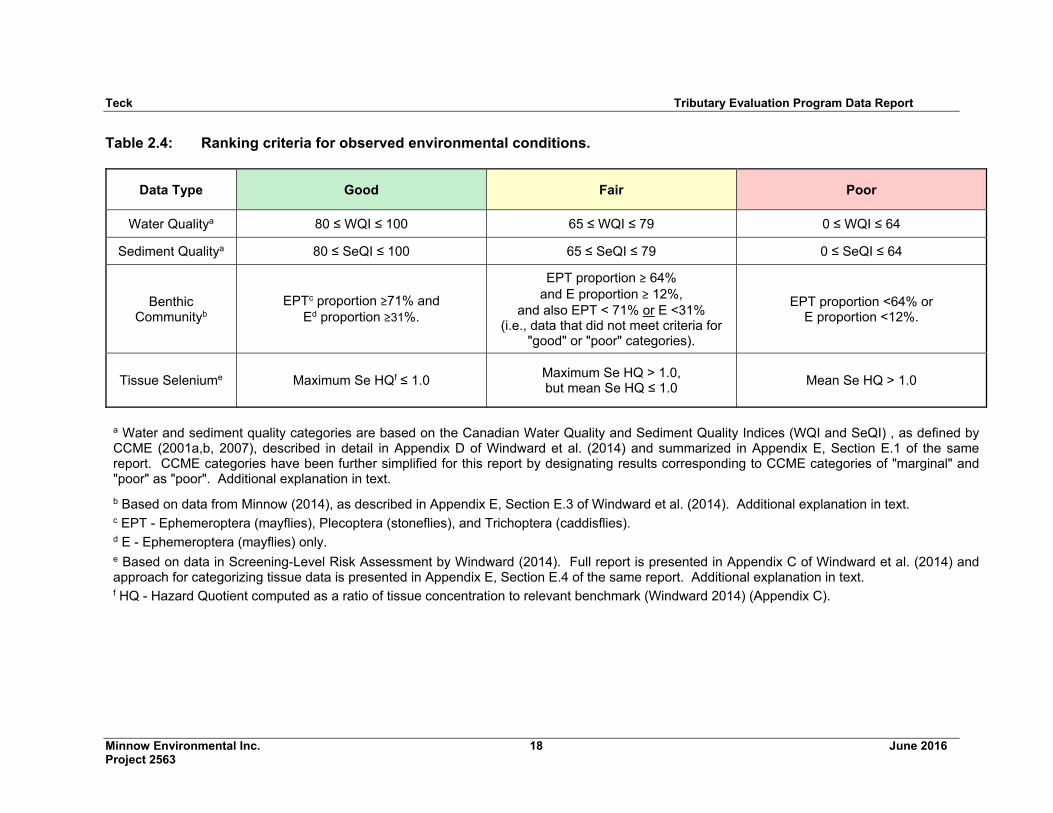
CCME (2001) uses WQI results to interpret overall water quality according to one of the
following five categories: excellent, good, marginal, fair, or poor. A simplified set of
categories was used for this report in which the “good” and “excellent” categories of
CCME were combined into a category called “good”, and CCME “marginal” and “poor”
categories were combined into a single category called “poor” (Table 2.4). This was done
to be consistent with the other data sets that were classified according to the same three
categories of good, fair, or poor (Table 2.4).
2.4.3 Concentrations of Selenium, Nitrate, Sulphate, Cadmium
Nitrate, selenium, sulphate, and cadmium are water quality constituents identified as
being of concern with respect to coal mining in the Elk Valley (Teck 2014). Median and
mean3 concentrations of these substances were taken from Windward et al. (2014) based
3 Standard deviation was not reported by Windward et al. (2014).
Teck Tributary Evaluation Program Data Report
Minnow Environmental Inc. 18 June 2016 Project 2563
Table 2.4: Ranking criteria for observed environmental conditions.
Data Type Good Fair Poor
Water Qualitya 80 ≤ WQI ≤ 100 65 ≤ WQI ≤ 79 0 ≤ WQI ≤ 64
Sediment Qualitya 80 ≤ SeQI ≤ 100 65 ≤ SeQI ≤ 79 0 ≤ SeQI ≤ 64
Benthic Communityb
EPTc proportion ≥71% and Ed proportion ≥31%.
EPT proportion ≥ 64% and E proportion ≥ 12%,
and also EPT < 71% or E <31% (i.e., data that did not meet criteria for
"good" or "poor" categories).
EPT proportion <64% or E proportion <12%.
Tissue Seleniume Maximum Se HQf ≤ 1.0 Maximum Se HQ > 1.0, but mean Se HQ ≤ 1.0
Mean Se HQ > 1.0
a Water and sediment quality categories are based on the Canadian Water Quality and Sediment Quality Indices (WQI and SeQI) , as defined by CCME (2001a,b, 2007), described in detail in Appendix D of Windward et al. (2014) and summarized in Appendix E, Section E.1 of the same report. CCME categories have been further simplified for this report by designating results corresponding to CCME categories of "marginal" and "poor" as "poor". Additional explanation in text.
b Based on data from Minnow (2014), as described in Appendix E, Section E.3 of Windward et al. (2014). Additional explanation in text. c EPT - Ephemeroptera (mayflies), Plecoptera (stoneflies), and Trichoptera (caddisflies). d E - Ephemeroptera (mayflies) only. e Based on data in Screening-Level Risk Assessment by Windward (2014). Full report is presented in Appendix C of Windward et al. (2014) and approach for categorizing tissue data is presented in Appendix E, Section E.4 of the same report. Additional explanation in text. f HQ - Hazard Quotient computed as a ratio of tissue concentration to relevant benchmark (Windward 2014) (Appendix C).
Teck Tributary Evaluation Program Data Report
Minnow Environmental Inc. 19 June 2016 Project 2563
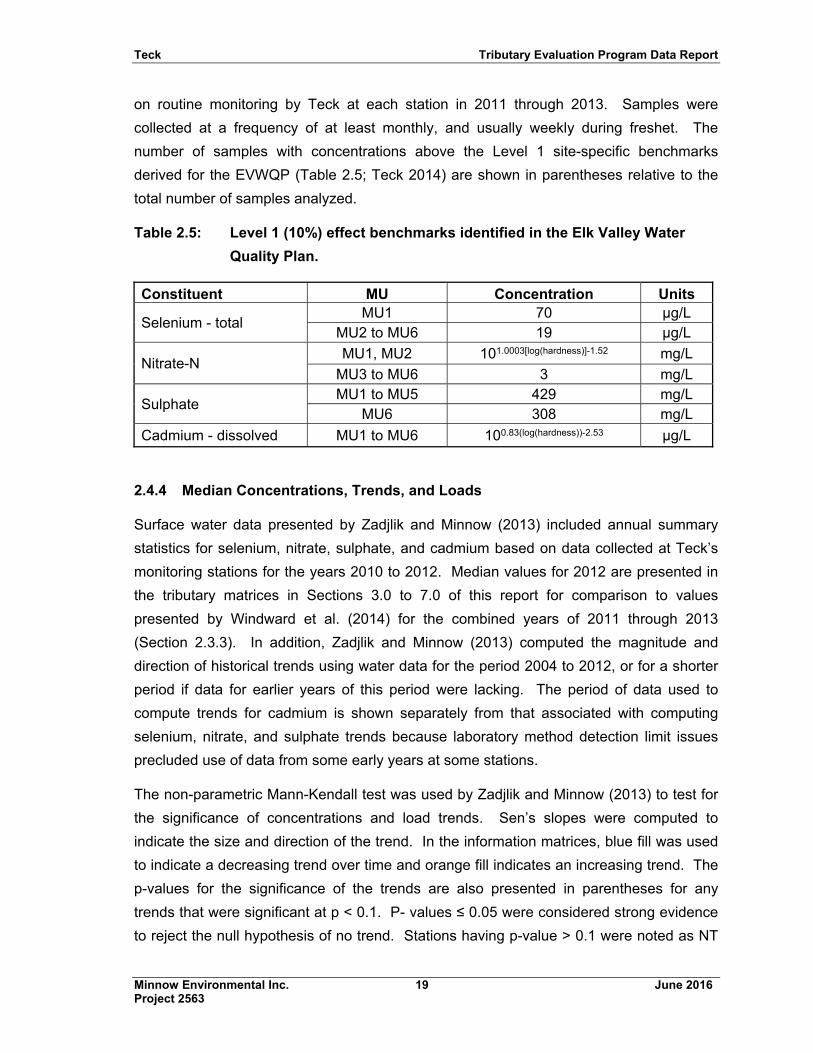
on routine monitoring by Teck at each station in 2011 through 2013. Samples were
collected at a frequency of at least monthly, and usually weekly during freshet. The
number of samples with concentrations above the Level 1 site-specific benchmarks
derived for the EVWQP (Table 2.5; Teck 2014) are shown in parentheses relative to the
total number of samples analyzed.
Table 2.5: Level 1 (10%) effect benchmarks identified in the Elk Valley Water
Quality Plan.
Constituent MU Concentration Units
Selenium - total MU1 70 µg/L
MU2 to MU6 19 µg/L
Nitrate-N MU1, MU2 101.0003[log(hardness)]-1.52 mg/L
MU3 to MU6 3 mg/L
Sulphate MU1 to MU5 429 mg/L
MU6 308 mg/L
Cadmium - dissolved MU1 to MU6 100.83(log(hardness))-2.53 µg/L
2.4.4 Median Concentrations, Trends, and Loads
Surface water data presented by Zadjlik and Minnow (2013) included annual summary
statistics for selenium, nitrate, sulphate, and cadmium based on data collected at Teck’s
monitoring stations for the years 2010 to 2012. Median values for 2012 are presented in
the tributary matrices in Sections 3.0 to 7.0 of this report for comparison to values
presented by Windward et al. (2014) for the combined years of 2011 through 2013
(Section 2.3.3). In addition, Zadjlik and Minnow (2013) computed the magnitude and
direction of historical trends using water data for the period 2004 to 2012, or for a shorter
period if data for earlier years of this period were lacking. The period of data used to
compute trends for cadmium is shown separately from that associated with computing
selenium, nitrate, and sulphate trends because laboratory method detection limit issues
precluded use of data from some early years at some stations.
The non-parametric Mann-Kendall test was used by Zadjlik and Minnow (2013) to test for
the significance of concentrations and load trends. Sen’s slopes were computed to
indicate the size and direction of the trend. In the information matrices, blue fill was used
to indicate a decreasing trend over time and orange fill indicates an increasing trend. The
p-values for the significance of the trends are also presented in parentheses for any
trends that were significant at p < 0.1. P- values ≤ 0.05 were considered strong evidence
to reject the null hypothesis of no trend. Stations having p-value > 0.1 were noted as NT
Teck Tributary Evaluation Program Data Report
Minnow Environmental Inc. 20 June 2016 Project 2563
(no trend). Based on a high proportion of cadmium results being reported near or less
than the detection limit, the indicated trends for cadmium should be interpreted with
caution.
Decreasing concentration trends were identified by Zadjlik and Minnow (2013) at many
non- or minimally-exposed monitoring stations, which are suspected to be the result of
improvements in analytical methods and detection limits over time, rather than actual
water quality trends. Therefore, decreasing trends are not specifically discussed in
Sections 3.0 to 7.0. However, those same patterns (of decreasing trends where mine
influence is absent or negligible) lends validity to the increasing trends reported by Zadjlik
and Minnow (2013); those increasing trends are mentioned in the text, where applicable.
Loads were computed as the product of synoptically-collected4 flow and concentration
measurements. Values were averaged within months before computing annual loads.
Total annual loads were computed using the composite trapezoid rule applied to within-
year Julian days and daily loads to estimate the area under the load/time curve.
Estimation at the boundaries (Julian day = {0,365} extrapolated the earliest and latest
within-year loads available to the boundaries (i.e., to estimate load contributions for
months lacking data). Load estimates for stations having at least nine months of within
year load data were considered to yield reasonably good estimates of annual total loads
(bold load values in matrices), but load estimates based on less than nine months of data
(non-bold load values in matrices) should be interpreted with caution. Loads for cadmium
were not reported in the matrices due to large uncertainty of results owing to the high
proportion of concentrations reported at less than the detection limit.
To provide context, constituent loads for each station were also expressed in the
information matrices in Sections 3.0 to 7.0 of this report as a percentage of the sum of the
total loads from all monitored tributaries to the Fording River, Michel Creek, or the Elk
River in 2012. Load data were not available for most tributaries that have not been
previously influenced by mining, as well as for some mine-influenced tributaries; however,
contributions from such tributaries are believed to be small. Nevertheless, the
percentages presented in the matrices should be considered approximations of the
relative (not absolute) contribution of mine-influenced tributaries to main stem loads.
4 If a flow measurement was not available for the same day as a chemical measurement, a flow measured up to 3 days before or after the chemical measurement was used (a median flow was used if more than one flow measurement was available).
Teck Tributary Evaluation Program Data Report
Minnow Environmental Inc. 21 June 2016 Project 2563
2.4.5 Surface Water Acute Toxicity
Percent mortality of rainbow trout and Daphnia magna observed in each quarterly test
(Q1-Q4, 2015) is presented for stations having acute toxicity test requirements in
Permit 107517. There were some instances when there was insufficient flow to collect a
sample for testing (reported as NS: No Sample). In a few other cases, no explanation
was provided for missing test data (reported as ND: No Data). Not applicable (NA) was
shown in the matrices in Sections 3.0 to 7.0 of this report for stations that do not have a
permit requirement for surface water acute toxicity testing.
2.4.6 Sediment Quality
Sediment samples were collected from a total of 26 depositional areas in the Elk River
watershed in early August 2013, including six mine settling ponds, 12 receiving
environment areas (e.g., oxbows, lakes or wetlands), and eight reference areas (e.g.,
oxbows, lakes or wetlands; Minnow 2014b as summarized by Windward et al. 2014). All
sediment samples were analyzed for PAHs, particle size, moisture and TOC (whole
sediments) and metals (in both the <1 mm and <0.063 mm size fractions). The number of
samples having metals or PAH concentrations above the high sediment quality guidelines
is shown in the matrices in Sections 3.0 to 7.0 of this report for samples associated with
tributaries. However, data relevant to tributaries are sparse due to lack of depositional
habitat in most tributaries (other than constructed settling ponds). Some sediment data
were collected in 2011 and reported by Windward et al. (2014) but results were not
reported in the matrices in Sections 3.0 to 7.0 in this report based on lack of clarity
regarding sampling methods and spatial representativeness of samples.
Sediment samples were also collected in 2013 from one settling pond, three receiving
environment areas and two reference areas for toxicity testing (using C. riparius and H.
azteca); data relevant to tributaries are available for only Henretta Lake (MU1) and
Goddard Marsh (MU3; Minnow 2014b). Sediment chemistry and toxicity were also
evaluated at multiple areas throughout the watershed in 2015 based on a study design
developed in consultation with BCMOE and KNC (Minnow et al. 2015) and preliminary
results were reported to the EMC in early 2016. However, sampling focused again on
depositional areas in the watershed that were mainly side channels of the Fording River,
Michel Creek, or Elk River. Data will be available in the RAEMP report, scheduled for
completion by May 2017, but Henretta Lake (MU1) Goddard Marsh, and Otto Creek
(MU3) are the only areas relevant to tributaries where sediment data were collected
(those data are not currently included in the matrices).
Teck Tributary Evaluation Program Data Report
Minnow Environmental Inc. 22 June 2016 Project 2563
2.4.7 Calcite
The data presented in the matrices in Sections 3.0 to 7.0 of this report for calcite were
collected in 2013 as part of the regional calcite monitoring program (Robinson and
MacDonald 2014) and incorporated in the Appendix E tables of Windward et al. (2014).
The same locations were sampled in 2014 and 2015 (Robinson and MacDonald 2015,
2016), but the data were not incorporated into the matrices because they would represent
a different time period than for the other environmental quality information that was
available (i.e., not directly comparable).
For the regional monitoring program, calcite deposition is measured at one to three
100 m-long areas in numerous reaches defined throughout the watershed, depending on
the size of the reach (Robinson and MacDonald 2014). At each 100-m area showing
evidence of calcite5, a modified Wolman (1954) pebble count procedure is applied
involving random selection and measurement of 100 substrate particles throughout each
100-m-long area (and distributed in proportion to the habitat types present6). The size of
each particle is measured (along the intermediate axis; i.e., perpendicular to the longest
axis) and the presence (score = 1) or absence (score = 0) of calcite is recorded. In
addition, the degree of concretion is assessed by determining if the particle is removed
with negligible resistance (not concreted; score = 0), noticeable resistance but removable
(partially concreted; score = 1), or immovable (fully concreted; score = 2).
The results for each 100-m-long area are then expressed as a Calcite Index (CI) based on
the following equation:
Where:
5 The pebble count is not required in areas with no visible calcite, which are simply assigned a calcite index score of 0.0. 6 Riffle, cascade, and pool habitats.
𝐶𝐼 𝐶𝑎𝑙𝑐𝑖𝑡𝑒 𝐼𝑛𝑑𝑒𝑥
𝐶𝐼 𝐶𝑎𝑙𝑐𝑖𝑡𝑒 𝑃𝑟𝑒𝑠𝑒𝑛𝑐𝑒 𝑆𝑐𝑜𝑟𝑒𝑁𝑢𝑚𝑏𝑒𝑟 𝑜𝑓 𝑝𝑒𝑏𝑏𝑙𝑒𝑠 𝑤𝑖𝑡ℎ 𝑐𝑎𝑙𝑐𝑖𝑡𝑒
𝑁𝑢𝑚𝑏𝑒𝑟 𝑜𝑓 𝑝𝑒𝑏𝑏𝑙𝑒𝑠 𝑐𝑜𝑢𝑛𝑡𝑒𝑑
CIc 𝐶𝑎𝑙𝑐𝑖𝑡𝑒 𝐶𝑜𝑛𝑐𝑟𝑒𝑡𝑖𝑜𝑛 𝑆𝑐𝑜𝑟𝑒 𝑆𝑢𝑚 𝑜𝑓 𝑝𝑒𝑏𝑏𝑙𝑒 𝑐𝑜𝑛𝑐𝑟𝑒𝑡𝑖𝑜𝑛 𝑠𝑐𝑜𝑟𝑒
𝑁𝑢𝑚𝑏𝑒𝑟 𝑜𝑓 𝑝𝑒𝑏𝑏𝑙𝑒𝑠 𝑐𝑜𝑢𝑛𝑡𝑒𝑑
Teck Tributary Evaluation Program Data Report
Minnow Environmental Inc. 23 June 2016 Project 2563
For reaches in which multiple 100-m-long areas are sampled, an average CI is computed
for the reach and used to monitor changes over time (Robinson and MacDonald 2014,
2015). Results are presented in the matrices in Sections 3.0 to 7.0 of this report for the
calcite monitoring area most closely corresponding to the locations of water and biological
sampling.
2.4.8 Benthic Invertebrate Community Structure
The data presented in matrices are from the regional aquatic effects monitoring program
(RAEMP) completed in 2012 (Minnow 2014a) and were also reported in the Appendix E
tables of Windward et al. (2014). Community samples were collected in September 2012
from 36 reference and 56 mine-exposed lotic areas for assessment of potential mine-
related effects on community composition. Reference areas were selected to represent a
range of natural habitat characteristics (such as elevation, stream size, catchment area,
and catchment gradient) corresponding to those for mine-exposed areas. Samples
collected in regional reference areas showed that healthy benthic invertebrate
communities are dominated by EPT larvae (Ephemeroptera [mayflies], Plecoptera
[stoneflies], Trichoptera [caddisflies]) and mine-related effects tend to be most strongly
reflected in reduced proportions of EPT overall, or Ephemeroptera (E) specifically
(Minnow 2014a).
Criteria used to categorize community health as good, fair, or poor are presented in
Table 2.4 based on evaluation of the data collected in 2012. All areas identified as
affected or potentially affected by mining (based on detailed statistical analyses of
differences between reference and mine-exposed communities) had EPT and/or E
proportions that were less than the 5th percentile of all reference areas combined.
Conversely, all but one area having EPT and E values equal to or greater than the
reference 5th percentile were judged to be within reference condition (i.e., within the
ranges exhibited by most reference areas). Therefore, benthic invertebrate communities
were categorized as “good” if both EPT and E proportions were equal to or greater than
the corresponding reference 5th percentiles (71% and 30%, respectively). Communities
were judged to be “poor” if either EPT or E proportions (or both) were less than the
minimum values observed among reference areas (64% and 12% respectively).
Communities at all other areas were classified as “fair” (i.e., either EPT or E proportion [or
both] was [were] below the reference 5th percentile but above the reference minimum). All
areas were re-sampled as part of 2015 RAEMP cycle, for which an interpretive report is
scheduled to be completed by May 2017 at which time newer data for tributaries will be
available. .
Teck Tributary Evaluation Program Data Report
Minnow Environmental Inc. 24 June 2016 Project 2563
2.4.9 Selenium in Periphyton or Invertebrate Tissue
Screening quotients (SQs)7 were calculated to estimate potential effects to invertebrates
and to fish and birds that consume invertebrates (i.e., dietary exposure). Values were
from Windward (2014), which evaluated the potential for ecological effects associated with
tissue contaminant levels measured in the Elk Valley. The Windward (2014) report was
included as Appendix C in Windward et al. (2014); the tissue selenium results presented
therein were also summarized in Appendix E of Windward et al. (2014) and in the
matrices in Sections 3.0 to 7.0 of this report.
The following equation was used to calculate the screening quotient for each receptor:
SQ = Observed tissue selenium concentration SV
Where SV = screening value, taken from the scientific literature
The maximum SQ is presented in the matrices, which represents the highest value of
replicate samples collected at an area. When the maximum SQ was greater than 1
(suggesting potential for effects), the mean SQ was also reported in parentheses. SQs
presented in matrices are based on benthic invertebrates, which are relatively immobile,
which makes the data suitable as an indicator of site-specific conditions.
SQs based on selenium concentrations in fish tissues were also computed by Windward
(2014) to indicate potential selenium effects to fish themselves and to wildlife consumers,
but the data are not presented in matrices because the mobility of fish makes the data
unreliable for indicating risks associated with the specific location of fish capture. Criteria
used to categorize results as good, fair, or poor are presented in Table 2.4 and are
consistent with those used by Windward et al. (2014).
7 The documents cited here presented Hazard Quotients (HQ) that are consistent with a generic tissue-based screening-level risk assessment approach. The terminology in the original document (Windward 2014) was subsequently updated to avoid confusion among some external reviewers that the study was intended to fulfil the scope of a Screening Level Risk Assessment as defined by BC’s Contaminated Sites Regulation. Instead, the study was completed to: (1) identify trace elements in aquatic organism tissues that may pose an unacceptable risk to consumers via diet-borne toxicity (and direct tissue-based toxicity for selenium and mercury), and (2) recommend any trace elements that should be considered in future tissue monitoring. The term “hazard quotient”, reflected in the original documents cited above, was changed to “screening quotient” in the updated version of the Windward (2014) report, but the data and overall approach did not change. So the newer term (SQ) has been used in this report.
Teck Tributary Evaluation Program Data Report
Minnow Environmental Inc. 25 June 2016 Project 2563
2.5 Fish and Aquatic Habitat Information
The third matrix presented for each MU in Sections 3.0 to 7.0 of this report contains
information about the fish and aquatic habitat of each tributary. A description of the
information included in this matrix for each MU is presented in the subsections below.
Table 2.6 provides a brief summary of the same information for quick reference.
2.5.1 Annual Average Flow
Average annual (2013) daily flows were presented in Table 3-8 of Golder (2014b) in units
of m3/day, which were converted to m3/s for presentation in the matrices of this report.
Average flow for Grace Creek was taken from Teck (2011a). For tributaries not included
in Golder (2014b) or Teck (2011a), average annual flows (m3/s) were calculated by
Minnow using available data from Teck (variable months and years). In the latter cases,
flow data were typically missing for some or all winter months, so annual averages are
likely overestimates and have been prefaced with “<” in the matrices in Sections 3.0 to 7.0
of this report.
2.5.2 Ktunaxa Traditional Uses and Cultural Values
The Ktunaxa traditional uses and cultural values will be inserted into the matrices from
reporting provided by KNC.
2.5.3 Stream Length
The total stream length (km) was calculated using the provincial CWB dataset and
includes all stream lengths within each CWB catchment area. The provincial CWB
dataset uses the Fresh Water Atlas (FWA) stream network. The FWA stream network is
derived from Terrain Resource Information Management 1 (TRIM1) stream linework
(TRIM II streams are not included). TRIM features are delineated through aerial photo
interpretation and have varying degrees of accuracy, particularly when defining smaller
streams (Norris and Mount, in draft).
The stream lengths within each CWB catchment area were labelled by Teck by type (i.e.,
connected, fragmented, altered/destroyed or permanently fragmented) based on Teck’s
dissolved disturbance layer and known barriers identified in the various environmental
assessment (EA) Fish and Fish Habitat Baseline Reports. Definitions of the types and
sources are provided in Table 2.6.
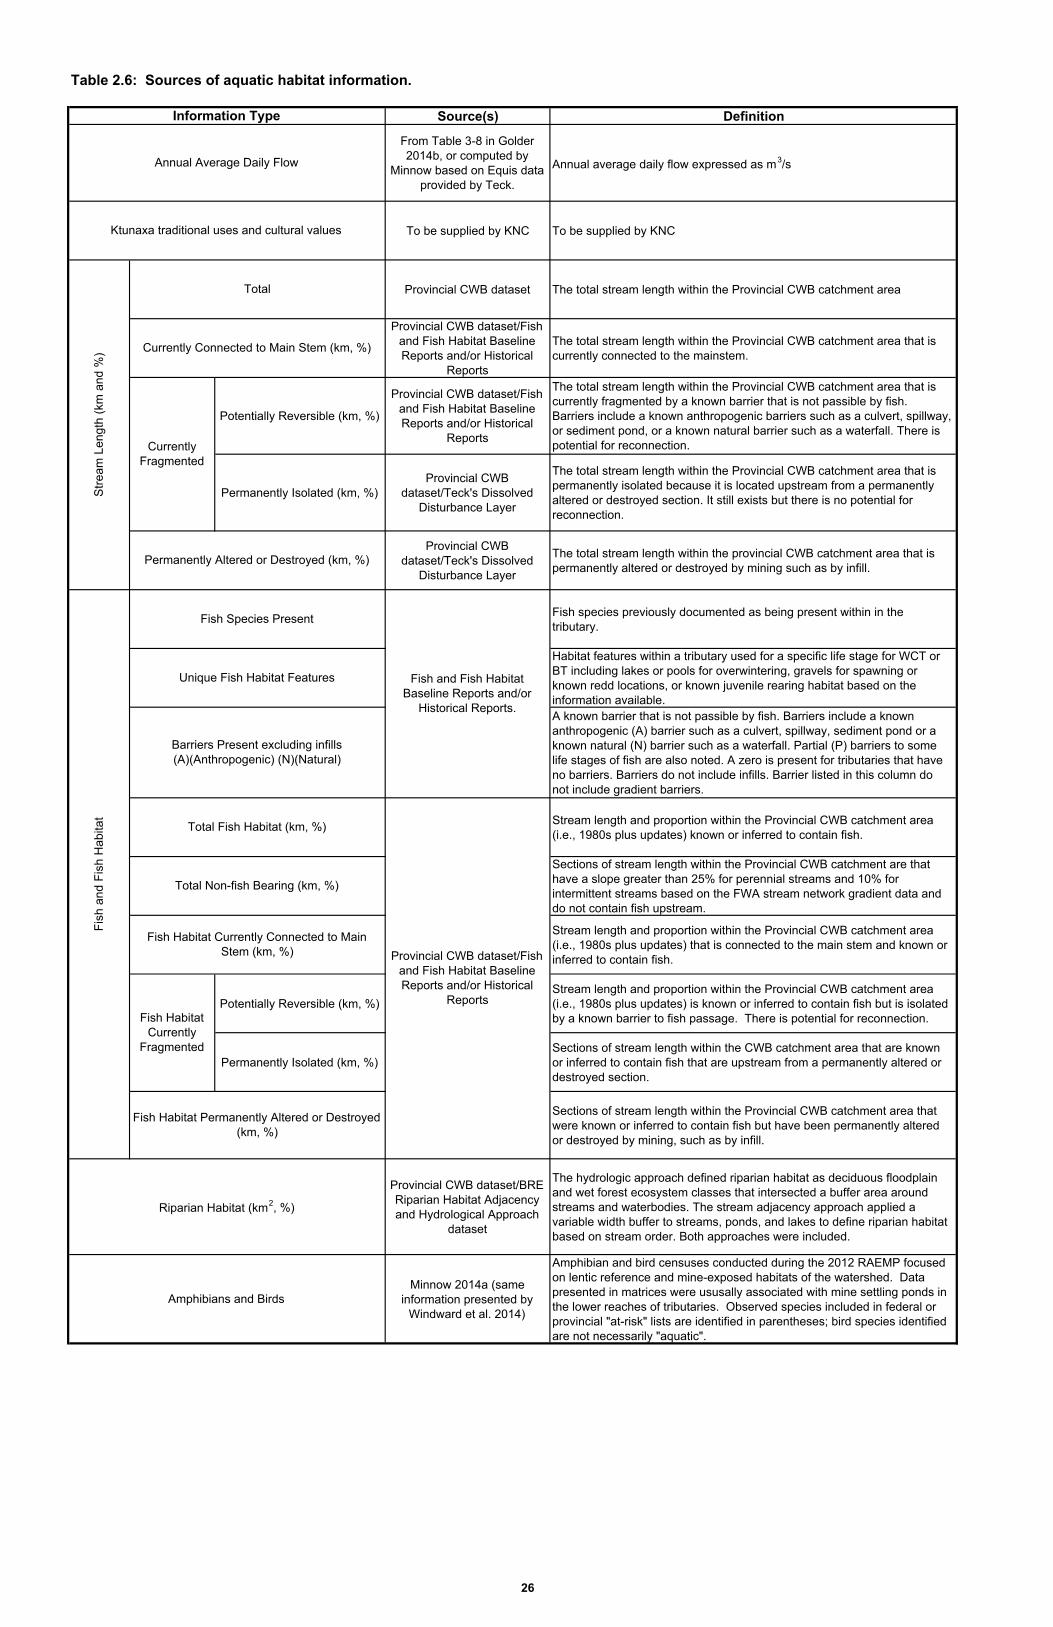
Table 2.6: Sources of aquatic habitat information.
Source(s) Definition
From Table 3-8 in Golder 2014b, or computed by
Minnow based on Equis data provided by Teck.
Annual average daily flow expressed as m3/s
To be supplied by KNC To be supplied by KNC
Provincial CWB dataset The total stream length within the Provincial CWB catchment area
Provincial CWB dataset/Fish and Fish Habitat Baseline Reports and/or Historical
Reports
The total stream length within the Provincial CWB catchment area that is currently connected to the mainstem.
Potentially Reversible (km, %)
Provincial CWB dataset/Fish and Fish Habitat Baseline Reports and/or Historical
Reports
The total stream length within the Provincial CWB catchment area that is currently fragmented by a known barrier that is not passible by fish. Barriers include a known anthropogenic barriers such as a culvert, spillway, or sediment pond, or a known natural barrier such as a waterfall. There is potential for reconnection.
Permanently Isolated (km, %)Provincial CWB
dataset/Teck's Dissolved Disturbance Layer
The total stream length within the Provincial CWB catchment area that is permanently isolated because it is located upstream from a permanently altered or destroyed section. It still exists but there is no potential for reconnection.
Provincial CWB dataset/Teck's Dissolved
Disturbance Layer
The total stream length within the provincial CWB catchment area that is permanently altered or destroyed by mining such as by infill.
Fish species previously documented as being present within in the tributary.
Habitat features within a tributary used for a specific life stage for WCT or BT including lakes or pools for overwintering, gravels for spawning or known redd locations, or known juvenile rearing habitat based on the information available.A known barrier that is not passible by fish. Barriers include a known anthropogenic (A) barrier such as a culvert, spillway, sediment pond or a known natural (N) barrier such as a waterfall. Partial (P) barriers to some life stages of fish are also noted. A zero is present for tributaries that have no barriers. Barriers do not include infills. Barrier listed in this column do not include gradient barriers.
Stream length and proportion within the Provincial CWB catchment area (i.e., 1980s plus updates) known or inferred to contain fish.
Sections of stream length within the Provincial CWB catchment are that have a slope greater than 25% for perennial streams and 10% for intermittent streams based on the FWA stream network gradient data and do not contain fish upstream.
Stream length and proportion within the Provincial CWB catchment area (i.e., 1980s plus updates) that is connected to the main stem and known or inferred to contain fish.
Potentially Reversible (km, %)Stream length and proportion within the Provincial CWB catchment area (i.e., 1980s plus updates) is known or inferred to contain fish but is isolated by a known barrier to fish passage. There is potential for reconnection.
Permanently Isolated (km, %)Sections of stream length within the CWB catchment area that are known or inferred to contain fish that are upstream from a permanently altered or destroyed section.
Sections of stream length within the Provincial CWB catchment area that were known or inferred to contain fish but have been permanently altered or destroyed by mining, such as by infill.
Provincial CWB dataset/BRE Riparian Habitat Adjacency and Hydrological Approach
dataset
The hydrologic approach defined riparian habitat as deciduous floodplain and wet forest ecosystem classes that intersected a buffer area around streams and waterbodies. The stream adjacency approach applied a variable width buffer to streams, ponds, and lakes to define riparian habitat based on stream order. Both approaches were included.
Minnow 2014a (same information presented by
Windward et al. 2014)
Amphibian and bird censuses conducted during the 2012 RAEMP focused on lentic reference and mine-exposed habitats of the watershed. Data presented in matrices were ususally associated with mine settling ponds in the lower reaches of tributaries. Observed species included in federal or provincial "at-risk" lists are identified in parentheses; bird species identified are not necessarily "aquatic".
Fish Species Present
Unique Fish Habitat Features
Amphibians and Birds
Riparian Habitat (km2, %)
Fish and Fish Habitat Baseline Reports and/or
Historical Reports.
Fis
h a
nd
Fis
h H
ab
itat
Provincial CWB dataset/Fish and Fish Habitat Baseline Reports and/or Historical
Reports
Barriers Present excluding infills (A)(Anthropogenic) (N)(Natural)
Total Fish Habitat (km, %)
Total Non-fish Bearing (km, %)
Fish Habitat Currently Connected to Main Stem (km, %)
Fish Habitat Currently
Fragmented
Fish Habitat Permanently Altered or Destroyed (km, %)
Information Type
Ktunaxa traditional uses and cultural values
Total
Currently Connected to Main Stem (km, %)
Currently Fragmented
Str
ea
m L
en
gth
(km
an
d %
)
Annual Average Daily Flow
Permanently Altered or Destroyed (km, %)
26
Teck Tributary Evaluation Program Data Report
Minnow Environmental Inc. 27 June 2016 Project 2563
Calculations for each stream length type (km and %) are provided in the matrix. The
stream length by type is also delineated on the orthophoto figures. All stream lengths
(perennial and intermittent) from the CWB dataset FWA (TRIM1) stream network are
included in this report. However, it has been acknowledged by BCMOE that there are
errors in the dataset and it has not been ground-truthed. For interior portions of the
province, TRIM1 may over-represent the number or magnitude of streams (Norris and
Mount in draft), including some ephemeral or intermittent streams that have water in them
only at the wettest times of the year. It is often found that there is a ‘dry draw’ at locations
where a stream has been shown on the mapping (Norris and Mount, in draft). See
Section 2.5.7 for more details.
2.5.4 Fish Species Present
Fish species present in each tributary were identified mainly from Fish and Fish Habitat
Baseline Reports associated with approved or planned mine development projects. Two
fish species are present in the Elk River watershed that have special conservation status:
westslope cutthroat trout (Oncorhynchus clarkii lewisi; blue list) and bull trout (Salvelinus
confluentus; blue list; BCCDC 2012). The BC population of WCT is also listed as special
concern in the Species at Risk Act under Schedule 1 List of Wildlife Species at Risk,
Part 4 Special Concern. The baseline reports summarize historical information that was
available at the time the reports were prepared, including fish catch data recorded in the
provincial Fisheries Information Summary System (FISS).
2.5.5 Unique Fish Habitat Features
A “yes”, “no”, or “unknown” was indicated in the unique fish habitat feature column based
on the Fish and Fish Habitat Baseline Reports and/or historical reports. This column is
subjective and based on professional opinion from the information available and likely
requires further refinement. The definition of unique fish habitat features is provided in
Table 2.6.
2.5.6 Anthropogenic and Natural Barriers Present
An anthropogenic or natural barrier to fish passage was provided in the matrix if identified
in the Fish and Fish Habitat Baseline Reports and/or historical reports. The definition of
barrier is provided in Table 2.6. Barriers are also shown on the orthophoto figures.
2.5.7 Fish Habitat Lengths
The total fish habitat length (km) was calculated using the stream length within each CWB
catchment area. The stream lengths within each CWB catchment area were labelled as
Teck Tributary Evaluation Program Data Report
Minnow Environmental Inc. 28 June 2016 Project 2563
fish habitat (observed and inferred) or non-fish bearing. Methods used were similar to the
BCMOE Fish Passage GIS Analysis Methodology and Output Data Specifications Version
2 (Norris and Mount, in draft), which built on the GIS Modelling of Fish Habitat and Road
Crossings for the Prioritization of Culvert Assessment and Remediation Version 1 (Mount
et al. 2011). The following sources were used for fish habitat determination: stream slope
from the FWA stream network, the Canfor stream classification dataset (Canfor 2012),
Fish and Fish Habitat Baseline Reports and/or historical reports, and Provincial historical
fish observation data (BCMOE 2014).
A GIS analysis process was run to update the stream base data with the Canfor fish
bearing classification, known fish-bearing reaches from the Fish and Fish Habitat Baseline
Reports and the known fish observations from the BCMOE database. Stream reaches
were then updated manually based on connectivity downstream from fish bearing class
reaches and for known conditions on the mine site. Stream reaches with a slope greater
than 25% (determined from the FWA stream network data) for more than 100 m of stream
length on perennial coded streams were set to non-fish bearing if they did not have fish
observations upstream. Stream reaches with a slope greater than 10% (determined from
the FWA stream network data) for more than 100 m of stream length on intermittently
coded streams were set to non-fish bearing if they did not have fish observations
upstream. Definitions and sources are provided in Table 2.6. Calculations for each fish
habitat length (km and %) by type (i.e., connected, fragmented, altered/destroyed or
permanently fragmented) are provided in the matrix. The fish habitat length by type and
the location of gradient barriers of 25% on perennial streams and 10% on intermittent
streams are also provided on the orthophoto figures.
2.5.8 Riparian Habitat
Methods from the Baldy Ridge Extension Project for ecosystems environmental
assessment for riparian habitat (Golder 2015c) were used to quantify the amounts of
riparian habitat within each catchment area presented in the matrices of this report. Data
are reported as total square kilometres of riparian habitat and as a proportion of the
overall basin area. Riparian habitat amount was calculated using both the hydrologic and
stream adjacency approaches. By including both approaches, calculations include
riparian habitat not connected to the watercourse (hydrologic approach) and riparian
habitat connected to the watercourse (stream adjacency approach) since both types were
deemed as riparian habitat in the Baldy Ridge Extension Project Environmental
Assessment. Both approaches are described in the following paragraphs.
Teck Tributary Evaluation Program Data Report
Minnow Environmental Inc. 29 June 2016 Project 2563
Hydrologic Approach
The hydrologic approach defined riparian habitat as deciduous floodplain and wet forest
ecosystem classes (i.e., site series 110, 111, 111x, 112x [i.e., wet forest] where soil
moisture regime is 5 or 6 [MacKillop 2012], and flooded low bench tall shrub types [Fl] and
flooded middle bench deciduous forest [Fm] types [Mackenzie and Moran 2004]) that
intersected a buffer area around streams and waterbodies. Buffers were 200 m for
stream orders 7 and 8, 100 m for stream orders 5 and 6, 50 m for stream orders 3 and 4
and all other waterbodies, and no buffer for stream orders 1 and 2 (i.e., the stream must
intersect the wet forest or floodplain). Deciduous floodplain and wet forest polygons
outside the buffer were not included. Similarly, ecosystems within the buffer that were not
wet forests or floodplains were not considered riparian habitat using the hydrologic
approach.
The hydrologic approach was selected to capture riparian habitat that is not necessarily
intersecting a watercourse, but is still defined as riparian habitat because it exists in low-
lying areas that may be periodically inundated when water levels are high, and ecological
connectivity with the watercourse is thereby maintained.
Stream Adjacency Approach
The stream adjacency approach applied a variable width buffer to streams, ponds, and
lakes to define riparian habitat, as follows:
• stream orders 7 and 8 = 50 m.
• stream orders 4, 5 and 6, waterbodies and wetlands = 30 m
• stream order 3 = 20 m.
• stream orders 1 and 2 = 10 m.
High-elevation streams with Biogeoclimatic Ecosystem Classifications (BEC) of
Englemann Spruce- Subalpine Fir (e.g., ESSF dkp, ESSF dkw, ESSF wpm, ESSF wmw)
and Undifferentiated Interior Mountain (IMA un) were excluded from the analysis because
conditions do not support riparian attributes in the ecological context of providing structure
and function to support riparian dependent vegetation and wildlife species. Such areas
are sub-alpine to alpine ecosystems with extremely harsh conditions that hamper survival
of vegetation and, specifically, riparian assemblages. To better understand the availability
of intact riparian systems (Environment Canada 2013), the amount of riparian habitat in
areas affected by disturbances that remove vegetation (e.g., mining) was calculated.
Riparian habitats near clear-cuts were assumed to be vegetated because of regulations
Teck Tributary Evaluation Program Data Report
Minnow Environmental Inc. 30 June 2016 Project 2563
(Tschaplinski and Pike 2010) and best management practices implemented by industry to
maintain natural vegetation in riparian habitat (Tembec 2005).
The adjacency approach was selected to capture habitat that plays a role in riparian and
aquatic health or function (e.g., shading, streamside deadfall), but that is not necessarily
identified as a riparian ecosystem in the BEC system.
2.5.9 Amphibians and Birds
Breeding amphibian and bird censuses were completed at 32 areas during the 2012
RAEMP, and focused on lentic reference and mine-exposed habitats of the watershed
(Minnow 2014). Of all 32 areas evaluated, 188 were associated with tributaries, and most
of those were constructed mine settling ponds. The bird species identified were not
necessarily "aquatic". Bird or amphibian survey data from EA baseline reports are also
provided if specific observation locations were reported in tables or maps of the reports
(i.e., tributary catchments in which observations were made could be confirmed). The
available breeding amphibian and bird survey results can considered qualitatively (e.g.,
indicative of locally available habitat suitable for species that were observed), but should
not be used quantitatively in the tributary evaluation.
The habitat matrix for each MU identifies the tributary-related survey areas and lists (in
parentheses) any species observed that are included in federal or provincial "at-risk" lists.
Overall, three species of amphibians were found (Columbia spotted frog [Rana
luteiventris], western toad [Anaxyrus boreas], and long-toed salamander [Ambystoma
macrodactylum]; Minnow 2014), of which the western toad is considered to be of “special
concern” from a provincial or federal conservation standpoint (BCCDC 2012). A total of
125 bird species were observed among areas of which five (bald eagle9, barn swallow,
great blue heron - herodias subspecies, long-billed curlew and olive-sided flycatcher) have
special conservation status in the Kootenay District (BCCDC 2012). Of those five
species, only the barn swallow, bald eagle and/or olive-sided flycatcher were observed at
one or more tributary sampling areas, typically in low numbers (i.e., 1-4 individuals).
8 Some of the surveyed areas lacked suitable amphibian breeding habitat so only a bird census was completed. 9 Puzzlingly the bald eagle is generally considered secure/not at risk by other lists (e.g., BC Yellow list and COSEWIC.
Teck Tributary Evaluation Program Data Report
Minnow Environmental Inc. 31 June 2016 Project 2563
2.5.10 Written Habitat Descriptions
Text descriptions of aquatic habitat that are presented in Sections 3.0 to 7.0 of this report
were taken mainly from Fish and Fish Habitat Baseline Reports associated with EAs for
mine development projects:
Golder Associates Ltd. 2014a. Fording River Operations Swift Project
Environmental Assessment Certificate Application. Annex G - Fish and Fish
Habitat Baseline Report.
Golder Associates Ltd. 2015. Coal Mountain Phase 2 Project. Annex I – Fish and
Fish Habitat Baseline Report.
Lotic Environmental. 2015a. Elkview Operations Baldy Ridge Extension Project -
Fish and Fish Habitat Baseline Assessment.
Lotic Environmental. 2015b. Greenhills Operations Cougar Pit Extension Project -
Fish and Fish Habitat Baseline Assessment.
Teck Coal Limited. 2011b. Line Creek Operations Phase II Project Fish and Fish
Habitat Baseline Report.
The baseline reports summarize existing information (e.g., from previous technical
studies) and the detailed results of any recent habitat surveys that were undertaken to
address gaps in the historical baseline information for tributaries of interest. This report
did not attempt to cite all original sources of information that were cited in the baseline
reports (i.e., only the baseline report itself is cited herein). Exceptions were cases when
additional information was found in historical documents that was not presented in
baseline documents, in which case the original source was cited. The list of the reports
reviewed are provided in the annotated bibliography in Appendix F of this report. Any
information that is used to evaluate tributaries in the next phases of the TEP (i.e., Phase C
to E in Figure 1.2) will be verified from original sources, if needed to reduce the
uncertainty of the evaluation.
As noted above, the habitat descriptions provided in this report were taken mainly from EA
fish and fish habitat baseline reports which followed standard assessment methods.
Although completed in the context of fish, the habitat descriptions are relevant to any biota
utilizing the stream. Additional habitat data are available in various monitoring reports,
such as those associated with benthic invertebrate and periphyton sampling locations of
the RAEMP and LAEMP, including stream width, depth, and velocity at the time of
sampling, plus riparian and substrate characteristics. Such information was generally
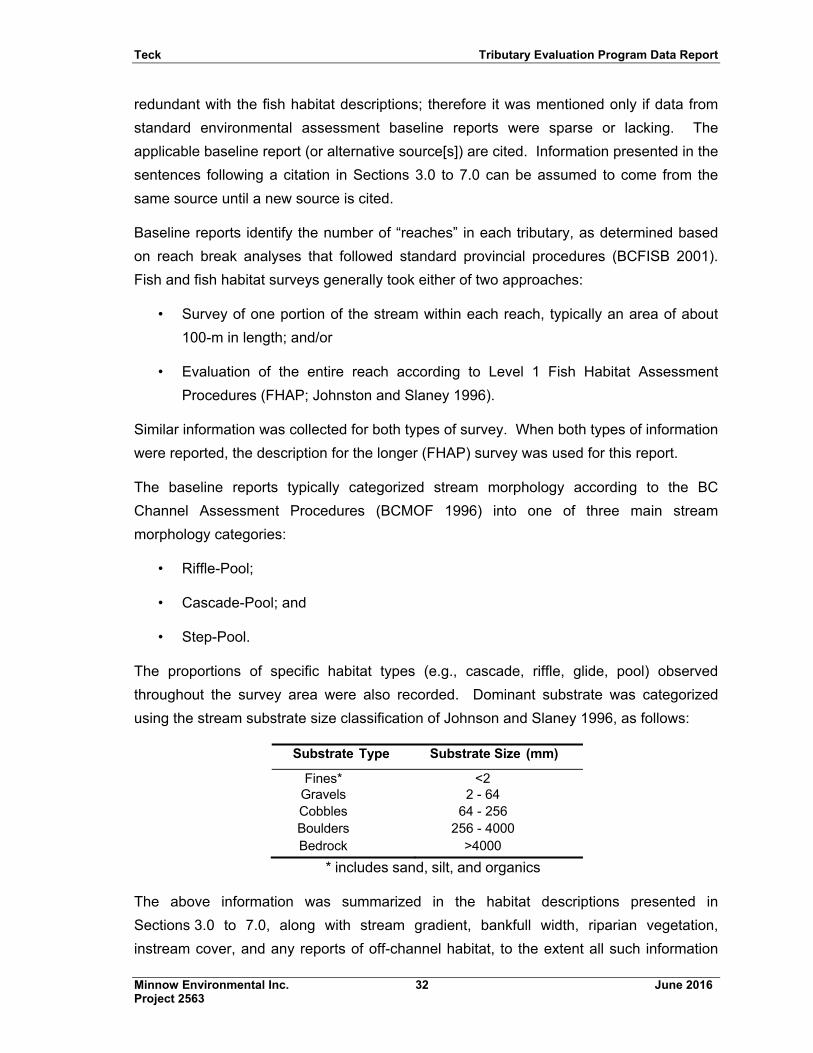
Teck Tributary Evaluation Program Data Report
Minnow Environmental Inc. 32 June 2016 Project 2563
redundant with the fish habitat descriptions; therefore it was mentioned only if data from
standard environmental assessment baseline reports were sparse or lacking. The
applicable baseline report (or alternative source[s]) are cited. Information presented in the
sentences following a citation in Sections 3.0 to 7.0 can be assumed to come from the
same source until a new source is cited.
Baseline reports identify the number of “reaches” in each tributary, as determined based
on reach break analyses that followed standard provincial procedures (BCFISB 2001).
Fish and fish habitat surveys generally took either of two approaches:
• Survey of one portion of the stream within each reach, typically an area of about
100-m in length; and/or
• Evaluation of the entire reach according to Level 1 Fish Habitat Assessment
Procedures (FHAP; Johnston and Slaney 1996).
Similar information was collected for both types of survey. When both types of information
were reported, the description for the longer (FHAP) survey was used for this report.
The baseline reports typically categorized stream morphology according to the BC
Channel Assessment Procedures (BCMOF 1996) into one of three main stream
morphology categories:
• Riffle-Pool;
• Cascade-Pool; and
• Step-Pool.
The proportions of specific habitat types (e.g., cascade, riffle, glide, pool) observed
throughout the survey area were also recorded. Dominant substrate was categorized
using the stream substrate size classification of Johnson and Slaney 1996, as follows:
Substrate Type Substrate Size (mm)
Fines* <2 Gravels 2 - 64 Cobbles 64 - 256 Boulders 256 - 4000 Bedrock >4000
* includes sand, silt, and organics
The above information was summarized in the habitat descriptions presented in
Sections 3.0 to 7.0, along with stream gradient, bankfull width, riparian vegetation,
instream cover, and any reports of off-channel habitat, to the extent all such information
Teck Tributary Evaluation Program Data Report
Minnow Environmental Inc. 33 June 2016 Project 2563
was found. Conclusions that were made in the baseline reports regarding the availability
of habitat suitable for various life stages of fish, including spawning, rearing, adult cover
and overwintering habitat have also been summarized in this report. Special note was
made of stream features confirmed in the field to be barriers to upstream fish movement
or unique habitat features (e.g., side-channels, lentic habitat).
2.6 Orthophoto Figures
Orthophoto figures of each tributary were developed in-house by Teck from sources and
definitions provided in Table 2.7.
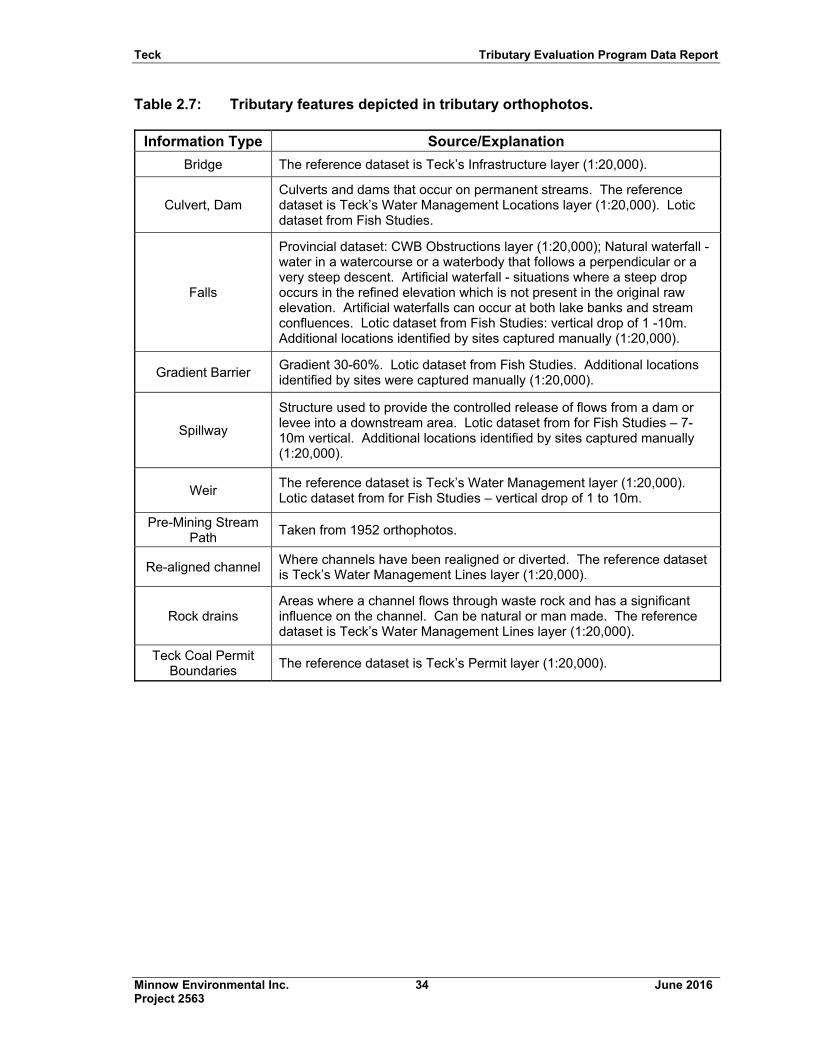
Teck Tributary Evaluation Program Data Report
Minnow Environmental Inc. 34 June 2016 Project 2563
Table 2.7: Tributary features depicted in tributary orthophotos.
Information Type Source/Explanation
Bridge The reference dataset is Teck’s Infrastructure layer (1:20,000).
Culvert, Dam Culverts and dams that occur on permanent streams. The reference dataset is Teck’s Water Management Locations layer (1:20,000). Lotic dataset from Fish Studies.
Falls
Provincial dataset: CWB Obstructions layer (1:20,000); Natural waterfall -water in a watercourse or a waterbody that follows a perpendicular or a very steep descent. Artificial waterfall - situations where a steep drop occurs in the refined elevation which is not present in the original raw elevation. Artificial waterfalls can occur at both lake banks and stream confluences. Lotic dataset from Fish Studies: vertical drop of 1 -10m. Additional locations identified by sites captured manually (1:20,000).
Gradient Barrier Gradient 30-60%. Lotic dataset from Fish Studies. Additional locations identified by sites were captured manually (1:20,000).
Spillway
Structure used to provide the controlled release of flows from a dam or levee into a downstream area. Lotic dataset from for Fish Studies – 7-10m vertical. Additional locations identified by sites captured manually (1:20,000).
Weir The reference dataset is Teck’s Water Management layer (1:20,000). Lotic dataset from for Fish Studies – vertical drop of 1 to 10m.
Pre-Mining Stream Path
Taken from 1952 orthophotos.
Re-aligned channel Where channels have been realigned or diverted. The reference dataset is Teck’s Water Management Lines layer (1:20,000).
Rock drains Areas where a channel flows through waste rock and has a significant influence on the channel. Can be natural or man made. The reference dataset is Teck’s Water Management Lines layer (1:20,000).
Teck Coal Permit Boundaries
The reference dataset is Teck’s Permit layer (1:20,000).
Teck Tributary Evaluation Program Data Report
Minnow Environmental Inc. 35 June 2016 Project 2563
3.0 TRIBUTARIES TO UPPER FORDING RIVER (MU1)
The tributaries in the Upper Fording River Watershed (MU1) are shown in Figure 3.1, and
include:
Upstream Fording River,
Henretta Creek,
Fish Pond Creek,
Clode Creek,
Lake Mountain Creek,
Kilmarnock Creek,
Swift Creek,
Cataract Creek,
Porter Creek,
Chauncey Creek,
Ewin Creek,
LCO Dry Creek, and
Greenhills Creek.
Matrices for these tributaries provide data related to watershed area and disturbances
(Table 3.1), environmental quality descriptors (Table 3.2) and fish and aquatic habitat
(Table 3.3). An orthophoto figure for each tributary is found in Appendix A. Each tributary
is briefly described in the following subsections.
Westslope cutthroat trout is the only fish species present in the Upper Fording River,
which is defined as the portion of the Fording River extending from the headwaters to
Josephine Falls.
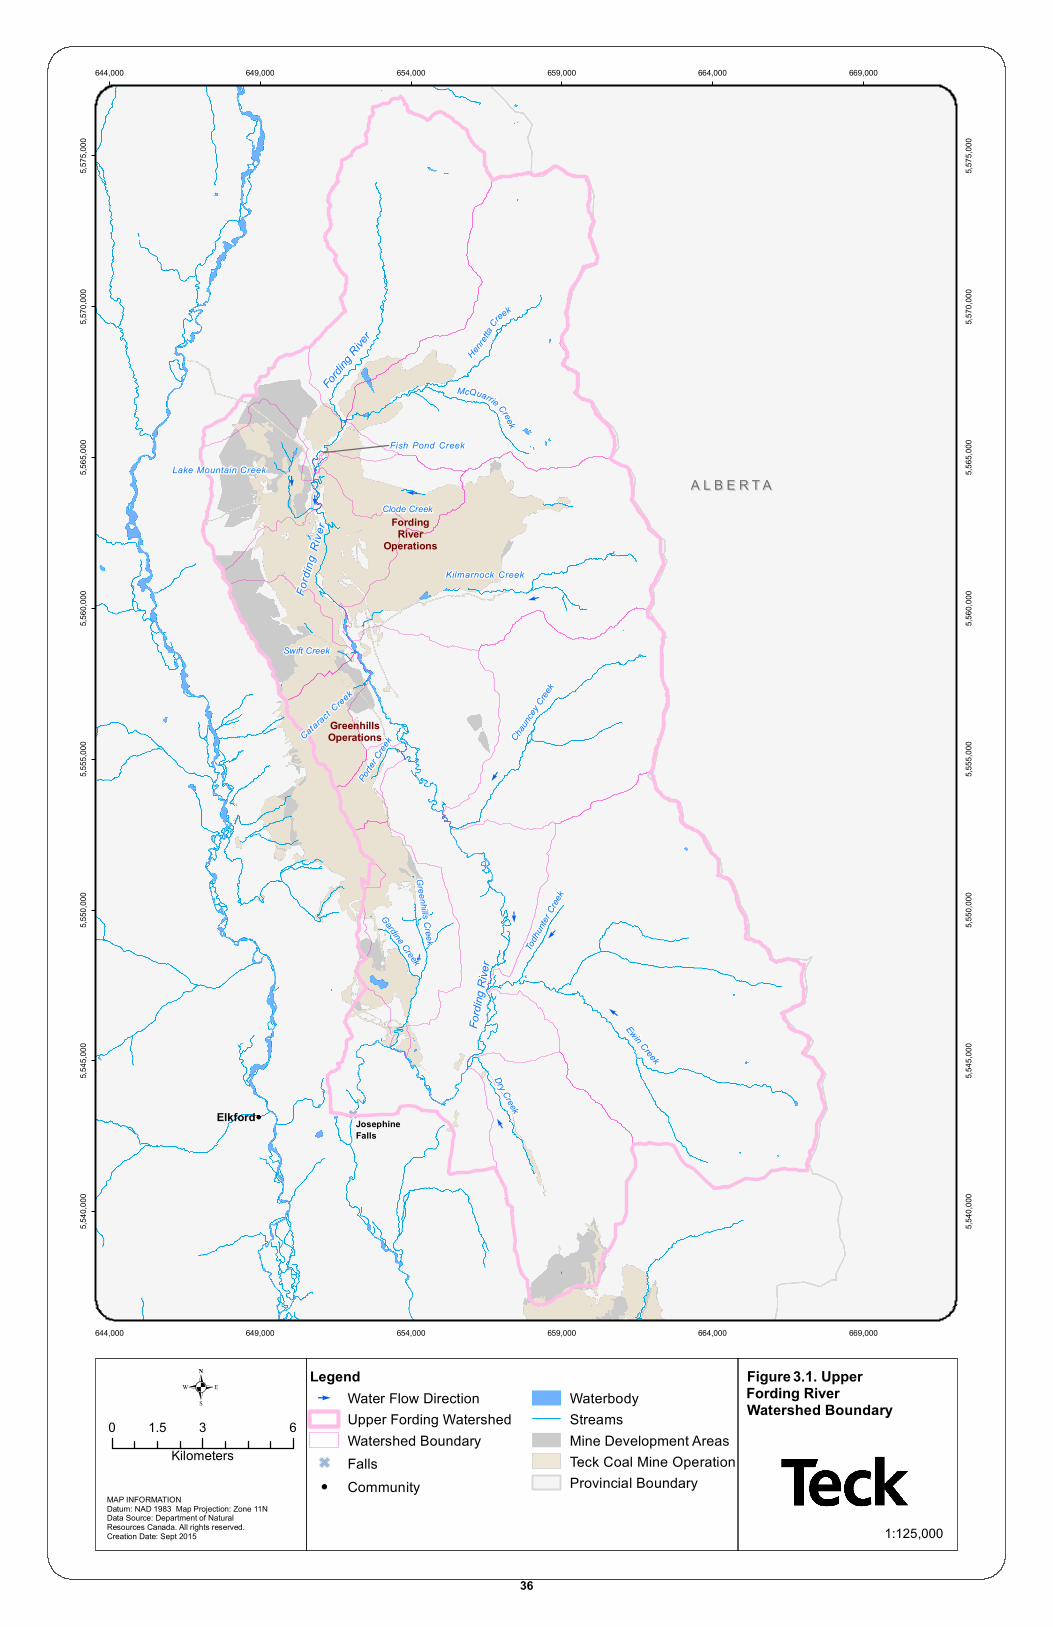
E
E
E
E
E
E
E
E E
E
Fish Pond Creek
Lake Mountain Creek
Cataract Creek
Kilmarnock Creek
Fordi
ng R
iver
Dry Creek
Ewin Creek
Todhu
nter C
reek
Fordi
ng R
iver
Greenhills Creek
Gardine Creek
Fordin
g Rive
r
Clode Creek
Porte
r Cree
k
Henrett
a Creek
McQuarrie Creek
Swift Creek
Chaunce
y Creek
A L B E R T AA L B E R T A
FordingRiver
Operations
GreenhillsOperations
JosephineFalls
Elkford
644,000
644,000
649,000
649,000
654,000
654,000
659,000
659,000
664,000
664,000
669,000
669,000
5,540
,000
5,540
,000
5,545
,000
5,545
,000
5,550
,000
5,550
,000
5,555
,000
5,555
,000
5,560
,000
5,560
,000
5,565
,000
5,565
,000
5,570
,000
5,570
,000
5,575
,000
5,575
,000
.Legend
E Water Flow DirectionUpper Fording WatershedWatershed Boundary
G Falls! Community
WaterbodyStreamsMine Development Areas Teck Coal Mine OperationProvincial Boundary
MAP INFORMATIONDatum: NAD 1983 Map Projection: Zone 11NData Source: Department of Natural Resources Canada. All rights reserved.Creation Date: Sept 2015
0 3 61.5Kilometers
1:125,000
Figure 3 . 1. Upper Fording River Watershed Boundary
36
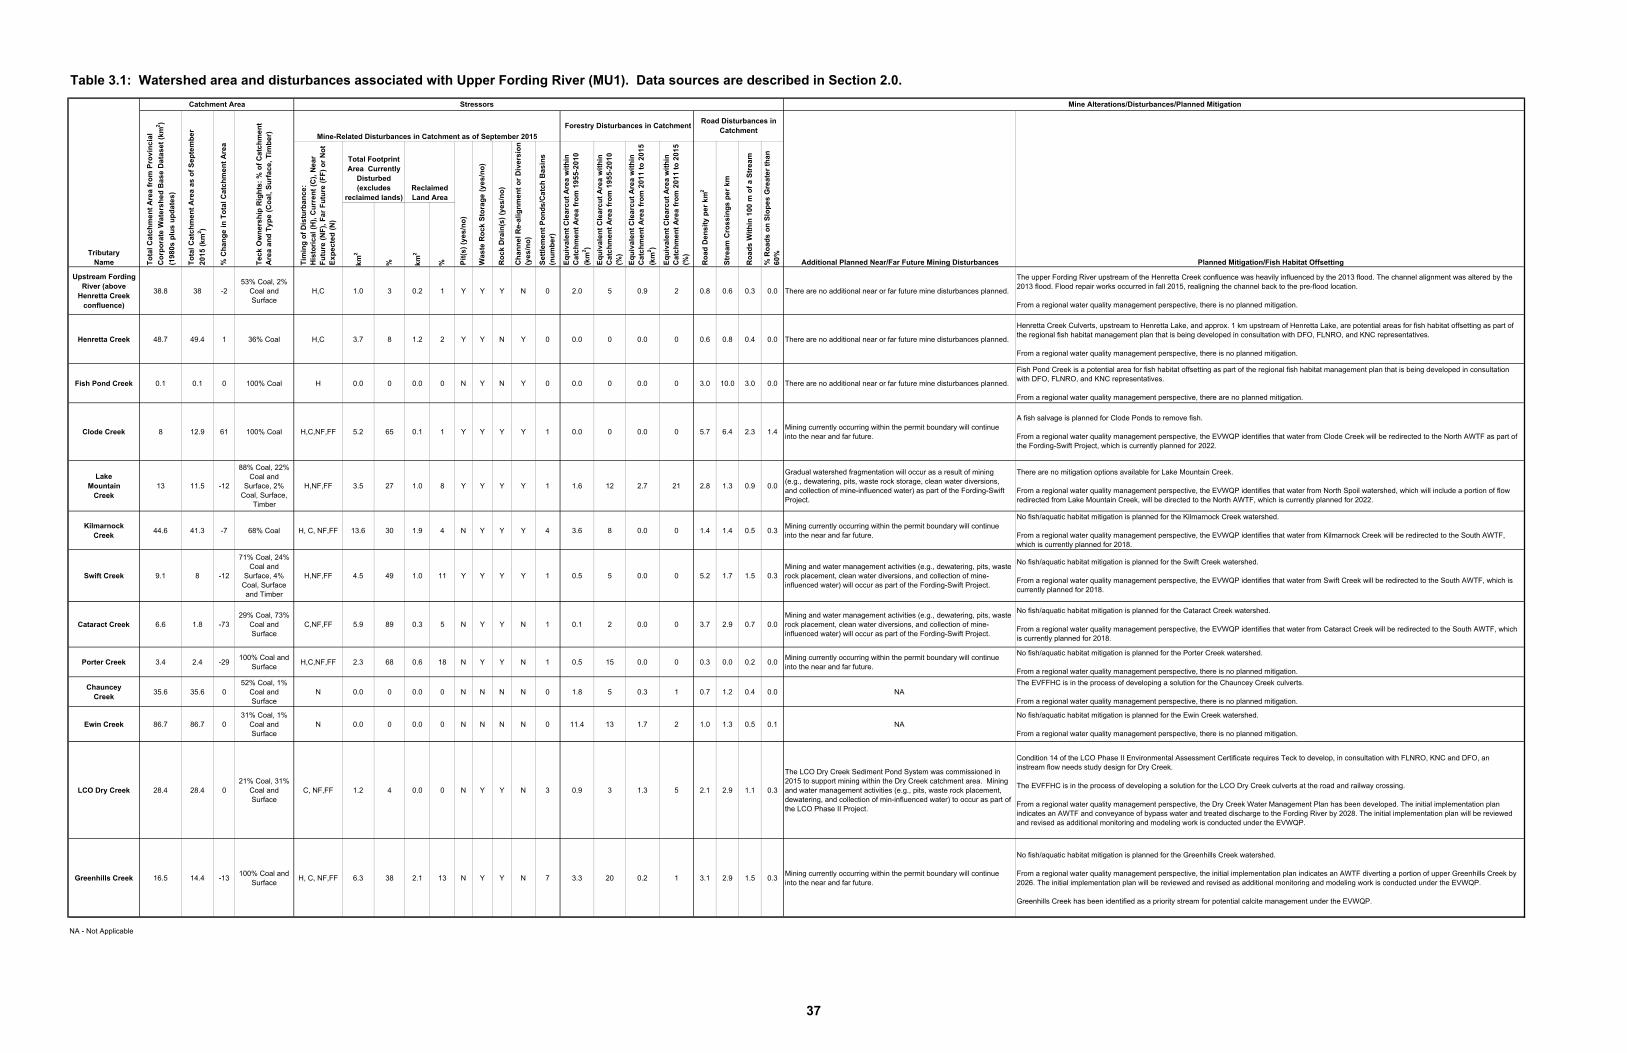
km
2
% km
2
%
Upstream Fording River (above
Henretta Creek confluence)
38.8 38 -253% Coal, 2%
Coal and Surface
H,C 1.0 3 0.2 1 Y Y Y N 0 2.0 5 0.9 2 0.8 0.6 0.3 0.0 There are no additional near or far future mine disturbances planned.
The upper Fording River upstream of the Henretta Creek confluence was heavily influenced by the 2013 flood. The channel alignment was altered by the 2013 flood. Flood repair works occurred in fall 2015, realigning the channel back to the pre-flood location.
From a regional water quality management perspective, there is no planned mitigation.
Henretta Creek 48.7 49.4 1 36% Coal H,C 3.7 8 1.2 2 Y Y N Y 0 0.0 0 0.0 0 0.6 0.8 0.4 0.0 There are no additional near or far future mine disturbances planned.
Henretta Creek Culverts, upstream to Henretta Lake, and approx. 1 km upstream of Henretta Lake, are potential areas for fish habitat offsetting as part of the regional fish habitat management plan that is being developed in consultation with DFO, FLNRO, and KNC representatives.
From a regional water quality management perspective, there is no planned mitigation.
Fish Pond Creek 0.1 0.1 0 100% Coal H 0.0 0 0.0 0 N Y N Y 0 0.0 0 0.0 0 3.0 10.0 3.0 0.0 There are no additional near or far future mine disturbances planned.
Fish Pond Creek is a potential area for fish habitat offsetting as part of the regional fish habitat management plan that is being developed in consultation with DFO, FLNRO, and KNC representatives.
From a regional water quality management perspective, there are no planned mitigation.
Clode Creek 8 12.9 61 100% Coal H,C,NF,FF 5.2 65 0.1 1 Y Y Y Y 1 0.0 0 0.0 0 5.7 6.4 2.3 1.4Mining currently occurring within the permit boundary will continue into the near and far future.
A fish salvage is planned for Clode Ponds to remove fish.
From a regional water quality management perspective, the EVWQP identifies that water from Clode Creek will be redirected to the North AWTF as part of the Fording-Swift Project, which is currently planned for 2022.
LakeMountain
Creek13 11.5 -12
88% Coal, 22% Coal and
Surface, 2% Coal, Surface,
Timber
H,NF,FF 3.5 27 1.0 8 Y Y Y Y 1 1.6 12 2.7 21 2.8 1.3 0.9 0.0
Gradual watershed fragmentation will occur as a result of mining (e.g., dewatering, pits, waste rock storage, clean water diversions, and collection of mine-influenced water) as part of the Fording-Swift Project.
There are no mitigation options available for Lake Mountain Creek.
From a regional water quality management perspective, the EVWQP identifies that water from North Spoil watershed, which will include a portion of flow redirected from Lake Mountain Creek, will be directed to the North AWTF, which is currently planned for 2022.
KilmarnockCreek
44.6 41.3 -7 68% Coal H, C, NF,FF 13.6 30 1.9 4 N Y Y Y 4 3.6 8 0.0 0 1.4 1.4 0.5 0.3Mining currently occurring within the permit boundary will continue into the near and far future.
No fish/aquatic habitat mitigation is planned for the Kilmarnock Creek watershed.
From a regional water quality management perspective, the EVWQP identifies that water from Kilmarnock Creek will be redirected to the South AWTF, which is currently planned for 2018.
Swift Creek 9.1 8 -12
71% Coal, 24% Coal and
Surface, 4% Coal, Surface and Timber
H,NF,FF 4.5 49 1.0 11 Y Y Y Y 1 0.5 5 0.0 0 5.2 1.7 1.5 0.3Mining and water management activities (e.g., dewatering, pits, waste rock placement, clean water diversions, and collection of mine-influenced water) will occur as part of the Fording-Swift Project.
No fish/aquatic habitat mitigation is planned for the Swift Creek watershed.
From a regional water quality management perspective, the EVWQP identifies that water from Swift Creek will be redirected to the South AWTF, which is currently planned for 2018.
Cataract Creek 6.6 1.8 -7329% Coal, 73%
Coal and Surface
C,NF,FF 5.9 89 0.3 5 N Y Y N 1 0.1 2 0.0 0 3.7 2.9 0.7 0.0Mining and water management activities (e.g., dewatering, pits, waste rock placement, clean water diversions, and collection of mine-influenced water) will occur as part of the Fording-Swift Project.
No fish/aquatic habitat mitigation is planned for the Cataract Creek watershed.
From a regional water quality management perspective, the EVWQP identifies that water from Cataract Creek will be redirected to the South AWTF, which is currently planned for 2018.
Porter Creek 3.4 2.4 -29100% Coal and
SurfaceH,C,NF,FF 2.3 68 0.6 18 N Y Y N 1 0.5 15 0.0 0 0.3 0.0 0.2 0.0
Mining currently occurring within the permit boundary will continue into the near and far future.
No fish/aquatic habitat mitigation is planned for the Porter Creek watershed.
From a regional water quality management perspective, there is no planned mitigation.
ChaunceyCreek
35.6 35.6 052% Coal, 1%
Coal and Surface
N 0.0 0 0.0 0 N N N N 0 1.8 5 0.3 1 0.7 1.2 0.4 0.0 NAThe EVFFHC is in the process of developing a solution for the Chauncey Creek culverts.
From a regional water quality management perspective, there is no planned mitigation.
Ewin Creek 86.7 86.7 031% Coal, 1%
Coal and Surface
N 0.0 0 0.0 0 N N N N 0 11.4 13 1.7 2 1.0 1.3 0.5 0.1 NANo fish/aquatic habitat mitigation is planned for the Ewin Creek watershed.
From a regional water quality management perspective, there is no planned mitigation.
LCO Dry Creek 28.4 28.4 021% Coal, 31%
Coal and Surface
C, NF,FF 1.2 4 0.0 0 N Y Y N 3 0.9 3 1.3 5 2.1 2.9 1.1 0.3
The LCO Dry Creek Sediment Pond System was commissioned in 2015 to support mining within the Dry Creek catchment area. Mining and water management activities (e.g., pits, waste rock placement, dewatering, and collection of min-influenced water) to occur as part of the LCO Phase II Project.
Condition 14 of the LCO Phase II Environmental Assessment Certificate requires Teck to develop, in consultation with FLNRO, KNC and DFO, an instream flow needs study design for Dry Creek.
The EVFFHC is in the process of developing a solution for the LCO Dry Creek culverts at the road and railway crossing.
From a regional water quality management perspective, the Dry Creek Water Management Plan has been developed. The initial implementation plan indicates an AWTF and conveyance of bypass water and treated discharge to the Fording River by 2028. The initial implementation plan will be reviewed and revised as additional monitoring and modeling work is conducted under the EVWQP.
Greenhills Creek 16.5 14.4 -13100% Coal and
SurfaceH, C, NF,FF 6.3 38 2.1 13 N Y Y N 7 3.3 20 0.2 1 3.1 2.9 1.5 0.3
Mining currently occurring within the permit boundary will continue into the near and far future.
No fish/aquatic habitat mitigation is planned for the Greenhills Creek watershed.
From a regional water quality management perspective, the initial implementation plan indicates an AWTF diverting a portion of upper Greenhills Creek by 2026. The initial implementation plan will be reviewed and revised as additional monitoring and modeling work is conducted under the EVWQP.
Greenhills Creek has been identified as a priority stream for potential calcite management under the EVWQP.
NA - Not Applicable
Catchment Area
Table 3.1: Watershed area and disturbances associated with Upper Fording River (MU1). Data sources are described in Section 2.0.
TributaryName
Stressors Mine Alterations/Disturbances/Planned Mitigation
Mine-Related Disturbances in Catchment as of September 2015
Additional Planned Near/Far Future Mining Disturbances Planned Mitigation/Fish Habitat OffsettingTim
ing
of
Dis
turb
an
ce
:H
isto
ric
al
(H),
Cu
rre
nt
(C),
Ne
ar
Fu
ture
(N
F),
Fa
r F
utu
re (
FF
) o
r N
ot
Ex
pe
cte
d (
N)
Eq
uiv
ale
nt
Cle
arc
ut
Are
a w
ith
in
Ca
tch
me
nt
Are
a f
rom
19
55
-20
10
(km
2 )
Eq
uiv
ale
nt
Cle
arc
ut
Are
a w
ith
in
Ca
tch
me
nt
Are
a f
rom
19
55
-20
10
(%
)
Wa
ste
Ro
ck
Sto
rag
e (
ye
s/n
o)
% C
ha
ng
e i
n T
ota
l C
atc
hm
en
t A
rea
Reclaimed Land Area
Te
ck
Ow
ne
rsh
ip R
igh
ts:
% o
f C
atc
hm
en
t A
rea
an
d T
yp
e (
Co
al,
Su
rfa
ce
, T
imb
er)
Pit
(s)
(ye
s/n
o)
To
tal
Ca
tch
me
nt
Are
a a
s o
f S
ep
tem
be
r
20
15
(k
m2 )
Total Footprint Area Currently
Disturbed(excludes
reclaimed lands)
To
tal
Ca
tch
me
nt
Are
a f
rom
Pro
vin
cia
l
Co
rpo
rate
Wa
ters
he
d B
as
e D
ata
se
t (k
m2 )
(19
80
s p
lus
up
da
tes
)
Eq
uiv
ale
nt
Cle
arc
ut
Are
a w
ith
in
Ca
tch
me
nt
Are
a f
rom
20
11
to
20
15
(km
2 )
Ro
ck
Dra
in(s
) (y
es
/no
)
Ch
an
ne
l R
e-a
lig
nm
en
t o
r D
ive
rsio
n
(ye
s/n
o)
Se
ttle
me
nt
Po
nd
s/C
atc
h B
as
ins
(n
um
be
r)
Eq
uiv
ale
nt
Cle
arc
ut
Are
a w
ith
in
Ca
tch
me
nt
Are
a f
rom
20
11
to
20
15
(%
)
Road Disturbances in Catchment
Ro
ad
De
ns
ity
pe
r k
m2
Str
ea
m C
ros
sin
gs
pe
r k
m
Ro
ad
s W
ith
in 1
00
m o
f a
Str
ea
m
% R
oa
ds
on
Slo
pe
s G
rea
ter
tha
n
60
%
Forestry Disturbances in Catchment
37
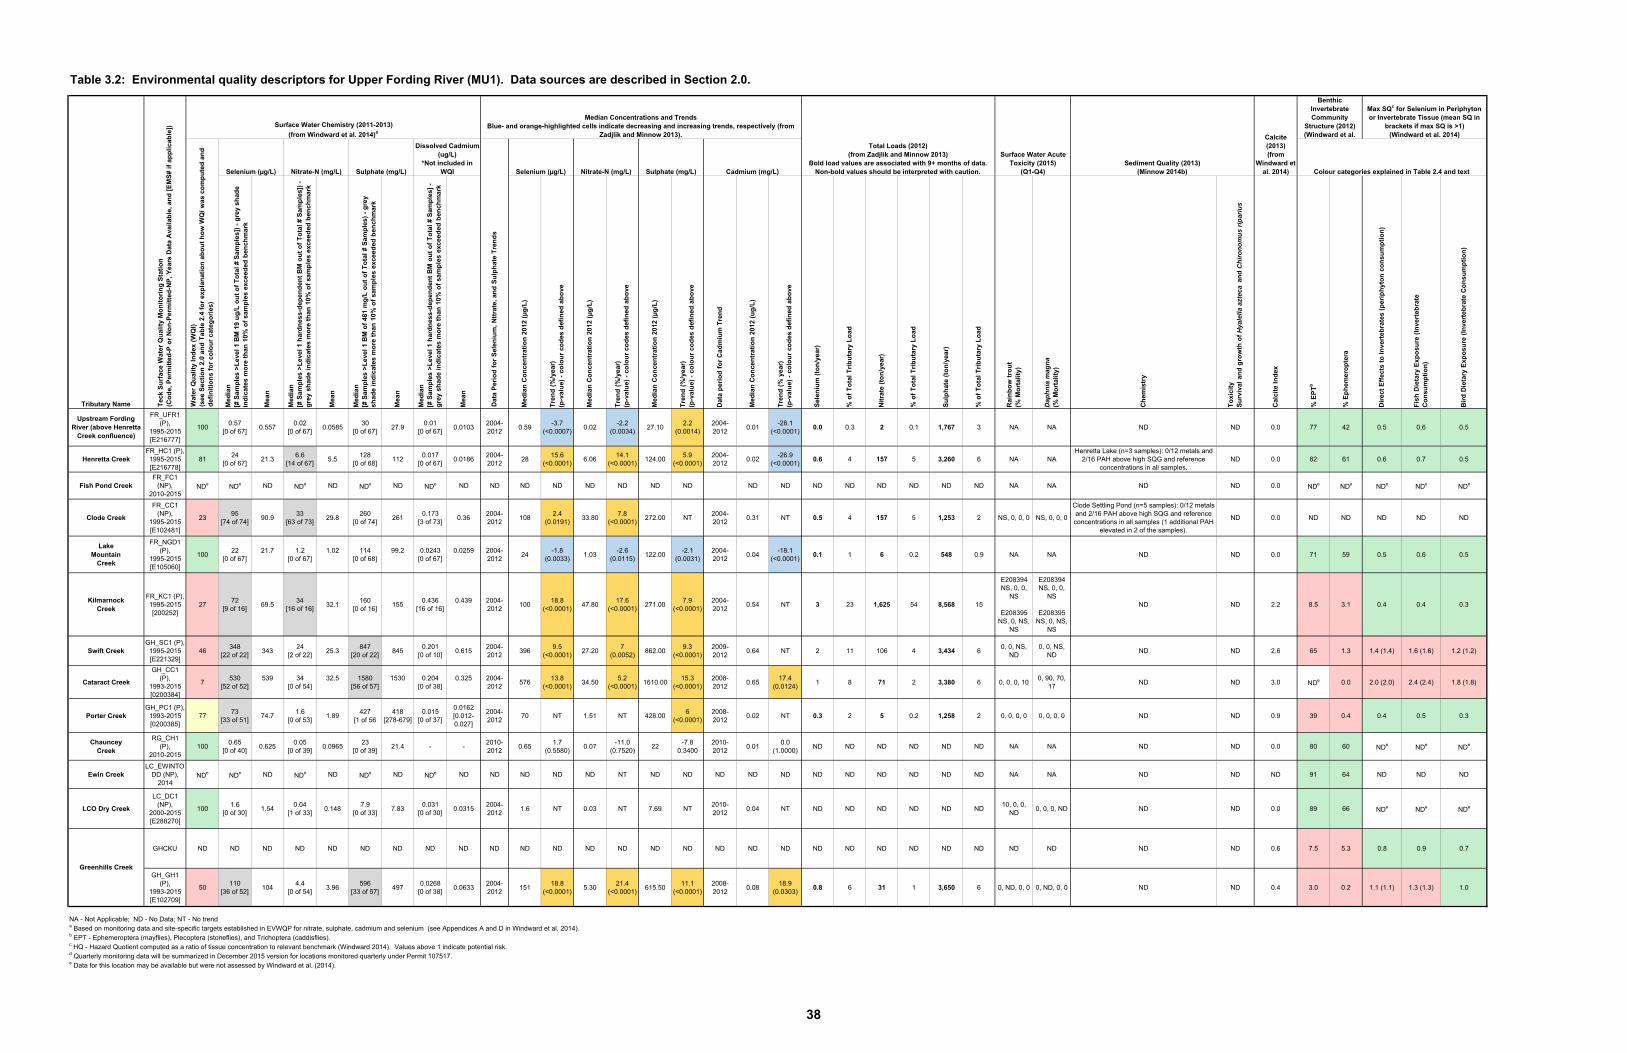
Table 3.2: Environmental quality descriptors for Upper Fording River (MU1). Data sources are described in Section 2.0.
Med
ian
[#
Sam
ple
s >
Lev
el 1
BM
19
ug
/L o
ut
of
To
tal
# S
amp
les]
) -
gre
y sh
ade
ind
icat
es m
ore
th
an 1
0% o
f sa
mp
les
exce
eded
ben
chm
ark
Mea
n
Med
ian
[# S
amp
les
>L
evel
1 h
ard
nes
s-d
epen
den
t B
M o
ut
of
To
tal
# S
amp
les]
) -
gre
y sh
ade
ind
icat
es m
ore
th
an 1
0% o
f sa
mp
les
exce
eded
ben
chm
ark
Mea
n
Med
ian
[# S
amp
les
>L
evel
1 B
M o
f 48
1 m
g/L
ou
t o
f T
ota
l #
Sam
ple
s) -
gre
y sh
ade
ind
icat
es m
ore
th
an 1
0% o
f sa
mp
les
exce
eded
ben
chm
ark
Mea
n
Med
ian
[#
Sam
ple
s >
Lev
el 1
har
dn
ess-
dep
end
ent
BM
ou
t o
f T
ota
l #
Sam
ple
s] -
g
rey
shad
e in
dic
ates
mo
re t
han
10%
of
sam
ple
s ex
ceed
ed b
ench
mar
k
Mea
n
Med
ian
Co
nce
ntr
atio
n 2
012
(µg
/L)
Tre
nd
(%
/yea
r)(p
-val
ue)
- c
olo
ur
cod
es d
efin
ed a
bo
ve
Med
ian
Co
nce
ntr
atio
n 2
012
(µg
/L)
Tre
nd
(%
/yea
r)(p
-val
ue)
- c
olo
ur
cod
es d
efin
ed a
bo
ve
Med
ian
Co
nce
ntr
atio
n 2
012
(µg
/L)
Tre
nd
(%
/yea
r)(p
-val
ue)
- c
olo
ur
cod
es d
efin
ed a
bo
ve
Dat
a p
erio
d f
or
Cad
miu
m T
ren
d
Med
ian
Co
nce
ntr
atio
n 2
012
(ug
/L)
Tre
nd
(%
yea
r)(p
-val
ue)
- c
olo
ur
cod
es d
efin
ed a
bo
ve
Sel
eniu
m (
ton
/yea
r)
% o
f T
ota
l T
rib
uta
ry L
oad
Nit
rate
(to
n/y
ear)
% o
f T
ota
l T
rib
uta
ry L
oad
Su
lph
ate
(to
n/y
ear)
% o
f T
ota
l T
rib
uta
ry L
oad
Rai
nb
ow
tro
ut
(% M
ort
alit
y)
Dap
hnia
mag
na(%
Mo
rtal
ity)
Ch
emis
try
To
xici
tyS
urv
ival
an
d g
row
th o
f H
yale
lla a
ztec
a a
nd
Chi
rono
mus
ripa
rius
Cal
cite
In
dex
% E
PT
b
% E
ph
emer
op
tera
Dir
ect
Eff
ects
to
In
vert
ebra
tes
(per
iph
yto
n c
on
sum
pti
on
)
Fis
h D
ieta
ry E
xpo
sure
(In
vert
ebra
teC
on
sum
pti
on
)
Bir
d D
ieta
ry E
xpo
sure
(In
vert
ebra
te C
on
sum
pti
on
)
Upstream Fording River (above Henretta
Creek confluence)
FR_UFR1 (P),
1995-2015[E216777]
1000.57
[0 of 67]0.557
0.02[0 of 67]
0.058530
[0 of 67]27.9
0.01[0 of 67]
0.01032004-2012
0.59-3.7
(<0.0007)0.02
-2.2(0.0034)
27.102.2
(0.0014)2004-2012
0.01-28.1
(<0.0001)0.0 0.3 2 0.1 1,767 3 NA NA ND ND 0.0 77 42 0.5 0.6 0.5
Henretta CreekFR_HC1 (P),1995-2015[E216778]
8124
[0 of 67]21.3
6.6[14 of 67]
5.5128
[0 of 68]112
0.017[0 of 67]
0.01862004-2012
2815.6
(<0.0001)6.06
14.1(<0.0001)
124.005.9
(<0.0001)2004-2012
0.02-26.9
(<0.0001)0.6 4 157 5 3,260 6 NA NA
Henretta Lake (n=3 samples): 0/12 metals and 2/16 PAH above high SQG and reference
concentrations in all samples.ND 0.0 82 61 0.6 0.7 0.5
Fish Pond CreekFR_FC1
(NP),2010-2015
NDe NDe ND NDe ND NDe ND NDe ND ND ND ND ND ND ND ND ND ND ND ND ND ND ND ND NA NA ND ND 0.0 NDe NDe NDe NDe NDe
Clode Creek
FR_CC1 (NP),
1995-2015[E102481]
2395
[74 of 74]90.9
33[63 of 73]
29.8260
[0 of 74]261
0.173[3 of 73]
0.362004-2012
1082.4
(0.0191)33.80
7.8(<0.0001)
272.00 NT2004-2012
0.31 NT 0.5 4 157 5 1,253 2 NS, 0, 0, 0 NS, 0, 0, 0
Clode Settling Pond (n=5 samples): 0/12 metals and 2/16 PAH above high SQG and reference concentrations in all samples (1 additional PAH
elevated in 2 of the samples).
ND 0.0 ND ND ND ND ND
LakeMountain
Creek
FR_NGD1 (P),
1995-2015[E105060]
10022
[0 of 67]21.7 1.2
[0 of 67]1.02 114
[0 of 68]99.2 0.0243
[0 of 67]0.0259 2004-
201224
-1.8(0.0033)
1.03-2.6
(0.0115)122.00
-2.1(0.0031)
2004-2012
0.04-18.1
(<0.0001)0.1 1 6 0.2 548 0.9 NA NA ND ND 0.0 71 59 0.5 0.6 0.5
KilmarnockCreek
FR_KC1 (P),1995-2015[200252]
2772
[9 of 16]69.5
34[16 of 16]
32.1160
[0 of 16]155
0.436[16 of 16]
0.439 2004-2012
10018.8
(<0.0001)47.80
17.6(<0.0001)
271.007.9
(<0.0001)2004-2012
0.54 NT 3 23 1,625 54 8,568 15
E208394NS, 0, 0,
NS
E208395NS, 0, NS,
NS
E208394NS, 0, 0,
NS
E208395NS, 0, NS,
NS
ND ND 2.2 8.5 3.1 0.4 0.4 0.3
Swift CreekGH_SC1 (P),
1995-2015[E221329]
46348
[22 of 22]343
24[2 of 22]
25.3847
[20 of 22]845
0.201[0 of 10]
0.6152004-2012
3969.5
(<0.0001)27.20
7(0.0052)
862.009.3
(<0.0001)2009-2012
0.64 NT 2 11 106 4 3,434 60, 0, NS,
ND0, 0, NS,
NDND ND 2.6 65 1.3 1.4 (1.4) 1.6 (1.6) 1.2 (1.2)
Cataract Creek
GH_CC1 (P),
1993-2015[0200384]
7530
[52 of 52]539 34
[0 of 54]32.5 1580
[56 of 57]1530 0.204
[0 of 38]0.325 2004-
2012576
13.8(<0.0001)
34.505.2
(<0.0001)1610.00
15.3(<0.0001)
2008-2012
0.6517.4
(0.0124)1 8 71 2 3,380 6 0, 0, 0, 10
0, 90, 70, 17
ND ND 3.0 NDe 0.0 2.0 (2.0) 2.4 (2.4) 1.8 (1.8)
Porter CreekGH_PC1 (P),
1993-2015[0200385]
7773
[33 of 51]74.7
1.6[0 of 53]
1.89427
[1 of 56418
[278-679]0.015
[0 of 37]
0.0162[0.012-0.027]
2004-2012
70 NT 1.51 NT 428.006
(<0.0001)2008-2012
0.02 NT 0.3 2 5 0.2 1,258 2 0, 0, 0, 0 0, 0, 0, 0 ND ND 0.9 39 0.4 0.4 0.5 0.3
ChaunceyCreek
RG_CH1 (P),
2010-2015100
0.65[0 of 40]
0.6250.05
[0 of 39]0.0965
23[0 of 39]
21.4 - -2010-2012
0.651.7
(0.5580)0.07
-11.0(0.7520)
22-7.8
0.34002010-2012
0.010.0
(1.0000)ND ND ND ND ND ND NA NA ND ND 0.0 80 60 NDe NDe NDe
Ewin CreekLC_EWINTO
DD (NP),2014
NDe NDe ND NDe ND NDe ND NDe ND ND ND ND ND NT ND ND ND ND ND ND ND ND ND ND ND NA NA ND ND ND 91 64 ND ND ND
LCO Dry Creek
LC_DC1 (NP),
2000-2015[E288270]
1001.6
[0 of 30]1.54
0.04[1 of 33]
0.1487.9
[0 of 33]7.83
0.031[0 of 30]
0.03152004-2012
1.6 NT 0.03 NT 7.69 NT2010-2012
0.04 NT ND ND ND ND ND ND10, 0, 0,
ND0, 0, 0, ND ND ND 0.0 89 66 NDe NDe NDe
GHCKU ND ND ND ND ND ND ND ND ND ND ND ND ND ND ND ND ND ND ND ND ND ND ND ND ND ND ND ND ND 0.6 7.5 5.3 0.8 0.9 0.7
GH_GH1 (P),
1993-2015[E102709]
50110
[36 of 52]104
4.4[0 of 54]
3.96596
[33 of 57]497
0.0268[0 of 38]
0.06332004-2012
15118.8
(<0.0001)5.30
21.4(<0.0001)
615.5011.1
(<0.0001)2008-2012
0.0818.9
(0.0303)0.8 6 31 1 3,650 6 0, ND, 0, 0 0, ND, 0, 0 ND ND 0.4 3.0 0.2 1.1 (1.1) 1.3 (1.3) 1.0
NA - Not Applicable; ND - No Data; NT - No trend
Max SQc for Selenium in Periphyton or Invertebrate Tissue (mean SQ in
brackets if max SQ is >1)(Windward et al. 2014)
Wat
er Q
ual
ity
Ind
ex (
WQ
I)(s
ee S
ecti
on
2.0
an
d T
able
2.4
fo
r ex
pla
nat
ion
ab
ou
t h
ow
WQ
I w
as c
om
pu
ted
an
d
def
init
ion
s fo
r co
lou
r ca
teg
ori
es)
Selenium (µg/L) Nitrate-N (mg/L) Sulphate (mg/L)
Dissolved Cadmium (ug/L)
*Not included in WQI Colour categories explained in Table 2.4 and text
Surface Water Acute Toxicity (2015)
(Q1-Q4)Selenium (µg/L) Nitrate-N (mg/L) Sulphate (mg/L) Cadmium (mg/L)
Total Loads (2012)(from Zadjlik and Minnow 2013)
Bold load values are associated with 9+ months of data. Non-bold values should be interpreted with caution.
e Data for this location may be available but were not assessed by Windward et al. (2014).
Sediment Quality (2013)(Minnow 2014b)
Calcite(2013)(from
Windward et al. 2014)
Benthic InvertebrateCommunity
Structure (2012)(Windward et al.
a Based on monitoring data and site-specific targets established in EVWQP for nitrate, sulphate, cadmium and selenium (see Appendices A and D in Windward et al. 2014). b EPT - Ephemeroptera (mayflies), Plecoptera (stoneflies), and Trichoptera (caddisflies).c HQ - Hazard Quotient computed as a ratio of tissue concentration to relevant benchmark (Windward 2014). Values above 1 indicate potential risk.d Quarterly monitoring data will be summarized in December 2015 version for locations monitored quarterly under Permit 107517.
Dat
a P
erio
d f
or
Sel
eniu
m,
Ntt
rate
, an
d S
ulp
hat
e T
ren
ds
Tributary Name Tec
k S
urf
ace
Wat
er Q
ual
ity
Mo
nit
ori
ng
Sta
tio
n(C
od
e, P
erm
itte
d-P
or
No
n-P
erm
itte
d-N
P,
Yea
rs D
ata
Ava
ilab
le,
and
[E
MS
# if
ap
pli
cab
le]) Surface Water Chemistry (2011-2013)
(from Windward et al. 2014)a
Median Concentrations and TrendsBlue- and orange-highlighted cells indicate decreasing and increasing trends, respectively (from
Zadjlik and Minnow 2013).
Greenhills Creek
38
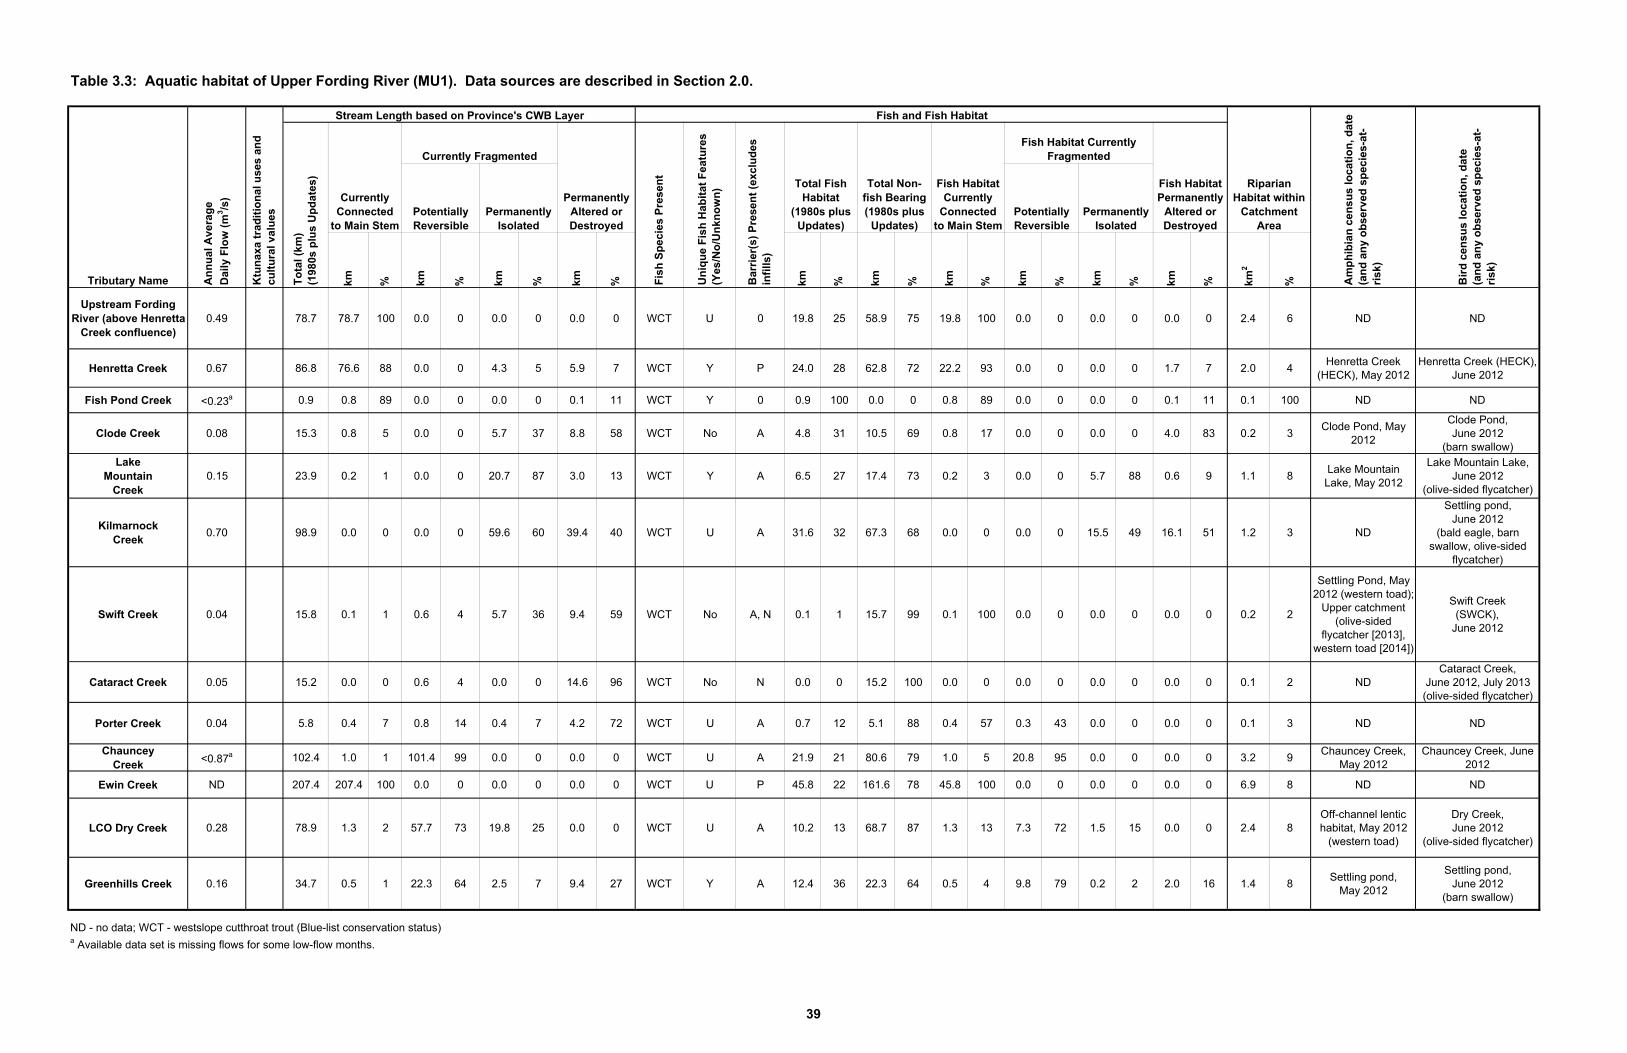
Table 3.3: Aquatic habitat of Upper Fording River (MU1). Data sources are described in Section 2.0.
km % km % km
% km % km % km % km % km % km % km % km2
%
Upstream Fording River (above Henretta
Creek confluence)0.49 78.7 78.7 100 0.0 0 0.0 0 0.0 0 WCT U 0 19.8 25 58.9 75 19.8 100 0.0 0 0.0 0 0.0 0 2.4 6 ND ND
Henretta Creek 0.67 86.8 76.6 88 0.0 0 4.3 5 5.9 7 WCT Y P 24.0 28 62.8 72 22.2 93 0.0 0 0.0 0 1.7 7 2.0 4Henretta Creek
(HECK), May 2012 Henretta Creek (HECK),
June 2012
Fish Pond Creek <0.23a 0.9 0.8 89 0.0 0 0.0 0 0.1 11 WCT Y 0 0.9 100 0.0 0 0.8 89 0.0 0 0.0 0 0.1 11 0.1 100 ND ND
Clode Creek 0.08 15.3 0.8 5 0.0 0 5.7 37 8.8 58 WCT No A 4.8 31 10.5 69 0.8 17 0.0 0 0.0 0 4.0 83 0.2 3Clode Pond, May
2012
Clode Pond,June 2012
(barn swallow)Lake
MountainCreek
0.15 23.9 0.2 1 0.0 0 20.7 87 3.0 13 WCT Y A 6.5 27 17.4 73 0.2 3 0.0 0 5.7 88 0.6 9 1.1 8Lake Mountain Lake, May 2012
Lake Mountain Lake,June 2012
(olive-sided flycatcher)
KilmarnockCreek
0.70 98.9 0.0 0 0.0 0 59.6 60 39.4 40 WCT U A 31.6 32 67.3 68 0.0 0 0.0 0 15.5 49 16.1 51 1.2 3 ND
Settling pond,June 2012
(bald eagle, barn swallow, olive-sided
flycatcher)
Swift Creek 0.04 15.8 0.1 1 0.6 4 5.7 36 9.4 59 WCT No A, N 0.1 1 15.7 99 0.1 100 0.0 0 0.0 0 0.0 0 0.2 2
Settling Pond, May 2012 (western toad);
Upper catchment (olive-sided
flycatcher [2013], western toad [2014])
Swift Creek(SWCK),
June 2012
Cataract Creek 0.05 15.2 0.0 0 0.6 4 0.0 0 14.6 96 WCT No N 0.0 0 15.2 100 0.0 0 0.0 0 0.0 0 0.0 0 0.1 2 NDCataract Creek,
June 2012, July 2013(olive-sided flycatcher)
Porter Creek 0.04 5.8 0.4 7 0.8 14 0.4 7 4.2 72 WCT U A 0.7 12 5.1 88 0.4 57 0.3 43 0.0 0 0.0 0 0.1 3 ND ND
ChaunceyCreek <0.87a 102.4 1.0 1 101.4 99 0.0 0 0.0 0 WCT U A 21.9 21 80.6 79 1.0 5 20.8 95 0.0 0 0.0 0 3.2 9
Chauncey Creek,May 2012
Chauncey Creek, June 2012
Ewin Creek ND 207.4 207.4 100 0.0 0 0.0 0 0.0 0 WCT U P 45.8 22 161.6 78 45.8 100 0.0 0 0.0 0 0.0 0 6.9 8 ND ND
LCO Dry Creek 0.28 78.9 1.3 2 57.7 73 19.8 25 0.0 0 WCT U A 10.2 13 68.7 87 1.3 13 7.3 72 1.5 15 0.0 0 2.4 8Off-channel lentic habitat, May 2012
(western toad)
Dry Creek,June 2012
(olive-sided flycatcher)
Greenhills Creek 0.16 34.7 0.5 1 22.3 64 2.5 7 9.4 27 WCT Y A 12.4 36 22.3 64 0.5 4 9.8 79 0.2 2 2.0 16 1.4 8Settling pond,
May 2012
Settling pond,June 2012
(barn swallow)
ND - no data; WCT - westslope cutthroat trout (Blue-list conservation status)a Available data set is missing flows for some low-flow months.
Potentially Reversible
Permanently Isolated
Permanently Altered or Destroyed
Currently Connected
to Main Stem
Fish Habitat Currently Fragmented
Potentially Reversible
Permanently Isolated
Total Non-fish Bearing(1980s plus
Updates)
Am
ph
ibia
n c
ensu
s lo
cati
on
, dat
e (a
nd
an
y o
bse
rved
sp
ecie
s-at
-ri
sk)
Bir
d c
ensu
s lo
cati
on
, dat
e(a
nd
an
y o
bse
rved
sp
ecie
s-at
-ri
sk)
Tributary Name An
nu
al A
vera
ge
Dai
ly F
low
(m
3/s
)
Ktu
nax
a tr
adit
ion
al u
ses
and
cu
ltu
ral v
alu
es
Fish and Fish HabitatStream Length based on Province's CWB Layer
To
tal (
km)
(198
0s p
lus
Up
dat
es)
Currently Fragmented
Fish Habitat Currently
Connected to Main Stem
Fish Habitat Permanently
Altered or Destroyed
Fis
h S
pec
ies
Pre
sen
t
Un
iqu
e F
ish
Hab
itat
Fea
ture
s (Y
es/N
o/U
nkn
ow
n)
Bar
rier
(s)
Pre
sen
t (e
xclu
des
in
fills
)
Total Fish Habitat
(1980s plus Updates)
Riparian Habitat within
Catchment Area
39
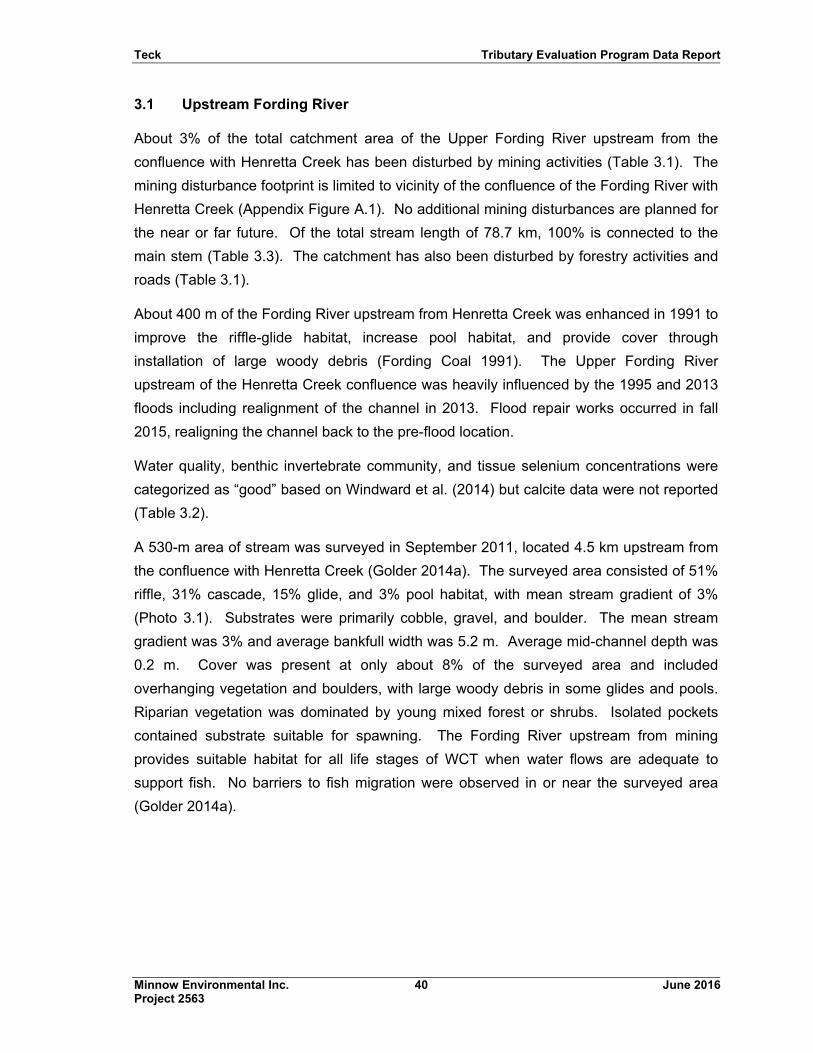
Teck Tributary Evaluation Program Data Report
Minnow Environmental Inc. 40 June 2016 Project 2563
3.1 Upstream Fording River
About 3% of the total catchment area of the Upper Fording River upstream from the
confluence with Henretta Creek has been disturbed by mining activities (Table 3.1). The
mining disturbance footprint is limited to vicinity of the confluence of the Fording River with
Henretta Creek (Appendix Figure A.1). No additional mining disturbances are planned for
the near or far future. Of the total stream length of 78.7 km, 100% is connected to the
main stem (Table 3.3). The catchment has also been disturbed by forestry activities and
roads (Table 3.1).
About 400 m of the Fording River upstream from Henretta Creek was enhanced in 1991 to
improve the riffle-glide habitat, increase pool habitat, and provide cover through
installation of large woody debris (Fording Coal 1991). The Upper Fording River
upstream of the Henretta Creek confluence was heavily influenced by the 1995 and 2013
floods including realignment of the channel in 2013. Flood repair works occurred in fall
2015, realigning the channel back to the pre-flood location.
Water quality, benthic invertebrate community, and tissue selenium concentrations were
categorized as “good” based on Windward et al. (2014) but calcite data were not reported
(Table 3.2).
A 530-m area of stream was surveyed in September 2011, located 4.5 km upstream from
the confluence with Henretta Creek (Golder 2014a). The surveyed area consisted of 51%
riffle, 31% cascade, 15% glide, and 3% pool habitat, with mean stream gradient of 3%
(Photo 3.1). Substrates were primarily cobble, gravel, and boulder. The mean stream
gradient was 3% and average bankfull width was 5.2 m. Average mid-channel depth was
0.2 m. Cover was present at only about 8% of the surveyed area and included
overhanging vegetation and boulders, with large woody debris in some glides and pools.
Riparian vegetation was dominated by young mixed forest or shrubs. Isolated pockets
contained substrate suitable for spawning. The Fording River upstream from mining
provides suitable habitat for all life stages of WCT when water flows are adequate to
support fish. No barriers to fish migration were observed in or near the surveyed area
(Golder 2014a).
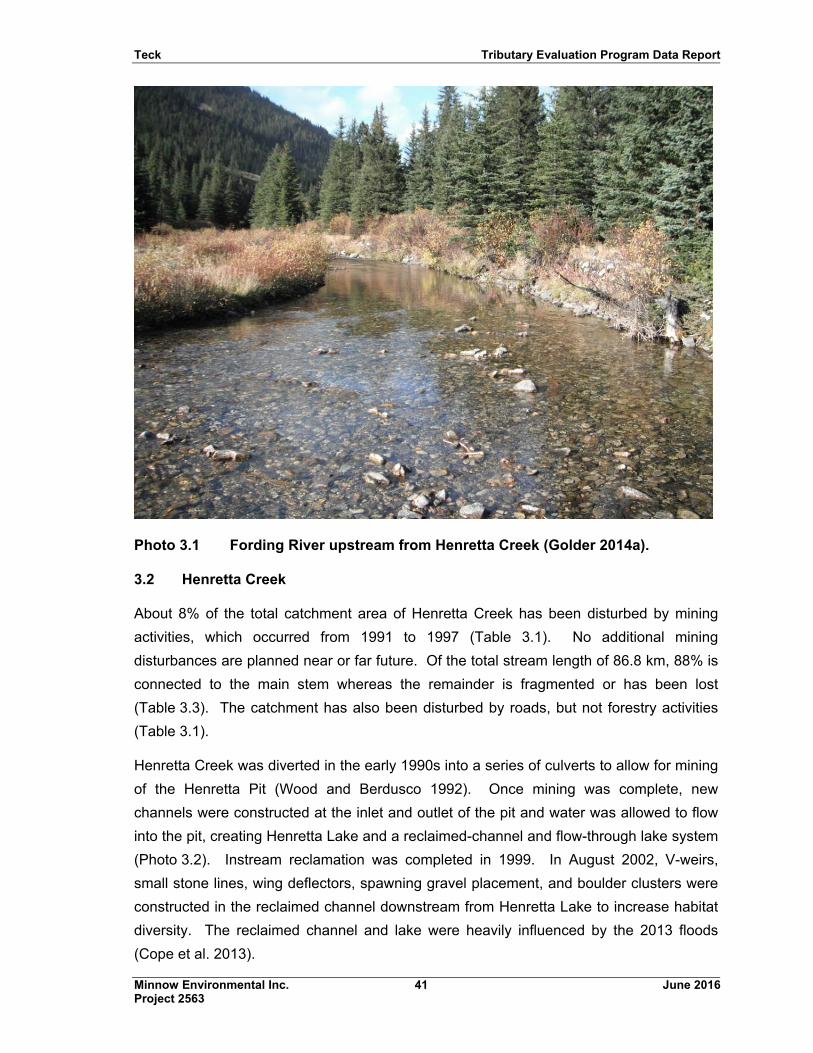
Teck Tributary Evaluation Program Data Report
Minnow Environmental Inc. 41 June 2016 Project 2563
Photo 3.1 Fording River upstream from Henretta Creek (Golder 2014a).
3.2 Henretta Creek
About 8% of the total catchment area of Henretta Creek has been disturbed by mining
activities, which occurred from 1991 to 1997 (Table 3.1). No additional mining
disturbances are planned near or far future. Of the total stream length of 86.8 km, 88% is
connected to the main stem whereas the remainder is fragmented or has been lost
(Table 3.3). The catchment has also been disturbed by roads, but not forestry activities
(Table 3.1).
Henretta Creek was diverted in the early 1990s into a series of culverts to allow for mining
of the Henretta Pit (Wood and Berdusco 1992). Once mining was complete, new
channels were constructed at the inlet and outlet of the pit and water was allowed to flow
into the pit, creating Henretta Lake and a reclaimed-channel and flow-through lake system
(Photo 3.2). Instream reclamation was completed in 1999. In August 2002, V-weirs,
small stone lines, wing deflectors, spawning gravel placement, and boulder clusters were
constructed in the reclaimed channel downstream from Henretta Lake to increase habitat
diversity. The reclaimed channel and lake were heavily influenced by the 2013 floods
(Cope et al. 2013).
Teck Tributary Evaluation Program Data Report
Minnow Environmental Inc. 42 June 2016 Project 2563
Photo 3.2: Henretta Lake (Wright et al. 2005).
Water quality, benthic invertebrate community, and tissue selenium concentrations were
characterized as “good”, based on Windward et al. (2014), but calcite data were not
reported (Table 3.2). However, increasing trends in the concentrations of selenium,
nitrate, and sulphate have been reported (Zadjlik and Minnow 2013; Figure 3.2).
Fish and fish habitat were monitored for seven years (1999 to 2006) along the reclaimed
channel (Golder 2014a). Surveys conducted in the early 2000s reported that the
reclaimed portions of stream were dominated by riffles (55%) and glides (45%) with
substrate of cobble and large gravel, gradient of 1.5%, and average depth of about 0.5 m.
The substrate was considered too large for WCT spawning and lacking in habitat
complexity and resting cover, with the exception of one relatively deep glide and one pool
downstream from Henretta Lake (Golder 2014a). Henretta Lake (area of 3.3 ha, mean
depth 4.2 m), which is located about 800 m upstream from the Fording River confluence,
is a high use area for WCT overwintering (Cope et al. 2014). WCT have been captured in
all reaches of Henretta Creek but adult densities are considered to be low upstream from
Henretta Lake (Golder 2014a).
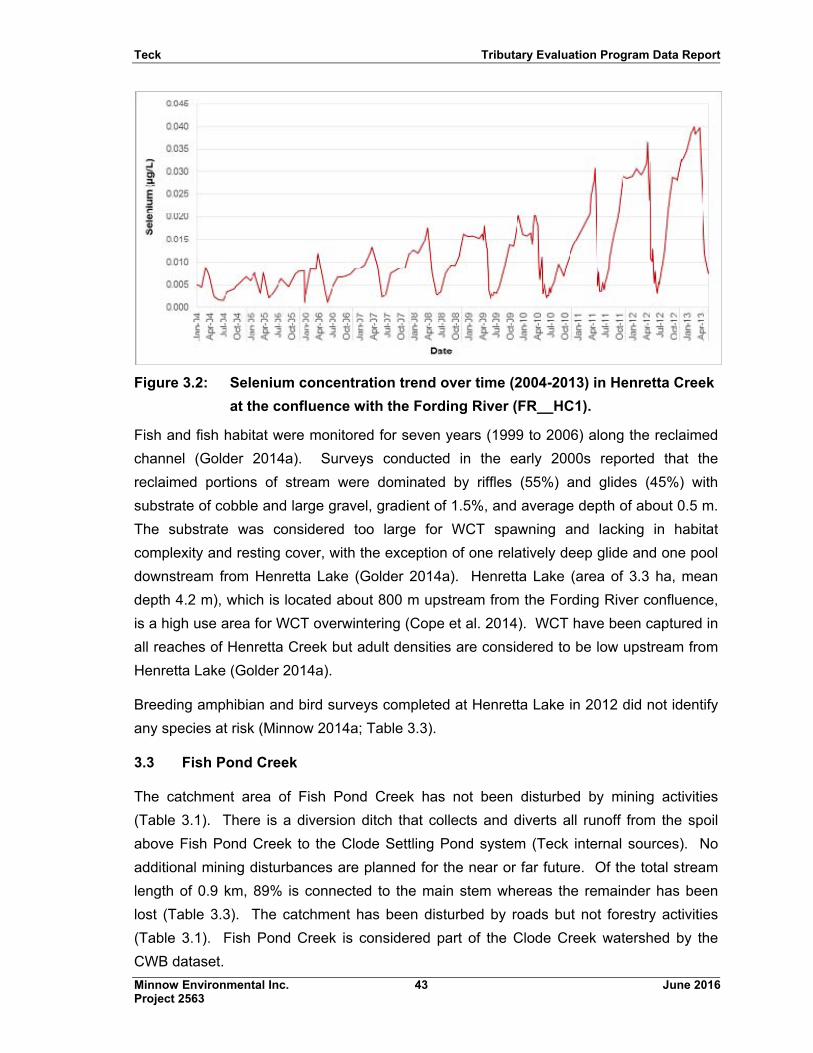
Teck Tributary Evaluation Program Data Report
Minnow Environmental Inc. 43 June 2016 Project 2563
Figure 3.2: Selenium concentration trend over time (2004-2013) in Henretta Creek
at the confluence with the Fording River (FR__HC1).
Fish and fish habitat were monitored for seven years (1999 to 2006) along the reclaimed
channel (Golder 2014a). Surveys conducted in the early 2000s reported that the
reclaimed portions of stream were dominated by riffles (55%) and glides (45%) with
substrate of cobble and large gravel, gradient of 1.5%, and average depth of about 0.5 m.
The substrate was considered too large for WCT spawning and lacking in habitat
complexity and resting cover, with the exception of one relatively deep glide and one pool
downstream from Henretta Lake (Golder 2014a). Henretta Lake (area of 3.3 ha, mean
depth 4.2 m), which is located about 800 m upstream from the Fording River confluence,
is a high use area for WCT overwintering (Cope et al. 2014). WCT have been captured in
all reaches of Henretta Creek but adult densities are considered to be low upstream from
Henretta Lake (Golder 2014a).
Breeding amphibian and bird surveys completed at Henretta Lake in 2012 did not identify
any species at risk (Minnow 2014a; Table 3.3).
3.3 Fish Pond Creek
The catchment area of Fish Pond Creek has not been disturbed by mining activities
(Table 3.1). There is a diversion ditch that collects and diverts all runoff from the spoil
above Fish Pond Creek to the Clode Settling Pond system (Teck internal sources). No
additional mining disturbances are planned for the near or far future. Of the total stream
length of 0.9 km, 89% is connected to the main stem whereas the remainder has been
lost (Table 3.3). The catchment has been disturbed by roads but not forestry activities
(Table 3.1). Fish Pond Creek is considered part of the Clode Creek watershed by the
CWB dataset.
Teck Tributary Evaluation Program Data Report
Minnow Environmental Inc. 44 June 2016 Project 2563
Fish Pond Creek was targeted for enhancement in the 1980s through 1991 to
compensate for effects of mining on Henretta Creek (Wood and Berdusco 1999). This
included the construction of overwintering and pocket pools, the addition of spawning
gravels, and the addition of various types of riparian vegetation and cover.
No data were presented by Windward et al. (2014) respecting water quality, benthic
invertebrate community, calcite levels, or tissue selenium concentrations (Table 3.2).
Fish Pond Creek flows east of and parallel to the Fording River through a wide, flat valley
bottom, which is believed to have groundwater influence based on stable, cool water
temperatures (Golder 2014a). Fish and fish habitat information was collected to evaluate
the effectiveness of enhancement actions in Fish Pond Creek between 1995 and 2002
(i.e. Allan 1996; Amos et al. 2002; Amos and Wright 2000, 2002). The head pond has
historically been used by cutthroat trout for overwintering and was deepened in the 1980s
and enhanced with natural cover (i.e., root wads and rock groupings; Wood and Berdsuco
1999). The creek is considered to provide some of the highest overall habitat quality in
the Fording River watershed for all life stages of westslope cutthroat trout, with
consistently high population estimates and numerous redds observed (Golder 2014a).
Extensive flooding in June 2013 compromised much of the habitat within the creek (Cope
et al. 2014).
3.4 Clode Creek
About 65% of the total catchment area of Clode Creek has been disturbed by mining
activities (Table 3.1; Photo 3.3). Mining is continuing within the permit boundary and is
planned to continue in the near and far future. Of the total stream length of 15.3 km, 5%
is connected to the main stem whereas the remainder is fragmented or has been lost
(Table 3.3). The catchment has also been disturbed by roads but not forestry activities
(Table 3.1).
The lower portion of the creek has been moved from its original confluence with the
Fording River. On topographic maps based on aerial imagery from 1972, Clode Creek
entered the Fording River where the Eagle Sediment Ponds are currently located. The
CWB dataset has Clode Creek flowing into Fish Pond Creek. However, Clode Creek has
been diverted into the Clode Settlement Pond system adjacent to Fish Pond Creek. The
remaining, lower portion of the creek consists of the East Settling Pond (180m x 34m,
mean depth 2 m), the Main Settling Pond (150m x 280m; mean depth 2-3 m; collectively
referred to as Clode Ponds), and the 100-m section of Clode Creek that discharges from
the Main Settling Pond to the Fording River (Golder 2014a). The Clode Ponds were
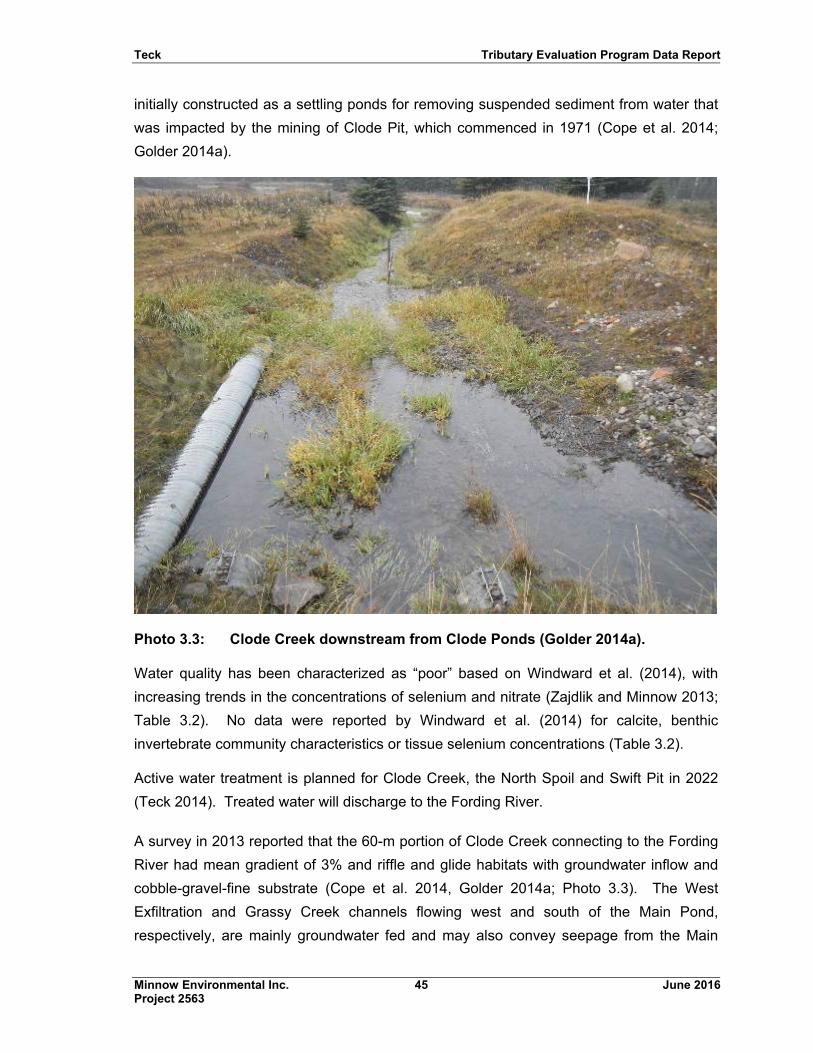
Teck Tributary Evaluation Program Data Report
Minnow Environmental Inc. 45 June 2016 Project 2563
initially constructed as a settling ponds for removing suspended sediment from water that
was impacted by the mining of Clode Pit, which commenced in 1971 (Cope et al. 2014;
Golder 2014a).
Photo 3.3: Clode Creek downstream from Clode Ponds (Golder 2014a).
Water quality has been characterized as “poor” based on Windward et al. (2014), with
increasing trends in the concentrations of selenium and nitrate (Zajdlik and Minnow 2013;
Table 3.2). No data were reported by Windward et al. (2014) for calcite, benthic
invertebrate community characteristics or tissue selenium concentrations (Table 3.2).
Active water treatment is planned for Clode Creek, the North Spoil and Swift Pit in 2022
(Teck 2014). Treated water will discharge to the Fording River.
A survey in 2013 reported that the 60-m portion of Clode Creek connecting to the Fording
River had mean gradient of 3% and riffle and glide habitats with groundwater inflow and
cobble-gravel-fine substrate (Cope et al. 2014, Golder 2014a; Photo 3.3). The West
Exfiltration and Grassy Creek channels flowing west and south of the Main Pond,
respectively, are mainly groundwater fed and may also convey seepage from the Main
Teck Tributary Evaluation Program Data Report
Minnow Environmental Inc. 46 June 2016 Project 2563
Pond. The area around the Clode Ponds and outflow channels is sometimes referred to
as “Clode Flats”. Prior to 1980, large aggregations of fluvial migratory westslope cutthroat
trout were identified as overwintering within the groundwater influenced Clode Flats area.
Radio tagged fish (n=6) were documented over-wintering at the confluence of Clode
Creek and West Exfiltration Creek in both 2013 and 2014 (Cope et al. 2014). Spawning
surveys have also identified westslope cutthroat trout redds in lower Clode Creek.
Clode Pond consistently retains water, and vegetation has grown over a large portion of
the bottom sediments, making it an ideal rearing ground for westslope cutthroat trout
(Wood and Berdusco 1999). After construction of the Clode Ponds, westslope cutthroat
trout moved freely between the Fording River and the ponds (Cope et al. 2014). In 2003,
the Turnbull South Pit and Spoil Development Application was submitted to reviewing
agencies and approved for construction. In the application, it was determined that the
East Pond, Main Pond and connecting portion of Clode Creek were going to be directly
impacted by spoil (Golder 2014a). In 2004, screens were installed at the seven outflow
culverts from the Main Pond to deter fish passage, and a large-scale fish salvage
operation was completed (2004 and 2005), which moved almost 6,000 trout from the
ponds into the upper Fording River and Fish Pond Creek. However, the salvage did not
capture all fish and some culvert screens subsequently failed (which have since been
repaired). Also, fish likely re-entered the pond during the record flood in June 2013.
Therefore, some westslope cutthroat trout remain the in the ponds (Golder 2014a).
Barn swallow was the only species at risk identified in breeding amphibian and bird
surveys completed at Clode Pond in 2012 (Minnow 2014a; Table 3.3).
3.5 Lake Mountain Creek
Lake Mountain Creek flows out of the southern end of Lake Mountain Lake and flows in a
southeasterly direction into the Fording River (Golder 2014a). About 27% of the total
catchment area of Lake Mountain Creek has been disturbed by mining (Table 3.1).
Specific portions of the upper Lake Mountain Creek watershed, referred to as the Lake
Mountain Spoil, are included in a Memorandum of Agreement (MOA) that documents
historically authorized mining activities affecting watercourses in Teck’s area of operations
in the Elk Valley (Teck et al. 2011). Gradual watershed fragmentation will occur in the
future due to mining (e.g., dewatering, pits, waste rock storage, clean water diversions,
and collection of mine-influenced water) as part of the Fording-Swift Project (Table 3.1).
Of the total stream length of 23.9 km, 1% is connected to the main stem whereas the
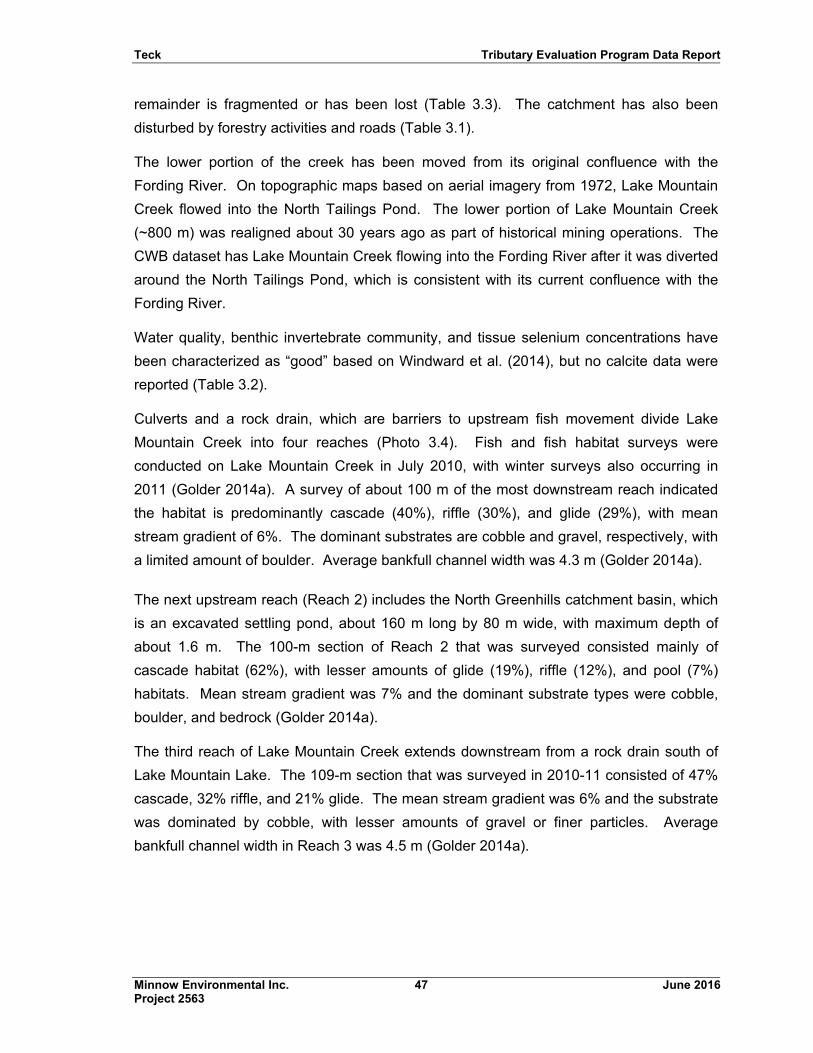
Teck Tributary Evaluation Program Data Report
Minnow Environmental Inc. 47 June 2016 Project 2563
remainder is fragmented or has been lost (Table 3.3). The catchment has also been
disturbed by forestry activities and roads (Table 3.1).
The lower portion of the creek has been moved from its original confluence with the
Fording River. On topographic maps based on aerial imagery from 1972, Lake Mountain
Creek flowed into the North Tailings Pond. The lower portion of Lake Mountain Creek
(~800 m) was realigned about 30 years ago as part of historical mining operations. The
CWB dataset has Lake Mountain Creek flowing into the Fording River after it was diverted
around the North Tailings Pond, which is consistent with its current confluence with the
Fording River.
Water quality, benthic invertebrate community, and tissue selenium concentrations have
been characterized as “good” based on Windward et al. (2014), but no calcite data were
reported (Table 3.2).
Culverts and a rock drain, which are barriers to upstream fish movement divide Lake
Mountain Creek into four reaches (Photo 3.4). Fish and fish habitat surveys were
conducted on Lake Mountain Creek in July 2010, with winter surveys also occurring in
2011 (Golder 2014a). A survey of about 100 m of the most downstream reach indicated
the habitat is predominantly cascade (40%), riffle (30%), and glide (29%), with mean
stream gradient of 6%. The dominant substrates are cobble and gravel, respectively, with
a limited amount of boulder. Average bankfull channel width was 4.3 m (Golder 2014a).
The next upstream reach (Reach 2) includes the North Greenhills catchment basin, which
is an excavated settling pond, about 160 m long by 80 m wide, with maximum depth of
about 1.6 m. The 100-m section of Reach 2 that was surveyed consisted mainly of
cascade habitat (62%), with lesser amounts of glide (19%), riffle (12%), and pool (7%)
habitats. Mean stream gradient was 7% and the dominant substrate types were cobble,
boulder, and bedrock (Golder 2014a).
The third reach of Lake Mountain Creek extends downstream from a rock drain south of
Lake Mountain Lake. The 109-m section that was surveyed in 2010-11 consisted of 47%
cascade, 32% riffle, and 21% glide. The mean stream gradient was 6% and the substrate
was dominated by cobble, with lesser amounts of gravel or finer particles. Average
bankfull channel width in Reach 3 was 4.5 m (Golder 2014a).
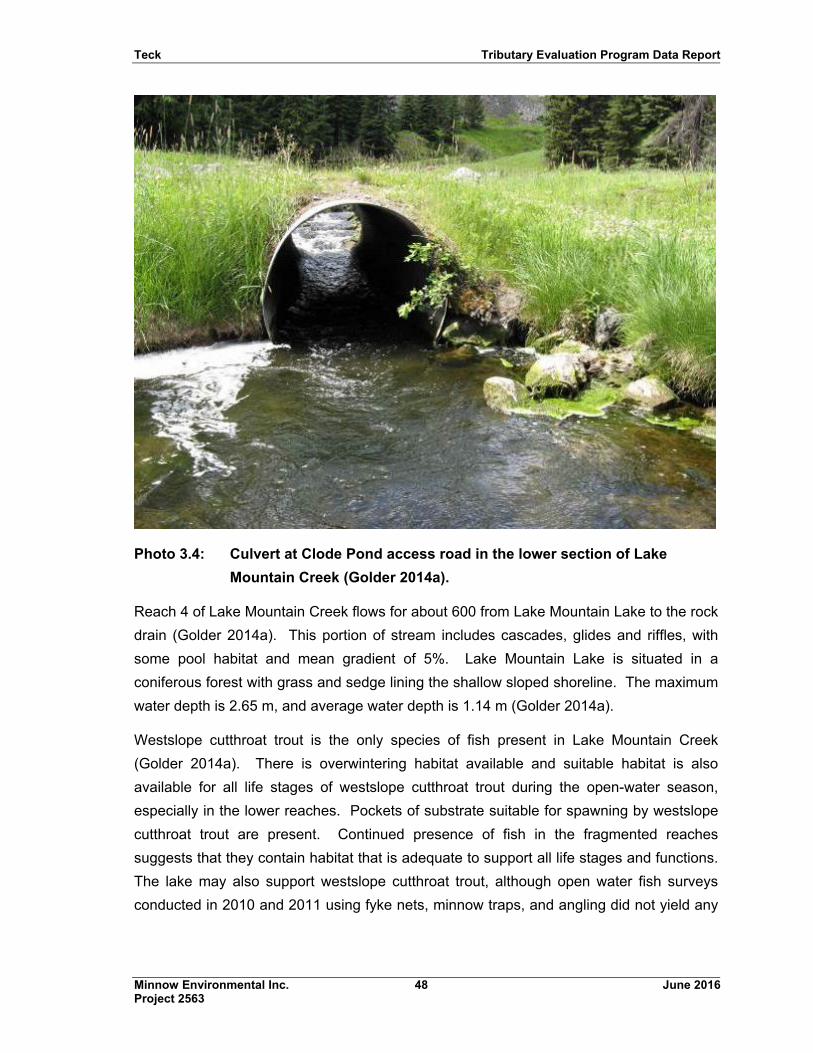
Teck Tributary Evaluation Program Data Report
Minnow Environmental Inc. 48 June 2016 Project 2563
Photo 3.4: Culvert at Clode Pond access road in the lower section of Lake
Mountain Creek (Golder 2014a).
Reach 4 of Lake Mountain Creek flows for about 600 from Lake Mountain Lake to the rock
drain (Golder 2014a). This portion of stream includes cascades, glides and riffles, with
some pool habitat and mean gradient of 5%. Lake Mountain Lake is situated in a
coniferous forest with grass and sedge lining the shallow sloped shoreline. The maximum
water depth is 2.65 m, and average water depth is 1.14 m (Golder 2014a).
Westslope cutthroat trout is the only species of fish present in Lake Mountain Creek
(Golder 2014a). There is overwintering habitat available and suitable habitat is also
available for all life stages of westslope cutthroat trout during the open-water season,
especially in the lower reaches. Pockets of substrate suitable for spawning by westslope
cutthroat trout are present. Continued presence of fish in the fragmented reaches
suggests that they contain habitat that is adequate to support all life stages and functions.
The lake may also support westslope cutthroat trout, although open water fish surveys
conducted in 2010 and 2011 using fyke nets, minnow traps, and angling did not yield any
Teck Tributary Evaluation Program Data Report
Minnow Environmental Inc. 49 June 2016 Project 2563
fish. Under-ice dissolved oxygen levels were low in the lake (0.08 to 1.51 mg/L) indicating
low likelihood for successful fish overwintering (Golder 2014a).
Olive-sided flycatcher was the only species at risk identified in breeding amphibian and
bird surveys completed at Lake Mountain Lake in 2012 (Minnow 2014a; Table 3.3).
3.6 Kilmarnock Creek
About 30% of the total catchment area of Kilmarnock Creek has been disturbed by mining
activities (Table 3.1). Mining is currently occurring within the permit boundary and will
continue in the near and far future (Table 3.1). All of the stream length of 98.9 km is
fragmented or has been lost (Table 3.3). The catchment has also been disturbed by
forestry activities and roads (Table 3.1).
The upper reaches of Kilmarnock Creek (and the most upstream portion of Brownie
Creek) remain relatively undisturbed apart from adjacent forest harvesting (Table 3.1).
The lower reaches have been disturbed by mining and forestry (Fording Coal 1985;
Golder 2014a,b). Kilmarnock Creek flows through a rock drain, as well as a settling pond
system that was constructed in 1989. This is a conventional settling pond, where a
portion of the total flow infiltrates to ground and the pond is empty for most of the year.
Water quality and benthic invertebrate community was characterized as “poor” based on
Windward et al. (2014), with increasing trends in the concentrations of selenium, nitrate
and sulphate (Zadjlik and Minnow 2013; Table 3.2). Tissue selenium concentrations have
been characterized as “good” (Windward et al. 2014; Table 3.2). High levels of calcite
have been reported (calcite index: 2.2).
The EVWQP committed to the construction of Active Water Treatment Facilities (AWTF)
to manage water associated with the existing and future coal mining development (Golder
2014d). The FRO South AWTF will be commissioned in 2018 and will include treatment
of water from Kilmarnock Creek.
Historically (e.g., 1952), the channel geomorphology of Kilmarnock Creek was
meandering, transitioning from a confined to wide valley, with braiding on the alluvial fan
where the tributary met with Fording River (Golder 2014b). Riparian vegetation was
primarily established forest. Avalanche paths connected directly to the channel in upper
reaches but less so in lower reaches where the valley widened. Prior to 1980, large
aggregations of fluvial migratory westslope cutthroat trout were identified within
Kilmarnock Creek (Cope et al. 2014). The lower portion of the creek prior to the
construction of the sediment pond system was characterized by shallow riffles and
Teck Tributary Evaluation Program Data Report
Minnow Environmental Inc. 50 June 2016 Project 2563
moderately deep glides (Fording Coal 1985). Some overwintering habitat was present in
Kilmarnock Creek prior to the construction of the sediment pond system (Fording
Coal 1985).
The lower section of Kilmarnock Creek has been substantially altered and portions are
buried. As the creek approaches the mine footprint it braids prior to discharging into a
lake formed against the edge of a waste rock spoil that has buried the stream channel.
This permitted habitat loss occurred in the late 1980’s as part of the Eagle Mountain
Project. (Cope et al. 2014). An isolated population of westslope cutthroat trout remains
in Kilmarnock Creek upstream from the rock drain (Golder 2014a). There are no fish
present in the Kilmarnock settling pond system. About 3,870 m of Brownie Creek and
associated streams were assessed in November 2002 and June 2003 (Edebum 2003 and
Berdusco 2003). Despite habitat suitable for overwintering (Edeburn 2003), no fish were
captured or observed (Berdusco 2003). The remainder of Brownie Creek and its
tributaries were considered non-fish bearing due to a gradient barrier to upstream fish
migration and a lack of suitable habitat in 2002 (Edeburn 2003).
Bald eagle, barn swallow and olive-sided flycatcher are species at risk that were identified
in breeding amphibian and bird surveys completed at Kilmarnock settling ponds in 2012
(Minnow 2014a; Table 3.3).
3.7 Swift Creek
About 49% of the total catchment area of Swift Creek has been disturbed by mining
activities (Table 3.1). Additional mining and water management activities will occur in the
future as part of the Fording-Swift Project (Table 3.1). Of the total stream length of
15.8 km, 1% is connected to the main stem whereas the remainder is fragmented or has
been lost (Table 3.3). The catchment has also been disturbed by forestry activities and
roads (Table 3.1).
Water quality and the benthic invertebrate community was characterized as “poor” based
on Windward et al. (2014), with increasing trends in the concentrations of selenium, nitrate
and sulphate (Zadjlik and Minnow 2013; Table 3.2). Tissue selenium concentrations were
characterized as “good” (Table 3.2). High levels of calcite were reported (calcite
index: 2.2).
The EVWQp committed to the construction of AWTFs to manage water associated with
the existing and future coal mining development (Golder 2014d). The FRO South AWTF
will be commissioned in 2018 and will include treatment of water from Swift Creek.
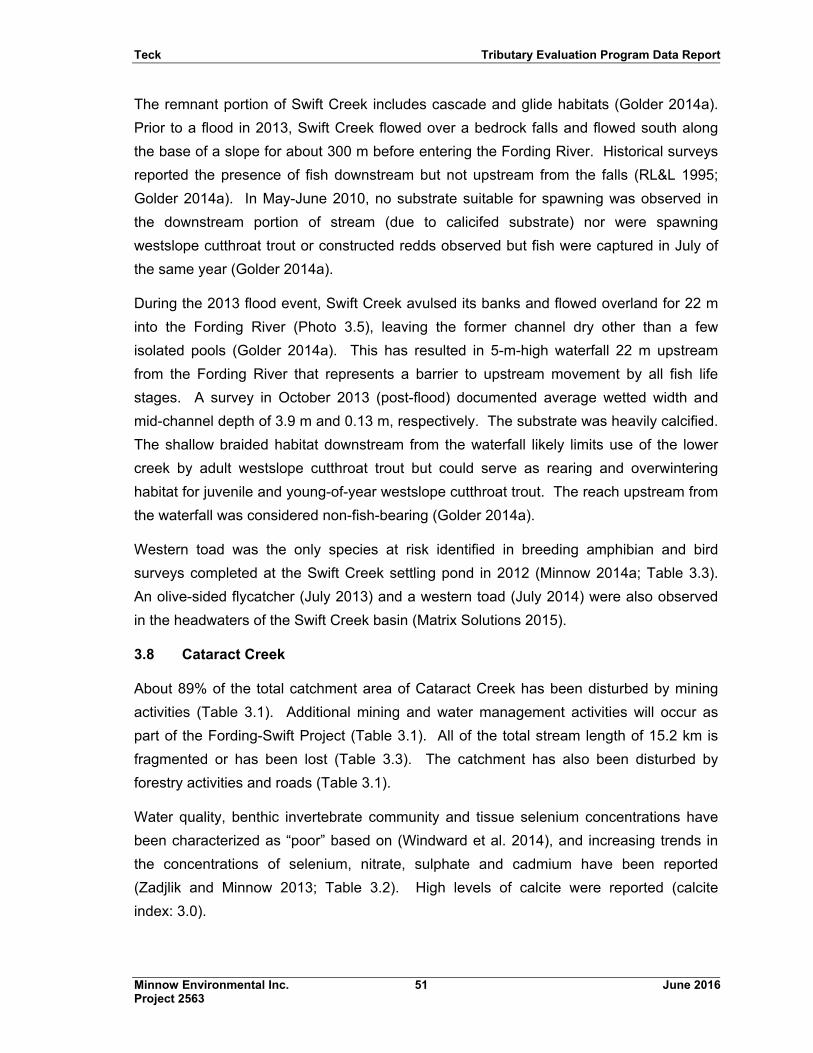
Teck Tributary Evaluation Program Data Report
Minnow Environmental Inc. 51 June 2016 Project 2563
The remnant portion of Swift Creek includes cascade and glide habitats (Golder 2014a).
Prior to a flood in 2013, Swift Creek flowed over a bedrock falls and flowed south along
the base of a slope for about 300 m before entering the Fording River. Historical surveys
reported the presence of fish downstream but not upstream from the falls (RL&L 1995;
Golder 2014a). In May-June 2010, no substrate suitable for spawning was observed in
the downstream portion of stream (due to calicifed substrate) nor were spawning
westslope cutthroat trout or constructed redds observed but fish were captured in July of
the same year (Golder 2014a).
During the 2013 flood event, Swift Creek avulsed its banks and flowed overland for 22 m
into the Fording River (Photo 3.5), leaving the former channel dry other than a few
isolated pools (Golder 2014a). This has resulted in 5-m-high waterfall 22 m upstream
from the Fording River that represents a barrier to upstream movement by all fish life
stages. A survey in October 2013 (post-flood) documented average wetted width and
mid-channel depth of 3.9 m and 0.13 m, respectively. The substrate was heavily calcified.
The shallow braided habitat downstream from the waterfall likely limits use of the lower
creek by adult westslope cutthroat trout but could serve as rearing and overwintering
habitat for juvenile and young-of-year westslope cutthroat trout. The reach upstream from
the waterfall was considered non-fish-bearing (Golder 2014a).
Western toad was the only species at risk identified in breeding amphibian and bird
surveys completed at the Swift Creek settling pond in 2012 (Minnow 2014a; Table 3.3).
An olive-sided flycatcher (July 2013) and a western toad (July 2014) were also observed
in the headwaters of the Swift Creek basin (Matrix Solutions 2015).
3.8 Cataract Creek
About 89% of the total catchment area of Cataract Creek has been disturbed by mining
activities (Table 3.1). Additional mining and water management activities will occur as
part of the Fording-Swift Project (Table 3.1). All of the total stream length of 15.2 km is
fragmented or has been lost (Table 3.3). The catchment has also been disturbed by
forestry activities and roads (Table 3.1).
Water quality, benthic invertebrate community and tissue selenium concentrations have
been characterized as “poor” based on (Windward et al. 2014), and increasing trends in
the concentrations of selenium, nitrate, sulphate and cadmium have been reported
(Zadjlik and Minnow 2013; Table 3.2). High levels of calcite were reported (calcite
index: 3.0).
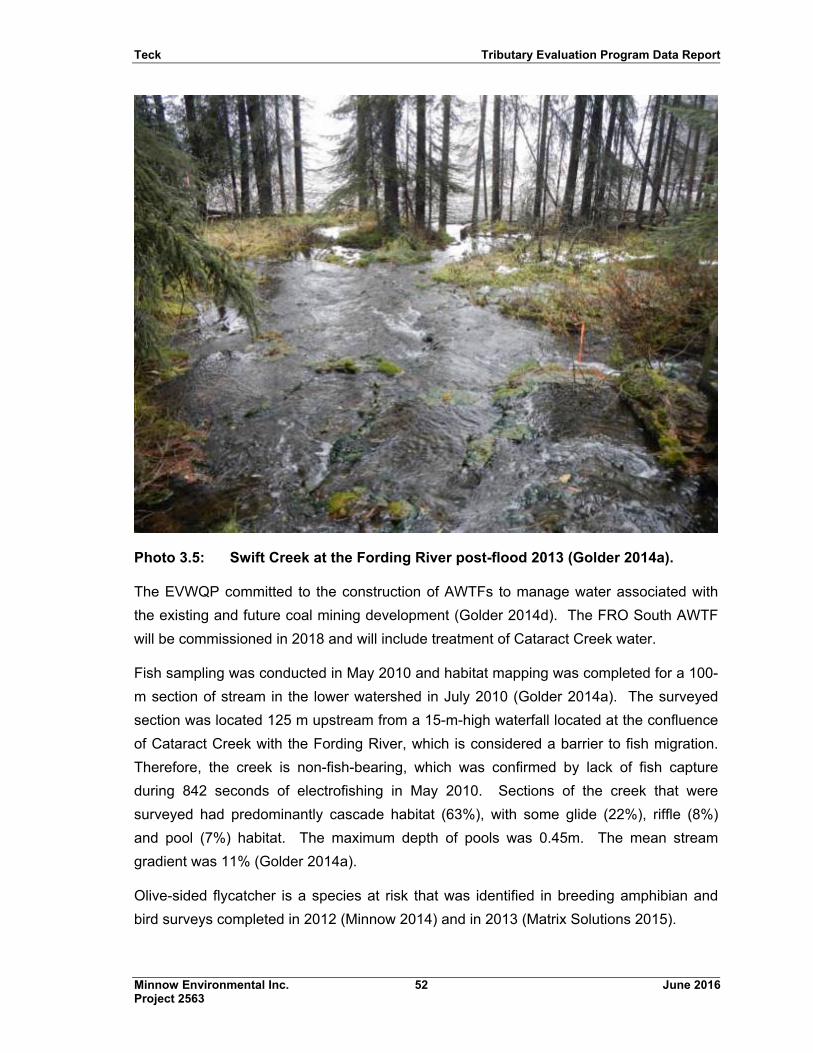
Teck Tributary Evaluation Program Data Report
Minnow Environmental Inc. 52 June 2016 Project 2563
Photo 3.5: Swift Creek at the Fording River post-flood 2013 (Golder 2014a).
The EVWQP committed to the construction of AWTFs to manage water associated with
the existing and future coal mining development (Golder 2014d). The FRO South AWTF
will be commissioned in 2018 and will include treatment of Cataract Creek water.
Fish sampling was conducted in May 2010 and habitat mapping was completed for a 100-
m section of stream in the lower watershed in July 2010 (Golder 2014a). The surveyed
section was located 125 m upstream from a 15-m-high waterfall located at the confluence
of Cataract Creek with the Fording River, which is considered a barrier to fish migration.
Therefore, the creek is non-fish-bearing, which was confirmed by lack of fish capture
during 842 seconds of electrofishing in May 2010. Sections of the creek that were
surveyed had predominantly cascade habitat (63%), with some glide (22%), riffle (8%)
and pool (7%) habitat. The maximum depth of pools was 0.45m. The mean stream
gradient was 11% (Golder 2014a).
Olive-sided flycatcher is a species at risk that was identified in breeding amphibian and
bird surveys completed in 2012 (Minnow 2014) and in 2013 (Matrix Solutions 2015).
Teck Tributary Evaluation Program Data Report
Minnow Environmental Inc. 53 June 2016 Project 2563
3.9 Porter Creek
About 68% of the total catchment area of Porter Creek has been disturbed by mining
activities (Table 3.1). Mining is currently occurring within the permit boundary and will
continue in the near and far future (Table 3.1). Of the total stream length of 5.8 km, 7% is
connected to the main stem whereas the remainder is fragmented or has been lost
(Table 3.3). The catchment has also been disturbed by forestry activities and roads
(Table 3.1).
Water quality was characterized as “fair”, the benthic invertebrate community was
characterized as “poor”, and tissue selenium concentrations were characterized as “good”
based on Windward et al. (2014; Table 3.2). An increasing trend in the concentration of
sulphate was reported, while no trends were observed in the concentrations of selenium,
nitrate, or cadmium (Zadjlik and Minnow 2013; Table 3.2). Low levels of calcite have
been reported in Porter Creek (calcite index: 0.9).
The settling pond was likely built as part of the Greenhills Surface Coal Mining Project
after 1981. The portion of the creek between the settling pond and the Fording River is
assumed to be fish-bearing because no barriers are present. No fish were captured in
325 m of channel that was electrofished in September 1979 and field observations
indicated the creek had low fish potential (BC Research 1981).
3.10 Chauncey Creek
None of the catchment area of Chauncey Creek has been disturbed by mining activities
and is not expected to be in the future (Table 3.1). Of the total stream length of 102.4 km,
1% is connected to the mainstem and the remainder is fragmented (Table 3.3). The
catchment has also been disturbed by forestry (Table 3.1) and road construction
(Golder 2014b).
Water quality and the benthic invertebrate community were characterized as “good” based
on Windward et al. (2014; Table 3.2). Tissue selenium concentrations were not reported
for Chauncey Creek but are likely comparable to other regional streams that have not
been affected by mining (e.g., “good”; Table 3.2). No calcite was observed in the creek.
Five sections of Chauncey Creek were surveyed in August 1995 to identify the number of
reaches, stream channel widths and gradients, fish distribution and identification of
species present (Russell and Oliver 1996). In the downstream section of the creek, about
200 m downstream from the highway and near the confluence with the Fording River, the
gradient was low at 1% and the average channel width was 8.5 m. The surveyed section
Teck Tributary Evaluation Program Data Report
Minnow Environmental Inc. 54 June 2016 Project 2563
was predominantly pool/glide features with abundant gravel substrate suitable for
westslope cutthroat trout. A second area was sampled 1 km upstream from a logging
road bridge crossing, and was characterized by a slightly steeper gradient (3%), a
narrower channel width (6.9 m), equal proportion of riffle, pool and run habitats, and
substrates of boulder and gravel. The upper sections of the creek increased in gradient
from 2% to 20%, contained intermittent subsurface flow with increasing substrate size.
Riparian vegetation was typically mixed forest with some sections dominated by shrubs
(e.g., willow, alder, fir and spruce; Russell and Oliver 1996).
The culvert at the Chauncey Creek crossing of the Fording River Road is a barrier to
westslope cutthroat trout migration (Russell and Oliver 1996). Relatively high densities of
westslope cutthroat trout are found in the Fording River in the vicinity of Chauncey Creek
where the habitat is dominated by deep pools, and high juvenile densities have been
observed in Chauncey Creek downstream from the culvert (Cope et al. 2014). By
comparison very low densities of both juvenile and mature westslope cutthroat trout are
present in upper Chauncey Creek. Restoring the connectivity of the mainstem Fording
River to the tributary habitat of Chauncey Creek represents an opportunity for habitat
improvement in the upper Fording River watershed (Cope et al. 2014).
No species at risk were identified in breeding amphibian and bird surveys conducted at an
area in lower Chauncey Creek in 2012 (Minnow 2014a; Table 3.3).
3.11 Ewin Creek
None of the catchment area of Ewin Creek has been disturbed by mining activities
(Table 3.1). No mining is planned for the future (Table 3.1). Of the total stream length of
207.4 km, 100% is connected to the main stem (Table 3.3). The catchment has been
disturbed by forestry activities (Table 3.1) and road construction (Golder 2014b).
The benthic invertebrate community of Ewin Creek was characterized as “good” based on
Windward et al. (2014; Table 3.2). Water quality and tissue selenium concentrations were
not reported by Windward et al. (2014) but are likely comparable to other regional streams
that have not been affected by mining (e.g., “good”). No calcite was observed.
Ewin Creek was surveyed in August 1995 to identify the number of reaches, stream
channel widths and gradients, fish distribution and identification of species present
(Russell and Oliver 1996). The first surveyed section was located about 30 m upstream
from the FRO access road bridge, lying within the floodplain of the Fording River. It had a
mean gradient of 1% and an average channel width of 7.1 m. This reach was
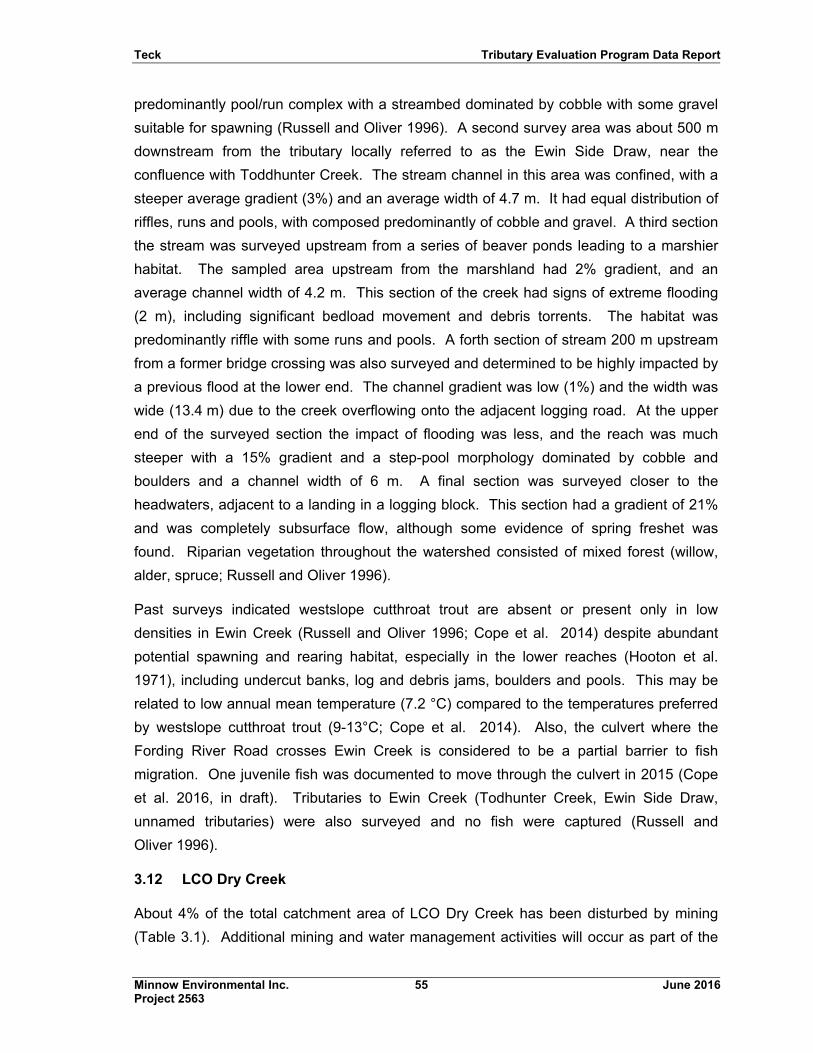
Teck Tributary Evaluation Program Data Report
Minnow Environmental Inc. 55 June 2016 Project 2563
predominantly pool/run complex with a streambed dominated by cobble with some gravel
suitable for spawning (Russell and Oliver 1996). A second survey area was about 500 m
downstream from the tributary locally referred to as the Ewin Side Draw, near the
confluence with Toddhunter Creek. The stream channel in this area was confined, with a
steeper average gradient (3%) and an average width of 4.7 m. It had equal distribution of
riffles, runs and pools, with composed predominantly of cobble and gravel. A third section
the stream was surveyed upstream from a series of beaver ponds leading to a marshier
habitat. The sampled area upstream from the marshland had 2% gradient, and an
average channel width of 4.2 m. This section of the creek had signs of extreme flooding
(2 m), including significant bedload movement and debris torrents. The habitat was
predominantly riffle with some runs and pools. A forth section of stream 200 m upstream
from a former bridge crossing was also surveyed and determined to be highly impacted by
a previous flood at the lower end. The channel gradient was low (1%) and the width was
wide (13.4 m) due to the creek overflowing onto the adjacent logging road. At the upper
end of the surveyed section the impact of flooding was less, and the reach was much
steeper with a 15% gradient and a step-pool morphology dominated by cobble and
boulders and a channel width of 6 m. A final section was surveyed closer to the
headwaters, adjacent to a landing in a logging block. This section had a gradient of 21%
and was completely subsurface flow, although some evidence of spring freshet was
found. Riparian vegetation throughout the watershed consisted of mixed forest (willow,
alder, spruce; Russell and Oliver 1996).
Past surveys indicated westslope cutthroat trout are absent or present only in low
densities in Ewin Creek (Russell and Oliver 1996; Cope et al. 2014) despite abundant
potential spawning and rearing habitat, especially in the lower reaches (Hooton et al.
1971), including undercut banks, log and debris jams, boulders and pools. This may be
related to low annual mean temperature (7.2 °C) compared to the temperatures preferred
by westslope cutthroat trout (9-13°C; Cope et al. 2014). Also, the culvert where the
Fording River Road crosses Ewin Creek is considered to be a partial barrier to fish
migration. One juvenile fish was documented to move through the culvert in 2015 (Cope
et al. 2016, in draft). Tributaries to Ewin Creek (Todhunter Creek, Ewin Side Draw,
unnamed tributaries) were also surveyed and no fish were captured (Russell and
Oliver 1996).
3.12 LCO Dry Creek
About 4% of the total catchment area of LCO Dry Creek has been disturbed by mining
(Table 3.1). Additional mining and water management activities will occur as part of the
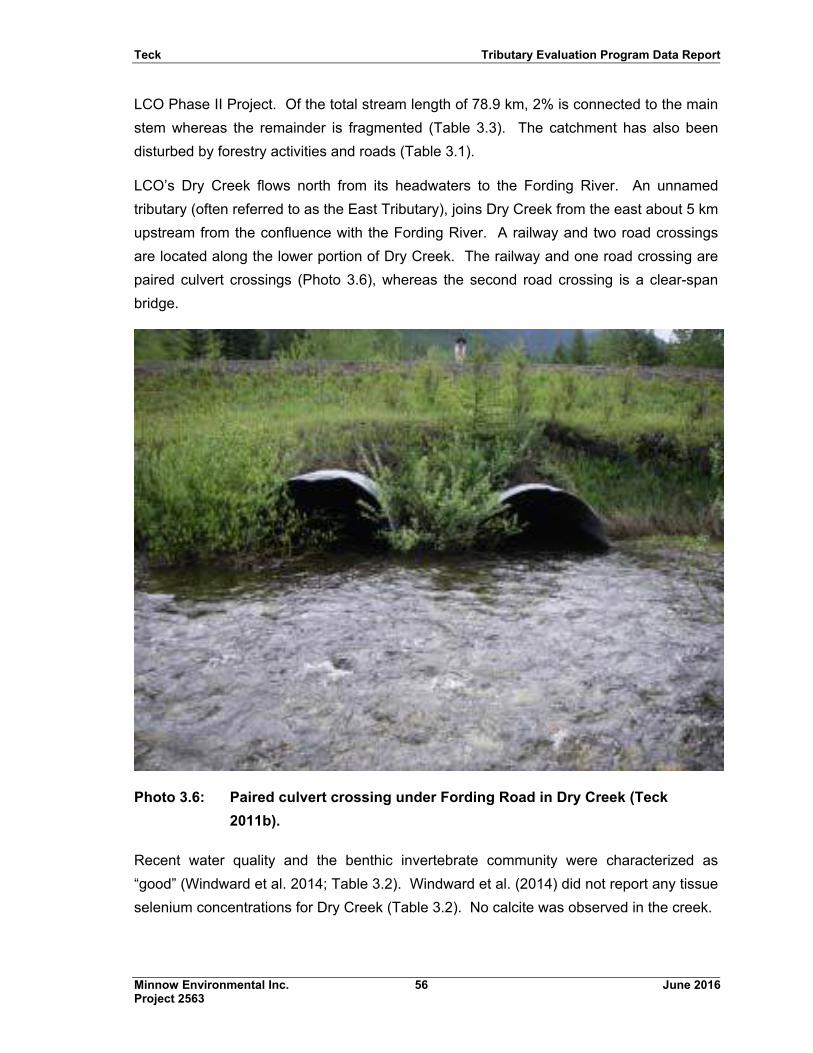
Teck Tributary Evaluation Program Data Report
Minnow Environmental Inc. 56 June 2016 Project 2563
LCO Phase II Project. Of the total stream length of 78.9 km, 2% is connected to the main
stem whereas the remainder is fragmented (Table 3.3). The catchment has also been
disturbed by forestry activities and roads (Table 3.1).
LCO’s Dry Creek flows north from its headwaters to the Fording River. An unnamed
tributary (often referred to as the East Tributary), joins Dry Creek from the east about 5 km
upstream from the confluence with the Fording River. A railway and two road crossings
are located along the lower portion of Dry Creek. The railway and one road crossing are
paired culvert crossings (Photo 3.6), whereas the second road crossing is a clear-span
bridge.
Photo 3.6: Paired culvert crossing under Fording Road in Dry Creek (Teck
2011b).
Recent water quality and the benthic invertebrate community were characterized as
“good” (Windward et al. 2014; Table 3.2). Windward et al. (2014) did not report any tissue
selenium concentrations for Dry Creek (Table 3.2). No calcite was observed in the creek.
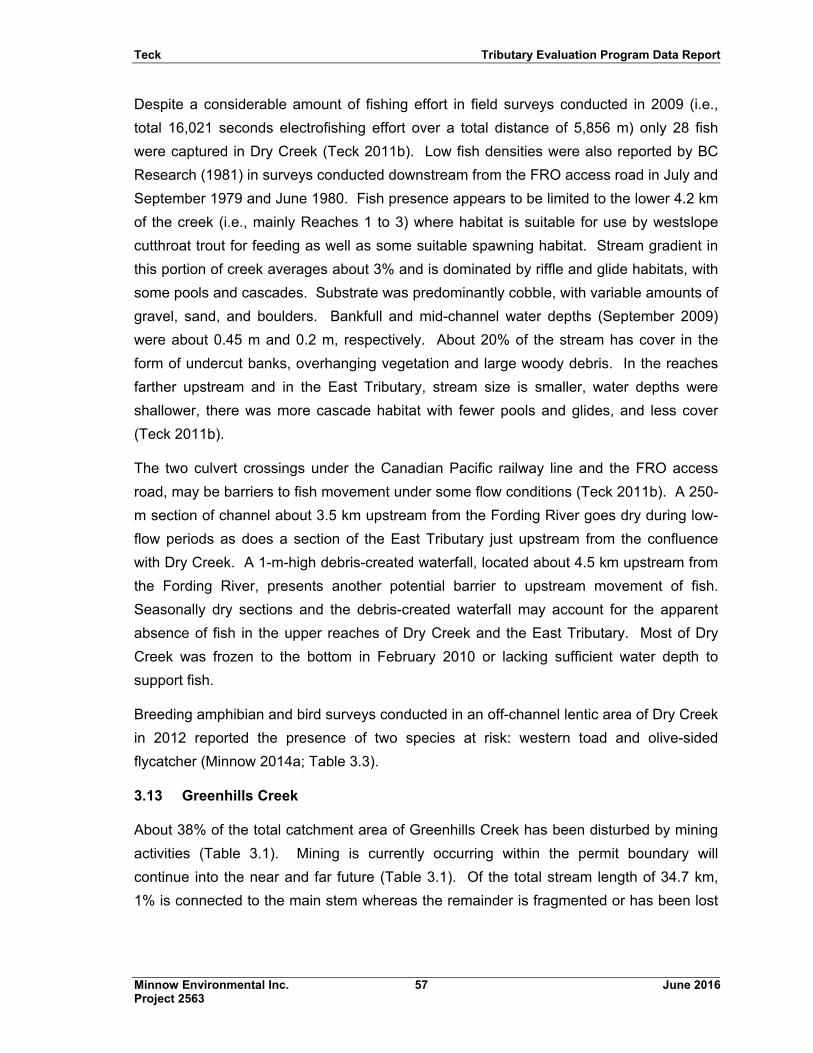
Teck Tributary Evaluation Program Data Report
Minnow Environmental Inc. 57 June 2016 Project 2563
Despite a considerable amount of fishing effort in field surveys conducted in 2009 (i.e.,
total 16,021 seconds electrofishing effort over a total distance of 5,856 m) only 28 fish
were captured in Dry Creek (Teck 2011b). Low fish densities were also reported by BC
Research (1981) in surveys conducted downstream from the FRO access road in July and
September 1979 and June 1980. Fish presence appears to be limited to the lower 4.2 km
of the creek (i.e., mainly Reaches 1 to 3) where habitat is suitable for use by westslope
cutthroat trout for feeding as well as some suitable spawning habitat. Stream gradient in
this portion of creek averages about 3% and is dominated by riffle and glide habitats, with
some pools and cascades. Substrate was predominantly cobble, with variable amounts of
gravel, sand, and boulders. Bankfull and mid-channel water depths (September 2009)
were about 0.45 m and 0.2 m, respectively. About 20% of the stream has cover in the
form of undercut banks, overhanging vegetation and large woody debris. In the reaches
farther upstream and in the East Tributary, stream size is smaller, water depths were
shallower, there was more cascade habitat with fewer pools and glides, and less cover
(Teck 2011b).
The two culvert crossings under the Canadian Pacific railway line and the FRO access
road, may be barriers to fish movement under some flow conditions (Teck 2011b). A 250-
m section of channel about 3.5 km upstream from the Fording River goes dry during low-
flow periods as does a section of the East Tributary just upstream from the confluence
with Dry Creek. A 1-m-high debris-created waterfall, located about 4.5 km upstream from
the Fording River, presents another potential barrier to upstream movement of fish.
Seasonally dry sections and the debris-created waterfall may account for the apparent
absence of fish in the upper reaches of Dry Creek and the East Tributary. Most of Dry
Creek was frozen to the bottom in February 2010 or lacking sufficient water depth to
support fish.
Breeding amphibian and bird surveys conducted in an off-channel lentic area of Dry Creek
in 2012 reported the presence of two species at risk: western toad and olive-sided
flycatcher (Minnow 2014a; Table 3.3).
3.13 Greenhills Creek
About 38% of the total catchment area of Greenhills Creek has been disturbed by mining
activities (Table 3.1). Mining is currently occurring within the permit boundary will
continue into the near and far future (Table 3.1). Of the total stream length of 34.7 km,
1% is connected to the main stem whereas the remainder is fragmented or has been lost
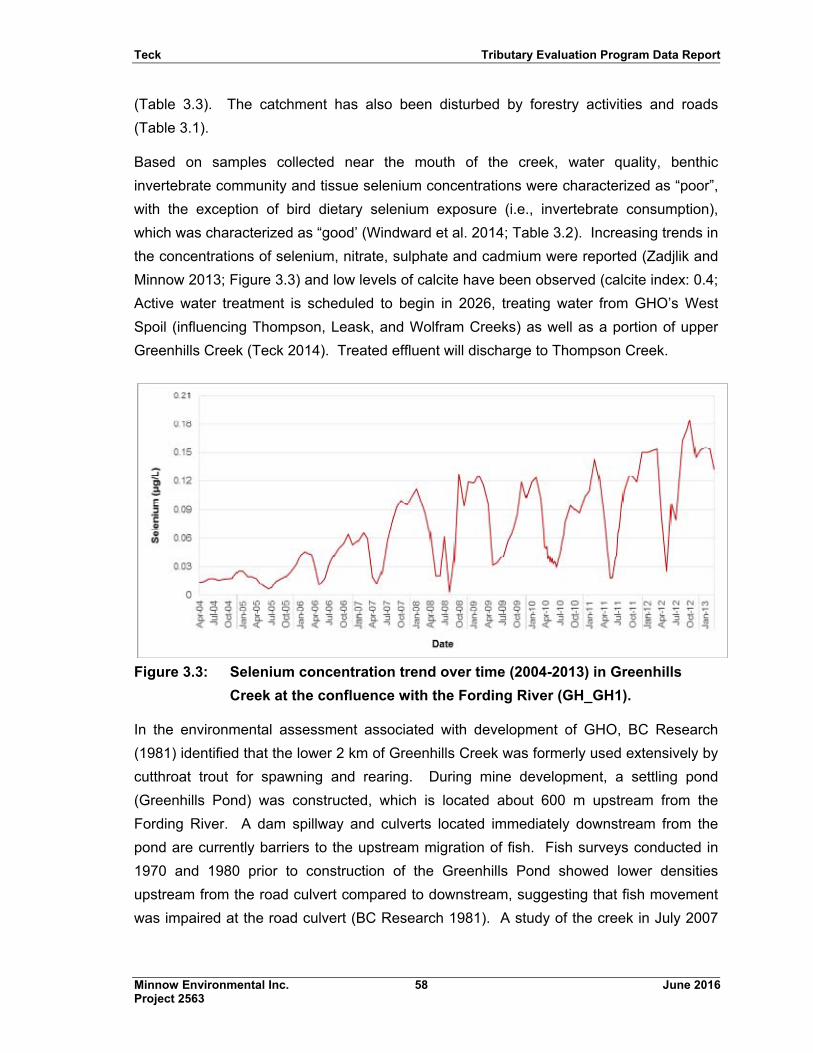
Teck Tributary Evaluation Program Data Report
Minnow Environmental Inc. 58 June 2016 Project 2563
(Table 3.3). The catchment has also been disturbed by forestry activities and roads
(Table 3.1).
Based on samples collected near the mouth of the creek, water quality, benthic
invertebrate community and tissue selenium concentrations were characterized as “poor”,
with the exception of bird dietary selenium exposure (i.e., invertebrate consumption),
which was characterized as “good’ (Windward et al. 2014; Table 3.2). Increasing trends in
the concentrations of selenium, nitrate, sulphate and cadmium were reported (Zadjlik and
Minnow 2013; Figure 3.3) and low levels of calcite have been observed (calcite index: 0.4;
Active water treatment is scheduled to begin in 2026, treating water from GHO’s West
Spoil (influencing Thompson, Leask, and Wolfram Creeks) as well as a portion of upper
Greenhills Creek (Teck 2014). Treated effluent will discharge to Thompson Creek.
Figure 3.3: Selenium concentration trend over time (2004-2013) in Greenhills
Creek at the confluence with the Fording River (GH_GH1).
In the environmental assessment associated with development of GHO, BC Research
(1981) identified that the lower 2 km of Greenhills Creek was formerly used extensively by
cutthroat trout for spawning and rearing. During mine development, a settling pond
(Greenhills Pond) was constructed, which is located about 600 m upstream from the
Fording River. A dam spillway and culverts located immediately downstream from the
pond are currently barriers to the upstream migration of fish. Fish surveys conducted in
1970 and 1980 prior to construction of the Greenhills Pond showed lower densities
upstream from the road culvert compared to downstream, suggesting that fish movement
was impaired at the road culvert (BC Research 1981). A study of the creek in July 2007
Teck Tributary Evaluation Program Data Report
Minnow Environmental Inc. 59 June 2016 Project 2563
(KNRC 2007) reported that, upstream from the pond, the main stem of the creek is fish-
bearing for about 4.9 km and westslope cutthroat trout have free access between the
creek and the pond (KNRC 2007). Over this reach, the gradient is about 4% and
adequate habitat is available to support all life-stages of fish, including spawning and
overwintering. Further upstream, the steep gradient, including a falls and long cascade,
act as a barrier to upstream fish movement, so no westslope cutthroat trout are present.
A tributary to the west (Gardine Creek) offers another 1.8 km of fish-bearing habitat
suitable for all life stages of westslope cutthroat trout, with gradients between 4% and 7%.
Portions of the stream both upstream and downstream from Greenhills Pond are affected
by calcite deposition (Robinson and MacDonald 2014).
Barn swallow, is a species at risk that was observed near the Greenhills Pond in breeding
bird and amphibian surveys conducted in 2012 (Minnow 2014a; Table 3.3).
Teck Tributary Evaluation Program Data Report
Minnow Environmental Inc. 60 June 2016 Project 2563
4.0 TRIBUTARIES TO LOWER FORDING RIVER (MU2)
The tributaries in the Lower Fording River Watershed (MU2) are shown in Figure 4.1, and
include:
Grace Creek; and
Line Creek.
Matrices for these tributaries provide data related to watershed area and disturbances
(Table 4.1), environmental quality descriptors (Table 4.2) and fish and aquatic habitat
(Table 4.3). An orthophoto figure for each tributary is found in Appendix B. Each tributary
is briefly described in the following sections.
4.1 Grace Creek
None of the catchment area of Grace Creek has been disturbed by mining activities
(Table 4.1; Photo 4.1). No mining disturbances are planned for the future (Table 4.1). Of
the total stream length of 45 km, 31% is connected to the main stem whereas the
remainder is fragmented (Table 4.3). The catchment has been disturbed by forestry
activities and roads (Table 4.1).
Water quality was characterized as “good” based on Windward et al. (2014; Table 4.2).
Benthic invertebrate community data and tissue selenium concentrations were not
reported for Grace Creek but are likely comparable to other regional streams that have not
been affected by mining (e.g., “good”). Low levels of calcite were reported (calcite index:
0.31; Table 4.2).
The lower portion (~2.6 km) of Grace Creek is dominated by glide and riffle habitat with
gravel substrate and mean stream gradient of about 2.2% (Teck 2011b). In
October 2010, mean bankfull channel width and depth were 3.15 m and 0.34 m, with an
average wetted width and mid-channel depth of 2.71 m and 0.21 m. Reaches farther
upstream have steeper gradient (about 5-8%; Photo 3.7) with predominantly riffle and
cascade habitats and substrate dominated by cobble, gravel, or sand. Stream cover
types include large and small woody debris, undercut banks, and overhanging vegetation.
Two corrugated steel pipe culvert crossings culverts are located several kilometres
upstream from the Fording River (Teck 2011b). The lower culvert, associated with a rail
road crossing, is 100 m long with a gradient of 5% and an outflow height of greater than
1 m. The second is a road crossing located upstream from the rail crossing that includes
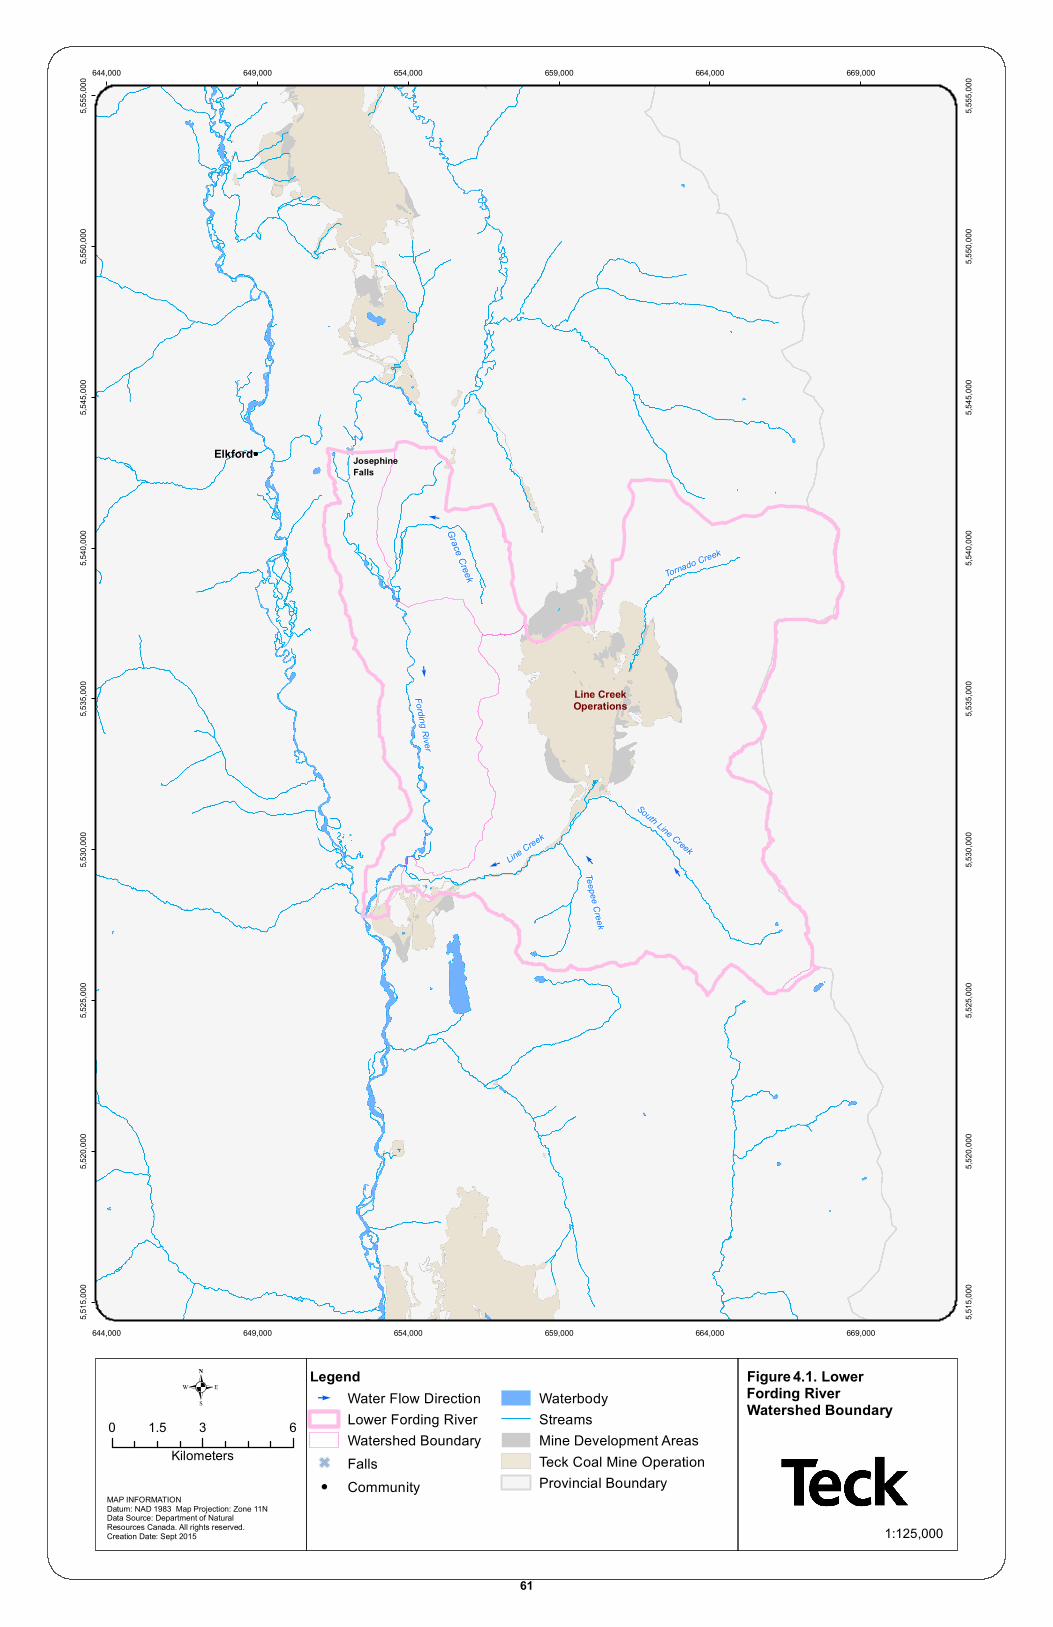
E
E
E
EE
Teepee Creek
Line Creek
South Line Creek
Fording River
Grace Creek Tornado Creek
Line CreekOperations
JosephineFalls
Elkford
644,000
644,000
649,000
649,000
654,000
654,000
659,000
659,000
664,000
664,000
669,000
669,000
5,515
,000
5,515
,000
5,520
,000
5,520
,000
5,525
,000
5,525
,000
5,530
,000
5,530
,000
5,535
,000
5,535
,000
5,540
,000
5,540
,000
5,545
,000
5,545
,000
5,550
,000
5,550
,000
5,555
,000
5,555
,000
.Legend
E Water Flow DirectionLower Fording RiverWatershed Boundary
G Falls! Community
WaterbodyStreamsMine Development Areas Teck Coal Mine OperationProvincial Boundary
MAP INFORMATIONDatum: NAD 1983 Map Projection: Zone 11NData Source: Department of Natural Resources Canada. All rights reserved.Creation Date: Sept 2015
0 3 61.5Kilometers
1:125,000
Figure 4 . 1. Lower Fording River Watershed Boundary
61
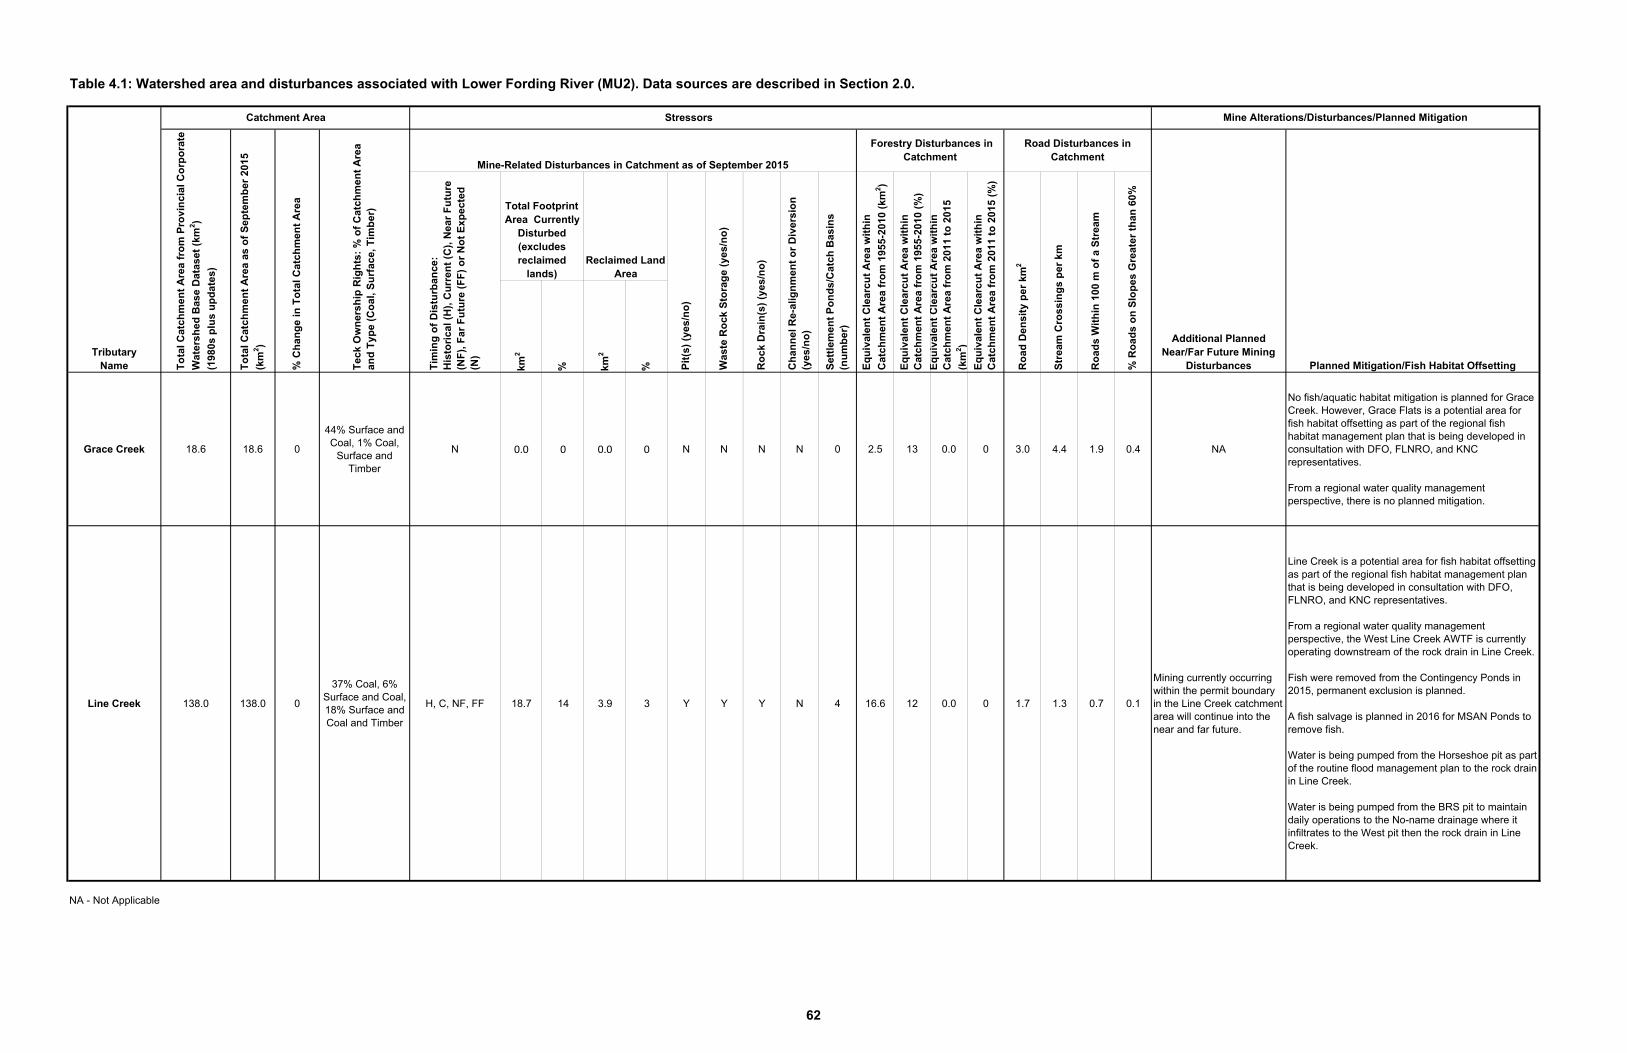
Table 4.1: Watershed area and disturbances associated with Lower Fording River (MU2). Data sources are described in Section 2.0.
km2
% km2
%
Grace Creek 18.6 18.6 0
44% Surface and Coal, 1% Coal,
Surface and Timber
N 0.0 0 0.0 0 N N N N 0 2.5 13 0.0 0 3.0 4.4 1.9 0.4 NA
No fish/aquatic habitat mitigation is planned for Grace Creek. However, Grace Flats is a potential area for fish habitat offsetting as part of the regional fish habitat management plan that is being developed in consultation with DFO, FLNRO, and KNC representatives.
From a regional water quality management perspective, there is no planned mitigation.
Line Creek 138.0 138.0 0
37% Coal, 6% Surface and Coal, 18% Surface and Coal and Timber
H, C, NF, FF 18.7 14 3.9 3 Y Y Y N 4 16.6 12 0.0 0 1.7 1.3 0.7 0.1
Mining currently occurring within the permit boundary in the Line Creek catchment area will continue into the near and far future.
Line Creek is a potential area for fish habitat offsetting as part of the regional fish habitat management plan that is being developed in consultation with DFO, FLNRO, and KNC representatives.
From a regional water quality management perspective, the West Line Creek AWTF is currently operating downstream of the rock drain in Line Creek.
Fish were removed from the Contingency Ponds in 2015, permanent exclusion is planned.
A fish salvage is planned in 2016 for MSAN Ponds to remove fish.
Water is being pumped from the Horseshoe pit as part of the routine flood management plan to the rock drain in Line Creek.
Water is being pumped from the BRS pit to maintain daily operations to the No-name drainage where it infiltrates to the West pit then the rock drain in Line Creek.
NA - Not Applicable
Mine Alterations/Disturbances/Planned Mitigation
Mine-Related Disturbances in Catchment as of September 2015
Additional Planned Near/Far Future Mining
Disturbances Planned Mitigation/Fish Habitat OffsettingTim
ing
of
Dis
turb
ance
:H
isto
rica
l (H
), C
urr
ent
(C),
Nea
r F
utu
re
(NF
), F
ar F
utu
re (
FF
) o
r N
ot
Exp
ecte
d
(N)
Road Disturbances in Catchment
Set
tlem
ent
Po
nd
s/C
atch
Bas
ins
(nu
mb
er)
Eq
uiv
alen
t C
lear
cut
Are
a w
ith
in
Cat
chm
ent
Are
a fr
om
195
5-20
10 (
km2)
Eq
uiv
alen
t C
lear
cut
Are
a w
ith
in
Cat
chm
ent
Are
a fr
om
201
1 to
201
5
(km
2)
Pit
(s)
(yes
/no
)
Was
te R
ock
Sto
rag
e (y
es/n
o)
Eq
uiv
alen
t C
lear
cut
Are
a w
ith
in
Cat
chm
ent
Are
a fr
om
195
5-20
10 (
%)
Ro
ck D
rain
(s)
(yes
/no
)
Ro
ad D
ensi
ty p
er k
m2
Str
eam
Cro
ssin
gs
per
km
Ro
ads
Wit
hin
100
m o
f a
Str
eam
% R
oad
s o
n S
lop
es G
reat
er t
han
60%
TributaryName
Stressors
To
tal C
atch
men
t A
rea
as o
f S
epte
mb
er 2
015
(km
2)
Tec
k O
wn
ersh
ip R
igh
ts:
% o
f C
atch
men
t A
rea
and
Typ
e (C
oal
, Su
rfac
e, T
imb
er)
Catchment Area
To
tal C
atch
men
t A
rea
fro
m P
rovi
nci
al C
orp
ora
te
Wat
ersh
ed B
ase
Dat
aset
(km
2)
(198
0s p
lus
up
dat
es)
% C
han
ge
in T
ota
l Cat
chm
ent
Are
a
Ch
ann
el R
e-al
ign
men
t o
r D
iver
sio
n
(yes
/no
)
Reclaimed Land Area
Total Footprint Area Currently
Disturbed(excludes reclaimed
lands)
Eq
uiv
alen
t C
lear
cut
Are
a w
ith
in
Cat
chm
ent
Are
a fr
om
201
1 to
201
5 (%
)
Forestry Disturbances in Catchment
62
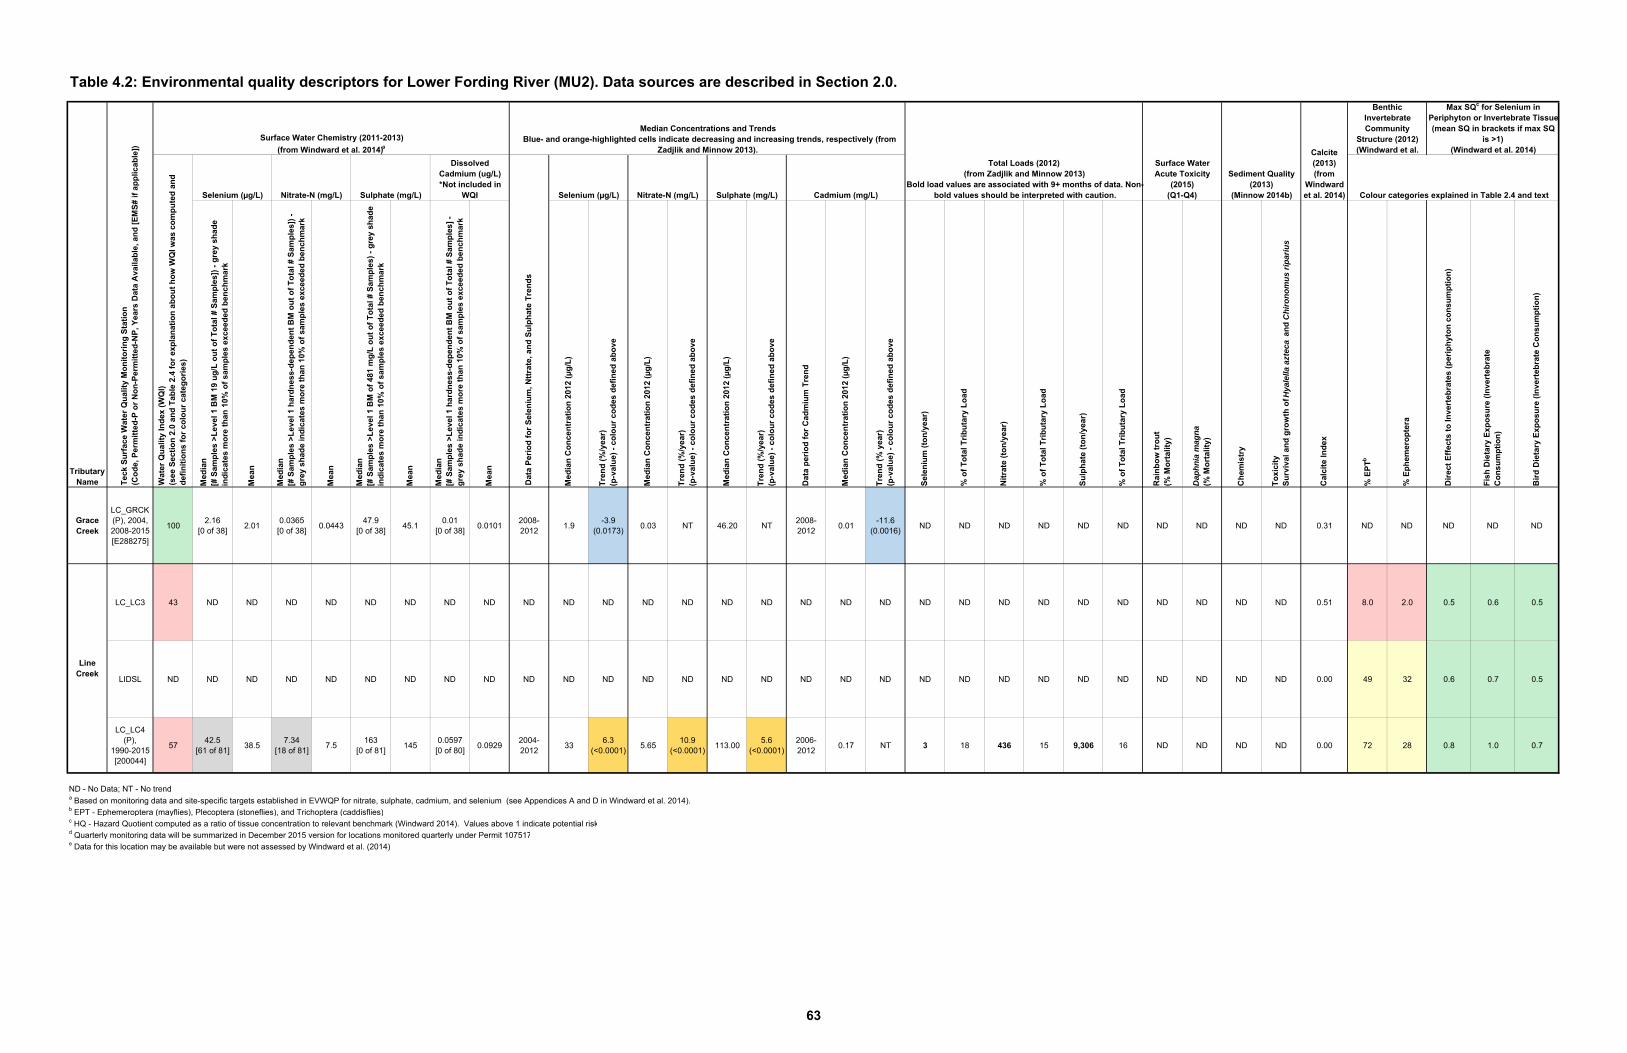
Table 4.2: Environmental quality descriptors for Lower Fording River (MU2). Data sources are described in Section 2.0.
Med
ian
[#
Sam
ple
s >
Lev
el 1
BM
19
ug
/L o
ut
of
To
tal #
Sam
ple
s])
- g
rey
shad
e in
dic
ates
mo
re t
han
10%
of
sam
ple
s ex
ceed
ed b
ench
mar
k
Mea
n
Med
ian
[# S
amp
les
>L
evel
1 h
ard
nes
s-d
epen
den
t B
M o
ut
of
To
tal #
Sam
ple
s])
- g
rey
shad
e in
dic
ates
mo
re t
han
10%
of
sam
ple
s ex
ceed
ed b
ench
mar
k
Mea
n
Med
ian
[# S
amp
les
>L
evel
1 B
M o
f 48
1 m
g/L
ou
t o
f T
ota
l # S
amp
les)
- g
rey
shad
e in
dic
ates
mo
re t
han
10%
of
sam
ple
s ex
ceed
ed b
ench
mar
k
Mea
n
Med
ian
[#
Sam
ple
s >
Lev
el 1
har
dn
ess-
dep
end
ent
BM
ou
t o
f T
ota
l # S
amp
les]
-
gre
y sh
ade
ind
icat
es m
ore
th
an 1
0% o
f sa
mp
les
exce
eded
ben
chm
ark
Mea
n
Med
ian
Co
nce
ntr
atio
n 2
012
(µg
/L)
Tre
nd
(%
/yea
r)(p
-val
ue)
- c
olo
ur
cod
es d
efin
ed a
bo
ve
Med
ian
Co
nce
ntr
atio
n 2
012
(µg
/L)
Tre
nd
(%
/yea
r)(p
-val
ue)
- c
olo
ur
cod
es d
efin
ed a
bo
ve
Med
ian
Co
nce
ntr
atio
n 2
012
(µg
/L)
Tre
nd
(%
/yea
r)(p
-val
ue)
- c
olo
ur
cod
es d
efin
ed a
bo
ve
Dat
a p
erio
d f
or
Cad
miu
m T
ren
d
Med
ian
Co
nce
ntr
atio
n 2
012
(µg
/L)
Tre
nd
(%
yea
r)(p
-val
ue)
- c
olo
ur
cod
es d
efin
ed a
bo
ve
Sel
eniu
m (
ton
/yea
r)
% o
f T
ota
l Tri
bu
tary
Lo
ad
Nit
rate
(to
n/y
ear)
% o
f T
ota
l Tri
bu
tary
Lo
ad
Su
lph
ate
(to
n/y
ear)
% o
f T
ota
l Tri
bu
tary
Lo
ad
Rai
nb
ow
tro
ut
(% M
ort
alit
y)
Dap
hnia
mag
na(%
Mo
rtal
ity)
Ch
emis
try
To
xici
tyS
urv
ival
an
d g
row
th o
f Hya
lella
azt
eca
an
d C
hiro
nom
us ri
pariu
s
Cal
cite
Ind
ex
% E
PT
b
% E
ph
emer
op
tera
Dir
ect
Eff
ects
to
Inve
rteb
rate
s (p
erip
hyt
on
co
nsu
mp
tio
n)
Fis
h D
ieta
ry E
xpo
sure
(In
vert
ebra
teC
on
sum
pti
on
)
Bir
d D
ieta
ry E
xpo
sure
(In
vert
ebra
te C
on
sum
pti
on
)
Grace Creek
LC_GRCK (P), 2004, 2008-2015 [E288275]
1002.16
[0 of 38]2.01
0.0365[0 of 38]
0.044347.9
[0 of 38]45.1
0.01[0 of 38]
0.01012008-2012
1.9-3.9
(0.0173)0.03 NT 46.20 NT
2008-2012
0.01-11.6
(0.0016)ND ND ND ND ND ND ND ND ND ND 0.31 ND ND ND ND ND
LC_LC3 43 ND ND ND ND ND ND ND ND ND ND ND ND ND ND ND ND ND ND ND ND ND ND ND ND ND ND ND ND 0.51 8.0 2.0 0.5 0.6 0.5
LIDSL ND ND ND ND ND ND ND ND ND ND ND ND ND ND ND ND ND ND ND ND ND ND ND ND ND ND ND ND ND 0.00 49 32 0.6 0.7 0.5
LC_LC4 (P),
1990-2015 [200044]
5742.5
[61 of 81]38.5
7.34[18 of 81]
7.5163
[0 of 81]145
0.0597[0 of 80]
0.09292004-2012
336.3
(<0.0001)5.65
10.9(<0.0001)
113.005.6
(<0.0001)2006-2012
0.17 NT 3 18 436 15 9,306 16 ND ND ND ND 0.00 72 28 0.8 1.0 0.7
ND - No Data; NT - No trenda Based on monitoring data and site-specific targets established in EVWQP for nitrate, sulphate, cadmium, and selenium (see Appendices A and D in Windward et al. 2014). b EPT - Ephemeroptera (mayflies), Plecoptera (stoneflies), and Trichoptera (caddisflies)c HQ - Hazard Quotient computed as a ratio of tissue concentration to relevant benchmark (Windward 2014). Values above 1 indicate potential riskd Quarterly monitoring data will be summarized in December 2015 version for locations monitored quarterly under Permit 107517e Data for this location may be available but were not assessed by Windward et al. (2014)
Total Loads (2012)(from Zadjlik and Minnow 2013)
Bold load values are associated with 9+ months of data. Non-bold values should be interpreted with caution.
Surface Water Acute Toxicity
(2015)(Q1-Q4)Selenium (µg/L) Nitrate-N (mg/L) Sulphate (mg/L) Cadmium (mg/L)
Line Creek
Colour categories explained in Table 2.4 and text
Sediment Quality (2013)
(Minnow 2014b)
Calcite(2013)(from
Windward et al. 2014)
Benthic InvertebrateCommunity
Structure (2012)(Windward et al.
Max SQc for Selenium in Periphyton or Invertebrate Tissue (mean SQ in brackets if max SQ
is >1)(Windward et al. 2014)
Dat
a P
erio
d f
or
Sel
eniu
m, N
ttra
te, a
nd
Su
lph
ate
Tre
nd
s
Tributary Name T
eck
Su
rfac
e W
ater
Qu
alit
y M
on
ito
rin
g S
tati
on
(Co
de,
Per
mit
ted
-P o
r N
on
-Per
mit
ted
-NP
, Yea
rs D
ata
Ava
ilab
le, a
nd
[E
MS
# if
ap
plic
able
])Surface Water Chemistry (2011-2013)
(from Windward et al. 2014)a
Median Concentrations and TrendsBlue- and orange-highlighted cells indicate decreasing and increasing trends, respectively (from
Zadjlik and Minnow 2013).
Wat
er Q
ual
ity
Ind
ex (
WQ
I)(s
ee S
ecti
on
2.0
an
d T
able
2.4
fo
r ex
pla
nat
ion
ab
ou
t h
ow
WQ
I was
co
mp
ute
d a
nd
d
efin
itio
ns
for
colo
ur
cate
go
ries
)
Selenium (µg/L) Nitrate-N (mg/L) Sulphate (mg/L)
Dissolved Cadmium (ug/L) *Not included in
WQI
63
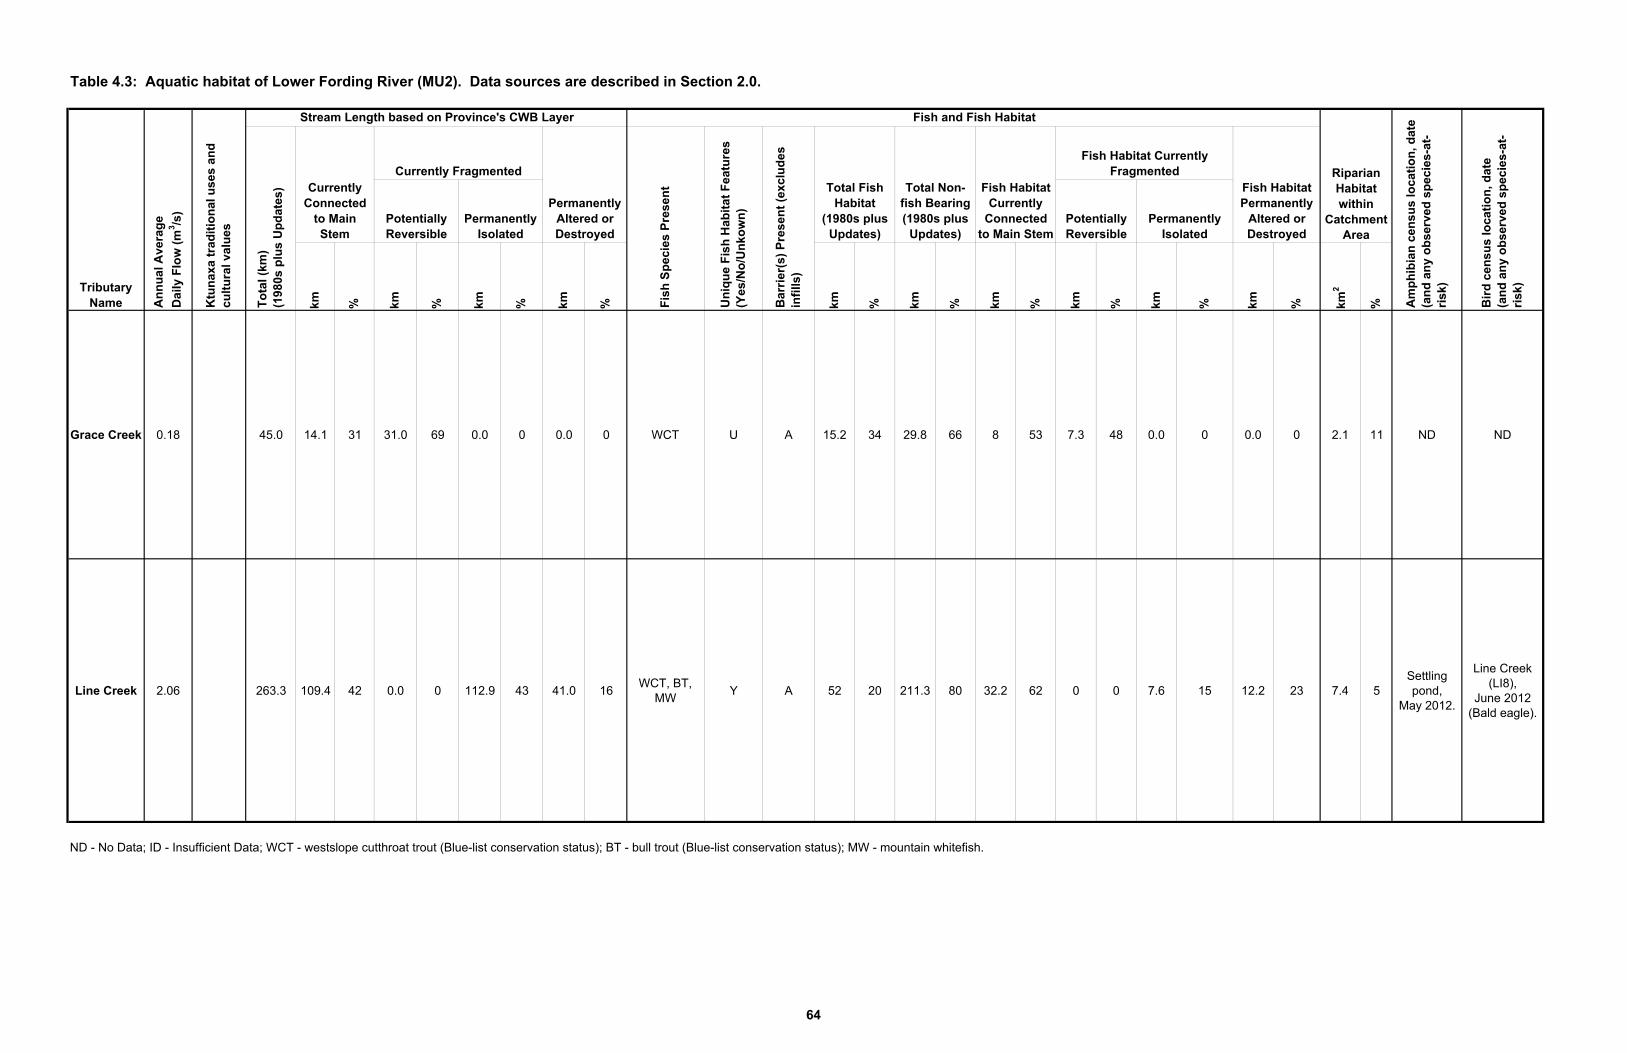
Table 4.3: Aquatic habitat of Lower Fording River (MU2). Data sources are described in Section 2.0.
km % km % km
% km % km % km % km % km % km % km % km2
%
Grace Creek 0.18 45.0 14.1 31 31.0 69 0.0 0 0.0 0 WCT U A 15.2 34 29.8 66 8 53 7.3 48 0.0 0 0.0 0 2.1 11 ND ND
Line Creek 2.06 263.3 109.4 42 0.0 0 112.9 43 41.0 16WCT, BT,
MWY A 52 20 211.3 80 32.2 62 0 0 7.6 15 12.2 23 7.4 5
Settling pond,
May 2012.
Line Creek (LI8),
June 2012(Bald eagle).
ND - No Data; ID - Insufficient Data; WCT - westslope cutthroat trout (Blue-list conservation status); BT - bull trout (Blue-list conservation status); MW - mountain whitefish.
Am
ph
ibia
n c
ensu
s lo
cati
on
, dat
e (a
nd
an
y o
bse
rved
sp
ecie
s-at
-ri
sk)
Bir
d c
ensu
s lo
cati
on
, dat
e(a
nd
an
y o
bse
rved
sp
ecie
s-at
-ri
sk)Tributary
Name An
nu
al A
vera
ge
Dai
ly F
low
(m
3 /s)
Ktu
nax
a tr
adit
ion
al u
ses
and
cu
ltu
ral v
alu
es
Stream Length based on Province's CWB Layer Fish and Fish Habitat
Riparian Habitat within
Catchment Area
To
tal (
km)
(198
0s p
lus
Up
dat
es) Currently
Connected to Main Stem
Currently Fragmented
Permanently Altered or Destroyed
Fis
h S
pec
ies
Pre
sen
t
Un
iqu
e F
ish
Hab
itat
Fea
ture
s (Y
es/N
o/U
nko
wn
)
Fish Habitat Permanently
Altered or Destroyed
Potentially Reversible
Permanently Isolated
Potentially Reversible
Permanently Isolated
Bar
rier
(s)
Pre
sen
t (e
xclu
des
in
fills
)
Total Fish Habitat
(1980s plus Updates)
Total Non-fish Bearing(1980s plus
Updates)
Fish Habitat Currently
Connected to Main Stem
Fish Habitat Currently Fragmented
64
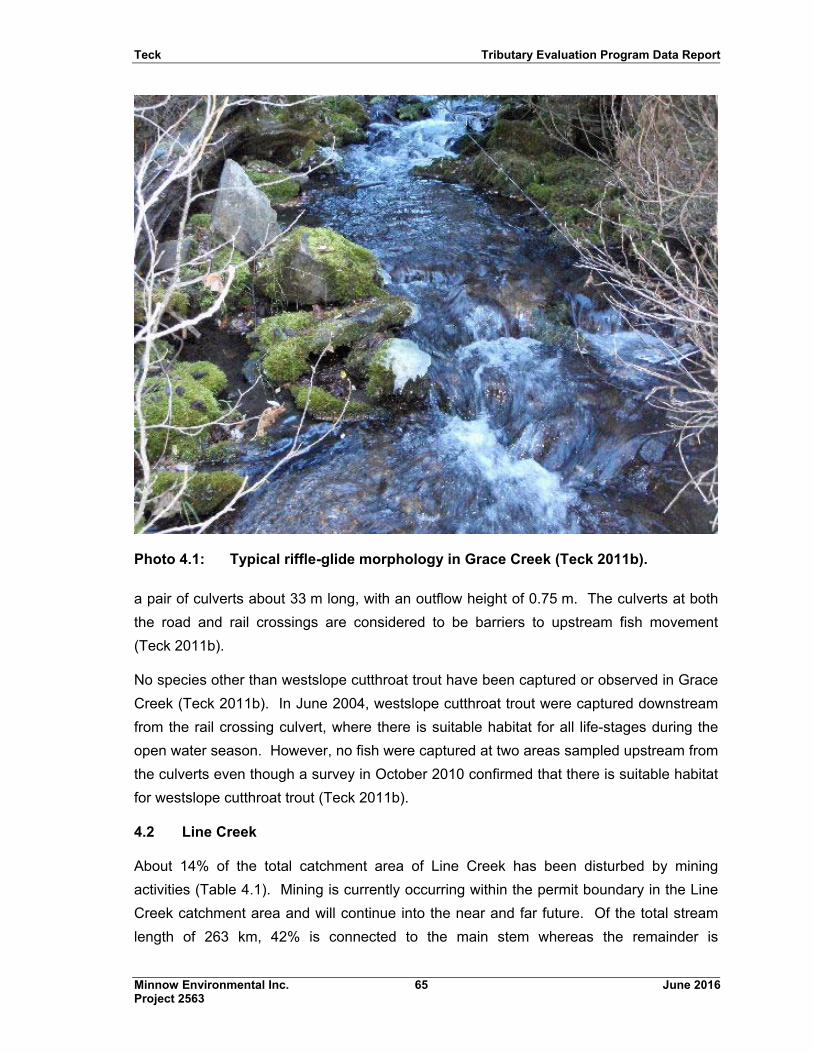
Teck Tributary Evaluation Program Data Report
Minnow Environmental Inc. 65 June 2016 Project 2563
Photo 4.1: Typical riffle-glide morphology in Grace Creek (Teck 2011b).
a pair of culverts about 33 m long, with an outflow height of 0.75 m. The culverts at both
the road and rail crossings are considered to be barriers to upstream fish movement
(Teck 2011b).
No species other than westslope cutthroat trout have been captured or observed in Grace
Creek (Teck 2011b). In June 2004, westslope cutthroat trout were captured downstream
from the rail crossing culvert, where there is suitable habitat for all life-stages during the
open water season. However, no fish were captured at two areas sampled upstream from
the culverts even though a survey in October 2010 confirmed that there is suitable habitat
for westslope cutthroat trout (Teck 2011b).
4.2 Line Creek
About 14% of the total catchment area of Line Creek has been disturbed by mining
activities (Table 4.1). Mining is currently occurring within the permit boundary in the Line
Creek catchment area and will continue into the near and far future. Of the total stream
length of 263 km, 42% is connected to the main stem whereas the remainder is
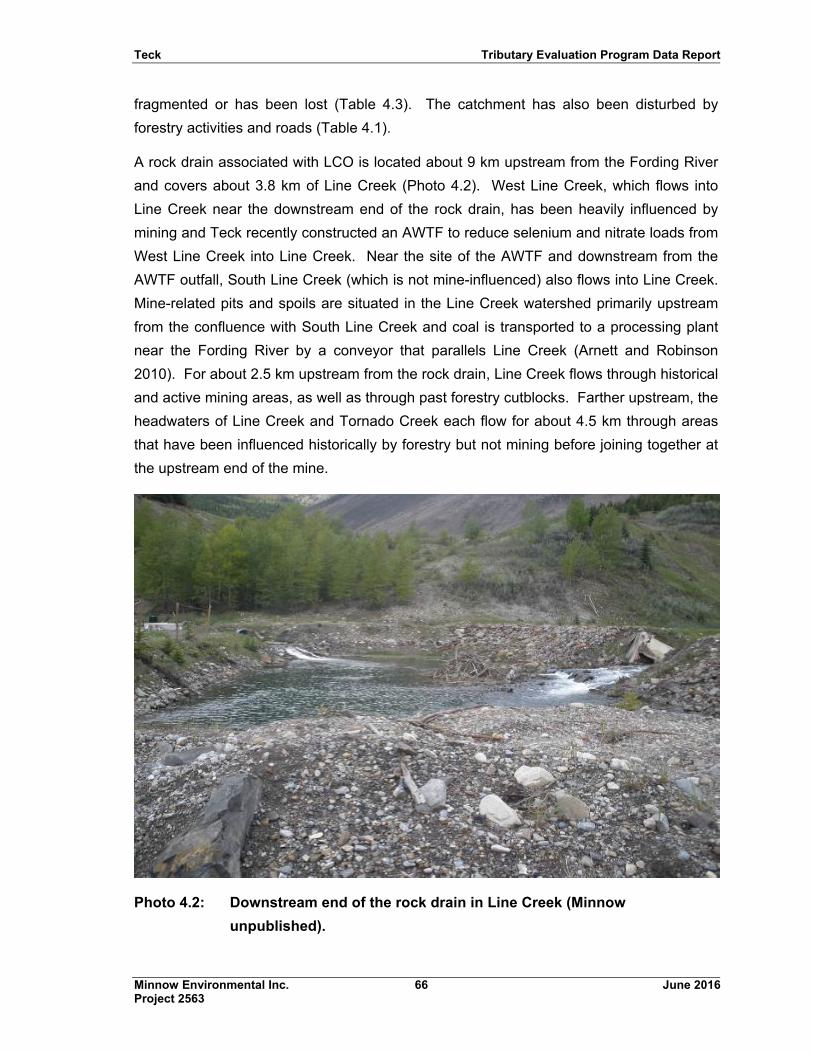
Teck Tributary Evaluation Program Data Report
Minnow Environmental Inc. 66 June 2016 Project 2563
fragmented or has been lost (Table 4.3). The catchment has also been disturbed by
forestry activities and roads (Table 4.1).
A rock drain associated with LCO is located about 9 km upstream from the Fording River
and covers about 3.8 km of Line Creek (Photo 4.2). West Line Creek, which flows into
Line Creek near the downstream end of the rock drain, has been heavily influenced by
mining and Teck recently constructed an AWTF to reduce selenium and nitrate loads from
West Line Creek into Line Creek. Near the site of the AWTF and downstream from the
AWTF outfall, South Line Creek (which is not mine-influenced) also flows into Line Creek.
Mine-related pits and spoils are situated in the Line Creek watershed primarily upstream
from the confluence with South Line Creek and coal is transported to a processing plant
near the Fording River by a conveyor that parallels Line Creek (Arnett and Robinson
2010). For about 2.5 km upstream from the rock drain, Line Creek flows through historical
and active mining areas, as well as through past forestry cutblocks. Farther upstream, the
headwaters of Line Creek and Tornado Creek each flow for about 4.5 km through areas
that have been influenced historically by forestry but not mining before joining together at
the upstream end of the mine.
Photo 4.2: Downstream end of the rock drain in Line Creek (Minnow
unpublished).
Teck Tributary Evaluation Program Data Report
Minnow Environmental Inc. 67 June 2016 Project 2563
Water quality in Line Creek downstream from LCO was characterized as “poor” based on
Windward et al. (2014), and increasing trends in concentrations of selenium, nitrate and
sulphate were reported (Zadjlik and Minnow 2013; Table 4.2). The benthic invertebrate
community was characterized as “fair” while tissue selenium concentrations were
characterized as “good” (Windward et al. 2014). No calcite was observed.
Downstream from LCO, Line Creek flows for about 9 km to its confluence with the Fording
River. The creek is low gradient with riffle/glide habitat, except for the portion that flows
through a canyon where the habitat includes cascade/pool segments and two falls (Teck
2011b). One of the falls was altered in 1989 to improve fish passage and thereafter
neither was considered a barrier to fish movement (Teck 2011b). There were two
landslides in the canyon section in June 2015 that blocked the creek, but removal of the
slide material and restoration of the creek has been completed.
Numerous surveys of fish and fish habitat in the Line Creek watershed have been
conducted over the past 30 years and continue to be completed (Allan 1987; Allan 1991;
Allan 1993; Allan 1994; Allan 1995; Goltz 1997; Goltz 1998; Goltz 1999; Allan 2000; Allan
2001; Robinson and Wright 2005; Berdusco et al. 2007; Berdusco and Arnett 2008; Arnett
and Berdusco 2009). Line Creek is the only tributary of the Fording River where bull trout
and mountain whitefish, as well as westslope cutthroat trout have been reported
(Teck 2011b). It is considered a regionally important stream for bull trout spawning, which
likely relates to relatively high proportion of groundwater contributing to total streamflow,
providing stable thermal conditions throughout the incubation period (Robinson et al.
2014). Adult bull trout overwinter in the Elk River and migrate into Line Creek to spawn (in
late September), whereas juveniles rear in Line Creek for several years before migrating
out to the Elk River (Teck 2011b). Adult whitefish move into Line Creek from the Fording
and Elk rivers to feed in the spring but move out in the fall. The westslope cutthroat trout
population in Line Creek is a resident population with all life stages occurring throughout
the year. Bull trout and cutthroat trout have also been observed in the lower reaches of
South Line Creek. Upstream from the Line Creek rock drain, fish salvages have been
conducted periodically since 2004 to relocate bull trout and westslope cutthroat trout to
habitats downstream from the rock drain, but it is likely that remnant populations of both
bull trout and westslope cutthroat trout remain (Teck 2011b).
Following a comprehensive sampling program in Line Creek after three consecutive years
(2007-2009) and comparisons to historical data, Arnett and Robinson (2010) reported that
“the absence of pre-mining fish population and spawning data precluded any comparisons
of pre- to post-mining conditions. However, based on 15 years of fish population estimate
Teck Tributary Evaluation Program Data Report
Minnow Environmental Inc. 68 June 2016 Project 2563
data and 20 years of bull trout spawning data, it was inferred that while fish populations
and bull trout spawning seem to be variable between years, the changes observed appear
to be fluctuating independently of mining activity and were more strongly correlated to
environmental variables (e.g., June and September discharge, bull trout escapement,
water temperature)”. The same authors also concluded that water flow (i.e., dilution of
mine-related constituents) and sediment loads from South Line Creek may be
ameliorating effects of mining on biota in lower Line Creek (Arnett and Robinson 2010).
No amphibians were observed in a survey completed near the settling ponds (Minnow
2014a). A breeding bird survey completed on Line Creek downstream from LCO
identified, bald eagle, a species at risk (Minnow 2014a; Table 4.3).
Teck Tributary Evaluation Program Data Report
Minnow Environmental Inc. 69 June 2016 Project 2563
5.0 TRIBUTARIES TO UPPER ELK RIVER (MU3)
Tributaries in the Upper Elk River Watershed (MU3) are shown in Figure 5.1, and include:
Branch F Creek;
Wolf Creek;
Willow Creek;
Wade Creek;
Cougar Creek;
No-Name Creek and Unnamed Tributary 14;
Mickelson Creek;
Leask Creek;
Wolfram Creek; and
Thompson Creek.
Matrices for these tributaries provide data related to watershed area and disturbances
(Table 5.1), environmental quality descriptors (Table 5.2) and fish and aquatic habitat
(Table 5.3). An orthophoto figure for each tributary is found in Appendix C. Each tributary
is briefly described in the following sections.
5.1 Branch F Creek
Branch F Creek is located on the west side of GHO about 14 km north of Elkford, BC,
along the Round Prairie Forest Service Road (FSR). There is currently no influence from
mining, but there are expected to be mine-related disturbances within the catchment in the
future as part of the Cougar Pit Expansion Project (Table 5.1). All of the total stream
length of 6 km is fragmented (Table 5.3). The catchment has also been disturbed by
forestry activities and roads (Table 5.1).
Water quality was characterized as “good” based on Windward et al. (2014), but the
authors did not report any biological or calcite data for this stream (Table 5.2). No water
quality trends were reported for Branch F Creek (Zadjlik and Minnow 2013).
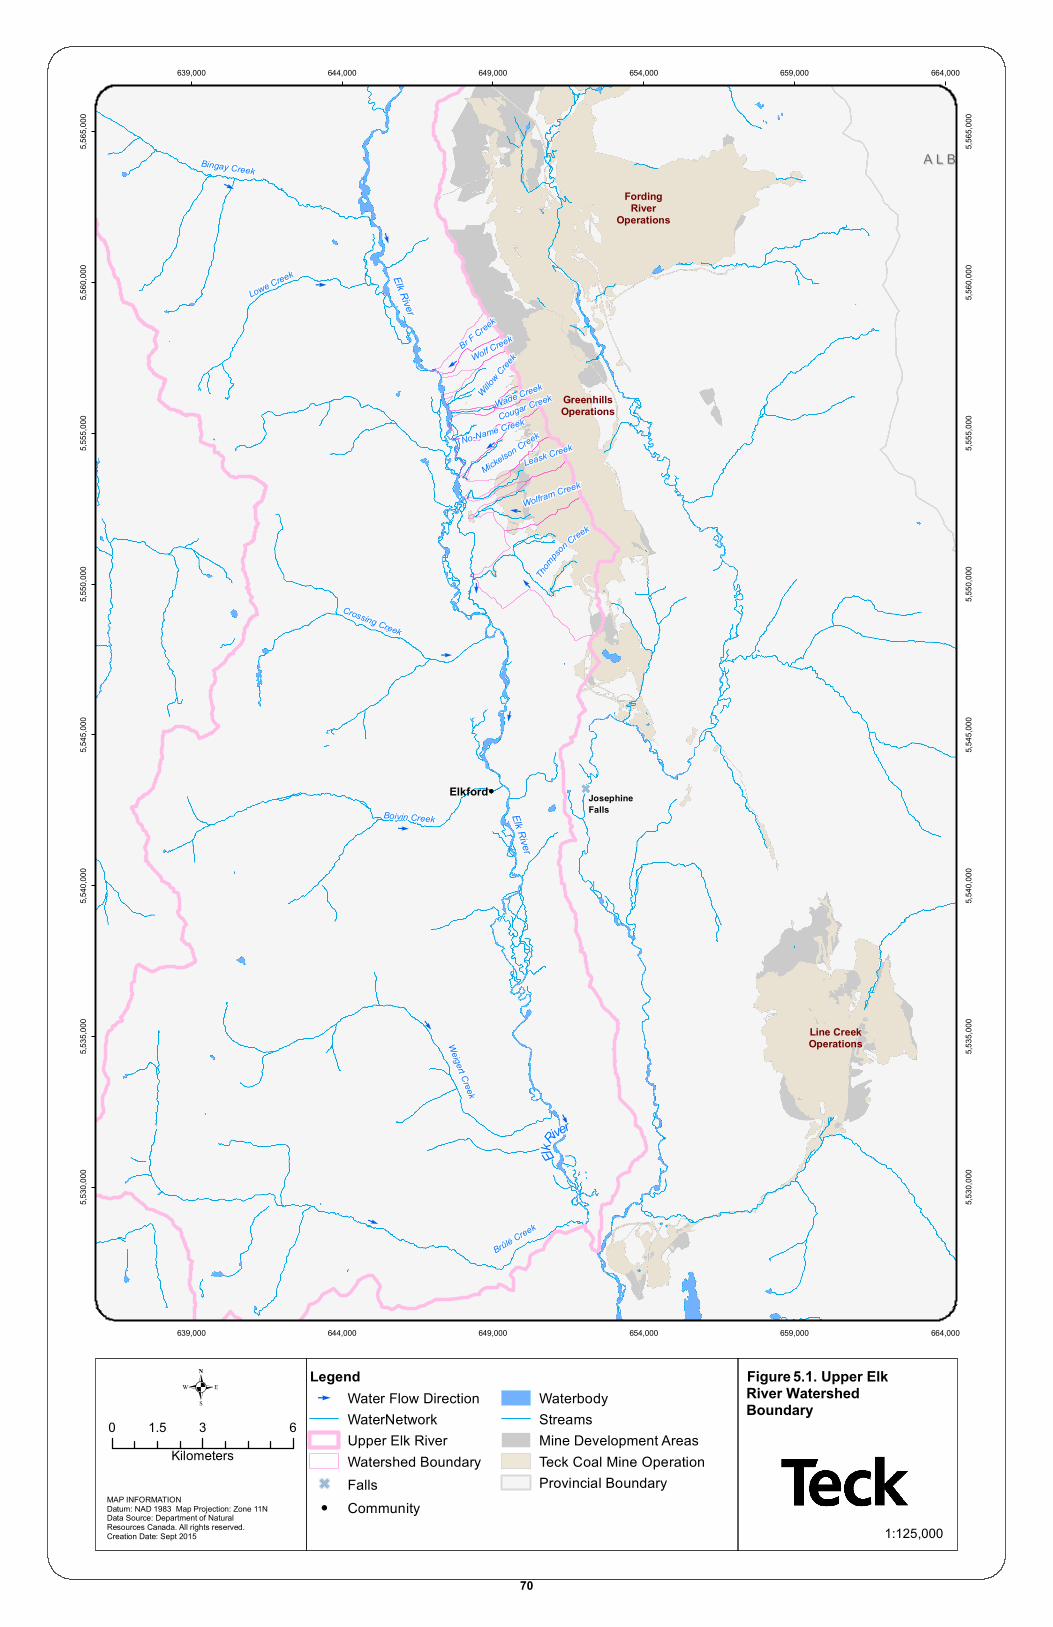
E
E
E
E
E
E
E
E
E
E
E
E
E
E
E
ElkRiver
Brûlé Creek
Weigert Creek
Boivin Creek Elk River
Crossing Creek
Lowe Creek Elk River
Bingay Creek
Wolfram Creek
Leask Creek
Mickelson Creek
Willow Cree
k
Br F Creek
Wolf Creek
Wade Creek
Cougar Creek
No-Name Creek
Thom
pson Creek
A L B E R T AA L B E R T A
FordingRiver
Operations
GreenhillsOperations
Line CreekOperations
JosephineFalls
Elkford
639,000
639,000
644,000
644,000
649,000
649,000
654,000
654,000
659,000
659,000
664,000
664,000
5,530
,000
5,530
,000
5,535
,000
5,535
,000
5,540
,000
5,540
,000
5,545
,000
5,545
,000
5,550
,000
5,550
,000
5,555
,000
5,555
,000
5,560
,000
5,560
,000
5,565
,000
5,565
,000
.Legend
E Water Flow DirectionWaterNetworkUpper Elk RiverWatershed Boundary
G Falls! Community
WaterbodyStreamsMine Development Areas Teck Coal Mine OperationProvincial Boundary
MAP INFORMATIONDatum: NAD 1983 Map Projection: Zone 11NData Source: Department of Natural Resources Canada. All rights reserved.Creation Date: Sept 2015
0 3 61.5Kilometers
1:125,000
Figure 5 . 1. Upper Elk River Watershed Boundary
70
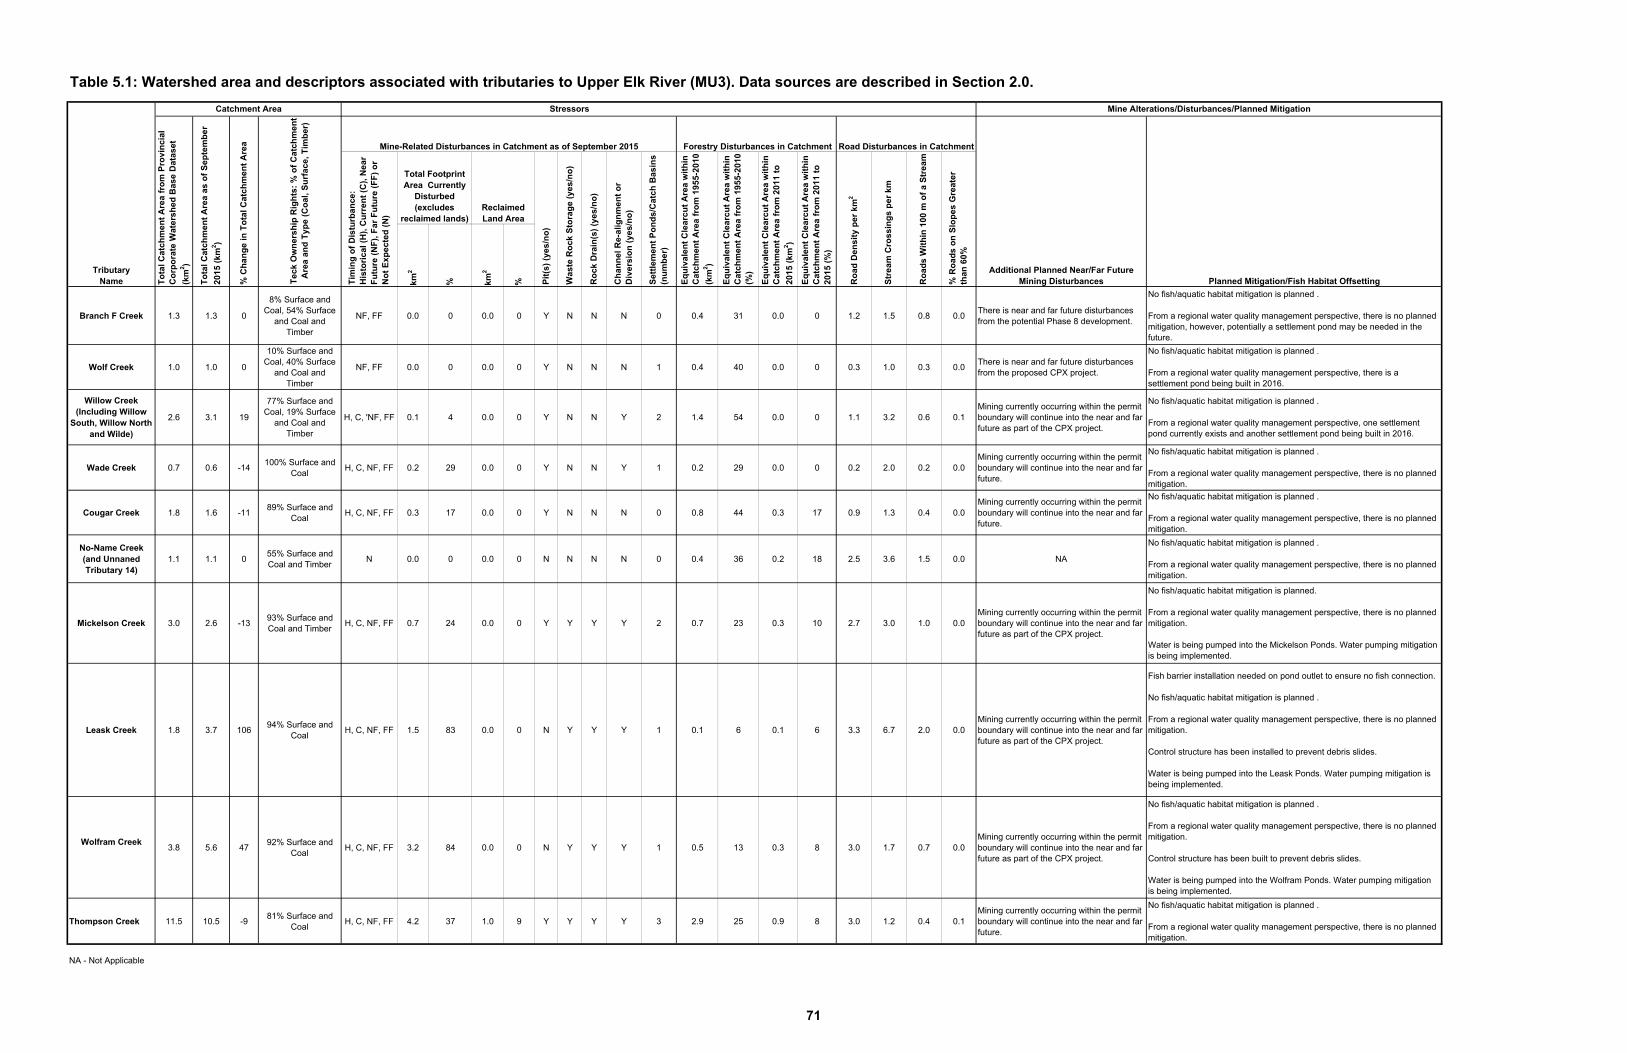
Table 5.1: Watershed area and descriptors associated with tributaries to Upper Elk River (MU3). Data sources are described in Section 2.0.
km2
% km2
%
Branch F Creek 1.3 1.3 0
8% Surface and Coal, 54% Surface
and Coal and Timber
NF, FF 0.0 0 0.0 0 Y N N N 0 0.4 31 0.0 0 1.2 1.5 0.8 0.0There is near and far future disturbances from the potential Phase 8 development.
No fish/aquatic habitat mitigation is planned .
From a regional water quality management perspective, there is no planned mitigation, however, potentially a settlement pond may be needed in the future.
Wolf Creek 1.0 1.0 0
10% Surface and Coal, 40% Surface
and Coal and Timber
NF, FF 0.0 0 0.0 0 Y N N N 1 0.4 40 0.0 0 0.3 1.0 0.3 0.0There is near and far future disturbances from the proposed CPX project.
No fish/aquatic habitat mitigation is planned .
From a regional water quality management perspective, there is a settlement pond being built in 2016.
Willow Creek (Including Willow
South, Willow North and Wilde)
2.6 3.1 19
77% Surface and Coal, 19% Surface
and Coal and Timber
H, C, 'NF, FF 0.1 4 0.0 0 Y N N Y 2 1.4 54 0.0 0 1.1 3.2 0.6 0.1Mining currently occurring within the permit boundary will continue into the near and far future as part of the CPX project.
No fish/aquatic habitat mitigation is planned .
From a regional water quality management perspective, one settlement pond currently exists and another settlement pond being built in 2016.
Wade Creek 0.7 0.6 -14100% Surface and
CoalH, C, NF, FF 0.2 29 0.0 0 Y N N Y 1 0.2 29 0.0 0 0.2 2.0 0.2 0.0
Mining currently occurring within the permit boundary will continue into the near and far future.
No fish/aquatic habitat mitigation is planned .
From a regional water quality management perspective, there is no planned mitigation.
Cougar Creek 1.8 1.6 -1189% Surface and
CoalH, C, NF, FF 0.3 17 0.0 0 Y N N N 0 0.8 44 0.3 17 0.9 1.3 0.4 0.0
Mining currently occurring within the permit boundary will continue into the near and far future.
No fish/aquatic habitat mitigation is planned .
From a regional water quality management perspective, there is no planned mitigation.
No-Name Creek(and Unnaned Tributary 14)
1.1 1.1 055% Surface and Coal and Timber
N 0.0 0 0.0 0 N N N N 0 0.4 36 0.2 18 2.5 3.6 1.5 0.0 NA
No fish/aquatic habitat mitigation is planned .
From a regional water quality management perspective, there is no planned mitigation.
Mickelson Creek 3.0 2.6 -1393% Surface and Coal and Timber
H, C, NF, FF 0.7 24 0.0 0 Y Y Y Y 2 0.7 23 0.3 10 2.7 3.0 1.0 0.0Mining currently occurring within the permit boundary will continue into the near and far future as part of the CPX project.
No fish/aquatic habitat mitigation is planned.
From a regional water quality management perspective, there is no planned mitigation.
Water is being pumped into the Mickelson Ponds. Water pumping mitigation is being implemented.
Leask Creek 1.8 3.7 10694% Surface and
CoalH, C, NF, FF 1.5 83 0.0 0 N Y Y Y 1 0.1 6 0.1 6 3.3 6.7 2.0 0.0
Mining currently occurring within the permit boundary will continue into the near and far future as part of the CPX project.
Fish barrier installation needed on pond outlet to ensure no fish connection.
No fish/aquatic habitat mitigation is planned .
From a regional water quality management perspective, there is no planned mitigation.
Control structure has been installed to prevent debris slides.
Water is being pumped into the Leask Ponds. Water pumping mitigation is being implemented.
Wolfram Creek3.8 5.6 47
92% Surface and Coal
H, C, NF, FF 3.2 84 0.0 0 N Y Y Y 1 0.5 13 0.3 8 3.0 1.7 0.7 0.0Mining currently occurring within the permit boundary will continue into the near and far future as part of the CPX project.
No fish/aquatic habitat mitigation is planned .
From a regional water quality management perspective, there is no planned mitigation.
Control structure has been built to prevent debris slides.
Water is being pumped into the Wolfram Ponds. Water pumping mitigation is being implemented.
Thompson Creek 11.5 10.5 -981% Surface and
CoalH, C, NF, FF 4.2 37 1.0 9 Y Y Y Y 3 2.9 25 0.9 8 3.0 1.2 0.4 0.1
Mining currently occurring within the permit boundary will continue into the near and far future.
No fish/aquatic habitat mitigation is planned .
From a regional water quality management perspective, there is no planned mitigation.
NA - Not Applicable
TributaryName
Stressors
Set
tlem
ent
Po
nd
s/C
atch
Bas
ins
(nu
mb
er)
Eq
uiv
alen
t C
lear
cut
Are
a w
ith
in
Cat
chm
ent
Are
a fr
om
195
5-20
10
(km
2 )
Was
te R
ock
Sto
rag
e (y
es/n
o)
Catchment Area
Total Footprint Area Currently
Disturbed(excludes
reclaimed lands)
To
tal C
atch
men
t A
rea
fro
m P
rovi
nci
al
Co
rpo
rate
Wat
ersh
ed B
ase
Dat
aset
(km
2 )
To
tal C
atch
men
t A
rea
as o
f S
epte
mb
er
2015
(km
2 )
% C
han
ge
in T
ota
l Cat
chm
ent
Are
a
Tec
k O
wn
ersh
ip R
igh
ts:
% o
f C
atch
men
t A
rea
and
Typ
e (C
oal
, Su
rfac
e, T
imb
er)
Ro
ck D
rain
(s)
(yes
/no
)
Forestry Disturbances in Catchment
Eq
uiv
alen
t C
lear
cut
Are
a w
ith
in
Cat
chm
ent
Are
a fr
om
201
1 to
20
15 (
%)
Mine Alterations/Disturbances/Planned Mitigation
Mine-Related Disturbances in Catchment as of September 2015
Additional Planned Near/Far Future Mining Disturbances Planned Mitigation/Fish Habitat OffsettingT
imin
g o
f D
istu
rban
ce:
His
tori
cal (
H),
Cu
rren
t (C
), N
ear
Fu
ture
(N
F),
Far
Fu
ture
(F
F)
or
No
t E
xpec
ted
(N
)
Eq
uiv
alen
t C
lear
cut
Are
a w
ith
in
Cat
chm
ent
Are
a fr
om
195
5-20
10
(%)
Eq
uiv
alen
t C
lear
cut
Are
a w
ith
in
Cat
chm
ent
Are
a fr
om
201
1 to
2015
(km
2 )
Road Disturbances in Catchment
Reclaimed Land Area
Ro
ad D
ensi
ty p
er k
m2
Str
eam
Cro
ssin
gs
per
km
Ro
ads
Wit
hin
100
m o
f a
Str
eam
% R
oad
s o
n S
lop
es G
reat
er
than
60%
Pit
(s)
(yes
/no
)
Ch
ann
el R
e-al
ign
men
t o
r D
iver
sio
n (
yes/
no
)
71
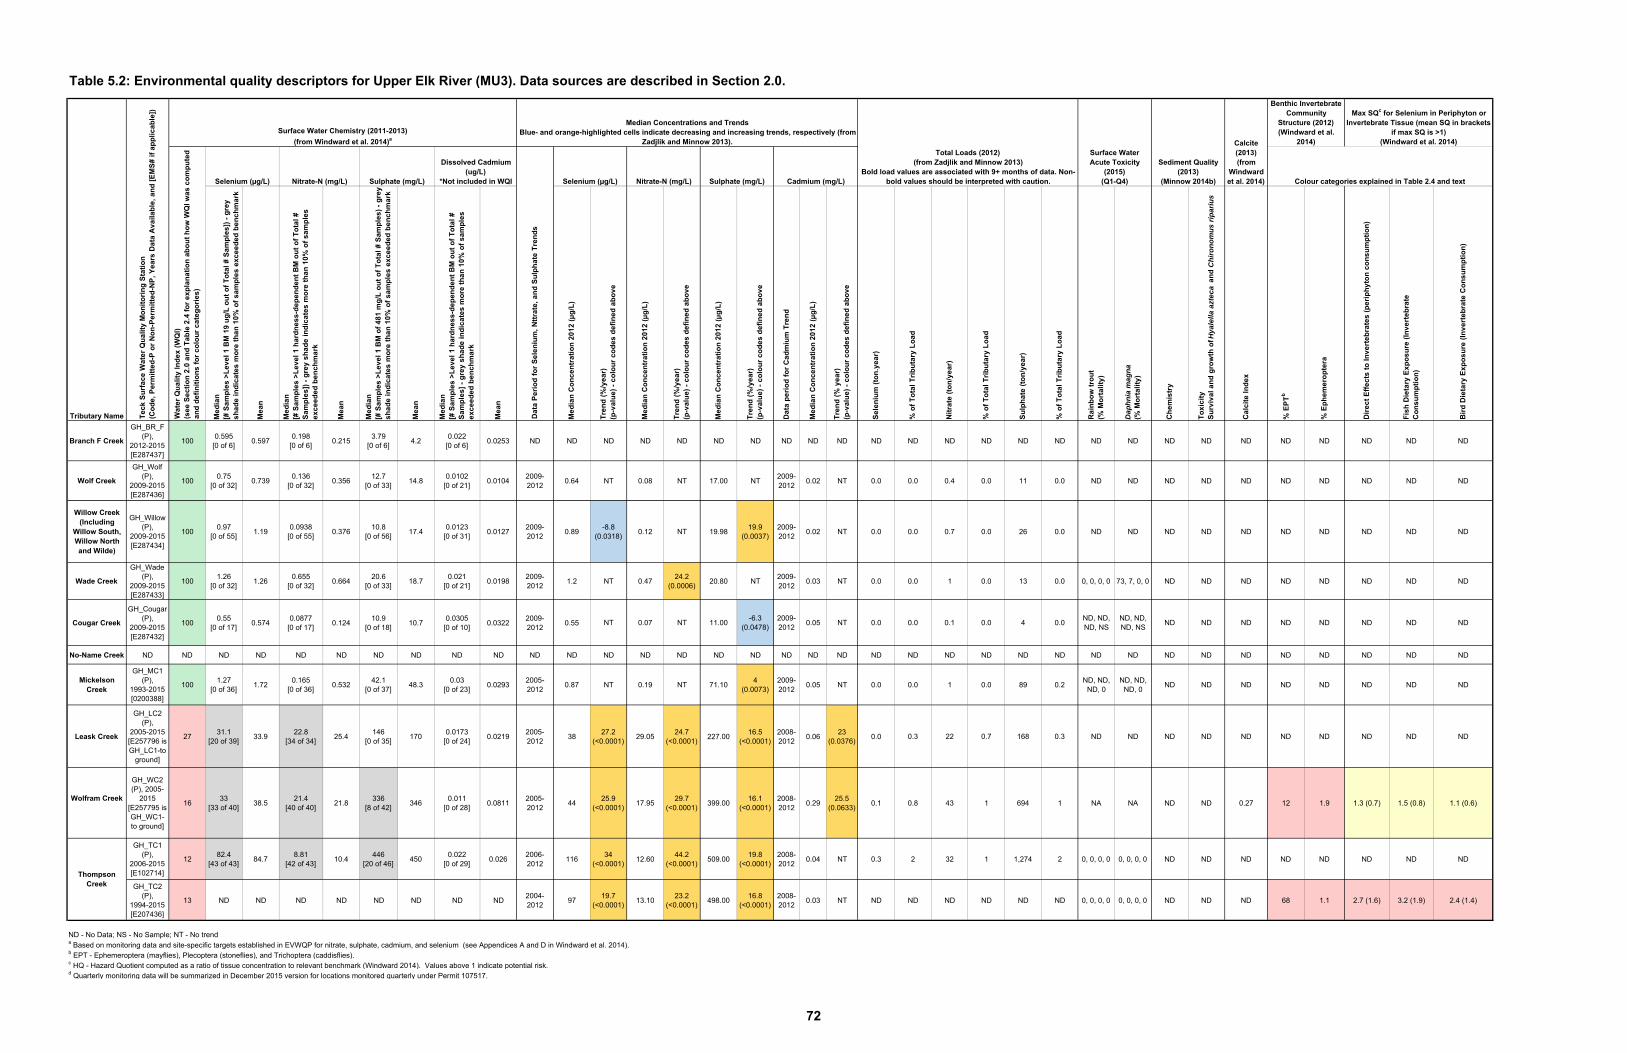
Table 5.2: Environmental quality descriptors for Upper Elk River (MU3). Data sources are described in Section 2.0.
Me
dia
n
[# S
am
ple
s >
Le
ve
l 1
BM
19
ug
/L o
ut
of
To
tal
# S
am
ple
s])
- g
rey
s
ha
de
in
dic
ate
s m
ore
th
an
10
% o
f s
am
ple
s e
xc
ee
de
d b
en
ch
ma
rk
Me
an
Me
dia
n[#
Sa
mp
les
>L
ev
el
1 h
ard
ne
ss
-de
pe
nd
en
t B
M o
ut
of
To
tal
#
Sa
mp
les
]) -
gre
y s
ha
de
in
dic
ate
s m
ore
th
an
10
% o
f s
am
ple
s
ex
ce
ed
ed
be
nc
hm
ark
Me
an
Me
dia
n[#
Sa
mp
les
>L
ev
el
1 B
M o
f 4
81
mg
/L o
ut
of
To
tal
# S
am
ple
s)
- g
rey
s
ha
de
in
dic
ate
s m
ore
th
an
10
% o
f s
am
ple
s e
xc
ee
de
d b
en
ch
ma
rk
Me
an
Me
dia
n
[# S
am
ple
s >
Le
ve
l 1
ha
rdn
es
s-d
ep
en
de
nt
BM
ou
t o
f T
ota
l #
S
am
ple
s]
- g
rey
sh
ad
e i
nd
ica
tes
mo
re t
ha
n 1
0%
of
sa
mp
les
e
xc
ee
de
d b
en
ch
ma
rk
Me
an
Me
dia
n C
on
ce
ntr
ati
on
20
12
(µ
g/L
)
Tre
nd
(%
/ye
ar)
(p-v
alu
e)
- c
olo
ur
co
de
s d
efi
ne
d a
bo
ve
Me
dia
n C
on
ce
ntr
ati
on
20
12
(µ
g/L
)
Tre
nd
(%
/ye
ar)
(p-v
alu
e)
- c
olo
ur
co
de
s d
efi
ne
d a
bo
ve
Me
dia
n C
on
ce
ntr
ati
on
20
12
(µ
g/L
)
Tre
nd
(%
/ye
ar)
(p-v
alu
e)
- c
olo
ur
co
de
s d
efi
ne
d a
bo
ve
Da
ta p
eri
od
fo
r C
ad
miu
m T
ren
d
Me
dia
n C
on
ce
ntr
ati
on
20
12
(µ
g/L
)
Tre
nd
(%
ye
ar)
(p-v
alu
e)
- c
olo
ur
co
de
s d
efi
ne
d a
bo
ve
Se
len
ium
(to
n.y
ea
r)
% o
f T
ota
l T
rib
uta
ry L
oa
d
Nit
rate
(to
n/y
ea
r)
% o
f T
ota
l T
rib
uta
ry L
oa
d
Su
lph
ate
(to
n/y
ea
r)
% o
f T
ota
l T
rib
uta
ry L
oa
d
Ra
inb
ow
tro
ut
(% M
ort
ali
ty)
Dap
hnia
mag
na(%
Mo
rta
lity
)
Ch
em
istr
y
To
xic
ity
Su
rviv
al
an
d g
row
th o
f Hya
lella
azt
eca
an
d C
hiro
nom
us ri
pariu
s
Ca
lcit
e I
nd
ex
% E
PT
b
% E
ph
em
ero
pte
ra
Dir
ec
t E
ffe
cts
to
In
ve
rte
bra
tes
(p
eri
ph
yto
n c
on
su
mp
tio
n)
Fis
h D
ieta
ry E
xp
os
ure
(In
ve
rte
bra
teC
on
su
mp
tio
n)
Bir
d D
ieta
ry E
xp
os
ure
(In
ve
rte
bra
te C
on
su
mp
tio
n)
Branch F Creek
GH_BR_F(P),
2012-2015[E287437]
1000.595
[0 of 6]0.597
0.198[0 of 6]
0.2153.79
[0 of 6]4.2
0.022[0 of 6]
0.0253 ND ND ND ND ND ND ND ND ND ND ND ND ND ND ND ND ND ND ND ND ND ND ND ND ND ND
Wolf Creek
GH_Wolf(P),
2009-2015[E287436]
1000.75
[0 of 32]0.739
0.136[0 of 32]
0.35612.7
[0 of 33]14.8
0.0102[0 of 21]
0.01042009-2012
0.64 NT 0.08 NT 17.00 NT2009-2012
0.02 NT 0.0 0.0 0.4 0.0 11 0.0 ND ND ND ND ND ND ND ND ND ND
Willow Creek (Including
Willow South, Willow North and Wilde)
GH_Willow(P),
2009-2015[E287434]
1000.97
[0 of 55]1.19
0.0938[0 of 55]
0.37610.8
[0 of 56]17.4
0.0123[0 of 31]
0.01272009-2012
0.89-8.8
(0.0318)0.12 NT 19.98
19.9(0.0037)
2009-2012
0.02 NT 0.0 0.0 0.7 0.0 26 0.0 ND ND ND ND ND ND ND ND ND ND
Wade Creek
GH_Wade(P),
2009-2015[E287433]
1001.26
[0 of 32]1.26
0.655[0 of 32]
0.66420.6
[0 of 33]18.7
0.021[0 of 21]
0.01982009-2012
1.2 NT 0.4724.2
(0.0006)20.80 NT
2009-2012
0.03 NT 0.0 0.0 1 0.0 13 0.0 0, 0, 0, 0 73, 7, 0, 0 ND ND ND ND ND ND ND ND
Cougar Creek
GH_Cougar(P),
2009-2015[E287432]
1000.55
[0 of 17]0.574
0.0877[0 of 17]
0.12410.9
[0 of 18]10.7
0.0305[0 of 10]
0.03222009-2012
0.55 NT 0.07 NT 11.00-6.3
(0.0478)2009-2012
0.05 NT 0.0 0.0 0.1 0.0 4 0.0ND, ND, ND, NS
ND, ND, ND, NS
ND ND ND ND ND ND ND ND
No-Name Creek ND ND ND ND ND ND ND ND ND ND ND ND ND ND ND ND ND ND ND ND ND ND ND ND ND ND ND ND ND ND ND ND ND ND ND ND
Mickelson Creek
GH_MC1(P),
1993-2015[0200388]
1001.27
[0 of 36]1.72
0.165[0 of 36]
0.53242.1
[0 of 37]48.3
0.03[0 of 23]
0.02932005-2012
0.87 NT 0.19 NT 71.104
(0.0073)2009-2012
0.05 NT 0.0 0.0 1 0.0 89 0.2ND, ND,
ND, 0ND, ND,
ND, 0ND ND ND ND ND ND ND ND
Leask Creek
GH_LC2(P),
2005-2015[E257796 is GH_LC1-to
ground]
2731.1
[20 of 39]33.9
22.8[34 of 34]
25.4146
[0 of 35]170
0.0173[0 of 24]
0.02192005-2012
3827.2
(<0.0001)29.05
24.7(<0.0001)
227.0016.5
(<0.0001)2008-2012
0.0623
(0.0376)0.0 0.3 22 0.7 168 0.3 ND ND ND ND ND ND ND ND ND ND
Wolfram Creek
GH_WC2(P), 2005-
2015[E257795 is GH_WC1-to ground]
1633
[33 of 40]38.5
21.4[40 of 40]
21.8336
[8 of 42]346
0.011[0 of 28]
0.08112005-2012
4425.9
(<0.0001)17.95
29.7(<0.0001)
399.0016.1
(<0.0001)2008-2012
0.2925.5
(0.0633)0.1 0.8 43 1 694 1 NA NA ND ND 0.27 12 1.9 1.3 (0.7) 1.5 (0.8) 1.1 (0.6)
GH_TC1(P),
2006-2015[E102714]
1282.4
[43 of 43]84.7
8.81[42 of 43]
10.4446
[20 of 46]450
0.022[0 of 29]
0.0262006-2012
11634
(<0.0001)12.60
44.2(<0.0001)
509.0019.8
(<0.0001)2008-2012
0.04 NT 0.3 2 32 1 1,274 2 0, 0, 0, 0 0, 0, 0, 0 ND ND ND ND ND ND ND ND
GH_TC2(P),
1994-2015[E207436]
13 ND ND ND ND ND ND ND ND2004-2012
9719.7
(<0.0001)13.10
23.2(<0.0001)
498.0016.8
(<0.0001)2008-2012
0.03 NT ND ND ND ND ND ND 0, 0, 0, 0 0, 0, 0, 0 ND ND ND 68 1.1 2.7 (1.6) 3.2 (1.9) 2.4 (1.4)
ND - No Data; NS - No Sample; NT - No trenda Based on monitoring data and site-specific targets established in EVWQP for nitrate, sulphate, cadmium, and selenium (see Appendices A and D in Windward et al. 2014). b EPT - Ephemeroptera (mayflies), Plecoptera (stoneflies), and Trichoptera (caddisflies).c HQ - Hazard Quotient computed as a ratio of tissue concentration to relevant benchmark (Windward 2014). Values above 1 indicate potential risk.d Quarterly monitoring data will be summarized in December 2015 version for locations monitored quarterly under Permit 107517.
Colour categories explained in Table 2.4 and text
Thompson Creek
Sediment Quality (2013)
(Minnow 2014b)
Calcite(2013)(from
Windward et al. 2014)
Benthic InvertebrateCommunity
Structure (2012)(Windward et al.
2014)
Max SQc for Selenium in Periphyton or Invertebrate Tissue (mean SQ in brackets
if max SQ is >1)(Windward et al. 2014)
Wa
ter
Qu
ali
ty I
nd
ex
(W
QI)
(se
e S
ec
tio
n 2
.0 a
nd
Ta
ble
2.4
fo
r e
xp
lan
ati
on
ab
ou
t h
ow
WQ
I w
as
co
mp
ute
d
an
d d
efi
nit
ion
s f
or
co
lou
r c
ate
go
rie
s)
Selenium (µg/L) Nitrate-N (mg/L) Sulphate (mg/L)
Total Loads (2012)(from Zadjlik and Minnow 2013)
Bold load values are associated with 9+ months of data. Non-bold values should be interpreted with caution.
Surface Water Acute Toxicity
(2015)(Q1-Q4)Selenium (µg/L) Nitrate-N (mg/L) Sulphate (mg/L) Cadmium (mg/L)
Dissolved Cadmium (ug/L)
*Not included in WQI
Da
ta P
eri
od
fo
r S
ele
niu
m,
Ntt
rate
, a
nd
Su
lph
ate
Tre
nd
s
Tributary Name Te
ck
Su
rfa
ce
Wa
ter
Qu
ali
ty M
on
ito
rin
g S
tati
on
(Co
de
, P
erm
itte
d-P
or
No
n-P
erm
itte
d-N
P,
Ye
ars
Da
ta A
va
ila
ble
, a
nd
[E
MS
# i
f a
pp
lic
ab
le])
Surface Water Chemistry (2011-2013)
(from Windward et al. 2014)a
Median Concentrations and TrendsBlue- and orange-highlighted cells indicate decreasing and increasing trends, respectively (from
Zadjlik and Minnow 2013).
72
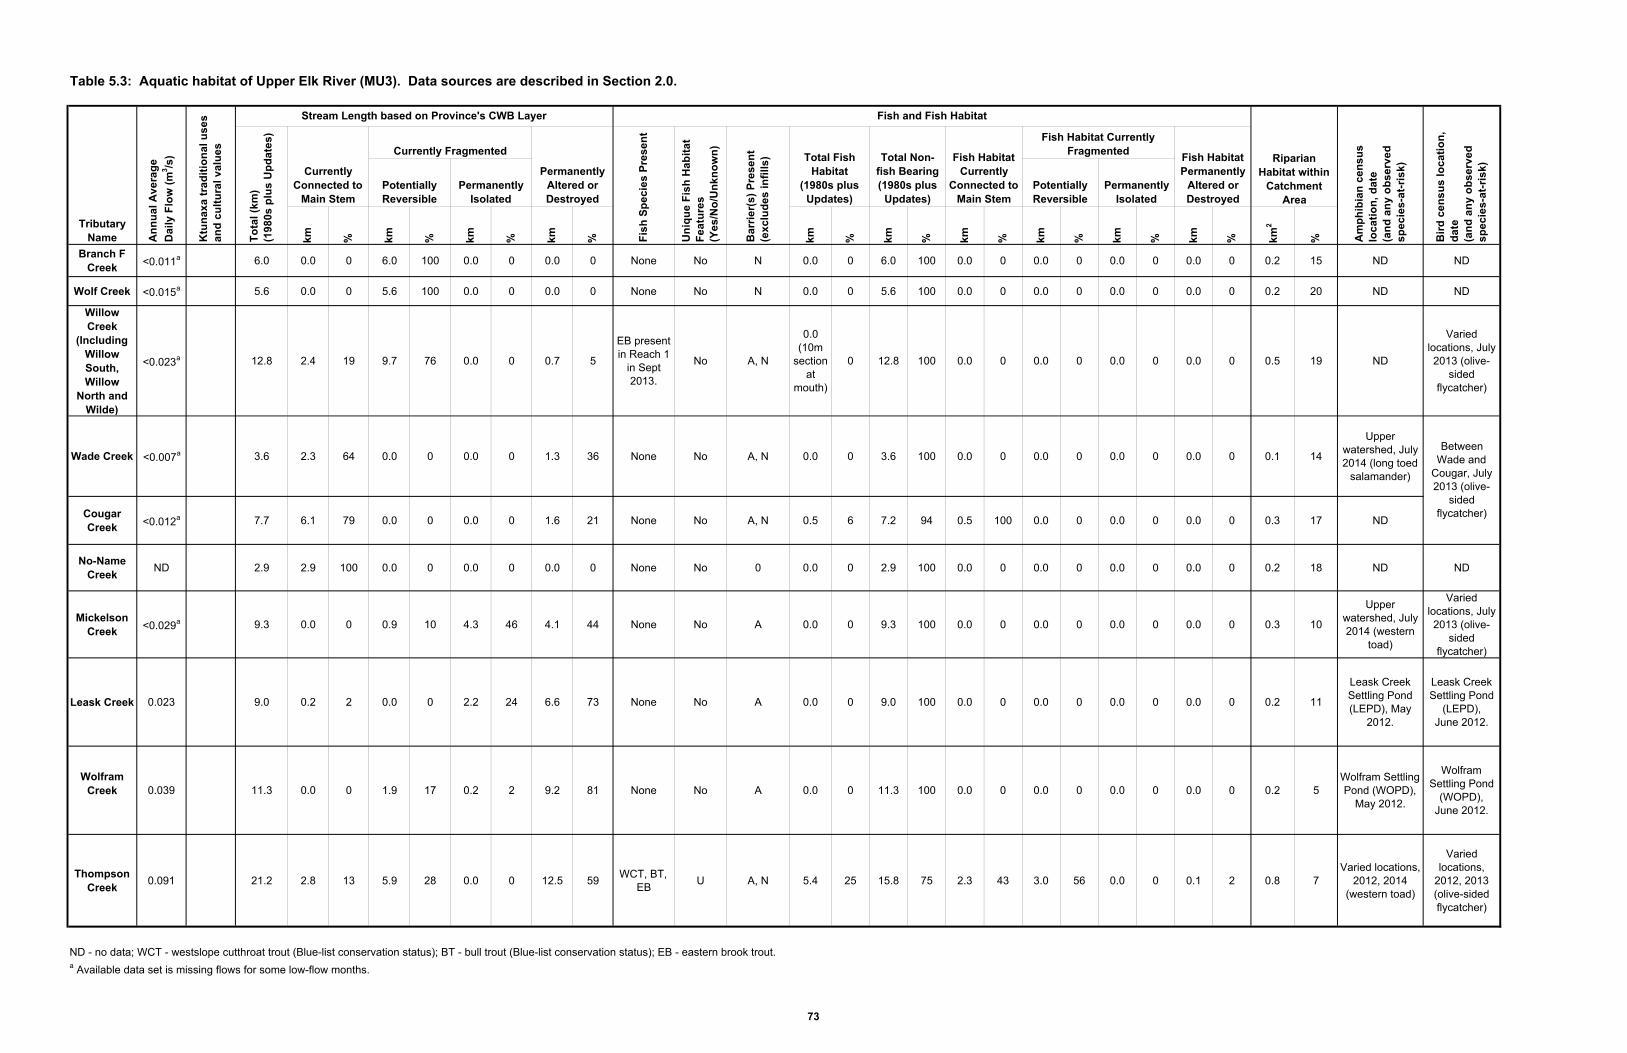
Table 5.3: Aquatic habitat of Upper Elk River (MU3). Data sources are described in Section 2.0.
km
% km
% km
% km
% km
% km
% km
% km
% km
% km
% km
2
%
Branch F Creek
<0.011a 6.0 0.0 0 6.0 100 0.0 0 0.0 0 None No N 0.0 0 6.0 100 0.0 0 0.0 0 0.0 0 0.0 0 0.2 15 ND ND
Wolf Creek <0.015a 5.6 0.0 0 5.6 100 0.0 0 0.0 0 None No N 0.0 0 5.6 100 0.0 0 0.0 0 0.0 0 0.0 0 0.2 20 ND ND
Willow Creek
(Including Willow South, Willow
North and Wilde)
<0.023a 12.8 2.4 19 9.7 76 0.0 0 0.7 5
EB present in Reach 1
in Sept 2013.
No A, N
0.0 (10m
section at
mouth)
0 12.8 100 0.0 0 0.0 0 0.0 0 0.0 0 0.5 19 ND
Varied locations, July 2013 (olive-
sided flycatcher)
Wade Creek <0.007a 3.6 2.3 64 0.0 0 0.0 0 1.3 36 None No A, N 0.0 0 3.6 100 0.0 0 0.0 0 0.0 0 0.0 0 0.1 14
Upper watershed, July 2014 (long toed
salamander)
Cougar Creek <0.012a 7.7 6.1 79 0.0 0 0.0 0 1.6 21 None No A, N 0.5 6 7.2 94 0.5 100 0.0 0 0.0 0 0.0 0 0.3 17 ND
No-Name Creek
ND 2.9 2.9 100 0.0 0 0.0 0 0.0 0 None No 0 0.0 0 2.9 100 0.0 0 0.0 0 0.0 0 0.0 0 0.2 18 ND ND
Mickelson Creek
<0.029a 9.3 0.0 0 0.9 10 4.3 46 4.1 44 None No A 0.0 0 9.3 100 0.0 0 0.0 0 0.0 0 0.0 0 0.3 10
Upper watershed, July 2014 (western
toad)
Varied locations, July 2013 (olive-
sided flycatcher)
Leask Creek 0.023 9.0 0.2 2 0.0 0 2.2 24 6.6 73 None No A 0.0 0 9.0 100 0.0 0 0.0 0 0.0 0 0.0 0 0.2 11
Leask Creek Settling Pond (LEPD), May
2012.
Leask Creek Settling Pond
(LEPD),June 2012.
Wolfram Creek 0.039 11.3 0.0 0 1.9 17 0.2 2 9.2 81 None No A 0.0 0 11.3 100 0.0 0 0.0 0 0.0 0 0.0 0 0.2 5
Wolfram Settling Pond (WOPD),
May 2012.
Wolfram Settling Pond
(WOPD),June 2012.
Thompson Creek
0.091 21.2 2.8 13 5.9 28 0.0 0 12.5 59WCT, BT,
EBU A, N 5.4 25 15.8 75 2.3 43 3.0 56 0.0 0 0.1 2 0.8 7
Varied locations, 2012, 2014
(western toad)
Varied locations,
2012, 2013 (olive-sided flycatcher)
ND - no data; WCT - westslope cutthroat trout (Blue-list conservation status); BT - bull trout (Blue-list conservation status); EB - eastern brook trout.a Available data set is missing flows for some low-flow months.
Potentially Reversible
Permanently Isolated
Potentially Reversible
Permanently Isolated
Ba
rrie
r(s
) P
res
en
t (e
xc
lud
es
in
fill
s) Total Fish
Habitat(1980s plus
Updates)
Total Non-fish Bearing(1980s plus
Updates)
Fish Habitat Currently
Connected to Main Stem
Fish Habitat Currently Fragmented
Between Wade and
Cougar, July 2013 (olive-
sided flycatcher)
Am
ph
ibia
n c
en
su
s
loc
ati
on
, d
ate
(a
nd
an
y o
bs
erv
ed
s
pe
cie
s-a
t-ri
sk
)
Bir
d c
en
su
s l
oc
ati
on
, d
ate
(an
d a
ny
ob
se
rve
d
sp
ec
ies
-at-
ris
k)
Tributary Name A
nn
ua
l A
ve
rag
e
Dai
ly F
low
(m
3 /s)
Ktu
na
xa
tra
dit
ion
al
us
es
a
nd
cu
ltu
ral
va
lue
s
Stream Length based on Province's CWB Layer Fish and Fish Habitat
Riparian Habitat within
Catchment Area
To
tal
(km
)(1
98
0s
plu
s U
pd
ate
s)
Currently Connected to
Main Stem
Currently Fragmented
Permanently Altered or Destroyed
Fis
h S
pe
cie
s P
res
en
t
Un
iqu
e F
ish
Ha
bit
at
Fe
atu
res
(Y
es
/No
/Un
kn
ow
n)
Fish Habitat Permanently
Altered or Destroyed
73
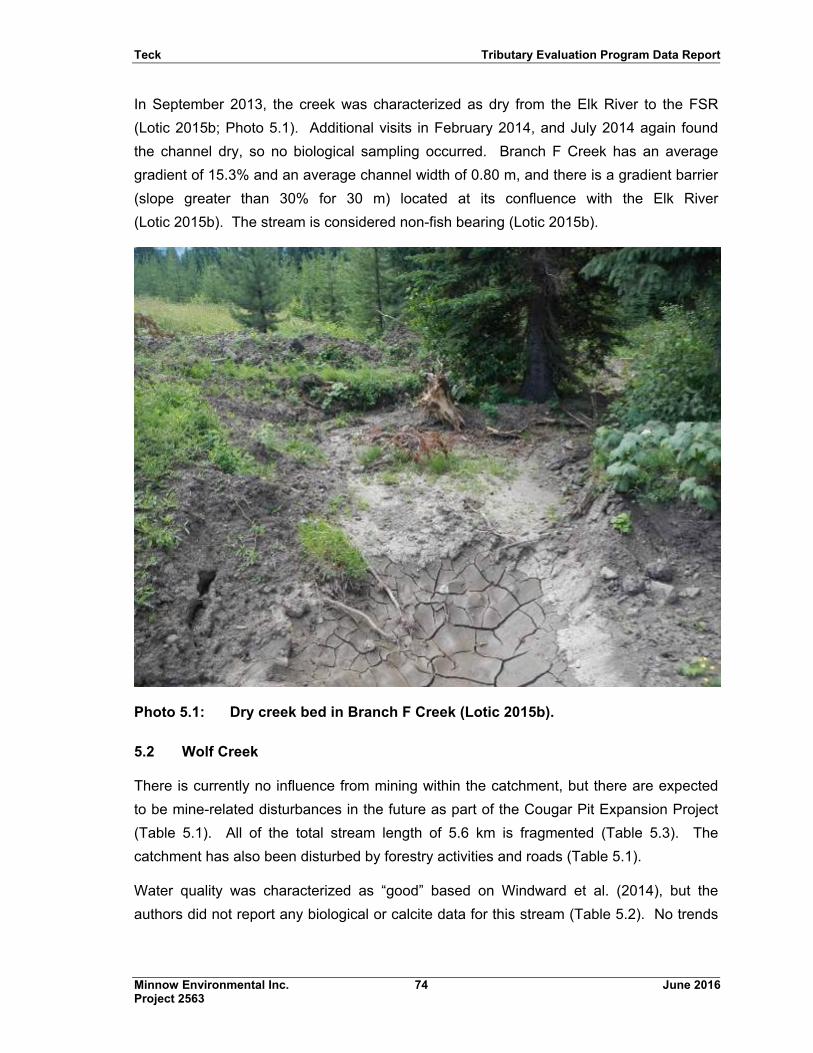
Teck Tributary Evaluation Program Data Report
Minnow Environmental Inc. 74 June 2016 Project 2563
In September 2013, the creek was characterized as dry from the Elk River to the FSR
(Lotic 2015b; Photo 5.1). Additional visits in February 2014, and July 2014 again found
the channel dry, so no biological sampling occurred. Branch F Creek has an average
gradient of 15.3% and an average channel width of 0.80 m, and there is a gradient barrier
(slope greater than 30% for 30 m) located at its confluence with the Elk River
(Lotic 2015b). The stream is considered non-fish bearing (Lotic 2015b).
Photo 5.1: Dry creek bed in Branch F Creek (Lotic 2015b).
5.2 Wolf Creek
There is currently no influence from mining within the catchment, but there are expected
to be mine-related disturbances in the future as part of the Cougar Pit Expansion Project
(Table 5.1). All of the total stream length of 5.6 km is fragmented (Table 5.3). The
catchment has also been disturbed by forestry activities and roads (Table 5.1).
Water quality was characterized as “good” based on Windward et al. (2014), but the
authors did not report any biological or calcite data for this stream (Table 5.2). No trends
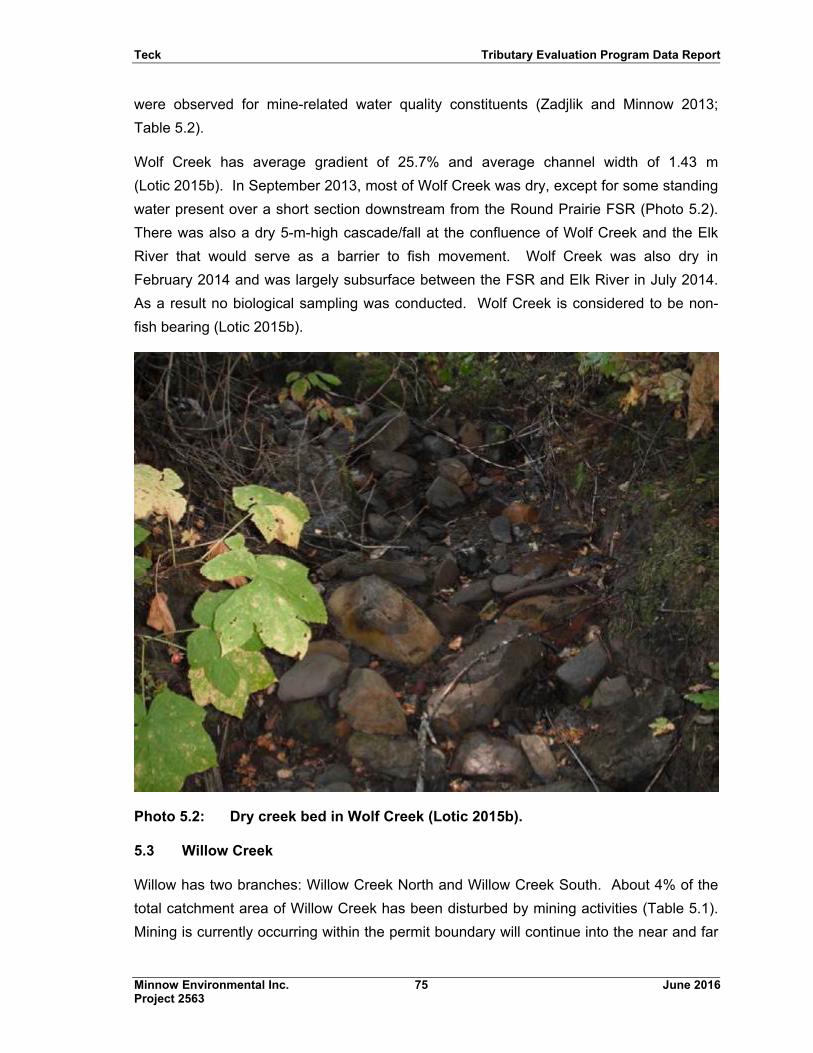
Teck Tributary Evaluation Program Data Report
Minnow Environmental Inc. 75 June 2016 Project 2563
were observed for mine-related water quality constituents (Zadjlik and Minnow 2013;
Table 5.2).
Wolf Creek has average gradient of 25.7% and average channel width of 1.43 m
(Lotic 2015b). In September 2013, most of Wolf Creek was dry, except for some standing
water present over a short section downstream from the Round Prairie FSR (Photo 5.2).
There was also a dry 5-m-high cascade/fall at the confluence of Wolf Creek and the Elk
River that would serve as a barrier to fish movement. Wolf Creek was also dry in
February 2014 and was largely subsurface between the FSR and Elk River in July 2014.
As a result no biological sampling was conducted. Wolf Creek is considered to be non-
fish bearing (Lotic 2015b).
Photo 5.2: Dry creek bed in Wolf Creek (Lotic 2015b).
5.3 Willow Creek
Willow has two branches: Willow Creek North and Willow Creek South. About 4% of the
total catchment area of Willow Creek has been disturbed by mining activities (Table 5.1).
Mining is currently occurring within the permit boundary will continue into the near and far
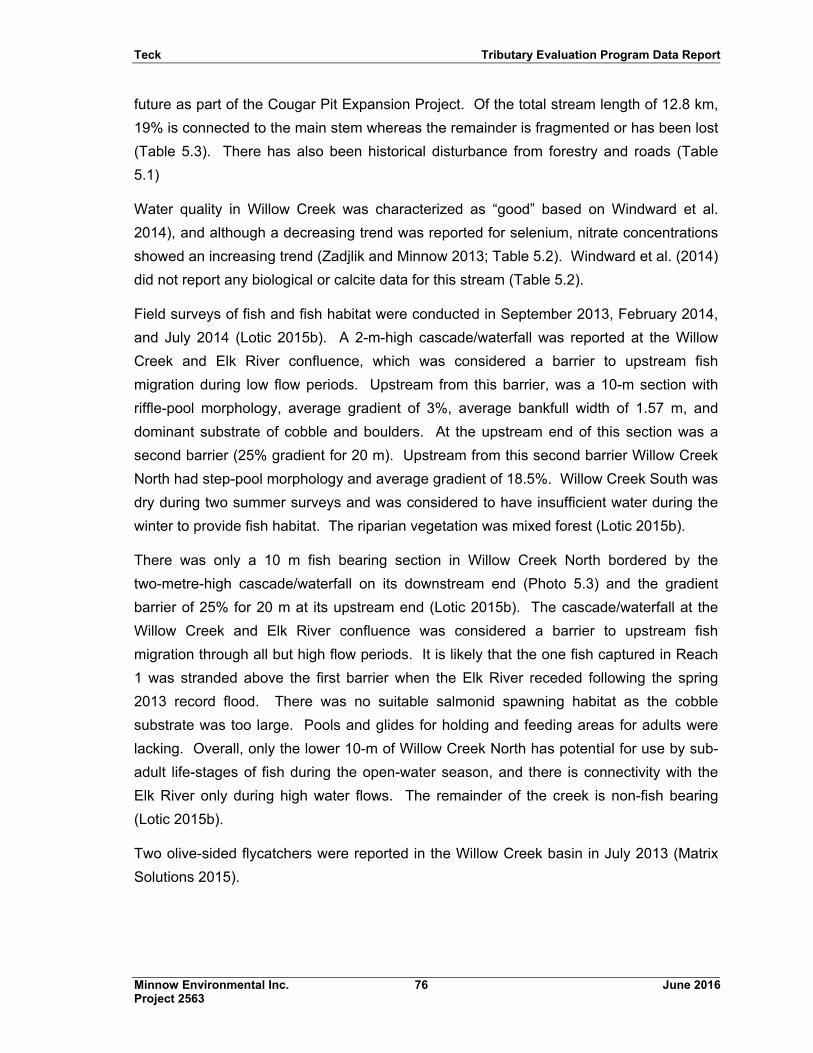
Teck Tributary Evaluation Program Data Report
Minnow Environmental Inc. 76 June 2016 Project 2563
future as part of the Cougar Pit Expansion Project. Of the total stream length of 12.8 km,
19% is connected to the main stem whereas the remainder is fragmented or has been lost
(Table 5.3). There has also been historical disturbance from forestry and roads (Table
5.1)
Water quality in Willow Creek was characterized as “good” based on Windward et al.
2014), and although a decreasing trend was reported for selenium, nitrate concentrations
showed an increasing trend (Zadjlik and Minnow 2013; Table 5.2). Windward et al. (2014)
did not report any biological or calcite data for this stream (Table 5.2).
Field surveys of fish and fish habitat were conducted in September 2013, February 2014,
and July 2014 (Lotic 2015b). A 2-m-high cascade/waterfall was reported at the Willow
Creek and Elk River confluence, which was considered a barrier to upstream fish
migration during low flow periods. Upstream from this barrier, was a 10-m section with
riffle-pool morphology, average gradient of 3%, average bankfull width of 1.57 m, and
dominant substrate of cobble and boulders. At the upstream end of this section was a
second barrier (25% gradient for 20 m). Upstream from this second barrier Willow Creek
North had step-pool morphology and average gradient of 18.5%. Willow Creek South was
dry during two summer surveys and was considered to have insufficient water during the
winter to provide fish habitat. The riparian vegetation was mixed forest (Lotic 2015b).
There was only a 10 m fish bearing section in Willow Creek North bordered by the
two-metre-high cascade/waterfall on its downstream end (Photo 5.3) and the gradient
barrier of 25% for 20 m at its upstream end (Lotic 2015b). The cascade/waterfall at the
Willow Creek and Elk River confluence was considered a barrier to upstream fish
migration through all but high flow periods. It is likely that the one fish captured in Reach
1 was stranded above the first barrier when the Elk River receded following the spring
2013 record flood. There was no suitable salmonid spawning habitat as the cobble
substrate was too large. Pools and glides for holding and feeding areas for adults were
lacking. Overall, only the lower 10-m of Willow Creek North has potential for use by sub-
adult life-stages of fish during the open-water season, and there is connectivity with the
Elk River only during high water flows. The remainder of the creek is non-fish bearing
(Lotic 2015b).
Two olive-sided flycatchers were reported in the Willow Creek basin in July 2013 (Matrix
Solutions 2015).
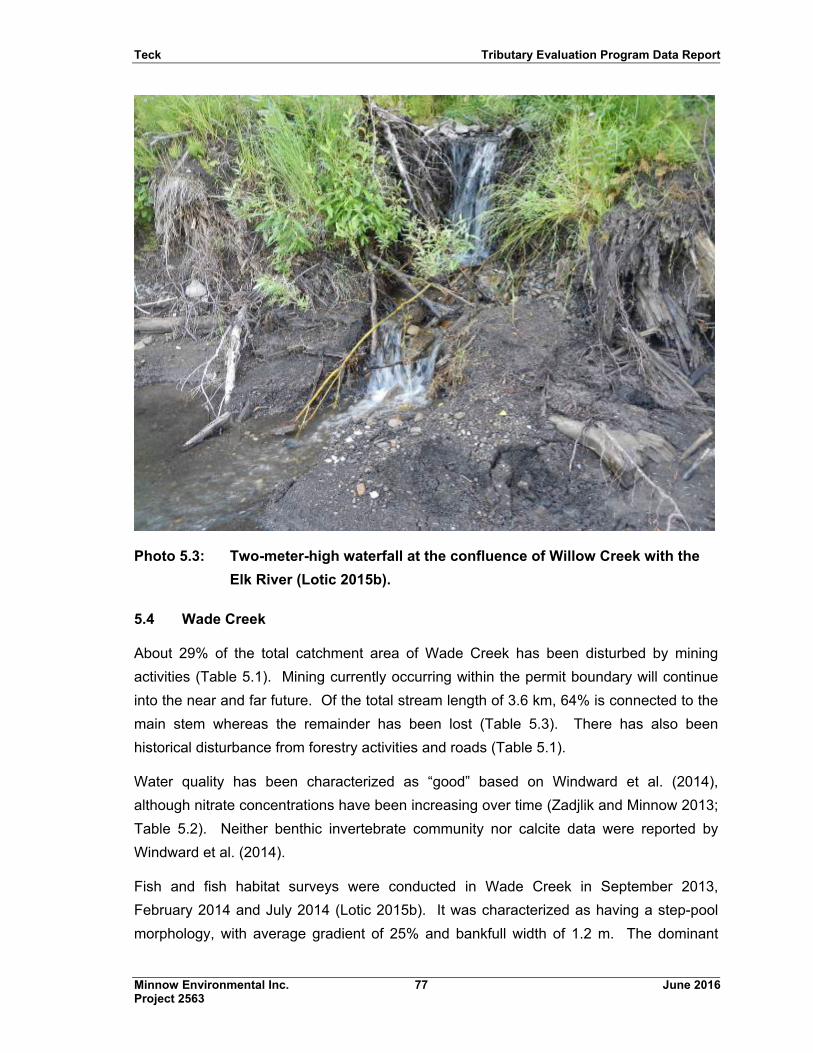
Teck Tributary Evaluation Program Data Report
Minnow Environmental Inc. 77 June 2016 Project 2563
Photo 5.3: Two-meter-high waterfall at the confluence of Willow Creek with the
Elk River (Lotic 2015b).
5.4 Wade Creek
About 29% of the total catchment area of Wade Creek has been disturbed by mining
activities (Table 5.1). Mining currently occurring within the permit boundary will continue
into the near and far future. Of the total stream length of 3.6 km, 64% is connected to the
main stem whereas the remainder has been lost (Table 5.3). There has also been
historical disturbance from forestry activities and roads (Table 5.1).
Water quality has been characterized as “good” based on Windward et al. (2014),
although nitrate concentrations have been increasing over time (Zadjlik and Minnow 2013;
Table 5.2). Neither benthic invertebrate community nor calcite data were reported by
Windward et al. (2014).
Fish and fish habitat surveys were conducted in Wade Creek in September 2013,
February 2014 and July 2014 (Lotic 2015b). It was characterized as having a step-pool
morphology, with average gradient of 25% and bankfull width of 1.2 m. The dominant
Teck Tributary Evaluation Program Data Report
Minnow Environmental Inc. 78 June 2016 Project 2563
substrate was cobble and boulders. The riparian vegetation was mixed forest
(Lotic 2015b).
There was abundant cover in Wade Creek provided by large woody debris, and moderate
cover was provided by small woody debris, boulders and undercut banks (Lotic 2015b).
However, a gradient barrier of 48% slope for 30 m was found immediately upstream from
the confluence of Wade Creek with Elk River which was determined to be a barrier to
upstream fish migration at low flows (Lotic 2015b).
Wade Creek was classified as non-fish bearing following two consecutive years of
sampling (September 2013, July 2014) during which no fish were caught or observed
(Lotic 2015b). The February 2014 overwintering survey indicated that Wade Creek did
not provide fish overwintering habitat (Lotic 2015b).
An olive-sided flycatcher was observed between Wade and Cougar Creeks in July 2013
(Matrix Solutions 2015). A long-toed salamander was also observed near Wade Creek in
July 2014 (Matrix Solutions 2015).
5.5 Cougar Creek
About 17% of the total catchment area of Cougar Creek has been disturbed by mining
activities (Table 5.1). Mining is currently occurring within the permit boundary and will
continue into the near and far future. Of the total stream length of 7.7 km, 79% is
connected to the main stem whereas the remainder has been lost (Table 5.3). The
catchment has also been disturbed by forestry activities and roads.
Water quality was classified as “good” based on Windward et al. (2014; Table 5.2), but
biological and calcite data were not reported by Windward et al. (2014).
Cougar Creek has an average gradient of 24% (Lotic 2015b). There is a gradient barrier
of 37% slope for 30 m immediately upstream from its confluence with the Elk River. In
September 2013, Cougar Creek was reported as dry from the Elk River up to the FSR
(Photo 5.4). It was also dry during surveys in February 2014 and July 2014. Therefore,
no biological sampling was completed. The combination of dry conditions and gradient
barrier preclude fish presence at any time of year. Cougar Creek is classified as non-fish
bearing (Lotic 2015b).
An olive-sided flycatcher was observed between Wade and Cougar Creeks in July 2013
(Matrix Solutions 2015).
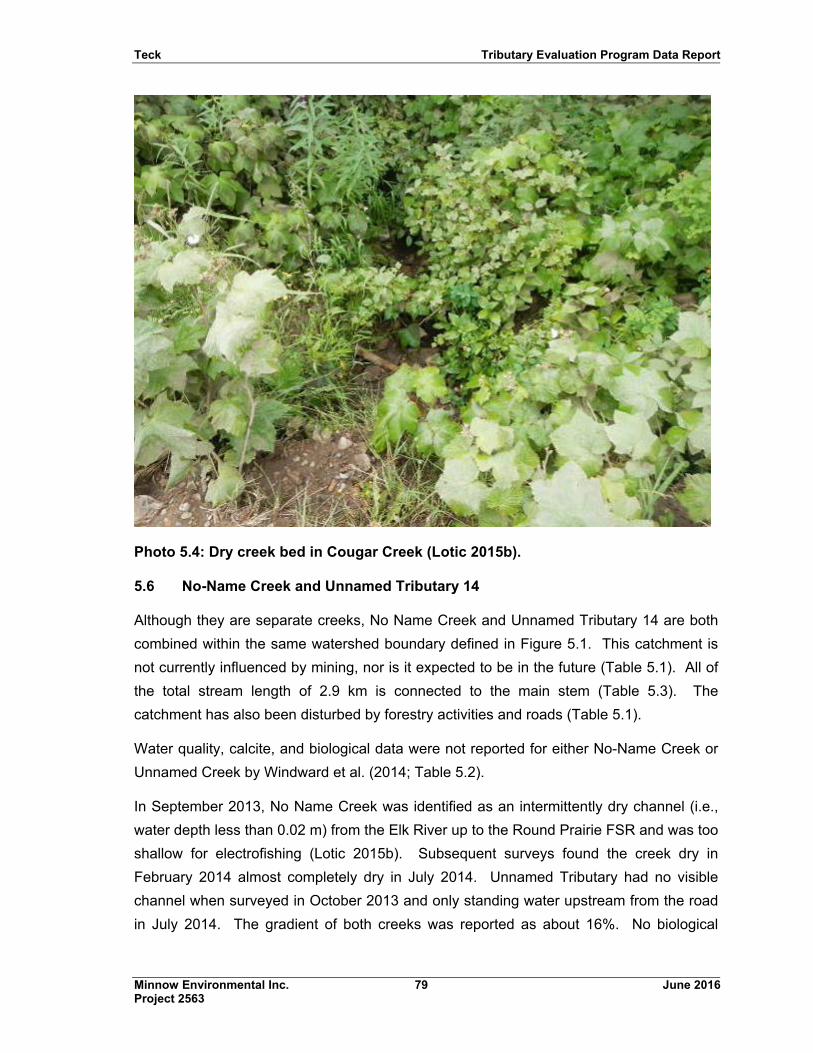
Teck Tributary Evaluation Program Data Report
Minnow Environmental Inc. 79 June 2016 Project 2563
Photo 5.4: Dry creek bed in Cougar Creek (Lotic 2015b).
5.6 No-Name Creek and Unnamed Tributary 14
Although they are separate creeks, No Name Creek and Unnamed Tributary 14 are both
combined within the same watershed boundary defined in Figure 5.1. This catchment is
not currently influenced by mining, nor is it expected to be in the future (Table 5.1). All of
the total stream length of 2.9 km is connected to the main stem (Table 5.3). The
catchment has also been disturbed by forestry activities and roads (Table 5.1).
Water quality, calcite, and biological data were not reported for either No-Name Creek or
Unnamed Creek by Windward et al. (2014; Table 5.2).
In September 2013, No Name Creek was identified as an intermittently dry channel (i.e.,
water depth less than 0.02 m) from the Elk River up to the Round Prairie FSR and was too
shallow for electrofishing (Lotic 2015b). Subsequent surveys found the creek dry in
February 2014 almost completely dry in July 2014. Unnamed Tributary had no visible
channel when surveyed in October 2013 and only standing water upstream from the road
in July 2014. The gradient of both creeks was reported as about 16%. No biological
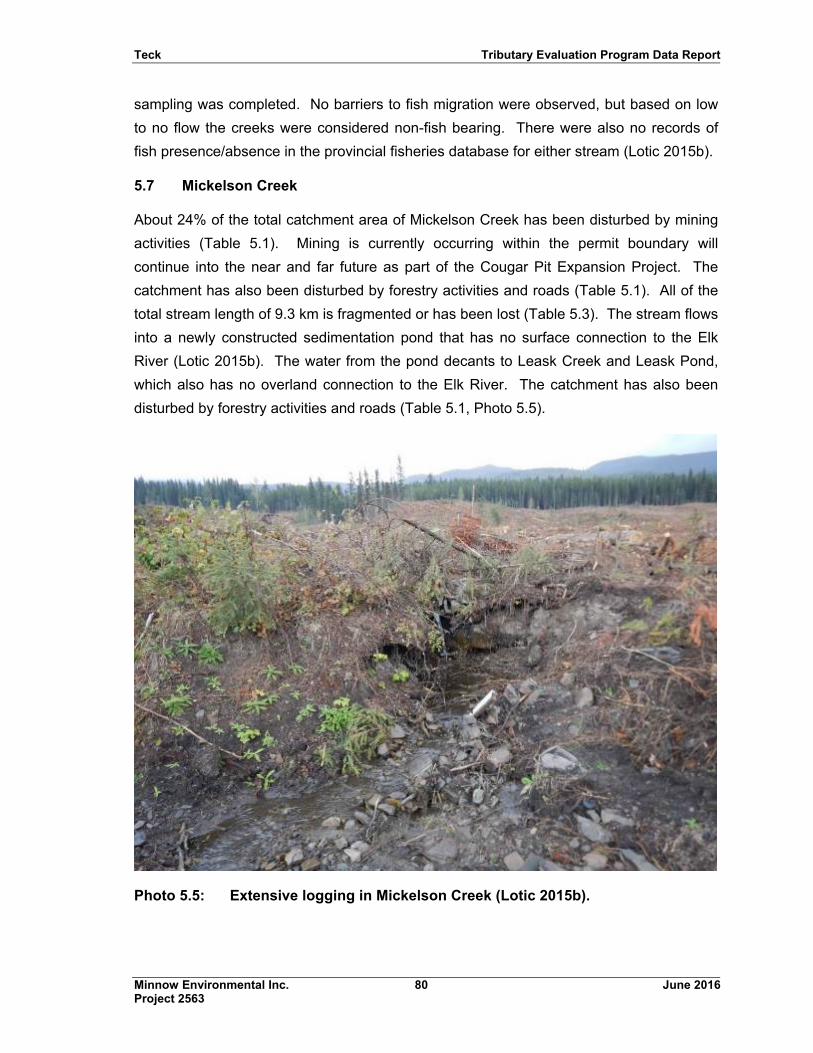
Teck Tributary Evaluation Program Data Report
Minnow Environmental Inc. 80 June 2016 Project 2563
sampling was completed. No barriers to fish migration were observed, but based on low
to no flow the creeks were considered non-fish bearing. There were also no records of
fish presence/absence in the provincial fisheries database for either stream (Lotic 2015b).
5.7 Mickelson Creek
About 24% of the total catchment area of Mickelson Creek has been disturbed by mining
activities (Table 5.1). Mining is currently occurring within the permit boundary will
continue into the near and far future as part of the Cougar Pit Expansion Project. The
catchment has also been disturbed by forestry activities and roads (Table 5.1). All of the
total stream length of 9.3 km is fragmented or has been lost (Table 5.3). The stream flows
into a newly constructed sedimentation pond that has no surface connection to the Elk
River (Lotic 2015b). The water from the pond decants to Leask Creek and Leask Pond,
which also has no overland connection to the Elk River. The catchment has also been
disturbed by forestry activities and roads (Table 5.1, Photo 5.5).
Photo 5.5: Extensive logging in Mickelson Creek (Lotic 2015b).
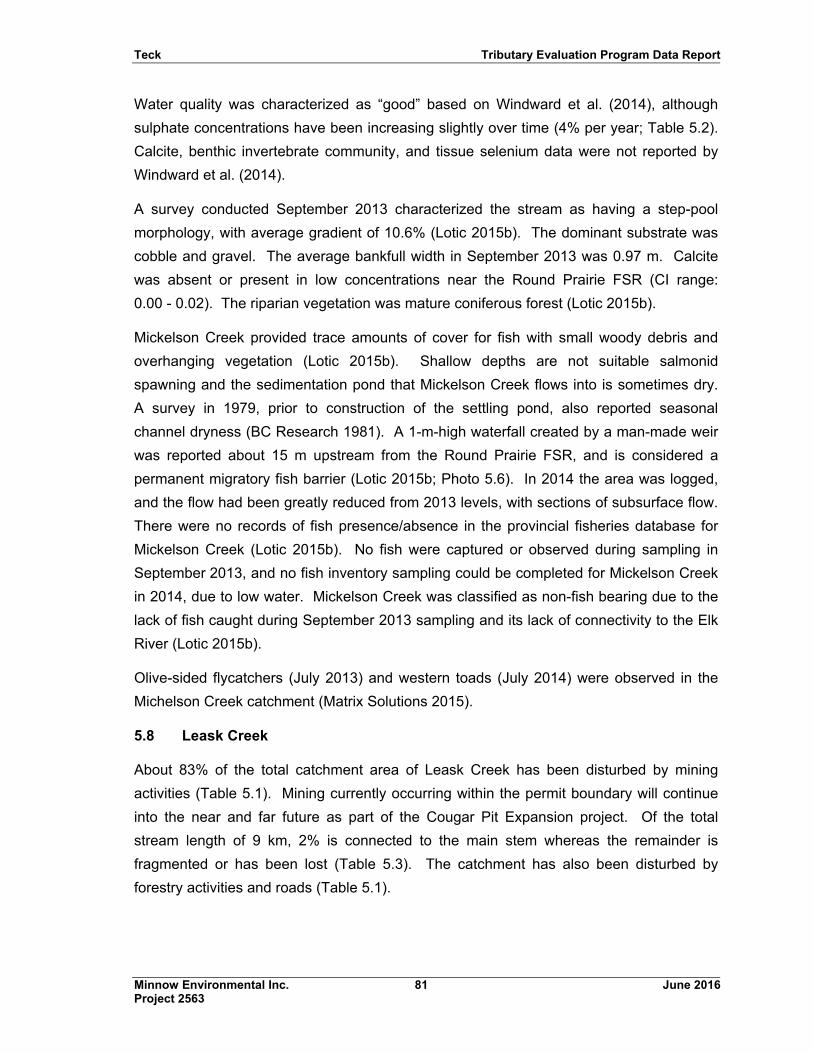
Teck Tributary Evaluation Program Data Report
Minnow Environmental Inc. 81 June 2016 Project 2563
Water quality was characterized as “good” based on Windward et al. (2014), although
sulphate concentrations have been increasing slightly over time (4% per year; Table 5.2).
Calcite, benthic invertebrate community, and tissue selenium data were not reported by
Windward et al. (2014).
A survey conducted September 2013 characterized the stream as having a step-pool
morphology, with average gradient of 10.6% (Lotic 2015b). The dominant substrate was
cobble and gravel. The average bankfull width in September 2013 was 0.97 m. Calcite
was absent or present in low concentrations near the Round Prairie FSR (CI range:
0.00 - 0.02). The riparian vegetation was mature coniferous forest (Lotic 2015b).
Mickelson Creek provided trace amounts of cover for fish with small woody debris and
overhanging vegetation (Lotic 2015b). Shallow depths are not suitable salmonid
spawning and the sedimentation pond that Mickelson Creek flows into is sometimes dry.
A survey in 1979, prior to construction of the settling pond, also reported seasonal
channel dryness (BC Research 1981). A 1-m-high waterfall created by a man-made weir
was reported about 15 m upstream from the Round Prairie FSR, and is considered a
permanent migratory fish barrier (Lotic 2015b; Photo 5.6). In 2014 the area was logged,
and the flow had been greatly reduced from 2013 levels, with sections of subsurface flow.
There were no records of fish presence/absence in the provincial fisheries database for
Mickelson Creek (Lotic 2015b). No fish were captured or observed during sampling in
September 2013, and no fish inventory sampling could be completed for Mickelson Creek
in 2014, due to low water. Mickelson Creek was classified as non-fish bearing due to the
lack of fish caught during September 2013 sampling and its lack of connectivity to the Elk
River (Lotic 2015b).
Olive-sided flycatchers (July 2013) and western toads (July 2014) were observed in the
Michelson Creek catchment (Matrix Solutions 2015).
5.8 Leask Creek
About 83% of the total catchment area of Leask Creek has been disturbed by mining
activities (Table 5.1). Mining currently occurring within the permit boundary will continue
into the near and far future as part of the Cougar Pit Expansion project. Of the total
stream length of 9 km, 2% is connected to the main stem whereas the remainder is
fragmented or has been lost (Table 5.3). The catchment has also been disturbed by
forestry activities and roads (Table 5.1).
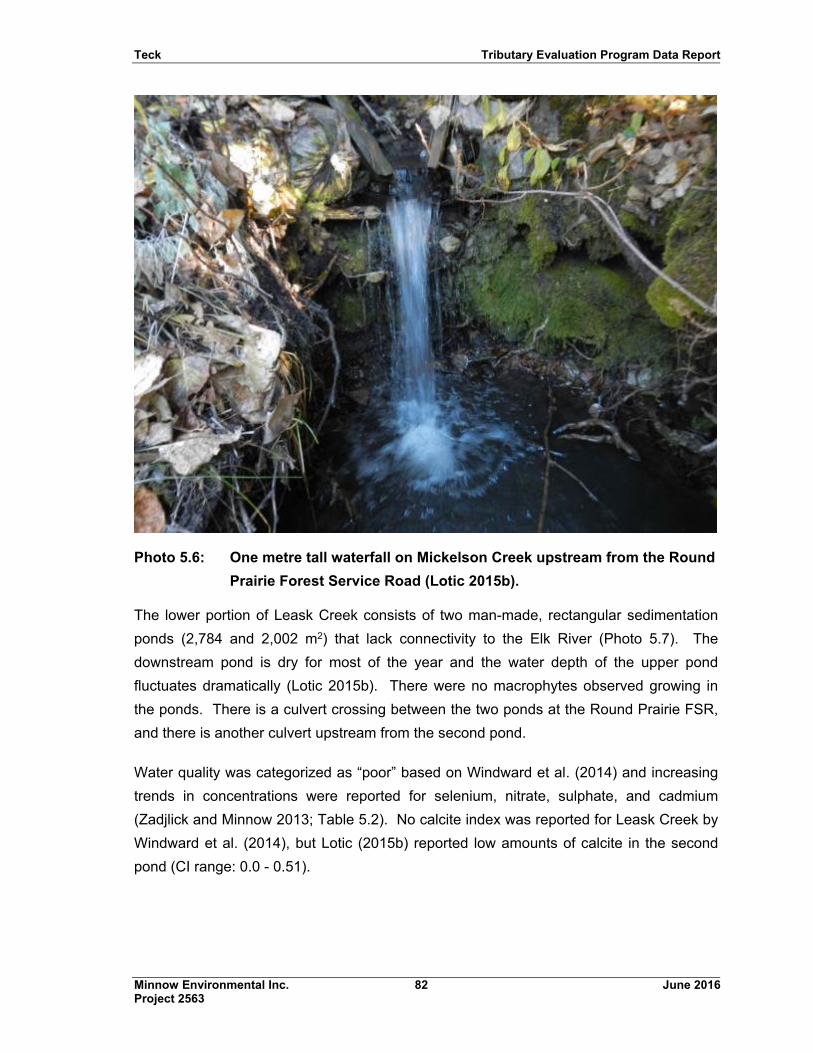
Teck Tributary Evaluation Program Data Report
Minnow Environmental Inc. 82 June 2016 Project 2563
Photo 5.6: One metre tall waterfall on Mickelson Creek upstream from the Round
Prairie Forest Service Road (Lotic 2015b).
The lower portion of Leask Creek consists of two man-made, rectangular sedimentation
ponds (2,784 and 2,002 m2) that lack connectivity to the Elk River (Photo 5.7). The
downstream pond is dry for most of the year and the water depth of the upper pond
fluctuates dramatically (Lotic 2015b). There were no macrophytes observed growing in
the ponds. There is a culvert crossing between the two ponds at the Round Prairie FSR,
and there is another culvert upstream from the second pond.
Water quality was categorized as “poor” based on Windward et al. (2014) and increasing
trends in concentrations were reported for selenium, nitrate, sulphate, and cadmium
(Zadjlick and Minnow 2013; Table 5.2). No calcite index was reported for Leask Creek by
Windward et al. (2014), but Lotic (2015b) reported low amounts of calcite in the second
pond (CI range: 0.0 - 0.51).
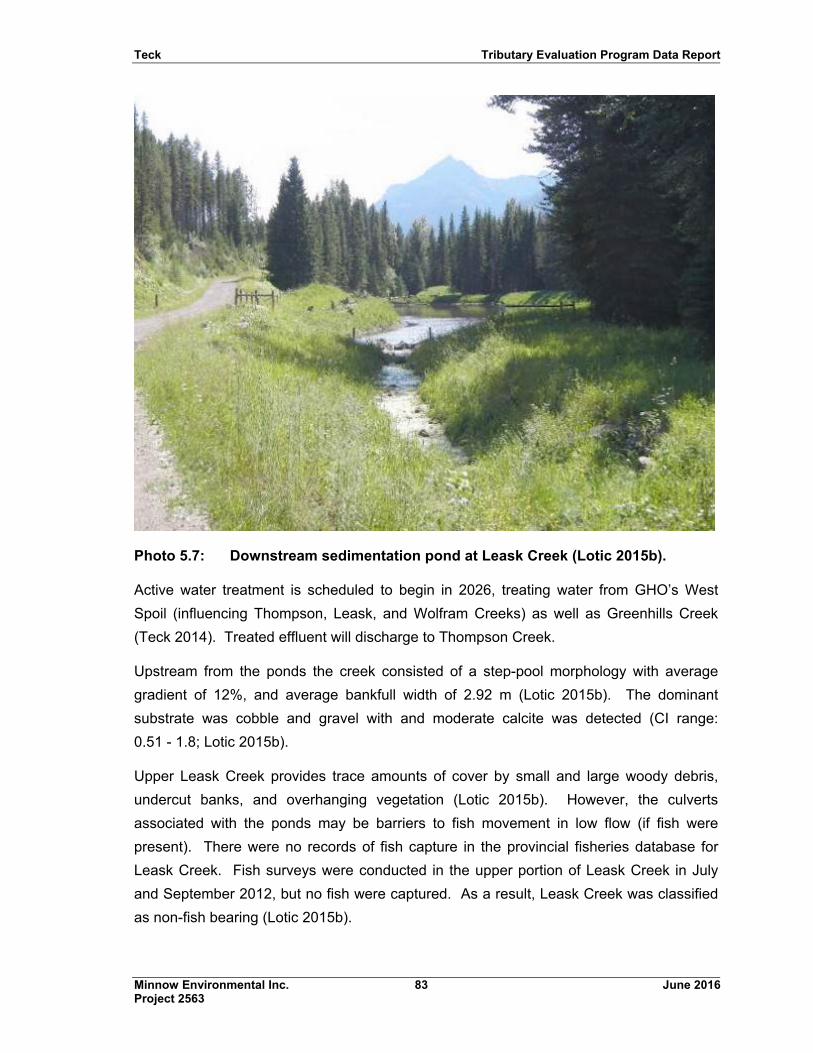
Teck Tributary Evaluation Program Data Report
Minnow Environmental Inc. 83 June 2016 Project 2563
Photo 5.7: Downstream sedimentation pond at Leask Creek (Lotic 2015b).
Active water treatment is scheduled to begin in 2026, treating water from GHO’s West
Spoil (influencing Thompson, Leask, and Wolfram Creeks) as well as Greenhills Creek
(Teck 2014). Treated effluent will discharge to Thompson Creek.
Upstream from the ponds the creek consisted of a step-pool morphology with average
gradient of 12%, and average bankfull width of 2.92 m (Lotic 2015b). The dominant
substrate was cobble and gravel with and moderate calcite was detected (CI range:
0.51 - 1.8; Lotic 2015b).
Upper Leask Creek provides trace amounts of cover by small and large woody debris,
undercut banks, and overhanging vegetation (Lotic 2015b). However, the culverts
associated with the ponds may be barriers to fish movement in low flow (if fish were
present). There were no records of fish capture in the provincial fisheries database for
Leask Creek. Fish surveys were conducted in the upper portion of Leask Creek in July
and September 2012, but no fish were captured. As a result, Leask Creek was classified
as non-fish bearing (Lotic 2015b).
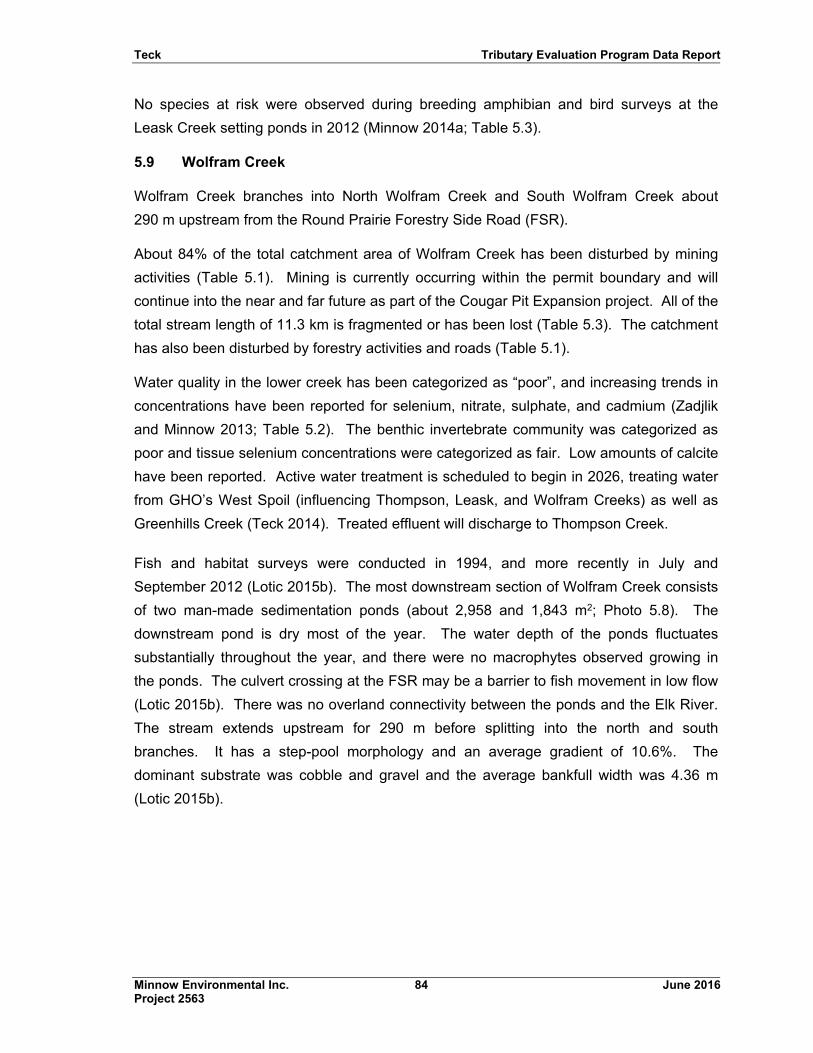
Teck Tributary Evaluation Program Data Report
Minnow Environmental Inc. 84 June 2016 Project 2563
No species at risk were observed during breeding amphibian and bird surveys at the
Leask Creek setting ponds in 2012 (Minnow 2014a; Table 5.3).
5.9 Wolfram Creek
Wolfram Creek branches into North Wolfram Creek and South Wolfram Creek about
290 m upstream from the Round Prairie Forestry Side Road (FSR).
About 84% of the total catchment area of Wolfram Creek has been disturbed by mining
activities (Table 5.1). Mining is currently occurring within the permit boundary and will
continue into the near and far future as part of the Cougar Pit Expansion project. All of the
total stream length of 11.3 km is fragmented or has been lost (Table 5.3). The catchment
has also been disturbed by forestry activities and roads (Table 5.1).
Water quality in the lower creek has been categorized as “poor”, and increasing trends in
concentrations have been reported for selenium, nitrate, sulphate, and cadmium (Zadjlik
and Minnow 2013; Table 5.2). The benthic invertebrate community was categorized as
poor and tissue selenium concentrations were categorized as fair. Low amounts of calcite
have been reported. Active water treatment is scheduled to begin in 2026, treating water
from GHO’s West Spoil (influencing Thompson, Leask, and Wolfram Creeks) as well as
Greenhills Creek (Teck 2014). Treated effluent will discharge to Thompson Creek.
Fish and habitat surveys were conducted in 1994, and more recently in July and
September 2012 (Lotic 2015b). The most downstream section of Wolfram Creek consists
of two man-made sedimentation ponds (about 2,958 and 1,843 m2; Photo 5.8). The
downstream pond is dry most of the year. The water depth of the ponds fluctuates
substantially throughout the year, and there were no macrophytes observed growing in
the ponds. The culvert crossing at the FSR may be a barrier to fish movement in low flow
(Lotic 2015b). There was no overland connectivity between the ponds and the Elk River.
The stream extends upstream for 290 m before splitting into the north and south
branches. It has a step-pool morphology and an average gradient of 10.6%. The
dominant substrate was cobble and gravel and the average bankfull width was 4.36 m
(Lotic 2015b).
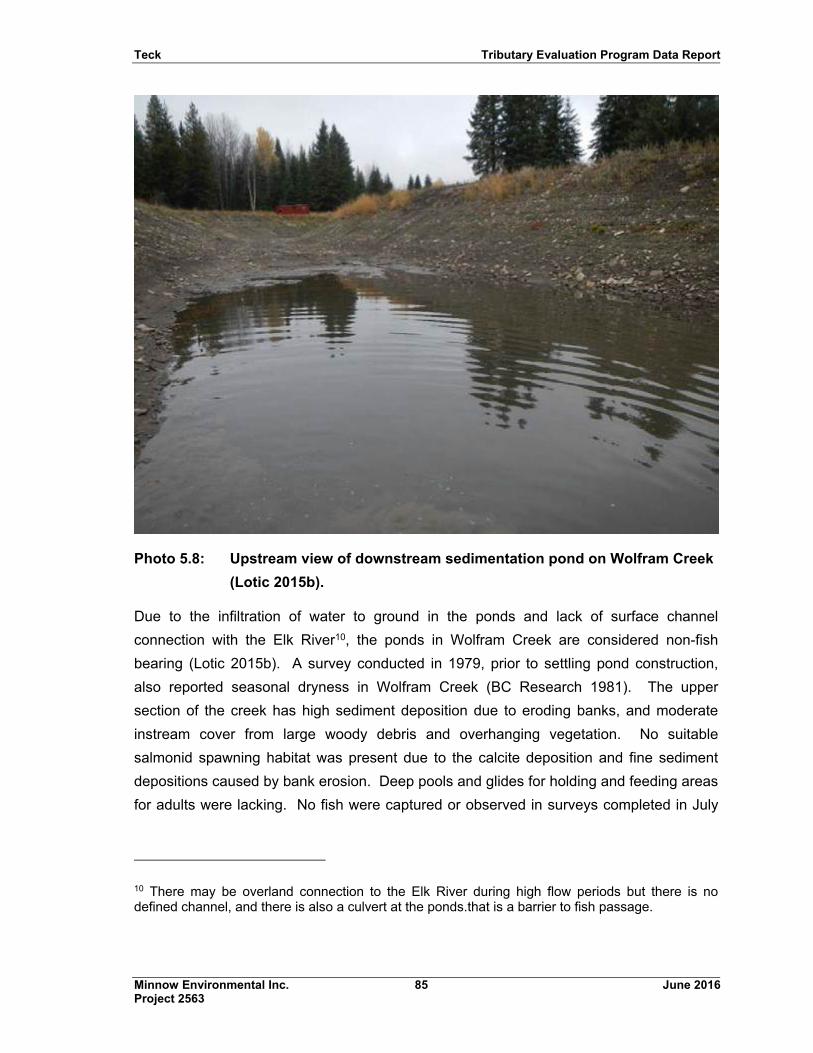
Teck Tributary Evaluation Program Data Report
Minnow Environmental Inc. 85 June 2016 Project 2563
Photo 5.8: Upstream view of downstream sedimentation pond on Wolfram Creek
(Lotic 2015b).
Due to the infiltration of water to ground in the ponds and lack of surface channel
connection with the Elk River10, the ponds in Wolfram Creek are considered non-fish
bearing (Lotic 2015b). A survey conducted in 1979, prior to settling pond construction,
also reported seasonal dryness in Wolfram Creek (BC Research 1981). The upper
section of the creek has high sediment deposition due to eroding banks, and moderate
instream cover from large woody debris and overhanging vegetation. No suitable
salmonid spawning habitat was present due to the calcite deposition and fine sediment
depositions caused by bank erosion. Deep pools and glides for holding and feeding areas
for adults were lacking. No fish were captured or observed in surveys completed in July
10 There may be overland connection to the Elk River during high flow periods but there is no defined channel, and there is also a culvert at the ponds.that is a barrier to fish passage.
Teck Tributary Evaluation Program Data Report
Minnow Environmental Inc. 86 June 2016 Project 2563
and September 2012. Therefore, upper Wolfram Creek is also classified as non-fish
bearing (Lotic 2015b).
No species at risk were observed during breeding amphibian and bird surveys at the
Leask Creek setting ponds in 2012 (Minnow 2014a; Table 5.3).
5.10 Thompson Creek
Upper (South) Thompson Creek flows northwest before it is joined by North Thompson
Creek and then flows west into a side channel of the Elk River. About 37% of the total
catchment area of Thompson Creek has been disturbed by mining activities (Table 5.1).
Mining currently occurring within the permit boundary will continue into the near and far
future. Of the total stream length of 21.2 km, 13% is connected to the main stem whereas
the remainder is fragmented or has been lost (Table 5.3). The catchment has also been
disturbed by forestry activities and roads (Table 5.1).
Water quality was characterized as “poor” based on Windward et al. (2014), and
increasing concentration trends were reported for selenium, nitrate and sulphate (Zadjlik
and Minnow 2013; Table 5.2). The benthic invertebrate community and tissue selenium
concentrations were also categorized as “poor” (Windward et al. 2014).
Active water treatment is scheduled to begin in 2026, treating water from GHO’s West
Spoil (influencing Thompson, Leask, and Wolfram Creeks) as well as Greenhills Creek
(Teck 2014). Treated effluent will discharge to Thompson Creek.
Most of Thompson Creek is high gradient and dominated by boulder substrates
(RL&L 1994). The lowest portion of the downstream reach has low gradient and subject
to intermittent water flows during fall months. Subsurface flow was reported in 1979 300
m downstream from the road crossing in 1979 (BC Research 1981). A series of waterfalls
located on North Thompson Creek, just upstream from the confluence with upper
Thompson Creek, is a barrier to fish passage. There is also a barrier on Upper Thompson
creek 150 m upstream of its confluence with North Thompson Creek. There are three
settling ponds (Lower Thompson Creek Pond, Upper Pond and North Pond). The Upper
and North ponds are located upstream from the falls that act as a barrier to fish
movement. Lower Thompson Creek Pond has three cells constructed within the creek
and adjacent low lying area. The system has a bypass channel (RL&L 1994).
Fish species found in Thompson Creek include bull trout, eastern brook trout, and
westslope cutthroat trout (RL&L 1994). Bull trout and westslope cutthroat trout were also
reported in Thompson Creek during a fish survey in 1979, prior to mine development (BC
Teck Tributary Evaluation Program Data Report
Minnow Environmental Inc. 87 June 2016 Project 2563
Research 1981). The creek contains some suitable habitat for fish rearing, feeding, and
spawning (RL&L 1994). Cutthroat trout are present year round, and the presence of
adults in spawning condition, and young-of-the-year downstream of the barriers indicates
the population may be resident. Fish can move in and out of the Lower Thompson Creek
Pond, although the spillway at the outlet may be a partial barrier during low flows (Teck
Internal Sources). The largest cell of the pond may provide overwinter habitat
(RL&L 1994).
Western toad and olive-sided flycatcher, which are species at risk, were identified during
breeding amphibian and bird surveys at the Thompson Creek setting ponds in 2012
(Minnow 2014a; Table 5.3). Surveys completed in 2013 and 2014 reported olive-sided
flycatchers, western toads, long-toed salamanders, and a Columbia spotted frog in the
catchment of Thompson Creek (Matrix Solutions 2015).
Teck Tributary Evaluation Program Data Report
Minnow Environmental Inc. 88 June 2016 Project 2563
6.0 TRIBUTARIES TO MICHEL CREEK (MU4)
Tributaries in the Michel Creek Watershed (MU4) are shown in Figure 6.1, and include:
Upstream Michel Creek;
Corbin Creek;
Andy Good Creek;
Leach Creek;
Carbon Creek;
Snowslide Creek;
Wheeler Creek;
Unnamed Tributary to Michel Creek;
Fir Creek
Alexander Creek
Erickson Creek
South Pit Creek
Milligan Creek
Gate Creek
Bodie Creek; and
Aqueduct Creek.
Matrices for these tributaries provide data related to watershed area and disturbances
(Table 6.1), environmental quality descriptors (Table 6.2) and fish and aquatic habitat
(Table 6.3). An orthophoto figure for each tributary is found in Appendix D. Each tributary
is briefly described in the following sections.
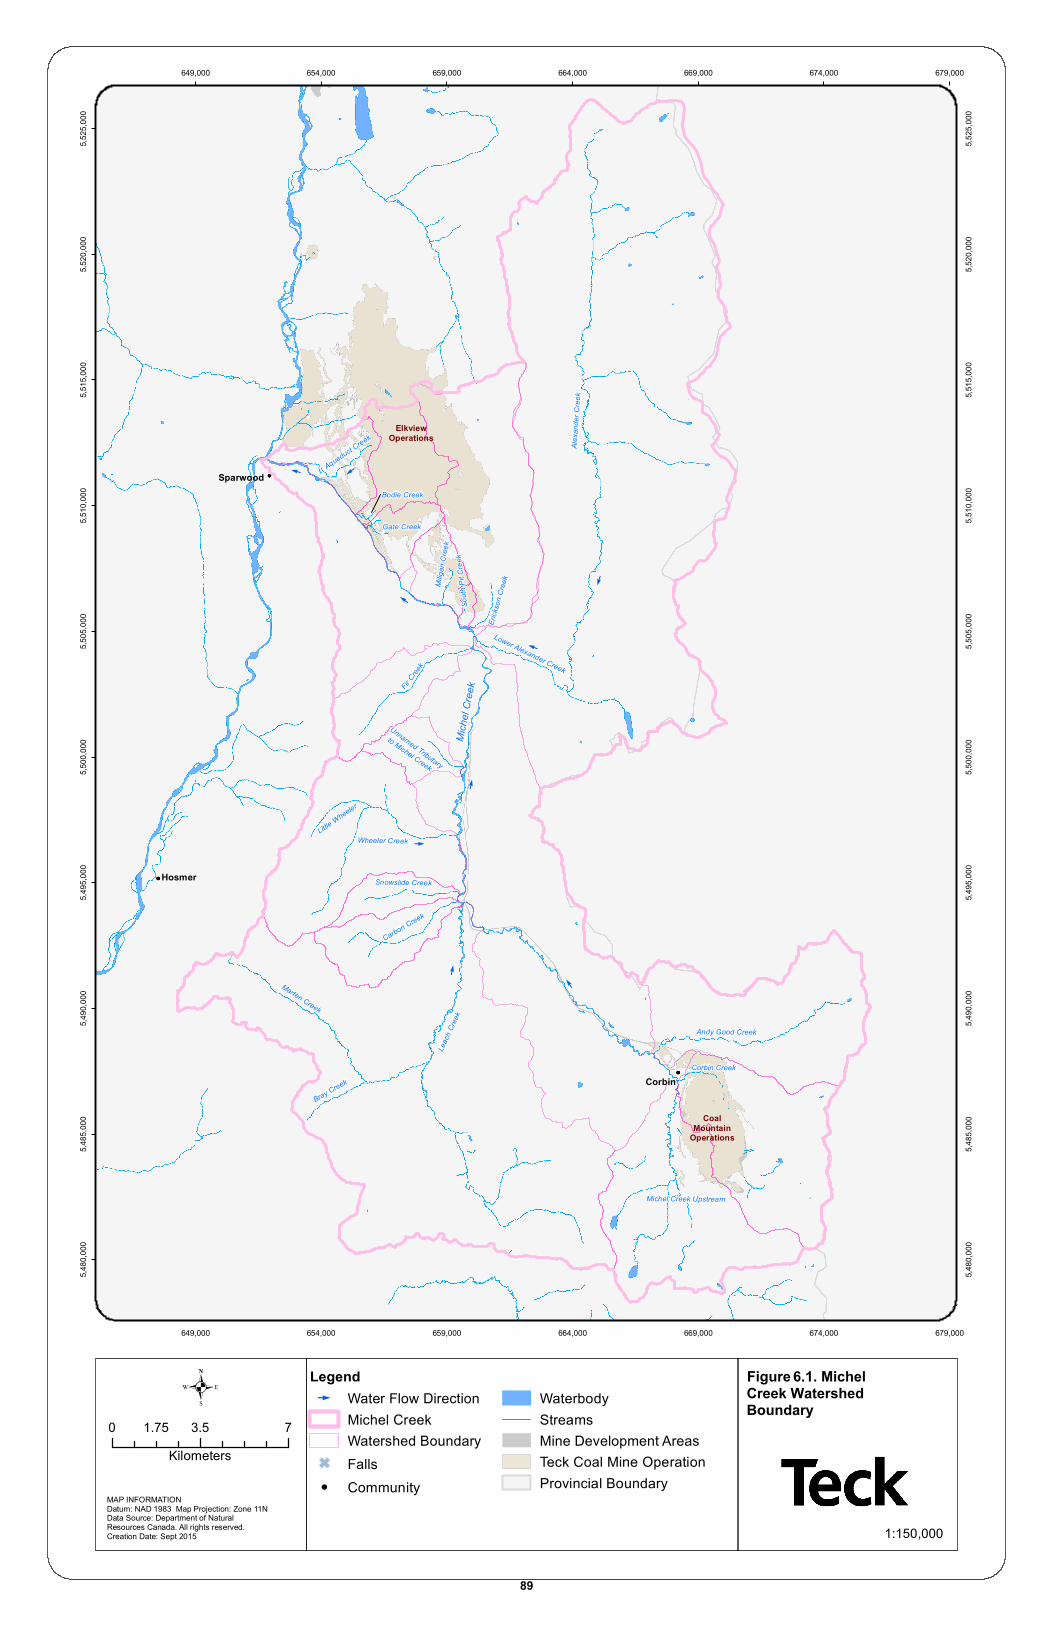
E
E
E
E
E
EE
E
E
Andy Good Creek
Marten Creek
Bray Creek
Erick
son C
reek
Alexa
nder
Cree
k
Aqueduct Creek
Lower Alexander Creek
Snowslide Creek
Carbon Creek
Leac
h Cree
kMi
chel
Cree
kBodie Creek
Gate Creek
Wheeler Creek
Corbin Creek
Milig
an C
reek
South
Pit C
reek
Fir Cree
k
Unnamed Tributary
Little Wheeler
to Michel Creek
Michel Creek Upstream
Sparwood
Hosmer
Corbin
CoalMountain
Operations
ElkviewOperations
649,000
649,000
654,000
654,000
659,000
659,000
664,000
664,000
669,000
669,000
674,000
674,000
679,000
679,000
5,480
,000
5,480
,000
5,485
,000
5,485
,000
5,490
,000
5,490
,000
5,495
,000
5,495
,000
5,500
,000
5,500
,000
5,505
,000
5,505
,000
5,510
,000
5,510
,000
5,515
,000
5,515
,000
5,520
,000
5,520
,000
5,525
,000
5,525
,000
.Legend
E Water Flow DirectionMichel CreekWatershed Boundary
G Falls! Community
WaterbodyStreamsMine Development Areas Teck Coal Mine OperationProvincial Boundary
MAP INFORMATIONDatum: NAD 1983 Map Projection: Zone 11NData Source: Department of Natural Resources Canada. All rights reserved.Creation Date: Sept 2015
0 3.5 71.75Kilometers
1:150,000
Figure 6 . 1. Michel Creek Watershed Boundary
89
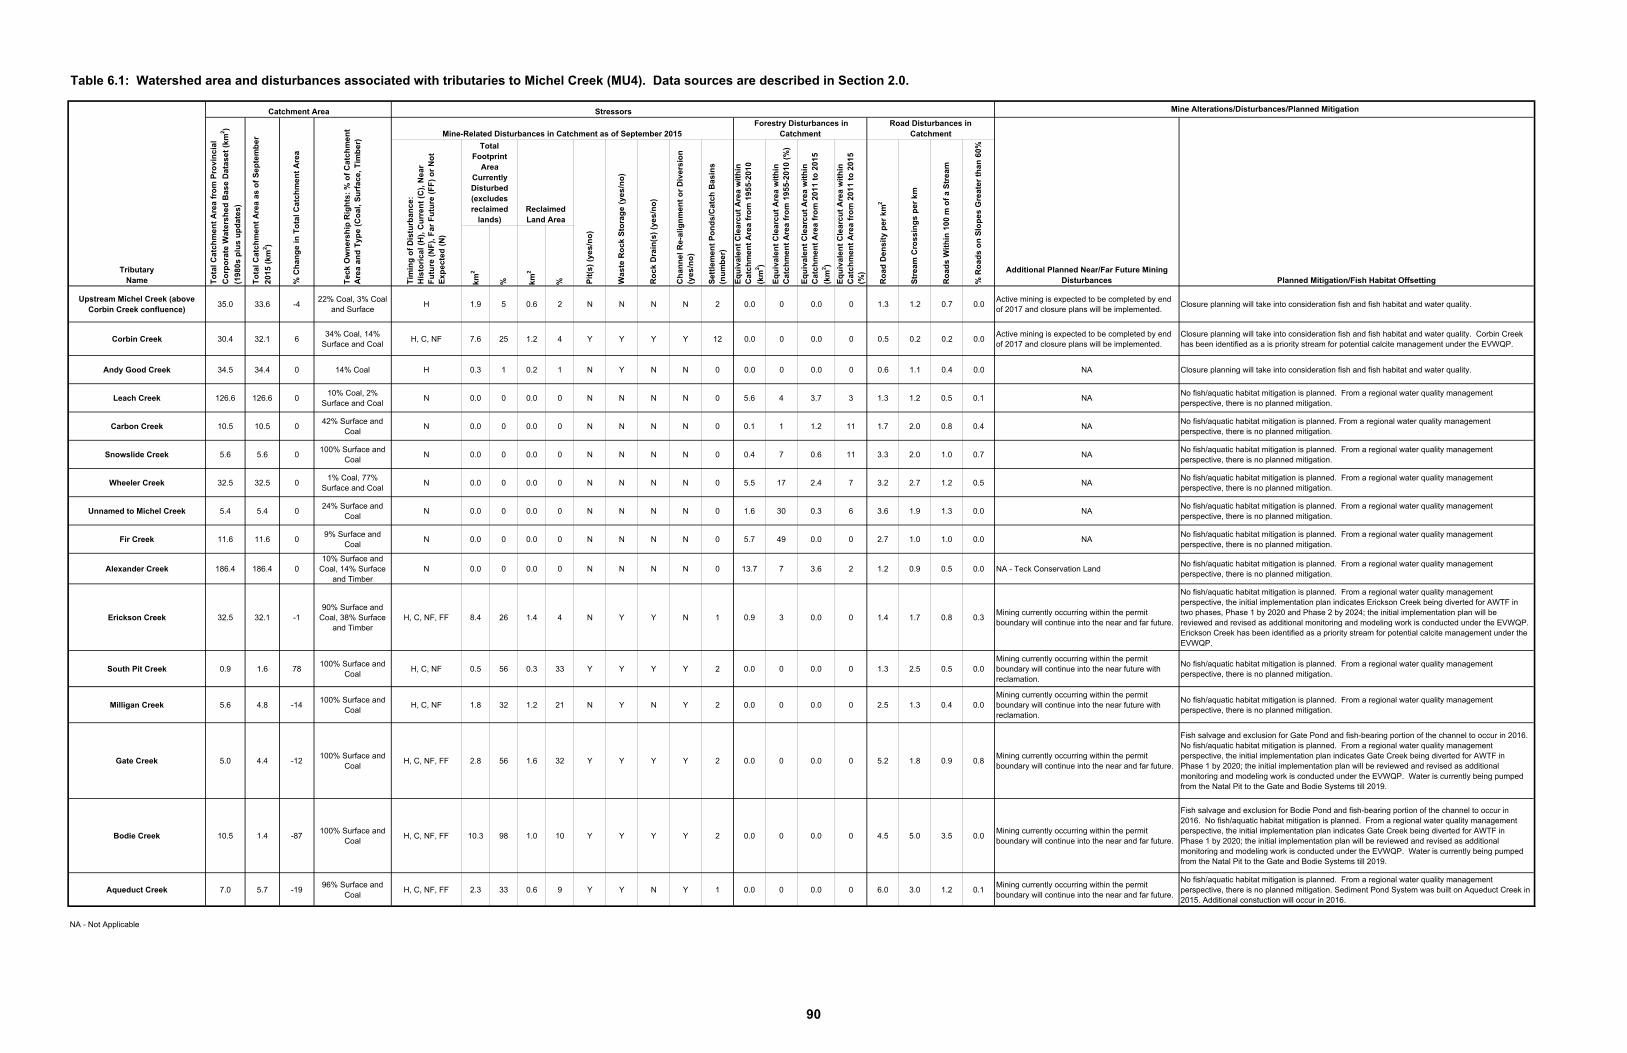
Table 6.1: Watershed area and disturbances associated with tributaries to Michel Creek (MU4). Data sources are described in Section 2.0.
km
2
% km
2
%
Upstream Michel Creek (above Corbin Creek confluence)
35.0 33.6 -422% Coal, 3% Coal
and Surface H 1.9 5 0.6 2 N N N N 2 0.0 0 0.0 0 1.3 1.2 0.7 0.0
Active mining is expected to be completed by end of 2017 and closure plans will be implemented.
Closure planning will take into consideration fish and fish habitat and water quality.
Corbin Creek 30.4 32.1 634% Coal, 14%
Surface and CoalH, C, NF 7.6 25 1.2 4 Y Y Y Y 12 0.0 0 0.0 0 0.5 0.2 0.2 0.0
Active mining is expected to be completed by end of 2017 and closure plans will be implemented.
Closure planning will take into consideration fish and fish habitat and water quality. Corbin Creek has been identified as a is priority stream for potential calcite management under the EVWQP.
Andy Good Creek 34.5 34.4 0 14% Coal H 0.3 1 0.2 1 N Y N N 0 0.0 0 0.0 0 0.6 1.1 0.4 0.0 NA Closure planning will take into consideration fish and fish habitat and water quality.
Leach Creek 126.6 126.6 010% Coal, 2%
Surface and CoalN 0.0 0 0.0 0 N N N N 0 5.6 4 3.7 3 1.3 1.2 0.5 0.1 NA
No fish/aquatic habitat mitigation is planned. From a regional water quality management perspective, there is no planned mitigation.
Carbon Creek 10.5 10.5 042% Surface and
CoalN 0.0 0 0.0 0 N N N N 0 0.1 1 1.2 11 1.7 2.0 0.8 0.4 NA
No fish/aquatic habitat mitigation is planned. From a regional water quality management perspective, there is no planned mitigation.
Snowslide Creek 5.6 5.6 0100% Surface and
CoalN 0.0 0 0.0 0 N N N N 0 0.4 7 0.6 11 3.3 2.0 1.0 0.7 NA
No fish/aquatic habitat mitigation is planned. From a regional water quality management perspective, there is no planned mitigation.
Wheeler Creek 32.5 32.5 01% Coal, 77%
Surface and CoalN 0.0 0 0.0 0 N N N N 0 5.5 17 2.4 7 3.2 2.7 1.2 0.5 NA
No fish/aquatic habitat mitigation is planned. From a regional water quality management perspective, there is no planned mitigation.
Unnamed to Michel Creek 5.4 5.4 024% Surface and
CoalN 0.0 0 0.0 0 N N N N 0 1.6 30 0.3 6 3.6 1.9 1.3 0.0 NA
No fish/aquatic habitat mitigation is planned. From a regional water quality management perspective, there is no planned mitigation.
Fir Creek 11.6 11.6 09% Surface and
CoalN 0.0 0 0.0 0 N N N N 0 5.7 49 0.0 0 2.7 1.0 1.0 0.0 NA
No fish/aquatic habitat mitigation is planned. From a regional water quality management perspective, there is no planned mitigation.
Alexander Creek 186.4 186.4 010% Surface and
Coal, 14% Surface and Timber
N 0.0 0 0.0 0 N N N N 0 13.7 7 3.6 2 1.2 0.9 0.5 0.0 NA - Teck Conservation LandNo fish/aquatic habitat mitigation is planned. From a regional water quality management perspective, there is no planned mitigation.
Erickson Creek 32.5 32.1 -190% Surface and
Coal, 38% Surface and Timber
H, C, NF, FF 8.4 26 1.4 4 N Y Y N 1 0.9 3 0.0 0 1.4 1.7 0.8 0.3Mining currently occurring within the permit boundary will continue into the near and far future.
No fish/aquatic habitat mitigation is planned. From a regional water quality management perspective, the initial implementation plan indicates Erickson Creek being diverted for AWTF in two phases, Phase 1 by 2020 and Phase 2 by 2024; the initial implementation plan will be reviewed and revised as additional monitoring and modeling work is conducted under the EVWQP. Erickson Creek has been identified as a priority stream for potential calcite management under the EVWQP.
South Pit Creek 0.9 1.6 78100% Surface and
CoalH, C, NF 0.5 56 0.3 33 Y Y Y Y 2 0.0 0 0.0 0 1.3 2.5 0.5 0.0
Mining currently occurring within the permit boundary will continue into the near future with reclamation.
No fish/aquatic habitat mitigation is planned. From a regional water quality management perspective, there is no planned mitigation.
Milligan Creek 5.6 4.8 -14100% Surface and
CoalH, C, NF 1.8 32 1.2 21 N Y N Y 2 0.0 0 0.0 0 2.5 1.3 0.4 0.0
Mining currently occurring within the permit boundary will continue into the near future with reclamation.
No fish/aquatic habitat mitigation is planned. From a regional water quality management perspective, there is no planned mitigation.
Gate Creek 5.0 4.4 -12100% Surface and
CoalH, C, NF, FF 2.8 56 1.6 32 Y Y Y Y 2 0.0 0 0.0 0 5.2 1.8 0.9 0.8
Mining currently occurring within the permit boundary will continue into the near and far future.
Fish salvage and exclusion for Gate Pond and fish-bearing portion of the channel to occur in 2016. No fish/aquatic habitat mitigation is planned. From a regional water quality management perspective, the initial implementation plan indicates Gate Creek being diverted for AWTF in Phase 1 by 2020; the initial implementation plan will be reviewed and revised as additional monitoring and modeling work is conducted under the EVWQP. Water is currently being pumped from the Natal Pit to the Gate and Bodie Systems till 2019.
Bodie Creek 10.5 1.4 -87100% Surface and
CoalH, C, NF, FF 10.3 98 1.0 10 Y Y Y Y 2 0.0 0 0.0 0 4.5 5.0 3.5 0.0
Mining currently occurring within the permit boundary will continue into the near and far future.
Fish salvage and exclusion for Bodie Pond and fish-bearing portion of the channel to occur in 2016. No fish/aquatic habitat mitigation is planned. From a regional water quality management perspective, the initial implementation plan indicates Gate Creek being diverted for AWTF in Phase 1 by 2020; the initial implementation plan will be reviewed and revised as additional monitoring and modeling work is conducted under the EVWQP. Water is currently being pumped from the Natal Pit to the Gate and Bodie Systems till 2019.
Aqueduct Creek 7.0 5.7 -1996% Surface and
CoalH, C, NF, FF 2.3 33 0.6 9 Y Y N Y 1 0.0 0 0.0 0 6.0 3.0 1.2 0.1
Mining currently occurring within the permit boundary will continue into the near and far future.
No fish/aquatic habitat mitigation is planned. From a regional water quality management perspective, there is no planned mitigation. Sediment Pond System was built on Aqueduct Creek in 2015. Additional constuction will occur in 2016.
NA - Not Applicable
TributaryName
Stressors Mine Alterations/Disturbances/Planned Mitigation
Mine-Related Disturbances in Catchment as of September 2015
Additional Planned Near/Far Future Mining Disturbances Planned Mitigation/Fish Habitat OffsettingT
imin
g o
f D
istu
rba
nc
e:
His
tori
ca
l (H
), C
urr
en
t (C
), N
ea
r F
utu
re (
NF
), F
ar
Fu
ture
(F
F)
or
No
t E
xp
ec
ted
(N
)
Catchment Area
To
tal
Ca
tch
me
nt
Are
a f
rom
Pro
vin
cia
l
Co
rpo
rate
Wa
ters
he
d B
as
e D
ata
se
t (k
m2 )
(19
80
s p
lus
up
da
tes
)
To
tal
Ca
tch
me
nt
Are
a a
s o
f S
ep
tem
be
r
20
15
(k
m2 )
% C
han
ge
in
To
tal
Cat
chm
en
t A
rea
Te
ck
Ow
ne
rsh
ip R
igh
ts:
% o
f C
atc
hm
en
t A
rea
an
d T
yp
e (
Co
al,
Su
rfa
ce
, T
imb
er)
Road Disturbances in Catchment
Se
ttle
me
nt
Po
nd
s/C
atc
h B
as
ins
(n
um
be
r)
Eq
uiv
ale
nt
Cle
arc
ut
Are
a w
ith
in
Ca
tch
me
nt
Are
a f
rom
19
55
-20
10
(km
2 )
Total Footprint
Area Currently Disturbed(excludes reclaimed
lands)
Eq
uiv
ale
nt
Cle
arc
ut
Are
a w
ith
in
Ca
tch
me
nt
Are
a f
rom
20
11
to
20
15
(km
2 )
Pit
(s)
(ye
s/n
o)
Wa
ste
Ro
ck
Sto
rag
e (
ye
s/n
o)
Eq
uiv
ale
nt
Cle
arc
ut
Are
a w
ith
in
Ca
tch
me
nt
Are
a f
rom
19
55
-20
10
(%
)
Ro
ck
Dra
in(s
) (y
es
/no
)
Ch
an
ne
l R
e-a
lig
nm
en
t o
r D
ive
rsio
n
(ye
s/n
o)
Reclaimed Land Area
Forestry Disturbances in Catchment
Ro
ad
De
ns
ity
pe
r k
m2
Str
ea
m C
ros
sin
gs
pe
r k
m
Ro
ad
s W
ith
in 1
00
m o
f a
Str
ea
m
% R
oa
ds
on
Slo
pe
s G
rea
ter
tha
n 6
0%
Eq
uiv
ale
nt
Cle
arc
ut
Are
a w
ith
in
Ca
tch
me
nt
Are
a f
rom
20
11
to
20
15
(%
)
90
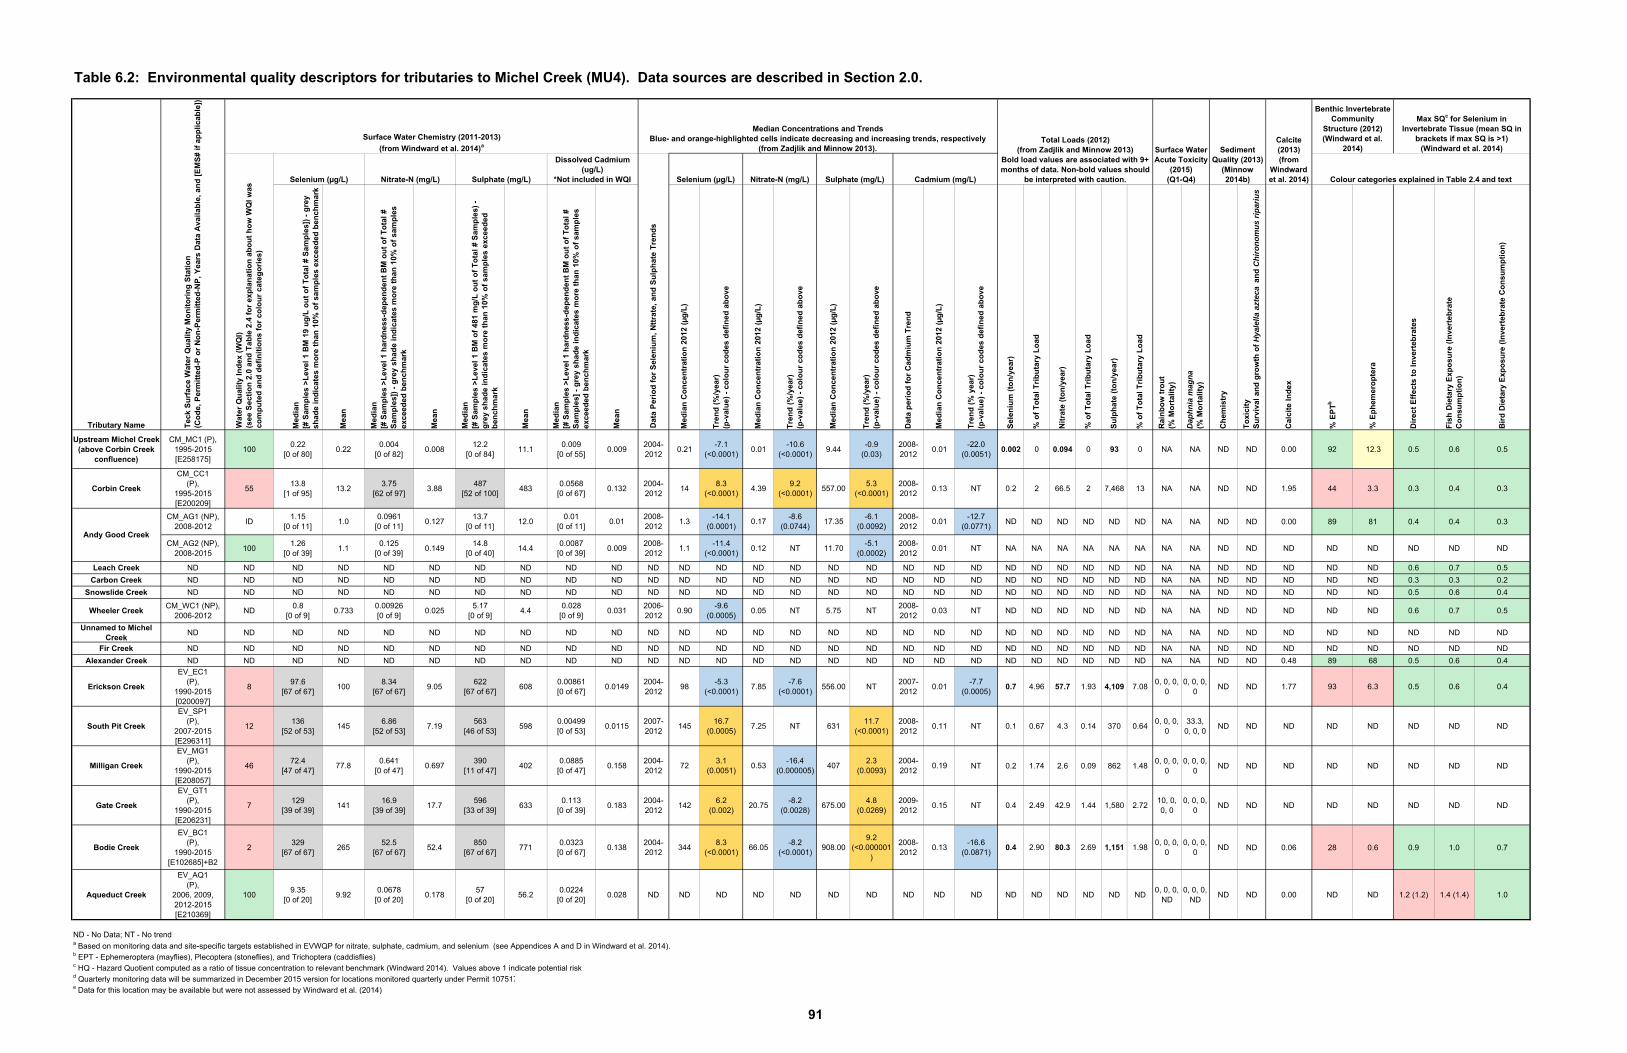
Table 6.2: Environmental quality descriptors for tributaries to Michel Creek (MU4). Data sources are described in Section 2.0.
Med
ian
[#
Sam
ple
s >
Lev
el 1
BM
19
ug
/L o
ut
of
To
tal
# S
amp
les]
) -
gre
y sh
ade
ind
icat
es m
ore
th
an 1
0% o
f sa
mp
les
exce
eded
ben
chm
ark
Mea
n
Med
ian
[# S
amp
les
>L
evel
1 h
ard
nes
s-d
epen
den
t B
M o
ut
of
To
tal
# S
amp
les]
) -
gre
y sh
ade
ind
icat
es m
ore
th
an 1
0% o
f sa
mp
les
exce
eded
ben
chm
ark
Mea
n
Med
ian
[# S
amp
les
>L
evel
1 B
M o
f 48
1 m
g/L
ou
t o
f T
ota
l #
Sam
ple
s) -
g
rey
shad
e in
dic
ates
mo
re t
han
10%
of
sam
ple
s ex
ceed
ed
ben
chm
ark
Mea
n
Med
ian
[#
Sam
ple
s >
Lev
el 1
har
dn
ess-
dep
end
ent
BM
ou
t o
f T
ota
l #
Sam
ple
s] -
gre
y sh
ade
ind
icat
es m
ore
th
an 1
0% o
f sa
mp
les
exce
eded
ben
chm
ark
Mea
n
Med
ian
Co
nce
ntr
atio
n 2
012
(µg
/L)
Tre
nd
(%
/yea
r)(p
-val
ue)
- c
olo
ur
cod
es d
efin
ed a
bo
ve
Med
ian
Co
nce
ntr
atio
n 2
012
(µg
/L)
Tre
nd
(%
/yea
r)(p
-val
ue)
- c
olo
ur
cod
es d
efin
ed a
bo
ve
Med
ian
Co
nce
ntr
atio
n 2
012
(µg
/L)
Tre
nd
(%
/yea
r)(p
-val
ue)
- c
olo
ur
cod
es d
efin
ed a
bo
ve
Dat
a p
erio
d f
or
Cad
miu
m T
ren
d
Med
ian
Co
nce
ntr
atio
n 2
012
(µg
/L)
Tre
nd
(%
yea
r)(p
-val
ue)
- c
olo
ur
cod
es d
efin
ed a
bo
ve
Sel
eniu
m (
ton
/yea
r)
% o
f T
ota
l T
rib
uta
ry L
oad
Nit
rate
(to
n/y
ear)
% o
f T
ota
l T
rib
uta
ry L
oad
Su
lph
ate
(to
n/y
ear)
% o
f T
ota
l T
rib
uta
ry L
oad
Rai
nb
ow
tro
ut
(% M
ort
alit
y)
Dap
hnia
mag
na(%
Mo
rtal
ity)
Ch
emis
try
To
xici
tyS
urv
ival
an
d g
row
th o
f H
yale
lla a
ztec
a a
nd
Chi
rono
mus
ripa
rius
Cal
cite
In
dex
% E
PT
b
% E
ph
emer
op
tera
Dir
ect
Eff
ects
to
In
vert
ebra
tes
Fis
h D
ieta
ry E
xpo
sure
(In
vert
ebra
teC
on
sum
pti
on
)
Bir
d D
ieta
ry E
xpo
sure
(In
vert
ebra
te C
on
sum
pti
on
)
Upstream Michel Creek (above Corbin Creek
confluence)
CM_MC1 (P), 1995-2015 [E258175]
1000.22
[0 of 80]0.22
0.004[0 of 82]
0.00812.2
[0 of 84]11.1
0.009[0 of 55]
0.0092004-2012
0.21-7.1
(<0.0001)0.01
-10.6(<0.0001)
9.44-0.9
(0.03)2008-2012
0.01-22.0
(0.0051)0.002 0 0.094 0 93 0 NA NA ND ND 0.00 92 12.3 0.5 0.6 0.5
Corbin Creek
CM_CC1(P),
1995-2015[E200209]
5513.8
[1 of 95]13.2
3.75[62 of 97]
3.88487
[52 of 100]483
0.0568[0 of 67]
0.1322004-2012
148.3
(<0.0001)4.39
9.2(<0.0001)
557.005.3
(<0.0001)2008-2012
0.13 NT 0.2 2 66.5 2 7,468 13 NA NA ND ND 1.95 44 3.3 0.3 0.4 0.3
CM_AG1 (NP),2008-2012
ID1.15
[0 of 11]1.0
0.0961[0 of 11]
0.12713.7
[0 of 11]12.0
0.01[0 of 11]
0.012008-2012
1.3-14.1
(0.0001)0.17
-8.6(0.0744)
17.35-6.1
(0.0092)2008-2012
0.01-12.7
(0.0771)ND ND ND ND ND ND NA NA ND ND 0.00 89 81 0.4 0.4 0.3
CM_AG2 (NP),2008-2015
1001.26
[0 of 39]1.1
0.125[0 of 39]
0.14914.8
[0 of 40]14.4
0.0087[0 of 39]
0.0092008-2012
1.1-11.4
(<0.0001)0.12 NT 11.70
-5.1(0.0002)
2008-2012
0.01 NT NA NA NA NA NA NA NA NA ND ND ND ND ND ND ND ND
Leach Creek ND ND ND ND ND ND ND ND ND ND ND ND ND ND ND ND ND ND ND ND ND ND ND ND ND ND NA NA ND ND ND ND ND 0.6 0.7 0.5
Carbon Creek ND ND ND ND ND ND ND ND ND ND ND ND ND ND ND ND ND ND ND ND ND ND ND ND ND ND NA NA ND ND ND ND ND 0.3 0.3 0.2
Snowslide Creek ND ND ND ND ND ND ND ND ND ND ND ND ND ND ND ND ND ND ND ND ND ND ND ND ND ND NA NA ND ND ND ND ND 0.5 0.6 0.4
Wheeler CreekCM_WC1 (NP),
2006-2012ND
0.8[0 of 9]
0.7330.00926[0 of 9]
0.0255.17
[0 of 9]4.4
0.028[0 of 9]
0.0312006-2012
0.90-9.6
(0.0005)0.05 NT 5.75 NT
2008-2012
0.03 NT ND ND ND ND ND ND NA NA ND ND ND ND ND 0.6 0.7 0.5
Unnamed to Michel Creek
ND ND ND ND ND ND ND ND ND ND ND ND ND ND ND ND ND ND ND ND ND ND ND ND ND ND NA NA ND ND ND ND ND ND ND ND
Fir Creek ND ND ND ND ND ND ND ND ND ND ND ND ND ND ND ND ND ND ND ND ND ND ND ND ND ND NA NA ND ND ND ND ND ND ND ND
Alexander Creek ND ND ND ND ND ND ND ND ND ND ND ND ND ND ND ND ND ND ND ND ND ND ND ND ND ND NA NA ND ND 0.48 89 68 0.5 0.6 0.4
Erickson Creek
EV_EC1(P),
1990-2015[0200097]
897.6
[67 of 67]100
8.34[67 of 67]
9.05622
[67 of 67]608
0.00861[0 of 67]
0.01492004-2012
98-5.3
(<0.0001)7.85
-7.6(<0.0001)
556.00 NT2007-2012
0.01-7.7
(0.0005)0.7 4.96 57.7 1.93 4,109 7.08
0, 0, 0, 0
0, 0, 0, 0
ND ND 1.77 93 6.3 0.5 0.6 0.4
South Pit Creek
EV_SP1(P),
2007-2015[E296311]
12136
[52 of 53]145
6.86[52 of 53]
7.19563
[46 of 53]598
0.00499[0 of 53]
0.01152007-2012
14516.7
(0.0005)7.25 NT 631
11.7(<0.0001)
2008-2012
0.11 NT 0.1 0.67 4.3 0.14 370 0.640, 0, 0,
033.3,
0, 0, 0ND ND ND ND ND ND ND ND
Milligan Creek
EV_MG1(P),
1990-2015[E208057]
4672.4
[47 of 47]77.8
0.641[0 of 47]
0.697390
[11 of 47]402
0.0885[0 of 47]
0.1582004-2012
723.1
(0.0051)0.53
-16.4(0.000005)
4072.3
(0.0093)2004-2012
0.19 NT 0.2 1.74 2.6 0.09 862 1.480, 0, 0,
00, 0, 0,
0ND ND ND ND ND ND ND ND
Gate Creek
EV_GT1(P),
1990-2015[E206231]
7129
[39 of 39]141
16.9[39 of 39]
17.7596
[33 of 39]633
0.113[0 of 39]
0.1832004-2012
1426.2
(0.002)20.75
-8.2(0.0028)
675.004.8
(0.0269)2009-2012
0.15 NT 0.4 2.49 42.9 1.44 1,580 2.7210, 0, 0, 0
0, 0, 0, 0
ND ND ND ND ND ND ND ND
Bodie Creek
EV_BC1(P),
1990-2015[E102685]+B2
2329
[67 of 67]265
52.5[67 of 67]
52.4850
[67 of 67]771
0.0323[0 of 67]
0.1382004-2012
3448.3
(<0.0001)66.05
-8.2(<0.0001)
908.009.2
(<0.000001)
2008-2012
0.13-16.6
(0.0871)0.4 2.90 80.3 2.69 1,151 1.98
0, 0, 0, 0
0, 0, 0, 0
ND ND 0.06 28 0.6 0.9 1.0 0.7
Aqueduct Creek
EV_AQ1(P),
2006, 2009,2012-2015[E210369]
1009.35
[0 of 20]9.92
0.0678[0 of 20]
0.17857
[0 of 20]56.2
0.0224[0 of 20]
0.028 ND ND ND ND ND ND ND ND ND ND ND ND ND ND ND ND0, 0, 0,
ND0, 0, 0,
NDND ND 0.00 ND ND 1.2 (1.2) 1.4 (1.4) 1.0
ND - No Data; NT - No trenda Based on monitoring data and site-specific targets established in EVWQP for nitrate, sulphate, cadmium, and selenium (see Appendices A and D in Windward et al. 2014). b EPT - Ephemeroptera (mayflies), Plecoptera (stoneflies), and Trichoptera (caddisflies)c HQ - Hazard Quotient computed as a ratio of tissue concentration to relevant benchmark (Windward 2014). Values above 1 indicate potential riskd Quarterly monitoring data will be summarized in December 2015 version for locations monitored quarterly under Permit 107517e Data for this location may be available but were not assessed by Windward et al. (2014).
Dissolved Cadmium (ug/L)
*Not included in WQI
Dat
a P
erio
d f
or
Sel
eniu
m,
Ntt
rate
, an
d S
ulp
hat
e T
ren
ds
Tributary Name Tec
k S
urf
ace
Wat
er Q
ual
ity
Mo
nit
ori
ng
Sta
tio
n(C
od
e, P
erm
itte
d-P
or
No
n-P
erm
itte
d-N
P,
Yea
rs D
ata
Ava
ilab
le,
and
[E
MS
# if
ap
pli
cab
le])
Surface Water Chemistry (2011-2013)
(from Windward et al. 2014)a
Median Concentrations and TrendsBlue- and orange-highlighted cells indicate decreasing and increasing trends, respectively
(from Zadjlik and Minnow 2013).
Colour categories explained in Table 2.4 and text
Andy Good Creek
Sediment Quality (2013)
(Minnow 2014b)
Calcite(2013)(from
Windward et al. 2014)
Benthic InvertebrateCommunity
Structure (2012)(Windward et al.
2014)
Max SQc for Selenium in Invertebrate Tissue (mean SQ in
brackets if max SQ is >1)(Windward et al. 2014)
Wat
er Q
ual
ity
Ind
ex (
WQ
I)(s
ee S
ecti
on
2.0
an
d T
able
2.4
fo
r ex
pla
nat
ion
ab
ou
t h
ow
WQ
I w
as
com
pu
ted
an
d d
efin
itio
ns
for
colo
ur
cate
go
ries
)
Selenium (µg/L) Nitrate-N (mg/L) Sulphate (mg/L)
Total Loads (2012)(from Zadjlik and Minnow 2013)
Bold load values are associated with 9+ months of data. Non-bold values should
be interpreted with caution.
Surface Water Acute Toxicity
(2015)(Q1-Q4)Selenium (µg/L) Nitrate-N (mg/L) Sulphate (mg/L) Cadmium (mg/L)
91
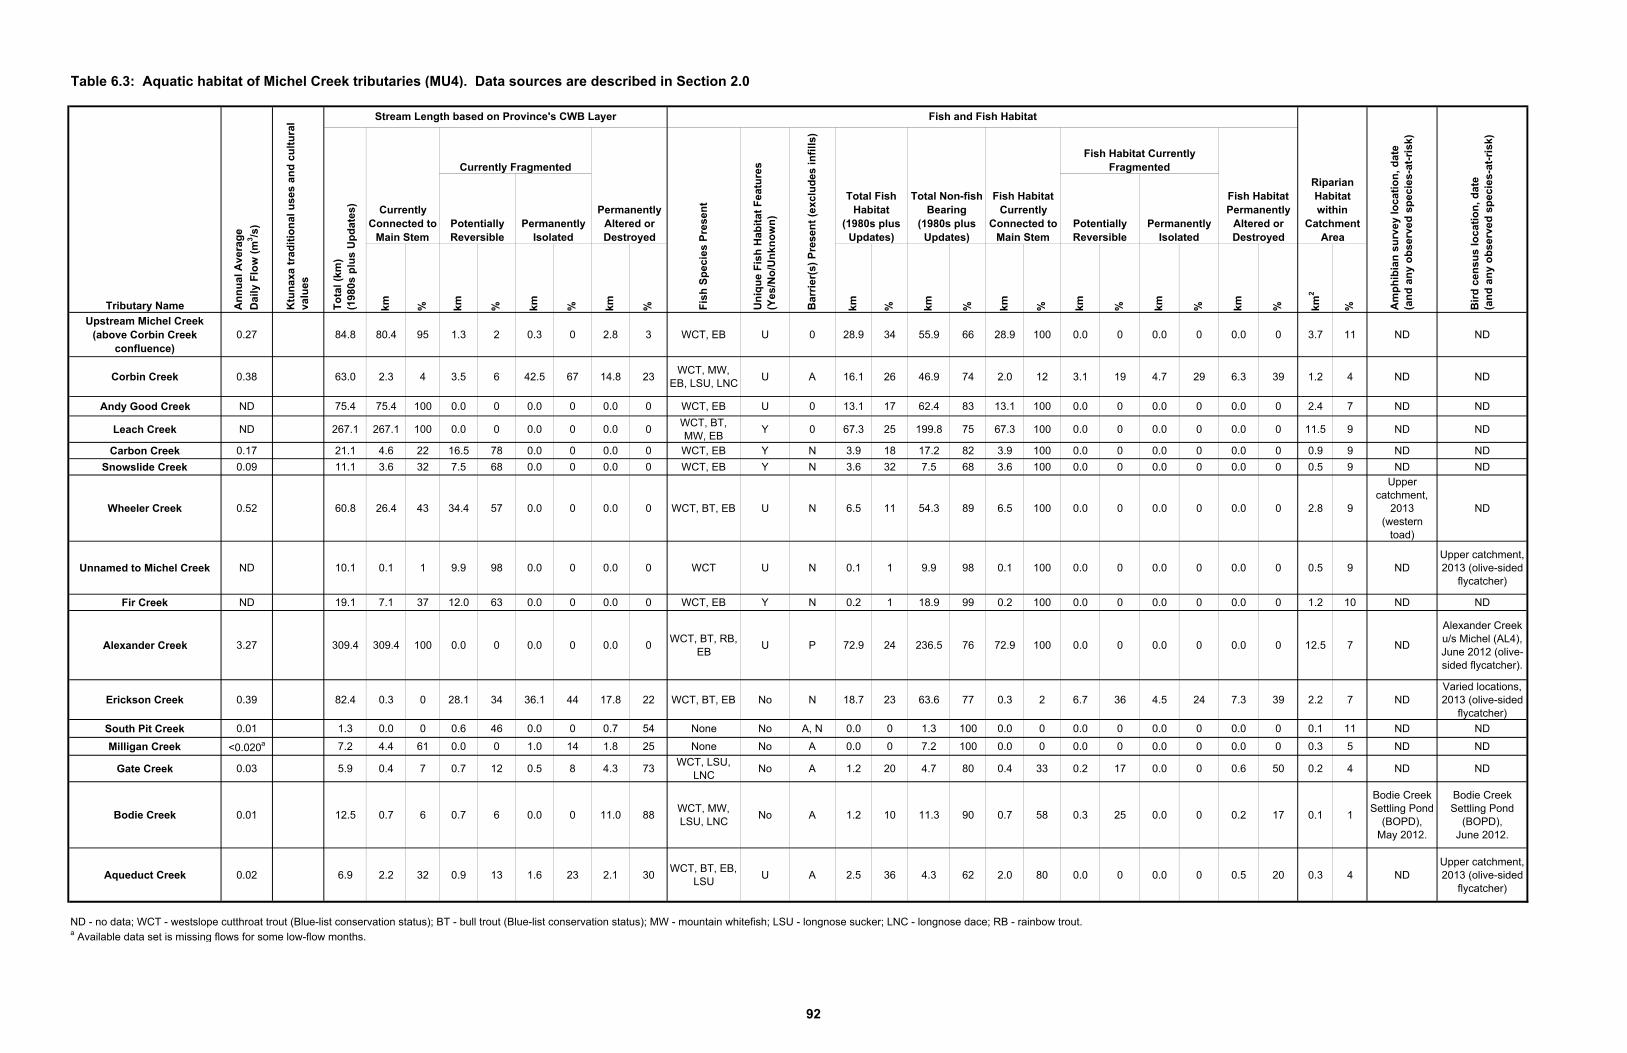
Table 6.3: Aquatic habitat of Michel Creek tributaries (MU4). Data sources are described in Section 2.0
km % km % km
% km % km % km % km % km % km % km % km2
%
Upstream Michel Creek (above Corbin Creek
confluence)0.27 84.8 80.4 95 1.3 2 0.3 0 2.8 3 WCT, EB U 0 28.9 34 55.9 66 28.9 100 0.0 0 0.0 0 0.0 0 3.7 11 ND ND
Corbin Creek 0.38 63.0 2.3 4 3.5 6 42.5 67 14.8 23WCT, MW,
EB, LSU, LNC U A 16.1 26 46.9 74 2.0 12 3.1 19 4.7 29 6.3 39 1.2 4 ND ND
Andy Good Creek ND 75.4 75.4 100 0.0 0 0.0 0 0.0 0 WCT, EB U 0 13.1 17 62.4 83 13.1 100 0.0 0 0.0 0 0.0 0 2.4 7 ND ND
Leach Creek ND 267.1 267.1 100 0.0 0 0.0 0 0.0 0WCT, BT, MW, EB
Y 0 67.3 25 199.8 75 67.3 100 0.0 0 0.0 0 0.0 0 11.5 9 ND ND
Carbon Creek 0.17 21.1 4.6 22 16.5 78 0.0 0 0.0 0 WCT, EB Y N 3.9 18 17.2 82 3.9 100 0.0 0 0.0 0 0.0 0 0.9 9 ND ND
Snowslide Creek 0.09 11.1 3.6 32 7.5 68 0.0 0 0.0 0 WCT, EB Y N 3.6 32 7.5 68 3.6 100 0.0 0 0.0 0 0.0 0 0.5 9 ND ND
Wheeler Creek 0.52 60.8 26.4 43 34.4 57 0.0 0 0.0 0 WCT, BT, EB U N 6.5 11 54.3 89 6.5 100 0.0 0 0.0 0 0.0 0 2.8 9
Upper catchment,
2013 (western
toad)
ND
Unnamed to Michel Creek ND 10.1 0.1 1 9.9 98 0.0 0 0.0 0 WCT U N 0.1 1 9.9 98 0.1 100 0.0 0 0.0 0 0.0 0 0.5 9 NDUpper catchment, 2013 (olive-sided
flycatcher)
Fir Creek ND 19.1 7.1 37 12.0 63 0.0 0 0.0 0 WCT, EB Y N 0.2 1 18.9 99 0.2 100 0.0 0 0.0 0 0.0 0 1.2 10 ND ND
Alexander Creek 3.27 309.4 309.4 100 0.0 0 0.0 0 0.0 0WCT, BT, RB,
EBU P 72.9 24 236.5 76 72.9 100 0.0 0 0.0 0 0.0 0 12.5 7 ND
Alexander Creek u/s Michel (AL4), June 2012 (olive-sided flycatcher).
Erickson Creek 0.39 82.4 0.3 0 28.1 34 36.1 44 17.8 22 WCT, BT, EB No N 18.7 23 63.6 77 0.3 2 6.7 36 4.5 24 7.3 39 2.2 7 NDVaried locations, 2013 (olive-sided
flycatcher)
South Pit Creek 0.01 1.3 0.0 0 0.6 46 0.0 0 0.7 54 None No A, N 0.0 0 1.3 100 0.0 0 0.0 0 0.0 0 0.0 0 0.1 11 ND ND
Milligan Creek <0.020a 7.2 4.4 61 0.0 0 1.0 14 1.8 25 None No A 0.0 0 7.2 100 0.0 0 0.0 0 0.0 0 0.0 0 0.3 5 ND ND
Gate Creek 0.03 5.9 0.4 7 0.7 12 0.5 8 4.3 73WCT, LSU,
LNCNo A 1.2 20 4.7 80 0.4 33 0.2 17 0.0 0 0.6 50 0.2 4 ND ND
Bodie Creek 0.01 12.5 0.7 6 0.7 6 0.0 0 11.0 88WCT, MW, LSU, LNC
No A 1.2 10 11.3 90 0.7 58 0.3 25 0.0 0 0.2 17 0.1 1
Bodie Creek Settling Pond
(BOPD),May 2012.
Bodie Creek Settling Pond
(BOPD),June 2012.
Aqueduct Creek 0.02 6.9 2.2 32 0.9 13 1.6 23 2.1 30WCT, BT, EB,
LSUU A 2.5 36 4.3 62 2.0 80 0.0 0 0.0 0 0.5 20 0.3 4 ND
Upper catchment, 2013 (olive-sided
flycatcher)
ND - no data; WCT - westslope cutthroat trout (Blue-list conservation status); BT - bull trout (Blue-list conservation status); MW - mountain whitefish; LSU - longnose sucker; LNC - longnose dace; RB - rainbow trout.a Available data set is missing flows for some low-flow months.
Fish Habitat Currently
Connected to Main Stem
Fish Habitat Currently Fragmented
Fish Habitat Permanently
Altered or Destroyed
Fis
h S
pec
ies
Pre
sen
t
Un
iqu
e F
ish
Hab
itat
Fea
ture
s (Y
es/N
o/U
nkn
ow
n)
Bar
rier
(s)
Pre
sen
t (e
xclu
des
in
fill
s)
Total Fish Habitat
(1980s plus Updates)
Total Non-fish Bearing
(1980s plus Updates)
Am
ph
ibia
n s
urv
ey l
oca
tio
n,
dat
e (a
nd
an
y o
bse
rved
sp
ecie
s-at
-ris
k)
Bir
d c
ensu
s lo
cati
on
, d
ate
(an
d a
ny
ob
serv
ed s
pec
ies-
at-r
isk)
Potentially Reversible
Permanently Isolated
Tributary Name An
nu
al A
vera
ge
Dai
ly F
low
(m
3 /s)
Ktu
nax
a tr
adit
ion
al u
ses
and
cu
ltu
ral
valu
es
Stream Length based on Province's CWB Layer
Potentially Reversible
Permanently Isolated
Fish and Fish Habitat
Riparian Habitat within
Catchment Area
To
tal
(km
)(1
980s
plu
s U
pd
ates
)
Currently Connected to
Main Stem
Currently Fragmented
Permanently Altered or Destroyed
92
Teck Tributary Evaluation Program Data Report
Minnow Environmental Inc. 93 June 2016 Project 2563
6.1 Upstream Michel Creek
A small amount (5%) of the total catchment area of Michel Creek upstream from Corbin
Creek has been disturbed by mining activities (Table 6.1). Active mining is expected to be
completed by 2017 (Table 6.1). Of the total stream length of 84.8 km, 95% is connected
to the main stem whereas the remainder is fragmented or has been lost (Table 6.3). The
catchment has also been disturbed by forestry activities and roads (Table 6.1).
Based on samples collected upstream from CMO influence, water quality and tissue
selenium concentrations were characterized as “good” (Windward et al. 2014; Table 6.2).
The benthic invertebrate community was categorized as “fair” based on relatively low
percentage of Ephemeroptera compared to other reference areas in the region
(Table 6.2). No calcite was observed.
A reach surveyed for fish and fish habitat upstream from CMO influence in 2007-2008 had
an average channel width from 5.1 m to 10.4 m and wetted width from 2.4 m to 5.9 m
(NorthSouth Consultants Inc. 2007, 2008). Gradient within the reach surveyed ranged
from 1% to 3%. A survey of a representative 10-m reach in 2012 noted bankfull width of
6 m, gradient of 3%, habitat of riffle (75%) and glide (25%), with dominant substrate of
cobble (Minnow 2014). Riparian vegetation consisted of coniferous trees, ferns and
grasses, and shrubs (Minnow 2014). Fish sampling in September 2007 and June and
August in 2008 captured westslope cutthroat trout and eastern brook trout (NorthSouth
Consultants Inc. 2007, 2008).
6.2 Corbin Creek
About 25% of the total catchment area of Corbin Creek has been disturbed by mining
activities but active mining is expected to be completed by 2017 (Table 6.1). Of the total
stream length of 63 km, 4% is connected to the main stem whereas the remainder is
fragmented or has been lost (Table 6.3). The catchment has also been disturbed by
forestry activities and roads (Table 6.1).
Water quality was categorized as “poor” (Windward et al., 2014) and increasing trends in
selenium, nitrate, and sulphate concentrations were reported (Zadjlick and Minnow 2013;
Table 6.2; Figure 6.2). High levels of calcite have been observed (calcite index: 1.95),
and the benthic invertebrate community was characterized as “poor”. Tissue selenium
concentrations were characterized as “good” (Windward et al. 2014).
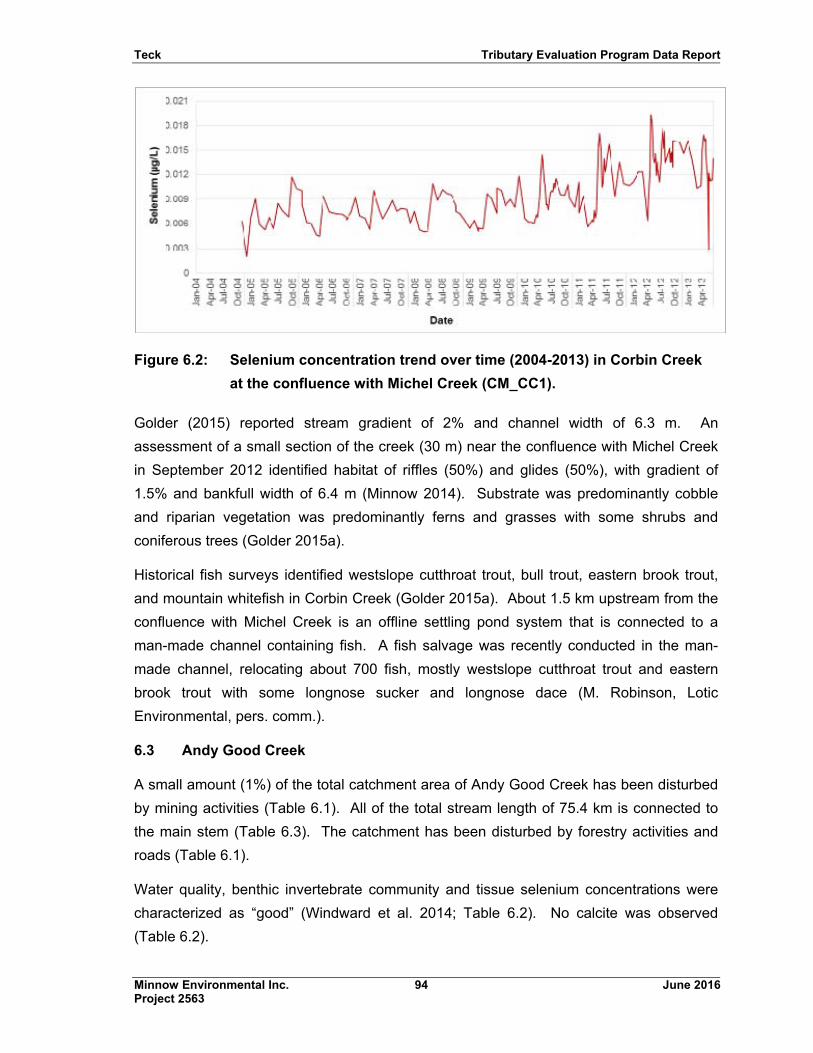
Teck Tributary Evaluation Program Data Report
Minnow Environmental Inc. 94 June 2016 Project 2563
Figure 6.2: Selenium concentration trend over time (2004-2013) in Corbin Creek
at the confluence with Michel Creek (CM_CC1).
Golder (2015) reported stream gradient of 2% and channel width of 6.3 m. An
assessment of a small section of the creek (30 m) near the confluence with Michel Creek
in September 2012 identified habitat of riffles (50%) and glides (50%), with gradient of
1.5% and bankfull width of 6.4 m (Minnow 2014). Substrate was predominantly cobble
and riparian vegetation was predominantly ferns and grasses with some shrubs and
coniferous trees (Golder 2015a).
Historical fish surveys identified westslope cutthroat trout, bull trout, eastern brook trout,
and mountain whitefish in Corbin Creek (Golder 2015a). About 1.5 km upstream from the
confluence with Michel Creek is an offline settling pond system that is connected to a
man-made channel containing fish. A fish salvage was recently conducted in the man-
made channel, relocating about 700 fish, mostly westslope cutthroat trout and eastern
brook trout with some longnose sucker and longnose dace (M. Robinson, Lotic
Environmental, pers. comm.).
6.3 Andy Good Creek
A small amount (1%) of the total catchment area of Andy Good Creek has been disturbed
by mining activities (Table 6.1). All of the total stream length of 75.4 km is connected to
the main stem (Table 6.3). The catchment has been disturbed by forestry activities and
roads (Table 6.1).
Water quality, benthic invertebrate community and tissue selenium concentrations were
characterized as “good” (Windward et al. 2014; Table 6.2). No calcite was observed
(Table 6.2).
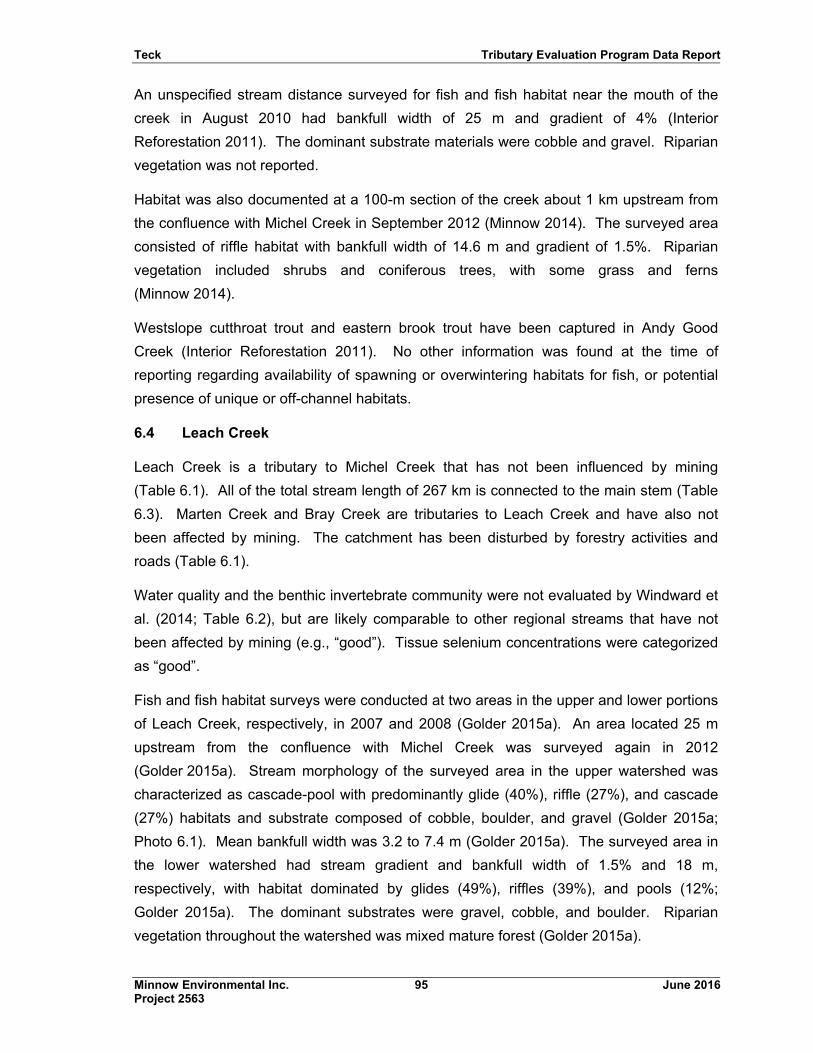
Teck Tributary Evaluation Program Data Report
Minnow Environmental Inc. 95 June 2016 Project 2563
An unspecified stream distance surveyed for fish and fish habitat near the mouth of the
creek in August 2010 had bankfull width of 25 m and gradient of 4% (Interior
Reforestation 2011). The dominant substrate materials were cobble and gravel. Riparian
vegetation was not reported.
Habitat was also documented at a 100-m section of the creek about 1 km upstream from
the confluence with Michel Creek in September 2012 (Minnow 2014). The surveyed area
consisted of riffle habitat with bankfull width of 14.6 m and gradient of 1.5%. Riparian
vegetation included shrubs and coniferous trees, with some grass and ferns
(Minnow 2014).
Westslope cutthroat trout and eastern brook trout have been captured in Andy Good
Creek (Interior Reforestation 2011). No other information was found at the time of
reporting regarding availability of spawning or overwintering habitats for fish, or potential
presence of unique or off-channel habitats.
6.4 Leach Creek
Leach Creek is a tributary to Michel Creek that has not been influenced by mining
(Table 6.1). All of the total stream length of 267 km is connected to the main stem (Table
6.3). Marten Creek and Bray Creek are tributaries to Leach Creek and have also not
been affected by mining. The catchment has been disturbed by forestry activities and
roads (Table 6.1).
Water quality and the benthic invertebrate community were not evaluated by Windward et
al. (2014; Table 6.2), but are likely comparable to other regional streams that have not
been affected by mining (e.g., “good”). Tissue selenium concentrations were categorized
as “good”.
Fish and fish habitat surveys were conducted at two areas in the upper and lower portions
of Leach Creek, respectively, in 2007 and 2008 (Golder 2015a). An area located 25 m
upstream from the confluence with Michel Creek was surveyed again in 2012
(Golder 2015a). Stream morphology of the surveyed area in the upper watershed was
characterized as cascade-pool with predominantly glide (40%), riffle (27%), and cascade
(27%) habitats and substrate composed of cobble, boulder, and gravel (Golder 2015a;
Photo 6.1). Mean bankfull width was 3.2 to 7.4 m (Golder 2015a). The surveyed area in
the lower watershed had stream gradient and bankfull width of 1.5% and 18 m,
respectively, with habitat dominated by glides (49%), riffles (39%), and pools (12%;
Golder 2015a). The dominant substrates were gravel, cobble, and boulder. Riparian
vegetation throughout the watershed was mixed mature forest (Golder 2015a).
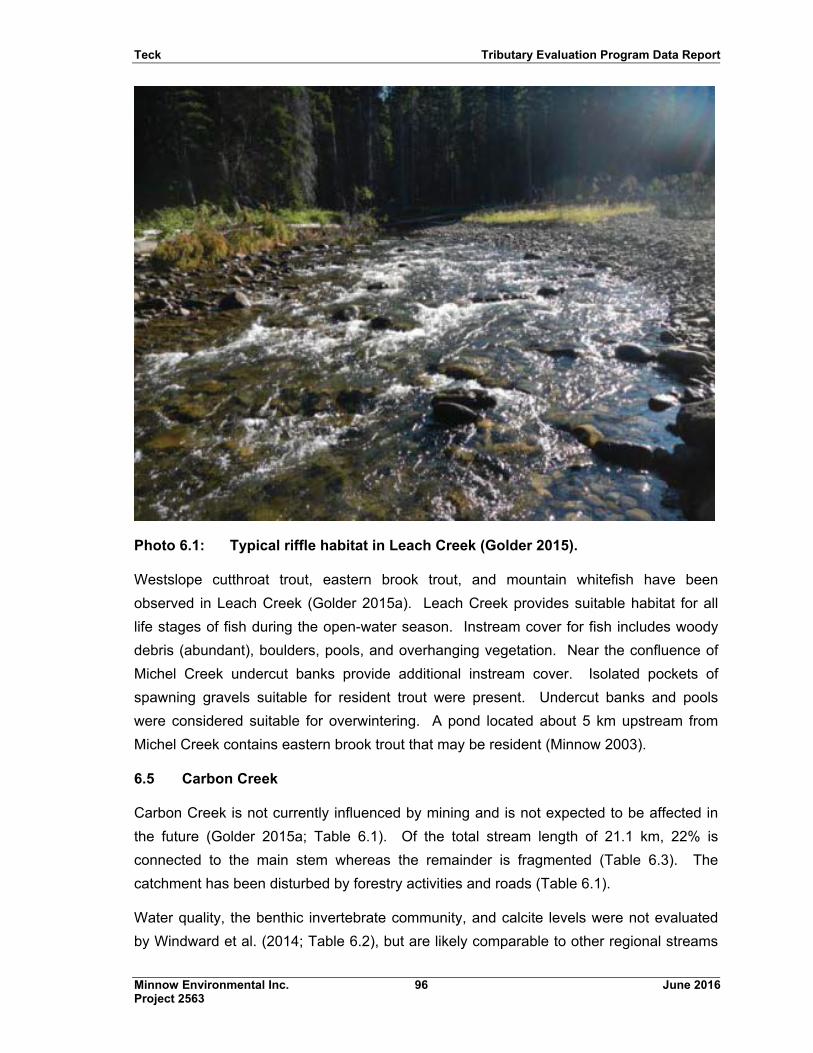
Teck Tributary Evaluation Program Data Report
Minnow Environmental Inc. 96 June 2016 Project 2563
Photo 6.1: Typical riffle habitat in Leach Creek (Golder 2015).
Westslope cutthroat trout, eastern brook trout, and mountain whitefish have been
observed in Leach Creek (Golder 2015a). Leach Creek provides suitable habitat for all
life stages of fish during the open-water season. Instream cover for fish includes woody
debris (abundant), boulders, pools, and overhanging vegetation. Near the confluence of
Michel Creek undercut banks provide additional instream cover. Isolated pockets of
spawning gravels suitable for resident trout were present. Undercut banks and pools
were considered suitable for overwintering. A pond located about 5 km upstream from
Michel Creek contains eastern brook trout that may be resident (Minnow 2003).
6.5 Carbon Creek
Carbon Creek is not currently influenced by mining and is not expected to be affected in
the future (Golder 2015a; Table 6.1). Of the total stream length of 21.1 km, 22% is
connected to the main stem whereas the remainder is fragmented (Table 6.3). The
catchment has been disturbed by forestry activities and roads (Table 6.1).
Water quality, the benthic invertebrate community, and calcite levels were not evaluated
by Windward et al. (2014; Table 6.2), but are likely comparable to other regional streams
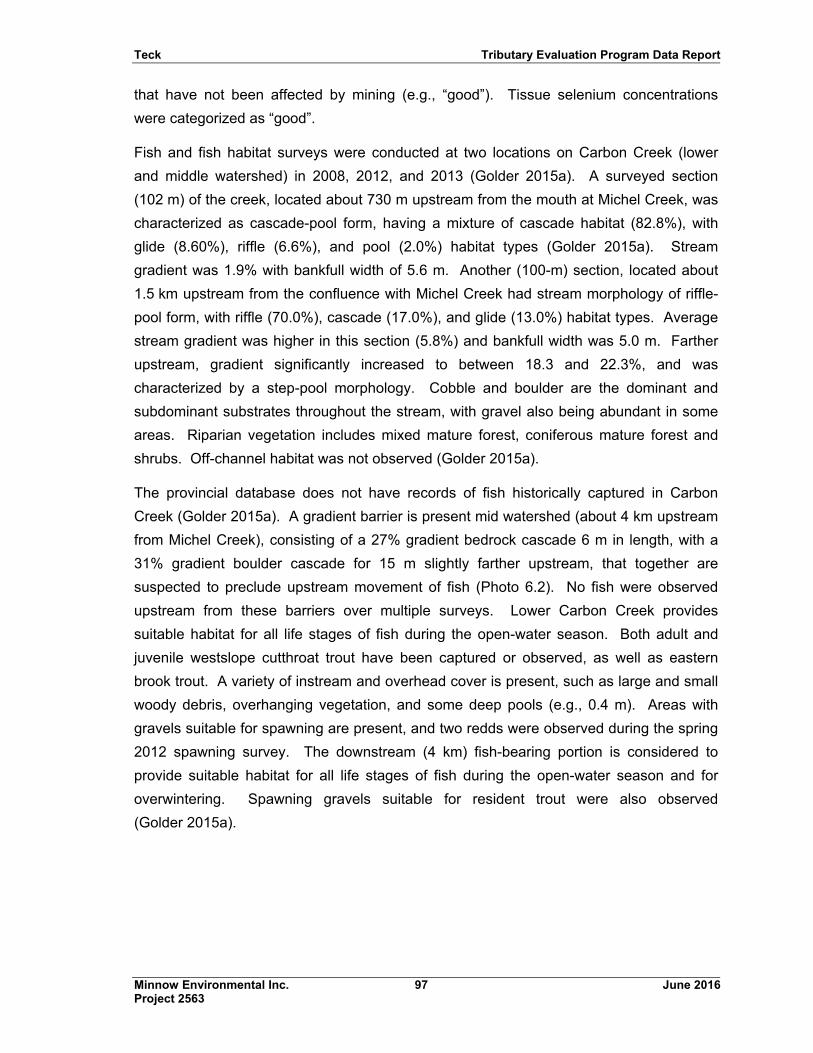
Teck Tributary Evaluation Program Data Report
Minnow Environmental Inc. 97 June 2016 Project 2563
that have not been affected by mining (e.g., “good”). Tissue selenium concentrations
were categorized as “good”.
Fish and fish habitat surveys were conducted at two locations on Carbon Creek (lower
and middle watershed) in 2008, 2012, and 2013 (Golder 2015a). A surveyed section
(102 m) of the creek, located about 730 m upstream from the mouth at Michel Creek, was
characterized as cascade-pool form, having a mixture of cascade habitat (82.8%), with
glide (8.60%), riffle (6.6%), and pool (2.0%) habitat types (Golder 2015a). Stream
gradient was 1.9% with bankfull width of 5.6 m. Another (100-m) section, located about
1.5 km upstream from the confluence with Michel Creek had stream morphology of riffle-
pool form, with riffle (70.0%), cascade (17.0%), and glide (13.0%) habitat types. Average
stream gradient was higher in this section (5.8%) and bankfull width was 5.0 m. Farther
upstream, gradient significantly increased to between 18.3 and 22.3%, and was
characterized by a step-pool morphology. Cobble and boulder are the dominant and
subdominant substrates throughout the stream, with gravel also being abundant in some
areas. Riparian vegetation includes mixed mature forest, coniferous mature forest and
shrubs. Off-channel habitat was not observed (Golder 2015a).
The provincial database does not have records of fish historically captured in Carbon
Creek (Golder 2015a). A gradient barrier is present mid watershed (about 4 km upstream
from Michel Creek), consisting of a 27% gradient bedrock cascade 6 m in length, with a
31% gradient boulder cascade for 15 m slightly farther upstream, that together are
suspected to preclude upstream movement of fish (Photo 6.2). No fish were observed
upstream from these barriers over multiple surveys. Lower Carbon Creek provides
suitable habitat for all life stages of fish during the open-water season. Both adult and
juvenile westslope cutthroat trout have been captured or observed, as well as eastern
brook trout. A variety of instream and overhead cover is present, such as large and small
woody debris, overhanging vegetation, and some deep pools (e.g., 0.4 m). Areas with
gravels suitable for spawning are present, and two redds were observed during the spring
2012 spawning survey. The downstream (4 km) fish-bearing portion is considered to
provide suitable habitat for all life stages of fish during the open-water season and for
overwintering. Spawning gravels suitable for resident trout were also observed
(Golder 2015a).
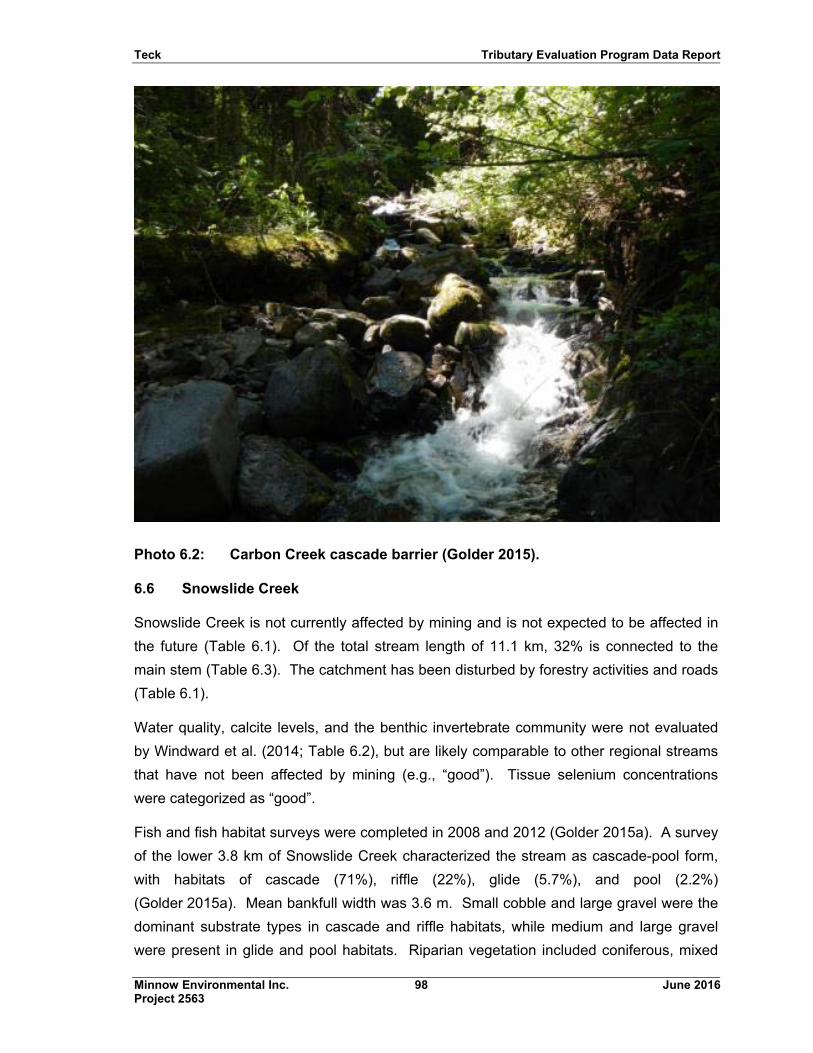
Teck Tributary Evaluation Program Data Report
Minnow Environmental Inc. 98 June 2016 Project 2563
Photo 6.2: Carbon Creek cascade barrier (Golder 2015).
6.6 Snowslide Creek
Snowslide Creek is not currently affected by mining and is not expected to be affected in
the future (Table 6.1). Of the total stream length of 11.1 km, 32% is connected to the
main stem (Table 6.3). The catchment has been disturbed by forestry activities and roads
(Table 6.1).
Water quality, calcite levels, and the benthic invertebrate community were not evaluated
by Windward et al. (2014; Table 6.2), but are likely comparable to other regional streams
that have not been affected by mining (e.g., “good”). Tissue selenium concentrations
were categorized as “good”.
Fish and fish habitat surveys were completed in 2008 and 2012 (Golder 2015a). A survey
of the lower 3.8 km of Snowslide Creek characterized the stream as cascade-pool form,
with habitats of cascade (71%), riffle (22%), glide (5.7%), and pool (2.2%)
(Golder 2015a). Mean bankfull width was 3.6 m. Small cobble and large gravel were the
dominant substrate types in cascade and riffle habitats, while medium and large gravel
were present in glide and pool habitats. Riparian vegetation included coniferous, mixed
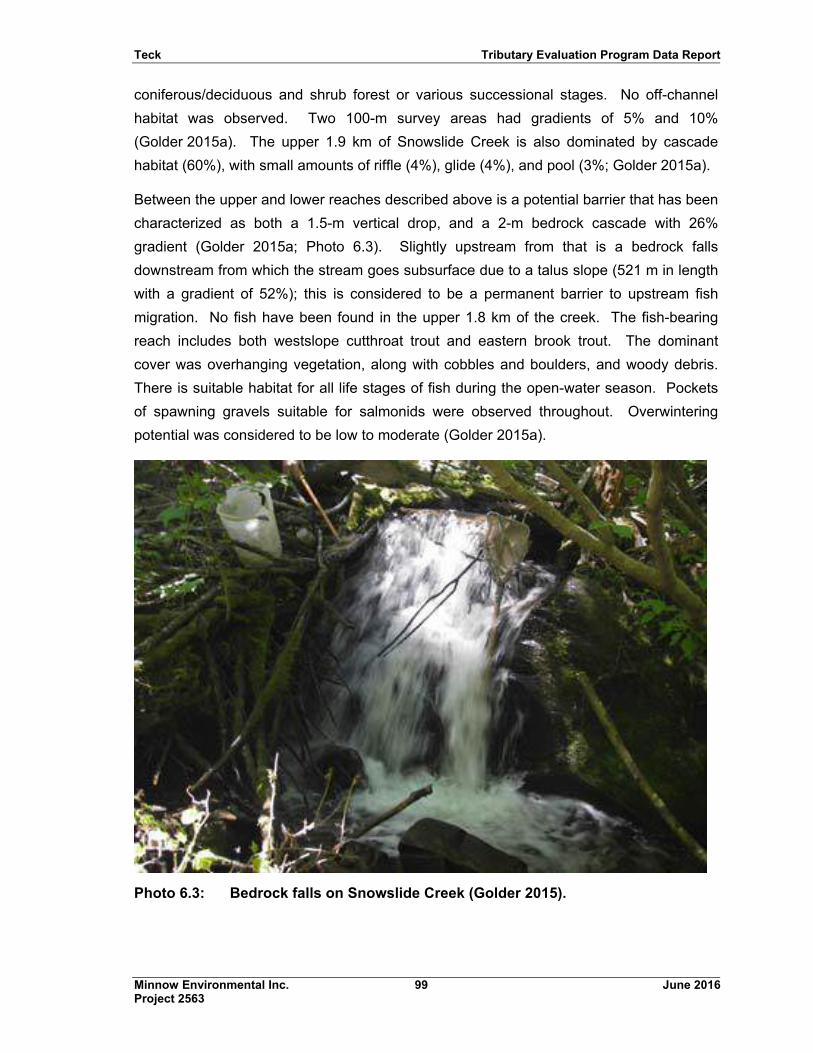
Teck Tributary Evaluation Program Data Report
Minnow Environmental Inc. 99 June 2016 Project 2563
coniferous/deciduous and shrub forest or various successional stages. No off-channel
habitat was observed. Two 100-m survey areas had gradients of 5% and 10%
(Golder 2015a). The upper 1.9 km of Snowslide Creek is also dominated by cascade
habitat (60%), with small amounts of riffle (4%), glide (4%), and pool (3%; Golder 2015a).
Between the upper and lower reaches described above is a potential barrier that has been
characterized as both a 1.5-m vertical drop, and a 2-m bedrock cascade with 26%
gradient (Golder 2015a; Photo 6.3). Slightly upstream from that is a bedrock falls
downstream from which the stream goes subsurface due to a talus slope (521 m in length
with a gradient of 52%); this is considered to be a permanent barrier to upstream fish
migration. No fish have been found in the upper 1.8 km of the creek. The fish-bearing
reach includes both westslope cutthroat trout and eastern brook trout. The dominant
cover was overhanging vegetation, along with cobbles and boulders, and woody debris.
There is suitable habitat for all life stages of fish during the open-water season. Pockets
of spawning gravels suitable for salmonids were observed throughout. Overwintering
potential was considered to be low to moderate (Golder 2015a).
Photo 6.3: Bedrock falls on Snowslide Creek (Golder 2015).
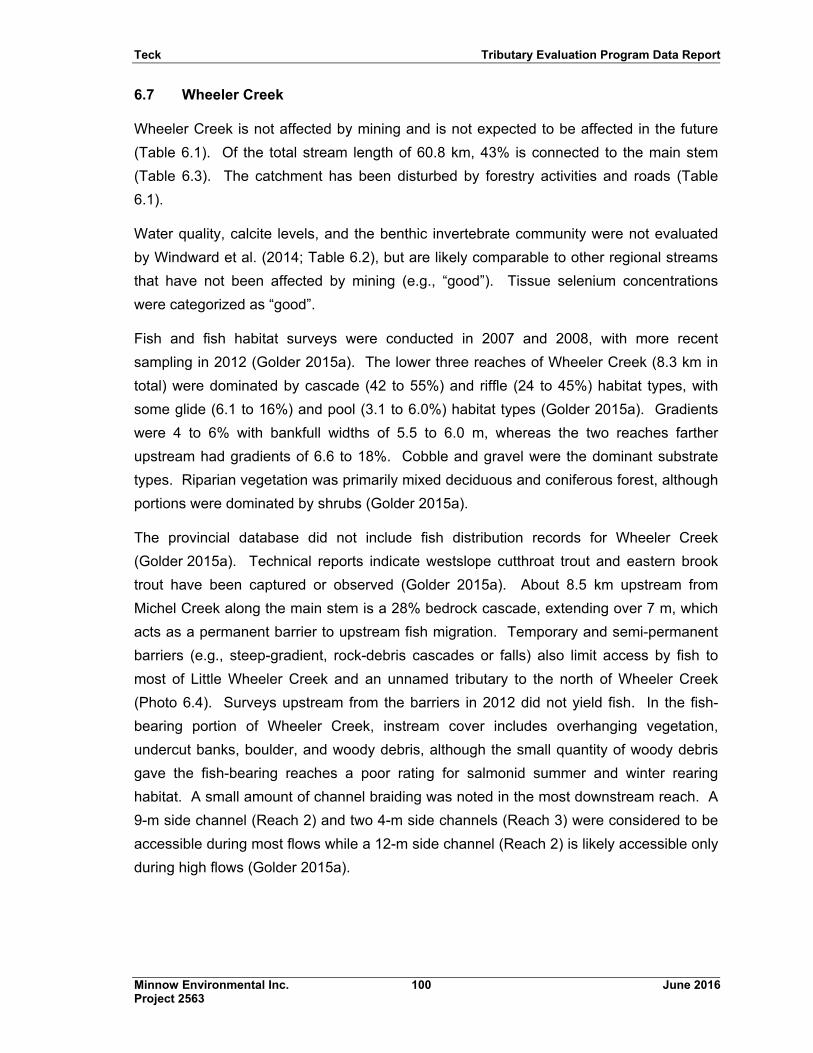
Teck Tributary Evaluation Program Data Report
Minnow Environmental Inc. 100 June 2016 Project 2563
6.7 Wheeler Creek
Wheeler Creek is not affected by mining and is not expected to be affected in the future
(Table 6.1). Of the total stream length of 60.8 km, 43% is connected to the main stem
(Table 6.3). The catchment has been disturbed by forestry activities and roads (Table
6.1).
Water quality, calcite levels, and the benthic invertebrate community were not evaluated
by Windward et al. (2014; Table 6.2), but are likely comparable to other regional streams
that have not been affected by mining (e.g., “good”). Tissue selenium concentrations
were categorized as “good”.
Fish and fish habitat surveys were conducted in 2007 and 2008, with more recent
sampling in 2012 (Golder 2015a). The lower three reaches of Wheeler Creek (8.3 km in
total) were dominated by cascade (42 to 55%) and riffle (24 to 45%) habitat types, with
some glide (6.1 to 16%) and pool (3.1 to 6.0%) habitat types (Golder 2015a). Gradients
were 4 to 6% with bankfull widths of 5.5 to 6.0 m, whereas the two reaches farther
upstream had gradients of 6.6 to 18%. Cobble and gravel were the dominant substrate
types. Riparian vegetation was primarily mixed deciduous and coniferous forest, although
portions were dominated by shrubs (Golder 2015a).
The provincial database did not include fish distribution records for Wheeler Creek
(Golder 2015a). Technical reports indicate westslope cutthroat trout and eastern brook
trout have been captured or observed (Golder 2015a). About 8.5 km upstream from
Michel Creek along the main stem is a 28% bedrock cascade, extending over 7 m, which
acts as a permanent barrier to upstream fish migration. Temporary and semi-permanent
barriers (e.g., steep-gradient, rock-debris cascades or falls) also limit access by fish to
most of Little Wheeler Creek and an unnamed tributary to the north of Wheeler Creek
(Photo 6.4). Surveys upstream from the barriers in 2012 did not yield fish. In the fish-
bearing portion of Wheeler Creek, instream cover includes overhanging vegetation,
undercut banks, boulder, and woody debris, although the small quantity of woody debris
gave the fish-bearing reaches a poor rating for salmonid summer and winter rearing
habitat. A small amount of channel braiding was noted in the most downstream reach. A
9-m side channel (Reach 2) and two 4-m side channels (Reach 3) were considered to be
accessible during most flows while a 12-m side channel (Reach 2) is likely accessible only
during high flows (Golder 2015a).
Teck Tributary Evaluation Program Data Report
Minnow Environmental Inc. 101 June 2016 Project 2563
Photo 6.4: Example of steep-gradient cascade barrier in Wheeler Creek (Golder
2015).
The habitat of Wheeler Creek is considered suitable for rearing, holding and feeding for
fish of various life stages, although pools were not considered deep enough (<1 m) to
function for adult holding (Golder 2015a).. Small amounts of spawning gravels were
observed, with greater abundance nearer to the Michel Creek confluence, but no redds
were observed during spring spawning surveys. Little overwintering habitat is available in
the creek (Golder 2015a).
Four wetlands were identified in upper portions of the Wheeler Creek basin, at one of
which a western toad was observed (Teck undated).
6.8 Unnamed Tributary to Michel Creek
Unnamed Tributary is not affected by mining and is not expected to be affected in the
future (Table 6.1). Of the total stream length of 10.1 km, 1% is connected to the main
stem (Table 6.3). The catchment has been disturbed by forestry activities and roads
(Table 6.1).
Teck Tributary Evaluation Program Data Report
Minnow Environmental Inc. 102 June 2016 Project 2563
Water quality, calcite, benthic invertebrate community, and tissue selenium concentrations
were not evaluated by Windward et al. (2014; Table 6.2), but are likely comparable to
other regional streams that have not been affected by mining (e.g., “good”).
Surveys of fish and fish habitat were conducted in 2012 and 2013 (Golder 2015a). A
131-m survey area, located about 500 m upstream from the confluence with Michel Creek
was categorized as cascade-pool morphology, with predominantly cascade habitat (74%)
and some glides (3.7%), pools (5.2%), and other features (17%). The average gradient
was 10.7% in this section, with bankfull width of 2.0 m, and cobble and boulders being the
dominant substrates. A 100-m section located about 3 km from the confluence with
Michel Creek, was characterized as riffle-pool form with a lower average gradient of 4%,
bankfull width of 2.8 m, and substrate consisting of gravel and fines. The riparian
vegetation consisted of mixed coniferous and deciduous mature forest (Golder 2015a).
Two falls were identified within the lower portion of the creek, the first being about 130 m
upstream from the confluence with Michel Creek and the second 140 m upstream from
the first falls, which are both expected to limit the movement of fish from Michel Creek into
Unnamed Michel Creek Tributary (Golder 2015a; Photo 6.5, Photo 6.6). Downstream
from the lower falls, westslope cutthroat trout have been captured. Instream cover types
included overhanding vegetation, boulders, undercut banks, and woody debris. There
were isolated pockets of spawning substrate and there is moderate overwintering
potential. Off-channel habitat was observed as a side channel habitat accessible to fish
only at high flows. Based on multiple years of sampling, the creek upstream from the falls
was classified as non-fish-bearing (Golder 2015a).
Two olive-sided flycatchers were observed in the headwater area of the Unnamed
Tributary in 2013 (Golder 2015b).
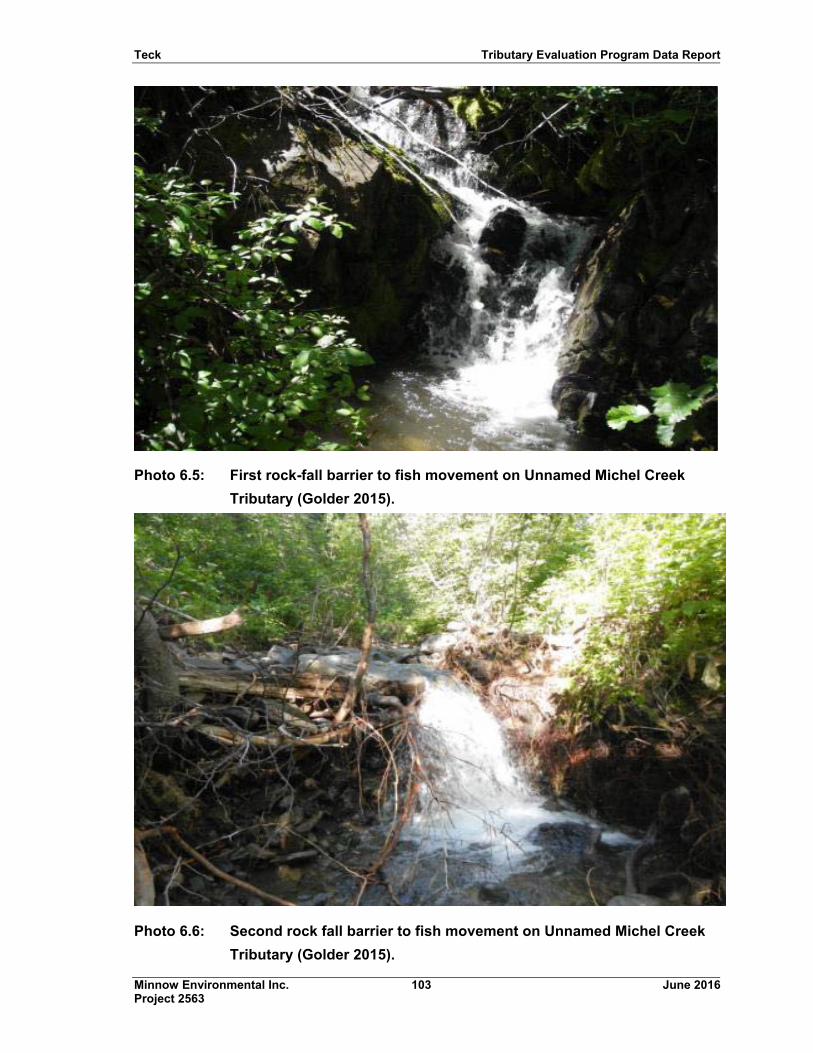
Teck Tributary Evaluation Program Data Report
Minnow Environmental Inc. 103 June 2016 Project 2563
Photo 6.5: First rock-fall barrier to fish movement on Unnamed Michel Creek
Tributary (Golder 2015).
Photo 6.6: Second rock fall barrier to fish movement on Unnamed Michel Creek
Tributary (Golder 2015).
Teck Tributary Evaluation Program Data Report
Minnow Environmental Inc. 104 June 2016 Project 2563
6.9 Fir Creek
Fir Creek is not currently affected by mining and is not expected to be influenced in the
future (Table 6.1). Of the total stream length of 19.1 km, 37% is connected to the main
stem (Table 6.3). The catchment has been disturbed by forestry activities and roads
(Table 6.1).
Water quality, calcite, benthic invertebrate community, and tissue selenium concentrations
were not evaluated by Windward et al. (2014; Table 6.2), but are likely comparable to
other regional streams that have not been affected by mining (e.g., “good”).
Fish and fish habitat surveys were conducted in 2007, 2008, and 2012 (Golder 2015a).
Surveyed areas of Fir Creek reflected relatively steep gradients (6.7 to 21%), with step-
pool morphology, predominantly cascade (47 to 74%) and glide (19 to 47%) habitat,
cobble-boulder-gravel substrate, and bankfull width of 3.6 to 5.6 m (Golder 2015a).
Riparian vegetation was dominated by coniferous mature forest in the downstream
reaches, and shrubs in the upstream reaches. Off-channel habitat was not observed
(Golder 2015a).
Both westslope cutthroat trout and eastern brook trout have been reported in Fir Creek,
although the most recent survey (2012) found only westslope cutthroat trout for which
catch-per-unit effort was high relative to other streams surveyed in the region
(Golder 2015a). A gradient barrier (>20% cascade) is present near the headwaters
(Photo 6.7), about 7 km upstream from Michel Creek, which prevents upstream migration
by fish and surveys upstream from the barrier have not yielded fish. Instream cover in the
fish-bearing portion includes woody debris, boulders, and overhanging vegetation, with
several deep pools present that may also provide overwintering habitat. The habitat was
considered suitable for all life stages of fish. Some pockets of suitable spawning gravel
were noted and two redds were confirmed in 2015 (Golder 2015a).
6.10 Alexander Creek
Alexander Creek has not been affected by mining activities (Table 6.1). All of the total
stream length of 309 km is connected to the main stem (Table 6.3). The catchment has
been disturbed by forestry activities and roads (Table 6.1).
Water quality was not evaluated by Windward et al. (2014; Table 6.2), but is likely
comparable to other regional streams that have not been affected by mining (e.g., “good”).
The benthic invertebrate community and tissue selenium concentrations were
characterized as “good”. Low levels of calcite have been observed (calcite index: 0.48).
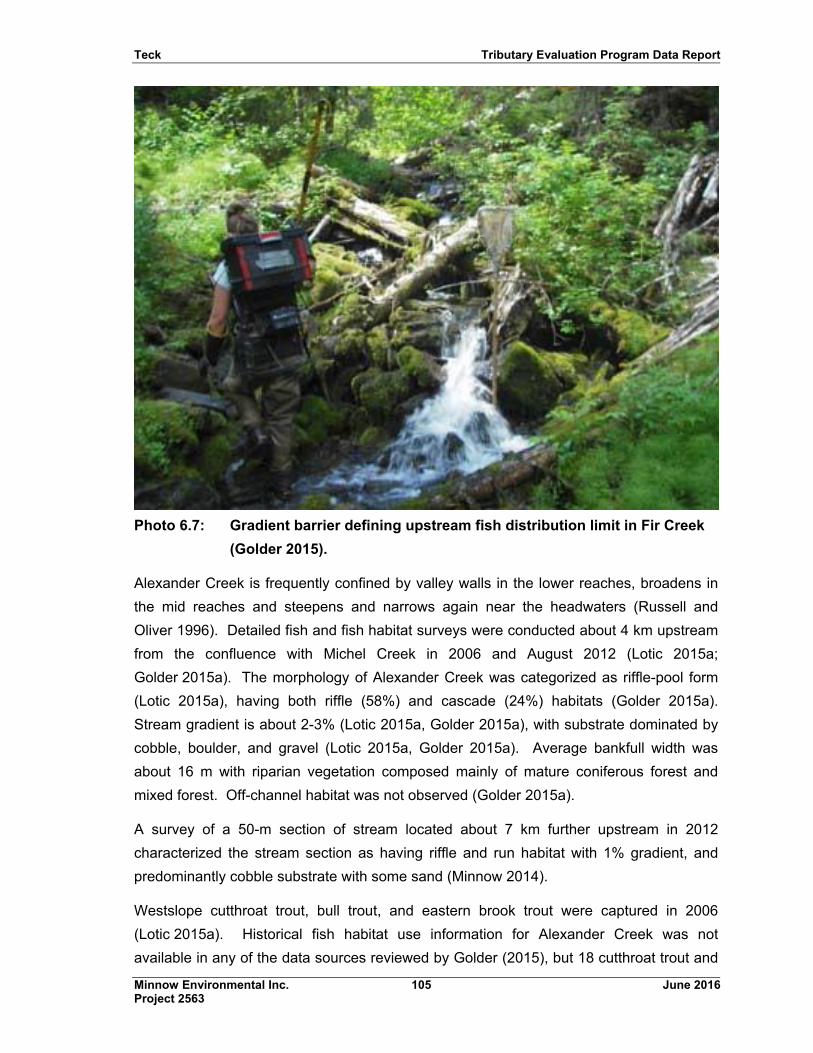
Teck Tributary Evaluation Program Data Report
Minnow Environmental Inc. 105 June 2016 Project 2563
Photo 6.7: Gradient barrier defining upstream fish distribution limit in Fir Creek
(Golder 2015).
Alexander Creek is frequently confined by valley walls in the lower reaches, broadens in
the mid reaches and steepens and narrows again near the headwaters (Russell and
Oliver 1996). Detailed fish and fish habitat surveys were conducted about 4 km upstream
from the confluence with Michel Creek in 2006 and August 2012 (Lotic 2015a;
Golder 2015a). The morphology of Alexander Creek was categorized as riffle-pool form
(Lotic 2015a), having both riffle (58%) and cascade (24%) habitats (Golder 2015a).
Stream gradient is about 2-3% (Lotic 2015a, Golder 2015a), with substrate dominated by
cobble, boulder, and gravel (Lotic 2015a, Golder 2015a). Average bankfull width was
about 16 m with riparian vegetation composed mainly of mature coniferous forest and
mixed forest. Off-channel habitat was not observed (Golder 2015a).
A survey of a 50-m section of stream located about 7 km further upstream in 2012
characterized the stream section as having riffle and run habitat with 1% gradient, and
predominantly cobble substrate with some sand (Minnow 2014).
Westslope cutthroat trout, bull trout, and eastern brook trout were captured in 2006
(Lotic 2015a). Historical fish habitat use information for Alexander Creek was not
available in any of the data sources reviewed by Golder (2015), but 18 cutthroat trout and
Teck Tributary Evaluation Program Data Report
Minnow Environmental Inc. 106 June 2016 Project 2563
one bull trout were captured in August 2012. Cover for fish included woody debris and
deep pools (Golder 2015a) with trace amounts of undercut banks (Lotic 2015a). Habitat
was considered suitable for all life stages of fish during the open-water season, and two
deep pools were documented that may provide overwintering habitat for juvenile and adult
fish (Golder 2015a). Isolated pockets of substrate suitable for cutthroat trout spawning
were found. No barriers to fish passage were reported during the surveys, however a
bedrock formation downstream from Highway 3 may be a barrier to fish movement during
some flows (M. Robinson, Lotic Environmental, pers. comm.). In the lower watershed,
major realignment of the stream channel has taken place to accommodate highway repair
and gas pipeline (Russell and Oliver 1996).
Olive-sided flycatcher is a species at risk that was observed near Alexander Creek in a
breeding bird survey conducted in 2012 (Minnow 2014a; Table 6.3).
6.11 Erickson Creek
About 26% of the total catchment area of Erickson Creek has been disturbed by mining
activities (Table 6.1). Mining currently occurring within the permit boundary will continue
into the near and far future. All of the total stream length of 82.4 is either fragmented or
has been lost (Table 6.3). There are four ponds near the headwaters of Erickson Creek
(Photo 6.8) and then a section of sub-surface flow before the stream flows above ground
for the remaining 2.3 km to the confluence with Michel Creek (Lotic 2015a). With the
exception of the upper-most pond, all ponds and reaches on Erickson Creek are
influenced by EVO mine activities. There has also been historical disturbance from
forestry activities and roads (Table 6.1).
Water quality was characterized as “poor” based on Windward et al. (2014), although
concentrations of selenium, nitrate, and cadmium have been decreasing (Zadjlik and
Minnow 2013; Table 6.2). The benthic invertebrate community was characterized as
“poor” but tissue selenium concentrations were characterized as “good”. Moderate levels
of calcite have been observed (calcite index: 1.77).
Active water treatment is scheduled for 2020 (EVO Phase I AWTF), which will treat water
from Erickson, Bodie, and Gate Creeks (Teck 2014). Treated effluent will discharge into
Erickson Creek. The second phase of AWTF is scheduled for Erickson Creek in 2024.
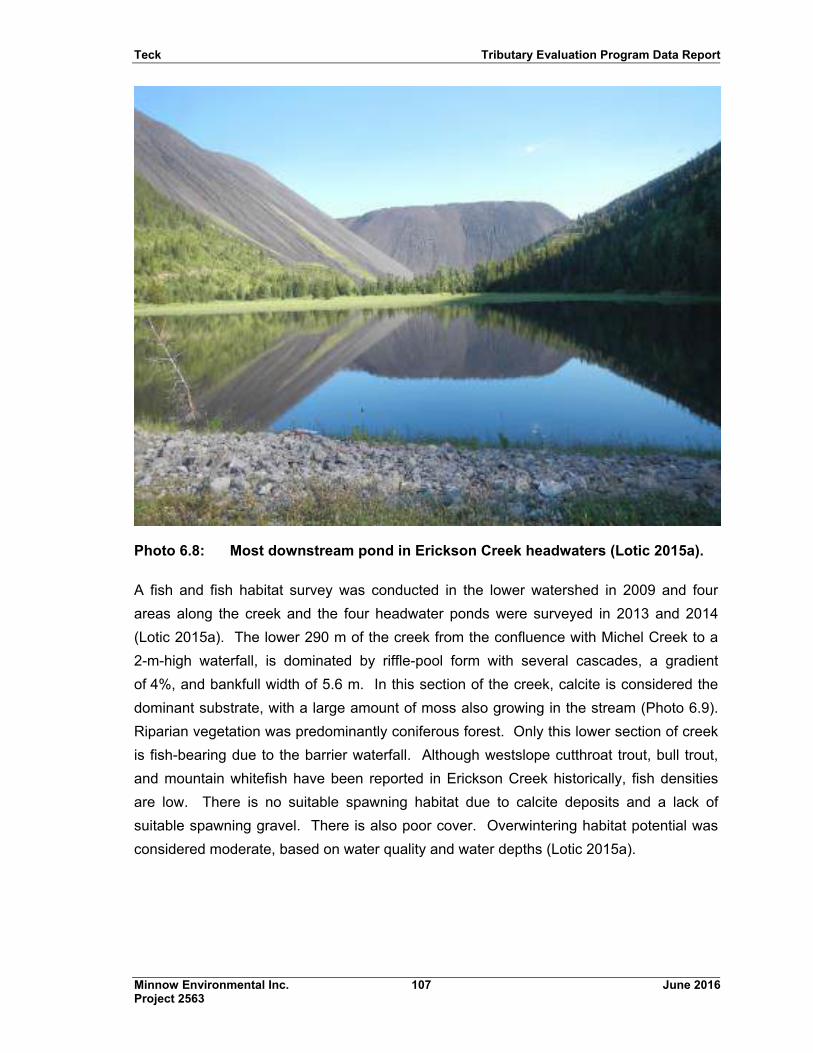
Teck Tributary Evaluation Program Data Report
Minnow Environmental Inc. 107 June 2016 Project 2563
Photo 6.8: Most downstream pond in Erickson Creek headwaters (Lotic 2015a).
A fish and fish habitat survey was conducted in the lower watershed in 2009 and four
areas along the creek and the four headwater ponds were surveyed in 2013 and 2014
(Lotic 2015a). The lower 290 m of the creek from the confluence with Michel Creek to a
2-m-high waterfall, is dominated by riffle-pool form with several cascades, a gradient
of 4%, and bankfull width of 5.6 m. In this section of the creek, calcite is considered the
dominant substrate, with a large amount of moss also growing in the stream (Photo 6.9).
Riparian vegetation was predominantly coniferous forest. Only this lower section of creek
is fish-bearing due to the barrier waterfall. Although westslope cutthroat trout, bull trout,
and mountain whitefish have been reported in Erickson Creek historically, fish densities
are low. There is no suitable spawning habitat due to calcite deposits and a lack of
suitable spawning gravel. There is also poor cover. Overwintering habitat potential was
considered moderate, based on water quality and water depths (Lotic 2015a).
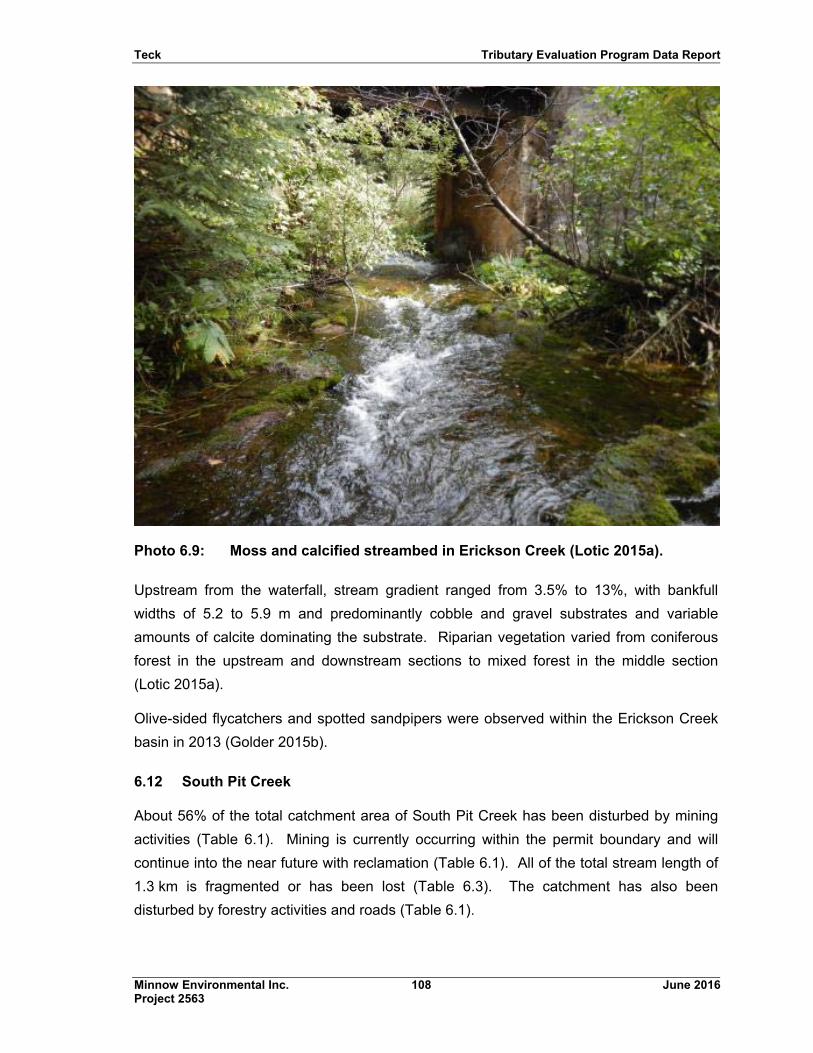
Teck Tributary Evaluation Program Data Report
Minnow Environmental Inc. 108 June 2016 Project 2563
Photo 6.9: Moss and calcified streambed in Erickson Creek (Lotic 2015a).
Upstream from the waterfall, stream gradient ranged from 3.5% to 13%, with bankfull
widths of 5.2 to 5.9 m and predominantly cobble and gravel substrates and variable
amounts of calcite dominating the substrate. Riparian vegetation varied from coniferous
forest in the upstream and downstream sections to mixed forest in the middle section
(Lotic 2015a).
Olive-sided flycatchers and spotted sandpipers were observed within the Erickson Creek
basin in 2013 (Golder 2015b).
6.12 South Pit Creek
About 56% of the total catchment area of South Pit Creek has been disturbed by mining
activities (Table 6.1). Mining is currently occurring within the permit boundary and will
continue into the near future with reclamation (Table 6.1). All of the total stream length of
1.3 km is fragmented or has been lost (Table 6.3). The catchment has also been
disturbed by forestry activities and roads (Table 6.1).
Teck Tributary Evaluation Program Data Report
Minnow Environmental Inc. 109 June 2016 Project 2563
Water quality was characterized as “poor” based on Windward et al. (2014) and
increasing trends in the concentrations of selenium and sulphate were reported (Zadjlik
and Minnow 2013; Table 6.2). Windward et al. (2014) did not report data for benthic
invertebrate community, tissue selenium concentrations, or calcite.
South Pit Creek is not fish-bearing and habitat surveys have not been completed.
6.13 Milligan Creek
About 32% of the total catchment area of Milligan Creek has been disturbed by mining
activities (Table 6.1). Mining is currently occurring within the permit boundary and will
continue into the near future with reclamation (Table 6.1). Of the total stream length of
7.2 km, 61% is connected to the main stem whereas the remainder is fragmented or has
been lost (Table 6.3). The catchment has also been disturbed by forestry activities and
roads (Table 6.1).
Water quality was characterized as “poor” (Windward et al. 2014) and increasing trends in
the concentrations of selenium and sulphate were reported (Zadjlik and Minnow 2013;
Table 6.2). A decreasing trend in the concentration of nitrate was observed. Windward
et al. (2014) did not report data for benthic invertebrate community, tissue selenium
concentration, or calcite.
Milligan Creek is not fish-bearing and no habitat surveys have been completed.
6.14 Gate Creek
About 56% of the total catchment area of Gate Creek has been disturbed by mining
activities (Table 6.1). Mining is currently occurring within the permit boundary and will
continue into the near and far future (Table 6.1). Of the total stream length of 5.9 km, 7%
is connected to the main stem whereas the remainder is fragmented or has been lost
(Table 6.3). The catchment has also been disturbed by forestry activities and roads
(Table 6.1).
Water quality was characterized as “poor” based on Windward et al. (2014) and
increasing trends in the concentrations of selenium and sulphate, and a decreasing trend
in the concentration of nitrate, were reported (Zadjlick and Minnow 2013; Table 6.2). No
data are available for the benthic invertebrate community, tissue selenium concentration,
or calcite.
Active water treatment is scheduled for 2020 (EVO Phase I AWTF), which will treat water
from Erickson, Bodie, and Gate Creeks (Teck 2014). Treated effluent will discharge into
Erickson Creek.
Teck Tributary Evaluation Program Data Report
Minnow Environmental Inc. 110 June 2016 Project 2563
The lower portion of Gate Creek is a settling pond (6,562 m2), with fine substrate and
maximum depth of 3 m (Lotic 2015a). Gate Creek and South Gate Creek both flow west
from EVO mining areas around the Bodie spoil and under the railway tracks and
Highway 3 before joining and entering into Gate Pond. Fish and fish habitat surveys were
conducted in 2013 (Lotic 2015a). The main stem of Gate Creek was characterized as a
very narrow (0.5 m width), shallow cascade with a gradient barrier. South Gate Creek
was characterized as having cascade-pool morphology, mean gradient of 1.5%, and
mean bankfull width of 2.07 m, with the dominant substrates being fines and gravel. No
off-channel habitat was reported and riparian vegetation was not documented for this
creek (Lotic 2015a).
Gate Pond has a small concrete culvert and flap valve (Photo 6.10) at the outlet which
may act as a deterrent to fish passage but is not considered a barrier (Lotic 2015a). Fish
access into the pond was easier prior to installation of the flap valve in 2011. Fish species
captured or observed in Gate Pond and/or Gate Creek were longnose sucker, longnose
dace, and westslope cutthroat trout (Lotic 2015a). Good cover is provided by aquatic
vegetation along the shore and by the depth of the pond. The pond habitat was
considered suitable for longnose sucker and density of this species was highest of all
areas surveyed in an evaluation of fish species distribution in the Elk Valley in 2010
(Interior Reforestation 2014). The creek upstream from Gate Pond is considered fish-
bearing for 730 m, because there are no barriers between the creek and the pond, but it
was concluded to have limited fish use. South Gate Creek provides suitable habitat for all
life stages of longnose sucker, but the lentic pond habitat would likely be preferred over
the flowing creek. Spawning habitat suitable for cutthroat trout was not present
(Lotic 2015a).
6.15 Bodie Creek
About 98% of the total catchment area of Bodie Creek has been disturbed by mining
activities (Table 6.1). Mining is currently occurring within the permit boundary and will
continue into the near and far future (Table 6.1). Of the total stream length of 12.5 km,
6% is connected to the main stem whereas the remainder is fragmented or has been lost
(Table 6.3). The catchment has also been disturbed by forestry activities and roads
(Table 6.1).
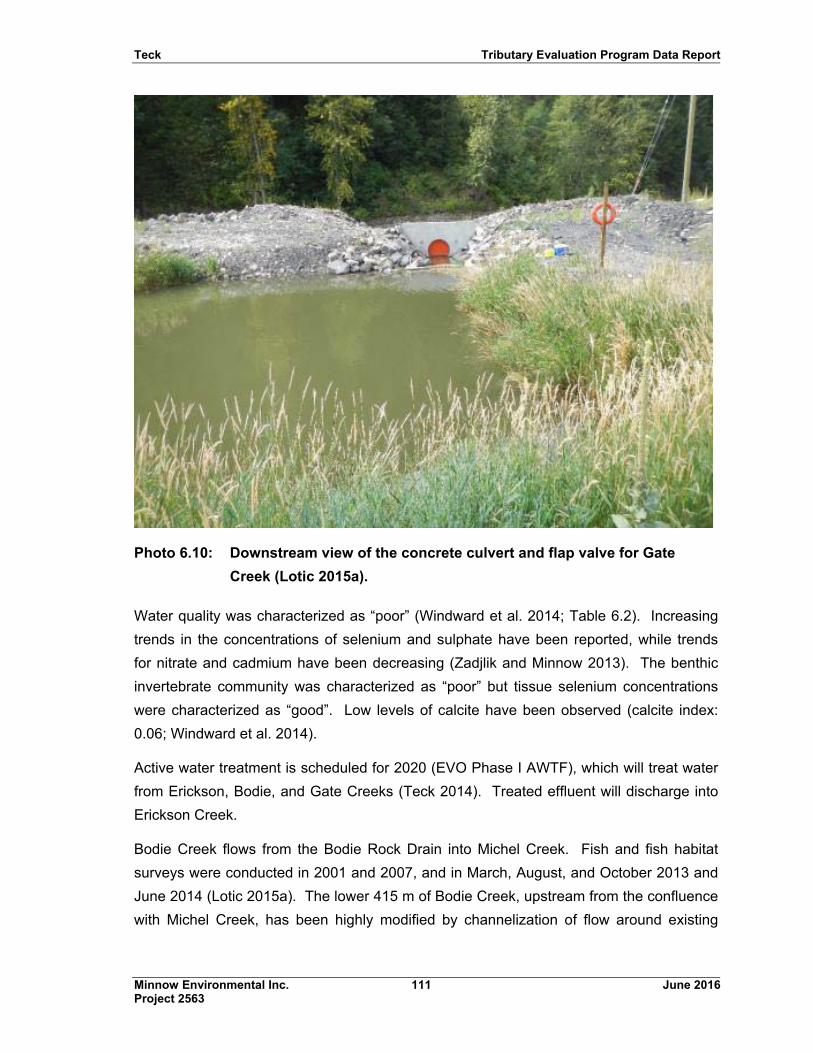
Teck Tributary Evaluation Program Data Report
Minnow Environmental Inc. 111 June 2016 Project 2563
Photo 6.10: Downstream view of the concrete culvert and flap valve for Gate
Creek (Lotic 2015a).
Water quality was characterized as “poor” (Windward et al. 2014; Table 6.2). Increasing
trends in the concentrations of selenium and sulphate have been reported, while trends
for nitrate and cadmium have been decreasing (Zadjlik and Minnow 2013). The benthic
invertebrate community was characterized as “poor” but tissue selenium concentrations
were characterized as “good”. Low levels of calcite have been observed (calcite index:
0.06; Windward et al. 2014).
Active water treatment is scheduled for 2020 (EVO Phase I AWTF), which will treat water
from Erickson, Bodie, and Gate Creeks (Teck 2014). Treated effluent will discharge into
Erickson Creek.
Bodie Creek flows from the Bodie Rock Drain into Michel Creek. Fish and fish habitat
surveys were conducted in 2001 and 2007, and in March, August, and October 2013 and
June 2014 (Lotic 2015a). The lower 415 m of Bodie Creek, upstream from the confluence
with Michel Creek, has been highly modified by channelization of flow around existing
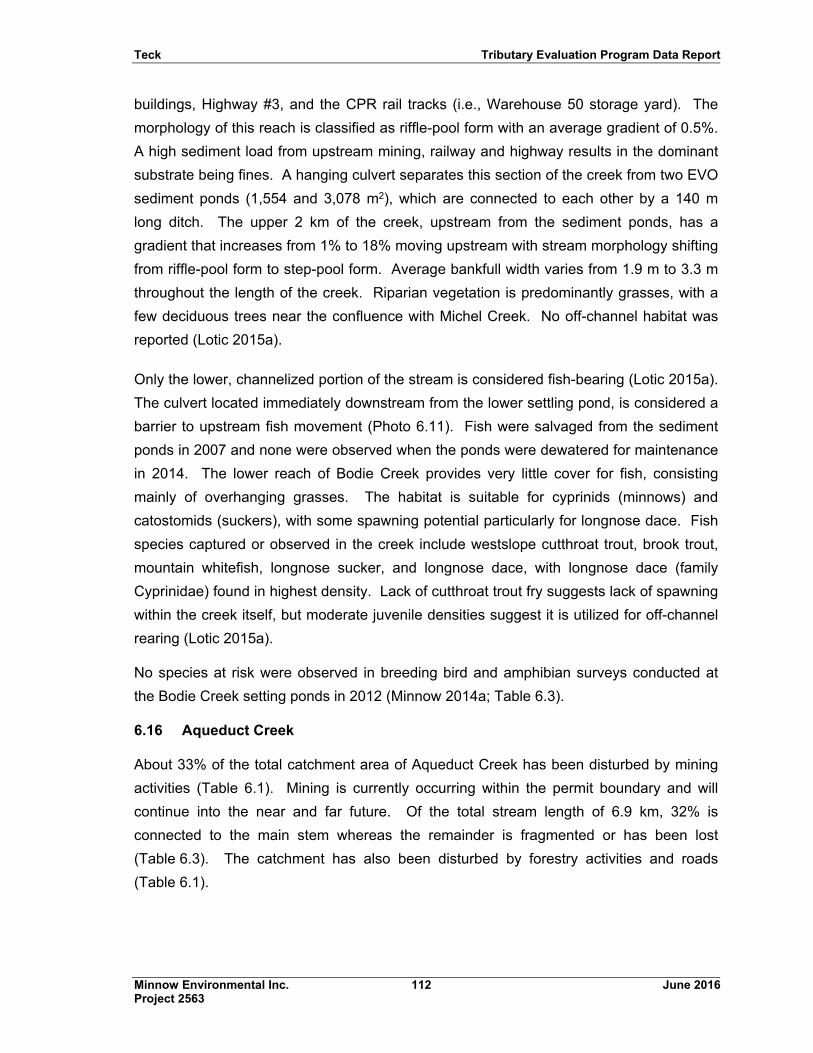
Teck Tributary Evaluation Program Data Report
Minnow Environmental Inc. 112 June 2016 Project 2563
buildings, Highway #3, and the CPR rail tracks (i.e., Warehouse 50 storage yard). The
morphology of this reach is classified as riffle-pool form with an average gradient of 0.5%.
A high sediment load from upstream mining, railway and highway results in the dominant
substrate being fines. A hanging culvert separates this section of the creek from two EVO
sediment ponds (1,554 and 3,078 m2), which are connected to each other by a 140 m
long ditch. The upper 2 km of the creek, upstream from the sediment ponds, has a
gradient that increases from 1% to 18% moving upstream with stream morphology shifting
from riffle-pool form to step-pool form. Average bankfull width varies from 1.9 m to 3.3 m
throughout the length of the creek. Riparian vegetation is predominantly grasses, with a
few deciduous trees near the confluence with Michel Creek. No off-channel habitat was
reported (Lotic 2015a).
Only the lower, channelized portion of the stream is considered fish-bearing (Lotic 2015a).
The culvert located immediately downstream from the lower settling pond, is considered a
barrier to upstream fish movement (Photo 6.11). Fish were salvaged from the sediment
ponds in 2007 and none were observed when the ponds were dewatered for maintenance
in 2014. The lower reach of Bodie Creek provides very little cover for fish, consisting
mainly of overhanging grasses. The habitat is suitable for cyprinids (minnows) and
catostomids (suckers), with some spawning potential particularly for longnose dace. Fish
species captured or observed in the creek include westslope cutthroat trout, brook trout,
mountain whitefish, longnose sucker, and longnose dace, with longnose dace (family
Cyprinidae) found in highest density. Lack of cutthroat trout fry suggests lack of spawning
within the creek itself, but moderate juvenile densities suggest it is utilized for off-channel
rearing (Lotic 2015a).
No species at risk were observed in breeding bird and amphibian surveys conducted at
the Bodie Creek setting ponds in 2012 (Minnow 2014a; Table 6.3).
6.16 Aqueduct Creek
About 33% of the total catchment area of Aqueduct Creek has been disturbed by mining
activities (Table 6.1). Mining is currently occurring within the permit boundary and will
continue into the near and far future. Of the total stream length of 6.9 km, 32% is
connected to the main stem whereas the remainder is fragmented or has been lost
(Table 6.3). The catchment has also been disturbed by forestry activities and roads
(Table 6.1).
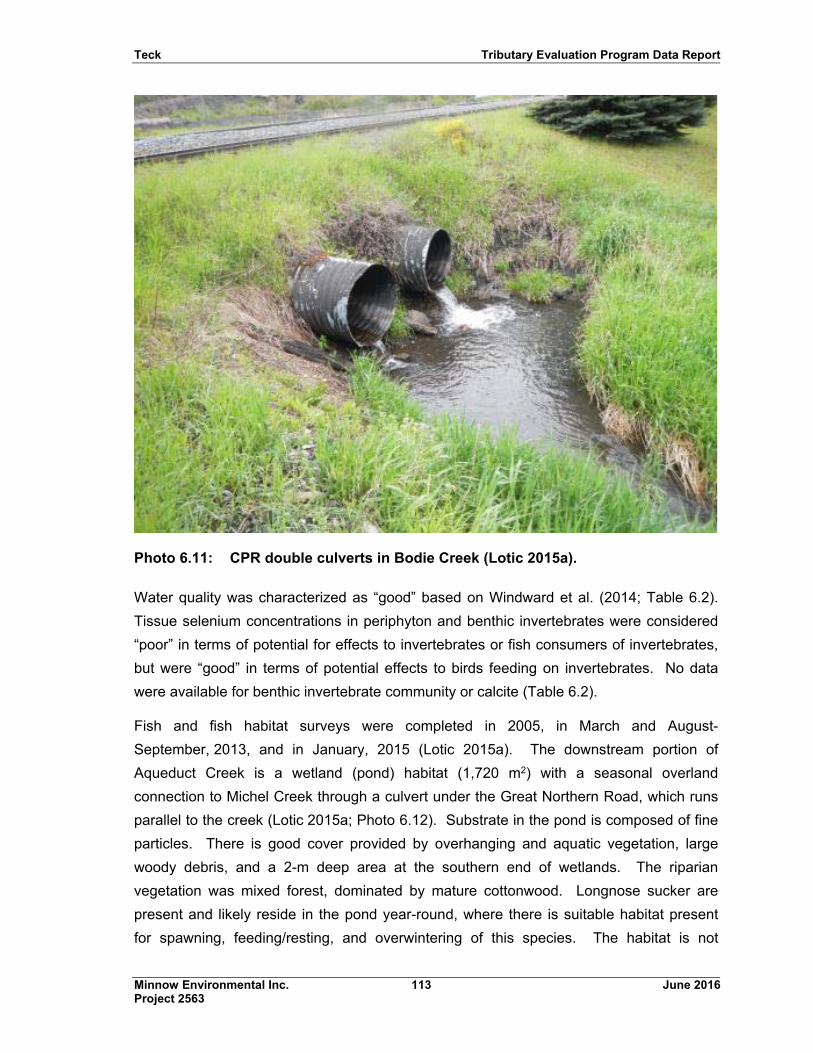
Teck Tributary Evaluation Program Data Report
Minnow Environmental Inc. 113 June 2016 Project 2563
Photo 6.11: CPR double culverts in Bodie Creek (Lotic 2015a).
Water quality was characterized as “good” based on Windward et al. (2014; Table 6.2).
Tissue selenium concentrations in periphyton and benthic invertebrates were considered
“poor” in terms of potential for effects to invertebrates or fish consumers of invertebrates,
but were “good” in terms of potential effects to birds feeding on invertebrates. No data
were available for benthic invertebrate community or calcite (Table 6.2).
Fish and fish habitat surveys were completed in 2005, in March and August-
September, 2013, and in January, 2015 (Lotic 2015a). The downstream portion of
Aqueduct Creek is a wetland (pond) habitat (1,720 m2) with a seasonal overland
connection to Michel Creek through a culvert under the Great Northern Road, which runs
parallel to the creek (Lotic 2015a; Photo 6.12). Substrate in the pond is composed of fine
particles. There is good cover provided by overhanging and aquatic vegetation, large
woody debris, and a 2-m deep area at the southern end of wetlands. The riparian
vegetation was mixed forest, dominated by mature cottonwood. Longnose sucker are
present and likely reside in the pond year-round, where there is suitable habitat present
for spawning, feeding/resting, and overwintering of this species. The habitat is not
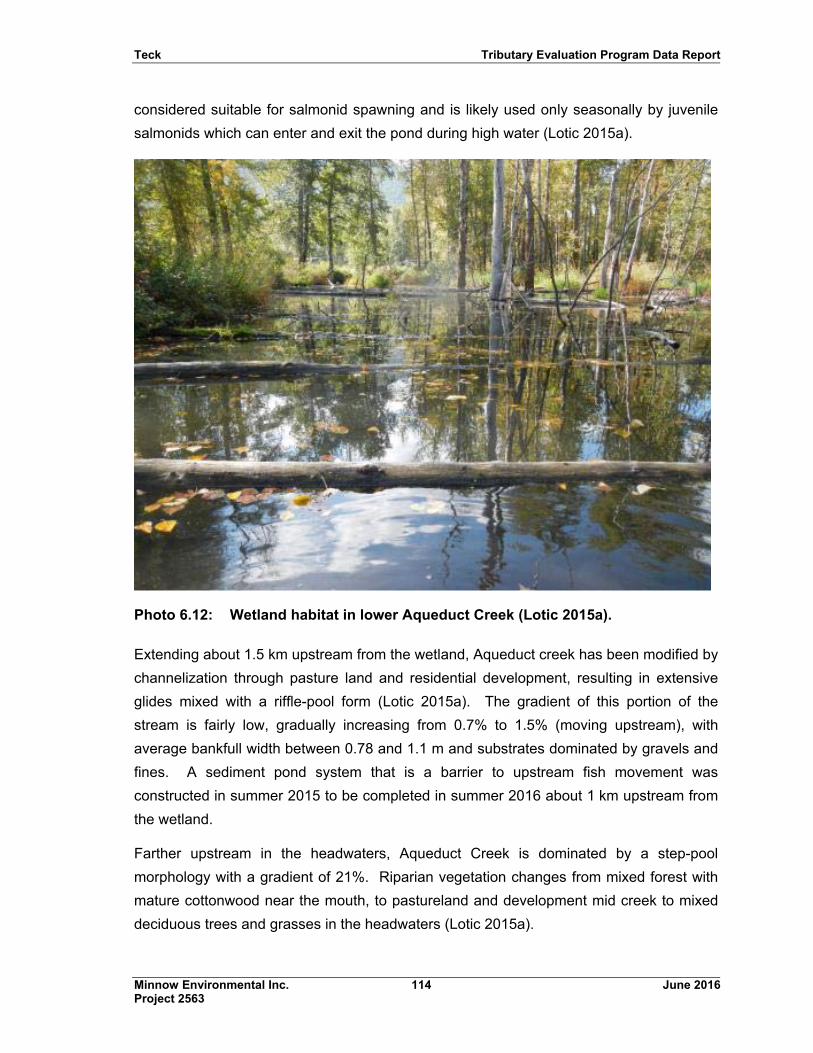
Teck Tributary Evaluation Program Data Report
Minnow Environmental Inc. 114 June 2016 Project 2563
considered suitable for salmonid spawning and is likely used only seasonally by juvenile
salmonids which can enter and exit the pond during high water (Lotic 2015a).
Photo 6.12: Wetland habitat in lower Aqueduct Creek (Lotic 2015a).
Extending about 1.5 km upstream from the wetland, Aqueduct creek has been modified by
channelization through pasture land and residential development, resulting in extensive
glides mixed with a riffle-pool form (Lotic 2015a). The gradient of this portion of the
stream is fairly low, gradually increasing from 0.7% to 1.5% (moving upstream), with
average bankfull width between 0.78 and 1.1 m and substrates dominated by gravels and
fines. A sediment pond system that is a barrier to upstream fish movement was
constructed in summer 2015 to be completed in summer 2016 about 1 km upstream from
the wetland.
Farther upstream in the headwaters, Aqueduct Creek is dominated by a step-pool
morphology with a gradient of 21%. Riparian vegetation changes from mixed forest with
mature cottonwood near the mouth, to pastureland and development mid creek to mixed
deciduous trees and grasses in the headwaters (Lotic 2015a).
Teck Tributary Evaluation Program Data Report
Minnow Environmental Inc. 115 June 2016 Project 2563
Spring Creek (fish-bearing) and Qualtieri Creek (no fish have been observed) are small
tributaries to Aqueduct Creek (Lotic 2015a). In Aqueduct Creek, although there is no
barrier to fish movement for 1.0 km upstream from the wetland, only the lower 440 m of
the system between Spring Creek and Michel Creek has been confirmed as fish-bearing
(Lotic 2015a). Overhanging vegetation provides fair cover for fish, along with small
quantities of small and large woody debris. This section supports all life stages of
longnose suckers and cyprinids, including spawning, especially in the wetland area.
Westslope cutthroat trout, bull trout, eastern brook trout and mountain white fish have also
been observed in this lower section. Fish utilization of reaches farther upstream is likely
limited by shallow water (dry in some seasons), highly modified channel morphology
(e.g., ditching), and cover (Lotic 2015a).
Olive-sided flycatchers were observed near the headwaters of Aqueduct Creek in 2013
(Golder 2015b).
Teck Tributary Evaluation Program Data Report
Minnow Environmental Inc. 116 June 2016 Project 2563
7.0 TRIBUTARIES TO MIDDLE ELK RIVER (MU4/MU5)
Tributaries in the Middle Elk River Watershed (MU4/MU5) are shown in Figure 7.1, and
include:
Grave Creek (Including Harmer Creek and EVO Dry Creek);
Six-Mile Creek;
Balmer Creek;
Fennelon Creek;
Goddard Creek;
Otto Creek;
Transmission Creek;
Mine Creek (Hosmer Creek)
Matrices for these tributaries provide data related to watershed area and disturbances
(Table 7.1), environmental quality descriptors (Table 7.2) and fish and aquatic habitat
(Table 7.3). An orthophoto figure for each tributary is found in Appendix E. Each tributary
is briefly described in the following sections.
7.1 Grave Creek (including Harmer Creek and EVO Dry Creek)
About 8% of the total catchment area of Grave Creek has been disturbed by mining
activities (Table 7.1), and the BRE Project will extend mining operations into the EVO Dry
Creek drainage. Harmer Creek is a major tributary of the Grave Creek system, and EVO
Dry Creek, located on the north-east side of EVO, flows into Harmer Creek. Grave Creek
upstream from the Harmer/Grave confluence is not mine influenced, nor are the
headwaters of Harmer Creek. Of the total stream length of 158 km, 1% is connected to
the main stem whereas the remainder is fragmented or has been lost (Table 7.3). The
catchment has also been disturbed by forestry activities and roads (Table 7.1). Grave
Lake, which flows into Grave Creek from the north, is used as a recreational site.
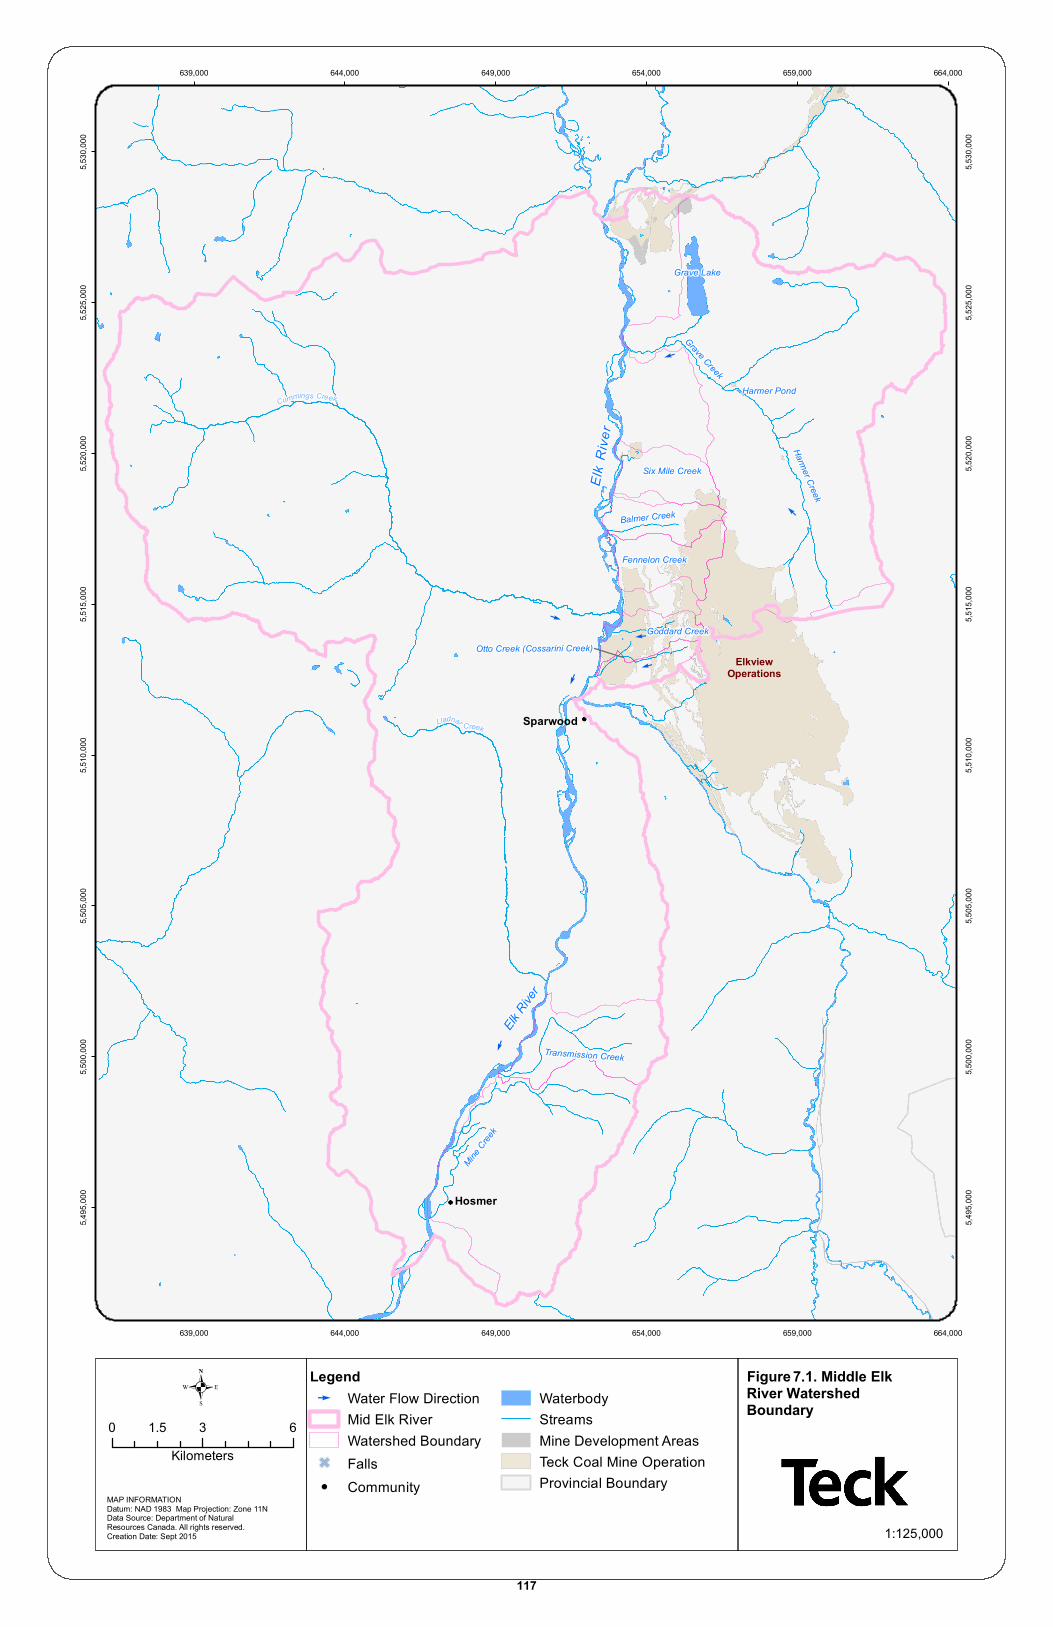
E
EE
E
E
E
E
Elk
Rive
r
Harmer Creek
Grave Creek
Elk Rive
r
Six Mile Creek
Fennelon Creek
Goddard CreekOtto Creek (Cossarini Creek)
Grave Lake
Harmer Pond
Balmer Creek
Mine Cree
k
Transmission Creek
Sparwood
Hosmer
ElkviewOperations
Lladnar Creek
Cummings Creek
639,000
639,000
644,000
644,000
649,000
649,000
654,000
654,000
659,000
659,000
664,000
664,000
5,495
,000
5,495
,000
5,500
,000
5,500
,000
5,505
,000
5,505
,000
5,510
,000
5,510
,000
5,515
,000
5,515
,000
5,520
,000
5,520
,000
5,525
,000
5,525
,000
5,530
,000
5,530
,000
.Legend
E Water Flow DirectionMid Elk RiverWatershed Boundary
G Falls! Community
WaterbodyStreamsMine Development Areas Teck Coal Mine OperationProvincial Boundary
MAP INFORMATIONDatum: NAD 1983 Map Projection: Zone 11NData Source: Department of Natural Resources Canada. All rights reserved.Creation Date: Sept 2015
0 3 61.5Kilometers
1:125,000
Figure 7 . 1. Middle Elk River Watershed Boundary
117
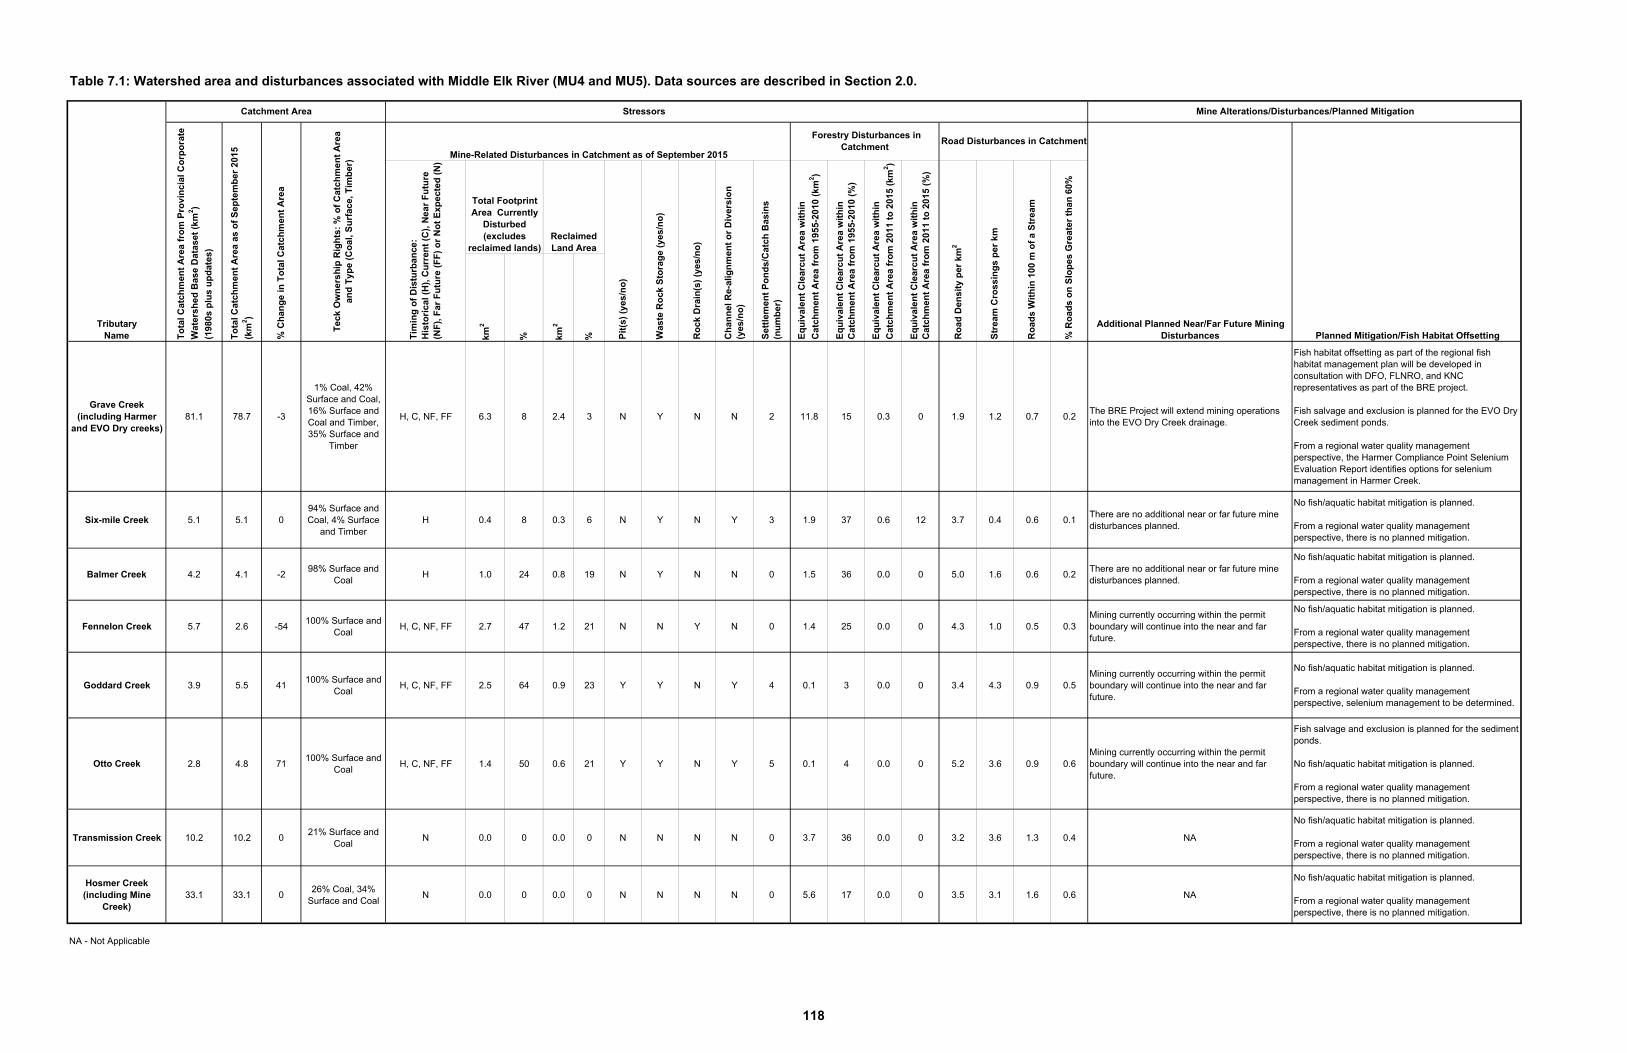
Table 7.1: Watershed area and disturbances associated with Middle Elk River (MU4 and MU5). Data sources are described in Section 2.0.
km2
% km2
%
Grave Creek (including Harmer
and EVO Dry creeks)81.1 78.7 -3
1% Coal, 42% Surface and Coal, 16% Surface and Coal and Timber, 35% Surface and
Timber
H, C, NF, FF 6.3 8 2.4 3 N Y N N 2 11.8 15 0.3 0 1.9 1.2 0.7 0.2The BRE Project will extend mining operations into the EVO Dry Creek drainage.
Fish habitat offsetting as part of the regional fish habitat management plan will be developed in consultation with DFO, FLNRO, and KNC representatives as part of the BRE project.
Fish salvage and exclusion is planned for the EVO Dry Creek sediment ponds.
From a regional water quality management perspective, the Harmer Compliance Point Selenium Evaluation Report identifies options for selenium management in Harmer Creek.
Six-mile Creek 5.1 5.1 094% Surface and Coal, 4% Surface
and TimberH 0.4 8 0.3 6 N Y N Y 3 1.9 37 0.6 12 3.7 0.4 0.6 0.1
There are no additional near or far future mine disturbances planned.
No fish/aquatic habitat mitigation is planned.
From a regional water quality management perspective, there is no planned mitigation.
Balmer Creek 4.2 4.1 -298% Surface and
CoalH 1.0 24 0.8 19 N Y N N 0 1.5 36 0.0 0 5.0 1.6 0.6 0.2
There are no additional near or far future mine disturbances planned.
No fish/aquatic habitat mitigation is planned.
From a regional water quality management perspective, there is no planned mitigation.
Fennelon Creek 5.7 2.6 -54100% Surface and
CoalH, C, NF, FF 2.7 47 1.2 21 N N Y N 0 1.4 25 0.0 0 4.3 1.0 0.5 0.3
Mining currently occurring within the permit boundary will continue into the near and far future.
No fish/aquatic habitat mitigation is planned.
From a regional water quality management perspective, there is no planned mitigation.
Goddard Creek 3.9 5.5 41100% Surface and
CoalH, C, NF, FF 2.5 64 0.9 23 Y Y N Y 4 0.1 3 0.0 0 3.4 4.3 0.9 0.5
Mining currently occurring within the permit boundary will continue into the near and far future.
No fish/aquatic habitat mitigation is planned.
From a regional water quality management perspective, selenium management to be determined.
Otto Creek 2.8 4.8 71100% Surface and
CoalH, C, NF, FF 1.4 50 0.6 21 Y Y N Y 5 0.1 4 0.0 0 5.2 3.6 0.9 0.6
Mining currently occurring within the permit boundary will continue into the near and far future.
Fish salvage and exclusion is planned for the sediment ponds.
No fish/aquatic habitat mitigation is planned.
From a regional water quality management perspective, there is no planned mitigation.
Transmission Creek 10.2 10.2 021% Surface and
CoalN 0.0 0 0.0 0 N N N N 0 3.7 36 0.0 0 3.2 3.6 1.3 0.4 NA
No fish/aquatic habitat mitigation is planned.
From a regional water quality management perspective, there is no planned mitigation.
Hosmer Creek (including Mine
Creek)33.1 33.1 0
26% Coal, 34% Surface and Coal
N 0.0 0 0.0 0 N N N N 0 5.6 17 0.0 0 3.5 3.1 1.6 0.6 NA
No fish/aquatic habitat mitigation is planned.
From a regional water quality management perspective, there is no planned mitigation.
NA - Not Applicable
Ro
ad D
ensi
ty p
er k
m2
Str
eam
Cro
ssin
gs
per
km
Ro
ads
Wit
hin
100
m o
f a
Str
eam
% R
oad
s o
n S
lop
es G
reat
er t
han
60%
Total Footprint Area Currently
Disturbed(excludes
reclaimed lands)Reclaimed Land Area
Eq
uiv
alen
t C
lear
cut
Are
a w
ith
in
Cat
chm
ent
Are
a fr
om
201
1 to
201
5 (k
m2)
Pit
(s)
(yes
/no
)
Was
te R
ock
Sto
rag
e (y
es/n
o)
Eq
uiv
alen
t C
lear
cut
Are
a w
ith
in
Cat
chm
ent
Are
a fr
om
195
5-20
10 (
%)
Ro
ck D
rain
(s)
(yes
/no
)
Ch
ann
el R
e-al
ign
men
t o
r D
iver
sio
n
(yes
/no
)
Eq
uiv
alen
t C
lear
cut
Are
a w
ith
in
Cat
chm
ent
Are
a fr
om
201
1 to
201
5 (%
)
Forestry Disturbances in Catchment
TributaryName
Stressors Mine Alterations/Disturbances/Planned Mitigation
Mine-Related Disturbances in Catchment as of September 2015
Additional Planned Near/Far Future Mining Disturbances Planned Mitigation/Fish Habitat OffsettingT
imin
g o
f D
istu
rban
ce:
His
tori
cal (
H),
Cu
rren
t (C
), N
ear
Fu
ture
(N
F),
Far
Fu
ture
(F
F)
or
No
t E
xpec
ted
(N
)
Catchment Area
To
tal C
atch
men
t A
rea
fro
m P
rovi
nci
al C
orp
ora
te
Wat
ersh
ed B
ase
Dat
aset
(km
2)
(198
0s p
lus
up
dat
es)
To
tal C
atch
men
t A
rea
as o
f S
epte
mb
er 2
015
(km
2)
% C
han
ge
in T
ota
l Cat
chm
ent
Are
a
Tec
k O
wn
ersh
ip R
igh
ts:
% o
f C
atch
men
t A
rea
and
Typ
e (C
oal
, Su
rfac
e, T
imb
er)
Road Disturbances in Catchment
Set
tlem
ent
Po
nd
s/C
atch
Bas
ins
(nu
mb
er)
Eq
uiv
alen
t C
lear
cut
Are
a w
ith
in
Cat
chm
ent
Are
a fr
om
195
5-20
10 (
km2)
118
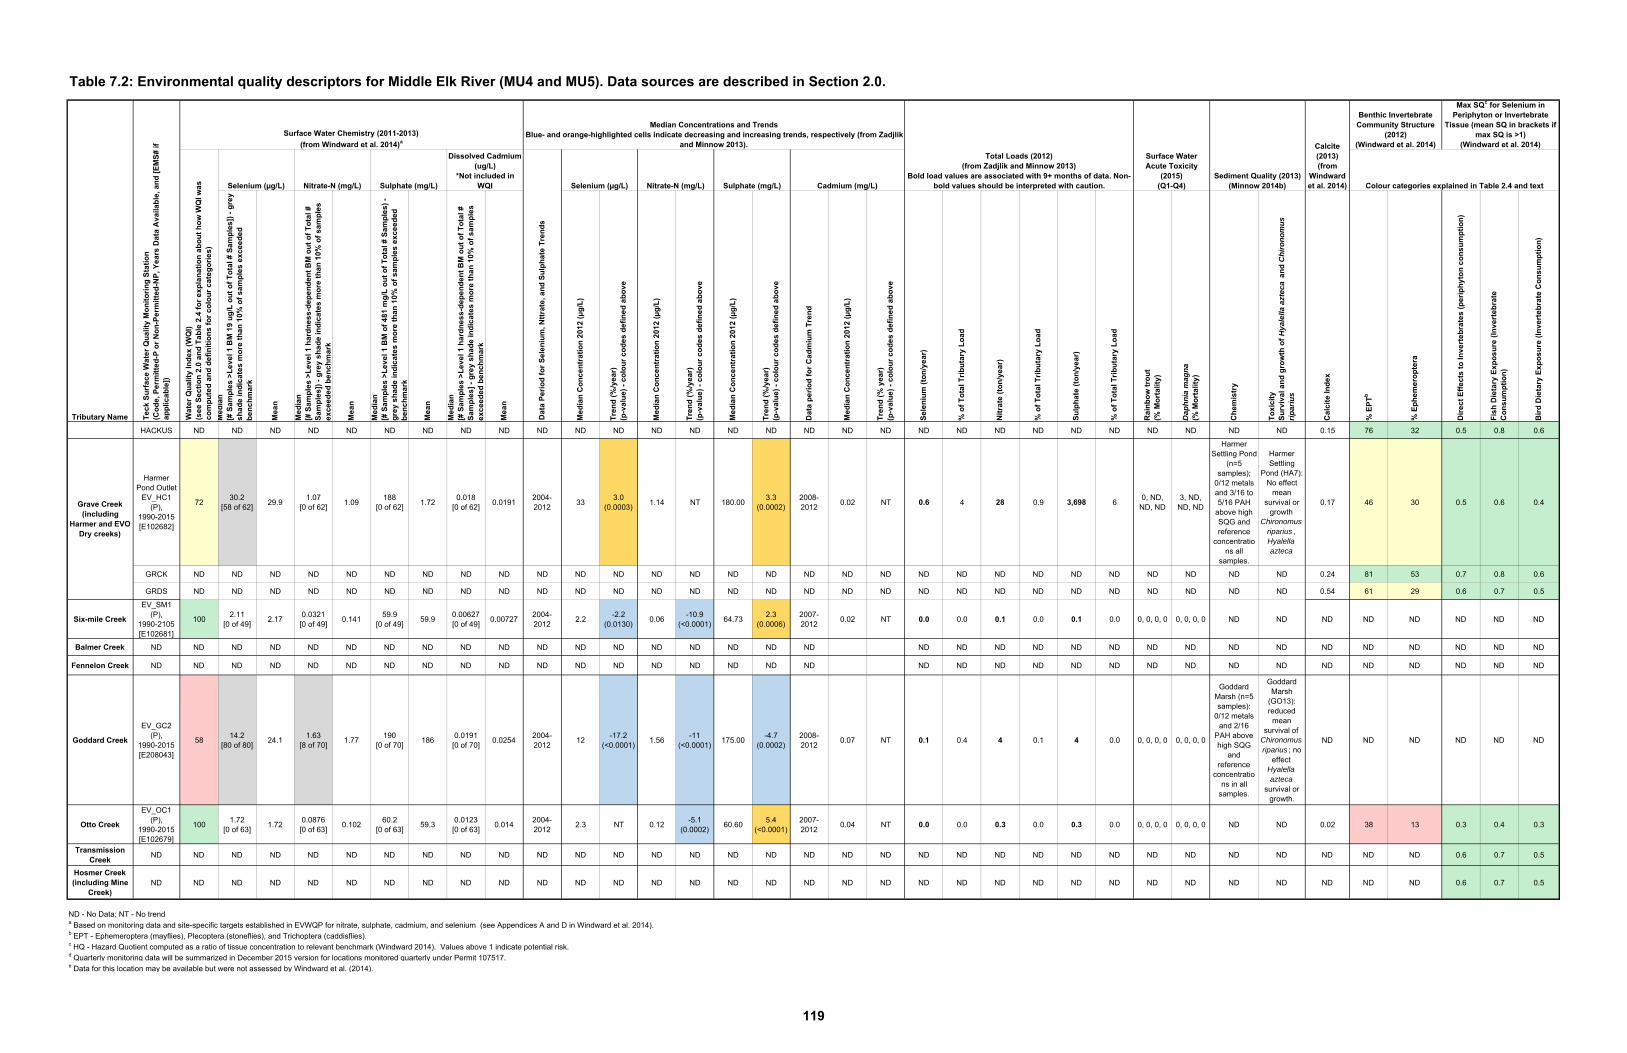
Table 7.2: Environmental quality descriptors for Middle Elk River (MU4 and MU5). Data sources are described in Section 2.0.
Me
dia
n
[# S
am
ple
s >
Le
ve
l 1 B
M 1
9 u
g/L
ou
t o
f T
ota
l # S
am
ple
s])
- g
rey
s
ha
de
ind
ica
tes
mo
re t
ha
n 1
0%
of
sa
mp
les
ex
ce
ed
ed
b
en
ch
ma
rk
Me
an
Me
dia
n[#
Sa
mp
les
>L
ev
el 1
ha
rdn
es
s-d
ep
en
de
nt
BM
ou
t o
f T
ota
l #
Sa
mp
les
]) -
gre
y s
ha
de
ind
ica
tes
mo
re t
ha
n 1
0%
of
sa
mp
les
e
xc
ee
de
d b
en
ch
ma
rk
Me
an
Me
dia
n[#
Sa
mp
les
>L
ev
el 1
BM
of
48
1 m
g/L
ou
t o
f T
ota
l # S
am
ple
s)
- g
rey
sh
ad
e in
dic
ate
s m
ore
th
an
10
% o
f s
am
ple
s e
xc
ee
de
d
be
nc
hm
ark
Me
an
Me
dia
n
[# S
am
ple
s >
Le
ve
l 1 h
ard
ne
ss
-de
pe
nd
en
t B
M o
ut
of
To
tal #
S
am
ple
s]
- g
rey
sh
ad
e in
dic
ate
s m
ore
th
an
10
% o
f s
am
ple
s
ex
ce
ed
ed
be
nc
hm
ark
Me
an
Me
dia
n C
on
ce
ntr
ati
on
20
12
(µ
g/L
)
Tre
nd
(%
/ye
ar)
(p-v
alu
e)
- c
olo
ur
co
de
s d
efi
ne
d a
bo
ve
Me
dia
n C
on
ce
ntr
ati
on
20
12
(µ
g/L
)
Tre
nd
(%
/ye
ar)
(p-v
alu
e)
- c
olo
ur
co
de
s d
efi
ne
d a
bo
ve
Me
dia
n C
on
ce
ntr
ati
on
20
12
(µ
g/L
)
Tre
nd
(%
/ye
ar)
(p-v
alu
e)
- c
olo
ur
co
de
s d
efi
ne
d a
bo
ve
Da
ta p
eri
od
fo
r C
ad
miu
m T
ren
d
Me
dia
n C
on
ce
ntr
ati
on
20
12
(µ
g/L
)
Tre
nd
(%
ye
ar)
(p-v
alu
e)
- c
olo
ur
co
de
s d
efi
ne
d a
bo
ve
Se
len
ium
(to
n/y
ea
r)
% o
f T
ota
l Tri
bu
tary
Lo
ad
Nit
rate
(to
n/y
ea
r)
% o
f T
ota
l Tri
bu
tary
Lo
ad
Su
lph
ate
(to
n/y
ea
r)
% o
f T
ota
l Tri
bu
tary
Lo
ad
Ra
inb
ow
tro
ut
(% M
ort
alit
y)
Dap
hnia
mag
na(%
Mo
rta
lity
)
Ch
em
istr
y
To
xic
ity
Su
rviv
al a
nd
gro
wth
of
Hya
lella
azt
eca
an
d C
hiro
nom
us
ripar
ius
Ca
lcit
e In
de
x
% E
PT
b
% E
ph
em
ero
pte
ra
Dir
ec
t E
ffe
cts
to
Inv
ert
eb
rate
s (
pe
rip
hy
ton
co
ns
um
pti
on
)
Fis
h D
ieta
ry E
xp
os
ure
(In
ve
rte
bra
teC
on
su
mp
tio
n)
Bir
d D
ieta
ry E
xp
os
ure
(In
ve
rte
bra
te C
on
su
mp
tio
n)
HACKUS ND ND ND ND ND ND ND ND ND ND ND ND ND ND ND ND ND ND ND ND ND ND ND ND ND ND ND ND ND 0.15 76 32 0.5 0.8 0.6
Harmer Pond Outlet
EV_HC1(P),
1990-2015[E102682]
7230.2
[58 of 62]29.9
1.07[0 of 62]
1.09188
[0 of 62]1.72
0.018[0 of 62]
0.01912004-2012
333.0
(0.0003)1.14 NT 180.00
3.3(0.0002)
2008-2012
0.02 NT 0.6 4 28 0.9 3,698 60, ND,
ND, ND3, ND,
ND, ND
Harmer Settling Pond
(n=5 samples);
0/12 metals and 3/16 to 5/16 PAH
above high SQG and reference
concentrations all
samples.
Harmer Settling
Pond (HA7): No effect
mean survival or
growth Chironomus
riparius , Hyalella azteca
0.17 46 30 0.5 0.6 0.4
GRCK ND ND ND ND ND ND ND ND ND ND ND ND ND ND ND ND ND ND ND ND ND ND ND ND ND ND ND ND ND 0.24 81 53 0.7 0.8 0.6
GRDS ND ND ND ND ND ND ND ND ND ND ND ND ND ND ND ND ND ND ND ND ND ND ND ND ND ND ND ND ND 0.54 61 29 0.6 0.7 0.5
Six-mile Creek
EV_SM1(P),
1990-2105[E102681]
1002.11
[0 of 49]2.17
0.0321[0 of 49]
0.14159.9
[0 of 49]59.9
0.00627[0 of 49]
0.007272004-2012
2.2-2.2
(0.0130)0.06
-10.9(<0.0001)
64.732.3
(0.0006)2007-2012
0.02 NT 0.0 0.0 0.1 0.0 0.1 0.0 0, 0, 0, 0 0, 0, 0, 0 ND ND ND ND ND ND ND ND
Balmer Creek ND ND ND ND ND ND ND ND ND ND ND ND ND ND ND ND ND ND ND ND ND ND ND ND ND ND ND ND ND ND ND ND ND ND
Fennelon Creek ND ND ND ND ND ND ND ND ND ND ND ND ND ND ND ND ND ND ND ND ND ND ND ND ND ND ND ND ND ND ND ND ND ND
Goddard Creek
EV_GC2(P),
1990-2015[E208043]
5814.2
[80 of 80]24.1
1.63[8 of 70]
1.77190
[0 of 70]186
0.0191[0 of 70]
0.02542004-2012
12-17.2
(<0.0001)1.56
-11(<0.0001)
175.00-4.7
(0.0002)2008-2012
0.07 NT 0.1 0.4 4 0.1 4 0.0 0, 0, 0, 0 0, 0, 0, 0
Goddard Marsh (n=5 samples):
0/12 metals and 2/16
PAH above high SQG
and reference
concentrations in all
samples.
Goddard Marsh
(GO13): reduced
meansurvival of
Chironomus riparius ; no
effect Hyalella azteca
survival or growth.
ND ND ND ND ND ND
Otto Creek
EV_OC1(P),
1990-2015[E102679]
1001.72
[0 of 63]1.72
0.0876[0 of 63]
0.10260.2
[0 of 63]59.3
0.0123[0 of 63]
0.0142004-2012
2.3 NT 0.12-5.1
(0.0002)60.60
5.4(<0.0001)
2007-2012
0.04 NT 0.0 0.0 0.3 0.0 0.3 0.0 0, 0, 0, 0 0, 0, 0, 0 ND ND 0.02 38 13 0.3 0.4 0.3
Transmission Creek
ND ND ND ND ND ND ND ND ND ND ND ND ND ND ND ND ND ND ND ND ND ND ND ND ND ND ND ND ND ND ND ND ND 0.6 0.7 0.5
Hosmer Creek (including Mine
Creek)ND ND ND ND ND ND ND ND ND ND ND ND ND ND ND ND ND ND ND ND ND ND ND ND ND ND ND ND ND ND ND ND ND 0.6 0.7 0.5
ND - No Data; NT - No trenda Based on monitoring data and site-specific targets established in EVWQP for nitrate, sulphate, cadmium, and selenium (see Appendices A and D in Windward et al. 2014). b EPT - Ephemeroptera (mayflies), Plecoptera (stoneflies), and Trichoptera (caddisflies).c HQ - Hazard Quotient computed as a ratio of tissue concentration to relevant benchmark (Windward 2014). Values above 1 indicate potential risk.d Quarterly monitoring data will be summarized in December 2015 version for locations monitored quarterly under Permit 107517.e Data for this location may be available but were not assessed by Windward et al. (2014).
Dissolved Cadmium (ug/L)
*Not included in WQI Colour categories explained in Table 2.4 and text
Sediment Quality (2013)(Minnow 2014b)
Calcite(2013)(from
Windward et al. 2014)
Benthic InvertebrateCommunity Structure
(2012)(Windward et al. 2014)
Max SQc for Selenium in Periphyton or Invertebrate
Tissue (mean SQ in brackets if max SQ is >1)
(Windward et al. 2014)
Grave Creek (including
Harmer and EVO Dry creeks)
Total Loads (2012)(from Zadjlik and Minnow 2013)
Bold load values are associated with 9+ months of data. Non-bold values should be interpreted with caution.
Surface Water Acute Toxicity
(2015)(Q1-Q4)Selenium (µg/L) Nitrate-N (mg/L) Sulphate (mg/L) Cadmium (mg/L)
Da
ta P
eri
od
fo
r S
ele
niu
m, N
ttra
te, a
nd
Su
lph
ate
Tre
nd
s
Tributary Name Te
ck
Su
rfa
ce
Wa
ter
Qu
alit
y M
on
ito
rin
g S
tati
on
(Co
de
, Pe
rmit
ted
-P o
r N
on
-Pe
rmit
ted
-NP
, Ye
ars
Da
ta A
va
ilab
le, a
nd
[E
MS
# if
a
pp
lica
ble
])
Surface Water Chemistry (2011-2013)
(from Windward et al. 2014)a
Median Concentrations and TrendsBlue- and orange-highlighted cells indicate decreasing and increasing trends, respectively (from Zadjlik
and Minnow 2013).
Wa
ter
Qu
alit
y In
de
x (
WQ
I)(s
ee
Se
cti
on
2.0
an
d T
ab
le 2
.4 f
or
ex
pla
na
tio
n a
bo
ut
ho
w W
QI w
as
c
om
pu
ted
an
d d
efi
nit
ion
s f
or
co
lou
r c
ate
go
rie
s)
Selenium (µg/L) Nitrate-N (mg/L) Sulphate (mg/L)
119
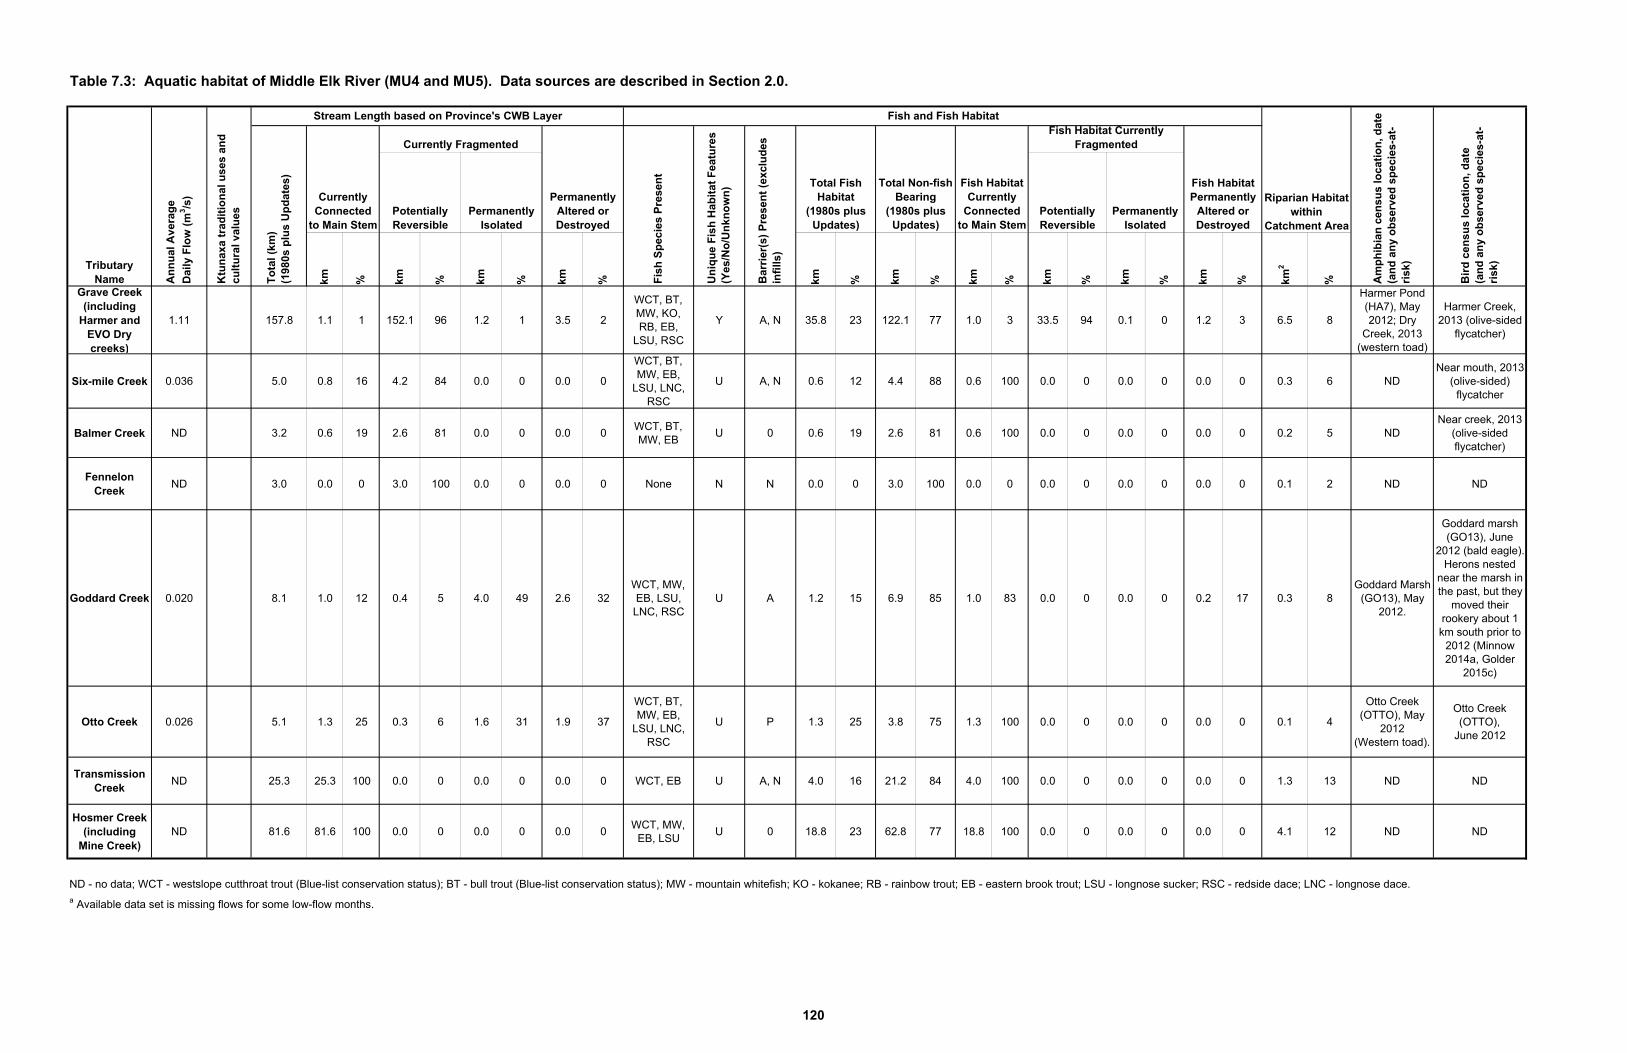
Table 7.3: Aquatic habitat of Middle Elk River (MU4 and MU5). Data sources are described in Section 2.0.
km % km % km
% km % km % km % km % km % km % km % km2
%
Grave Creek (including
Harmer and EVO Dry creeks)
1.11 157.8 1.1 1 152.1 96 1.2 1 3.5 2
WCT, BT, MW, KO, RB, EB,
LSU, RSC
Y A, N 35.8 23 122.1 77 1.0 3 33.5 94 0.1 0 1.2 3 6.5 8
Harmer Pond (HA7), May 2012; Dry
Creek, 2013 (western toad)
Harmer Creek, 2013 (olive-sided
flycatcher)
Six-mile Creek 0.036 5.0 0.8 16 4.2 84 0.0 0 0.0 0
WCT, BT, MW, EB,
LSU, LNC, RSC
U A, N 0.6 12 4.4 88 0.6 100 0.0 0 0.0 0 0.0 0 0.3 6 NDNear mouth, 2013
(olive-sided) flycatcher
Balmer Creek ND 3.2 0.6 19 2.6 81 0.0 0 0.0 0WCT, BT, MW, EB
U 0 0.6 19 2.6 81 0.6 100 0.0 0 0.0 0 0.0 0 0.2 5 NDNear creek, 2013
(olive-sided flycatcher)
Fennelon Creek
ND 3.0 0.0 0 3.0 100 0.0 0 0.0 0 None N N 0.0 0 3.0 100 0.0 0 0.0 0 0.0 0 0.0 0 0.1 2 ND ND
Goddard Creek 0.020 8.1 1.0 12 0.4 5 4.0 49 2.6 32WCT, MW, EB, LSU, LNC, RSC
U A 1.2 15 6.9 85 1.0 83 0.0 0 0.0 0 0.2 17 0.3 8Goddard Marsh
(GO13), May 2012.
Goddard marsh (GO13), June
2012 (bald eagle). Herons nested
near the marsh in the past, but they
moved their rookery about 1 km south prior to
2012 (Minnow 2014a, Golder
2015c)
Otto Creek 0.026 5.1 1.3 25 0.3 6 1.6 31 1.9 37
WCT, BT, MW, EB,
LSU, LNC, RSC
U P 1.3 25 3.8 75 1.3 100 0.0 0 0.0 0 0.0 0 0.1 4
Otto Creek (OTTO), May
2012(Western toad).
Otto Creek(OTTO),
June 2012
Transmission Creek
ND 25.3 25.3 100 0.0 0 0.0 0 0.0 0 WCT, EB U A, N 4.0 16 21.2 84 4.0 100 0.0 0 0.0 0 0.0 0 1.3 13 ND ND
Hosmer Creek (including
Mine Creek)ND 81.6 81.6 100 0.0 0 0.0 0 0.0 0
WCT, MW, EB, LSU
U 0 18.8 23 62.8 77 18.8 100 0.0 0 0.0 0 0.0 0 4.1 12 ND ND
ND - no data; WCT - westslope cutthroat trout (Blue-list conservation status); BT - bull trout (Blue-list conservation status); MW - mountain whitefish; KO - kokanee; RB - rainbow trout; EB - eastern brook trout; LSU - longnose sucker; RSC - redside dace; LNC - longnose dace. a Available data set is missing flows for some low-flow months.
Am
ph
ibia
n c
ensu
s lo
cati
on
, dat
e (a
nd
an
y o
bse
rved
sp
ecie
s-at
-ri
sk)
Bir
d c
ensu
s lo
cati
on
, dat
e(a
nd
an
y o
bse
rved
sp
ecie
s-at
-ri
sk)Tributary
Name An
nu
al A
vera
ge
Dai
ly F
low
(m
3/s
)
Ktu
nax
a tr
adit
ion
al u
ses
and
cu
ltu
ral v
alu
es
Stream Length based on Province's CWB Layer Fish and Fish Habitat
Riparian Habitat within
Catchment Area
To
tal (
km)
(198
0s p
lus
Up
dat
es)
Currently Connected
to Main Stem
Currently Fragmented
Permanently Altered or Destroyed
Fis
h S
pec
ies
Pre
sen
t
Un
iqu
e F
ish
Hab
itat
Fea
ture
s (Y
es/N
o/U
nkn
ow
n) Fish Habitat
Permanently Altered or Destroyed
Potentially Reversible
Permanently Isolated
Potentially Reversible
Permanently Isolated
Bar
rier
(s)
Pre
sen
t (e
xclu
des
in
fills
)
Total Fish Habitat
(1980s plus Updates)
Total Non-fish Bearing
(1980s plus Updates)
Fish Habitat Currently
Connected to Main Stem
Fish Habitat Currently Fragmented
120
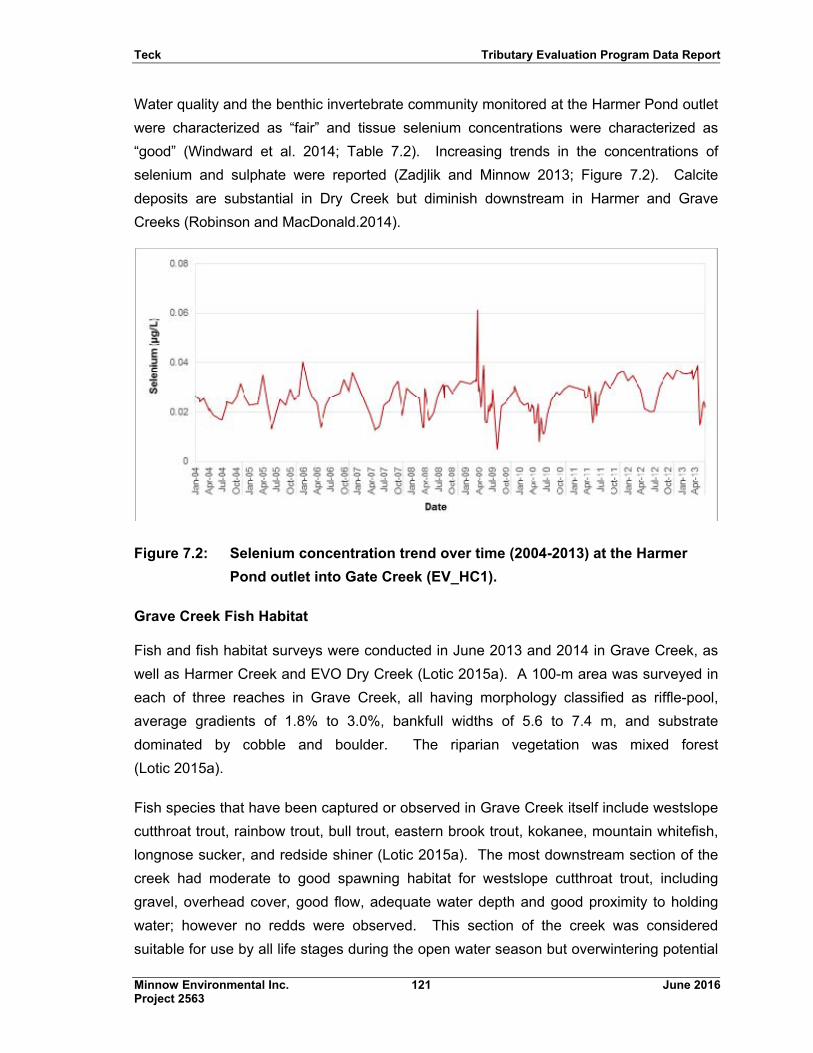
Teck Tributary Evaluation Program Data Report
Minnow Environmental Inc. 121 June 2016 Project 2563
Water quality and the benthic invertebrate community monitored at the Harmer Pond outlet
were characterized as “fair” and tissue selenium concentrations were characterized as
“good” (Windward et al. 2014; Table 7.2). Increasing trends in the concentrations of
selenium and sulphate were reported (Zadjlik and Minnow 2013; Figure 7.2). Calcite
deposits are substantial in Dry Creek but diminish downstream in Harmer and Grave
Creeks (Robinson and MacDonald.2014).
Figure 7.2: Selenium concentration trend over time (2004-2013) at the Harmer
Pond outlet into Gate Creek (EV_HC1).
Grave Creek Fish Habitat
Fish and fish habitat surveys were conducted in June 2013 and 2014 in Grave Creek, as
well as Harmer Creek and EVO Dry Creek (Lotic 2015a). A 100-m area was surveyed in
each of three reaches in Grave Creek, all having morphology classified as riffle-pool,
average gradients of 1.8% to 3.0%, bankfull widths of 5.6 to 7.4 m, and substrate
dominated by cobble and boulder. The riparian vegetation was mixed forest
(Lotic 2015a).
Fish species that have been captured or observed in Grave Creek itself include westslope
cutthroat trout, rainbow trout, bull trout, eastern brook trout, kokanee, mountain whitefish,
longnose sucker, and redside shiner (Lotic 2015a). The most downstream section of the
creek had moderate to good spawning habitat for westslope cutthroat trout, including
gravel, overhead cover, good flow, adequate water depth and good proximity to holding
water; however no redds were observed. This section of the creek was considered
suitable for use by all life stages during the open water season but overwintering potential
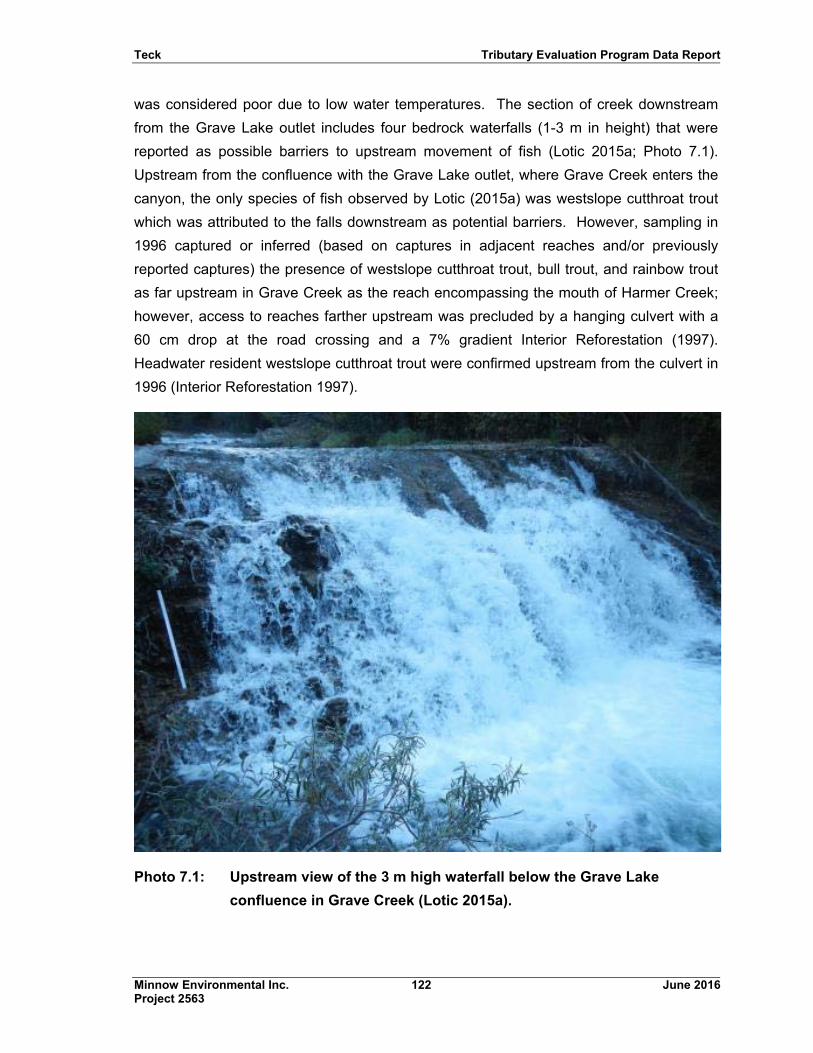
Teck Tributary Evaluation Program Data Report
Minnow Environmental Inc. 122 June 2016 Project 2563
was considered poor due to low water temperatures. The section of creek downstream
from the Grave Lake outlet includes four bedrock waterfalls (1-3 m in height) that were
reported as possible barriers to upstream movement of fish (Lotic 2015a; Photo 7.1).
Upstream from the confluence with the Grave Lake outlet, where Grave Creek enters the
canyon, the only species of fish observed by Lotic (2015a) was westslope cutthroat trout
which was attributed to the falls downstream as potential barriers. However, sampling in
1996 captured or inferred (based on captures in adjacent reaches and/or previously
reported captures) the presence of westslope cutthroat trout, bull trout, and rainbow trout
as far upstream in Grave Creek as the reach encompassing the mouth of Harmer Creek;
however, access to reaches farther upstream was precluded by a hanging culvert with a
60 cm drop at the road crossing and a 7% gradient Interior Reforestation (1997).
Headwater resident westslope cutthroat trout were confirmed upstream from the culvert in
1996 (Interior Reforestation 1997).
Photo 7.1: Upstream view of the 3 m high waterfall below the Grave Lake
confluence in Grave Creek (Lotic 2015a).
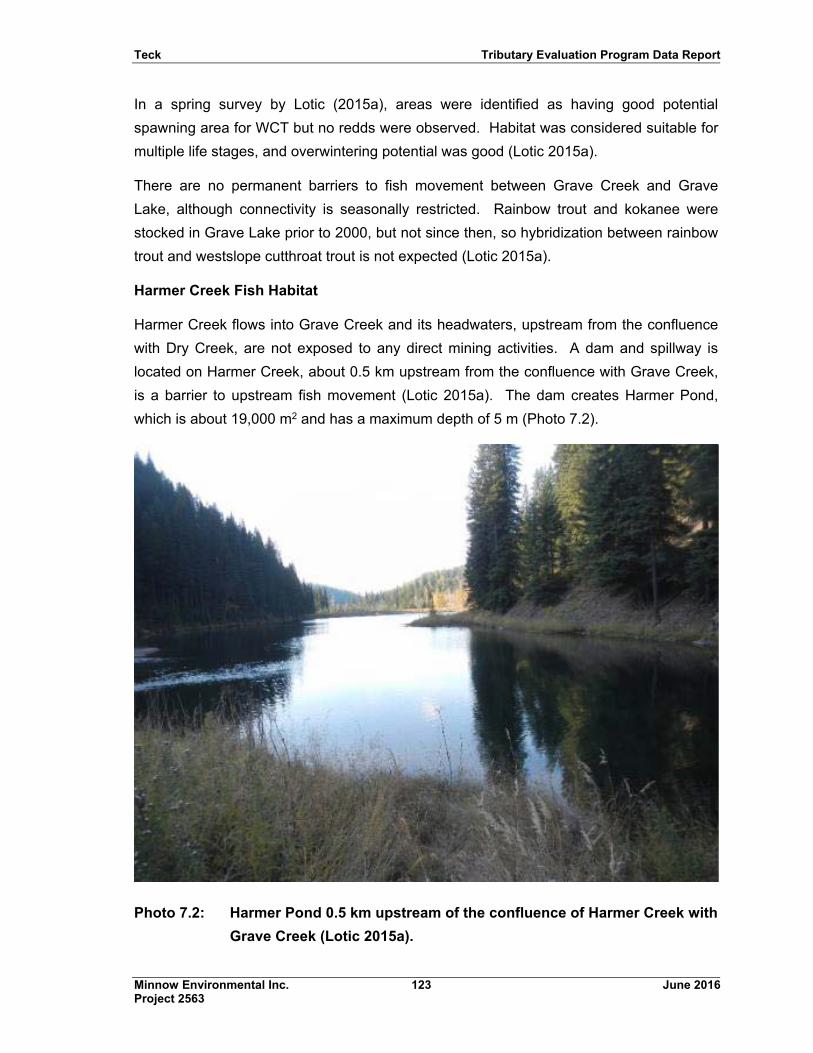
Teck Tributary Evaluation Program Data Report
Minnow Environmental Inc. 123 June 2016 Project 2563
In a spring survey by Lotic (2015a), areas were identified as having good potential
spawning area for WCT but no redds were observed. Habitat was considered suitable for
multiple life stages, and overwintering potential was good (Lotic 2015a).
There are no permanent barriers to fish movement between Grave Creek and Grave
Lake, although connectivity is seasonally restricted. Rainbow trout and kokanee were
stocked in Grave Lake prior to 2000, but not since then, so hybridization between rainbow
trout and westslope cutthroat trout is not expected (Lotic 2015a).
Harmer Creek Fish Habitat
Harmer Creek flows into Grave Creek and its headwaters, upstream from the confluence
with Dry Creek, are not exposed to any direct mining activities. A dam and spillway is
located on Harmer Creek, about 0.5 km upstream from the confluence with Grave Creek,
is a barrier to upstream fish movement (Lotic 2015a). The dam creates Harmer Pond,
which is about 19,000 m2 and has a maximum depth of 5 m (Photo 7.2).
Photo 7.2: Harmer Pond 0.5 km upstream of the confluence of Harmer Creek with
Grave Creek (Lotic 2015a).
Teck Tributary Evaluation Program Data Report
Minnow Environmental Inc. 124 June 2016 Project 2563
Harmer Pond appears to provide habitat suitable to support all life stages of fish year-
round except for spawning, but no recent surveys have caught or observed any fish
(Lotic 2015a). Cutthroat trout have been captured in the creek upstream from the pond so
both the creek and pond are considered fish-bearing. Upstream from the pond to the
confluence with Dry Creek is habitat suitable for all life stages, with fair cover, good
overwintering potential, and confirmed spawning. However, use by fish might be limited
by warm summer temperatures. There are no barriers preventing access by trout to the
headwaters upstream of mining influence, where there is also diverse habitat for all life
stages, including potential spawning and overwintering habitats (Lotic 2015a).
No species at risk were observed in breeding amphibian and bird surveys completed at
Harmer Pond in 2012 (Minnow 2014a), but olive-sided flycatchers were observed near the
confluence of Harmer and Grave Creeks in 2013 (Golder 2015b) (Table 7.3). American
dippers were also observed near the confluence with EVO Dry Creek, as well as farther
downstream in Harmer Creek, and a Harlequin duck was observed at Harmer Pond
(Golder 2015b).
EVO Dry Creek Fish Habitat
The Dry Creek watershed has been directly influenced by mining, including the
construction of the Dry Creek Spoil (Lotic 2015a). Sampling has been minimal due to
safety concerns with the proximity of the spoil runout zone. Extensive calcite deposition
has occurred all reaches of the creek, with evidence that calcite terracing has altered
stream direction into forested riparian areas at certain locations, and limiting aquatic
habitat in all reaches (Lotic 2015a). Although one cutthroat trout was captured in the
lower 120 m of the creek, habitat was considered minimal for all life stages. A constructed
settling pond (3,218 m2) was located upstream from this section of creek, and could be a
barrier to smaller fish migration. A 2008 survey reported catching cutthroat trout in the
pond (Lotic 2015a). Dry Creek continues upstream from the settling pond about 0.7 m to
a series of ponds, and then about one km farther to the runout of the Dry Creek Spoil.
Both sections were inferred to be fish bearing due to a lack of barrier, but no fish were
captured or observed during recent surveys (Lotic 2015a).
A Western toad was observed near EVO Dry Creek in 2013 (Golder 2015b).
7.2 Six-Mile Creek
About 8% of the total catchment area of Six-Mile Creek has been disturbed by mining
activities (Table 7.1). There are no additional mine disturbances planned for the near or
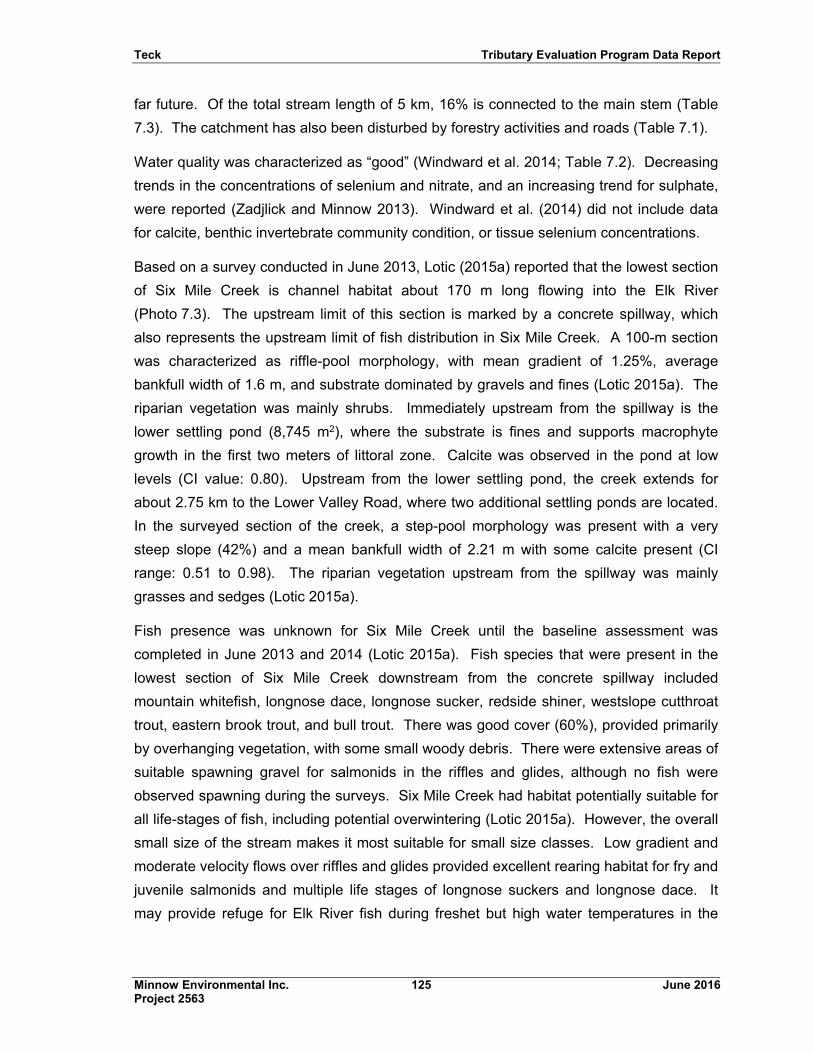
Teck Tributary Evaluation Program Data Report
Minnow Environmental Inc. 125 June 2016 Project 2563
far future. Of the total stream length of 5 km, 16% is connected to the main stem (Table
7.3). The catchment has also been disturbed by forestry activities and roads (Table 7.1).
Water quality was characterized as “good” (Windward et al. 2014; Table 7.2). Decreasing
trends in the concentrations of selenium and nitrate, and an increasing trend for sulphate,
were reported (Zadjlick and Minnow 2013). Windward et al. (2014) did not include data
for calcite, benthic invertebrate community condition, or tissue selenium concentrations.
Based on a survey conducted in June 2013, Lotic (2015a) reported that the lowest section
of Six Mile Creek is channel habitat about 170 m long flowing into the Elk River
(Photo 7.3). The upstream limit of this section is marked by a concrete spillway, which
also represents the upstream limit of fish distribution in Six Mile Creek. A 100-m section
was characterized as riffle-pool morphology, with mean gradient of 1.25%, average
bankfull width of 1.6 m, and substrate dominated by gravels and fines (Lotic 2015a). The
riparian vegetation was mainly shrubs. Immediately upstream from the spillway is the
lower settling pond (8,745 m2), where the substrate is fines and supports macrophyte
growth in the first two meters of littoral zone. Calcite was observed in the pond at low
levels (CI value: 0.80). Upstream from the lower settling pond, the creek extends for
about 2.75 km to the Lower Valley Road, where two additional settling ponds are located.
In the surveyed section of the creek, a step-pool morphology was present with a very
steep slope (42%) and a mean bankfull width of 2.21 m with some calcite present (CI
range: 0.51 to 0.98). The riparian vegetation upstream from the spillway was mainly
grasses and sedges (Lotic 2015a).
Fish presence was unknown for Six Mile Creek until the baseline assessment was
completed in June 2013 and 2014 (Lotic 2015a). Fish species that were present in the
lowest section of Six Mile Creek downstream from the concrete spillway included
mountain whitefish, longnose dace, longnose sucker, redside shiner, westslope cutthroat
trout, eastern brook trout, and bull trout. There was good cover (60%), provided primarily
by overhanging vegetation, with some small woody debris. There were extensive areas of
suitable spawning gravel for salmonids in the riffles and glides, although no fish were
observed spawning during the surveys. Six Mile Creek had habitat potentially suitable for
all life-stages of fish, including potential overwintering (Lotic 2015a). However, the overall
small size of the stream makes it most suitable for small size classes. Low gradient and
moderate velocity flows over riffles and glides provided excellent rearing habitat for fry and
juvenile salmonids and multiple life stages of longnose suckers and longnose dace. It
may provide refuge for Elk River fish during freshet but high water temperatures in the
Teck Tributary Evaluation Program Data Report
Minnow Environmental Inc. 126 June 2016 Project 2563
summer (>17.0°C) preclude use by salmonids at that time of year. No fish are present
upstream from the spillway (Lotic 2015a).
Photo 7.3: Channel habitat in lower Six-Mile Creek (Lotic 2015a).
An olive-sided flycatcher and spotted sandpiper were observed near the mouth of Six-Mile
Creek basin in 2013 (Golder 2015b).
7.3 Balmer Creek
About 24% of the total catchment area of Balmer Creek has been disturbed by mining
activities, but no additional mine disturbances are planned for the near or far future
(Table 7.1). Of the total stream length of 3.2 km, 19% is connected to the main stem
whereas the remainder is fragmented (Table 7.3). The catchment has also been
disturbed by forestry activities and roads (Table 7.1).
No data were available for water quality, benthic invertebrate community, tissue selenium
concentrations, or calcite (Table 7.2).
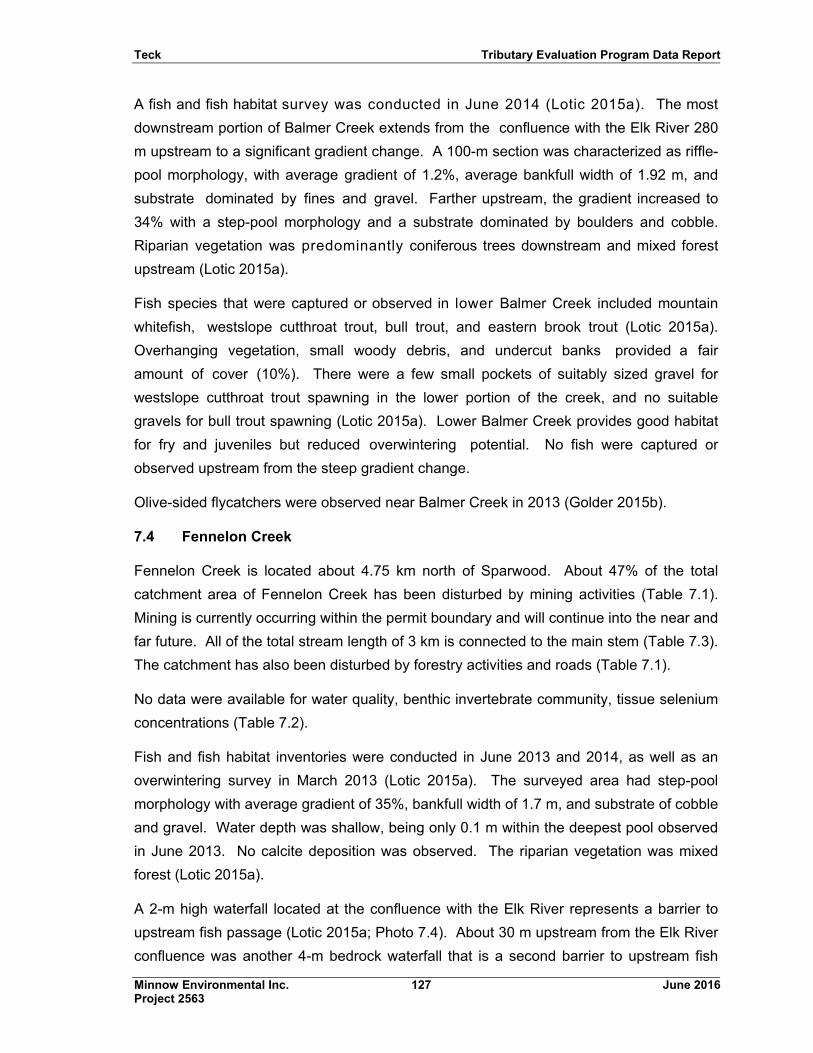
Teck Tributary Evaluation Program Data Report
Minnow Environmental Inc. 127 June 2016 Project 2563
A fish and fish habitat survey was conducted in June 2014 (Lotic 2015a). The most
downstream portion of Balmer Creek extends from the confluence with the Elk River 280
m upstream to a significant gradient change. A 100-m section was characterized as riffle-
pool morphology, with average gradient of 1.2%, average bankfull width of 1.92 m, and
substrate dominated by fines and gravel. Farther upstream, the gradient increased to
34% with a step-pool morphology and a substrate dominated by boulders and cobble.
Riparian vegetation was predominantly coniferous trees downstream and mixed forest
upstream (Lotic 2015a).
Fish species that were captured or observed in lower Balmer Creek included mountain
whitefish, westslope cutthroat trout, bull trout, and eastern brook trout (Lotic 2015a).
Overhanging vegetation, small woody debris, and undercut banks provided a fair
amount of cover (10%). There were a few small pockets of suitably sized gravel for
westslope cutthroat trout spawning in the lower portion of the creek, and no suitable
gravels for bull trout spawning (Lotic 2015a). Lower Balmer Creek provides good habitat
for fry and juveniles but reduced overwintering potential. No fish were captured or
observed upstream from the steep gradient change.
Olive-sided flycatchers were observed near Balmer Creek in 2013 (Golder 2015b).
7.4 Fennelon Creek
Fennelon Creek is located about 4.75 km north of Sparwood. About 47% of the total
catchment area of Fennelon Creek has been disturbed by mining activities (Table 7.1).
Mining is currently occurring within the permit boundary and will continue into the near and
far future. All of the total stream length of 3 km is connected to the main stem (Table 7.3).
The catchment has also been disturbed by forestry activities and roads (Table 7.1).
No data were available for water quality, benthic invertebrate community, tissue selenium
concentrations (Table 7.2).
Fish and fish habitat inventories were conducted in June 2013 and 2014, as well as an
overwintering survey in March 2013 (Lotic 2015a). The surveyed area had step-pool
morphology with average gradient of 35%, bankfull width of 1.7 m, and substrate of cobble
and gravel. Water depth was shallow, being only 0.1 m within the deepest pool observed
in June 2013. No calcite deposition was observed. The riparian vegetation was mixed
forest (Lotic 2015a).
A 2-m high waterfall located at the confluence with the Elk River represents a barrier to
upstream fish passage (Lotic 2015a; Photo 7.4). About 30 m upstream from the Elk River
confluence was another 4-m bedrock waterfall that is a second barrier to upstream fish
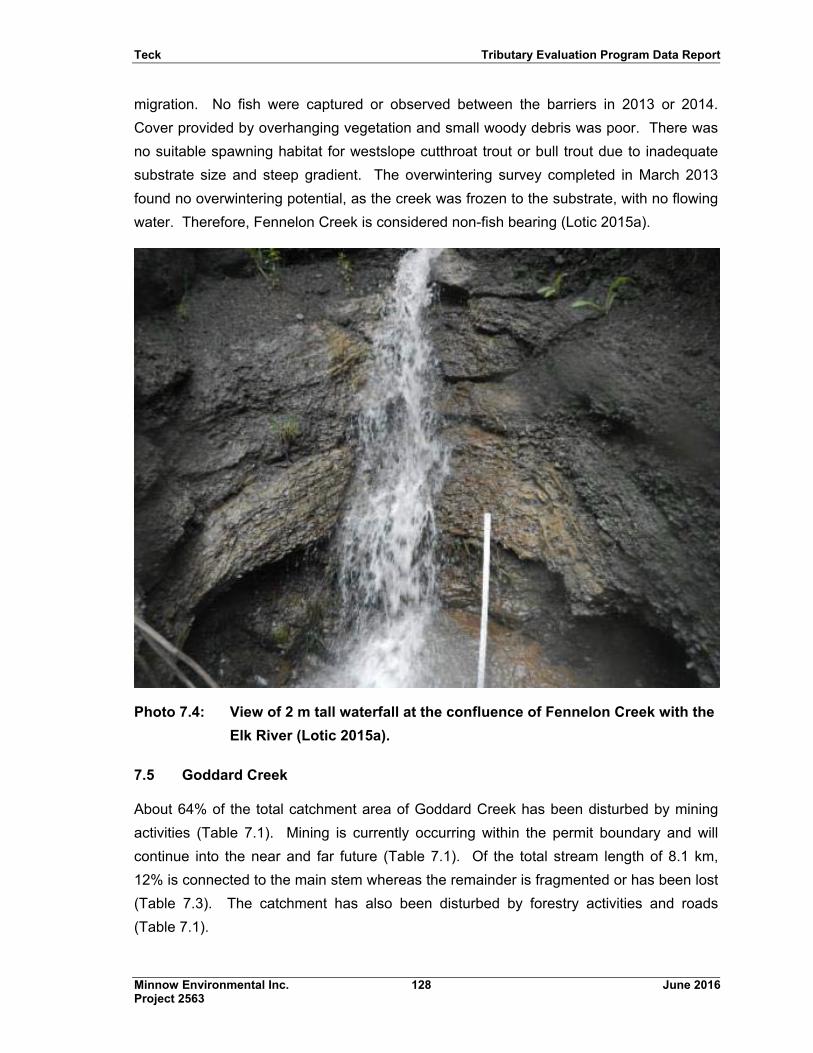
Teck Tributary Evaluation Program Data Report
Minnow Environmental Inc. 128 June 2016 Project 2563
migration. No fish were captured or observed between the barriers in 2013 or 2014.
Cover provided by overhanging vegetation and small woody debris was poor. There was
no suitable spawning habitat for westslope cutthroat trout or bull trout due to inadequate
substrate size and steep gradient. The overwintering survey completed in March 2013
found no overwintering potential, as the creek was frozen to the substrate, with no flowing
water. Therefore, Fennelon Creek is considered non-fish bearing (Lotic 2015a).
Photo 7.4: View of 2 m tall waterfall at the confluence of Fennelon Creek with the
Elk River (Lotic 2015a).
7.5 Goddard Creek
About 64% of the total catchment area of Goddard Creek has been disturbed by mining
activities (Table 7.1). Mining is currently occurring within the permit boundary and will
continue into the near and far future (Table 7.1). Of the total stream length of 8.1 km,
12% is connected to the main stem whereas the remainder is fragmented or has been lost
(Table 7.3). The catchment has also been disturbed by forestry activities and roads
(Table 7.1).
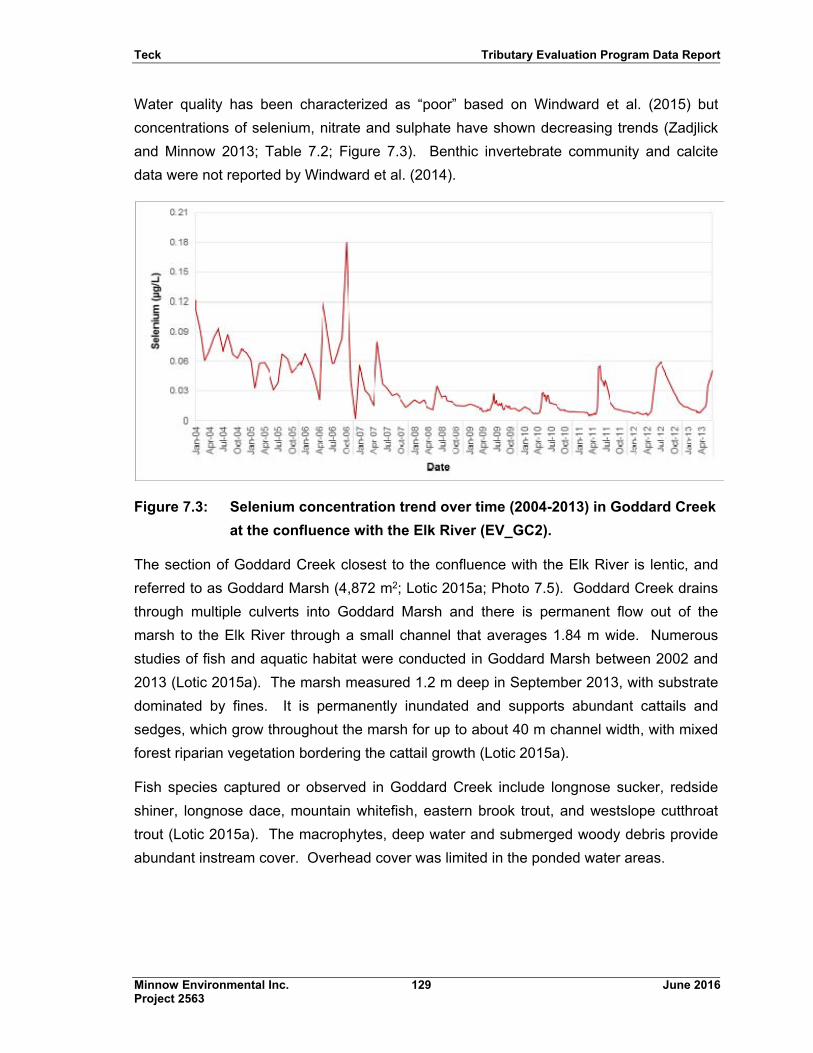
Teck Tributary Evaluation Program Data Report
Minnow Environmental Inc. 129 June 2016 Project 2563
Water quality has been characterized as “poor” based on Windward et al. (2015) but
concentrations of selenium, nitrate and sulphate have shown decreasing trends (Zadjlick
and Minnow 2013; Table 7.2; Figure 7.3). Benthic invertebrate community and calcite
data were not reported by Windward et al. (2014).
Figure 7.3: Selenium concentration trend over time (2004-2013) in Goddard Creek
at the confluence with the Elk River (EV_GC2).
The section of Goddard Creek closest to the confluence with the Elk River is lentic, and
referred to as Goddard Marsh (4,872 m2; Lotic 2015a; Photo 7.5). Goddard Creek drains
through multiple culverts into Goddard Marsh and there is permanent flow out of the
marsh to the Elk River through a small channel that averages 1.84 m wide. Numerous
studies of fish and aquatic habitat were conducted in Goddard Marsh between 2002 and
2013 (Lotic 2015a). The marsh measured 1.2 m deep in September 2013, with substrate
dominated by fines. It is permanently inundated and supports abundant cattails and
sedges, which grow throughout the marsh for up to about 40 m channel width, with mixed
forest riparian vegetation bordering the cattail growth (Lotic 2015a).
Fish species captured or observed in Goddard Creek include longnose sucker, redside
shiner, longnose dace, mountain whitefish, eastern brook trout, and westslope cutthroat
trout (Lotic 2015a). The macrophytes, deep water and submerged woody debris provide
abundant instream cover. Overhead cover was limited in the ponded water areas.
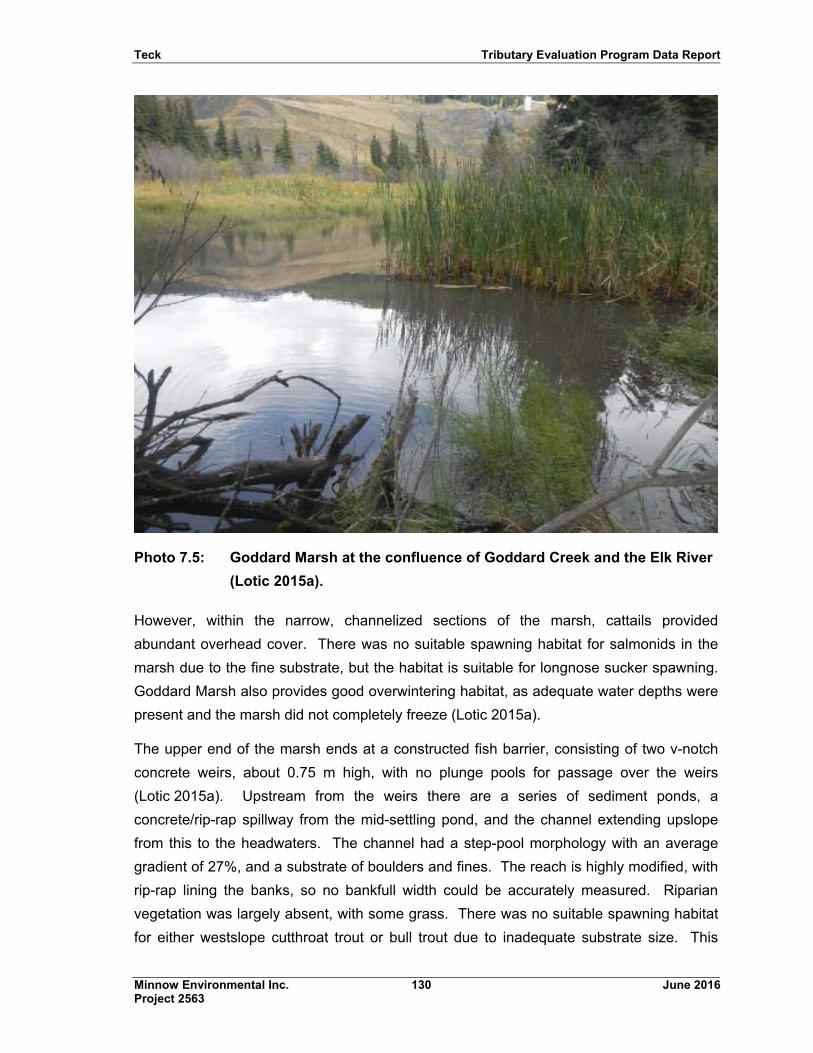
Teck Tributary Evaluation Program Data Report
Minnow Environmental Inc. 130 June 2016 Project 2563
Photo 7.5: Goddard Marsh at the confluence of Goddard Creek and the Elk River
(Lotic 2015a).
However, within the narrow, channelized sections of the marsh, cattails provided
abundant overhead cover. There was no suitable spawning habitat for salmonids in the
marsh due to the fine substrate, but the habitat is suitable for longnose sucker spawning.
Goddard Marsh also provides good overwintering habitat, as adequate water depths were
present and the marsh did not completely freeze (Lotic 2015a).
The upper end of the marsh ends at a constructed fish barrier, consisting of two v-notch
concrete weirs, about 0.75 m high, with no plunge pools for passage over the weirs
(Lotic 2015a). Upstream from the weirs there are a series of sediment ponds, a
concrete/rip-rap spillway from the mid-settling pond, and the channel extending upslope
from this to the headwaters. The channel had a step-pool morphology with an average
gradient of 27%, and a substrate of boulders and fines. The reach is highly modified, with
rip-rap lining the banks, so no bankfull width could be accurately measured. Riparian
vegetation was largely absent, with some grass. There was no suitable spawning habitat
for either westslope cutthroat trout or bull trout due to inadequate substrate size. This
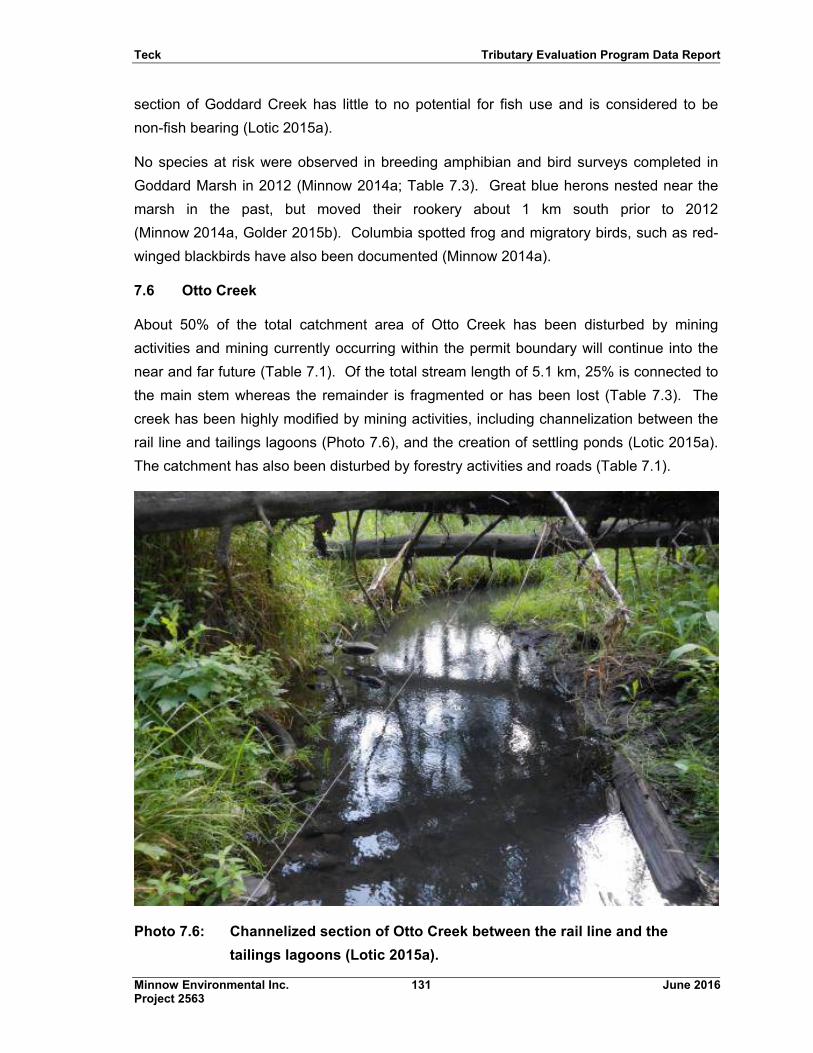
Teck Tributary Evaluation Program Data Report
Minnow Environmental Inc. 131 June 2016 Project 2563
section of Goddard Creek has little to no potential for fish use and is considered to be
non-fish bearing (Lotic 2015a).
No species at risk were observed in breeding amphibian and bird surveys completed in
Goddard Marsh in 2012 (Minnow 2014a; Table 7.3). Great blue herons nested near the
marsh in the past, but moved their rookery about 1 km south prior to 2012
(Minnow 2014a, Golder 2015b). Columbia spotted frog and migratory birds, such as red-
winged blackbirds have also been documented (Minnow 2014a).
7.6 Otto Creek
About 50% of the total catchment area of Otto Creek has been disturbed by mining
activities and mining currently occurring within the permit boundary will continue into the
near and far future (Table 7.1). Of the total stream length of 5.1 km, 25% is connected to
the main stem whereas the remainder is fragmented or has been lost (Table 7.3). The
creek has been highly modified by mining activities, including channelization between the
rail line and tailings lagoons (Photo 7.6), and the creation of settling ponds (Lotic 2015a).
The catchment has also been disturbed by forestry activities and roads (Table 7.1).
Photo 7.6: Channelized section of Otto Creek between the rail line and the
tailings lagoons (Lotic 2015a).
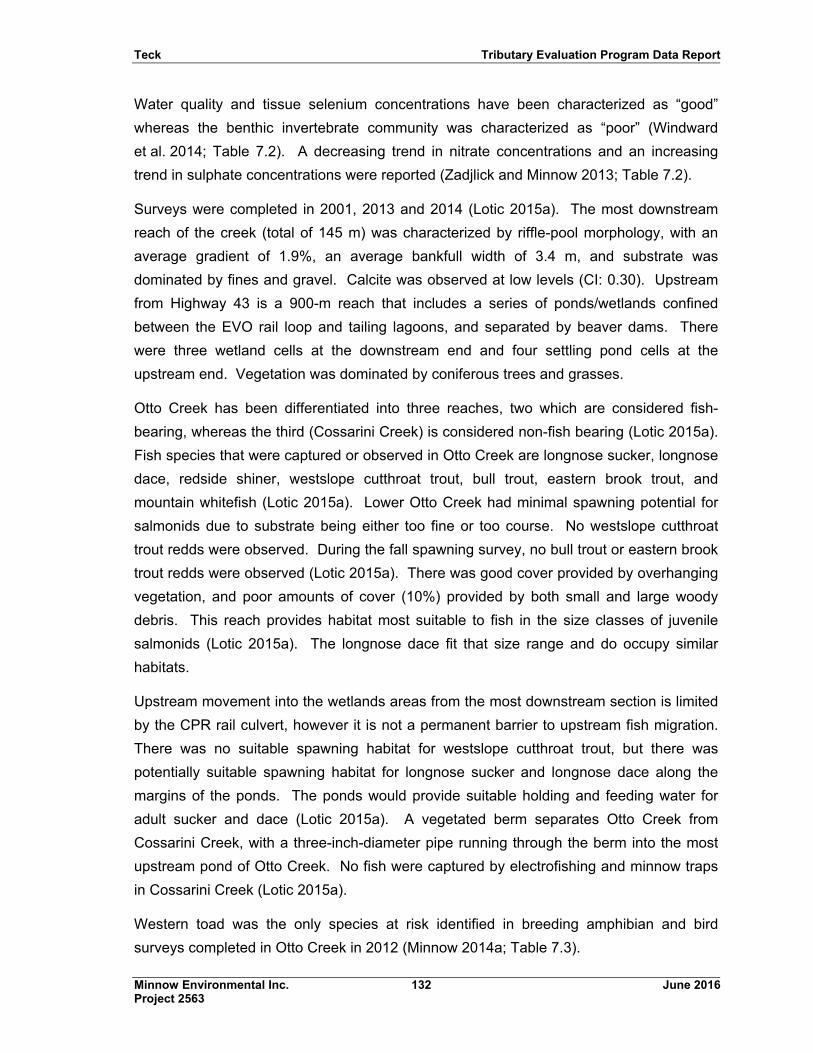
Teck Tributary Evaluation Program Data Report
Minnow Environmental Inc. 132 June 2016 Project 2563
Water quality and tissue selenium concentrations have been characterized as “good”
whereas the benthic invertebrate community was characterized as “poor” (Windward
et al. 2014; Table 7.2). A decreasing trend in nitrate concentrations and an increasing
trend in sulphate concentrations were reported (Zadjlick and Minnow 2013; Table 7.2).
Surveys were completed in 2001, 2013 and 2014 (Lotic 2015a). The most downstream
reach of the creek (total of 145 m) was characterized by riffle-pool morphology, with an
average gradient of 1.9%, an average bankfull width of 3.4 m, and substrate was
dominated by fines and gravel. Calcite was observed at low levels (CI: 0.30). Upstream
from Highway 43 is a 900-m reach that includes a series of ponds/wetlands confined
between the EVO rail loop and tailing lagoons, and separated by beaver dams. There
were three wetland cells at the downstream end and four settling pond cells at the
upstream end. Vegetation was dominated by coniferous trees and grasses.
Otto Creek has been differentiated into three reaches, two which are considered fish-
bearing, whereas the third (Cossarini Creek) is considered non-fish bearing (Lotic 2015a).
Fish species that were captured or observed in Otto Creek are longnose sucker, longnose
dace, redside shiner, westslope cutthroat trout, bull trout, eastern brook trout, and
mountain whitefish (Lotic 2015a). Lower Otto Creek had minimal spawning potential for
salmonids due to substrate being either too fine or too course. No westslope cutthroat
trout redds were observed. During the fall spawning survey, no bull trout or eastern brook
trout redds were observed (Lotic 2015a). There was good cover provided by overhanging
vegetation, and poor amounts of cover (10%) provided by both small and large woody
debris. This reach provides habitat most suitable to fish in the size classes of juvenile
salmonids (Lotic 2015a). The longnose dace fit that size range and do occupy similar
habitats.
Upstream movement into the wetlands areas from the most downstream section is limited
by the CPR rail culvert, however it is not a permanent barrier to upstream fish migration.
There was no suitable spawning habitat for westslope cutthroat trout, but there was
potentially suitable spawning habitat for longnose sucker and longnose dace along the
margins of the ponds. The ponds would provide suitable holding and feeding water for
adult sucker and dace (Lotic 2015a). A vegetated berm separates Otto Creek from
Cossarini Creek, with a three-inch-diameter pipe running through the berm into the most
upstream pond of Otto Creek. No fish were captured by electrofishing and minnow traps
in Cossarini Creek (Lotic 2015a).
Western toad was the only species at risk identified in breeding amphibian and bird
surveys completed in Otto Creek in 2012 (Minnow 2014a; Table 7.3).
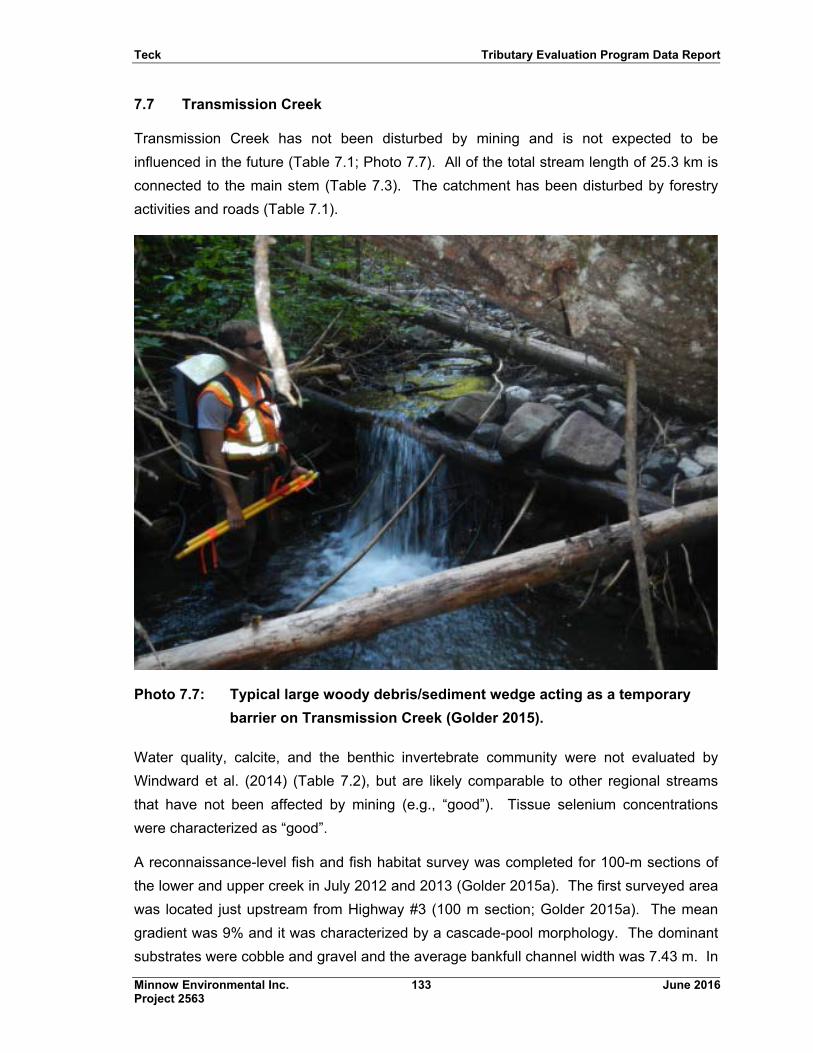
Teck Tributary Evaluation Program Data Report
Minnow Environmental Inc. 133 June 2016 Project 2563
7.7 Transmission Creek
Transmission Creek has not been disturbed by mining and is not expected to be
influenced in the future (Table 7.1; Photo 7.7). All of the total stream length of 25.3 km is
connected to the main stem (Table 7.3). The catchment has been disturbed by forestry
activities and roads (Table 7.1).
Photo 7.7: Typical large woody debris/sediment wedge acting as a temporary
barrier on Transmission Creek (Golder 2015).
Water quality, calcite, and the benthic invertebrate community were not evaluated by
Windward et al. (2014) (Table 7.2), but are likely comparable to other regional streams
that have not been affected by mining (e.g., “good”). Tissue selenium concentrations
were characterized as “good”.
A reconnaissance-level fish and fish habitat survey was completed for 100-m sections of
the lower and upper creek in July 2012 and 2013 (Golder 2015a). The first surveyed area
was located just upstream from Highway #3 (100 m section; Golder 2015a). The mean
gradient was 9% and it was characterized by a cascade-pool morphology. The dominant
substrates were cobble and gravel and the average bankfull channel width was 7.43 m. In
Teck Tributary Evaluation Program Data Report
Minnow Environmental Inc. 134 June 2016 Project 2563
the upstream section of the creek, the mean gradient was 24% and the reach was
characterized as step-pool morphology. Substrate was dominated by cobbles and
boulders with some gravel present as well (Golder 2015a).
Both westslope cutthroat trout and eastern brook trout have been captured or observed in
Transmission Creek (Golder 2015a). Only the downstream reach is fish-bearing.
Overhanging vegetation was the dominant instream cover with trace amounts of small
woody debris, boulders, and undercut banks. Both adult and juvenile trout were captured,
indicating that rearing, holding, and feeding habitat is present. Upstream from the first
survey location, the creek branches into the main branch and an unnamed tributary, both
of which are considered non-fish bearing due to a series of temporary and permanent
barriers to upstream migration (Golder 2015a; Photo 7.7). For example, over the first
460 m upstream from the first survey area were a series of woody debris and sediment
wedge features that created falls ranging from 0.7 to 1.8 m. In addition, a temporary
culvert barrier was noted, which had a 1.2-m outlet drop into a 0.2 m plunge pool and was
considered impassible to fish (Golder 2015a). The first feature considered to be a
permanent barrier to upstream fish migration was a 24% cascade, about 11 m long,
located 56 m upstream from the culvert and 420 m downstream from the confluence with
an unnamed tributary (Golder 2015a).
7.8 Mine Creek (Hosmer Creek)
Mine Creek has not been disturbed by mining and is not expected to be influenced in the
future (Table 7.1). Mine Creek is a major tributary to Hosmer Creek, located close to the
confluence of Hosmer Creek with the Elk River. All of the total stream length of 81.6 km is
connected to the main stem (Table 7.3). The catchment has been disturbed by forestry
activities and roads (Table 7.1).
Water quality, calcite, and the benthic invertebrate community were not evaluated by
Windward et al. (2014) (Table 7.2), but are likely comparable to other regional streams
that have not been affected by mining (e.g., “good”). Tissue selenium concentrations
were characterized as “good”.
Fish and fish habitat surveys were conducted in 2007, 2012, and 2013 (Golder 2015a).
This first surveyed section (85 m) of Mine Creek was lentic habitat located about 4 km
upstream from the confluence with Hosmer Creek (Golder 2015a; Photo 7.8). The area
was dominated by a series of pools and low flow glide areas, with a mean gradient of
only 0.3%. The dominant substrate was fines with some gravel, and the average bankfull
width was 3.20 m. A culvert was noted within the site. A second surveyed area (100 m)
was located 6.6 km upstream from the confluence with Hosmer Creek. This section was
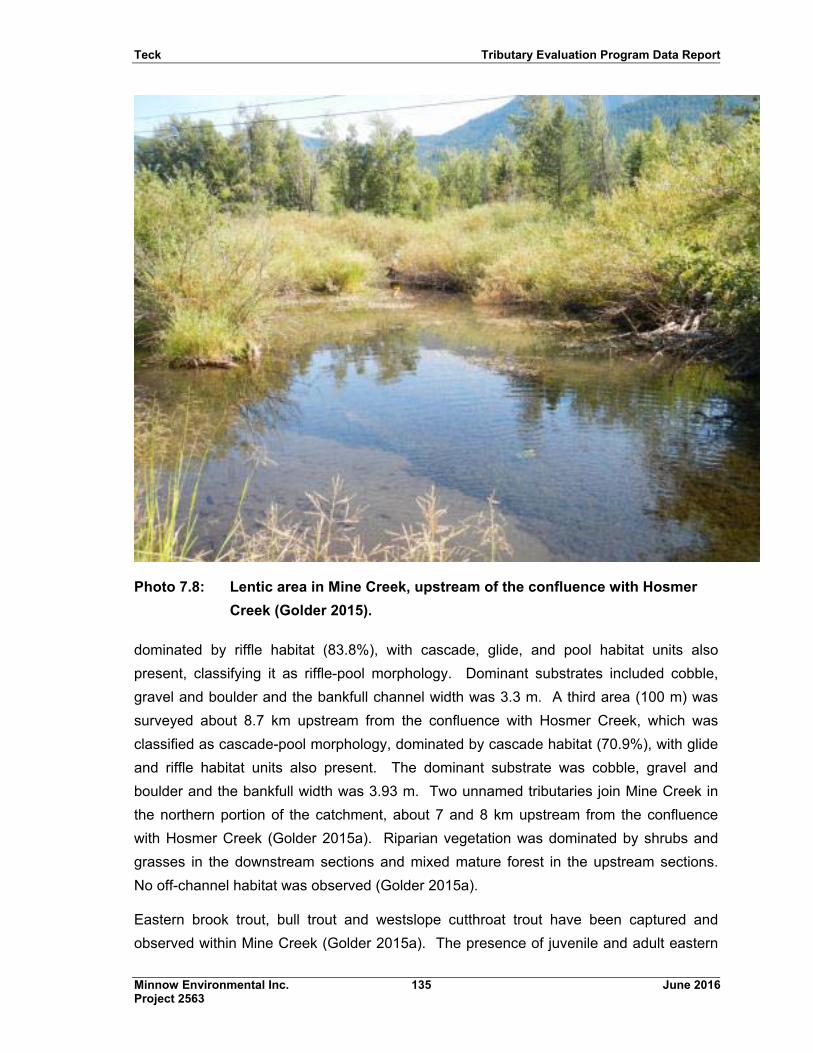
Teck Tributary Evaluation Program Data Report
Minnow Environmental Inc. 135 June 2016 Project 2563
Photo 7.8: Lentic area in Mine Creek, upstream of the confluence with Hosmer
Creek (Golder 2015).
dominated by riffle habitat (83.8%), with cascade, glide, and pool habitat units also
present, classifying it as riffle-pool morphology. Dominant substrates included cobble,
gravel and boulder and the bankfull channel width was 3.3 m. A third area (100 m) was
surveyed about 8.7 km upstream from the confluence with Hosmer Creek, which was
classified as cascade-pool morphology, dominated by cascade habitat (70.9%), with glide
and riffle habitat units also present. The dominant substrate was cobble, gravel and
boulder and the bankfull width was 3.93 m. Two unnamed tributaries join Mine Creek in
the northern portion of the catchment, about 7 and 8 km upstream from the confluence
with Hosmer Creek (Golder 2015a). Riparian vegetation was dominated by shrubs and
grasses in the downstream sections and mixed mature forest in the upstream sections.
No off-channel habitat was observed (Golder 2015a).
Eastern brook trout, bull trout and westslope cutthroat trout have been captured and
observed within Mine Creek (Golder 2015a). The presence of juvenile and adult eastern

Teck Tributary Evaluation Program Data Report
Minnow Environmental Inc. 136 June 2016 Project 2563
brook trout indicates that the lentic areas on Mine Creek provide rearing and
holding/feeding habitat. The shallow water depths at the time of the survey in
August 2013 precludes the use of the area as overwintering habitat for adult fish species,
but may provide adequate overwintering habitat for juvenile eastern brook trout. In the
upstream lotic areas, the presence of juvenile and adult fish species indicates suitable
rearing, holding, and feeding habitat are present. Trace amounts of suitable resident trout
spawning gravels were observed. Gradient barriers limit fish access to headwaters
(Golder 2015a).
Teck Tributary Evaluation Program Data Report
Minnow Environmental Inc. 137 June 2016 Project 2563
8.0 REFERENCES
Allan, J.H. 1987. Fisheries investigations in Line Creek in 1987. Consultant report prepared for Luscar Ltd., Line Creek Mine, Sparwood, BC. Prepared by Pisces Environmental Consulting Services Ltd., Red Deer, AB.
Allan, J.H. 1991. Fisheries investigations in Line Creek in 1991. Consultant report prepared for Luscar Ltd., Line Creek Mine, Sparwood, BC. Prepared by Pisces Environmental Consulting Services Ltd., Red Deer, AB.
Allan, J.H. 1993. Fisheries investigations in Line Creek in 1993. Consultant report prepared for Luscar Ltd., Line Creek Mine, Sparwood, BC. Prepared by Pisces Environmental Consulting Services Ltd., Red Deer, AB.
Allan, J.H. 1994. Fisheries investigations in Line Creek and South Line Creek in 1994. Consultant report prepared for Luscar Ltd., Line Creek Mine, Sparwood, BC. Prepared by Pisces Environmental Consulting Services Ltd., Red Deer, AB.
Allan, J.H. 1995. Fisheries investigations in Line Creek in 1995. Consultant report prepared for Luscar Ltd., Line Creek Mine, Sparwood, BC. Prepared by Pisces Environmental Consulting Services Ltd., Red Deer, AB.
Allan, J.H. 1996. Fisheries Investigations in Henretta Creek and Fish Pond Creek in 1995. Prepared for Fording Coal Ltd. Prepared by Pisces Environmental Consulting Services Ltd, Red Deer, AB.
Allan, J.H. 2000. Fisheries investigations in Line Creek in 2000. Consultant report prepared for Luscar Ltd., Line Creek Mine, Sparwood, BC. Prepared by Pisces Environmental Consulting Services Ltd., Red Deer, AB.
Allan, J.H. 2001. Fisheries investigations in Line Creek in 2001. Consultant report prepared for Luscar Ltd., Line Creek Mine, Sparwood, BC. Prepared by Pisces Environmental Consulting Services Ltd., Red Deer, AB.
Amos, L., and J. Wright. 2000. 1999 Fording River fish and fish habitat monitoring program. Prepared for Fording Coal Ltd., Elkford, B.C. Prepared by Interior Reforestation Co. Ltd. Cranbrook, B.C. 46 p. + 8 app.
Amos, L., J. Wright. 2002. Fish and habitat assessments associated with coal bed methane development in the Upper Fording River drainage. Prepared for EnCana Corporation, Calgary, AB. 2002.
Teck Tributary Evaluation Program Data Report
Minnow Environmental Inc. 138 June 2016 Project 2563
Arnett, T., and Berdusco, J. 2009. Line Creek Operations 2008 Aquatic Health Monitoring Program. Consultant report prepared for Elk Valley Coal Corporation - Line Creek Operations, Sparwood, BC. Prepared by Interior Reforestation Co. Ltd., Cranbrook, BC. 53 pp + 8 appds
Arnett, T., and M.D. Robinson. 2010. 2007 – 2009 Line Creek Aquatic Health Monitoring Summary. Prepared for Teck Coal Ltd. – Line Creek Operations, Sparwood, BC. Prepared by Interior Reforestation Co. Ltd., Cranbrook, BC. 72 pp + 8 appds.
BCCDC (British Columbia Conservation Data Centre). 2012. Search tools for conservation status available at http://www.env.gov.bc.ca/cdc/access.html.
BCFISB (British Columbia Fisheries Information Services Branch). 2001. Reconnaissance (1:20,000) Fish and Fish Habitat Inventory: Standards and Procedures. Prepared for the Resources Inventory Committee. April.
BCMOE (British Columbia Ministry of Environment). 2014. Permit 107517, Under the Provisions of the Environmental Management Act, Teck Coal Limited. Issued November 19, 2014.
BCMOE (British Columbia Ministry of Environment). 2015. Fish Inventory Data Queries (FIDQ) Tool. Website: http://www.env.gov.bc.ca/fish/fidq/queries.html
BCMOF (British Columbia Ministry of Forests). 1996. Channel Assessment Procedures Guidebook. Available at: http://www.for.gov.bc.ca/tasb/legsregs/fpc/fpcguide/chanfld/cfld-toc.htm. Accessed September 2014.
BC Research. 1981. Greenhills Surface Coal Mining Project. Stage II Environmental Assessment, Volume I-III. Prepared for Kaiser Resources Ltd.
Berdusco J. 2003. Brownie Creek and Tributaries Followup Fisheries and RMA Classification. Prepared for Fording River Operations, Elkford, B.C. Prepared by Interior Reforestation Co. Ltd. Cranbrook, B.C. July. 9 p.
Berdusco, J., T. Arnett, and J. Bisset. 2007. Line Creek Operations 2006 Fisheries Investigation. Consultant report prepared for Elk Valley Coal Corporation – Line Creek Operations, Sparwood, BC. Prepared by Interior Reforestation Co. Ltd., Cranbrook, BC.
Berdusco, J., and T. Arnett. 2008. Line Creek Operations 2007 Aquatic Health Monitoring Program. Consultant report prepared for Elk Valley Coal Corporation – Line Creek Operations, Sparwood, BC. Prepared by Interior Reforestation Co. Ltd., Cranbrook, BC. 57 pp + 8 appds.
Teck Tributary Evaluation Program Data Report
Minnow Environmental Inc. 139 June 2016 Project 2563
CCME. 2001a. CCME water quality index 1.0. Technical report. Canadian water quality guidelines for the protection of aquatic life. Canadian Council of Ministers of the Environment, Winnipeg, MB.
CCME. 2001b. CCME water quality index 1.0. User's manual. Canadian water quality guidelines for the protection of aquatic life. Canadian Council of Ministers of the Environment, Winnipeg, MB.
CCME. 2007. Sediment quality index 1.0 calculator (SeQI) [online]. Canadian Council of Ministers of the Environment, Winnipeg, MB. Available from: http://www.ccme.ca/ourwork/water.html?category_id=103.
Cope, S., C.J. Schwarz, J. Bisset, and A. Prince. 2014. Upper Fording River Westslope Cutthroat trout (Oncorhynchus clarkii lewisi) population assessment – telemetry project annual report: 2013 (Interim Report 2). Report Prepared for Teck Coal Limited, Calgary, AB. Report Prepared by Westslope Fisheries Ltd., Cranbrook, B.C. 108 p. + 2 app.
Edeburn, A. 2003. Brownie Creek and Tributaries Habitat Assessment. Prepared for Greg Sword, Fording Coal Ltd. Elkford, B.C. Prepared by Interior Reforestation Co. Ltd. Cranbrook, B.C. 3 p.
Environment Canada. 2013. How Much Habitat is Enough? Third Edition. Environment Canada, Toronto, Ontario.
Fording Coal Limited. 1985. Kilmarnock Creek dragline mining proposal environmental impact assessment. Report prepared for British Columbia Mine Development Steering Committee. Prepared by Fording Coal Limited, 61 p.
Fording Coal Limited. 1991. Fording Coal Limited Enhancement of the Upper Fording River (Above Confluence with Henretta Creek). Prepared by Fording Coal Limited, 21 p, 1 app.
Golder Associates Ltd. 2014a. Fish and Fish Habitat Baseline Report. Submitted to Teck Coal Limited, Fording River Operations, Elkford, BC. Annex G of Fording River Operations Swift Project Environmental Assessment Certificate Application. November.
Golder Associates Ltd. 2014b. Fording River Operation Swift Project: Geomorphic Overview Characterization and Review. Technical Memorandum from J. Wright, R. Atkins, and J. Seabrook, Golder Associates Ltd., to G. Sword and W. Franklin, Teck Coal Limited. November 17, 2014. (Appendix G.VIII of Golder 2014a).
Teck Tributary Evaluation Program Data Report
Minnow Environmental Inc. 140 June 2016 Project 2563
Golder Associates Ltd. 2014c. Site Conditions. Annex D.5 of the Elk Valley Water Quality Plan. Teck Coal Limited. July.
Golder Associates Ltd. 2014d. Fording River Operations Swift Project Environmental Assessment Certificate Application.
Golder Associates Ltd.. 2015a. Coal Mountain Phase 2 Project. Annex I – Fish and Fish Habitat Baseline Report. Submitted to Teck Coal Limited. August.
Golder Associates Ltd.. 2015b. Elkview Operations Baldy Ridge Extension Project. Annex J – Wildlife and Wildlife Habitat Baseline Report. Submitted to Teck Coal Limited, Elkview Operations. October.
Golder Associates Ltd.. 2015c. Elkview Operations Baldy Ridge Extension Project. Annex N – Landscape and Ecosystems Baseline Report. Submitted to Teck Coal Limited, Elkview Operations. July.
Goltz C. 1997. Fisheries investigations in Line Creek in 1997. Consultant report prepared for Luscar Ltd., Line Creek Mine, Sparwood, BC. Prepared by Pisces Environmental Consulting Services Ltd., Red Deer, AB.
Goltz C. 1998. Fisheries investigations in Line Creek in 1998. Consultant report prepared for Luscar Ltd., Line Creek Mine, Sparwood, BC. Prepared by Pisces Environmental Consulting Services Ltd., Red Deer, AB.
Goltz C. 1999. Fisheries investigations in Line Creek in 1999. Consultant report prepared for Luscar Ltd., Line Creek Mine, Sparwood, BC. Prepared by Pisces Environmental Consulting Services Ltd., Red Deer, AB.
Interior Reforestation Co. Ltd. 1997. Fish and Fish Habitat Inventory for Select Tributaries of the Upper Flathead and Elk Rivers. Prepared for Cresbrook Forest Industries Ltd., Sparwood Division, Cranbrook, BC. September.
Interior Reforestation Co. Ltd.. 2003... Turnbull South Pit and Spoil development Application, Fish and Fish Habitat Assessment. Prepared for Elk Valley Coal Corporation.
Interior Reforestation Co. Ltd. 2006. Letter to Mr. G. Sword of Elk Valley Coal Corporation, Fording River Operations, dated January 27, 2006. Re: 2005 Clode Ponds fish salvage project.
Interior Reforestation 2011. Elk River Fish Distribution Report. Surveyed area AND1 in August 2010.
Teck Tributary Evaluation Program Data Report
Minnow Environmental Inc. 141 June 2016 Project 2563
Johnston, N.T., and P.A. Slaney. 1996. Fish Habitat Assessment Procedures. Watershed Restoration Tech. Circ. No. 8. Ministry of Environment, Lands and Parks and Ministry of Forests, Vancouver, BC.
KNRC (Kootenay Natural Resource Consulting. 2007. Fish Stream Identification, Greenhills Creek. Prepared for D. Charest, Elk Valley Coal Corporation. July 30, 2007.
Lotic Environmental. 2015a. Elkview Operations Baldy Ridge Extension Project - Fish and Fish Habitat Baseline Assessment. Prepared by Lotic Environmental Ltd. for Teck Coal Ltd. July.
Lotic Environmental. 2015b. Greenhills Operations Cougar Pit Extension Project - Fish and Fish Habitat Baseline Assessment. Prepared by Lotic Environmental Ltd. for Teck Coal Ltd. July.
MacKenzie, W.H.. and J.R. Moran. 2004. Wetlands of British Columbia: A Guide to Identification. Land Management Handbook 52, BC Ministry of Forestry, Research Branch, Victoria, BC.
MacKillop, D. 2012. Kootenay-Boundary BEC Update. Unpublished draft report by Deb Mackillop, Regional Ecologist, Kootenay-Boundary Region (March 2012).
Matrix Solutions Inc. 2015. Wildlife Baseline Report: Greenhills Operations Cougar Pit Extension Project. Prepared for Teck Coal Limited Greenhills Operations. July.
Minnow Environmental Inc. 2003. Selenium study of lentic areas in the Elk Valley (draft).Prepared for Elk Valley Selenium task Force, Mississauga, ON.
Minnow Environmental Inc. 2014a. 2012 Biological Monitoring Program for Coal Mines in the Elk River Valley, B.C. Report Prepared for Teck Coal Limited, Sparwood, BC. March. Project #2456.
Minnow Environmental Inc. 2014b. 2013 Sediment Sampling Program for the Coal Mines in the Elk River Watershed, BC. Prepared for Teck Coal Limited, Sparwood, BC. July. Project #2494.
Minnow Environmental Inc. 2015a. Design for the Regional Aquatic Effects Monitoring Program (RAEMP), Elk River Watershed. Prepared for Teck Coal Limited, Sparwood, B.C. March 2015. Project #2529.
Minnow Environmental Inc. 2015b. Phased Study Design for the Tributary Evaluation Program. Prepared for Teck Coal Limited, Sparwood, BC. May. Project #2563.
Teck Tributary Evaluation Program Data Report
Minnow Environmental Inc. 142 June 2016 Project 2563
Minnow Environmental Inc., Golder Associates Ltd. and Nautilus Environmental Inc. 2015. Sediment Toxicity Supporting Study Design, Elk River Watershed, B.C. Prepared for Teck Coal Limited. March. Project #3565.
Mount, C., S. Norris, R. Thompson, and D. Tesch. 2011. GIS Modelling of Fish Habitat and Road Crossings for the Prioritization of Culvert Assessment and Remediation. Streamline Watershed Management Bulletin 14:7-13
Norris, S., and C. Mount. In Draft. Fish Passage GIS Analysis. Version 2. Methodology and Output Data Specifications. B.C. Ministry of Environment.
NorthSouth Consultants Inc. 2008. BP Canada Mist Mountain Project 2008 Baseline Aquatics Report: Surface Water Quality, Fisheries and Aquatic Habitat Assessment. Prepared for: Matrix Solutions Inc.
NorthSouth Consultants Inc. 2007. BP Canada Mist Mountain Project 2007 Baseline Aquatics Report: Surface Water Quality, Fisheries and Aquatic Habitat Assessment. Prepared for: Matrix Solutions Inc.
Paine, Ledge and Associates, and Minnow Environmental Inc. 2011. Three Year (2007-2009) Evaluation of Selenium Concentrations and Loads in the Elk River Watershed, BC. Prepared for Teck Coal Limited. Sparwood, BC. February.
RL&L Environmental Services Ltd. 1994. Review of Fisheries and Habitat Investigations on Thompson Creek. Prepared for Fording Coal Ltd., Greenhills Creek. October.
RL&L Environmental Services Ltd. 1995. Memo to R. Jones from Rick Pattenden. Re: Swift Creek Fish Inventory. 31 January.
Robinson, M.D., and R.J. MacDonald. 2014. Teck Coal Ltd – 2013 Calcite Monitoring Program. Prepared for Teck Coal Ltd by Lotic Environmental Ltd. 13 pp + appendices.
Robinson, M.D. and R.J. MacDonald. 2015. Teck Coal Ltd – Elk Valley 2014 Calcite Monitoring Program. Prepared for Teck Coal Ltd by Lotic Environmental Ltd.
Robinson, M.D. and R.J. MacDonald. 2016. Teck Coal Ltd – Elk Valley 2015 Calcite Monitoring Program. Prepared for Teck Coal Ltd by Lotic Environmental Ltd.
Robinson, M. Fish Biologist. Lotic Environmental Inc. Cranbrook, BC. Phone: 250-421-7802.
Robinson, M., and J. Wright. 2005. Line Creek Fisheries Investigation 2004 Program. Prepared for Elk Valley Coal Corporation – Line Creek Operations, Sparwood, BC. Prepared by Interior Reforestation Co. Ltd., Cranbrook, BC.
Teck Tributary Evaluation Program Data Report
Minnow Environmental Inc. 143 June 2016 Project 2563
Robinson, M.D., Goodbrand, A., and R.J. MacDonald. 2014. Multi-scale Characterization of Bull Trout Spawning Locations in Line Creek. Prepared for Teck Coal Ltd by Lotic Environmental Ltd. 25 pp.
Teck. 2014. Elk Valley Water Quality Plan. Submitted to the British Columbia Minister of Environment for approval on July 22, 2014.
Teck. 2015. Fording River Operations Swift Project Environmental Assessment Certificate
Application. Issued November 2014, Revised January 2015.
Teck Coal Limited. Undated. Coal Mountain Operations – Phase 2: Wildlife Baseline Report (DRAFT).
Teck Coal Limited. 2011a. Line Creek Operations Phase II Project Environmental Assessment Certificate Application. Issued December 2011. Section B.2.2.3
Teck Coal Limited. 2011b. Line Creek Operations Phase II Project Fish and Fish Habitat Baseline Report. Submitted to British Columbia Environmental Assessment Office, Victoria, BC. December 2011.
Teck, Her Majesty the Queen in Right of Canada, and Her Majesty the Queen in Right of British Columbia. 2011. Memorandum of Agreement for the Management of Select Coal Mining Impacts on Fish and Fish Habitat within the Elk Valley, BC.
Tembec. 2005. Sustainable Forest Management Plan. Tembec Industries Inc. Forest Resource Management BC Division. Term: 2005-2010. Available at: http://forest.tembec.com/sites/forest.tembec.com/files/pdf/tembec_sfmp_final_sept_22_2005.pdf.
Tschaplinski P.J., and R.G. Pike. 2010. Riparian management and effects on function. Pages 479-525 In R.G. Pike, T.E. Redding, R.D. Moore, R.D. Winkler and K.D. Bladon. Compendium of forest hydrology and geomorphology in British Columbia. BC Min. For. Range, For. Sci. Prog., Victoria, BC and FORREX Forum for Research and Extension in Natural Resources, Kamloops, BC. Land Manag. Handb. 66. Available at: www.for.gov.bc.ca/hfd/pubs/Docs/Lmh/Lmh66.htm.
Windward Environmental LLC. 2014. Screening-Level Dietary Ecological Risk Assessment of Metals in the Elk River Watershed and Lake Koocanusa. Prepared for Teck Coal Ltd.
Windward Environmental LLC, Minnow Environmental Inc. and CH2M HILL Ltd. 2014. Elk River Watershed and Lake Koocanusa British Columbia Aquatic Environment Synthesis Report. Prepared for Teck Coal Ltd. October.

Teck Tributary Evaluation Program Data Report
Minnow Environmental Inc. 144 June 2016 Project 2563
Zajdlik & Associates, Inc and Minnow Environmental Inc. 2013. Three-year (2010-2012) evaluation of selenium, cadmium, sulphate and nitrate concentrations and loads in the Elk River Watershed, BC. (DRAFT). October.
APPENDIX A
TRIBUTARIES TO UPPER FORDING RIVER (MU1)
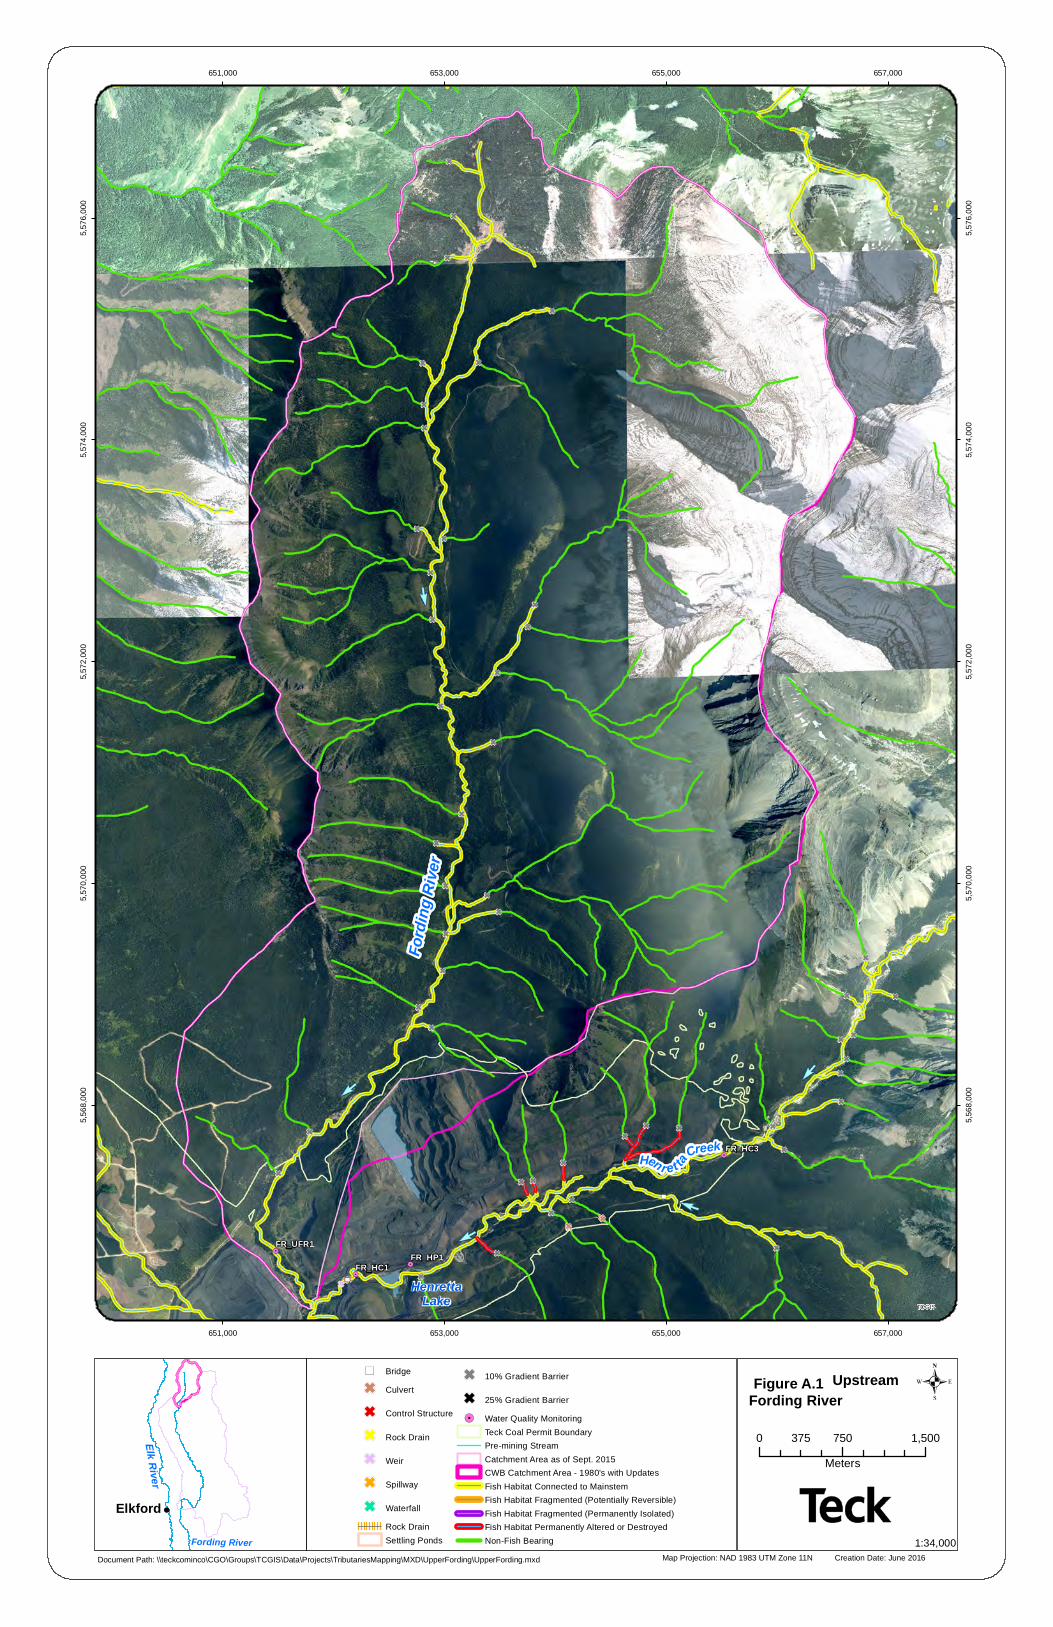
HenrettaLake
Henr et taCreek
Ford
ing R
iver
FR_HC1
FR_HC3
FR_HP1FR_UFR1
TCGIS
651,000
651,000
653,000
653,000
655,000
655,000
657,000
657,000
5,568
,000
5,568
,000
5,570
,000
5,570
,000
5,572
,000
5,572
,000
5,574
,000
5,574
,000
5,576
,000
5,576
,000
Map Projection: NAD 1983 UTM Zone 11N Creation Date: June 2016
.Figur e A.1 Upstream Fording River
!
Elk River
Fording River
Elkford
Document Path: \\teckcominco\CGO\Groups\TCGIS\Data\Projects\TributariesMapping\MXD\UpperFording\UpperFording.mxd1:34,000
0 750 1,500375Meters
") Bridge
G Culvert
G Control Structure
G Rock Drain
G Weir
G Spillway
G WaterfallRock DrainSettling Ponds
G 10% Gradient Barrier
G 25% Gradient Barrier!. Water Quality Monitoring
Teck Coal Permit BoundaryPre-mining StreamCatchment Area as of Sept. 2015CWB Catchment Area - 1980's with UpdatesFish Habitat Connected to MainstemFish Habitat Fragmented (Potentially Reversible)Fish Habitat Fragmented (Permanently Isolated)Fish Habitat Permanently Altered or DestroyedNon-Fish Bearing
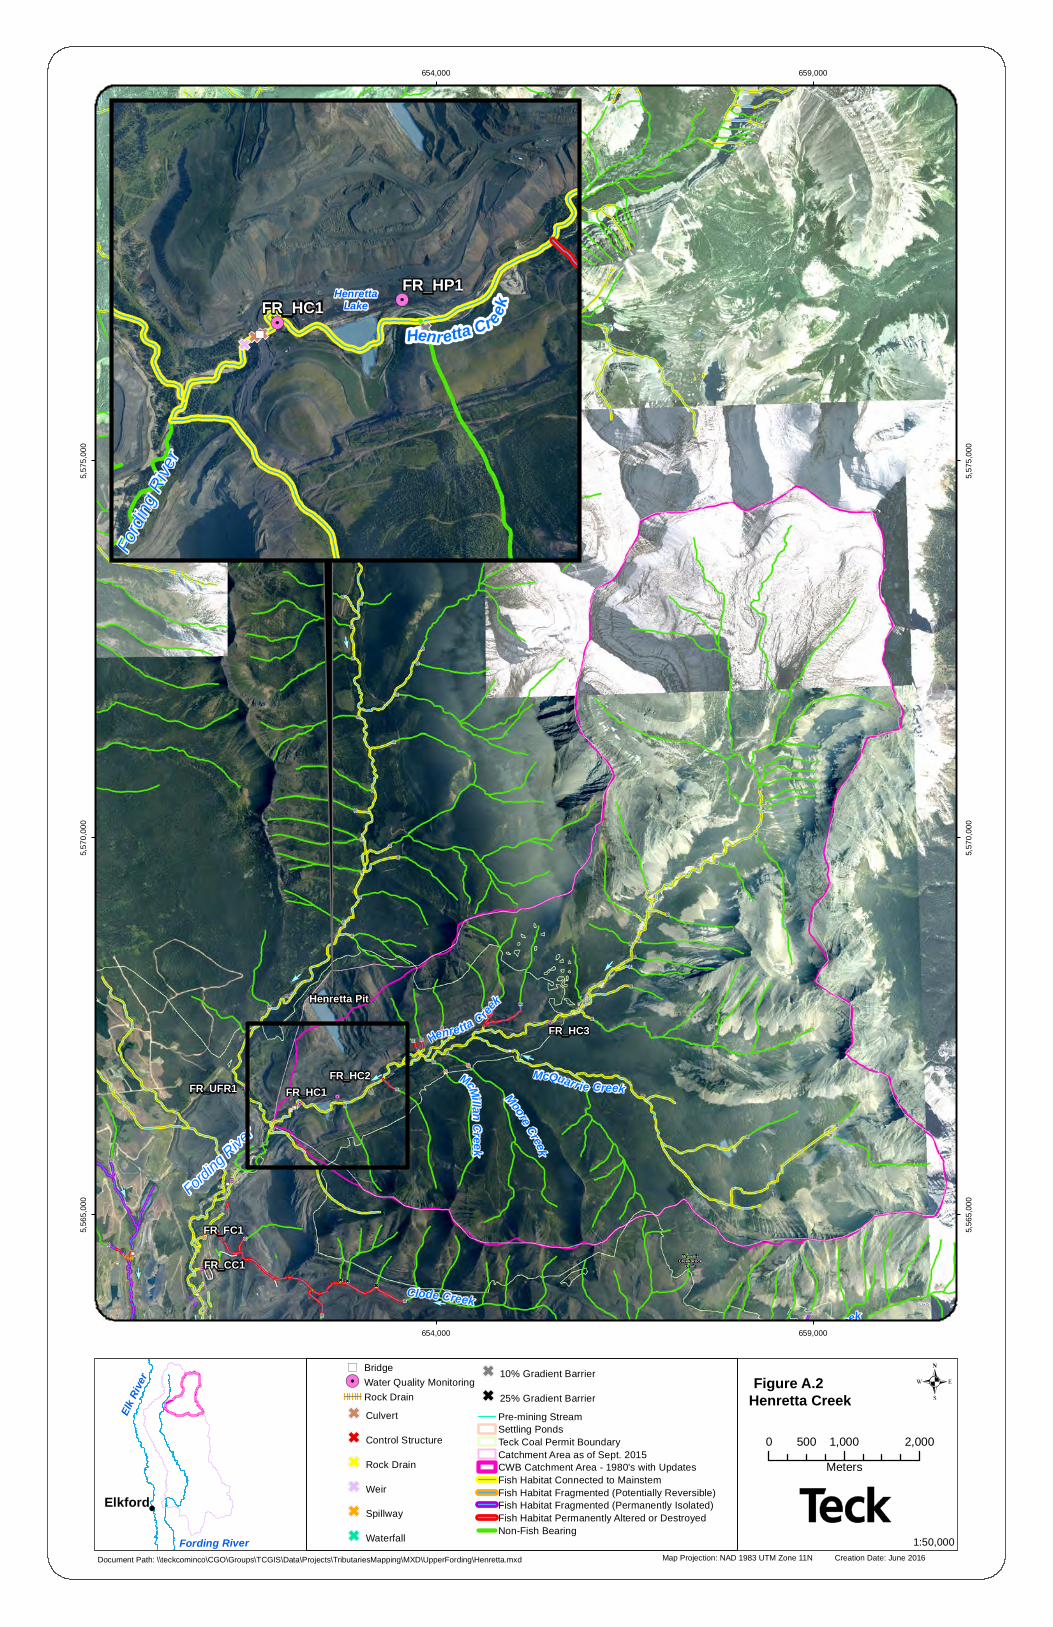
Henretta Pit
BrownieCreek Rock
Drain
Henretta C ree
k
Clode CreekBrownie C reek
McQuarrie CreekMcMilla n Cre ek
Fording
River
Moore Creek
FR_CC1
FR_FC1
FR_HC1FR_HC2
FR_HC3
FR_UFR1
TCGIS
654,000
654,000
659,000
659,000
5,565
,000
5,565
,000
5,570
,000
5,570
,000
5,575
,000
5,575
,000
Map Projection: NAD 1983 UTM Zone 11N Creation Date: June 2016
.Figure A.2 Henretta Creek
!Elkford
Document Path: \\teckcominco\CGO\Groups\TCGIS\Data\Projects\TributariesMapping\MXD\UpperFording\Henretta.mxd
Text
Elk Ri
ver
Fording River
0 1,000 2,000500Meters
1:50,000
Henretta Creek
Fordi
ng Ri
ver
HenrettaLakeFR_HC1
FR_HP1
") Bridge!. Water Quality Monitoring
Rock DrainG Culvert
G Control Structure
G Rock Drain
G Weir
G Spillway
G Waterfall
G 10% Gradient Barrier
G 25% Gradient BarrierPre-mining StreamSettling PondsTeck Coal Permit BoundaryCatchment Area as of Sept. 2015CWB Catchment Area - 1980's with UpdatesFish Habitat Connected to MainstemFish Habitat Fragmented (Potentially Reversible)Fish Habitat Fragmented (Permanently Isolated)Fish Habitat Permanently Altered or DestroyedNon-Fish Bearing
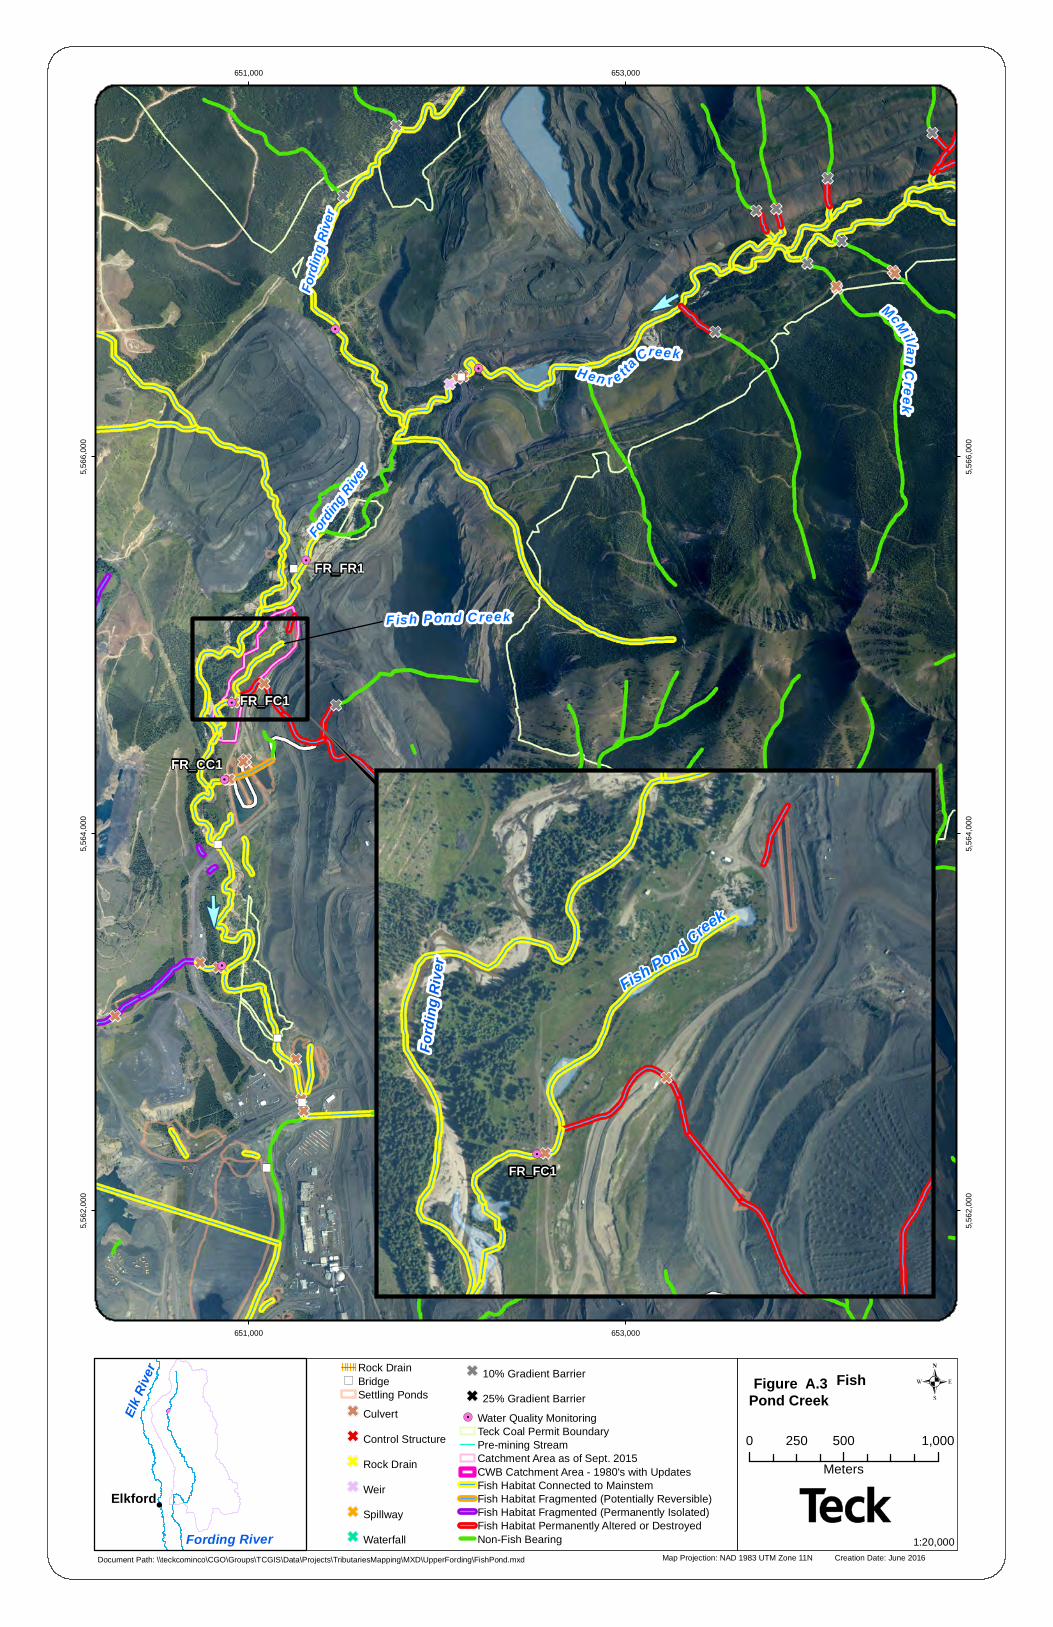
FR_FR1
FR_FC1
FR_CC1
Hen r e tta
Creek
F ish Pon d C reek
Blackmore Creek
McM illanCreek
Ford
ing R
iver
Fordi
ng Rive
r
651,000
651,000
653,000
653,000
5,562
,000
5,562
,000
5,564
,000
5,564
,000
5,566
,000
5,566
,000
Map Projection: NAD 1983 UTM Zone 11N Creation Date: June 2016
.Figure A.3 Fish Pond Creek
!Elkford
Document Path: \\teckcominco\CGO\Groups\TCGIS\Data\Projects\TributariesMapping\MXD\UpperFording\FishPond.mxd
Text
Elk Ri
ver
Fording River
0 500 1,000250Meters
1:20,000
Ford
ing R
iver
FR_FC1
Fish Pond Creek
Rock Drain") Bridge
Settling PondsG Culvert
G Control Structure
G Rock Drain
GWeir
G Spillway
GWaterfall
G 10% Gradient Barrier
G 25% Gradient Barrier!. Water Quality Monitoring
Teck Coal Permit BoundaryPre-mining StreamCatchment Area as of Sept. 2015CWB Catchment Area - 1980's with UpdatesFish Habitat Connected to MainstemFish Habitat Fragmented (Potentially Reversible)Fish Habitat Fragmented (Permanently Isolated)Fish Habitat Permanently Altered or DestroyedNon-Fish Bearing
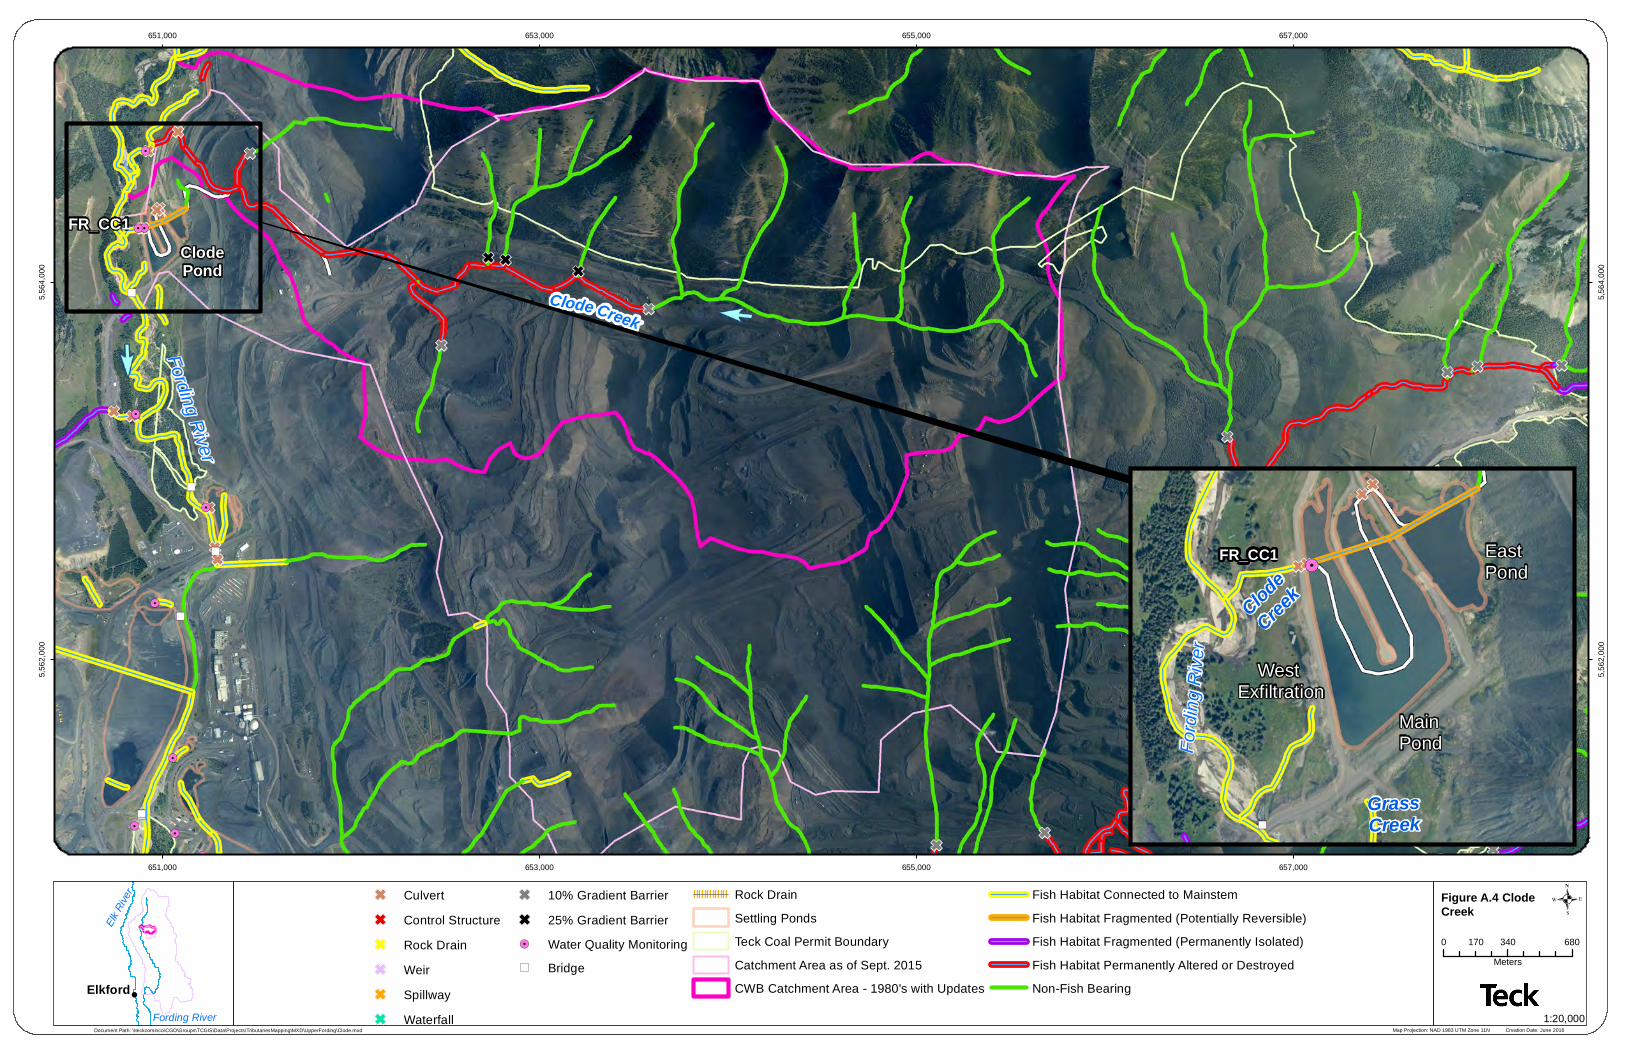
Map Projection: NAD 1983 UTM Zone 11N Creation Date: June 2016
Figure A.4 Clode Creek
!
Fording River
Elk Ri
ver
Elkford
Document Path: \\teckcominco\CGO\Groups\TCGIS\Data\Projects\TributariesMapping\MXD\UpperFording\Clode.mxd
!.
!.
!.
ClodePond
FR_CC1
Clode Creek
Fording River
651,000
651,000
653,000
653,000
655,000
655,000
657,000
657,000
5,562
,000
5,562
,000
5,564
,000
5,564
,000
.0 340 680170
Meters
Text
East Pond
MainPond
ClodeCree
k
West Exfiltration
GrassCreek
FR_CC1
Fordi
ng R
iver
1:20,000
G CulvertG Control StructureG Rock DrainG WeirG SpillwayG Waterfall
G 10% Gradient BarrierG 25% Gradient Barrier!. Water Quality Monitoring") Bridge
Rock DrainSettling PondsTeck Coal Permit BoundaryCatchment Area as of Sept. 2015CWB Catchment Area - 1980's with Updates
Fish Habitat Connected to MainstemFish Habitat Fragmented (Potentially Reversible)Fish Habitat Fragmented (Permanently Isolated)Fish Habitat Permanently Altered or DestroyedNon-Fish Bearing
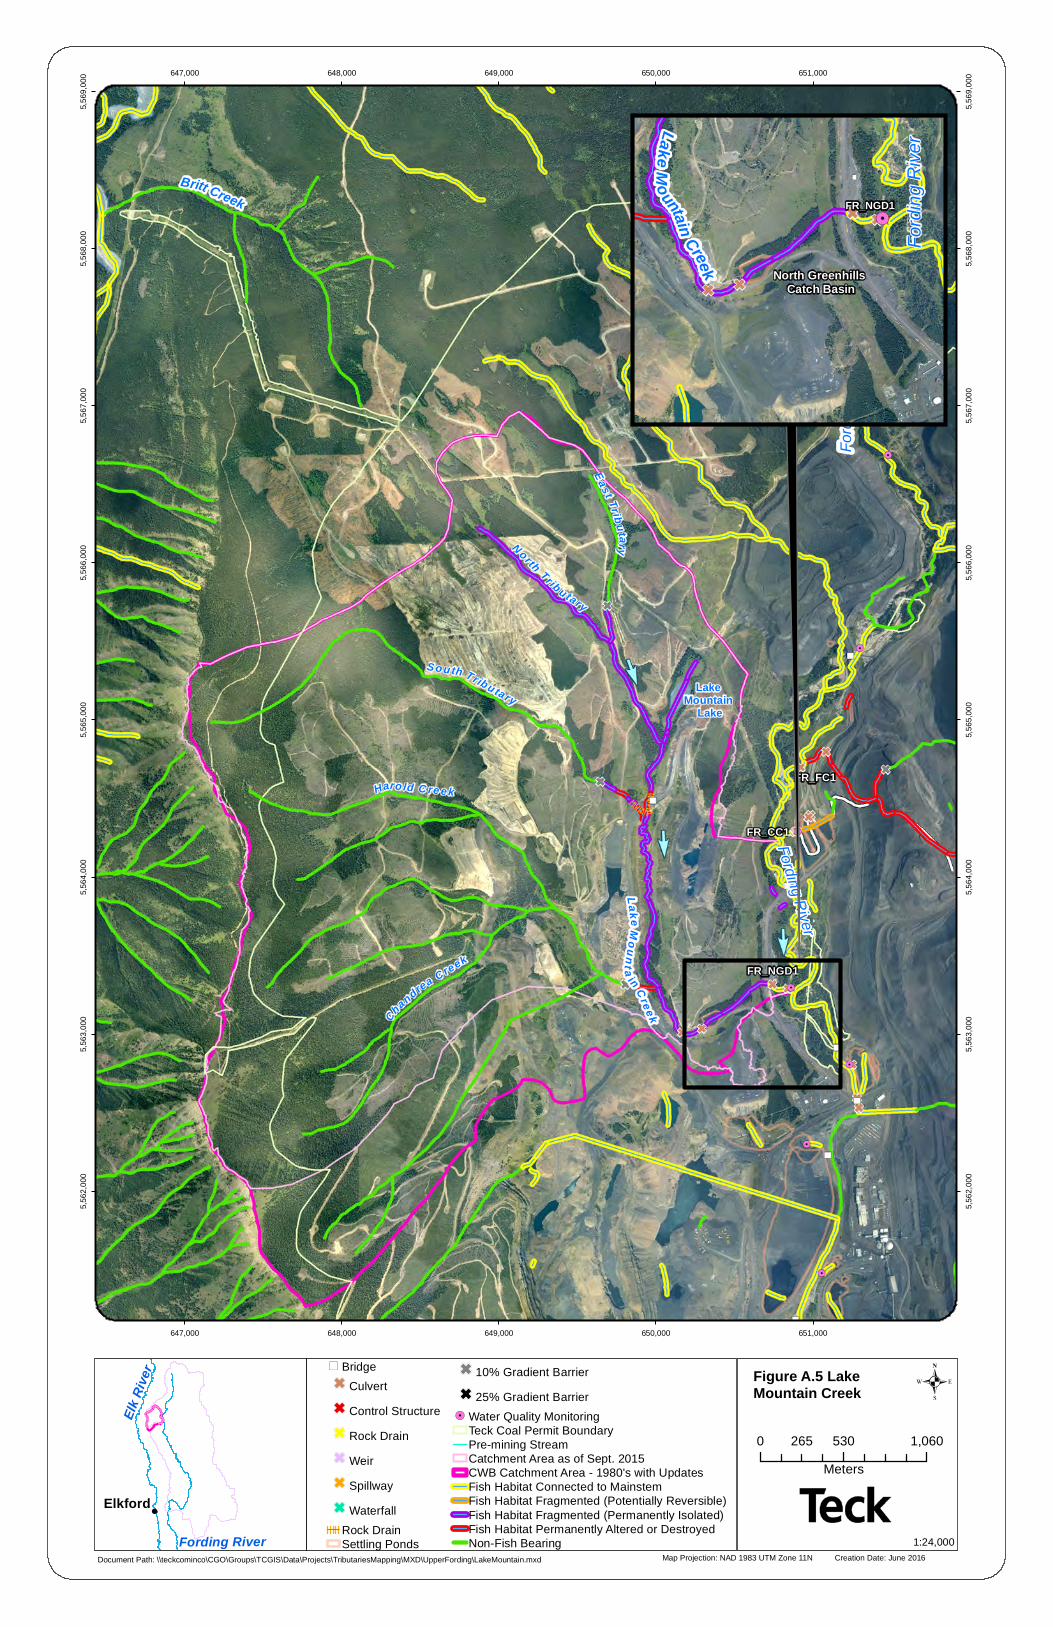
FR_NGD1
FR_FC1
Lake Mountain
Lake
FR_CC1
Britt Creek
Lak eMounta in C reekChandrea Creek
Eas t Tribut aryN orth Tribu tary
Haro ld C re ek
South Tributary
Fording River
Fordi
ng R
iver
647,000
647,000
648,000
648,000
649,000
649,000
650,000
650,000
651,000
651,000
5,562
,000
5,562
,000
5,563
,000
5,563
,000
5,564
,000
5,564
,000
5,565
,000
5,565
,000
5,566
,000
5,566
,000
5,567
,000
5,567
,000
5,568
,000
5,568
,000
5,569
,000
5,569
,000
Map Projection: NAD 1983 UTM Zone 11N Creation Date: June 2016
.Figure A.5 Lake Mountain Creek
!Elkford
Document Path: \\teckcominco\CGO\Groups\TCGIS\Data\Projects\TributariesMapping\MXD\UpperFording\LakeMountain.mxd
Text
Elk Ri
ver
Fording River
0 530 1,060265Meters
1:24,000
North Greenhills Catch Basin
Fordi
ng R
iverLakeM
ountain Creek
FR_NGD1
") BridgeGCulvertGControl StructureGRock DrainGWeirGSpillwayGWaterfallRock DrainSettling Ponds
G10% Gradient BarrierG25% Gradient Barrier
!. Water Quality MonitoringTeck Coal Permit BoundaryPre-mining StreamCatchment Area as of Sept. 2015CWB Catchment Area - 1980's with UpdatesFish Habitat Connected to MainstemFish Habitat Fragmented (Potentially Reversible)Fish Habitat Fragmented (Permanently Isolated)Fish Habitat Permanently Altered or DestroyedNon-Fish Bearing
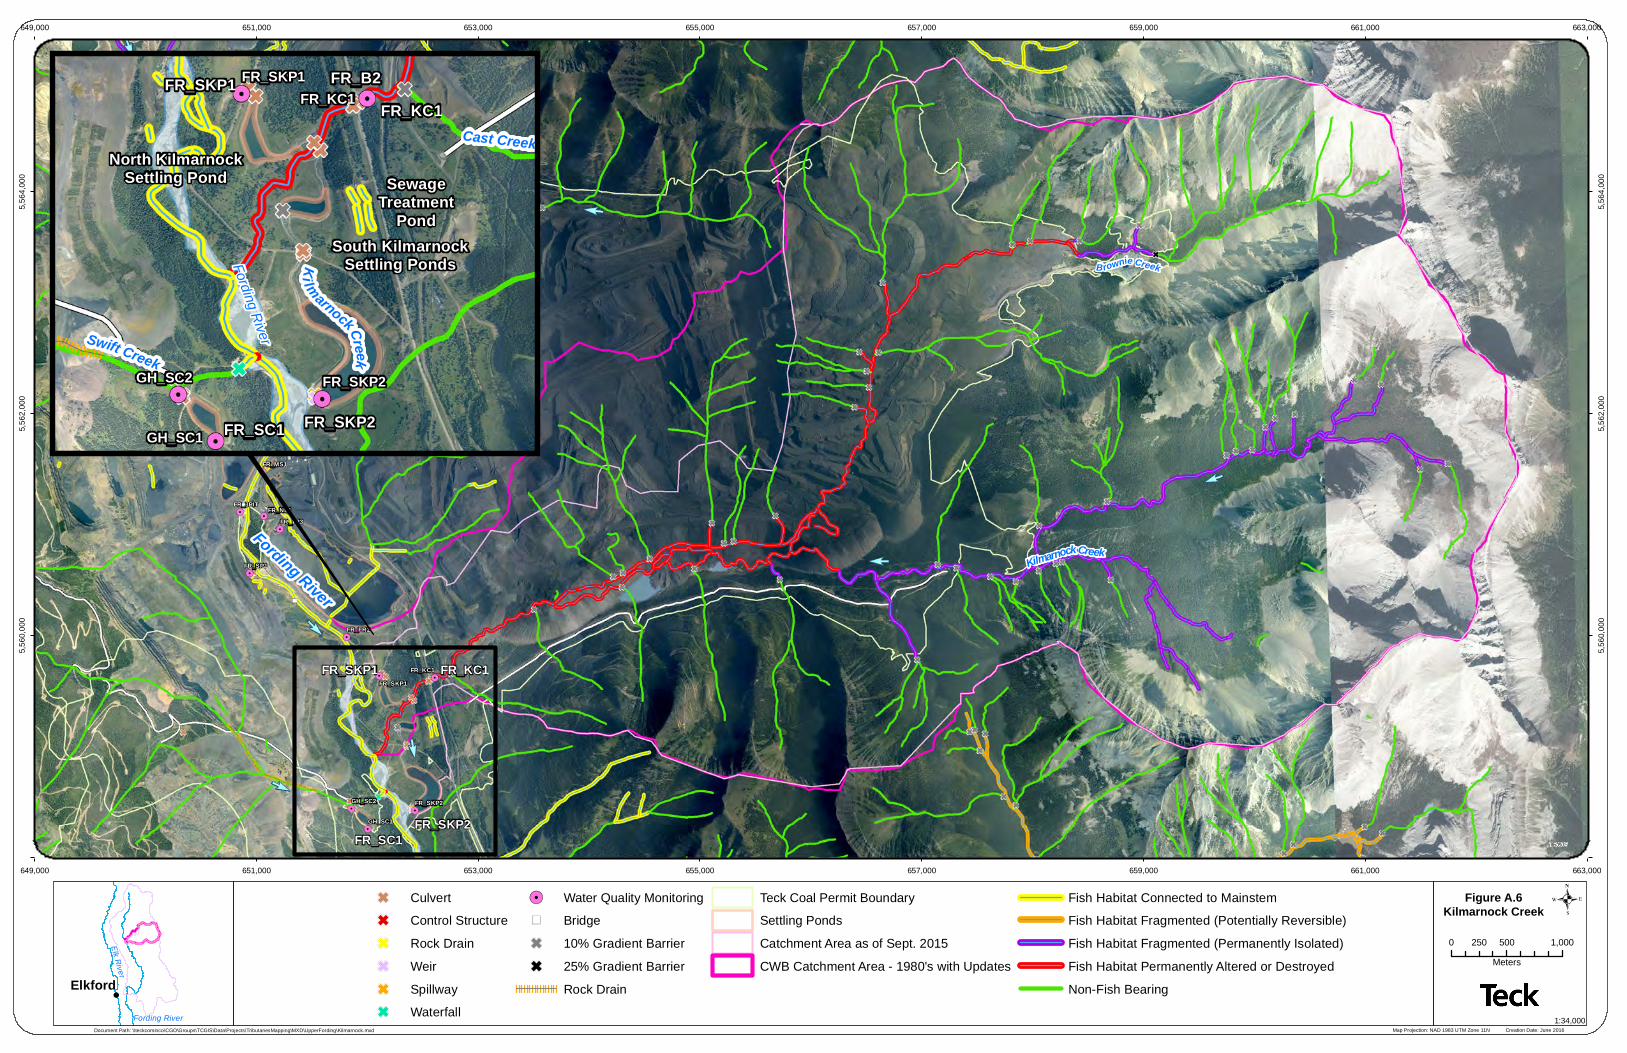
Map Projection: NAD 1983 UTM Zone 11N Creation Date: June 2016
Figure A.6 Kilmarnock Creek
!
Elk River
Fording River
Elkford
Document Path: \\teckcominco\CGO\Groups\TCGIS\Data\Projects\TributariesMapping\MXD\UpperFording\Kilmarnock.mxd
!.
!.
!.
!.
!.
!.
!.
!.
!.
!.
!.
!.
!.
!.
!.
!.
FR_SC1
KilmarnockCreek
Brownie Creek
Fording River
FR_KC1FR_SKP1
FR_SKP2
FR_3PIT
FR_CC1
FR_EC1
FR_FR2
FR_KC1
FR_MS1
FR_NGD1
FR_NL1
FR_SKP1
FR_SKP2
FR_SP1
FR_TP1
FR_TP3
GH_SC1
GH_SC2
TCGIS
649,000
649,000
651,000
651,000
653,000
653,000
655,000
655,000
657,000
657,000
659,000
659,000
661,000
661,000
663,000
663,000
5,560
,000
5,560
,000
5,562
,000
5,562
,000
5,564
,000
5,564
,000
.0 500 1,000250
Meters
1:34,000
TextFR_SKP2
FR_B2
North KilmarnockSettling Pond
South KilmarnockSettling Ponds
SewageTreatment
Pond
FR_KC1FR_SKP1
FR_SC1
Fording River
Ki lmarnockCreek
Swift Creek
Cast Creek
FR_KC1FR_SKP1
FR_SKP2
GH_SC1
GH_SC2
G CulvertG Control StructureG Rock DrainG WeirG SpillwayG Waterfall
!. Water Quality Monitoring") BridgeG 10% Gradient BarrierG 25% Gradient Barrier
Rock Drain
Teck Coal Permit BoundarySettling PondsCatchment Area as of Sept. 2015CWB Catchment Area - 1980's with Updates
Fish Habitat Connected to MainstemFish Habitat Fragmented (Potentially Reversible)Fish Habitat Fragmented (Permanently Isolated)Fish Habitat Permanently Altered or DestroyedNon-Fish Bearing
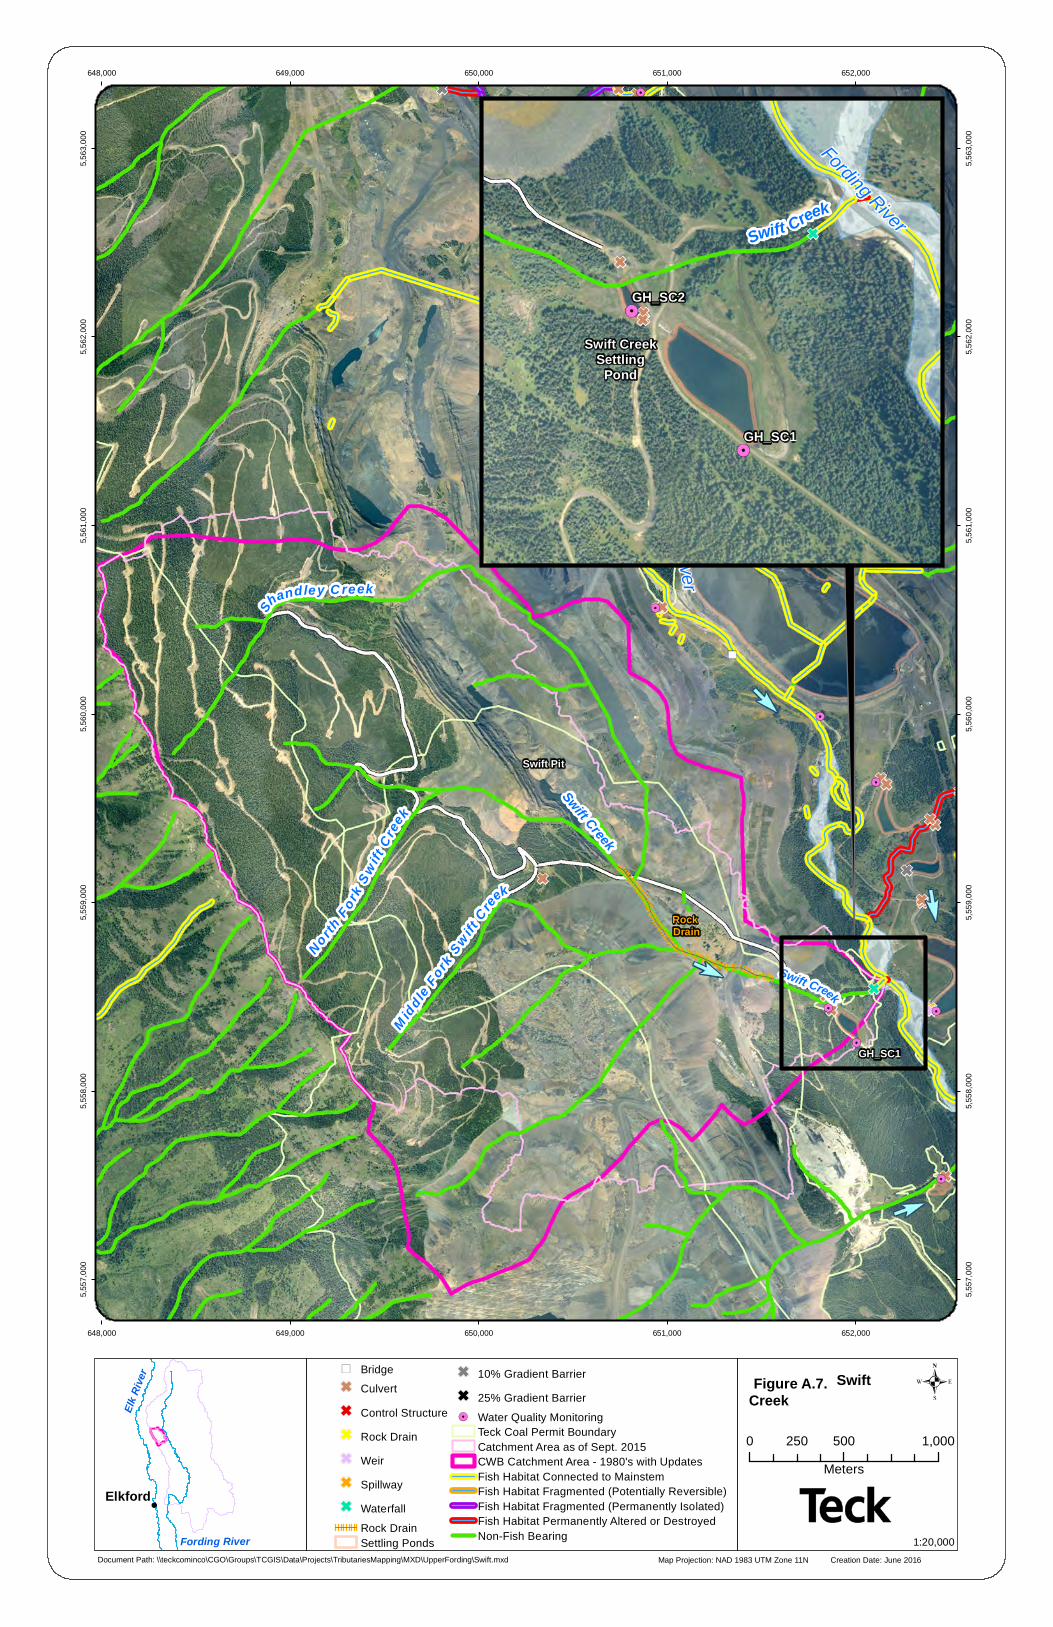
Rock Drain
Swift Pit
GH_SC1
Swift Creek
Swift Creek
Shandley C reek
M iddleFork
Sw iftC ree
k
No rthF or
k Swift
C reek
Fording River
648,000
648,000
649,000
649,000
650,000
650,000
651,000
651,000
652,000
652,000
5,557
,000
5,557
,000
5,558
,000
5,558
,000
5,559
,000
5,559
,000
5,560
,000
5,560
,000
5,561
,000
5,561
,000
5,562
,000
5,562
,000
5,563
,000
5,563
,000
Map Projection: NAD 1983 UTM Zone 11N Creation Date: June 2016
.Figur e A.7. Swift Creek
!Elkford
Document Path: \\teckcominco\CGO\Groups\TCGIS\Data\Projects\TributariesMapping\MXD\UpperFording\Swift.mxd
Text
Elk Ri
ver
Fording River
") BridgeG CulvertG Control StructureG Rock DrainG WeirG SpillwayG Waterfall
Rock DrainSettling Ponds
G 10% Gradient BarrierG 25% Gradient Barrier!. Water Quality Monitoring
Teck Coal Permit BoundaryCatchment Area as of Sept. 2015CWB Catchment Area - 1980's with UpdatesFish Habitat Connected to MainstemFish Habitat Fragmented (Potentially Reversible)Fish Habitat Fragmented (Permanently Isolated)Fish Habitat Permanently Altered or DestroyedNon-Fish Bearing
0 500 1,000250Meters
1:20,000
Swift CreekSettling
Pond
Fording RiverSwift Creek
GH_SC1
GH_SC2
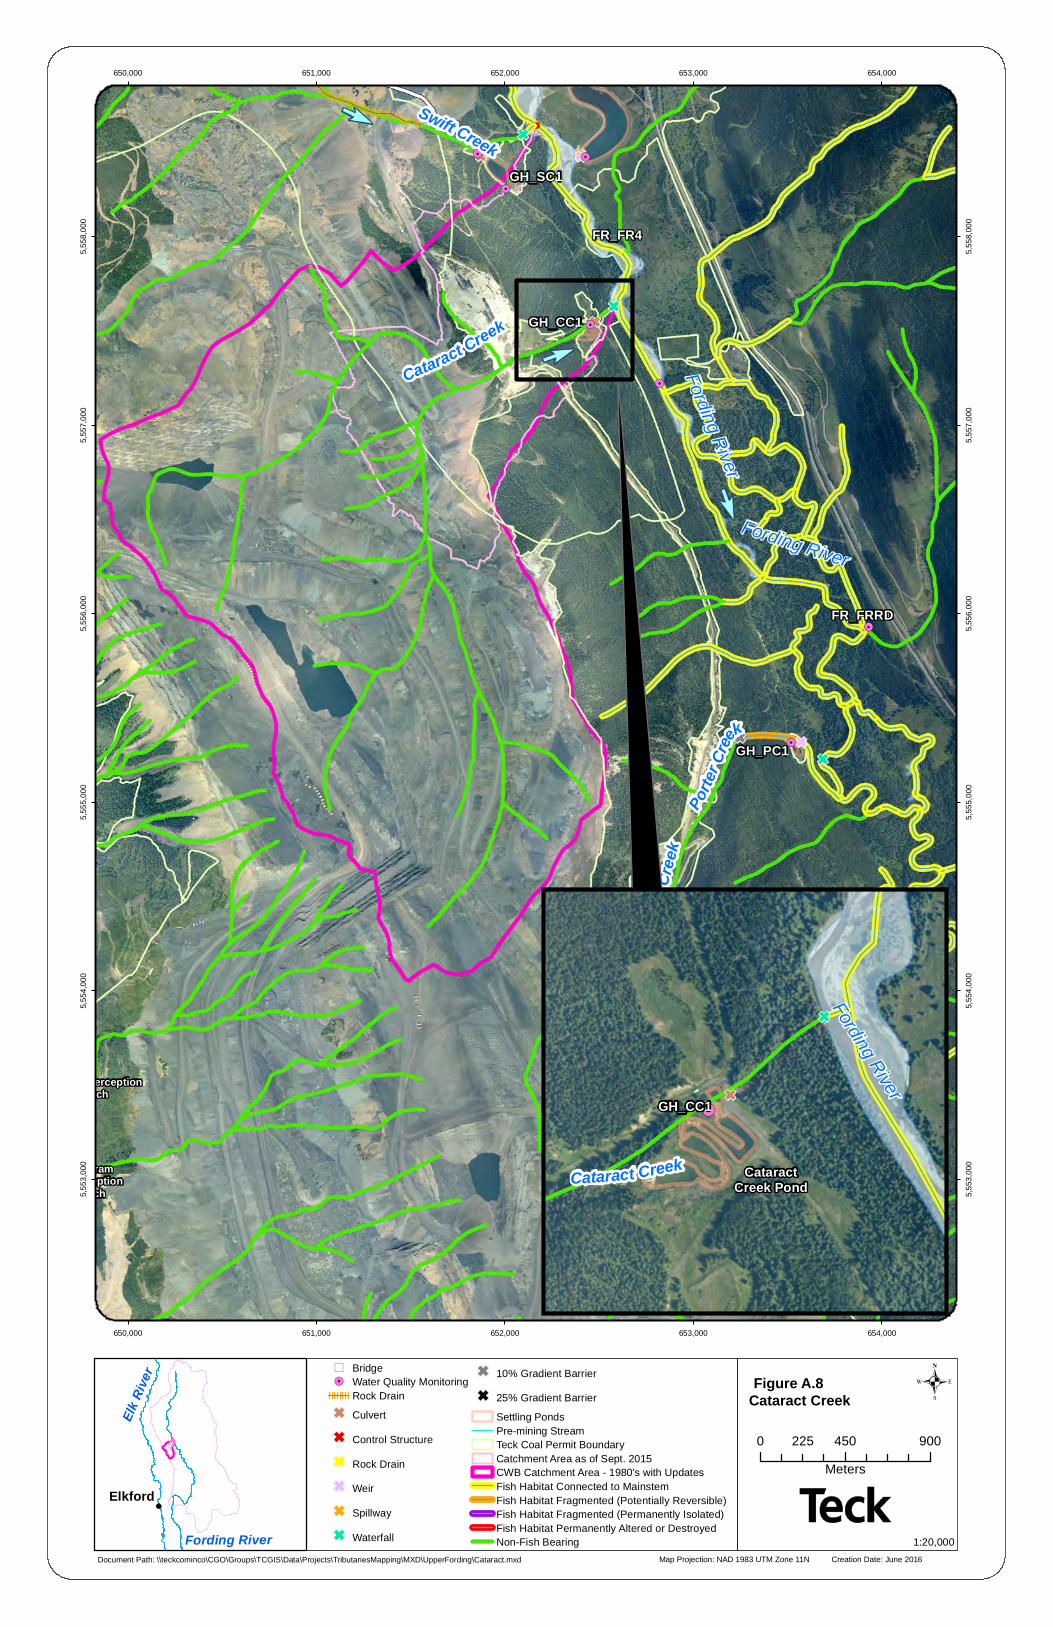
WolframInterception
Ditch
Leask InterceptionDitch
Cataract Creek
Porte
r Cree
k
Fording River
FR_FR4
FR_FRRD
GH_CC1
GH_PC1
GH_SC1
Fording River
Swift Creek
Porter Cree
k
650,000
650,000
651,000
651,000
652,000
652,000
653,000
653,000
654,000
654,000
5,553
,000
5,553
,000
5,554
,000
5,554
,000
5,555
,000
5,555
,000
5,556
,000
5,556
,000
5,557
,000
5,557
,000
5,558
,000
5,558
,000
.Figure A.8 Cataract Creek
!Elkford
Document Path: \\teckcominco\CGO\Groups\TCGIS\Data\Projects\TributariesMapping\MXD\UpperFording\Cataract.mxd
hfdfds
Elk Ri
ver
Fording River
") Bridge!. Water Quality Monitoring
Rock DrainG Culvert
G Control Structure
G Rock Drain
G Weir
G Spillway
G Waterfall
G 10% Gradient Barrier
G 25% Gradient BarrierSettling PondsPre-mining StreamTeck Coal Permit BoundaryCatchment Area as of Sept. 2015CWB Catchment Area - 1980's with UpdatesFish Habitat Connected to MainstemFish Habitat Fragmented (Potentially Reversible)Fish Habitat Fragmented (Permanently Isolated)Fish Habitat Permanently Altered or DestroyedNon-Fish Bearing
0 450 900225Meters
1:20,000
CataractCreek Pond
GH_CC1
Cataract Creek
Fording River
Cataract Creek
Map Projection: NAD 1983 UTM Zone 11N Creation Date: June 2016
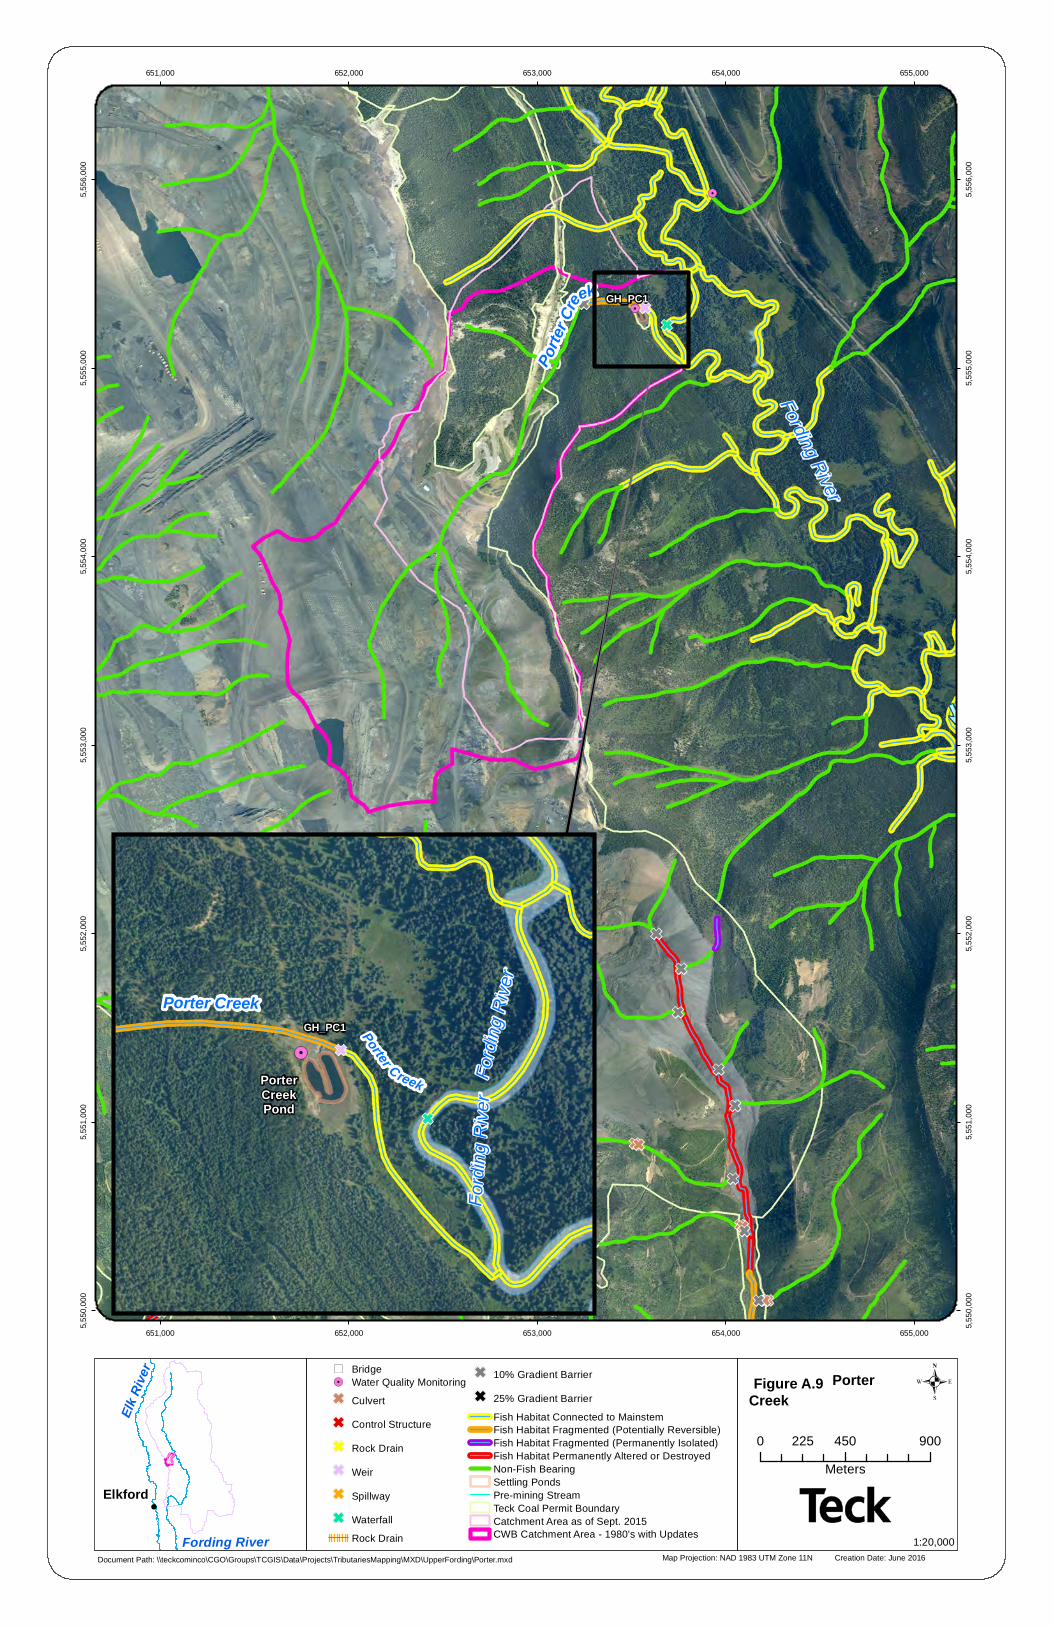
UpperThompson
Pond
GH_PC1
Fording River
Porte
r Creek
651,000
651,000
652,000
652,000
653,000
653,000
654,000
654,000
655,000
655,0005,550
,000
5,550
,000
5,551
,000
5,551
,000
5,552
,000
5,552
,000
5,553
,000
5,553
,000
5,554
,000
5,554
,000
5,555
,000
5,555
,000
5,556
,000
5,556
,000
Map Projection: NAD 1983 UTM Zone 11N Creation Date: June 2016
.Figure A.9 Porter Creek
!
Elkford
Document Path: \\teckcominco\CGO\Groups\TCGIS\Data\Projects\TributariesMapping\MXD\UpperFording\Porter.mxd
fdafdsa
Elk Ri
ver
Fording River
") Bridge!. Water Quality MonitoringG Culvert
G Control Structure
G Rock Drain
G Weir
G Spillway
G WaterfallRock Drain
G 10% Gradient Barrier
G 25% Gradient BarrierFish Habitat Connected to MainstemFish Habitat Fragmented (Potentially Reversible)Fish Habitat Fragmented (Permanently Isolated)Fish Habitat Permanently Altered or DestroyedNon-Fish BearingSettling PondsPre-mining StreamTeck Coal Permit BoundaryCatchment Area as of Sept. 2015CWB Catchment Area - 1980's with Updates
0 450 900225Meters
1:20,000
PorterCreekPond
Porter Creek Fordi
ng R
iver
GH_PC1
Fordi
ng R
iver
Porter Creek
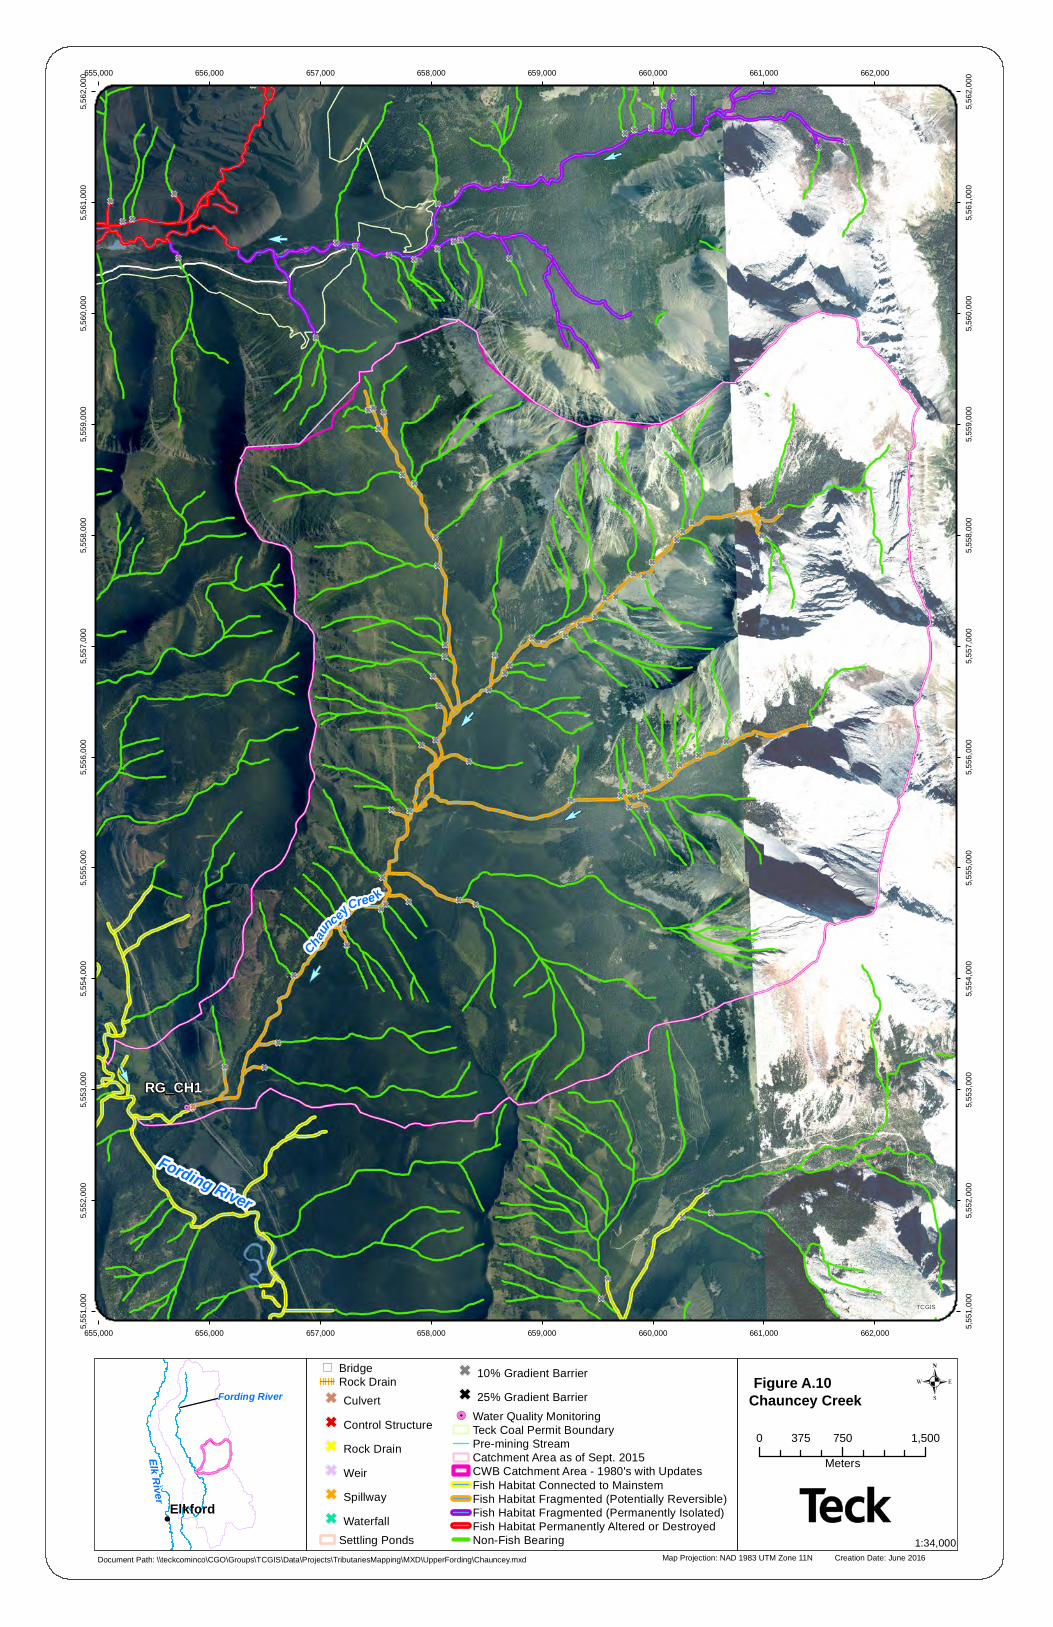
RG_CH1
Chaunc
eyCree k
Fording River
TCGIS
655,000
655,000
656,000
656,000
657,000
657,000
658,000
658,000
659,000
659,000
660,000
660,000
661,000
661,000
662,000
662,0005,551
,000
5,551
,000
5,552
,000
5,552
,000
5,553
,000
5,553
,000
5,554
,000
5,554
,000
5,555
,000
5,555
,000
5,556
,000
5,556
,000
5,557
,000
5,557
,000
5,558
,000
5,558
,000
5,559
,000
5,559
,000
5,560
,000
5,560
,000
5,561
,000
5,561
,000
5,562
,000
5,562
,000
Map Projection: NAD 1983 UTM Zone 11N Creation Date: June 2016
.") Bridge
Rock DrainG CulvertG Control StructureG Rock DrainG WeirG SpillwayG Waterfall
Settling Ponds
G 10% Gradient BarrierG 25% Gradient Barrier
!. Water Quality MonitoringTeck Coal Permit BoundaryPre-mining StreamCatchment Area as of Sept. 2015CWB Catchment Area - 1980's with UpdatesFish Habitat Connected to MainstemFish Habitat Fragmented (Potentially Reversible)Fish Habitat Fragmented (Permanently Isolated)Fish Habitat Permanently Altered or DestroyedNon-Fish Bearing
Figur e A.10 Chauncey Creek
!
Elk River
Fording River
Elkford
Document Path: \\teckcominco\CGO\Groups\TCGIS\Data\Projects\TributariesMapping\MXD\UpperFording\Chauncey.mxd1:34,000
0 750 1,500375Meters
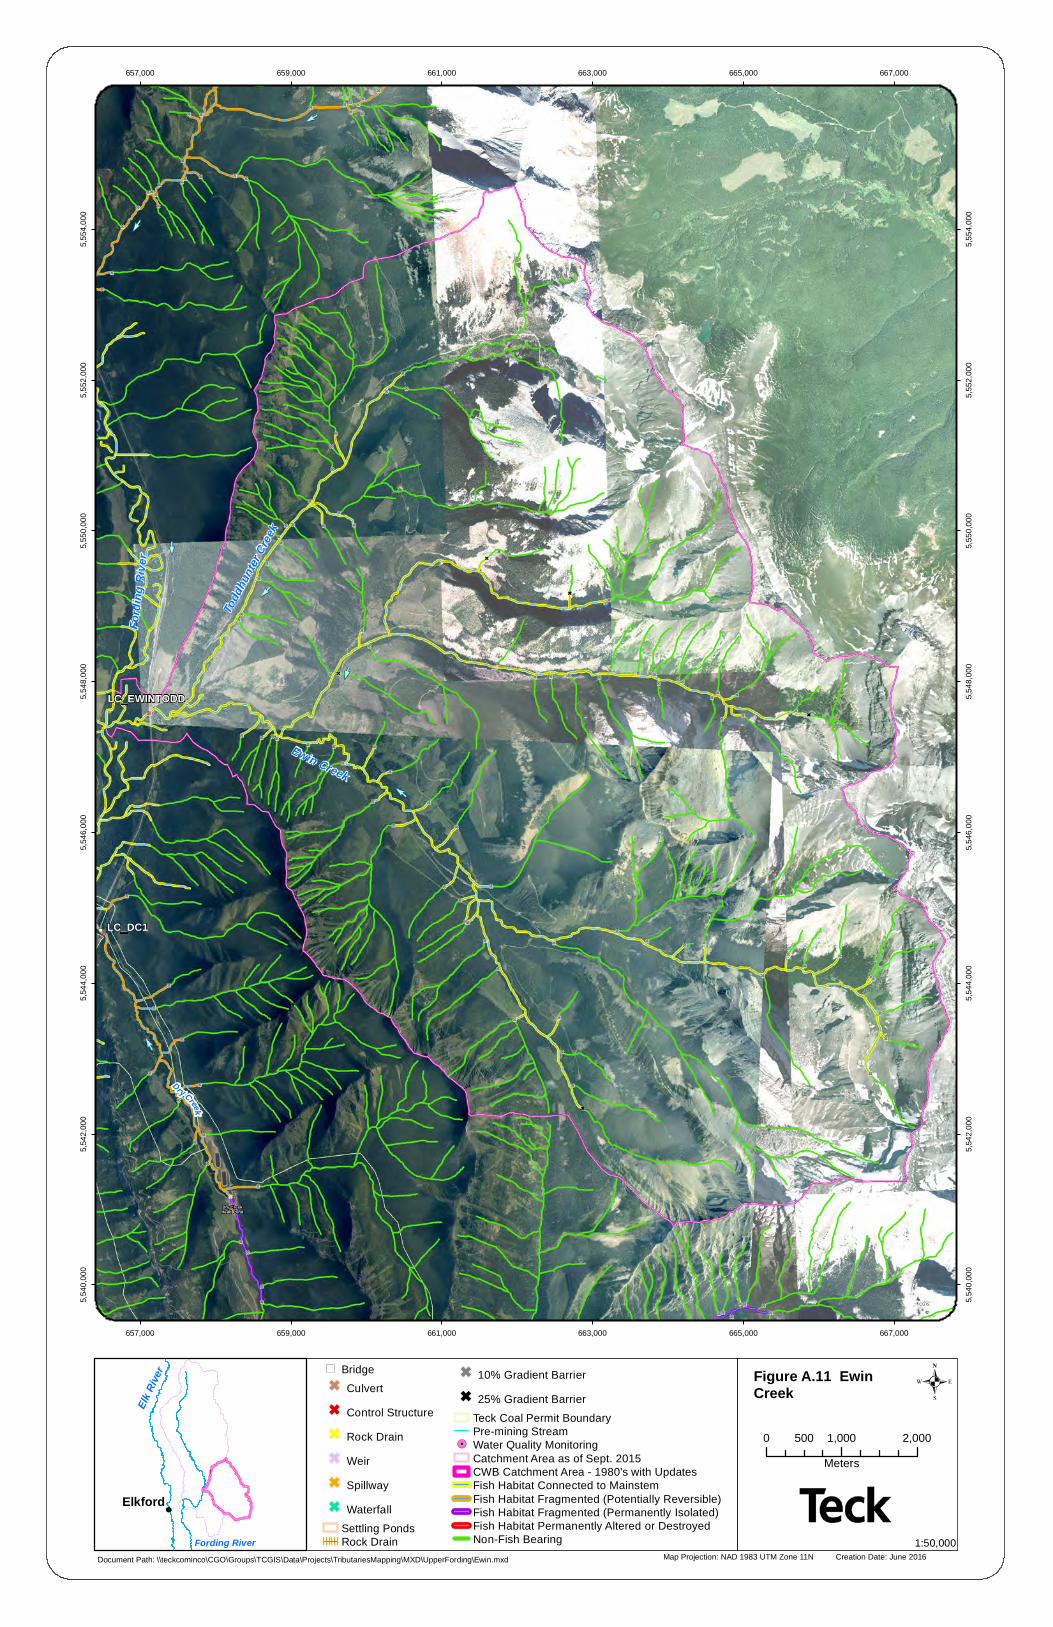
Todd
hunte
r Cree
k
Ewin Creek
Dry CreekHead Pond
LC_DC1
LC_EWINTODD
DryCreek
Ford
ing R
iver
TCGIS
657,000
657,000
659,000
659,000
661,000
661,000
663,000
663,000
665,000
665,000
667,000
667,000
5,540
,000
5,540
,000
5,542
,000
5,542
,000
5,544
,000
5,544
,000
5,546
,000
5,546
,000
5,548
,000
5,548
,000
5,550
,000
5,550
,000
5,552
,000
5,552
,000
5,554
,000
5,554
,000
Map Projection: NAD 1983 UTM Zone 11N Creation Date: June 2016
.") BridgeG CulvertG Control StructureG Rock DrainG WeirG SpillwayG Waterfall
Settling PondsRock Drain
G 10% Gradient BarrierG 25% Gradient Barrier
Teck Coal Permit BoundaryPre-mining Stream
!. Water Quality MonitoringCatchment Area as of Sept. 2015CWB Catchment Area - 1980's with UpdatesFish Habitat Connected to MainstemFish Habitat Fragmented (Potentially Reversible)Fish Habitat Fragmented (Permanently Isolated)Fish Habitat Permanently Altered or DestroyedNon-Fish Bearing
Figure A.11 Ewin Creek
!
Elk Ri
ver
Fording River
Elkford
Document Path: \\teckcominco\CGO\Groups\TCGIS\Data\Projects\TributariesMapping\MXD\UpperFording\Ewin.mxd1:50,000
0 1,000 2,000500Meters
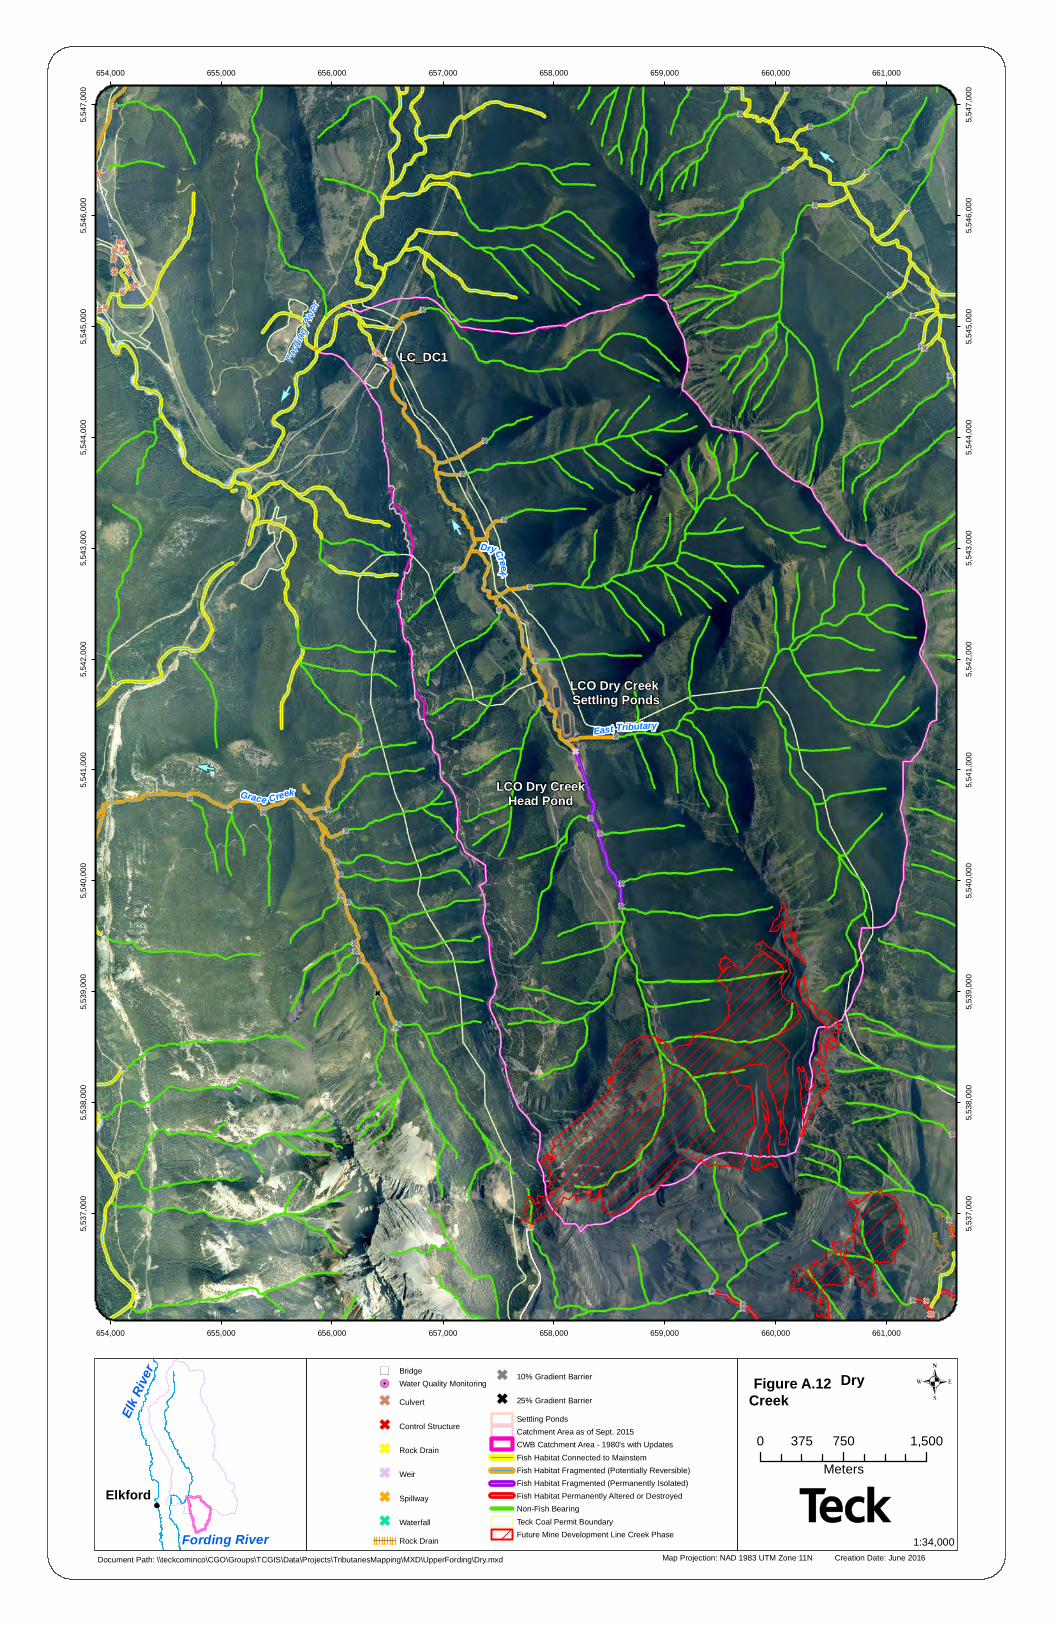
East Tributary
LCO Dry Creek Settling Ponds
LCO Dry CreekHead Pond
LC_DC1
Grace Creek
DryCreek
Fordi
ng Ri
ver
654,000
654,000
655,000
655,000
656,000
656,000
657,000
657,000
658,000
658,000
659,000
659,000
660,000
660,000
661,000
661,000
5,537
,000
5,537
,000
5,538
,000
5,538
,000
5,539
,000
5,539
,000
5,540
,000
5,540
,000
5,541
,000
5,541
,000
5,542
,000
5,542
,000
5,543
,000
5,543
,000
5,544
,000
5,544
,000
5,545
,000
5,545
,000
5,546
,000
5,546
,000
5,547
,000
5,547
,000
Map Projection: NAD 1983 UTM Zone 11N Creation Date: June 2016
.Figure A.12 Dry Creek
!
Elkford
Document Path: \\teckcominco\CGO\Groups\TCGIS\Data\Projects\TributariesMapping\MXD\UpperFording\Dry.mxd
Elk Ri
ver
Fording River
") Bridge!. Water Quality Monitoring
G Culvert
G Control Structure
G Rock Drain
G Weir
G Spillway
G WaterfallRock Drain
G 10% Gradient Barrier
G 25% Gradient BarrierSettling PondsCatchment Area as of Sept. 2015CWB Catchment Area - 1980's with UpdatesFish Habitat Connected to MainstemFish Habitat Fragmented (Potentially Reversible)Fish Habitat Fragmented (Permanently Isolated)Fish Habitat Permanently Altered or DestroyedNon-Fish BearingTeck Coal Permit BoundaryFuture Mine Development Line Creek Phase
0 750 1,500375Meters
1:34,000
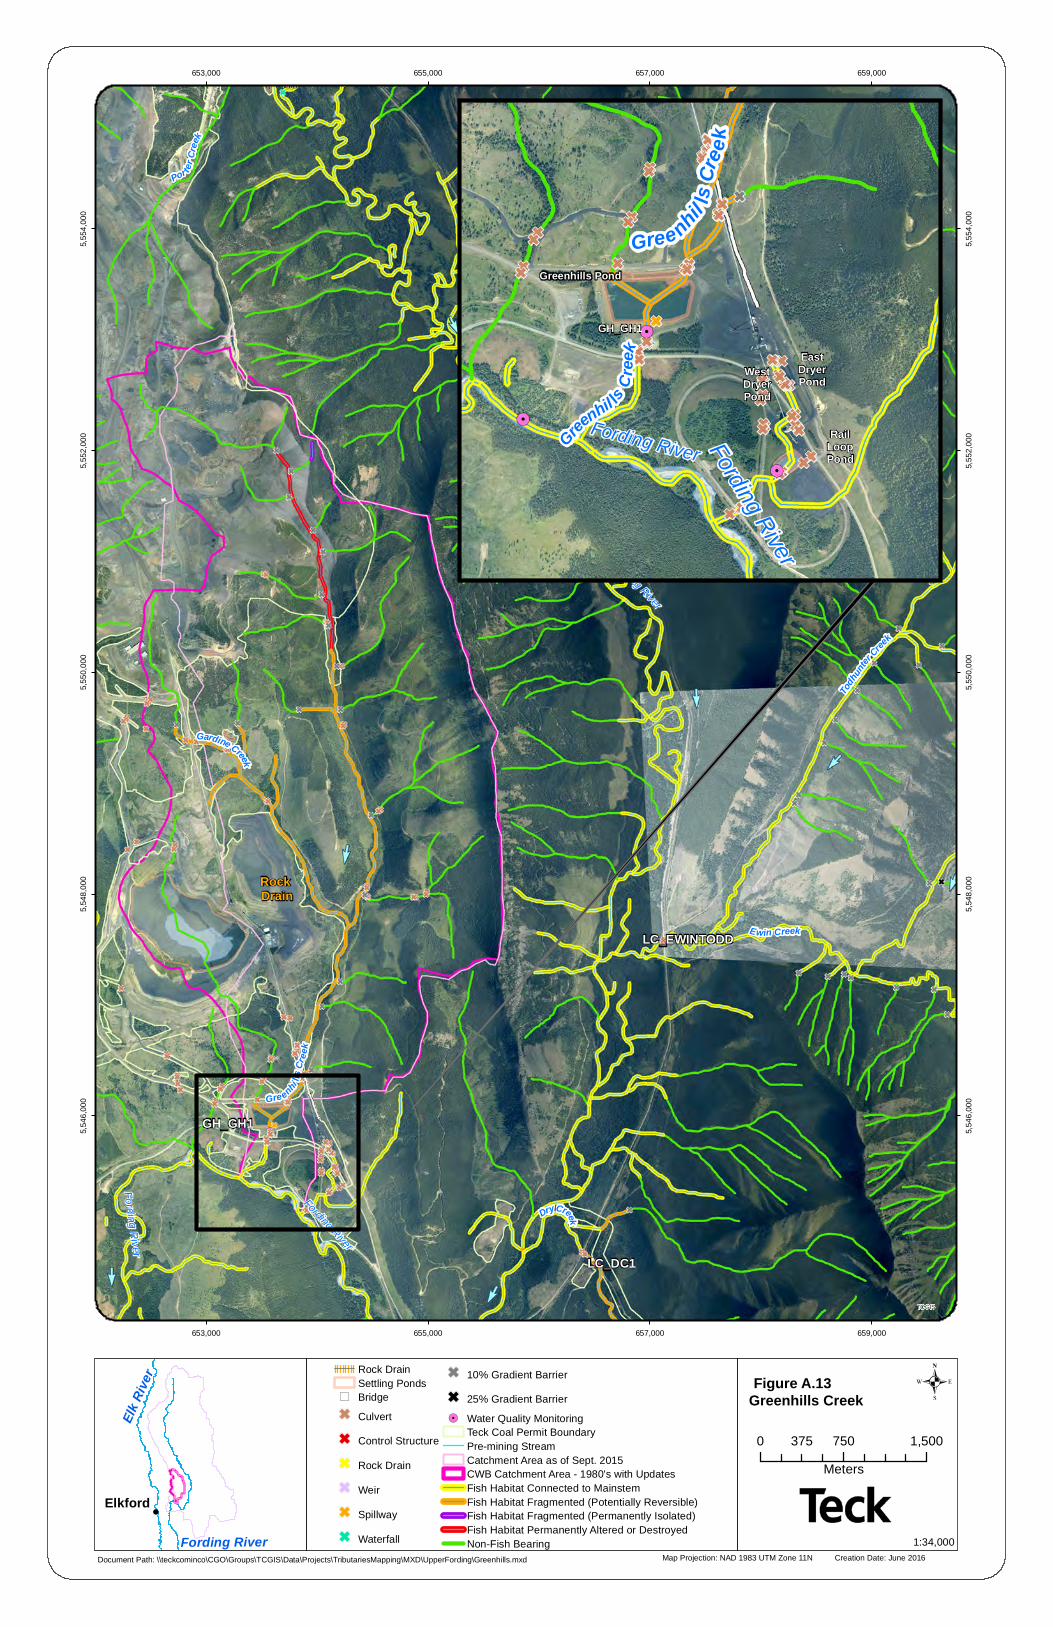
Rock Drain
Falls
GH_GH1
LC_DC1
LC_EWINTODD
RG_CH1Culvert- OutletCulvert -
InletCulvert- Outlet
Culvert- Inlet
Fording River
Fording River
Fording River
Chaun
cey
Creek
Todh
unter
Creek
Gre enhills
Cree
k
Por terCr
eek
Gardine Creek
DryCreek
Ewin Creek
TCGIS
653,000
653,000
655,000
655,000
657,000
657,000
659,000
659,000
5,546
,000
5,546
,000
5,548
,000
5,548
,000
5,550
,000
5,550
,000
5,552
,000
5,552
,000
5,554
,000
5,554
,000
Map Projection: NAD 1983 UTM Zone 11N Creation Date: June 2016
.Figure A.13 Greenhills Creek
!Elkford
Document Path: \\teckcominco\CGO\Groups\TCGIS\Data\Projects\TributariesMapping\MXD\UpperFording\Greenhills.mxd
Text
Elk Ri
ver
Fording River
Rock DrainSettling Ponds
") BridgeG Culvert
G Control Structure
G Rock Drain
G Weir
G Spillway
G Waterfall
G 10% Gradient Barrier
G 25% Gradient Barrier!. Water Quality Monitoring
Teck Coal Permit BoundaryPre-mining StreamCatchment Area as of Sept. 2015CWB Catchment Area - 1980's with UpdatesFish Habitat Connected to MainstemFish Habitat Fragmented (Potentially Reversible)Fish Habitat Fragmented (Permanently Isolated)Fish Habitat Permanently Altered or DestroyedNon-Fish Bearing
0 750 1,500375Meters
1:34,000
Greenhills Pond
RailLoopPond
WestDryerPond
EastDryerPond
GH_GH1
Gree nhills
Cree
k
Fording River
Fording RiverGreenhil ls
Cree
k
APPENDIX B
TRIBUTARIES TO LOWER FORDING RIVER (MU2)
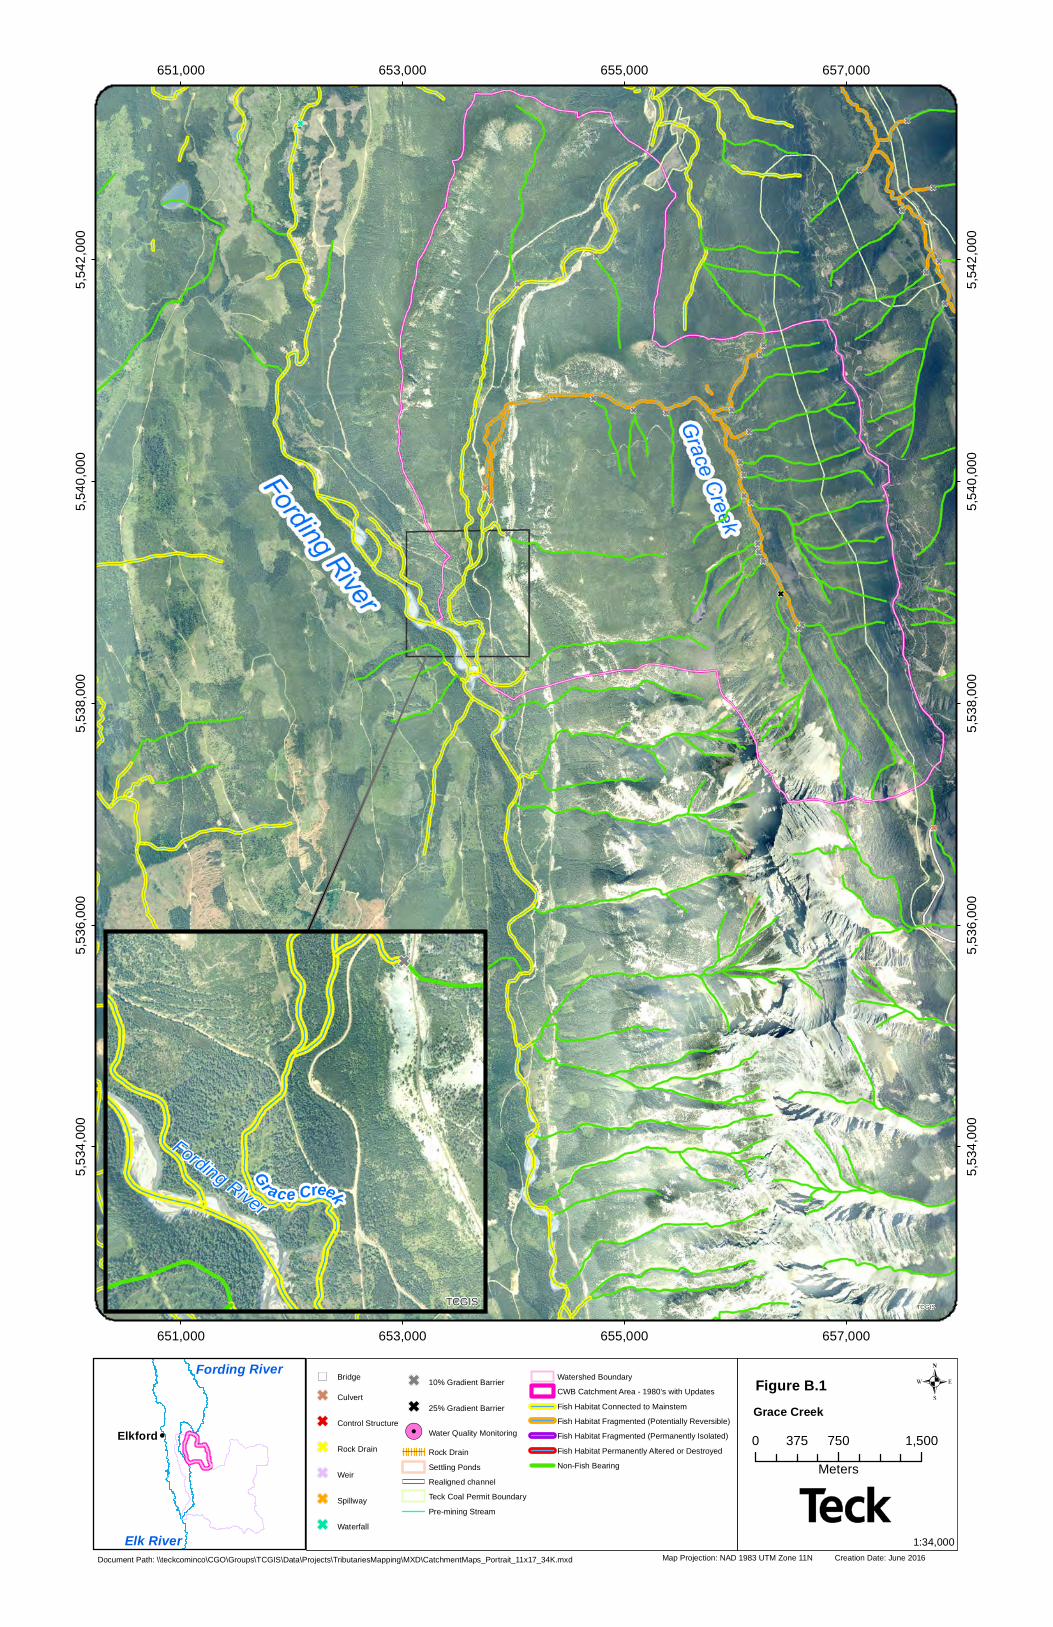
TCGIS
651,000
651,000
653,000
653,000
655,000
655,000
657,000
657,000
5,534
,000
5,534
,000
5,536
,000
5,536
,000
5,538
,000
5,538
,000
5,540
,000
5,540
,000
5,542
,000
5,542
,000
Map Projection: NAD 1983 UTM Zone 11N Creation Date: June 2016
.
Document Path: \\teckcominco\CGO\Groups\TCGIS\Data\Projects\TributariesMapping\MXD\CatchmentMaps_Portrait_11x17_34K.mxd
Text
0 750 1,500375Meters
1:34,000
") Bridge
G Culvert
G Control Structure
G Rock Drain
G Weir
G Spillway
G Waterfall
G 10% Gradient Barrier
G 25% Gradient Barrier
!. Water Quality MonitoringRock DrainSettling PondsRealigned channelTeck Coal Permit BoundaryPre-mining Stream
Watershed BoundaryCWB Catchment Area - 1980's with UpdatesFish Habitat Connected to MainstemFish Habitat Fragmented (Potentially Reversible)Fish Habitat Fragmented (Permanently Isolated)Fish Habitat Permanently Altered or DestroyedNon-Fish Bearing
Grace Creek!Elkford
Elk River
Fording River
Fording River
Gr ace Creek
TCGIS
Figure B.1
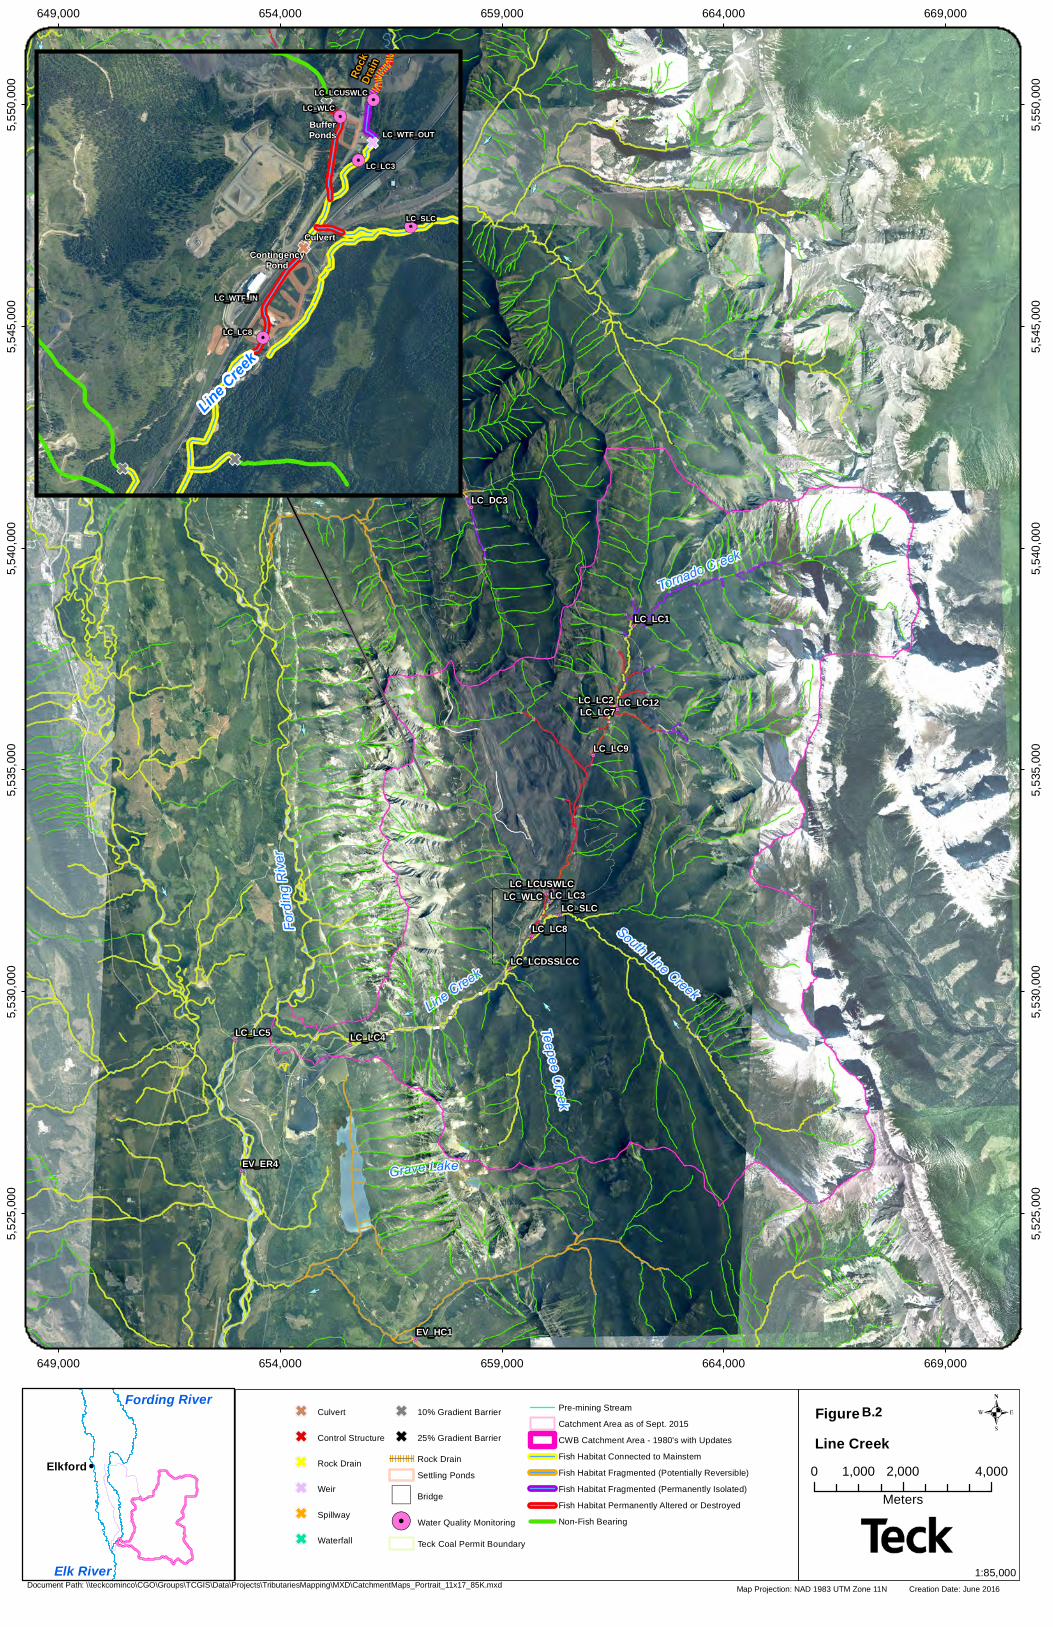
EV_ER4
EV_HC1
GH_ER1
GH_ERC
GH_FR1GH_GH1
GH_RLP
GH_TC1GH_TC2
GH_TPS
LC_DC3
LC_LC1
LC_LC12LC_LC2
LC_LC3
LC_LC4LC_LC5
LC_LC7
LC_LC8
LC_LC9
LC_LCDSSLCC
LC_LCUSWLC
LC_SLCLC_WLC
TCGIS
649,000
649,000
654,000
654,000
659,000
659,000
664,000
664,000
669,000
669,000
5,525
,000
5,525
,000
5,530
,000
5,530
,000
5,535
,000
5,535
,000
5,540
,000
5,540
,000
5,545
,000
5,545
,000
5,550
,000
5,550
,000
Map Projection: NAD 1983 UTM Zone 11N Creation Date: June 2016
.Figure
Document Path: \\teckcominco\CGO\Groups\TCGIS\Data\Projects\TributariesMapping\MXD\CatchmentMaps_Portrait_11x17_85K.mxd
Text
0 2,000 4,0001,000Meters
1:85,000
G Culvert
G Control Structure
G Rock Drain
G Weir
G Spillway
G Waterfall
G 10% Gradient Barrier
G 25% Gradient Barrier
Rock DrainSettling Ponds
") Bridge
!. Water Quality Monitoring
Teck Coal Permit Boundary
Pre-mining StreamCatchment Area as of Sept. 2015CWB Catchment Area - 1980's with UpdatesFish Habitat Connected to MainstemFish Habitat Fragmented (Potentially Reversible)Fish Habitat Fragmented (Permanently Isolated)Fish Habitat Permanently Altered or DestroyedNon-Fish Bearing
Line Creek!Elkford
Elk River
Fording River
CulvertContingency
Pond
BufferPonds
LC_LC3
LC_LC8
LC_LCUSWLC
LC_SLC
LC_WLC
LC_WTF_IN
LC_WTF_OUT
Line Cree
k
Rock
Drain
B.2
APPENDIX C
TRIBUTARIES TO UPPER ELK RIVER (MU3)
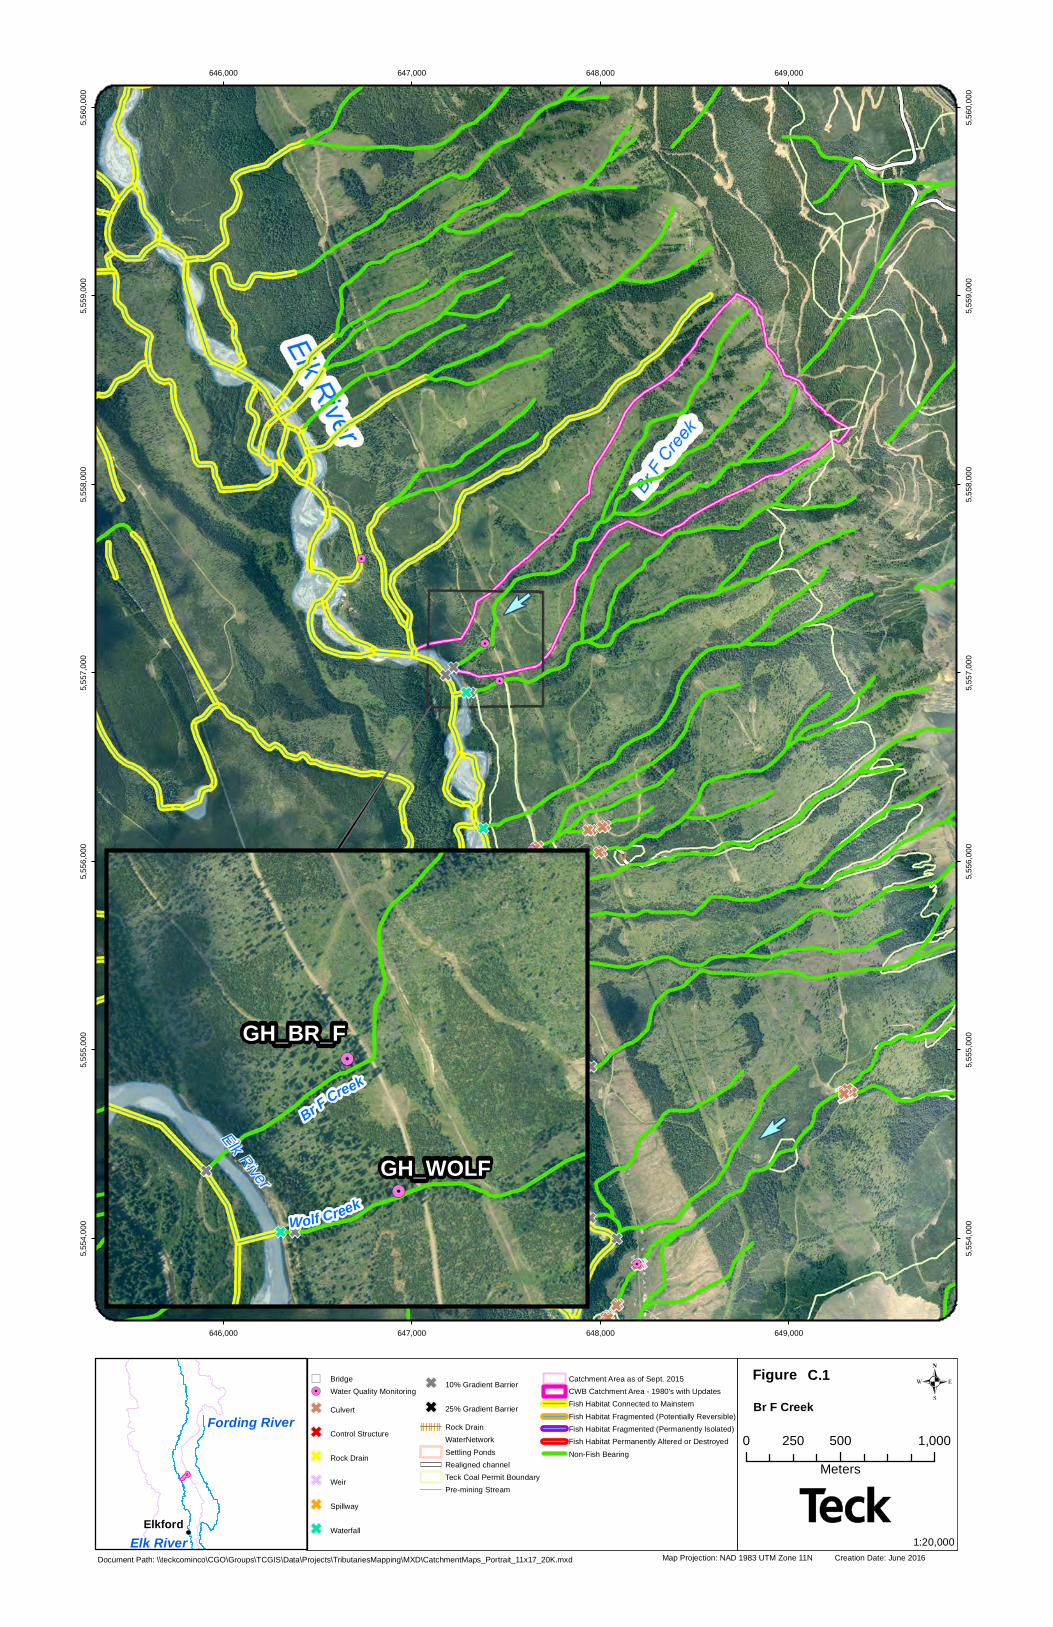
646,000
646,000
647,000
647,000
648,000
648,000
649,000
649,000
5,554
,000
5,554
,000
5,555
,000
5,555
,000
5,556
,000
5,556
,000
5,557
,000
5,557
,000
5,558
,000
5,558
,000
5,559
,000
5,559
,000
5,560
,000
5,560
,000
Map Projection: NAD 1983 UTM Zone 11N Creation Date: June 2016
.Figure
Document Path: \\teckcominco\CGO\Groups\TCGIS\Data\Projects\TributariesMapping\MXD\CatchmentMaps_Portrait_11x17_20K.mxd
Text
0 500 1,000250Meters
1:20,000
Br F Creek
!Elkford
Elk River
Fording River
GH_BR_F
GH_WOLFWolf Creek
Br F Creek
Elk River
C.1") Bridge!. Water Quality Monitoring
G Culvert
G Control Structure
G Rock Drain
G Weir
G Spillway
G Waterfall
G 10% Gradient Barrier
G 25% Gradient BarrierRock DrainWaterNetworkSettling PondsRealigned channelTeck Coal Permit BoundaryPre-mining Stream
Catchment Area as of Sept. 2015CWB Catchment Area - 1980's with UpdatesFish Habitat Connected to MainstemFish Habitat Fragmented (Potentially Reversible)Fish Habitat Fragmented (Permanently Isolated)Fish Habitat Permanently Altered or DestroyedNon-Fish Bearing
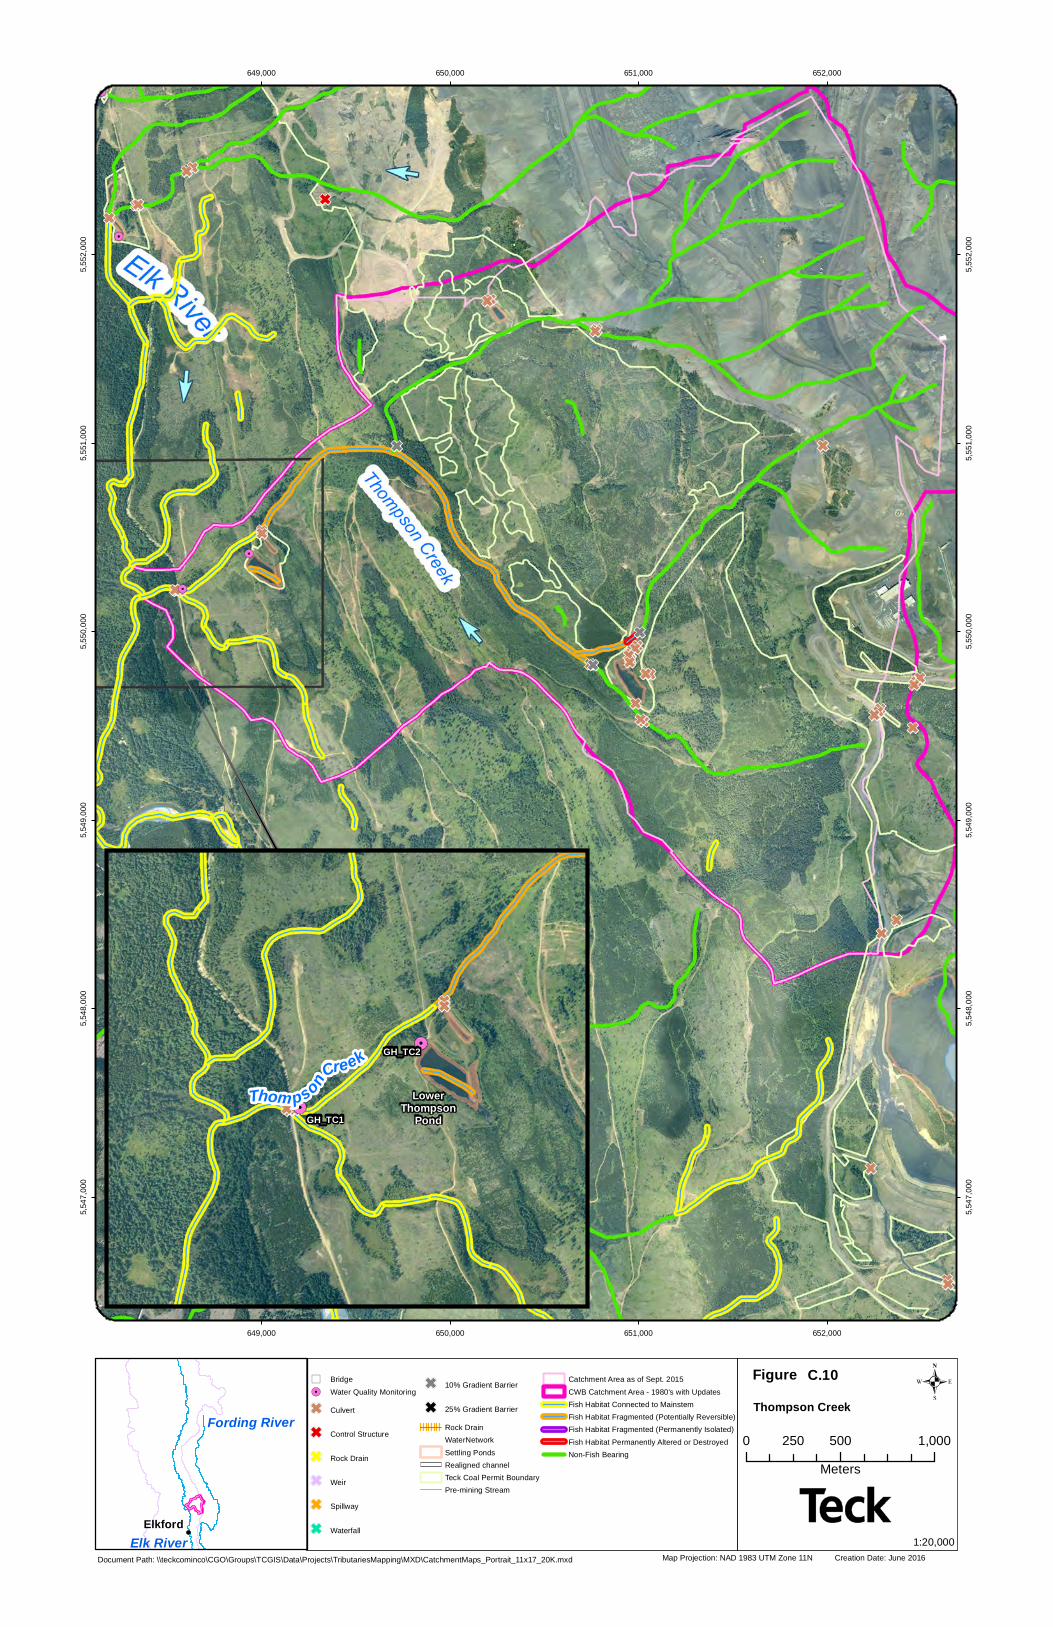
649,000
649,000
650,000
650,000
651,000
651,000
652,000
652,000
5,547
,000
5,547
,000
5,548
,000
5,548
,000
5,549
,000
5,549
,000
5,550
,000
5,550
,000
5,551
,000
5,551
,000
5,552
,000
5,552
,000
Map Projection: NAD 1983 UTM Zone 11N Creation Date: June 2016
.Figure
Document Path: \\teckcominco\CGO\Groups\TCGIS\Data\Projects\TributariesMapping\MXD\CatchmentMaps_Portrait_11x17_20K.mxd
Text
0 500 1,000250Meters
1:20,000
Thompson Creek
!Elkford
Elk River
Fording River
LowerThompson
PondGH_TC1
GH_TC2
ThompsonCreek
C.10") Bridge!. Water Quality Monitoring
G Culvert
G Control Structure
G Rock Drain
G Weir
G Spillway
G Waterfall
G 10% Gradient Barrier
G 25% Gradient BarrierRock DrainWaterNetworkSettling PondsRealigned channelTeck Coal Permit BoundaryPre-mining Stream
Catchment Area as of Sept. 2015CWB Catchment Area - 1980's with UpdatesFish Habitat Connected to MainstemFish Habitat Fragmented (Potentially Reversible)Fish Habitat Fragmented (Permanently Isolated)Fish Habitat Permanently Altered or DestroyedNon-Fish Bearing
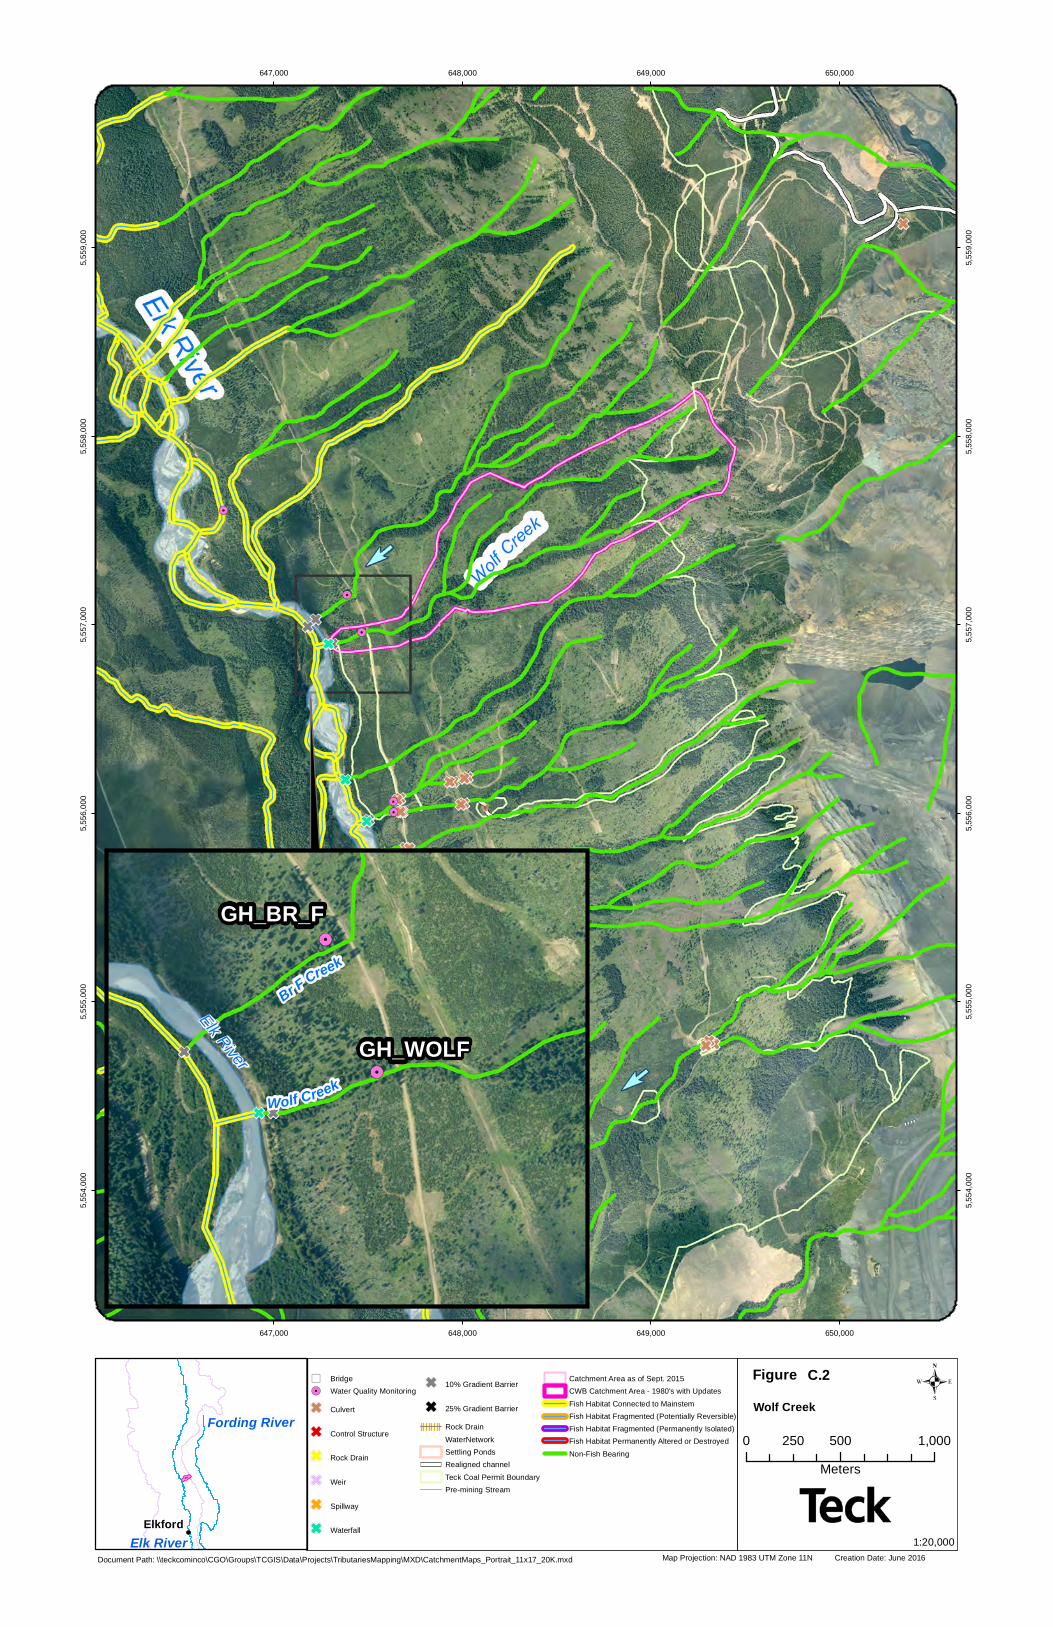
647,000
647,000
648,000
648,000
649,000
649,000
650,000
650,000
5,554
,000
5,554
,000
5,555
,000
5,555
,000
5,556
,000
5,556
,000
5,557
,000
5,557
,000
5,558
,000
5,558
,000
5,559
,000
5,559
,000
Map Projection: NAD 1983 UTM Zone 11N Creation Date: June 2016
.Figure
Document Path: \\teckcominco\CGO\Groups\TCGIS\Data\Projects\TributariesMapping\MXD\CatchmentMaps_Portrait_11x17_20K.mxd
Text
0 500 1,000250Meters
1:20,000
Wolf Creek
!Elkford
Elk River
Fording River
GH_BR_F
GH_WOLFWolf Creek
Br F Creek
Elk River
C.2") Bridge!. Water Quality Monitoring
G Culvert
G Control Structure
G Rock Drain
G Weir
G Spillway
G Waterfall
G 10% Gradient Barrier
G 25% Gradient BarrierRock DrainWaterNetworkSettling PondsRealigned channelTeck Coal Permit BoundaryPre-mining Stream
Catchment Area as of Sept. 2015CWB Catchment Area - 1980's with UpdatesFish Habitat Connected to MainstemFish Habitat Fragmented (Potentially Reversible)Fish Habitat Fragmented (Permanently Isolated)Fish Habitat Permanently Altered or DestroyedNon-Fish Bearing
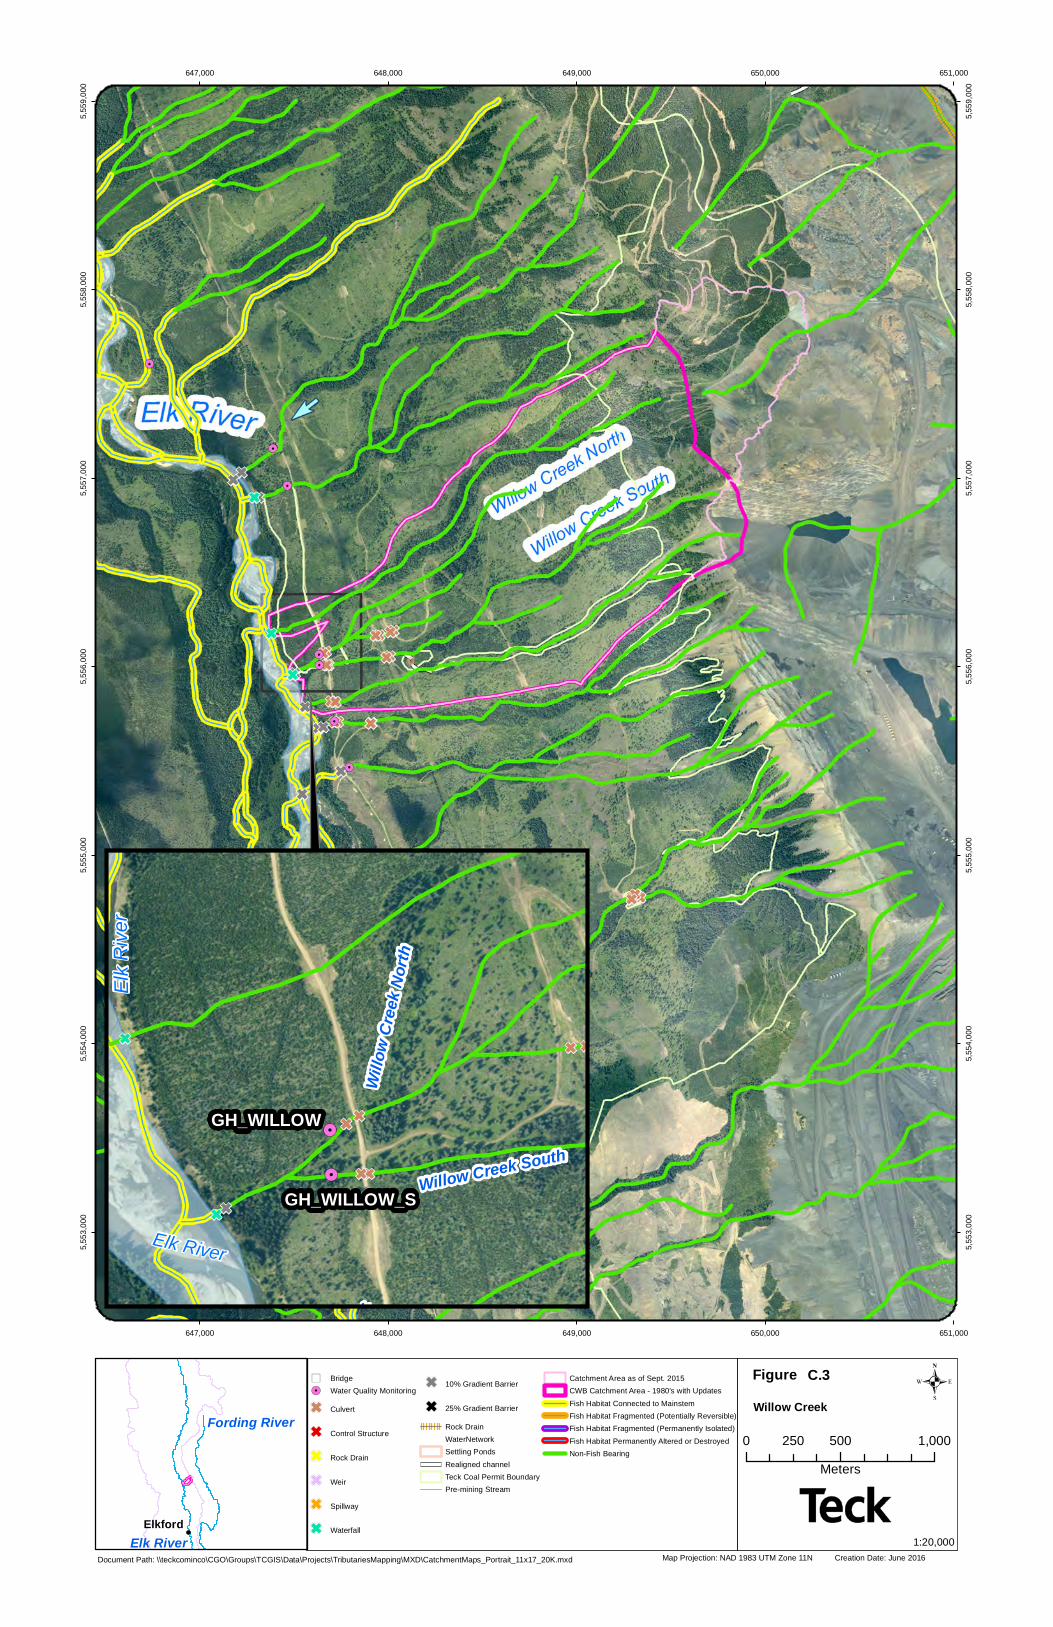
647,000
647,000
648,000
648,000
649,000
649,000
650,000
650,000
651,000
651,000
5,553
,000
5,553
,000
5,554
,000
5,554
,000
5,555
,000
5,555
,000
5,556
,000
5,556
,000
5,557
,000
5,557
,000
5,558
,000
5,558
,000
5,559
,000
5,559
,000
Map Projection: NAD 1983 UTM Zone 11N Creation Date: June 2016
.Figure
Document Path: \\teckcominco\CGO\Groups\TCGIS\Data\Projects\TributariesMapping\MXD\CatchmentMaps_Portrait_11x17_20K.mxd
Text
0 500 1,000250Meters
1:20,000
Willow Creek
!Elkford
Elk River
Fording River
Willo
w Cr
eek N
orth
Willow Creek South
Wilde Creek
GH_WILLOW
GH_WILLOW_S
Elk R
iver
Elk River
C.3") Bridge!. Water Quality Monitoring
G Culvert
G Control Structure
G Rock Drain
G Weir
G Spillway
G Waterfall
G 10% Gradient Barrier
G 25% Gradient Barrier
Rock DrainWaterNetworkSettling PondsRealigned channelTeck Coal Permit BoundaryPre-mining Stream
Catchment Area as of Sept. 2015CWB Catchment Area - 1980's with UpdatesFish Habitat Connected to MainstemFish Habitat Fragmented (Potentially Reversible)Fish Habitat Fragmented (Permanently Isolated)Fish Habitat Permanently Altered or DestroyedNon-Fish Bearing
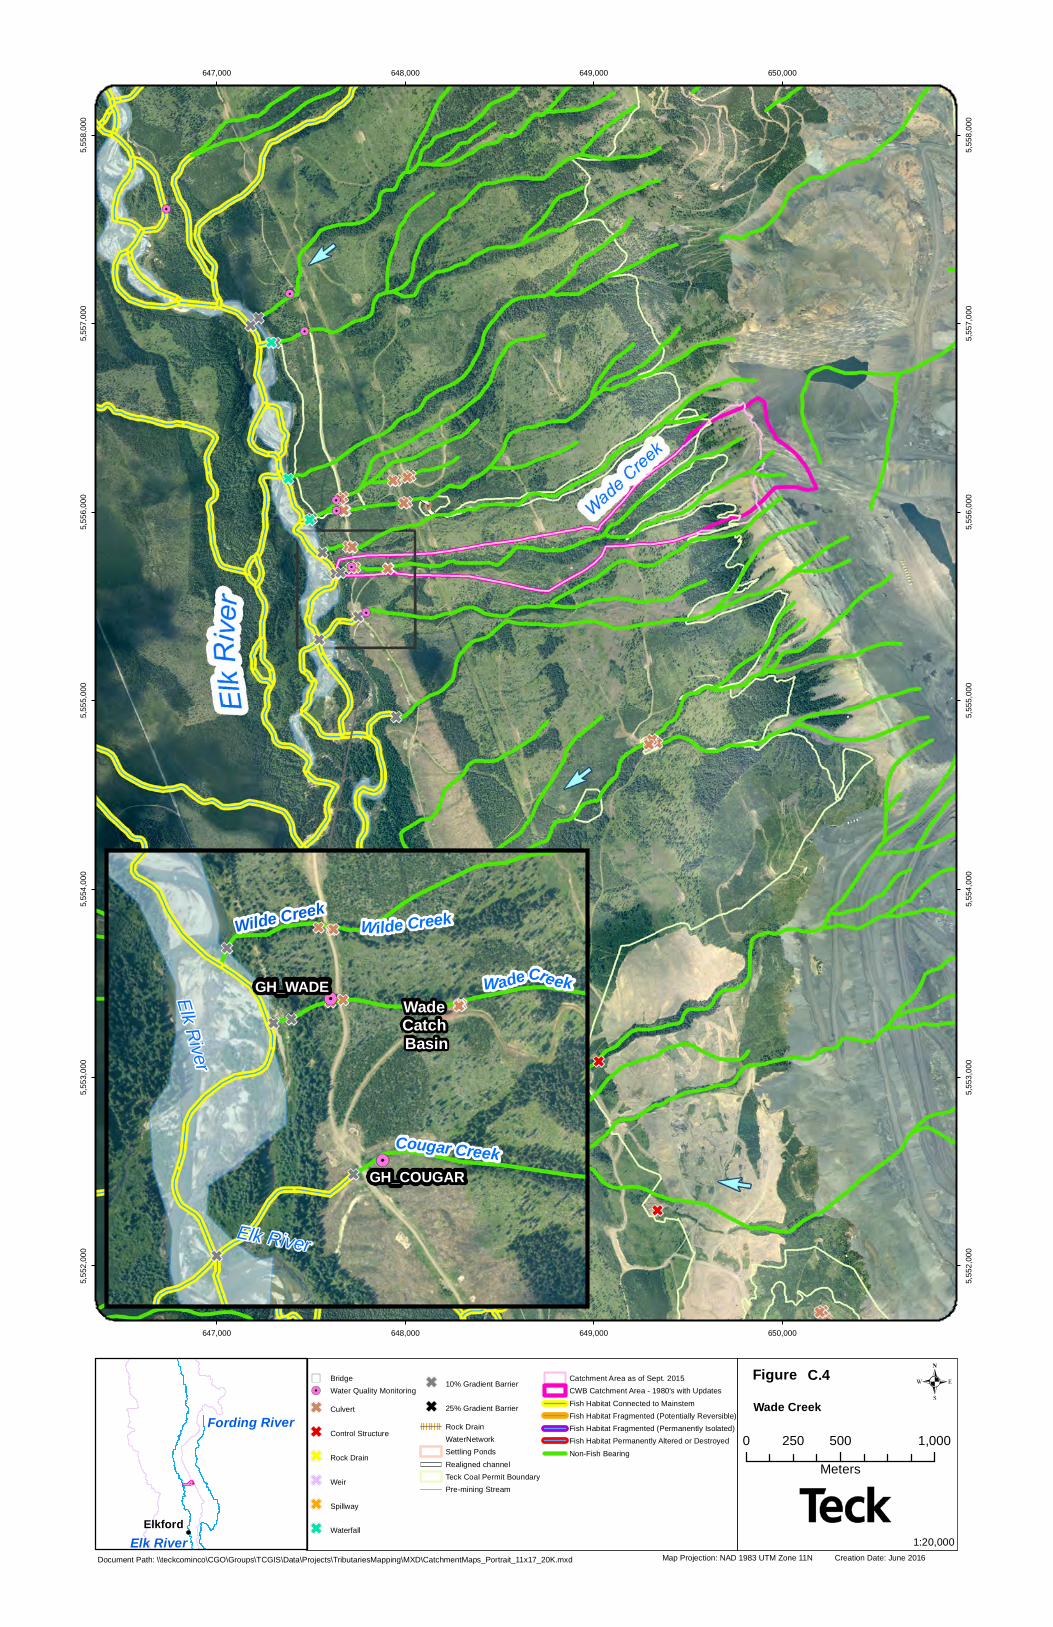
647,000
647,000
648,000
648,000
649,000
649,000
650,000
650,000
5,552
,000
5,552
,000
5,553
,000
5,553
,000
5,554
,000
5,554
,000
5,555
,000
5,555
,000
5,556
,000
5,556
,000
5,557
,000
5,557
,000
5,558
,000
5,558
,000
Map Projection: NAD 1983 UTM Zone 11N Creation Date: June 2016
.Figure
Document Path: \\teckcominco\CGO\Groups\TCGIS\Data\Projects\TributariesMapping\MXD\CatchmentMaps_Portrait_11x17_20K.mxd
Text
0 500 1,000250Meters
1:20,000
Wade Creek
!Elkford
Elk River
Fording River
Wade Catch Basin
Wilde Creek
GH_COUGAR
GH_WADEElk River
Elk River
Cougar Creek
Wade Creek
Wilde Creek
C.4") Bridge!. Water Quality Monitoring
G Culvert
G Control Structure
G Rock Drain
G Weir
G Spillway
G Waterfall
G 10% Gradient Barrier
G 25% Gradient Barrier
Rock DrainWaterNetworkSettling PondsRealigned channelTeck Coal Permit BoundaryPre-mining Stream
Catchment Area as of Sept. 2015CWB Catchment Area - 1980's with UpdatesFish Habitat Connected to MainstemFish Habitat Fragmented (Potentially Reversible)Fish Habitat Fragmented (Permanently Isolated)Fish Habitat Permanently Altered or DestroyedNon-Fish Bearing
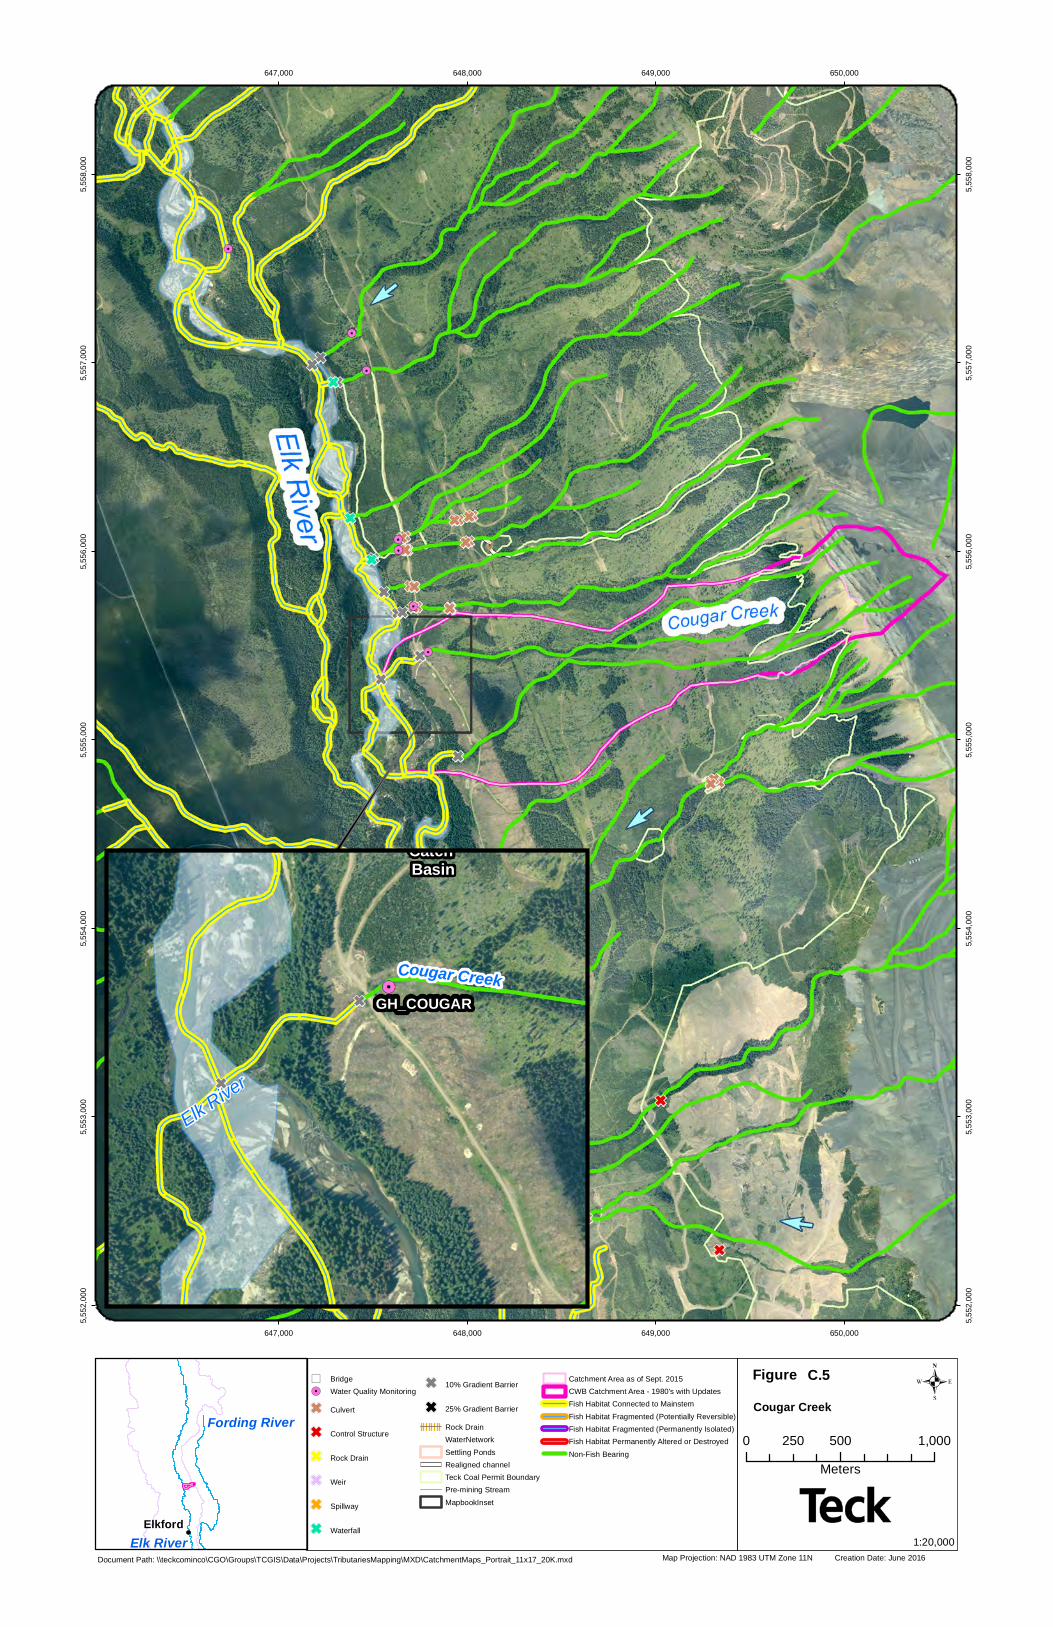
647,000
647,000
648,000
648,000
649,000
649,000
650,000
650,000
5,552
,000
5,552
,000
5,553
,000
5,553
,000
5,554
,000
5,554
,000
5,555
,000
5,555
,000
5,556
,000
5,556
,000
5,557
,000
5,557
,000
5,558
,000
5,558
,000
Map Projection: NAD 1983 UTM Zone 11N Creation Date: June 2016
.Figure
Document Path: \\teckcominco\CGO\Groups\TCGIS\Data\Projects\TributariesMapping\MXD\CatchmentMaps_Portrait_11x17_20K.mxd
Text
0 500 1,000250Meters
1:20,000
Cougar Creek
!Elkford
Elk River
Fording River
WadeCatchBasin
Culvert Culvert
GH_COUGAR
Elk River
Cougar Creek
C.5") Bridge!. Water Quality Monitoring
G Culvert
G Control Structure
G Rock Drain
G Weir
G Spillway
G Waterfall
G 10% Gradient Barrier
G 25% Gradient BarrierRock DrainWaterNetworkSettling PondsRealigned channelTeck Coal Permit BoundaryPre-mining StreamMapbookInset
Catchment Area as of Sept. 2015CWB Catchment Area - 1980's with UpdatesFish Habitat Connected to MainstemFish Habitat Fragmented (Potentially Reversible)Fish Habitat Fragmented (Permanently Isolated)Fish Habitat Permanently Altered or DestroyedNon-Fish Bearing
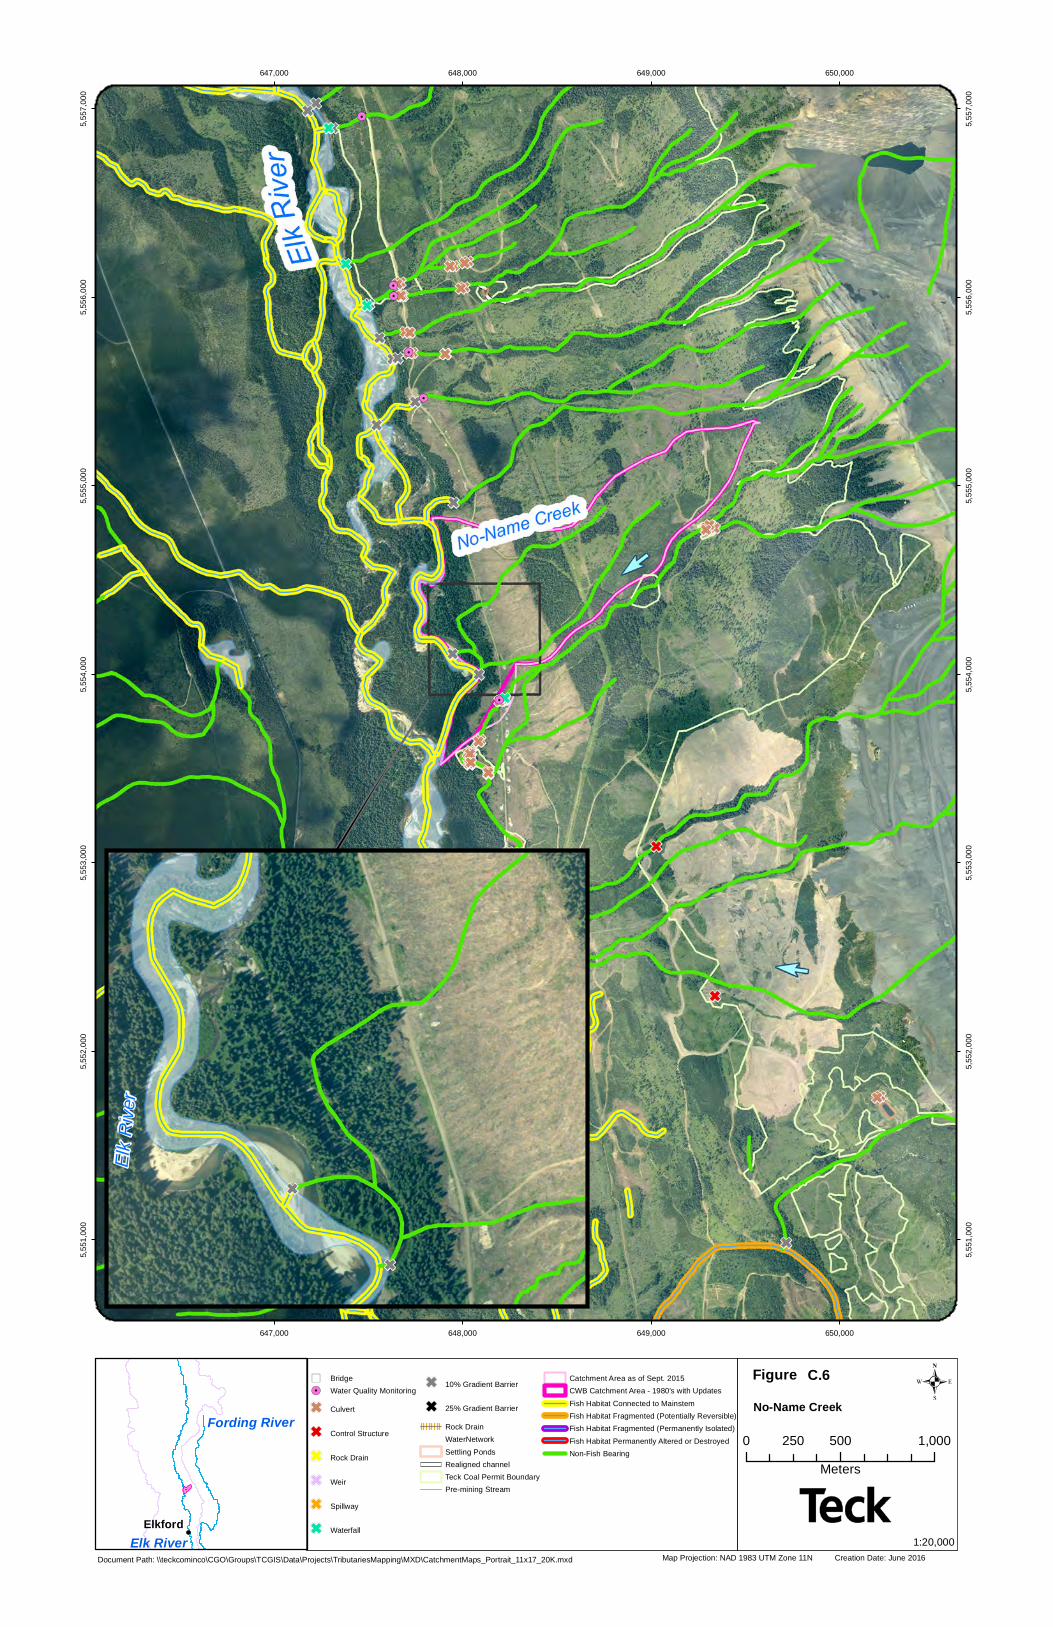
647,000
647,000
648,000
648,000
649,000
649,000
650,000
650,000
5,551
,000
5,551
,000
5,552
,000
5,552
,000
5,553
,000
5,553
,000
5,554
,000
5,554
,000
5,555
,000
5,555
,000
5,556
,000
5,556
,000
5,557
,000
5,557
,000
Map Projection: NAD 1983 UTM Zone 11N Creation Date: June 2016
.Figure
Document Path: \\teckcominco\CGO\Groups\TCGIS\Data\Projects\TributariesMapping\MXD\CatchmentMaps_Portrait_11x17_20K.mxd
Text
0 500 1,000250Meters
1:20,000
No-Name Creek
!Elkford
Elk River
Fording River
Mick
elson Cree
k
Elk R
iver
C.6") Bridge!. Water Quality Monitoring
G Culvert
G Control Structure
G Rock Drain
G Weir
G Spillway
G Waterfall
G 10% Gradient Barrier
G 25% Gradient Barrier
Rock DrainWaterNetworkSettling PondsRealigned channelTeck Coal Permit BoundaryPre-mining Stream
Catchment Area as of Sept. 2015CWB Catchment Area - 1980's with UpdatesFish Habitat Connected to MainstemFish Habitat Fragmented (Potentially Reversible)Fish Habitat Fragmented (Permanently Isolated)Fish Habitat Permanently Altered or DestroyedNon-Fish Bearing
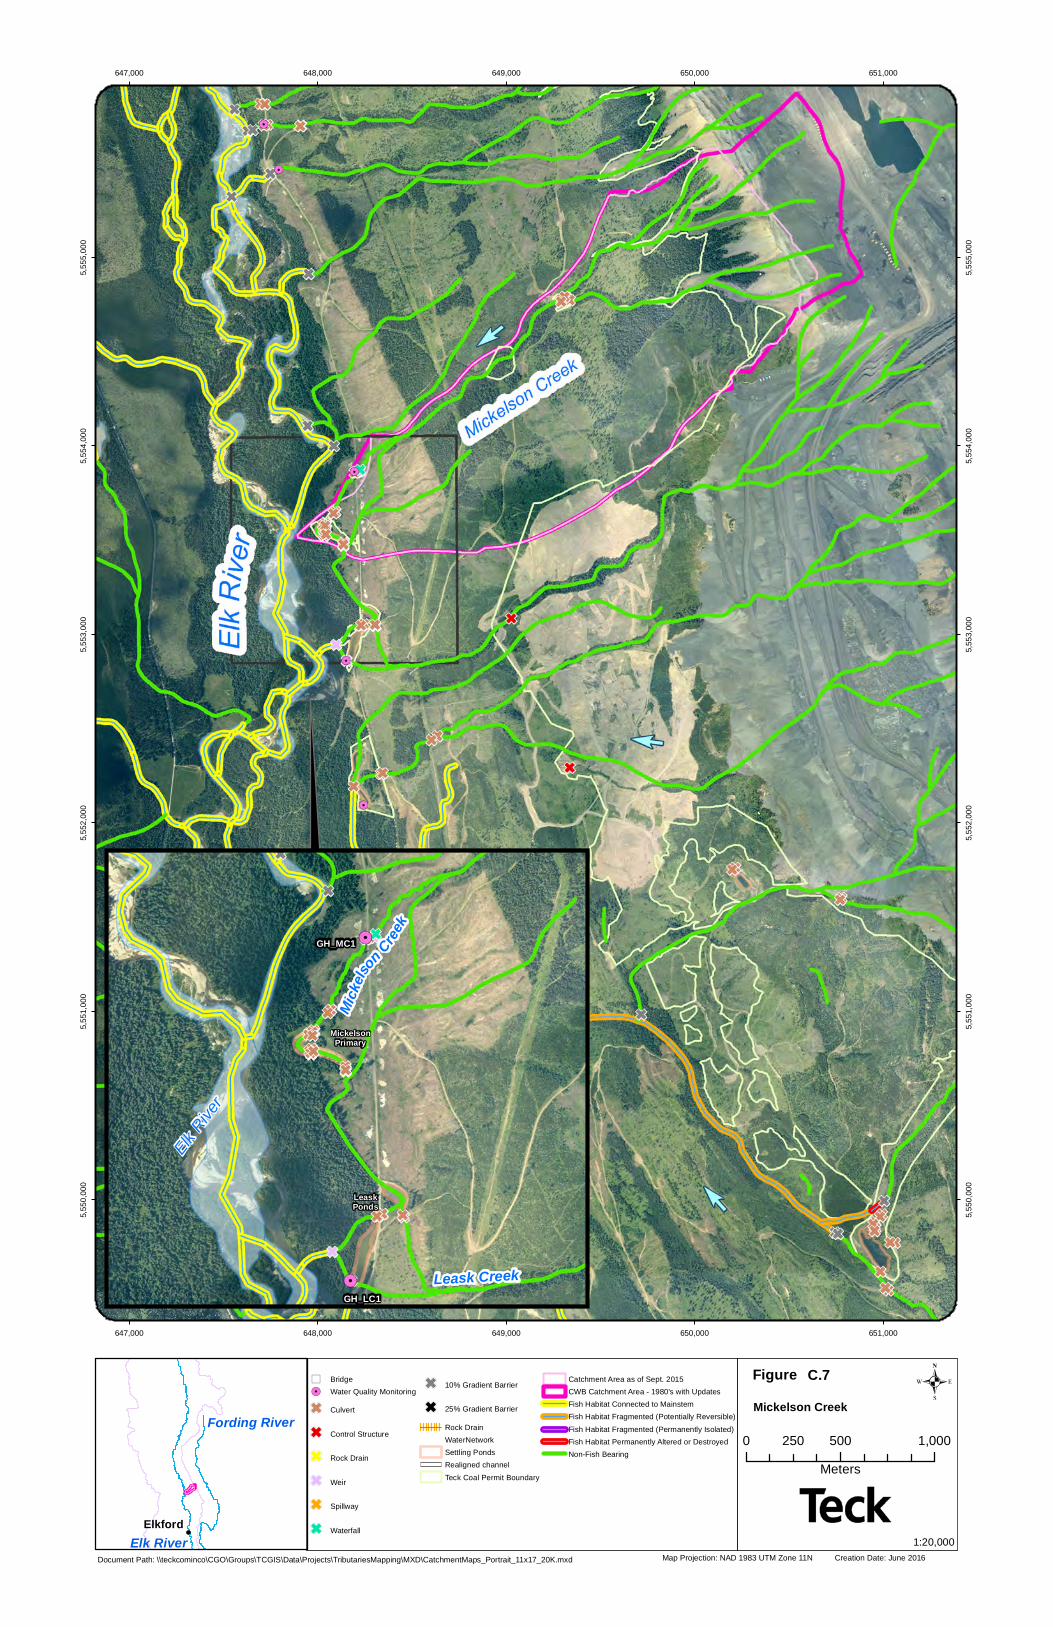
647,000
647,000
648,000
648,000
649,000
649,000
650,000
650,000
651,000
651,000
5,550
,000
5,550
,000
5,551
,000
5,551
,000
5,552
,000
5,552
,000
5,553
,000
5,553
,000
5,554
,000
5,554
,000
5,555
,000
5,555
,000
Map Projection: NAD 1983 UTM Zone 11N Creation Date: June 2016
.Figure
Document Path: \\teckcominco\CGO\Groups\TCGIS\Data\Projects\TributariesMapping\MXD\CatchmentMaps_Portrait_11x17_20K.mxd
Text
0 500 1,000250Meters
1:20,000
Mickelson Creek
!Elkford
Elk River
Fording River
LeaskPonds
MickelsonPrimary
GH_LC1
GH_MC1
Mick
elson Cree
k
Leask Creek
Elk Rive
r
C.7") Bridge!. Water Quality Monitoring
G Culvert
G Control Structure
G Rock Drain
G Weir
G Spillway
G Waterfall
G 10% Gradient Barrier
G 25% Gradient Barrier
Rock DrainWaterNetworkSettling PondsRealigned channelTeck Coal Permit Boundary
Catchment Area as of Sept. 2015CWB Catchment Area - 1980's with UpdatesFish Habitat Connected to MainstemFish Habitat Fragmented (Potentially Reversible)Fish Habitat Fragmented (Permanently Isolated)Fish Habitat Permanently Altered or DestroyedNon-Fish Bearing
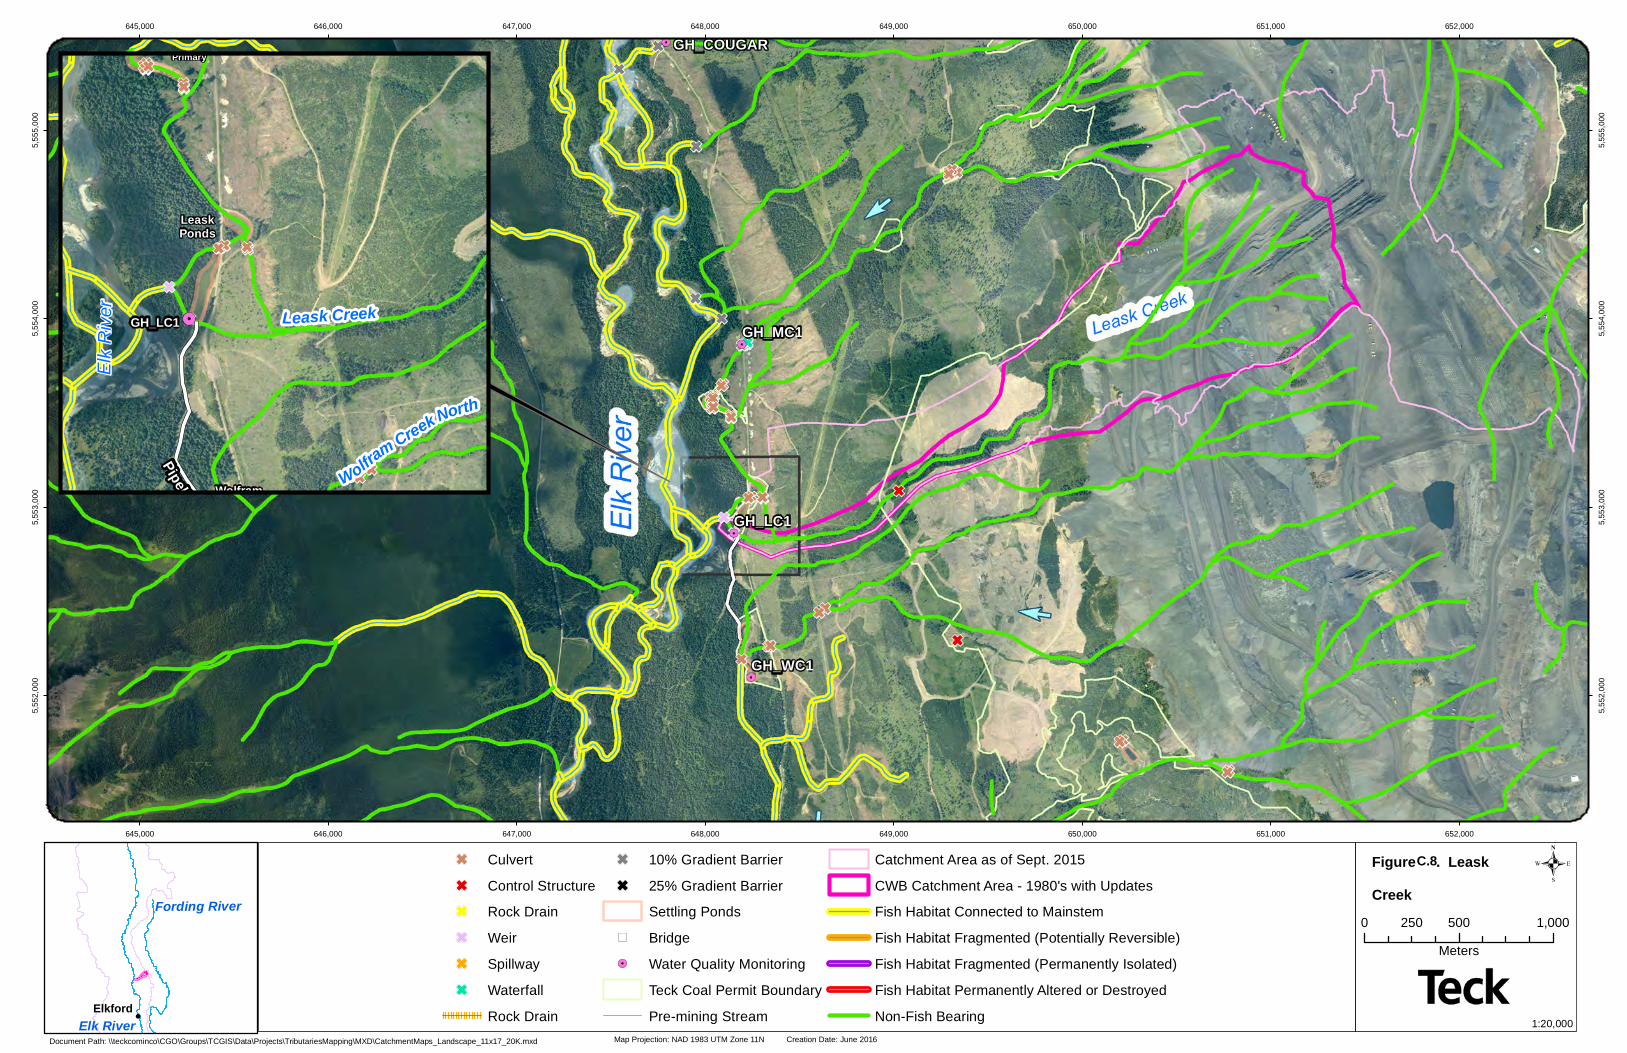
GH_COUGAR
GH_LC1
GH_MC1
GH_WC1
645,000
645,000
646,000
646,000
647,000
647,000
648,000
648,000
649,000
649,000
650,000
650,000
651,000
651,000
652,0005,5
52,00
0
5,552
,000
5,553
,000
5,553
,000
5,554
,000
5,554
,000
5,555
,000
5,555
,000
Map Projection: NAD 1983 UTM Zone 11N Creation Date: June 2016
.
Document Path: \\teckcominco\CGO\Groups\TCGIS\Data\Projects\TributariesMapping\MXD\CatchmentMaps_Landscape_11x17_20K.mxd
Text
0 500 1,000250Meters
1:20,000
G CulvertG Control StructureG Rock DrainG WeirG SpillwayG Waterfall
Rock Drain
G 10% Gradient BarrierG 25% Gradient Barrier
Settling Ponds") Bridge!. Water Quality Monitoring
Teck Coal Permit BoundaryPre-mining Stream
Catchment Area as of Sept. 2015CWB Catchment Area - 1980's with UpdatesFish Habitat Connected to MainstemFish Habitat Fragmented (Potentially Reversible)Fish Habitat Fragmented (Permanently Isolated)Fish Habitat Permanently Altered or DestroyedNon-Fish Bearing
652,000
Figure C . 8 . Leask Creek
!Elkford
Elk River
Fording River
Pipeline WolframPond
LeaskPonds
MickelsonPrimary
GH_LC1
Elk R
iver
Wolfram Creek North
Leask Creek
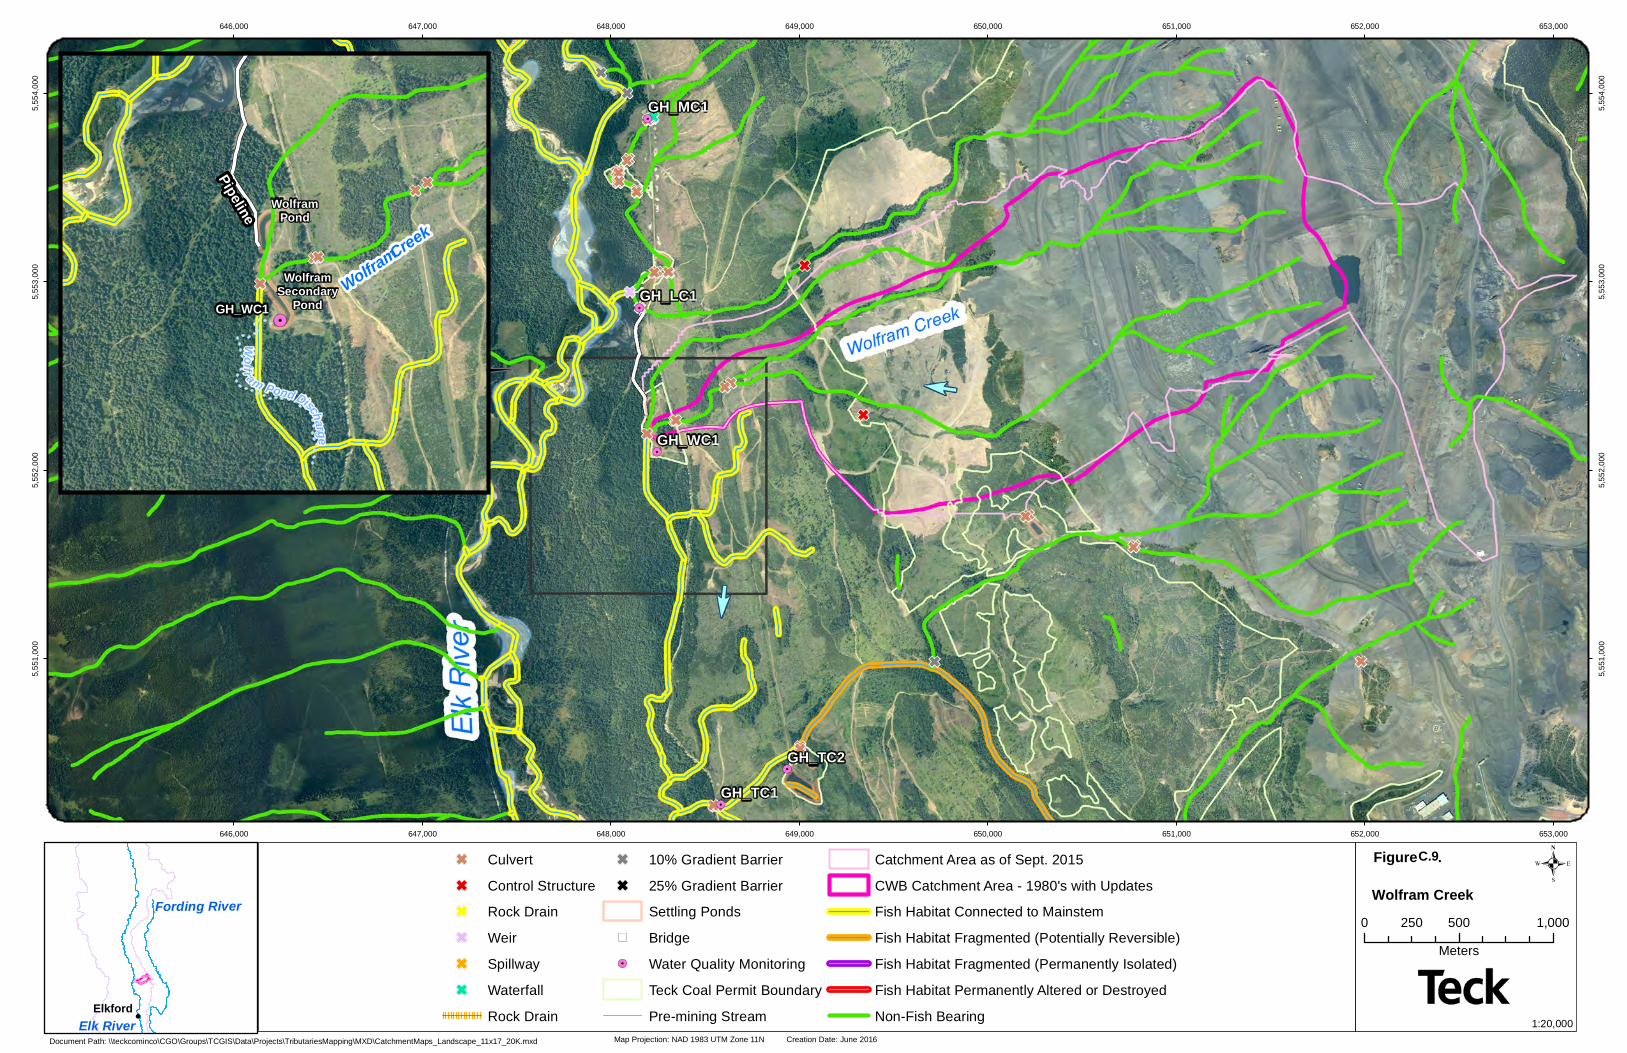
GH_LC1
GH_MC1
GH_TC1
GH_TC2
GH_WC1
646,000
646,000
647,000
647,000
648,000
648,000
649,000
649,000
650,000
650,000
651,000
651,000
652,000
652,000
653,000
653,000
5,551
,000
5,551
,000
5,552
,000
5,552
,000
5,553
,000
5,553
,000
5,554
,000
5,554
,000
Map Projection: NAD 1983 UTM Zone 11N Creation Date: June 2016
.
Document Path: \\teckcominco\CGO\Groups\TCGIS\Data\Projects\TributariesMapping\MXD\CatchmentMaps_Landscape_11x17_20K.mxd
Text
0 500 1,000250Meters
1:20,000
G CulvertG Control StructureG Rock DrainG WeirG SpillwayG Waterfall
Rock Drain
G 10% Gradient BarrierG 25% Gradient Barrier
Settling Ponds") Bridge!. Water Quality Monitoring
Teck Coal Permit BoundaryPre-mining Stream
Catchment Area as of Sept. 2015CWB Catchment Area - 1980's with UpdatesFish Habitat Connected to MainstemFish Habitat Fragmented (Potentially Reversible)Fish Habitat Fragmented (Permanently Isolated)Fish Habitat Permanently Altered or DestroyedNon-Fish Bearing
Figure C . 9 .
Wolfram Creek
!Elkford
Elk River
Fording River
Pipeline WolframPond
WolframSecondary
PondGH_WC1WolframCreek
Wolfr am Pond Discharge
APPENDIX D
TRIBUTARIES TO MICHEL CREEK (MU4)
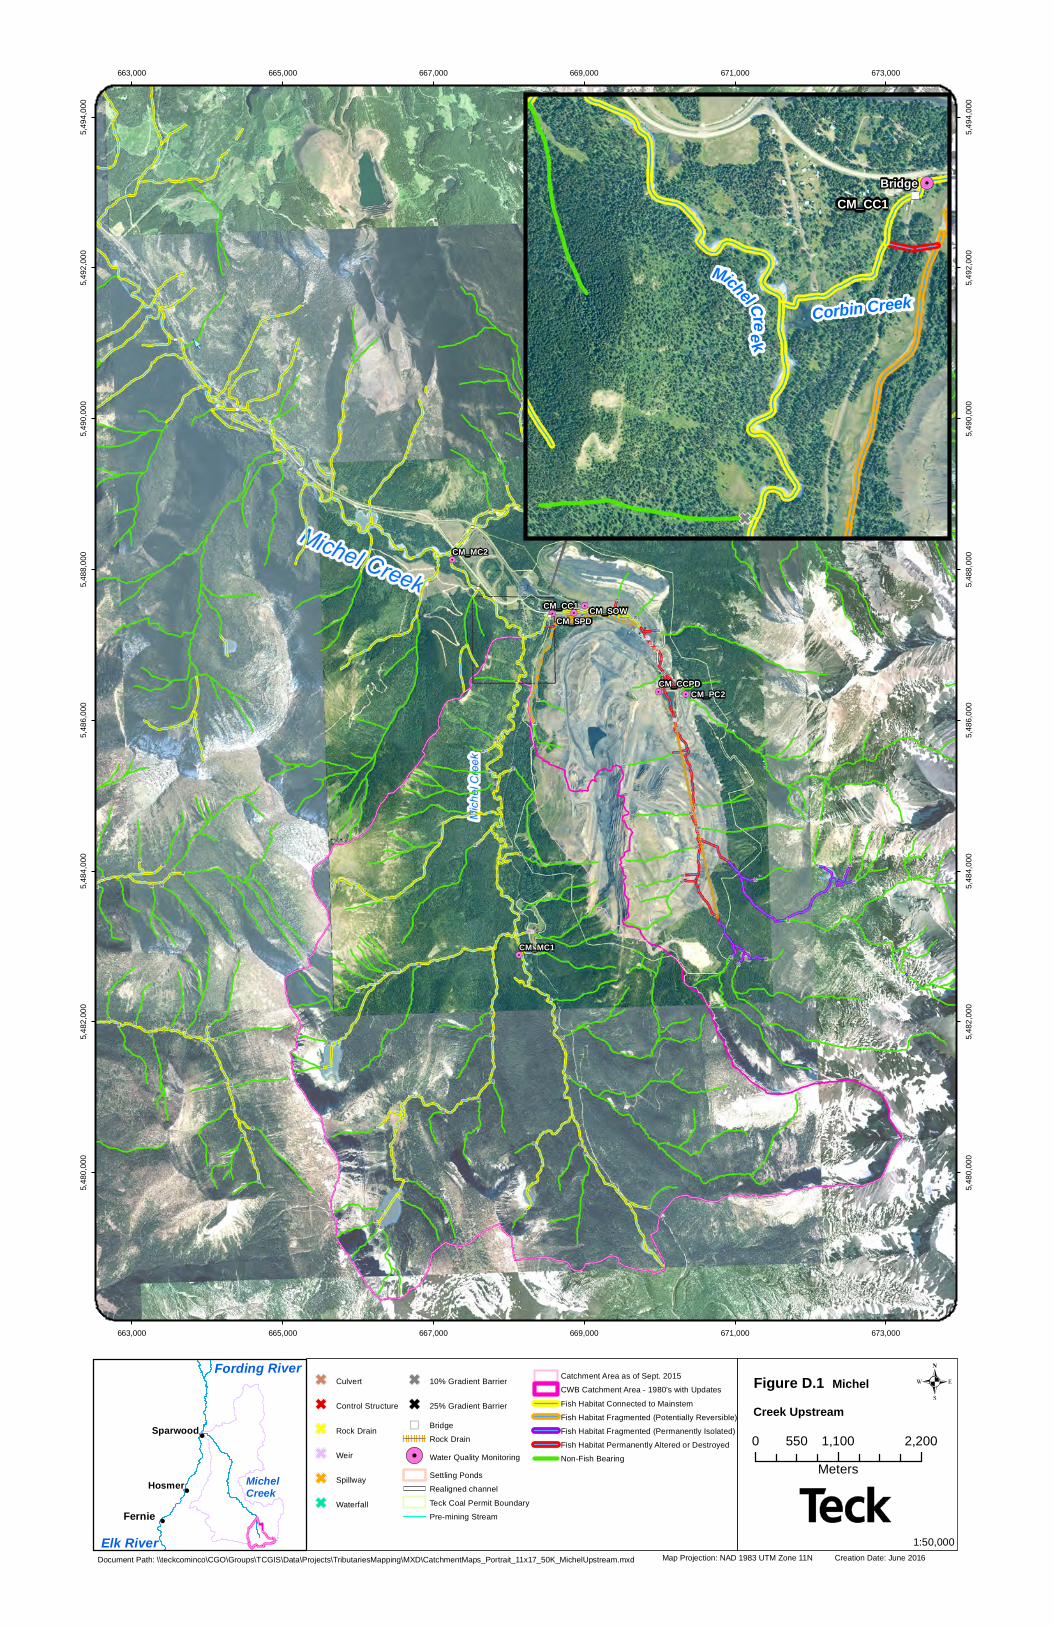
CM_CC1
CM_CCPD
CM_MC1
CM_MC2
CM_PC2
CM_SOWCM_SPD
TCGIS
663,000
663,000
665,000
665,000
667,000
667,000
669,000
669,000
671,000
671,000
673,000
673,000
5,480
,000
5,480
,000
5,482
,000
5,482
,000
5,484
,000
5,484
,000
5,486
,000
5,486
,000
5,488
,000
5,488
,000
5,490
,000
5,490
,000
5,492
,000
5,492
,000
5,494
,000
5,494
,000
Map Projection: NAD 1983 UTM Zone 11N Creation Date: June 2016
.
Document Path: \\teckcominco\CGO\Groups\TCGIS\Data\Projects\TributariesMapping\MXD\CatchmentMaps_Portrait_11x17_50K_MichelUpstream.mxd
Text
0 1,100 2,200550Meters
1:50,000
G Culvert
G Control Structure
G Rock Drain
G Weir
G Spillway
G Waterfall
G 10% Gradient Barrier
G 25% Gradient Barrier
") BridgeRock Drain
!. Water Quality MonitoringSettling PondsRealigned channelTeck Coal Permit BoundaryPre-mining Stream
Catchment Area as of Sept. 2015CWB Catchment Area - 1980's with UpdatesFish Habitat Connected to MainstemFish Habitat Fragmented (Potentially Reversible)Fish Habitat Fragmented (Permanently Isolated)Fish Habitat Permanently Altered or DestroyedNon-Fish Bearing
Figur e D.1 Michel Creek Upstream
!
!
!
Fernie
Hosmer
Sparwood
Elk River
Fording River
MichelCreek
BridgeCM_CC1
Corbin CreekMichel Creek
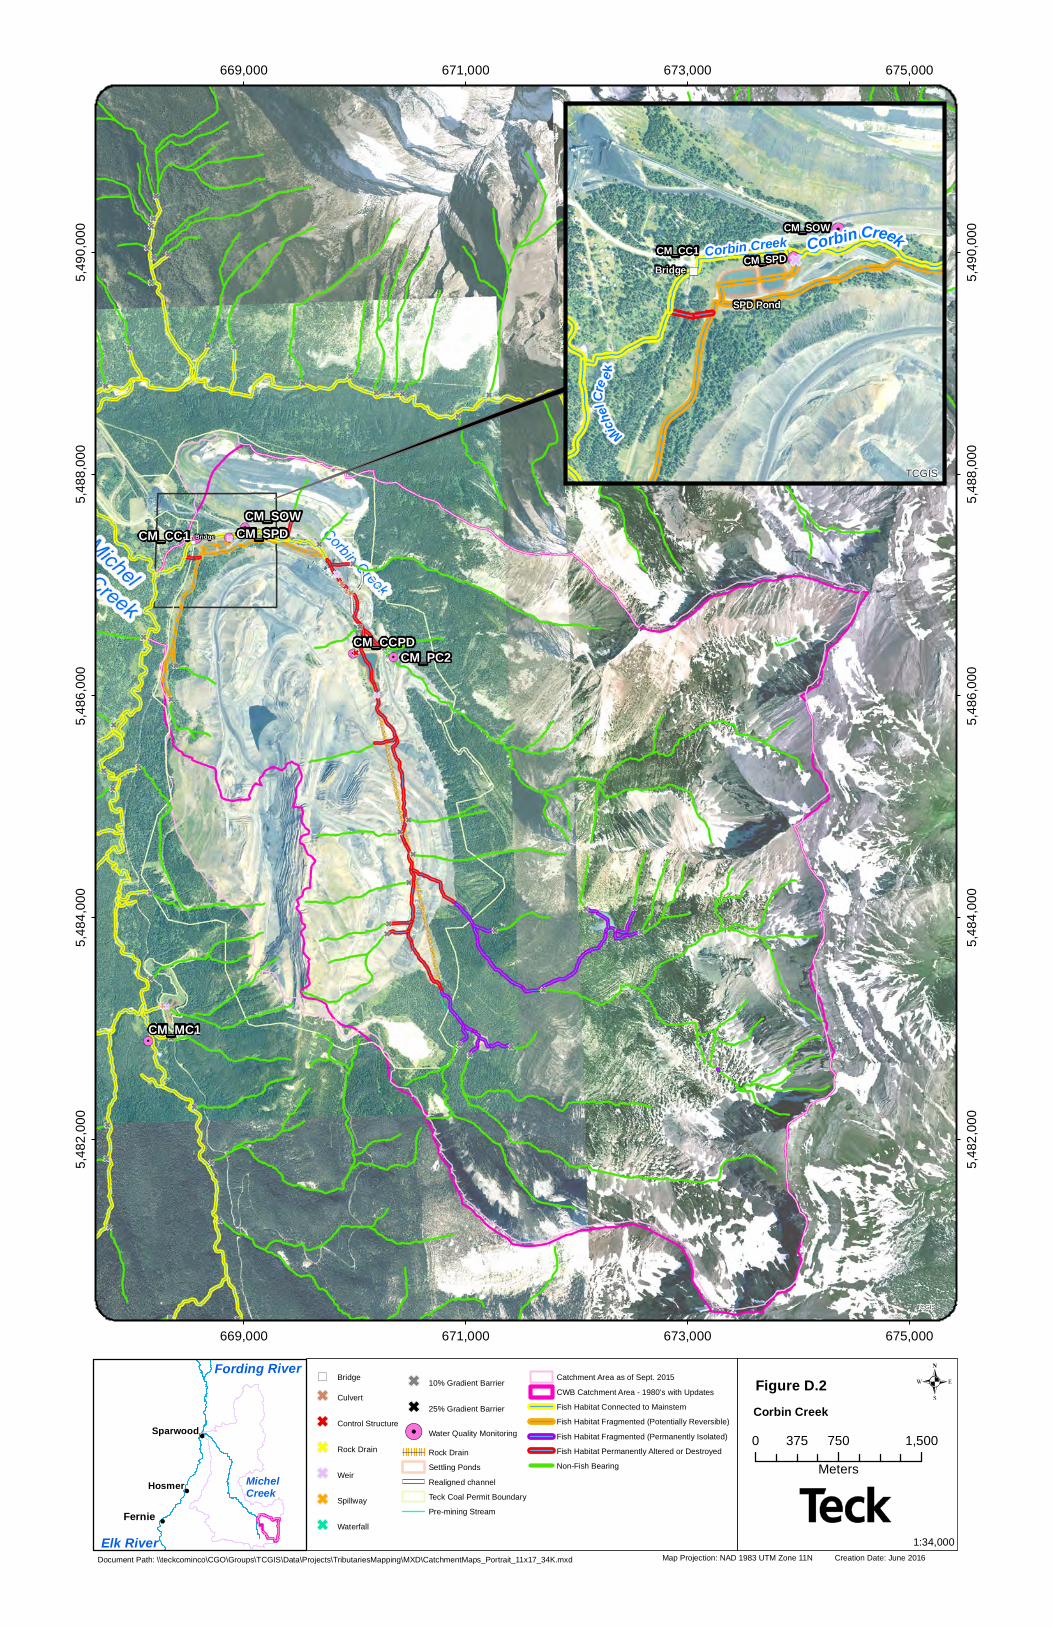
CM_CC1
CM_CCPD
CM_MC1
CM_PC2
CM_SOWCM_SPDBridge
TCGIS
669,000
669,000
671,000
671,000
673,000
673,000
675,000
675,000
5,482
,000
5,482
,000
5,484
,000
5,484
,000
5,486
,000
5,486
,000
5,488
,000
5,488
,000
5,490
,000
5,490
,000
Map Projection: NAD 1983 UTM Zone 11N Creation Date: June 2016
.
Document Path: \\teckcominco\CGO\Groups\TCGIS\Data\Projects\TributariesMapping\MXD\CatchmentMaps_Portrait_11x17_34K.mxd
Text
0 750 1,500375Meters
1:34,000
") Bridge
G Culvert
G Control Structure
G Rock Drain
G Weir
G Spillway
G Waterfall
G 10% Gradient Barrier
G 25% Gradient Barrier
!. Water Quality MonitoringRock DrainSettling PondsRealigned channelTeck Coal Permit BoundaryPre-mining Stream
Catchment Area as of Sept. 2015CWB Catchment Area - 1980's with UpdatesFish Habitat Connected to MainstemFish Habitat Fragmented (Potentially Reversible)Fish Habitat Fragmented (Permanently Isolated)Fish Habitat Permanently Altered or DestroyedNon-Fish Bearing
Corbin Creek!
!
!
Fernie
Hosmer
Sparwood
Elk River
Fording River
MichelCreek
Bridge
SPD Pond
CM_CC1CM_SOW
CM_SPDCorbin Creek
MichelC
re e k
Corbin Creek
TCGIS
Figure D.2
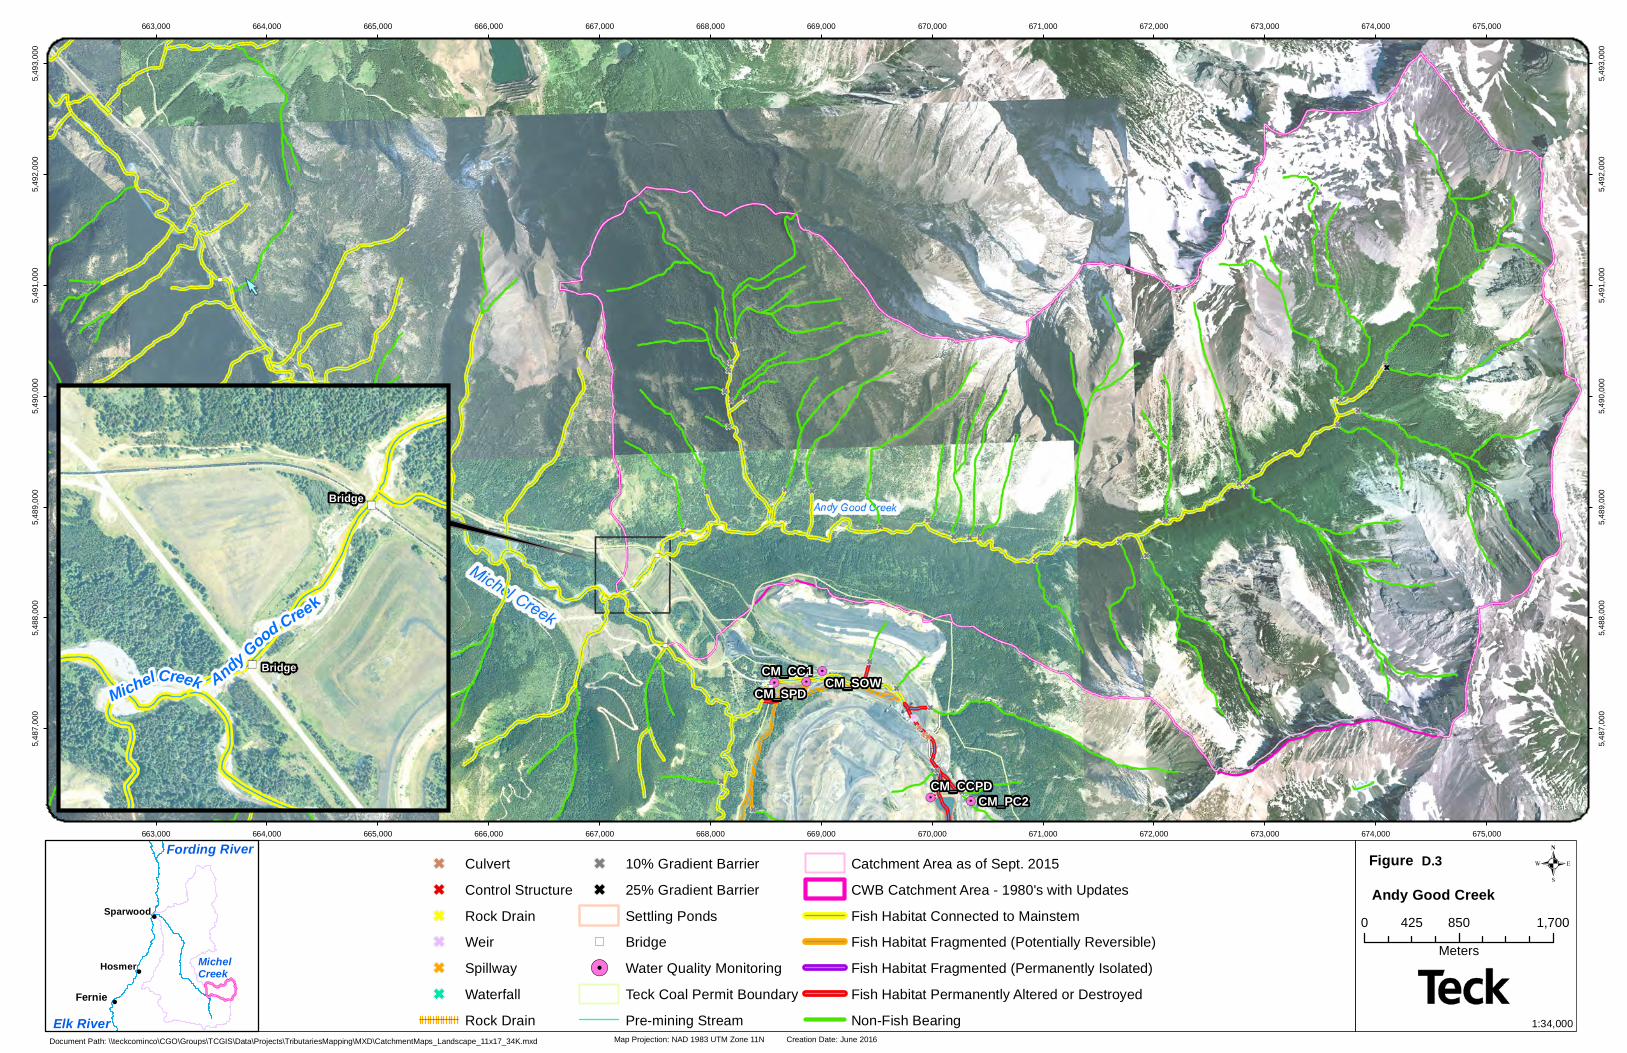
!
!
!
Fernie
Hosmer
Sparwood
Elk River
Fording River
MichelCreek
CM_CC1
CM_CCPDCM_PC2
CM_SOWCM_SPD
TCGIS
663,000
663,000
664,000
664,000
665,000
665,000
666,000
666,000
667,000
667,000
668,000
668,000
669,000
669,000
670,000
670,000
671,000
671,000
672,000
672,000
673,000
673,000
674,000
674,000
675,000
675,000
5,487
,000
5,487
,000
5,488
,000
5,488
,000
5,489
,000
5,489
,000
5,490
,000
5,490
,000
5,491
,000
5,491
,000
5,492
,000
5,492
,000
5,493
,000
5,493
,000
Map Projection: NAD 1983 UTM Zone 11N Creation Date: June 2016
.Figure
Document Path: \\teckcominco\CGO\Groups\TCGIS\Data\Projects\TributariesMapping\MXD\CatchmentMaps_Landscape_11x17_34K.mxd
Text
0 850 1,700425Meters
1:34,000
G CulvertG Control StructureG Rock DrainG WeirG SpillwayG Waterfall
Rock Drain
G 10% Gradient BarrierG 25% Gradient Barrier
Settling Ponds") Bridge!. Water Quality Monitoring
Teck Coal Permit BoundaryPre-mining Stream
Catchment Area as of Sept. 2015CWB Catchment Area - 1980's with UpdatesFish Habitat Connected to MainstemFish Habitat Fragmented (Potentially Reversible)Fish Habitat Fragmented (Permanently Isolated)Fish Habitat Permanently Altered or DestroyedNon-Fish Bearing
Andy Good Creek
Bridge
Bridge
Andy Good Creek
MichelCreek
D.3
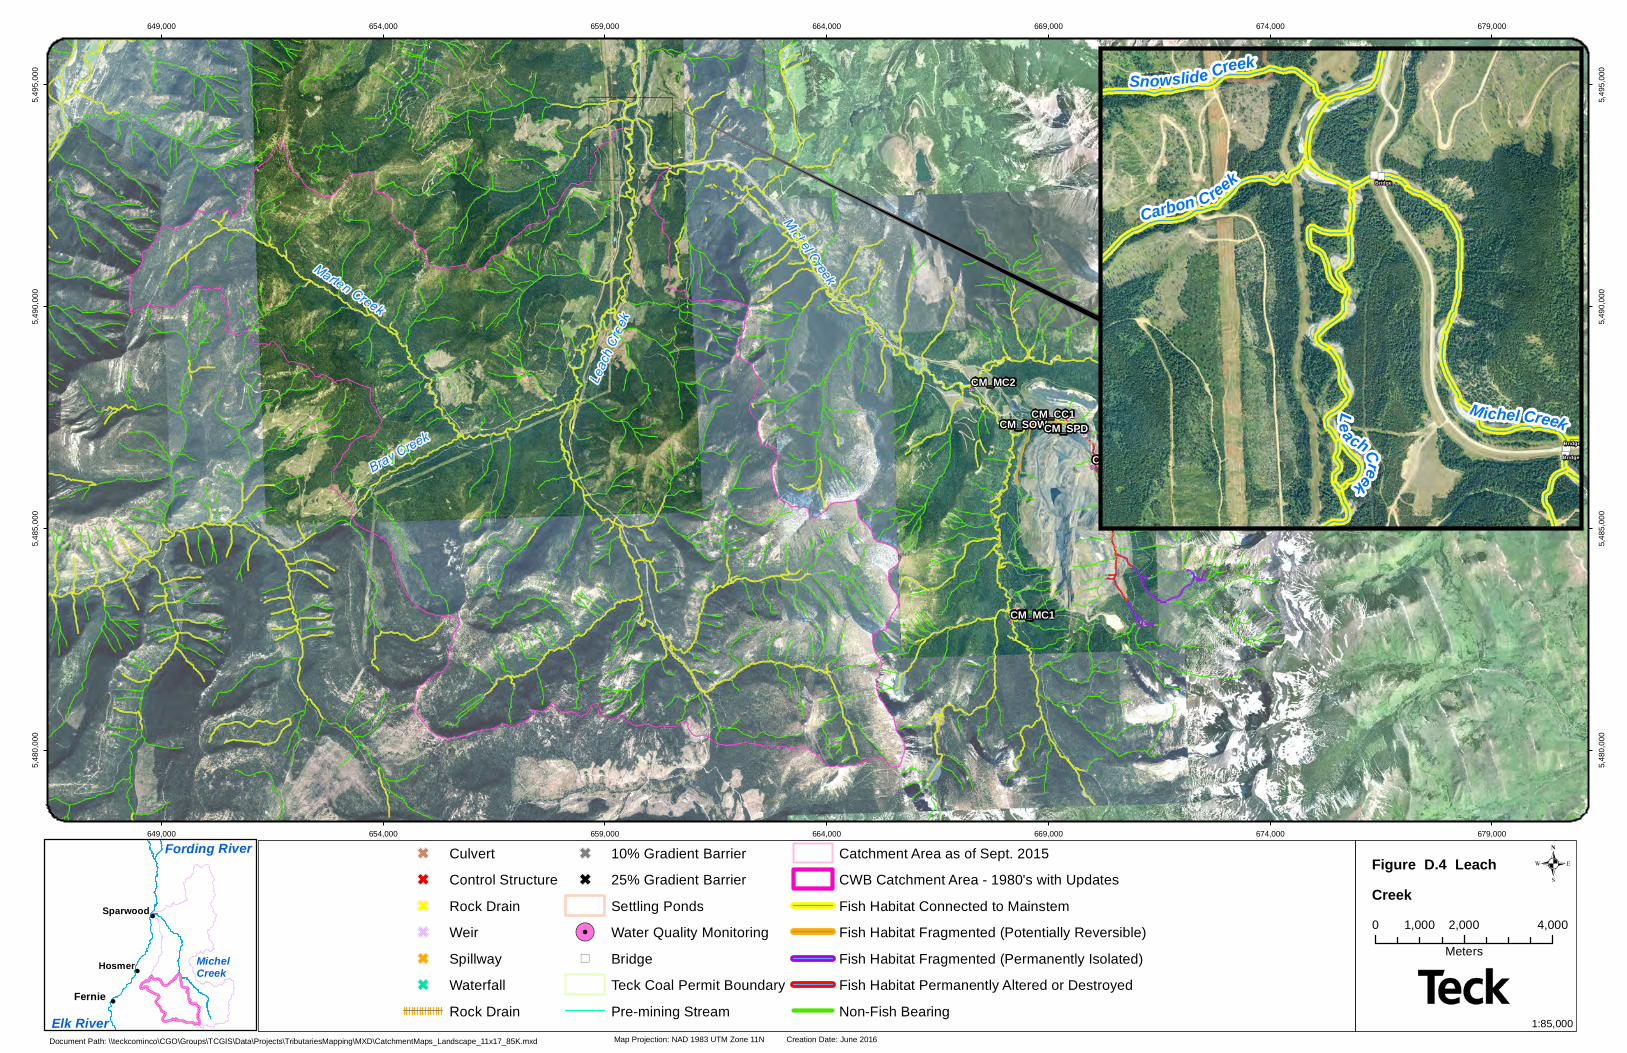
!
!
!
Fernie
Hosmer
Sparwood
Elk River
Fording River
MichelCreek
CM_CC1
CM_CCPD
CM_MC1
CM_MC2
CM_PC2
CM_SOWCM_SPD
TCGIS
649,000
649,000
654,000
654,000
659,000
659,000
664,000
664,000
669,000
669,000
674,000
674,000
679,000
679,000
5,480
,000
5,480
,000
5,485
,000
5,485
,000
5,490
,000
5,490
,000
5,495
,000
5,495
,000
Map Projection: NAD 1983 UTM Zone 11N Creation Date: June 2016
.
Document Path: \\teckcominco\CGO\Groups\TCGIS\Data\Projects\TributariesMapping\MXD\CatchmentMaps_Landscape_11x17_85K.mxd
Text
0 2,000 4,0001,000Meters
1:85,000
G CulvertG Control StructureG Rock DrainG WeirG SpillwayG Waterfall
Rock Drain
G 10% Gradient BarrierG 25% Gradient Barrier
Settling Ponds!. Water Quality Monitoring") Bridge
Teck Coal Permit BoundaryPre-mining Stream
Catchment Area as of Sept. 2015CWB Catchment Area - 1980's with UpdatesFish Habitat Connected to MainstemFish Habitat Fragmented (Potentially Reversible)Fish Habitat Fragmented (Permanently Isolated)Fish Habitat Permanently Altered or DestroyedNon-Fish Bearing
Figur e D.4 Leach Creek
Bridge
Bridge
Bridge
Le a chCreek
Snowslide Creek
Michel Creek
Carbon Creek
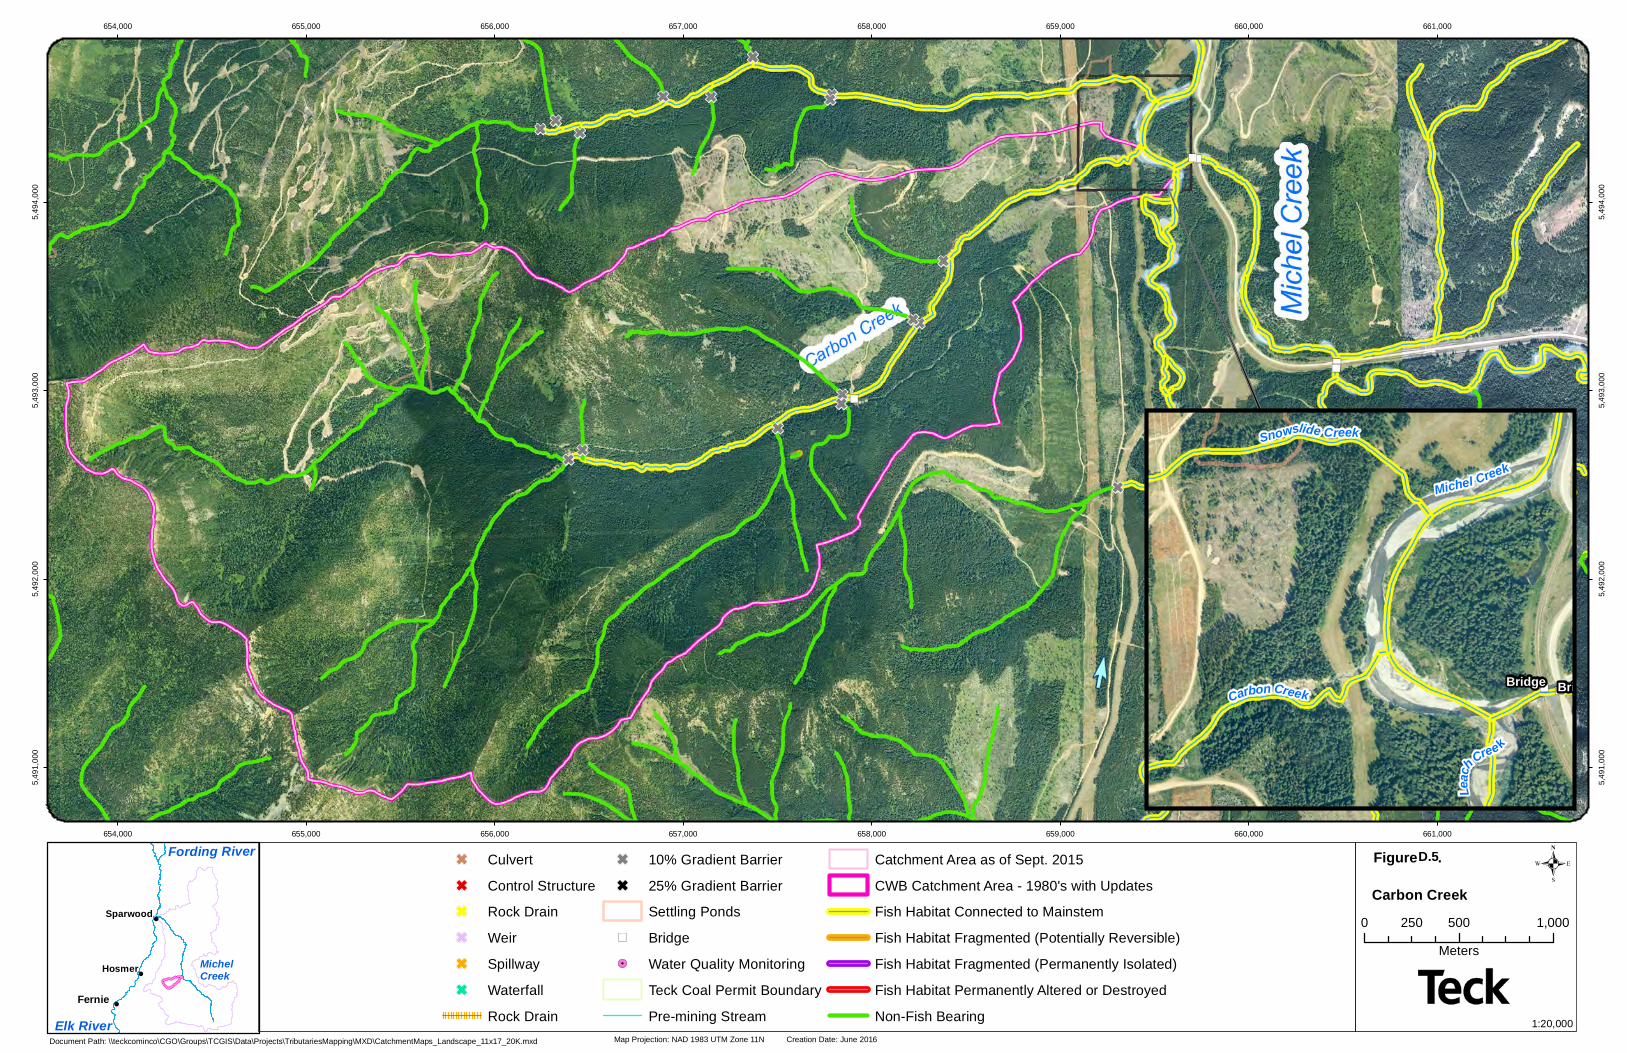
!
!
!
Fernie
Hosmer
Sparwood
Elk River
Fording River
MichelCreek
654,000
654,000
655,000
655,000
656,000
656,000
657,000
657,000
658,000
658,000
659,000
659,000
660,000
660,000
661,000
661,000
5,491
,000
5,491
,000
5,492
,000
5,492
,000
5,493
,000
5,493
,000
5,494
,000
5,494
,000
Map Projection: NAD 1983 UTM Zone 11N Creation Date: June 2016
.Figure D . 5 .
Document Path: \\teckcominco\CGO\Groups\TCGIS\Data\Projects\TributariesMapping\MXD\CatchmentMaps_Landscape_11x17_20K.mxd
Text
0 500 1,000250Meters
1:20,000
G CulvertG Control StructureG Rock DrainG WeirG SpillwayG Waterfall
Rock Drain
G 10% Gradient BarrierG 25% Gradient Barrier
Settling Ponds") Bridge!. Water Quality Monitoring
Teck Coal Permit BoundaryPre-mining Stream
Catchment Area as of Sept. 2015CWB Catchment Area - 1980's with UpdatesFish Habitat Connected to MainstemFish Habitat Fragmented (Potentially Reversible)Fish Habitat Fragmented (Permanently Isolated)Fish Habitat Permanently Altered or DestroyedNon-Fish Bearing
Carbon Creek
BridgeBridge
Snowslide Creek
Michel Creek
Leac
hCree k
Carbon Creek
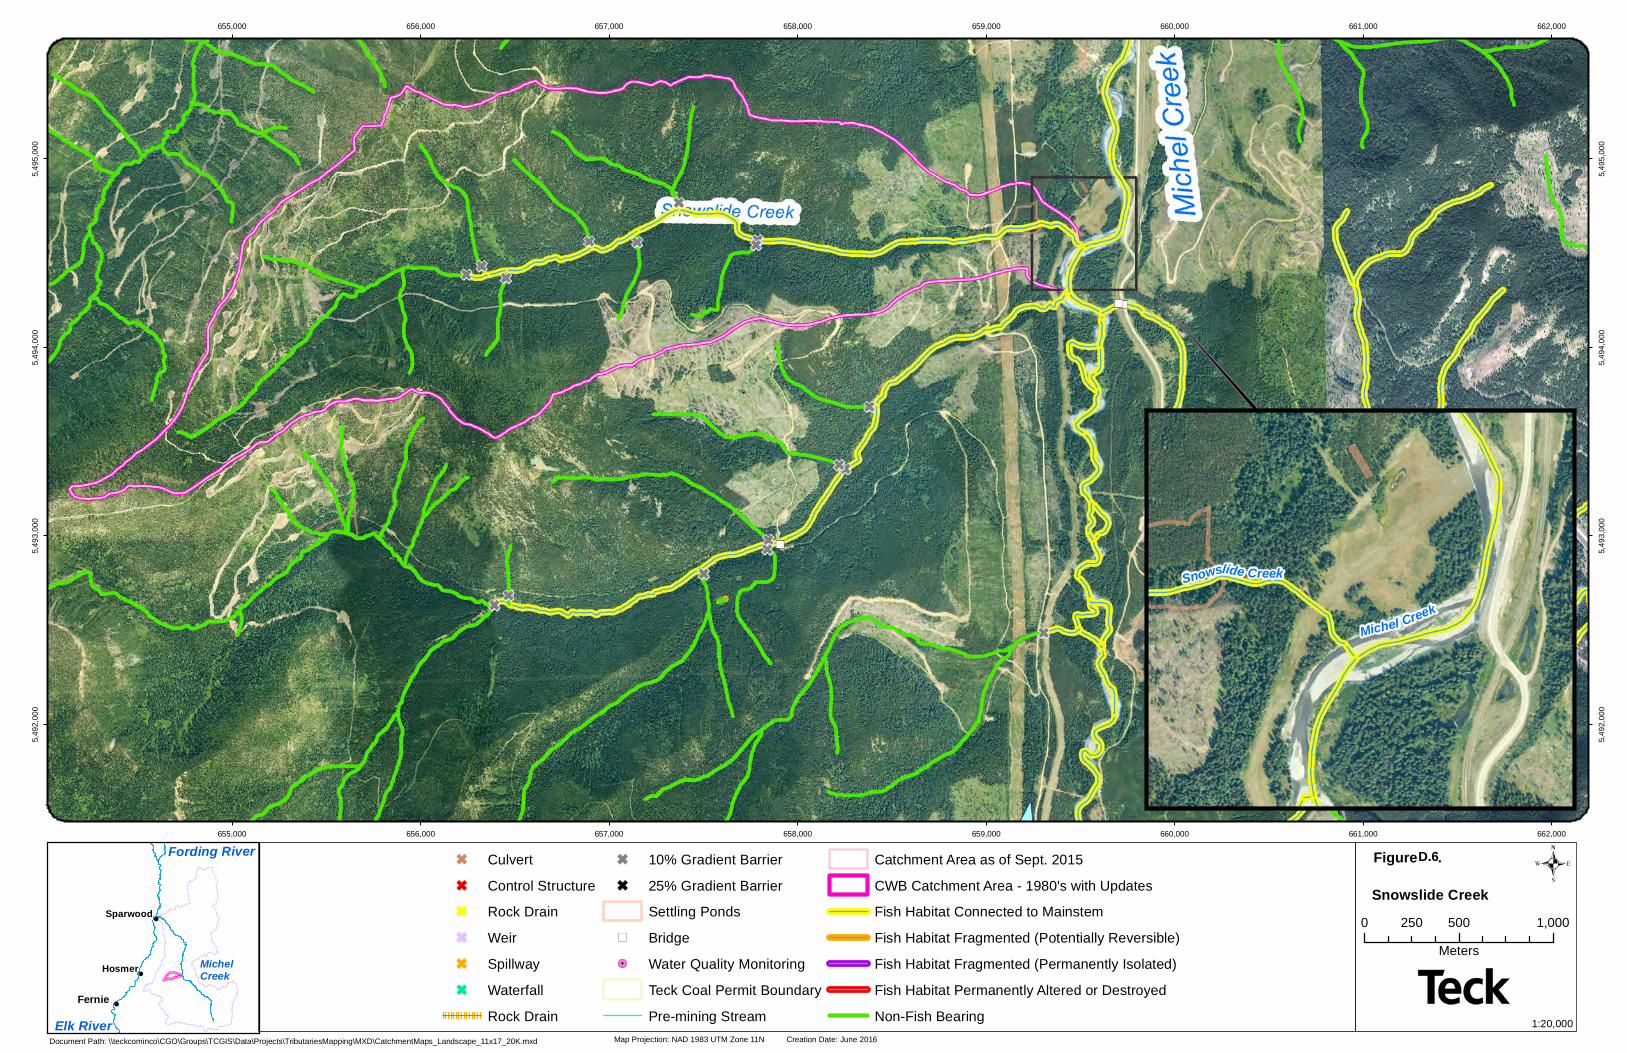
!
!
!
Fernie
Hosmer
Sparwood
Elk River
Fording River
MichelCreek
655,000
655,000
656,000
656,000
657,000
657,000
658,000
658,000
659,000
659,000
660,000
660,000
661,000
661,000
662,000
662,000
5,492
,000
5,492
,000
5,493
,000
5,493
,000
5,494
,000
5,494
,000
5,495
,000
5,495
,000
Map Projection: NAD 1983 UTM Zone 11N Creation Date: June 2016
.Figure D . 6 .
Document Path: \\teckcominco\CGO\Groups\TCGIS\Data\Projects\TributariesMapping\MXD\CatchmentMaps_Landscape_11x17_20K.mxd
Text
0 500 1,000250Meters
1:20,000
G CulvertG Control StructureG Rock DrainG WeirG SpillwayG Waterfall
Rock Drain
G 10% Gradient BarrierG 25% Gradient Barrier
Settling Ponds") Bridge!. Water Quality Monitoring
Teck Coal Permit BoundaryPre-mining Stream
Catchment Area as of Sept. 2015CWB Catchment Area - 1980's with UpdatesFish Habitat Connected to MainstemFish Habitat Fragmented (Potentially Reversible)Fish Habitat Fragmented (Permanently Isolated)Fish Habitat Permanently Altered or DestroyedNon-Fish Bearing
Snowslide Creek
Snowslide Creek
Michel Creek
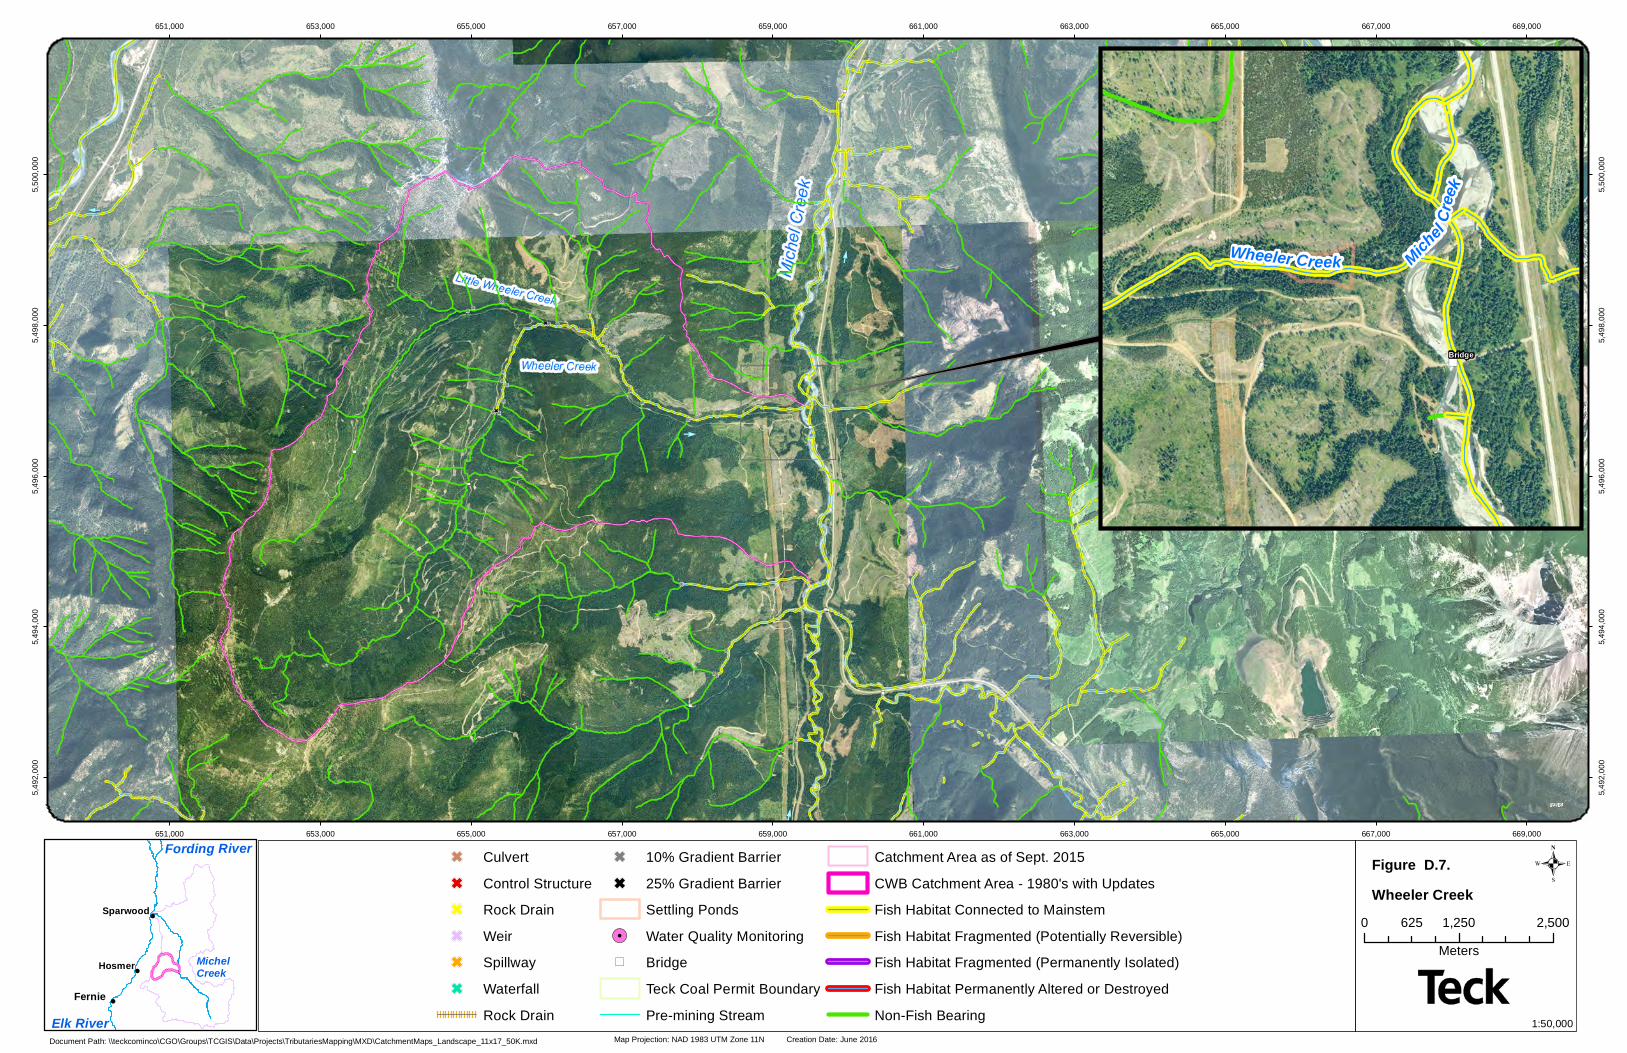
!
!
!
Fernie
Hosmer
Sparwood
Elk River
Fording River
MichelCreek
TCGIS
651,000
651,000
653,000
653,000
655,000
655,000
657,000
657,000
659,000
659,000
661,000
661,000
663,000
663,000
665,000
665,000
667,000
667,000
669,000
669,000
5,492
,000
5,492
,000
5,494
,000
5,494
,000
5,496
,000
5,496
,000
5,498
,000
5,498
,000
5,500
,000
5,500
,000
Map Projection: NAD 1983 UTM Zone 11N Creation Date: June 2016
.Figure D.7.
Document Path: \\teckcominco\CGO\Groups\TCGIS\Data\Projects\TributariesMapping\MXD\CatchmentMaps_Landscape_11x17_50K.mxd
Text
0 1,250 2,500625Meters
1:50,000
G CulvertG Control StructureG Rock DrainG WeirG SpillwayG Waterfall
Rock Drain
G 10% Gradient BarrierG 25% Gradient Barrier
Settling Ponds!. Water Quality Monitoring") Bridge
Teck Coal Permit BoundaryPre-mining Stream
Catchment Area as of Sept. 2015CWB Catchment Area - 1980's with UpdatesFish Habitat Connected to MainstemFish Habitat Fragmented (Potentially Reversible)Fish Habitat Fragmented (Permanently Isolated)Fish Habitat Permanently Altered or DestroyedNon-Fish Bearing
Wheeler Creek
Bridge
Michel
Creek
Wheeler Creek
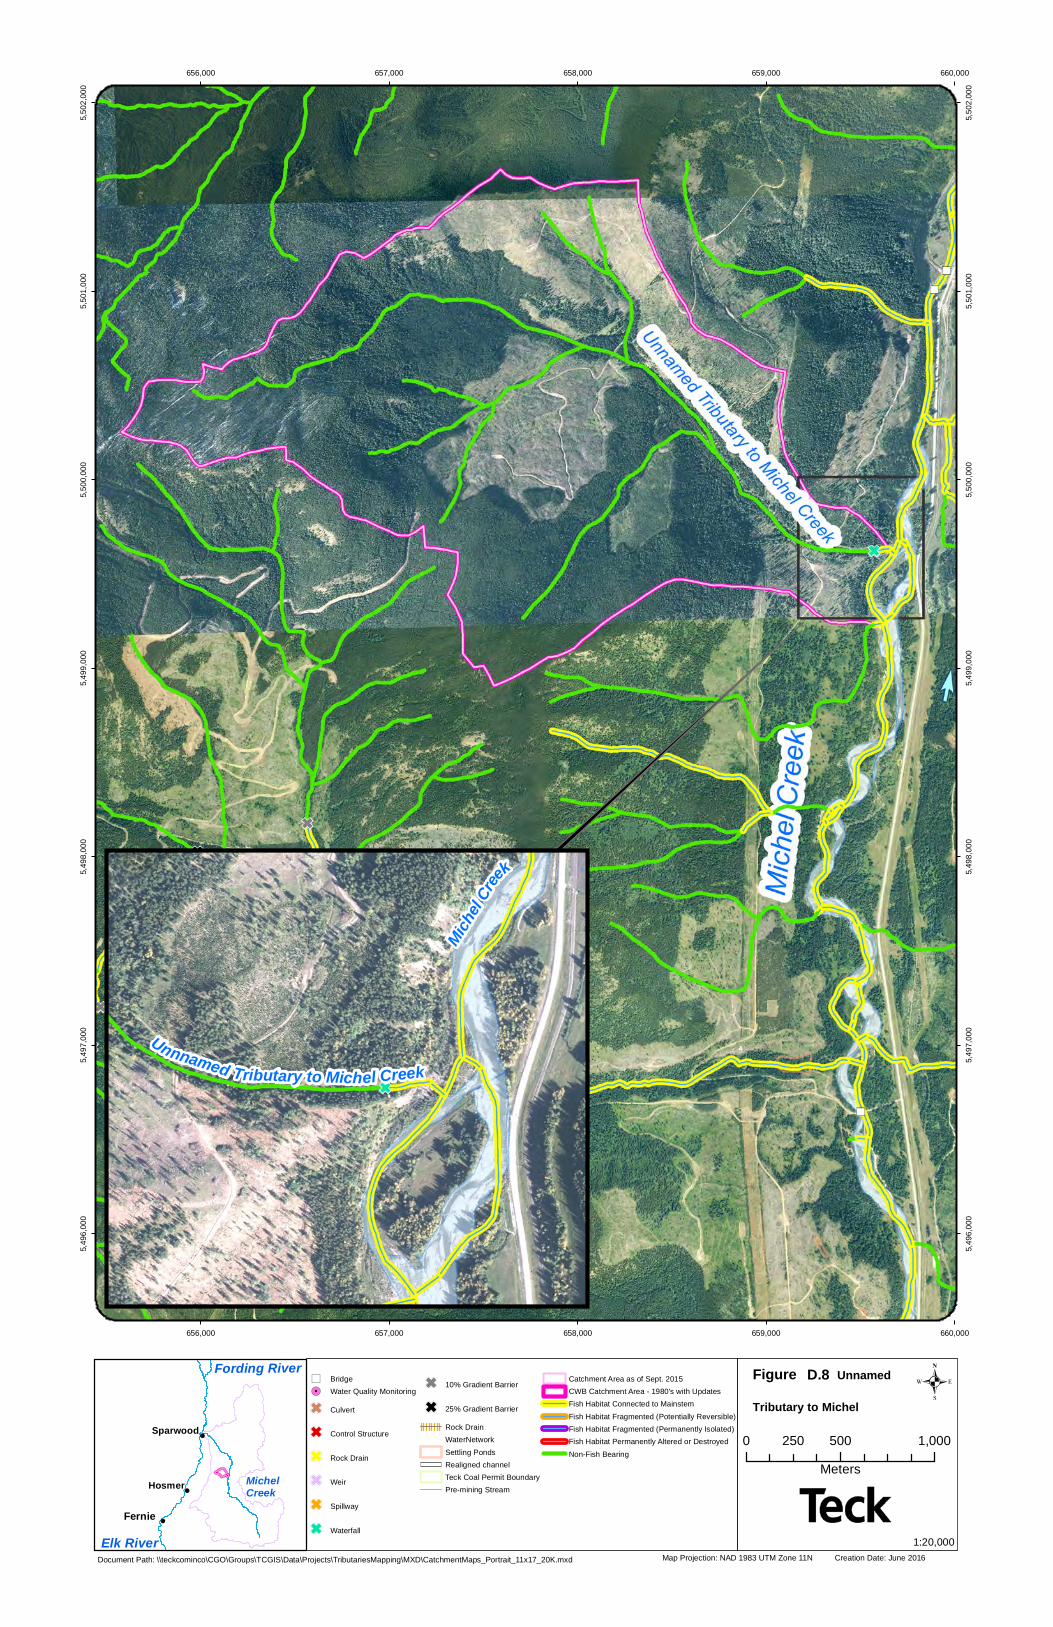
656,000
656,000
657,000
657,000
658,000
658,000
659,000
659,000
660,000
660,000
5,496
,000
5,496
,000
5,497
,000
5,497
,000
5,498
,000
5,498
,000
5,499
,000
5,499
,000
5,500
,000
5,500
,000
5,501
,000
5,501
,000
5,502
,000
5,502
,000
Map Projection: NAD 1983 UTM Zone 11N Creation Date: June 2016
.
Document Path: \\teckcominco\CGO\Groups\TCGIS\Data\Projects\TributariesMapping\MXD\CatchmentMaps_Portrait_11x17_20K.mxd
Text
0 500 1,000250Meters
1:20,000
Figure D . 8 Unnamed
Tributary to Michel!
!
!
Fernie
Hosmer
Sparwood
Elk River
Fording River
MichelCreek
Michel C
reek
Unnnamed Tributary to Michel Creek
") Bridge!. Water Quality Monitoring
G Culvert
G Control Structure
G Rock Drain
G Weir
G Spillway
G Waterfall
G 10% Gradient Barrier
G 25% Gradient BarrierRock DrainWaterNetworkSettling PondsRealigned channelTeck Coal Permit BoundaryPre-mining Stream
Catchment Area as of Sept. 2015CWB Catchment Area - 1980's with UpdatesFish Habitat Connected to MainstemFish Habitat Fragmented (Potentially Reversible)Fish Habitat Fragmented (Permanently Isolated)Fish Habitat Permanently Altered or DestroyedNon-Fish Bearing
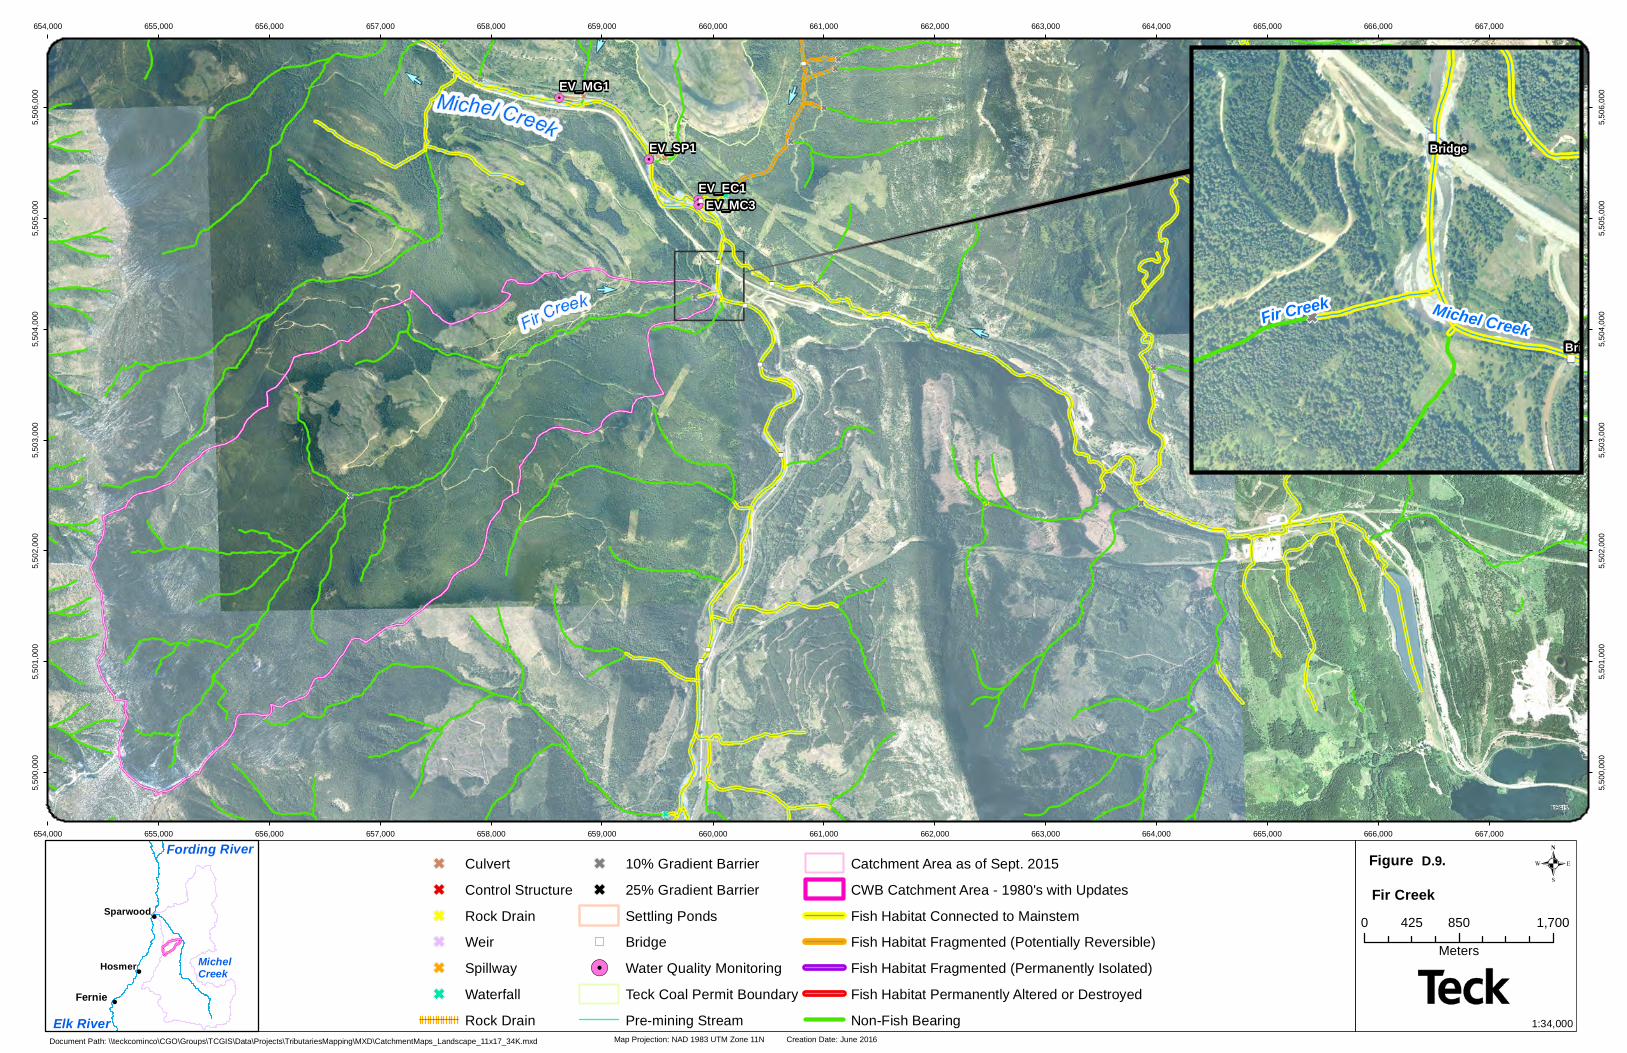
!
!
!
Fernie
Hosmer
Sparwood
Elk River
Fording River
MichelCreek
EV_EC1EV_MC3
EV_MG1
EV_SP1
TCGIS
654,000
654,000
655,000
655,000
656,000
656,000
657,000
657,000
658,000
658,000
659,000
659,000
660,000
660,000
661,000
661,000
662,000
662,000
663,000
663,000
664,000
664,000
665,000
665,000
666,000
666,000
667,000
667,000
5,500
,000
5,500
,000
5,501
,000
5,501
,000
5,502
,000
5,502
,000
5,503
,000
5,503
,000
5,504
,000
5,504
,000
5,505
,000
5,505
,000
5,506
,000
5,506
,000
Map Projection: NAD 1983 UTM Zone 11N Creation Date: June 2016
.Figure .
Document Path: \\teckcominco\CGO\Groups\TCGIS\Data\Projects\TributariesMapping\MXD\CatchmentMaps_Landscape_11x17_34K.mxd
Text
0 850 1,700425Meters
1:34,000
G CulvertG Control StructureG Rock DrainG WeirG SpillwayG Waterfall
Rock Drain
G 10% Gradient BarrierG 25% Gradient Barrier
Settling Ponds") Bridge!. Water Quality Monitoring
Teck Coal Permit BoundaryPre-mining Stream
Catchment Area as of Sept. 2015CWB Catchment Area - 1980's with UpdatesFish Habitat Connected to MainstemFish Habitat Fragmented (Potentially Reversible)Fish Habitat Fragmented (Permanently Isolated)Fish Habitat Permanently Altered or DestroyedNon-Fish Bearing
Fir Creek
Bridge
Bridge
Fir Creek Michel Creek
D.9
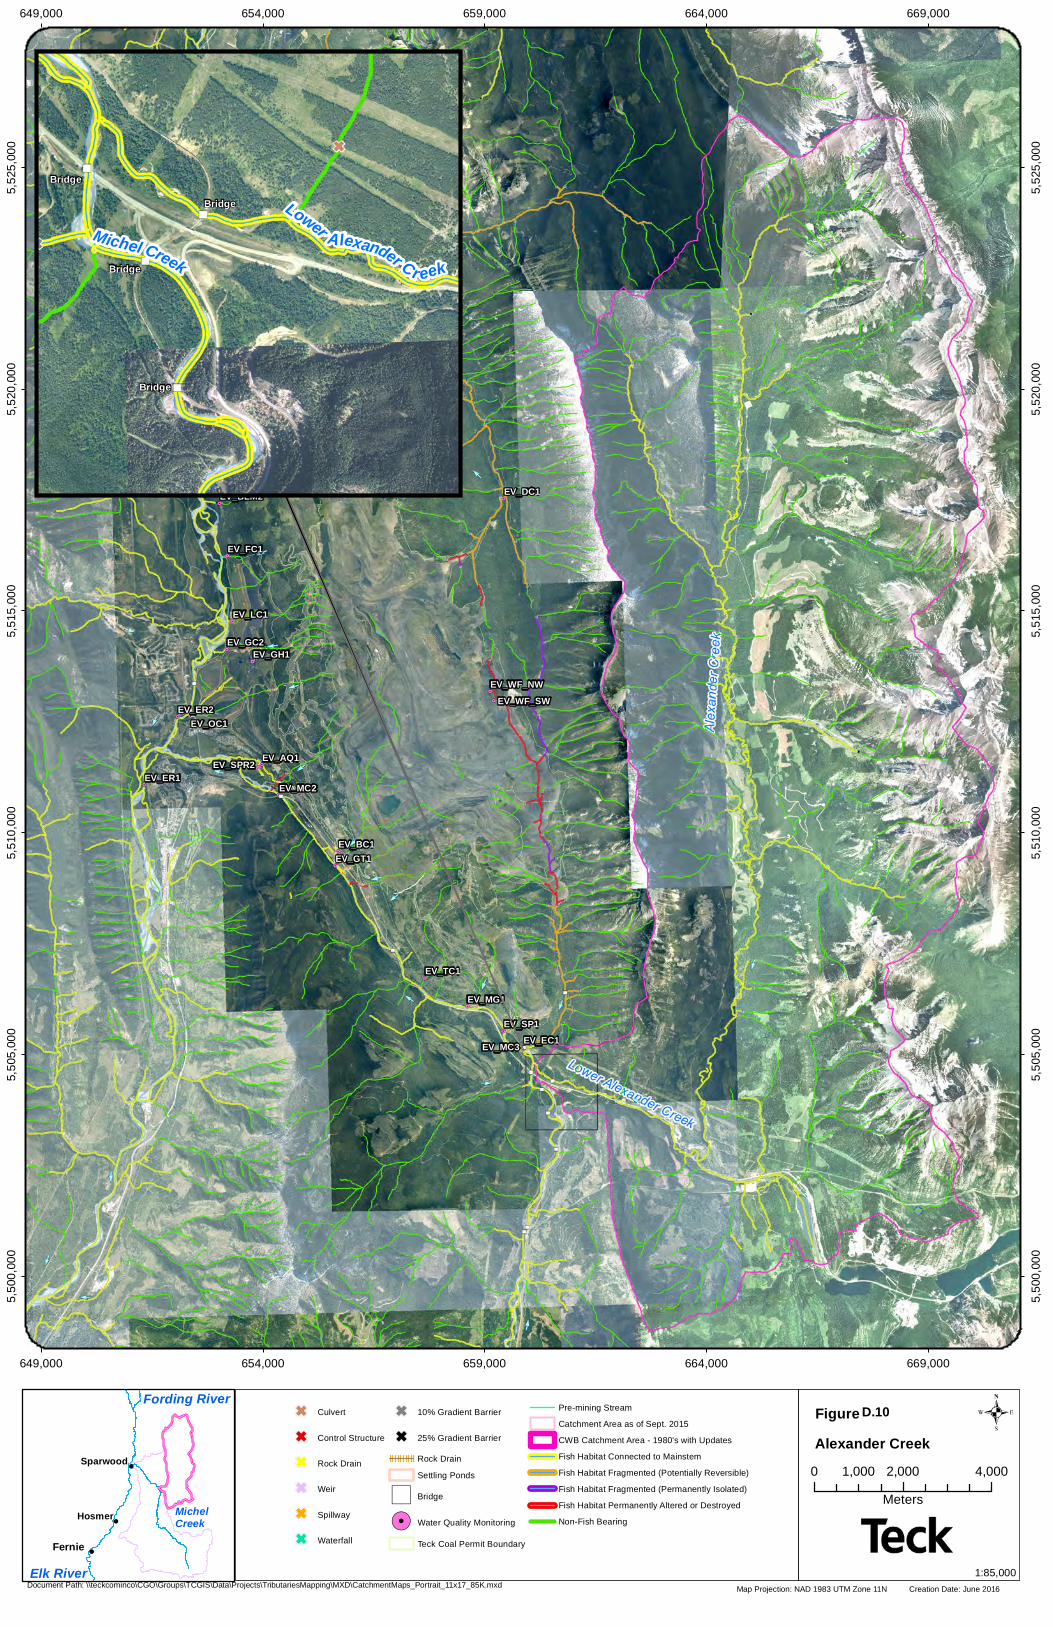
EV_AQ1
EV_BC1
EV_BLM2 EV_DC1
EV_EC1
EV_ER1
EV_ER2
EV_ER4
EV_FC1
EV_GC2EV_GH1
EV_GT1
EV_HC1
EV_LC1
EV_MC2
EV_MC3
EV_MG1
EV_OC1
EV_SM1
EV_SP1
EV_SPR2
EV_TC1
EV_WF_NWEV_WF_SW
TCGIS
649,000
649,000
654,000
654,000
659,000
659,000
664,000
664,000
669,000
669,000
5,500
,000
5,500
,000
5,505
,000
5,505
,000
5,510
,000
5,510
,000
5,515
,000
5,515
,000
5,520
,000
5,520
,000
5,525
,000
5,525
,000
Map Projection: NAD 1983 UTM Zone 11N Creation Date: June 2016
.Figure
Document Path: \\teckcominco\CGO\Groups\TCGIS\Data\Projects\TributariesMapping\MXD\CatchmentMaps_Portrait_11x17_85K.mxd
Text
0 2,000 4,0001,000Meters
1:85,000
G Culvert
G Control Structure
G Rock Drain
G Weir
G Spillway
G Waterfall
G 10% Gradient Barrier
G 25% Gradient Barrier
Rock DrainSettling Ponds
") Bridge
!. Water Quality Monitoring
Teck Coal Permit Boundary
Pre-mining StreamCatchment Area as of Sept. 2015CWB Catchment Area - 1980's with UpdatesFish Habitat Connected to MainstemFish Habitat Fragmented (Potentially Reversible)Fish Habitat Fragmented (Permanently Isolated)Fish Habitat Permanently Altered or DestroyedNon-Fish Bearing
Alexander Creek!
!
!
Fernie
Hosmer
Sparwood
Elk River
Fording River
MichelCreek
Bridge
Bridge
Bridge
Bridge
Michel Creek
Lower Alexander Cr eek
D.10
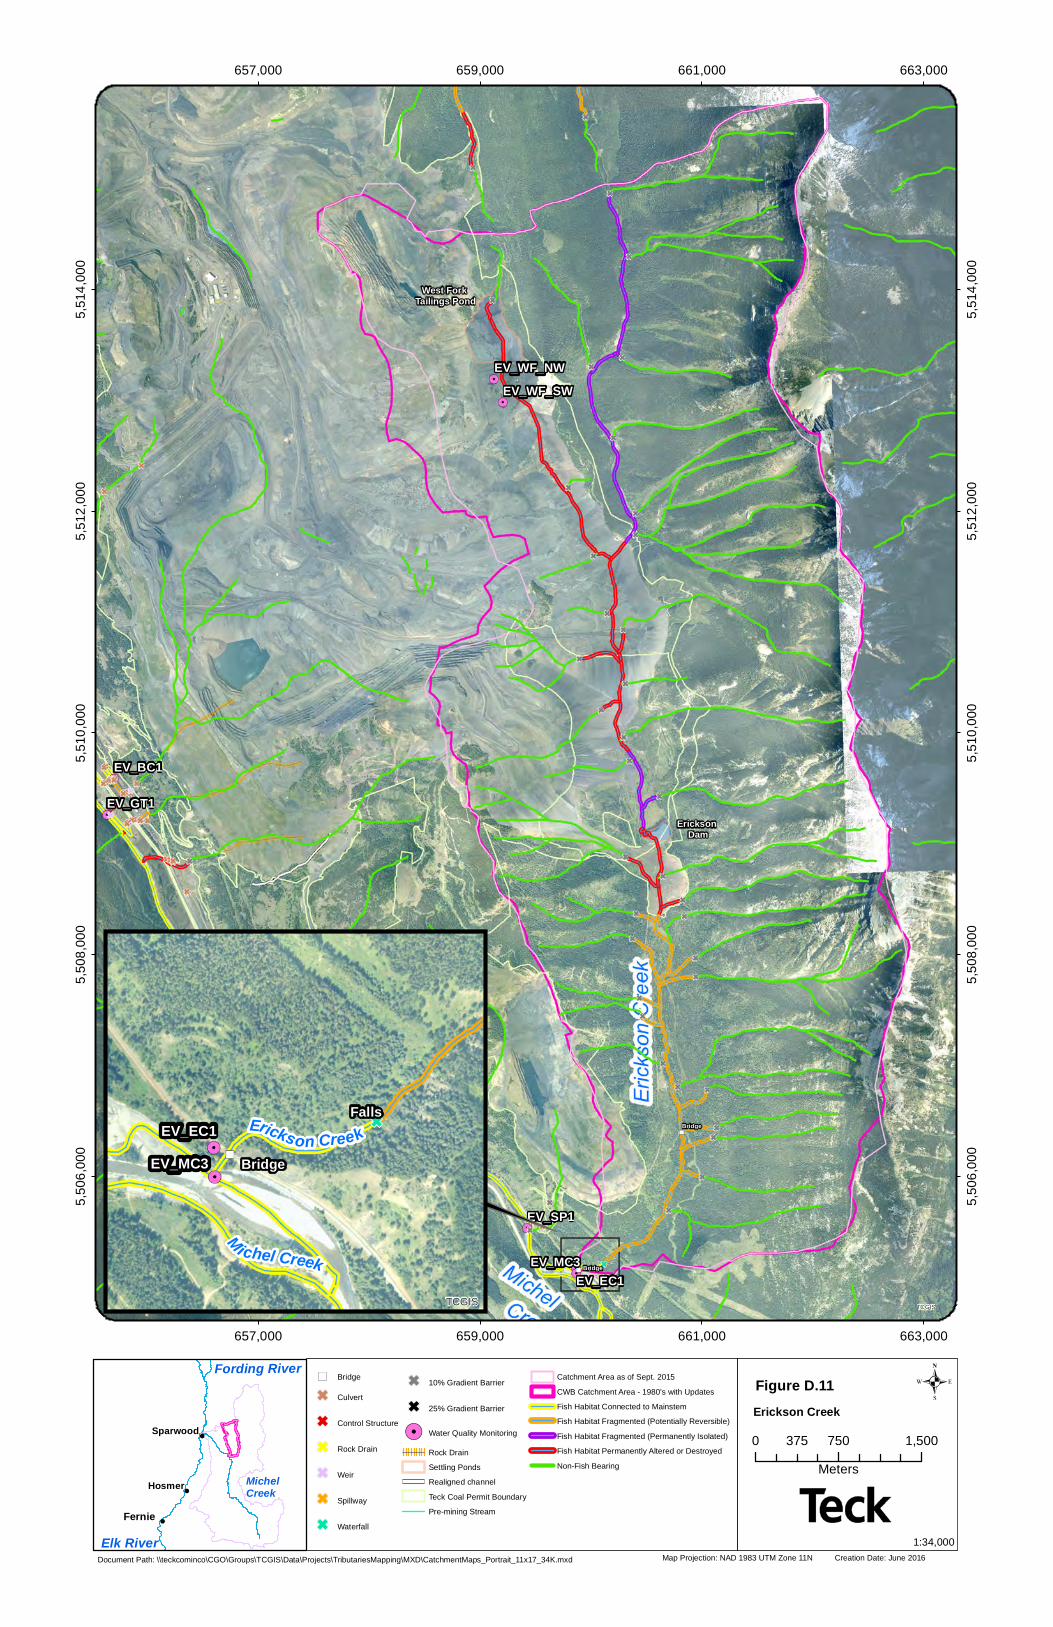
West Fork Tailings Pond
Erickson Dam
EV_BC1
EV_EC1
EV_GT1
EV_MC3
EV_MG1
EV_SP1
EV_TC1
EV_WF_NWEV_WF_SW
Bridge
Bridge
Bridge
TCGIS
657,000
657,000
659,000
659,000
661,000
661,000
663,000
663,000
5,506
,000
5,506
,000
5,508
,000
5,508
,000
5,510
,000
5,510
,000
5,512
,000
5,512
,000
5,514
,000
5,514
,000
Map Projection: NAD 1983 UTM Zone 11N Creation Date: June 2016
.
Document Path: \\teckcominco\CGO\Groups\TCGIS\Data\Projects\TributariesMapping\MXD\CatchmentMaps_Portrait_11x17_34K.mxd
Text
0 750 1,500375Meters
1:34,000
") Bridge
G Culvert
G Control Structure
G Rock Drain
G Weir
G Spillway
G Waterfall
G 10% Gradient Barrier
G 25% Gradient Barrier
!. Water Quality Monitoring
Rock DrainSettling PondsRealigned channelTeck Coal Permit BoundaryPre-mining Stream
Catchment Area as of Sept. 2015CWB Catchment Area - 1980's with UpdatesFish Habitat Connected to MainstemFish Habitat Fragmented (Potentially Reversible)Fish Habitat Fragmented (Permanently Isolated)Fish Habitat Permanently Altered or DestroyedNon-Fish Bearing
Erickson Creek!
!
!
Fernie
Hosmer
Sparwood
Elk River
Fording River
MichelCreek
Bridge
FallsEV_EC1
EV_MC3
Erickson Creek
Mi chel CreekTCGIS
Figure D.11
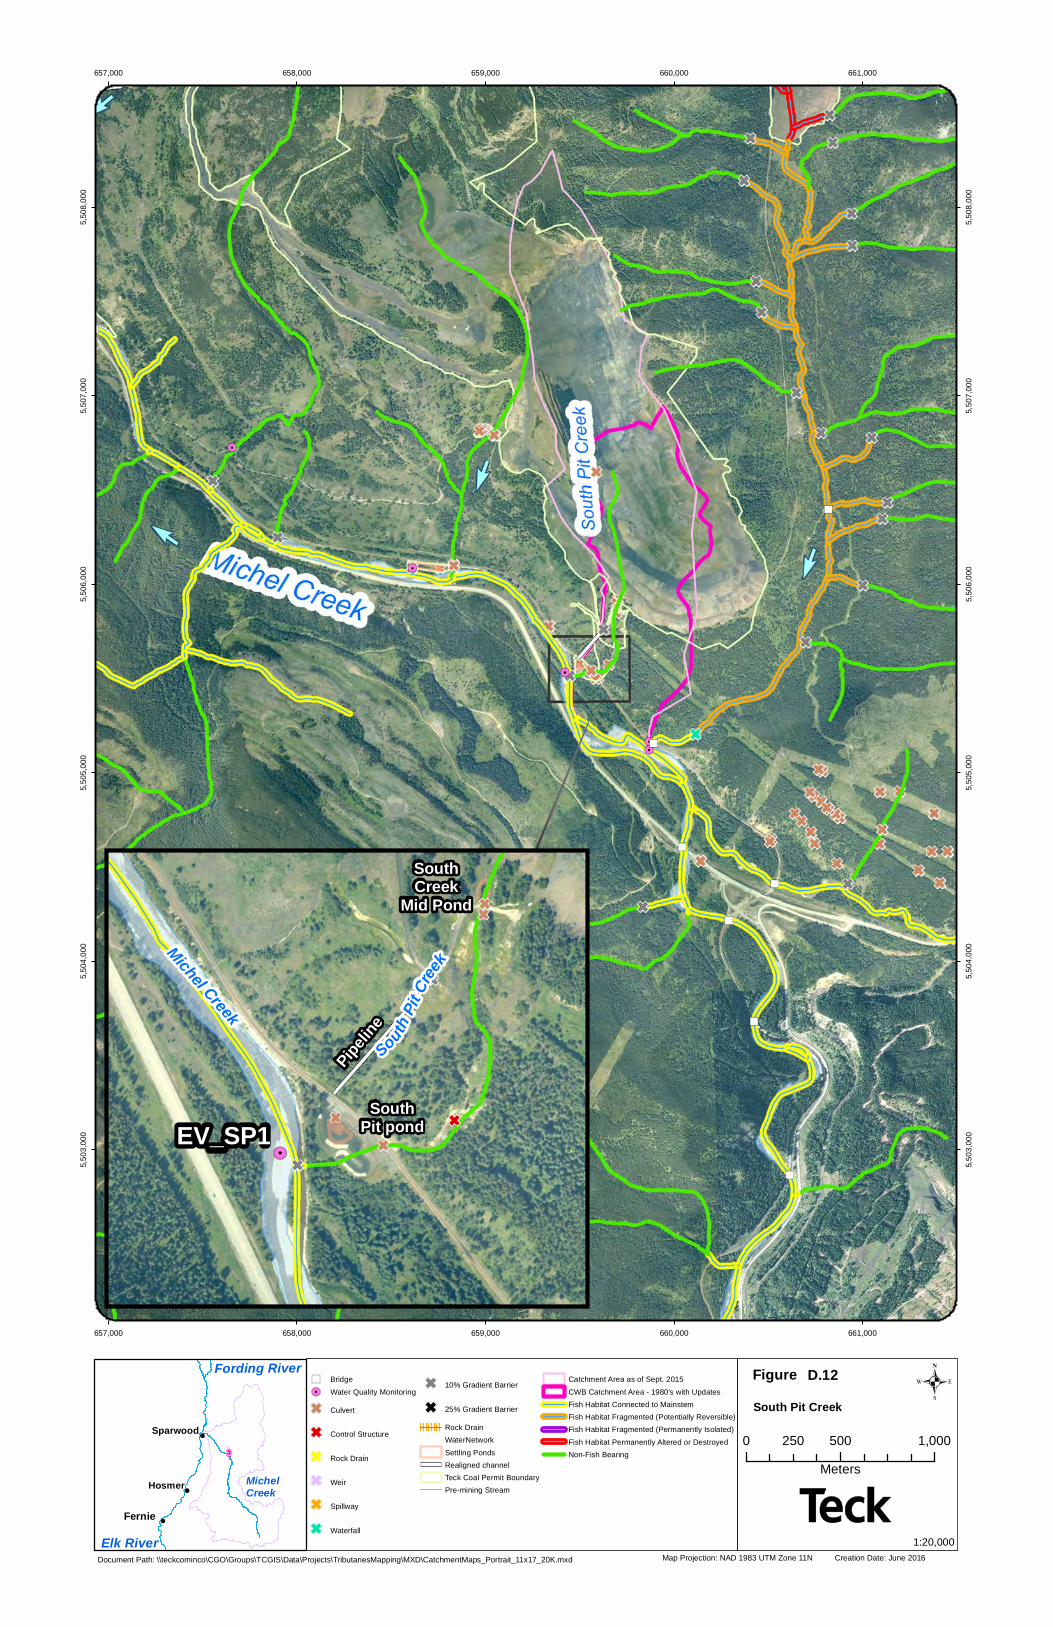
657,000
657,000
658,000
658,000
659,000
659,000
660,000
660,000
661,000
661,000
5,503
,000
5,503
,000
5,504
,000
5,504
,000
5,505
,000
5,505
,000
5,506
,000
5,506
,000
5,507
,000
5,507
,000
5,508
,000
5,508
,000
Map Projection: NAD 1983 UTM Zone 11N Creation Date: June 2016
.Figure
Document Path: \\teckcominco\CGO\Groups\TCGIS\Data\Projects\TributariesMapping\MXD\CatchmentMaps_Portrait_11x17_20K.mxd
Text
0 500 1,000250Meters
1:20,000
South Pit Creek!
!
!
Fernie
Hosmer
Sparwood
Elk River
Fording River
MichelCreek
GG
GG
Pipeline
SouthCreek
Mid Pond
SouthPit pondEV_SP1
SouthPit
Creek
Michel Creek
D.12") Bridge!. Water Quality Monitoring
G Culvert
G Control Structure
G Rock Drain
G Weir
G Spillway
G Waterfall
G 10% Gradient Barrier
G 25% Gradient BarrierRock DrainWaterNetworkSettling PondsRealigned channelTeck Coal Permit BoundaryPre-mining Stream
Catchment Area as of Sept. 2015CWB Catchment Area - 1980's with UpdatesFish Habitat Connected to MainstemFish Habitat Fragmented (Potentially Reversible)Fish Habitat Fragmented (Permanently Isolated)Fish Habitat Permanently Altered or DestroyedNon-Fish Bearing
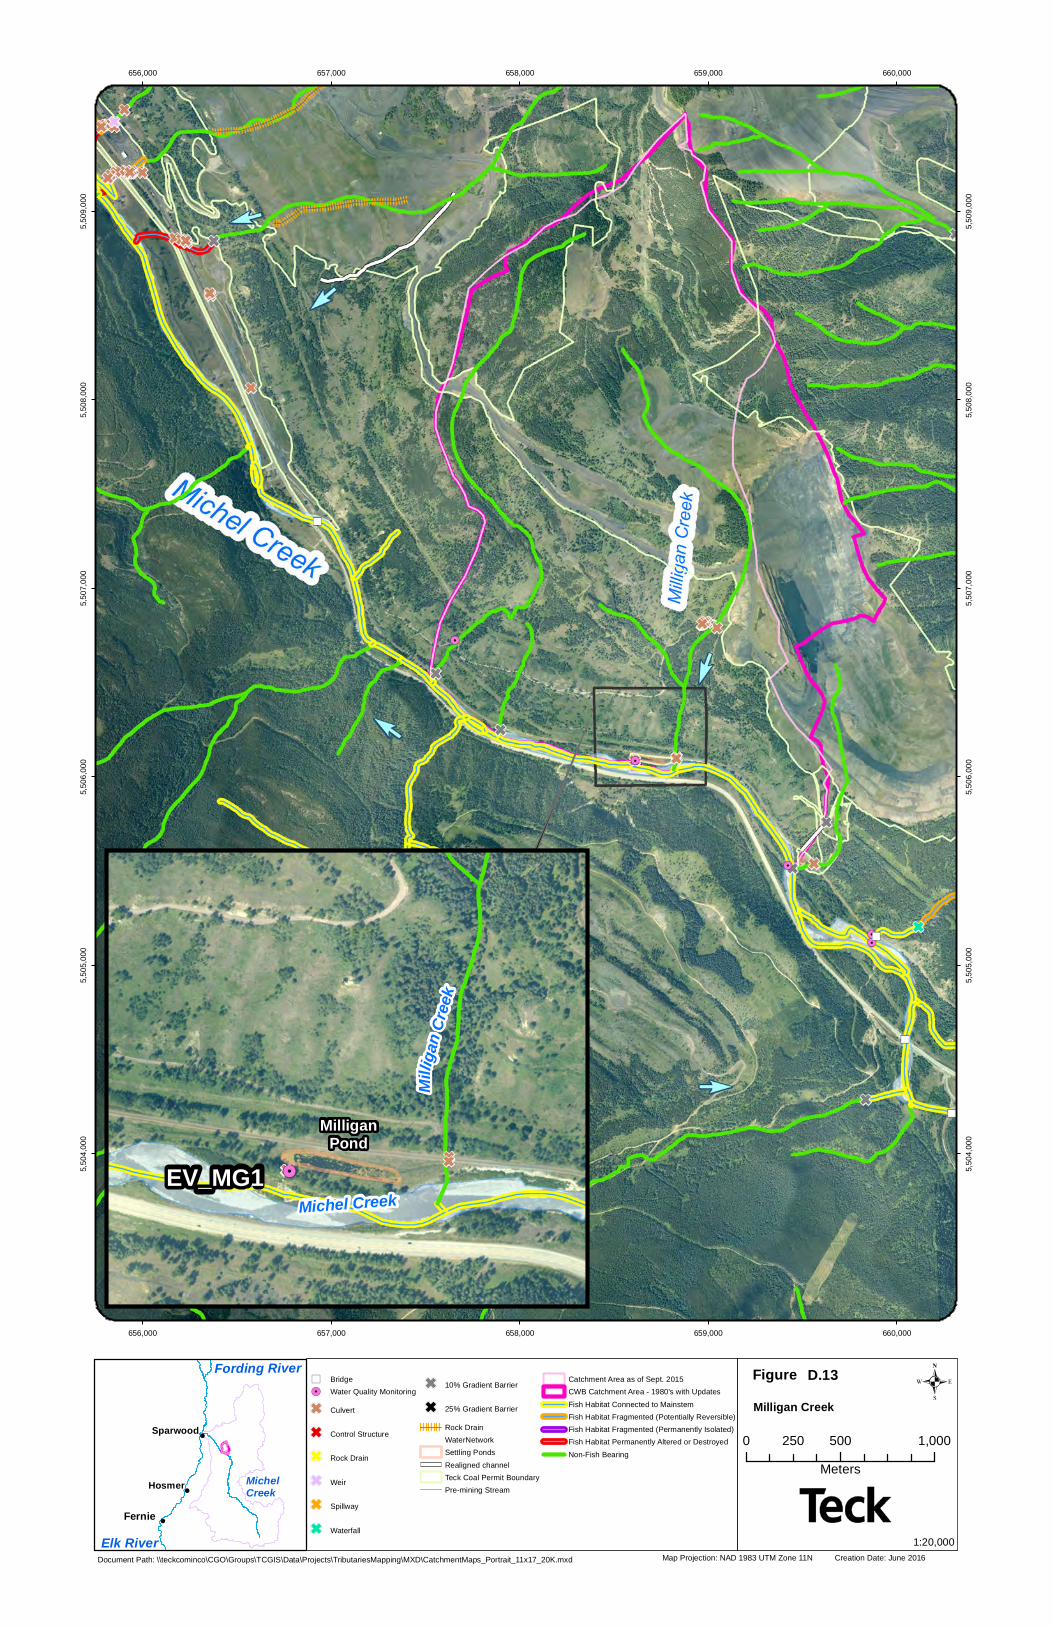
656,000
656,000
657,000
657,000
658,000
658,000
659,000
659,000
660,000
660,000
5,504
,000
5,504
,000
5,505
,000
5,505
,000
5,506
,000
5,506
,000
5,507
,000
5,507
,000
5,508
,000
5,508
,000
5,509
,000
5,509
,000
Map Projection: NAD 1983 UTM Zone 11N Creation Date: June 2016
.Figure
Document Path: \\teckcominco\CGO\Groups\TCGIS\Data\Projects\TributariesMapping\MXD\CatchmentMaps_Portrait_11x17_20K.mxd
Text
0 500 1,000250Meters
1:20,000
Milligan Creek!
!
!
Fernie
Hosmer
Sparwood
Elk River
Fording River
MichelCreek
MilliganPond
EV_MG1
Millig
anCr
eek
Michel Creek
D.13") Bridge!. Water Quality Monitoring
G Culvert
G Control Structure
G Rock Drain
G Weir
G Spillway
G Waterfall
G 10% Gradient Barrier
G 25% Gradient Barrier
Rock DrainWaterNetworkSettling PondsRealigned channelTeck Coal Permit BoundaryPre-mining Stream
Catchment Area as of Sept. 2015CWB Catchment Area - 1980's with UpdatesFish Habitat Connected to MainstemFish Habitat Fragmented (Potentially Reversible)Fish Habitat Fragmented (Permanently Isolated)Fish Habitat Permanently Altered or DestroyedNon-Fish Bearing
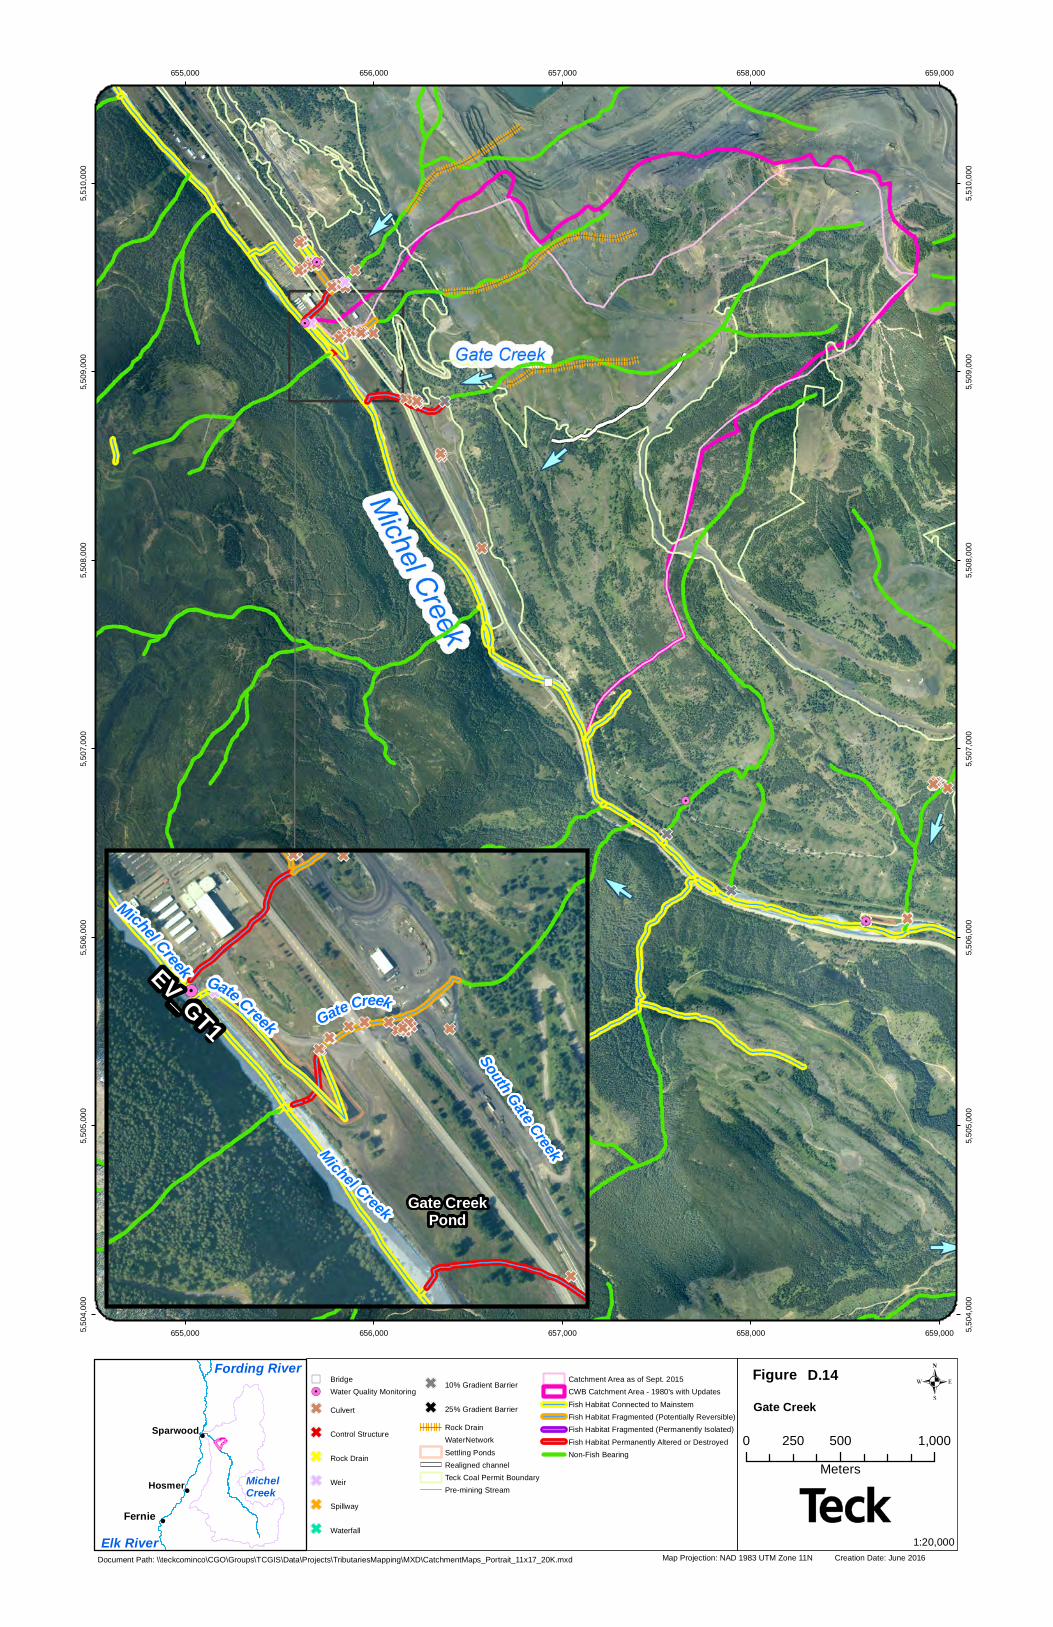
655,000
655,000
656,000
656,000
657,000
657,000
658,000
658,000
659,000
659,0005,504
,000
5,504
,000
5,505
,000
5,505
,000
5,506
,000
5,506
,000
5,507
,000
5,507
,000
5,508
,000
5,508
,000
5,509
,000
5,509
,000
5,510
,000
5,510
,000
Map Projection: NAD 1983 UTM Zone 11N Creation Date: June 2016
.Figure
Document Path: \\teckcominco\CGO\Groups\TCGIS\Data\Projects\TributariesMapping\MXD\CatchmentMaps_Portrait_11x17_20K.mxd
Text
0 500 1,000250Meters
1:20,000
Gate Creek!
!
!
Fernie
Hosmer
Sparwood
Elk River
Fording River
MichelCreek
Gate CreekPond
EV_GT1 Gate Creek
South Gate CreekMichel Creek
Michel Creek Gate Creek
D.14") Bridge!. Water Quality Monitoring
G Culvert
G Control Structure
G Rock Drain
G Weir
G Spillway
G Waterfall
G 10% Gradient Barrier
G 25% Gradient BarrierRock DrainWaterNetworkSettling PondsRealigned channelTeck Coal Permit BoundaryPre-mining Stream
Catchment Area as of Sept. 2015CWB Catchment Area - 1980's with UpdatesFish Habitat Connected to MainstemFish Habitat Fragmented (Potentially Reversible)Fish Habitat Fragmented (Permanently Isolated)Fish Habitat Permanently Altered or DestroyedNon-Fish Bearing
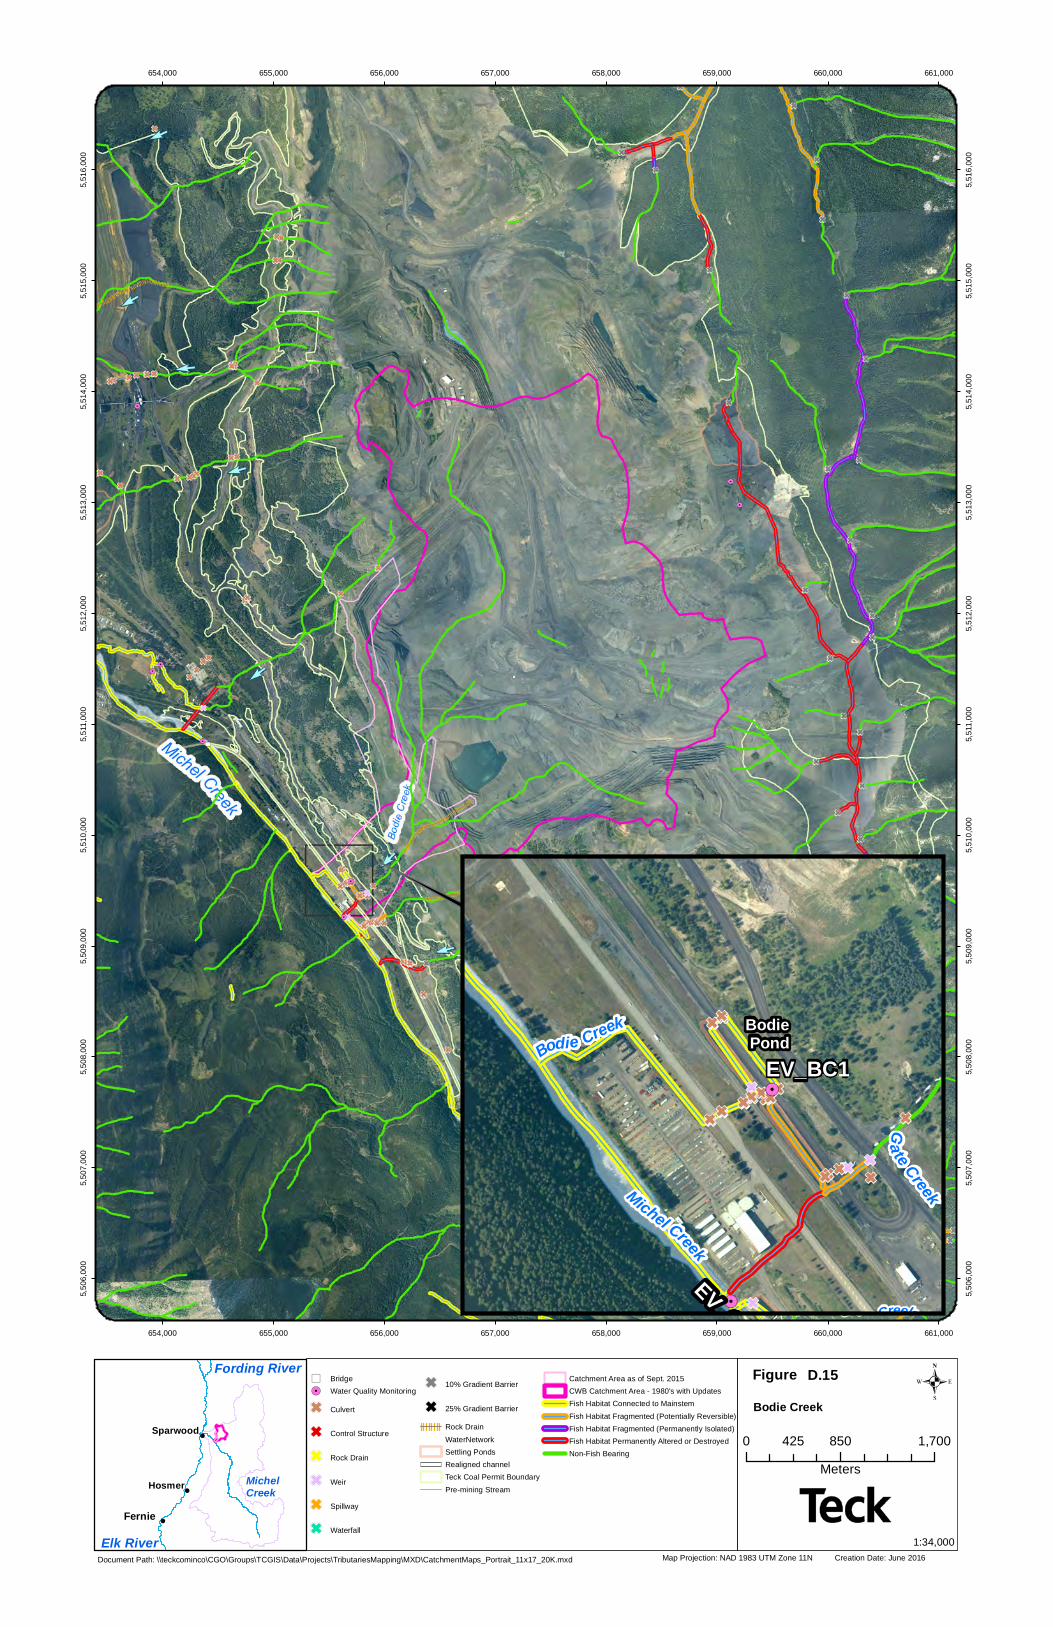
654,000
654,000
655,000
655,000
656,000
656,000
657,000
657,000
658,000
658,000
659,000
659,000
660,000
660,000
661,000
661,000
5,506
,000
5,506
,000
5,507
,000
5,507
,000
5,508
,000
5,508
,000
5,509
,000
5,509
,000
5,510
,000
5,510
,000
5,511
,000
5,511
,000
5,512
,000
5,512
,000
5,513
,000
5,513
,000
5,514
,000
5,514
,000
5,515
,000
5,515
,000
5,516
,000
5,516
,000
Map Projection: NAD 1983 UTM Zone 11N Creation Date: June 2016
.Figure
Document Path: \\teckcominco\CGO\Groups\TCGIS\Data\Projects\TributariesMapping\MXD\CatchmentMaps_Portrait_11x17_20K.mxd
Text
0 850 1,700425Meters
1:34,000
Bodie Creek!
!
!
Fernie
Hosmer
Sparwood
Elk River
Fording River
MichelCreek
Bodie Pond
EV_BC1
EV_GT1 Gate Creek
Ga te Creek
Bodie Creek
Michel Creek
D.15") Bridge!. Water Quality Monitoring
G Culvert
G Control Structure
G Rock Drain
G Weir
G Spillway
G Waterfall
G 10% Gradient Barrier
G 25% Gradient BarrierRock DrainWaterNetworkSettling PondsRealigned channelTeck Coal Permit BoundaryPre-mining Stream
Catchment Area as of Sept. 2015CWB Catchment Area - 1980's with UpdatesFish Habitat Connected to MainstemFish Habitat Fragmented (Potentially Reversible)Fish Habitat Fragmented (Permanently Isolated)Fish Habitat Permanently Altered or DestroyedNon-Fish Bearing
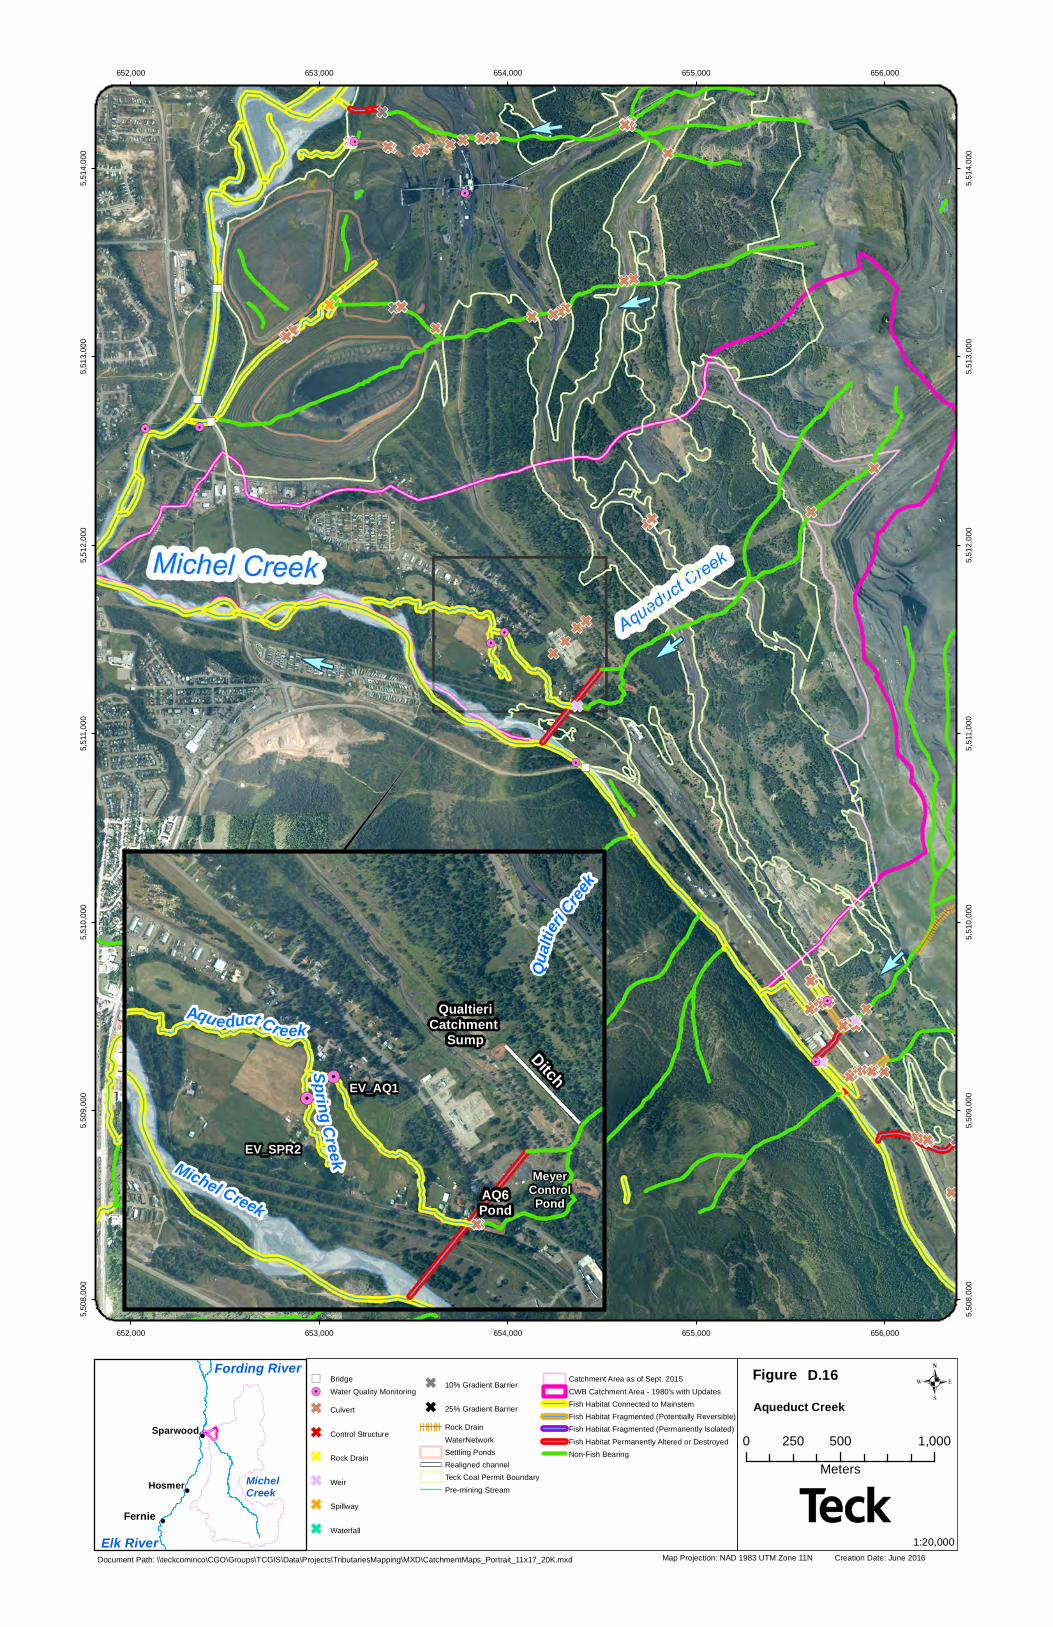
652,000
652,000
653,000
653,000
654,000
654,000
655,000
655,000
656,000
656,000
5,508
,000
5,508
,000
5,509
,000
5,509
,000
5,510
,000
5,510
,000
5,511
,000
5,511
,000
5,512
,000
5,512
,000
5,513
,000
5,513
,000
5,514
,000
5,514
,000
Map Projection: NAD 1983 UTM Zone 11N Creation Date: June 2016
.Figure
Document Path: \\teckcominco\CGO\Groups\TCGIS\Data\Projects\TributariesMapping\MXD\CatchmentMaps_Portrait_11x17_20K.mxd
Text
0 500 1,000250Meters
1:20,000
Aqueduct Creek!
!
!
Fernie
Hosmer
Sparwood
Elk River
Fording River
MichelCreek
QualtieriCatchment
Sump
Ditch
AQ6Pond
MeyerControlPond
EV_AQ1
EV_SPR2
Spring Creek
Aqueduct Creek
Qualt
ieriCree
k
Michel Creek
D.16") Bridge!. Water Quality Monitoring
G Culvert
G Control Structure
G Rock Drain
G Weir
G Spillway
G Waterfall
G 10% Gradient Barrier
G 25% Gradient BarrierRock DrainWaterNetworkSettling PondsRealigned channelTeck Coal Permit BoundaryPre-mining Stream
Catchment Area as of Sept. 2015CWB Catchment Area - 1980's with UpdatesFish Habitat Connected to MainstemFish Habitat Fragmented (Potentially Reversible)Fish Habitat Fragmented (Permanently Isolated)Fish Habitat Permanently Altered or DestroyedNon-Fish Bearing
APPENDIX E
TRIBUTARIES TO MIDDLE ELK RIVER (MU4/MU5)
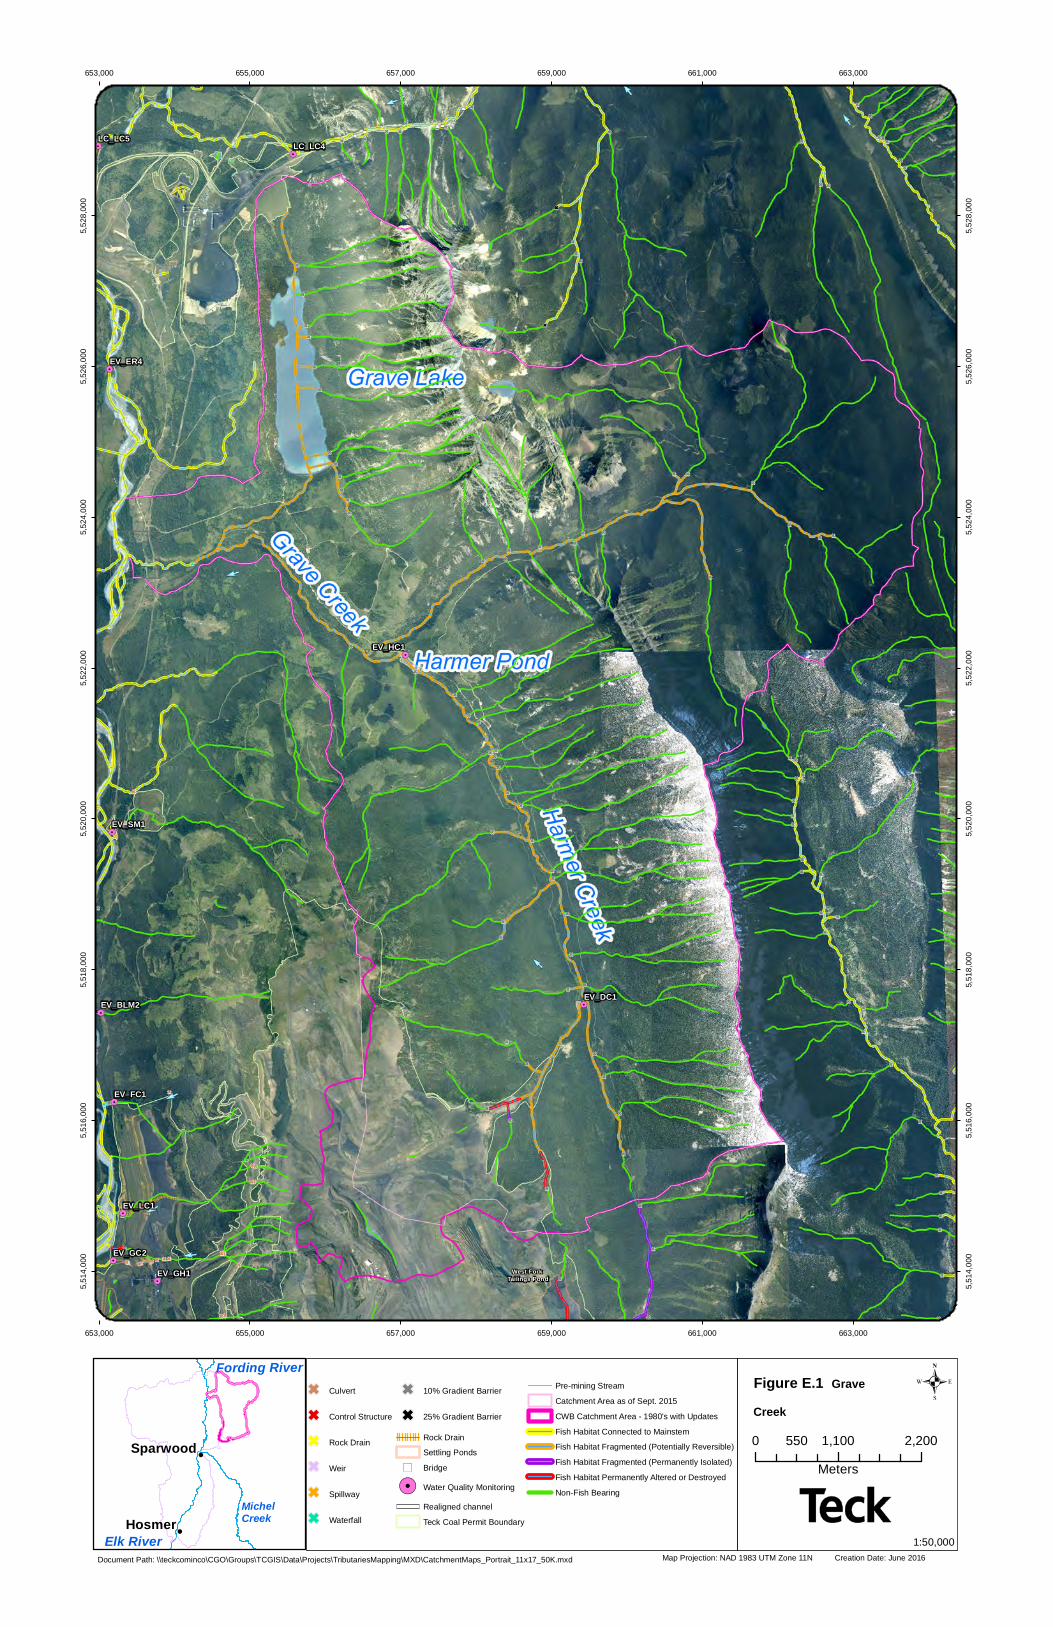
West Fork Tailings Pond
EV_BLM2EV_DC1
EV_ER4
EV_FC1
EV_GC2
EV_GH1
EV_HC1
EV_LC1
EV_SM1
LC_LC4LC_LC5
653,000
653,000
655,000
655,000
657,000
657,000
659,000
659,000
661,000
661,000
663,000
663,000
5,514
,000
5,514
,000
5,516
,000
5,516
,000
5,518
,000
5,518
,000
5,520
,000
5,520
,000
5,522
,000
5,522
,000
5,524
,000
5,524
,000
5,526
,000
5,526
,000
5,528
,000
5,528
,000
Map Projection: NAD 1983 UTM Zone 11N Creation Date: June 2016
.
Document Path: \\teckcominco\CGO\Groups\TCGIS\Data\Projects\TributariesMapping\MXD\CatchmentMaps_Portrait_11x17_50K.mxd
0 1,100 2,200550Meters
1:50,000
G Culvert
G Control Structure
G Rock Drain
G Weir
G Spillway
G Waterfall
G 10% Gradient Barrier
G 25% Gradient Barrier
Rock DrainSettling Ponds
") Bridge
!. Water Quality MonitoringRealigned channelTeck Coal Permit Boundary
Pre-mining StreamCatchment Area as of Sept. 2015CWB Catchment Area - 1980's with UpdatesFish Habitat Connected to MainstemFish Habitat Fragmented (Potentially Reversible)Fish Habitat Fragmented (Permanently Isolated)Fish Habitat Permanently Altered or DestroyedNon-Fish Bearing
Figur e E.1 Grave Creek
!
!Hosmer
Sparwood
Elk River
Fording River
MichelCreek
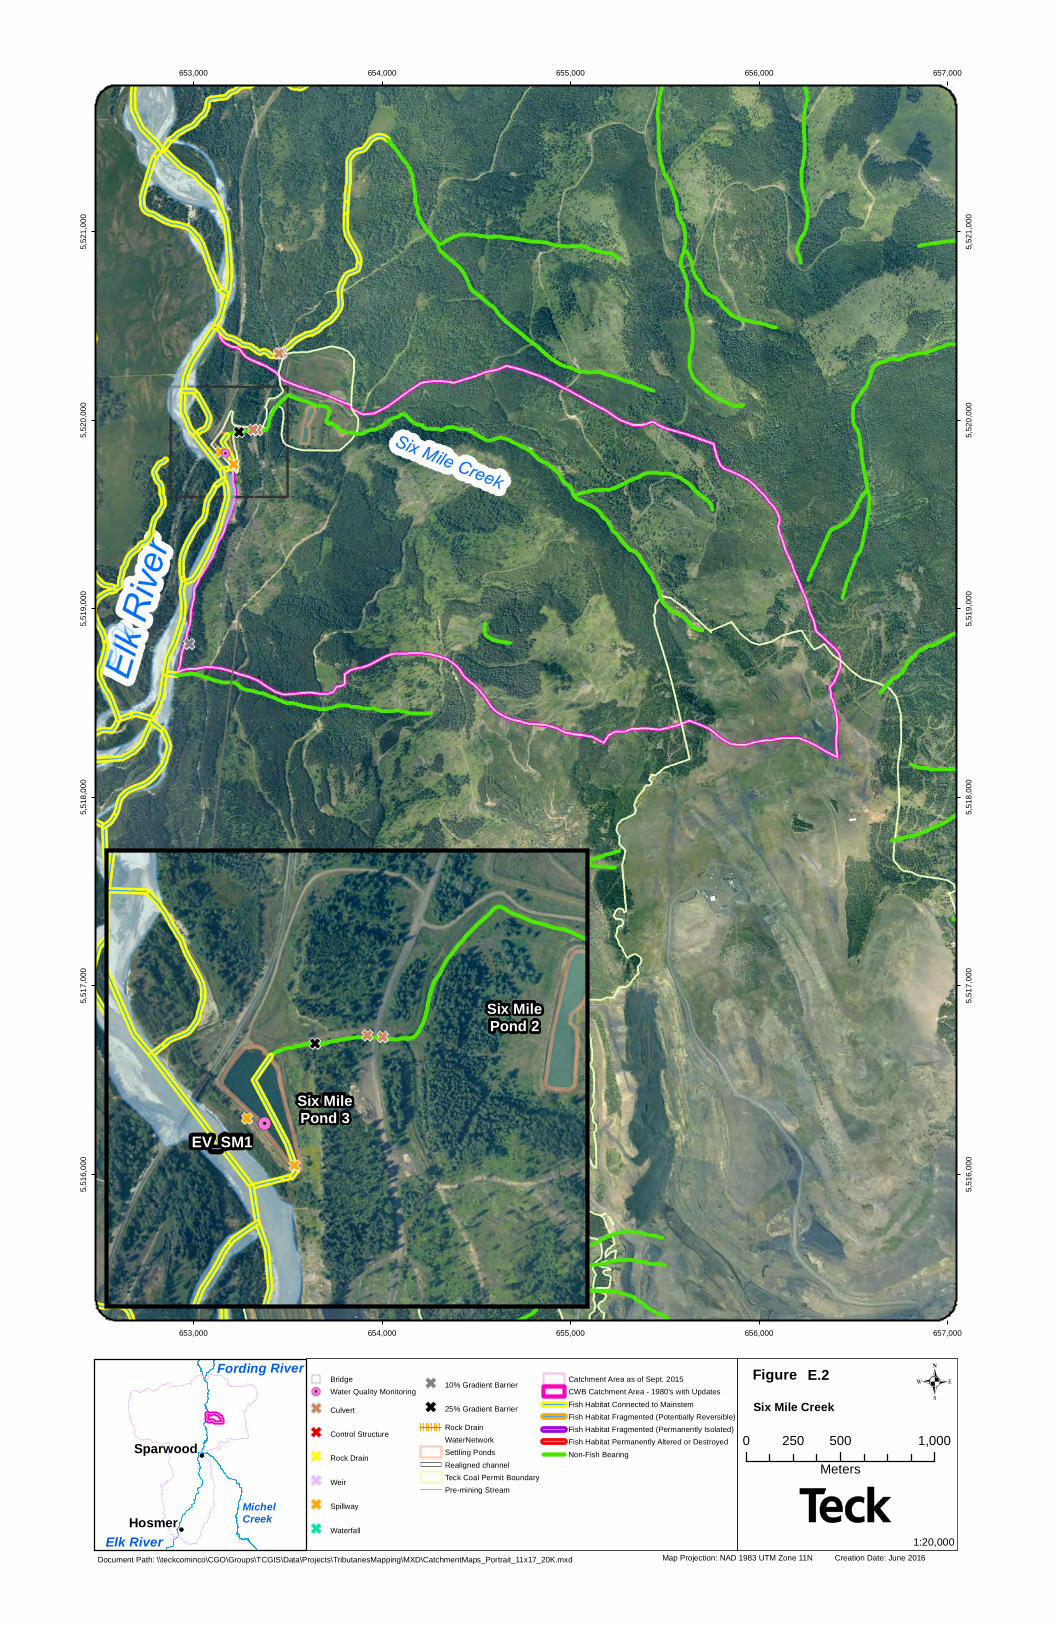
653,000
653,000
654,000
654,000
655,000
655,000
656,000
656,000
657,000
657,000
5,516
,000
5,516
,000
5,517
,000
5,517
,000
5,518
,000
5,518
,000
5,519
,000
5,519
,000
5,520
,000
5,520
,000
5,521
,000
5,521
,000
Map Projection: NAD 1983 UTM Zone 11N Creation Date: June 2016
.Figure
Document Path: \\teckcominco\CGO\Groups\TCGIS\Data\Projects\TributariesMapping\MXD\CatchmentMaps_Portrait_11x17_20K.mxd
Text
0 500 1,000250Meters
1:20,000
Six Mile Creek
!
!Hosmer
Sparwood
Elk River
Fording River
MichelCreek
Six MilePond 2
Six MilePond 3
EV_SM1
E.2") Bridge!. Water Quality Monitoring
G Culvert
G Control Structure
G Rock Drain
G Weir
G Spillway
G Waterfall
G 10% Gradient Barrier
G 25% Gradient Barrier
Rock DrainWaterNetworkSettling PondsRealigned channelTeck Coal Permit BoundaryPre-mining Stream
Catchment Area as of Sept. 2015CWB Catchment Area - 1980's with UpdatesFish Habitat Connected to MainstemFish Habitat Fragmented (Potentially Reversible)Fish Habitat Fragmented (Permanently Isolated)Fish Habitat Permanently Altered or DestroyedNon-Fish Bearing
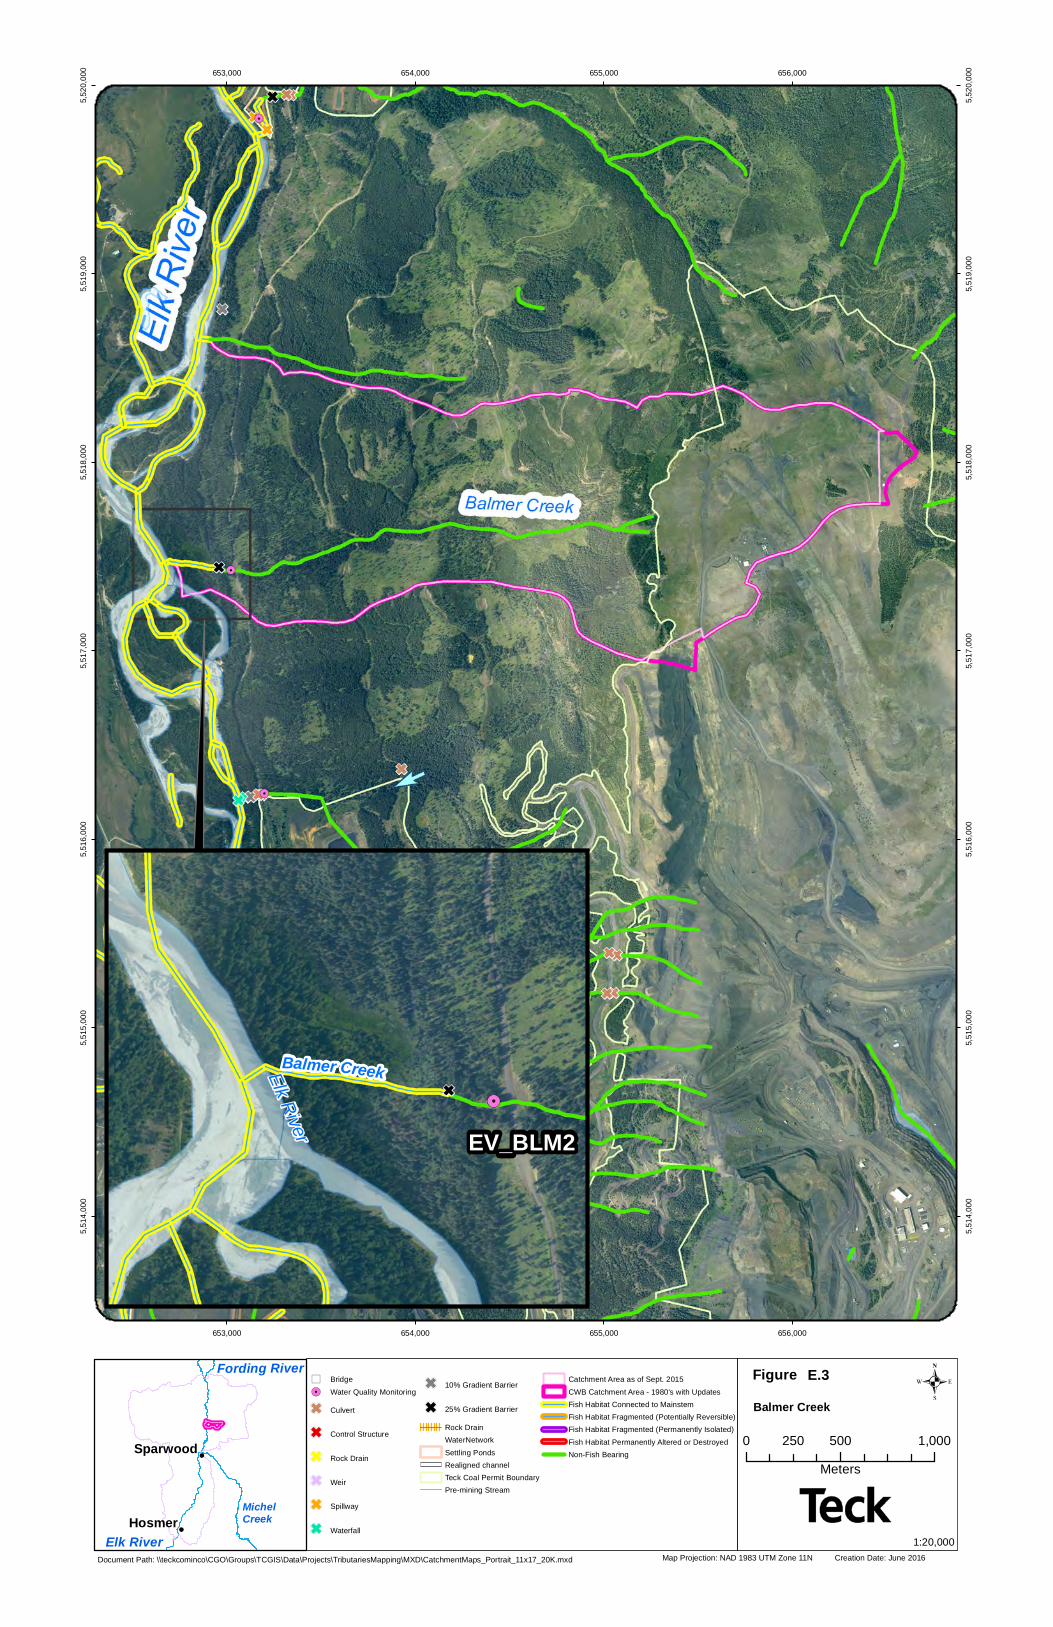
653,000
653,000
654,000
654,000
655,000
655,000
656,000
656,000
5,514
,000
5,514
,000
5,515
,000
5,515
,000
5,516
,000
5,516
,000
5,517
,000
5,517
,000
5,518
,000
5,518
,000
5,519
,000
5,519
,000
5,520
,000
5,520
,000
Map Projection: NAD 1983 UTM Zone 11N Creation Date: June 2016
.Figure
Document Path: \\teckcominco\CGO\Groups\TCGIS\Data\Projects\TributariesMapping\MXD\CatchmentMaps_Portrait_11x17_20K.mxd
Text
0 500 1,000250Meters
1:20,000
Balmer Creek
!
!Hosmer
Sparwood
Elk River
Fording River
MichelCreek
EV_BLM2
Elk River
Balmer Creek
E.3") Bridge!. Water Quality Monitoring
G Culvert
G Control Structure
G Rock Drain
G Weir
G Spillway
G Waterfall
G 10% Gradient Barrier
G 25% Gradient BarrierRock DrainWaterNetworkSettling PondsRealigned channelTeck Coal Permit BoundaryPre-mining Stream
Catchment Area as of Sept. 2015CWB Catchment Area - 1980's with UpdatesFish Habitat Connected to MainstemFish Habitat Fragmented (Potentially Reversible)Fish Habitat Fragmented (Permanently Isolated)Fish Habitat Permanently Altered or DestroyedNon-Fish Bearing
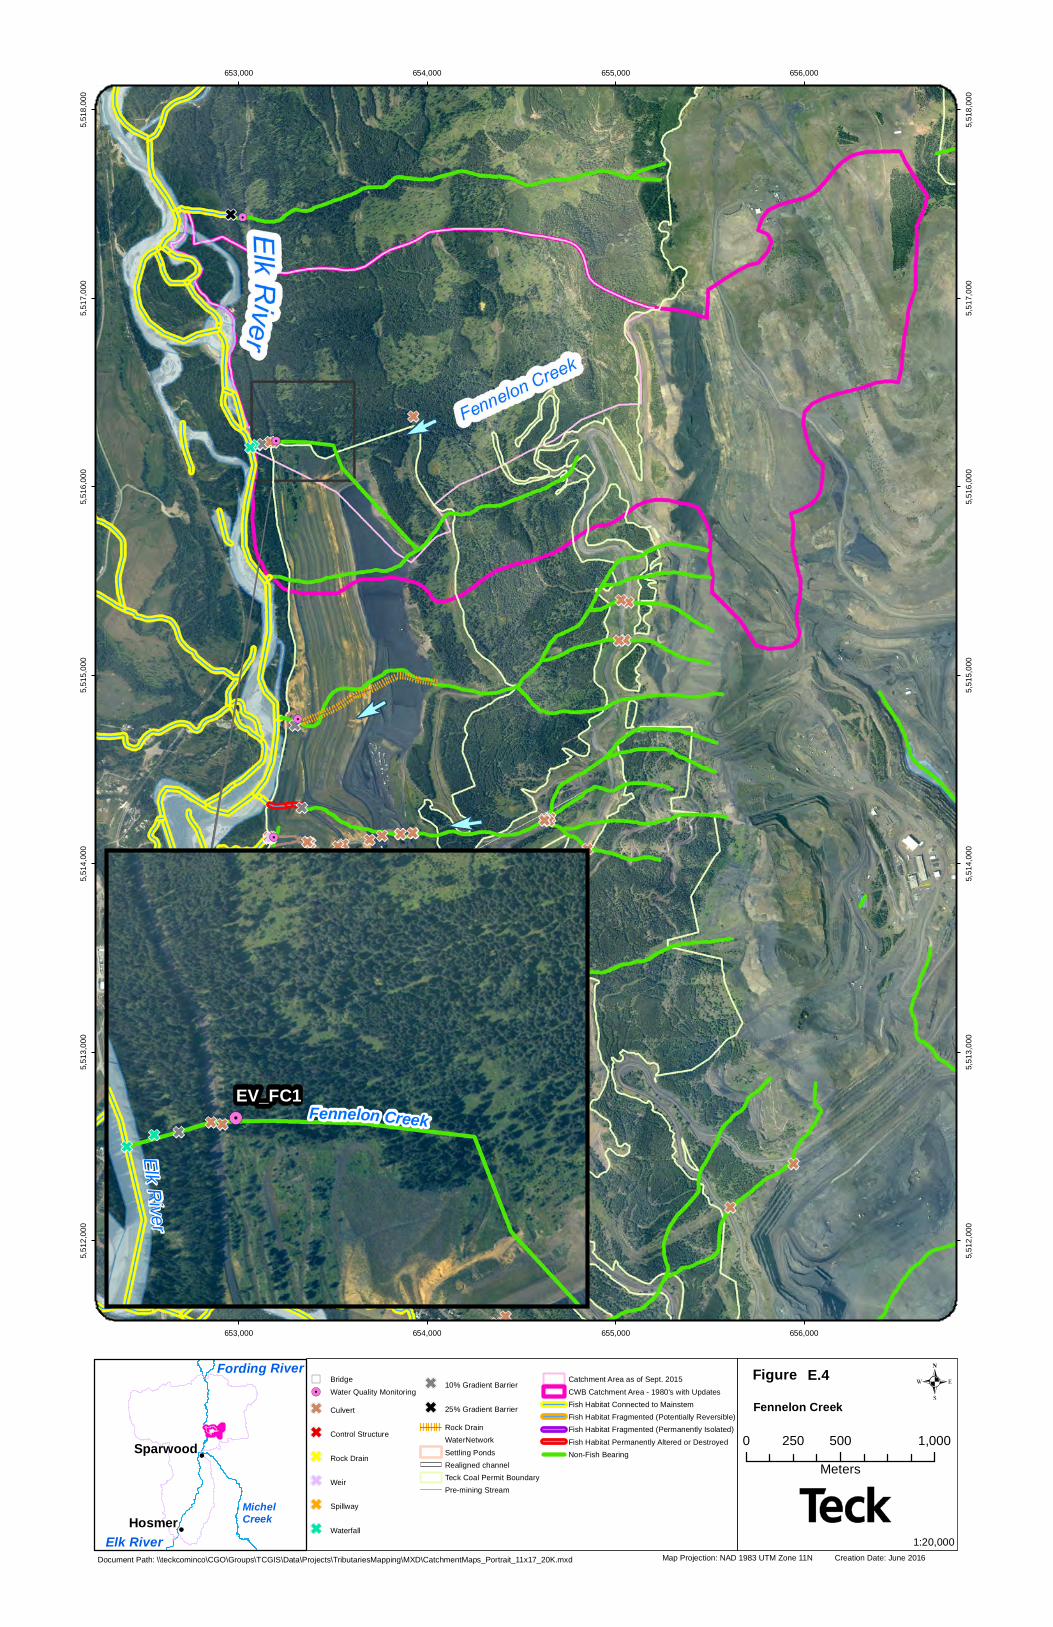
653,000
653,000
654,000
654,000
655,000
655,000
656,000
656,000
5,512
,000
5,512
,000
5,513
,000
5,513
,000
5,514
,000
5,514
,000
5,515
,000
5,515
,000
5,516
,000
5,516
,000
5,517
,000
5,517
,000
5,518
,000
5,518
,000
Map Projection: NAD 1983 UTM Zone 11N Creation Date: June 2016
.Figure
Document Path: \\teckcominco\CGO\Groups\TCGIS\Data\Projects\TributariesMapping\MXD\CatchmentMaps_Portrait_11x17_20K.mxd
Text
0 500 1,000250Meters
1:20,000
Fennelon Creek
!
!Hosmer
Sparwood
Elk River
Fording River
MichelCreek
EV_FC1
Elk River
Fennelon Creek
E.4") Bridge!. Water Quality Monitoring
G Culvert
G Control Structure
G Rock Drain
G Weir
G Spillway
G Waterfall
G 10% Gradient Barrier
G 25% Gradient BarrierRock DrainWaterNetworkSettling PondsRealigned channelTeck Coal Permit BoundaryPre-mining Stream
Catchment Area as of Sept. 2015CWB Catchment Area - 1980's with UpdatesFish Habitat Connected to MainstemFish Habitat Fragmented (Potentially Reversible)Fish Habitat Fragmented (Permanently Isolated)Fish Habitat Permanently Altered or DestroyedNon-Fish Bearing
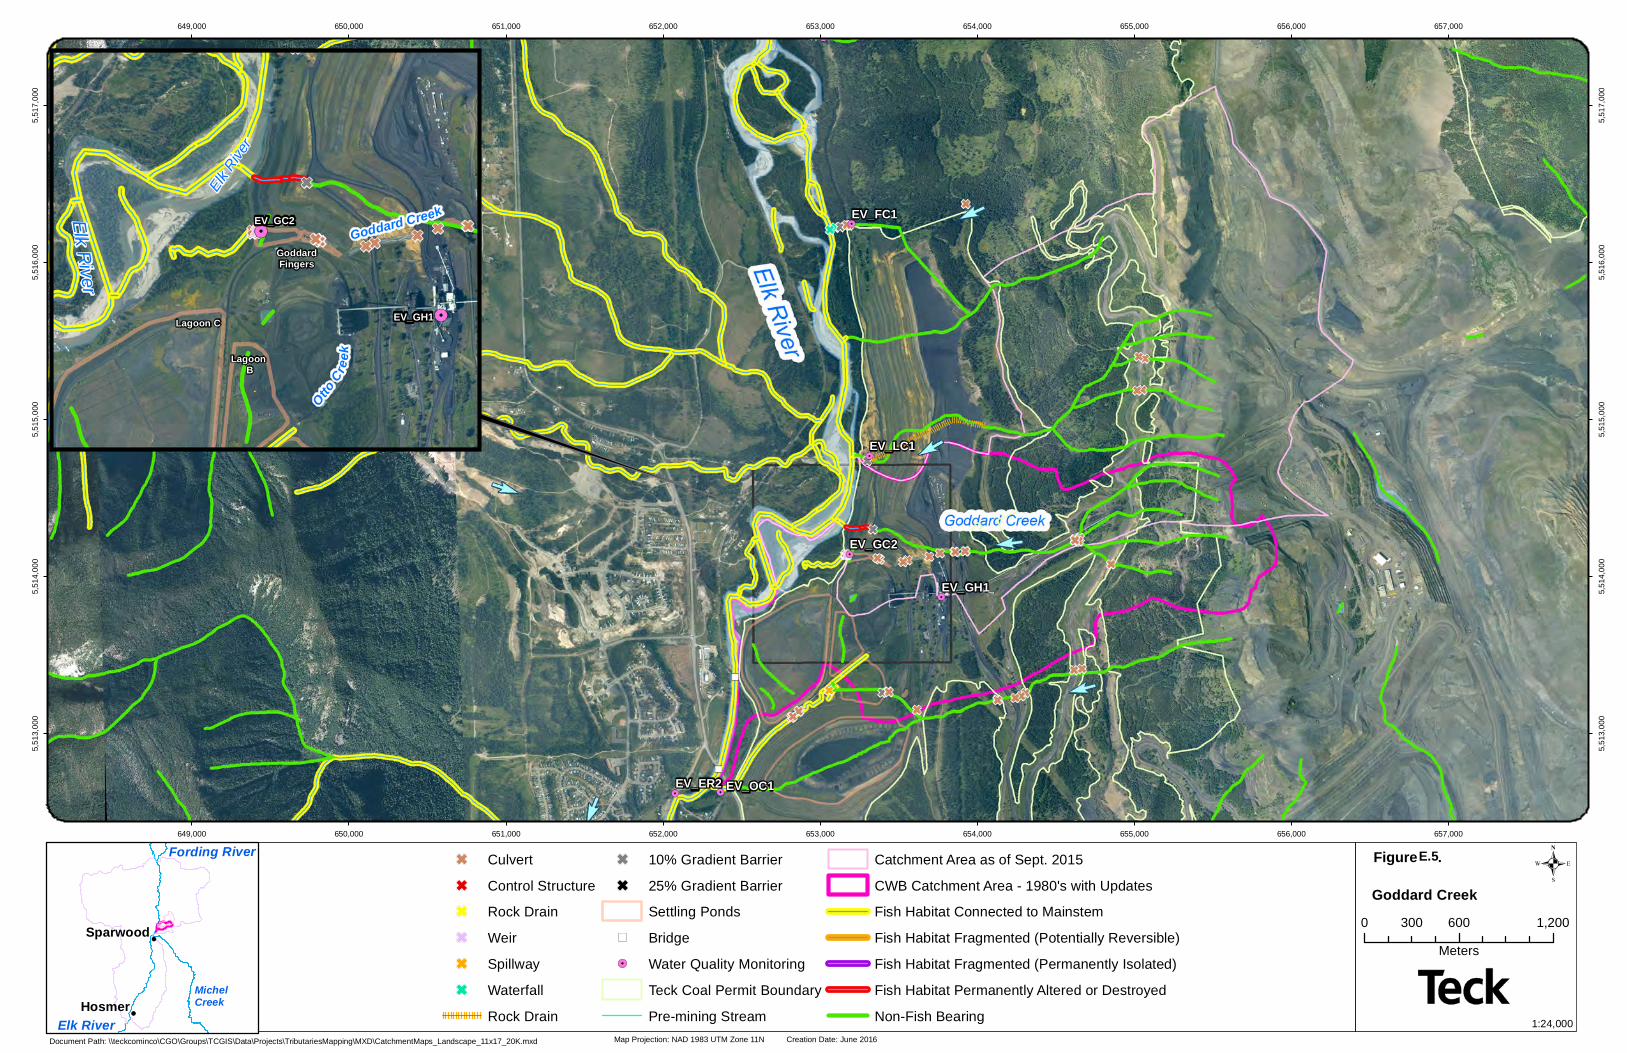
!
!Hosmer
Sparwood
Elk River
Fording River
MichelCreek
EV_ER2
EV_FC1
EV_GC2
EV_GH1
EV_LC1
EV_OC1
649,000
649,000
650,000
650,000
651,000
651,000
652,000
652,000
653,000
653,000
654,000
654,000
655,000
655,000
656,000
656,000
657,000
657,000
5,513
,000
5,513
,000
5,514
,000
5,514
,000
5,515
,000
5,515
,000
5,516
,000
5,516
,000
5,517
,000
5,517
,000
Map Projection: NAD 1983 UTM Zone 11N Creation Date: June 2016
. Figure .
Document Path: \\teckcominco\CGO\Groups\TCGIS\Data\Projects\TributariesMapping\MXD\CatchmentMaps_Landscape_11x17_20K.mxd
Text
0 600 1,200300Meters
1:24,000
G CulvertG Control StructureG Rock DrainG WeirG SpillwayG Waterfall
Rock Drain
G 10% Gradient BarrierG 25% Gradient Barrier
Settling Ponds") Bridge!. Water Quality Monitoring
Teck Coal Permit BoundaryPre-mining Stream
Catchment Area as of Sept. 2015CWB Catchment Area - 1980's with UpdatesFish Habitat Connected to MainstemFish Habitat Fragmented (Potentially Reversible)Fish Habitat Fragmented (Permanently Isolated)Fish Habitat Permanently Altered or DestroyedNon-Fish Bearing
Goddard Creek
Lagoon B
Lagoon C
GoddardFingers
EV_GC2
EV_GH1Otto
Creek
Goddard CreekElk
River
Elk River
E.5
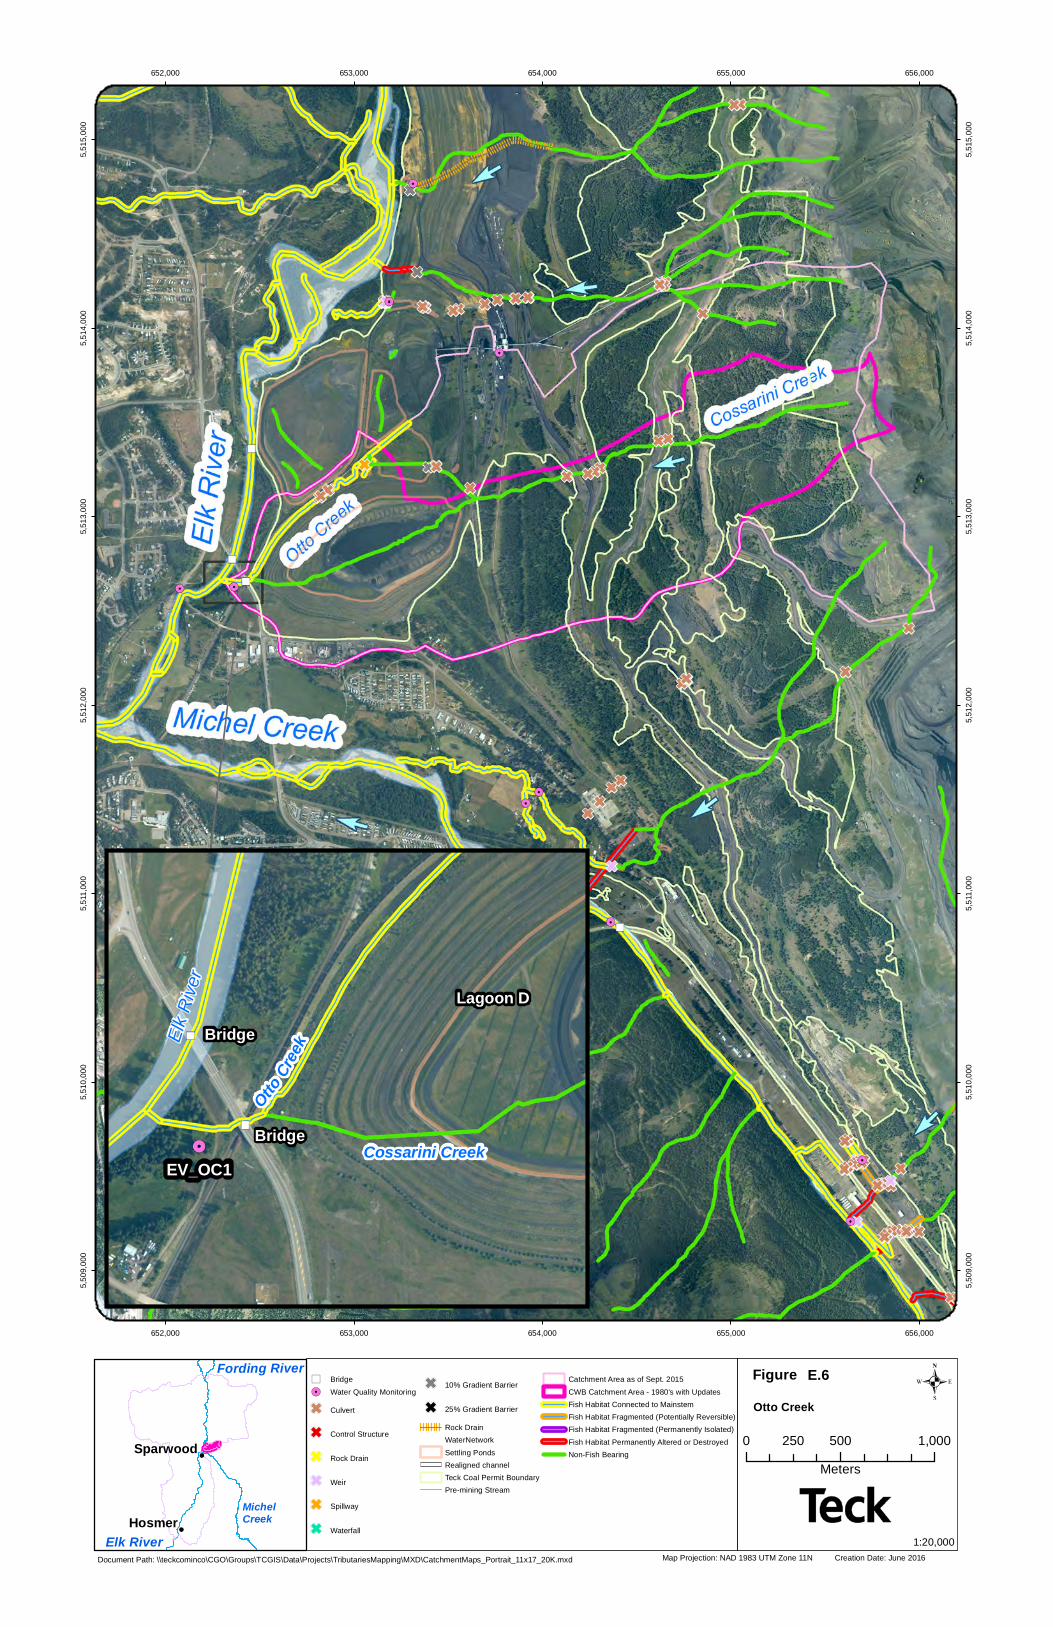
652,000
652,000
653,000
653,000
654,000
654,000
655,000
655,000
656,000
656,000
5,509
,000
5,509
,000
5,510
,000
5,510
,000
5,511
,000
5,511
,000
5,512
,000
5,512
,000
5,513
,000
5,513
,000
5,514
,000
5,514
,000
5,515
,000
5,515
,000
Map Projection: NAD 1983 UTM Zone 11N Creation Date: June 2016
.Figure
Document Path: \\teckcominco\CGO\Groups\TCGIS\Data\Projects\TributariesMapping\MXD\CatchmentMaps_Portrait_11x17_20K.mxd
Text
0 500 1,000250Meters
1:20,000
Otto Creek
!
!Hosmer
Sparwood
Elk River
Fording River
MichelCreek
Lagoon D
Cossarini CreekBridge
Bridge
EV_OC1
OttoCre
ekElk R
iver
E.6") Bridge!. Water Quality Monitoring
G Culvert
G Control Structure
G Rock Drain
G Weir
G Spillway
G Waterfall
G 10% Gradient Barrier
G 25% Gradient BarrierRock DrainWaterNetworkSettling PondsRealigned channelTeck Coal Permit BoundaryPre-mining Stream
Catchment Area as of Sept. 2015CWB Catchment Area - 1980's with UpdatesFish Habitat Connected to MainstemFish Habitat Fragmented (Potentially Reversible)Fish Habitat Fragmented (Permanently Isolated)Fish Habitat Permanently Altered or DestroyedNon-Fish Bearing
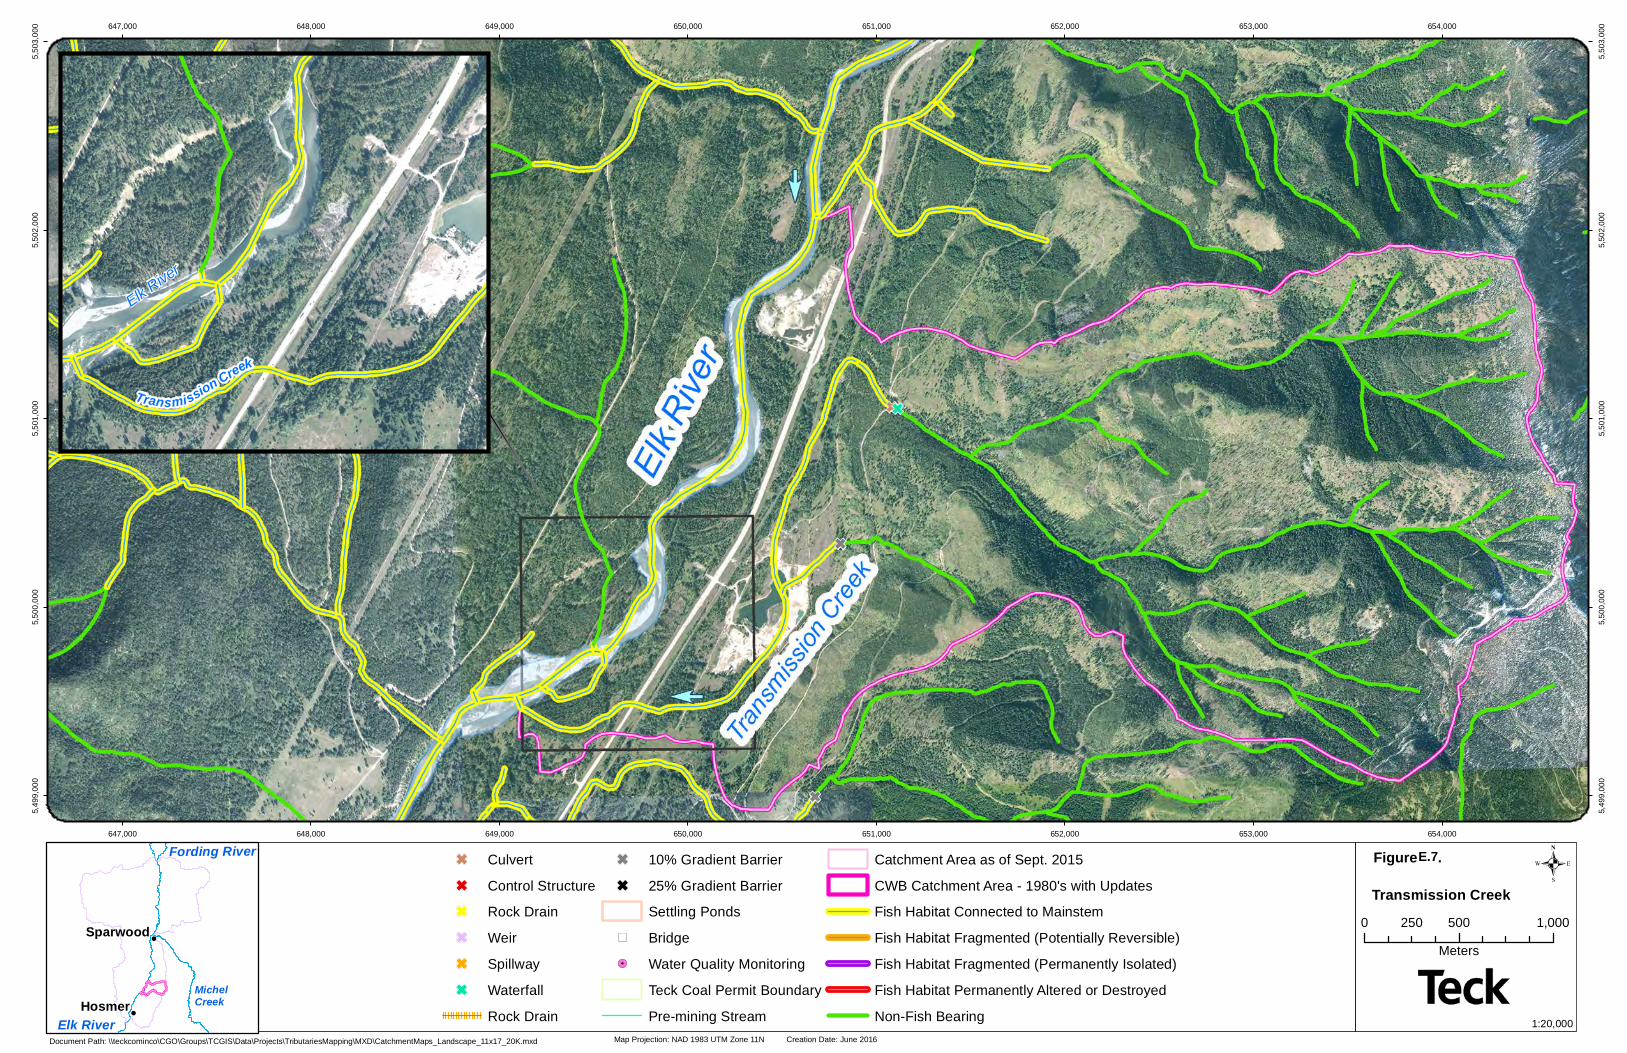
!
!Hosmer
Sparwood
Elk River
Fording River
MichelCreek
647,000
647,000
648,000
648,000
649,000
649,000
650,000
650,000
651,000
651,000
652,000
652,000
653,000
653,000
654,000
654,000
5,499
,000
5,499
,000
5,500
,000
5,500
,000
5,501
,000
5,501
,000
5,502
,000
5,502
,000
5,503
,000
5,503
,000
Map Projection: NAD 1983 UTM Zone 11N Creation Date: June 2016
.Figure E . 7 .
Document Path: \\teckcominco\CGO\Groups\TCGIS\Data\Projects\TributariesMapping\MXD\CatchmentMaps_Landscape_11x17_20K.mxd
Text
0 500 1,000250Meters
1:20,000
G CulvertG Control StructureG Rock DrainG WeirG SpillwayG Waterfall
Rock Drain
G 10% Gradient BarrierG 25% Gradient Barrier
Settling Ponds") Bridge!. Water Quality Monitoring
Teck Coal Permit BoundaryPre-mining Stream
Catchment Area as of Sept. 2015CWB Catchment Area - 1980's with UpdatesFish Habitat Connected to MainstemFish Habitat Fragmented (Potentially Reversible)Fish Habitat Fragmented (Permanently Isolated)Fish Habitat Permanently Altered or DestroyedNon-Fish Bearing
Transmission Creek
Transmission Creek
Elk River
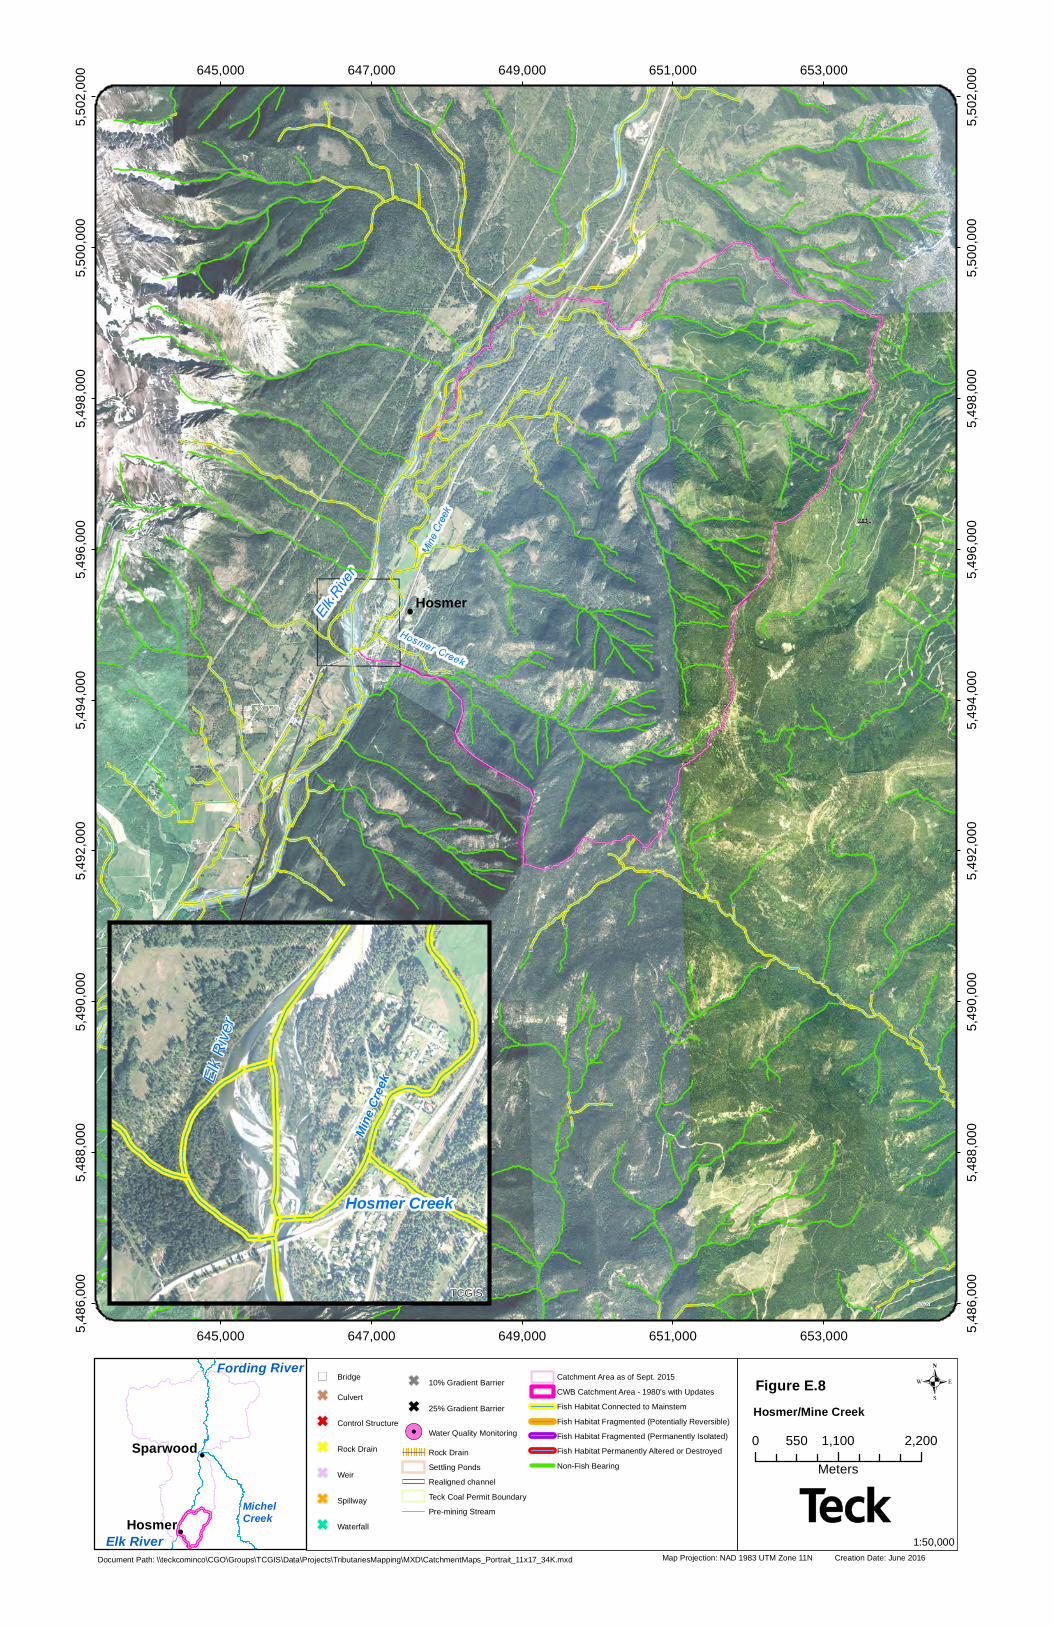
Hosmer
Bridge
TCGIS
645,000
645,000
647,000
647,000
649,000
649,000
651,000
651,000
653,000
653,0005,486
,000
5,486
,000
5,488
,000
5,488
,000
5,490
,000
5,490
,000
5,492
,000
5,492
,000
5,494
,000
5,494
,000
5,496
,000
5,496
,000
5,498
,000
5,498
,000
5,500
,000
5,500
,000
5,502
,000
5,502
,000
Map Projection: NAD 1983 UTM Zone 11N Creation Date: June 2016
.
Document Path: \\teckcominco\CGO\Groups\TCGIS\Data\Projects\TributariesMapping\MXD\CatchmentMaps_Portrait_11x17_34K.mxd
Text
0 1,100 2,200550Meters
1:50,000
") Bridge
G Culvert
G Control Structure
G Rock Drain
G Weir
G Spillway
G Waterfall
G 10% Gradient Barrier
G 25% Gradient Barrier
!. Water Quality Monitoring
Rock DrainSettling PondsRealigned channelTeck Coal Permit BoundaryPre-mining Stream
Catchment Area as of Sept. 2015CWB Catchment Area - 1980's with UpdatesFish Habitat Connected to MainstemFish Habitat Fragmented (Potentially Reversible)Fish Habitat Fragmented (Permanently Isolated)Fish Habitat Permanently Altered or DestroyedNon-Fish Bearing
Hosmer/Mine Creek
!
!Hosmer
Sparwood
Elk River
Fording River
MichelCreek
Hosmer Creek
Mine
Cree
kElk R
iver
TCGIS
Figure E.8

APPENDIX F
BIBLIOGRAPHIES
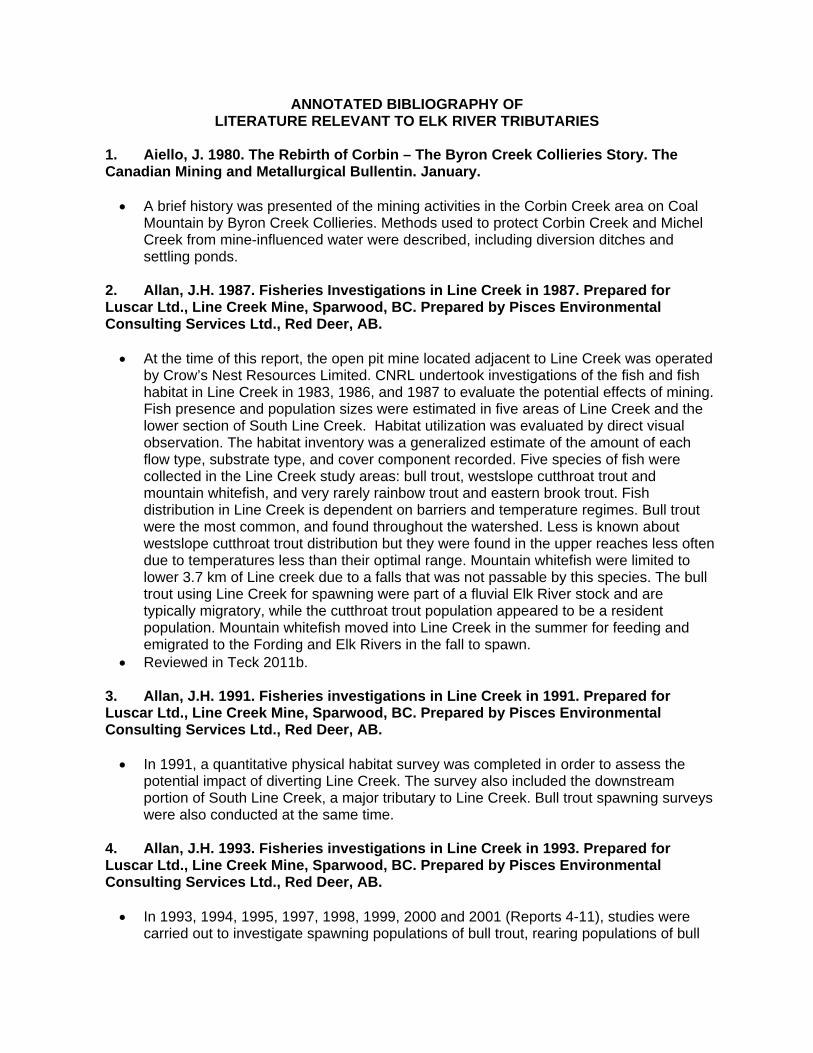
ANNOTATED BIBLIOGRAPHY OF LITERATURE RELEVANT TO ELK RIVER TRIBUTARIES
1. Aiello, J. 1980. The Rebirth of Corbin – The Byron Creek Collieries Story. The Canadian Mining and Metallurgical Bullentin. January.
A brief history was presented of the mining activities in the Corbin Creek area on Coal
Mountain by Byron Creek Collieries. Methods used to protect Corbin Creek and Michel Creek from mine-influenced water were described, including diversion ditches and settling ponds.
2. Allan, J.H. 1987. Fisheries Investigations in Line Creek in 1987. Prepared for Luscar Ltd., Line Creek Mine, Sparwood, BC. Prepared by Pisces Environmental Consulting Services Ltd., Red Deer, AB.
At the time of this report, the open pit mine located adjacent to Line Creek was operated
by Crow’s Nest Resources Limited. CNRL undertook investigations of the fish and fish habitat in Line Creek in 1983, 1986, and 1987 to evaluate the potential effects of mining. Fish presence and population sizes were estimated in five areas of Line Creek and the lower section of South Line Creek. Habitat utilization was evaluated by direct visual observation. The habitat inventory was a generalized estimate of the amount of each flow type, substrate type, and cover component recorded. Five species of fish were collected in the Line Creek study areas: bull trout, westslope cutthroat trout and mountain whitefish, and very rarely rainbow trout and eastern brook trout. Fish distribution in Line Creek is dependent on barriers and temperature regimes. Bull trout were the most common, and found throughout the watershed. Less is known about westslope cutthroat trout distribution but they were found in the upper reaches less often due to temperatures less than their optimal range. Mountain whitefish were limited to lower 3.7 km of Line creek due to a falls that was not passable by this species. The bull trout using Line Creek for spawning were part of a fluvial Elk River stock and are typically migratory, while the cutthroat trout population appeared to be a resident population. Mountain whitefish moved into Line Creek in the summer for feeding and emigrated to the Fording and Elk Rivers in the fall to spawn.
Reviewed in Teck 2011b.
3. Allan, J.H. 1991. Fisheries investigations in Line Creek in 1991. Prepared for Luscar Ltd., Line Creek Mine, Sparwood, BC. Prepared by Pisces Environmental Consulting Services Ltd., Red Deer, AB.
In 1991, a quantitative physical habitat survey was completed in order to assess the
potential impact of diverting Line Creek. The survey also included the downstream portion of South Line Creek, a major tributary to Line Creek. Bull trout spawning surveys were also conducted at the same time.
4. Allan, J.H. 1993. Fisheries investigations in Line Creek in 1993. Prepared for Luscar Ltd., Line Creek Mine, Sparwood, BC. Prepared by Pisces Environmental Consulting Services Ltd., Red Deer, AB. In 1993, 1994, 1995, 1997, 1998, 1999, 2000 and 2001 (Reports 4-11), studies were
carried out to investigate spawning populations of bull trout, rearing populations of bull
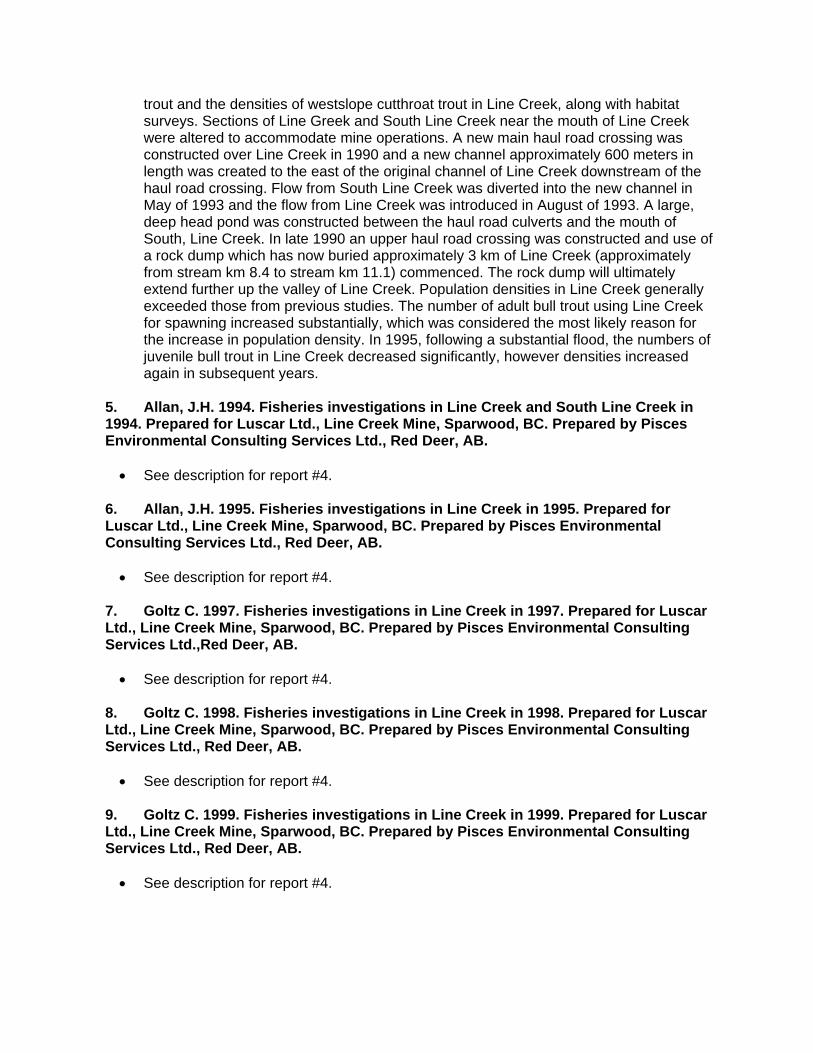
trout and the densities of westslope cutthroat trout in Line Creek, along with habitat surveys. Sections of Line Greek and South Line Creek near the mouth of Line Creek were altered to accommodate mine operations. A new main haul road crossing was constructed over Line Creek in 1990 and a new channel approximately 600 meters in length was created to the east of the original channel of Line Creek downstream of the haul road crossing. Flow from South Line Creek was diverted into the new channel in May of 1993 and the flow from Line Creek was introduced in August of 1993. A large, deep head pond was constructed between the haul road culverts and the mouth of South, Line Creek. In late 1990 an upper haul road crossing was constructed and use of a rock dump which has now buried approximately 3 km of Line Creek (approximately from stream km 8.4 to stream km 11.1) commenced. The rock dump will ultimately extend further up the valley of Line Creek. Population densities in Line Creek generally exceeded those from previous studies. The number of adult bull trout using Line Creek for spawning increased substantially, which was considered the most likely reason for the increase in population density. In 1995, following a substantial flood, the numbers of juvenile bull trout in Line Creek decreased significantly, however densities increased again in subsequent years.
5. Allan, J.H. 1994. Fisheries investigations in Line Creek and South Line Creek in 1994. Prepared for Luscar Ltd., Line Creek Mine, Sparwood, BC. Prepared by Pisces Environmental Consulting Services Ltd., Red Deer, AB.
See description for report #4.
6. Allan, J.H. 1995. Fisheries investigations in Line Creek in 1995. Prepared for Luscar Ltd., Line Creek Mine, Sparwood, BC. Prepared by Pisces Environmental Consulting Services Ltd., Red Deer, AB.
See description for report #4.
7. Goltz C. 1997. Fisheries investigations in Line Creek in 1997. Prepared for Luscar Ltd., Line Creek Mine, Sparwood, BC. Prepared by Pisces Environmental Consulting Services Ltd.,Red Deer, AB.
See description for report #4.
8. Goltz C. 1998. Fisheries investigations in Line Creek in 1998. Prepared for Luscar Ltd., Line Creek Mine, Sparwood, BC. Prepared by Pisces Environmental Consulting Services Ltd., Red Deer, AB.
See description for report #4.
9. Goltz C. 1999. Fisheries investigations in Line Creek in 1999. Prepared for Luscar Ltd., Line Creek Mine, Sparwood, BC. Prepared by Pisces Environmental Consulting Services Ltd., Red Deer, AB.
See description for report #4.
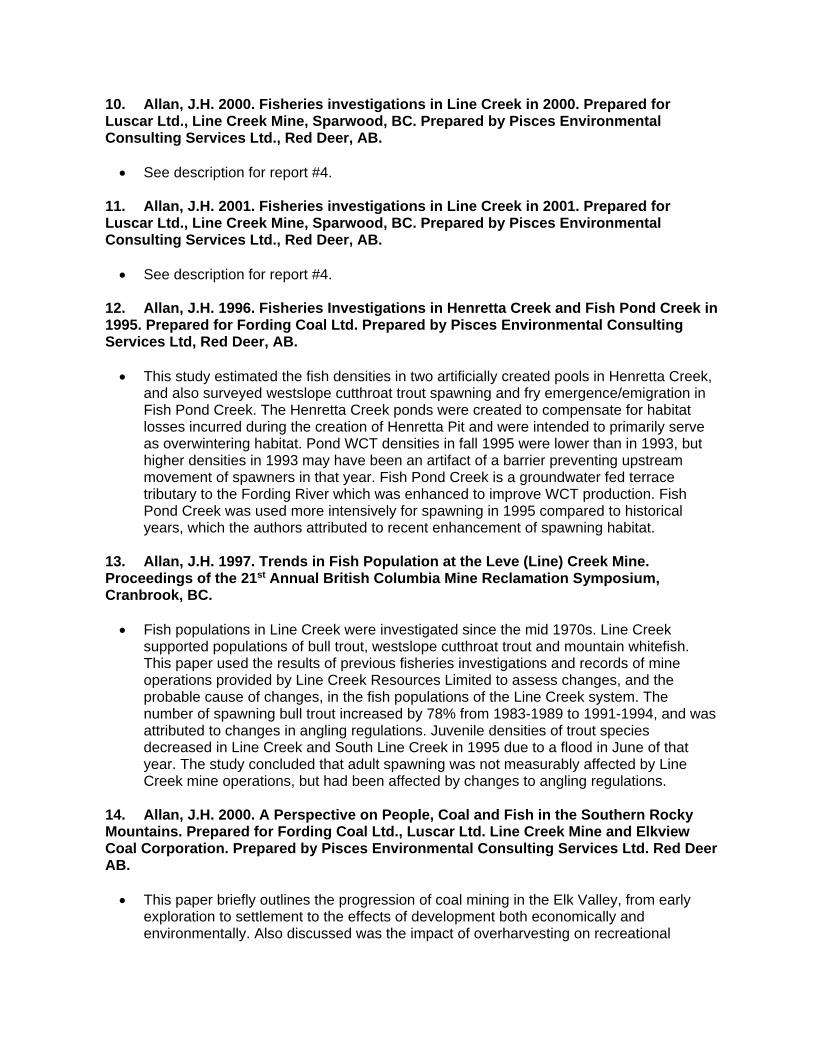
10. Allan, J.H. 2000. Fisheries investigations in Line Creek in 2000. Prepared for Luscar Ltd., Line Creek Mine, Sparwood, BC. Prepared by Pisces Environmental Consulting Services Ltd., Red Deer, AB.
See description for report #4.
11. Allan, J.H. 2001. Fisheries investigations in Line Creek in 2001. Prepared for Luscar Ltd., Line Creek Mine, Sparwood, BC. Prepared by Pisces Environmental Consulting Services Ltd., Red Deer, AB.
See description for report #4.
12. Allan, J.H. 1996. Fisheries Investigations in Henretta Creek and Fish Pond Creek in 1995. Prepared for Fording Coal Ltd. Prepared by Pisces Environmental Consulting Services Ltd, Red Deer, AB.
This study estimated the fish densities in two artificially created pools in Henretta Creek,
and also surveyed westslope cutthroat trout spawning and fry emergence/emigration in Fish Pond Creek. The Henretta Creek ponds were created to compensate for habitat losses incurred during the creation of Henretta Pit and were intended to primarily serve as overwintering habitat. Pond WCT densities in fall 1995 were lower than in 1993, but higher densities in 1993 may have been an artifact of a barrier preventing upstream movement of spawners in that year. Fish Pond Creek is a groundwater fed terrace tributary to the Fording River which was enhanced to improve WCT production. Fish Pond Creek was used more intensively for spawning in 1995 compared to historical years, which the authors attributed to recent enhancement of spawning habitat.
13. Allan, J.H. 1997. Trends in Fish Population at the Leve (Line) Creek Mine. Proceedings of the 21st Annual British Columbia Mine Reclamation Symposium, Cranbrook, BC.
Fish populations in Line Creek were investigated since the mid 1970s. Line Creek
supported populations of bull trout, westslope cutthroat trout and mountain whitefish. This paper used the results of previous fisheries investigations and records of mine operations provided by Line Creek Resources Limited to assess changes, and the probable cause of changes, in the fish populations of the Line Creek system. The number of spawning bull trout increased by 78% from 1983-1989 to 1991-1994, and was attributed to changes in angling regulations. Juvenile densities of trout species decreased in Line Creek and South Line Creek in 1995 due to a flood in June of that year. The study concluded that adult spawning was not measurably affected by Line Creek mine operations, but had been affected by changes to angling regulations.
14. Allan, J.H. 2000. A Perspective on People, Coal and Fish in the Southern Rocky Mountains. Prepared for Fording Coal Ltd., Luscar Ltd. Line Creek Mine and Elkview Coal Corporation. Prepared by Pisces Environmental Consulting Services Ltd. Red Deer AB.
This paper briefly outlines the progression of coal mining in the Elk Valley, from early
exploration to settlement to the effects of development both economically and environmentally. Also discussed was the impact of overharvesting on recreational
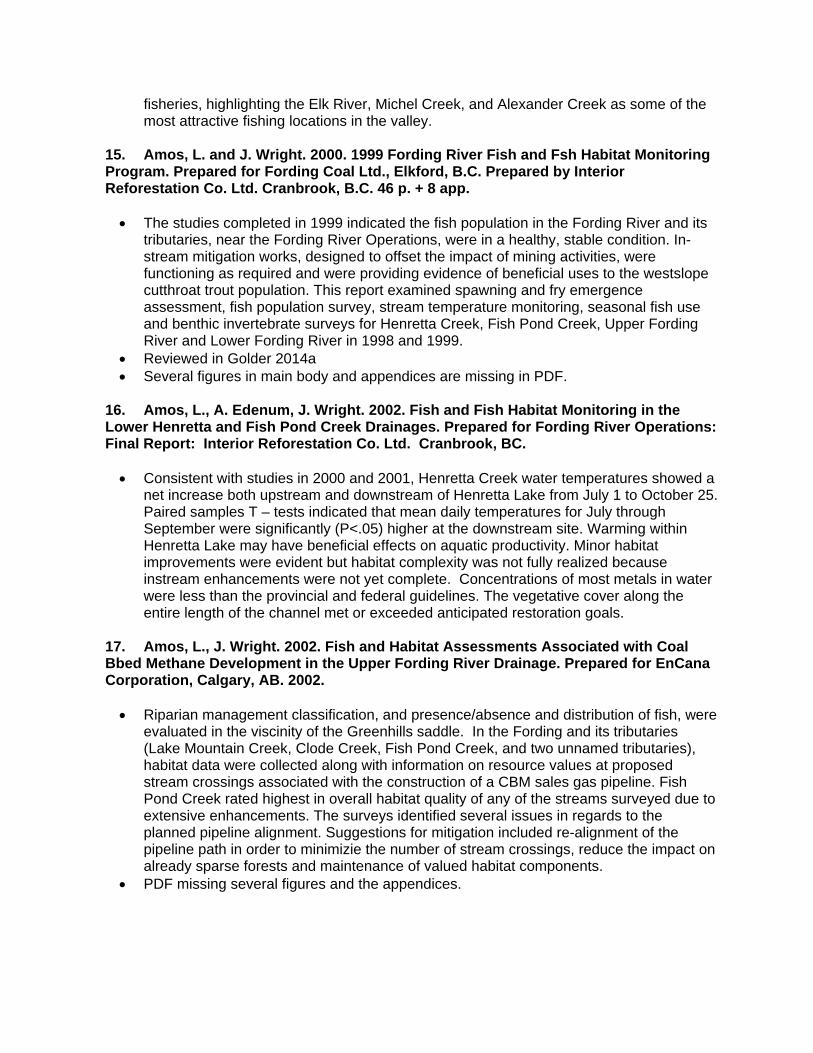
fisheries, highlighting the Elk River, Michel Creek, and Alexander Creek as some of the most attractive fishing locations in the valley.
15. Amos, L. and J. Wright. 2000. 1999 Fording River Fish and Fsh Habitat Monitoring Program. Prepared for Fording Coal Ltd., Elkford, B.C. Prepared by Interior Reforestation Co. Ltd. Cranbrook, B.C. 46 p. + 8 app. The studies completed in 1999 indicated the fish population in the Fording River and its
tributaries, near the Fording River Operations, were in a healthy, stable condition. In-stream mitigation works, designed to offset the impact of mining activities, were functioning as required and were providing evidence of beneficial uses to the westslope cutthroat trout population. This report examined spawning and fry emergence assessment, fish population survey, stream temperature monitoring, seasonal fish use and benthic invertebrate surveys for Henretta Creek, Fish Pond Creek, Upper Fording River and Lower Fording River in 1998 and 1999.
Reviewed in Golder 2014a Several figures in main body and appendices are missing in PDF.
16. Amos, L., A. Edenum, J. Wright. 2002. Fish and Fish Habitat Monitoring in the Lower Henretta and Fish Pond Creek Drainages. Prepared for Fording River Operations: Final Report: Interior Reforestation Co. Ltd. Cranbrook, BC.
Consistent with studies in 2000 and 2001, Henretta Creek water temperatures showed a
net increase both upstream and downstream of Henretta Lake from July 1 to October 25. Paired samples T – tests indicated that mean daily temperatures for July through September were significantly (P<.05) higher at the downstream site. Warming within Henretta Lake may have beneficial effects on aquatic productivity. Minor habitat improvements were evident but habitat complexity was not fully realized because instream enhancements were not yet complete. Concentrations of most metals in water were less than the provincial and federal guidelines. The vegetative cover along the entire length of the channel met or exceeded anticipated restoration goals.
17. Amos, L., J. Wright. 2002. Fish and Habitat Assessments Associated with Coal Bbed Methane Development in the Upper Fording River Drainage. Prepared for EnCana Corporation, Calgary, AB. 2002.
Riparian management classification, and presence/absence and distribution of fish, were
evaluated in the viscinity of the Greenhills saddle. In the Fording and its tributaries (Lake Mountain Creek, Clode Creek, Fish Pond Creek, and two unnamed tributaries), habitat data were collected along with information on resource values at proposed stream crossings associated with the construction of a CBM sales gas pipeline. Fish Pond Creek rated highest in overall habitat quality of any of the streams surveyed due to extensive enhancements. The surveys identified several issues in regards to the planned pipeline alignment. Suggestions for mitigation included re-alignment of the pipeline path in order to minimizie the number of stream crossings, reduce the impact on already sparse forests and maintenance of valued habitat components.
PDF missing several figures and the appendices.
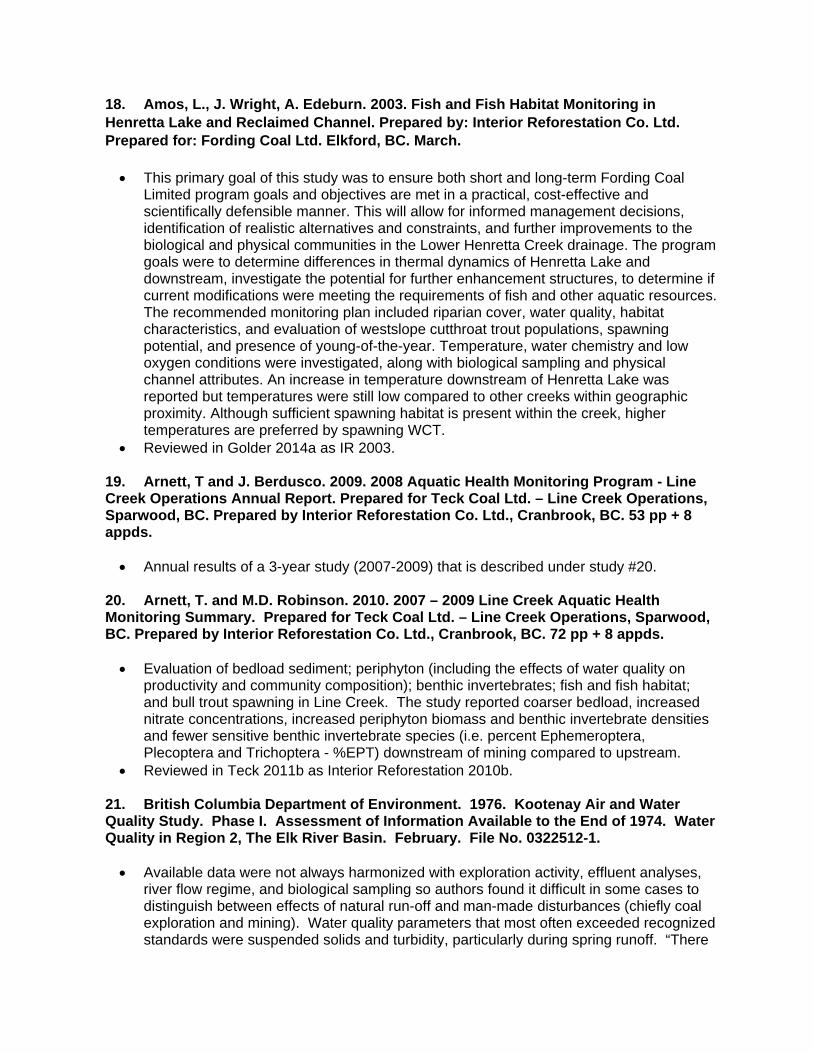
18. Amos, L., J. Wright, A. Edeburn. 2003. Fish and Fish Habitat Monitoring in Henretta Lake and Reclaimed Channel. Prepared by: Interior Reforestation Co. Ltd. Prepared for: Fording Coal Ltd. Elkford, BC. March. This primary goal of this study was to ensure both short and long-term Fording Coal
Limited program goals and objectives are met in a practical, cost-effective and scientifically defensible manner. This will allow for informed management decisions, identification of realistic alternatives and constraints, and further improvements to the biological and physical communities in the Lower Henretta Creek drainage. The program goals were to determine differences in thermal dynamics of Henretta Lake and downstream, investigate the potential for further enhancement structures, to determine if current modifications were meeting the requirements of fish and other aquatic resources. The recommended monitoring plan included riparian cover, water quality, habitat characteristics, and evaluation of westslope cutthroat trout populations, spawning potential, and presence of young-of-the-year. Temperature, water chemistry and low oxygen conditions were investigated, along with biological sampling and physical channel attributes. An increase in temperature downstream of Henretta Lake was reported but temperatures were still low compared to other creeks within geographic proximity. Although sufficient spawning habitat is present within the creek, higher temperatures are preferred by spawning WCT.
Reviewed in Golder 2014a as IR 2003.
19. Arnett, T and J. Berdusco. 2009. 2008 Aquatic Health Monitoring Program - Line Creek Operations Annual Report. Prepared for Teck Coal Ltd. – Line Creek Operations, Sparwood, BC. Prepared by Interior Reforestation Co. Ltd., Cranbrook, BC. 53 pp + 8 appds.
Annual results of a 3-year study (2007-2009) that is described under study #20.
20. Arnett, T. and M.D. Robinson. 2010. 2007 – 2009 Line Creek Aquatic Health Monitoring Summary. Prepared for Teck Coal Ltd. – Line Creek Operations, Sparwood, BC. Prepared by Interior Reforestation Co. Ltd., Cranbrook, BC. 72 pp + 8 appds.
Evaluation of bedload sediment; periphyton (including the effects of water quality on
productivity and community composition); benthic invertebrates; fish and fish habitat; and bull trout spawning in Line Creek. The study reported coarser bedload, increased nitrate concentrations, increased periphyton biomass and benthic invertebrate densities and fewer sensitive benthic invertebrate species (i.e. percent Ephemeroptera, Plecoptera and Trichoptera - %EPT) downstream of mining compared to upstream.
Reviewed in Teck 2011b as Interior Reforestation 2010b.
21. British Columbia Department of Environment. 1976. Kootenay Air and Water Quality Study. Phase I. Assessment of Information Available to the End of 1974. Water Quality in Region 2, The Elk River Basin. February. File No. 0322512-1.
Available data were not always harmonized with exploration activity, effluent analyses,
river flow regime, and biological sampling so authors found it difficult in some cases to distinguish between effects of natural run-off and man-made disturbances (chiefly coal exploration and mining). Water quality parameters that most often exceeded recognized standards were suspended solids and turbidity, particularly during spring runoff. “There
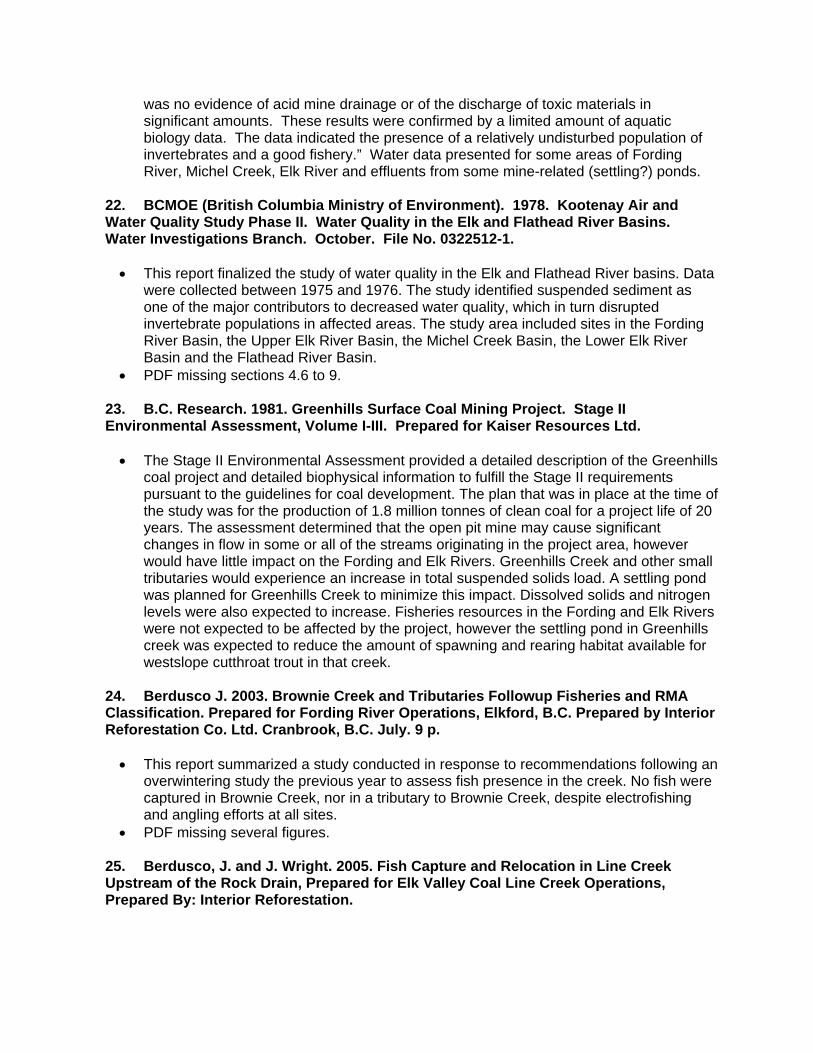
was no evidence of acid mine drainage or of the discharge of toxic materials in significant amounts. These results were confirmed by a limited amount of aquatic biology data. The data indicated the presence of a relatively undisturbed population of invertebrates and a good fishery.” Water data presented for some areas of Fording River, Michel Creek, Elk River and effluents from some mine-related (settling?) ponds.
22. BCMOE (British Columbia Ministry of Environment). 1978. Kootenay Air and Water Quality Study Phase II. Water Quality in the Elk and Flathead River Basins. Water Investigations Branch. October. File No. 0322512-1.
This report finalized the study of water quality in the Elk and Flathead River basins. Data
were collected between 1975 and 1976. The study identified suspended sediment as one of the major contributors to decreased water quality, which in turn disrupted invertebrate populations in affected areas. The study area included sites in the Fording River Basin, the Upper Elk River Basin, the Michel Creek Basin, the Lower Elk River Basin and the Flathead River Basin.
PDF missing sections 4.6 to 9.
23. B.C. Research. 1981. Greenhills Surface Coal Mining Project. Stage II Environmental Assessment, Volume I-III. Prepared for Kaiser Resources Ltd.
The Stage II Environmental Assessment provided a detailed description of the Greenhills
coal project and detailed biophysical information to fulfill the Stage II requirements pursuant to the guidelines for coal development. The plan that was in place at the time of the study was for the production of 1.8 million tonnes of clean coal for a project life of 20 years. The assessment determined that the open pit mine may cause significant changes in flow in some or all of the streams originating in the project area, however would have little impact on the Fording and Elk Rivers. Greenhills Creek and other small tributaries would experience an increase in total suspended solids load. A settling pond was planned for Greenhills Creek to minimize this impact. Dissolved solids and nitrogen levels were also expected to increase. Fisheries resources in the Fording and Elk Rivers were not expected to be affected by the project, however the settling pond in Greenhills creek was expected to reduce the amount of spawning and rearing habitat available for westslope cutthroat trout in that creek.
24. Berdusco J. 2003. Brownie Creek and Tributaries Followup Fisheries and RMA Classification. Prepared for Fording River Operations, Elkford, B.C. Prepared by Interior Reforestation Co. Ltd. Cranbrook, B.C. July. 9 p.
This report summarized a study conducted in response to recommendations following an
overwintering study the previous year to assess fish presence in the creek. No fish were captured in Brownie Creek, nor in a tributary to Brownie Creek, despite electrofishing and angling efforts at all sites.
PDF missing several figures.
25. Berdusco, J. and J. Wright. 2005. Fish Capture and Relocation in Line Creek Upstream of the Rock Drain, Prepared for Elk Valley Coal Line Creek Operations, Prepared By: Interior Reforestation.
This report described a catch and relocation project initiated in July 2005 to relocate fish (bull trout and westslope cutthroat trout) from above the rock drain to downstream of the rock drain in Line Creek. Angling and electrofishing were used to capture the fish. The authors concluded that the relocation effort was successful. A total of 18 bull trout and 21 westslope cutthroat trout were relocated.
Reviewed in Teck 2011b as Interior Reforestation 2005a.
26. Berdusco, J.R. and J. Wright. 2006. Fish and Fish Habitat Monitoring in the Henretta Creek Reclaimed Channel (2005). Prepared for Elk Valley Coal Corporation – Fording River Operations, Elkford, BC. Prepared by Interior Reforestation Co. Ltd., Cranbrook, B.C. 22pp + 6 appendices The 2005 fish and fish habitat monitoring in Henretta Lake and the Henretta Creek
Reclaimed Channel represented the sixth year of a seven year monitoring program required by the C-3 Reclamation Permit issued to Elk Valley Coal Corporation’s Fording River Operations (FRO). Consistent with all reports completed previously, no Westslope cutthroat trout (WCT) spawning pairs or redds were observed in a spawning assessment conducted over the length of the reclaimed channel. As with previous reports, the water temperatures measured upstream and downstream of Henretta Lake were significantly different. No accurate westslope cutthroat trout population estimate was obtained through mark-recapture procedures as no tagged fish were recaptured. The detailed fish habitat assessments completed in 2005, in conjunction with a GPS survey of the thalweg position and habitat units, photo point comparison and overview assessment indicate that the complexity and quantity of habitat, riparian vegetation, and channel stability is steadily improving.
27. Berdusco, J., T. Arnett, and J. Bisset. 2007. Line Creek Operations 2006 Fisheries Investigation. Prepared for Elk Valley Coal Corporation – Line Creek Operations, Sparwood, BC. Prepared by Interior Reforestation Co. Ltd., Cranbrook, BC.
This study focused on completion of population density estimates at two index sites,
undertaking an assessment of bull trout spawning activity in 8.3 km of the Line Creek mainstem and 1.0 km of South Line Creek, and an analysis of recommended changes implemented during the field program of that year. Conclusions supported the need for careful identification and selection of environmental and biological indicators that provide measurable attributes of Line Creek. Trends seen in Line Creek are generally positive, and changes to the monitoring program were made to provide a better indication of Line Creek’s overall ecosystem health, and to identify any relationships to mining activity.
Reviewed in Teck 2011b as Interior Reforestation 2007.
28. Berdusco, J. and T. Arnett. 2008. Line Creek Operations 2007 Aquatic Health Monitoring Program. Prepared for Elk Valley Coal Corporation – Line Creek Operations, Sparwood, BC. Prepared by Interior Reforestation Co. Ltd., Cranbrook, BC. 57 pp + 8 appds. Annual results of a 3-year study (2007-2009) that is described under study #20.
29. Arnett, T and J. Berdusco. 2009. 2008 Aquatic Health Monitoring Program - Line Creek Operations Annual Report. Prepared for Teck Coal Ltd. – Line Creek Operations,
Sparwood, BC. Prepared by Interior Reforestation Co. Ltd., Cranbrook, BC. 53 pp + 8 appds.
Annual results of a 3-year study (2007-2009) that is described under study #20.
30. Carscadden, K. and S. Rogers. 2011. Genetic analysis of Westslope Cutthroat Trout from the Upper Fording River Drainage, British Columbia. Report Prepared for Golder Associates Ltd., Calagary, AB.
Westslope cutthroat trout were caught from Swift Creek and Dry Creek and adipose fins
were collected in order to determine whether any hybridization between WCT and rainbow trout had occurred. Microsatellite fingerprint analysis concluded that WCT in Swift Creek and Dry Creek were genetically pure and showed no signs of hybridization with rainbow trout.
Reviewed in Teck 2011b.
31. Chapman, P.M., R. Berdusco and R. Jones. 2008. Selenium Investigations in the Elk River valley, B.C. – 2008 Update. Report prepared for Elk Valley Selenium Task Force. Prepared by Golder Associates Ltd., Burnaby, B.C. This report evaluated the current information on selenium concentrations water in the Elk
Valley watershed. Se has been measured in benthic invertebrates, fish muscle and bird eggs but although levels are elevated, they have not increased significantly over several years at the time of this report. Using Line Creek as an example, concentrations detected downstream of mining operations have not appeared to have an impact on fish and water bird viability. Despite this, significant effort has been invested in predicting future Se loads, factors affecting cycling once it reaches the environment, and mitigation plans to manage the release of Se, including treatment options to reduce the load.
32. Edeburn, A. 2003. Brownie Creek and Tributaries Habitat Assessment. Prepared for Greg Sword, Fording Coal Ltd. Elkford, B.C. Prepared by Interior Reforestation Co. Ltd. Cranbrook, B.C. 3 p. This letter described a cursory fish habitat assessment completed in Brownie Creek and
its tributaries on November 28, 2002. A key objective of this study was to determine fish habitat present, particularly overwintering suitability for the assumed fish species present, westslope cutthroat trout. Two sites were surveyed, one in the lower watershed and one in the upper watershed. The author recommended further biological sampling to determine fish presence, in particular above a gradient cascade thought to be a potential barrier to upstream fish migration.
33. Edeburn, A. and J. Wright. 2003. Line Creek Fisheries Investigation 2002 Program. Prepared for Elk Valley Coal Corporation - Line Creek Operations, Sparwood, BC. Prepared by Interior Reforestation Co. Ltd., Cranbrook, BC.
The overall intent of the fisheries investigations program was to provide a measure of
the success of the environmental protection and management program at Line Creek mine with regard to aquatic resources. The scope of the assessment in 2002 focused on completing population estimates at 2 index sites in Line Creek and undertaking an assessment of bull trout spawning activity in 8.4 km of the Line Creek mainstem and 610
m of South Line Creek. Based on this study the authors proposed several recommendations for potential improvements to the program. These recommendations included the use of permanently marked index sites in the field, the use of consistent annual sampling methodologies, and scheduling sampling to minimize variability in flow conditions. Additional recommendations to improve the strength of the program included fish aging to complement previous data collected, adding another index site in reach 1, and completion of a Fish Habitat Assessment Procedure (FHAP) for each reach of Line Creek. Completion of a westslope cutthroat trout redd count and a benthic invertebrate survey to provide an indication of general aquatic health was also suggested.
Reviewed in Teck 2011b as Interior Reforestation 2003.
34. Ferguson, K.D., and S.M. Leask. 1988. The Export of Nutrients from Surface Coal Mines. Environment Canada, West Vancouver, British Columbia. Regional Program Report 87-12. March.
Historical nitrogen and phosphorus data were reviewed from 1980 to 1985 for the five
(now Teck) surface coal mines in Elk Valley. The focus was evaluation of nitrogen losses from explosives use (range 0.1% to 4.3% among operations and years), with values being generally higher downstream of the mining activity.
35. Fording Coal Limited. 1985. Kilmarnock Creek Dragline Mining Proposal Environmental Impact Assessment. Report Prepared for British Columbia Mine Development Steering Committee. Prepared by Fording Coal Limited, 61 p.
This report summarized the Kilmarnock Creek Dragline mining proposal (commencing
1987 for 2.5 years), its impacts, and the planned mitigation. The project involved the mining of a 1.1 km portion of the Kilmarnock Creek Valley, which was made possible by diversion of Kilmarnock Creek by a cut-off dam and large steel culverts skirting the perimeter of the pit. At the time of the project, the project area consisted of post logging condition with numerous access roads and drillsites. The authors concluded that the project would have a significant impact on groundwater, surface water quality, fisheries, and to a lesser degree wildlife in the Kilmarnock area. Impact management was planned to offset the disturbance. The mitigation included increased settling pond capacity in Brownie Creek, a cutoff dam above the mining area, large diameter steel culverts for diversion, stream re-establishment and the revised role of Kilmarnock settling ponds. There was also construction of offsite overwintering pools and summer rearing areas for westslope cutthroat trout. Creeks surveyed for physical habitat included Henretta Creek, Brownie Creek, Swift Creek, Lake Mountain Creek, Kilmarnock Creek and the Fording River.
PDF missing sections two and three.
36. Fording Coal Limited. 1991. Fording Coal Limited Enhancement of the Upper Fording River (Above Confluence with Henretta Creek). Prepared by Fording Coal Limited, 21 p, 1 app.
This report described the enhancements made to the Upper Fording River in a 400 to
450 m portion upstream from the confluence with Henretta Creek. It was enhanced to improve riffle-glide habitat. Enhancements included the installation of root wads, rock spurs, single rocks, rock groups, and rock clusters.
PDF is missing appendices
37. Frenette, J.L. 2008. An Evaluation of Benthic Invertebrate Communities as an Indicator of Stream Ecosystem Health below Active Coal Mines in the Elk River Watershed. Master of Science Thesis, Royal Roads University. May.
Water and benthic invertebrate samples were collected in September 2006 and 2007.
Sampling areas were upstream and downstream of mining discharges on Michel Creek, and in reference streams (Alexander, Wheeler, Leach). In areas downstream of coal mines, several invertebrate community metrics were below, or at the low end, of the range observed at reference areas: #EPT individuals, # and % E and the number and percent of EPT taxa. Correlations were observed with some community metrics and concentrations of one or more water quality variables associated with mining (e.g., selenium, sulphate, nitrate, nitrite) as well as various habitat variables (e.g., elevation, water depth, discharge, substrate).
Reviewed in Teck 2011b.
38. Golder Associates. 2015. Elkview Operations Baldy Ridge Extension Project. Annex J – Wildlife and Wildlife Habitat Baseline Report. Submitted to Teck Coal Limited, Elkview Operations. October.
This reports described the terrestrial wildlife species and important wildlife habitats
present near the Baldy Ridge Expansion Project at Elkview Operations that are potentially affected by the project. Particular attention was paid to searching for species of conservation concern, which were defined as those that were either federally listed as “Special Concern”, “Threatened” or “Endangered”, or provincially “blue” or “red-listed”. During the 11 field surveys that were conducted, 136 unique vertebrate species out of the 272 that were identified as potentially present were observed in the study area. Results were presented on area maps showing the locations of sightings of key species. The presence and absence of species of conservation concern were documented, however results were not presented in tabular form showing the precise locations of each of the species, so information could not be accurately interpreted with respect to site-specific presence/absence.
39. Hooton, R., Andrusak, H. and Bull, C.J. 1971. A Survey of the Elk River and Its Tributaries. British Columbia Fish and Wildlife Branch.
Until shortly before the report was written, most local mining was underground, and there
had been few obvious harmful effects to fish, wildlife and recreation. In the late 1960s, surface areas started to be disturbed for exploration and mining purposes as well as other mine related activities such as coal washing and coking, leading to periodic influences on Michel Creek. This study was undertaken to document the presence, distribution and relative abundance of sport fish and food fish populations in the Elk River Watershed, along with the watersheds use for fishing and other recreational activities. The effects of mining were also examined. Steams sampled included Boivin, Bingay, Forsyth, Quarrie, Aldridge, Bleasdell, Cadorna, Tobermory, Line and Todhunter Creeks. At least one-half mile of each stream was walked to make “cursory inventory”, including discharge, riparian vegetation, river velocity, river substrate and fish species that could be observed or angled.
Reviewed in Teck 2011b and Golder 2014a.
40. Interior Reforestation Co. Ltd. 2006. Memo – 2005 Clode Ponds Fish Salvage Project. Prepared for Elk Valley Coal Corporation, Fording River Operations, Elkford, B.C. 6 p.
Westslope cutthroat trout were captured via boat and backpack electrofishing, and seine
netting from the Clode Ponds system in June 2005 to be released to predetermined release sites within the Fording River Watershed. Effort and capture results were recorded to determine total fish captured by reach, date and method. Biological endpoints (length and weight) were measured on a subset of fish, and abnormalities and deformities were recorded. Age-class was determined using length categories. Fish were released into Fish Pond Creek, the Fording River at Swift Creek, the Fording River at Chauncey Creek, and the Fording River upstream of the Fording Bridge. A total of 758 fish were captured in the salvage effort, 675 from boat electrofishing, 52 from backpack electrofishing and 31 from seining. Out of the total number of fish caught, 177 were subsampled and 2 of these fish had external deformities. The authors speculated that one of these deformities may have been due to selenium exposure (sideways spinal curvature and protruding eyeball). Overall, a low frequency of deformities were observed. Over the current salvage operation and another in 2004, 5,956 fish were removed from Clode Ponds. In light of a decreased catch per unit effort and the placement of a permanent upstream migration barrier between Clode Pond and the Fording River, the salvage was considered complete.
Reviewed in Golder 2014a.
41. Interior Reforestation Co. Ltd. 2010. Elk River Watershed Historic Fish Distribution Project. Phase 1: Desktop Study, Prepared for Teck Coal, Prepared by Interior Reforestation In this report, species composition was assessed at a rudimentary level by contrasting
mining influenced exposed sites with sites not located downstream of mines or reference sites of similar habitat to consider the effect of habitat preference. Habitat considered only lotic types in the Elk River, upstream of Elko. One hypothesis was that the observed species composition within the Elk River is a function of habitat preference. A second was that the migratory barrier at Elko has prevented colonization by some fish species. Finally, a third hypothesis suggested that the lack of certain species (e.g., Cottidae spp.) may be a result of mining activities, specifically increased water-borne selenium concentrations. This report presented the results of the desktop study that reviewed available data on fish distributions throughout the Elk River system since the 1970s. Whenever possible, the study used fisheries information previously compiled for Teck as part of past projects; the majority of which was fish distribution data obtained through the British Columbia Ministry of Environment’s (MOE) Fisheries Inventory Summary System (FISS 2009). Pairs of tributaries were created with sub-basins that were similar in geographic location, drainage area and elevation, and all analyses were based on the assumption that a sub-basin pair represented similar stream habitat. The sub-basin pairs were Lower Elk River:Wigwam River, Michel Creek:Alexander Creek, and Upper Elk River:Fording River. The results of this study suggest that the Elk River (lower) sub-basin had the highest species diversity. This site was shown to be unique when averaged over the entire data record, but did not vary over time any differently than Wigwam sub-basin in a paired comparison. The differences between the exposed and reference watersheds were thought to be more likely due to habitat differences
rather than exposure, and suggests that the fish community structure and spatial variability are more likely due to the first two hypotheses.
Reviewed in Golder 2015a.
42. KNRC (Kootenay Natural Resource Consulting. 2007. Fish Stream Identification, Greenhills Creek. Prepared for D. Charest, Elk Valley Coal Corporation. July 30, 2007. Between July 9th and 12th, 2007 Kootenay Natural Resource Consulting (KNRC)
completed a fish stream identification (FSID) on Greenhills Creek to help facilitate the continued planning of Elk Valley Coal Corportation’s Greenhills Operation min development. The stream was surveyed from its confluence with the settling pond upstream approximately 5.8 km until the stream becomes covered by spill rock from a mine spoil. The survey consisted of electrofishing, visual observations, research and professional judgment. This information was used to classify the stream based on riparian assessment procedures. The lower portion of the creek was identified as fish-bearing (S3/S2), while the upper portion was not (S6). The west-fork of Greenhills Creek was also surveyed and determined to be fishbearing (S3/S4).
43. Lister, D.B. and Associates Ltd. and Kerr Wood Leidal Associates Ltd. 1980. Fording River Aquatic Environment Study. Prepared for Fording Coal Ltd., Elkford, B.C. 77 pp. + app.
This report described the results and conclusions of a study of the Fording River and its
Yellowstone cutthroat trout (now westslope cutthroat trout). The study area included the Fording River from the confluence with Henretta Creek downstream to a point 5 km downstream from the Kilmarnock Creek mouth, as well as several tributaries draining the mine area in the vicinity of the Clode Settling Pond. A major focus was a 0.9 km section of the Fording River which was diverted in 1977 to permit construction of the South Tailings Pond. The study consisted of a biophysical survey (habitat, obstructions), fish population estimates, fish size and age, benthic invertebrates, substrate sampling, temperature and discharge. Principal findings included decreased abundance of benthic invertebrates important for trout diets, especially in the diversion and other highly mine-influenced areas. Water quality was generally good in the areas studied, although suspended solids were significantly higher in mine-impacted areas particularly during spring freshet. Plans to reduce erosion and sediment output were recommended. Population estimates identified fish in all the sampling locations, but density was greater in areas not affected by mining, possibly due to habitat suitability. Several obstructions to fish migration were identified. A groundwater fed pond that was deepened and enlarged in November 1978 provided a significant overwintering habitat for fish. The tributaries around Clode Settling Pond lacked suitable cover and thus were utilized very little for spawning and rearing.
44. McDonald, L. Undated. Nutrient/Algal Growth Ttrends in the Elk River Basin. Impacts on Algal Growth of Various Nutrient Inputs, 1979-1983. Interim Report. Prepared for M.K. Baillargeon, Regional Waster Manager, Kootenay Region, B.C. Ministry of Environment.
The study examined the relationship between nutrient levels and periphytic algal growth
in the Elk River Basin due to concern over increased nitrate concentrations from bulk
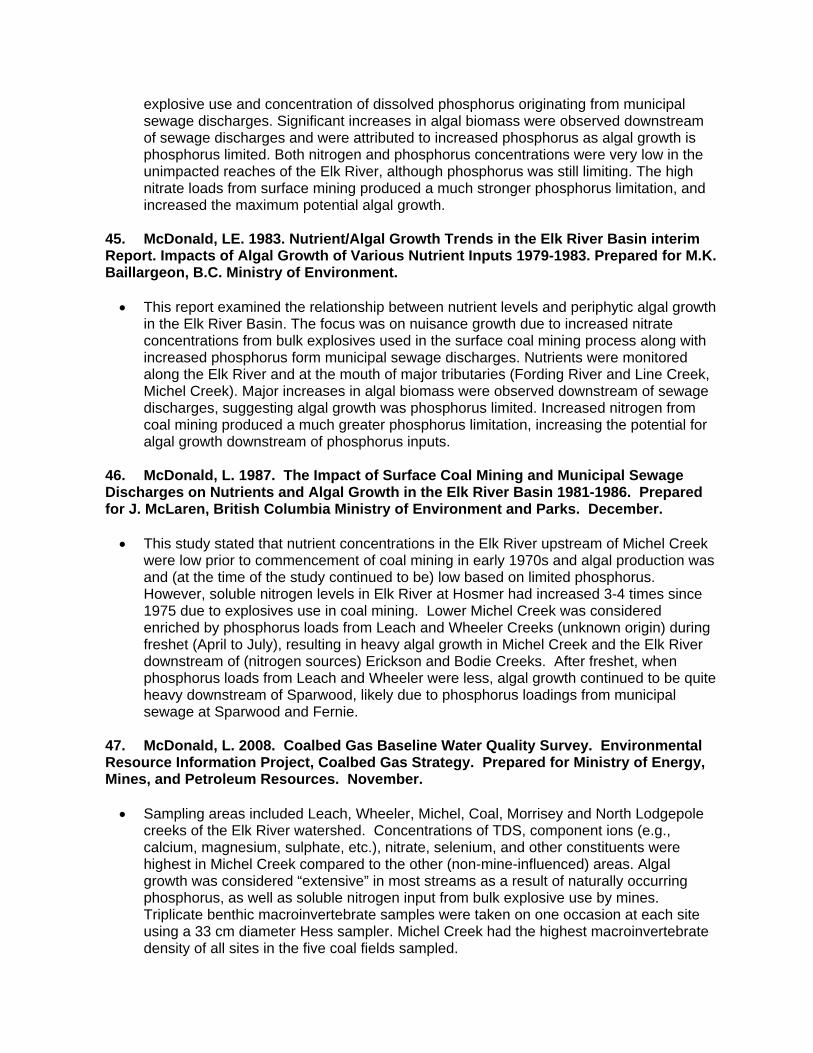
explosive use and concentration of dissolved phosphorus originating from municipal sewage discharges. Significant increases in algal biomass were observed downstream of sewage discharges and were attributed to increased phosphorus as algal growth is phosphorus limited. Both nitrogen and phosphorus concentrations were very low in the unimpacted reaches of the Elk River, although phosphorus was still limiting. The high nitrate loads from surface mining produced a much stronger phosphorus limitation, and increased the maximum potential algal growth.
45. McDonald, LE. 1983. Nutrient/Algal Growth Trends in the Elk River Basin interim Report. Impacts of Algal Growth of Various Nutrient Inputs 1979-1983. Prepared for M.K. Baillargeon, B.C. Ministry of Environment.
This report examined the relationship between nutrient levels and periphytic algal growth
in the Elk River Basin. The focus was on nuisance growth due to increased nitrate concentrations from bulk explosives used in the surface coal mining process along with increased phosphorus form municipal sewage discharges. Nutrients were monitored along the Elk River and at the mouth of major tributaries (Fording River and Line Creek, Michel Creek). Major increases in algal biomass were observed downstream of sewage discharges, suggesting algal growth was phosphorus limited. Increased nitrogen from coal mining produced a much greater phosphorus limitation, increasing the potential for algal growth downstream of phosphorus inputs.
46. McDonald, L. 1987. The Impact of Surface Coal Mining and Municipal Sewage Discharges on Nutrients and Algal Growth in the Elk River Basin 1981-1986. Prepared for J. McLaren, British Columbia Ministry of Environment and Parks. December.
This study stated that nutrient concentrations in the Elk River upstream of Michel Creek
were low prior to commencement of coal mining in early 1970s and algal production was and (at the time of the study continued to be) low based on limited phosphorus. However, soluble nitrogen levels in Elk River at Hosmer had increased 3-4 times since 1975 due to explosives use in coal mining. Lower Michel Creek was considered enriched by phosphorus loads from Leach and Wheeler Creeks (unknown origin) during freshet (April to July), resulting in heavy algal growth in Michel Creek and the Elk River downstream of (nitrogen sources) Erickson and Bodie Creeks. After freshet, when phosphorus loads from Leach and Wheeler were less, algal growth continued to be quite heavy downstream of Sparwood, likely due to phosphorus loadings from municipal sewage at Sparwood and Fernie.
47. McDonald, L. 2008. Coalbed Gas Baseline Water Quality Survey. Environmental Resource Information Project, Coalbed Gas Strategy. Prepared for Ministry of Energy, Mines, and Petroleum Resources. November.
Sampling areas included Leach, Wheeler, Michel, Coal, Morrisey and North Lodgepole
creeks of the Elk River watershed. Concentrations of TDS, component ions (e.g., calcium, magnesium, sulphate, etc.), nitrate, selenium, and other constituents were highest in Michel Creek compared to the other (non-mine-influenced) areas. Algal growth was considered “extensive” in most streams as a result of naturally occurring phosphorus, as well as soluble nitrogen input from bulk explosive use by mines. Triplicate benthic macroinvertebrate samples were taken on one occasion at each site using a 33 cm diameter Hess sampler. Michel Creek had the highest macroinvertebrate density of all sites in the five coal fields sampled.
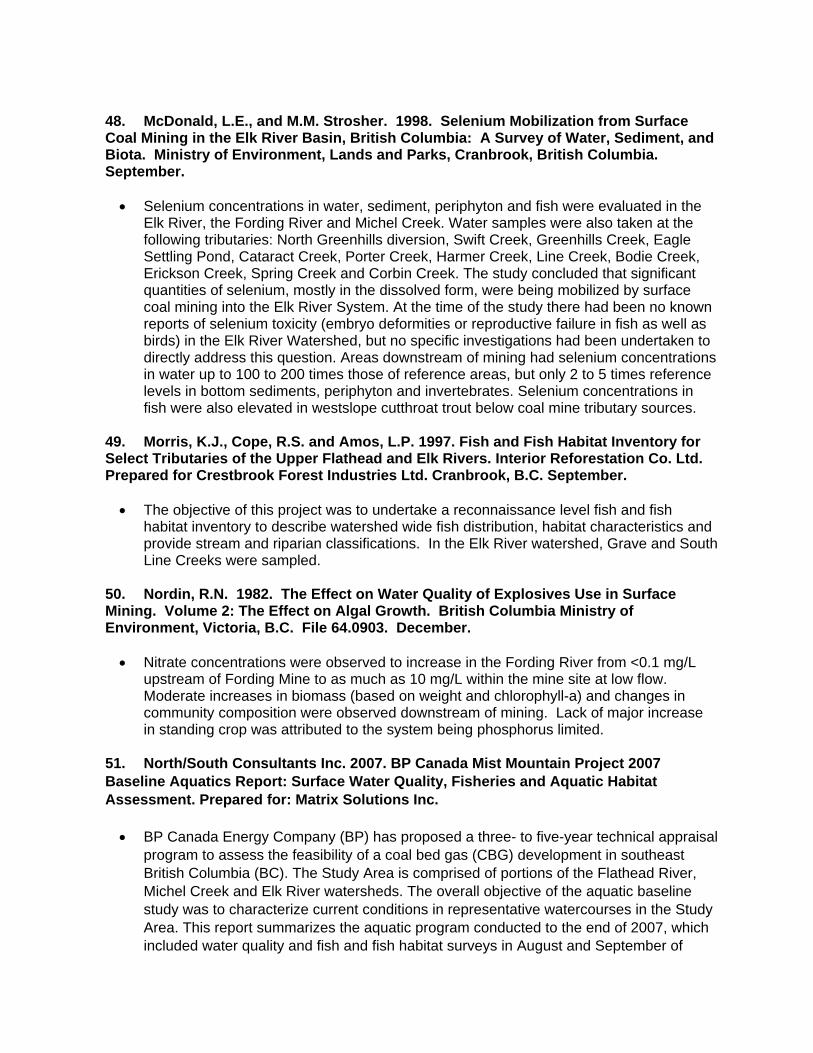
48. McDonald, L.E., and M.M. Strosher. 1998. Selenium Mobilization from Surface Coal Mining in the Elk River Basin, British Columbia: A Survey of Water, Sediment, and Biota. Ministry of Environment, Lands and Parks, Cranbrook, British Columbia. September.
Selenium concentrations in water, sediment, periphyton and fish were evaluated in the
Elk River, the Fording River and Michel Creek. Water samples were also taken at the following tributaries: North Greenhills diversion, Swift Creek, Greenhills Creek, Eagle Settling Pond, Cataract Creek, Porter Creek, Harmer Creek, Line Creek, Bodie Creek, Erickson Creek, Spring Creek and Corbin Creek. The study concluded that significant quantities of selenium, mostly in the dissolved form, were being mobilized by surface coal mining into the Elk River System. At the time of the study there had been no known reports of selenium toxicity (embryo deformities or reproductive failure in fish as well as birds) in the Elk River Watershed, but no specific investigations had been undertaken to directly address this question. Areas downstream of mining had selenium concentrations in water up to 100 to 200 times those of reference areas, but only 2 to 5 times reference levels in bottom sediments, periphyton and invertebrates. Selenium concentrations in fish were also elevated in westslope cutthroat trout below coal mine tributary sources.
49. Morris, K.J., Cope, R.S. and Amos, L.P. 1997. Fish and Fish Habitat Inventory for Select Tributaries of the Upper Flathead and Elk Rivers. Interior Reforestation Co. Ltd. Prepared for Crestbrook Forest Industries Ltd. Cranbrook, B.C. September. The objective of this project was to undertake a reconnaissance level fish and fish
habitat inventory to describe watershed wide fish distribution, habitat characteristics and provide stream and riparian classifications. In the Elk River watershed, Grave and South Line Creeks were sampled.
50. Nordin, R.N. 1982. The Effect on Water Quality of Explosives Use in Surface Mining. Volume 2: The Effect on Algal Growth. British Columbia Ministry of Environment, Victoria, B.C. File 64.0903. December. Nitrate concentrations were observed to increase in the Fording River from <0.1 mg/L
upstream of Fording Mine to as much as 10 mg/L within the mine site at low flow. Moderate increases in biomass (based on weight and chlorophyll-a) and changes in community composition were observed downstream of mining. Lack of major increase in standing crop was attributed to the system being phosphorus limited.
51. North/South Consultants Inc. 2007. BP Canada Mist Mountain Project 2007 Baseline Aquatics Report: Surface Water Quality, Fisheries and Aquatic Habitat Assessment. Prepared for: Matrix Solutions Inc. BP Canada Energy Company (BP) has proposed a three- to five-year technical appraisal
program to assess the feasibility of a coal bed gas (CBG) development in southeast British Columbia (BC). The Study Area is comprised of portions of the Flathead River, Michel Creek and Elk River watersheds. The overall objective of the aquatic baseline study was to characterize current conditions in representative watercourses in the Study Area. This report summarizes the aquatic program conducted to the end of 2007, which included water quality and fish and fish habitat surveys in August and September of
2007. Creeks included Flathead River, McEvoy Creek (Flathead River), Marten Creek, Fir Creek, Michel Creek, Robert Creek, Wheeler Creek (Michel Creek), Coal Creek, Morrissey Creek and North Lodgepole Creek (Elk River). Stream flows in August and September 2007 were typical or below average due to less than usual precipitation during the summer of 2007, and represented a baseflow or near-baseflow condition.
52. North/South Consultants Inc. 2008. BP Canada Mist Mountain Project 2008 Baseline Aquatics Report: Surface Water Quality, Fisheries and Aquatic Habitat Assessment. Prepared for: Matrix Solutions Inc. Second year (2008) of study #51. Surface water and sediment quality was considered
protective of aquatic life at most of the sites, and suitable fish habitat was present at all sites in at least one of the open water seasons. Benthic invertebrates and periphyton were considered productive.
Reviewed in Golder 2015a.
53. Oliver, G.G. 1999. Fish and Fish Habitat Assessment at Designated Sites in the Upper Fording River. Prepared by Interior Reforestation Co. Ltd., Cranbrook, BC. Prepared for Fording Coal Ltd. (Fording River Operations), Elkford, B.C. 47 pp. + app. An assessment of the enhancement structures in Fish Pond Creek and the Upper
Fording River above Henretta Creek was completed in August 1998 to determine habitat suitability and functionality. Spawning surveys were also conducted in Fish Pond Creek, Henretta Creek, and Clode Pond outlet channels along with summer utilization surveys in lower Henretta Creek and the Fording River in June to August 1998. Additional information was collected on benthic invertebrates in Fish Pond Creek, water temperature at all sites. Overall, structures place in Fish Pond Creek were more suitable than those in the Upper Fording River, with the highest densities of fish being at those structures with the greatest complexity. Overall the highest fish densities were in Fish Pond Creek.
Reviewed in Golder 2014a
54. Pisces Environmental Consulting Services Ltd. 1992. Impact Assessment for fisheries for a proposed diversion of Line Creek. Prepared for Line Creek Resources Limited. Sparwood, BC. 19 pp.
This report documents an impact assessment into the potential effects on fisheries
resources of the diversion of a portion of Line Creek to accommodate several settling ponds. Previous studies on fish presence, habitat and habitat utilization were reviewed. Assessment concluded that the most sensitive fisheries component that might be affected by the diversion was the spawning, incubation and rearing life phases for bull trout and westslope cutthroat trout, however mitigation plans were sufficient to compensate for the loss.
55. Robinson, M., and J. Wright. 2005. Clode Pond Fish Salvage. Prepared by Interior Reforestation Co. Ltd., Cranbrook, BC.
Westslope cutthroat trout were captured from the Clode Ponds system in 2004 with the
goal of maximizing fish salvage and reducing the risks associated with the Turnbull
South Pit construction, spatially and temporally distribute fish to predetermined release sites, record effort and catch results by reach date and method, collect biological data (length, weight, age) on a subset of fish to compliment long term data sets, tag selected fish to observe movement, determine size at age, subsample for abnormalities and deformities and to block fish passage into Clode Ponds. Fish were collected by seining, boat electrofishing and backpack electrofishing. A total of 5,198 fish were collected, and of those 781 were subsampled for biological endpoints, and those fish that were greater than 190 mm (254) were tagged. Fish were relocated to the West Exfiltration, Fish Pond Creek, Fording River at Swift Creek, Fording River at Chauncey Creek, and the Fording River Bridge. Only 12 fish were found with external deformities that the authors concluded could be related to selenium exposure (fin damage most prevalent). The salvage operation was considered as success with minimal mortality observed.
Reviewed in Golder 2014a.
56. Robinson, M., and J. Wright. 2005. Line Creek Fisheries Investigation 2004 Program. Prepared for Elk Valley Coal Corporation – Line Creek Operations, Sparwood, BC. Prepared by Interior Reforestation Co. Ltd., Cranbrook, BC. This report documented the 2004 Fisheries Investigation Program through the Line
Creek Operations. Fish densities were estimated and spawning assessments were undertaken in both Line Creek and in the lower section of South Line Creek. A slightly lower number of redds were observed compared to previous years, but the authors attributed that to increased seasonal discharge rather than reduction in population or escapement. The authors underscored the importance of careful identification and selection of environmental and biological indicators that provide measurable attributes if system behavior. This is essential in order to properly interpret fisheries changes that may be observed.
57. Robinson, M.D., Goodbrand, A., and R.J. MacDonald. 2014. Multi-Scale Characterization of Bull Trout Spawning Locations in Line Creek. Prepared for Teck Coal Ltd by Lotic Environmental Ltd. 25 pp.
This study applied an approach that accounted for a range of spatial scales in assessing
factors influencing bull trout spawning in Line Creek. The objective of this study was to characterize the factors that describe bull trout spawning habitat site selection at various spatial scales from the watershed to a sub-channel unit scale. The information will be used to inform Teck Coal’s design and decisions regarding fish habitat offsetting projects. Results suggested that moving from the watershed scale to channel unit scale, the interaction between groundwater and surface water remains an important characterization of spawning habitat. Line Creek is a stream with a relatively high proportion of groundwater contributing to total streamflow, providing stable thermal conditions throughout the incubation period. There does not appear to be selection of spawning locations that rely upon groundwater discharge at smaller spatial scales (reach to channel unit). However, this study clearly demonstrates that spawning habitat site selection is likely driven by velocity and depth between channel units, and vertical hydraulic gradient within channel units.
58. Russell, E.J.A and G.G. Oliver. 1996. Fish-Stream Identification in the Upper Elk River Drainage. Prepared for: W.T. Westover, B.C. Ministry of Environment, Lands and Parks. Cranbrook, BC. January.
This study investigated the presence/absence of fish, the identity of fish species present
and reported on the specific habitat components of Alexander, Crossing, Chauncey, Ewin and Todhunter Creeks. Data were collected between August 22 and September 29, 1995. Four main criteria were identified for each watercourse: the number of stream reaches, the stream channel widths and gradients, the fish distribution throughout each stream length and the identification of species present. The streams were sorted into two broad categories: fish-bearing and non fish-bearing, with an additional category of suspect fish-bearing added to the report in the aftermath of extreme flooding and stream damage in June 2005. (NOTE Copy of paper received appears to be incomplete.)
59. Townsend Environmental. 2004. Fish Stream Identification of Grace Creek 2004. Prepared for Elk Valley Coal Corporation, Line Creek Operations, Sparwood, B.C. A fish stream identification assessment and report was completed for Grace Creek in
May 2004. Westslope cutthroat trout were known to be present, and the study confirmed presence, but this limited to the lowest reach closest to the confluence with the Fording River. A culvert crossing associated with the rail line was deemed impassible to fish due to its considerable length (100 m). The authors recommended that further sampling be conducted in the fall.
Reviewed in Teck 2011b.
60. Westslope Fisheries Ltd. 2003. Elk River Westslope Cutthroat trout radio telemetry study 2000-2002. Prepared for Columbia-Kootenay Fisheries Renewal Partnership. Cranbook, B.C. 2003.
Native species of cutthroat trout have experienced drastic declines in their distributions
due to over-harvest, habitat degradation, and the introduction of non-native salmonids. In order to manage, protect and possibly enhance Elk River Westslope cutthroat trout in the face of increasing angler effort, industrial activities, and urban development, baseline data including fish distribution and habitat use are required. Despite geographic differences among spawning locations (mainstem margin, off-channel, ephemeral and perennial tributaries), there appeared to be little variation in both the microhabitats and characteristics of redds. Elk River cutthroat trout spawned in stable stream channels with a mean velocity of 0.62 m/s, an abundance of large woody debris (LWD), and undercut banks. Most redds were near the tailout of pools or glides.
PDF missing appendices.
61. Wood, J.A. and R.J. Berdusco. 1999. Fording River revisited. A Review of Environmental Projects at Fording Coal Limited’s Operations at Fording River over the Last 25 Years. Proceedings of the 23rd Annual British Columbia Mine Reclamation Symposium, Kamloops, B.C., 1999. Pages 58 – 70.
At the time of this study, Fording Coal Ltd. had completed a number of environmental
projects at the Fording River Operations including major river diversions, water quality control settling ponds, stream enhancements for westslope cutthroat trout, and wildlife habitat restoration. The study looked to assess the effectiveness of these projects after they had been in place for over 20 years. The projects included the Fording River Diversion (1976), the Henretta Dragline Project (1990), Fish Pond Creek and Upper
Fording River Habitat Replacement, Stormwater Settling Ponds, and Riparian Vegetation.
62. Wright, J. A., J.R. Berdusco and J.E. Bisset. 2005. Fish and Fish Habitat Monitoring in the Henretta Creek Reclaimed Channel (2004). Prepared for Elk Valley Coal Corporation – Fording River Operations, Elkford, BC. Prepared by Interior Reforestation Co. Ltd., Cranbrook, B.C. 24pp + 6 appendices.
The 2004 fish and fish habitat monitoring represented Year 5 of the proposed seven
year monitoring program required by the C-3 Reclamation Permit issued to Elk Valley Coal Corporation’s Fording River Operations’ (FRO). In 2004, changes in the invertebrate populations were variable between sites, dependent on the metric being analyzed. At the control site there were notable reductions in invertebrate densities, and moderate reductions in the percent composition of mayflies, stoneflies and caddisflies (%EPT) and mayflies alone (% Emphemeroptera). Upstream of Henretta Lake, benthic metrics were generally comparable with 2003 results. No spawning pairs were observed during the 2004 spawning and redd assessment. This is consistent with previous studies and observations of low utilization prior to and after mining. The detailed fish habitat assessments completed in 2004 indicate that the complexity and quantity of habitat and channel stability upstream and downstream is improving since 2003. Physical features in Henretta Lake have not changed for the most part. Continued channel adjustment (downcutting, narrowing, bar formation) which provides deeper pools and increased habitat features (glides, undercuts, woody debris accumulation), along with continued growth and establishment of healthy riparian vegetation, has further contributed to channel stability and complexity.
63. Wright, J., L. Amos and A. Edeburn. 2001. 2000 Fish and Fish Habitat Monitoring in the Henretta Creek Drainage. Report prepared for Fording Coal Ltd., Elkford, B.C. Prepared by Interior Reforestation Co. Ltd. Cranbrook, BC. -58 pp.
As with previous reports, water temperature was higher downstream of Henretta Lake
compared to upstream. Temperatures in the current report were considered within the preferred range for westslope cutthroat trout. The lack of spawning or redd construction during the 2000 survey provides no definitive proof of spawning or redd construction in the Henretta Creek reclaimed channel, despite the availability of suitable spawning gravels from initial restoration efforts by FCL. As the freshet flows coincide with the expected peak spawning times in the drainage, fish may have avoided use of the reclaimed channel as a natural mechanism to avoid the currently dynamic streambed and subsequently improve spawning success by relocating to other possible spawning locations. Average fish density in Henretta Creek during the 2000 survey was 6.7 fish/100m2, which exceeds that of pre-impact studies. Fish habitat enhancement structures were installed within the stream portion of Henretta Creek to provide resting and holding cover for fry, juvenile and adult WCT, and most were meeting their intended purposes. Henretta Lake was still in the early stages of succession, with submergent, floating and emergent vegetation still lacking. At this stage, Henretta Lake also faces challenges with a lack of dissolved oxygen, particularly in December, January and February, confining fish to the top 2 m of the lake where water temperatures are well below optimum during these months.
PDF missing several figures and the appendices.
REPORTS LACKING INFORMATION SPECIFIC TO TRIBUTARIES IN THE TEP
1. Amos, K., J. Wright, and L. Amos. 2000. Reconnaissance (1:20,000) fish and fish habitat inventory of the Upper Elk River Watershed WSCL 349-248100. Phases IV to VI. Prepared for Crestbrook Forest Industries Ltd. Canbrook, B.C. Prepared by Interior Reforestation Co. Ltd. Cranbrook, B.C. May. 20 p. + 4 app.
2. Canton, S.P., A. Fairbrother, A.D. Lemly, H.M. Ohlendorf, L.E. McDonald, D.D. MacDonald. 2008. Experts workshop on the evaluation and management of selenium in the Elk Valley, British Columbia. Prepared for Ministry of Environment Environmental Protection Division. Nelson, B.C. August. 46 p. + 3 app.
3. COSEWIC (Committee on the Status of Endangered Wildlife in Canada). 2006. COSEWIC assessment and update status report on the Westslope Cutthroat trout Oncorhynchus clarkii lewisi (British Columbia population and Alberta population) in Canada. COSEWIC, Ottawa. Available: www.cosewic.gc.ca/. (December 2008).
4. Dessouki, T.C.E., and A. Ryan. 2010. Canada-British Columbia Water Quality Monitoring Agreement. Water Quality Assessment of the Kootenay, Elk, and St. Mary Rivers. Prepared for B.C. Ministry of Environment and Environment Canada. March.
5. Elphick, J.R., H.C. Bailey, B.K. Lo, J. Berdusco and G. Sword. 2009. Effect of Selenium on Early Life-stage Development of Westslope Cutthroat Trout. Report prepared for the Elk Valley Selenium Task Force. Prepared by Nautilus Environmental, Burnaby, British Columbia. -66 pp.
6. G3 Consulting Ltd. 2006. Coalbed gas environmental resource project. Fish population and habitat study review: Crowsnest Coalfield. Prepared for Ministry of Energy, Mines and Petroleum Resources, Victoria, B.C. Janaury. 17 p + 2 app.
7. Hagen, J. and J.T.A. Baxter. 2009. 2008 Westslope Cutthroat trout population abundance monitoring of classified waters in the East Kootenay region of British Columbia. Prepared for BC Ministry of Environment, Cranbrook, BC, 34 p.
8. McDonald, L. 2009. Survey of Selenium in Water, Zooplankton and Fish in Lake Kookanusa, BC, 2008. Report Prepared for Environmental Protection, Kootenay Region, BC MOW on the Behalf og the Elk Valley Selenium Task Force, July 2009.
9. Robinson, M.D. 2011. Elk River fish distribution and longnose dace tissue assessment. Prepared for the Elk Valley Selenium Task Force. Prepared by Interior Reforestation Co. Ltd. 21 pp +app.
10. Swain, L.G. 2007. Canada-British Columbia Water Quality Monitoring Agreement. Water Quality Assessment of Elk River at Highway 93 near Elko (1968-2005). Prepared for B.C. Ministry of Environment and Environment Canada.
11. Swain, L.G. 2007. Canada-British Columbia Water Quality Monitoring Agreement. Water Quality Assessment of Elk River at Sparwood (2002-2005). Prepared for B.C. Ministry of Environment and Environment Canada.
12. Valdal, E.J. 2006. Cumulative effects of landscape disturbance on westslope cutthroat trout in the Upper Kootenay River Watershed: Implications for management and conservation. Master of Science Thesis. University of Calgary, Calgary, A.B. April.
13. Wilkinson, C.E. 2009. Sportfish population dynamics in an intensively managed river system. M.Sc. Thesis. University British Columbia, Vancouver, B.C. 140 p. + 3 app.


