Embed Size (px)
Citation preview
Department of Science and Information Technologies
Data Warehouse Automation
Trick or Treat?
Paula Alexandra Pereira de Oliveira
Dissertation submitted as partial fulfilment of the requirements for the
Master’s degree in Integrated Business Intelligence Systems
Supervisor:
Doctor Rui Gonçalves, Assistant Professor,
ISCTE-IUL
Co-Supervisor:
Doctor Elsa Alexandra Cabral da Rocha Cardoso, Assistant Professor
ISCTE – IUL
September 2019

Data Warehouse Automation Trick or Treat?
ii
Data Warehouse Automation Trick or Treat?
iii
Acknowledgements
To my Mother and Father, for being my ‘rock'; for teaching me that goods things don´t
come easy and that we need to work for them; for teaching me that every living being
deserves my Respect and for teaching me Gratitude.
To my sisters, with whom I learn a lot every single day, and for giving me my treasures,
my nephews.
To my supervisor, Doctor Rui Gonçalves and to my Co-Supervisor Doctor Elsa
Cardoso, for their guidance in the last year.
To the organisation that allowed for the case study, without their trust and willingness
to share and contribute to the scientific community, this study would not have been
possible.
To my dear and never forgotten teacher, Maria José Trigueiros, a soul that touched me
so deeply by believing in me, more than myself. May God hold you in His arms until we
meet again.
To Passio consulting and all my colleagues, for trusting me, letting me learn with them
every single day and to be part of my professional family.
To WhereScape Inc. for their support and technology enablement, without
WhereScape’s support, this study would have been harder.
And last but not least, to my partner in life for supporting me every step of the way,
thank you my Love.
I feel blessed that these life's crossed mine.
Thank you all!
Data Warehouse Automation Trick or Treat?
iv
Resumo
Os sistemas de armazenamento de dados existem há 25 anos, desempenhando um
papel crucial na recolha de dados e na transformação desses dados em valor, permitindo
que os utilizadores tomem decisões com base em fatos. É amplamente aceite, que um data
warehouse é um componente crítico para uma empresa orientada a dados e se torna parte
da estratégia de sistemas de informação da organização, com um impacto significativo
nos negócios. No entanto, após 25 anos, a construção de um Data Warehouse ainda é uma
tarefa penosa, demora muito tempo, é cara e difícil de mudar após a sua conclusão.
A automação de Data Warehouse aparece com a promessa de endereçar as limitações
das abordagens tradicionais, transformando o desenvolvimento da data warehouse de um
esforço prolongado em um esforço ágil, com ganhos de eficiência e eficácia. Será, a
automação de Data Warehouse uma doçura ou travessura?
Foi desenvolvido um estudo de caso de uma arquitetura de data warehousing usando
uma ferramenta de automação, designada WhereScape. Foi também conduzido um
questionário a organizações que utilizam ferramentas de automação de data warehouse,
para entender sua motivação na adoção deste tipo de ferramentas.
Com base nos resultados da pesquisa e no estudo de caso, a automação no processo de
construção de data warehouses, é necessária para uma maior agilidade destes sistemas e
uma solução a considerar na modernização destas arquiteturas, pois permitem obter
resultados mais rapidamente, mantendo os custos controlados e reduzindo o risco. A
automação de data warehouse pode bem vir a ser uma “doçura”.
Keywords: Data Warehouse, Automação, Data Warehouse Automation, Integração de
dados
Data Warehouse Automation Trick or Treat?
v
Abstract
Data warehousing systems have been around for 25 years playing a crucial role in
collecting data and transforming that data into value, allowing users to make decisions
based on informed business facts. It is widely accepted that a data warehouse is a critical
component to a data-driven enterprise, and it becomes part of the organisation’s
information systems strategy, with a significant impact on the business. However, after
25 years, building a Data Warehouse is still painful, they are too time-consuming, too
expensive and too difficult to change after deployment.
Data Warehouse Automation appears with the promise to address the limitations of
traditional approaches, turning the data warehouse development from a prolonged effort
into an agile one, with gains in efficiency and effectiveness in data warehousing
processes. So, is Data Warehouse Automation a Trick or Treat?
To answer this question, a case study of a data warehousing architecture using a data
warehouse automation tool, called WhereScape, was developed. Also, a survey was made
to organisations that are using data warehouse automation tools, in order to understand
their motivation in the adoption of this kind of tools in their data warehousing systems.
Based on the results of the survey and on the case study, automation in the data
warehouses building process is necessary to deliver data warehouse systems faster, and a
solution to consider when modernize data warehouse architectures as a way to achieve
results faster, keeping costs controlled and reduce risk. Data Warehouse Automation
definitely may be a Treat.
Keywords: Data Warehouse, Automation, Data Warehouse Automation, Data
Integration
Data Warehouse Automation Trick or Treat?
vi
Acknowledgements ........................................................................................................ iii
Resumo ........................................................................................................................... iv
Abstract ........................................................................................................................... v
Index of Tables ............................................................................................................. viii
Index of Figures ............................................................................................................. ix
Chapter 1 – Introduction ............................................................................................. 11
1.1. Motivation and Problem Definition ................................................................. 11
1.2. Research Questions .......................................................................................... 13
1.3. Research Methodology .................................................................................... 14
1.4. Structure and Organisation .............................................................................. 15
Chapter 2 – Literature Review .................................................................................... 17
2.1. Data Warehousing Core Concepts ................................................................... 17
2.2. Data Warehousing Architectures ..................................................................... 23
2.2.1. CIF Architecture ........................................................................................... 24
2.2.2. Data Warehouse Bus Architecture ............................................................... 25
2.2.3. Centralised Data Warehouse ........................................................................ 26
2.2.4. Federated Architecture ................................................................................. 26
2.2.5. Data Vault 2.0 Architecture ......................................................................... 27
2.2.6. Data Delivery Platform Architecture ........................................................... 28
2.3. Data Warehousing Development Approaches ................................................. 31
2.3.1. Waterfall Model ........................................................................................... 32
2.3.2. V-Model ....................................................................................................... 32
2.3.3. Agile Model.................................................................................................. 33
2.4. Data Warehouse Automation ........................................................................... 35
2.4.1. Data Warehouse Automation Benefits ......................................................... 36
2.4.2. Data Warehouse Automation Tools Design Approach ................................ 38
2.4.3. Data Warehouse Automation Tools Vendors Comparison .......................... 39
2.5. Related Work ................................................................................................... 41
Chapter 3–What Drives Data Warehouse Automation? .......................................... 43
3.1. Survey Methodology ........................................................................................ 43
3.2. Organisations Demographics ........................................................................... 44
3.3. Drivers for Adoption of Data Warehouse Automation Tools .......................... 45
3.4. Architecture and SDLC models ....................................................................... 47
3.5. Research Discussion ........................................................................................ 48
Chapter 4 – The DWA in Action ................................................................................. 50
Data Warehouse Automation Trick or Treat?
vii
4.1. The Organisation .............................................................................................. 50
4.2. The Organisation’s Objectives ......................................................................... 50
4.3. About WhereScape .......................................................................................... 51
4.4. The System Development Life Cycle Approach ............................................. 54
4.5. The Architecture and DWS .............................................................................. 55
4.5.1. DWS: Building the Staging area (Load Tables)........................................... 56
4.5.2. DWS: Building the EDW ............................................................................. 57
4.5.3. DWS: Building Data Marts .......................................................................... 58
4.5.4. DWS: Building Scheduler ............................................................................ 59
4.5.5. DWS: Building Documentation ................................................................... 60
4.5.6. DWS: Release Management and Deploy ..................................................... 61
4.5.7. DWS: Maintenance ...................................................................................... 62
4.6. Project Plan and Team ..................................................................................... 63
4.7. Case Study Conclusions and Lessons Learned ................................................ 64
Chapter 5 – Conclusion and Recommendations ........................................................ 66
5.1. Main Conclusions and Limitations .................................................................. 66
5.2. Future investigation ......................................................................................... 68
Bibliography .................................................................................................................. 69
Appendix A ................................................................................................................ 72
Appendix B ................................................................................................................. 78
Appendix C ................................................................................................................. 80
Data Warehouse Automation Trick or Treat?
viii
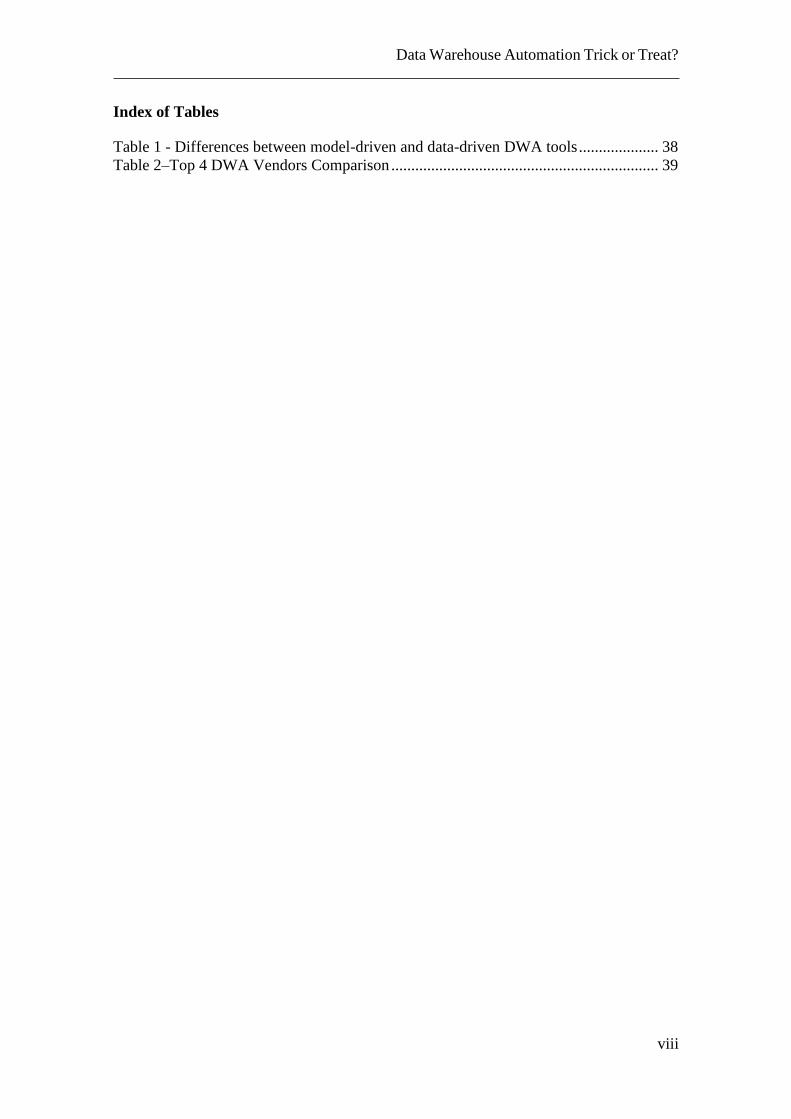
Index of Tables
Table 1 - Differences between model-driven and data-driven DWA tools .................... 38
Table 2–Top 4 DWA Vendors Comparison ................................................................... 39
Data Warehouse Automation Trick or Treat?
ix
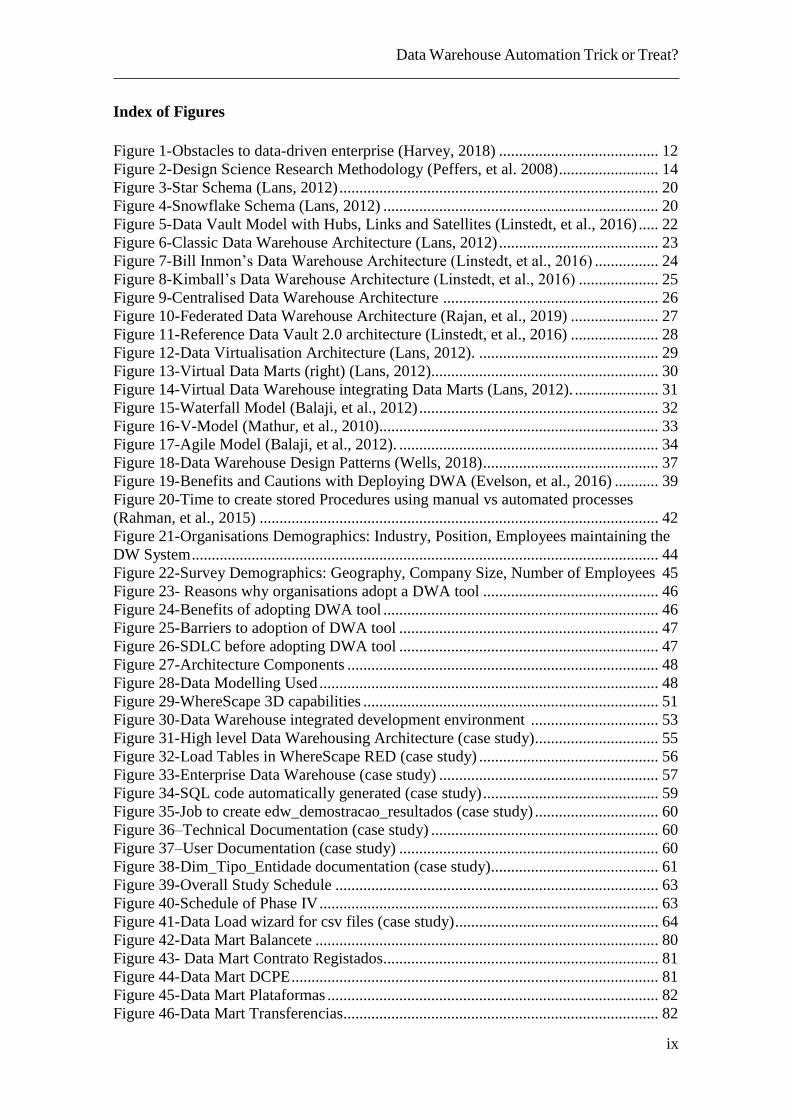
Index of Figures
Figure 1-Obstacles to data-driven enterprise (Harvey, 2018) ........................................ 12
Figure 2-Design Science Research Methodology (Peffers, et al. 2008) ......................... 14 Figure 3-Star Schema (Lans, 2012) ................................................................................ 20 Figure 4-Snowflake Schema (Lans, 2012) ..................................................................... 20 Figure 5-Data Vault Model with Hubs, Links and Satellites (Linstedt, et al., 2016) ..... 22 Figure 6-Classic Data Warehouse Architecture (Lans, 2012) ........................................ 23
Figure 7-Bill Inmon’s Data Warehouse Architecture (Linstedt, et al., 2016) ................ 24 Figure 8-Kimball’s Data Warehouse Architecture (Linstedt, et al., 2016) .................... 25 Figure 9-Centralised Data Warehouse Architecture ...................................................... 26
Figure 10-Federated Data Warehouse Architecture (Rajan, et al., 2019) ...................... 27 Figure 11-Reference Data Vault 2.0 architecture (Linstedt, et al., 2016) ...................... 28 Figure 12-Data Virtualisation Architecture (Lans, 2012). ............................................. 29 Figure 13-Virtual Data Marts (right) (Lans, 2012)......................................................... 30 Figure 14-Virtual Data Warehouse integrating Data Marts (Lans, 2012). ..................... 31
Figure 15-Waterfall Model (Balaji, et al., 2012) ............................................................ 32 Figure 16-V-Model (Mathur, et al., 2010)...................................................................... 33 Figure 17-Agile Model (Balaji, et al., 2012). ................................................................. 34 Figure 18-Data Warehouse Design Patterns (Wells, 2018) ............................................ 37
Figure 19-Benefits and Cautions with Deploying DWA (Evelson, et al., 2016) ........... 39 Figure 20-Time to create stored Procedures using manual vs automated processes
(Rahman, et al., 2015) .................................................................................................... 42 Figure 21-Organisations Demographics: Industry, Position, Employees maintaining the
DW System ..................................................................................................................... 44 Figure 22-Survey Demographics: Geography, Company Size, Number of Employees 45
Figure 23- Reasons why organisations adopt a DWA tool ............................................ 46 Figure 24-Benefits of adopting DWA tool ..................................................................... 46 Figure 25-Barriers to adoption of DWA tool ................................................................. 47
Figure 26-SDLC before adopting DWA tool ................................................................. 47 Figure 27-Architecture Components .............................................................................. 48 Figure 28-Data Modelling Used ..................................................................................... 48
Figure 29-WhereScape 3D capabilities .......................................................................... 51 Figure 30-Data Warehouse integrated development environment ................................ 53
Figure 31-High level Data Warehousing Architecture (case study)............................... 55 Figure 32-Load Tables in WhereScape RED (case study) ............................................. 56
Figure 33-Enterprise Data Warehouse (case study) ....................................................... 57 Figure 34-SQL code automatically generated (case study) ............................................ 59 Figure 35-Job to create edw_demostracao_resultados (case study) ............................... 60
Figure 36–Technical Documentation (case study) ......................................................... 60 Figure 37–User Documentation (case study) ................................................................. 60
Figure 38-Dim_Tipo_Entidade documentation (case study).......................................... 61 Figure 39-Overall Study Schedule ................................................................................. 63 Figure 40-Schedule of Phase IV ..................................................................................... 63
Figure 41-Data Load wizard for csv files (case study) ................................................... 64
Figure 42-Data Mart Balancete ...................................................................................... 80
Figure 43- Data Mart Contrato Registados..................................................................... 81 Figure 44-Data Mart DCPE ............................................................................................ 81 Figure 45-Data Mart Plataformas ................................................................................... 82 Figure 46-Data Mart Transferencias............................................................................... 82
Data Warehouse Automation Trick or Treat?
x
List of Abbreviations and Acronyms
DBA Database Administrator
DDP Data Delivery Platform
DW Data Warehouse
DWA Data Warehouse Automation
DWS Data Warehouse System
DM Data Mart
DSRM Design Science Research Methodology
ETL Extract, Transform, Load
GDPR General Data Protection Regulation
ODS Operational Data Store
PoC Proof of Concept
RED WhereScape RED (Rapid Environment Development)
RQ Research Question
SCD Slowly Changing Dimension
SDLC System Development Lifecycle
SQL Structured Query Language
UE United Europe
Data Warehouse Automation Trick or Treat?
11
Chapter 1 – Introduction
Digital transformation comes to offer organisations a new world of opportunities, to
make more and better deals. Although the strategy in terms of digital transformation
varies from company to company, an essential fact to any strategy is the amount of data
that is to be generated. This data enables companies to gain greater insight into their
customers, products, competitors and new markets, enabling them to gain competitive
advantage. However, to take advantage of this new world of opportunities, it is necessary
to effectively and efficiently manage this immense amount of data, transform it into
valuable information capable of generating a competitive advantage.
For more than 25 years, data warehousing systems have been playing a crucial role in
collecting data and transforming that data into valued information to the organisation,
allowing users to make decisions based on informed business facts and not just intuitions.
Is widely accepted that a data warehouse is a critical component to a data-driven
enterprise (Ekerson, 2015) and it becomes part of the organisation’s information systems
strategy, with a significant impact in the business (Inmon, et al., 2008). The integrated
vision of data that Data Warehouses provides, enables organisations to control better their
business and therefore becoming more efficient and competitive is critical to processes
such as fraud and client relationship management (Inmon, et al., 2008). Data Warehouses
represent a central piece for supporting an organisation's decision-making process and is
the centre of Decision Support Systems, which are one of the simplest and intuitive ways
of making information it needs, to make decisions available to end users (Inmon, et al.,
2002).
1.1. Motivation and Problem Definition
Becoming more data-driven is the goal of almost 100% of the enterprises, but more
than a third achieved that goal (Harvey, 2018). In fact, in the New Vantage Partners Big
Data Executive Survey 2018, 98.6% of the respondents said their organisations were
working in creating a data-driven culture, more 13.1% than in 2017 (Harvey, 2018).
However, the success towards this goal has decreased to 4.7%. Also, a research conducted
Data Warehouse Automation Trick or Treat?
12
by Gartner Inc. to 196 organisations in 2018, also reveals that organisations are still
struggling with data, despite of the investments made in this area, and still have not
reached the maturity they want. (Gartner, 2018).
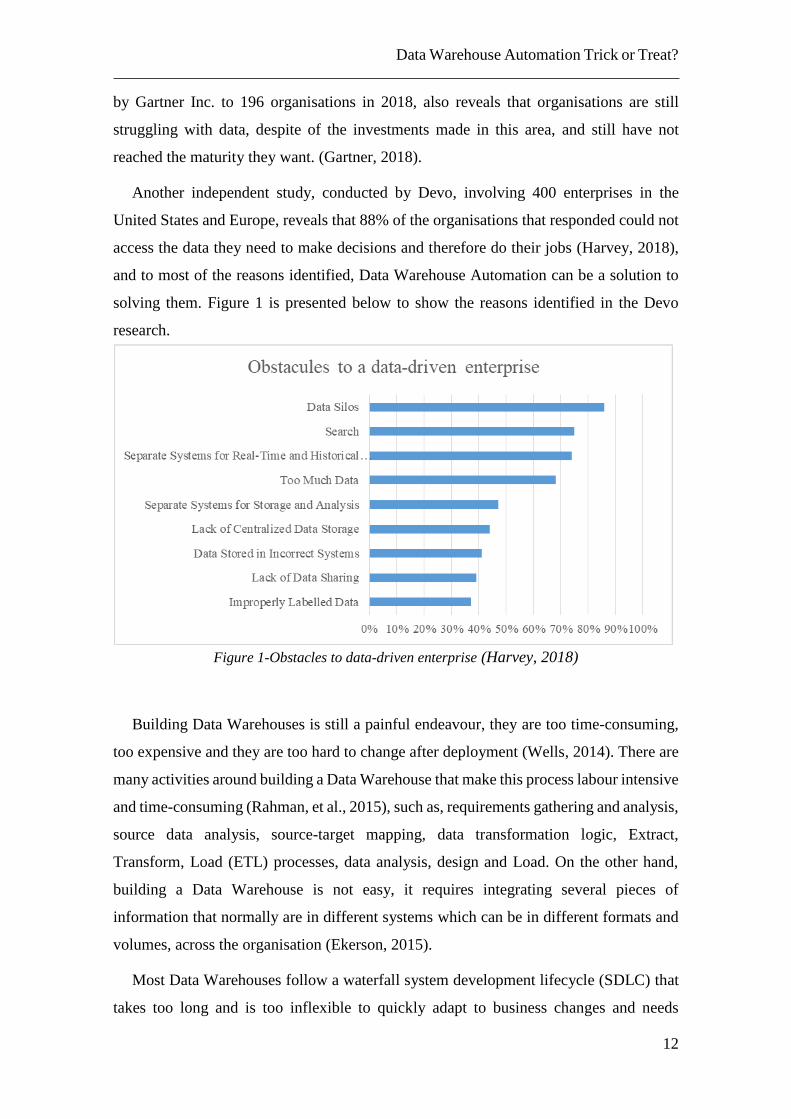
Another independent study, conducted by Devo, involving 400 enterprises in the
United States and Europe, reveals that 88% of the organisations that responded could not
access the data they need to make decisions and therefore do their jobs (Harvey, 2018),
and to most of the reasons identified, Data Warehouse Automation can be a solution to
solving them. Figure 1 is presented below to show the reasons identified in the Devo
research.
Figure 1-Obstacles to data-driven enterprise (Harvey, 2018)
Building Data Warehouses is still a painful endeavour, they are too time-consuming,
too expensive and they are too hard to change after deployment (Wells, 2014). There are
many activities around building a Data Warehouse that make this process labour intensive
and time-consuming (Rahman, et al., 2015), such as, requirements gathering and analysis,
source data analysis, source-target mapping, data transformation logic, Extract,
Transform, Load (ETL) processes, data analysis, design and Load. On the other hand,
building a Data Warehouse is not easy, it requires integrating several pieces of
information that normally are in different systems which can be in different formats and
volumes, across the organisation (Ekerson, 2015).
Most Data Warehouses follow a waterfall system development lifecycle (SDLC) that
takes too long and is too inflexible to quickly adapt to business changes and needs
Data Warehouse Automation Trick or Treat?
13
(Evelson, et al., 2016). Due to this situation, at some point in a project life cycle, there
will be issues related to resources, and project teams will be working after hours to keep
up with project timelines (Rahman, et al., 2015). Normally, the response to this situation
is adding more resources to the project, but this is not a productive way of addressing this
issue, “adding manpower to a late software project makes it later” (Brooks, 1975). While
the project team invests time and effort explaining the project context and training new
team members, there is a reduction in productivity and the consequences are projects that
fall behind schedule (Rahman, et al., 2015).
Another issue when using the waterfall system development for Data Warehouse
projects concerns business requirements. Business users struggle in defining, upfront
business requirements, without seeing and understand the data first. This may lead to
projects that in the end, do not meet organisational needs. Waterfall development does
not allow trial and error, exploration and data discovery to rapidly create business insights
(Evelson, et al., 2016).
Data warehousing development process, in a classic architecture, takes too long, is too
costly, is not easy to build and is hard to change. This is the research problem studied in
this dissertation. Using Data warehouse automation (DWA) tools can help to address the
limitations of waterfall and traditional approaches for building Data Warehouse, turning
the data warehouse development from a time-consuming effort into an agile one, with
gains in efficiency, effectiveness and agility in data warehousing processes (Wells, 2014).
1.2. Research Questions
Considering the definition of the problem and the motivation behind it, as well as the
related work, this study focused on one main objective, to study the effectiveness and
efficiency of data warehouse automation tools in data warehousing development process.
To achieve this main objective, three research questions were formulated:
RQ1: What are the drivers for the adoption of data warehouse automation for an
organisation?
RQ2: What are the characteristics of companies that adopt data warehouse
automation?
Data Warehouse Automation Trick or Treat?
14
RQ3: How can data warehouse automation help in a data warehousing development
process?
To respond to research question RQ1 and RQ2, a survey was made to organisations
that use data warehouse automation tools, and to answer RQ3 a case study was conducted
using a data warehouse automation tool called WhereScape to create a data warehousing
architecture.
1.3. Research Methodology
The methodology used in this study was Design Science Research Methodology (DSRM).
This method has the objective to provide a mental model for the characteristics of research
outputs (Peffers, et al., 2008) and was used as a guideline to this study and to structure
this document.
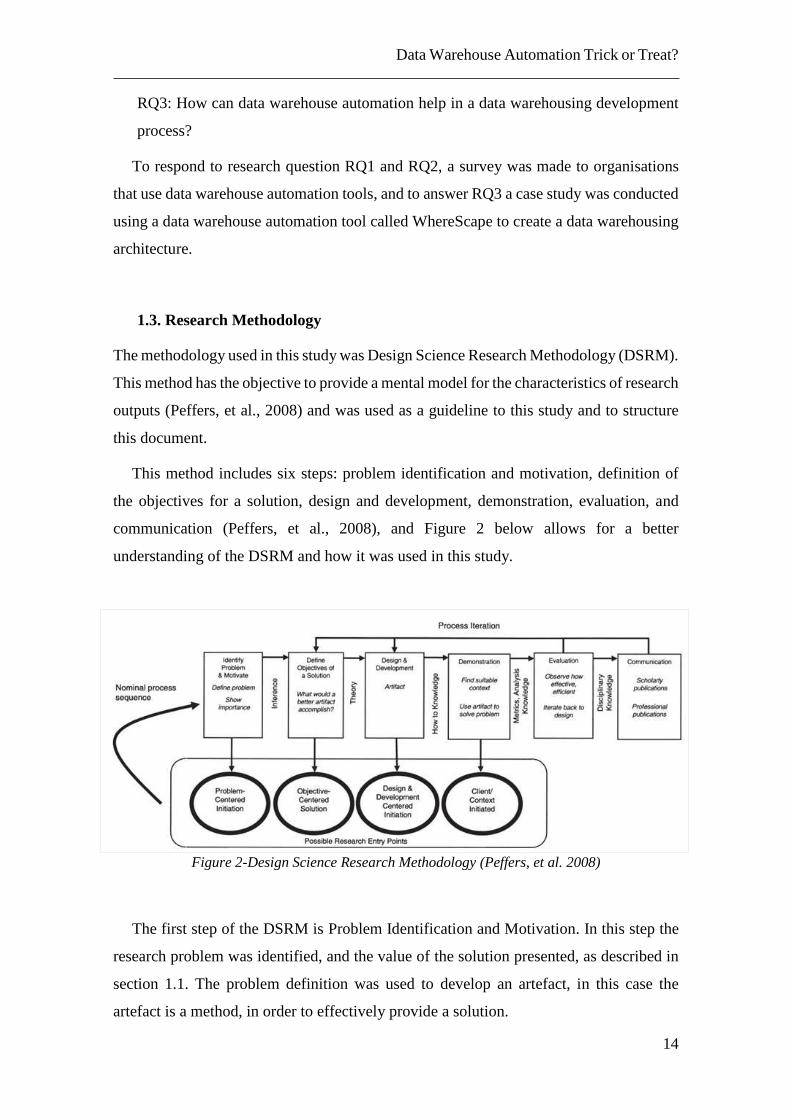
This method includes six steps: problem identification and motivation, definition of
the objectives for a solution, design and development, demonstration, evaluation, and
communication (Peffers, et al., 2008), and Figure 2 below allows for a better
understanding of the DSRM and how it was used in this study.
Figure 2-Design Science Research Methodology (Peffers, et al. 2008)
The first step of the DSRM is Problem Identification and Motivation. In this step the
research problem was identified, and the value of the solution presented, as described in
section 1.1. The problem definition was used to develop an artefact, in this case the
artefact is a method, in order to effectively provide a solution.
Data Warehouse Automation Trick or Treat?
15
The second step of the DSRM is to Define Objectives for the solution. Objectives can
be quantitative (e.g. in which terms would a desirable solution be better than current ones)
or qualitative (e.g. a description of how a new artefact is expected to support solutions to
problems not hitherto addressed) (Cardoso, 2011). In this study, a main objective to the
solution was defined and this objective was presented in section 1.2 along with the defined
research questions.
The third step of the DSRM is Design and Development. This activity includes
determining the artefact’s desired functionality and its architecture, and then creating the
actual artefact (e.g. construct models, methods, or instantiations) (Cardoso, 2011).
However, in order to do a rigorous Design and Development, a literature review must be
performed before starting this activity, in order to identify related work and theory that
can be useful to the research.
Step four of the DSRM is Demonstration. The objective of this activity is to
demonstrate the use of the artefact to solve one or more instances of the problem
(Cardoso, 2011), and in this study a case study was used to demonstrate how the artefact
solved the identified problem. This was described in chapter four.
Step five of the DSRM is Evaluation. The objective of this activity is to observe and
measure how well the artefact supports a solution (Cardoso, 2011). Since this activity
involves comparing the objectives of a solution to actual observed results by using a
comparison of the artefact’s functionality with the solution objectives, quantitative
performance measures such as the results of satisfaction surveys, client feedback, or
simulations (Cardoso, 2011), due to time restriction of this study, an Evaluation of this
study in this sense, was not presented, but instead study results were shown. This was
described in chapter five.
Step six of the DSRM is Communication. The objective of this activity is to
communicate the problem and its importance. To communicate the utility of the artefact,
the rigour of its design (Cardoso, 2011). This document represented the Communication
of the artefact and its effectiveness to researchers and other audiences that could find this
study relevant.
1.4. Structure and Organisation
This study is organised in three chapters, following the Introduction.
Data Warehouse Automation Trick or Treat?
16
Chapter two introduces data warehousing core concepts, architectures, development
approaches and data warehouse automation approach.
Chapter three analyses the results of the survey that was conducted to gain insights
about what drivers Data Warehouse automation in organisations.
Chapter four presents a case study of an application of data warehouse automation
concept in a Portuguese organisation, where data warehouse architecture was created,
from scratch, using a data warehouse automation tool called WhereScape. In this case
study the objectives, the system development life cycle approach, the architecture
components that were created, the project plan, the team and the lessons learned are
presented.
Chapter five resumes the main conclusions of this study, limitations and future work,
followed by bibliography and appendices. At the beginning of this study the content of
each chapter is presented.
Data Warehouse Automation Trick or Treat?
17
Chapter 2 – Literature Review
This chapter of the study covers the literature review, an important step because it will
give a theoretical basis for the study and the literature related to the problem identified in
section 1.1. It allows for the definition of study objectives and to discover
recommendations for further research.
2.1. Data Warehousing Core Concepts
In the 1990s, Bill Inmon introduces the concept of Data Warehouse for the first time,
which is why he became known as the ‘father’ of Data Warehouse. The Data Warehouse
arises with the aim of supporting the decision-making process of an organisation and is
at the centre of the decision support systems, which are one of the simple and intuitive
ways of providing information, stored in the Data Warehouse, to users who need it to
make decisions (Inmon, et al., 2002).
A Data Warehouse System can be defined as subject-oriented, temporal, integrated,
non-volatile collection of data, created with the objective of providing information in the
right format to support the decision process (Inmon, 2002), and the repository where this
data is stored is called Data Warehouse (Inmon, 2002).
Data Warehouses become an integral part of organisations' information systems
strategy, with a significant impact on business. The unified view of information provided
by Data Warehouses enables organisations to better control their business, making their
critical processes more efficient such as fraud management and customer relationship
management (Inmon, 2008).
The information at its most elementary level is processed by the data warehouse
system, transforming functional and departmental information into corporate
information. When the information passes through the Data Warehouse, it is ready to be
accessed and analysed by everyone in the organisation (Inmon, et al., 2002), or even
transformed for other purposes, such as for the creation of analytical models.
A data warehouse system has components and each of them has a specific and well-
defined function in the architecture, and it is important to understand that function. The
Data Warehouse Automation Trick or Treat?
18
Source systems are the data sources for the Data Warehouse system and can be internal
or external. The internal sources of these sources can be operating systems, whose
function is the capture of day-to-day business transactions (Kimball, 1998) and are
systems that pre-dictate the performance of transactional processing (Inmon, 2002).
External sources are information sources that come from outside the organisation and can
be structured or unstructured information (Inmon, et al., 2002).
The Staging area is a gateway between source systems and the Data Warehouse. At
this stage, clean up and transformation operations are performed to prepare the
information to be processed by the data warehouse. The Staging area may have an entity-
relation model design or not. This is an option that will depend on how the data source is
structured in the organisation (Kimball, 1998). The Entity-Relationship Modelling or
Normalised Schema is a logical design technique that eliminates data redundancy and by
doing so, data cannot become inconsistent (Kimball, 1998). In an entity-relation model,
tables do not have duplicate data, so they are suitable for supporting day-to-day business
transactions. There is only one row in a table to manage inserts, updates and deletes and
therefore it is the preferred schema for source systems that has to maintain business
consistency (Lans, 2012).
Other components of a data warehouse system are the Extract, Transform, Load (ETL)
processes. The first step, Extract, is responsible for extracting information from source
systems to the data warehouse system. The second step is Transform and refers to the
transformation process of extracted information. Processes such as processing, clearing
data to correct missing values, summarising information, reconciling information from
different sources and deleting duplicate records are part of the transformation process.
Once the information is transformed, it is ready to be loaded into the Data Warehouse and
this is the last step (Kimball, 1998).
The Data Warehouse is the centre of a data warehousing architecture and therefore the
main repository, and regardless of distinct approaches of Bill Inmon and Ralph Kimball
on this subject, both agree that the Data Warehouse is a subject-oriented, non-volatile,
integrated, time-variant repository that supports the organisation's decision-making
process (Inmon, 2002). However, there are other repositories, such as the Operational
Data Store (ODS), that can be part of the architecture and this repository can be used in
two different ways:
Data Warehouse Automation Trick or Treat?
19
1. The ODS is a repository that integrates the information of the various operating
systems with constant operational updates. Its management is carried out outside
the Data Warehouse system (Kimball, 1998);
2. The ODS is a repository with integrated and detailed information, prepared to be
accessed by the organisation for decision support. In this perspective, ODS is an
integrate part of the Data Warehouse system, as it contains detailed information
on the Data Warehouse (Kimball, 1998). As an integrate part of a Data
Warehouse system, ODS is defined as a repository whose subject-oriented,
volatile, integrated repository contains enterprise information at a detailed level
(Inmon, 2002) and is frequently updated (Kimball, 1998).
Another repository in the architecture is the Data Mart. A Data Mart is a subset of
the Data Warehouse, which represents a business process (Kimball, 1998). These
repositories aim to respond to specific requirements of a process or business unit (Inmon,
et al., 2002). Through a set of applications and tools, users of the Data Warehouse system
access information stored in the Data Warehouse and Data Marts, and this process is
called Data Access. In a data warehouse system, there is technical and business
information about the system (Kimball, 1998), but not the information itself. This is a key
concept for the study in question because the operation of data warehouse automation
tools is based on metadata.
The type of modelling and their concepts are also an important decision to make
when creating a data warehouse architecture. The most common types of modelling are,
Dimensional Modelling and Data Vault. The dimensional modelling is a logical design
technique that aims to structure the information that is intuitive to users and allows for
high performance. This type of model has a central table with a multi-part key that is
called fact table and a set of tables called dimensions. A fact is an observation or event
that the organisation wants to measure and most of them are numeric although some can
be text. A dimension describes characteristics of a fact and usually are text fields. Each
dimension as a primary key that corresponds to one of the multi-part key in the fact table
(Kimball, 1998). The dimensional modelling has two main approaches:
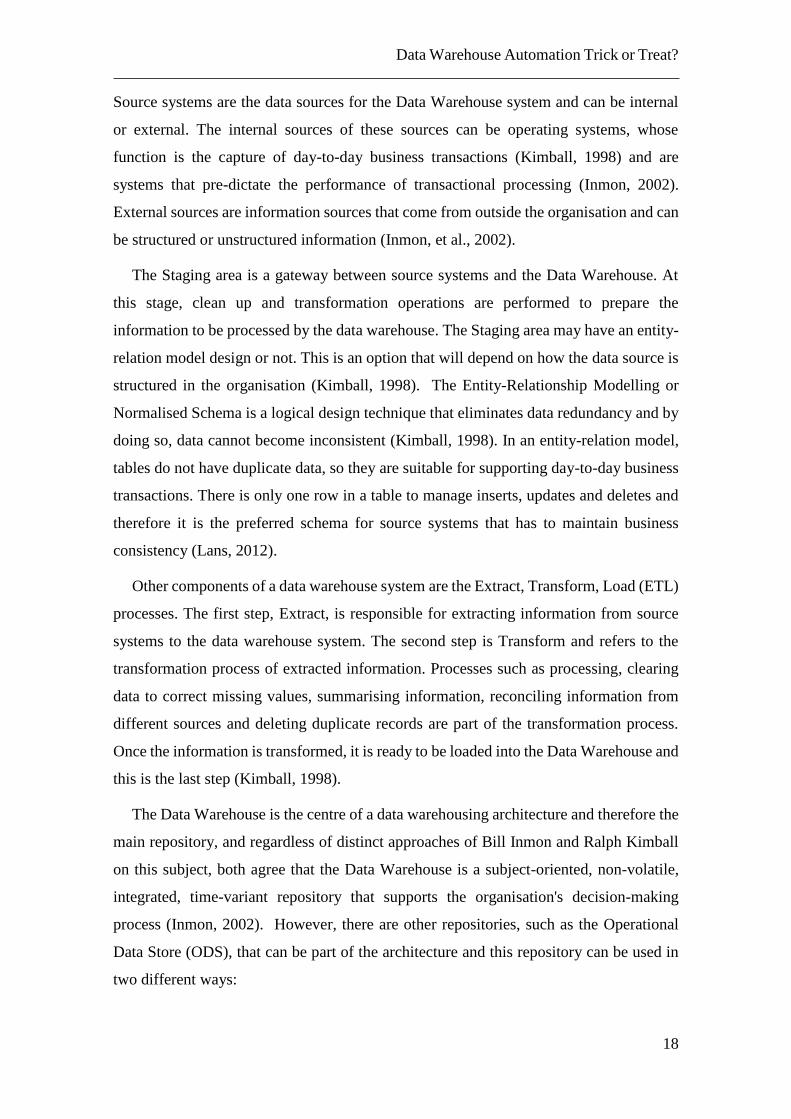
1. Star Schema – Start schema is a dimensional modelling design where the fact table
forms the centre and the dimensions tables representing the business objects are
linked to the fact table forming a star. For better understanding of a star schema,
Figure 3 is presented.
Data Warehouse Automation Trick or Treat?
20
Figure 3-Star Schema (Lans, 2012)
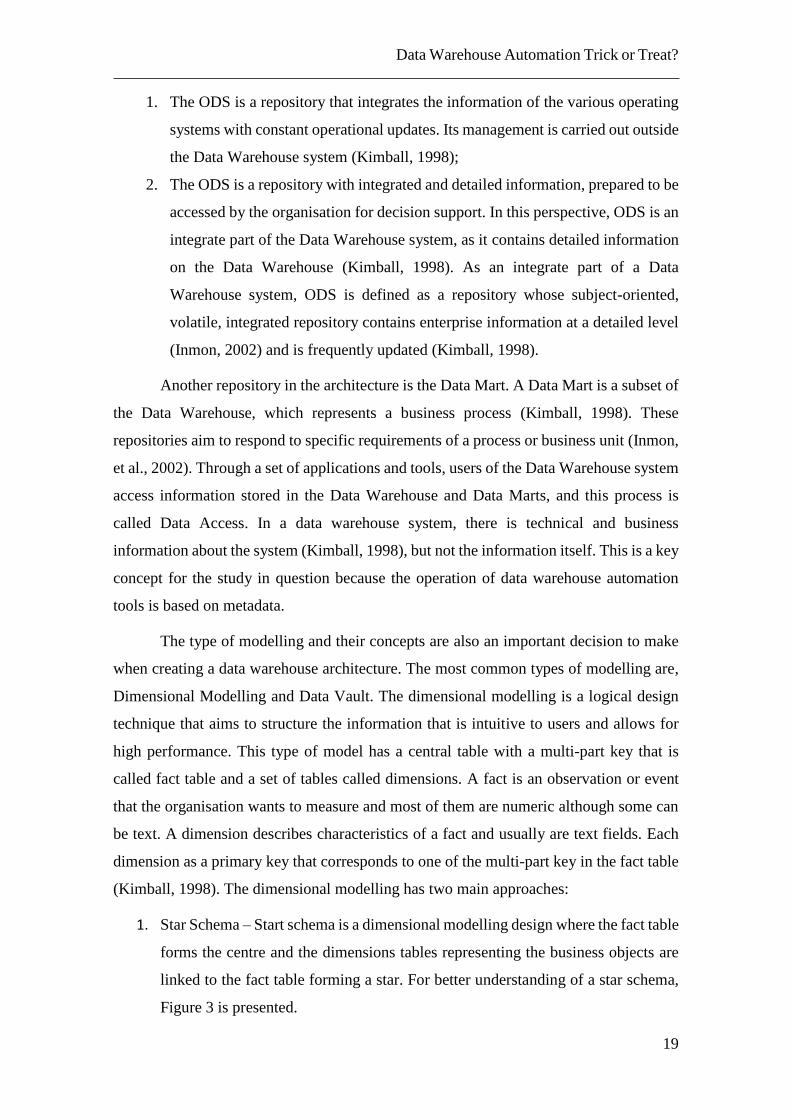
2. Snowflake Schema – Snowflake schema is very similar to the star schema, both
organising the dimension around a fact table. The key difference is that dimension
in a snowflake schema is normalised. Figure 4 is presented for better
understanding of this concept.
Figure 4-Snowflake Schema (Lans, 2012)
When designing a data warehouse system attention must be given to Conformed
Dimensions, because they are “dimensions that means the same thing with every possible
Data Warehouse Automation Trick or Treat?
21
fact table to which it can be joined” (Kimball, 1998), they are the way to ensure
integration of master data.
Dimensions can change over time and in order to ensure integration, dimensional
changing must be captured. Slowly Changing Dimensions (SCD) are the most common
advanced technique to capture dimensional changing over time:
Slowly Changing Dimension (SCD) Type 1: For this type of SCD, the information is
overwritten and therefore these dimensions always have the most recent values.
(Kimball, et al., 2002)
Slowly Changing Dimension (SCD) Type 2: In this type, a new record is added with
the recent values and the old record is marked as inactive. In this type of SCD, at least
three columns must be added, the active flag, start date and the end date, in order to
record the period of time the data is valid. (Kimball, et al., 2002)
Slowly Changing Dimension (SCD) Type 3: In this type of dimension, a second
column is added to store the most recent value. Every time a change is captured, the
value in the second column is stored in the first column and the recent value goes to
the second column. (Kimball, et al., 2002)
Slowly Changing Dimension (SCD) Type 6: Type 6 is a combination of Type 2
+Type 3. A second column is added to store the recent value, like type 3, but also a
record is added like type 2. So, there is a second column with recent value, and three
more columns, active flag, start date and end date. (Kimball, et al., 2002)
Another type of modelling technique used to design data warehouses, is Data Vault.
“Data Vault is a detail oriented, historical tracking and uniquely linked set of normalised
tables that support one or more functional areas of business,” (Inmon, et al., 2015). This
technique is a hybrid approach between the 3NF and star schema and it is flexible,
scalable, consistent and adaptable to the needs of today’s enterprise (Inmon, et al., 2015).
A Data Vault model is based on three main concepts: Hubs, Links and Satellites.
Hubs are entities that store business keys and there are Hubs for each business key
(Linstedt, et al., 2016). Links are entities that connect two or more Hubs, and Satellites
are entities that store information about the business keys and therefore about the Hubs,
but also store information about the Links. Figure 5 represents an example of a data vault
model in an aviation scenario. There is a link between the carrier, the flight number and
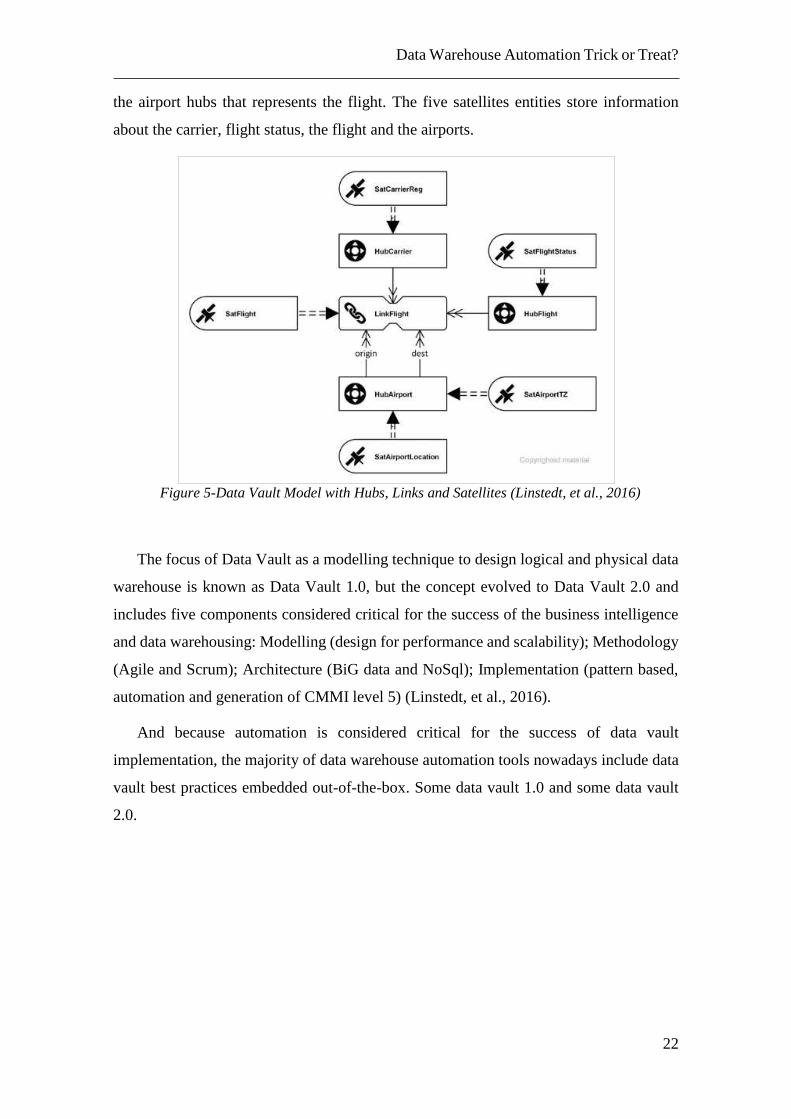
Data Warehouse Automation Trick or Treat?
22
the airport hubs that represents the flight. The five satellites entities store information
about the carrier, flight status, the flight and the airports.
The focus of Data Vault as a modelling technique to design logical and physical data
warehouse is known as Data Vault 1.0, but the concept evolved to Data Vault 2.0 and
includes five components considered critical for the success of the business intelligence
and data warehousing: Modelling (design for performance and scalability); Methodology
(Agile and Scrum); Architecture (BiG data and NoSql); Implementation (pattern based,
automation and generation of CMMI level 5) (Linstedt, et al., 2016).
And because automation is considered critical for the success of data vault
implementation, the majority of data warehouse automation tools nowadays include data
vault best practices embedded out-of-the-box. Some data vault 1.0 and some data vault
2.0.
Figure 5-Data Vault Model with Hubs, Links and Satellites (Linstedt, et al., 2016)
Data Warehouse Automation Trick or Treat?
23
2.2. Data Warehousing Architectures
With the amount of information that is generated every minute, is the challenge for
organisations is not about having information for the decision-making process, but how
to manage it effectively, so that it remains a competitive advantage? How to develop the
most fit data warehouse system?
There are many ways to develop a data warehouse system, but all of them are based in
a data warehousing architecture, which can be defined as “a set of design guidelines,
descriptions, and prescriptions for integrating various modules, such as data warehouses,
data marts, operational data stores, staging areas, ETL tools, and analytical and reporting
tools to form an effective and efficient business intelligence system” (Lans, 2012).
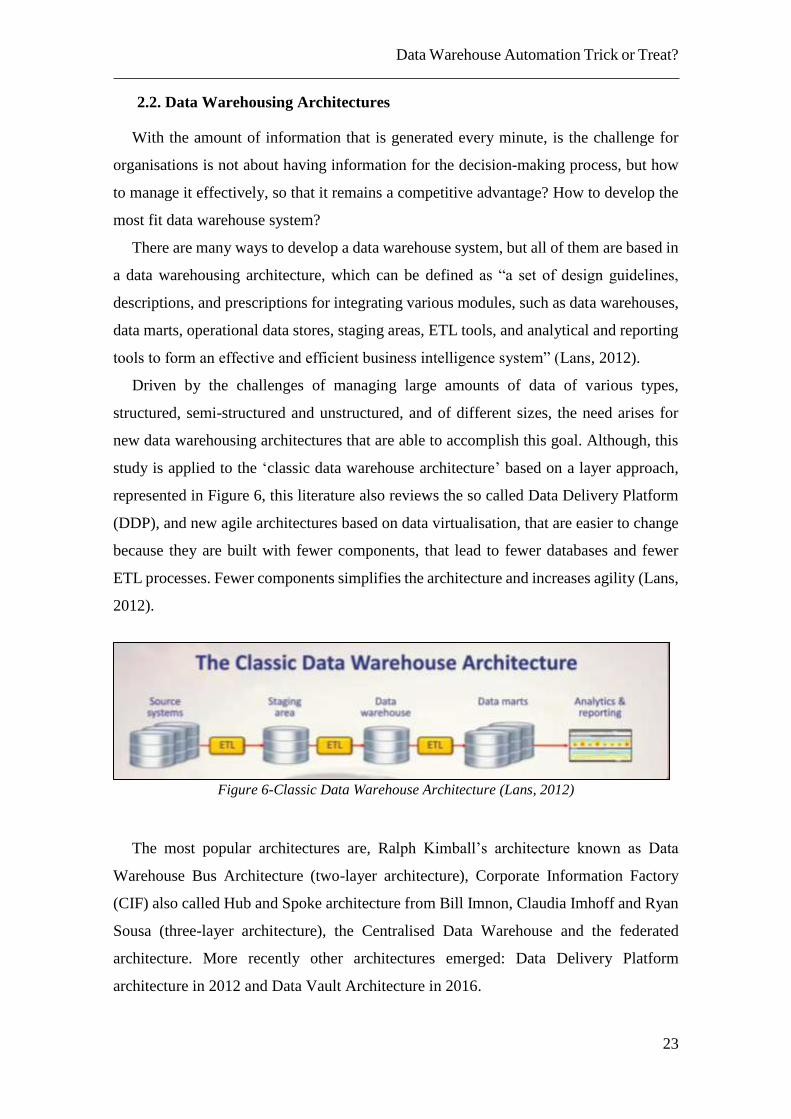
Driven by the challenges of managing large amounts of data of various types,
structured, semi-structured and unstructured, and of different sizes, the need arises for
new data warehousing architectures that are able to accomplish this goal. Although, this
study is applied to the ‘classic data warehouse architecture’ based on a layer approach,
represented in Figure 6, this literature also reviews the so called Data Delivery Platform
(DDP), and new agile architectures based on data virtualisation, that are easier to change
because they are built with fewer components, that lead to fewer databases and fewer
ETL processes. Fewer components simplifies the architecture and increases agility (Lans,
2012).
Figure 6-Classic Data Warehouse Architecture (Lans, 2012)
The most popular architectures are, Ralph Kimball’s architecture known as Data
Warehouse Bus Architecture (two-layer architecture), Corporate Information Factory
(CIF) also called Hub and Spoke architecture from Bill Imnon, Claudia Imhoff and Ryan
Sousa (three-layer architecture), the Centralised Data Warehouse and the federated
architecture. More recently other architectures emerged: Data Delivery Platform
architecture in 2012 and Data Vault Architecture in 2016.
Data Warehouse Automation Trick or Treat?
24
2.2.1. CIF Architecture
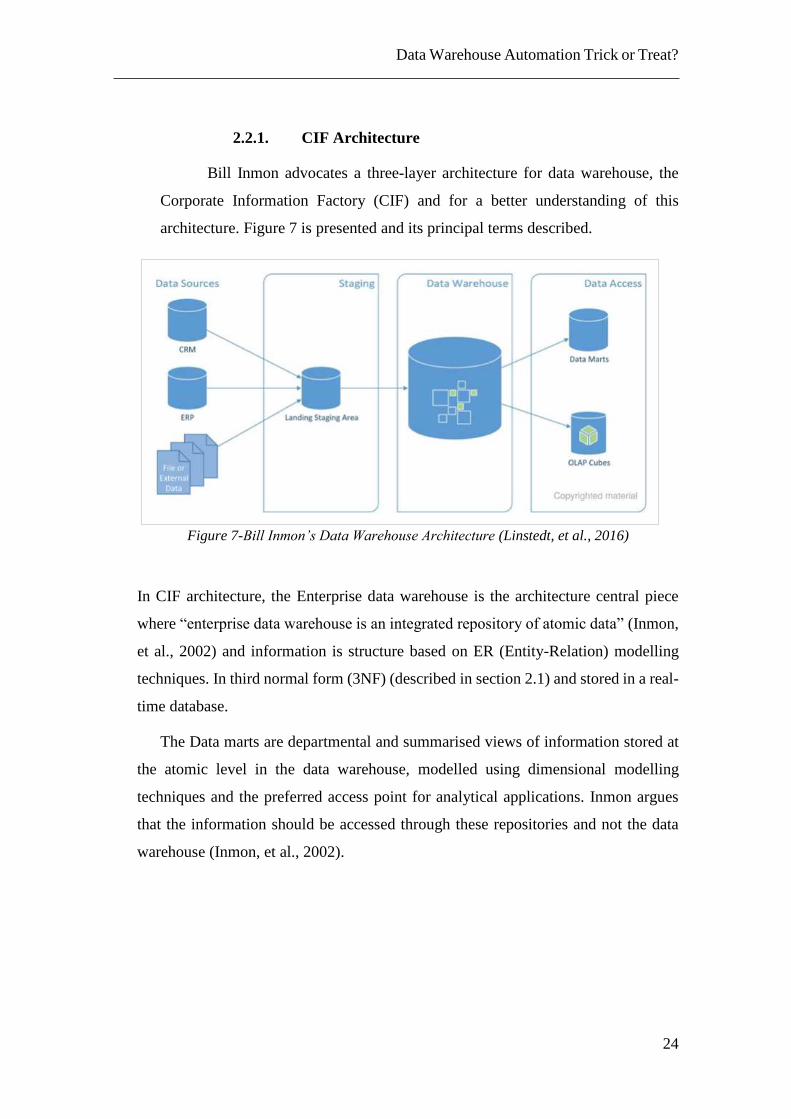
Bill Inmon advocates a three-layer architecture for data warehouse, the
Corporate Information Factory (CIF) and for a better understanding of this
architecture. Figure 7 is presented and its principal terms described.
Figure 7-Bill Inmon’s Data Warehouse Architecture (Linstedt, et al., 2016)
In CIF architecture, the Enterprise data warehouse is the architecture central piece
where “enterprise data warehouse is an integrated repository of atomic data” (Inmon,
et al., 2002) and information is structure based on ER (Entity-Relation) modelling
techniques. In third normal form (3NF) (described in section 2.1) and stored in a real-
time database.
The Data marts are departmental and summarised views of information stored at
the atomic level in the data warehouse, modelled using dimensional modelling
techniques and the preferred access point for analytical applications. Inmon argues
that the information should be accessed through these repositories and not the data
warehouse (Inmon, et al., 2002).
Data Warehouse Automation Trick or Treat?
25
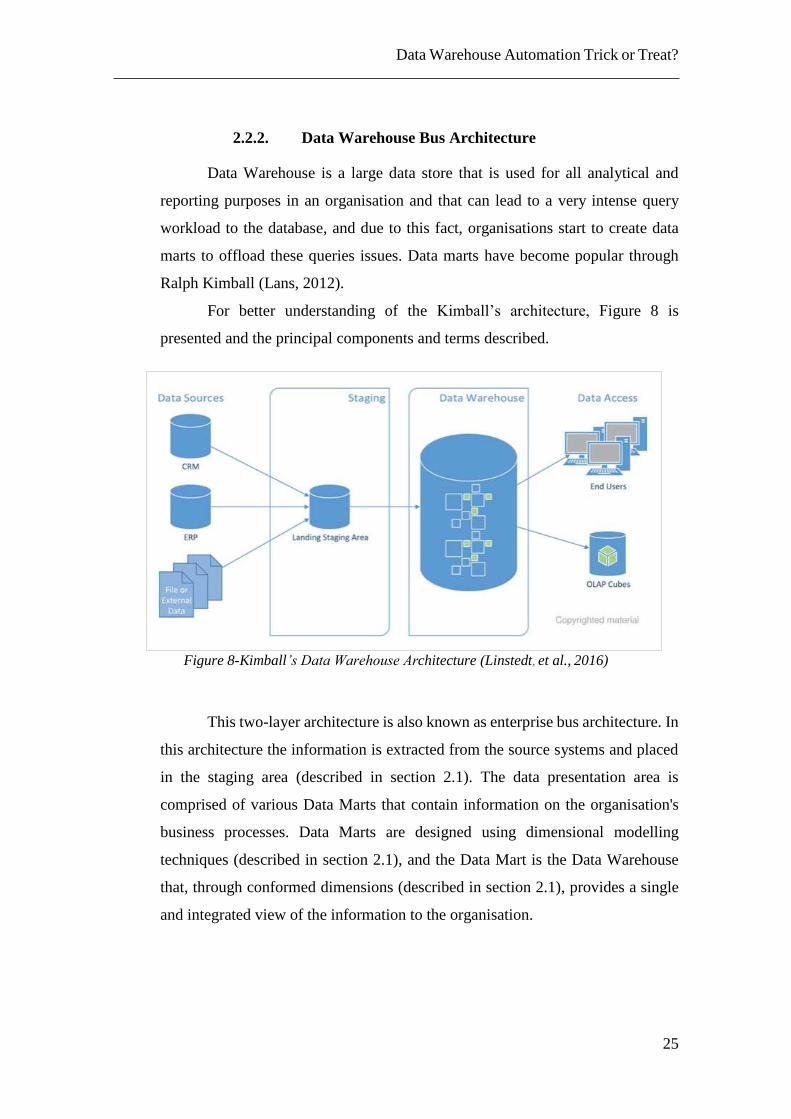
2.2.2. Data Warehouse Bus Architecture
Data Warehouse is a large data store that is used for all analytical and
reporting purposes in an organisation and that can lead to a very intense query
workload to the database, and due to this fact, organisations start to create data
marts to offload these queries issues. Data marts have become popular through
Ralph Kimball (Lans, 2012).
For better understanding of the Kimball’s architecture, Figure 8 is
presented and the principal components and terms described.
Figure 8-Kimball’s Data Warehouse Architecture (Linstedt, et al., 2016)
This two-layer architecture is also known as enterprise bus architecture. In
this architecture the information is extracted from the source systems and placed
in the staging area (described in section 2.1). The data presentation area is
comprised of various Data Marts that contain information on the organisation's
business processes. Data Marts are designed using dimensional modelling
techniques (described in section 2.1), and the Data Mart is the Data Warehouse
that, through conformed dimensions (described in section 2.1), provides a single
and integrated view of the information to the organisation.
Data Warehouse Automation Trick or Treat?
26
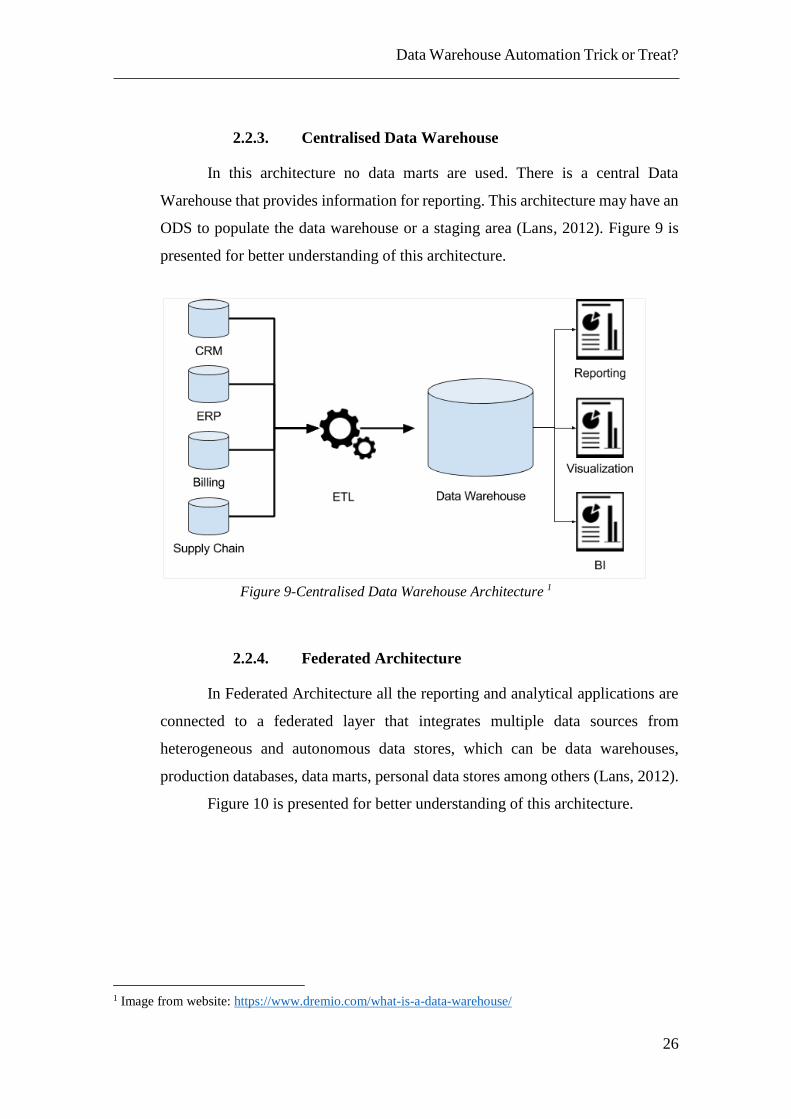
2.2.3. Centralised Data Warehouse
In this architecture no data marts are used. There is a central Data
Warehouse that provides information for reporting. This architecture may have an
ODS to populate the data warehouse or a staging area (Lans, 2012). Figure 9 is
presented for better understanding of this architecture.
Figure 9-Centralised Data Warehouse Architecture 1
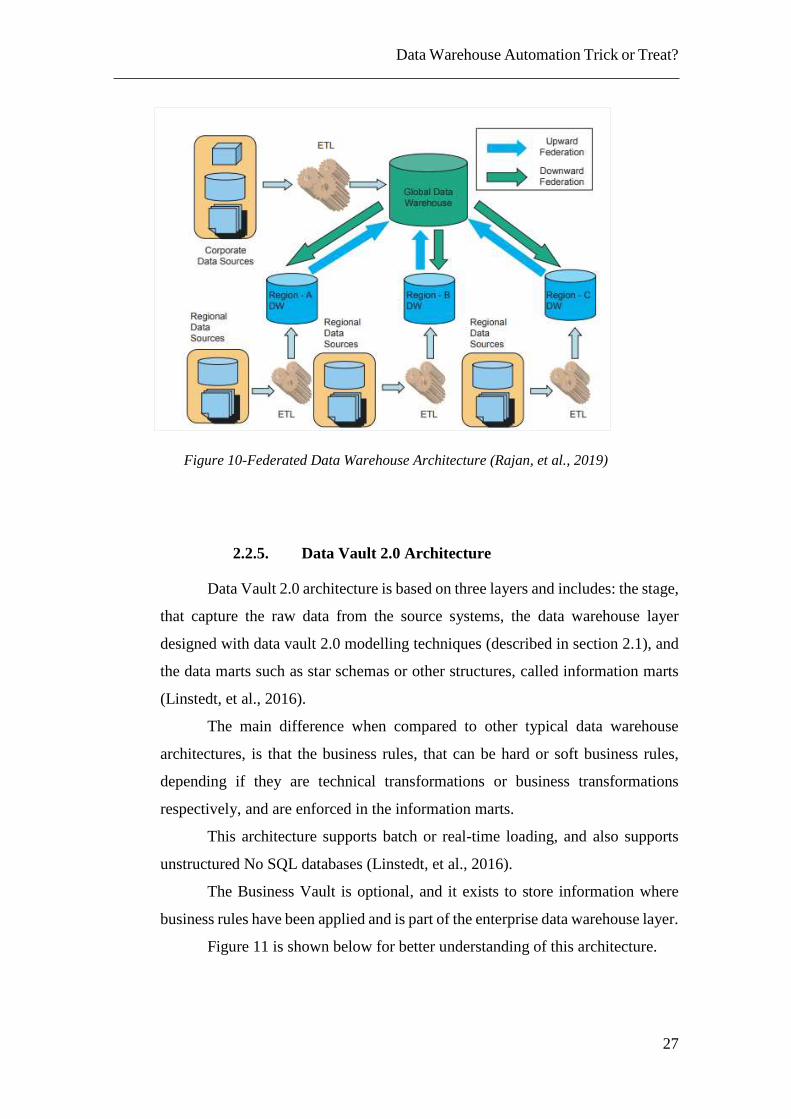
2.2.4. Federated Architecture
In Federated Architecture all the reporting and analytical applications are
connected to a federated layer that integrates multiple data sources from
heterogeneous and autonomous data stores, which can be data warehouses,
production databases, data marts, personal data stores among others (Lans, 2012).
Figure 10 is presented for better understanding of this architecture.
1 Image from website: https://www.dremio.com/what-is-a-data-warehouse/
Data Warehouse Automation Trick or Treat?
27
Figure 10-Federated Data Warehouse Architecture (Rajan, et al., 2019)
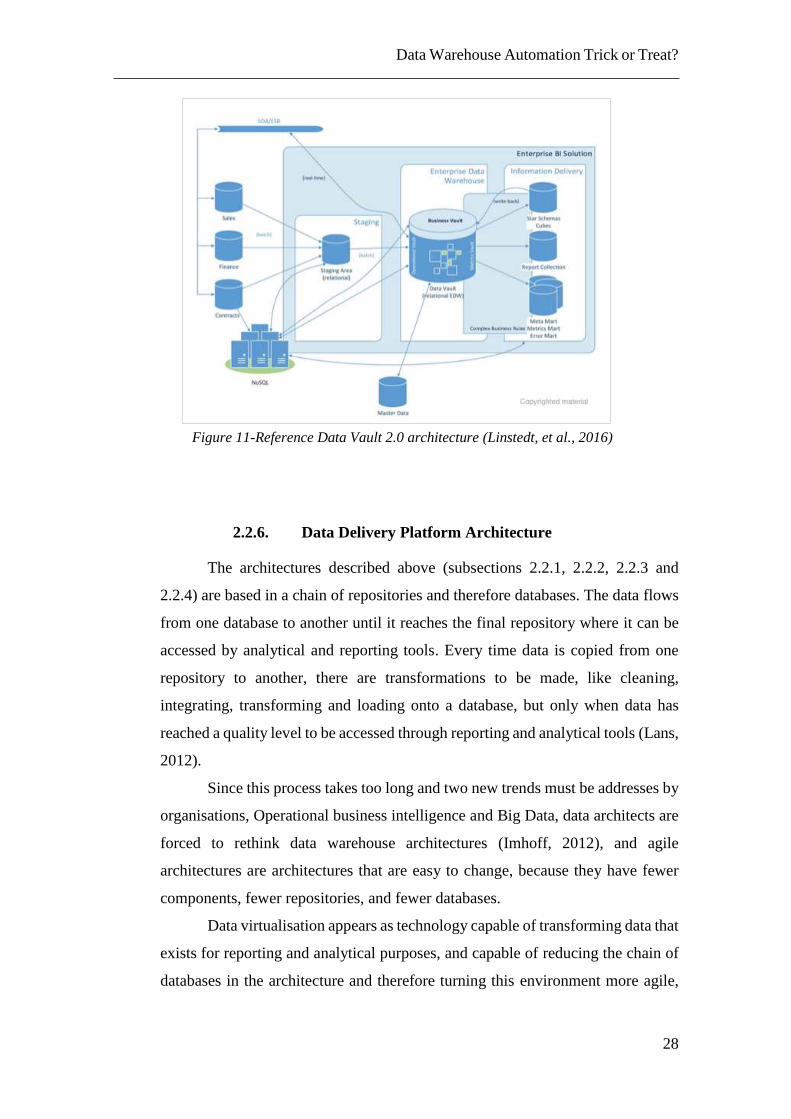
2.2.5. Data Vault 2.0 Architecture
Data Vault 2.0 architecture is based on three layers and includes: the stage,
that capture the raw data from the source systems, the data warehouse layer
designed with data vault 2.0 modelling techniques (described in section 2.1), and
the data marts such as star schemas or other structures, called information marts
(Linstedt, et al., 2016).
The main difference when compared to other typical data warehouse
architectures, is that the business rules, that can be hard or soft business rules,
depending if they are technical transformations or business transformations
respectively, and are enforced in the information marts.
This architecture supports batch or real-time loading, and also supports
unstructured No SQL databases (Linstedt, et al., 2016).
The Business Vault is optional, and it exists to store information where
business rules have been applied and is part of the enterprise data warehouse layer.
Figure 11 is shown below for better understanding of this architecture.
Data Warehouse Automation Trick or Treat?
28
2.2.6. Data Delivery Platform Architecture
The architectures described above (subsections 2.2.1, 2.2.2, 2.2.3 and
2.2.4) are based in a chain of repositories and therefore databases. The data flows
from one database to another until it reaches the final repository where it can be
accessed by analytical and reporting tools. Every time data is copied from one
repository to another, there are transformations to be made, like cleaning,
integrating, transforming and loading onto a database, but only when data has
reached a quality level to be accessed through reporting and analytical tools (Lans,
2012).
Since this process takes too long and two new trends must be addresses by
organisations, Operational business intelligence and Big Data, data architects are
forced to rethink data warehouse architectures (Imhoff, 2012), and agile
architectures are architectures that are easy to change, because they have fewer
components, fewer repositories, and fewer databases.
Data virtualisation appears as technology capable of transforming data that
exists for reporting and analytical purposes, and capable of reducing the chain of
databases in the architecture and therefore turning this environment more agile,
Figure 11-Reference Data Vault 2.0 architecture (Linstedt, et al., 2016)
Data Warehouse Automation Trick or Treat?
29
meeting the expectations of organisations, simple and agile architectures (Lans,
2012).
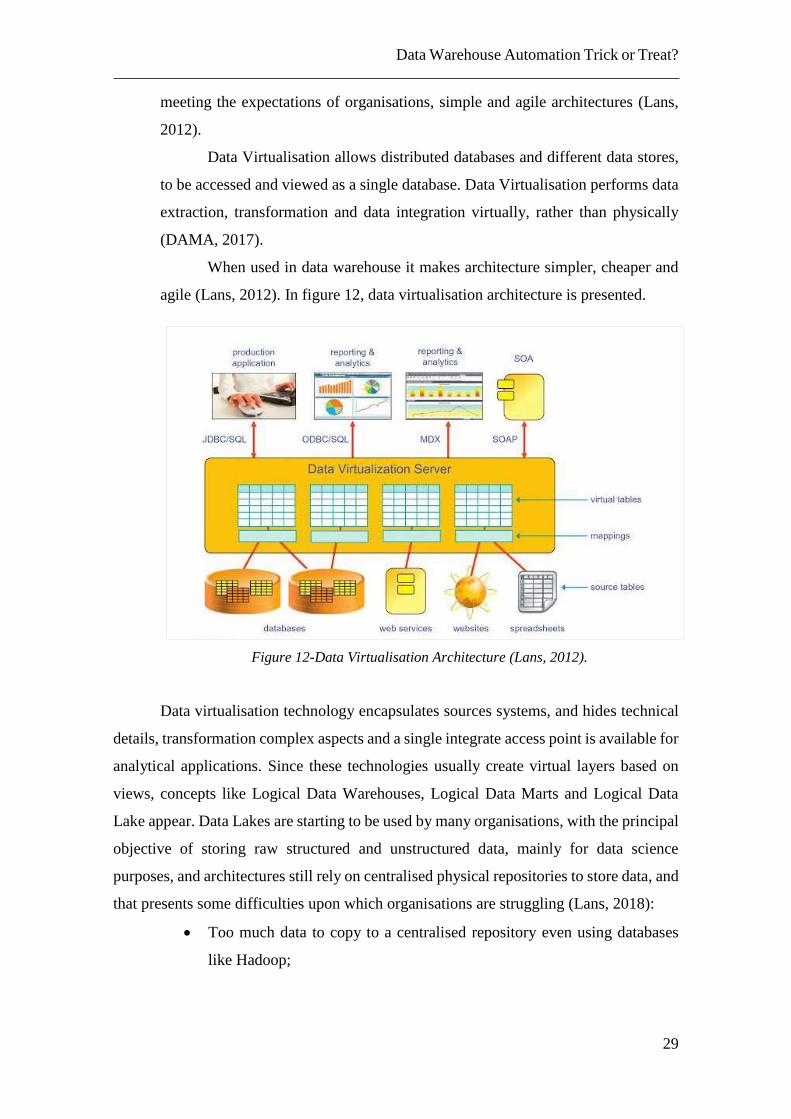
Data Virtualisation allows distributed databases and different data stores,
to be accessed and viewed as a single database. Data Virtualisation performs data
extraction, transformation and data integration virtually, rather than physically
(DAMA, 2017).
When used in data warehouse it makes architecture simpler, cheaper and
agile (Lans, 2012). In figure 12, data virtualisation architecture is presented.
Figure 12-Data Virtualisation Architecture (Lans, 2012).
Data virtualisation technology encapsulates sources systems, and hides technical
details, transformation complex aspects and a single integrate access point is available for
analytical applications. Since these technologies usually create virtual layers based on
views, concepts like Logical Data Warehouses, Logical Data Marts and Logical Data
Lake appear. Data Lakes are starting to be used by many organisations, with the principal
objective of storing raw structured and unstructured data, mainly for data science
purposes, and architectures still rely on centralised physical repositories to store data, and
that presents some difficulties upon which organisations are struggling (Lans, 2018):
Too much data to copy to a centralised repository even using databases
like Hadoop;
Data Warehouse Automation Trick or Treat?
30
Data Privacy restrictions, like General Data Protection Regulation
(GDPR) from United Europe (UE), may restrict the copy of data;
Metadata is key to describe the data that may be missing after copying;
Some data needs to be periodically refreshed;
Data Scientists spend too much tome with complex ETL, but much more
time with the “T” part of the ETL processes, because in the data lake, data
is in its raw form, so they spend most of the time with data preparation.
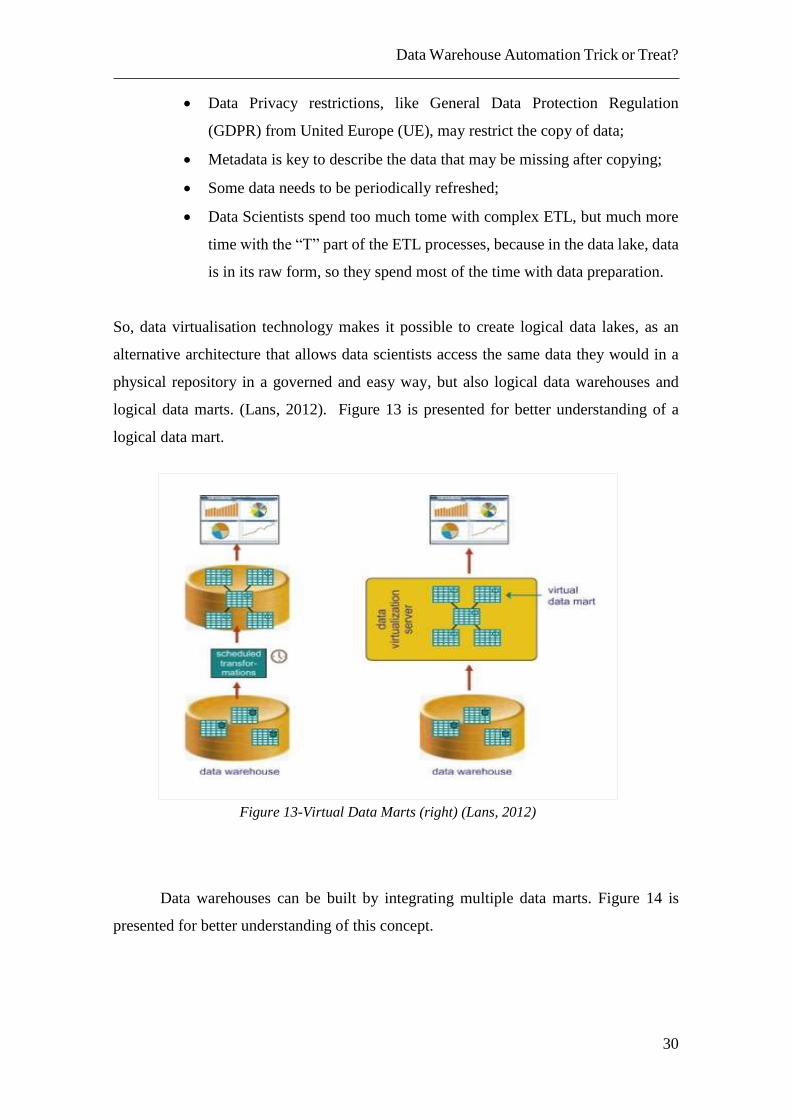
So, data virtualisation technology makes it possible to create logical data lakes, as an
alternative architecture that allows data scientists access the same data they would in a
physical repository in a governed and easy way, but also logical data warehouses and
logical data marts. (Lans, 2012). Figure 13 is presented for better understanding of a
logical data mart.
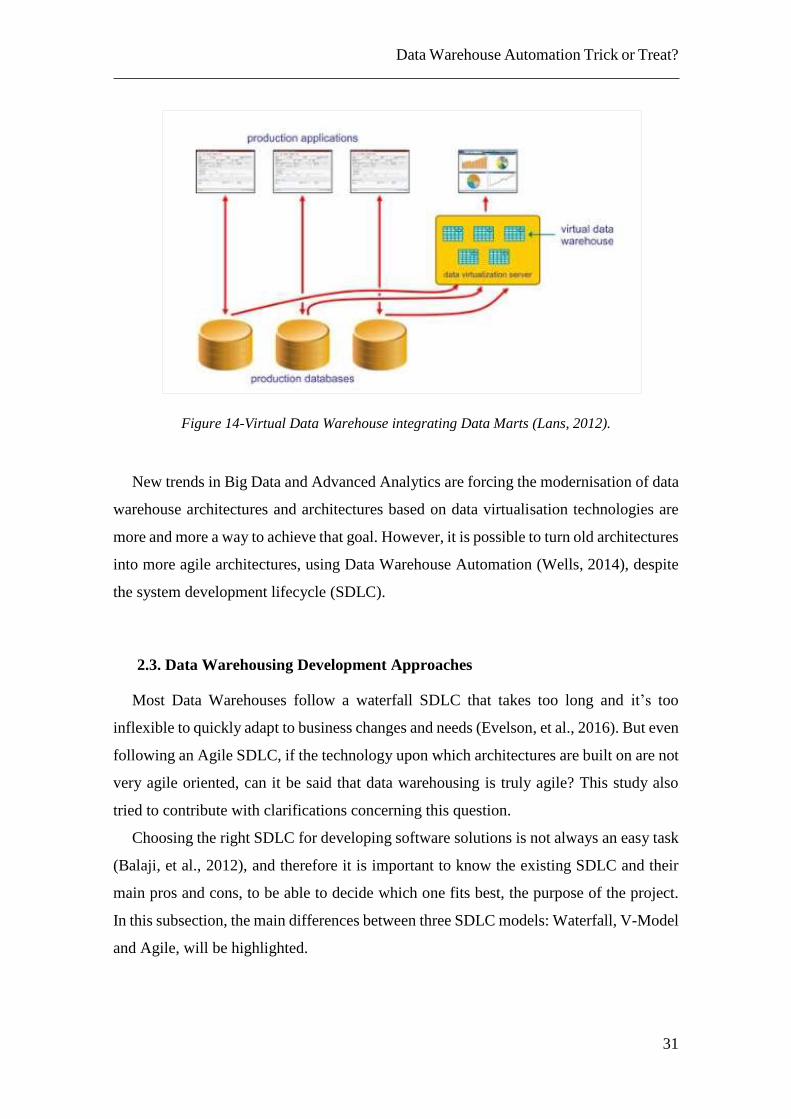
Data warehouses can be built by integrating multiple data marts. Figure 14 is
presented for better understanding of this concept.
Figure 13-Virtual Data Marts (right) (Lans, 2012)
Data Warehouse Automation Trick or Treat?
31
Figure 14-Virtual Data Warehouse integrating Data Marts (Lans, 2012).
New trends in Big Data and Advanced Analytics are forcing the modernisation of data
warehouse architectures and architectures based on data virtualisation technologies are
more and more a way to achieve that goal. However, it is possible to turn old architectures
into more agile architectures, using Data Warehouse Automation (Wells, 2014), despite
the system development lifecycle (SDLC).
2.3. Data Warehousing Development Approaches
Most Data Warehouses follow a waterfall SDLC that takes too long and it’s too
inflexible to quickly adapt to business changes and needs (Evelson, et al., 2016). But even
following an Agile SDLC, if the technology upon which architectures are built on are not
very agile oriented, can it be said that data warehousing is truly agile? This study also
tried to contribute with clarifications concerning this question.
Choosing the right SDLC for developing software solutions is not always an easy task
(Balaji, et al., 2012), and therefore it is important to know the existing SDLC and their
main pros and cons, to be able to decide which one fits best, the purpose of the project.
In this subsection, the main differences between three SDLC models: Waterfall, V-Model
and Agile, will be highlighted.
Data Warehouse Automation Trick or Treat?
32
2.3.1. Waterfall Model
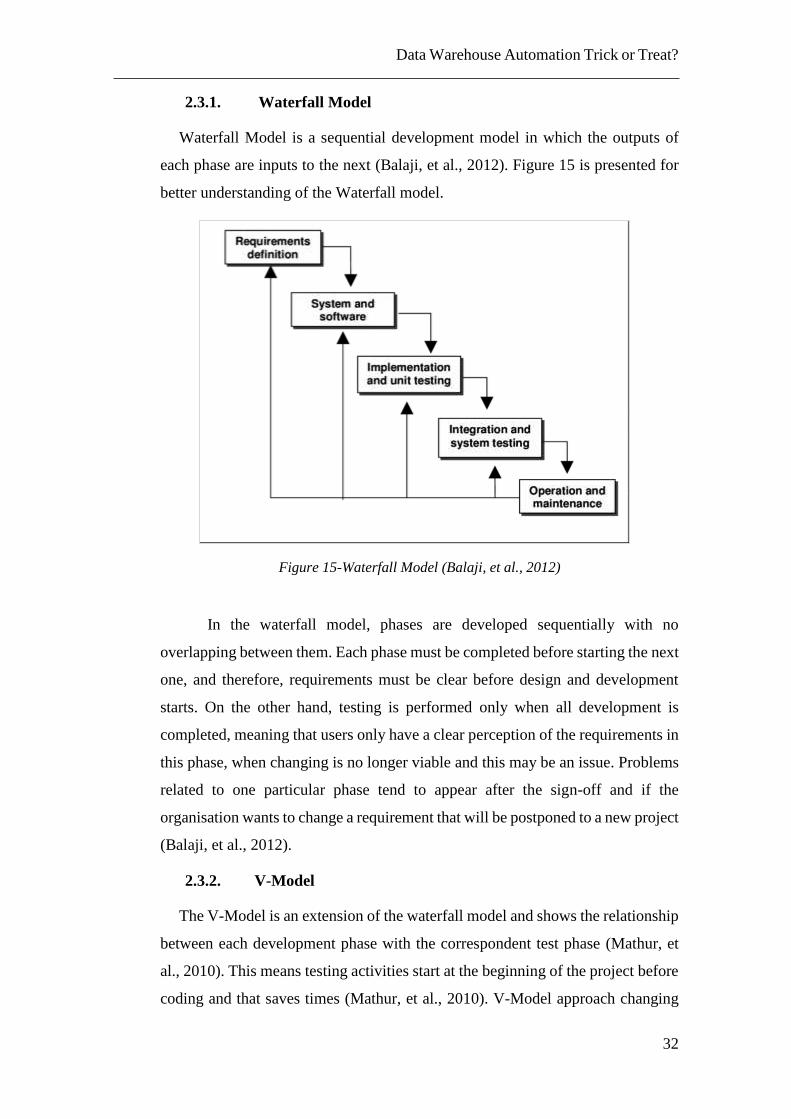
Waterfall Model is a sequential development model in which the outputs of
each phase are inputs to the next (Balaji, et al., 2012). Figure 15 is presented for
better understanding of the Waterfall model.
Figure 15-Waterfall Model (Balaji, et al., 2012)
In the waterfall model, phases are developed sequentially with no
overlapping between them. Each phase must be completed before starting the next
one, and therefore, requirements must be clear before design and development
starts. On the other hand, testing is performed only when all development is
completed, meaning that users only have a clear perception of the requirements in
this phase, when changing is no longer viable and this may be an issue. Problems
related to one particular phase tend to appear after the sign-off and if the
organisation wants to change a requirement that will be postponed to a new project
(Balaji, et al., 2012).
2.3.2. V-Model
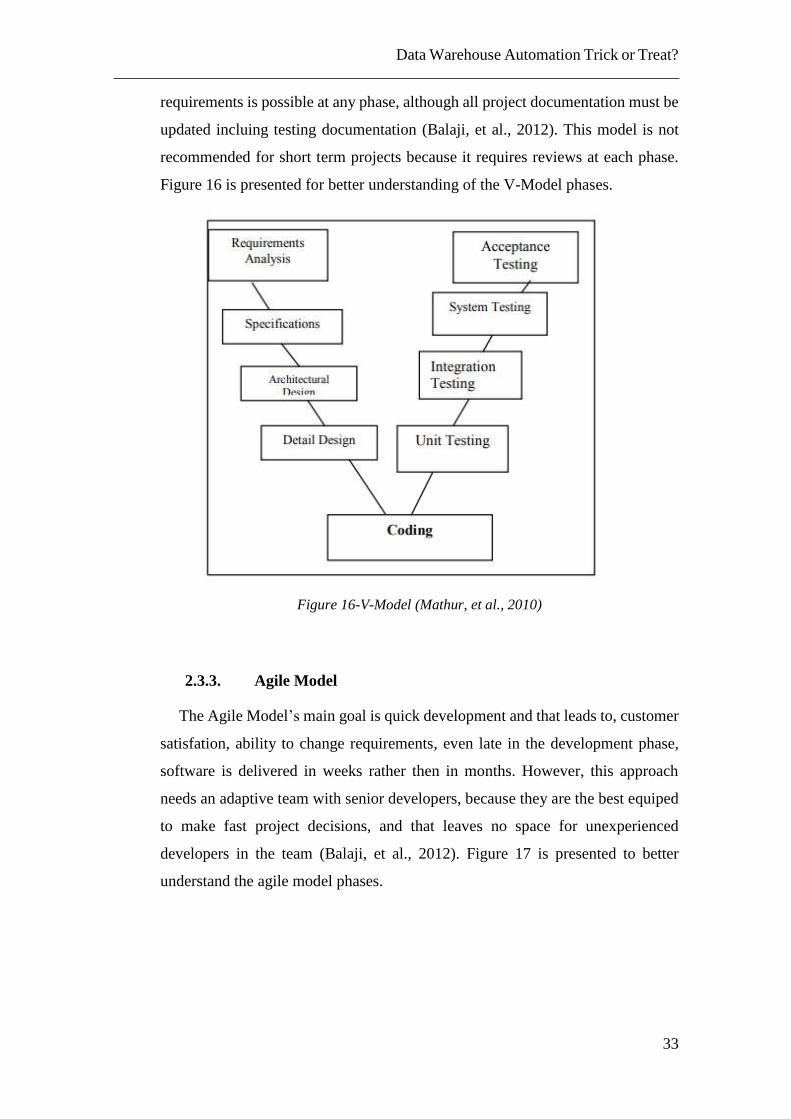
The V-Model is an extension of the waterfall model and shows the relationship
between each development phase with the correspondent test phase (Mathur, et
al., 2010). This means testing activities start at the beginning of the project before
coding and that saves times (Mathur, et al., 2010). V-Model approach changing
Data Warehouse Automation Trick or Treat?
33
requirements is possible at any phase, although all project documentation must be
updated incluing testing documentation (Balaji, et al., 2012). This model is not
recommended for short term projects because it requires reviews at each phase.
Figure 16 is presented for better understanding of the V-Model phases.
Figure 16-V-Model (Mathur, et al., 2010)
2.3.3. Agile Model
The Agile Model’s main goal is quick development and that leads to, customer
satisfation, ability to change requirements, even late in the development phase,
software is delivered in weeks rather then in months. However, this approach
needs an adaptive team with senior developers, because they are the best equiped
to make fast project decisions, and that leaves no space for unexperienced
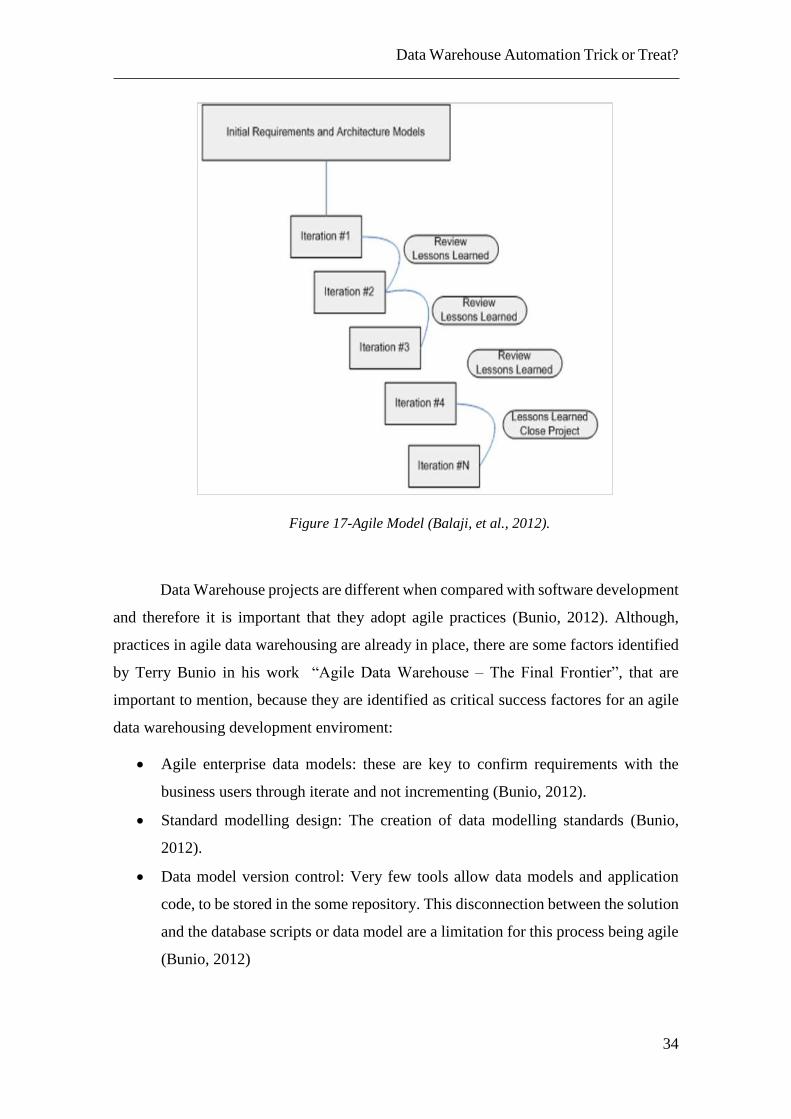
developers in the team (Balaji, et al., 2012). Figure 17 is presented to better
understand the agile model phases.
Data Warehouse Automation Trick or Treat?
34
Figure 17-Agile Model (Balaji, et al., 2012).
Data Warehouse projects are different when compared with software development
and therefore it is important that they adopt agile practices (Bunio, 2012). Although,
practices in agile data warehousing are already in place, there are some factors identified
by Terry Bunio in his work “Agile Data Warehouse – The Final Frontier”, that are
important to mention, because they are identified as critical success factores for an agile
data warehousing development enviroment:
Agile enterprise data models: these are key to confirm requirements with the
business users through iterate and not incrementing (Bunio, 2012).
Standard modelling design: The creation of data modelling standards (Bunio,
2012).
Data model version control: Very few tools allow data models and application
code, to be stored in the some repository. This disconnection between the solution
and the database scripts or data model are a limitation for this process being agile
(Bunio, 2012)
Data Warehouse Automation Trick or Treat?
35
Integrate and automate database re-factoring: the ability to adapt to all database
changes and schedule database re-factoring and changes between major releases.
Database continuous integration: Data models and database fully integrated into
continuous integration environment. Database, data population and testing as part
of regular rebuild software (Bunio, 2012).
These factors, considered critical for an agile development in data warehousing identified
in 2012, are included in data warehouse automation tools, and so, this study will analyse
if DWA are a trick or treat concerning agile development for data warehousing.
2.4. Data Warehouse Automation
Data Warehouse Automation (DWA) is the process of automating that can be
automated in the data warehouse lifecycle using Data Warehouse Automation tools
(Timextender, 2019).
Data warehouse automation provides an integrated development environment that
eliminates much of the manual effort to design, develop, deploy, and operate a data
warehouse. DWA tools enables collaboration between developers and business users
around designs and iteratively creates data warehouses components such as data marts
(Ekerson, 2015).
“(…) Metadata provide the foundation upon which we build the warehouse” (Kimball,
1998). Data warehouse automation tools are also called “metadata-generated analytics”,
because they are metadata driven tools that automatically generate data warehouses and
apply best practices for data warehouse design embedded in the technology (Evelson, et
al., 2016).
Data Warehouse automation automates more than ETL processes, it automates the data
infrastructure lifecycle (WhereScape, 2019a): design, development, operations,
maintenance, and change management (Wells, 2014).
The data infrastructure lifecycle is shown in Figure 15, and all of these steps can
be automated with these tools.
The adoption of data warehouse automation implies a change in mindset. The
main goal of using this approach is fast and frequently advanced with an interactive
development, enabling business users to see and ‘touch’ the data in early stages of the
development, helping business users to have a clear perception of the business
Data Warehouse Automation Trick or Treat?
36
requirements that are needed for the enterprise. This approach is aligned with agile best
practices, but it is not mandatory to use agile practices in order to use data warehouse
automation. Speed, quality and cost saving can be achieved without going agile in the
implementation (Wells, 2014).
Despite the importance of data warehouses, these are also in a fragile position
being criticised by business managers and big data enthusiastics, as being too slow, costly
and inflexible. Data warehouse automation tools are the solution to put traditional data
warehouses aligned with enterprise stakeholders’ expectations again (Ekerson, 2015).
2.4.1. Data Warehouse Automation Benefits
Design, Build and Operate. These tools convert requirements and design into
metadata which are used to create physical databases, transformations and manage
workflows. DWA tools, as best practices embedded in the industry, like slowly changing
dimensions and surrogate keys management. DWA automatically generate data
warehouses schema (3NF, star schema, snowflake, data vault), staging areas, data marts,
OLAP Cubes, Indexes, business metadata for intelligence tools). These tools also
generate automatically the project documentation. With DWA there is no need for ETL
tools. (Ekerson, 2015). Operating a data warehouse includes a set of activities:
Sequencing, Dependencies, Scheduling, Execution, Verification, Validation, and Error
Handling. Automation supports data warehouse operations with features and functions
for: Scheduling, Documentation and Metadata, Managed Environments and Validation
Testing (Myers, 2017).
Standardised development. DWA tools impose a standard development method
as they work with ‘templates’ to generate code. These characteristics improve quality and
consistency and ensure that all processes are generated the same way. They also use
version control. (Ekerson, 2015)
Change Management. DWA tools allow to make impact analysis before making
a change to the design. This feature enables it to make changes very quickly and adapt
the data warehouse to business changes in a fast way. (Ekerson, 2015)
Roll-back. DWA tools log everything that is done in the environment, and that
allows to roll-back the data warehouse to a previous version by pushing a bottom
(Ekerson, 2015).
Data Warehouse Automation Trick or Treat?
37
Identifying and using patterns are the foundation for data warehouse automation.
The design patterns of a data warehouse, define standards and best practices chosen by
the organisation, based on current and future needs of an organisation. Data Warehouse
Automation Technologies use these standards to achieve agility in design and
development, but also ensure compliance and consistency of the Data Warehouse system.
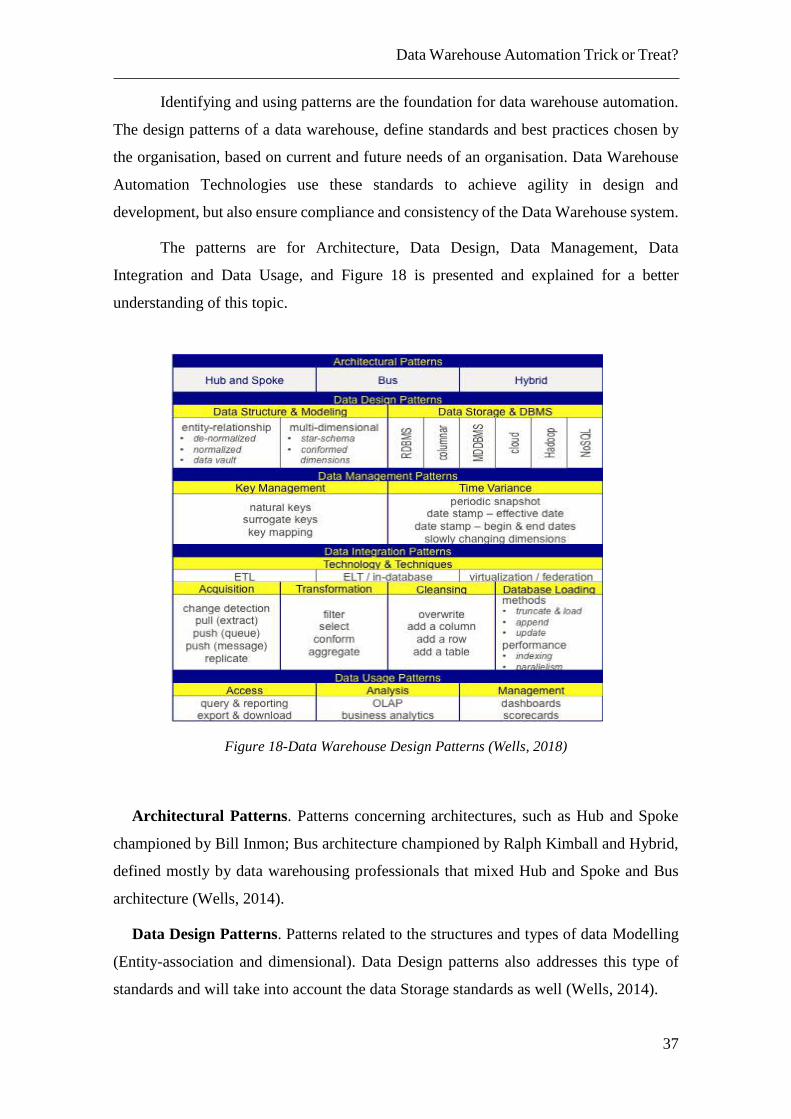
The patterns are for Architecture, Data Design, Data Management, Data
Integration and Data Usage, and Figure 18 is presented and explained for a better
understanding of this topic.
Figure 18-Data Warehouse Design Patterns (Wells, 2018)
Architectural Patterns. Patterns concerning architectures, such as Hub and Spoke
championed by Bill Inmon; Bus architecture championed by Ralph Kimball and Hybrid,
defined mostly by data warehousing professionals that mixed Hub and Spoke and Bus
architecture (Wells, 2014).
Data Design Patterns. Patterns related to the structures and types of data Modelling
(Entity-association and dimensional). Data Design patterns also addresses this type of
standards and will take into account the data Storage standards as well (Wells, 2014).
Data Warehouse Automation Trick or Treat?
38
Data Management Patterns. Patterns related to Key management (natural vs.
surrogate keys), with a variation of time (snapshots, date stamps, and slowly changing
dimensions) (Wells, 2014).
Data Integration Patterns. Includes technologies and tools related to information
integration: ETL, ETL/database, data Virtualisation/Federation. It is also part of this topic
to address issues related to the extraction, cleaning, transformation and Load into the
databases (Wells, 2014).
Data Usage Patterns. It is very important to think about how the information will be
consumed by the organisation when building a Data Warehousing system. Information
should be delivered to end users in the format that best suits them for the decision-making
process, for operational, tactical or strategic decisions (Wells, 2014).
These patterns are embedded with architecture to build reusable components that
are captured and described as metadata.
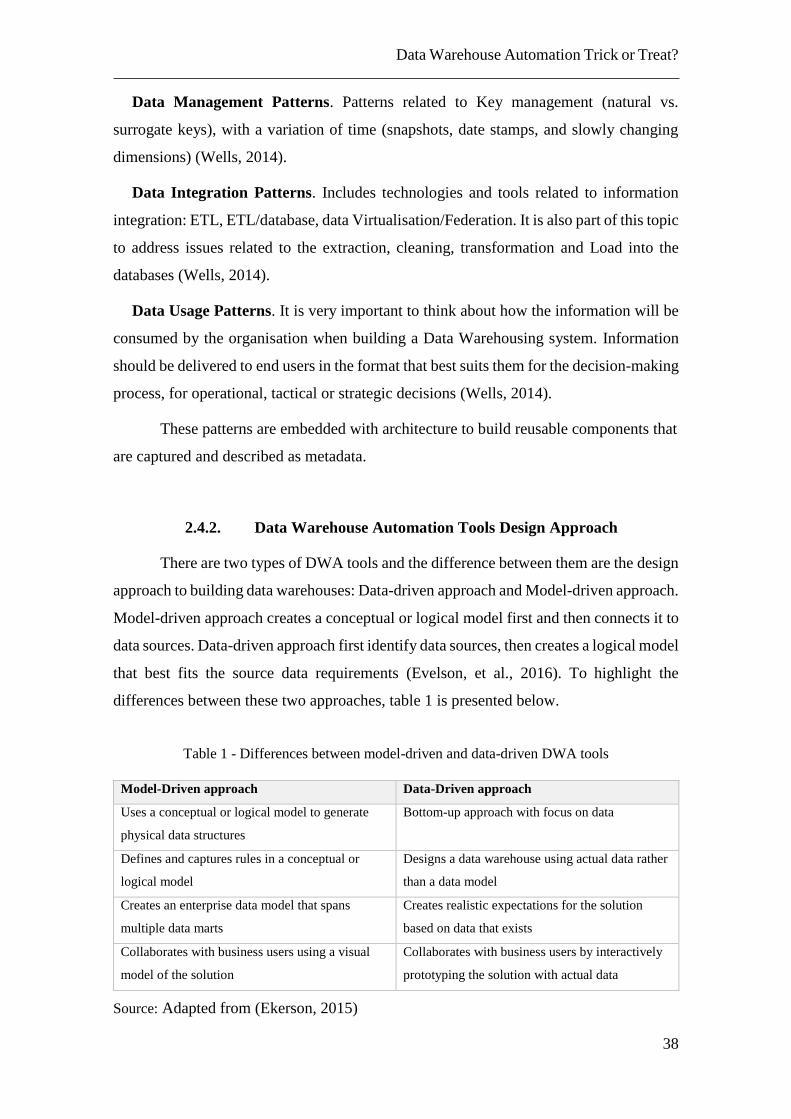
2.4.2. Data Warehouse Automation Tools Design Approach
There are two types of DWA tools and the difference between them are the design
approach to building data warehouses: Data-driven approach and Model-driven approach.
Model-driven approach creates a conceptual or logical model first and then connects it to
data sources. Data-driven approach first identify data sources, then creates a logical model
that best fits the source data requirements (Evelson, et al., 2016). To highlight the
differences between these two approaches, table 1 is presented below.
Table 1 - Differences between model-driven and data-driven DWA tools
Model-Driven approach Data-Driven approach
Uses a conceptual or logical model to generate
physical data structures
Bottom-up approach with focus on data
Defines and captures rules in a conceptual or
logical model
Designs a data warehouse using actual data rather
than a data model
Creates an enterprise data model that spans
multiple data marts
Creates realistic expectations for the solution
based on data that exists
Collaborates with business users using a visual
model of the solution
Collaborates with business users by interactively
prototyping the solution with actual data
Source: Adapted from (Ekerson, 2015)
Data Warehouse Automation Trick or Treat?
39
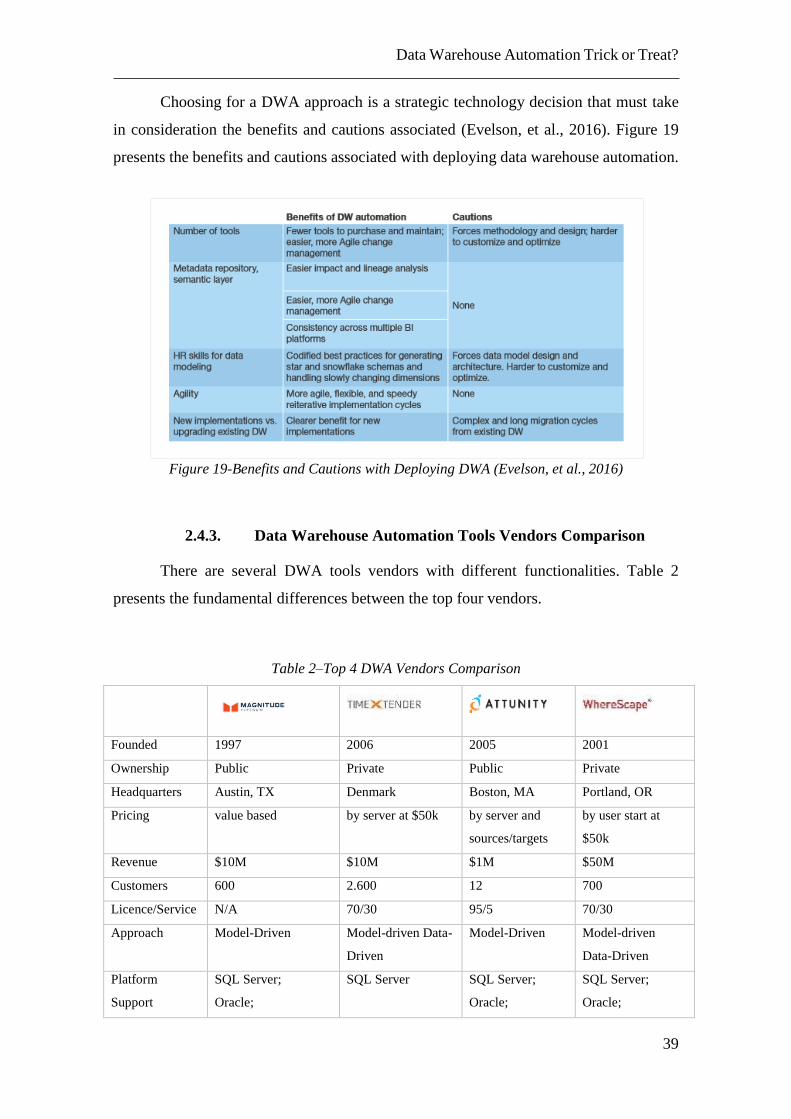
Choosing for a DWA approach is a strategic technology decision that must take
in consideration the benefits and cautions associated (Evelson, et al., 2016). Figure 19
presents the benefits and cautions associated with deploying data warehouse automation.
Figure 19-Benefits and Cautions with Deploying DWA (Evelson, et al., 2016)
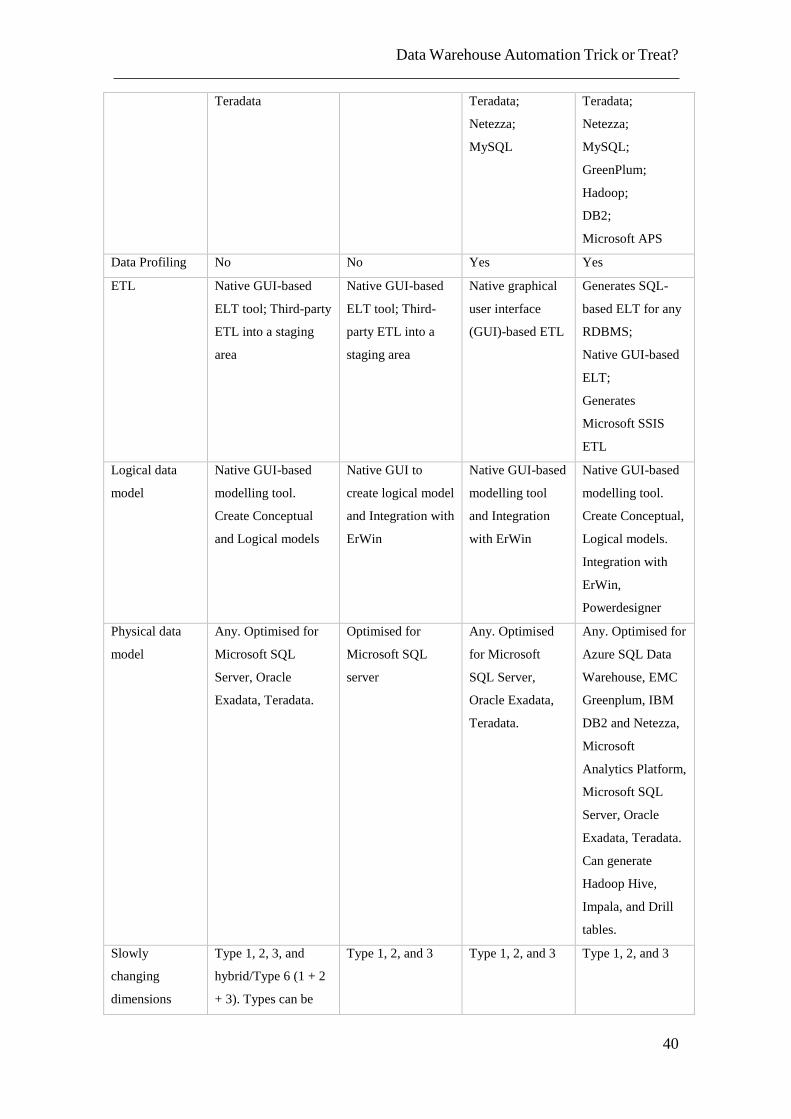
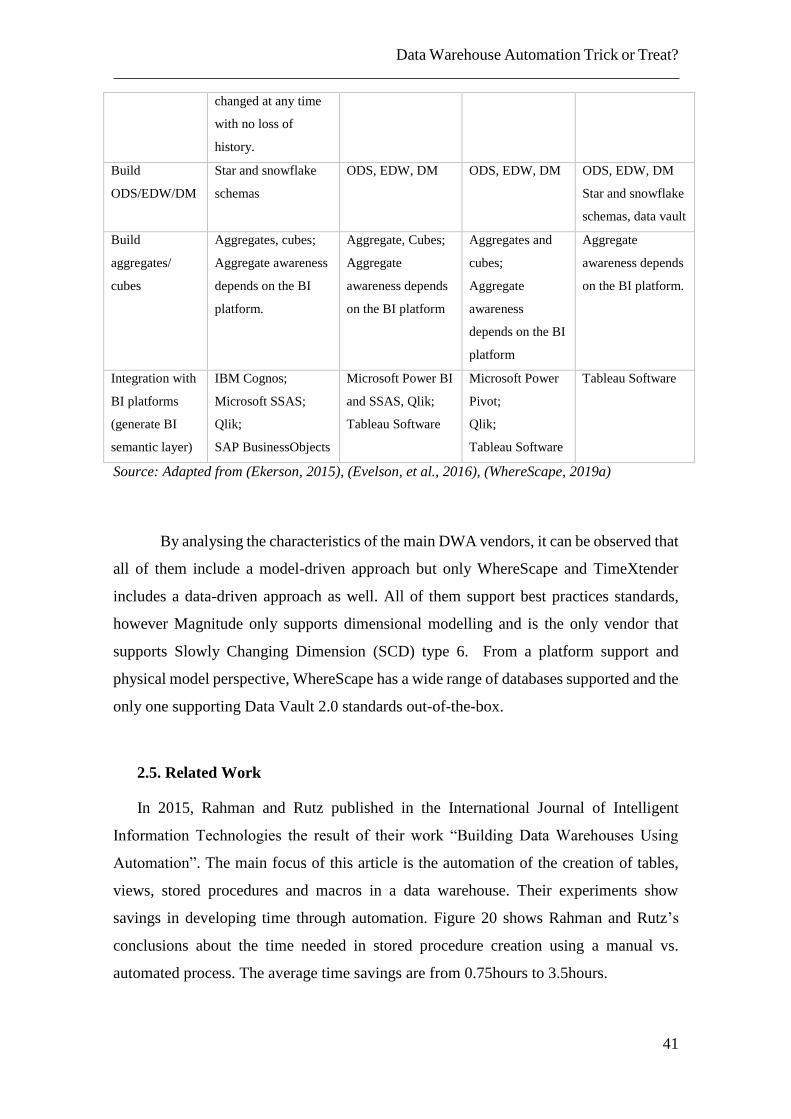
2.4.3. Data Warehouse Automation Tools Vendors Comparison
There are several DWA tools vendors with different functionalities. Table 2
presents the fundamental differences between the top four vendors.
Table 2–Top 4 DWA Vendors Comparison
Founded 1997 2006 2005 2001
Ownership Public Private Public Private
Headquarters Austin, TX Denmark Boston, MA Portland, OR
Pricing value based by server at $50k by server and
sources/targets
by user start at
$50k
Revenue $10M $10M $1M $50M
Customers 600 2.600 12 700
Licence/Service N/A 70/30 95/5 70/30
Approach Model-Driven Model-driven Data-
Driven
Model-Driven Model-driven
Data-Driven
Platform
Support
SQL Server;
Oracle;
SQL Server SQL Server;
Oracle;
SQL Server;
Oracle;
Data Warehouse Automation Trick or Treat?
40
Teradata Teradata;
Netezza;
MySQL
Teradata;
Netezza;
MySQL;
GreenPlum;
Hadoop;
DB2;
Microsoft APS
Data Profiling No No Yes Yes
ETL Native GUI-based
ELT tool; Third-party
ETL into a staging
area
Native GUI-based
ELT tool; Third-
party ETL into a
staging area
Native graphical
user interface
(GUI)-based ETL
Generates SQL-
based ELT for any
RDBMS;
Native GUI-based
ELT;
Generates
Microsoft SSIS
ETL
Logical data
model
Native GUI-based
modelling tool.
Create Conceptual
and Logical models
Native GUI to
create logical model
and Integration with
ErWin
Native GUI-based
modelling tool
and Integration
with ErWin
Native GUI-based
modelling tool.
Create Conceptual,
Logical models.
Integration with
ErWin,
Powerdesigner
Physical data
model
Any. Optimised for
Microsoft SQL
Server, Oracle
Exadata, Teradata.
Optimised for
Microsoft SQL
server
Any. Optimised
for Microsoft
SQL Server,
Oracle Exadata,
Teradata.
Any. Optimised for
Azure SQL Data
Warehouse, EMC
Greenplum, IBM
DB2 and Netezza,
Microsoft
Analytics Platform,
Microsoft SQL
Server, Oracle
Exadata, Teradata.
Can generate
Hadoop Hive,
Impala, and Drill
tables.
Slowly
changing
dimensions
Type 1, 2, 3, and
hybrid/Type 6 (1 + 2
+ 3). Types can be
Type 1, 2, and 3 Type 1, 2, and 3 Type 1, 2, and 3
Data Warehouse Automation Trick or Treat?
41
changed at any time
with no loss of
history.
Build
ODS/EDW/DM
Star and snowflake
schemas
ODS, EDW, DM ODS, EDW, DM ODS, EDW, DM
Star and snowflake
schemas, data vault
Build
aggregates/
cubes
Aggregates, cubes;
Aggregate awareness
depends on the BI
platform.
Aggregate, Cubes;
Aggregate
awareness depends
on the BI platform
Aggregates and
cubes;
Aggregate
awareness
depends on the BI
platform
Aggregate
awareness depends
on the BI platform.
Integration with
BI platforms
(generate BI
semantic layer)
IBM Cognos;
Microsoft SSAS;
Qlik;
SAP BusinessObjects
Microsoft Power BI
and SSAS, Qlik;
Tableau Software
Microsoft Power
Pivot;
Qlik;
Tableau Software
Tableau Software
Source: Adapted from (Ekerson, 2015), (Evelson, et al., 2016), (WhereScape, 2019a)
By analysing the characteristics of the main DWA vendors, it can be observed that
all of them include a model-driven approach but only WhereScape and TimeXtender
includes a data-driven approach as well. All of them support best practices standards,
however Magnitude only supports dimensional modelling and is the only vendor that
supports Slowly Changing Dimension (SCD) type 6. From a platform support and
physical model perspective, WhereScape has a wide range of databases supported and the
only one supporting Data Vault 2.0 standards out-of-the-box.
2.5. Related Work
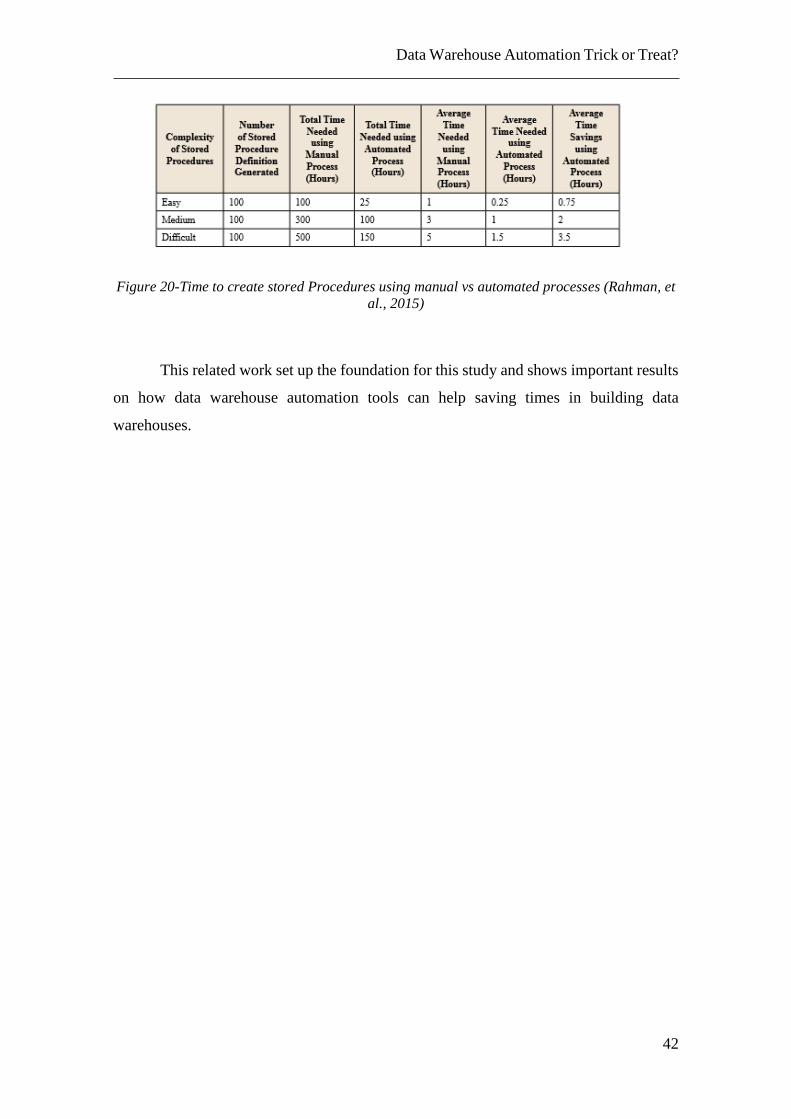
In 2015, Rahman and Rutz published in the International Journal of Intelligent
Information Technologies the result of their work “Building Data Warehouses Using
Automation”. The main focus of this article is the automation of the creation of tables,
views, stored procedures and macros in a data warehouse. Their experiments show
savings in developing time through automation. Figure 20 shows Rahman and Rutz’s
conclusions about the time needed in stored procedure creation using a manual vs.
automated process. The average time savings are from 0.75hours to 3.5hours.
Data Warehouse Automation Trick or Treat?
42
Figure 20-Time to create stored Procedures using manual vs automated processes (Rahman, et
al., 2015)
This related work set up the foundation for this study and shows important results
on how data warehouse automation tools can help saving times in building data
warehouses.
Data Warehouse Automation Trick or Treat?
43
Chapter 3–What Drives Data Warehouse Automation?
In order to respond to the research questions RQ1 (What are the drivers for the
adoption of data warehouse automation for an organisation?) and RQ2 (What are the
characteristics of companies that adopt data warehouse automation?), a survey was made
(see appendix A).
This research method was used to question individuals and collect data about the
drivers for data warehouse automation adoption and at the same time, collect data on the
characteristics of those companies.
The sample was composed by organisations that were already using DWA tools,
therefore, the universe of possible respondents is smaller, due to the specifications of this
type of solution since they are used by a subset of organisations that have DWS. From
the beginning it was expected to have respondents from countries outside Portugal, since
in Portugal this solution is not yet widely spread.
3.1. Survey Methodology
The chosen sampling process was sampling for convenience, and it is not possible
to generalise the results of this study. In April 2019, the invitation to fill in the survey was
posted online on LinkedIn and sent through a LinkedIn campaign to data professionals
that were involved in data warehouse automation implementations, asking them to
complete an online survey, and they were selected using the case studies available in the
following DWA vendor’s websites: Magnitude, Attunity, TimeXtender and WhereScape.
The survey collected responses from 19 respondents, and all of them answered 100% of
the questions.
The survey was structured with three major parts: 1) Questions on demographic
information; 2) Questions on drivers to be adopted and barriers of data warehouse
automation tools, and 3) Questions on the characteristics of data warehouse architecture
and SDLC models of respondents’ organisations.
The questionnaire was anonymous, but respondents had the option to fill in email and
company name. The surveys’ results were shared with 68% of the respondents, the ones
who expressed that choice.
Data Warehouse Automation Trick or Treat?
44
The questionnaire was built with the platform Google Forms2 and its structure can be
found in the appendix A. Google Forms was chosen because it was a very user-friendly
interface, thus providing an easy creation and management of questionnaires. Google
forms allows to create, distribute, control and handle the data collected easily. The results
of this survey cannot be generalised.
3.2. Organisations Demographics
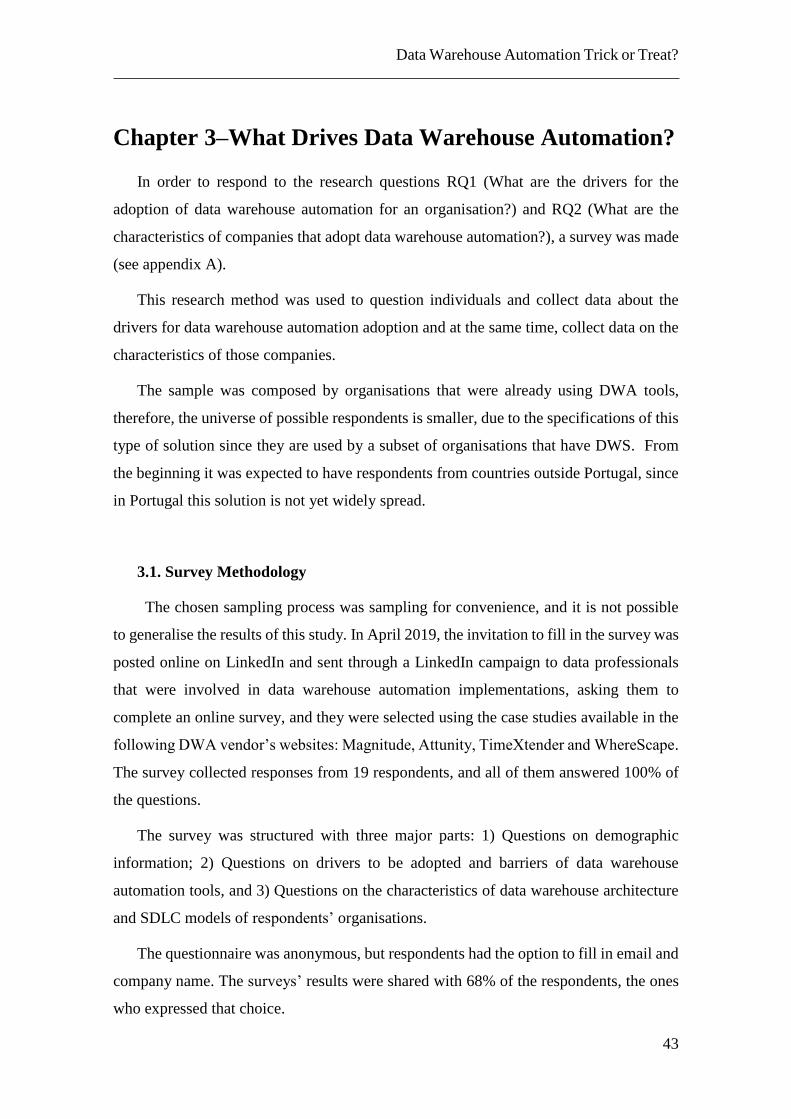
Respondents act in a variety of roles. The majority of survey respondents are data
warehousing professionals that implemented data warehouse automation tools (47.37%),
followed by IT Directors (21.05%) and Business Directors (10.53%). The
Finance/Accounting/Bank/Insurance (42.11%), Business services (21.05%), and
Manufacturer (15.79%) industries dominate the respondent population, followed by
Medical/Dental/Healthcare, Government and Consultancy (5.26%). Concerning the
number of employees maintaining the DWA, the majority of the respondents are
companies Under 10 employees (57.89%), followed by More than 100 (21.05%) and
between 10 – 49 employees (15.79%). Figure 21 is presented for better understanding.
2 Website of the platform: https://docs.google.com/forms/u/0/
Figure 21-Organisations Demographics: Industry, Position, Employees maintaining the DW
System
Data Warehouse Automation Trick or Treat?
45
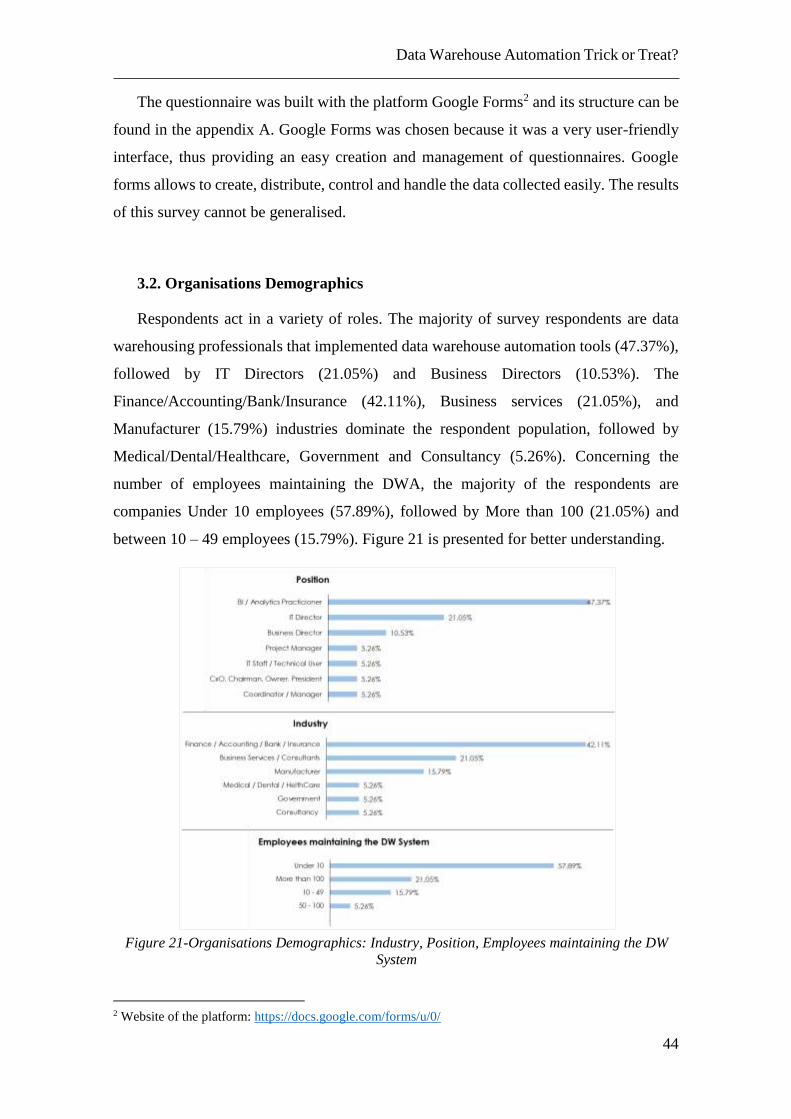
Most survey respondents reside in Europe (89.47%). Respondents come from
enterprises of all sizes, although companies whose revenue is Less than $50M dollars
(36.84%) and More than $1 Billion dollars (31.58%) dominate the respondent population,
followed by those whose revenue are between $100M - $499M dollars (15.76%). On the
other hand, concerning the number of employees, the majority of survey respondents were
companies with 10,000 or more employees (31.58%) and Under 100 employees
(26.32%), followed by those 100 - 499 and 1,000 – 4,999 (15.79%). Figure 22 is presented
for better understanding.
3.3. Drivers for Adoption of Data Warehouse Automation Tools
To understand which are the drivers for the adoption of Data Warehouse Automation
tools, three questions were asked to respondents, and to the question “Why the
organisation adopted a Data Warehouse Automation tool?”, the top three reasons
identified by respondents were that data warehousing projects were taking too long
Figure 22-Survey Demographics: Geography, Company Size, Number of Employees
Data Warehouse Automation Trick or Treat?
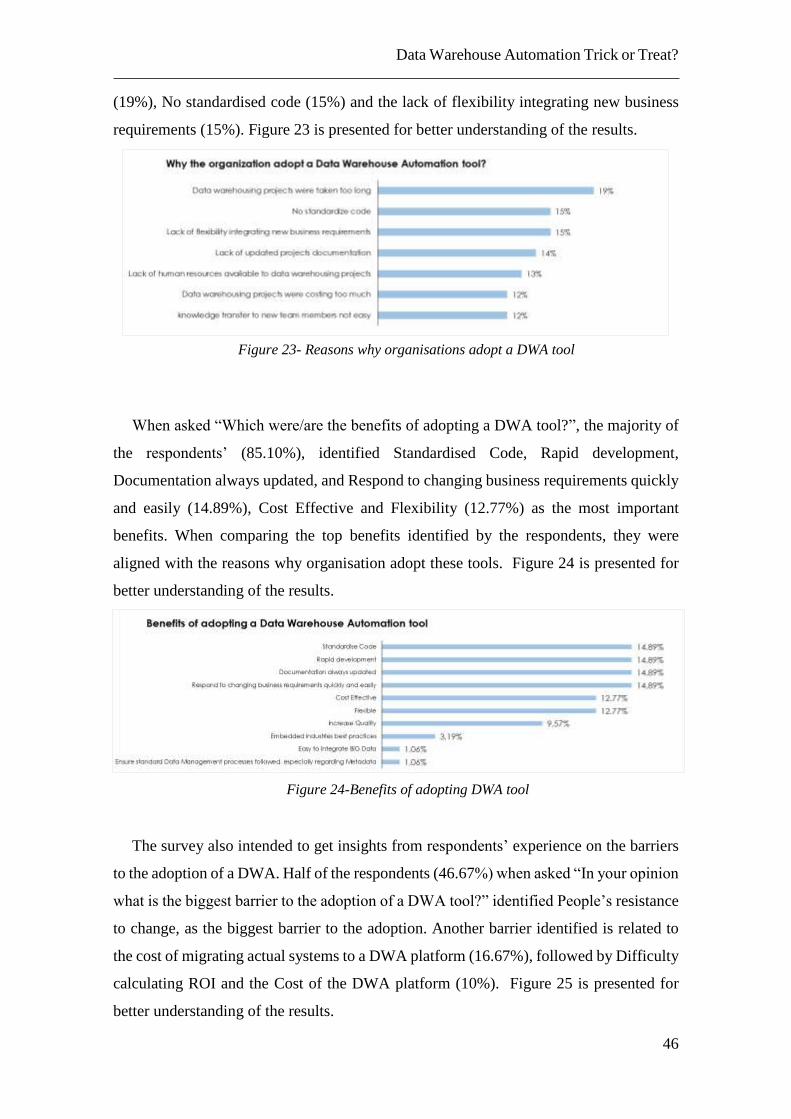
46
(19%), No standardised code (15%) and the lack of flexibility integrating new business
requirements (15%). Figure 23 is presented for better understanding of the results.
When asked “Which were/are the benefits of adopting a DWA tool?”, the majority of
the respondents’ (85.10%), identified Standardised Code, Rapid development,
Documentation always updated, and Respond to changing business requirements quickly
and easily (14.89%), Cost Effective and Flexibility (12.77%) as the most important
benefits. When comparing the top benefits identified by the respondents, they were
aligned with the reasons why organisation adopt these tools. Figure 24 is presented for
better understanding of the results.
The survey also intended to get insights from respondents’ experience on the barriers
to the adoption of a DWA. Half of the respondents (46.67%) when asked “In your opinion
what is the biggest barrier to the adoption of a DWA tool?” identified People’s resistance
to change, as the biggest barrier to the adoption. Another barrier identified is related to
the cost of migrating actual systems to a DWA platform (16.67%), followed by Difficulty
calculating ROI and the Cost of the DWA platform (10%). Figure 25 is presented for
better understanding of the results.
Figure 23- Reasons why organisations adopt a DWA tool
Figure 24-Benefits of adopting DWA tool
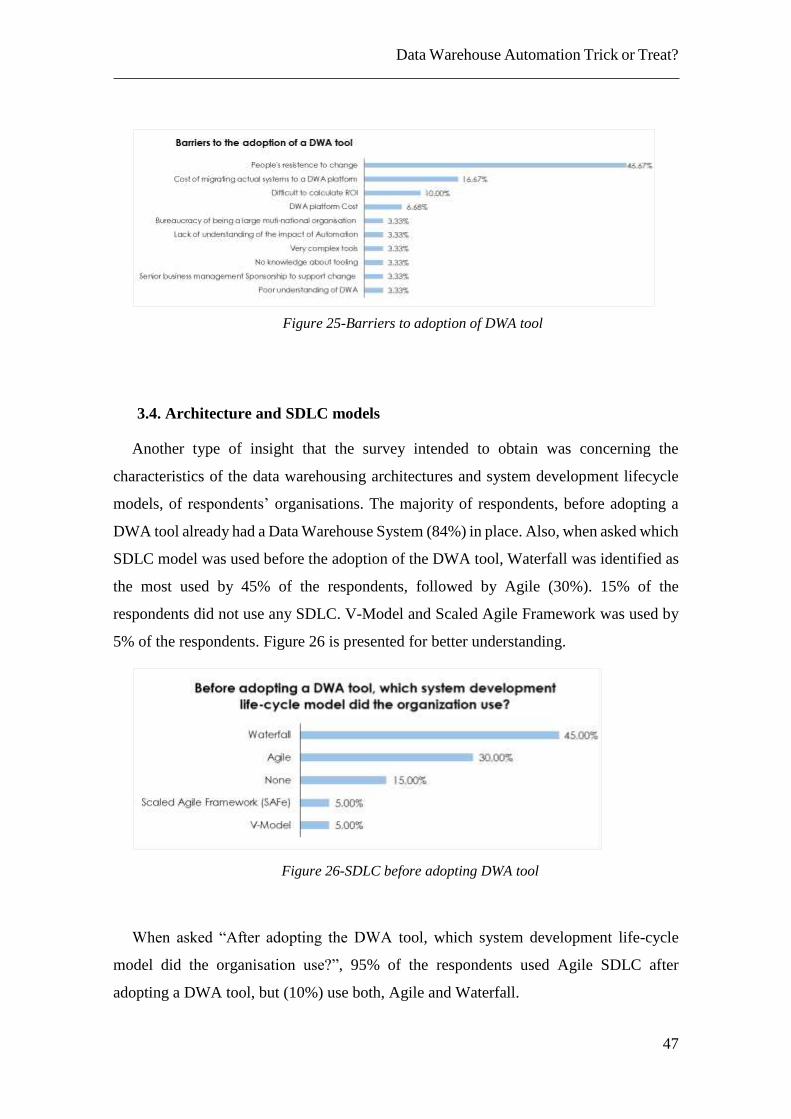
Data Warehouse Automation Trick or Treat?
47
3.4. Architecture and SDLC models
Another type of insight that the survey intended to obtain was concerning the
characteristics of the data warehousing architectures and system development lifecycle
models, of respondents’ organisations. The majority of respondents, before adopting a
DWA tool already had a Data Warehouse System (84%) in place. Also, when asked which
SDLC model was used before the adoption of the DWA tool, Waterfall was identified as
the most used by 45% of the respondents, followed by Agile (30%). 15% of the
respondents did not use any SDLC. V-Model and Scaled Agile Framework was used by
5% of the respondents. Figure 26 is presented for better understanding.
When asked “After adopting the DWA tool, which system development life-cycle
model did the organisation use?”, 95% of the respondents used Agile SDLC after
adopting a DWA tool, but (10%) use both, Agile and Waterfall.
Figure 26-SDLC before adopting DWA tool
Figure 25-Barriers to adoption of DWA tool
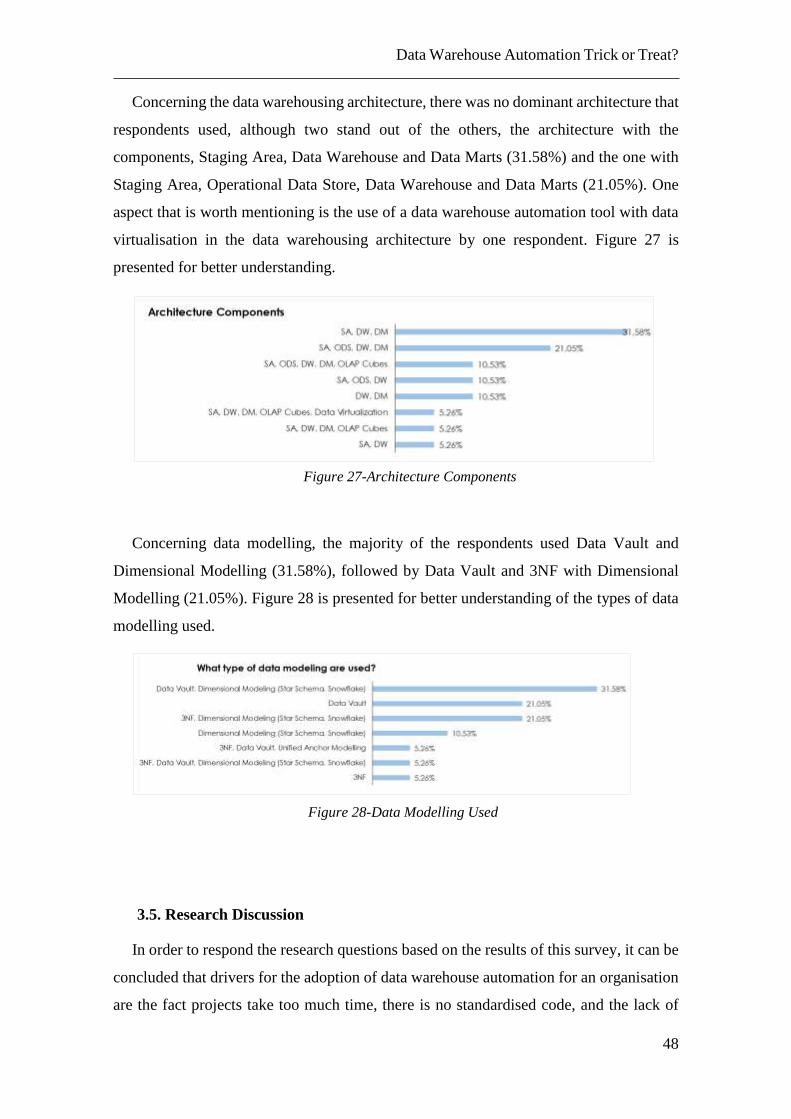
Data Warehouse Automation Trick or Treat?
48
Concerning the data warehousing architecture, there was no dominant architecture that
respondents used, although two stand out of the others, the architecture with the
components, Staging Area, Data Warehouse and Data Marts (31.58%) and the one with
Staging Area, Operational Data Store, Data Warehouse and Data Marts (21.05%). One
aspect that is worth mentioning is the use of a data warehouse automation tool with data
virtualisation in the data warehousing architecture by one respondent. Figure 27 is
presented for better understanding.
Concerning data modelling, the majority of the respondents used Data Vault and
Dimensional Modelling (31.58%), followed by Data Vault and 3NF with Dimensional
Modelling (21.05%). Figure 28 is presented for better understanding of the types of data
modelling used.
3.5. Research Discussion
In order to respond the research questions based on the results of this survey, it can be
concluded that drivers for the adoption of data warehouse automation for an organisation
are the fact projects take too much time, there is no standardised code, and the lack of
Figure 27-Architecture Components
Figure 28-Data Modelling Used
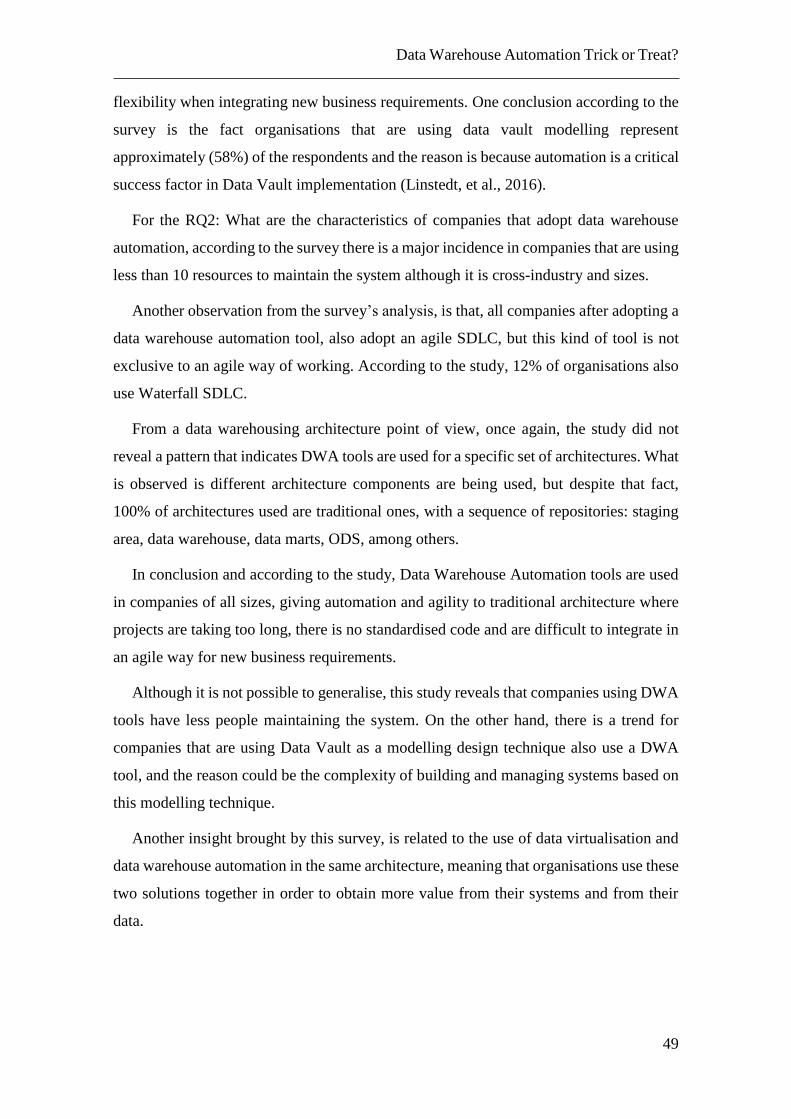
Data Warehouse Automation Trick or Treat?
49
flexibility when integrating new business requirements. One conclusion according to the
survey is the fact organisations that are using data vault modelling represent
approximately (58%) of the respondents and the reason is because automation is a critical
success factor in Data Vault implementation (Linstedt, et al., 2016).
For the RQ2: What are the characteristics of companies that adopt data warehouse
automation, according to the survey there is a major incidence in companies that are using
less than 10 resources to maintain the system although it is cross-industry and sizes.
Another observation from the survey’s analysis, is that, all companies after adopting a
data warehouse automation tool, also adopt an agile SDLC, but this kind of tool is not
exclusive to an agile way of working. According to the study, 12% of organisations also
use Waterfall SDLC.
From a data warehousing architecture point of view, once again, the study did not
reveal a pattern that indicates DWA tools are used for a specific set of architectures. What
is observed is different architecture components are being used, but despite that fact,
100% of architectures used are traditional ones, with a sequence of repositories: staging
area, data warehouse, data marts, ODS, among others.
In conclusion and according to the study, Data Warehouse Automation tools are used
in companies of all sizes, giving automation and agility to traditional architecture where
projects are taking too long, there is no standardised code and are difficult to integrate in
an agile way for new business requirements.
Although it is not possible to generalise, this study reveals that companies using DWA
tools have less people maintaining the system. On the other hand, there is a trend for
companies that are using Data Vault as a modelling design technique also use a DWA
tool, and the reason could be the complexity of building and managing systems based on
this modelling technique.
Another insight brought by this survey, is related to the use of data virtualisation and
data warehouse automation in the same architecture, meaning that organisations use these
two solutions together in order to obtain more value from their systems and from their
data.
Data Warehouse Automation Trick or Treat?
50
Chapter 4 – The DWA in Action
This study aimed to investigate how data warehouse automation can help in a data
warehousing development process and therefore it was necessary to see it in action in
order to analyse data, collect facts to write how DWA helps in data warehousing
development process.
4.1. The Organisation
The case study was conducted in a company from the financial industry with the
following characteristics:
Organisation's Location: Europe
Organisation's Industry: Finance / Accounting / Bank / Insurance
Organisation’s approximate revenue: $500M - $999M
Organisation's approximate number of employees: Under 100
Organisation's approximate number of employees supporting DWS: Under 10
4.2. The Organisation’s Objectives
The company aimed to create an Enterprise Data Warehouse (EDW) that could
consolidate and integrate in a single repository the data from the company core system,
enabling the organisation to manage the business daily based on key performance
indicators (KPI) and therefore make business informed decisions.
The company had the following three main concerns that were the drivers for a Data
Warehouse Automation tool:
Human Resources. The number of human resources for developing and
maintaining the system should be between one and two;
Flexibility. Responses to changing business requirements quickly and easily;
Agility. Easy to develop and easy to maintain
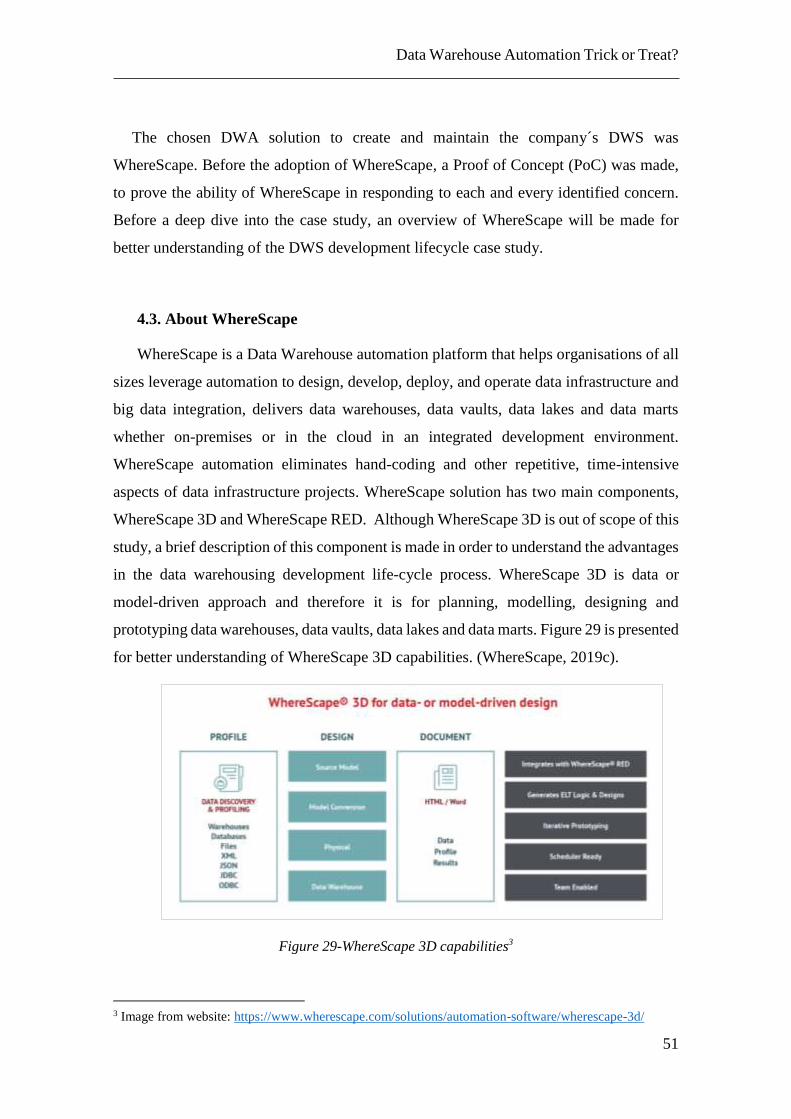
Data Warehouse Automation Trick or Treat?
51
The chosen DWA solution to create and maintain the company´s DWS was
WhereScape. Before the adoption of WhereScape, a Proof of Concept (PoC) was made,
to prove the ability of WhereScape in responding to each and every identified concern.
Before a deep dive into the case study, an overview of WhereScape will be made for
better understanding of the DWS development lifecycle case study.
4.3. About WhereScape
WhereScape is a Data Warehouse automation platform that helps organisations of all
sizes leverage automation to design, develop, deploy, and operate data infrastructure and
big data integration, delivers data warehouses, data vaults, data lakes and data marts
whether on-premises or in the cloud in an integrated development environment.
WhereScape automation eliminates hand-coding and other repetitive, time-intensive
aspects of data infrastructure projects. WhereScape solution has two main components,
WhereScape 3D and WhereScape RED. Although WhereScape 3D is out of scope of this
study, a brief description of this component is made in order to understand the advantages
in the data warehousing development life-cycle process. WhereScape 3D is data or
model-driven approach and therefore it is for planning, modelling, designing and
prototyping data warehouses, data vaults, data lakes and data marts. Figure 29 is presented
for better understanding of WhereScape 3D capabilities. (WhereScape, 2019c).
Figure 29-WhereScape 3D capabilities3
3 Image from website: https://www.wherescape.com/solutions/automation-software/wherescape-3d/
Data Warehouse Automation Trick or Treat?
52
WhereScape 3D profiles data, reviews data sources, assesses data quality and
identifies gaps and areas of potential risk for the data warehouse architecture with data
discovery and profiling capabilities. Automatically designs, tests and revises data
warehouse models as iterate on prototypes with business users with real data. Also,
WhereScape 3D automatically creates and updates documentation as changes are made
so it is always up-to-date, accurate, and comprehensive.
WhereScape RED is a data driven approach and automates develop, deploy,
operate data infrastructure and big data integration. It automates up to 95% of the coding
and makes data infrastructure changes to support business needs. Whether on-premises
or in the cloud, it delivers data warehouses, data vaults, data lakes and data marts in an
integrated development environment. (WhereScape, 2019b).
WhereScape RED Automates development and operations workflows, shortens
data infrastructure development, deployment and operation using a drag-and-drop
approach to define data infrastructure and automates data integration and metadata usage.
It generates all of the code needed to instantiate and populate data models and schedule
and migrate changes. Another characteristic of WhereScape RED is that it automatically
generates SQL and other code native, depending on target platform, including big data
analytics and it also leverages platform-specific best practices and features, such as
optimised database loaders. Another characteristic is the documentation that is
automatically generated and updates it with any changes that are made. As it is a
metadata-driven tool, it produces full data source lineage, including track back, track
forward, and impact analysis, so it is possible to always have an up-to-date, accurate and
complete view of the data infrastructure. WhereScape RED provides built-in best
practices and out-of-the-box wizards and templates for common data warehouse
modelling methodologies such as third-normal form (3NF), Data Vault and dimensional
to reduce complexity and accelerate development. (WhereScape, 2019b).
Figure 30 is presented for better understanding of WhereScape RED architecture
and the way the architecture is populated.
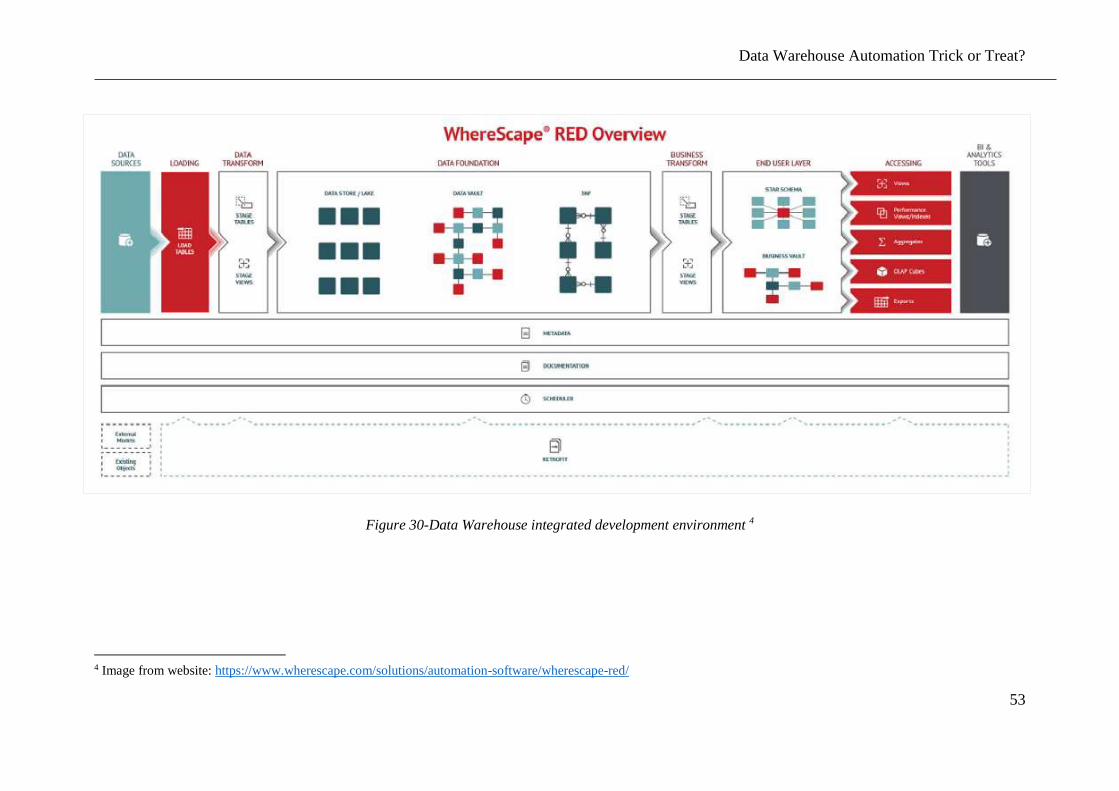
Data Warehouse Automation Trick or Treat?
53
Figure 30-Data Warehouse integrated development environment 4
4 Image from website: https://www.wherescape.com/solutions/automation-software/wherescape-red/
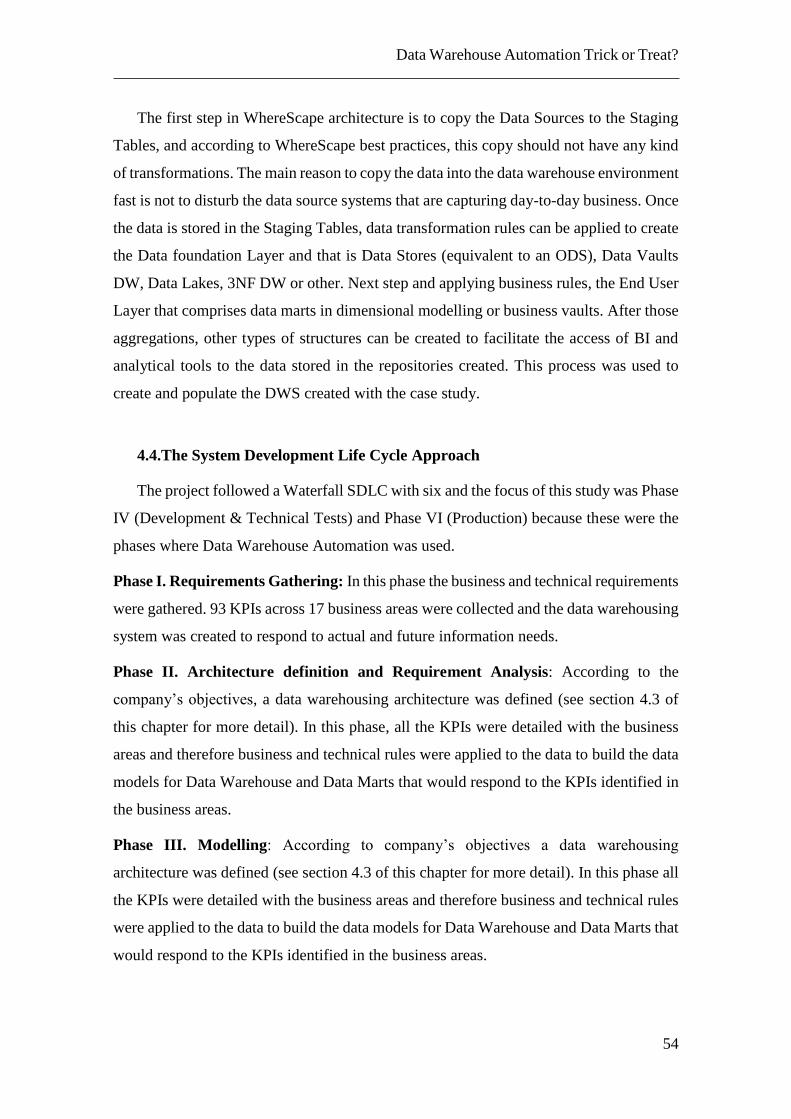
Data Warehouse Automation Trick or Treat?
54
The first step in WhereScape architecture is to copy the Data Sources to the Staging
Tables, and according to WhereScape best practices, this copy should not have any kind
of transformations. The main reason to copy the data into the data warehouse environment
fast is not to disturb the data source systems that are capturing day-to-day business. Once
the data is stored in the Staging Tables, data transformation rules can be applied to create
the Data foundation Layer and that is Data Stores (equivalent to an ODS), Data Vaults
DW, Data Lakes, 3NF DW or other. Next step and applying business rules, the End User
Layer that comprises data marts in dimensional modelling or business vaults. After those
aggregations, other types of structures can be created to facilitate the access of BI and
analytical tools to the data stored in the repositories created. This process was used to
create and populate the DWS created with the case study.
4.4.The System Development Life Cycle Approach
The project followed a Waterfall SDLC with six and the focus of this study was Phase
IV (Development & Technical Tests) and Phase VI (Production) because these were the
phases where Data Warehouse Automation was used.
Phase I. Requirements Gathering: In this phase the business and technical requirements
were gathered. 93 KPIs across 17 business areas were collected and the data warehousing
system was created to respond to actual and future information needs.
Phase II. Architecture definition and Requirement Analysis: According to the
company’s objectives, a data warehousing architecture was defined (see section 4.3 of
this chapter for more detail). In this phase, all the KPIs were detailed with the business
areas and therefore business and technical rules were applied to the data to build the data
models for Data Warehouse and Data Marts that would respond to the KPIs identified in
the business areas.
Phase III. Modelling: According to company’s objectives a data warehousing
architecture was defined (see section 4.3 of this chapter for more detail). In this phase all
the KPIs were detailed with the business areas and therefore business and technical rules
were applied to the data to build the data models for Data Warehouse and Data Marts that
would respond to the KPIs identified in the business areas.
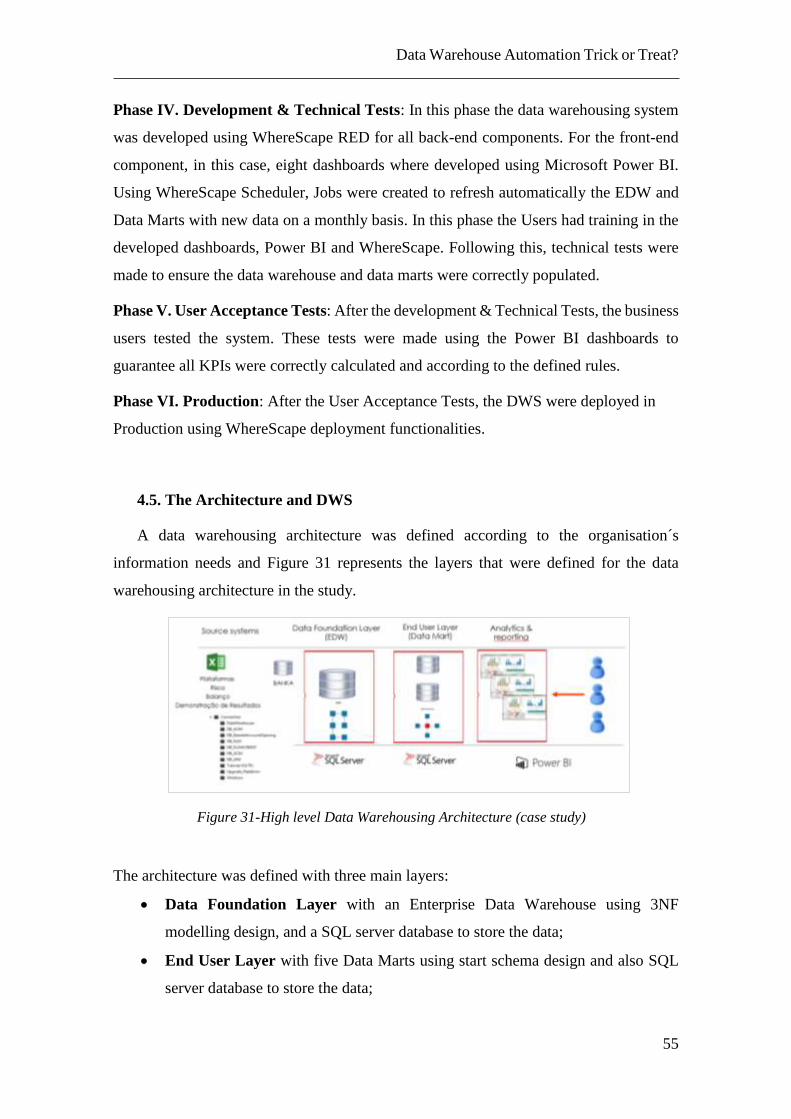
Data Warehouse Automation Trick or Treat?
55
Phase IV. Development & Technical Tests: In this phase the data warehousing system
was developed using WhereScape RED for all back-end components. For the front-end
component, in this case, eight dashboards where developed using Microsoft Power BI.
Using WhereScape Scheduler, Jobs were created to refresh automatically the EDW and
Data Marts with new data on a monthly basis. In this phase the Users had training in the
developed dashboards, Power BI and WhereScape. Following this, technical tests were
made to ensure the data warehouse and data marts were correctly populated.
Phase V. User Acceptance Tests: After the development & Technical Tests, the business
users tested the system. These tests were made using the Power BI dashboards to
guarantee all KPIs were correctly calculated and according to the defined rules.
Phase VI. Production: After the User Acceptance Tests, the DWS were deployed in
Production using WhereScape deployment functionalities.
4.5. The Architecture and DWS
A data warehousing architecture was defined according to the organisation´s
information needs and Figure 31 represents the layers that were defined for the data
warehousing architecture in the study.
The architecture was defined with three main layers:
Data Foundation Layer with an Enterprise Data Warehouse using 3NF
modelling design, and a SQL server database to store the data;
End User Layer with five Data Marts using start schema design and also SQL
server database to store the data;
Figure 31-High level Data Warehousing Architecture (case study)
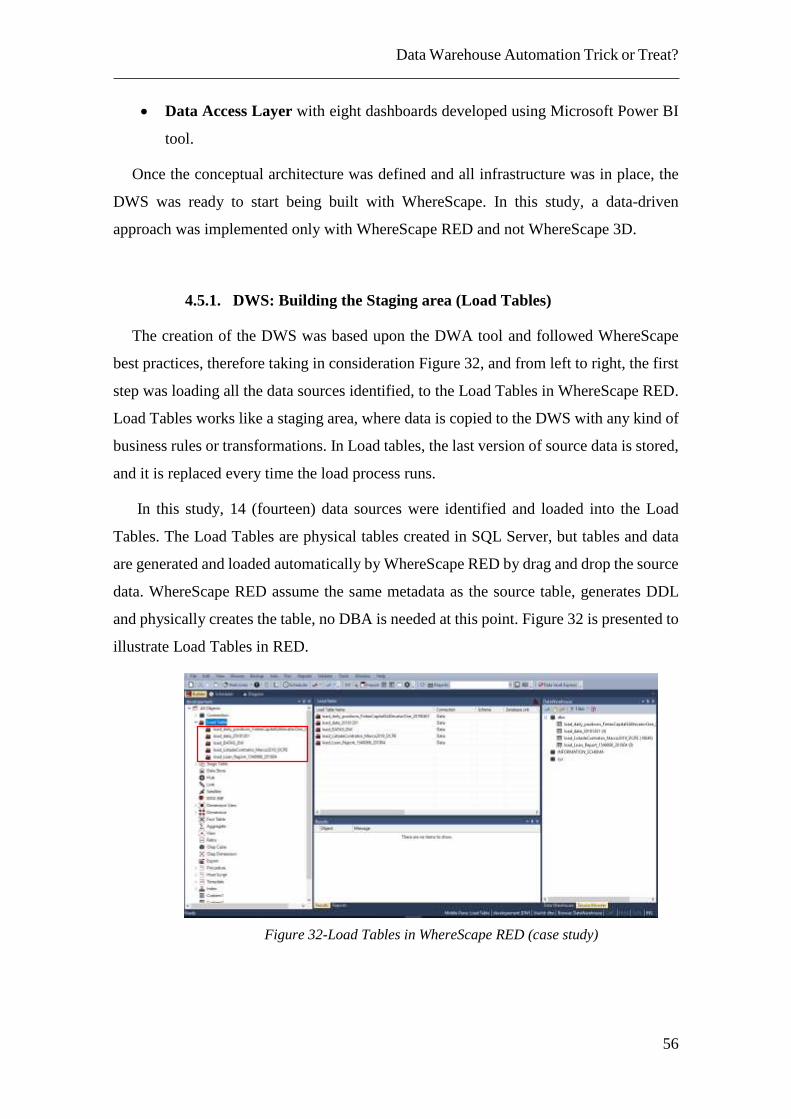
Data Warehouse Automation Trick or Treat?
56
Data Access Layer with eight dashboards developed using Microsoft Power BI
tool.
Once the conceptual architecture was defined and all infrastructure was in place, the
DWS was ready to start being built with WhereScape. In this study, a data-driven
approach was implemented only with WhereScape RED and not WhereScape 3D.
4.5.1. DWS: Building the Staging area (Load Tables)
The creation of the DWS was based upon the DWA tool and followed WhereScape
best practices, therefore taking in consideration Figure 32, and from left to right, the first
step was loading all the data sources identified, to the Load Tables in WhereScape RED.
Load Tables works like a staging area, where data is copied to the DWS with any kind of
business rules or transformations. In Load tables, the last version of source data is stored,
and it is replaced every time the load process runs.
In this study, 14 (fourteen) data sources were identified and loaded into the Load
Tables. The Load Tables are physical tables created in SQL Server, but tables and data
are generated and loaded automatically by WhereScape RED by drag and drop the source
data. WhereScape RED assume the same metadata as the source table, generates DDL
and physically creates the table, no DBA is needed at this point. Figure 32 is presented to
illustrate Load Tables in RED.
Figure 32-Load Tables in WhereScape RED (case study)
Data Warehouse Automation Trick or Treat?
57
4.5.2. DWS: Building the EDW
After all data sources are loaded in RED the EDW can be created. All data
transformations (calculated metrics, key performance indicators, new data formats, data
cleansing, etc.) are made in Stage Tables. Stage Tables can be persistent or virtual
(views), considering if space in disk is an issue or not. In this study, persistent Stages
Tables were used to transform and clean data before populating EDW and Data Marts.
The next step was creating the EDW and to do so, the EDW metadata object was
double clicked to allow RED to create an Enterprise Data Warehouse using 3NF
modelling, through drag and drop of stage tables to the central panel and a wizard. An
EDW was created with 17 (seventeen).
When the stage table is dragged and dropped, a window appears with the object type
and the object name is already filled. RED knows that all 3NF object names start with
“EDW_” followed by the name of the stage table, because it is template driven and all
names and conventions are defined in the objects template and like so, standard
development is guaranteed. Figure 33 is presented with the final Enterprise Data
Warehouse.
Figure 33-Enterprise Data Warehouse (case study)
The EDW integrated core banking information: clients, current accounts, saving
accounts, securities, credit, collections, risk, balance sheet and financial statement. All
EDW tables are historised and that means they follow the same technique, SCD type 2,
to store new changes in attributes.
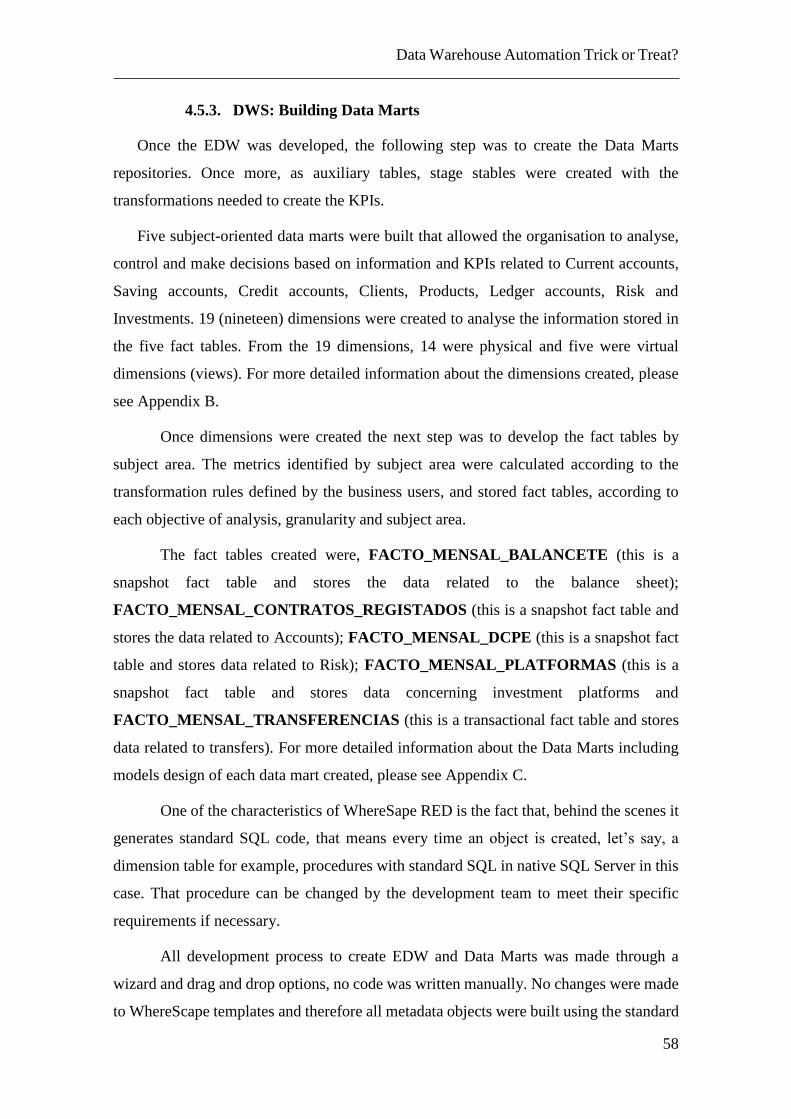
Data Warehouse Automation Trick or Treat?
58
4.5.3. DWS: Building Data Marts
Once the EDW was developed, the following step was to create the Data Marts
repositories. Once more, as auxiliary tables, stage stables were created with the
transformations needed to create the KPIs.
Five subject-oriented data marts were built that allowed the organisation to analyse,
control and make decisions based on information and KPIs related to Current accounts,
Saving accounts, Credit accounts, Clients, Products, Ledger accounts, Risk and
Investments. 19 (nineteen) dimensions were created to analyse the information stored in
the five fact tables. From the 19 dimensions, 14 were physical and five were virtual
dimensions (views). For more detailed information about the dimensions created, please
see Appendix B.
Once dimensions were created the next step was to develop the fact tables by
subject area. The metrics identified by subject area were calculated according to the
transformation rules defined by the business users, and stored fact tables, according to
each objective of analysis, granularity and subject area.
The fact tables created were, FACTO_MENSAL_BALANCETE (this is a
snapshot fact table and stores the data related to the balance sheet);
FACTO_MENSAL_CONTRATOS_REGISTADOS (this is a snapshot fact table and
stores the data related to Accounts); FACTO_MENSAL_DCPE (this is a snapshot fact
table and stores data related to Risk); FACTO_MENSAL_PLATFORMAS (this is a
snapshot fact table and stores data concerning investment platforms and
FACTO_MENSAL_TRANSFERENCIAS (this is a transactional fact table and stores
data related to transfers). For more detailed information about the Data Marts including
models design of each data mart created, please see Appendix C.
One of the characteristics of WhereSape RED is the fact that, behind the scenes it
generates standard SQL code, that means every time an object is created, let’s say, a
dimension table for example, procedures with standard SQL in native SQL Server in this
case. That procedure can be changed by the development team to meet their specific
requirements if necessary.
All development process to create EDW and Data Marts was made through a
wizard and drag and drop options, no code was written manually. No changes were made
to WhereScape templates and therefore all metadata objects were built using the standard
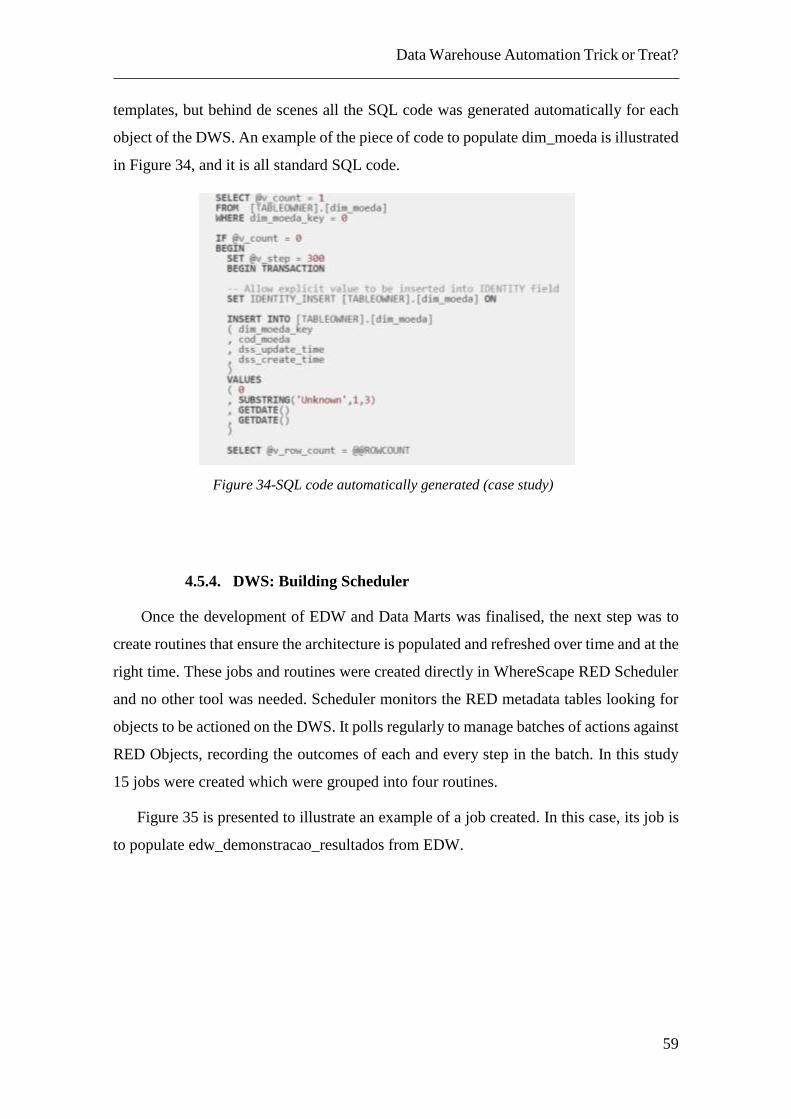
Data Warehouse Automation Trick or Treat?
59
templates, but behind de scenes all the SQL code was generated automatically for each
object of the DWS. An example of the piece of code to populate dim_moeda is illustrated
in Figure 34, and it is all standard SQL code.
4.5.4. DWS: Building Scheduler
Once the development of EDW and Data Marts was finalised, the next step was to
create routines that ensure the architecture is populated and refreshed over time and at the
right time. These jobs and routines were created directly in WhereScape RED Scheduler
and no other tool was needed. Scheduler monitors the RED metadata tables looking for
objects to be actioned on the DWS. It polls regularly to manage batches of actions against
RED Objects, recording the outcomes of each and every step in the batch. In this study
15 jobs were created which were grouped into four routines.
Figure 35 is presented to illustrate an example of a job created. In this case, its job is
to populate edw_demonstracao_resultados from EDW.
Figure 34-SQL code automatically generated (case study)
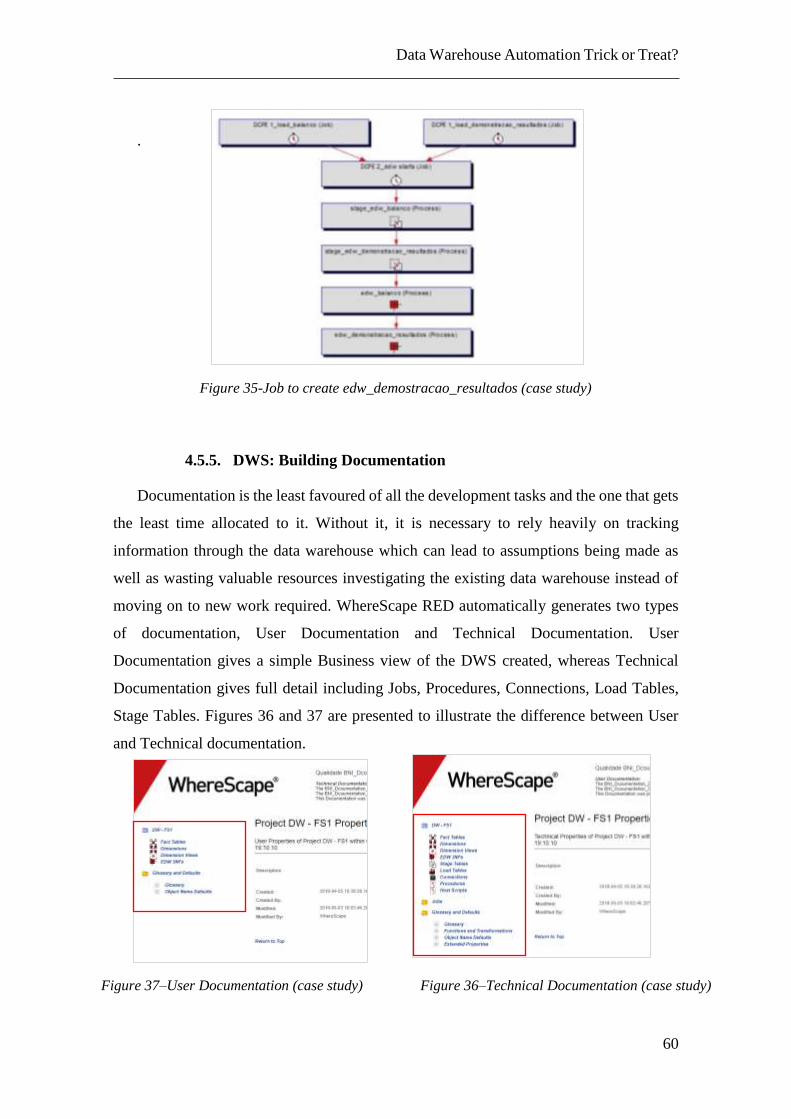
Data Warehouse Automation Trick or Treat?
60
.
4.5.5. DWS: Building Documentation
Documentation is the least favoured of all the development tasks and the one that gets
the least time allocated to it. Without it, it is necessary to rely heavily on tracking
information through the data warehouse which can lead to assumptions being made as
well as wasting valuable resources investigating the existing data warehouse instead of
moving on to new work required. WhereScape RED automatically generates two types
of documentation, User Documentation and Technical Documentation. User
Documentation gives a simple Business view of the DWS created, whereas Technical
Documentation gives full detail including Jobs, Procedures, Connections, Load Tables,
Stage Tables. Figures 36 and 37 are presented to illustrate the difference between User
and Technical documentation.
Figure 35-Job to create edw_demostracao_resultados (case study)
Figure 36–Technical Documentation (case study) Figure 37–User Documentation (case study)
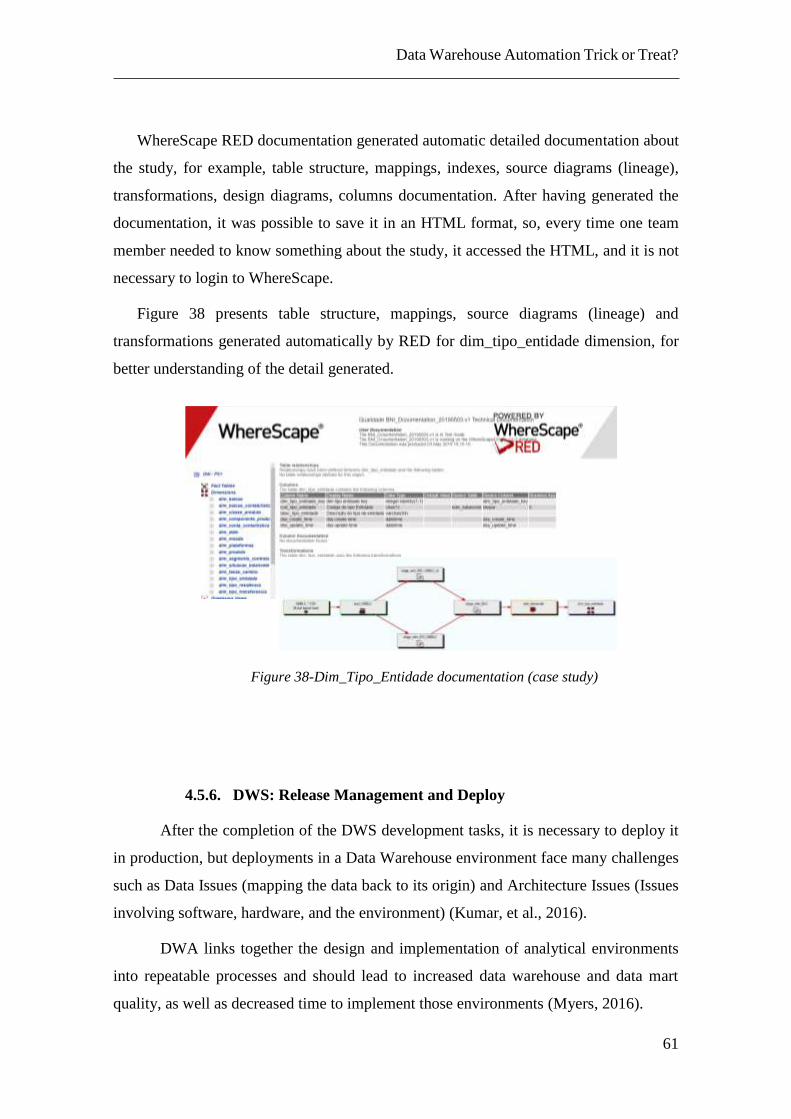
Data Warehouse Automation Trick or Treat?
61
WhereScape RED documentation generated automatic detailed documentation about
the study, for example, table structure, mappings, indexes, source diagrams (lineage),
transformations, design diagrams, columns documentation. After having generated the
documentation, it was possible to save it in an HTML format, so, every time one team
member needed to know something about the study, it accessed the HTML, and it is not
necessary to login to WhereScape.
Figure 38 presents table structure, mappings, source diagrams (lineage) and
transformations generated automatically by RED for dim_tipo_entidade dimension, for
better understanding of the detail generated.
4.5.6. DWS: Release Management and Deploy
After the completion of the DWS development tasks, it is necessary to deploy it
in production, but deployments in a Data Warehouse environment face many challenges
such as Data Issues (mapping the data back to its origin) and Architecture Issues (Issues
involving software, hardware, and the environment) (Kumar, et al., 2016).
DWA links together the design and implementation of analytical environments
into repeatable processes and should lead to increased data warehouse and data mart
quality, as well as decreased time to implement those environments (Myers, 2016).
Figure 38-Dim_Tipo_Entidade documentation (case study)
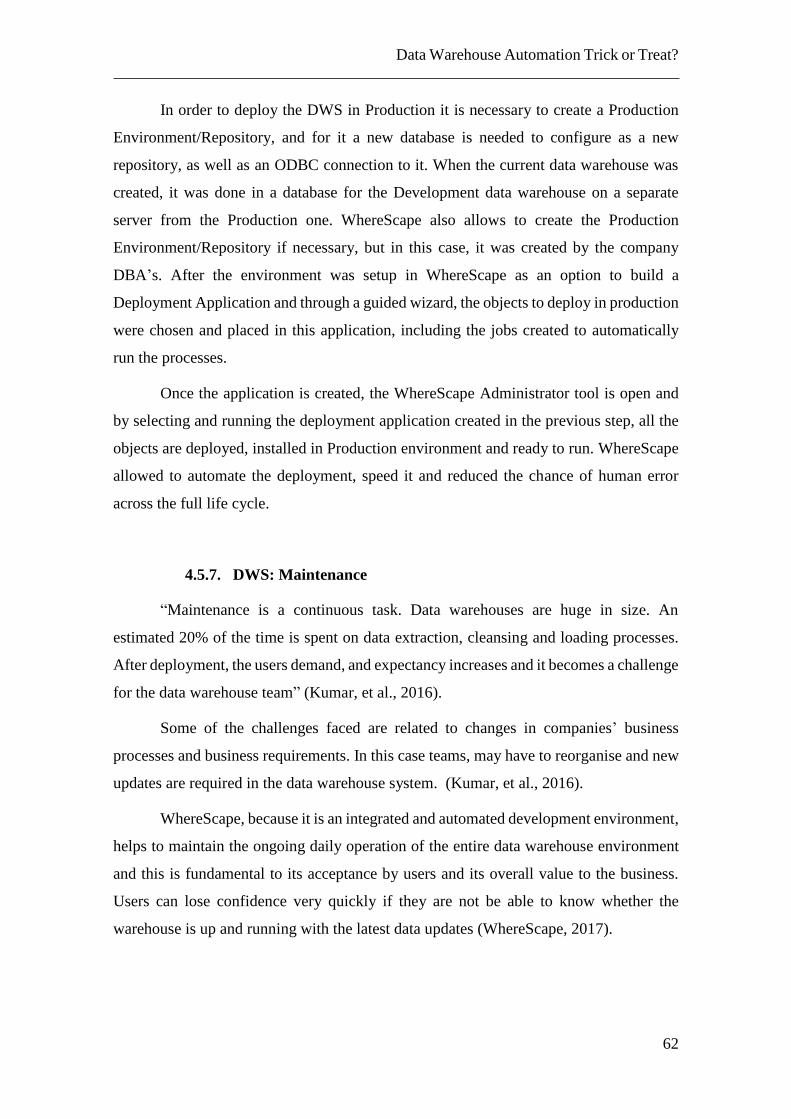
Data Warehouse Automation Trick or Treat?
62
In order to deploy the DWS in Production it is necessary to create a Production
Environment/Repository, and for it a new database is needed to configure as a new
repository, as well as an ODBC connection to it. When the current data warehouse was
created, it was done in a database for the Development data warehouse on a separate
server from the Production one. WhereScape also allows to create the Production
Environment/Repository if necessary, but in this case, it was created by the company
DBA’s. After the environment was setup in WhereScape as an option to build a
Deployment Application and through a guided wizard, the objects to deploy in production
were chosen and placed in this application, including the jobs created to automatically
run the processes.
Once the application is created, the WhereScape Administrator tool is open and
by selecting and running the deployment application created in the previous step, all the
objects are deployed, installed in Production environment and ready to run. WhereScape
allowed to automate the deployment, speed it and reduced the chance of human error
across the full life cycle.
4.5.7. DWS: Maintenance
“Maintenance is a continuous task. Data warehouses are huge in size. An
estimated 20% of the time is spent on data extraction, cleansing and loading processes.
After deployment, the users demand, and expectancy increases and it becomes a challenge
for the data warehouse team” (Kumar, et al., 2016).
Some of the challenges faced are related to changes in companies’ business
processes and business requirements. In this case teams, may have to reorganise and new
updates are required in the data warehouse system. (Kumar, et al., 2016).
WhereScape, because it is an integrated and automated development environment,
helps to maintain the ongoing daily operation of the entire data warehouse environment
and this is fundamental to its acceptance by users and its overall value to the business.
Users can lose confidence very quickly if they are not be able to know whether the
warehouse is up and running with the latest data updates (WhereScape, 2017).
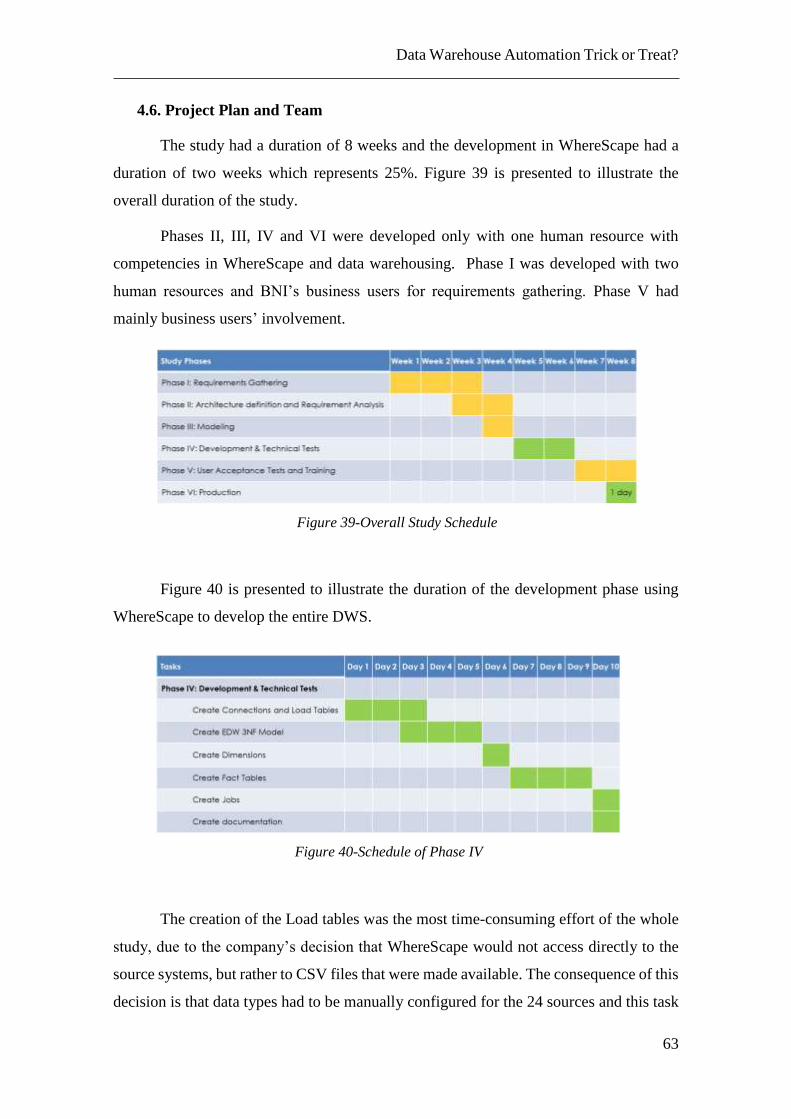
Data Warehouse Automation Trick or Treat?
63
4.6. Project Plan and Team
The study had a duration of 8 weeks and the development in WhereScape had a
duration of two weeks which represents 25%. Figure 39 is presented to illustrate the
overall duration of the study.
Phases II, III, IV and VI were developed only with one human resource with
competencies in WhereScape and data warehousing. Phase I was developed with two
human resources and BNI’s business users for requirements gathering. Phase V had
mainly business users’ involvement.
Figure 40 is presented to illustrate the duration of the development phase using
WhereScape to develop the entire DWS.
The creation of the Load tables was the most time-consuming effort of the whole
study, due to the company’s decision that WhereScape would not access directly to the
source systems, but rather to CSV files that were made available. The consequence of this
decision is that data types had to be manually configured for the 24 sources and this task
Figure 39-Overall Study Schedule
Figure 40-Schedule of Phase IV
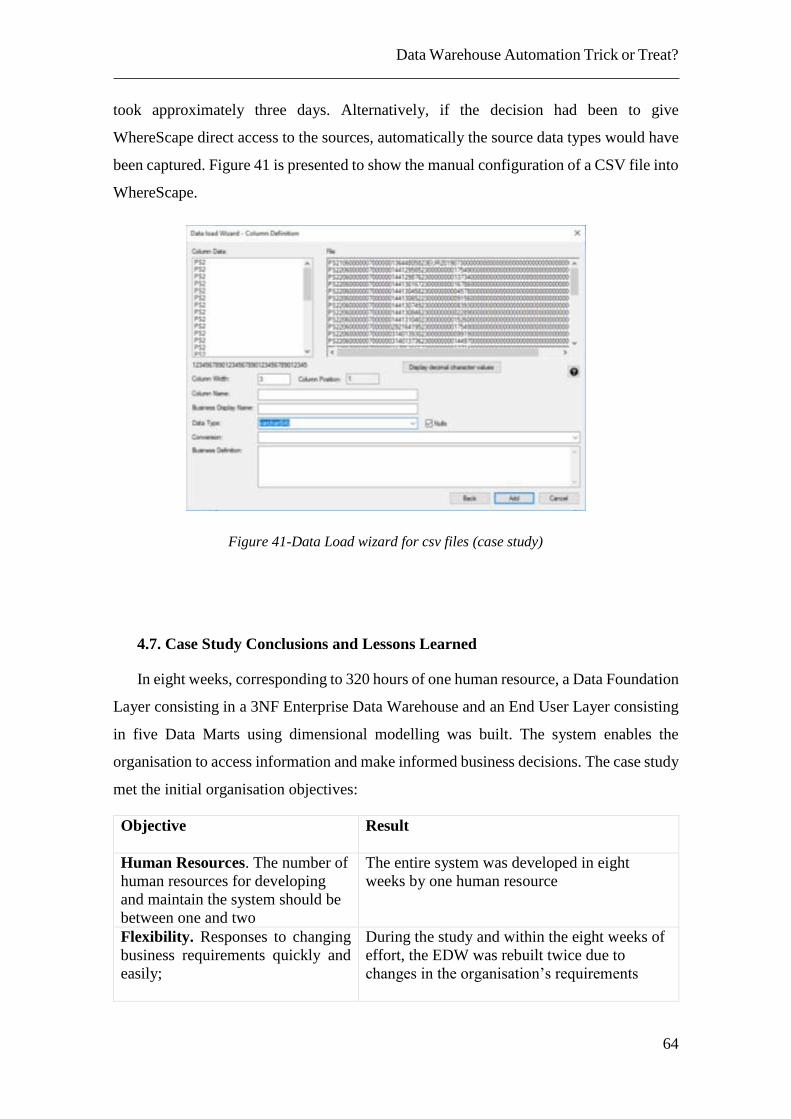
Data Warehouse Automation Trick or Treat?
64
took approximately three days. Alternatively, if the decision had been to give
WhereScape direct access to the sources, automatically the source data types would have
been captured. Figure 41 is presented to show the manual configuration of a CSV file into
WhereScape.
4.7. Case Study Conclusions and Lessons Learned
In eight weeks, corresponding to 320 hours of one human resource, a Data Foundation
Layer consisting in a 3NF Enterprise Data Warehouse and an End User Layer consisting
in five Data Marts using dimensional modelling was built. The system enables the
organisation to access information and make informed business decisions. The case study
met the initial organisation objectives:
Objective
Result
Human Resources. The number of
human resources for developing
and maintain the system should be
between one and two
The entire system was developed in eight
weeks by one human resource
Flexibility. Responses to changing
business requirements quickly and
easily;
During the study and within the eight weeks of
effort, the EDW was rebuilt twice due to
changes in the organisation’s requirements
Figure 41-Data Load wizard for csv files (case study)
Data Warehouse Automation Trick or Treat?
65
Agility. Easy to develop and easy to
maintain
Wizard based with embedded best practices
that make the tool very intuitive, easy and fast
to develop.
Apart from the technical benefits that were observed in the study such as, easy
development, fast development, integrated environment, automatic documentation,
development of integration processes without writing a line of code, the human factor
should not be put aside and is critical to the success of this kind of approach.
The resistance of people to change and to adopt new technologies which they are
not comfortable with, could be the total failure of a disruptive approach like this.
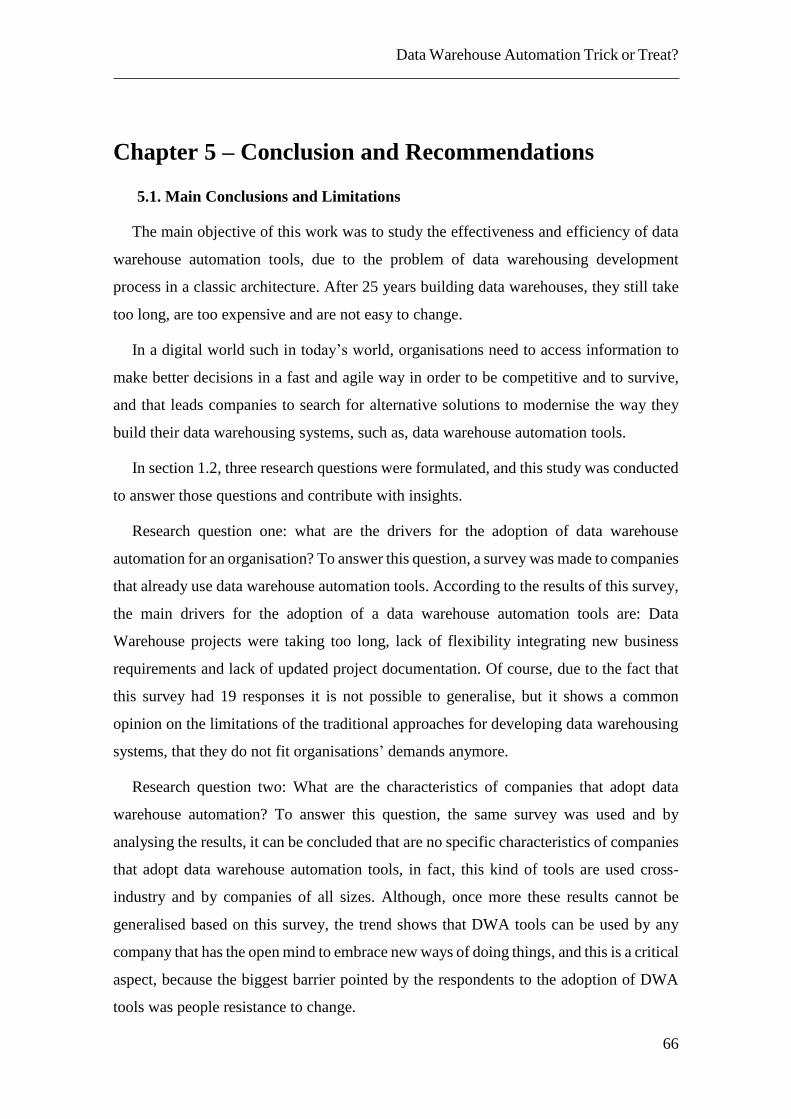
Data Warehouse Automation Trick or Treat?
66
Chapter 5 – Conclusion and Recommendations
5.1. Main Conclusions and Limitations
The main objective of this work was to study the effectiveness and efficiency of data
warehouse automation tools, due to the problem of data warehousing development
process in a classic architecture. After 25 years building data warehouses, they still take
too long, are too expensive and are not easy to change.
In a digital world such in today’s world, organisations need to access information to
make better decisions in a fast and agile way in order to be competitive and to survive,
and that leads companies to search for alternative solutions to modernise the way they
build their data warehousing systems, such as, data warehouse automation tools.
In section 1.2, three research questions were formulated, and this study was conducted
to answer those questions and contribute with insights.
Research question one: what are the drivers for the adoption of data warehouse
automation for an organisation? To answer this question, a survey was made to companies
that already use data warehouse automation tools. According to the results of this survey,
the main drivers for the adoption of a data warehouse automation tools are: Data
Warehouse projects were taking too long, lack of flexibility integrating new business
requirements and lack of updated project documentation. Of course, due to the fact that
this survey had 19 responses it is not possible to generalise, but it shows a common
opinion on the limitations of the traditional approaches for developing data warehousing
systems, that they do not fit organisations’ demands anymore.
Research question two: What are the characteristics of companies that adopt data
warehouse automation? To answer this question, the same survey was used and by
analysing the results, it can be concluded that are no specific characteristics of companies
that adopt data warehouse automation tools, in fact, this kind of tools are used cross-
industry and by companies of all sizes. Although, once more these results cannot be
generalised based on this survey, the trend shows that DWA tools can be used by any
company that has the open mind to embrace new ways of doing things, and this is a critical
aspect, because the biggest barrier pointed by the respondents to the adoption of DWA
tools was people resistance to change.
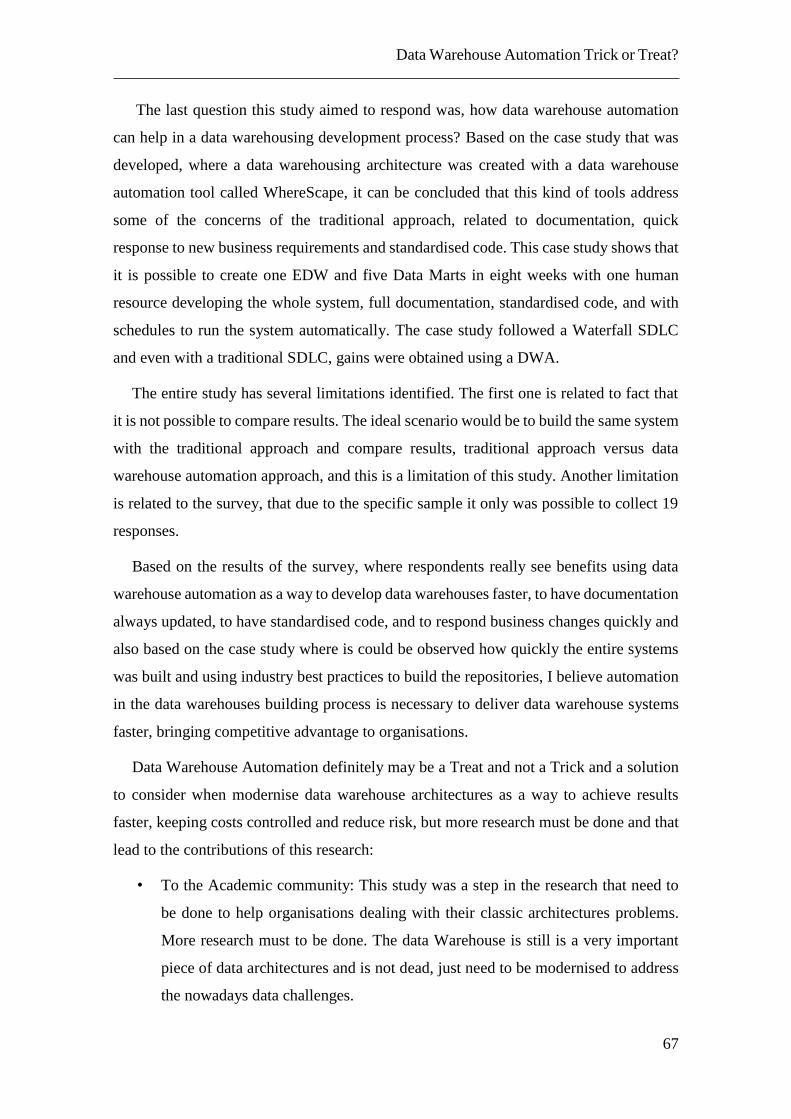
Data Warehouse Automation Trick or Treat?
67
The last question this study aimed to respond was, how data warehouse automation
can help in a data warehousing development process? Based on the case study that was
developed, where a data warehousing architecture was created with a data warehouse
automation tool called WhereScape, it can be concluded that this kind of tools address
some of the concerns of the traditional approach, related to documentation, quick
response to new business requirements and standardised code. This case study shows that
it is possible to create one EDW and five Data Marts in eight weeks with one human
resource developing the whole system, full documentation, standardised code, and with
schedules to run the system automatically. The case study followed a Waterfall SDLC
and even with a traditional SDLC, gains were obtained using a DWA.
The entire study has several limitations identified. The first one is related to fact that
it is not possible to compare results. The ideal scenario would be to build the same system
with the traditional approach and compare results, traditional approach versus data
warehouse automation approach, and this is a limitation of this study. Another limitation
is related to the survey, that due to the specific sample it only was possible to collect 19
responses.
Based on the results of the survey, where respondents really see benefits using data
warehouse automation as a way to develop data warehouses faster, to have documentation
always updated, to have standardised code, and to respond business changes quickly and
also based on the case study where is could be observed how quickly the entire systems
was built and using industry best practices to build the repositories, I believe automation
in the data warehouses building process is necessary to deliver data warehouse systems
faster, bringing competitive advantage to organisations.
Data Warehouse Automation definitely may be a Treat and not a Trick and a solution
to consider when modernise data warehouse architectures as a way to achieve results
faster, keeping costs controlled and reduce risk, but more research must be done and that
lead to the contributions of this research:
• To the Academic community: This study was a step in the research that need to
be done to help organisations dealing with their classic architectures problems.
More research must to be done. The data Warehouse is still is a very important
piece of data architectures and is not dead, just need to be modernised to address
the nowadays data challenges.
Data Warehouse Automation Trick or Treat?
68
• To Business community: As a step towards understanding how DWA can help
organisations with their traditional development approach in classic architectures.
• Publish an article until March 31, 2020 to share this research results.
5.2. Future investigation
Taking into account the limitations presented in section 5.1, as future investigation the
following proposals are presented:
To extend the investigation already initiated and implement a new project using a data
warehouse automation tool approach and the traditional approach and compare results in
terms of time-saving, cost-saving, speed of deployments, documentation and data lineage.
Raham and Rutz could compare time-savings in their experiment and I think that kind of
experimented can contribute not only to scientific community but also to help
organizations in their decision process concerning automation as a way to modernize their
architectures.
Data Warehouse Automation Trick or Treat?
69
Bibliography
Balaji, S., and M. Murugaiyan. 2012. Waterfall Vs V-Model Vs Agile: A comparative
study on SDLC. International Jornal of Information Technology and Business
Management 26-30.
Brooks, Frederick. 1975. The Mythical Ma-month: Essays on Software Engineering.
Addison-Wesley.
Bunio, Terry. 2012. Agile Data Warehouse - the Final Frontier. 2012 Agile
Conference. Winnipeg, Canada: Protegra Inc. 156-164.
Cardoso, Elsa. 2011. Performance and Quality Management of HE programmes. Elsa
Cardoso, PhD thesis, 2011
DAMA. 2017. Data Management Book of Knowledge (DMBOK), second edition.
Techics Publications.
Ekerson, Wayne. 2015. Data Warehouse Automation Tools: Product Categories and
Positioning. September. Accessed 1 29, 2019.
https://www.eckerson.com/register?content=which-data-warehouse-automation-
tool-is-right-for-you.
Evelson, Boris, and Nasry Angel. 2016. Data Warehouse Automation Platforms Help
Close The Data-To-Insight Gap. Forrester. https://www.forrester.com. 16
August. Accessed December 19, 2018.
https://www.forrester.com/report/Data+Warehouse+Automation+Helps+Close+
The+DataToInsight+Gap/-/E-RES135810#.
Gartner. 2018. Gartner Survey Shows Organizations Are Slow to Advance in Data and
Analytics. https://www.gartner.com. 5 February. Accessed 01 10, 2019.
https://www.gartner.com/en/newsroom/press-releases/2018-02-05-gartner-
survey-shows-organizations-are-slow-to-advance-in-data-and-analytics.
Harvey, Cynthia. 2018. 10 Roadblocks to Becoming a Data-Driven Enterprise.
https://www.informationweek.com. 4 September. Accessed October 10, 2018.
https://www.informationweek.com/strategic-cio/digital-business/10-roadblocks-
to-becoming-a-data-driven-enterprise/d/d-
id/1332705?ngAction=register&ngAsset=389473&page_number=1.
Imhoff, Claudia. 2012. Forword. Em Data Virtualization for Business Intelligence
Systems: Revolutionizing Data Integration for Data Warehouses, Rick van der
Lans, xiii - xiv. Morgan Kaufmann is an imprint of Elsevier.
Inmon, W H, and Daniel Linstedt. 2015. Data Architecture: A Primer for the Data
Scientist: Big Data, Data Warehouse, Data Vault. Morgan Kaufmann.
Inmon, W. 2002. Building the Data Warehouse. John Wiley & Sons.
Inmon, W, Claudia Imhoff, and Ryan Sousa. 2002. Corporate Information Factory.
John Wiley & Sons.
Inmon, W, Derek Strauss, and Genia Neushloss. 2008. DW 2.0: The Architecture for
the Next Generation of Data Warehousing. Burlington, USA: Elsevier.
Data Warehouse Automation Trick or Treat?
70
Kimball, Ralph. 1998. The Data Warehouse Life-cycle Tollkit. Jonh Wiley & Sons,
Inc.
Kimball, Ralph, and Margy Ross. 2002. The Data Warehouse Toolkit: The Complete
Guide to Dimensional Modeling. Jonh Wiley & Sons, Inc.
Kumar, Avinash , and Pravin S. Metkewar. 2016. Challenges in Data Warehouse
Deployment and Maintenance. International Journal of Trend in Research and
Development 104-105.
Lans, Rick. 2018. Architecting the Multi-Purpose Data Lake with Data Virtualization.
—. 2012. Data Virtualization for Business Intelligence Systems: Revolutionizing Data
Integration for Data Warehouses. Morgan Kaufmann is an imprint of Elsevier.
Linstedt, Daniel, and Michael Olschimke. 2016. Building a Scalable Data Warehouse
with Data Vault 2.0. Morgan Kaufmann.
Mathur, Sonali, and Shaily Malik. 2010. Advancements in the V-Model. International
Journal of Computer Applications 29-34.
Myers, John L. 2017. TDWI Data Warehouse Automation: Better, Faster, Cheaper ...
You Can Have It All. TDWI, 10.
—. 2016. Be careful when implementing data warehouse automation. InfoWorld.
inforworld.com. 19 February. Accessed August 25, 2019.
https://www.infoworld.com/article/3035476/be-careful-when-implementing-data-
warehouse-automation.html.
Peffers, Ken, Tuure Tuunanen, Marcus Rothenberger, and Samir Chatterjee. 2008. A
Design Science Research Methodology for Information Systems Research.
Journal of Management Information System 45-78.
Rahman, Nayem, and Dale Rutz. 2015. Building Data Warehouses Using Automation.
International Jornal of Intelligent Information Technologies 1-22.
Rajan, Jindal, and Acharya Abhishek. 2019. Federated Data Warehouse. WIPRO.
Timextender. 2019. The secret sauce your analytics is missing: robots. Timextender
Corporation. 14 September. Accessed January 19, 2019.
http://blog.timextender.com/the-secret-sauce-your-data-warehouse-is-missing-
robots-automation.
Wells, Dave. 2018. Data Warehouse Automation A Decision Guide.
www.wherescape.com. Accessed January 19, 2019.
https://www.wherescape.com/resources/white-paper-decision-guide-data-
warehouse-automation/.
—. 2014. Relieving the Pain of the BI Back Room with Data Warehouse Automation.
15 April. Accessed October 15, 2018. https://tdwi.org/Articles/2014/04/15/Data-
Warehouse-Automation.aspx?Page=1
WhereScape. 2017. Maintaining a Data Warehouse. Edited by Barry Devlin. 31 July.
Accessed August 25, 2019. https://www.wherescape.com/blog/maintaining-a-
data-warehouse/.
—. 2019a. Deliver data and analytics 80 percent faster, with less cost and risk.
Wherescape. wherescape.com. Accessed February 8, 2019.

Data Warehouse Automation Trick or Treat?
71
https://www.wherescape.com/media/3531/wherescape-automation-overview-
brochure-us.pdf.
—. 2019b. Deliver data warehousing projects more quickly with less hassle.
Wherescape. Accessed February 8, 2019.
https://www.wherescape.com/solutions/automation-software/wherescape-red/.
—. 2019c. Automate design for faster project success. Wherescape. Accessed February
8, 2019. https://www.wherescape.com/solutions/automation-
software/wherescape-3d/.
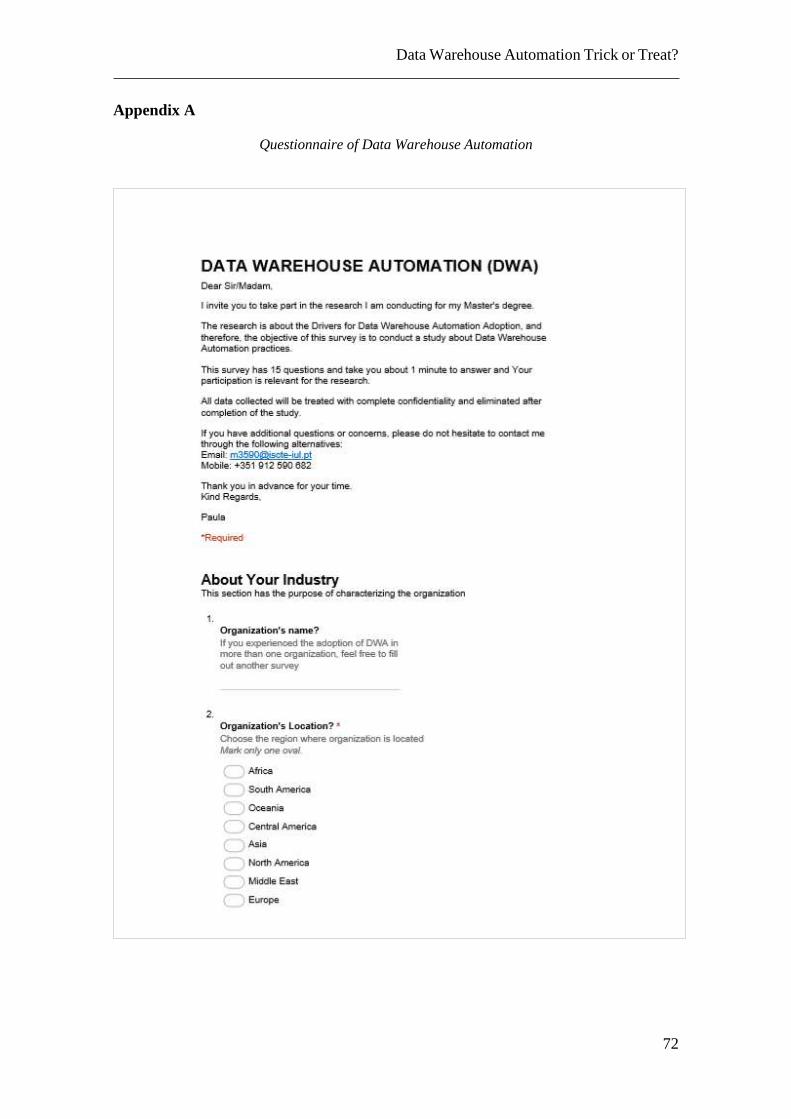
Data Warehouse Automation Trick or Treat?
72
Appendix A
Questionnaire of Data Warehouse Automation
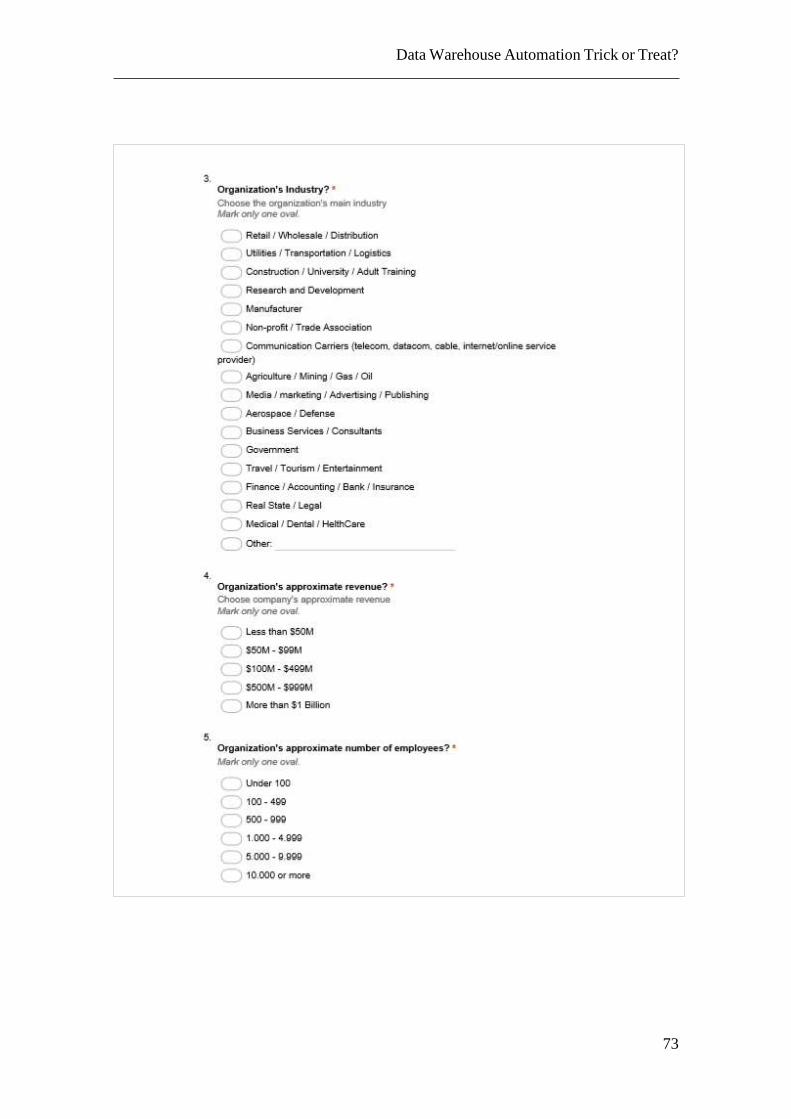
Data Warehouse Automation Trick or Treat?
73
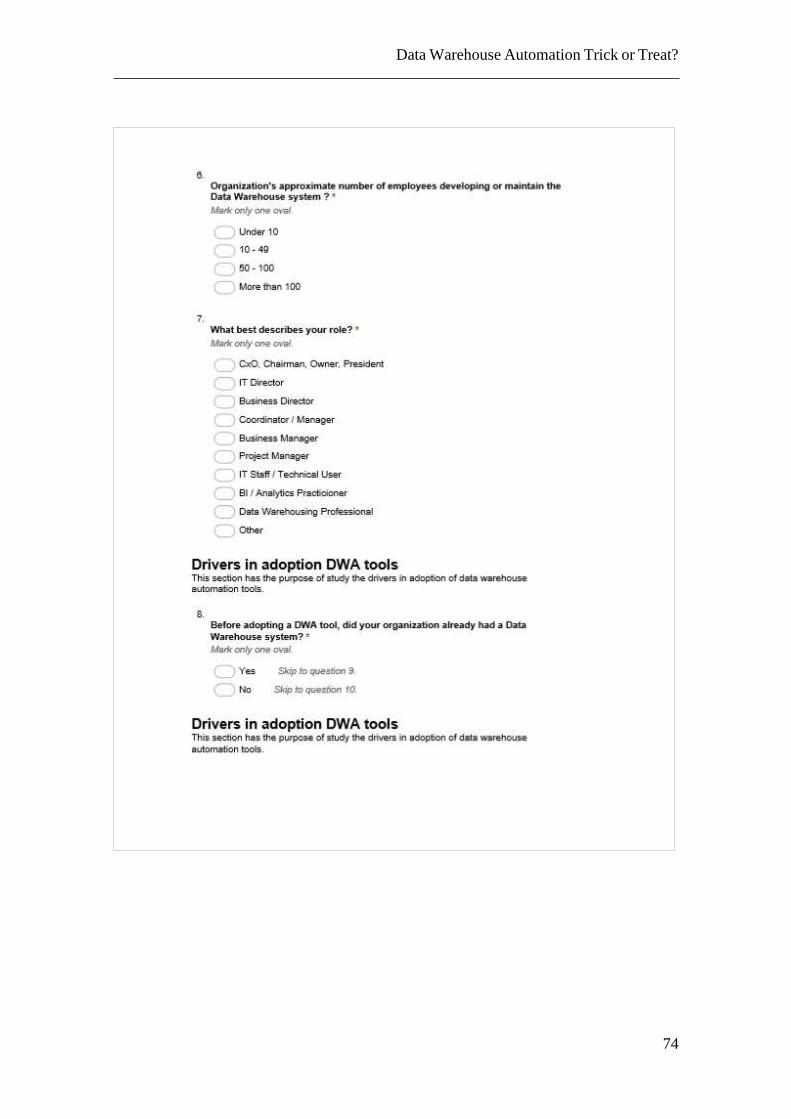
Data Warehouse Automation Trick or Treat?
74
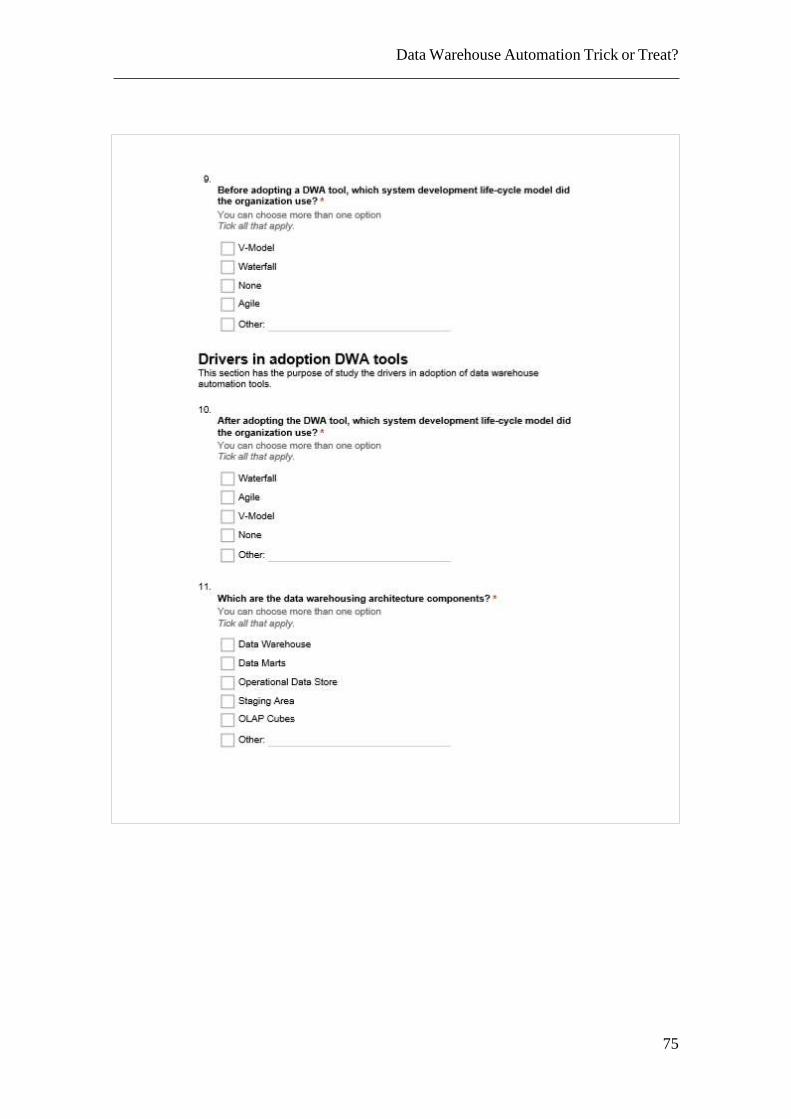
Data Warehouse Automation Trick or Treat?
75
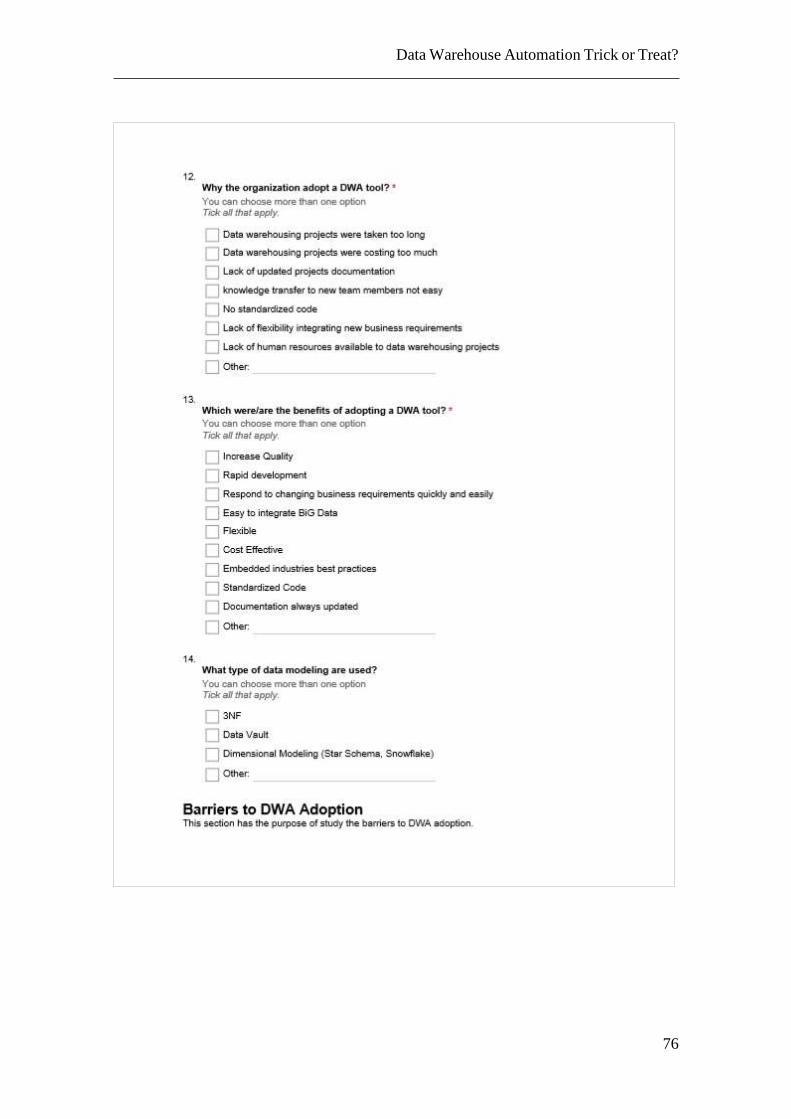
Data Warehouse Automation Trick or Treat?
76
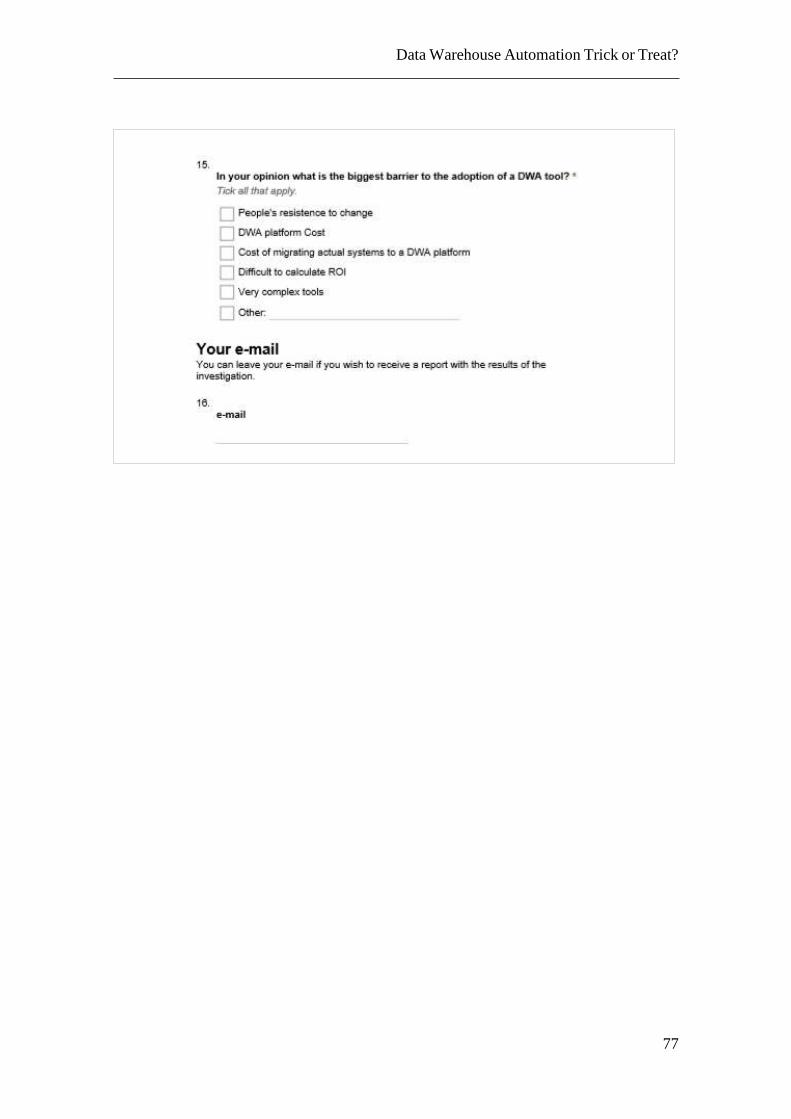
Data Warehouse Automation Trick or Treat?
77
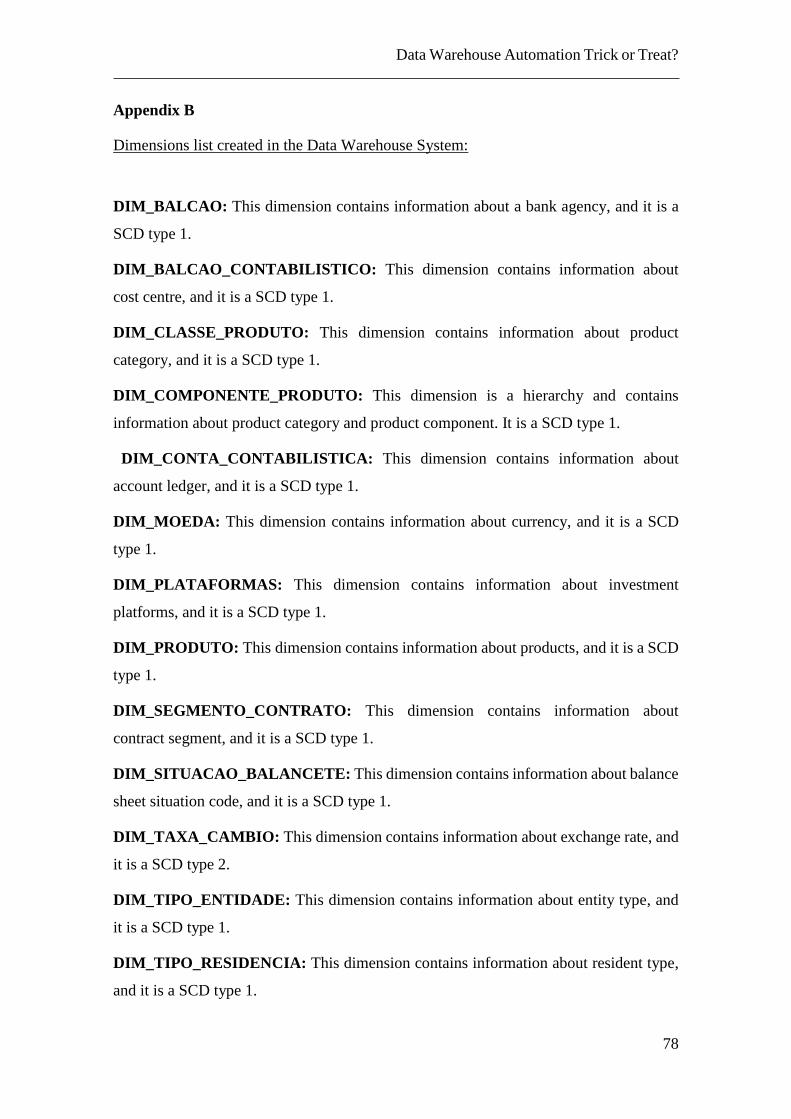
Data Warehouse Automation Trick or Treat?
78
Appendix B
Dimensions list created in the Data Warehouse System:
DIM_BALCAO: This dimension contains information about a bank agency, and it is a
SCD type 1.
DIM_BALCAO_CONTABILISTICO: This dimension contains information about
cost centre, and it is a SCD type 1.
DIM_CLASSE_PRODUTO: This dimension contains information about product
category, and it is a SCD type 1.
DIM_COMPONENTE_PRODUTO: This dimension is a hierarchy and contains
information about product category and product component. It is a SCD type 1.
DIM_CONTA_CONTABILISTICA: This dimension contains information about
account ledger, and it is a SCD type 1.
DIM_MOEDA: This dimension contains information about currency, and it is a SCD
type 1.
DIM_PLATAFORMAS: This dimension contains information about investment
platforms, and it is a SCD type 1.
DIM_PRODUTO: This dimension contains information about products, and it is a SCD
type 1.
DIM_SEGMENTO_CONTRATO: This dimension contains information about
contract segment, and it is a SCD type 1.
DIM_SITUACAO_BALANCETE: This dimension contains information about balance
sheet situation code, and it is a SCD type 1.
DIM_TAXA_CAMBIO: This dimension contains information about exchange rate, and
it is a SCD type 2.
DIM_TIPO_ENTIDADE: This dimension contains information about entity type, and
it is a SCD type 1.
DIM_TIPO_RESIDENCIA: This dimension contains information about resident type,
and it is a SCD type 1.
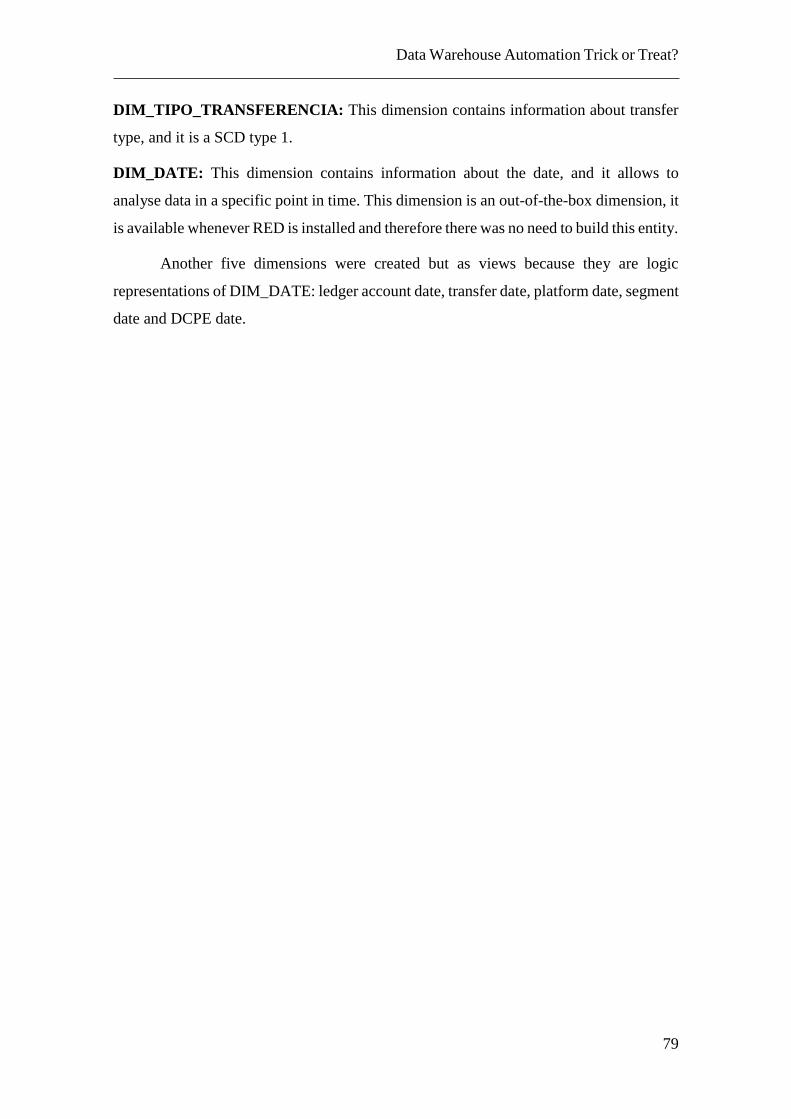
Data Warehouse Automation Trick or Treat?
79
DIM_TIPO_TRANSFERENCIA: This dimension contains information about transfer
type, and it is a SCD type 1.
DIM_DATE: This dimension contains information about the date, and it allows to
analyse data in a specific point in time. This dimension is an out-of-the-box dimension, it
is available whenever RED is installed and therefore there was no need to build this entity.
Another five dimensions were created but as views because they are logic
representations of DIM_DATE: ledger account date, transfer date, platform date, segment
date and DCPE date.
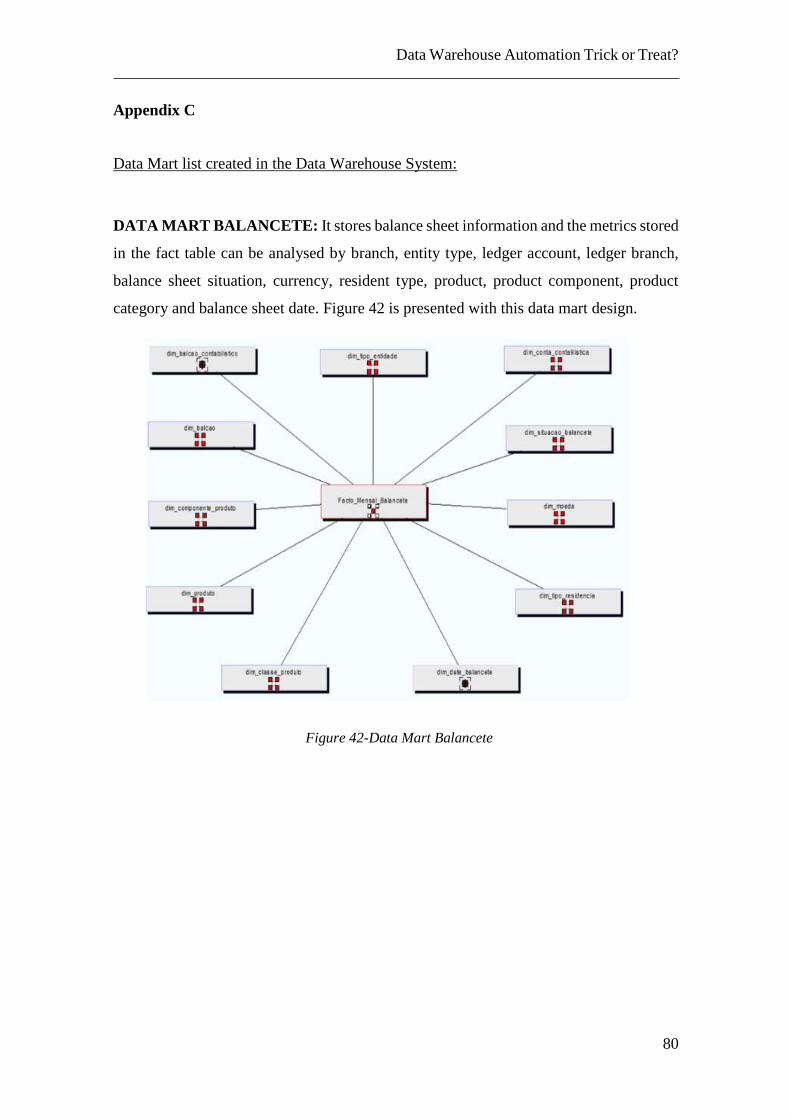
Data Warehouse Automation Trick or Treat?
80
Appendix C
Data Mart list created in the Data Warehouse System:
DATA MART BALANCETE: It stores balance sheet information and the metrics stored
in the fact table can be analysed by branch, entity type, ledger account, ledger branch,
balance sheet situation, currency, resident type, product, product component, product
category and balance sheet date. Figure 42 is presented with this data mart design.
Figure 42-Data Mart Balancete
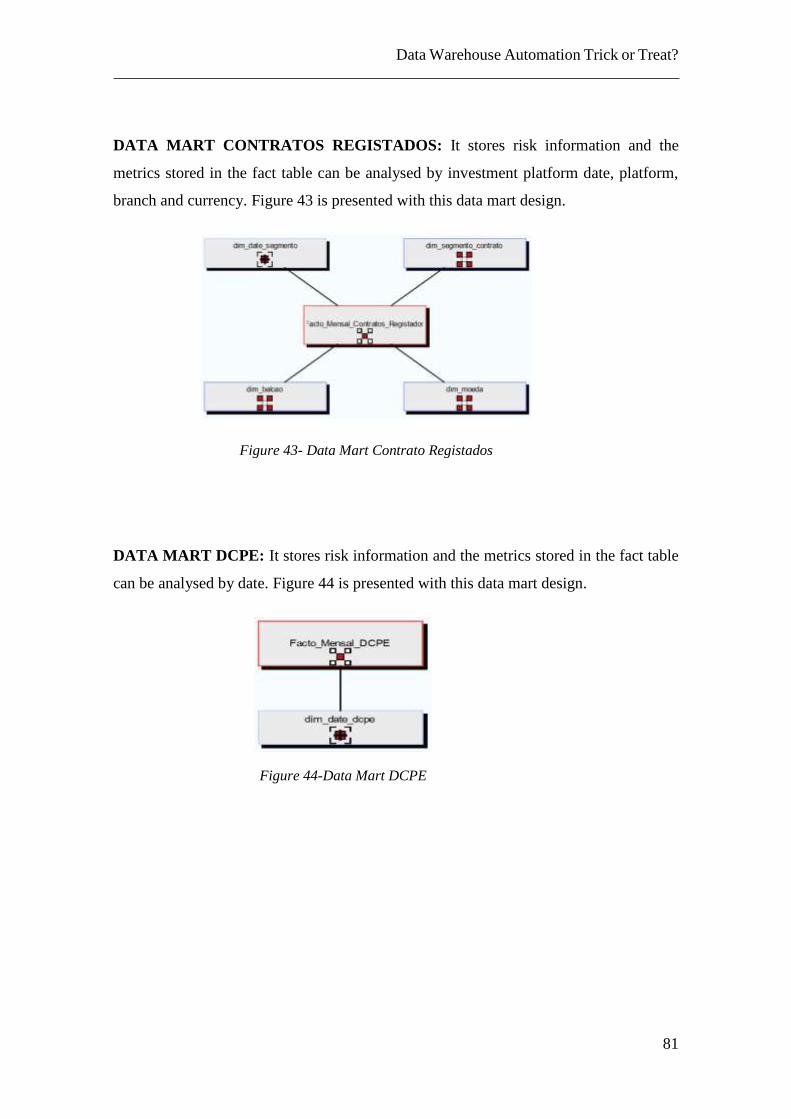
Data Warehouse Automation Trick or Treat?
81
DATA MART CONTRATOS REGISTADOS: It stores risk information and the
metrics stored in the fact table can be analysed by investment platform date, platform,
branch and currency. Figure 43 is presented with this data mart design.
DATA MART DCPE: It stores risk information and the metrics stored in the fact table
can be analysed by date. Figure 44 is presented with this data mart design.
Figure 43- Data Mart Contrato Registados
Figure 44-Data Mart DCPE
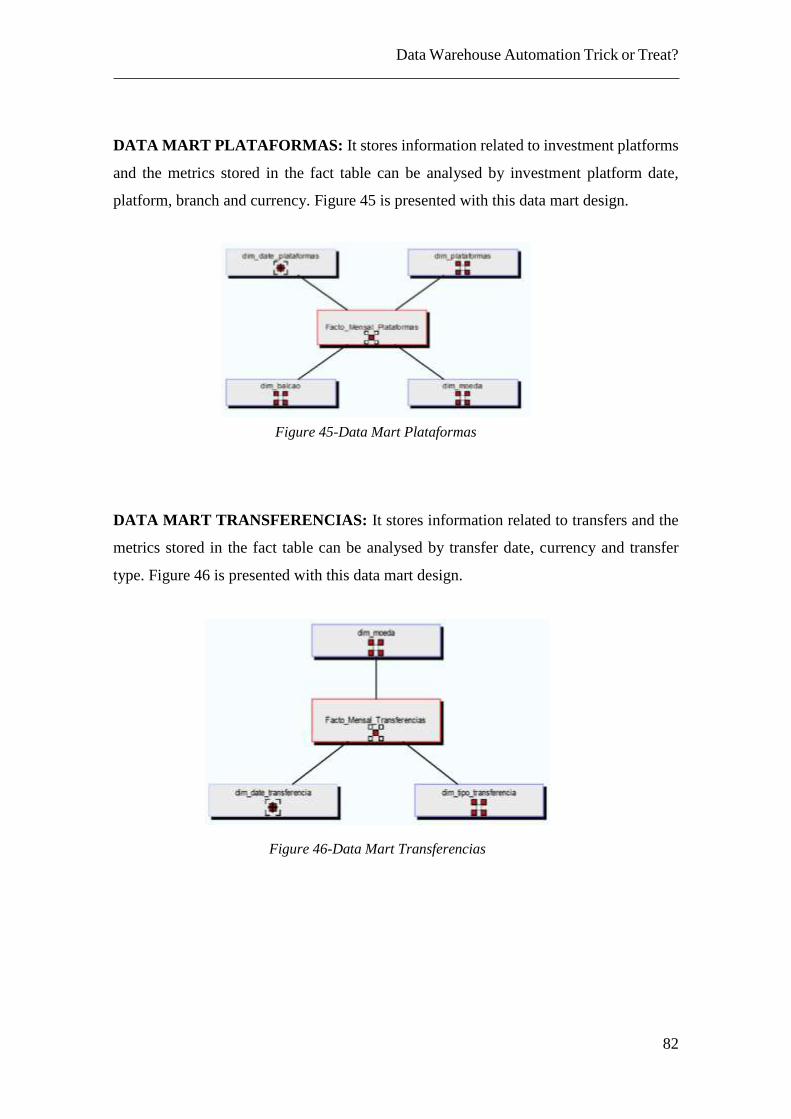
Data Warehouse Automation Trick or Treat?
82
DATA MART PLATAFORMAS: It stores information related to investment platforms
and the metrics stored in the fact table can be analysed by investment platform date,
platform, branch and currency. Figure 45 is presented with this data mart design.
DATA MART TRANSFERENCIAS: It stores information related to transfers and the
metrics stored in the fact table can be analysed by transfer date, currency and transfer
type. Figure 46 is presented with this data mart design.
Figure 45-Data Mart Plataformas
Figure 46-Data Mart Transferencias


