Embed Size (px)
Citation preview
www.datamonitor.com Datamonitor USA 245 Fifth Avenue 4th Floor New York, NY 10016 USA t: +1 212 686 7400 f: +1 212 686 2626 e: [email protected]
Datamonitor Europe Charles House 108-110 Finchley Road London NW3 5JJ United Kingdom t: +44 20 7675 7000 f: +44 20 7675 7500 e: [email protected]
Datamonitor Germany Kastor & Pollux Platz der Einheit 1 60327 Frankfurt Deutschland t: +49 69 9754 4517 f: +49 69 9754 4900 e: [email protected]
Datamonitor Asia Pacific Level 46, 2 Park Street Sydney, NSW 2000 Australia t: +61 2 8705 6900 f: +61 2 8705 6901 e: [email protected]
Beer in India
Industry Profile
Reference Code: 0102-0744Publication date: December 2007
ABOUT DATAMONITOR
All Rights Reserved.
No part of this publication may be reproduced, stored in a retrieval system or transmitted in any form by
any means, electronic, mechanical, photocopying, recording or otherwise, without the prior permission of
the publisher, Datamonitor plc.
The facts of this report are believed to be correct at the time of publication but cannot be guaranteed.
Please note that the findings, conclusions and recommendations that Datamonitor delivers will be based
on information gathered in good faith from both primary and secondary sources, whose accuracy we are
not always in a position to guarantee. As such Datamonitor can accept no liability whatever for actions
taken based on any information that may subsequently prove to be incorrect.
India - Beer
© Datamonitor (Published December 2007) Page 2
ABOUT DATAMONITOR
Datamonitor is a leading business information company specializing in industry analysis.
Through its proprietary databases and wealth of expertise, Datamonitor provides clients with unbiased expert analysis and in depth forecasts for six industry sectors: Healthcare, Technology, Automotive, Energy, Consumer Markets, and Financial Services.
The company also advises clients on the impact that new technology and eCommerce will have on their businesses. Datamonitor maintains its headquarters in London, and regional offices in New York, Frankfurt, and Hong Kong. The company serves the world’s largest 5000 companies.
Datamonitor's premium reports are based on primary research with industry panels and consumers. We gather information on market segmentation, market growth and pricing, competitors and products. Our experts then interpret this data to produce detailed forecasts and actionable recommendations, helping you create new business opportunities and ideas.
Our series of company, industry and country profiles complements our premium products, providing top-level information on 10,000 companies, 2,500 industries and 50 countries. While they do not contain the highly detailed breakdowns found in premium reports, profiles give you the most important qualitative and quantitative summary information you need - including predictions and forecasts.
EXECUTIVE SUMMARY
India - Beer
© Datamonitor (Published December 2007) Page 3
EXECUTIVE SUMMARY
Market Value
The Indian beer market grew by 10.2% in 2007 to reach a value of $2.5 billion.
Market Value Forecast
In 2012, the Indian beer market is forecast to have a value of $3.9 billion, an increase of 53.9% since 2007.
Market Volume
The Indian beer market grew by 9.3% in 2007 to reach a volume of 1.1 billion liters.
Market Volume Forecast
In 2012, the Indian beer market is forecast to have a volume of 1.6 billion liters, an increase of 46.4% since 2007.
Market Segmentation I
Sales of standard lager form the most lucrative sector of the Indian beer market, with an 95.8% share of the market's value.
Market Segmentation II
India accounts for 2.9% of the Asia-Pacific market by value.
Market Share
United Breweries (Holdings) Limited is the leading company in the Indian beer market, with a 45.5% share of the market's volume.
Distribution
On-trade sales form the leading distribution channel, with a 73.1% share of the Indian beer market by volume.
CONTENTS
India - Beer
© Datamonitor (Published December 2007) Page 4
TABLE OF CONTENTS
EXECUTIVE SUMMARY 3
CHAPTER 1 Market Overview 7
1.1 Market Definition 7
1.2 Research Highlights 7
1.3 Market Analysis 8
CHAPTER 2 Market Value 9
CHAPTER 3 Market Volume 10
CHAPTER 4 Market Segmentation I 11
CHAPTER 5 Market Segmentation II 12
CHAPTER 6 Market Share 13
CHAPTER 7 Five Forces Analysis 14
7.1 Summary 14
7.2 Buyer Power 15
7.3 Supplier Power 16
7.4 New Entrants 17
7.5 Substitutes 19
7.6 Rivalry 20
CONTENTS
India - Beer
© Datamonitor (Published December 2007) Page 5
CHAPTER 8 Leading Companies 21
8.1 United Breweries (Holdings) Limited 21
8.2 SABMiller 22
8.3 Mohan Meakin 26
CHAPTER 9 Distribution 27
CHAPTER 10 Market Forecasts 28
10.1 Market Value Forecast 28
10.2 Market Volume Forecast 29
CHAPTER 11 Macroeconomic Indicators 30
CHAPTER 12 Appendix 32
12.1 Methodology 32
12.2 Industry Associations 33
12.3 Related Datamonitor Research 33
CONTENTS
India - Beer
© Datamonitor (Published December 2007) Page 6
LIST OF TABLES
Table 1: India Beer Market Value: $ billion, 2003-2007 ....................................................9
Table 2: India Beer Market Volume: Liters billion, 2003-2007.........................................10
Table 3: India Beer Market Segmentation I: % Share, by Value, 2007 ...........................11
Table 4: India Beer Market Segmentation II: % Share, by Value, 2007 ..........................12
Table 5: India Beer Market Share: % Share, by Volume, 2007.......................................13
Table 6: Key Facts: United Breweries (Holdings) Limited ...............................................21
Table 7: Key Facts: SABMiller ........................................................................................22
Table 8: Key Financials: SABMiller.................................................................................25
Table 9: Key Facts: Mohan Meakin ................................................................................26
Table 10: India Beer Distribution: % Share, by Volume, 2007 ..........................................27
Table 11: India Beer Market Value Forecast: $ billion, 2007-2012....................................28
Table 12: India Beer Market Volume Forecast: Liters billion, 2007-2012..........................29
Table 13: India Size of Population (million) , 2003-2007...................................................30
Table 14: India GDP (Constant 2000 Prices, $ billion), 2003-2007...................................30
Table 15: India Inflation, 2003-2007 .................................................................................30
Table 16: India Exchange Rate, 2003-2007 .....................................................................31
MARKET OVERVIEW
India - Beer
© Datamonitor (Published December 2007) Page 7
CHAPTER 1 MARKET OVERVIEW
1.1 Market Definition
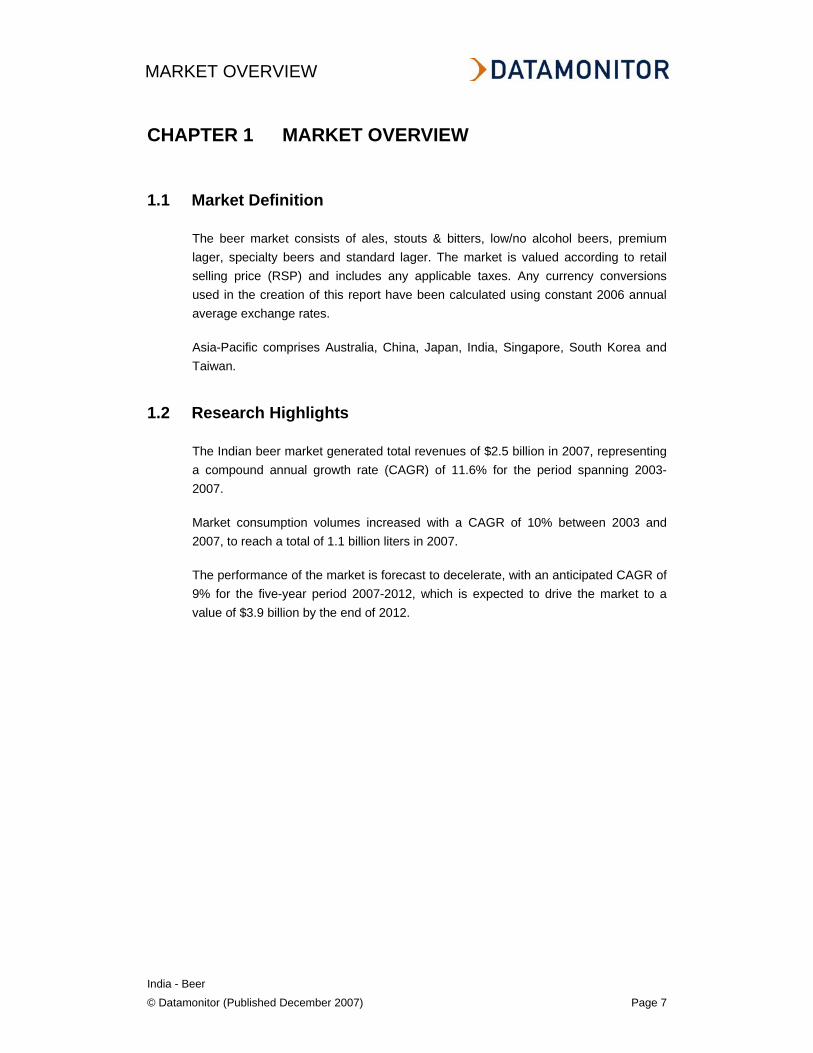
The beer market consists of ales, stouts & bitters, low/no alcohol beers, premium lager, specialty beers and standard lager. The market is valued according to retail selling price (RSP) and includes any applicable taxes. Any currency conversions used in the creation of this report have been calculated using constant 2006 annual average exchange rates.
Asia-Pacific comprises Australia, China, Japan, India, Singapore, South Korea and Taiwan.
1.2 Research Highlights
The Indian beer market generated total revenues of $2.5 billion in 2007, representing a compound annual growth rate (CAGR) of 11.6% for the period spanning 2003-2007.
Market consumption volumes increased with a CAGR of 10% between 2003 and 2007, to reach a total of 1.1 billion liters in 2007.
The performance of the market is forecast to decelerate, with an anticipated CAGR of 9% for the five-year period 2007-2012, which is expected to drive the market to a value of $3.9 billion by the end of 2012.
MARKET OVERVIEW
India - Beer
© Datamonitor (Published December 2007) Page 8
1.3 Market Analysis
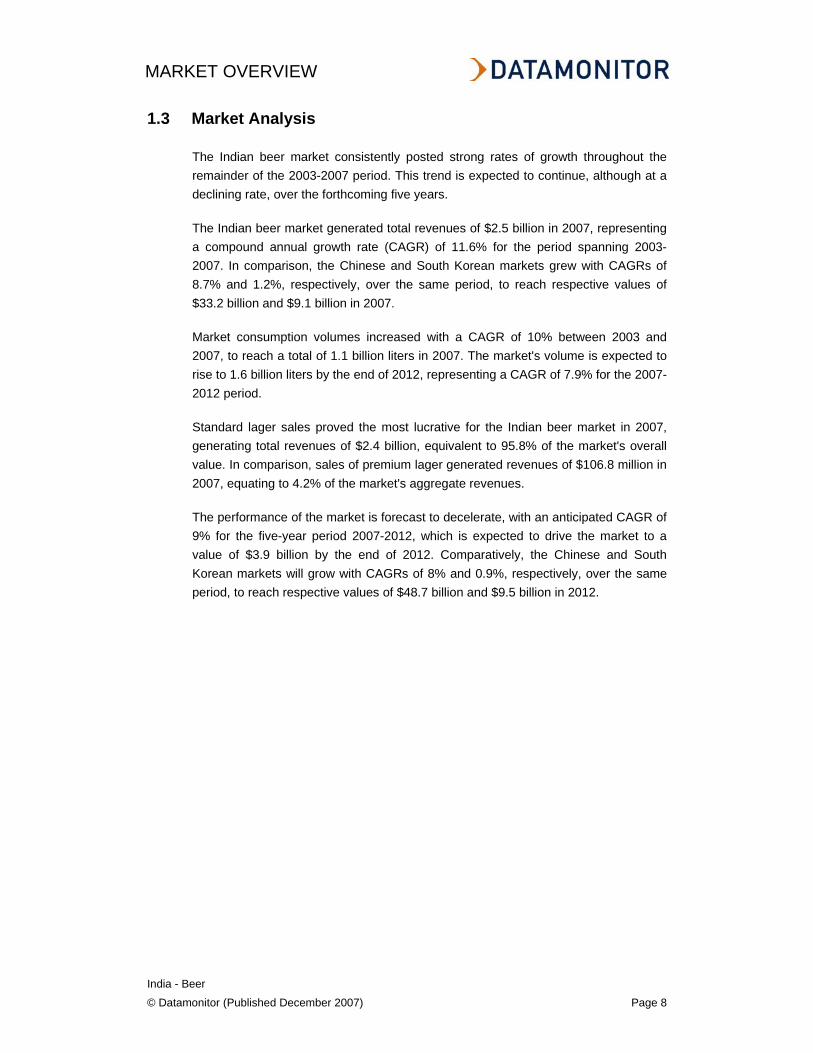
The Indian beer market consistently posted strong rates of growth throughout the remainder of the 2003-2007 period. This trend is expected to continue, although at a declining rate, over the forthcoming five years.
The Indian beer market generated total revenues of $2.5 billion in 2007, representing a compound annual growth rate (CAGR) of 11.6% for the period spanning 2003-2007. In comparison, the Chinese and South Korean markets grew with CAGRs of 8.7% and 1.2%, respectively, over the same period, to reach respective values of $33.2 billion and $9.1 billion in 2007.
Market consumption volumes increased with a CAGR of 10% between 2003 and 2007, to reach a total of 1.1 billion liters in 2007. The market's volume is expected to rise to 1.6 billion liters by the end of 2012, representing a CAGR of 7.9% for the 2007-2012 period.
Standard lager sales proved the most lucrative for the Indian beer market in 2007, generating total revenues of $2.4 billion, equivalent to 95.8% of the market's overall value. In comparison, sales of premium lager generated revenues of $106.8 million in 2007, equating to 4.2% of the market's aggregate revenues.
The performance of the market is forecast to decelerate, with an anticipated CAGR of 9% for the five-year period 2007-2012, which is expected to drive the market to a value of $3.9 billion by the end of 2012. Comparatively, the Chinese and South Korean markets will grow with CAGRs of 8% and 0.9%, respectively, over the same period, to reach respective values of $48.7 billion and $9.5 billion in 2012.
MARKET VALUE
India - Beer
© Datamonitor (Published December 2007) Page 9
CHAPTER 2 MARKET VALUE
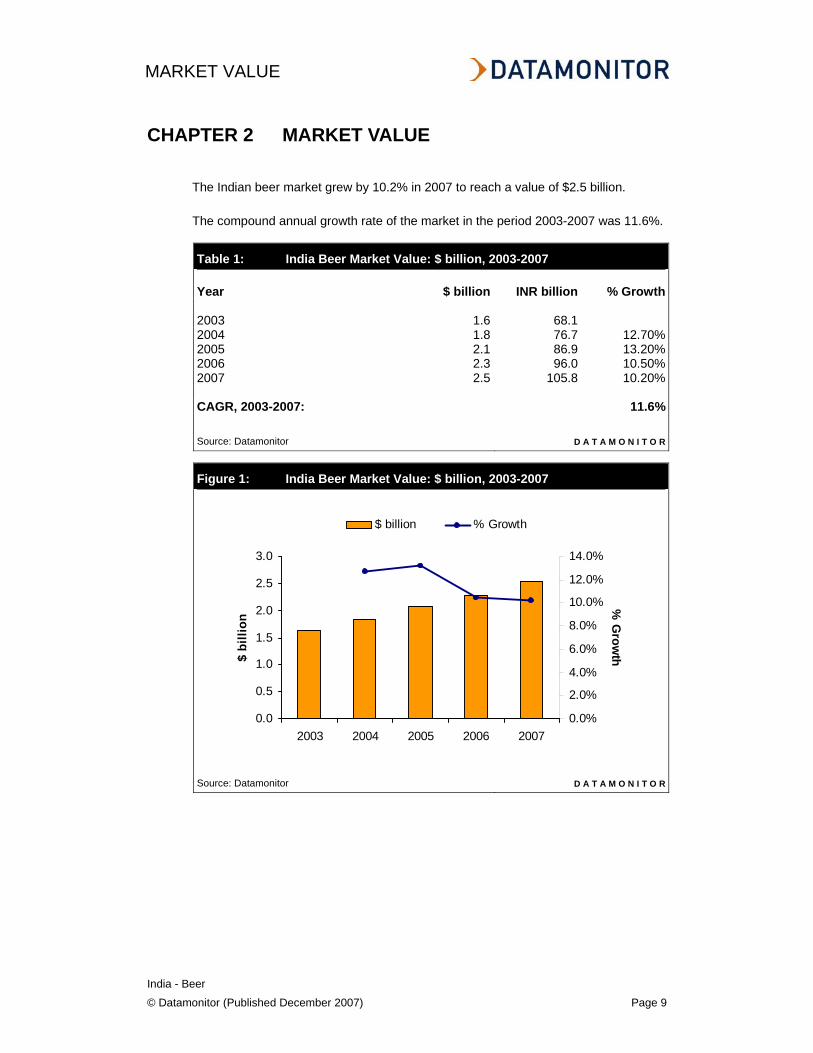
The Indian beer market grew by 10.2% in 2007 to reach a value of $2.5 billion.
The compound annual growth rate of the market in the period 2003-2007 was 11.6%.
Table 1: India Beer Market Value: $ billion, 2003-2007 Year $ billion INR billion % Growth 2003 1.6 68.1 2004 1.8 76.7 12.70%2005 2.1 86.9 13.20%2006 2.3 96.0 10.50%2007 2.5 105.8 10.20% CAGR, 2003-2007: 11.6% Source: Datamonitor D A T A M O N I T O R
Figure 1: India Beer Market Value: $ billion, 2003-2007
Source: Datamonitor D A T A M O N I T O R
0.0
0.5
1.0
1.5
2.0
2.5
3.0
2003 2004 2005 2006 2007
$ bi
llion
0.0%
2.0%
4.0%
6.0%
8.0%
10.0%
12.0%
14.0%
% G
rowth
$ billion % Growth
MARKET VOLUME
India - Beer
© Datamonitor (Published December 2007) Page 10
CHAPTER 3 MARKET VOLUME
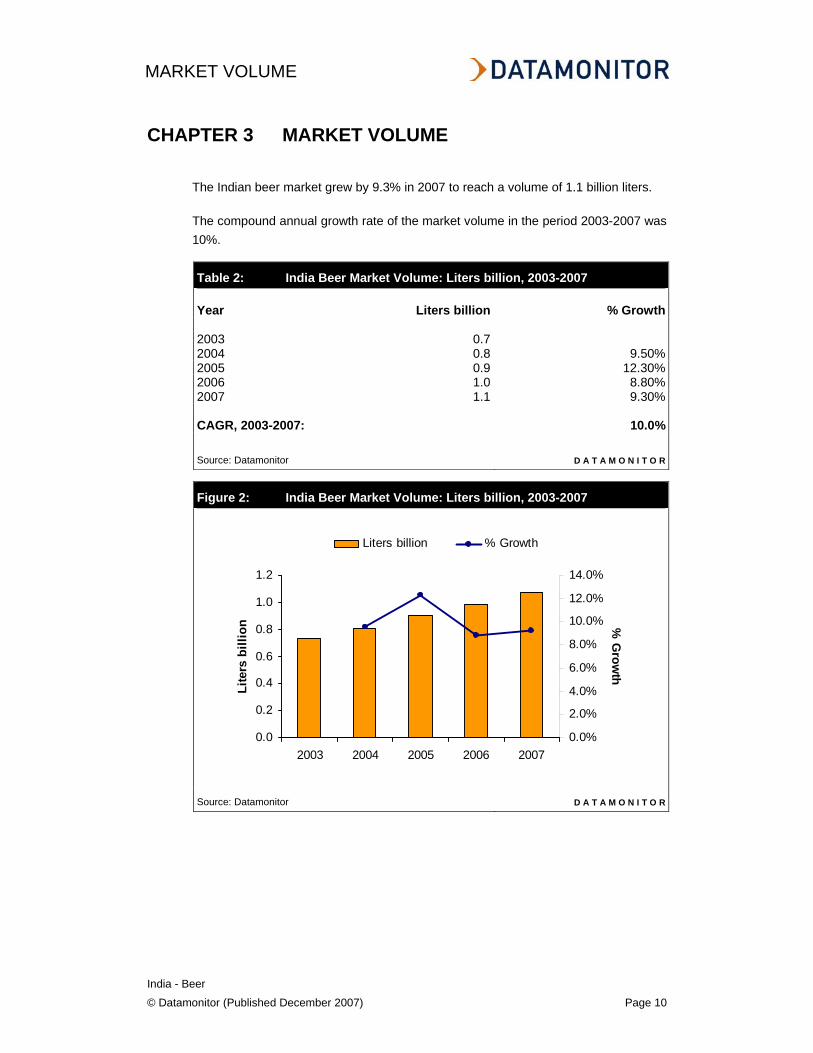
The Indian beer market grew by 9.3% in 2007 to reach a volume of 1.1 billion liters.
The compound annual growth rate of the market volume in the period 2003-2007 was 10%.
Table 2: India Beer Market Volume: Liters billion, 2003-2007 Year Liters billion % Growth 2003 0.7 2004 0.8 9.50%2005 0.9 12.30%2006 1.0 8.80%2007 1.1 9.30% CAGR, 2003-2007: 10.0% Source: Datamonitor D A T A M O N I T O R
Figure 2: India Beer Market Volume: Liters billion, 2003-2007
Source: Datamonitor D A T A M O N I T O R
0.0
0.2
0.4
0.6
0.8
1.0
1.2
2003 2004 2005 2006 2007
Lite
rs b
illio
n
0.0%
2.0%
4.0%
6.0%
8.0%
10.0%
12.0%
14.0%
% G
rowth
Liters billion % Growth
MARKET SEGMENTATION I
India - Beer
© Datamonitor (Published December 2007) Page 11
CHAPTER 4 MARKET SEGMENTATION I
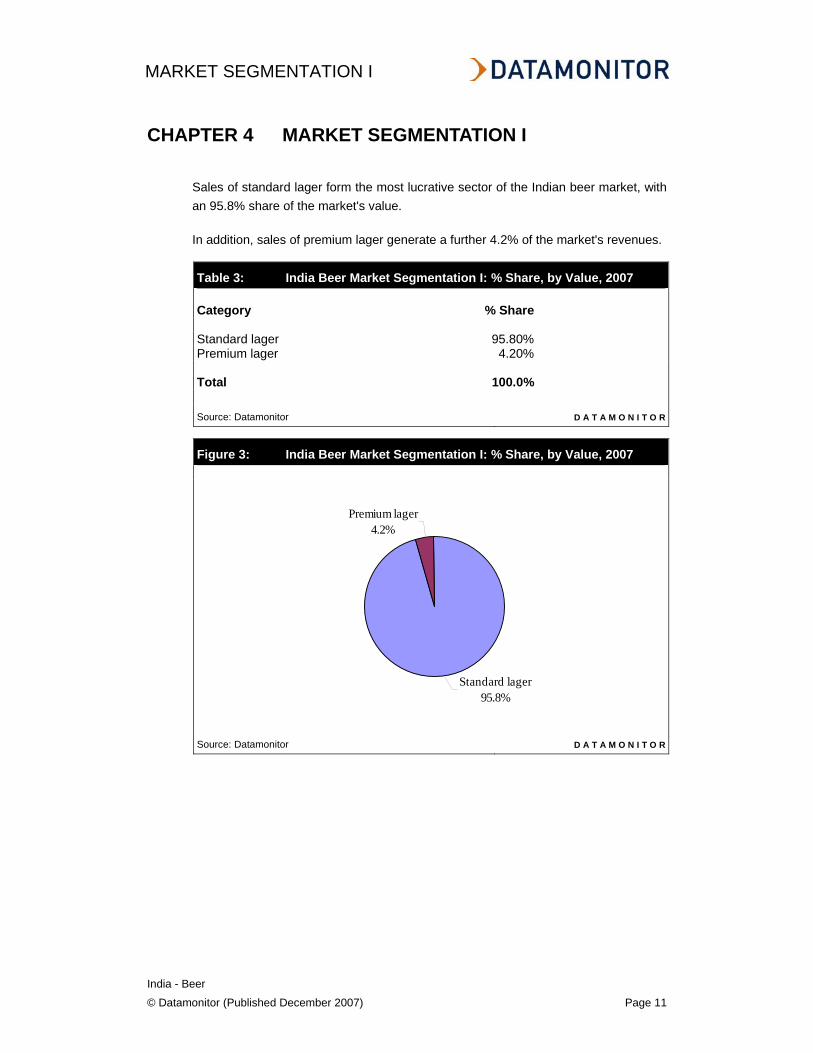
Sales of standard lager form the most lucrative sector of the Indian beer market, with an 95.8% share of the market's value.
In addition, sales of premium lager generate a further 4.2% of the market's revenues.
Table 3: India Beer Market Segmentation I: % Share, by Value, 2007 Category % Share Standard lager 95.80%Premium lager 4.20% Total 100.0% Source: Datamonitor D A T A M O N I T O R
Figure 3: India Beer Market Segmentation I: % Share, by Value, 2007
Standard lager95.8%
Premium lager4.2%
Source: Datamonitor D A T A M O N I T O R
MARKET SEGMENTATION II
India - Beer
© Datamonitor (Published December 2007) Page 12
CHAPTER 5 MARKET SEGMENTATION II
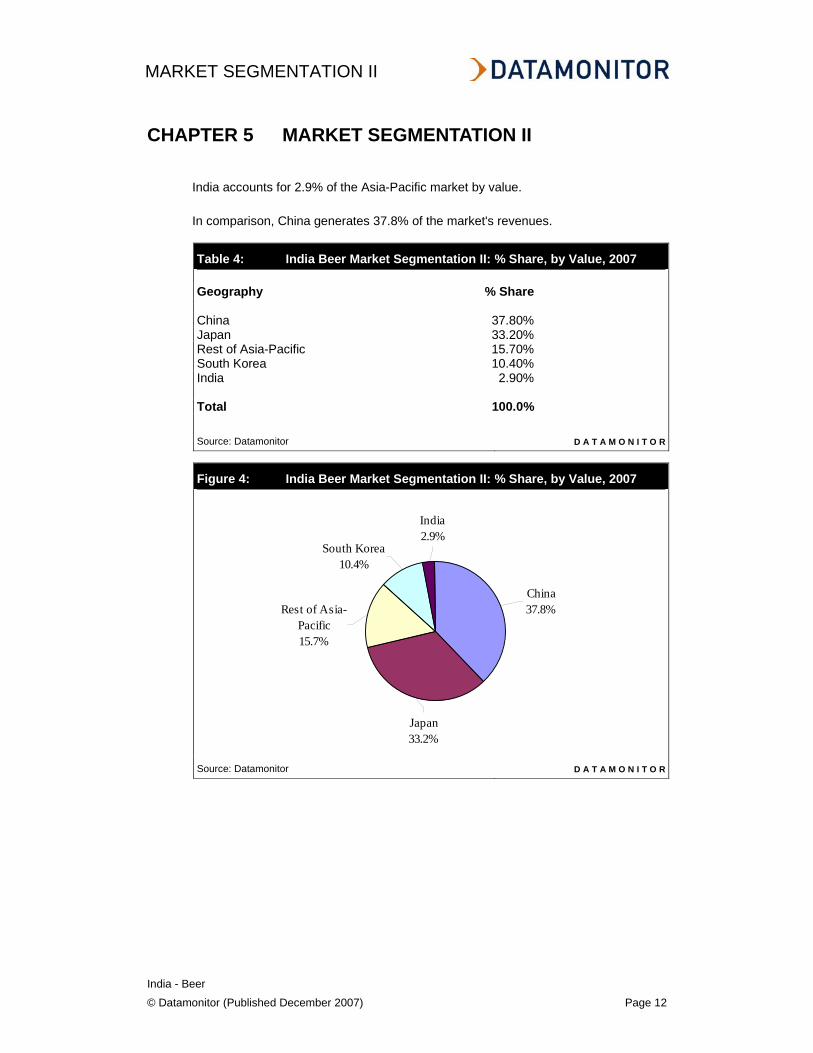
India accounts for 2.9% of the Asia-Pacific market by value.
In comparison, China generates 37.8% of the market's revenues.
Table 4: India Beer Market Segmentation II: % Share, by Value, 2007 Geography % Share China 37.80%Japan 33.20%Rest of Asia-Pacific 15.70%South Korea 10.40%India 2.90% Total 100.0% Source: Datamonitor D A T A M O N I T O R
Figure 4: India Beer Market Segmentation II: % Share, by Value, 2007
Japan33.2%
Rest of Asia-Pacific15.7%
South Korea10.4%
India2.9%
China37.8%
Source: Datamonitor D A T A M O N I T O R
MARKET SHARE
India - Beer
© Datamonitor (Published December 2007) Page 13
CHAPTER 6 MARKET SHARE
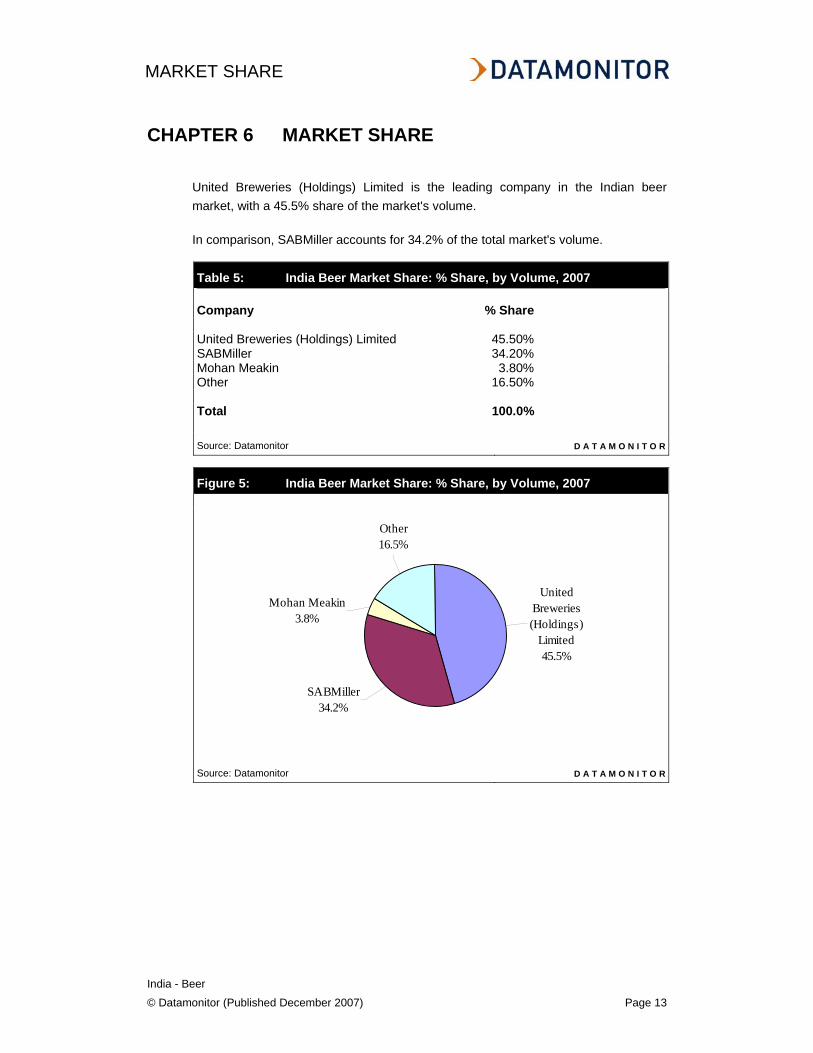
United Breweries (Holdings) Limited is the leading company in the Indian beer market, with a 45.5% share of the market's volume.
In comparison, SABMiller accounts for 34.2% of the total market's volume.
Table 5: India Beer Market Share: % Share, by Volume, 2007 Company % Share United Breweries (Holdings) Limited 45.50%SABMiller 34.20%Mohan Meakin 3.80%Other 16.50% Total 100.0% Source: Datamonitor D A T A M O N I T O R
Figure 5: India Beer Market Share: % Share, by Volume, 2007
Other16.5%
SABMiller34.2%
Mohan Meakin3.8%
United Breweries (Holdings)
Limited45.5%
Source: Datamonitor D A T A M O N I T O R
FIVE FORCES ANALYSIS
India - Beer
© Datamonitor (Published December 2007) Page 14
CHAPTER 7 FIVE FORCES ANALYSIS
7.1 Summary
Figure 6: Forces Driving Competition in the Beer Market in India, 2007
012345
Buyer Pow er
Supplier Pow er
New EntrantsSubstitutes
Degree of rivalry
Score for each force is mean of scores for its drivers. Total area & color indicates intensity of competition overall. Source: Datamonitor D A T A M O N I T O R
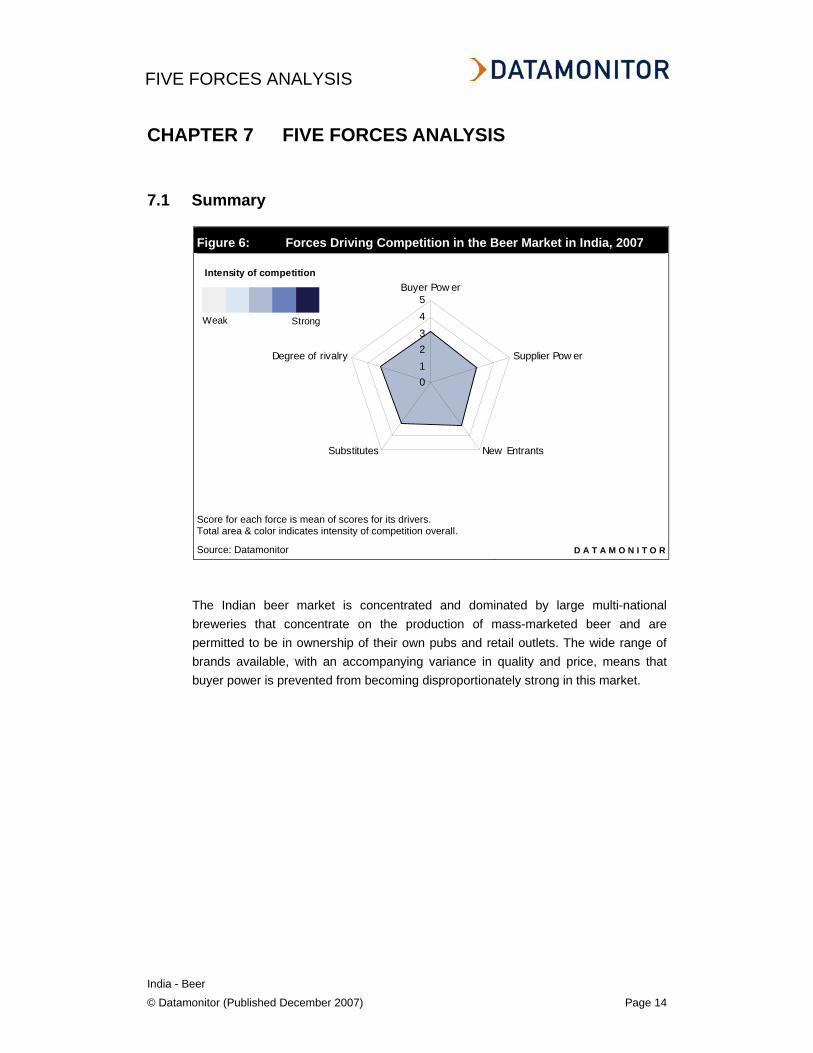
The Indian beer market is concentrated and dominated by large multi-national breweries that concentrate on the production of mass-marketed beer and are permitted to be in ownership of their own pubs and retail outlets. The wide range of brands available, with an accompanying variance in quality and price, means that buyer power is prevented from becoming disproportionately strong in this market.
Intensity of competition
Weak Strong
FIVE FORCES ANALYSIS
India - Beer
© Datamonitor (Published December 2007) Page 15
7.2 Buyer Power
Figure 7: Drivers of Buyer Power in the Beer Market in India, 2007
012345
Buyer size
Oligopsony threat
Low -cost sw itching
Undif ferentiated product
Tendency to sw itch
Price sensitivity
Financial muscle
Backw ards integration
Buyer independence
Product dispensability
Scores: 1= weak driver...5=strong driver Source: Datamonitor D A T A M O N I T O R
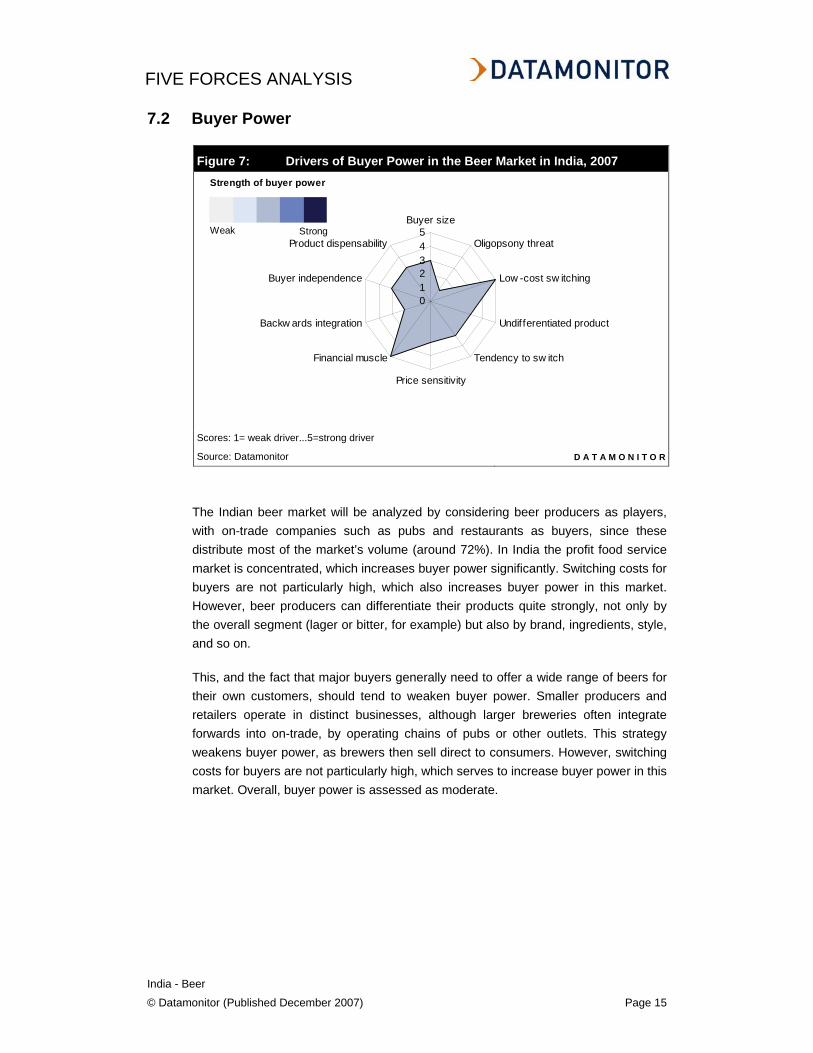
The Indian beer market will be analyzed by considering beer producers as players, with on-trade companies such as pubs and restaurants as buyers, since these distribute most of the market’s volume (around 72%). In India the profit food service market is concentrated, which increases buyer power significantly. Switching costs for buyers are not particularly high, which also increases buyer power in this market. However, beer producers can differentiate their products quite strongly, not only by the overall segment (lager or bitter, for example) but also by brand, ingredients, style, and so on.
This, and the fact that major buyers generally need to offer a wide range of beers for their own customers, should tend to weaken buyer power. Smaller producers and retailers operate in distinct businesses, although larger breweries often integrate forwards into on-trade, by operating chains of pubs or other outlets. This strategy weakens buyer power, as brewers then sell direct to consumers. However, switching costs for buyers are not particularly high, which serves to increase buyer power in this market. Overall, buyer power is assessed as moderate.
Strength of buyer power
Weak Strong
FIVE FORCES ANALYSIS
India - Beer
© Datamonitor (Published December 2007) Page 16
7.3 Supplier Power
Figure 8: Drivers of Supplier Power in the Beer Market in India, 2007
012345
Supplier size
Oligopoly threat
Sw itching costs
Player independence
Player dispensabilityNo substitute inputs
Importance of quality/cost
Differentiated input
Forw ard integration
Scores: 1= weak driver...5=strong driver Source: Datamonitor D A T A M O N I T O R
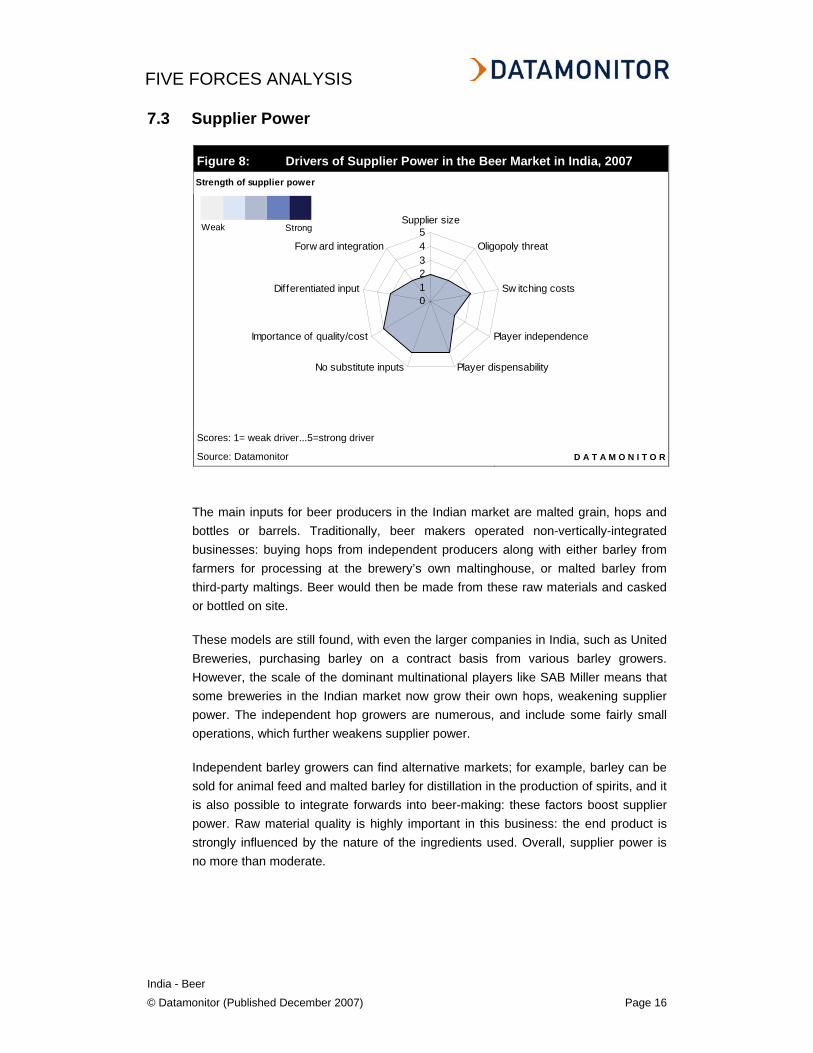
The main inputs for beer producers in the Indian market are malted grain, hops and bottles or barrels. Traditionally, beer makers operated non-vertically-integrated businesses: buying hops from independent producers along with either barley from farmers for processing at the brewery’s own maltinghouse, or malted barley from third-party maltings. Beer would then be made from these raw materials and casked or bottled on site.
These models are still found, with even the larger companies in India, such as United Breweries, purchasing barley on a contract basis from various barley growers. However, the scale of the dominant multinational players like SAB Miller means that some breweries in the Indian market now grow their own hops, weakening supplier power. The independent hop growers are numerous, and include some fairly small operations, which further weakens supplier power.
Independent barley growers can find alternative markets; for example, barley can be sold for animal feed and malted barley for distillation in the production of spirits, and it is also possible to integrate forwards into beer-making: these factors boost supplier power. Raw material quality is highly important in this business: the end product is strongly influenced by the nature of the ingredients used. Overall, supplier power is no more than moderate.
Strength of supplier power
Weak Strong
FIVE FORCES ANALYSIS
India - Beer
© Datamonitor (Published December 2007) Page 17
7.4 New Entrants
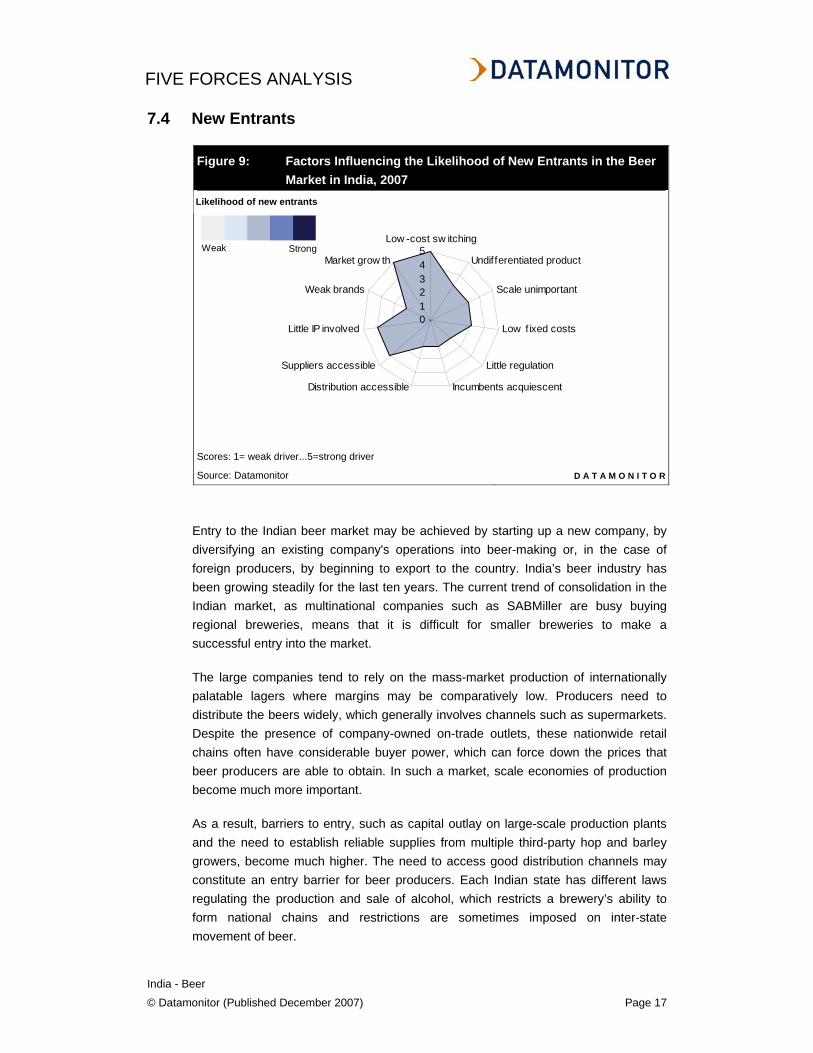
Figure 9: Factors Influencing the Likelihood of New Entrants in the Beer Market in India, 2007
012345
Low -cost sw itching
Undifferentiated product
Scale unimportant
Low fixed costs
Little regulation
Incumbents acquiescentDistribution accessible
Suppliers accessible
Little IP involved
Weak brands
Market grow th
Scores: 1= weak driver...5=strong driver Source: Datamonitor D A T A M O N I T O R
Entry to the Indian beer market may be achieved by starting up a new company, by diversifying an existing company's operations into beer-making or, in the case of foreign producers, by beginning to export to the country. India’s beer industry has been growing steadily for the last ten years. The current trend of consolidation in the Indian market, as multinational companies such as SABMiller are busy buying regional breweries, means that it is difficult for smaller breweries to make a successful entry into the market.
The large companies tend to rely on the mass-market production of internationally palatable lagers where margins may be comparatively low. Producers need to distribute the beers widely, which generally involves channels such as supermarkets. Despite the presence of company-owned on-trade outlets, these nationwide retail chains often have considerable buyer power, which can force down the prices that beer producers are able to obtain. In such a market, scale economies of production become much more important.
As a result, barriers to entry, such as capital outlay on large-scale production plants and the need to establish reliable supplies from multiple third-party hop and barley growers, become much higher. The need to access good distribution channels may constitute an entry barrier for beer producers. Each Indian state has different laws regulating the production and sale of alcohol, which restricts a brewery’s ability to form national chains and restrictions are sometimes imposed on inter-state movement of beer.
Likelihood of new entrants
Weak Strong
FIVE FORCES ANALYSIS
India - Beer
© Datamonitor (Published December 2007) Page 18
Despite the fact that breweries are now legally permitted to own retail outlets, smaller breweries may not be able to afford to do this and must persuade local supermarkets, specialist stores, and on-trade businesses to stock their products. Overall, there is a moderate likelihood of new entrants.
FIVE FORCES ANALYSIS
India - Beer
© Datamonitor (Published December 2007) Page 19
7.5 Substitutes
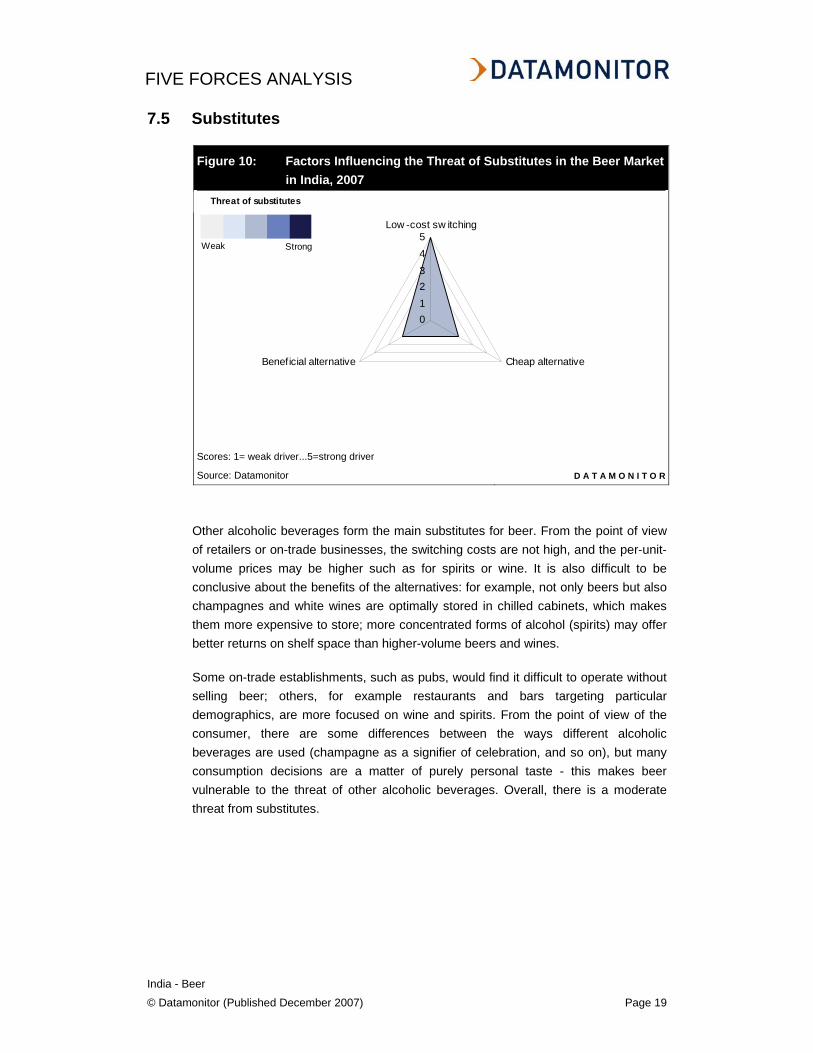
Figure 10: Factors Influencing the Threat of Substitutes in the Beer Market in India, 2007
012345
Low -cost sw itching
Cheap alternativeBeneficial alternative
Scores: 1= weak driver...5=strong driver Source: Datamonitor D A T A M O N I T O R
Other alcoholic beverages form the main substitutes for beer. From the point of view of retailers or on-trade businesses, the switching costs are not high, and the per-unit-volume prices may be higher such as for spirits or wine. It is also difficult to be conclusive about the benefits of the alternatives: for example, not only beers but also champagnes and white wines are optimally stored in chilled cabinets, which makes them more expensive to store; more concentrated forms of alcohol (spirits) may offer better returns on shelf space than higher-volume beers and wines.
Some on-trade establishments, such as pubs, would find it difficult to operate without selling beer; others, for example restaurants and bars targeting particular demographics, are more focused on wine and spirits. From the point of view of the consumer, there are some differences between the ways different alcoholic beverages are used (champagne as a signifier of celebration, and so on), but many consumption decisions are a matter of purely personal taste - this makes beer vulnerable to the threat of other alcoholic beverages. Overall, there is a moderate threat from substitutes.
Threat of substitutes
Weak Strong
FIVE FORCES ANALYSIS
India - Beer
© Datamonitor (Published December 2007) Page 20
7.6 Rivalry
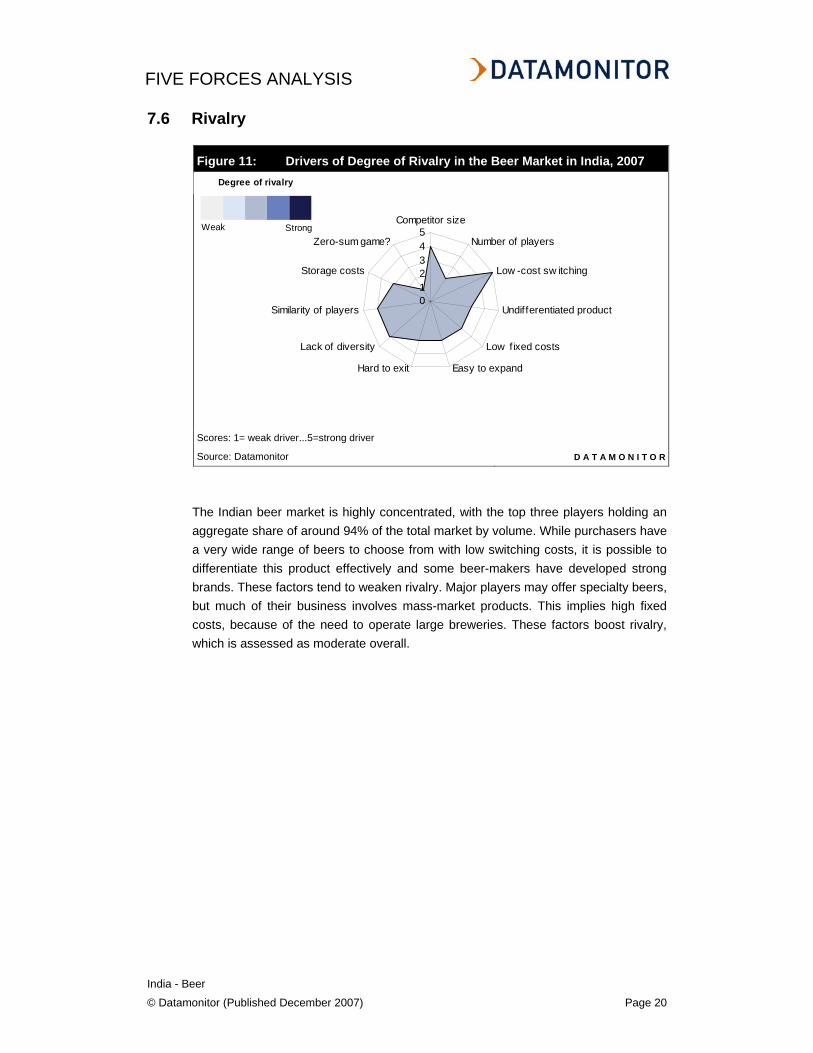
Figure 11: Drivers of Degree of Rivalry in the Beer Market in India, 2007
012345
Competitor size
Number of players
Low -cost sw itching
Undifferentiated product
Low fixed costs
Easy to expandHard to exit
Lack of diversity
Similarity of players
Storage costs
Zero-sum game?
Scores: 1= weak driver...5=strong driver Source: Datamonitor D A T A M O N I T O R
The Indian beer market is highly concentrated, with the top three players holding an aggregate share of around 94% of the total market by volume. While purchasers have a very wide range of beers to choose from with low switching costs, it is possible to differentiate this product effectively and some beer-makers have developed strong brands. These factors tend to weaken rivalry. Major players may offer specialty beers, but much of their business involves mass-market products. This implies high fixed costs, because of the need to operate large breweries. These factors boost rivalry, which is assessed as moderate overall.
Degree of rivalry
Weak Strong
LEADING COMPANIES
India - Beer
© Datamonitor (Published December 2007) Page 21
CHAPTER 8 LEADING COMPANIES
8.1 United Breweries (Holdings) Limited
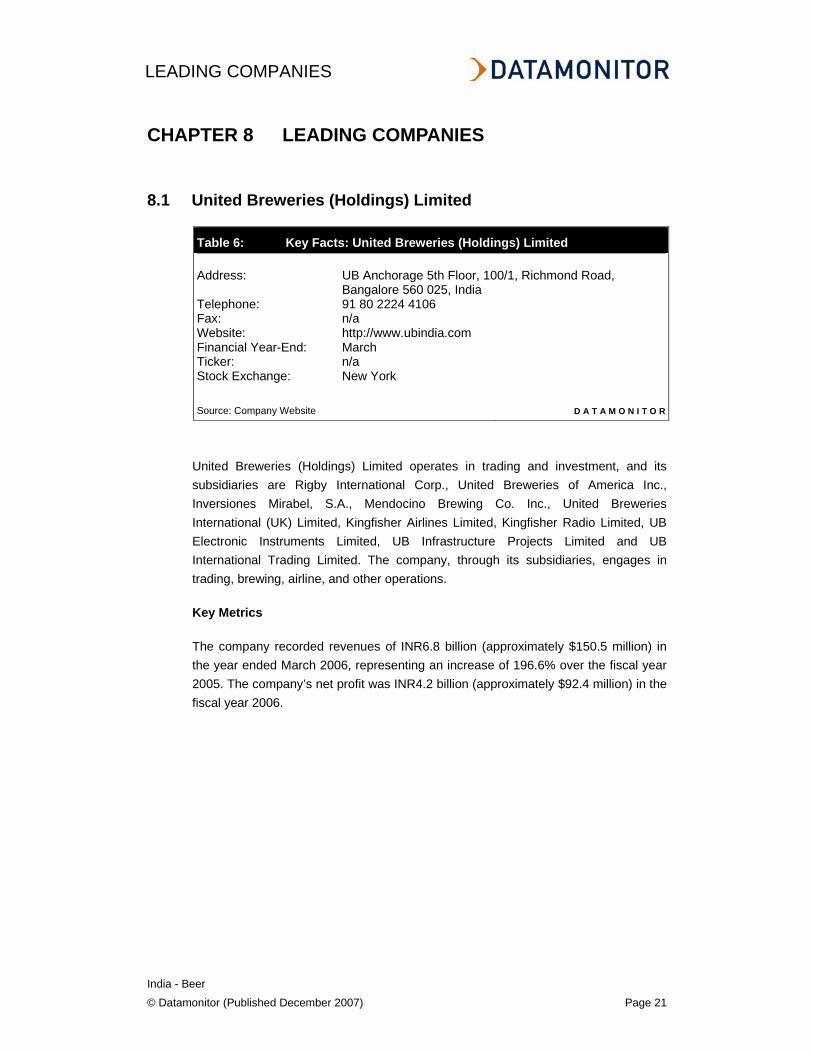
Table 6: Key Facts: United Breweries (Holdings) Limited Address: UB Anchorage 5th Floor, 100/1, Richmond Road,
Bangalore 560 025, India Telephone: 91 80 2224 4106 Fax: n/a Website: http://www.ubindia.com Financial Year-End: March Ticker: n/a Stock Exchange: New York Source: Company Website D A T A M O N I T O R
United Breweries (Holdings) Limited operates in trading and investment, and its subsidiaries are Rigby International Corp., United Breweries of America Inc., Inversiones Mirabel, S.A., Mendocino Brewing Co. Inc., United Breweries International (UK) Limited, Kingfisher Airlines Limited, Kingfisher Radio Limited, UB Electronic Instruments Limited, UB Infrastructure Projects Limited and UB International Trading Limited. The company, through its subsidiaries, engages in trading, brewing, airline, and other operations.
Key Metrics
The company recorded revenues of INR6.8 billion (approximately $150.5 million) in the year ended March 2006, representing an increase of 196.6% over the fiscal year 2005. The company’s net profit was INR4.2 billion (approximately $92.4 million) in the fiscal year 2006.
LEADING COMPANIES
India - Beer
© Datamonitor (Published December 2007) Page 22
8.2 SABMiller
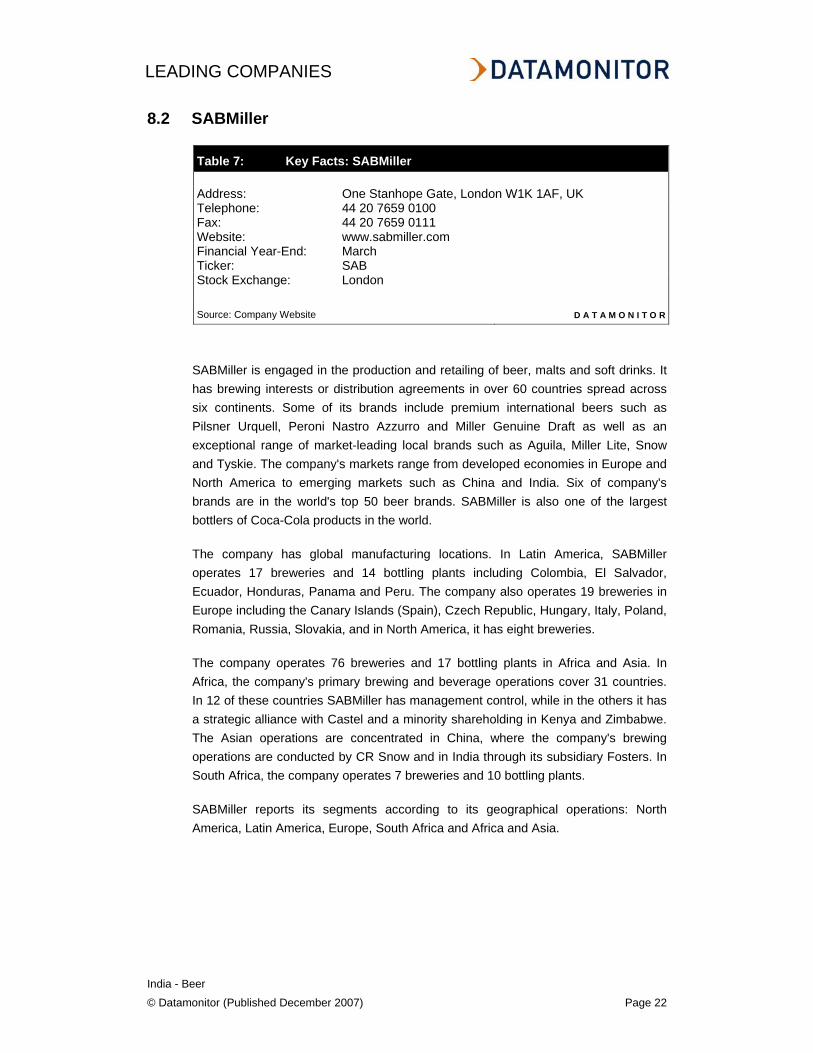
Table 7: Key Facts: SABMiller Address: One Stanhope Gate, London W1K 1AF, UK Telephone: 44 20 7659 0100 Fax: 44 20 7659 0111 Website: www.sabmiller.com Financial Year-End: March Ticker: SAB Stock Exchange: London Source: Company Website D A T A M O N I T O R
SABMiller is engaged in the production and retailing of beer, malts and soft drinks. It has brewing interests or distribution agreements in over 60 countries spread across six continents. Some of its brands include premium international beers such as Pilsner Urquell, Peroni Nastro Azzurro and Miller Genuine Draft as well as an exceptional range of market-leading local brands such as Aguila, Miller Lite, Snow and Tyskie. The company's markets range from developed economies in Europe and North America to emerging markets such as China and India. Six of company's brands are in the world's top 50 beer brands. SABMiller is also one of the largest bottlers of Coca-Cola products in the world.
The company has global manufacturing locations. In Latin America, SABMiller operates 17 breweries and 14 bottling plants including Colombia, El Salvador, Ecuador, Honduras, Panama and Peru. The company also operates 19 breweries in Europe including the Canary Islands (Spain), Czech Republic, Hungary, Italy, Poland, Romania, Russia, Slovakia, and in North America, it has eight breweries.
The company operates 76 breweries and 17 bottling plants in Africa and Asia. In Africa, the company's primary brewing and beverage operations cover 31 countries. In 12 of these countries SABMiller has management control, while in the others it has a strategic alliance with Castel and a minority shareholding in Kenya and Zimbabwe. The Asian operations are concentrated in China, where the company's brewing operations are conducted by CR Snow and in India through its subsidiary Fosters. In South Africa, the company operates 7 breweries and 10 bottling plants.
SABMiller reports its segments according to its geographical operations: North America, Latin America, Europe, South Africa and Africa and Asia.
LEADING COMPANIES
India - Beer
© Datamonitor (Published December 2007) Page 23
SABMiller operates in North America through its subsidiary, Miller Brewing Company (Miller), which is the second largest brewer in the US. Miller operates eight breweries in the US in Wisconsin, California, Ohio, Georgia, North Carolina and Texas. The total brewing capacity of these eight breweries is about 66.8 million hectoliters. Its brands in North America include Miller Lite, Miller Genuine Draft, Ice House, Miller High Life, Milwaukee's Best, Peroni Nastro Azzurro, Pilsner Urquell, Leinenkugel's, Henry Weinhard's, Olde English 800, Mickey's.
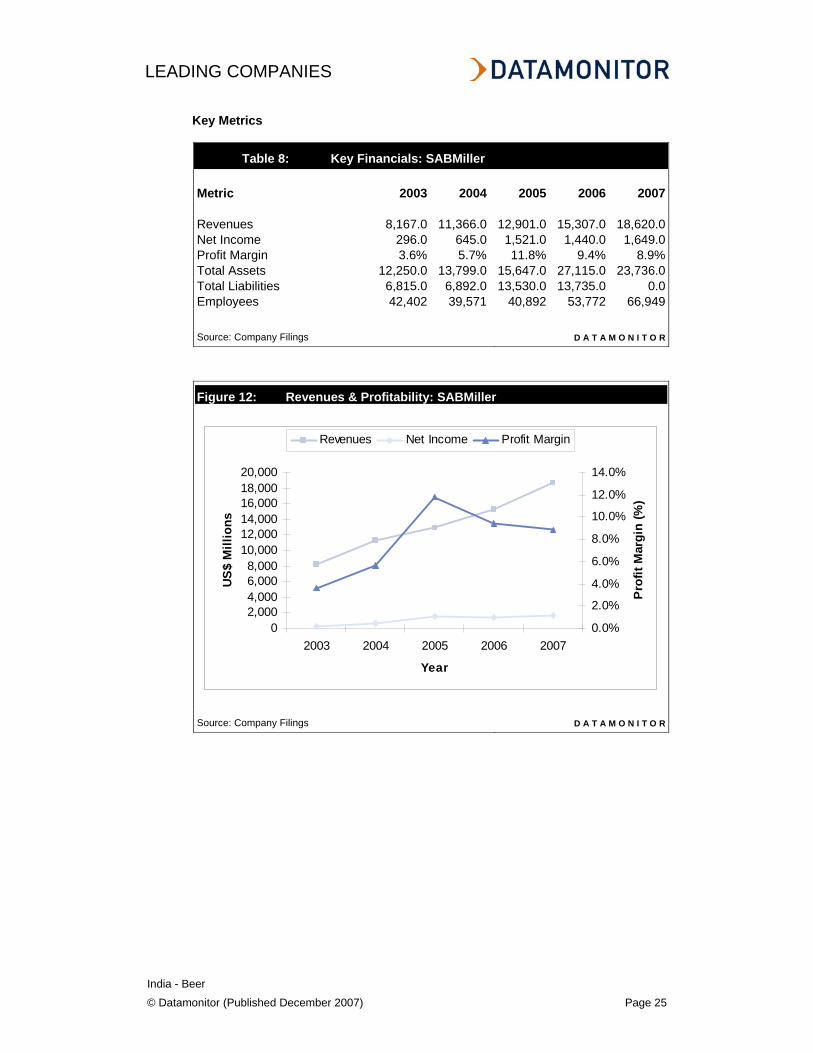
North America, SABMiller's largest geographical market, accounted for 26.2% of the total revenues in the fiscal year 2007. Revenues from North America reached $4,887 million in 2007, a decrease of 0.5% over 2006. As the US beer industry continued to feel the impact of consumers' growing preference for wine and spirits, volume performance of mainstream domestic beers was outpaced by imported and crafted brands. The domestic shipment volumes in the US industry decreased by 0.4% during the financial year, while imports increased by 13.1%. Miller's domestic sales to retailers (STRs) in the US were to the sales in 2006 and domestic shipments to wholesalers (STWs) were in line with STRs in the same period. The North American market recorded an operating profit of $366 million in 2007, a decrease of 19.4% over 2006.
In Latin America, the company operates in six countries including Colombia, El Salvador, Ecuador, Honduras, Panama and Peru. It operates 17 breweries and 14 bottling plants in Latin America. The brands sold by SABMiller in Latin America include Aguila, Atlas, Balboa, Barena, Cristal, Club, Club Colombia, Costena, Cusquena, Pilsen Callao, Golden Light, Pilsen, Poker, Pilsener, Port Royal and Salva Vida. SABMiller also bottles soft drinks for The Coca-Cola Company in El Salvador and Honduras.
Latin America accounted for 23.5% of the total revenues in the fiscal year 2007. Revenues from Latin America reached $4,373 million in 2007 compared with $2,153 million in 2006. The growth in Latin America reflects robust market performances and successful business initiatives in each country underpinned by strong economic growth in the region. In South America, the strong momentum reported in the first half of 2006 continued into the second half with pro forma lager volumes increasing by 12% for the year. In Central America both beer and CSDs showed commendable performances, with growth of 8% and 6% respectively. The Latin American market recorded operating profits of $746 million in 2007, an increase of 98.4% over 2006.
LEADING COMPANIES
India - Beer
© Datamonitor (Published December 2007) Page 24
The company operates 19 breweries in European countries, including Canary Islands, the Czech Republic, Hungary, Italy, Poland, Romania, Russia and Slovakia. The company markets the following brands: Holsten, Miller Genuine Draft, Pilsner Urquell, Redds, Velkopopovicky Kozel, Zolotaya Bochka and Try Bogatyrya in Russia; Ursus, Timisoreana, Keller, Miller Genuine Draft, Pilsner Urquell and Ciucas in Romania; Peroni Nastro Azzurro, Gran Reserva, Raffo, Wuhrer, Miller Genuine Draft and Kronenbourg in Italy; and Pilsner Urquell, Gambrinus and Radegast Velkopopovicky Kozel in the Czech Republic. In the UK, the company operates through Miller Brands UK, which markets, sells and distributes its international premium beer brands.
SABMiller operates in South Africa through South African Breweries Limited. The company operates 7 breweries and 10 bottling plants in South Africa. The soft drinks division of SAB Limited is South Africa's largest producer of products for The Coca-Cola Company. Its key brands include Brutal Fruit, Carling Black Label, Castle, Castle Lite, Castle Milk Stout, Hansa Marzen Gold, Hansa Pilsener; Redd's and Sarita. SABMiller is also engaged in the hotel and gaming sector through its 49% stake in the Tsogo Sun group.
In Africa, the company's brewing and beverage operations cover 31 countries. In 12 of these countries SABMiller has management control, while in the others the company has a strategic alliance with Castel and a minority shareholding in Kenya and Zimbabwe. The company also bottles soft drinks for The Coca-Cola Company in seven of its African markets. In Asia, the company operates in China through China Resources Breweries (CRB), a joint venture with China Resources Enterprise (CRE). SABMiller owns 49% and CRE owns 51% of CRB. In India, it operates through its subsidiary, MBL Investments (Mysore). In September 2006, SABMiller acquired 100% of the Foster's business in India. SABMiller has also formed a partnership with the Vietnam Dairy Products Joint Stock Company (Vinamilk) in Vietnam. In all, the company operates 47 breweries and one bottling operation in Asia. Its main brands in Asia include Shengquan, Xibao, Zero Clock, Harbin Huadan, Yate, He Shi, Shenyang, Snowflake, Yatai, Tianjin, Largo, Yingshi, Haywards 5000, Haywards 2000, Knock Out, Royal Challenge and Castle Lager.
LEADING COMPANIES
India - Beer
© Datamonitor (Published December 2007) Page 25
Key Metrics
Table 8: Key Financials: SABMiller Metric 2003 2004 2005 2006 2007 Revenues 8,167.0 11,366.0 12,901.0 15,307.0 18,620.0Net Income 296.0 645.0 1,521.0 1,440.0 1,649.0Profit Margin 3.6% 5.7% 11.8% 9.4% 8.9%Total Assets 12,250.0 13,799.0 15,647.0 27,115.0 23,736.0Total Liabilities 6,815.0 6,892.0 13,530.0 13,735.0 0.0Employees 42,402 39,571 40,892 53,772 66,949 Source: Company Filings D A T A M O N I T O R
Figure 12: Revenues & Profitability: SABMiller
02,0004,0006,0008,000
10,00012,00014,00016,00018,00020,000
2003 2004 2005 2006 2007
Year
US
$ M
illio
ns
0.0%
2.0%
4.0%
6.0%
8.0%
10.0%
12.0%
14.0%
Pro
fit M
argi
n (%
)
Revenues Net Income Profit Margin
Source: Company Filings D A T A M O N I T O R
LEADING COMPANIES
India - Beer
© Datamonitor (Published December 2007) Page 26
8.3 Mohan Meakin
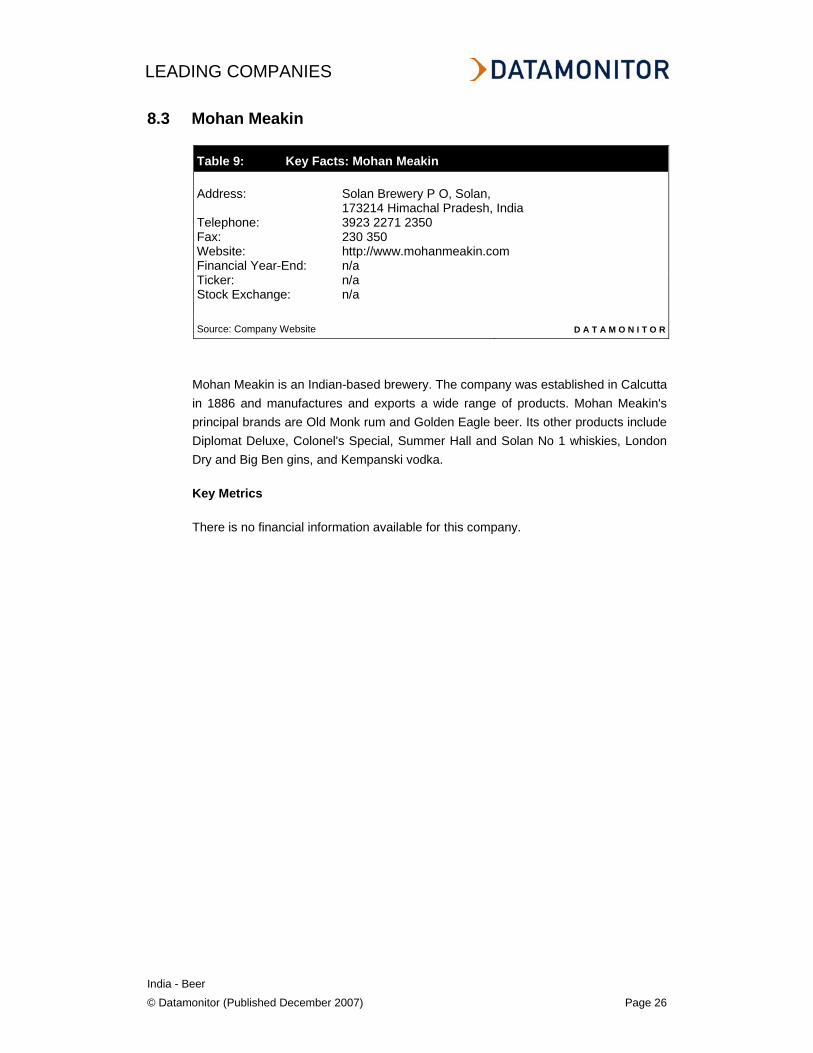
Table 9: Key Facts: Mohan Meakin Address: Solan Brewery P O, Solan,
173214 Himachal Pradesh, India Telephone: 3923 2271 2350 Fax: 230 350 Website: http://www.mohanmeakin.com Financial Year-End: n/a Ticker: n/a Stock Exchange: n/a Source: Company Website D A T A M O N I T O R
Mohan Meakin is an Indian-based brewery. The company was established in Calcutta in 1886 and manufactures and exports a wide range of products. Mohan Meakin's principal brands are Old Monk rum and Golden Eagle beer. Its other products include Diplomat Deluxe, Colonel's Special, Summer Hall and Solan No 1 whiskies, London Dry and Big Ben gins, and Kempanski vodka.
Key Metrics
There is no financial information available for this company.
DISTRIBUTION
India - Beer
© Datamonitor (Published December 2007) Page 27
CHAPTER 9 DISTRIBUTION
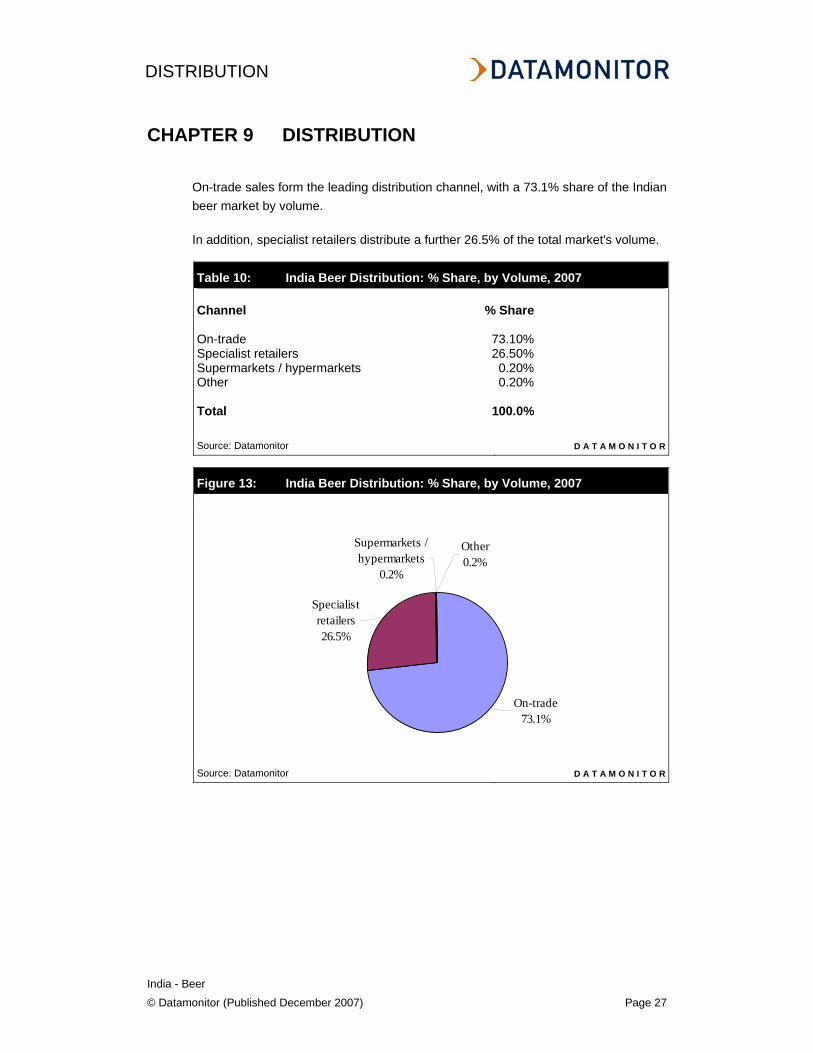
On-trade sales form the leading distribution channel, with a 73.1% share of the Indian beer market by volume.
In addition, specialist retailers distribute a further 26.5% of the total market's volume.
Table 10: India Beer Distribution: % Share, by Volume, 2007 Channel % Share On-trade 73.10%Specialist retailers 26.50%Supermarkets / hypermarkets 0.20%Other 0.20% Total 100.0% Source: Datamonitor D A T A M O N I T O R
Figure 13: India Beer Distribution: % Share, by Volume, 2007
Supermarkets / hypermarkets
0.2%
Other0.2%
Specialist retailers26.5%
On-trade73.1%
Source: Datamonitor D A T A M O N I T O R
MARKET FORECASTS
India - Beer
© Datamonitor (Published December 2007) Page 28
CHAPTER 10 MARKET FORECASTS
10.1 Market Value Forecast
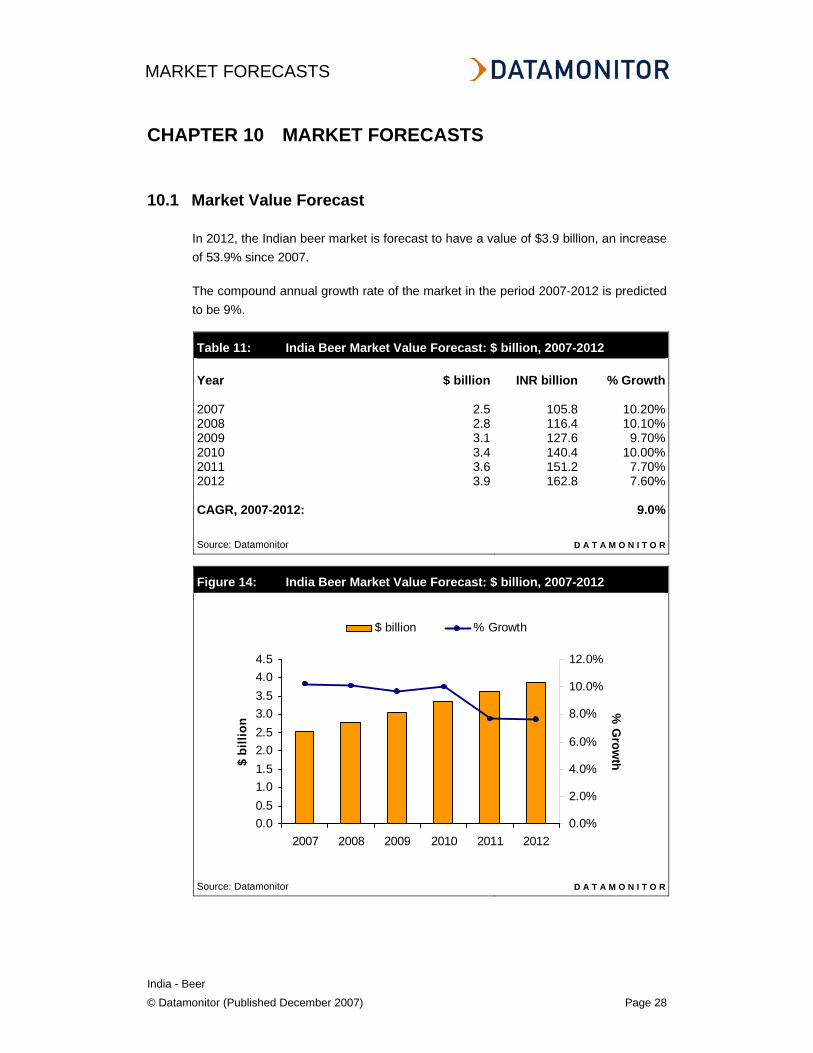
In 2012, the Indian beer market is forecast to have a value of $3.9 billion, an increase of 53.9% since 2007.
The compound annual growth rate of the market in the period 2007-2012 is predicted to be 9%.
Table 11: India Beer Market Value Forecast: $ billion, 2007-2012 Year $ billion INR billion % Growth 2007 2.5 105.8 10.20%2008 2.8 116.4 10.10%2009 3.1 127.6 9.70%2010 3.4 140.4 10.00%2011 3.6 151.2 7.70%2012 3.9 162.8 7.60% CAGR, 2007-2012: 9.0% Source: Datamonitor D A T A M O N I T O R
Figure 14: India Beer Market Value Forecast: $ billion, 2007-2012
Source: Datamonitor D A T A M O N I T O R
0.00.51.01.52.02.53.03.54.04.5
2007 2008 2009 2010 2011 2012
$ bi
llion
0.0%
2.0%
4.0%
6.0%
8.0%
10.0%
12.0%
% G
rowth
$ billion % Growth
MARKET FORECASTS
India - Beer
© Datamonitor (Published December 2007) Page 29
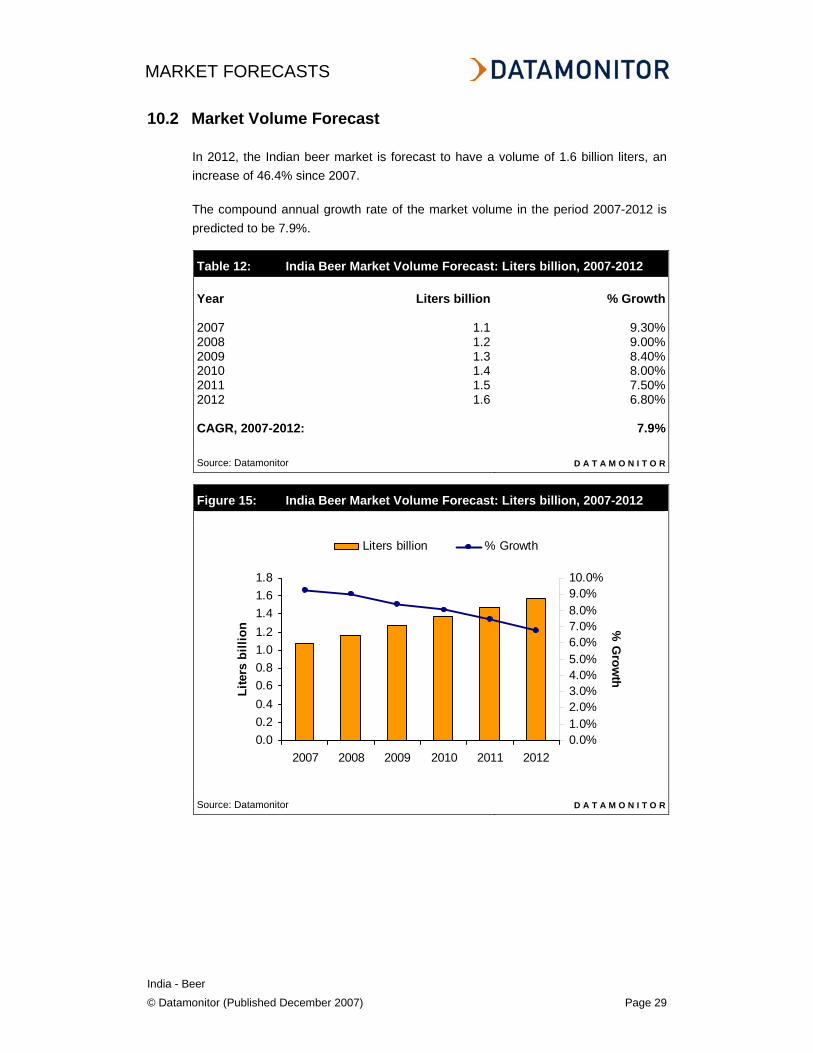
10.2 Market Volume Forecast
In 2012, the Indian beer market is forecast to have a volume of 1.6 billion liters, an increase of 46.4% since 2007.
The compound annual growth rate of the market volume in the period 2007-2012 is predicted to be 7.9%.
Table 12: India Beer Market Volume Forecast: Liters billion, 2007-2012 Year Liters billion % Growth 2007 1.1 9.30%2008 1.2 9.00%2009 1.3 8.40%2010 1.4 8.00%2011 1.5 7.50%2012 1.6 6.80% CAGR, 2007-2012: 7.9% Source: Datamonitor D A T A M O N I T O R
Figure 15: India Beer Market Volume Forecast: Liters billion, 2007-2012
Source: Datamonitor D A T A M O N I T O R
0.00.20.40.60.81.01.21.41.61.8
2007 2008 2009 2010 2011 2012
Lite
rs b
illio
n
0.0%1.0%2.0%3.0%4.0%5.0%6.0%7.0%8.0%9.0%10.0%
% G
rowth
Liters billion % Growth
MACROECONOMIC INDICATORS
India - Beer
© Datamonitor (Published December 2007) Page 30
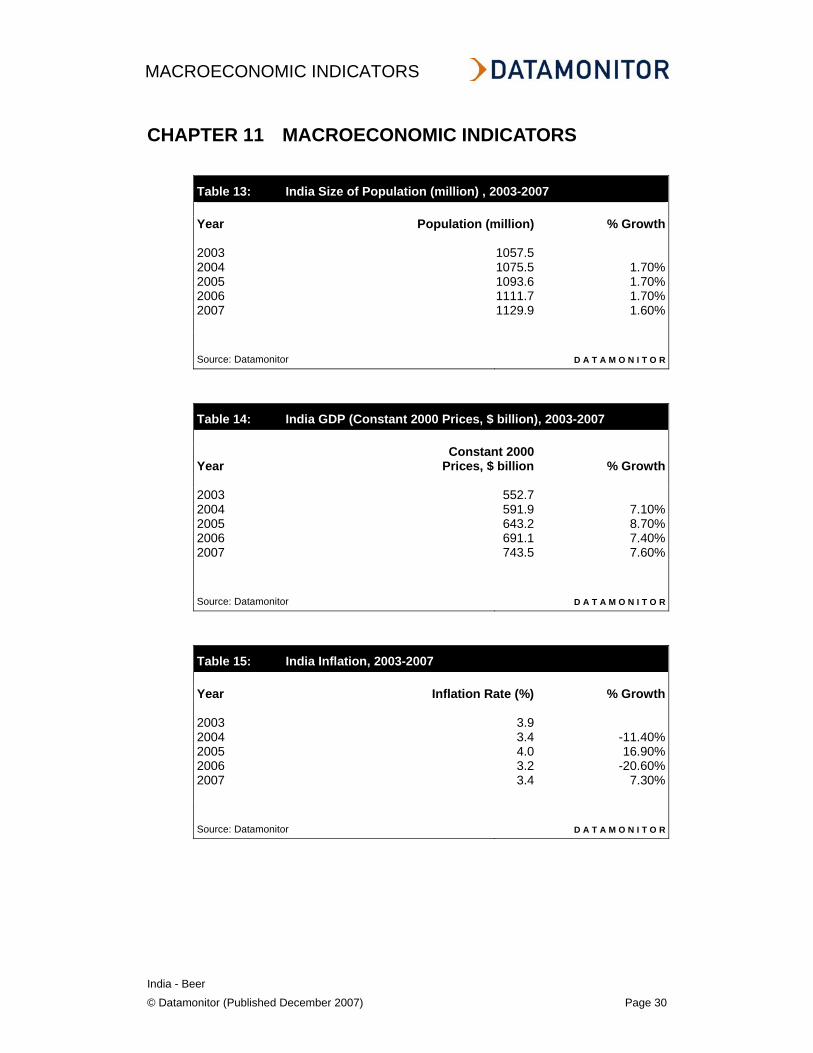
CHAPTER 11 MACROECONOMIC INDICATORS
Table 13: India Size of Population (million) , 2003-2007 Year Population (million) % Growth 2003 1057.52004 1075.5 1.70%2005 1093.6 1.70%2006 1111.7 1.70%2007 1129.9 1.60% Source: Datamonitor D A T A M O N I T O R
Table 14: India GDP (Constant 2000 Prices, $ billion), 2003-2007
Year Constant 2000
Prices, $ billion % Growth 2003 552.72004 591.9 7.10%2005 643.2 8.70%2006 691.1 7.40%2007 743.5 7.60% Source: Datamonitor D A T A M O N I T O R
Table 15: India Inflation, 2003-2007 Year Inflation Rate (%) % Growth 2003 3.92004 3.4 -11.40%2005 4.0 16.90%2006 3.2 -20.60%2007 3.4 7.30% Source: Datamonitor D A T A M O N I T O R
MACROECONOMIC INDICATORS
India - Beer
© Datamonitor (Published December 2007) Page 31
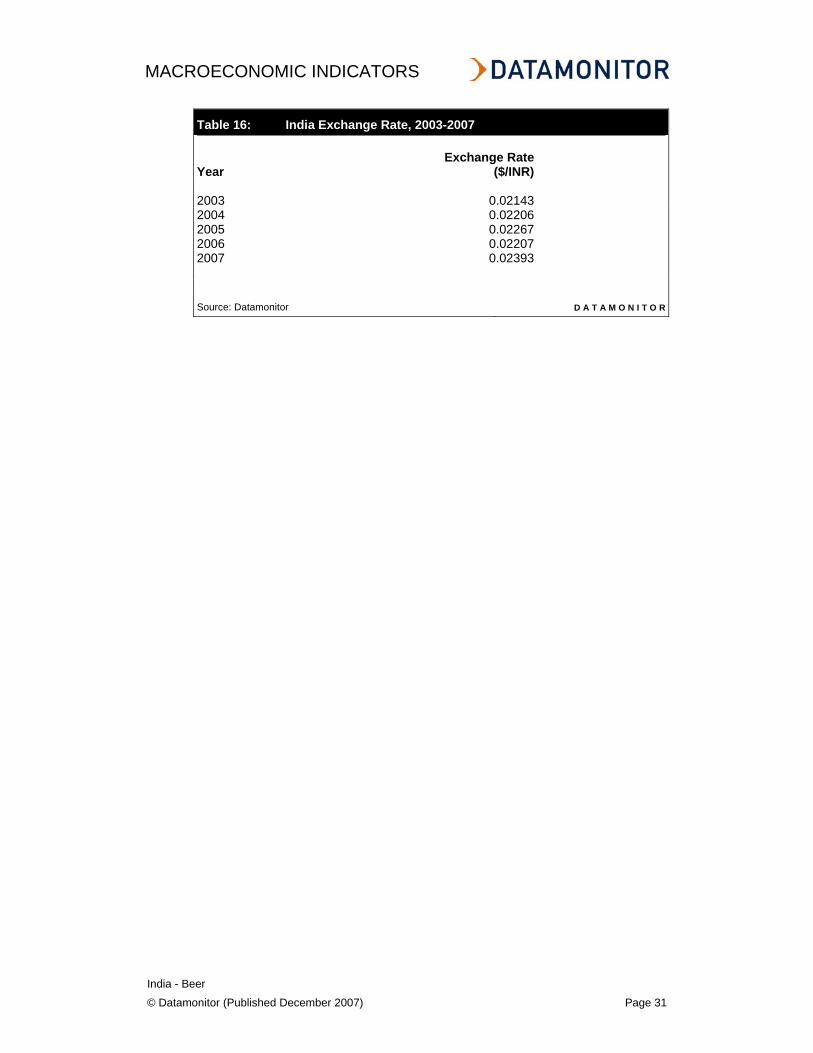
Table 16: India Exchange Rate, 2003-2007
Year Exchange Rate
($/INR) 2003 0.021432004 0.022062005 0.022672006 0.022072007 0.02393 Source: Datamonitor D A T A M O N I T O R
APPENDIX
India - Beer
© Datamonitor (Published December 2007) Page 32
CHAPTER 12 APPENDIX
12.1 Methodology
Datamonitor Industry Profiles draw on extensive primary and secondary research, all aggregated, analyzed, cross-checked and presented in a consistent and accessible style.
Review of in-house databases – Created using 250,000+ industry interviews and consumer surveys and supported by analysis from industry experts using highly complex modeling & forecasting tools, Datamonitor’s in-house databases provide the foundation for all related industry profiles
Preparatory research – We also maintain extensive in-house databases of news, analyst commentary, company profiles and macroeconomic & demographic information, which enable our researchers to build an accurate market overview
Definitions – Market definitions are standardized to allow comparison from country to country. The parameters of each definition are carefully reviewed at the start of the research process to ensure they match the requirements of both the market and our clients
Extensive secondary research activities ensure we are always fully up-to-date with the latest industry events and trends
Datamonitor aggregates and analyzes a number of secondary information sources, including:
• National/Governmental statistics • International data (official international sources) • National and International trade associations • Broker and analyst reports • Company Annual Reports • Business information libraries and databases
Modeling & forecasting tools – Datamonitor has developed powerful tools that allow quantitative and qualitative data to be combined with related macroeconomic and demographic drivers to create market models and forecasts, which can then be refined according to specific competitive, regulatory and demand-related factors
Continuous quality control ensures that our processes and profiles remain focused, accurate and up-to-date
APPENDIX
India - Beer
© Datamonitor (Published December 2007) Page 33
12.2 Industry Associations
All India Brewers' Association Bangalore, India Tel: 91 80 226 6619 Fax: 91 80 226 9984
12.3 Related Datamonitor Research
Datamonitor Industry Profiles
Global Beer
Beer in the United States
Beer in Australia
Beer in Belgium
Beer in Brazil
Beer in Canada
Beer in the Czech Republic
Beer in Denmark
Beer in Europe
Beer in France
Beer in Germany


