Embed Size (px)
Citation preview

DECENTRALISATION AND GOVERNANCE IN UGANDA. A CASE STUDY OF
KALIRO DISTRICT.
BY
JOHN STEPHEN KASADHA
REG. NUMBER: 08/MMS/PAM/17/121
A DISSERTATION SUBMITTED TO THE SCHOOL OF MANAGEMENT
SCIENCE INPARTIAL FULFILLMENT OF THE REQUIREMENTS FOR
THE AWARD OF A MASTERS DEGREE IN MANAGEMENT STUDIES
(PUBLIC ADMINISTRATION AND MANAGEMENT) OF
UGANDA MANAGEMENT INSTITUTE
JANUARY, 2016.

i
DECLARATION
I JOHN STEPHEN KASADHA hereby declare that this is my original work and has never
been submitted to any University or Institution of higher learning for any academic award.
Sign:……………………………… Date:................................................
ii
APPROVAL
This is to certify that this is an original research of JOHN STEPHEN KASADHA done
under our supervision and submitted with our approval.
1. Sign: …………………………….. Date:.......................................
Name: DR. MICHEAL KIWANUKA (Supervisor)
2. Sign: …………………………….. Date:......................................
Name: MR. GODFREY BWANIKA (Supervisor)

iii
DEDICATION
I dedicate this work to my entire family; most especially my dear wife Edith Kasadha, my
children: Jovan, Ian, Diana, Vanessa and Priscilla for their support, encouragement and
perseverance during the hard conditions especially when they missed my love because of my
dedication to this work.
In a special way I would like also to dedicate this work to my dear parents Mr. and Mrs.
Masedhere who brought me up and for the self-denial that laid my basic education foundation.
ACKNOWLEDGEMENT

iv
The completion of this research work was due to the maximum co-operation and
participation of many people who deserve a lot of thanks.
In addition I thank my supervisors Dr. Micheal Kiwanuka and Mr. Godfrey Bwanika whose
professional guidance, tolerance and parental advise paved my way to the completion of this
report. Equally I thank the entire staff and administration of UMI for their priceless support during
this course.
I am indebted to my Research Assistants –Mr. Richard Wambi, Mr. Patrick Wanzala and Mr.
Emma Waigulo, the administration and colleagues of the entire Kaliro district local government;
more particularly those of Kaliro Town Council for the encouragement and support rendered to
me during this course.
Last but not least all my respondents are thanked for their valued time and contribution towards
the completion of this work. May God bless you all.
TABLE OF CONTENTS
v
Contents Pages
DECLARATION ............................................................................................................................. i
APPROVAL ................................................................................................................................... ii
DEDICATION ............................................................................................................................... iii
ACKNOWLEDGEMENT ............................................................................................................. iii
TABLE OF CONTENTS ............................................................................................................... iv
LIST OF TABLES ....................................................................................................................... viii
LIST OF FIGURES ........................................................................................................................ x
LIST OF ABBREVIATIONS AND ACRONYMS ...................................................................... xi
ABSTRACT ................................................................................................................................... xi
CHAPTER ONE- INTRODUCTION............................................................................................. 1
1.1 Introduction ........................................................................................................................... 1
1.2 Background to the study. ...................................................................................................... 1
1.3. Statement of the problem. .................................................................................................... 6
1.4. Purpose of the study. ............................................................................................................ 8
1.5. Objectives of the study......................................................................................................... 8
1.6 Research Questions. .............................................................................................................. 8
1.7. Hypotheses of the study ....................................................................................................... 9
1.8. Conceptual Framework. ....................................................................................................... 9
1.9. Significance of the study. ................................................................................................... 10
1.10. Justification of the study. ................................................................................................. 11
1.11. Scope of the study. ........................................................................................................... 11
1.11.1 Geographical scope .................................................................................................... 11
1.11.2 Content scope: ............................................................................................................ 12
1.11.3 Time scope ................................................................................................................. 12
1.12. Operational Definitions of Key Concepts. ....................................................................... 12
CHAPTER TWO -LITERATURE REVIEW ............................................................................... 14
2.1 Introduction ......................................................................................................................... 14
2.2. Theoretical review ............................................................................................................. 14
2.3. Conceptual Review ............................................................................................................ 16
2.4. Decentralization and Governance ...................................................................................... 17
2.4.1 Decentralization and Community Participation ........................................................... 18
2.4.2. Decentralization and Accountability ........................................................................... 22
2.4.3 Decentralization and Local Capacity ........................................................................... 25
2.4.4 Decentralization and Locality Factors ......................................................................... 28
2.5. Summary of the Literature Review .................................................................................... 30
CHAPTER THREE- METHODOLOGY ..................................................................................... 32
vi
3.1 Introduction ......................................................................................................................... 32
3.2. Research Design................................................................................................................. 33
3.3. Study Population. ............................................................................................................... 33
3.3.1. Sample size and selection. ...................................................................................... 34
3.3.2. Sampling techniques and procedure. .......................................................................... 34
3.4. Data Collection Methods. .................................................................................................. 35
3.4.1 Questionnaire. .............................................................................................................. 35
3.4.2. Interviewing ............................................................................................................ 35
3.4.3. Focus Group Discussion ............................................................................................. 36
3.4.4 Documentation Review. ............................................................................................... 36
3.5. Data collection instruments................................................................................................ 37
3.5.1 Interview guide. ........................................................................................................... 37
3.5.2 Questionnaire. .............................................................................................................. 37
3.5.3 Focus Group discussion Guide. ................................................................................... 38
3.5.4 Documentation Review Guide ..................................................................................... 38
3.6. Validity and Reliability. ..................................................................................................... 38
3.6.1 Validity. ....................................................................................................................... 39
3.6.2. Reliability .................................................................................................................... 40
3.7. Procedure of Data Collection .......................................................................................... 41
3.8. Data analysis. ..................................................................................................................... 41
3.8.1. Qualitative data analysis. ............................................................................................ 42
3.8.2. Quantitative data analysis. .......................................................................................... 42
CHAPTER FOUR- DATA PRESENTATION, ANALYSIS AND INTERPRETATION OF
FINDINGS .................................................................................................................................... 42
4.1 Introduction ......................................................................................................................... 42
4.2 Response rate ...................................................................................................................... 43
4.3 Demographic Characteristics of the Respondents .............................................................. 43
4.3.1 Gender of the respondents ............................................................................................ 44
4.3.2 Age ............................................................................................................................... 45
4.3.4 Level of Education ....................................................................................................... 45
4.2 Relationships between variables ......................................................................................... 46
4.2.2 Relationship between decentralization and community participation in developmental
activities in Kaliro district ............................................................................................ 47
4.2.3 The relationship between decentralization and accountable leadership in Kaliro district.
...................................................................................................................................... 48
4.2.4 Relationship between decentralization and local capacity to participate in development
programs in Kaliro district ........................................................................................... 48
4.4 Regression analysis ......................................................................................................... 49
vii
4.4.1 Objective 1: The effect of decentralization in promoting community participation ... 49
4.4.2 Objective 2: Decentralization has a role to play in promoting transparency and
accountable leadership ................................................................................................. 51
4.4.3 Objective 3: The role of decentralization in promoting local capacity towards
development programs ................................................................................................. 53
4.4.4 Objective 4: The moderating effect of locality factors on decentralization in promoting
good governance. .......................................................................................................... 55
CHAPTER FIVE - SUMMARY, DISCUSSION OF KEY FINDINGS, CONCLUSIONS AND
RECOMMENDATIONS .............................................................................................................. 57
5.1 Introduction. ........................................................................................................................ 57
5.2 Summary of findings........................................................................................................... 57
5.2.1 Decentralization and promotion of community participation in decision-making. ..... 57
5.2.2 Decentralization and accountable leadership ............................................................... 58
5.2.3 Decentralization and promotion of local capacity. ....................................................... 58
5.2.4 Locality factors and promotion of decentralization and good governance. ................. 59
5.3 Discussion of Key findings ............................................................................................. 59
5.3.1 Decentralization and promotion of community participation in decision-making ...... 60
5.3.2 Decentralization and accountable leadership ............................................................... 60
5.3.3 Decentralization and promotion of local capacity. ...................................................... 61
5.3.4 Effects of the Locality factors on decentralization in promoting local governance. ... 62
5.4 Conclusions ......................................................................................................................... 63
5.4.1 Decentralization and promotion of community participation in developmental activities.
...................................................................................................................................... 63
5.4.2 Decentralization and Accountable leadership. ............................................................. 63
5.4.3 Decentralization and the promotion of local capacity ................................................. 63
5.4.4 The effect of the locality factors on decentralization in promoting good governance. 64
5.5 Recommendations ............................................................................................................... 65
5.5.1 Decentralization and promotion of community participation in developmental activities.
...................................................................................................................................... 65
5.5.2 Decentralization and Accountable leadership. ............................................................. 65
5.5.3 Decentralization and promotion of local capacity. ...................................................... 67
5.5.4 The effect of the locality factors on decentralization in promoting good governance. 68
5.6 Areas for further research ................................................................................................... 68
REFERENCES ............................................................................................................................. 70
APPENDIX 1: STUDY QUESTIONNAIRE .................................................................................. i
APPENDIX 2: INTERVIEW GUIDE ............................................................................................. i
APPENDIX 3: GUIDE TO FOCUS GROUP DISCUSSIONS ....................................................... i
APPENDIX 4: DOCUMENTARY REVIEW GUIDE.................................................................... i

viii
APPENDIX 5: COMPUTED DATA............................................................................................... i
APPENDIX 6: RELIABILITY ........................................................................................................ i
APPENDIX 7: BACKGROUND INFORMATION ....................................................................... i
APPENDIX 8: CORRELLATION COEFFICIENTS ..................................................................... i
APPENDIX 9: REGRESSION ........................................................................................................ i
LIST OF TABLES
ix
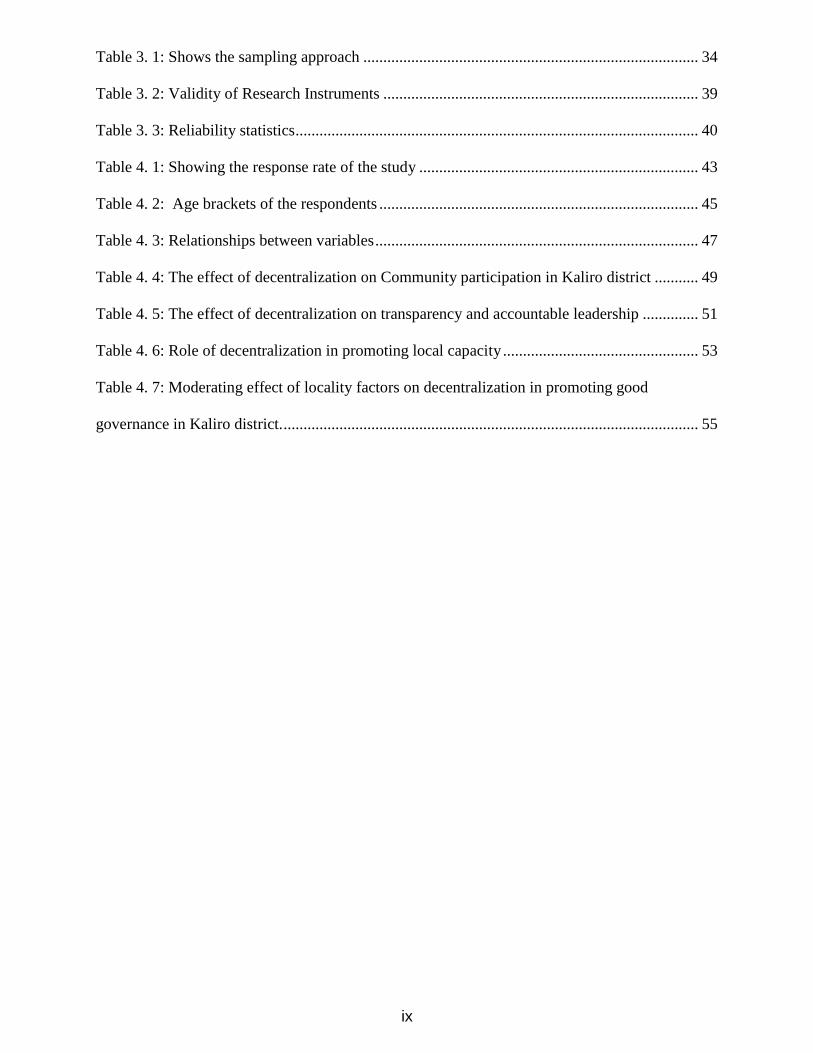
Table 3. 1: Shows the sampling approach .................................................................................... 34
Table 3. 2: Validity of Research Instruments ............................................................................... 39
Table 3. 3: Reliability statistics ..................................................................................................... 40
Table 4. 1: Showing the response rate of the study ...................................................................... 43
Table 4. 2: Age brackets of the respondents ................................................................................ 45
Table 4. 3: Relationships between variables ................................................................................. 47
Table 4. 4: The effect of decentralization on Community participation in Kaliro district ........... 49
Table 4. 5: The effect of decentralization on transparency and accountable leadership .............. 51
Table 4. 6: Role of decentralization in promoting local capacity ................................................. 53
Table 4. 7: Moderating effect of locality factors on decentralization in promoting good
governance in Kaliro district. ........................................................................................................ 55

x
LIST OF FIGURES
Figure 1: Conceptual framework showing the relationship between Decentralization and
Governance. .................................................................................................................................. 10
Figure 2: Pie-chart showing Gender of respondents ..................................................................... 44
Figure 3: Bar graph showing the educational level of respondents. ............................................. 46

xi
LIST OF ABBREVIATIONS AND ACRONYMS
CAO - Chief Administrative Officer
CBO - Community Based Organization
CSOs - Civil Society Organizations
DTPC - District Technical Planning Committee
FAL - Functional Adult Literacy
GoU - Government of Uganda
KDLG - Kaliro District Local Government
LCs - Local Councils
LG - Local Government
LGA - Local Government Act
LLG - Lower Local Government
MoFPED - Ministry of Finance, Planning and EconomicDevelopment
NAADS - NationalAgriculture Advisory Services
NGO - Non Government Organization
NRA - National Resistance Army
NRM - National Resistance Movement
PDC - Parish Development Committee
SPSS - Statistical Package for Social Sciences
STPC - Sub County Technical Planning Committee
UPE - Universal Primary Education
USE - Universal Secondary Education
UMI - Uganda Management Institute
UNDP - United Nations Development Programme
ABSTRACT
xii
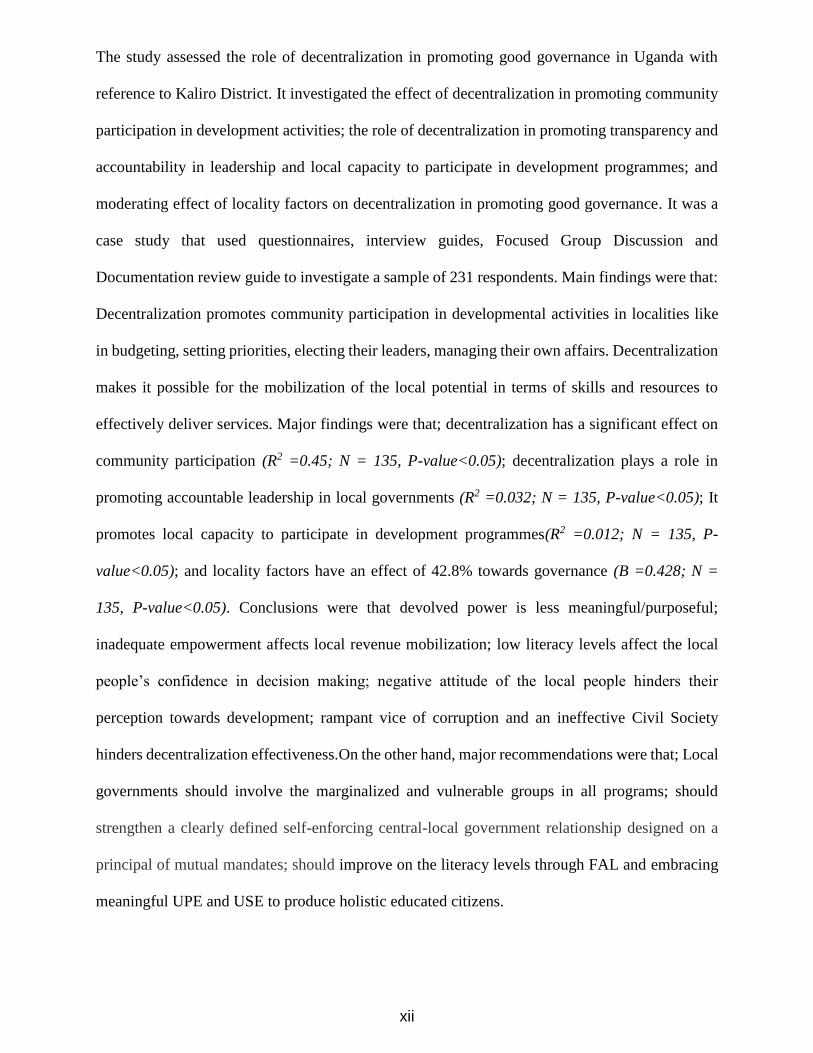
The study assessed the role of decentralization in promoting good governance in Uganda with
reference to Kaliro District. It investigated the effect of decentralization in promoting community
participation in development activities; the role of decentralization in promoting transparency and
accountability in leadership and local capacity to participate in development programmes; and
moderating effect of locality factors on decentralization in promoting good governance. It was a
case study that used questionnaires, interview guides, Focused Group Discussion and
Documentation review guide to investigate a sample of 231 respondents. Main findings were that:
Decentralization promotes community participation in developmental activities in localities like
in budgeting, setting priorities, electing their leaders, managing their own affairs. Decentralization
makes it possible for the mobilization of the local potential in terms of skills and resources to
effectively deliver services. Major findings were that; decentralization has a significant effect on
community participation (R2 =0.45; N = 135, P-value<0.05); decentralization plays a role in
promoting accountable leadership in local governments (R2 =0.032; N = 135, P-value<0.05); It
promotes local capacity to participate in development programmes(R2 =0.012; N = 135, P-
value<0.05); and locality factors have an effect of 42.8% towards governance (B =0.428; N =
135, P-value<0.05). Conclusions were that devolved power is less meaningful/purposeful;
inadequate empowerment affects local revenue mobilization; low literacy levels affect the local
people’s confidence in decision making; negative attitude of the local people hinders their
perception towards development; rampant vice of corruption and an ineffective Civil Society
hinders decentralization effectiveness.On the other hand, major recommendations were that; Local
governments should involve the marginalized and vulnerable groups in all programs; should
strengthen a clearly defined self-enforcing central-local government relationship designed on a
principal of mutual mandates; should improve on the literacy levels through FAL and embracing
meaningful UPE and USE to produce holistic educated citizens.
1
CHAPTER ONE
INTRODUCTION
1.1 Introduction
This study assessed the role of decentralization in promoting good governance in Uganda with
reference to Kaliro District Local Government. Decentralization was conceived as the
independent variable while governance was the dependent variable. This chapter presents the
background to the study, statement of the problem, purpose of the study, objectives of the study,
research questions, hypotheses, scope of the study, significance, justification and operational
definitions of terms and concepts.
1.2 Background to the study.
Since the 1980s, decentralization and the quest for governance at local levels has remained the
biggest governance concern on global agenda especially in developing countries and it is more
likely to remain so in the present millennium. Almost all governments, both in industrialized and
developing countries, have experimented with decentralization in varying degrees, (Wanyama,
2002).
Many countries are promoting decentralized governance as a measure for democratization, people
empowerment, and poverty reduction. Braun and Grote (2000) confers that decentralization has
emerged as a highly popular strategy for improving public sector efficiency, responsiveness, and
accountability in the developing world and also increasing opportunities for citizen participation
and ownership contributing to social and political stability.
Devolution of powers is intended to improve service delivery by shifting responsibility for policy
implementation to the local beneficiaries themselves; to promote good governance by placing
emphasis on transparency and accountability in public sector management; to develop, broaden,
and deepen political and administrative competence in the management of public affairs; to
democratize society by promoting inclusive, representative and gender-sensitive decision-
making; and to alleviate poverty through collaborative efforts between central and local
2
governments, donors, non-government organizations (NGOs), community based organizations
(CBOs), the private sector and other stakeholders, (Kiwanuka, 2015).
Decentralization in Uganda has meant conferring authority on local councils, converting them
from appointed to popularly elected bodies and mobilizing the resources necessary for public
services and administration of the council. Districts and sub-counties have been made local
governments that are body corporate according to the Local Government Act CAP. 243. The
centre no longer approves by-laws of these local governments, except for harmonizing them with
the constitution or any other law made by the legislature. The revocation of the mandate of a
councilor is constitutionally vested in the electorate, who can initiate the removal of any councilor
(Munyonyo, 1999).
Decentralized governance provides a structural arrangement and a leveled playing field for
stakeholders and players to promote peace, democracy, and development. However, the
effectiveness of efforts in developing countries to achieve human development goals hinges
largely on the quality of governance in those countries and the zeal and commitment of
governments' and civil society institutions,(Kiwanuka, 2014).
Governance in a decentralized setting emphasizes bottom – up approach as opposed to top – down
approach. In terms of planning and decision making, it gives people at lower levels an opportunity
to participate in problem identification, prioritization, search for solutions, implementation,
monitoring and evaluation of development programmes in their areas. Most countries in the world
have not made adequate efforts to engage stakeholders in the development of local governance.
Stakeholders’ participation is still a major challenge for decentralized systems. For instance in
Bolivia, there was the domination of elites’ interests over the communities which naturally
extended into the arena of participatory planning process. It did not recognize the validity of
3
indigenous knowledge, which made participation by indigenous people very challenging. In
Brazil, the mandates for service delivery were devolved but not the resources and the bureaucrats
generally resisted participatory approaches, (The International Workshop Report, 2002).
In African countries like Cote’ de’Voire and Malawi there was an apparent lack of participatory
governance by excluding the rural targeted population from participating in the management of
their development programmes and projects. In Cote’ de’Voire disappointments can be found in
limited involvement of Mayors in local resource mobilization and lack of sufficient qualifications
of lower level municipal servants. In Malawi decentralization was constrained by a continued
lack of political framework within which to evolve, as well as an acute shortage of personnel.
Inadequate information on programme, cost data and budget expenditure, inappropriate training
programmes, weak staff supervision and weak vertical and horizontal management
communications, (UNDP Report, 1993). Decentralized governance connotes a better perception
of the needs of local areas, makes better informed decision – making possible, and gives a greater
voice in decision making to the poor.
Abigaba (1998) noted that the reasons for the failure of over centralized system ranged from non-
achievement of the objectives – related to grand development design, the non-involvement of
local population and their indigenous knowledge – into the process of problem analysis, plan
formulation and project identification and the ineffective implementation of development projects
that did not reach the beneficiaries.
In Uganda, before and decades after independence, power was either highly concentrated in the
centre or in the hands of a few local elites. Sight was lost of the primary beneficiaries who became
the helpless objects of top down planning and service provision. Planning processes and decision
4
making were dominated by technocrats. There were little efforts made to customize the needs,
aspirations and concerns of the various categories of Ugandans.
As soon as the National Resistance Movement/National Resistance Army (NRM/NRA) captured
state power on 26th January, 1986, initiated a process of decentralization in governance to promote
and sustain popular democratic participation through a system of elected local councils (LCs).
The major focus of this decentralization policy was to empower citizens to participate in decisions
that affect their localities.
According to Kiyaga and Olum (2009), decentralization by devolution of decision-making to the
lowest levels is a fundamental principle of local democracy and good governance because it gives
rise to a more responsive organization and greater community involvement. Conceptually,
therefore, organized local bodies with clear mandates are generally more efficient and effective
in enhancing local democracy and good governance, in delivering services to the local people and
in reducing poverty. Because devolution of power to local levels has been quite rare in Africa,
Uganda’s experiment has attracted significant attention regarding the extent to which it can
promote governance and democracy, enhance service delivery and help reduce poverty, (Kiyaga,
2007).
Gerring et al (2004) sets out the general assumption that government works best when political
institutions diffuse power broadly among multiple, independent bodies. Efficiency is enhanced
by political bodies that lie close to the constituents they serve. The existent multiple veto - points
force a consensual style of decision making in which all organized groups are compelled to reach
agreement on matters affecting the polity. Institutional fragmentation at various levels sets
barriers against the abuse of power by minorities, against the overweening ambitions of individual
5
leaders, against democratic tyrannies instituted by the majority, and against hasty and ill-
considered public policies.
Also Gerring et al (2004) perceive decentralized institutions as a mechanism to prevent direct
popular rule, or at least to moderate its effects against manipulation by unscrupulous leaders and
envious masses bent on the redistribution of wealth. Decentralization of power brings government
closer to the people as centralized power is always controlled by elites, whose interests run
contrary to the masses.
Several decentralist theorist as cited by Gerring et al (2004) expects the existence of multiple veto
points to force a consensual style of decision making, in which all organized groups are compelled
to reach agreement on matters affecting the polity. And seems to implore the presence of a written
constitution, perhaps with enumerated individual rights and explicit restrictions on the authority
of the central state, and strong local government.
Therefore, Uganda’s decentralization (devolution) can only foster good governance and
democracy if it is properly conceptualized, the facilitating conditions given careful attention and
the institutional framework sufficiently elaborate and effective to enable it to achieve its intended
objectives. Short of these measures, the gap between the intent and reality might be so great as to
disable the decentralization policy from achieving good governance and democracy,
(Kiyaga&Olum, 2009).
Equally, Schacter (2000) noted that governance is about power, relationships, and accountability
– who has influence, who decides, how citizens and other stakeholders have their say, and how
decision makers are held accountable. Therefore the concept of governance combines ideas about
6
political authority and the management of economic and social resources (Fiscal
decentralization); as well as the capacity of governments to formulate sound policies (Political
decentralization) and perform their functions in an effective, efficient, and equitable manner
(Administrative decentralization), (Smith, 2007).
Kiyaga and Olum (2009) aver that good governance is essential for sustaining economic
transformation in developing countries. However, many developing countries currently lack the
capacity, as opposed to the will, to achieve and then sustain a climate of good governance. In
pursuing capacity development for good governance, developing countries must ensure that such
initiatives are comprehensively designed to be simultaneously related to change and
transformation at the individual, institutional, and societal levels and to be owned and controlled
locally, (Hope, 2006).
1.3. Statement of the problem.
Uganda’s decentralization policy was intended to improve service delivery by empowering the
nationals to participate in the process of development to improve their livelihood. The
responsibility for policy implementation was shifted to the local beneficiaries themselves,
(Uganda Government, 1997). The local people were empowered to take charge of their
governance through community participation, accountable leadership and improved local
capacity. Gradual comprehensive reforms of LG system have been facilitated where considerable
discretionary powers have increasingly been passed on to local governments, (Adoko, 2014).
The present decentralization is not static, but an evolving and dynamic process whose form and
implementation pace are shaped by each country's political and institutional arrangements,
capacities and resources. There is an increasing note of skepticism about the results of
decentralization, particularly because of the evident weaknesses of local level democratic
processes in so many countries (Olowu& James, 2004). In Uganda, the local governments which
7
assumed corporate status, their autonomy, political authority and powers are being eroded. Today
there is a great disparity between the intended and the reality. Under political decentralization,
the political leaders are slowly losing their mandate to appoint Civil servants in the districts. For
instance the main actors - CAOs, Deputy CAOs and Town Clerks of Municipalities are being
appointed by the Public Service Commission and posted by the central government. This is
diluting the oversight role of the political leaders over the technical staff in the districts.
Under fiscal decentralization local governments were to be empowered to mobilize and generate
their own revenue. Today, 90% of the resources used in LGs are generated and controlled by the
centre and depend on central government to exist as they lack resources. Central government
determines which local revenue to be collected and how to be used. This is changing the flow
direction of accountability - favouring LG-Centre reporting instead of LG-Community reporting.
Thus making the technocrats less accountable to the communities.
Under Administrative decentralization all local government administrative units were to be
governed by the respective local governments. Up to date some LG departments like prisons and
police are not yet decentralized - still controlled by the centre. This makes the LGs to lose control
over the management of these vital institutions. And most of the local politicians up todate lack
the capacity to fully understand, exercise and monitor government programmes which
compromises their oversight role to supervise the delivery of services in local governments. If
unchecked there is a looming collapse of the system as it is slowly losing its effectiveness which
will lead to a breakdown of the service delivery mechanism and increased tensions and clashes
among communities.
8
1.4. Purpose of the study.
The purpose of the study was to assess the role of decentralization in promoting good governance
in Uganda with reference to Kaliro District.
1.5. Objectives of the study.
The objectives of this study included;
a) To establish the role of decentralization in promoting community participation in
development activities in Kaliro district.
b) To determine the role of decentralization in promoting accountable leadership in Kaliro
district.
c) To establish the role of decentralization in promoting local capacity to participate in
development programs in Kaliro district.
d) To determine the moderating effect of locality factors on decentralization and good
governance in Kaliro district.
1.6 Research Questions.
a) What is the role of decentralization in promoting community participation in development
activities in Kaliro district?
b) What is the role of decentralization in promoting accountable leadership in Kaliro district?
c) How effective has decentralization promoted local capacity to participate in development
programs in Kaliro district?
d) What is the moderating effect of locality factors on decentralization and good
governance in Kaliro district?
9
1.7. Hypotheses of the study
The study tested the following hypotheses:
H1: Decentralization plays a significant role in promoting community participation in
development
Activities.
H2: Decentralization plays a significant role in promoting transparency and accountable
leadership.
H3: Decentralization promotes local capacity towards participation in development programmes.
H4: There is a moderating effect caused by locality factors on decentralization and good
Governance.
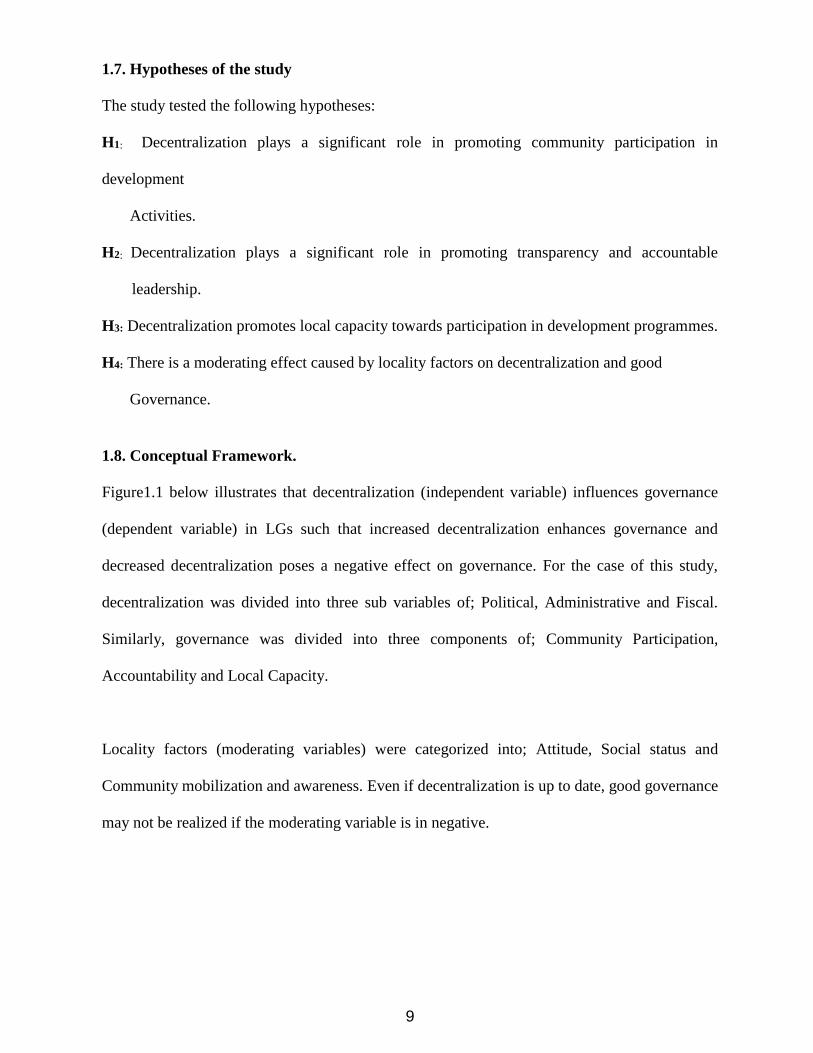
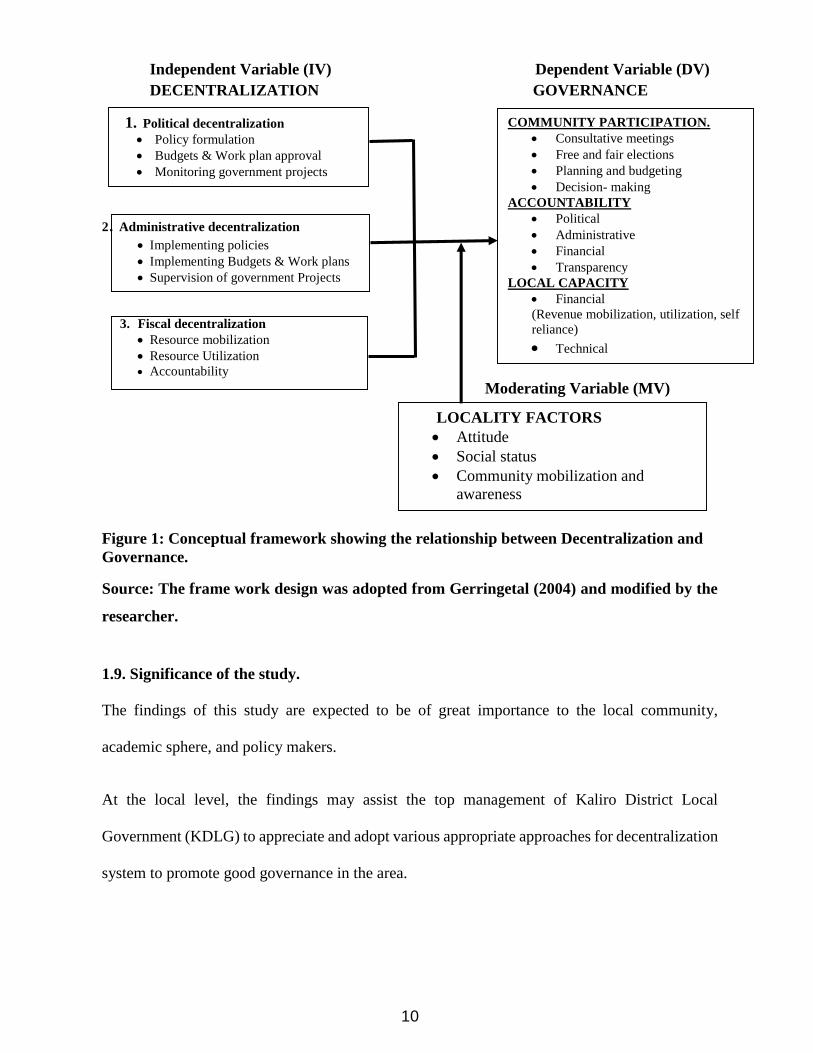
1.8. Conceptual Framework.
Figure1.1 below illustrates that decentralization (independent variable) influences governance
(dependent variable) in LGs such that increased decentralization enhances governance and
decreased decentralization poses a negative effect on governance. For the case of this study,
decentralization was divided into three sub variables of; Political, Administrative and Fiscal.
Similarly, governance was divided into three components of; Community Participation,
Accountability and Local Capacity.
Locality factors (moderating variables) were categorized into; Attitude, Social status and
Community mobilization and awareness. Even if decentralization is up to date, good governance
may not be realized if the moderating variable is in negative.
10
Independent Variable (IV) Dependent Variable (DV)
DECENTRALIZATION GOVERNANCE
2. Administrative decentralization Implementing policies
Implementing Budgets & Work plans
Supervision of government Projects
3. Fiscal decentralization
Resource mobilization
Resource Utilization
Accountability
Moderating Variable (MV)
Figure 1: Conceptual framework showing the relationship between Decentralization and
Governance.
Source: The frame work design was adopted from Gerringetal (2004) and modified by the
researcher.
1.9. Significance of the study.
The findings of this study are expected to be of great importance to the local community,
academic sphere, and policy makers.
At the local level, the findings may assist the top management of Kaliro District Local
Government (KDLG) to appreciate and adopt various appropriate approaches for decentralization
system to promote good governance in the area.
1. Political decentralization
Policy formulation
Budgets & Work plan approval
Monitoring government projects
COMMUNITY PARTICIPATION.
Consultative meetings
Free and fair elections
Planning and budgeting
Decision- making
ACCOUNTABILITY
Political
Administrative
Financial
Transparency
LOCAL CAPACITY
Financial
(Revenue mobilization, utilization, self
reliance)
Technical
LOCALITY FACTORS
Attitude
Social status
Community mobilization and
awareness
11
And inevitably, the findings of this study may influence policy at the district, central government
and donor agency levels. Thus it can be used to revise the LGA or the entire local government
regulatory frame work.
In the academic sphere, the study will add to the few existing literature about decentralization and
governance in the public sector. The study will therefore act as a spring board for further research
at master’s and doctorate levels.
1.10. Justification of the study.
Decentralization initiatives have been launched in the majority of developing countries, but these
have rarely laid the foundations necessary to reach decentralization’s purported efficiency and
equity benefits, (OECD 1986). Whereas many studies have been conducted the world over for
instance in India, Sudan, Kenya, Zambia and Venezuela in the field of decentralization, there are
gaps in – depth surveys to investigate its effect in promoting good governance in local
governments, (Smith, 1985). Some surveys, which have addressed this noble cause in Uganda,
have been based more on urban than rural setting. For example the study of Asimwe and
Nakanyike (2007) was based in Mukono district; and Golooba-Mutebi (1999) was based in
Kampala and Tororo which are more urban than rural. It was the considered opinion of the
researcher to undertake an in–depth study to investigate the role of decentralization in
governments’ performance basing on a rural setting like Kaliro District.
1.11. Scope of the study.
1.11.1 Geographical scope
The study was conducted in Kaliro district. This district is in eastern region of Uganda
neighbouring; Iganga, Kamuli, Luuka, Namutumba and Pallisa districts. Kaliro district was
chosen because it is the researcher’s area of residence, a rural district and one of the newly created
12
districts – hardly ten (10) years ago. The study covered three (3) sub counties and one (1) town
council as lower local governments (LLG) in the district. It involved various district stakeholders
who were purposively selected.
1.11.2 Content scope:
The study was limited to whether decentralization system has facilitated good local governance
in the local governments of Uganda. More specifically by assessing the extent to which
decentralization has contributed to the improvement in governance i.e. in enhancing community
participation; promoting accountability and local capacity in Uganda. Kaliro district acted as a
case study to illustrate this.
1.11.3 Time scope
The time scope of the study was limited to the years 2005 to 2015. This was attributed to the fact
that Kaliro district – our case study area, was created as a local government in 2005 and this study
was completed in 2015.
1.12. Operational Definitions of Key Concepts.
The definitions of these terms have been developed purely for the sake of this study and may not
be very applicable to all situations other than this study.
Civil society: Refers to various partners of political participation outside formal state structures,
(Nsibambi, 2000).
Deconcentration: A type of decentralization frequently used in unitary states which merely shifts
responsibilities from central government officials in the capital city to those working in regions,
provinces or districts, (Olowu, 2003).
Delegation: This is a more extensive form of decentralization which involves the central
government transferring responsibilities for decision-making and administration of public
13
functions to semi-autonomous organizations not wholly controlled by the central government, but
ultimately accountable to it, (Olowu, 2003).
Devolution: This is an administrative type of decentralization where governments transfer
authority for decision-making, financial resources and management to quasi-autonomous units of
local government with corporate status, (Olowu, 2003).
Effectiveness: The level of output produced in achieving objectives which meets the required
standards, (Nsibambi, 2000).
Empowerment: This is a process through which people and communities increase their control
or mastery over their own lives and the decisions that affect them, (Fumihiko, 2000).
Planning: This refers to a process by which communities or individuals and other stakeholders
come together to identify their problems, mobilize the available resources and utilize them in an
effective and efficient manner to address the identified problems according to their priorities,
(Deepa, 2002).
Vulnerable persons: This refer to people who are economically, socially, physically,
emotionally and mentally exposed to suffering, want, threats and lack of services for an adequate
standard of living but lack the means, abilities and or resources, for the reasons beyond their
control, to cope with such suffering, needs/wants or threats, (Fumihiko, 2000).
14
CHAPTER TWO
LITERATURE REVIEW
2.1 Introduction
This chapter presents theoretical and related literature review. Relevant literature was reviewed
in order to critically present the knowledge of other scholars on the study. Literature was sought
from different libraries of various institutions and soft material was easily accessed by the
researcher from the internet. This study was brought in perspective by giving a brief background
to decentralization in the developing world in general and Uganda in particular. Literature was
structured according to the study variables of governance involving: Community participation,
Local community capacity and Accountability. The review also sought to assess the impact of the
moderating variables notably; the locality factors involving attitude, social status and community
mobilization and awareness in the implementation of the decentralization system.
2.2. Theoretical review
The normative models of democratic governance; decentralism and centralism with an alternative
model of centripetalism (Gerring etal, 2004) give the basis for our review. Decentralists envision
political institutions that are separate and independent of one another, resulting in a decision
making process that is highly localized and requires universal consent. Centralists envision
political institutions that are highly focused and coordinated from the top. While the
Centripetalists see the source of good government in institutions that reconcile inclusion and
authority, bringing interests, ideas, and identities towards the center into an authoritative decision
making process, (Gerring etal, 2004).
Ibid asserts that the decentralist theory, supposes that good governance arises from the diffusion
of power among multiple independent bodies and that good governance should arise when
15
political institutions preserve the authority of the sovereign while gathering together and
effectively representing whatever ideas, interests, and identities are existent in a society.
Perceives the decentralization of power as a mechanism to bring government closer to the people.
Their assumption is that centralized power is generally controlled by leaders whose interests run
contrary to the electorate; the only hope for popular control of government is therefore to
decentralize the locus of decision making. Despite their evident differences, all twentieth century
decentralists agree with several core precepts of: diffusion of power, broad political participation,
and limits on governmental action.Existence of multiple veto points forces a consensual style of
decision making in which all organized groups are compelled to reach agreement on matters
affecting them. Decentralized authority structures may also lead to greater popular control of, and
direct participation in, political decision making. Efficiency is enhanced by political bodies that
lie close to the constituents they serve, (Gerring, et al, 2004).
Theories of democratic governance being decentralist in nature, the general assumption is that
government works best when political institutions diffuse power broadly among multiple,
independent bodies. This is the model of good government embraced by most lay citizens
(Uganda inclusive). (Gerring etal, 2005).
Gerring etal (2004) further states that centralized power is always controlled by elites, whose
interests run contrary to the masses. The only hope for popular control of government is therefore
to decentralize the locus of decision making. He further asserts that decentralized authority
structures may also lead to greater popular control of, and direct participation in political decision
making. This is in line with Smith (1985) who stated that efficiency is enhanced by political
bodies that lie close to the constituents they serve and through competition that is set into motion
among semi-autonomous governmental units.
16
Uganda’s devolutionary decentralization can only foster good local governance and local
democracy if it is properly conceptualized, the facilitating conditions given careful attention and
the institutional framework sufficiently elaborate and effective to enable it to achieve its intended
objectives. Short of these measures, the gap between the intent and reality might be so great as to
disable the decentralization policy from achieving real local governance and local democracy,
(Kiyaga & Olum, 2009).
Therefore, it was the considered opinion of the researcher to use this model to assess how separate
and independent political institutions can enhance community participation, local capacity and
accountability to achieve good local governance.
2.3. Conceptual Review
The study was based on the normative models of democratic governance as conceptualized in the
frame work indicated in figure 1.in 1.7 above. Like the decentralists, the liberal theorists of the
state urge that local democracy makes a positive contribution to the health of the nation’s
democracy generally by offering opportunities for greater personal participation in the actual
business on governing and by creating a democratic climate of opinion, (Smith, 1985).
The term decentralization is commonly used to describe various arrangements, and there is a
dispute amongst scholars as to whether it should be used to mean deconcentration or devolution.
For thepurpose of this study the researcher exhaustively dwelt on devolution; the type of
decentralization that Uganda is practicing; which refers to a form of political decentralization
where a local government has an established local assembly with usually elected members and
characterized by a high level of local government autonomy, (Munyonyo, 1999).
17
Devolution embraces political, administrative and financial forms of decentralization which
encourages greater participation in decision making, redistributes resources and responsibility.
While diversity in degree of decentralization across the world is a fact, there is no consensus in
the empirical literature over questions like ‘which country is more decentralized?’ This is because
decentralization is defined and measured differently in different studies, (Sharma, 2006).
2.4. Decentralization and Governance
In this section, the researcher defined, described, explained, discussed and reviewed the different
study variables/concepts of local governance. Notably: community participation, accountability,
local capacity, and locality factors in relation to decentralization.
Landell-Mills and Serageldinas cited in Kiwanuka, 2012 defines governance as the use of political
authority and exercise of control over a society and the management of resources for social and
economic development. And Charlick Robert as cited in Kiwanuka, 2012 looked at governance
as the effective management of public affairs through the generation of a set of rules accepted as
legitimate, for the purpose of promoting and enhancing societal values sought by individuals and
groups. And he notes that the fundamental principles of good governance include respect for the
rule of law and human rights, political openness, participation and inclusiveness, equality and
non-discrimination, effective and efficient processes and institutions, transparency, and
accountability.
According to Ronald & Henry (2000), decentralization offers a key element of the enabling
environment for good governance through which responsibilities are transferred from the central
government to the local level, where citizens can more readily participate in decisions that affect
them. He continues to assert that decentralization offers partnerships between local government
institutions, civil society organizations and the private sector for attainment of good governance.
18
It is generally agreed that the following constitute the main attributes of good local governance:
constitutionalism, rule-of-law, justice, security of person and property, electoral and participatory
democracy, respect for human rights and basic freedoms, equity, citizen participation in local
decision-making, effective and efficient service delivery, and transparency, accountability and
integrity in the management of public and private corporate affairs, (Kauzya, 2002).
Good governance is a critical prerequisite for achieving sustainable development. Growth and
development cannot be achieved where governance is bad. Sustained good governance is the
ultimate goal, and capacity development is a critical input for achieving that goal. The lack of
good governance has been demonstrated to have corrosive effects on the development process.
Improving the governance environment in the developing world is therefore a major priority on
the development agenda, and the capacity to do so must be enhanced, (Hope, 2006).
This study considered three concepts in the dependent variable which are key in determining good
local governance i.e.; community participation, local capacity and accountability; while the
locality factors i.e.: attitude, social status and community mobilization and awareness being
considered as the moderating variable.
2.4.1 Decentralization and Community Participation
Community participation is a process by which stakeholders’ influence and share control over
priority setting, policy making, resources allocation and or programme implementation, (World
Bank, 2002). Literature on consultative meetings, free and fair elections, planning and budgeting
and decision making were reviewed, explained, discussed and evaluated.
19
Under community participation the critical issues to be considered was; the awareness and the
will of the locals and of the technocrats to involve the community in consultative/ planning and
budget meetings, the understanding of the community’s roles to be played in councils’
programmes; the level of participation and the reward for effective participation. When
communities effectively participate in local government programmes, there is likelihood to attain
the desired goals and objectives. Whereas, where there is inadequate or ineffective community
participation service delivery suffers and good governance may not be realized.
The most popular conception in current discourse formed by liberal democracy postulates that
democracy is a system of government in which there is meaningful, extensive, regular and fair
competition for all elected positions of government; a highly inclusive level of political
participation; and civil and political liberties sufficient to ensure the integrity of political
competition and participation, (Novacx, 1970).
With regard to functionality key questions are: do local people feel that decentralized bodies have
a positive effect on their lives, and do local people feel that participation in decentralized bodies
is meaningful? People embrace governments that can serve their needs. Exposure to locally
relevant government can help to create a record of legitimacy and accountability among local
people that can strengthen a decentralized government’s ability to assume broader political and
developmental responsibilities, (Olowu& James, 2004). One District Councillor of KDLG
lamented that due to poor remuneration councilors have become beggars before technical persons.
As beggars councilors are not empowered to monitor government programmes implemented by
technocrats. Democracy not only conditions the way in which the poor can participate in decision-
making and thereby facilitate the alleviation of their conditions, it also creates space in which
individuals and groups can organize along social and economic lines to pursue their interests,
(Webster, 2000).
20
The major premise, upon which Uganda’s local government system was built, was that local
citizens would participate effectively in making decisions over local development in addition to
holding their leaders to account. It was also assumed that elected leaders would always work in
the best interest of their electorate – although the reality has turned out to be different, (Francis
& James, 2003).Councilors are poorly motivated and thus cannot deliver results. Councilors are
supposed to make decisions in favor of the public, but many times they make them in favor of
technocrats who give them what to eat.
GoU (2001)observed specifically that popular participation is very crucial in its overall
development efforts. Politically the government has entrenched a system at all levels based on
people’s committees commonly known as LCs composed of popularly elected representatives to
promote full participation of the population in decisions that affect them.
Generally, Uganda’s local government system is open and participative. However, there are
serious challenges facing citizen participation in local development. The fact is that citizens
cannot fully participate in public affairs, even over matters that affect them directly, unless they
are empowered, (Deepa, 2002). In most cases citizens have little understanding of their local
economies, and also find the planning and budgeting process complicated and their decisions
never implemented. Practice has also shown that the local people are easily hoodwinked by
unscrupulous political elites who capture the planning and budgeting process to advance their
selfish interests. It should also be noted that it is not easy to get the necessary information, such
as services to be delivered and the funds spent on them, to local people at the right time to facilitate
appropriate decision-making. Furthermore, not all ideas get included in development plans during
bottom-up participatory planning, leading to unfulfilled expectations.

21
The local people at the grass root levels, lack sufficient knowledge and organization, which
exposes their agenda to the risk of ‘elite capture’. A classic case of elite capture can be seen in
School Management Committees (SMCs) in primary schools where the majority of the parents
are poor peasants who exercise minimal control over the decision-making process, for example,
in financial matters, (Prinsen & Titeca, 2008). Reinikka and Svesson (2004) also observed that
the bulk of school grants are captured by local officials and politicians in primary schools with
impunity. The end result being poor service provision. To hold teachers and schools accountable
requires parents to be at the frontline of schools’ inspection and monitoring which is lacking.
Much as it would appear that every citizen above the age of eighteen is free to contest local
elections, the reality is that because of the ‘monetized’ nature of politics in the country, many
peasants can il-afford to buy their way into political office. This monetized electoral process has
now taken root to the extent that even the annulment of results by the courts has not deterred those
with money from buying their way into power. This elite capture of the governance process has
become endemic.
The attendance of local council meetings has been progressively declining. There is increased
perception by local people that local governments are in reality mere appendages of the central
government and that most politicians get into office principally to help themselves to public
resources and privileges. Councils and standing committees at HLG and LLGs exist but with
limited functionality. During meetings members personalize issues rather than talking issues
objectively. Even community structures are still weak to make informed decision making in the
District, (USAID Report, 2012). This view is reinforced by the widely reported systemic
corruption at central and local government levels, resulting in the diversion of meager funds away
from service provision. The other unintended consequence of corruption is that decentralization
is reinforcing the power of local elites because local citizens lack ‘civic competence’ in the sense
22
that they are reluctant to exercise their ‘voice’ and ‘political agency’ to effect change in their
favour, (Golooba, 2009).
Fumihiko (2000)asserts that many of the women Councilors in Uganda still need more training
and support, and this is acknowledged by Councilors, including women Councilors themselves.
They particularly need more training on leadership, lobbying and budgeting skills. The budgeting
seems to be an extremely difficult subject for most of the Councilors. It is, therefore, imperative
that citizens are regularly provided with adequate information on the nature and resources of local
economies, and have their skills in, say, financial management, planning and budgeting enhanced
so that they can sensibly participate in deciding over local plans, budgets and investments. Local
governments should be assisted to develop effective communication strategies to enable this to
happen.
2.4.2. Decentralization and Accountability
Accountability is the situation of being responsible for any action and or decision taken and acting
on criticism or requirement made, (MoFPED, 2004). The key factors to consider under
accountability include; Political, Administrative, Financial and Physical accountabilities and
Transparency. This is to dwell on commitment of staff in performance of their duties and that of
the political representative to the community and transparency in councils’ transactions. Lack of
commitment on part of the local government officials which greatly affect the efforts of promoting
good governance. Decentralization as it places the decision making centres close to the
beneficiaries, it therefore, creates opportunities for those beneficiaries to gain access to the
decision making elites and thus increase the chances for effective accountability and transparency
in the conduct of public affairs, (Nsibambi, 2000).
In theory, the local government system is transparent and the citizens are expected to be well
informed. In practice, however, the reality is different. The primary avenue through which the
23
citizens are supposed to be informed about decisions and investments made by their local
governments is through their council representatives. To do this the council representatives must
be able to travel through their constituencies to provide feedback and solicit the views of their
electorate. Resources for this facilitation should come from locally generated revenue, but this
source of revenue has always been inadequate and has continued to dwindle in recent years
following the abolition of graduated tax. Thus, local government councillors are immobilized due
to lack of these resources. Nationally, there is a marked decline in local revenue from
Ug.Shs.109billion in 1997/98 to Ug.Shs.93billion in 1998/200, then Ug.Shs.78billion in
2000/2002, (Local Government Finance Commission, 2009).
Good governance is increasingly being recognized as not only pivotal to ensuring national
prosperity and sustainable democracy, but also as a major challenge to growing democracies such
as Uganda. As the country recovers from over forty years of politically and socially-induced
conflicts which are largely the result of bad governance in the political, social and economic
spheres, it is important that significant effort be devoted to addressing the deficiencies in
transparency and accountability in managing public affairs, (The First Annual State of
Governance Conference in Uganda; 2006, Pg 1).
If decentralization is to be democratic and local governance is to emerge, locally accountable
institutions must be established that make key decisions: setting local priorities, allocating
resources, and supervising implementation of these decisions. Thus any assessment of democratic
decentralization finds its success closely linked to that of locally elected legislative bodies,
normally called councils, (Olowu et. al, 2004). Perhaps the single greatest cause of council
weakness in Uganda is the weakness of their committees as most of the committees rarely meet
to discuss council’s affairs. The citizens are supposed to be informed through their representatives
in local government councils who scrutinize local plans, budgets and expenditures through
24
various council committees. However, the citizens are rarely aware of these measures due to
limited feedback from councilors. They also have limited means of holding the councilors to
account, except perhaps during elections when their only option is either to return their councilors
or to vote them out. The high turnover of councilors at local elections is indicative of built up
citizens’ frustration, which could have been contained if leaders periodically provided feedback
to the citizens on progress made in implementing their electoral manifestos.
The limited degree of participation at the local levels might be the single most important
explanation for the current weakness of the accountability framework. The experience of more
developed countries suggests that a vibrant civil society that is able to keep local governments in
check is essential to enhance downward accountability. In Uganda, an elaborate framework is in
place to ensure upward and downward accountability. However, its operation is quite
problematic. Intergrated bottom-up planning is not done largely due to inadequacy of funds to
facilitate consultations at LLG level. The district relies on the planning data provided by sub
counties who in turn depend on what parishes give with no feedback to the communities, (Kaliro
District Development Plan, 2012).Indeed, Blair (2000) commented that there are important
limitations on how much participation can actually deliver because accountability covers a much
wider range of activity and larger scope for democratic local governance strategy than it initially
appears.
Upward accountability has been effective in improving the operations of local governments in an
administrative sense. However, for downward accountability to be effective, political leaders
should have benchmarks against which they are judged. Furthermore, the citizens should be
regularly informed about how resources are being utilized and the impact arising there from.
There is little or no transparency in local council dealings. Whether it is in the process of making
by-laws, imposing taxes, or providing information about the locally generated revenue, local
25
government officials tell the people little about what is going on, nor do they encourage them to
think that it concerns them. Thus, the likelihood of a transparent and accountable system of
governance is virtually negligible, (Massoud Omar, 2009). Good governance, in all its facets, has
been demonstrated to be positively correlated with the achievement of better development
performance, and particularly through the building of institutions in support of transparency,
accountability, and better public financial management.
Conclusively, much as there is an urgent requirement for the development of a national civic
programme and sensitization of citizens on the nature of their local economies, local governments
need to develop effective strategies for communicating their decisions and activities to the
citizens beyond those that are currently in use. The peoples’ representatives should also be
adequately skilled and supported to enable them to provide regular and effective feedback to their
constituents. Equally important, civil society organizations should be strengthened to provide
effective checks on local governments to ensure transparency and accountability in their
operations, (Kiyaga&Olum, 2009).
2.4.3 Decentralization and Local Capacity
Capacity may refer to the ability to perform or being capable of handling any challenges at hand.
It can be categorized into various forms. But for the purpose of this study the researcher was
concerned with technical capacity and financial capacity. The study will look at financial capacity
in the context of revenue mobilization, utilization and self-reliance for local governments. Then
technical capacity in the context of available expertise towards service delivery in local
governments.Implementation of service delivery programmes mainly depend on the financial
capacity and the technical expertise. Therefore, it is important to have adequate resources and
technical staff for the success of such programmes.
26
Saturday Vision Survey (June13, 2015) noted that most of the councilors are not well educated
and some cannot read documents presented to council since the law doesn’t require a person
aspiring for a council seat to present academic qualifications many of those elected as councilors
are illiterate. The District Chairperson Kalungu was reported requesting Parliament to set
minimum academic qualification for councilors intending to vie for elective positions. He argued
that allowing whoever wishes to contest regardless of their academic qualification, affects the
quality of debate in local councils thus impacting negatively on performance. He further noted
that a good number of councilors do not have even the minimum competence to interpret the basic
governance policies and laws hence leading to malfunctioning of local government
administrations, (Musoke, 2015; Pg. 13).
The financing of local governments has a significant bearing on local democracy and governance.
If local governments raise substantial amounts of revenue from their local areas they are likely to
be subjected to increased demands for downward accountability and for increased citizen
participation in deciding how the resources will be used. On the other hand, the more reliant local
governments are on central government for their revenue, the more likely they are to place more
emphasis on upward accountability and to have less room in which to address local priorities.
Given that local governments in Uganda, KDLG inclusive, are reliant on central government for
nearly 90% of their revenue, it can be safely stated that the accountability flow is severely
distorted upwards with serious implications for local level development, especially when
combined with the other factors mentioned above. In fact, Steiner (2007) argues that poverty
reduction through decentralization is in jeopardy in Uganda because of low levels of information
about local government affairs, limited human capital and financial resources, restricted local
autonomy, corruption and patronage, high administrative costs related with decentralization and
low downward accountability.
27
Local revenue sources presently constitute less than 10% of total local government funding. In
the rural areas, local governments used to depend mainly on graduated tax but, this tax was
abolished in 2006 and has been replaced by local service and hotel taxes, which local governments
are yet to fully understand and implement. With respect to budgeting, central government remains
the most important source of funding for Kaliro district budget with local revenue contributing
0.6% against a total budget of shs. 11.1 billion. It was further revealed that against a local revenue
budget of shs 650 Million, only Shs. 42 Million was realized in Financial Year 2010/11, (Kaliro
District Draft Final Accounts, 2012).What this means is that local citizens have limited leverage
on local governments because their contribution to local revenue is quite minimal. This indirectly
undermines local democracy as it weakens downward accountability.
The limited resources coupled with poor execution have prevented the benefits of local
investments to be felt fully. Examples are bunches of shoddy construction of access roads and
drainage channels, and of markets that have not made any noticeable difference. If anything,
questions have been asked as to whether interventions in service delivery are making a real
difference for the poor or whether they are, in fact, abetting further inequality.
In many developing countries and Uganda in particular, local governments or administrative units
possess the legal authority to impose taxes, but the tax base is so weak and the dependence on
central government subsidies so ingrained that no attempt is made to exercise that authority.
Recent empirical analysis suggests a positive correlation between democratic governance and the
levels of income, investment, human capital, economic liberalization, and distributive income
growth in society, (Hope, 2006).
Under a decentralized system, professional staff may be relatively more isolated and lack the
frequency of contact with colleagues, than would have occurred under centralization. This has
been said to lead to a lower quality of service and provision than would otherwise have been the
28
case, (OECD, 1986). And also has contributed to the high rate of turn over for professionals like
medical doctors especially in rural districts like Kaliro. Hence this has in turn led to inadequate
technical capacity for service delivery in such areas.
Even where the ordinary citizens were supplied with all the available information on local
development issues, it is doubtful if many of them would accurately interpret it due to the low
literacy levels and lack of effective civic education. Lack of civic education and sensitization on
their local economies has prevented ordinary citizens from coming to grips with local
development issues to demand accountability from local governments. The lack of local capacity
has been cited as both a cause and a consequence of poor governance and failed attempts at
governance support in some developing countries, (Louis, 1999).
2.4.4 Decentralization and Locality Factors
Other than the above factors mentioned there are moderating factors that are playing a critical
complementary role in either promoting good governance or frustrating the good intended
objectives of decentralization. These have been broadly grouped as locality factors i.e. community
attitude, social status and community mobilization and awareness.
Some locals may be indifferent to change their attitudes towards development. While others
because of their social statuses like, literacy levels, religion, gender and so on may feel
uncomfortable to participate or may be marginalized. But also the intervention or non-
intervention of civil society organizations (CSOs) can greatly impact on the type of governance.
In that if communities are mobilized by the CSOs and awareness caused for their need to
participate in local government programmes, it will go a long way in promoting good governance.
This is because they will know their rights and demand for them.
29
The emergence of civil society, however, does not guarantee democracy, but it is unlikely that a
viable democracy can survive without a vibrant civil society. It is within civil society that public
opinion is formed and that it is through independent associations that individuals can have some
influence on government decision-making, (Woods. D, 1992). Here emphasis will be put on
community mobilization and awareness. The efficacy of bottom-up planning is constrained by
limited involvement of USAID and non- USAID implementing partners at LLGs level which
renders development planning not fully participatory and all-inclusive for sustainability of
decentralized planning and budgeting, (USAID Report, 2012).
Nsibambi (2000) observed that when the paradigms of good governance, decentralization,
democratization and civil society are closely analyzed, it becomes evident that they all seek to
empower people to exercise as much influence as possible on their social and political destiny. In
other words, economic, political, legal, technical, and even technological empowerment is the
meeting point of good governance, decentralization, democratization and civil society.
It should further be noted that decentralization is not synonymous with good governance. Neither
is it the same thing as democratization. If decentralization does not lead to empowerment of the
people, then it can not constitute an element of good governance. Nor can it contribute to
democratization or the strengthening of civil society, (Nsibambi, 2000).
In many states, these aspects of democracy are state given, and, therefore, there should be ways
through which the state is checked, to keep on the truck of democracy. The most common is
through a viable civil society. The importance of civil society to democracy is to provide a strong
foundation for democracy when it generates opportunities for participation and influence at all
levels of governance most especially at the local level. The democratization of local governments
thus goes hand in hand with developments of civil society as an important condition for the
deepening of democracy, (Munyonyo, 1999).
30
Most of the local civil society organizations are weak, narrowly based and generally politically
inactive. This means that the councilors’ passivity is unchallenged by those who might otherwise
make demands on them and the potential political resource for councils that might help them
challenge dominant executives are never brought to the table, (Olowu et. al, 2004).
Decentralization has not enhanced participation in local affairs by the majority of the citizens.
Yet this is the only way to check graft. On the ground, particularly in rural areas where the
majority of the population lives, civil society hardly exists. A few local organizations that have
emerged spontaneously are driven by survival strategies rather than the desire to influence public
policy. Therefore, meaningful participation is lacking, (Nsibambi, 2000).
Kanyeihamba argued that a robust civil society is a cornerstone for good governance, especially
in free and mature democracies. He cited the major challenge of civil society as getting the
courage to come out openly and seriously to fight injustice, deprivation or maladministration
regardless of the perceived consequences. He however warned that civil society operates in an
environment in which other institutions and bodies have authority and power to direct and affect
events far beyond the capability of civil society. Civil society therefore needs to appreciate the
powers and modus-operendi of these institutions and bodies if it is to maintain its role as an
effective watchdog, (The First Annual State of Governance Conference in Uganda, 2006; Pg.12).
The involvement of civil society in the management of local development is crucial in influencing
local and national government policies and promoting democracy at the local level.
2.5. Summary of the Literature Review
In summary, the above reviewed literature reveals the concept of decentralization and how it
influences governance in local governments; its attendant benefits and challenges to achieve this
in the various parts of the world – Uganda inclusive and Kaliro District in particular. However
the reviewed literature is not exhaustive as it leaves some gaps that fails a localized, systematic
31
and clear flow of understanding of the study variables - as far as influencing each other is
concerned.
The reviewed literature dwell on the role of the elites towards power capture to deny the illiterate
poor from accessing their intended decentralization benefits. However, little is mentioned on
whether the illiterate poor can adequately dispense the requirements of decentralization like
planning, budgeting and project implementation without the involvement of the elites. Instead it
emphasizes curtailing the powers of the elites in the processes.
Furthermore, the literature reviewed did not indicate the effect and financial implication for the
creation of more new districts in the country. And whether new districts’ creation should continue
or halted (in case of Uganda) in the name of bringing services to the people.
Much as the role of civil society in local governance has been emphasized in the literature
reviewed little was explored on the level at which NGOs/CBOs should perform to cause effective
participation as a community mouth piece and how to identify authentic NGOs/CBOs.
Equally, the developmentsin communications media like local radios which has become quite
common and popular, as medium for debate about local issues, and phone-in programs with local
political leaders; whether it can adequately supplement other forums for community participation.
Their role is quite under looked or not revealed in the literature reviewed.
In conclusion, therefore, the literature reviewed although very relevant, was lacking some
pertinent aspects which can be customized for the good of decentralization and good governance.
However, despite these apparent gaps, the literature was important in as far as guiding
investigations into the assessment of the role of decentralization in the promotion of good
governance in Uganda and Kaliro district in particular.
32
CHAPTER THREE
METHODOLOGY
3.1 Introduction
This chapter presents the methodology to the study: it gives descriptions of the research design,
study population, sample size and selection, sampling techniques and procedure, data collection
methods and instruments, pre-testing techniques, procedure of data collection, data analysis and
measurements of variables to giving a deeper understanding of the effectiveness of
decentralization on the promotion of good governance in Kaliro district.
33
3.2. Research Design
A case study design was used to describe the nature and pattern of the study. The choice of the
case study design was aimed at enabling the understanding of the study in depth so as to get
adequate solutions to the problems in the area of study. The rationale for choosing a specific case
was to enable to predict certain outcomes whether the theory holds truth, as it contained crucial
elements that were specifically significant, (Amin, 2005).
Correlation study was also adopted to help the researcher find an answer to the issue at hand –
cause and effect relationship, (Sekaran, 2003). To this both the qualitative and quantitative
approaches were used as they complement each other. Qualitative approach being descriptive and
using conceptualization, was used to capture feelings, opinions and other subjective variables,
(Sekaran, 2003). Whereas quantitative approach which uses statistics was basically used to solicit
and present data numerically in order to explain, describe, understand, predict or control the
phenomenon of interest, (Mugenda & Mugenda, 1999). This enabled the researcher to quantify
the views of the respondents towards certain variables and draw statistical conclusions. The
qualitative methods used included interviews which were conducted at Community level, Focus
Discussion Groups at the sub county/town council levels and the quantitative which included use
of questionnaires at the district, sub county and LC I levels.
3.3. Study Population.
The study population was from Kaliro district comprising of 253 people, the accessible population
comprised of DTPC staff, District Councillors, Councillors at Sub county and town council, sub
county and town council technical staff, Chairpersons Parish Development Committee and
Chairpersons LCI.
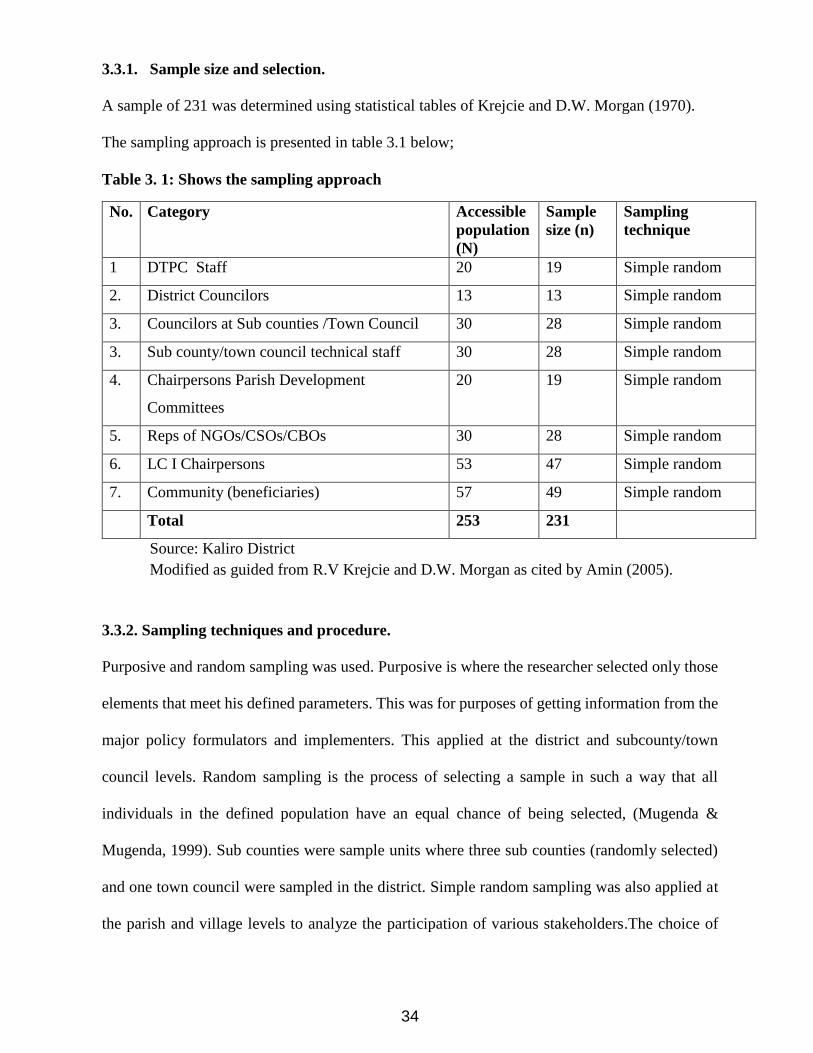
34
3.3.1. Sample size and selection.
A sample of 231 was determined using statistical tables of Krejcie and D.W. Morgan (1970).
The sampling approach is presented in table 3.1 below;
Table 3. 1: Shows the sampling approach
No. Category Accessible
population
(N)
Sample
size (n)
Sampling
technique
1 DTPC Staff 20 19 Simple random
2. District Councilors 13 13 Simple random
3. Councilors at Sub counties /Town Council 30 28 Simple random
3. Sub county/town council technical staff 30 28 Simple random
4. Chairpersons Parish Development
Committees
20 19 Simple random
5. Reps of NGOs/CSOs/CBOs 30 28 Simple random
6. LC I Chairpersons 53 47 Simple random
7. Community (beneficiaries) 57 49 Simple random
Total 253 231
Source: Kaliro District
Modified as guided from R.V Krejcie and D.W. Morgan as cited by Amin (2005).
3.3.2. Sampling techniques and procedure.
Purposive and random sampling was used. Purposive is where the researcher selected only those
elements that meet his defined parameters. This was for purposes of getting information from the
major policy formulators and implementers. This applied at the district and subcounty/town
council levels. Random sampling is the process of selecting a sample in such a way that all
individuals in the defined population have an equal chance of being selected, (Mugenda &
Mugenda, 1999). Sub counties were sample units where three sub counties (randomly selected)
and one town council were sampled in the district. Simple random sampling was also applied at
the parish and village levels to analyze the participation of various stakeholders.The choice of
35
this method was because it gives equal opportunity to all respondents to be selected and very
convenient to use when handling a large population.
3.4. Data Collection Methods.
The data collection methods for this study were categorized namely: face to face interviews which
were conducted, questionnaires for quantitative data that were personally administered; Focused
Group Discussions (FGDs) and documentation reviews.
3.4.1 Questionnaire.
Questionnaire is a list of carefully structured questions, chosen after a considerable testing with a
view of eliciting reliable responses from chosen samples, (Hussey & Hussey, 1997). The choice
of a questionnaire is justified by the fact that it is the best tool in collecting quantitative data from
a big number of respondents. Questionnaire provided information based on facts and opinion.
This was self-administered with semi – structured set of questions, open and closed ended.Semi
structured questionnaires were used because large samples were made of use and thus making
results more dependable and reliable, also offered the greatest assurance of anonymity, cheaper
than other methods and free from bias. A total of 135 questionnaires were distributed to the
selected respondents and 125 questionnaires were returned fully filled in.
3.4.2. Interviewing
This is a method of collecting data in which selected participants were asked questions in order
to find out what they do, think or feel to enable the researcher solicit information of subjects under
thorough probing, (Denscombe, 2000). This is a face to face interaction where the interviewer
asked questions to the interviewee, (Amin, 2005). The choice of the method was that it was
viewed to be flexible and it was an easy way of getting information. Also permitted the researcher
to clarify on some questions respondents could not understand and it took into account verbal
communications such as attitudes and behaviour of the interviewee in relation to the subject being
36
discussed. Interview guide was formulated covering the four thematic areas of study. Interviews
were conducted with the help of the interview guide, and were used on selected members of the
communities (beneficiaries) of selected villages from the four lower local governments.
3.4.3. Focus Group Discussion
Four Focus Group Discussions were conducted. One at each of the four selected LLGs (3 sub
counties and 1Towncouncil) involving Parish Development Committee members and
representatives of NGOs/CBOs/CSOs in the respective local governments. The purpose of the
study was explained to the participants to enable them explore their knowledge on the topic of
the study. A part from questions for further information and clarification, participants were
encouraged to share other experiences that enriched the subject under discussion. Key lessons and
recommendations were developed under each topic. Focus groups were used because they allow
interviewers to study people in a more natural conversation pattern than typically occurs in a one-
to-one interview; because of their fairly low cost compared to other methods, as one can get
results relatively quickly and increase the sample size of a report by talking with several people
at once.
3.4.4 Documentation Review.
This method involved delivering information by carefully studying written documents, or visual
information from sources called documents, (Amin, 2005). The researcher reviewed the District,
Town Council, and Sub-County Development Plans, Final Accounts, District Newsletters,
Budget Estimates and Council minutes for the period under review to ascertain their performance
in promoting good governance practices as primary sources.
37
3.5. Data collection instruments.
The data collection instruments are tools that a researcher used to collect data from the
respondents. A combination of instruments were used as appropriate to make use of their different
strength, as none of those methods when exclusively used was to collect sufficient data.
The following instruments were used; interview guide with unstructured questions, a semi –
structured close ended questionnaire, focused group discussion checklist, and documentation
review guide.
3.5.1 Interview guide.
An interview guide is a face – to – face interaction where the interviewer asked questions to the
interviewee, (Denscombe, 2000). Structured interview guide wasdeveloped listing the questions
or issues explored during the interview and including an informed consent form. Where
necessary, the guide was translated into locallanguage for easy understanding. According to
McNamara (2009), the strength of a general interview guide approach is the ability of a researcher
to ensure that general areas of information are collected from each interviewee; this provides more
focus than the conversational approach, but still allows a degree of freedom and adaptability in
getting information from the interviewee. The choice of this technique was that it is flexible and
easy to generate information from participants. This tool is helpful in obtaining information in
details. Qualitative research (using interviews) is useful for finding out information in areas where
little information is known, or to study a particular concept in more detail, (Denscombe, 1998).
3.5.2 Questionnaire.
A questionnaire was a carefully designed instrument for collecting data in accordance with the
specifications of the research questions. It consisted of questions in which the subject responded
in writing, (Denscombe, 2000). Questionnaires have advantages over some other types of the
methods in that they are cheap, do not require as much effort from the questioner as verbal or
38
telephone surveys, and often have standardized answers that make it simple to compile data. The
questionnaire presented five (5) preceded response rate using Likert scale to ease respondents’
effort in answering and minimizing subjectivity. Also the Likert scale was easy to construct,
(Kumar, 2011).
3.5.3 Focus Group discussion Guide.
This is a data instrument that helped people from similar background or setting/ experiences to
handle/discuss an issue of interest to the researcher, (Denscombe, 2000). Questions were
formulated on the four main thematic areas to guide the discussion. The choice of the instrument
was to enable the researcher collect in-depth information about groups’ perceptions, attitudes and
experiences of the topic under study.
3.5.4 Documentation Review Guide
This is a data collection instrument used by a researcher to collect information by carefully
studying written documents, or visual information from sources. Sociologists point out that
documentary evidence does not only mean words but can also include audio and visual evidence,
(Amin, 2005). The guide included District, Town Council, and Sub-County Development Plans,
Final Accounts, District Newsletters, Budget Estimates, Council minutes and Budget Estimate
speeches for the period under review to assess how decentralization has promoted good
governance in local governments.
3.6. Validity and Reliability.
The research instruments were pre- tested to minimize the random error and increase the
reliability of the data to be collected.
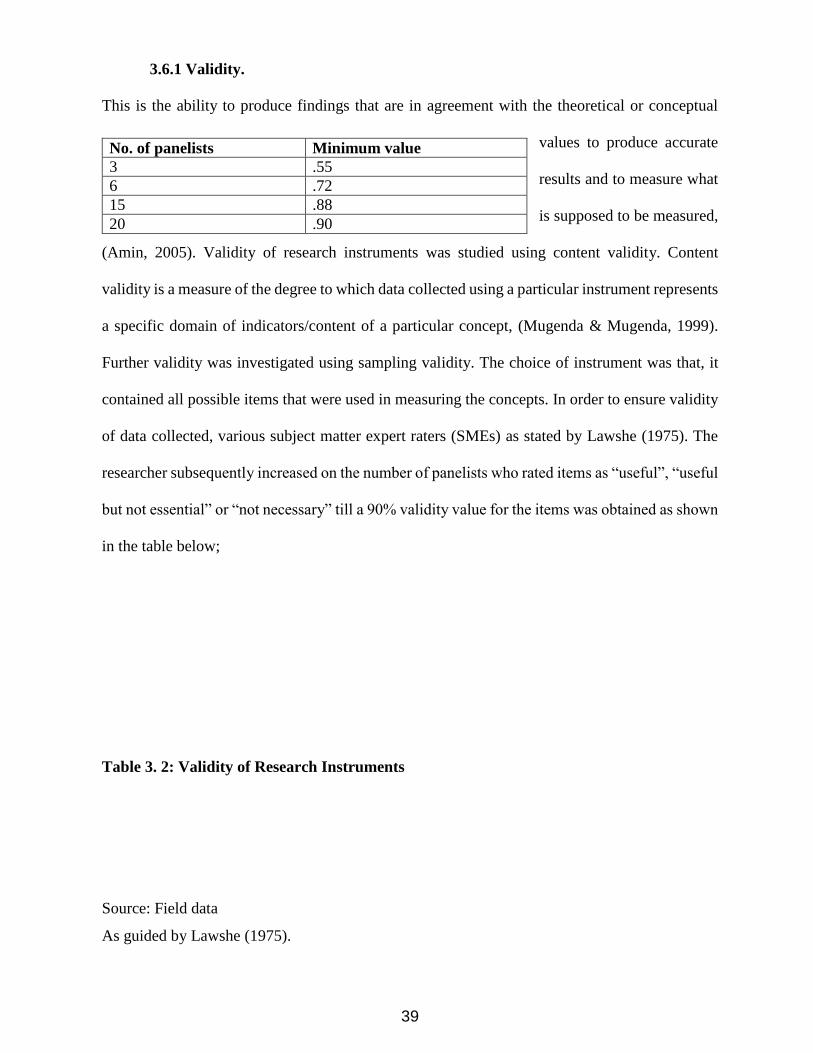
39
3.6.1 Validity.
This is the ability to produce findings that are in agreement with the theoretical or conceptual
values to produce accurate
results and to measure what
is supposed to be measured,
(Amin, 2005). Validity of research instruments was studied using content validity. Content
validity is a measure of the degree to which data collected using a particular instrument represents
a specific domain of indicators/content of a particular concept, (Mugenda & Mugenda, 1999).
Further validity was investigated using sampling validity. The choice of instrument was that, it
contained all possible items that were used in measuring the concepts. In order to ensure validity
of data collected, various subject matter expert raters (SMEs) as stated by Lawshe (1975). The
researcher subsequently increased on the number of panelists who rated items as “useful”, “useful
but not essential” or “not necessary” till a 90% validity value for the items was obtained as shown
in the table below;
Table 3. 2: Validity of Research Instruments
Source: Field data
As guided by Lawshe (1975).
No. of panelists Minimum value
3 .55
6 .72
15 .88
20 .90
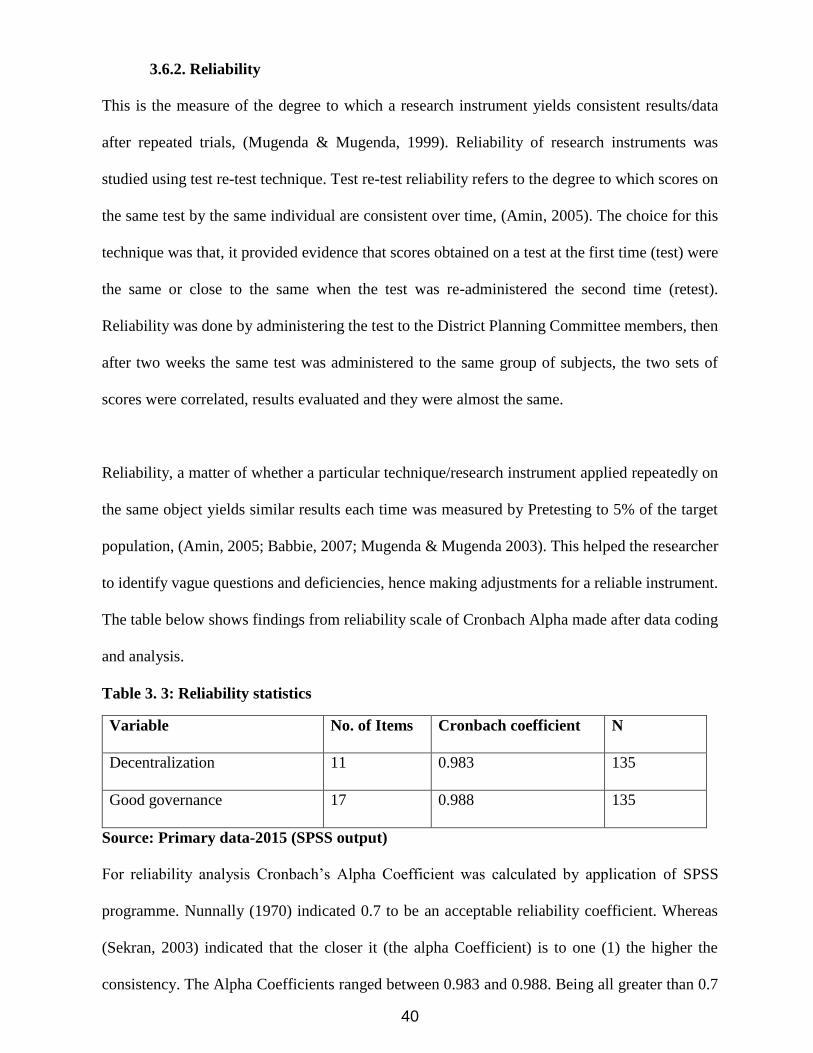
40
3.6.2. Reliability
This is the measure of the degree to which a research instrument yields consistent results/data
after repeated trials, (Mugenda & Mugenda, 1999). Reliability of research instruments was
studied using test re-test technique. Test re-test reliability refers to the degree to which scores on
the same test by the same individual are consistent over time, (Amin, 2005). The choice for this
technique was that, it provided evidence that scores obtained on a test at the first time (test) were
the same or close to the same when the test was re-administered the second time (retest).
Reliability was done by administering the test to the District Planning Committee members, then
after two weeks the same test was administered to the same group of subjects, the two sets of
scores were correlated, results evaluated and they were almost the same.
Reliability, a matter of whether a particular technique/research instrument applied repeatedly on
the same object yields similar results each time was measured by Pretesting to 5% of the target
population, (Amin, 2005; Babbie, 2007; Mugenda & Mugenda 2003). This helped the researcher
to identify vague questions and deficiencies, hence making adjustments for a reliable instrument.
The table below shows findings from reliability scale of Cronbach Alpha made after data coding
and analysis.
Table 3. 3: Reliability statistics
Variable No. of Items Cronbach coefficient N
Decentralization 11 0.983 135
Good governance 17 0.988 135
Source: Primary data-2015 (SPSS output)
For reliability analysis Cronbach’s Alpha Coefficient was calculated by application of SPSS
programme. Nunnally (1970) indicated 0.7 to be an acceptable reliability coefficient. Whereas
(Sekran, 2003) indicated that the closer it (the alpha Coefficient) is to one (1) the higher the
consistency. The Alpha Coefficients ranged between 0.983 and 0.988. Being all greater than 0.7
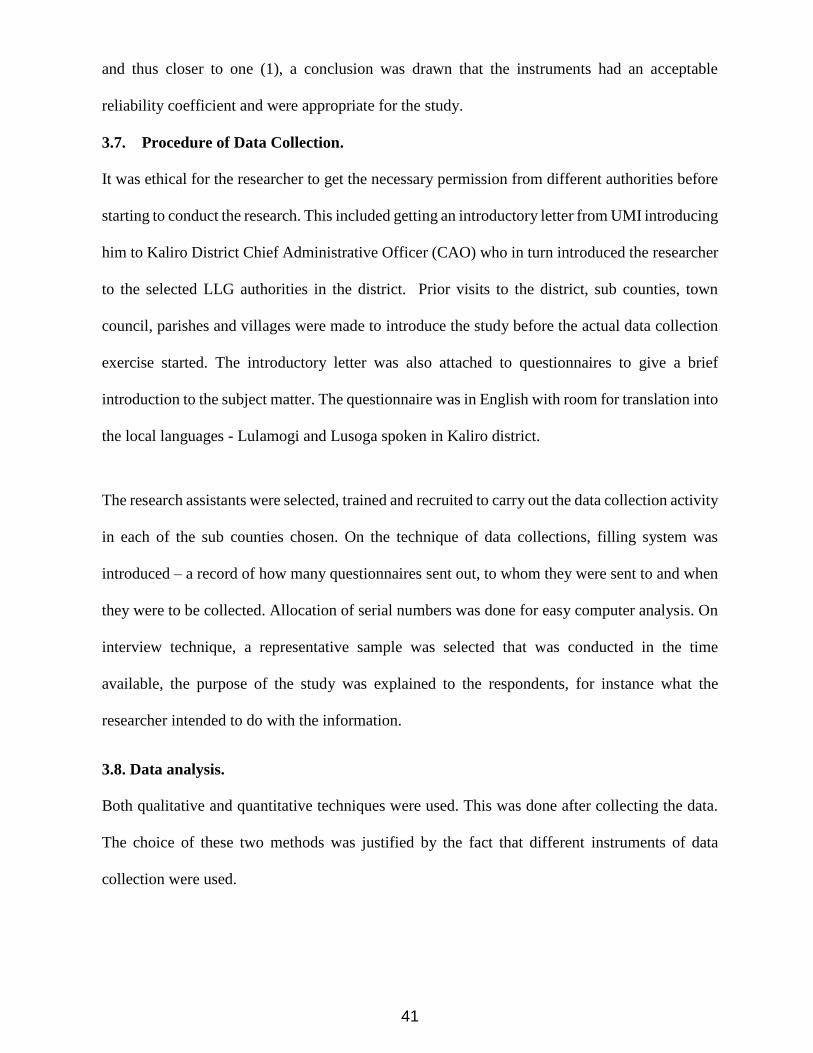
41
and thus closer to one (1), a conclusion was drawn that the instruments had an acceptable
reliability coefficient and were appropriate for the study.
3.7. Procedure of Data Collection.
It was ethical for the researcher to get the necessary permission from different authorities before
starting to conduct the research. This included getting an introductory letter from UMI introducing
him to Kaliro District Chief Administrative Officer (CAO) who in turn introduced the researcher
to the selected LLG authorities in the district. Prior visits to the district, sub counties, town
council, parishes and villages were made to introduce the study before the actual data collection
exercise started. The introductory letter was also attached to questionnaires to give a brief
introduction to the subject matter. The questionnaire was in English with room for translation into
the local languages - Lulamogi and Lusoga spoken in Kaliro district.
The research assistants were selected, trained and recruited to carry out the data collection activity
in each of the sub counties chosen. On the technique of data collections, filling system was
introduced – a record of how many questionnaires sent out, to whom they were sent to and when
they were to be collected. Allocation of serial numbers was done for easy computer analysis. On
interview technique, a representative sample was selected that was conducted in the time
available, the purpose of the study was explained to the respondents, for instance what the
researcher intended to do with the information.
3.8. Data analysis.
Both qualitative and quantitative techniques were used. This was done after collecting the data.
The choice of these two methods was justified by the fact that different instruments of data
collection were used.
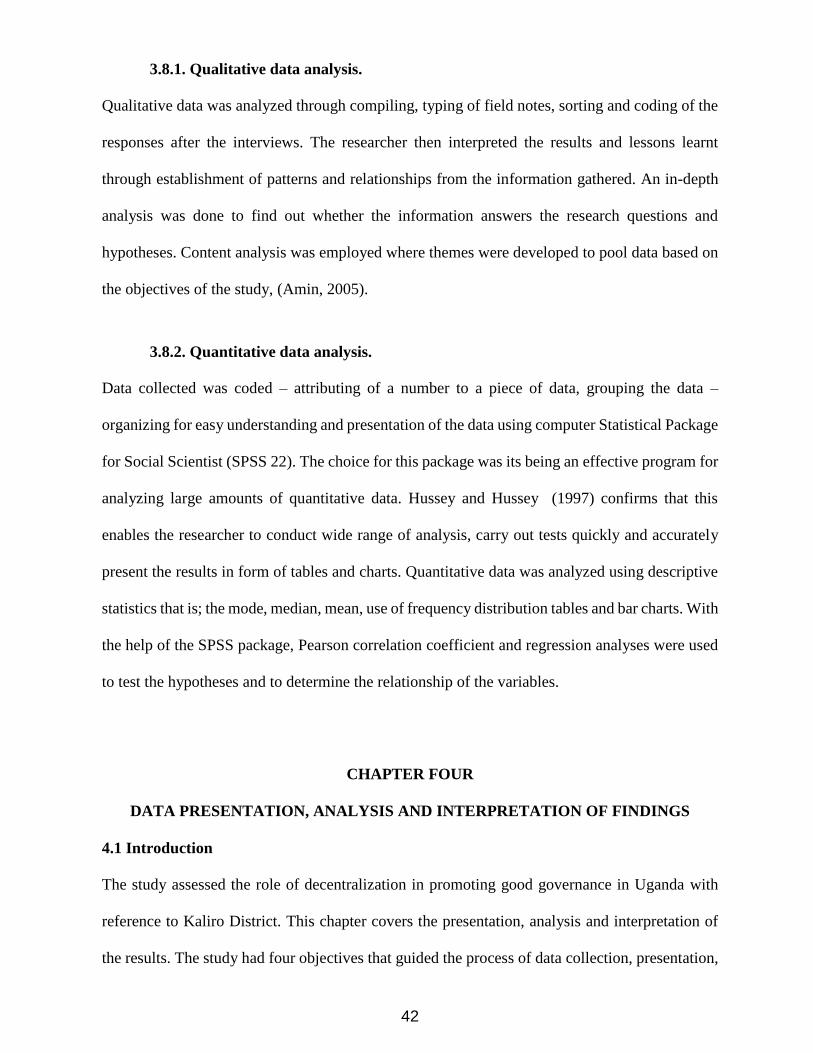
42
3.8.1. Qualitative data analysis.
Qualitative data was analyzed through compiling, typing of field notes, sorting and coding of the
responses after the interviews. The researcher then interpreted the results and lessons learnt
through establishment of patterns and relationships from the information gathered. An in-depth
analysis was done to find out whether the information answers the research questions and
hypotheses. Content analysis was employed where themes were developed to pool data based on
the objectives of the study, (Amin, 2005).
3.8.2. Quantitative data analysis.
Data collected was coded – attributing of a number to a piece of data, grouping the data –
organizing for easy understanding and presentation of the data using computer Statistical Package
for Social Scientist (SPSS 22). The choice for this package was its being an effective program for
analyzing large amounts of quantitative data. Hussey and Hussey (1997) confirms that this
enables the researcher to conduct wide range of analysis, carry out tests quickly and accurately
present the results in form of tables and charts. Quantitative data was analyzed using descriptive
statistics that is; the mode, median, mean, use of frequency distribution tables and bar charts. With
the help of the SPSS package, Pearson correlation coefficient and regression analyses were used
to test the hypotheses and to determine the relationship of the variables.
CHAPTER FOUR
DATA PRESENTATION, ANALYSIS AND INTERPRETATION OF FINDINGS
4.1 Introduction
The study assessed the role of decentralization in promoting good governance in Uganda with
reference to Kaliro District. This chapter covers the presentation, analysis and interpretation of
the results. The study had four objectives that guided the process of data collection, presentation,
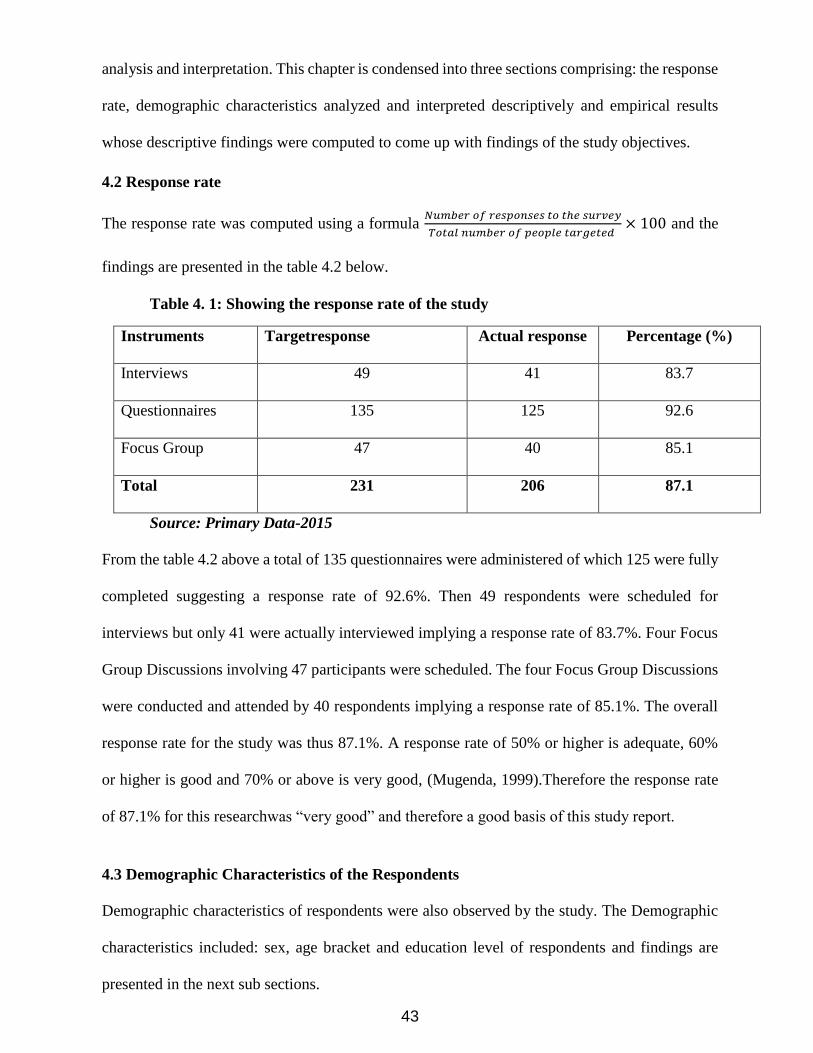
43
analysis and interpretation. This chapter is condensed into three sections comprising: the response
rate, demographic characteristics analyzed and interpreted descriptively and empirical results
whose descriptive findings were computed to come up with findings of the study objectives.
4.2 Response rate
The response rate was computed using a formula 𝑁𝑢𝑚𝑏𝑒𝑟 𝑜𝑓 𝑟𝑒𝑠𝑝𝑜𝑛𝑠𝑒𝑠 𝑡𝑜 𝑡ℎ𝑒 𝑠𝑢𝑟𝑣𝑒𝑦
𝑇𝑜𝑡𝑎𝑙 𝑛𝑢𝑚𝑏𝑒𝑟 𝑜𝑓 𝑝𝑒𝑜𝑝𝑙𝑒 𝑡𝑎𝑟𝑔𝑒𝑡𝑒𝑑 × 100 and the
findings are presented in the table 4.2 below.
Table 4. 1: Showing the response rate of the study
Instruments Targetresponse Actual response Percentage (%)
Interviews 49 41 83.7
Questionnaires 135 125 92.6
Focus Group 47 40 85.1
Total 231 206 87.1
Source: Primary Data-2015
From the table 4.2 above a total of 135 questionnaires were administered of which 125 were fully
completed suggesting a response rate of 92.6%. Then 49 respondents were scheduled for
interviews but only 41 were actually interviewed implying a response rate of 83.7%. Four Focus
Group Discussions involving 47 participants were scheduled. The four Focus Group Discussions
were conducted and attended by 40 respondents implying a response rate of 85.1%. The overall
response rate for the study was thus 87.1%. A response rate of 50% or higher is adequate, 60%
or higher is good and 70% or above is very good, (Mugenda, 1999).Therefore the response rate
of 87.1% for this researchwas “very good” and therefore a good basis of this study report.
4.3 Demographic Characteristics of the Respondents
Demographic characteristics of respondents were also observed by the study. The Demographic
characteristics included: sex, age bracket and education level of respondents and findings are
presented in the next sub sections.
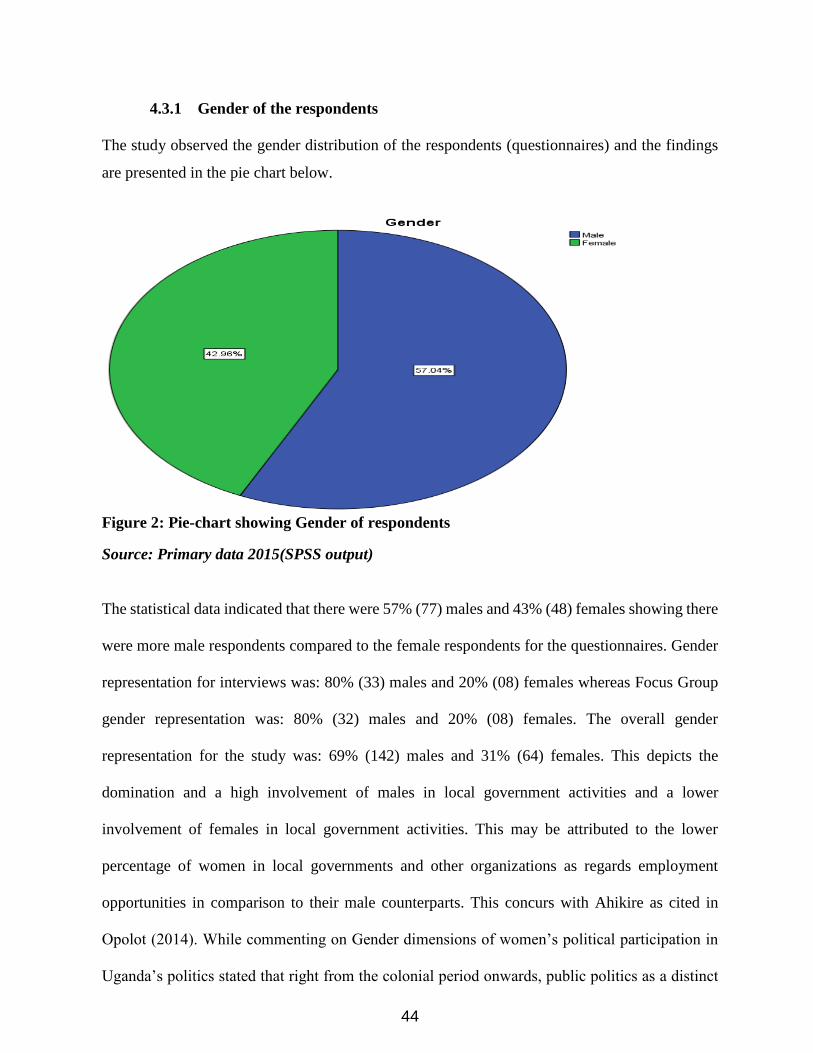
44
4.3.1 Gender of the respondents
The study observed the gender distribution of the respondents (questionnaires) and the findings
are presented in the pie chart below.
Figure 2: Pie-chart showing Gender of respondents
Source: Primary data 2015(SPSS output)
The statistical data indicated that there were 57% (77) males and 43% (48) females showing there
were more male respondents compared to the female respondents for the questionnaires. Gender
representation for interviews was: 80% (33) males and 20% (08) females whereas Focus Group
gender representation was: 80% (32) males and 20% (08) females. The overall gender
representation for the study was: 69% (142) males and 31% (64) females. This depicts the
domination and a high involvement of males in local government activities and a lower
involvement of females in local government activities. This may be attributed to the lower
percentage of women in local governments and other organizations as regards employment
opportunities in comparison to their male counterparts. This concurs with Ahikire as cited in
Opolot (2014). While commenting on Gender dimensions of women’s political participation in
Uganda’s politics stated that right from the colonial period onwards, public politics as a distinct
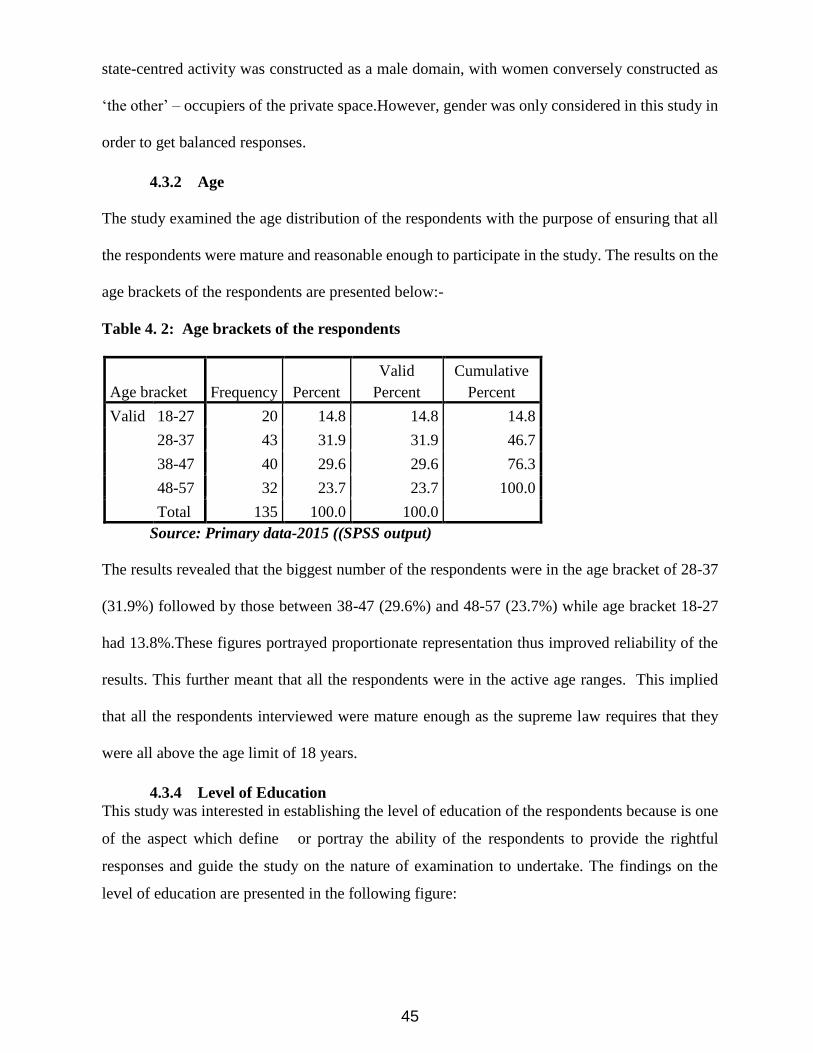
45
state-centred activity was constructed as a male domain, with women conversely constructed as
‘the other’ – occupiers of the private space.However, gender was only considered in this study in
order to get balanced responses.
4.3.2 Age
The study examined the age distribution of the respondents with the purpose of ensuring that all
the respondents were mature and reasonable enough to participate in the study. The results on the
age brackets of the respondents are presented below:-
Table 4. 2: Age brackets of the respondents
Age bracket Frequency Percent
Valid
Percent
Cumulative
Percent
Valid 18-27 20 14.8 14.8 14.8
28-37 43 31.9 31.9 46.7
38-47 40 29.6 29.6 76.3
48-57 32 23.7 23.7 100.0
Total 135 100.0 100.0
Source: Primary data-2015 ((SPSS output)
The results revealed that the biggest number of the respondents were in the age bracket of 28-37
(31.9%) followed by those between 38-47 (29.6%) and 48-57 (23.7%) while age bracket 18-27
had 13.8%.These figures portrayed proportionate representation thus improved reliability of the
results. This further meant that all the respondents were in the active age ranges. This implied
that all the respondents interviewed were mature enough as the supreme law requires that they
were all above the age limit of 18 years.
4.3.4 Level of Education
This study was interested in establishing the level of education of the respondents because is one
of the aspect which define or portray the ability of the respondents to provide the rightful
responses and guide the study on the nature of examination to undertake. The findings on the
level of education are presented in the following figure:
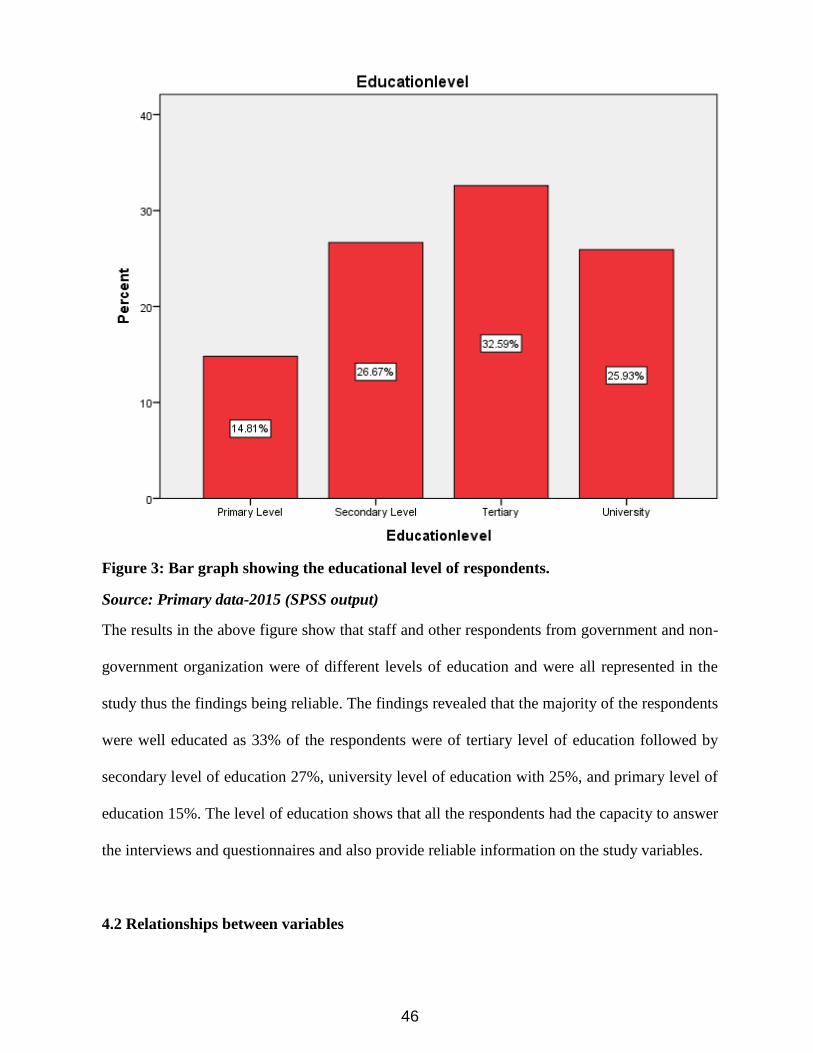
46
Figure 3: Bar graph showing the educational level of respondents.
Source: Primary data-2015 (SPSS output)
The results in the above figure show that staff and other respondents from government and non-
government organization were of different levels of education and were all represented in the
study thus the findings being reliable. The findings revealed that the majority of the respondents
were well educated as 33% of the respondents were of tertiary level of education followed by
secondary level of education 27%, university level of education with 25%, and primary level of
education 15%. The level of education shows that all the respondents had the capacity to answer
the interviews and questionnaires and also provide reliable information on the study variables.
4.2 Relationships between variables
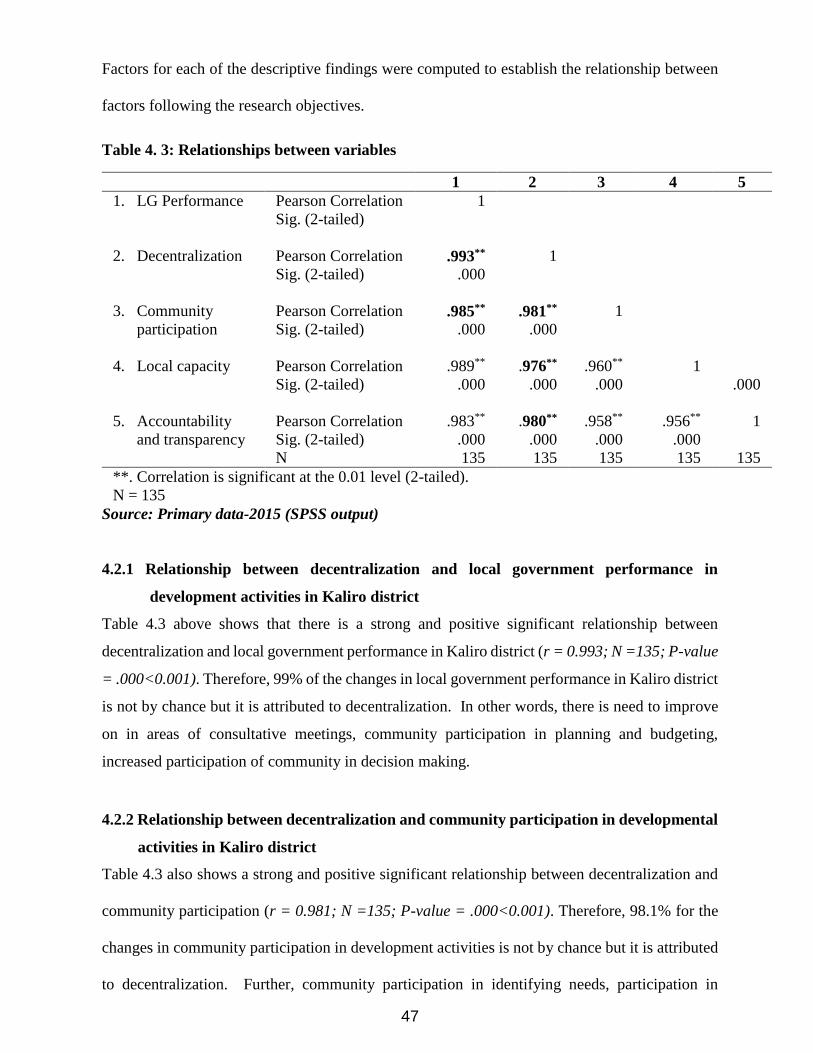
47
Factors for each of the descriptive findings were computed to establish the relationship between
factors following the research objectives.
Table 4. 3: Relationships between variables
1 2 3 4 5
1. LG Performance Pearson Correlation 1
Sig. (2-tailed)
2. Decentralization Pearson Correlation .993** 1
Sig. (2-tailed) .000
3. Community
participation
Pearson Correlation .985** .981** 1
Sig. (2-tailed) .000 .000
4. Local capacity Pearson Correlation .989** .976** .960** 1
Sig. (2-tailed) .000 .000 .000 .000
5. Accountability
and transparency
Pearson Correlation .983** .980** .958** .956** 1
Sig. (2-tailed) .000 .000 .000 .000
N 135 135 135 135 135
**. Correlation is significant at the 0.01 level (2-tailed).
N = 135
Source: Primary data-2015 (SPSS output)
4.2.1 Relationship between decentralization and local government performance in
development activities in Kaliro district
Table 4.3 above shows that there is a strong and positive significant relationship between
decentralization and local government performance in Kaliro district (r = 0.993; N =135; P-value
= .000<0.001). Therefore, 99% of the changes in local government performance in Kaliro district
is not by chance but it is attributed to decentralization. In other words, there is need to improve
on in areas of consultative meetings, community participation in planning and budgeting,
increased participation of community in decision making.
4.2.2 Relationship between decentralization and community participation in developmental
activities in Kaliro district
Table 4.3 also shows a strong and positive significant relationship between decentralization and
community participation (r = 0.981; N =135; P-value = .000<0.001). Therefore, 98.1% for the
changes in community participation in development activities is not by chance but it is attributed
to decentralization. Further, community participation in identifying needs, participation in
48
decision making programs, participation of the community in making and implementation of
local government programs, and involvement of community in monitoring development programs
of in Kaliro district must be emphasized and embraced by the majority of the residents in the
district.
4.2.3 The relationship between decentralization and accountable leadership in Kaliro
district.
Table 4.3 shows a strong and positive statistically significant relationship between
decentralization and accountable leadership (r = 0.980; N =135; P-value = .000<0.001). This
means that decentralization explains 98% change in accountable leadership in Kaliro district. The
biggest number of the respondents interviewed had enough knowledge concerning the
decentralization and very few respondents who showed little idea about the topic under
investigation. These findings are consistent with Kauzya (2002) who notes the following as
components of decentralization: constitutionalism, rule-of-law, justice, security of person and
property, electoral and participatory democracy, respect for human rights and basic freedoms,
equity, citizen participation in local decision-making, effective and efficient service delivery, and
transparency, accountability and integrity in the management of public and private corporate
affairs.
4.2.4 Relationship between decentralization and local capacity to participate in
development programs in Kaliro district
Table 4.3 above shows a strong positive statistical significant relationship between
decentralization and local capacity to participate in development activities (r = 0.976; N =135;
P-value = .000<0.001). In other words 97.6% of the contributions made by decentralization is
explained by capacity of local people to participate in development activities in Kaliro district.
Since the extent to which the two variables are related is high, it is true to assert that
decentralization system enables council staffs and local political leaders to mobilize the local
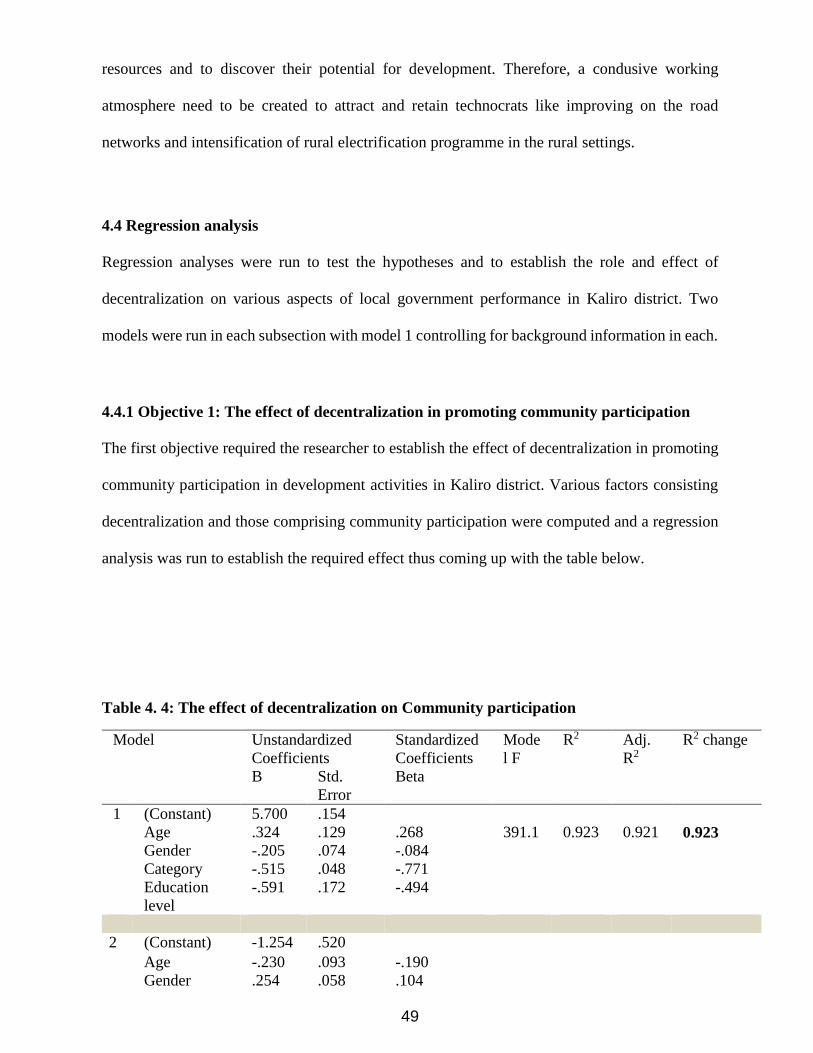
49
resources and to discover their potential for development. Therefore, a condusive working
atmosphere need to be created to attract and retain technocrats like improving on the road
networks and intensification of rural electrification programme in the rural settings.
4.4 Regression analysis
Regression analyses were run to test the hypotheses and to establish the role and effect of
decentralization on various aspects of local government performance in Kaliro district. Two
models were run in each subsection with model 1 controlling for background information in each.
4.4.1 Objective 1: The effect of decentralization in promoting community participation
The first objective required the researcher to establish the effect of decentralization in promoting
community participation in development activities in Kaliro district. Various factors consisting
decentralization and those comprising community participation were computed and a regression
analysis was run to establish the required effect thus coming up with the table below.
Table 4. 4: The effect of decentralization on Community participation
Model Unstandardized
Coefficients
Standardized
Coefficients
Mode
l F
R2 Adj.
R2
R2 change
B Std.
Error
Beta
1 (Constant) 5.700 .154
Age .324 .129 .268 391.1 0.923 0.921 0.923
Gender -.205 .074 -.084
Category -.515 .048 -.771
Education
level
-.591 .172 -.494
2 (Constant) -1.254 .520
Age -.230 .093 -.190
Gender .254 .058 .104
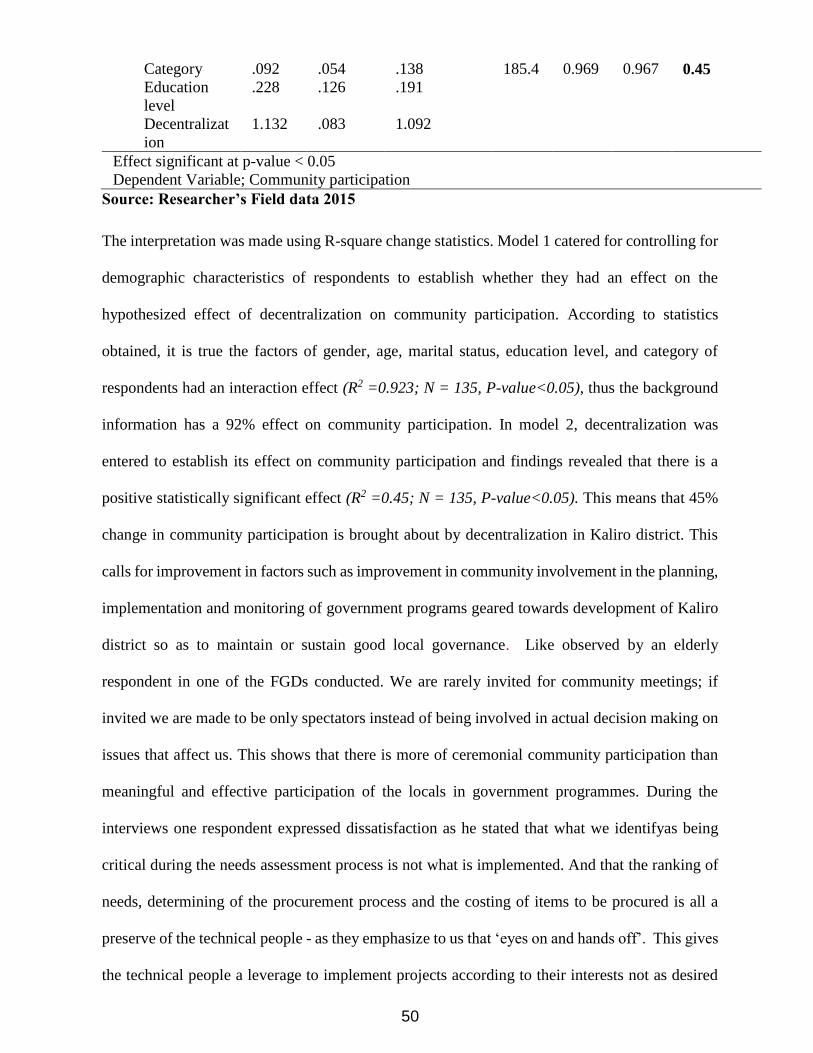
50
Category .092 .054 .138 185.4 0.969 0.967 0.45
Education
level
.228 .126 .191
Decentralizat
ion
1.132 .083 1.092
Effect significant at p-value < 0.05
Dependent Variable; Community participation
Source: Researcher’s Field data 2015
The interpretation was made using R-square change statistics. Model 1 catered for controlling for
demographic characteristics of respondents to establish whether they had an effect on the
hypothesized effect of decentralization on community participation. According to statistics
obtained, it is true the factors of gender, age, marital status, education level, and category of
respondents had an interaction effect (R2 =0.923; N = 135, P-value<0.05), thus the background
information has a 92% effect on community participation. In model 2, decentralization was
entered to establish its effect on community participation and findings revealed that there is a
positive statistically significant effect (R2 =0.45; N = 135, P-value<0.05). This means that 45%
change in community participation is brought about by decentralization in Kaliro district. This
calls for improvement in factors such as improvement in community involvement in the planning,
implementation and monitoring of government programs geared towards development of Kaliro
district so as to maintain or sustain good local governance. Like observed by an elderly
respondent in one of the FGDs conducted. We are rarely invited for community meetings; if
invited we are made to be only spectators instead of being involved in actual decision making on
issues that affect us. This shows that there is more of ceremonial community participation than
meaningful and effective participation of the locals in government programmes. During the
interviews one respondent expressed dissatisfaction as he stated that what we identifyas being
critical during the needs assessment process is not what is implemented. And that the ranking of
needs, determining of the procurement process and the costing of items to be procured is all a
preserve of the technical people - as they emphasize to us that ‘eyes on and hands off’. This gives
the technical people a leverage to implement projects according to their interests not as desired
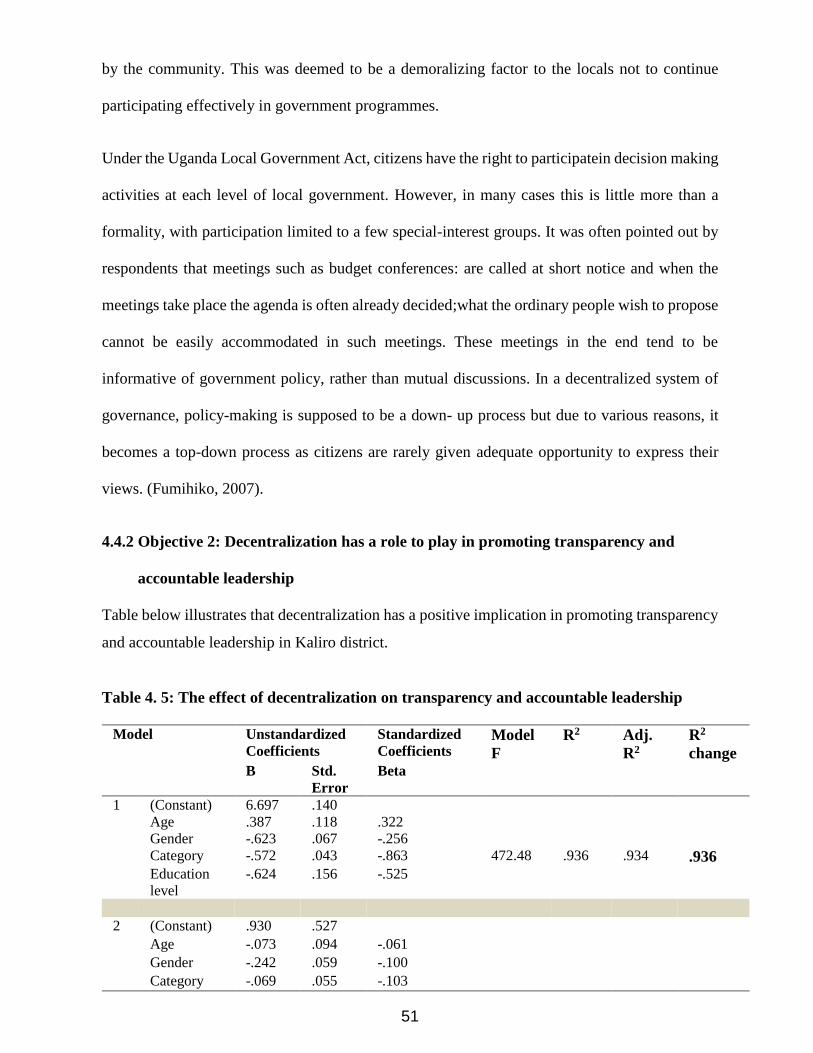
51
by the community. This was deemed to be a demoralizing factor to the locals not to continue
participating effectively in government programmes.
Under the Uganda Local Government Act, citizens have the right to participatein decision making
activities at each level of local government. However, in many cases this is little more than a
formality, with participation limited to a few special-interest groups. It was often pointed out by
respondents that meetings such as budget conferences: are called at short notice and when the
meetings take place the agenda is often already decided;what the ordinary people wish to propose
cannot be easily accommodated in such meetings. These meetings in the end tend to be
informative of government policy, rather than mutual discussions. In a decentralized system of
governance, policy-making is supposed to be a down- up process but due to various reasons, it
becomes a top-down process as citizens are rarely given adequate opportunity to express their
views. (Fumihiko, 2007).
4.4.2 Objective 2: Decentralization has a role to play in promoting transparency and
accountable leadership
Table below illustrates that decentralization has a positive implication in promoting transparency
and accountable leadership in Kaliro district.
Table 4. 5: The effect of decentralization on transparency and accountable leadership
Model Unstandardized
Coefficients
Standardized
Coefficients Model
F
R2 Adj.
R2
R2
change B Std.
Error
Beta
1 (Constant) 6.697 .140
Age .387 .118 .322
Gender -.623 .067 -.256
Category -.572 .043 -.863 472.48 .936 .934 .936 Education
level
-.624 .156 -.525
2 (Constant) .930 .527
Age -.073 .094 -.061 Gender -.242 .059 -.100 Category -.069 .055 -.103
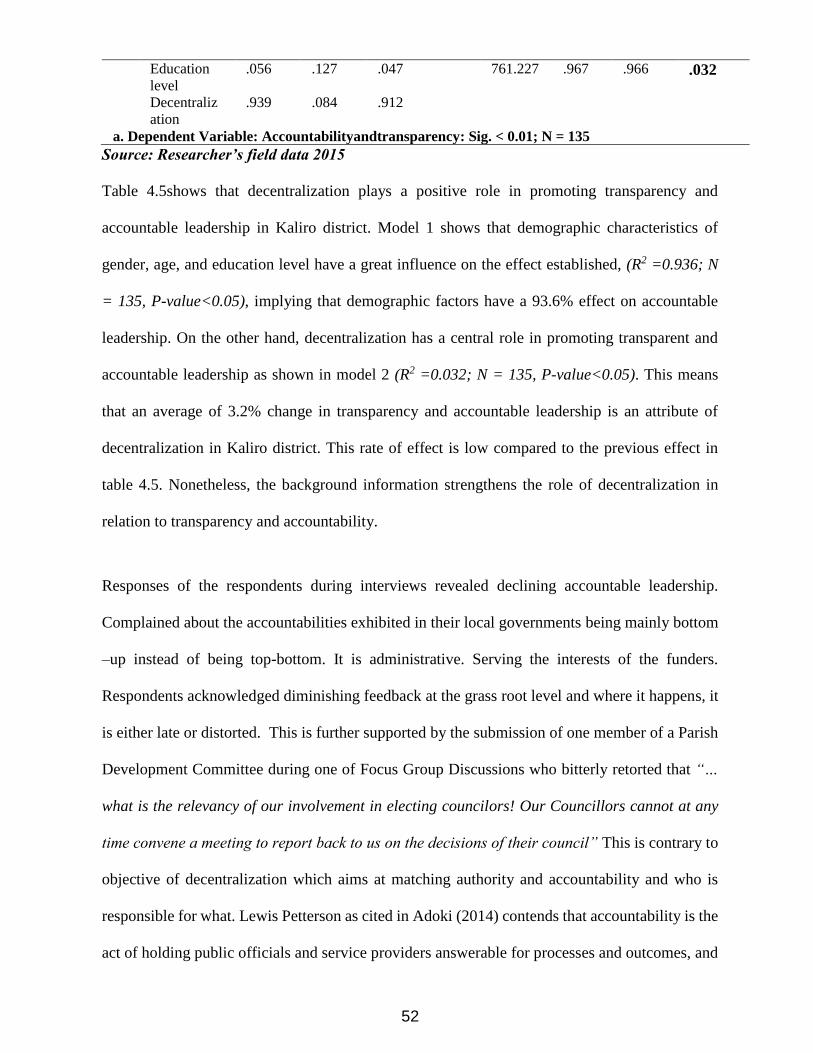
52
Education
level
.056 .127 .047 761.227 .967 .966 .032
Decentraliz
ation
.939 .084 .912
a. Dependent Variable: Accountabilityandtransparency: Sig. < 0.01; N = 135
Source: Researcher’s field data 2015
Table 4.5shows that decentralization plays a positive role in promoting transparency and
accountable leadership in Kaliro district. Model 1 shows that demographic characteristics of
gender, age, and education level have a great influence on the effect established, (R2 =0.936; N
= 135, P-value<0.05), implying that demographic factors have a 93.6% effect on accountable
leadership. On the other hand, decentralization has a central role in promoting transparent and
accountable leadership as shown in model 2 (R2 =0.032; N = 135, P-value<0.05). This means
that an average of 3.2% change in transparency and accountable leadership is an attribute of
decentralization in Kaliro district. This rate of effect is low compared to the previous effect in
table 4.5. Nonetheless, the background information strengthens the role of decentralization in
relation to transparency and accountability.
Responses of the respondents during interviews revealed declining accountable leadership.
Complained about the accountabilities exhibited in their local governments being mainly bottom
–up instead of being top-bottom. It is administrative. Serving the interests of the funders.
Respondents acknowledged diminishing feedback at the grass root level and where it happens, it
is either late or distorted. This is further supported by the submission of one member of a Parish
Development Committee during one of Focus Group Discussions who bitterly retorted that “…
what is the relevancy of our involvement in electing councilors! Our Councillors cannot at any
time convene a meeting to report back to us on the decisions of their council” This is contrary to
objective of decentralization which aims at matching authority and accountability and who is
responsible for what. Lewis Petterson as cited in Adoki (2014) contends that accountability is the
act of holding public officials and service providers answerable for processes and outcomes, and
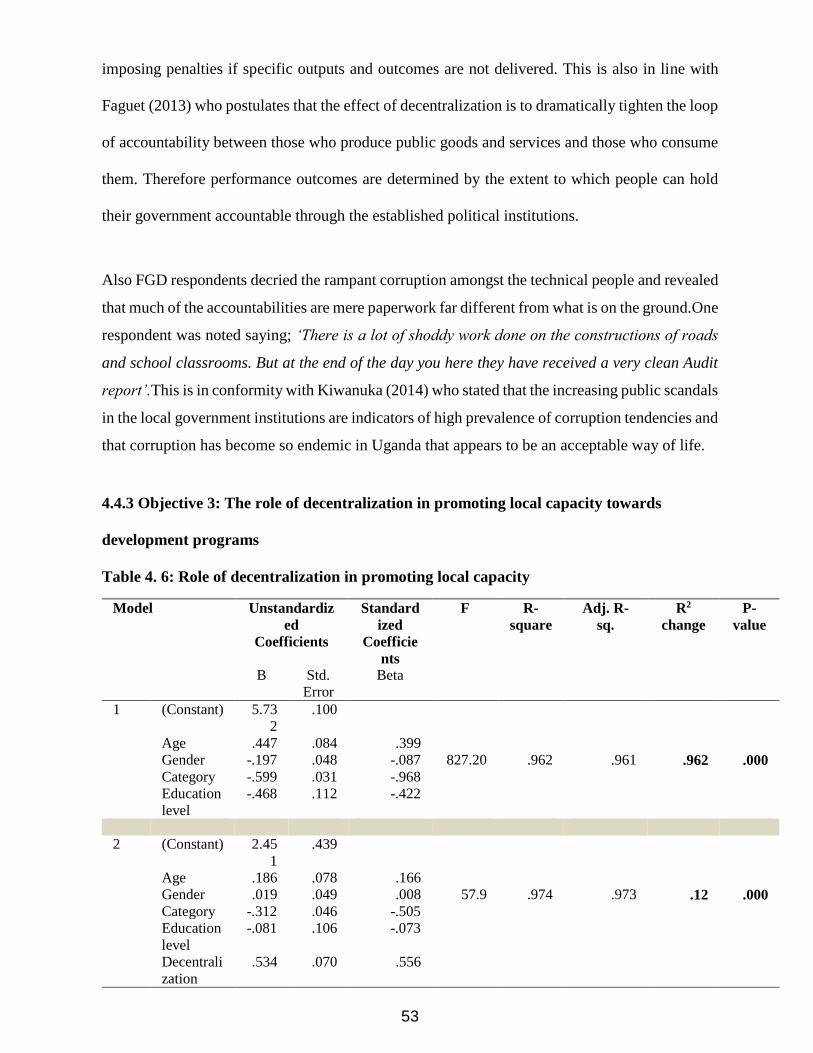
53
imposing penalties if specific outputs and outcomes are not delivered. This is also in line with
Faguet (2013) who postulates that the effect of decentralization is to dramatically tighten the loop
of accountability between those who produce public goods and services and those who consume
them. Therefore performance outcomes are determined by the extent to which people can hold
their government accountable through the established political institutions.
Also FGD respondents decried the rampant corruption amongst the technical people and revealed
that much of the accountabilities are mere paperwork far different from what is on the ground.One
respondent was noted saying; ‘There is a lot of shoddy work done on the constructions of roads
and school classrooms. But at the end of the day you here they have received a very clean Audit
report’.This is in conformity with Kiwanuka (2014) who stated that the increasing public scandals
in the local government institutions are indicators of high prevalence of corruption tendencies and
that corruption has become so endemic in Uganda that appears to be an acceptable way of life.
4.4.3 Objective 3: The role of decentralization in promoting local capacity towards
development programs
Table 4. 6: Role of decentralization in promoting local capacity
Model Unstandardiz
ed
Coefficients
Standard
ized
Coefficie
nts
F R-
square
Adj. R-
sq.
R2
change
P-
value
B Std.
Error
Beta
1 (Constant) 5.73
2
.100
Age .447 .084 .399
Gender -.197 .048 -.087 827.20 .962 .961 .962 .000
Category -.599 .031 -.968
Education
level
-.468 .112 -.422
2 (Constant) 2.45
1
.439
Age .186 .078 .166
Gender .019 .049 .008 57.9 .974 .973 .12 .000
Category -.312 .046 -.505
Education
level
-.081 .106 -.073
Decentrali
zation
.534 .070 .556
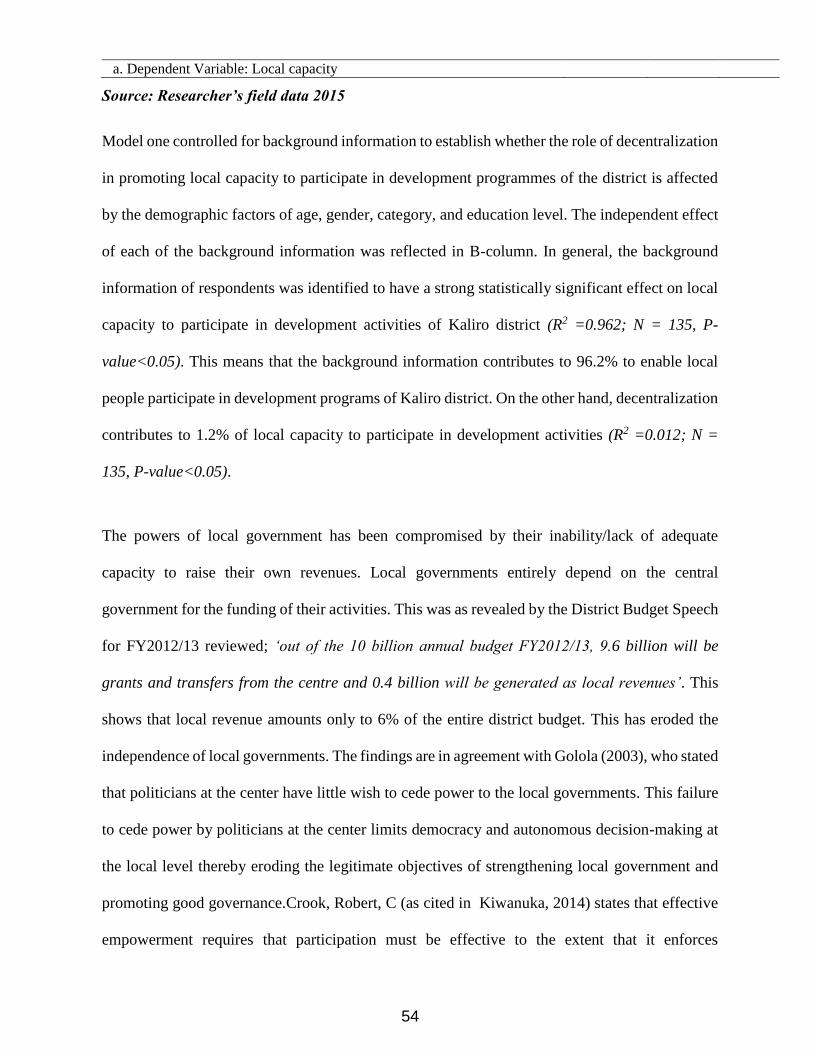
54
a. Dependent Variable: Local capacity
Source: Researcher’s field data 2015
Model one controlled for background information to establish whether the role of decentralization
in promoting local capacity to participate in development programmes of the district is affected
by the demographic factors of age, gender, category, and education level. The independent effect
of each of the background information was reflected in B-column. In general, the background
information of respondents was identified to have a strong statistically significant effect on local
capacity to participate in development activities of Kaliro district (R2 =0.962; N = 135, P-
value<0.05). This means that the background information contributes to 96.2% to enable local
people participate in development programs of Kaliro district. On the other hand, decentralization
contributes to 1.2% of local capacity to participate in development activities (R2 =0.012; N =
135, P-value<0.05).
The powers of local government has been compromised by their inability/lack of adequate
capacity to raise their own revenues. Local governments entirely depend on the central
government for the funding of their activities. This was as revealed by the District Budget Speech
for FY2012/13 reviewed; ‘out of the 10 billion annual budget FY2012/13, 9.6 billion will be
grants and transfers from the centre and 0.4 billion will be generated as local revenues’. This
shows that local revenue amounts only to 6% of the entire district budget. This has eroded the
independence of local governments. The findings are in agreement with Golola (2003), who stated
that politicians at the center have little wish to cede power to the local governments. This failure
to cede power by politicians at the center limits democracy and autonomous decision-making at
the local level thereby eroding the legitimate objectives of strengthening local government and
promoting good governance.Crook, Robert, C (as cited in Kiwanuka, 2014) states that effective
empowerment requires that participation must be effective to the extent that it enforces
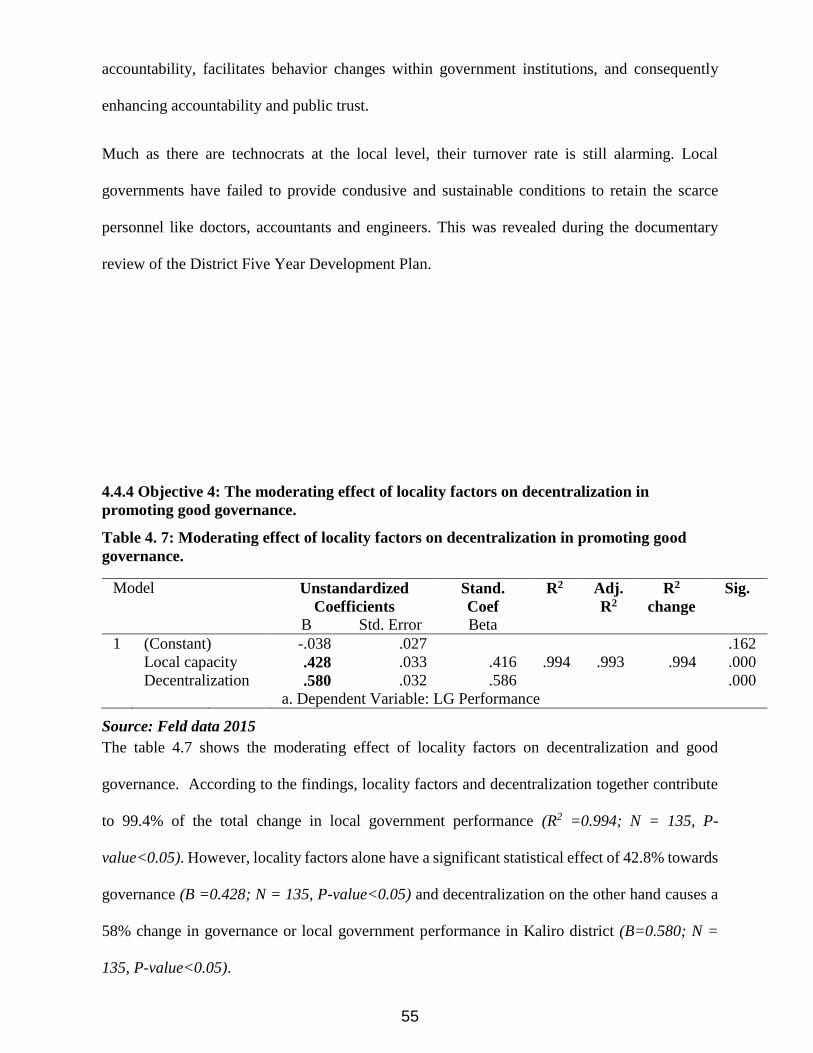
55
accountability, facilitates behavior changes within government institutions, and consequently
enhancing accountability and public trust.
Much as there are technocrats at the local level, their turnover rate is still alarming. Local
governments have failed to provide condusive and sustainable conditions to retain the scarce
personnel like doctors, accountants and engineers. This was revealed during the documentary
review of the District Five Year Development Plan.
4.4.4 Objective 4: The moderating effect of locality factors on decentralization in
promoting good governance.
Table 4. 7: Moderating effect of locality factors on decentralization in promoting good
governance.
Model Unstandardized
Coefficients
Stand.
Coef
R2 Adj.
R2
R2
change
Sig.
B Std. Error Beta
1 (Constant) -.038 .027 .162
Local capacity .428 .033 .416 .994 .993 .994 .000
Decentralization .580 .032 .586 .000
a. Dependent Variable: LG Performance
Source: Feld data 2015
The table 4.7 shows the moderating effect of locality factors on decentralization and good
governance. According to the findings, locality factors and decentralization together contribute
to 99.4% of the total change in local government performance (R2 =0.994; N = 135, P-
value<0.05). However, locality factors alone have a significant statistical effect of 42.8% towards
governance (B =0.428; N = 135, P-value<0.05) and decentralization on the other hand causes a
58% change in governance or local government performance in Kaliro district (B=0.580; N =
135, P-value<0.05).
56
High levels of poverty have had a negative effect on decentralization. The poor tend to regard
themselves as societal misfit. Hence refraining themselves from participating in much of the
government programmes out of apathy.
As revealed by the District Development plans the illiteracy levels in the district is still high. This
is another negative impact on decentralization. The locals feel inferior to take part in decision
making for issues that concern them. Thus leaving a room which is easily exploited by the
technocrats to deny them the would-be services. This agrees with Musoke (2015) who revealed
that allowing whoever wishes to contest for elective position - regardless of their academic
qualification, affects the quality of debate in local councils thus impacting negatively on
performance. And that a good number of councilors do not have even the minimum competence
to interpret the basic governance policies and laws hence leading to malfunctioning of local
governments.
The negative discriminative culture has proved a serious factor to affect decentralization. Women
are usually treated as secondary citizens. Their voices are not adequately listened to, always few
in meetings as they are usually engaged in household chores and attending to their gardens. Good
governance demands the consent and full participation and lasting involvement of all the citizens
in the future of their nation. The will of the people must be the basis of government authority.
That is the foundation of good governance … good governance will give every citizen, young,
and old, man or woman, a real lasting stake in the future of his or her society, (Annan, 1997).
The role of NGOs in checking the excesses of the local government technocrats cannot be
underestimated. However, in the FDGs conducted it was revealed that the existing NGOs are
quite ineffective and very thin on ground. A youthful respondent said; ‘Most of the existing
NGOs/CBOs are mere brief-case entities created for survival strategies other than to act as
mouthpiece for the vulnerable and local poor – many don’t have even an office’. Schneider
57
(1999), avers that decentralization and good governance thrives on institutional arrangements and
implementation, so it is essential to avoid inefficiencies in the institutional arrangements. If the
civil society is not effectively involved in local governance and even the participating civil society
(especially local NGOs) lack the dynamism to be able to effectively engage with local
governments on the nature of services provided it loses its purpose and good governance suffers.
CHAPTER FIVE
SUMMARY, DISCUSSION OF KEY FINDINGS, CONCLUSIONS AND
RECOMMENDATIONS
5.1 Introduction.
This study carried out an assessment on the role of decentralization in promoting local governance
in Uganda with reference to Kaliro District.This chapter therefore presents and summarizes the
key research findings identified in chapter four and gives conclusions and recommendations
based on the study objectives formulated at the beginning of the study. The contributions of the
study to the field of public administration are also discussed. The attendant theoretical, managerial
and policy as well as future research implications of the study are also discussed.
5.2 Summary of findings
The summary of the findings is presented below based on the objectives of the study.
5.2.1 Decentralization and promotion of community participation in decision-making.
The findings of the study revealed a strong significant positive relationship between
decentralization and community participation in developmental activities. As a legal requirement,
58
communities participate in the budgeting and planning process; democratically elect their leaders
and monitor government projects in their localities. All these are a result of decentralization. This
is in line with Kauzya (2002) who argues that decentralization promotes people’s participation in
decision making processes and developmental activities. Also Mulema and Wetterberg as cited
by Adoko (2014; Pg.3) postulate that political decentralization allows for increased efficiency in
the delivery of local services; increased citizens’ participation in their own governance and leads
to greater ownership of interventions and responsiveness to local needs.
This research objective was therefore satisfactorily achieved. However, further discussions are to
be conducted on the findings of this objective in the next sub-section to assess whether community
participation guarantee effective empowerment and transparency.
5.2.2 Decentralization and accountable leadership
The findings related to transparency and accountability revealed a positive relationship between
decentralization and accountable leadership. This therefore implies that when local governments
publish and display financial information and hold accountability forums (Barazas) where local
citizens face off with local officials to get feedbacks, explanations and justification for certain
actions they are being transparent and accountable to the people. The study findings are in line
with Steiner (2007) who stipulated that local governments being compelled by law to periodically
publish and publically display financial information for the consumption of the general local
community is in itself accountability. However, further discussions were conducted in this line to
assess the effectiveness and content of this accountability.
5.2.3 Decentralization and promotion of local capacity.
Findings revealed a strong statistically significant effect of decentralization on local capacity
towards participation in developmental activities. Decentralization enhances local capacity. Local
governments /communities mobilize, allocate and utilize their revenues according to their
59
priorities. This is in conformity with Brendsen .B. as cited by Adoko (2014) who attests that
political decentralization serves as a tool and a means of obtaining access of allocation of
resources. Also believes that allocation of resources made by local governments is more
consistent with community preferences than allocation from the centre. The findings of the study
and the reviewed literature relate to the study hypothesis which stresses that decentralization
promotes local capacity towards participation in development programmes. Therefore, the
objective of the study was satisfactorily attained.
5.2.4 Locality factors and promotion of decentralization and good governance.
Findings revealed a positive significant moderating effect of locality factors on decentralization
towards the promotion of good governance. Community attitude towards government
programmes; literacy levels of the people in the community; community awareness on their role
in developmental programmes and civil society activeness were found to be having a significant
effect on the grounding of good governance. Matovu (2007) sums it up that with increased
awareness of human rights, citizens increasingly demand a governance scheme that promotes
development, access to justice, access to markets, quality livelihood and equity, more direct
participation in the decision-making process of public policies, as well as their implementation,
monitoring and evaluation. Negative attitude among the locals towards their participation in
developmental activities and low literacy levels among the locals hinders quick and easy analysis
of issues, negatively affects decision making and fails to recognize the role of women in
development. Therefore, the objective of the study was satisfactorily attained as it confirmed the
effect of locality factors.
5.3Discussion of Key findings
This section presents a discussion that integrates the objectives of the study from chapter four
with the relationship portrayed by conceptual frame work in chapter one and reviewed literature
60
in chapter two. This section enabled the researcher to reach concrete conclusions which later led
to the recommendations.
5.3.1 Decentralization and promotion of community participation in decision-making
The findings related to this objective revealed that decentralization has led: to increased
community participation in decision making;increased community participation in planning &
budgeting and increased Political accountability in local governments. This is inline with the
World Bank (2002) which states that community participation is a process by which stakeholders
influence and share control over priority setting, policy making, resources allocation and or
programme implementation. This is also consistent with Nsibambi (2000) who observes that
decentralization places the decision making centres close to the beneficiaries, it therefore, creates
opportunities for those beneficiaries to gain access to the decision making elites and thus increase
the chances for effective accountability and transparency in the conduct of public affairs. But
Jitting etal (2004) contend that the quality and depth of community participation right from needs
identification, decision making, and implementation through monitoring to evaluation is
important in assuring quality outputs of the programmes undertaken by the institution. In support
of this is Gomes (2009) and Devas (2002) who argued that it is one thing to invite citizens to
participate and identify their priorities but it is another matter to account for to them the decisions
made and the way resources have actually been used. This meant to cause effective governance,
decentralization should go beyond mere citizen participation and instead yearn for effective and
meaningful participation indecision making, planning and budgeting to enhance quality service
delivery and improved standard of living for the community.
5.3.2 Decentralization and accountable leadership
Under this objective, the findings revealed that decentralization has led to increased political
accountability; increased administrative accountability and increased transparency in local
61
governments. This is in agreement with Professor Suleiman Ngware (as cited in Matovu, 2007)
who elaborates that whatever form of the definition it takes, good governance is about creating
space for sharing of: ideas and information, power, authority and responsibility. In the process it
creates a culture of: ownership, accountability, transparency, rule of law and respect for human
rights, openness, ethics and integrity, and honesty. To the contrary, Nsibambi (2000) differs as he
stresses that decentralization has not enhanced participation in local affairs by the majority of the
citizens. Yet this is the only way to check graft. On the ground, particularly in rural areas where
the majority of the population lives, civil societies hardly exist. A few local organizations that
have emerged spontaneously are driven by survival strategies rather than the desire to influence
public policy and they are un coordinated making them too weak to check the excesses of the
powerful politicians and technocrats to cause meaningful accountabilities. Therefore, meaningful
accountabilities to the community -other than being a formality, are still lacking.
5.3.3 Decentralization and promotion of local capacity.
The results related to this objective indicated that decentralization is playing a role in promoting
local capacity in Kaliro district. The majority of the respondents agreed that the community get
involved or participate in monitoring of council programmes. Community participates in decision
making of councils. However the results also revealed that the majority of the community
members were not aware of their need to be involved in council programmes and many don’t
understand their roles as far as involvement in Council programmes are concerned. This is
consistent with Girgis (2007)who notes that even where the ordinary citizens were supplied with
all the available information on local development issues, it is doubtful if many of them would
accurately interpret it due to the low literacy levels and lack of effective civic education. Lack of
civic education and sensitization on their local economies has prevented ordinary citizens from
coming to grips with local development issues to demand accountability from local governments.
The lack of local capacity has been cited as both a cause and a consequence of poor governance
62
and failed attempts at governance support in some developing countries. This means that the
government still faces a big challenge of building the capacity of the local people for effective
implementation of its policies in order to register quality service delivery and improved standard
of living.The resource base of local governments is still very limited, making them reliant on
central government transfers for operations. Kiwanuka (2014) sums it well when he avers that
without feasible financial autonomy, local governments cannot adequately respond to local needs
and aspirations. This is because, without a reasonable level of financial independence delegated
from the central government to local governments, autonomous local activities, which are based
on aspirations of local population, can rarely be carried out or implemented. Without financial
empowerment, good governance in a decentralized setting will remain a myth. According to
Kayizzi-Mugerwa (1999), the success of decentralization depends on the capacity of districts and
urban governments to raise their own revenue and use it efficiently in the provision of services.
5.3.4 Effects of the Locality factors on decentralization in promoting local governance.
As regards this objective, thefindings revealed that decentralization leads to community
participation in consultative meetings, increased community participation in planning and
budgeting. But the locality factors like; community attitude, social status and community
mobilization and awareness have a greatly affected decentralization in promoting good
governance. Nsibambi (2000) observes that when the paradigms of good governance,
decentralization, democratization and civil society are closely analyzed, it becomes evident that
they all seek to empower people to exercise as much influence as possible on their social and
political destiny. In other words, economic, political, legal, technical, and even technological
empowerment is the meeting point of good governance, decentralization, democratization and
civil society.It can therefore be recognized that the perspective of community participation in
decision making, planning and implementation of the government programs has an influence on

63
the promotion of good local governance. This relates to Nsibambi (2000) who continued to
observe that if decentralization does not lead to empowerment of the people, then it can not
constitute an element of good governance nor can it contribute to democratization or the
strengthening of civil society.
5.4 Conclusions
Decentralization policy is very important in promoting good local governance. The study led to
statistically significant relationships on the study variables and conclusions have been made as
follows:-
5.4.1 Decentralization and promotion of community participation in developmental
activities.
In view of the findings presented, analyzed and discussed under this objective it can be stressed
that decentralization has a role to play in promoting good governance if meaningful community
participation in decision-making is enhanced. This implies that more effective community
participation will deliver good local governance.
5.4.2 Decentralization and Accountable leadership.
The discussion regarding this objective pointed out that decentralization plays a role in promoting
accountable leadership in local governments. This has been revealed by the fact that increased
political, administrative and fiscal accountability enhances good governance in local
governments. Therefore this means that the devolution of power (political, administrative and
fiscal decentralization) must be meaningful and purposeful.
5.4.3 Decentralization and the promotion of local capacity
64
The discussion of the findings has summarized that decentralization to a great extent has promoted
local capacity to participate in development programmes in Kaliro district. It was evident that the
community get involved or participate in monitoring of council programmes and in decision
making of councils; some taxes are being collected and more qualified technical staffs can be
recruited from the locality. However, more empowerment is needed mainly in the area of local
revenue mobilization.
5.4.4The effect of the locality factors on decentralization in promoting good governance.
The discussion regarding this objective pointed out that there is a negative effect of the locality
factors on decentralization to play its role to promote good governance in Kaliro District.
The low literacy levels affects the local people’s confidence not to effectively participate in
decision making on issues that affect them, hinders the capacity of the local people to demand for
their rights and what is due to them. Similarly, the negative attitude of the local people not to
embrace change hinders their perception to participate in development activities. The rampant
vise of corruption and the presence of an ineffective Civil Society - to fight the vise hinders,
decentralization to realize its objective as the allocated resources don’t reach the intended
beneficiaries. Crowning it all, Nuwagaba (2006) emphasized the importance of good governance
that whereas Uganda has good economic policies, the country still faces challenges in their
implementation in order to ensure positive change on the ground. He recommended that Uganda
needs to tackle issues of governance, especially those relating to corruption, ensuring
accountability, developing and strengthening institutions of democracy and respect for human
rights if it is to realize full development.
65
5.5 Recommendations
The study suggests the following recommendations to be undertaken in a bid to improve the
effectiveness of decentralization in promoting good governance. And it is handled objective by
objective.
5.5.1 Decentralization and promotion of community participation in developmental
activities.
Basing on the above given conclusions out of the study findings on this objective, the following
recommendations are proposed.
Local governments should take the initiative and involve the marginalized and vulnerable groups
and address the practical barriers to enjoying the public good. This will bridge the perception gap
between the services provided and the local needs of citizens. This can, however, only be achieved
with substantial involvement and participation of such groups within a framework of equal
opportunities.
Central government should make/revise policies that will ensure an effective inclusion and
involvement of all citizens in the enjoyment of their economic and social rights.
The Central Government should increase on the funding to local governments to enable them
fund the decision-making processes and all decisions made during participatory planning.
5.5.2 Decentralization and Accountable leadership.
Basing on the above given conclusions out of the study findings on this objective, the following
recommendations are proposed.

66
The decentralization policy should be revised to strengthen a clearly defined self-enforcing,
central-local government relationship, designed on a principal of mutual mandates. Good
governance will be realized in situations where there is a strong central government (in terms of
legitimacy and capacity) and an empowered population at local community level to make their
leaders accountable to their actions or inactions.
The Central government must continue to play a key role in ensuring that resources are properly
used. All public money, whatever the level of collection, should be a supervisory concern of
central government. After all, the level of collection is only an administrative convenience.
Should also institute proper mechanisms to simplify published financial information and breaking
it into clear and user-friendly public information. This will considerably increase transparency
and accountability, as well as the engagement of local authorities with citizens and civil society.
Proper information flow will promote the emergence of a strong civil society capable of engaging
effectively with local governments, and not just on behalf of elite interests, but also on behalf of
the poor.
In addition, local governments should use the available resources optimally following priorities
selected basing on the agreed level of importance by the beneficiaries.
Local governments should put in place effective mechanisms for communicating the decisions
made to those to be affected by them. Given that resources cannot allow implementation of all
decisions, communities that may not receive services in a particular period should also be
communicated to - to know why and what solutions lie for them.
67
5.5.3 Decentralization and promotion of local capacity.
Basing on the above given conclusions out of the study findings on this objective, the following
recommendations are proposed.
To improve on infrastructure development, the central government needs to procure dependable
road equipment for the district road units so as to easily repair and maintain their roads in time.
As long as some categories of people in the community like the women are not adequately
empowered, participation in needs identification, planning and decision-making will remain
minimal hence affecting service delivery. Therefore, all local government programs should be
targeted towards building capacity of all people socially, economically, culturally and politically
to enhance good governance.
Improving the living conditions in rural areas by planning for rural electrification, efficient road
network, improving vital staff remuneration and creating a condusive working climate for the
technocrats will reverse the great out-turn of the vital technical staff. And Local governments
must seek alternative motivational schemes to retain such personnel.
The tax collection trend needs to be reversed where hard to collect taxes should be the
responsibility of the centre as local governments lack the capacity to cause tax payment
compliance.
Reckless political sentiments which negatively affect local revenue mobilization and tax
collection should be avoided instead sensitize the community on why they ought to pay taxes.
Corruption tendencies which deny the community of the vital services should be squarely fought
at all levels of government.

68
Central government should revise the fiscal decentralization policy, by giving local governments
a more meaningful share of taxes to ensure financial autonomy. Local government structures
should be strengthened to possess genuine political and administrative independence.
5.5.4 The effect of the locality factors on decentralization in promoting good governance.
Basing on the above given conclusions out of the study findings on this objective, the following
recommendations are proposed.
There is need to improve on the literacy levels through Functional Adult Literacy and embracing
meaningful Universal Primary Education and Universal Secondary Education to produce holistic
educated citizens. This will help to: change the citizens’ perception and attitude towards
development; to change their negative and discriminative culture against the women and the
PWDs.
Also intensive checks need to be made on the rampant vise of corruption by building a strong
Civil Society to counter the strong technocrats on behalf of the community.
Central and local governments should strive to facilitate establishment of credible social
movements to enable organized participation. These could be advocacy NGOs/CBOs, local
government associations, religious groups, women groups, professional associations, youth
groups, disabled groups etc. Citizens who will belong to such organizations will have a far greater
propensity to participate than participation as individual ordinary citizens as the case today.
5.6 Areas for further research
Basing on the findings of the study, the researcher recommends the following areas for future
research.
69
The study considered the role of decentralization in promoting good local governance in Uganda
but did not ascertain whether gender has a link with participation in planning. Future research in
this area should ascertain the link to help government and local governments revisit the gender-
related policies to improve on participation.
Whether community procurement improves on the quality of service delivery would be another
area for research since findings indicated that communities participate in planning but they stop
at that. They disputed the costs of the services which they described as benefiting the providers
not the community.
The study dwelt much onassessing the role of the decentralization in promoting good local
governance in Uganda with reference to Kaliro District but ignored the role that multi-partism
might have on the quality of service delivery on the community. This is another area that needs
further research.
70
REFERENCES
Abigaba (1998) Financial Decentralization and social services delivery in Uganda 1993- 1998.
Unpublished MA (PAM) Dissertation Makerere University.
Adoko .O.A. (2014). Political Decentralization and Service Delivery: Evidence from Agago
District, Uganda. The Uganda Journal of Management and Public Policy Studies. Vol.8
no.1 (2014): 1-14.
Amin, E. M. (2005). Social Science Techniques Research; conception, Methodology
andAnalysis. Kampala, Makerere University Printer.
Annan, Kofi (1997). Inaugural address, International Conference on Governance for sustainable
Growth and Equity, United Nations, New York, 28 – 30 July 1997.
Asiimwe, D. and Nakanyike, M. B. (2007) Decentralization and the Transformation of
Governance in Uganda, Kampala, Fountain Publishers.
Babbie, Earl R. (1998). The Practice of social research. Wadsworth Pub. Co. (Belmont, CA)
Blair H. (2000), Participation and Accountability at the Periphery: Democratic Local
Governance in six countries world development, Vol.28 No.1
71
Braun, Von Joachim and Grote, Ulrike (2000). 'Does Decentralization Serve the Poor?' Paper
read at IMF Conference on Fiscal Decentralization, Washington. DC. 58
Deepa,Narayan (2002). Empowerment and Poverty Reduction: A Sourcebook. Washington, DC:
World Bank.
Denscombe, M. (1998) The Good Research Guide. Buckingham. Open University Press.
Denscombe, M. (2000). The Good Research Guide: For small scale Research Projects.
Philadelphia, Open University Press.
Devas, N. (2002). The Challenge of Decentralization: Global Forum on Fighting Corruption.
Brasilia.
Faguet, J.P. (2013). Can sub –national autonomy strengthen democracy in Bolivia? London:
Oxford University Press
Francis, Paul and James, Robert, (2003). ‘Balancing Rural Poverty Reduction and Citizen
Participation: The Contradictions of Uganda’s Decentralization Program’. World
Development 31(2), 325-337.
Fumihiko, S. (2000). Decentralization for Participatory Development in Uganda: Limitations
and Prospects, Journal of Intercultural Studies, Japan, Ryukoku University.
Gerring, J., Strom C., Thacker.S.C &Carola .M. (2004). Normative Models of Democratic
Governance: Decentralism, Centralism, and Centripetalism,Boston University
Department of Political Science, 232 Bay State Road, Boston MA 02215
Gerring, J., Strom C., Thacker.S.C &Carola .M. (2005). Centripetal Democratic Governance: A
Theory and Global Inquiry, American Political Science Review Vol. 99, No. 4 November
2005, Boston University.
Louis W. Pauly (1999). Good Governance and Bad Policy: The Perils of International
Organization Overextension. University of Toronto.
72
Golola, L. M., 2003, 'Decentralization, Local Bureaucracies and Service Delivery in Uganda', in
Reforming Africa's Institutions, ed. Kayizzi-Mugerwa, S., New York:United Nations
University Press.
Golooba-Mutebi, F. (1999), Decentralization, Democracy and Development Administration in
Uganda, 1986-1996. Doctoral Dissertation submitted to the London School of Economics
and Political Science.
Gomes, Sandra (2009). The Multi-faceted debate on Decentralization and Collective welfare.
Federal University of Rio Grande do Norte (UFRN), Brazil.
GOU (2001)National Urban Observatory Report 2001
Hope K.R. (2006), Poverty, Livelihood, and Governance in Africa: Fulfilling the Development
Promise, Palgrave Macmillan, USAID, 111 UN Drive, Mamba Point, Monrovia,
Liberia.
Hussey J.& Hussey R. (1997) Business Research: A practical guide for undergraduate students.
Palgrave Publishers, Houndmill.
Jitting J. Kauffaman& I. Macdonell (2004) “Decentralization Implementation in
Uganda:Achievements, Challenges & Way forward” Joint Annual Review of
Decentralization, Kampala.
Kaliro District Development Plan (2012), The District Three Year development plan
FY2010/2015, Planning Unit, Kaliro, Uganda
Kaliro District Draft Final Accounts (2012), District Final Accounts FY2011/2012, Finance
Department, Kaliro, Uganda
Kaliro District News Letter (2014), Designed and Printed by WAF Communications Ltd.
Kampala.
73
Kauzya J. M. (2002), Local governance capacity building for full range participation, concepts,
frame works and experiences in African Countries (in the Fourth Global Forum
reinventing Government, Morocco – 11th – 13th Dec. 2002)
Kayizzi-Mugerwa, S. (1999).Uganda at the End of the 1990s: A Medium-term Assessment,
Stockholm: Swedish International Development Agency (SIDA).
Kiwanuka, M. (2012). Decentralization and good governance in Africa: Institutional Challenges
to Uganda’s local governments. Journal of African and Asian Local Government
Studies, 1(3). 45-59.
Kiwanuka, M. (2014). Democratic Deficits and Public Confidence in Public Institutions in
Uganda: Implications of Accountability on Public Confidence in the Uganda Local
Government Institutions. The Uganda Journal of Management and Public Policy Studies.
Vol.8 no.1 (2014): 15-27.
Kiyaga (2007), Decentralization, Local Governance and Poverty Reductions: A theoretical
exploration - UMI
Kiyaga, N, J. &Olum,Y. (2009); Local Governance and Local Democracy in Uganda, Kampala.
Kothari,C. R. (2004). Research Methodology: Methods and Techniques use. 2nd Ed. New Delhi.
New Age International Limited
Krejcie,V.R, & Morgan, D.W. (1970). Determining sample size for research activities,
educational and Psychological measurement. Sage Publications.
Kumar, R. (2011).Research methodology: a step‐by‐step guide for beginners(3rd edition).
London:Sage Publications.
Lawshe, C. H. (1975). A quantitative approach to contentvalidity. Personnel psychology, 28, 563–
575.
74
Local Government Finance Commission (2009): “The Historical Perspective of financing Urban
Local Government Infrastructure and Service delivery” (unpublished paper).
Massoud, Omar, (2009). Urban governance and service delivery in Nigeria. Routledge Publishers.
Matovu, George (2007), The Challenges and Constraints of Introducing Participatory Budgeting
as a Tool for Resource Mobilization and Allocation and Realizing Good Governance in
Africa. Paper presented for the 7th Edition of the Africa Local Government Action Forum
(ALGAF) on February 2nd 2007.
McNamara, C. (2009). General guidelines for conducting interviews. Retrieved January 11, 2010,
from http://managementhelp.org/evaluatn/intrview.htm
MoFPED (2004), Uganda Poverty Status Report, Kampala.
Mugenda,O&Mugenda A. (1999). Research Methods: Quantitative and Qualitative Approaches.
Nairobi, African Centre for Technology Studies [ACTS]
Munyonyo .R. (1999). Decentralization in Uganda: Theory and Practice: Electronic Publications
Number 5 retrieved July 20, 2009 from Uganda Martyrs University, Nkozi, net-Library
Web site: http://www.fiuc.org/iaup/sap/
Musoke .E.(2015, June 19) District Boss wants minimum qualification for LCs. Daily
Monitor,Pg.13 column 1-4.
Novacx, G. 1970. Democracy and Revolution, Pathfinder Press, New York, in M.M. Yusif, 2008.
‘Local Governance and Democracy: The Basic Principles’, viewed 7 January 2009,
<http://mmyusuf.blogspot.com/2009/01/local-governance-and-democracy-
basic.html>
Novacx, G. (1970). Democracy and Revolution, Pathfinder Press, New York, in M.M. Yusif, 2008.
‘Local Governance and Democracy: The Basic Principles’, viewed 7 January 2009,
Nsibambi, A. R (2000), Decentralization and Civil Society in Uganda: The Quest for good
governance, Fountain Publishers Ltd, Kampala.
Nunnally, J. C. (1970). Introduction to psychological measurement. New York: McGraw-Hill.
75
Nuwagaba, Augustus (2006). ‘Dualism in Kampala: Squalid Slums in a Royal Realm’. in D.F.
Bryceson and D. Potts (eds). African Urban Economies. Basingstoke UK: Palgrave
Macmillan, 151-65.
OECD (1986), Performance Management in Government: Performance Measurement and
Results Oriented Management”, Public Management Occasional paper No. 6
Olowu, D. (2003). Local Institutions and Political structures and Processes; Recent Experience
in Africa, San Franscisco, TCs.
Olowu, D.& James .S. W. (2004), Local Governance in Africa: The Challenges of Democratic
Decentralization, Lynne Rienner Publishers, Inc, 3 Henrietta Street, Convent Garden,
London WC2E 8LU.
Opolot, S. J. (2014). State and Society Relations in Uganda’s Politico – Economic Transitions:
Structures, Processes and Outcomes of Governance since 1986. The Uganda Journal of
Management and Public Policy Studies. Vol.8 no.1 (2014): 87 – 113
Prinsen, G. and Titeca, K. (2008). Uganda's decentralized primary education: musical chairs and
inverted elite capture in School Management Committees,Public Administration and
Development, 28(2):149-164
Reinikka, D. J. and Svensson, J. (2004.) Survey Tools for Assessing Service Delivery. World
Bank: Washington DC.
Ronald W. Johnson & Henry P. Minis (2000). Toward Democratic Decentralization: Approaches
to Promoting Good Governance” Washington DC
Sarantakos, S. (2005). Social research (3rded) Palgrave Macmillan, China
Schacter, Mark. (2000). Monitoring and Evaluation Capacity Development in Sub-Saharan Africa
Lessons from Experience in Supporting Sound Governance. ECD Working Paper Series
No. 7
76
Sekaran, U. (2003). Research Methods for Business. A skill Building Approach. Singapore, John
Wiley and sons Inc. Southern Illinois University.
Sharma, (2006).Democracy at the Local Level: The International IDEAHandbook on
Participation, Representation, Conflict Management, and Governance,Stockholm:
International IDEA.
Smith, B. C. (2007). Decentralization: The territorial dimension of the state, George Allen and
Unwin (Publishers) Ltd, 40 Museum Street, London WCIA ILU, UK.
Soren, V. &Lubanga .F. (1996). Democratic Decentralization in Uganda: A New Approach to
Local Governance. Fountain Publishers, Kampala, Uganda
Steiner, S (2007), Decentralization in Uganda: Exploring the Constraints for poverty reduction,
GIGA Working Paper No. 31: Hamburg Germany: General Institute for Global and Area
studies.
The 1st Annual State of Governance Conference in Uganda; Friday, Nov. 24, 2006; Hotel
Africana, Kampala.
The International Workshop Report (2002). Empowering local communities: Decentralization,
Empowerment and Community Driven development. World Bank Policy Research
Working paper 3510. Washington D.C
Uganda Government (1995). Constitution of the Republic of Uganda, Entebbe, Government
Printers.
Uganda Government (1997). The Local Government Act: CAP, 243. Entebbe, Government
Printers.
United Nations Development Programme(1993).Governance for Sustainable Human
Development: A UNDP Policy Document, New York: UNDP.
USAID Report (2012). Kaliro District Local Government, District Management Improvement
Plan [DMIP 2012 – 2015]).
77
Wanyama, R., (2002) Donor News 2(2): 1–17 (July–September).
Webster, N. (2000). ‘Democracy, Development and the Institutionalized Participation of the Poor
for Poverty Reduction’, in P. Collins (ed.), Applying Public Administration in
Development: Guide Posts to the Future, John Wiley and Sons Ltd, Chichester, UK.
Woods, D. (1992). Civil Society in Europe and Africa: Limiting State Power through a Public
Sphere, Journal of African Studies Review, Vol. 35, No. 2.
World Bank, (2002). State Society Synergy for Accountability. Washington, World Bank.

i
APPENDIX 1: STUDY QUESTIONNAIRE
Questionnaire for: DTPC, LC V& III Councilors, STPC and LC I CHAIRPERSONS
Introduction
I am Kasadha John Stephen, a student of Masters Degree in Management Studies at Uganda
Management Institute Kampala carrying out a study on the Role of Decentralization in
promoting Local Governance in Uganda.Its main concern is to assess the role of decentralization
on promoting good local governance in Kaliro district. It is believed that the findings of this
study and recommendations thereof will be helpful to redirect the decentralization policy to
achieve its intended goals.
Your input therefore, will be useful and important for the successful completion of this study.
Information given will be treated with utmost confidentiality and used solely for academic
purposes.
I will be very grateful if you would kindly answer the questions as honestly as possible. There is
no need for you to disclose your name unless you wish to do so.
I thank you in advance for your positive cooperation.
Yours truly,
KASADHA JOHN STEPHEN
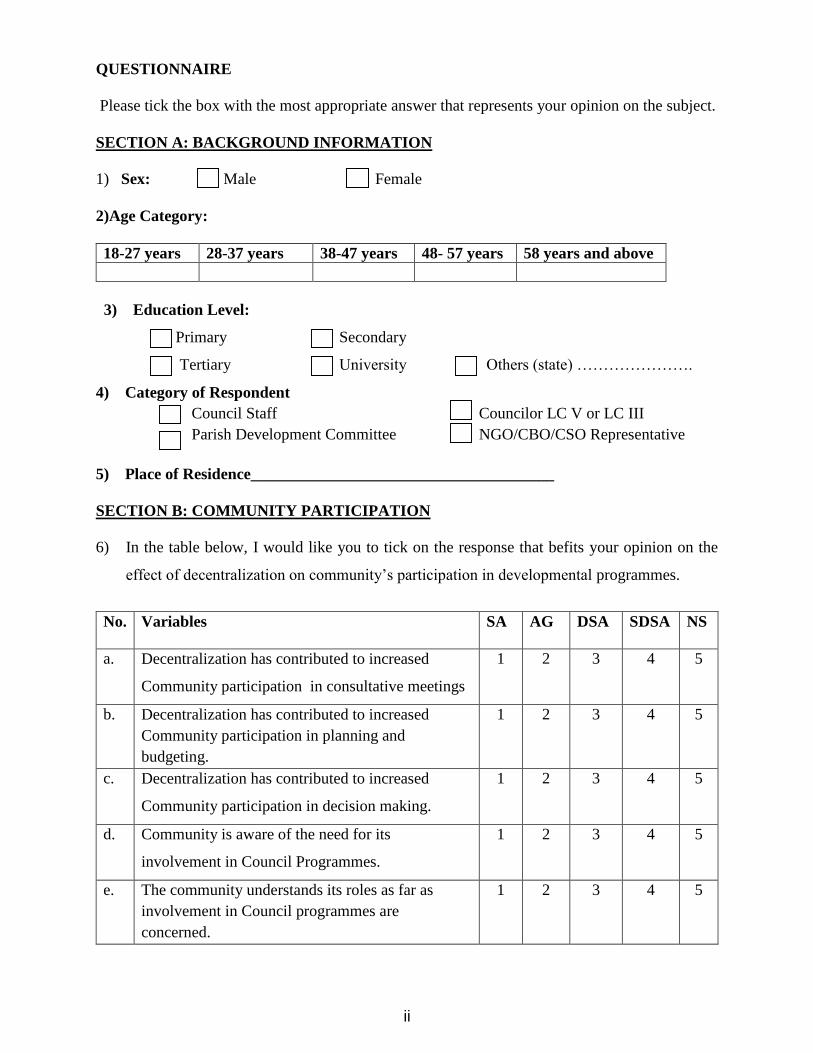
ii
QUESTIONNAIRE
Please tick the box with the most appropriate answer that represents your opinion on the subject.
SECTION A: BACKGROUND INFORMATION
1) Sex: Male Female
2)Age Category:
18-27 years 28-37 years 38-47 years 48- 57 years 58 years and above
3) Education Level:
Primary Secondary
Tertiary University Others (state) ………………….
4) Category of Respondent
Council Staff Councilor LC V or LC III
Parish Development Committee NGO/CBO/CSO Representative
5) Place of Residence______________________________________
SECTION B: COMMUNITY PARTICIPATION
6) In the table below, I would like you to tick on the response that befits your opinion on the
effect of decentralization on community’s participation in developmental programmes.
No. Variables SA AG DSA SDSA NS
a. Decentralization has contributed to increased
Community participation in consultative meetings
1 2 3 4 5
b. Decentralization has contributed to increased
Community participation in planning and
budgeting.
1 2 3 4 5
c. Decentralization has contributed to increased
Community participation in decision making.
1 2 3 4 5
d. Community is aware of the need for its
involvement in Council Programmes.
1 2 3 4 5
e. The community understands its roles as far as
involvement in Council programmes are
concerned.
1 2 3 4 5
iii
f. The community positively responds to Council’s
invitation to participate in council’s programmes.
1 2 3 4 5
g. The Community often attends / meet at LC I level
to discuss issues that concern them.
1 2 3 4 5
h. Community is involved/participates in
identification of its needs
1 2 3 4 5
i. Community is involved/participates in decision
making of council’s programmes
1 2 3 4 5
j. Community is involved/participates in
implementation of council’s programmes
1 2 3 4 5
k. Community is involved/participates in monitoring
of council’s programmes
1 2 3 4 5
7) Which of the following attracts the community most to participate in Council’s
programmes?
Improved service delivery Personal allowances
Status in community Fight corruption
Others (specify) ___________________________________________
SECTION C: ACCOUNTABLE LEADERSHIP
8) In the table below, I would like you to tick on the response that befits your opinion on the
effects of decentralization on promoting accountability in local governments.
[1=Strongly Agree (SA); 2=Agree (AG); 3=Disagree (DSA); 4=Strongly Disagree (SDSA);
5=Not Sure (NS)]
No. Variables SA AG DSA SDSA NS
a. Decentralization has contributed to increased
political accountability in local governments.
1 2 3 4 5
b. Decentralization has contributed to increased
administrative accountability in local governments.
1 2 3 4 5
c. Decentralization has contributed to increased
financial accountability in local governments.
1 2 3 4 5
d. Decentralization has contributed to increased
transparency in local governments.
1 2 3 4 5
e. Councilors at LC III & LC V always consult the
community on issues that are to be discussed in
Council that concern them.
1 2 3 4 5
iv
f. Councilors at LC III & LCV always brief their
communities on the decisions taken in councils.
1 2 3 4 5
g. Council officials always exhibit transparency in the
operations of council programmes.
1 2 3 4 5
h. Council officials always properly utilize its
revenue only for the implementation of council
programmes.
1 2 3 4 5
i. There are cases of corruption in council 1 2 3 4 5
SECTION D: LOCAL CAPACITY
9) In the table below, I would like you to tick on the response that befits your opinion on the
effects of decentralization in promoting local capacity in local governments.
[1=Strongly Agree (SA); 2=Agree (AG); 3=Disagree (DSA); 4=Strongly Disagree (SDSA);
5=Not Sure (NS)]
No. Variables SA AG DSA SDSA NS
a. Decentralization has contributed to increased
financial self-reliance in local governments.
1 2 3 4 5
b. Decentralization has contributed to increased
revenue mobilization in local governments.
1 2 3 4 5
c. Decentralization has contributed to increased
availability of technical staff in local governments.
1 2 3 4 5
d. The council staffs perform their duties effectively. 1 2 3 4 5
e. There is a cordial relationship between councilors
and the community.
1 2 3 4 5
f. There is a cordial relationship between the elected
and appointed officials of the council
1 2 3 4 5
g. Councilors at LCIII & V effectively represent their
communities
1 2 3 4 5
h. Council adequately deliver on Water 1 2 3 4 5
i. Council adequately deliver on Community
Development
1 2 3 4 5
j. Council adequately deliver on Agricultural
services/NAADS
1 2 3 4 5
k. Council adequately deliver on Health services 1 2 3 4 5
l. Council adequately deliver on Road maintenance 1 2 3 4 5
m. Council adequately deliver on Education services 1 2 3 4 5
n. Council adequately deliver on Law and order 1 2 3 4 5

v
10) For the services where you have rated council as low performance, mention the reason(s)
why? ________________________________________________________________________
_____________________________________________________________________________
11) Does Council have specific programmes to enhance good local governance?
Yes No I don’t know
12) If yes, mention some_________________________________________________________
______________________________________________________________________________
13) Does council collect her budgeted income?
Yes No I don’t know
14) If no, explain _________________________________________________________
_________________________________________________________________________
SECTION F: LOCALITY FACTORS
15) What is the attitude of the community’s involvement in government programmes?
Good Bad I don’t know
16) If bad, why ________________________________________________________________
______________________________________________________________________________
17) Are there any NGOs/CBOs/CSOs operating in your community (ies)?
Yes No I don’t know
18) If yes, have they been actively involved in council’s programmes?
Yes No I don’t know
19) If yes, explain how___________________________________________________________
_____________________________________________________________________________
20) If no, explain why___________________________________________________________
_____________________________________________________________________________
END
THANK YOU

i
APPENDIX 2: INTERVIEW GUIDE
Section A: Devolution
Decentralization and increased:
1) Community participation in consultative meetings
2) Community participation in planning and budgeting.
3) Community participation in decision making.
4) Political accountability in local governments.
5) Administrative accountability in local governments.
6) Financial accountability in local governments.
7) Transparency in local governments.
8) Financial self-reliance in local governments.
9) Revenue mobilization in local governments.
10) Availability of technical staff in local governments.
Section B: Community Participation.
1) Aware of the need for its involvement in Council Programmes
2) Understanding of roles
3) Community response to council’s invitation to participate in Council’s programmes
4) Frequency of meetings at L.C.I level
5) Level of participation in Council programmes
6) Attractions of the community to participate in Council’s programmes
Section C: Local leadership capacity
1. Performance of Council staff
2. Consultation of community by political representatives
3. Relationship between councilors and the community
4. Feed back to the community by political representatives

ii
5. Transparency/corruption in the operation of council programmes
6. Rating of Councils in the delivery of services
7. Major reasons that potentially affect council’s delivery of services.
8. Relationship between the elected and appointed officials of the council
9. Comment on Council’s specific programmes for poverty alleviation
Section D: Local Revenue Capacity.
1. Comment on Council’s budgeted income
2. Utilisation of Revenue
Section E: Other Factors
1. Comment on the community’s attitude towards involvement in government programmes
2. Comment on NGOs/CBOs/CSOs if any operating in your community(ies)?
END

i
APPENDIX 3: GUIDE TO FOCUS GROUP DISCUSSIONS
Section A: Devolution.
Decentralization and increased:
1) Community participation in consultative meetings
2) Community participation in planning and budgeting.
3) Community participation in decision making.
4) Political accountability in local governments.
5) Administrative accountability in local governments.
6) Financial accountability in local governments.
7) Transparency in local governments.
8) Financial self-reliance in local governments.
9) Revenue mobilization in local governments.
10) Availability of technical staff in local governments.
Section B: Community Participation.
1) Aware of the need for its involvement in Council Programmes
2) Understanding of roles
3) Community response to council’s invitation to participate in Council’s programmes
4) Frequency of meetings at L.C.I level
5) Level of participation in Council programmes
6) Attractions of the community to participate in Council’s programmes
Section C: Local leadership capacity
1) Performance of Council staff
2) Consultation of community by political representatives
3) Relationship between councilors and the community
4) Feed back to the community by political representatives

ii
5) Transparency/corruption in the operation of council programmes
6) Rating of Councils in the delivery of services
7) Major reasons that potentially affect council’s delivery of services.
8) Relationship between the elected and appointed officials of the council
9) Comment on Council’s specific programmes for poverty alleviation
Section D: Local Revenue Capacity.
1) Comment on Council’s budgeted income
2) Utilisation of Revenue
Section E: Other Factors
1) Comment on the community’s attitude towards involvement in government programmes
2) Comment on NGOs/CBOs/CSOs if any operating in your community(ies)?
END

i
APPENDIX 4: DOCUMENTARY REVIEW GUIDE
1. Scrutiny of district and sub county budget speeches to ascertain the sources of the
budgeted revenues.
2. Scrutiny of district and sub county development plans, Final Accounts and District News
letters to ascertain community involvement and participation

i
APPENDIX 5: COMPUTED DATA
/COMPRESSED.
COMPUTE
Decentralization=MEAN(DCa1,DCa2,DCa3,DCa4,DCb1,DCb2,DCb3,DCb4,DCc1,DCc2,DCc3)
.
EXECUTE.
COMPUTE
Communityparticipation=MEAN(CPa1,CPa2,CPa3,CPa4,CPb1,CPb2,CPb3,CPb4,CP5).
EXECUTE.
COMPUTE
Localcapacity=MEAN(LCa1,LCa2,LCa3,LCa4,LCb1,LCb2,LCb3,LCb4,LCb5,LCb6,LCb7,LCb
8,LCb9).
EXECUTE.
COMPUTE
Accountabilityandtransparency=MEAN(ATa1,ATa2,ATa3,ATa4,ATa5,ATa6,ATa7,ATa8,AT
a9).
EXECUTE.
RELIABILITY
/VARIABLES=DCa1 DCa2 DCa3 DCa4 DCb1 DCb2 DCb3 DCb4 DCc1 DCc2 DCc3
/SCALE('ALL VARIABLES') ALL
/MODEL=ALPHA
/STATISTICS=DESCRIPTIVE SCALE
/SUMMARY=MEANS.
COMPUTE LGPerfromance=MEAN
(CPa1,CPa2,CPa3,CPa4,CPb1,CPb2,CPb3,CPb4,CP5,LCa1,LCa2,LCa3,LCa4,LCb1,LCb2,LC
b3,LCb4,LCb5,LCb6,LCb7,LCb8,LCb9,ATa1,ATa2,ATa3,ATa4,ATa5,ATa6,ATa7,ATa8,ATa9
).
EXECUTE.
RELIABILITY
/VARIABLES=DCa1 DCa2 DCa3 DCa4 DCb1 DCb2 DCb3 DCb4 DCc1 DCc2 DCc3
/SCALE('ALL VARIABLES') ALL
/MODEL=ALPHA
/STATISTICS=DESCRIPTIVE SCALE
/SUMMARY=MEANS VARIANCE COV.
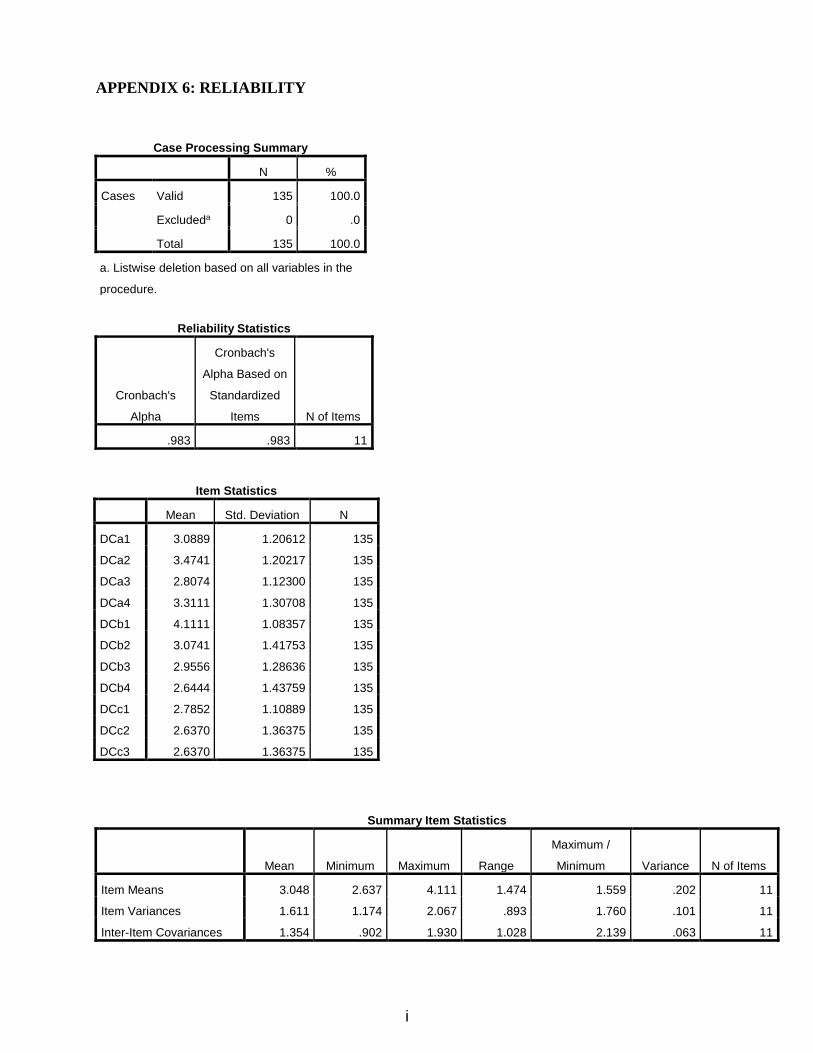
i
APPENDIX 6: RELIABILITY
Case Processing Summary
N %
Cases Valid 135 100.0
Excludeda 0 .0
Total 135 100.0
a. Listwise deletion based on all variables in the
procedure.
Reliability Statistics
Cronbach's
Alpha
Cronbach's
Alpha Based on
Standardized
Items N of Items
.983 .983 11
Item Statistics
Mean Std. Deviation N
DCa1 3.0889 1.20612 135
DCa2 3.4741 1.20217 135
DCa3 2.8074 1.12300 135
DCa4 3.3111 1.30708 135
DCb1 4.1111 1.08357 135
DCb2 3.0741 1.41753 135
DCb3 2.9556 1.28636 135
DCb4 2.6444 1.43759 135
DCc1 2.7852 1.10889 135
DCc2 2.6370 1.36375 135
DCc3 2.6370 1.36375 135
Summary Item Statistics
Mean Minimum Maximum Range
Maximum /
Minimum Variance N of Items
Item Means 3.048 2.637 4.111 1.474 1.559 .202 11
Item Variances 1.611 1.174 2.067 .893 1.760 .101 11
Inter-Item Covariances 1.354 .902 1.930 1.028 2.139 .063 11
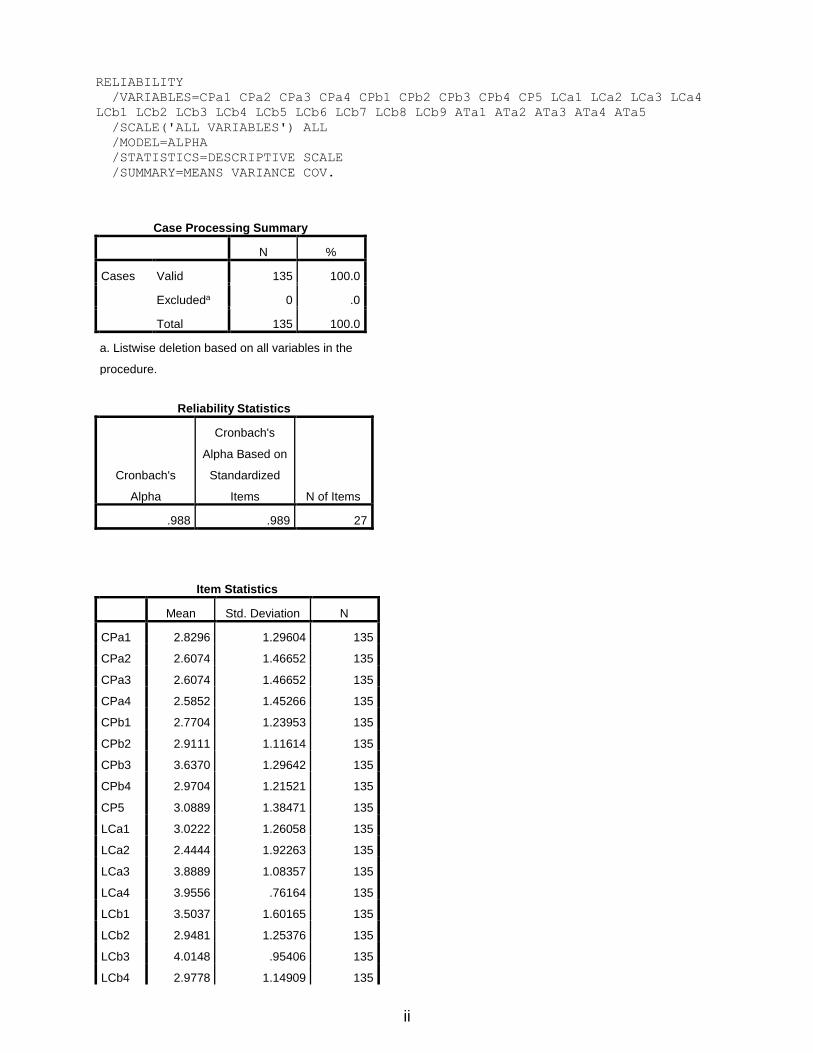
ii
RELIABILITY
/VARIABLES=CPa1 CPa2 CPa3 CPa4 CPb1 CPb2 CPb3 CPb4 CP5 LCa1 LCa2 LCa3 LCa4
LCb1 LCb2 LCb3 LCb4 LCb5 LCb6 LCb7 LCb8 LCb9 ATa1 ATa2 ATa3 ATa4 ATa5
/SCALE('ALL VARIABLES') ALL
/MODEL=ALPHA
/STATISTICS=DESCRIPTIVE SCALE
/SUMMARY=MEANS VARIANCE COV.
Case Processing Summary
N %
Cases Valid 135 100.0
Excludeda 0 .0
Total 135 100.0
a. Listwise deletion based on all variables in the
procedure.
Reliability Statistics
Cronbach's
Alpha
Cronbach's
Alpha Based on
Standardized
Items N of Items
.988 .989 27
Item Statistics
Mean Std. Deviation N
CPa1 2.8296 1.29604 135
CPa2 2.6074 1.46652 135
CPa3 2.6074 1.46652 135
CPa4 2.5852 1.45266 135
CPb1 2.7704 1.23953 135
CPb2 2.9111 1.11614 135
CPb3 3.6370 1.29642 135
CPb4 2.9704 1.21521 135
CP5 3.0889 1.38471 135
LCa1 3.0222 1.26058 135
LCa2 2.4444 1.92263 135
LCa3 3.8889 1.08357 135
LCa4 3.9556 .76164 135
LCb1 3.5037 1.60165 135
LCb2 2.9481 1.25376 135
LCb3 4.0148 .95406 135
LCb4 2.9778 1.14909 135
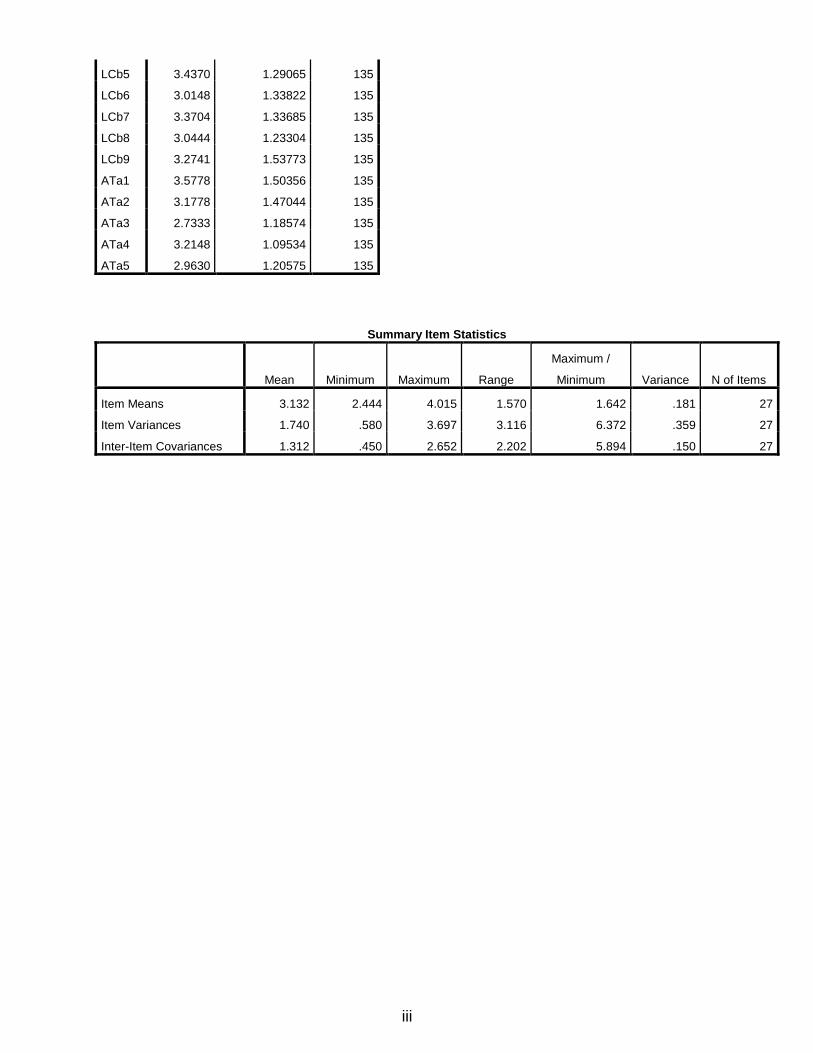
iii
LCb5 3.4370 1.29065 135
LCb6 3.0148 1.33822 135
LCb7 3.3704 1.33685 135
LCb8 3.0444 1.23304 135
LCb9 3.2741 1.53773 135
ATa1 3.5778 1.50356 135
ATa2 3.1778 1.47044 135
ATa3 2.7333 1.18574 135
ATa4 3.2148 1.09534 135
ATa5 2.9630 1.20575 135
Summary Item Statistics
Mean Minimum Maximum Range
Maximum /
Minimum Variance N of Items
Item Means 3.132 2.444 4.015 1.570 1.642 .181 27
Item Variances 1.740 .580 3.697 3.116 6.372 .359 27
Inter-Item Covariances 1.312 .450 2.652 2.202 5.894 .150 27
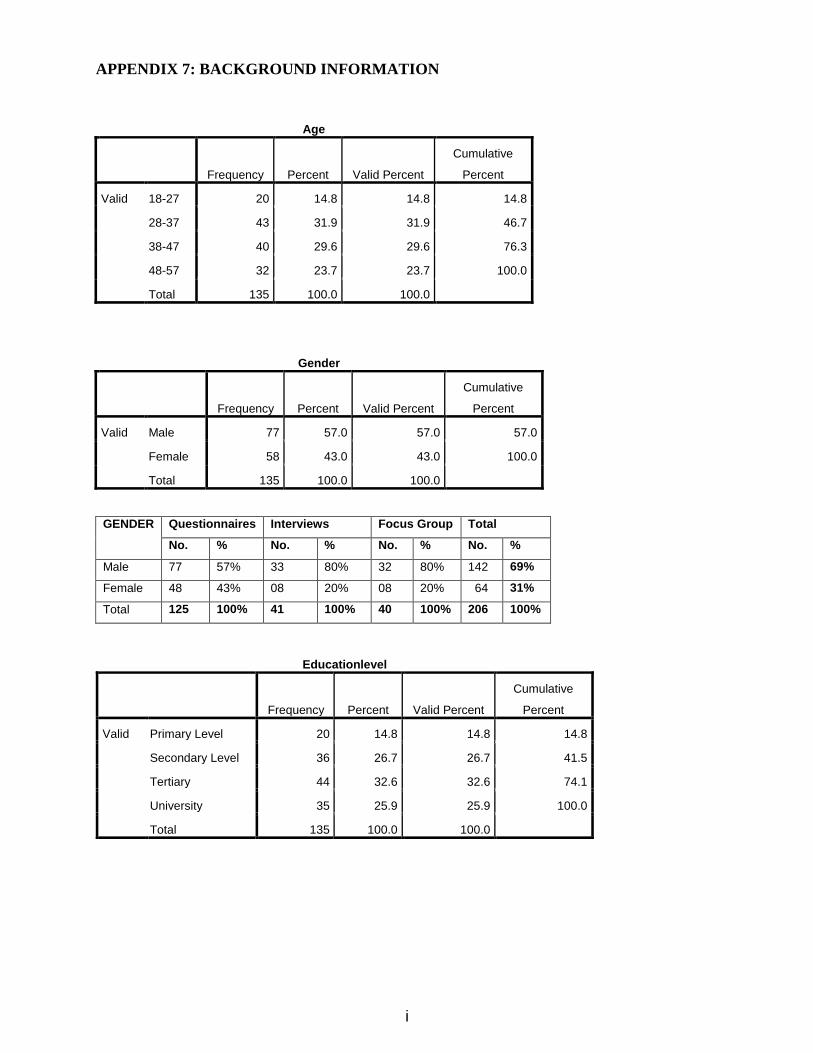
i
APPENDIX 7: BACKGROUND INFORMATION
Age
Frequency Percent Valid Percent
Cumulative
Percent
Valid 18-27 20 14.8 14.8 14.8
28-37 43 31.9 31.9 46.7
38-47 40 29.6 29.6 76.3
48-57 32 23.7 23.7 100.0
Total 135 100.0 100.0
Gender
Frequency Percent Valid Percent
Cumulative
Percent
Valid Male 77 57.0 57.0 57.0
Female 58 43.0 43.0 100.0
Total 135 100.0 100.0
GENDER Questionnaires Interviews Focus Group Total
No. % No. % No. % No. %
Male 77 57% 33 80% 32 80% 142 69%
Female 48 43% 08 20% 08 20% 64 31%
Total 125 100% 41 100% 40 100% 206 100%
Educationlevel
Frequency Percent Valid Percent
Cumulative
Percent
Valid Primary Level 20 14.8 14.8 14.8
Secondary Level 36 26.7 26.7 41.5
Tertiary 44 32.6 32.6 74.1
University 35 25.9 25.9 100.0
Total 135 100.0 100.0
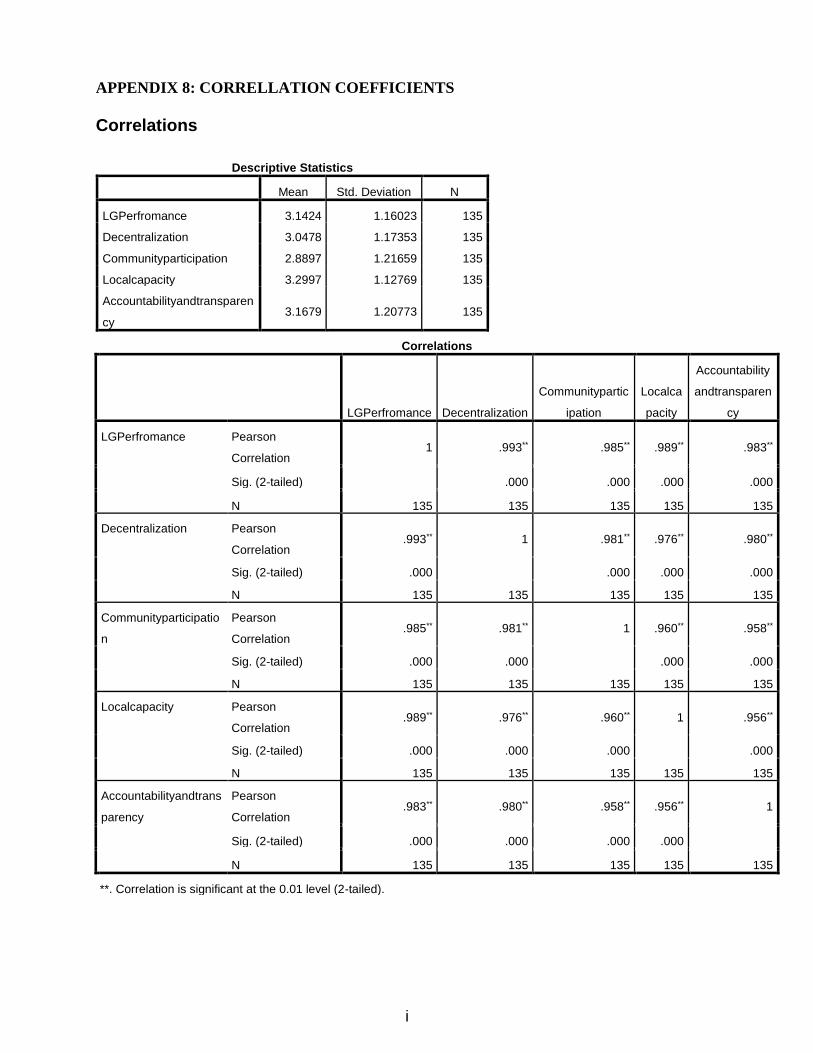
i
APPENDIX 8: CORRELLATION COEFFICIENTS
Correlations
Descriptive Statistics
Mean Std. Deviation N
LGPerfromance 3.1424 1.16023 135
Decentralization 3.0478 1.17353 135
Communityparticipation 2.8897 1.21659 135
Localcapacity 3.2997 1.12769 135
Accountabilityandtransparen
cy 3.1679 1.20773 135
Correlations
LGPerfromance Decentralization
Communitypartic
ipation
Localca
pacity
Accountability
andtransparen
cy
LGPerfromance Pearson
Correlation 1 .993** .985** .989** .983**
Sig. (2-tailed) .000 .000 .000 .000
N 135 135 135 135 135
Decentralization Pearson
Correlation .993** 1 .981** .976** .980**
Sig. (2-tailed) .000 .000 .000 .000
N 135 135 135 135 135
Communityparticipatio
n
Pearson
Correlation .985** .981** 1 .960** .958**
Sig. (2-tailed) .000 .000 .000 .000
N 135 135 135 135 135
Localcapacity Pearson
Correlation .989** .976** .960** 1 .956**
Sig. (2-tailed) .000 .000 .000 .000
N 135 135 135 135 135
Accountabilityandtrans
parency
Pearson
Correlation .983** .980** .958** .956** 1
Sig. (2-tailed) .000 .000 .000 .000
N 135 135 135 135 135
**. Correlation is significant at the 0.01 level (2-tailed).
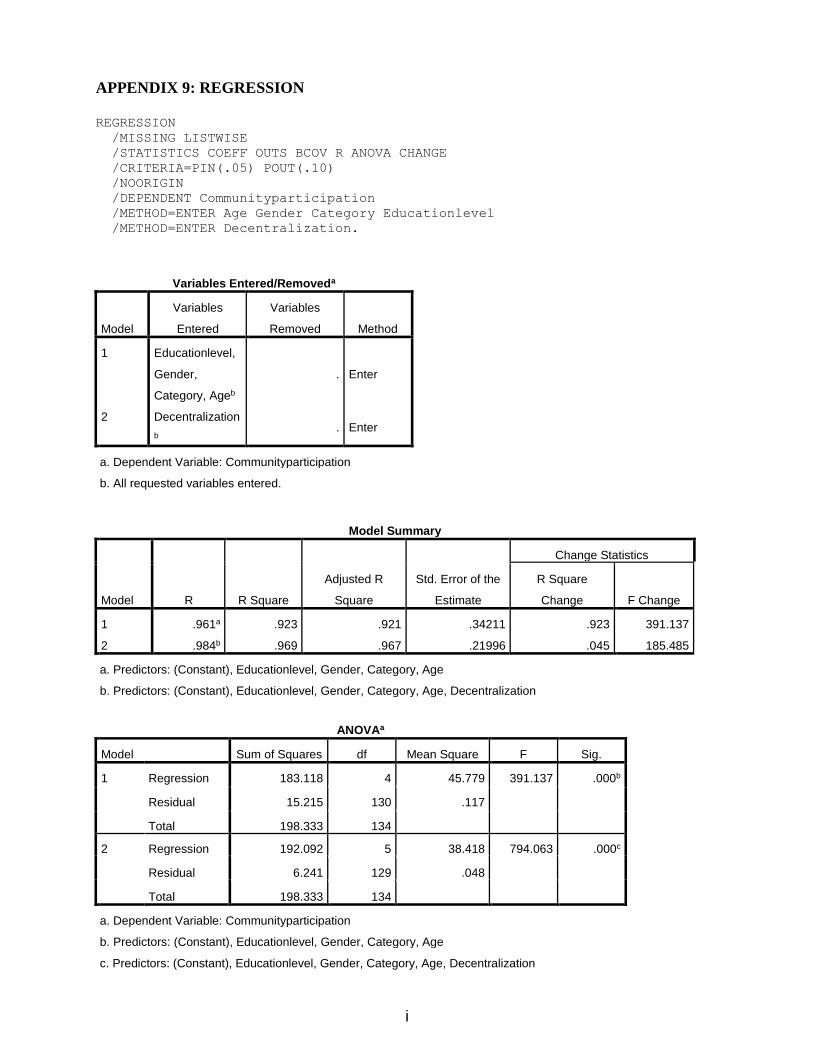
i
APPENDIX 9: REGRESSION
REGRESSION
/MISSING LISTWISE
/STATISTICS COEFF OUTS BCOV R ANOVA CHANGE
/CRITERIA=PIN(.05) POUT(.10)
/NOORIGIN
/DEPENDENT Communityparticipation
/METHOD=ENTER Age Gender Category Educationlevel
/METHOD=ENTER Decentralization.
Variables Entered/Removeda
Model
Variables
Entered
Variables
Removed Method
1 Educationlevel,
Gender,
Category, Ageb
. Enter
2 Decentralization
b . Enter
a. Dependent Variable: Communityparticipation
b. All requested variables entered.
Model Summary
Model R R Square
Adjusted R
Square
Std. Error of the
Estimate
Change Statistics
R Square
Change F Change
1 .961a .923 .921 .34211 .923 391.137
2 .984b .969 .967 .21996 .045 185.485
a. Predictors: (Constant), Educationlevel, Gender, Category, Age
b. Predictors: (Constant), Educationlevel, Gender, Category, Age, Decentralization
ANOVAa
Model Sum of Squares df Mean Square F Sig.
1 Regression 183.118 4 45.779 391.137 .000b
Residual 15.215 130 .117
Total 198.333 134
2 Regression 192.092 5 38.418 794.063 .000c
Residual 6.241 129 .048
Total 198.333 134
a. Dependent Variable: Communityparticipation
b. Predictors: (Constant), Educationlevel, Gender, Category, Age
c. Predictors: (Constant), Educationlevel, Gender, Category, Age, Decentralization
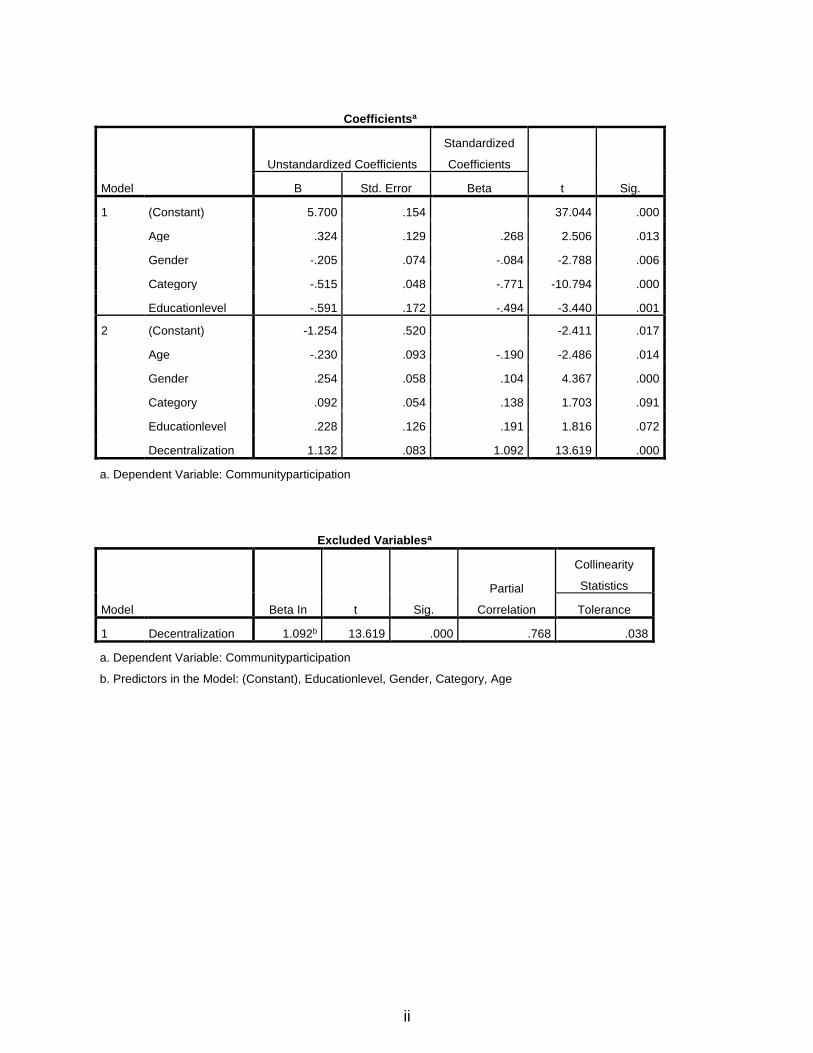
ii
Coefficientsa
Model
Unstandardized Coefficients
Standardized
Coefficients
t Sig. B Std. Error Beta
1 (Constant) 5.700 .154 37.044 .000
Age .324 .129 .268 2.506 .013
Gender -.205 .074 -.084 -2.788 .006
Category -.515 .048 -.771 -10.794 .000
Educationlevel -.591 .172 -.494 -3.440 .001
2 (Constant) -1.254 .520 -2.411 .017
Age -.230 .093 -.190 -2.486 .014
Gender .254 .058 .104 4.367 .000
Category .092 .054 .138 1.703 .091
Educationlevel .228 .126 .191 1.816 .072
Decentralization 1.132 .083 1.092 13.619 .000
a. Dependent Variable: Communityparticipation
Excluded Variablesa
Model Beta In t Sig.
Partial
Correlation
Collinearity
Statistics
Tolerance
1 Decentralization 1.092b 13.619 .000 .768 .038
a. Dependent Variable: Communityparticipation
b. Predictors in the Model: (Constant), Educationlevel, Gender, Category, Age
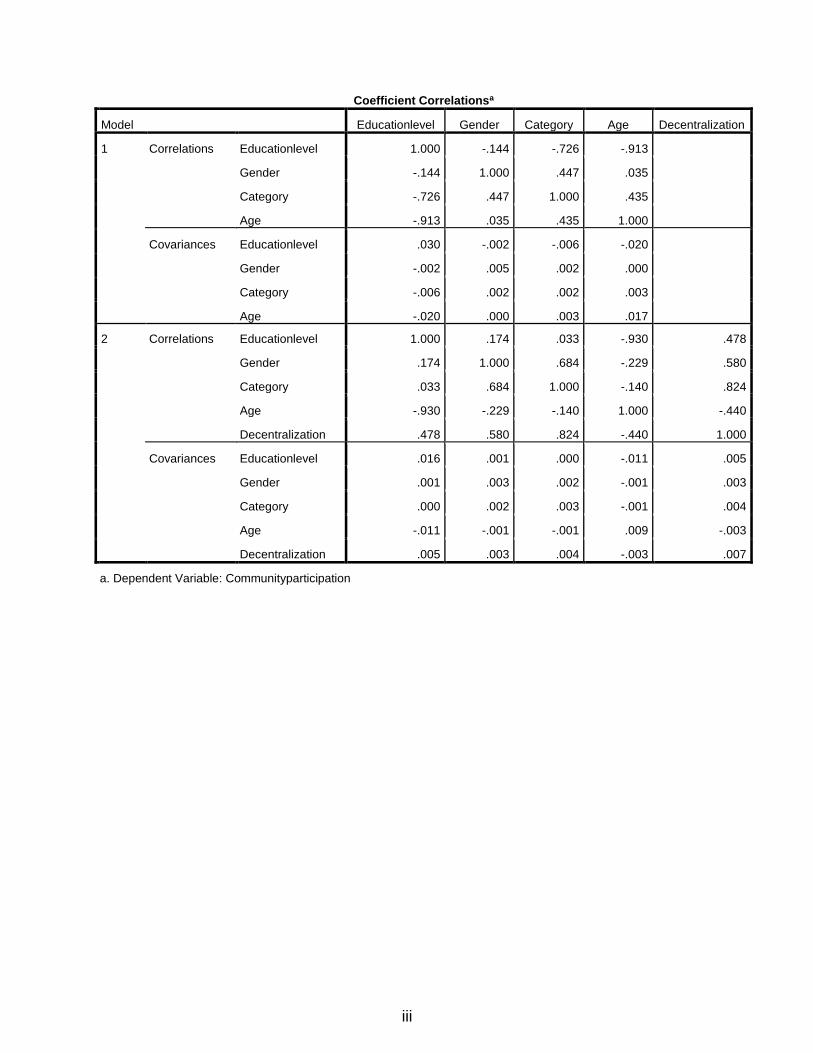
iii
Coefficient Correlationsa
Model Educationlevel Gender Category Age Decentralization
1 Correlations Educationlevel 1.000 -.144 -.726 -.913
Gender -.144 1.000 .447 .035
Category -.726 .447 1.000 .435
Age -.913 .035 .435 1.000
Covariances Educationlevel .030 -.002 -.006 -.020
Gender -.002 .005 .002 .000
Category -.006 .002 .002 .003
Age -.020 .000 .003 .017
2 Correlations Educationlevel 1.000 .174 .033 -.930 .478
Gender .174 1.000 .684 -.229 .580
Category .033 .684 1.000 -.140 .824
Age -.930 -.229 -.140 1.000 -.440
Decentralization .478 .580 .824 -.440 1.000
Covariances Educationlevel .016 .001 .000 -.011 .005
Gender .001 .003 .002 -.001 .003
Category .000 .002 .003 -.001 .004
Age -.011 -.001 -.001 .009 -.003
Decentralization .005 .003 .004 -.003 .007
a. Dependent Variable: Communityparticipation
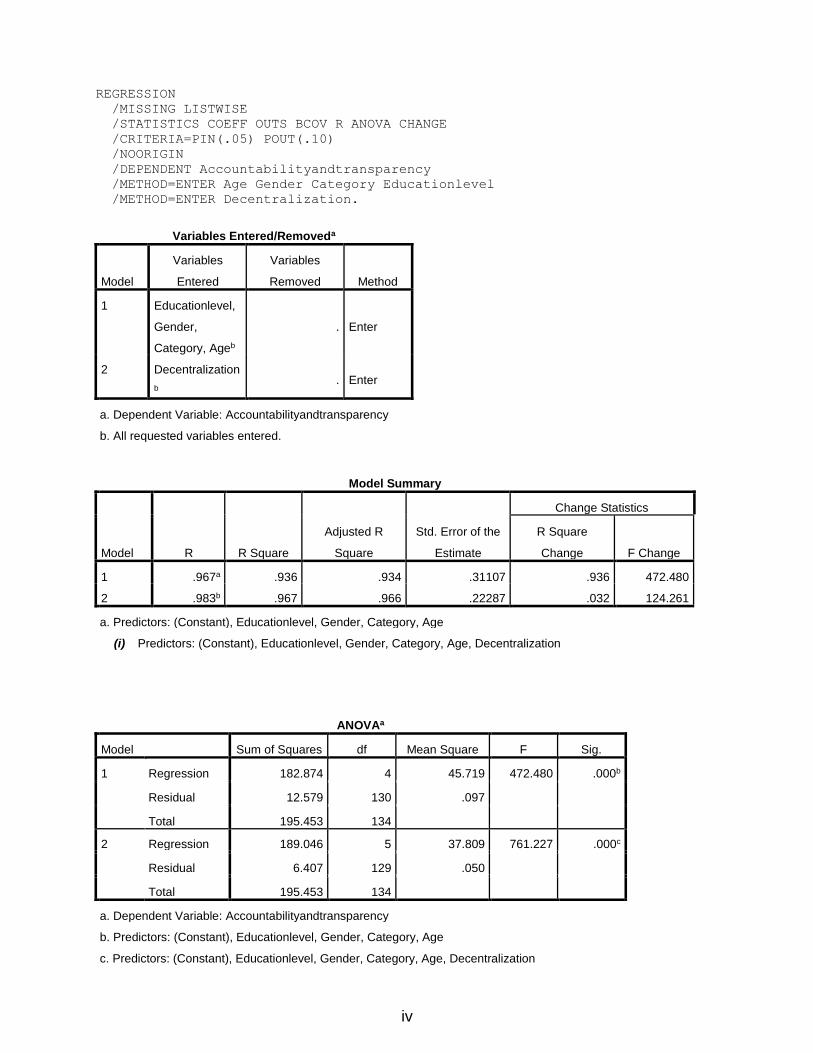
iv
REGRESSION
/MISSING LISTWISE
/STATISTICS COEFF OUTS BCOV R ANOVA CHANGE
/CRITERIA=PIN(.05) POUT(.10)
/NOORIGIN
/DEPENDENT Accountabilityandtransparency
/METHOD=ENTER Age Gender Category Educationlevel
/METHOD=ENTER Decentralization.
Variables Entered/Removeda
Model
Variables
Entered
Variables
Removed Method
1 Educationlevel,
Gender,
Category, Ageb
. Enter
2 Decentralization
b . Enter
a. Dependent Variable: Accountabilityandtransparency
b. All requested variables entered.
Model Summary
Model R R Square
Adjusted R
Square
Std. Error of the
Estimate
Change Statistics
R Square
Change F Change
1 .967a .936 .934 .31107 .936 472.480
2 .983b .967 .966 .22287 .032 124.261
a. Predictors: (Constant), Educationlevel, Gender, Category, Age
(i) Predictors: (Constant), Educationlevel, Gender, Category, Age, Decentralization
ANOVAa
Model Sum of Squares df Mean Square F Sig.
1 Regression 182.874 4 45.719 472.480 .000b
Residual 12.579 130 .097
Total 195.453 134
2 Regression 189.046 5 37.809 761.227 .000c
Residual 6.407 129 .050
Total 195.453 134
a. Dependent Variable: Accountabilityandtransparency
b. Predictors: (Constant), Educationlevel, Gender, Category, Age
c. Predictors: (Constant), Educationlevel, Gender, Category, Age, Decentralization
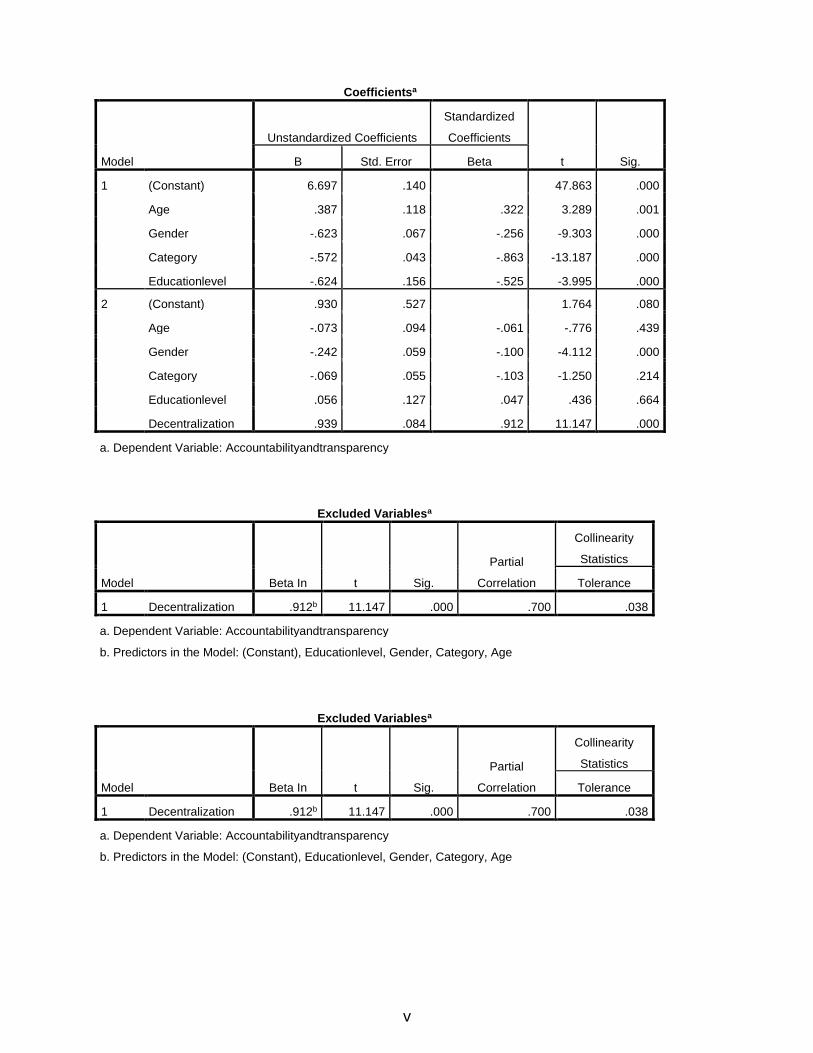
v
Coefficientsa
Model
Unstandardized Coefficients
Standardized
Coefficients
t Sig. B Std. Error Beta
1 (Constant) 6.697 .140 47.863 .000
Age .387 .118 .322 3.289 .001
Gender -.623 .067 -.256 -9.303 .000
Category -.572 .043 -.863 -13.187 .000
Educationlevel -.624 .156 -.525 -3.995 .000
2 (Constant) .930 .527 1.764 .080
Age -.073 .094 -.061 -.776 .439
Gender -.242 .059 -.100 -4.112 .000
Category -.069 .055 -.103 -1.250 .214
Educationlevel .056 .127 .047 .436 .664
Decentralization .939 .084 .912 11.147 .000
a. Dependent Variable: Accountabilityandtransparency
Excluded Variablesa
Model Beta In t Sig.
Partial
Correlation
Collinearity
Statistics
Tolerance
1 Decentralization .912b 11.147 .000 .700 .038
a. Dependent Variable: Accountabilityandtransparency
b. Predictors in the Model: (Constant), Educationlevel, Gender, Category, Age
Excluded Variablesa
Model Beta In t Sig.
Partial
Correlation
Collinearity
Statistics
Tolerance
1 Decentralization .912b 11.147 .000 .700 .038
a. Dependent Variable: Accountabilityandtransparency
b. Predictors in the Model: (Constant), Educationlevel, Gender, Category, Age
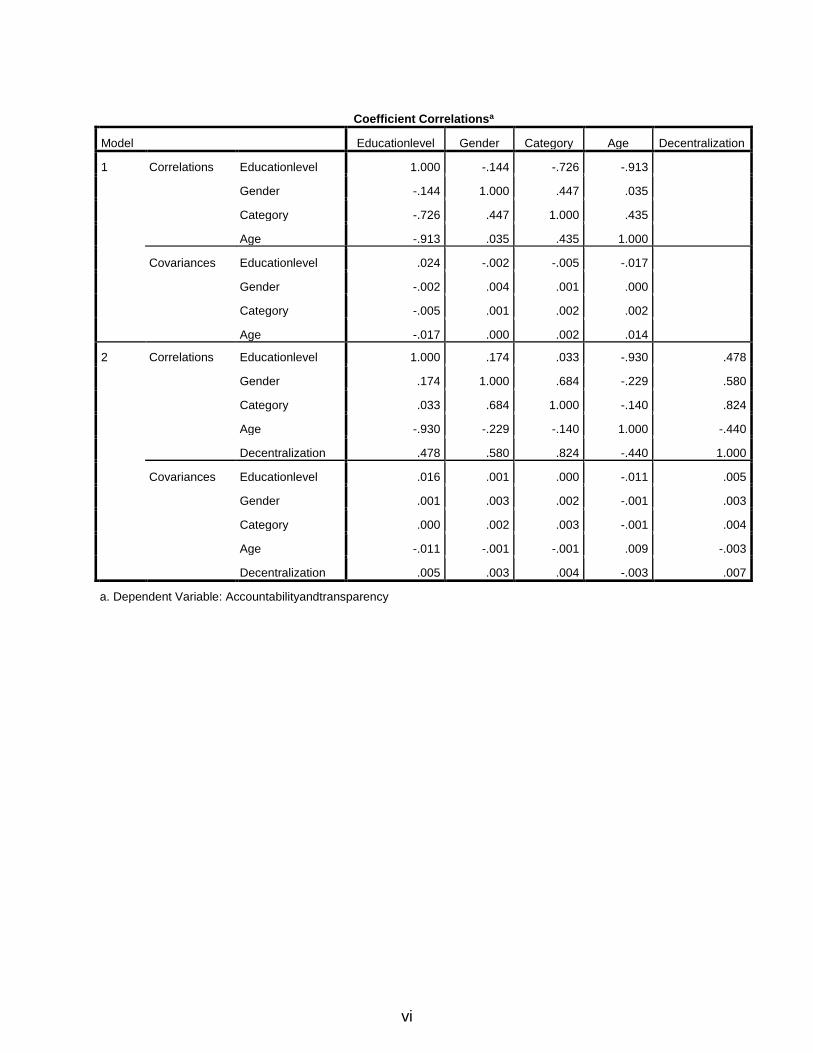
vi
Coefficient Correlationsa
Model Educationlevel Gender Category Age Decentralization
1 Correlations Educationlevel 1.000 -.144 -.726 -.913
Gender -.144 1.000 .447 .035
Category -.726 .447 1.000 .435
Age -.913 .035 .435 1.000
Covariances Educationlevel .024 -.002 -.005 -.017
Gender -.002 .004 .001 .000
Category -.005 .001 .002 .002
Age -.017 .000 .002 .014
2 Correlations Educationlevel 1.000 .174 .033 -.930 .478
Gender .174 1.000 .684 -.229 .580
Category .033 .684 1.000 -.140 .824
Age -.930 -.229 -.140 1.000 -.440
Decentralization .478 .580 .824 -.440 1.000
Covariances Educationlevel .016 .001 .000 -.011 .005
Gender .001 .003 .002 -.001 .003
Category .000 .002 .003 -.001 .004
Age -.011 -.001 -.001 .009 -.003
Decentralization .005 .003 .004 -.003 .007
a. Dependent Variable: Accountabilityandtransparency
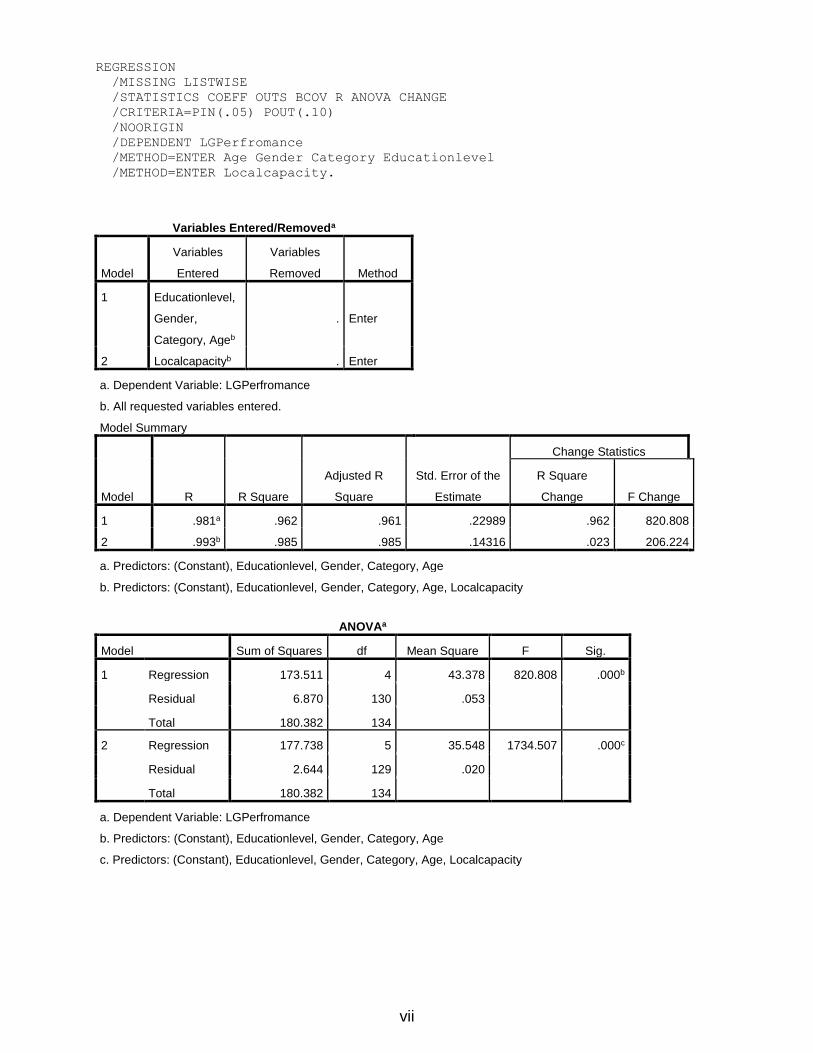
vii
REGRESSION
/MISSING LISTWISE
/STATISTICS COEFF OUTS BCOV R ANOVA CHANGE
/CRITERIA=PIN(.05) POUT(.10)
/NOORIGIN
/DEPENDENT LGPerfromance
/METHOD=ENTER Age Gender Category Educationlevel
/METHOD=ENTER Localcapacity.
Variables Entered/Removeda
Model
Variables
Entered
Variables
Removed Method
1 Educationlevel,
Gender,
Category, Ageb
. Enter
2 Localcapacityb . Enter
a. Dependent Variable: LGPerfromance
b. All requested variables entered.
Model Summary
Model R R Square
Adjusted R
Square
Std. Error of the
Estimate
Change Statistics
R Square
Change F Change
1 .981a .962 .961 .22989 .962 820.808
2 .993b .985 .985 .14316 .023 206.224
a. Predictors: (Constant), Educationlevel, Gender, Category, Age
b. Predictors: (Constant), Educationlevel, Gender, Category, Age, Localcapacity
ANOVAa
Model Sum of Squares df Mean Square F Sig.
1 Regression 173.511 4 43.378 820.808 .000b
Residual 6.870 130 .053
Total 180.382 134
2 Regression 177.738 5 35.548 1734.507 .000c
Residual 2.644 129 .020
Total 180.382 134
a. Dependent Variable: LGPerfromance
b. Predictors: (Constant), Educationlevel, Gender, Category, Age
c. Predictors: (Constant), Educationlevel, Gender, Category, Age, Localcapacity
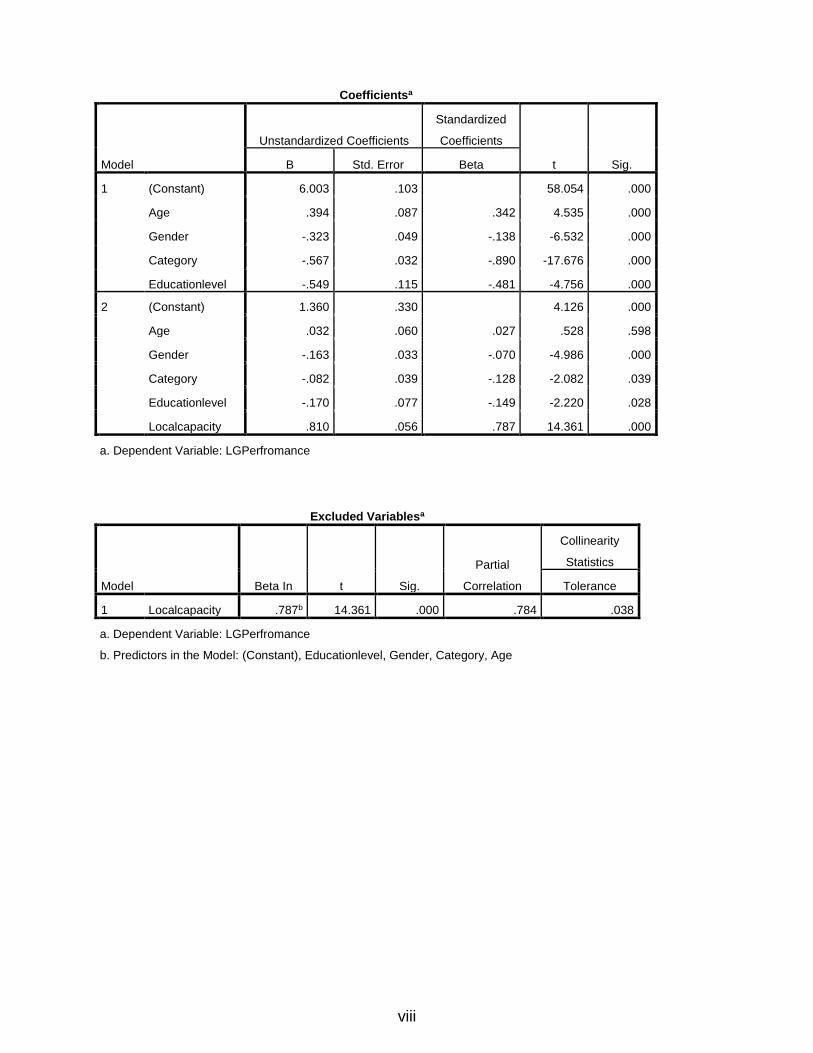
viii
Coefficientsa
Model
Unstandardized Coefficients
Standardized
Coefficients
t Sig. B Std. Error Beta
1 (Constant) 6.003 .103 58.054 .000
Age .394 .087 .342 4.535 .000
Gender -.323 .049 -.138 -6.532 .000
Category -.567 .032 -.890 -17.676 .000
Educationlevel -.549 .115 -.481 -4.756 .000
2 (Constant) 1.360 .330 4.126 .000
Age .032 .060 .027 .528 .598
Gender -.163 .033 -.070 -4.986 .000
Category -.082 .039 -.128 -2.082 .039
Educationlevel -.170 .077 -.149 -2.220 .028
Localcapacity .810 .056 .787 14.361 .000
a. Dependent Variable: LGPerfromance
Excluded Variablesa
Model Beta In t Sig.
Partial
Correlation
Collinearity
Statistics
Tolerance
1 Localcapacity .787b 14.361 .000 .784 .038
a. Dependent Variable: LGPerfromance
b. Predictors in the Model: (Constant), Educationlevel, Gender, Category, Age
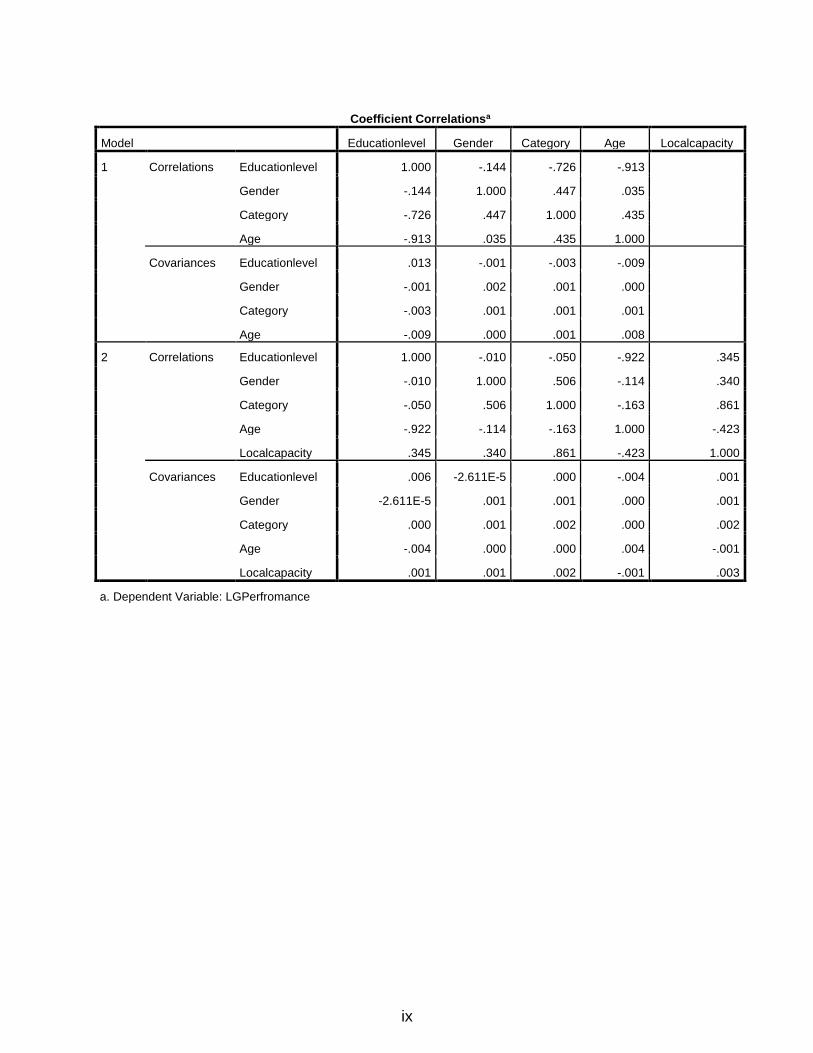
ix
Coefficient Correlationsa
Model Educationlevel Gender Category Age Localcapacity
1 Correlations Educationlevel 1.000 -.144 -.726 -.913
Gender -.144 1.000 .447 .035
Category -.726 .447 1.000 .435
Age -.913 .035 .435 1.000
Covariances Educationlevel .013 -.001 -.003 -.009
Gender -.001 .002 .001 .000
Category -.003 .001 .001 .001
Age -.009 .000 .001 .008
2 Correlations Educationlevel 1.000 -.010 -.050 -.922 .345
Gender -.010 1.000 .506 -.114 .340
Category -.050 .506 1.000 -.163 .861
Age -.922 -.114 -.163 1.000 -.423
Localcapacity .345 .340 .861 -.423 1.000
Covariances Educationlevel .006 -2.611E-5 .000 -.004 .001
Gender -2.611E-5 .001 .001 .000 .001
Category .000 .001 .002 .000 .002
Age -.004 .000 .000 .004 -.001
Localcapacity .001 .001 .002 -.001 .003
a. Dependent Variable: LGPerfromance
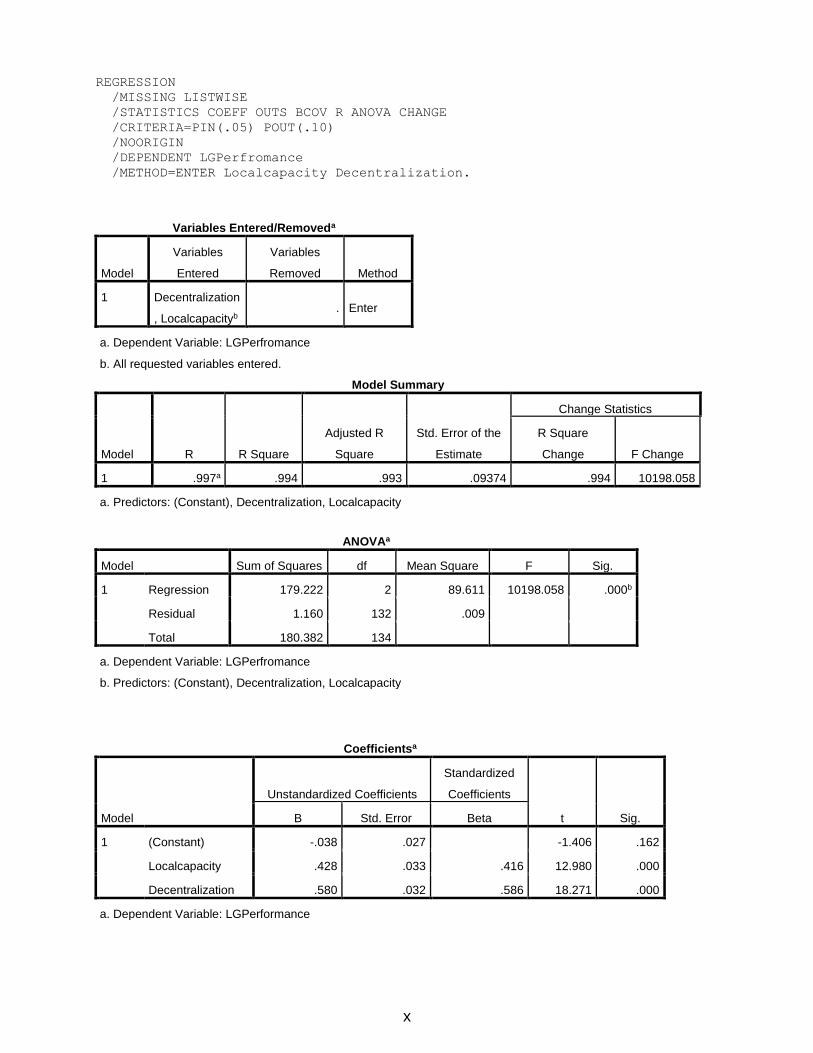
x
REGRESSION
/MISSING LISTWISE
/STATISTICS COEFF OUTS BCOV R ANOVA CHANGE
/CRITERIA=PIN(.05) POUT(.10)
/NOORIGIN
/DEPENDENT LGPerfromance
/METHOD=ENTER Localcapacity Decentralization.
Variables Entered/Removeda
Model
Variables
Entered
Variables
Removed Method
1 Decentralization
, Localcapacityb . Enter
a. Dependent Variable: LGPerfromance
b. All requested variables entered.
Model Summary
Model R R Square
Adjusted R
Square
Std. Error of the
Estimate
Change Statistics
R Square
Change F Change
1 .997a .994 .993 .09374 .994 10198.058
a. Predictors: (Constant), Decentralization, Localcapacity
ANOVAa
Model Sum of Squares df Mean Square F Sig.
1 Regression 179.222 2 89.611 10198.058 .000b
Residual 1.160 132 .009
Total 180.382 134
a. Dependent Variable: LGPerfromance
b. Predictors: (Constant), Decentralization, Localcapacity
Coefficientsa
Model
Unstandardized Coefficients
Standardized
Coefficients
t Sig. B Std. Error Beta
1 (Constant) -.038 .027 -1.406 .162
Localcapacity .428 .033 .416 12.980 .000
Decentralization .580 .032 .586 18.271 .000
a. Dependent Variable: LGPerformance

xi
Coefficient Correlationsa
Model Decentralization Localcapacity
1 Correlations Decentralization 1.000 -.976
Localcapacity -.976 1.000
Covariances Decentralization .001 -.001
Localcapacity -.001 .001
a. Dependent Variable: LGPerfromance


