Embed Size (px)
Citation preview

Decimal Trading and Market Impact
Sugato Chakravarty
Purdue University, West Lafayette, IN 47907 Tel: (765) 494 6427
E-mail: [email protected]
Stephen P. Harris Bridge Information Systems
Tel: (314) 468-8292 E-mail: [email protected]
Robert A. Wood University of Memphis, Memphis, TN 38152
Tel: (901) 755-8322 E-mail: [email protected]
Version 2.1: March 29, 2001
Abstract
Using high-frequency data and a carefully constructed 1-1 matched sample of control (non decimal) stocks, we isolate the effects of decimalization for a sample of NYSE-listed common stocks trading in decimals. We find that decimalization has resulted in significantly lower quoted and effective bid/ask spreads and that the most popular quoted spread is 1 cent. The available depths at the best bid and ask prices are also significantly lower. Together, these spread-depth results deliver a mixed verdict on market liquidity after decimalization. We find that decimalization has resulted in significant increases (decreases) in relatively smaller size (larger size) trades and trading volume. The frequency of quote updates and autoquotes in decimal stocks following decimalization has also increased significantly. Regional stock exchanges also appear to be significantly more active in competing for order flow. Our results have important research and policy implications.
JEL classification: Keywords: decimalization, bid/ask spread, trading, stock exchange
Acknowledgements: Please direct all comments to Chakravarty. We thank Robert Battalio, Tarun Chordia, Bill Christie, Mike Cooper, Amy Edwards, Gene Finn, Melinda Gigante-Carlson, Michael Goldstein, Robert Jennings, Ananth Madhavan, Tim McCormick, Eric Sirri, George Sofianos, Robert Wood Jr., and Robert Van Ness, for comments on earlier drafts, Wonil Hwang and Dan Zhou for research assistance, and Stephen Harris of Bridge Information Systems for providing some of the data. An earlier version of this paper was titled “The Effect of Decimal Trading on Market Liquidity.” Sadly, we alone are responsible for any remaining errors.

Decimal Trading and Market Impact
Abstract
Using high-frequency data and a carefully constructed 1-1 matched sample of control (non decimal) stocks, we isolate the effects of decimalization for a sample of NYSE-listed common stocks trading in decimals. We find that decimalization has resulted in significantly lower quoted and effective bid/ask spreads and that the most popular quoted spread is 1 cent. The available depth at the best bid and offer prices is also significantly lower. These spread-depth results together deliver a mixed verdict on market liquidity after decimalization. We find that decimalization has resulted in significant increases (decreases) in relatively smaller size (larger size) trades and trading volume. The frequency of bid/ask quote updates and autoquotes in decimal stocks following decimalization has also increased significantly. Regional stock exchanges also appear to be significantly more active in competing for order flow. Our results have important research and policy implications.
JEL classification: Keywords: decimalization, bid/ask spread, trading, stock exchange

3
“The theory is straightforward: As prices are quoted in smaller and smaller increments, there are more opportunities and less costs for dealers and investors to improve the bid or offer on a security. As more competitive bidding ensues, naturally the spread becomes smaller. And this means better, more efficient prices for investors.”
Arthur Levitt, Chairman SEC. March, 2000.
1. Introduction
Between August 28, 2000, and January 29, 2001, the New York Stock Exchange (NYSE),
through a series of incremental steps, began trading and quoting all its listed securities in
increments of a penny. Decimalization had finally arrived in Wall Street! A two-hundred-year
tradition of trading in fractions was now officially history.
According to the NYSE, the reduction in minimum price increment to sixteenths, in June
1997, was but an interim step in a move toward the decimalization of prices and price
increments (Jones and Lipson (2000)). And while it is tempting to think of decimalization as
merely a continuation in the process of tick size reduction, it is actually much more than just
that. While the move to sixteenths resulted in a doubling of the price points or “ticks”, the
move to decimals (from sixteenths) results in a six-fold increase in ticks.1 Also, a unique, and
potentially dangerous, aspect of decimalization is that for as little as 1 cent per share (as
compared to about 6.25 cents a share under sixteenths), intermediaries could step in front of
public limit orders in what amounts to “front running.” If the stock heads down after this
purchase, these investors could simply sell to the public limit orders and be none the worse for
it. It is, therefore, conceivable that the supply of liquidity from the investing public in the form
1 A report by the Securities Industry Association (SIA) and SRI Consulting group, prepared in early 2000, before the first phase of the decimal pilot, reveals that the minimum price variation of a penny was expected to have a more significant impact on share volume and the number of trades and quotes than during the previous switch over to sixteenths: specifically, that the move to decimals was expected to result in a 139% increase in trades, an 80% increase in quotes and a 9% increase in share volume.

4
of public limit orders may also dry up. Conversely, with decimalization it will be easier for
institutional investors to jump in front of the queue with limit orders, supplying liquidity rather
than demanding it (thereby acting as pseudo-dealers) and, in the process, earning the spread
rather than paying it. Which effect will ultimately dominate is unclear.
The NYSE's board approved conversion to decimal pricing in June 1997 with the goal of
making prices more easily understood by investors, reducing spreads and bringing the United
States into conformity with international practices. The importance of liquid markets is of
paramount importance to both suppliers and demanders of capital as well as regulators
entrusted with the mandate of maintaining a fair and orderly market. While there is little
debate that prices are easily understood under the decimal system where one does not have to
pause momentarily and wonder if 5/8 is greater than 9/16, for example, whether or not this has
actually impacted market liquidity (and its various facets) is an empirical issue and is a focus of
the current paper.
Many stock exchanges have recently reduced their minimum ticks. And despite such
changes being studied extensively, both theoretically and empirically, its appropriateness
remains an open question.2 Of particular relevance to the current paper is Bacidore’s (1997)
investigation into the impact on market quality associated with Toronto Stock Exchange’s
switching to decimal trading on April 15, 1996. He finds that for stocks whose minimum tick
was reduced from one-eighth dollar to five cents, such reduction decreased spreads, while
2Examples of theoretical research include Grossman and Miller (1988), Brown, Laux and Schachter (1991),
Hart (1993), Chordia and Subrahmanyam (1995), Peake (1995), Battalio and Holden (1996), Bernhardt and Hughson (1996), Kandel and Marx (1996), Cordella and Foucault (1996), O’Connell (1997), Harris (1994, 1997), Seppi (1997), and Anshuman and Kalay (1998). Examples of empirical research include Crack (1994), Ahn, Cao and Choe (1996), Bacidore (1997), Bessembinder (1997), Huson, Kim and Mehrotra (1997), Porter and Weaver (1997) and Ahn, Cao and Choe (1998), Ronen and Weaver (1998), Bollen and Whaley (1998), Ricker (1998), Goldstein and Kavajecz (2000), Jones and Lipson (2000)).

5
liquidity was not adversely affected and trading volume did not increase. For stocks whose
minimum tick size declined from 5 cents to 1 cent, the reduction had little impact on market
quality. Goldstein and Kavajecz (2000) investigate the impact of reducing the tick size from
eighths to sixteenths on the NYSE (on June 24, 1997) on the liquidity of the market. Their main
finding is that the quoted spreads and the corresponding depths, as well as depth in the limit
order book itself, declined post sixteenths.3 Finally, Jones and Lipson (2000) investigate the
impact of the tick size reduction to sixteenths on execution costs of a sample of institutional
trades. They conclude that smaller tick sizes may actually reduce market liquidity.
We use tick-by-tick (TAQ) data from the NYSE to investigate the impact of decimal
trading on the various facets of market liquidity. Our investigation period comprises October 2,
2000, to January 26, 2001 (the decimal period) and July, 2000 (the pre-decimal benchmark
period). The ending date of our analysis corresponds to the last trading date of the decimal
pilot program. Private communications with market participants confirm that significant
“learning” was taking place in the first few weeks of commencement of the decimal pilot as
traders freely experimented with the new system. We, therefore, choose to report results from
week 6 onwards (relative to the start of Phase I decimal pilot in August 28, 2000) to provide
enough time for market participants to have found an equilibrium trading pattern.
Our decimal sample consists of 87 common stocks listed in the NYSE and included in
the decimal pilot in any of the three phases before full conversion. To isolate the effects of
decimalization independent of market trends, we also construct a portfolio of control stocks
matched 1-1 with the decimal stocks in our sample. Essentially, at the time of selection, each
control stock was “similar” to its matched decimal stock on a number of dimensions with the
3In related work, Ball and Chordia (1998) show that the tick size of US stocks is large compared to the
“true” spreads for large, liquid stocks, and advocate a move to decimalization with a tick size of one cent.

6
important distinction that it was still trading in sixteenths over the decimal period. The details
of the selection of the control stocks are provided later.
Our main results for decimal stocks over the decimal period can be summarized as
follows.
Regional exchange competition parameters
��We find significant increases (of about 14%) in frequency of quote adjustment (or quote
flickering) and in autoquotes4 in decimal stocks among regional stock exchanges after
decimalization. The increase in quote adjustments and autoquotes remains significant
after controlling for factors other than decimalization through our sample of matched
control stocks.
��There are significant increases in time during which the regional exchanges possess
either the best bid and/or the best offer (BBO5) following decimalization in the decimal
stocks.
��About 29% of the BBO quote changes in decimal stocks occur at a penny and almost 80%
of the quote changes occur at a nickel or less. In comparison, about 75% of all (bid or
ask) quote changes in control stocks occur at 1/16ths and a further 19% of the quote
changes occur at 1/8ths. The NYSE also appears to be leading the way in the greatest
number of 1- through 5-cent quote changes (i.e., in the updating of the best bid or the
best ask or both) among all exchanges.
4 Autoquote is a bid ask quote generated automatically by computers in regional exchanges positioned just outside the prevailing highest price to buy and the lowest price to sell (otherwise known as the best bid and offer or BBO). The presence of autoquotes usually mean that the regional specialists are willing to be market participants for orders but not by paying as aggressive a price as the BBO. 5 The BBO is an important measure of an exchange’s dominance as a liquidity supplier and as a source of price discovery.

7
Liquidity related parameters
��Quoted spreads in the decimal stocks declined (compared to the non event period) an
average of 35% compared to about 9% in the control stocks. This decline in decimal
stocks remains significant after controlling for factors other than decimalization.
Specifically, we find that decimalization itself results in quoted spreads in decimal stocks
declining by an average of about 3.8 cents. Also, the most frequently quoted spread
among the decimal stocks was 1 cent.
��Effective spreads (measured as twice the absolute difference between the trade price and
the prevailing BBO midpoint) declined an average of 11% in the decimal stocks
compared to a 2% increase in effective spreads in control stocks. Decimalization itself
is responsible for a reduction of about 2.7 cents in effective spreads.
��Effective spreads also display most significant decline in relatively smaller trade sizes,
ranging from a decline of 28% in trade sizes of less than 500 shares, to a 20% decline in
trade sizes of 1,000-4,999 shares. Its decline for large size trades is comparatively
modest. For example, the decline in effective spreads for trade sizes of at least 10,000
shares is about 3.5%. In comparison, the control stocks either show a significantly
modest decrease or a significant increase in effective spreads in the corresponding trade
size categories. The effect of decimalization itself appears to have had no significant
impact on the reduction in effective spreads associated with 10,000-share (or greater)
trades.
��Bid and ask depths (trade sizes for which the corresponding quotes are guaranteed) in
decimal stocks declined an average of about 62% compared to an increase of about 19%

8
in control stocks.6 Decimalization itself is associated with an average decline in depth of
about 7,560 shares.
Transaction related parameters
��We find that that while both trades and trading volume have increased in relatively
smaller size trades (less than 1,000 shares) in decimal stocks following decimals, the
relatively larger size trades (greater than 1,000 shares) have declined significantly both
in frequency and in trading volume.
��We find no evidence of any significant changes in volatility in decimal stocks following
decimalization.
��We find evidence of significant increases in runs (or trends) in BBO quotes and
simultaneously fewer quote reversals in decimal stocks, compared to the control stocks.
These results have important policy implications as the debate on decimalization
continues. Foremost among them is the concern on available liquidity. Proponents of
decimalization argue that decimals allow for more efficient price discovery without adversely
affecting the supply of liquidity. Opponents, however, argue that decimals will result in less
liquid and high volatility markets. Our results provide a mixed verdict on the issue of liquidity
and volatility. Overall, our results suggest that we have moved to a new phase in security
transactions – one in which participants will have to learn new rules to play the game
effectively. Whether or not they do so, will determine, in large part, the success of
decimalization in keeping prices efficient and markets liquid. At the very least, information
6 Our spread and depth-related results are consistent with earlier work surrounding the conversion to sixteenths in 1997 (see, for example, Goldstein and Kavajecz (2000)).

9
about the available supply and demand schedule outside the BBO will be have to be made
available to market participants. There is evidence that the NYSE is already heading in that
direction.7 Other implications of our study are discussed in the conclusion.
The plan for the remainder of the paper is as follows. Section 2 discusses related
research. Section 3 provides a brief history of decimal pricing. Section 4 describes the data
methodology. Section 5 provides results related to bid/ask spreads. Section 6 provides
transactional results. Section 7 provides a discussion of some of the implications of our results.
The Appendix provides details of the decimal stocks in our sample and their corresponding
matched control stocks.
2. Related Research
Many stock exchanges have recently reduced their minimum ticks. And despite such
changes being studied extensively, both theoretically and empirically, its appropriateness
remains an open question. On the theoretical front, one stream of research has investigated the
issue of the optimal tick size and posits that the minimum tick results from market friction
arising from Bertrand competition among the liquidity providers (Anshuman and Kalay (1998)
Bernhardt and Hughson (1996), Kandel and Marx (1996)). Another stream models the idea that
minimum tick size coordinates negotiation (Brown, Laux and Schachter (1991) and Cordella and
Foucault (1996)). A third stream of theoretical literature investigates the relationship between
tick size and payment for order flow (Chordia and Subrahmanyam (1995) and Battalio and
Holden (1996)). A fourth group of researchers (see, for example, Hart (1993), Peake (1995),
7 For example, the NYSE, beginning March 19, 2001, has started disseminating “depth indications” on eight of its stocks. Its purpose is to show investors that there is a meaningful number of shares of a given stock available beyond the best price being bid and offered for the stock (WSJ, March 15, 2001, C1).

10
O’Connell (1997) and Ricker (1998)) argues that with smaller ticks, competition between
liquidity suppliers should reduce the bid/ask spread—thereby increasing liquidity and
benefiting liquidity demanders. Finally, a fifth group (Grossman and Miller (1988), Harris
(1994, 1997), and Seppi (1997)) makes the opposite argument that a finer tick size would lower
spreads but also lower the quoted depth (and, hence, market liquidity) due to the decline in the
marginal profitability of supplying liquidity. This may reduce the incentive of liquidity
suppliers to supply liquidity in such markets.
The current paper, however, appeals to the empirical research that investigates the
effects of actual tick size reduction in financial markets. These include the September 1992
reduction in minimum tick size for stocks priced under five dollars for AMEX stocks (Crack
(1994) and Ahn, Cao and Choe (1996)); the April 1996 reduction in tick size from eighths to a
nickel in the Toronto Stock Exchange (Bacidore (1997), Huson, Kim and Mehrotra (1997), Porter
and Weaver (1997) and Ahn, Cao and Choe (1998)); the May 1997 changeover of AMEX stocks
to sixteenths (Ronen and Weaver (1998)); the June 1997 changeover of NYSE stocks to sixteenths
(Bollen and Whaley (1998), Ricker (1998), Goldstein and Kavajecz (2000), and Jones and Lipson
(2000)). Additionally, Bessembinder (1997) examines Nasdaq stocks that change on an
individual basis to (or from) sixteenths. Overall, the focus of almost all of the empirical research
is to examine trades, the inside bid/ask quotes (or, the best bid and offer or BBO) and the
corresponding bid and offer sizes; and the effective spreads around tick-size reduction. Some
have also examined the impact of institutional trades on spreads. The overall conclusion of
these studies is that a reduction in tick sizes has caused spreads to decline and has made it
costlier for institutions to trade.

11
3. Brief History of Decimal Pricing
The move toward decimal pricing began in 1996 – significantly before the conversion to
sixteenths. At that point, a congressional subcommittee was formed to study the issue.
Hearings were held and legislation was proposed that would direct the SEC to require that
securities be traded in dollars and cents rather than in traditional fractions. During the 105th
Congress, Finance and Hazardous Materials Subcommittee Chairman Mike Oxley proposed
H.R. 1053, the Common Cents Stock Pricing Act of 1997. His bill required U.S. exchanges to
price stocks in dollars and cents, rather than in government set fractions. This set the tone for
the initiatives that followed. The National Association of Securities Dealers (NASD) has been a
strong proponent of the marketplace's shift to decimals. The NASD, in cooperation with the
Securities Industry Association (SIA), the SEC, and other equity and options markets have been
working to ensure a successful transition to decimals. Some of the benefits that decimalization
is expected to provide include savings for investors through narrower spreads and easily
understood numbers.
4. Data and Methodology
4.1 The Sample Stocks
The stocks in the decimal pilot were chosen based on several criteria developed by the
NYSE, along with a securities-industry committee. These criteria include stocks having varying
levels of daily trading activity, that trade on multiple exchanges, are part of an index, are
underlying issues for multiply listed options; and may have corporate action pending. To avoid
introducing confounding effects, we eliminate all preferred and convertible preferred stocks,
closed end funds, ADRs, stocks that may have merged, stocks with abnormally low average

12
daily trading volume over the study period, and stocks with no trading in at least one day over
the decimal and/or control periods. We also exclude all common stocks below $5 and above
$150, and those stocks in the decimal pilot that moved from Nasdaq to NYSE during the period
of the study. Finally, decimal stocks, which were delisted due to merger, or for other reasons,
during the study period, were also excluded. Our final sample comprises 87 NYSE-listed
common stocks selected for trading in decimals under the three phases of the decimal pilot.
These include 4 stocks from Phase I, 39 stocks from Phase IIA and 44 stocks from Phase IIB.8
Even though we report results corresponding to NYSE-listed stocks only, we repeated
the analysis for the eligible AMEX-listed stocks in the various phases of the decimal pilot, as
well. We do not report them here since they do not add any new insights.
We obtain tick-by-tick transaction and quote data for each stock in our sample over
October 2, 2000, and January 26, 2001, in the post-decimals phase, and over July 2000 as the non-
event benchmark period. It should be noted that while the overall period after decimalization
that is studied is from October to January, it is only the phase I and IIA stocks that entered the
sample on October 2 and remained till January 26, 2001. Phase IIB stocks entered the sample
only on December 11 and remained till January 26, 2001.
The quote data was extensively error filtered and all quotes with missing values, with
negative and zero spreads, and with quoted spreads greater than $2, were eliminated. This
removed less than 1% of the quotes.9 Transactions prices were also examined (and filtered) for
8 The main reason for the existence of Phase IIB was that all of the Phase IIA stocks were assigned to the same specialist firm and the NYSE wanted to involve other specialist firms before general conversion took place at the end of January 2001. 9 The comparison of trades and quotes also requires that data from CTA and CQS be merged by time.
For various technical reasons (see Blume and Goldstein (1997), Hasbrouck and Soesbee (1992)), not only can the time stamps be in error, but also the very sequencing of trades in the same stock can be wrong. We considered using the Blume and Goldstein (1997) formula to adjust our quote time stamps the same

13
potential errors. The appendix provides a breakdown of the specific decimal tickers included in
our study.
4.2 Selection of Control Stocks
Investigating the impact of decimalization on the pilot stocks after and before the event is
valid under the assumption that the market remains constant over the examination period. In the
presence of market trends, however, it is impossible to tell if an effect is due to decimalization or
due to market trends. One way to isolate the effect of decimalization, independent of market
trends, is to examine a matching sample of stocks, identical to the control stocks in every way,
except that they do not trade in decimals. We, therefore, compile a matching sample of NYSE-
listed control stocks for the decimal stocks in our sample, using the following exhaustive criteria.
Specifically, for each stock in the decimal sample, the selection criterion for a matching
stock in the control group is
��(option availability). Decimal stocks that have options got matching control stocks that also have options, and vice versa.
��(similar price). The price of each control stock had to be no more than 20% above
or below the price of its corresponding decimal stock. This limit was increased somewhat for lower priced stocks. For stocks trading under $3, the limit was expanded to 35%. In many cases, a control stock had a price within a dollar or two of its decimal partner.
��(similar traded volume). The average traded volume of each control stock was
no more than 20% above or below the average traded volume of its corresponding decimal stock. In practice this limit was set lower than 20% and if no satisfactory matches were found it was increased.
��(similar volatility). The volatility of the decimalized stocks generally ranged
from 20 - 80, with a few outliers. The control stocks were selected to have a
trading day. But the quote adjustment algorithm Blume and Goldstein develop is based upon 10-year old data contained in the NYSE TORQ database. Extensive improvements in trade recording systems have been implemented in the intervening years and there is currently a sense that adjusting quote time stamps is no longer appropriate.

14
volatility within 25% of that of their decimal partners. In a few cases this limit had to be widened to find a suitable match.
��(similar market capitalization). The market capitalization of each control stock
was selected to be within a 50% range of that of the corresponding decimal stock in most cases. This range had to be expanded in a few cases to find a match.
��The three-month relative strength to the S&P 500 Index, between a decimal stock
and its chosen control stock, should have been similar.
��Additionally, recent price performance was considered. A stock that had been rising strongly in recent months was not given a control stock whose price had been falling sharply and vice versa.
��Control stock selected from same industry as decimal stock, if possible.
��Each NYSE decimal stock was given a control stock that also traded on the
NYSE.
It should be noted, however, that for each phase, control stocks were selected shortly
before the date of decimalization. Due to normal stock market fluctuations, the prices, trading
volume and volatilities of stocks that were similar when the selection was made could have been
much less similar by the end of the study period. They also could have been different during the
benchmark period of July 2000. The appendix provides a breakdown of the control stocks
matched with the corresponding NYSE-listed decimal stock.
5. Decimalization and Bid and Ask Quotes
We present the results of our analysis based on the NYSE-listed decimal stocks in our
sample and the matched control stock sample, both before decimalization (over July, 2000) and
after decimalization (from October, 2, 2000 through January 26, 2001).
5.1. Daily Quote Frequency
From a theoretical standpoint, bid/ask quotes are updated when market conditions
change. These may be related to adverse selection, liquidity pressure or a combination of the

15
two. Suffice it to say that frequent updating of quotes would be indicative of a volatile market
overall where the search for an efficient price for that security is actively being pursued,
compared to a market with relatively infrequent quote adjustments. A market with frequently
changing quotes is also a trading venue where the “best” possible price for a trade execution
may be harder to determine and, hence, may be open to gaming and other strategic behavior by
professional investors for personal gain.
Table 1 presents the daily average quote frequency of the NYSE-listed decimal and
control stocks in our sample, both after (panel A) and before (panel B) decimalization, across the
five regional stock exchanges in addition to the NYSE and NASDAQ. While the non-event
period finds average daily quote adjustment frequencies that are statistically similar between
decimal and control stocks in almost all of the regional exchanges, the picture changes
significantly over the decimal period. Here we see significant increases in quote adjustment
frequencies in all five regional exchanges, both with respect to the control stocks and with
respect to the non-event period. Overall, table 1 shows that there was an increase of 14% in
quote adjustments in decimal stocks after decimalization relative to a decrease of 11% in quote
adjustments in control stocks over the same period.
To focus on the change in quote frequencies in decimal stocks due to the act of
decimalization itself, we compute the net difference in daily average quote frequencies by
subtracting the daily average (quote frequency) of each control stock from its matched decimal
stock in our sample. The average of these differences over each exchange and over each period
(pre decimal and post decimal) is then computed. The table reports this difference in the pre-
decimal average from the post-decimal average for each exchange. Overall, these numbers
confirm that the act of decimalization itself appears to have caused a significant increase in
quote frequency in all regional stock exchanges. The main markets like NYSE and NASDAQ,

16
however, do not display this tendency, where quote frequencies after decimalization stay about
the same as those before decimals. What these results imply towards the overall market
liquidity is unclear and is examined in greater detail in following sections.
An extreme case of quote adjustment is known as quote flickering where quotes changes
occur so rapidly that the eye cannot discern the changes. Not surprisingly, some traders are
uncomfortable in a market with quote flickering since it is extremely difficult to get a sense of
the true value of the stock at a given point in time. Our results (not reported) indicate that
quote flickering (as high as 4 per second in some stocks post decimals) is likely to be a
significant issue in a world of decimal trading.
5.2 Prevalence and distribution of the Best Bid and Offer (BBO) among Regional Stock Exchanges
In a competitive dealer market, multiple dealers post quotes simultaneously and there
exists at any point in time, a set of bid and ask quotes that represent the highest price to buy
and the lowest price to sell. This is known as the best bid and offer (BBO). In a continuous
auction market, such as the NYSE and AMEX, a specialist posts quotes in stocks, comprising of
a combination of own interest as well as the interest of the public limit orders competing
directly with the specialist. Such competition can also come from the regional stock exchanges,
posting quotes simultaneously in those stocks. In short, BBOs are generated by public limit
orders originating both in the primary market as well in the regional stock exchanges, and
dictate which exchange at any point in time has the best bid and offer quotes. The fraction of
time that any particular exchange has the BBO is an indication of its dominance in terms of a
supplying liquidity as well as price discovery – the two most important roles of a modern
financial exchange.
To examine the issue of BBO dominance, we compute the frequency of BBOs using the

17
quoted bids and asks and the corresponding bid and ask depths offered by the exchanges at
those prices. If two exchanges have the same bid, for example, but one has a larger quoted size
at the bid, it is awarded the BBO. If both have the same bid price and quoted size, then the BBO
is awarded to that exchange with the oldest bid quote. Note that this procedure strongly favors
the NYSE since by virtue of its dominant position the NYSE almost always has the maximum
size offered.
Table 2 presents the frequency of BBO observations and the corresponding percent of
total trading time that a BBO is in effect across the regional exchanges for decimal and control
stocks both during the decimal period and during the pre event period. While the percentage of
BBO times held by regional exchanges in decimal stocks increases significantly after
decimalization, the percentage of the BBO times held by most regionals in control stocks also
increases over the same period. Simultaneously, the percentage of BBO times held by NYSE
declines significantly in decimal stocks from 86% to 79% and in control stocks from 87% to 81%.
To isolate the effect of decimalization on BBO times in the regional exchanges, the net
difference in decimal stocks is calculated as the difference between the daily average frequency
of BBO observations of each decimal stock and its paired control stock. The average of these
differences over each exchange and over each (pre decimal and post decimal) period is then
computed. The table reports the difference in the pre-decimal average from the post-decimal
average. The results indicate that after controlling for other factors, decimalization appears to
have significantly increased the ability of most regionals to price-compete with the NYSE. An
important implication of this finding for academics is that research involving spreads, which
have traditionally considered only NYSE quotes as a representation of the market as a whole,
will henceforth need to consider regional and third-market quotes.
5.2 Frequency distribution of changes in the best bids and the best asks (BBOs)

18
In this section, we investigate the frequency of changes in the best bids and the best
offers (BBOs). The purpose is to see if all penny increments are being hit after decimalization or
are the BBO quote changes loading up only on certain penny increments. Specifically, we find
the number of times the best prevailing bid (for example) changes by 1 cent, 2 cents, and so on,
and simultaneously the number of times the best prevailing ask changes by the same
increments, for all the decimal and control stocks in our sample and over the decimal period.
Table 3 explores the frequency distribution of the sum of changes in both the best bids
and the best asks, in cents, and presents the corresponding cumulative percent, of all such
changes at the bid and at the ask. Note that while about 75% of quote changes in the control
stocks occur at 1/16ths and a further 18% at 1/8ths, about 29% of the changes in decimal stocks
occur at one penny, while about 80% of the changes occur at 5 cents or less. Clearly, even
though the cumulative changes in the bid and offer quotes between decimal and control stocks
at an 1/8th or less are almost identical, all penny-ticks in between appear to be hit by the
decimal stocks and, especially comforting to the supporters of decimal pricing is the fact that,
quote increments of 5 cents or less appear to be used actively by the market in the decimal
stocks. The latter may also indicate that 1/8 and 1/16 minimum tick sizes may have
represented barriers to price competition, which have been ameliorated with decimal pricing.
5.3 Distribution of bid and ask quotes and quote changes among regional exchanges
Given the significant usage of increments of 5 cents or less in the BBOs noted in Table 3,
a natural question to investigate is for possible clustering in BBO quotes ending in numbers 0-9.
A related question is to ask which regional exchanges are responsible for this narrowing of the
BBOs. Panel A of table 4 provides a frequency distribution of all bid and ask quotes ending in
numbers 0-9. We find evidence of clustering in that quotes ending in 4, 5, 9 and 0 appear to be
favored over quotes ending in the remaining numbers in all regional and national exchanges.

19
Panel B of table 4 examines 1-5 cents quote changes (at the best bid and at the best ask) by the
regional exchanges for NYSE-listed decimal stocks over the sample period. The reported
numbers, for each exchange, are computed as the sum of all ask changes and bid changes of 1
through 5 cents expressed as a percentage of all changes at a given cent. From Panel B, we see
that NYSE has by far the greatest number of 1-5 cent changes, while Nasdaq is competitive in all
five-cent categories. The Pacific comes in third in all except the 3-cent category. The NYSE and
NASDAQ also appear to have disproportionately high frequencies of 5-cent quote changes.
Overall, it appears that all the regional exchanges are actively contending for quote changes,
even though the NYSE is still leading the way.
5.4 Quoted and Effective bid/ask spreads
A traditional measure of market liquidity has been the quoted bid-ask spread that
captures the ex ante transactions cost (see O’Hara (1995), Huang and Stoll (1996) and
Bessembinder (1997)). Peterson and Fialkowski (1994) and others have, however, argued that
the quoted bid-ask spread is no longer an accurate measure of transaction costs when trades are
executed inside the prevailing quoted spread. They also show that when the posted (quoted)
spread widens, only about 10-22% of the increase in posted spreads appears in the effective
spread, where the effective bid-ask spread associated with a trade is defined as twice the
absolute difference between the transaction rice and the midpoint of the prevailing quoted bid-
ask spread (BBO). The effective spread, which measures the ex post transaction cost, is thus
favored by some.
We begin our investigation into spreads by examining, in Table 5A, the distribution of
all quoted spreads originating from the national and regional exchanges in terms of odd and
even ticks for decimal and control stocks, following decimalization. Even ticks are spreads of 2,
4,…cents, while odd ticks are covered by 1,3, 5,…..cent spreads. While decimal stocks show an

20
almost even split between even and odd ticks in every exchange, the control stocks, over the
same period, show a preponderance towards even ticks in Boston, Chicago and Philadelphia
and towards odd ticks in Cincinnati and Pacific. About 61% of all quotes from the NASDAQ
are at even-ticks while 45% of all quotes at the NYSE are at even-ticks.
Table 5B refines the examination of quoted spreads by investigating the distribution of
BBO spreads (in cents) for decimal and control stocks following decimalization. It is notable
that decimal stocks have a higher frequency of spreads at six cents or less compared to the
control stocks (49.4% versus 44.9%). Even for spreads up to 13 cents, decimal stocks dominate
the control stocks (75.3% versus 73.8%). Not surprisingly, the difference (in cumulative
frequencies) between decimal and control stocks disappears at spreads of 19 cents or higher.
Overall, there is evidence that 1-5 cent spreads are being quoted actively by the market makers.
Tables 6A and 6B provide information on the quoted and the effective bid/ask spreads
on the NYSE-listed decimal stocks and the corresponding control sample over the sample
period and over the non-event benchmark period of July 2000. Both the quoted and effective
bid/ask spreads are calculated on the basis of the best bid and offer (BBO) prices available at
the time of trade. Thus, autoquotes, which simply bracket an existing BBO, are automatically
eliminated from consideration. Such autoquotes, however, have other purposes and are
discussed later in section 5.6. We compute spreads of stock portfolios formed on the basis of the
average daily dollar volume of trade of stocks over the non-event benchmark period. Stocks in
portfolio 1 (5) comprise the smallest (largest) dollar volume stocks. The reported spreads in
Table 6A (and in Panel A of Table 6B) for each dollar volume portfolio are computed by
weighting, for a given stock within a given day, by the time each spread is outstanding, and
weighted across stocks, by their daily average non-event dollar trading volume.
Table 6A reveals that the decrease in quoted spreads for decimal stocks is significant
21
across all five dollar volume portfolios, and ranges from 21% for the portfolio 1 to 36% in
portfolio 4, while the (dollar-volume weighted) average over all portfolios is also about 35%.
The corresponding changes in the control stock portfolios range from a 0% increase to a 10%
decrease, with an overall average of 9% decrease. Thus, decimalization appears to have
significantly reduced quoted spreads, in comparison to control stocks.
To isolate the effect of decimalization on the quoted spreads of decimals stocks, the net
difference in quoted spreads in decimal stocks is calculated as the difference between the daily
average quoted spread of each decimal stock and its paired control stock in a particular size
rank. For each portfolio, the average of these differences over each (pre decimal and post
decimal) period is then computed. The table reports the difference in the post-decimal and pre-
decimal averages. These reveal that decimalization itself may have resulted in quoted spreads
declining by an average of about 3.8 cents.
Table 6B Panel A reports the effective spreads of portfolios, once again classified by their
average daily non event dollar volume. The reduction in effective spreads in decimal stocks
ranges from 4% to 15% among the five portfolios with the greatest reductions occurring in the
higher dollar volume portfolios. The overall (dollar volume weighted average) decrease is about
11%. In contrast, the control portfolios show significant increases in effective spreads in almost
all portfolio size categories with an overall (dollar volume weighted average) increase of about
1.5%. Once again, a net difference variable is reported to isolate the effect of decimalization on
the effective spreads of decimal stocks. The net difference for the small portfolios (1 and 2) is
statistically insignificant from zero while those for the remaining portfolios are negative and
statistically significant. Overall, decimalization itself appears to be responsible for a reduction
of about 2.7 cents in effective spreads.
To get a sense of the relationship between effective spreads and trade size, we further

22
compute the effective spreads corresponding to trades in each of five trade size categories: all
trades less than 500 shares (small trades), all trades between 500 and 999 shares (medium1
trades), all trades between 1,000 and 4,999 shares (medium2 trades), all trades between 5000 and
9999 shares (medium3 trades), and all trades of 10000 shares or greater (large trades). Panel B of
Table 6B presents the average effective spreads (in cents) in each trade size category, for decimal
and control stocks, before and after decimalization.
We see that while the spreads in each trade size category are statistically similar between
decimal and control stocks over the pre-decimal period, there are significant declines in
effective spreads in every trade size category in decimal stocks after decimalization.
Specifically, the spread decreases monotonically from 28% in small trades to about 3% in large
size trades. In contrast, within control stocks, effective spreads appear to have increased in the
larger trade size categories and show relatively insignificant declines in the two remaining
smaller trade size categories, compared to effective spreads associated with corresponding size
trades in decimal stocks. The net difference variable indicates that decimalization itself has
resulted in reduction of effective spreads ranging from 2.08 – 2.81 cents in all but the largest
trade size category. For large size trades, however, the net difference variable is negative but
not statistically significant at the 10% level, indicating no significant effect of decimalization on
effective spread reduction.
In summary, decimalization appears to have significantly reduced both quoted and
effective spreads. Our conclusion holds even after accounting for effects other than
decimalization, through the net difference variable, and are consistent with those reported in
Goldstein and Kavajecz (2000) and Jones and Lipson (2001) following the conversion to
sixteenths. Decimalization appears to have enabled relatively smaller size trades to obtain
better prices and execute deeper inside the quoted spreads, compared to larger size trades.

23
5.5 Changes in bid and ask depths
Following Harris (1990), it is now widely accepted that a complete characterization of
market liquidity encompasses both the bid/ask spreads and the corresponding bid and ask
depths. When liquidity is defined along these two dimensions, it is entirely likely that a
reduction in liquidity could occur through a reduction in the bid and/or ask depth even though
the bid/ask spread itself remains unchanged. Having examined spreads in the prior section,
we now turn to the depths to see if we could say anything conclusive about market liquidity
following decimalization.
Related to the magnitude of the quoted bid and ask depths themselves, it is reasonable
to expect that quoted depths will reduce, the closer a bid or offer is to the equilibrium price,
consistent with the shape of the supply-demand curves. Further, the likelihood of a quote
becoming stale increases as the spread narrows, so the option cost implicit in quotes will
increase correspondingly.10 Finally, the advantage of being at the front of the queue decreases
as the tick size decreases and the spread narrows.
Table 7 provides information on the bid and ask depths of the decimal and control
stocks both before and after decimalization. As in the case of spreads, we report depths based
on the five portfolios (1-5) formed on the basis of the average daily dollar volume of trade of the
sample stocks over the benchmark period. Consistent with the spread table, the reported
depths in Table 7 for each dollar volume portfolio are computed by averaging across stocks in a
10 Consider, for example, a stock trading at 20 - 20 1/8 where a trader has posted a limit order to sell at 20 1/8. If the quote then jumps to 20 1/4 - 20 3/8 while the limit order is left unchanged, one could buy the stale limit order at 20 1/8 and immediately resell it at 20 1/4 ("picking it off"). With decimal trading, if a stock is quoted at 20 - 20.01, a 20.01 sell limit order could be picked off with a much smaller upward spread movement. Thus, the likelihood of the option being excercised against the limit-order provider is greater with decimal trading, but the expected value of the payoff price is smaller. The net effect of these two counteracting forces is indeterminate. Yet this influence could discourage the placement of limit orders in a decimal environment.

24
portfolio, by their non-event daily average dollar trading volume.
We see that both the bid and ask depths decreased significantly during the decimal
period compared to the pre event period. Specifically, the decline in depths among the five
decimal stock portfolios ranges from 15% to 79%. The higher dollar volume stock portfolios
appear to experience a greater decline in depths than the less active lower dollar volume stock
portfolios. In contrast, the control stock portfolios, over the same period, show an overall
increase in depths (by about 19%). There is also no clear trend between depth change and size
portfolios. Once again, the net difference variable isolates the impact of decimalization on the
depths of decimal stocks following decimalization. From here, we see that decimalization has
lead to a reduction in depth of about 7,560 shares.
In summary, after controlling for market trends (other than decimalization), there
appears to be a significant decline in bid and ask depths at the BBO. Goldstein and Kavajecz
(2000), in comparison, report an average quote depth decline of about 48% following conversion
to sixteenths. While a decline in quoted and effective spreads indicates an increase in market
liquidity, a simultaneous decrease in the corresponding bid and ask depths (i.e., the
corresponding order sizes that these quotes are valid for) implies a drop in liquidity. The
overall effect is therefore uncertain, although the observation that trading volume in upstairs
markets and in automated equity-matching systems like POSIT has increased significantly since
decimalization would suggest that institutional trading costs, and the cost of executing large
size trades through conventional channels, have, in fact, increased.
5.6 Autoquoting behavior of regional exchanges
In this section, we examine the dynamic behavior of quotes originating from the NYSE
and the regional stock exchanges between decimal and control stocks, before and after
decimalization. The issue of dynamic quote behavior itself has been addressed by various

25
researchers in the context of increased fragmentation of U.S. equity orders and in the context of
price discovery (see, for example, Garbade and Silber (1979), Shapiro (1993) and Hasbrouck
(1995)). The NYSE and the regional exchanges are electronically linked and all trades and
quotes are disseminated by a central transmission authority (the Consolidated Tape Association
(CTA)). Although the regional exchanges sometimes establish the BBO, frequently they will
choose to extract themselves from active quote competition in listed stocks by programming a
computer to intercept all NYSE/AMEX quotes and immediately generate a new quote of their
own by adding a delta to the ask and subtracting a delta from the bid, with 100 shares bid and
100 shares offered (the bid and ask depths). The mechanism(s) by which the regional quotes
default to the BBOs, widened by a small arbitrary amount, are known as “autoquotes”. Thus,
an autoquote is effectively a non-quote whereby regional specialists signal that they are willing
to supply liquidity but not at the best prices. Trades occur on the regional exchanges during
periods of autoquoting, but those trades must match or better the existing BBO. Our algorithm
identifies an autoquote as any regional or third-market quote that brackets the existing NYSE or
AMEX quote.
With the advent of decimalization it is reasonable to anticipate an increase in posting
quotes off the BBO by serious liquidity providers. With the possible elimination of the barrier
to price competition that was provided by a minimum tick size of sixteenths, it follows that
liquidity providers who wish to earn more than a 1-2 cent spread will be forced to post quotes
off the BBO following decimalization. With the thin book that naturally results from such tight
spreads, significant buy/sell programs could easily march up/down the book and hit limit
orders away from the minimum tick size. Thus, some regional exchange specialists are
increasingly autoquoting to supply liquidity with sophisticated algorithms to determine quote
prices and sizes. These autoquotes are, however, not for 100 shares bid and 100 shares offered

26
but for quantities greater than 100 shares on either (or both) side. We attempt to capture this
behavior by reporting autoquotes over both 100-share depths (the regular autoquotes) and
greater than 100-share depths (the smart autoquotes).
Table 8 reports the percentage of time the NYSE-listed decimal and control stocks are
(regular and smart) autoquoted before and after decimalization in the various regional
exchanges. The reported numbers are a simple percentage of all autoquotes (in each regular or
smart autoquote category) from a given regional over all quotes from the regionals and the
NYSE. While tests reveal that the percentage of regular autoquoting is statistically similar
between decimal and control stocks in the pre event period, post decimalization finds that
regular autoquoting has increased significantly in decimal stocks compared to the control stocks
in almost all the regional exchanges. Cincinnati, Pacific and Chicago have the highest increases
of autoquoting in decimal stocks, while there is decline in autoquoting in the control stocks in
two of these exchanges.
To isolate the effect of decimalization itself on autoquoting behavior, we provide the net
difference in (regular or smart) autoquotes, calculated as the difference in daily average
autoquote frequency between each decimal stock and its matched control stock. The averaging
is now done over each exchange and over each (pre decimal and post decimal) period. The
table reports the difference in post and pre-decimal average. While Boston and Chicago show
evidence of significant increase in autoquotes as a result of decimalization, for the rest,
including NYSE and NASDAQ, the increase is statistically insignificant at the 10% level. From
Panel B, the net increase in smart autoquotes as a result of decimalization is positive and
statistically significant in all but the Pacific and Philadelphia stock exchanges.
Overall, it appears that (with few exceptions), the regional exchanges are ready to
participate in quote competition in the decimal stocks following decimalization, as evidenced

27
by overall net increases in both regular and smart autogquoting.
6. Decimalization and Transaction-related Variables
6.1 Trades and trading volume
An issue of interest to regulators and practitioners is the relative behavior of institutions
compared to individual investors. It is generally perceived that institutions are “smart” or
informed traders while individuals are uninformed investors. Evidence that institutional
investors are more likely to use larger trade sizes than individuals, appears in Chakravarty
(2001). Support that large trade sizes are more likely to be from informed traders than small
trade sizes appears in Easley and O’Hara (1987). To investigate the relative activity of large
(informed) trades versus small (uninformed) trades around decimalization, we investigate the
frequency of trades and trading volume in the five trade size categories described earlier: small,
medium1, medium2, medium3 and large.
Table 9 reports results both for decimal and control stocks over the benchmark period
and the decimal pilot period. Panel A presents the average daily trading volume results
classified by trade size; panel B provides the corresponding daily average trade frequency
statistics.
From table 9, we see an increase in average daily trading volume in almost all trade size
categories in decimal stocks following decimalization. Interestingly, the control stocks show an
even greater increase in every trade size category. Average daily trades show a decline in three
of the five categories in the decimal stocks while the control stocks show a significant increase in
each trade size category following decimalization.
To isolate the effects of decimalization, we report the net difference in trade volume (or
28
trade frequency) in decimal stocks is calculated as the difference between the daily average
volume (or trade frequency) of each decimal stock and its paired control stock in a particular
trade size category. The average of these differences over each category and over each (pre
decimal and post decimal) period is then computed. The table reports the difference in the
post-decimal average and the pre-decimal average. These numbers indicate that while both
trades and trading volume have increased in relatively lower size trades (less than 1,000 shares)
in decimal stocks following decimals, the relatively larger size trades (greater than 1,000 shares)
have declined significantly both in frequency and in trading volume. Decimalization appears to
have dampened the market for large size trades.
6.2 Volatility
In this section we examine volatility, before and after decimalization, and between
decimal and control stocks. Our investigation is motivated by a desire to investigate if market
risk in decimal stocks has increased significantly (relative to the control stocks) following
decimalization. If it is the case that the aggregate liquidity in the limit order book has shrunk
post-decimals, we would expect a greater price impact (or higher volatility) for a trade of a
given size.
To study volatility, we use the same five (quintile) portfolios of decimal and control
stocks separately, based on the average daily dollar trading volume over the non-event period
(and discussed earlier). We form a minute-by-minute return series for the stocks within these
portfolios, where each return is weighted by its corresponding share volume. Portfolio returns
are then formed by weighting each stock in a portfolio by its pre event average daily dollar
volume. Overnight returns are discarded. Volatility for portfolio returns is calculated daily and
the average volatility across days is reported.
Table 10 does not reveal a clear pattern of volatility increases or decreases across the

29
dollar volume portfolios. There is, however, evidence that volatility appears to have gone up in
the smallest (7.9%) and largest quintile (47%) portfolios of decimal stocks following
decimalization. In comparison, the corresponding control stock portfolios show a decrease of
about 13% and an increase of about 62%, respectively. The remaining portfolios indicate both
increases and decreases for both decimal and control stocks.
As always, the net difference variable attempts to isolate the effects of decimalization on
decimal stocks. The results indicate that in four of the five portfolios there is a decline in
volatility in decimal stocks following decimalization although none are significant at the 10%
level.
In summary, there is no evidence of any significant pattern of volatility changes
following decimalization.
6.3 Runs and Reversals in Quote Adjustments
There is concern amongst practitioners in Wall Street that decimal pricing may lead to
more runs in price and less price reversals, thereby exposing the limit orders of individual
investors to greater stale price risks, which may, in turn, leave them at the mercy of being
picked off by professional investors. Thus, an investor could easily step in front (by a penny) of
a standing limit order in a rising market or sell into a standing limit order in a falling market
(see also footnote 10). In either situation, the liquidity supplier would be faced with losses in
her position. If this situation leads some limit order traders to avoid submitting such orders, the
overall liquidity and depth of the markets are in jeopardy. Brown and Holden (1999) model
“mispricing” risk of limit orders and show how market adjusted (or smart) limit orders can
mitigate this risk.
To examine the issue of price runs versus reversals, we define a simple metric to
measure such phenomena. Specifically, we examine the prevailing BBO quote midpoint

30
sequence and define an increase in quote midpoint by +1 and a decrease by –1. A simple run of
length 1 is defined as (+1+1) or a (-1-1). Similarly, a run of length 2 is defined as (+1+1+1) or (-1-
1-1), and so on. A reversal is defined very simply as triples of BBO quote changes, where the
direction of the quote midpoint is reversed, as in (+1-1+1) or (-1+1-1). While relatively crude, it
provides us with a framework to study the issue.11
Table 11 Panel A documents quote reversals, both in terms of the frequency of quote
reversals and the corresponding percentage of all non-zero quote changes, among decimal and
control stocks, both in the pre event period and during the decimal pilot. While the frequency
of quote reversals between the decimal and control stock sample over the pre event period is
statistically similar, about 25% (34%) of all non-zero quote changes were reversals in the
decimal (control) stock sample. This difference is statistically distinct at reasonable levels of
significance. Thus, quotes appear to be reversed less frequently in decimal stocks following
decimalization.
Panel B provides the frequency (and the corresponding cumulative percentage) of runs
in quote adjustments between decimal and control stocks before and after decimalization.
While the pre-decimal run length frequency at run lengths up to 25 are statistically similar
between the decimal and control stocks, following decimalization we find statistically
significantly greater run lengths among decimal stocks over the control stock sample for almost
all reasonable run lengths reported in the table.
In summary, our results underscore the significant increase in quote trends in the
market following decimalization and provide support to the argument that decimalization may
have increased stale price risk of the liquidity supplying limit order traders, who stand a greater
11 For robustness, we replicated our work using changes in transaction prices in place of quote midpoint changes and obtained qualitatively similar results.

31
chance of being picked off for a loss. The broader implications of our finding here are discussed
in the following section.
7. Discussion of Results
Using tick-by-tick transaction and quote data over the pre-decimal period of July 2000,
and the decimal period of October 2, 2000, through January 26, 2001, we study the impact of
decimalization on NYSE and AMEX-listed common stocks. To ensure that our results are not
influenced by market trends over the decimal period, we carefully construct a sample of control
stocks matched 1-1 with each decimal stock in our sample. We study the effects of
decimalization, both with respect to the non-event period and with regard to the control sample
of stocks.
Even though it is tempting to think of decimalization as just another decrease in
minimum tick size, it is, in reality, much more than just that. The mantra is that the minimum
tick must make it an economic cost for someone to step up in front of another liquidity supplier.
While this was true even up to the conversion to sixteenths, it may not be true anymore where it
takes just one penny to step ahead of a standing limit order. And if it is almost costless to step
ahead, as one fund manager puts it, “……mutual funds may stop using limit orders and simply
pay fees to brokers to buy and sell at the prevailing market price. Most stocks already are
traded that way on the nation's exchanges.” In this backdrop, we study the impact of
decimalization on market liquidity parameters, price competition (through quotes) of regional
exchanges vis-à-vis the NYSE and/or AMEX, and transaction related parameters.
We find mixed evidence on market liquidity following decimalization. Specifically,
while both the quoted and effective bid/ask spreads show significant decline, the

32
corresponding bid and ask depths also display a significant decline. Thus, while better prices
now exist to buy and sell, the quantities that can be purchased or sold at those improved prices
have also declined significantly. Our finding of significantly smaller spreads post
decimalization bodes well for retail traders trading smaller size trades. Anecdotal evidence,
however, suggests that institutional investors are, in fact, experiencing significantly higher costs
to execute block trades (in decimal stocks) following decimalization and automated trading
systems like POSIT, which let users confidentially find the natural buyer or seller of a trade
during the market day, has experienced a tremendous increase in trading volume in recent
months.12
We find evidence of significantly increased competition coming from the regional
exchanges in terms of bid/ask quote adjustment frequencies, BBO times, and percentage of
autoquotes. Decimalization may have increased the ability of the regionals and Nasdaq third-
market dealers to aggressively price-compete with the main listing exchanges like the NYSE.
Interestingly, however, the NYSE appears to be still leading the way in terms of 1-5 cent
changes in bids and offers among all exchanges.
Finally, using a simple metric to capture runs and reversals in bid/ask quotes, we find
evidence of significantly greater frequency of trending quotes (and significantly lower quote
reversals) in decimal stocks. One implication of the latter result is the possibility of the
existence of greater stale price or mispricing risk in public limit orders, which could then be
picked off by relatively professional investors, thereby inflicting losses on these liquidity
suppliers. If this is pervasive, there is concern that placement of limit orders (and, by extension,
the supply of liquidity) may begin to dry up in the market. In fact, Bacidore et al. (2001) report
12 The Toronto Stock Exchange also displayed a similar drop off in market liquidity and a resulting increase in trading costs following their conversion to decimals in 1996.

33
that, following decimalization, traders appear to have decrease their use (and size) of traditional
limit orders and are canceling orders more frequently.
One way for investors to protect themselves from being “penny-jumped” is to place
smart limit orders, which could be adjusted automatically to reflect changing market conditions
by a computer algorithm. Brown and Holden (1998) provide a comparative analysis of liquidity
supply through market and quote adjusted limit orders to minimize mispricing risk.
Fortunately, there is evidence that such mechanisms may already be in place. Recently, a
brokerage subsidiary of CS First Boston began offering its clients the opportunity to trade with
limit orders that are adjusted automatically by the brokerage to reflect changing market
conditions. It is likely that more such opportunities will be available to investors in the near
future.

34
References
Ahn, H., Cao, C.Q., and H. Choe, 1996, Tick size, spread and volume, Journal of Financial Intermediation, 5, 2-22.
Ahn, H., Cao, C.Q., and H. Choe, 1998, Decimalization and competition among stock markets:
evidence from the Toronto Stock Exchange cross-listed securities, Journal of Financial Markets, 1, 51-87.
Anshuman, V., and A. Kalay, 1998, Market making rents under discrete prices, Review of
Financial Studies, 11, 81-109. Bacidore, J.M., 1997, The Impact of Decimalization on Market Quality: An Empirical
Investigation of the Toronto Stock Exchange, Journal of Financial Intermediation, 6, 92-120. Bacidore, J.M., R. H. Battalio, and R.H. Jennings, 2001, Order submission strategies, liquidity
supply, and trading in pennies on the New York Stock Exchange, NYSE working paper. Ball, C., and T. Chordia, 1998, True spreads and equilibrium prices, working paper, Vanderbilt
University. Battalio, R., and C. Holden, 2001, A simple model of payment for order flow, internalization,
and total trading cost, Journal of Financial Markets, 4, 33-71. Bernhardt, D., and E. Hughson, 1996, Discrete pricing and the design of dealership markets,
Journal of Economic Theory, 71, 148-182. Bessembinder, H., 1997, The degree of price resolution and equity trading costs, Journal of
Financial Economics, 45, 9-34. Blume, M.E., and M.A. Goldstein, 1997, Quotes, Order Flow, and Price Discovery, Journal of
Finance, 52, 221-244. Bollen, N. P. B., and R.E. Whaley, 1998, Are “teenies” better? Journal of Portfolio Management, 25,
10-24. Brown, S., P. Laux, and B., Schachter, 1991, On the existence of an optimal tick size, Review of
Futures Markets, 10, 50-72. Brown, D.P., and C. Holden, 1998, The design of limit orders under a hybrid mechanism with
endogenous depth, working paper, Indiana University. Chakravarty, S., 2001, Stealth trading: Which traders’ trades move stock prices? Forthcoming
Journal of Financial Economics. Chordia, T., and A. Subrahmanyam, 1995. Market making, the tick size, and payment-for-order

35
flow: theory and evidence, Journal of Business 68, 543-575. Cordella, T., and T. Foucault, 1996, Minimum price variation, time priority and quote dynamics,
working paper, Universitat Pompeu Fabra. Crack, T. F., 1994, Tinkering with ticks: choosing minimum price variation for U.S. equity
markets, working paper, MIT. Easley, D., and M. O’Hara, 1987, Price, trade size and information in securities’ markets, Journal
of Financial Economics, 19, 69-90. Garbade, K.D., and W. L. Silber, 1979, Dominant and satellite markets: A study of dually-
traded securities, Review of Economics and Statistics, 61, 455-460. Glosten, L.R., and L.E. Harris, 1988, Estimating the components of the bid ask spread, Journal of
Financial Economics, 21, 123-142. Garfinkel, J.A., and M. Nimalendran, 1995, Market structure and trader anonymity: an analysis
of insider trading, working paper, University of Florida, Gainesville. Goldstein, M.A., K.A. Kavajecz, 2000, Eights, sixteenths and market depth: changes in tick size
and liquidity provision on the NYSE, Journal of Financial Economics, 56, 125-149. Grossman, S.J., M.H. Miller, 1988, Liquidity and market structure, Journal of Finance, 43, 617-633. Harris, L.E., 1990, Liquidity, trading rules, and electronic trading systems, Monograph Series in
Finance and Economics, New York University. Harris, L. E., 1994, Minimum price variations, discrete bid ask spreads, and quotation sizes,
Review of Financial Studies, 7, 149-178. Harris, L. E., 1997, Decimalization: a review of the arguments and evidence, working paper,
University of Southern California. Hart, M., 1993, Decimal stock pricing: dragging the securities industry into the twenty-first
century, Loyola of Los Angeles Law Review, 26, 883-890. Hasbrouck, J., and D. Sosebee, 1992, Orders, trades, reports and quotes at the New York Stock
Exchange, working paper, New York Stock Exchange. Hasbrouck, J., 1995, One security, many markets: determining the contributions to price
discovery, Journal of Finance, 50, 1175-1199. Huang, R.D., and H.R. Stoll, 1996, Dealer versus auction markets: a paired comparison of
execution costs on NASDAQ and the NYSE, Journal of Financial Economics, 41, 313-357. Huson, M., Kim, Y., and V. Mehrotra, 1997, Decimal quotes, market quality, and competition

36
for order flow: evidence from the Toronto Stock Exchange, working paper, University of Alberta.
Jones, C. M., and M.L. Lipson, 2000, Sixteenths: direct evidence on institutional execution costs,
forthcoming Journal of Financial Economics, Kandel, E., and L. Marx, 1996, Nasdaq market structure and spread patterns, working paper,
University of Rochester. Lee, C. M. C., and M.A. Ready, 1991, Inferring trade direction from intraday data, Journal of
Finance, 46, 733-746. Madhavan, A., M. Richardson and M. Roomans, 1997, Why do security prices fluctuate? A
transaction-level analysis of NYSE stocks, Review of Financial Studies, 10, 1035-1064. Madhavan, A., and S. Smidt, 1991, A Bayesian model of intraday specialist pricing, Journal of
Financial Economics, 30, 99-134. O’Connell, V., 1997, Conversion to decimal system in stocks could prove a boon to small
investors. Wall Street Journal, June 6, C1. O’Hara, M., 1995, Market Microstructure Theory, Blackwell Publishers. Peake, J.W., 1995, Brother can you spare a dime: let’s decimalize U.S. equity markets In:
Schwartz, R.A. (Ed.), Global Equity Markets: Technological, Competitive and Regulatory Challenges. Irwin Professional, Chicago.
Peterson, M. and D. Fialkowski, 1994, Posted versus effective spreads, Journal of Financial
Economics, 35, 269-292. Porter, D., and D. Weaver, 1997, Decimalization and market quality, Financial Management, 26, 5-
26. Ricker, J.P., 1998, Breaking the eighth: sixteenths on the New York Stock Exchange, working
paper. Ronen, T., and D.G. Weaver, 1998, Teenies’ anyone: the case of the American Stock Exchange,
working paper, Rutgers University. Seppi, D.J., 1997, Liquidity provision with limit orders and a strategic specialist, Review of
Financial Studies, 10, 103-150. Shapiro, J., 1993, Recent competitive developments in U.S. equity markets, NYSE working
paper, 93-02.

37
Table 1. Daily Average Quote Updating Frequency of NYSE-listed Decimal Stocks Across Regional Exchanges. This table presents the daily average quote frequency in each regional exchange for selected NYSE-listed decimal stocks and the corresponding matched sample of control stocks, before decimalization (July, 2000) and after decimalization (between October 22, 2000 and January 26, 2001). The reported numbers, for a given exchange, are weighted averages of daily averages (across stocks), where the weights are the average daily dollar trading volume of stocks over the non-event benchmark period of July 2000. The net difference in daily average quote frequency in decimal stocks is calculated as the difference between the daily average (quote frequency) of each decimal stock and its paired control stock. The average of these differences over each exchange and over each period is then computed. The table reports the difference in the post-decimal average and the pre-decimal average. T-tests (of equality of means) are performed to see if the net differences in decimal stocks are statistically distinct from zero.
Pre-decimal Period (July, 2000)
Post-decimal Period (October 2, 2000 – January 26,
2001)
% Change Decimal Stocks
(post – pre)
% Change Control Stocks
(post – pre)
Net Difference in
Quoted Spreads in Decimal Stocks
(post – pre ) Exchanges Decimal Stocks Control Stocks Decimal Stocks Control Stocks
Boston 374 346 541 285 44.7 -17.6 175.9*** Chicago 287 298 701 286 144.3 -4.0 151.1*** NYSE 1,769 1,511 1,515 1,809 -14.4 19.7 -13.6 Pacific 394 462 705 350 78.9 -24.2 119.5*** Nasdaq 1,659 1,682 1,201 1,033 -27.6 -38.6 52.4* Philadelphia 468 418 795 416 69.9 -0.5 127.0*** Cincinnati 273 401 495 380 81.3 -5.2 119.0** Average 751 735 854 654 13.7 -11.0 *** p-value ≤ 0.01, ** 0.01 < p-value ≤ 0.05, * 0.05 < p-value ≤ 0.10

38
Table 2. Time of Existence of the Best Bid and Offer Prices (BBO) by Regional Exchanges for NYSE-listed Decimal Stocks
This table presents the frequency and the corresponding percent of total trading time that a given exchange held the best bid and the times that the same exchange held the best offer. The sample comprises of selected NYSE-listed stocks in the decimal pilot and a matched sample of control stocks. The examination period is between October 2, 2000, and January 26, 2001 (decimal period). Results are also provided for the same stocks over July 2000, the pre-decimal benchmark period. The net difference in decimal stocks is calculated as the difference between the daily average (frequency of BBO observations) of each decimal stock and its paired control stock. The average of these differences over each exchange and over each (pre decimal and post decimal) period is then computed. The table reports the difference in the post-decimal average and the pre-decimal average. T-tests (of equality of means) are performed to see if the net differences in decimal stocks are statistically distinct from zero.
Pre-decimal Period (July, 2000)
Post-decimal Period (October 2, 2000 --- January 26, 2001)
%change in Number of BBO Obs
(post – pre)
%change in Number of BBO Obs
(post – pre)
Net Difference in the
Number of BBO Obs in Decimal Stocks
(post – pre) Exchange Number
of BBO Obs
% of Total Seconds
Number of BBO
Obs
% of Total Seconds
Number of BBO
Obs
% of Total Seconds
Number of BBO
Obs
% of Total Seconds
Decimal Stocks Control Stocks Decimal Stocks Control Stocks Decimal Stocks
Control Stocks
Boston 1,400 1.69 1,371 1.31 3,154 3.02 3,811 1.63 125.29 177.97 37.8*** Chicago 2,047 2.63 2,149 2.44 6,052 3.40 6,159 2.90 195.65 186.60 -19.9*** NYSE 3,472 86.24 3,478 87.18 9,256 79.23 9,254 81.27 166.59 166.07 19.5* Pacific 1,762 2.69 1,416 2.66 4,797 1.67 4,061 2.01 172.25 186.79 26.3*** Nasdaq 3,195 5.62 3,201 4.27 8,762 9.40 8,103 7.53 174.24 153.14 71.6***
Philadelphia 1,628 0.55 1,294 0.97 3,548 0.36 4,098 2.45 117.94 216.69 -103.4*** Cincinnati 834 0.58 966 1.18 2,890 2.92 2,675 2.21 246.52 176.92 86.8*** *** p-value ≤ 0.01, ** 0.01 < p-value ≤ 0.05, * 0.05 < p-value ≤ 0.10

39
Table 3. Distribution of change in the Best Bid and Offer (BBO) Following Decimalization
The table considers the sum of changes (in cents) in both the best bid and the best ask for all NYSE-listed decimal stocks in our sample and the corresponding matched sample of NYSE-listed control stocks. The sample period is between October 2, 2000, and January 26, 2001.
Decimal Stocks Control Stocks
Cents Sum of Cum % Sum of Cum %
Changes (in cents)
Changes (in cents)
1 422,585 29.2% 245 0.0% 2 243,335 46.0% 0 0.0% 3 79,926 51.5% 11 0.0% 4 193,230 64.8% 154 0.0% 5 216,478 79.8% 0 0.0% 6 30,598 81.9% 722,854 75.3% 7 35,232 84.3% 10 75.3% 8 40,341 87.1% 0 75.3% 9 29,243 89.1% 6 75.3% 10 36,849 91.6% 101 75.3% 11 15,304 92.7% 0 75.3% 12 5,665 93.1% 175,096 93.5% 13 14,587 94.1% 0 93.5% 14 15,461 95.2% 5 93.5% 15 8,405 95.7% 1 93.5% 16 5,432 96.1% 0 93.5% 17 4,782 96.5% 28 93.5% 18 3,697 96.7% 33,110 97.0% 19 10,394 97.4% 0 97.0% 20 6,123 97.8% 1 97.0% 21 1,583 98.0% 0 97.0% 22 2,345 98.1% 0 97.0% 23 2,854 98.3% 45 97.0% 24 1,343 98.4% 0 97.0% 25 6,777 98.9% 17,297 98.8% 26 1,033 98.9% 1 98.8% 27 1,040 99.0% 0 98.8% 28 869 99.1% 0 98.8% 29 1,673 99.2% 3 98.8% 30 1,281 99.3% 0 98.8% 31 275 99.3% 3,884 99.2% 32 503 99.3% 0 99.2% 33 774 99.4% 0 99.2% 34 746 99.4% 0 99.2% 35 597 99.5% 11 99.2% 36 351 99.5% 0 99.2% 37 201 99.5% 3,182 99.5%

40
Table 4. Distribution of Bid and Ask Quotes and Quote Changes of NYSE-listed Decimal Stocks by Regional Exchanges Panel A reports the sum of all BBO quotes ending in 0-9 and expressed as a percentage of all changes across a given exchange. Panel B reports the frequency of the sum of 1-5 cent quote changes at the best bid and at the best ask. The reported numbers, for a given cent and a given exchange, are expressed as a percentage of all changes at that cent across all exchanges. The sample comprises of selected NYSE-listed common stocks in the Decimal Pilot between October 2, 2000 and January 26, 2001. Panel A: Distribution of the sum of bid and ask quotes ending in 0 – 9.
Cents 0 1 2 3 4 5 6 7 8 9 Exchange
Boston 19.60% 7.69% 8.02% 4.54% 13.36% 13.77% 4.22% 7.38% 4.86% 16.56% Chicago 19.61% 5.66% 5.50% 7.36% 13.02% 12.62% 4.39% 7.32% 6.77% 17.75% NYSE 16.41% 6.92% 6.81% 7.18% 11.82% 12.79% 6.51% 7.38% 8.28% 15.92% Pacific 13.47% 8.50% 7.93% 10.78% 9.64% 11.73% 8.10% 7.97% 12.36% 9.51% Nasdaq 15.95% 6.74% 6.82% 8.23% 11.37% 13.43% 6.45% 7.52% 7.94% 15.55%
Philadelphia 13.16% 8.37% 8.91% 7.66% 11.72% 13.47% 8.16% 9.14% 8.97% 10.44% Cincinnati 14.42% 7.38% 7.62% 9.68% 10.85% 13.98% 7.92% 7.97% 7.87% 12.31% Panel B: Distribution of the sum of bid and ask quote changes of 1 – 5 cents.
Cents 1 2 3 4 5
Exchange
Boston
1.0% 1.4% 1.5% 1.3% 1.0%
Chicago 2.9% 2.7% 2.3% 2.1% 1.3%
NYSE 77.5% 81.3% 82.8% 74.3% 58.9%
Pacific 8.9% 4.6% 1.6% 8.7% 7.1%
Nasdaq 7.1% 5.2% 7.9% 10.2% 25.5%
Philadelphia 1.0% 1.3% 1.2% 0.7% 1.2%
Cincinnati 1.7% 3.4% 2.6% 2.6% 4.8%

41
Table 5A. Distribution of Odd and Even Tick Bid/Ask Spreads among Regional Exchanges The sample comprises of selected NYSE-listed common stocks included in the Decimal Pilot, and their corresponding NYSE-listed matched control stocks over the decimal period from October 2, 2000, to January 26, 2001. The quoted bid/ask spreads are denominated in cents and are computed from all (not just the BBOs) bid and ask quotes originating from the various exchanges. Only quoted spreads of up to a dollar are considered for this table. Well over 95% of all quoted spreads are within a dollar.
Decimal Stocks Control Stocks
Exchanges ticks Frequency Cum % Frequency Cum %
Boston Even-ticks 472,112 49.5 324,296 70.2
Odd-ticks 481,233 100.0 137,829 100.0
Chicago Even-ticks 590,561 48.9 367,176 70.8
Odd-ticks 615,995 100.0 151,770 100.0
NYSE Even-ticks 1,275,476 47.0 1,277,079 45.1
Odd-ticks 1,438,252 100.0 1,554,342 100.0
Pacific Even-ticks 400,038 49.0 169,830 41.4
Odd-ticks 416,889 100.0 240,229 100.0
Nasdaq Even-ticks 870,335 48.3 925,116 61.0
Odd-ticks 932,406 100.0 592,196 100.0
Philadelphia Even-ticks 496,187 49.4 403,544 64.4
Odd-ticks 508,880 100.0 222,806 100.0
Cincinnati Even-ticks 205,887 49.8 120,012 42.7
Odd-ticks 207,904 100.0 161,228 100.0

42
Table 5B. Distribution of BBO Quoted Spreads of NYSE-listed Decimal and Control Stocks
The sample comprises of selected NYSE-listed common stocks included in the Decimal Pilot, and their corresponding NYSE-listed control stocks over the decimal period from October 2, 2000, to January 26, 2001. The quoted bid/ask spreads are denominated in cents and are computed from the best bid and ask prices (BBO) in the various exchanges. Only quoted spreads of up to a dollar are considered for this table. Well over 99.9% of all quoted BBO spreads are within a dollar.
Quoted
Spread Decimal Stocks Control Stocks
Cents Frequency Cum % Frequency Cum %
1 436,447 12.4 0 0.0
2 325,837 21.6 65 0.0
3 245,423 28.5 13 0.0
4 232,206 35.1 0 0.0 5 286,320 43.2 0 0.0 6 218,827 49.4 1516228 44.9
7 177,881 54.4 0 44.9
8 136,189 58.3 110 44.9
9 135,581 62.1 2 44.9
10 199,872 67.8 0 44.9 11 110,330 70.9 0 44.9 12 80,673 73.2 0 44.9 13 74,228 75.3 974558 73.8
14 74,053 77.4 115 73.8
15 111,016 80.5 0 73.8
16 58,451 82.2 10 73.8
17 42,891 83.4 0 73.8 18 42,377 84.6 0 73.8 19 48,171 86.0 428645 86.5
20 82,601 88.3 125 86.5
21 37,848 89.4 0 86.5
22 25,125 90.1 2 86.5
23 26,236 90.8 0 86.5 24 30,118 91.7 0 86.5 25 57,111 93.3 241774 93.7
26 24,346 94.0 0 93.7
27 13,700 94.4 95 93.7
28 14,286 94.8 0 93.7 29 14,828 95.2 0 93.7 30 28,938 96.0 0 93.7 31 11,611 96.3 82154 96.1
32 7,284 96.5 0 96.1
33 7,488 96.7 17 96.1
34 7,861 97.0 0 96.1 35 14,648 97.4 0 96.1 36 6,041 97.6 0 96.1 37 4,924 97.7 0 96.1 38 5,221 97.8 52209 97.7

43
Table 6A. Quoted Spreads of NYSE-listed Decimal and Control Stocks
The sample comprises of selected NYSE-listed common stocks included in the Decimal Pilot, and their corresponding NYSE-listed control stocks. Pre-decimal period is the month of July, 2000 and post-decimal period is from October 2, 2000, to January 26, 2001. All stocks in the sample are classified into portfolios based on average daily dollar trading volume computed over the month of July, 2000. Portfolio 1 consists of the smallest dollar volume stocks and portfolio 5 consists of the largest dollar volume stocks. The average quoted bid/ask spreads are denominated in cents. The quoted spreads are computed from the best bid and ask prices (BBO) in the various exchanges. The spreads are weighted intra-day and across days by the transaction volume, and across stocks by pre-decimal (July, 2000) dollar trading volume. For each given portfolio, the reported spreads are weighted intraday by time outstanding and across stocks by pre-decimal dollar trading volume. The net difference in quoted spreads in decimal stocks is calculated as the difference between the daily average quoted spread of each decimal stock and its paired control stock in a particular size rank. The average of these differences over each size rank and over each (pre decimal and post decimal) period is then computed. The table reports the difference in the post-decimal average and the pre-decimal average. T-tests (of equality of means) are performed to see if the net difference in decimal stocks in each size portfolio is statistically distinct from zero.
Pre-decimal Period (July, 2000)
Post-decimal Period (October 2, 2000 – January 26,
2001)
% Change Decimal Stocks
% Change Control Stocks
Net Difference in
Quoted Spreads in Decimal Stocks
(post – pre ) Cents
Portfolio Size Rank
Decimal Stocks Control Stocks Decimal Stocks Control Stocks
1 17.04 15.44 13.46 16.06 -21.00% 3.99% -2.70** 2 18.08 14.15 12.58 12.85 -30.38% -9.18% -3.00* 3 15.87 18.56 11.01 17.22 -30.60% -7.18% -6.17** 4 14.20 13.48 9.04 13.48 -36.29% -0.01% -5.51*** 5 10.11 10.15 6.54 9.11 -35.33% -10.25% -2.78***
Dollar Volume Weighted Average 10.67 10.65 6.91 9.70 -35.22% -8.88% -3.84***
*** p-value ≤ 0.01, ** 0.01 < p-value ≤ 0.05, * 0.05 < p-value ≤ 0.10

44
Table 6B. Effective Spreads of NYSE-listed Decimal and Control Stocks
The sample comprises of selected NYSE-listed common stocks included in the Decimal Pilot, and their corresponding NYSE-listed control stocks. Pre-decimal period is the month of July, 2000 and post-decimal period is from October 2, 2000, to January 26, 2001. For Panel A, all stocks in the sample are classified into portfolios based on average daily dollar trading volume computed over the month of July, 2000. Portfolio 1 consists of the smallest dollar volume stocks and portfolio 5 consists of the largest dollar volume stocks. The average effective bid/ask spreads are denominated in cents. The effective spread is calculated as twice the absolute difference between the transaction price and the midpoint of the prevailing BBO. In panel A, for a given portfolio, the effective spreads are weighted intra-day and across days by the transaction volume, and across stocks by pre-decimal (July, 2000) dollar trading volume. In panel B, the effective spreads are calculated on the basis of trade size categories as indicated. The net difference in effective spreads in decimal stocks is calculated as the difference between the daily average quoted spread of each decimal stock and its paired control stock in a particular size rank. The average of these differences over each size rank and over each (pre decimal and post decimal) period is then computed. The table reports the difference in the post-decimal average and the pre-decimal average. In panel B, the corresponding net differences are calculated (and reported) based on trade size categories. T-tests are performed to see if the net difference in decimal stocks in each size portfolio (or trade size category) is statistically distinct from zero. Panel A: Effective Bid/ask Spreads of stock portfolios classified by of dollar volume
Pre-decimal Period
(July, 2000)
Post-decimal Period (October 2, 2000 – January 26, 2001)
% Change Decimal Stocks
(Post – Pre)
% Change Control Stocks
(Post – Pre)
Net Difference in
Effective Spreads in Decimal Stocks
(post – pre) Cents
Portfolio Size Rank
Decimal Stocks
Control Stocks Decimal Stocks Control Stocks
1 11.03 9.84 10.64 12.43 -3.59 26.32 -2.74 2 10.46 9.01 9.90 9.82 -5.38 9.06 -2.84 3 10.26 11.83 8.99 13.15 -12.41 11.11 -2.77** 4 9.21 8.57 7.79 10.37 -15.39 20.94 -4.47*** 5 7.54 7.82 6.76 7.72 -10.29 -1.17 -1.17
Dollar Volume Weighted Average 7.78 7.97 6.93 8.09 -10.87 1.52 -2.67*** *** p-value ≤ 0.01, ** 0.01 < p-value ≤ 0.05, * 0.05 < p-value ≤ 0.10

45
Table 6B continued. Panel B: Effective Bid/ask Spreads by Trade Size
Pre-decimal Period
(July, 2000) Post-decimal Period
(October 2, 2000 – January 26, 2001)
% Change Decimal Stocks
(Post – Pre)
% Change Control Stocks
(Post – Pre)
Net Difference in
Effective Spreads in Decimal Stocks
(post – pre ) Cents
Trade Size Rank Decimal Stocks
Control Stocks Decimal Stocks Control Stocks
<500 7.59 7.52 5.50 6.97 -27.54 -7.31 -2.28*** 500-999 7.53 7.41 5.64 7.34 -25.10 -0.94 -2.49***
1,000-4,999 7.45 7.31 5.96 7.60 -20.00 3.97 -2.81*** 5,000-9,999 7.35 7.43 6.69 7.93 -8.98 6.73 -2.08***
≥10,000 7.81 7.69 7.54 8.33 -3.46 8.32 -1.49 *** p-value ≤ 0.01, ** 0.01 < p-value ≤ 0.05, * 0.05 < p-value ≤ 0.10

46
Table 7. Bid and Ask Depth Changes of NYSE-listed Decimal and Control Stocks
The sample comprises of selected NYSE-listed common stocks included in the Decimal Pilot, and their corresponding NYSE-listed control stocks. Pre-decimal period is the month of July, 2000. Post-decimal period includes the period from October 2, 2000, through January 26, 2001. The bid and ask depths correspond to the sizes corresponding to the prevailing best bids and offers (BBO) and represent round lots of 100 shares. The net difference in depths in decimal stocks is calculated as the difference between the daily average (bid depth + ask depth) of each decimal stock and its paired control stock in a particular size rank. The average of these differences over each size rank and over each (pre decimal and post decimal) period is then computed. The table reports the difference in the post-decimal average and the pre-decimal average. T-tests are performed to see if the net difference in decimal stocks in each size portfolio is statistically distinct from zero.
Pre-decimal Period
July, 2000 Post-decimal Period
October 2, 2000 – January 26, 2001
% Change
(Post – Pre)
% Change
(Post – Pre)
Net Difference in
Depths in Decimal Stocks
(post – pre) Cents
Bid Depth
Ask Depth
Ask+Bid Depth
Bid Depth
Ask Depth
Ask+Bid Depth
Bid Depth
Ask Depth
Ask+Bid Depth
Bid Depth
Ask Depth
Ask+Bid Depth
Portfolio Rank
Decimal Stocks Control Stocks Decimal Stocks Control Stocks Decimal Stocks
Control
Stocks
1 26.97 18.99 45.96 28.40 22.49 50.90 18.95 19.97 38.92 33.57 30.69 64.27 -15.31 26.27 -40.62***
2 101.09 39.80 140.89 39.03 43.06 82.09 13.18 16.36 29.53 68.93 39.76 108.69 -79.04 32.40 -228.20***
3 30.43 37.38 67.80 26.89 30.56 57.45 15.50 19.22 34.72 18.33 23.60 41.92 -48.79 -27.03 -13.83***
4 58.10 59.30 117.40 40.42 49.98 90.40 21.19 25.24 46.42 38.17 48.91 87.08 -60.46 -3.67 -42.73***
5 107.93 137.54 245.46 127.35 158.65 286.00 43.25 49.71 92.96 164.89 173.84 338.73 -62.13 18.44 -108.10***
Dollar Volume
Weighted Average 101.36 127.30 228.66 116.73 145.29 262.01 40.84 47.04 87.88 150.88 159.76 310.64 -61.57 18.56 -75.60***
*** p-value ≤ 0.01, ** 0.01 < p-value ≤ 0.05, * 0.05 < p-value ≤ 0.10

47
Table 8. Autoquoting Behavior on Regional Exchanges for NYSE-listed Decimal and Control Stocks The sample comprises of selected NYSE-listed common stocks included in the Decimal Pilot, and the corresponding NYE-listed control stocks. Pre-decimal period is the month of July, 2000. Post-decimal period includes the period from October 2, 2000, to January 26, 2001. This table reports the percentage of time the NYSE-listed decimal and control stocks are (regular and smart) autoquoted before and after decimalization in the various regional exchanges. The reported numbers are a simple percentage of all autoquotes (in each regular or smart autoquote category) from a given regional expressed as a percentage of all quotes from the regionals and the NYSE. The net difference in (regular or smart) autoquotes is calculated as the difference in daily average autoquote frequency between each decimal stock and its matched control stock. The averaging is now done over each exchange and over each (pre decimal and post decimal) period. The table reports the difference in the post-decimal average and the pre-decimal average. T-tests (of equality of means) are performed to see if the net differences in decimal stocks are statistically distinct from zero.
Panel A: Regular autoquotes
Pre-decimal Period (July, 2000)
Post-decimal Period (October 2, 2000 – January 26, 2001)
% Change Decimal Stocks
(Post – Pre)
% Change Control Stocks
(Post – Pre)
Net Difference in
Regular Autoquotes in Decimal Stocks (%)
(post – pre) Exchange Decimal Stocks Control Stocks Decimal Stocks Control Stocks
Boston 37.99% 43.11% 45.38% 37.33% 19.45 -13.41 9.6*** Chicago 46.68% 51.21% 69.46% 49.16% 48.80 -4.00 9.7** Pacific 41.70% 65.39% 67.91% 59.94% 62.85 -8.33 2.6 Nasdaq 4.61% 5.29% 4.93% 3.28% 6.94 -38.00 0.07
Philadelphia 92.53% 74.19% 85.19% 63.16% -7.93 -14.87 6.5 Cincinnati 26.46% 22.18% 51.55% 25.43% 94.82 14.65 4.8
Panel B: Smart autoquotes
Pre-decimal Period (July, 2000)
Post-decimal Period (October 2, 2000 – January 26, 2001)
% Change Decimal Stocks
(Post – Pre)
% Change Control Stocks
(Post – Pre)
Net Difference in
Smart Autoquotes in Decimal Stocks (%)
(post – pre)
Exchange Decimal Stocks Control Stocks Decimal Stocks Control Stocks Boston 26.95% 27.20% 33.37% 30.31% 23.82 11.43 7.76*
Chicago 26.84% 19.87% 20.17% 22.74% -24.85 14.44 10.97*** Pacific 20.51% 12.68% 12.38% 21.27% -39.64 67.74 4.6 Nasdaq 5.83% 4.48% 3.09% 4.01% -47.00 -10.49 0.7*
Philadelphia 3.93% 8.21% 9.53% 11.57% 142.49 40.93 6.4 Cincinnati 46.55% 40.97% 23.56% 33.77% -49.39 -17.57 19.6***
*** p-value ≤ 0.01, ** 0.01 < p-value ≤ 0.05, * 0.05 < p-value ≤ 0.10

48
Table 9. Trade Frequency and Trading Volume in NYSE-listed Decimal and Control Stocks. The sample comprises of selected NYSE-listed common stocks included in the Decimal Pilot, and their corresponding control stocks also listed in the NYSE. Before is the month of July, 2000. After includes the period from October 2, 2000, to January 26, 2001. Panel A presents the average daily trading volume results classified by trade size, and panel B provides the corresponding daily average trade frequency statistics. Results are reported for decimal and control stocks over the pre-decimal and post-decimal period. The average daily volume numbers are represented in 100-share units. The net difference in trade volume (or trade frequency) in decimal stocks is calculated as the difference between the daily average volume (or trade frequency) of each decimal stock and its paired control stock in a particular trade size category. The average of these differences over each category and over each (pre decimal and post decimal) period is then computed. The table reports the difference in the post-decimal average and the pre-decimal average. T-tests are performed to see if the net difference in decimal stocks in each trade size category is statistically distinct from zero.
Panel A: Trading Volume
Pre-decimal Period (July, 2000)
Post-decimal Period (October 2, 2000 – January 26, 2001)
% Change Decimal Stocks
(Post – Pre)
% Change Control Stocks
(Post – Pre)
Net Difference in
Trade Volume in Decimal Stocks
(post – pre) Trade size Decimal Stocks Control Stocks Decimal Stocks Control Stocks
<500 184.21 183.43 188.68 188.80 2.43 2.93 1943 500-999 602.22 604.95 608.22 611.44 1.00 1.07 2768**
1,000-4,999 1825.82 1831.54 1820.18 1861.89 -0.31 1.66 -9298** 5,000-9,999 6204.24 6165.52 6313.84 6220.41 1.77 0.89 -10431***
≥10,000 24751.09 25579.79 25362.33 27313.15 2.47 6.78 -127000*** Panel B: Trade Frequency
Pre-decimal Period (July, 2000)
Post-decimal Period (October 2, 2000 – January 25, 2001)
% Change Decimal Stocks
(Post – Pre)
% Change Control Stocks
(Post – Pre)
Net Difference in
Trade Frequency in Decimal Stocks
(post – pre) Trade size Decimal Stocks Control Stocks Decimal Stocks Control Stocks
<500 2601.94 1705.53 2277.79 1937.22 -12.46 13.58 10.87 500-999 602.85 459.2 585.97 540.18 -2.80 17.63 4.29**
1,000-4,999 847.18 650.72 863.51 767.01 1.93 17.87 -0.26 5,000-9,999 145.87 111.6 143.03 134.00 -1.94 20.07 -1.77***
≥10,000 145.34 121.85 162.14 155.76 11.56 27.83 -2.92** *** p-value ≤ 0.01, ** 0.01 < p-value ≤ 0.05, * 0.05 < p-value ≤ 0.10
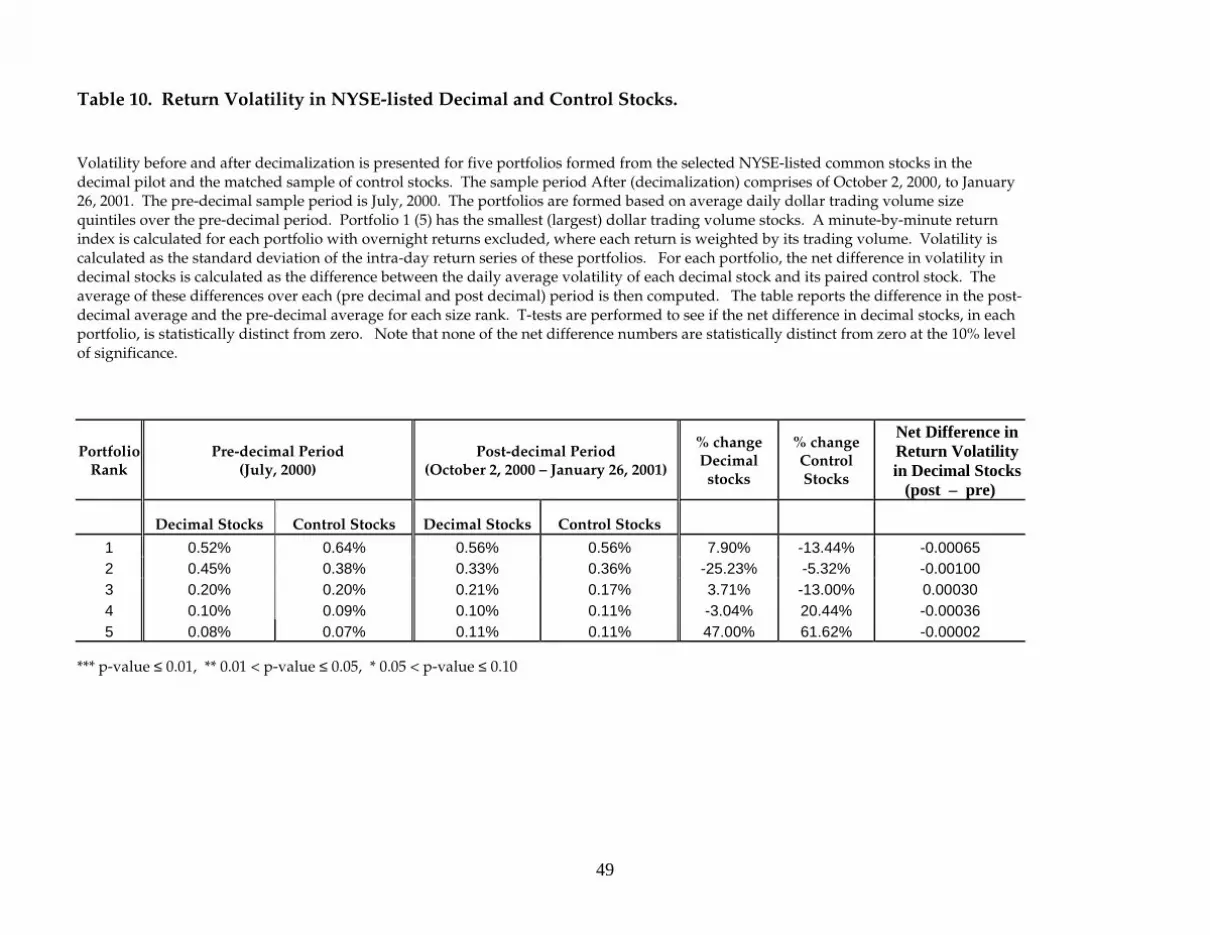
49
Table 10. Return Volatility in NYSE-listed Decimal and Control Stocks.
Volatility before and after decimalization is presented for five portfolios formed from the selected NYSE-listed common stocks in the decimal pilot and the matched sample of control stocks. The sample period After (decimalization) comprises of October 2, 2000, to January 26, 2001. The pre-decimal sample period is July, 2000. The portfolios are formed based on average daily dollar trading volume size quintiles over the pre-decimal period. Portfolio 1 (5) has the smallest (largest) dollar trading volume stocks. A minute-by-minute return index is calculated for each portfolio with overnight returns excluded, where each return is weighted by its trading volume. Volatility is calculated as the standard deviation of the intra-day return series of these portfolios. For each portfolio, the net difference in volatility in decimal stocks is calculated as the difference between the daily average volatility of each decimal stock and its paired control stock. The average of these differences over each (pre decimal and post decimal) period is then computed. The table reports the difference in the post-decimal average and the pre-decimal average for each size rank. T-tests are performed to see if the net difference in decimal stocks, in each portfolio, is statistically distinct from zero. Note that none of the net difference numbers are statistically distinct from zero at the 10% level of significance.
Portfolio Rank
Pre-decimal Period (July, 2000)
Post-decimal Period (October 2, 2000 – January 26, 2001)
% change Decimal
stocks
% change Control Stocks
Net Difference in
Return Volatility in Decimal Stocks
(post – pre)
Decimal Stocks Control Stocks Decimal Stocks Control Stocks
1 0.52% 0.64% 0.56% 0.56% 7.90% -13.44% -0.00065 2 0.45% 0.38% 0.33% 0.36% -25.23% -5.32% -0.00100 3 0.20% 0.20% 0.21% 0.17% 3.71% -13.00% 0.00030 4 0.10% 0.09% 0.10% 0.11% -3.04% 20.44% -0.00036 5 0.08% 0.07% 0.11% 0.11% 47.00% 61.62% -0.00002
*** p-value ≤ 0.01, ** 0.01 < p-value ≤ 0.05, * 0.05 < p-value ≤ 0.10

50
Table 11. Runs and Reversals in BBO Quote Midpoints in NYSE-listed Decimal and
Control Stocks.
This table examines reversals and runs for selected NYSE-listed common stocks in the decimal pilot and their matched sample of control stocks, over the decimal period of October 2, 2000 to January 26, 2001 and over the pre-decimal period of July 2000. Runs and reversals are defined in the text and are computed based on the prevailing BBO midpoint. T-tests (of equality of means) are performed between decimal and control stocks for both the pre-decimal period and the decimal period.
Panel A. Quote Reversals
Pre-decimal Period
(July 2000) Post-decimal Period
(October 2, 2000 – January 26, 2001)
Decimal Stocks Control Stocks Decimal Stocks Control Stocks
Total number of quote reversals
% of all non-zero quote changes
Total number of quote reversals
% of all non-zero quote changes
Total number of
quote reversals
% of all non-zero
quote changes
Total number of
quote reversals
% of all non-zero
quote changes
Quote Reversals
88,487 10.19% 87,236 10.05% 405,000 25.05% 312.292 33.63%
Note: T-test of the differences in quote reversals and nonzero quote changes between decimal and control stocks in the pre event period are not significant, but are significant at the 0.01 level in the decimal period.
Panel B: Quote Runs
Pre-decimal Period
(July 2000) Post-decimal Period
(October 2, 2000 – January 26, 2001)
Run Decimal Stocks Control Stocks Decimal Stocks Control Stocks
Number Cumulative percentage Number
Cumulative percentage Number
Cumulative percentage Number
Cumulative percentage
1 32,683 3.76% 30,379 3.50% 187,736 5.32% 104,145 3.15% 2 15,730 5.57% 14,552 5.18% 102,671 8.23% 50,438 4.68% 3 10,447 6.78% 10,243 6.36% 64,675 10.07% 34,681 5.73% 4 7,794 7.67% 7,699 7.24% 43,931 11.31% 26,573 6.53% 5 6,143 8.38% 6,224 7.96% 32,039 12.22% 21,604 7.19% 6 5,019 8.96% 4,997 8.54% 24,734 12.92% 17,645 7.72% 7 4,050 9.43% 4,071 9.01% 19,461 13.48% 14,999 8.17% 8 3,505 9.83% 3,431 9.40% 15,249 13.91% 12,380 8.55% 9 2,822 10.15% 2,841 9.73% 12,253 14.26% 10,611 8.87% 10 2,461 10.44% 2,492 10.02% 9,798 14.53% 8,935 9.14% 15 1,107 11.32% 1,180 10.93% 3,838 15.35% 4,445 10.04% 20 591 11.75% 575 11.37% 1,698 15.71% 2,361 10.52% 25 305 11.98% 322 11.60% 800 15.86% 1,448 10.79%
Note: T-tests of the difference in run frequency between decimal and control stocks in the pre event period are not significant at the 0.10 level, but are significant at the 0.01 level in the decimal period.
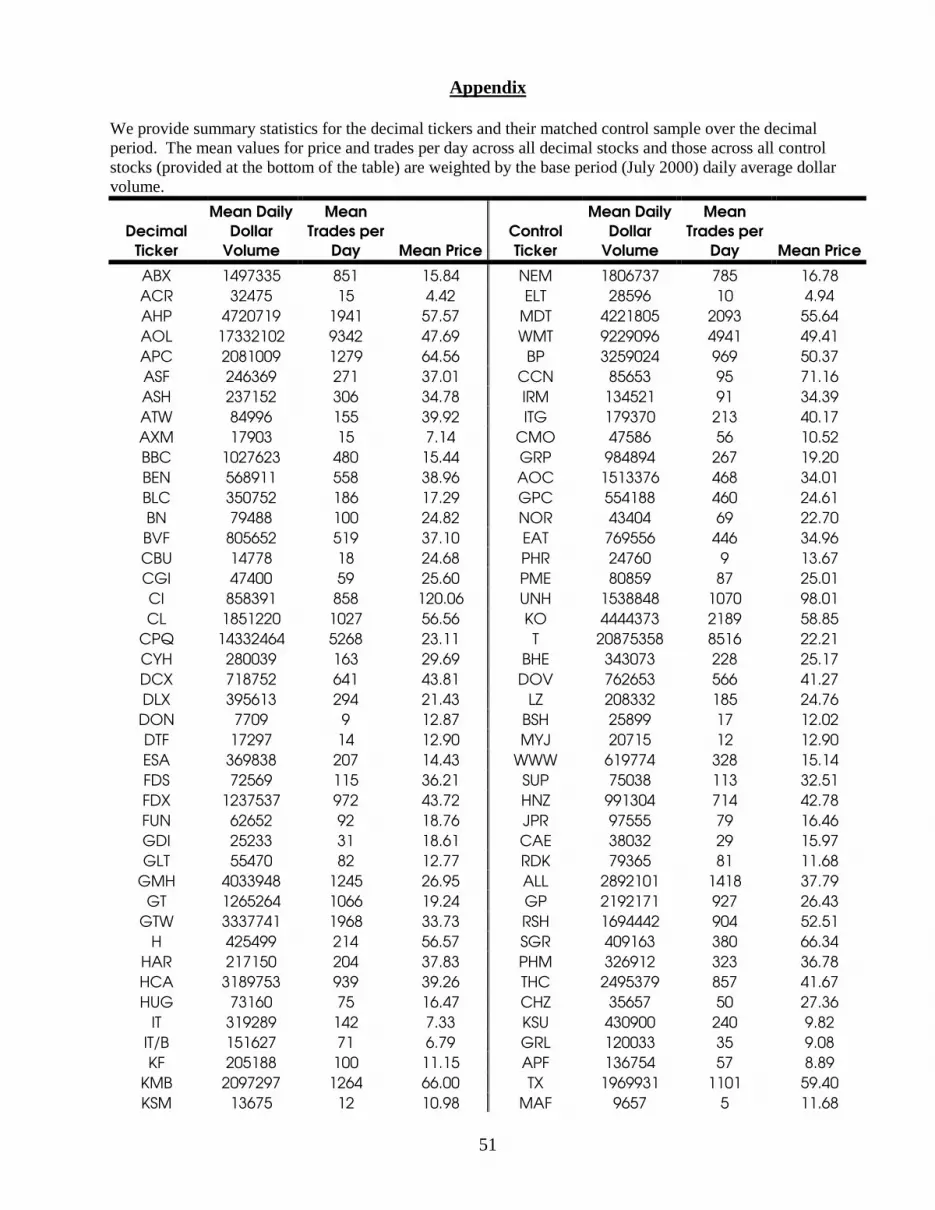
51
Appendix
We provide summary statistics for the decimal tickers and their matched control sample over the decimal period. The mean values for price and trades per day across all decimal stocks and those across all control stocks (provided at the bottom of the table) are weighted by the base period (July 2000) daily average dollar volume.
Decimal
Ticker
Mean Daily
Dollar
Volume
Mean
Trades per
Day Mean Price
Control
Ticker
Mean Daily
Dollar
Volume
Mean
Trades per
Day Mean Price
ABX 1497335 851 15.84 NEM 1806737 785 16.78
ACR 32475 15 4.42 ELT 28596 10 4.94
AHP 4720719 1941 57.57 MDT 4221805 2093 55.64
AOL 17332102 9342 47.69 WMT 9229096 4941 49.41
APC 2081009 1279 64.56 BP 3259024 969 50.37
ASF 246369 271 37.01 CCN 85653 95 71.16
ASH 237152 306 34.78 IRM 134521 91 34.39
ATW 84996 155 39.92 ITG 179370 213 40.17
AXM 17903 15 7.14 CMO 47586 56 10.52
BBC 1027623 480 15.44 GRP 984894 267 19.20
BEN 568911 558 38.96 AOC 1513376 468 34.01
BLC 350752 186 17.29 GPC 554188 460 24.61
BN 79488 100 24.82 NOR 43404 69 22.70
BVF 805652 519 37.10 EAT 769556 446 34.96
CBU 14778 18 24.68 PHR 24760 9 13.67
CGI 47400 59 25.60 PME 80859 87 25.01
CI 858391 858 120.06 UNH 1538848 1070 98.01
CL 1851220 1027 56.56 KO 4444373 2189 58.85
CPQ 14332464 5268 23.11 T 20875358 8516 22.21
CYH 280039 163 29.69 BHE 343073 228 25.17
DCX 718752 641 43.81 DOV 762653 566 41.27
DLX 395613 294 21.43 LZ 208332 185 24.76
DON 7709 9 12.87 BSH 25899 17 12.02
DTF 17297 14 12.90 MYJ 20715 12 12.90
ESA 369838 207 14.43 WWW 619774 328 15.14
FDS 72569 115 36.21 SUP 75038 113 32.51
FDX 1237537 972 43.72 HNZ 991304 714 42.78
FUN 62652 92 18.76 JPR 97555 79 16.46
GDI 25233 31 18.61 CAE 38032 29 15.97
GLT 55470 82 12.77 RDK 79365 81 11.68
GMH 4033948 1245 26.95 ALL 2892101 1418 37.79
GT 1265264 1066 19.24 GP 2192171 927 26.43
GTW 3337741 1968 33.73 RSH 1694442 904 52.51
H 425499 214 56.57 SGR 409163 380 66.34
HAR 217150 204 37.83 PHM 326912 323 36.78
HCA 3189753 939 39.26 THC 2495379 857 41.67
HUG 73160 75 16.47 CHZ 35657 50 27.36
IT 319289 142 7.33 KSU 430900 240 9.82
IT/B 151627 71 6.79 GRL 120033 35 9.08
KF 205188 100 11.15 APF 136754 57 8.89
KMB 2097297 1264 66.00 TX 1969931 1101 59.40
KSM 13675 12 10.98 MAF 9657 5 11.68

52
Table continued
Decimal
Ticker
Mean Daily
Dollar
Volume
Mean
Trades per
Day Mean Price
Control
Ticker
Mean Daily
Dollar
Volume
Mean
Trades per
Day Mean Price
LE 202894 229 24.67 CLB 107200 83 22.27
LMT 1356361 833 33.12 MRO 1296848 679 27.53
LSI 4311999 3912 20.84 F 6402244 2864 25.26
LSS 128556 167 37.37 CBC 97918 112 40.81
LUV 2677121 1419 31.64 RHI 1100180 519 25.29
MAD 21172 9 5.47 GSH 29444 13 6.21
MAT 2159058 1063 14.31 UIS 2536426 1297 15.26
MCK 1281262 601 32.23 BDX 811929 497 32.90
MDC 111472 140 34.23 BZH 90746 125 38.87
MHI 54161 85 30.54 BWC 97443 96 24.06
MI 227106 251 50.32 SZA 204723 214 46.28
MLM 177147 195 38.59 HTN 196461 150 38.47
MMR 38104 40 12.31 BOG 46881 25 9.57
MPR 8862 9 10.36 GBX 7354 11 9.04
MWY 87635 92 7.60 SRR 123592 85 6.87
N 503237 446 15.66 SOI 467850 221 12.37
NHL 17211 14 23.11 FRW 53126 34 25.50
NSS 170007 84 9.23 MM 210599 85 16.99
POM 329715 333 22.50 PLL 528156 335 21.53
PTZ 26949 44 43.84 NJR 20687 44 39.84
RBK 672243 414 24.51 DHI 607453 502 23.88
RCL 677702 282 22.91 CNF 392611 292 28.05
S 1705928 976 32.64 NKE 1281766 768 44.97
SE 41746 51 9.47 SHS 21531 20 9.36
SFD 194412 175 30.03 SNA 243798 237 27.77
SGY 150445 199 56.20 AMG 172732 236 54.07
SJM 38938 69 26.23 CMC 46411 57 22.48
SLR 5506622 2238 34.63 HWP 8802136 4421 32.55
SRF 17222 17 21.88 ALZ 10366 13 22.67
STT 745938 1019 121.08 PKI 643222 855 101.44
SWM 43631 41 19.64 AOS 38305 43 16.55
SYK 1125526 521 48.20 KG 1232806 764 45.88
TBC 27147 36 13.43 FFG 11867 17 15.26
TM 30276 64 73.72 GUC 129823 150 92.93
TMO 1000633 482 28.42 TOS 1115095 538 32.38
TRC 17238 27 21.97 RUS 21742 17 20.68
UBS 289427 241 146.48 HIT 35071 93 102.65
VAL 106365 155 27.37 AGX 60061 35 47.70
VFC 283935 329 34.41 CAR 140356 160 28.45
VIG 8758 8 8.18 AOF 14468 10 7.23
VTS 195066 247 28.64 HP 453222 437 40.70
WLV 49796 37 11.86 PCU 17631 25 12.88
WPC 21715 23 18.50 PEI 40627 46 19.81
WSO 40089 35 10.63 BKE 38316 54 17.34
ZTR 223568 136 6.81 TDF 126063 99 7.74
Means 1055902 4032 42.84 1102576 3534 39.46

53


