Embed Size (px)
Citation preview

Electronic copy available at: http://ssrn.com/abstract=1718423
BIS Working Papers No 332
The impact of CDS trading on the bond market: evidence from Asia by Ilhyock Shim and Haibin Zhu
Monetary and Economic Department
November 2010
JEL classification: G12, G32 Keywords: Credit default swaps, bond spreads, bond liquidity, CDS index, Asia

Electronic copy available at: http://ssrn.com/abstract=1718423
BIS Working Papers are written by members of the Monetary and Economic Department of the Bank for International Settlements, and from time to time by other economists, and are published by the Bank. The papers are on subjects of topical interest and are technical in character. The views expressed in them are those of their authors and not necessarily the views of the BIS.
Copies of publications are available from:
Bank for International Settlements Communications CH-4002 Basel, Switzerland E-mail: [email protected]
Fax: +41 61 280 9100 and +41 61 280 8100
This publication is available on the BIS website (www.bis.org).
© Bank for International Settlements 2010. All rights reserved. Brief excerpts may be reproduced or translated provided the source is stated.
ISSN 1020-0959 (print)
ISBN 1682-7678 (online)

Electronic copy available at: http://ssrn.com/abstract=1718423
The impact of CDS trading on the bond market:evidence from Asia�
Ilhyock Shimyand Haibin Zhuz
October 2010
Abstract
This paper investigates the impact of CDS trading on the development of the bondmarket in Asia. In general, CDS trading has lowered the cost of issuing bonds andenhanced the liquidity in the bond market. The positive impact is stronger for smaller�rms, non-�nancial �rms and those �rms with higher liquidity in the CDS market.These empirical �ndings support the diversi�cation and information hypotheses in theliterature. Nevertheless, CDS trading has also introduced a new source of risk. Thereis strong evidence that, at the peak of the recent global �nancial crisis, those �rmsincluded in CDS indices faced higher bond yield spreads than those not included.
Keywords: Credit default swaps, bond spreads, bond liquidity, CDS index, Asia.
JEL Classi�cation: G12, G32.
�We are grateful for comments by Jean Helwege, Michael King, Frank Packer, Eli Remolona and seminarparticipants at the Hong Kong Monetary Authority, the City University of Hong Kong and the Bank forInternational Settlements. We thank Clara Garcia, Jhuvesh Sobrun and Garry Tang for their excellentresearch assistance and Emma Claggett for language editing. The views presented here are solely those ofthe authors and do not necessarily represent those of the Bank for International Settlements.
yBank for International Settlements. E-mail: [email protected] for International Settlements. E-mail: [email protected].
1


1 Introduction
The rise and fall of the credit derivatives market have been considered as the single most
important development in the global credit market in the past decade. Before the onset of
the global �nancial turmoil that started in mid-2007, the use of credit default swaps (CDSs)
as an instrument to trade credit risk had increased exponentially. Since 2008, however,
activity in the CDS market has shrunk substantially. In particular, CDS notional amounts
outstanding dropped from roughly $60 trillion at the end of 2007 to about $33 trillion at
the end of 2009 (Figure 1), re�ecting severely strained credit markets and the increased
multilateral netting of o¤setting positions by market participants.1
In Asia, the CDS market has also grown rapidly in the past decade, despite the fact that
it is relatively small and illiquid compared to its counterparts in Europe and the United
States. CDS contracts written on Asian reference entities started to be traded in the late
1990s (Remolona and Shim (2008)). In July 2004, the �rst CDS indices focusing on the
region, iTraxx Japan and iTraxx Asia ex-Japan, started to be traded in the market. The
trading was relatively limited in the �rst few years, and then picked up strongly after these
indices were reconstituted to re�ect a surge in bond issuance by new large borrowers in the
region starting in the fourth quarter of 2006. The gained liquidity in the index market spilled
over into single-name CDS contracts. As a result, the CDS market in Asia began to emerge
as a potentially serious market in its own right.
Compared to Europe and the United States, the CDS market in Asia was introduced
against the backdrop of a corporate bond market still in its infancy. In most Asian economies,
the size of the bond market was quite small, the trading was not liquid, and the issuance of
new bonds was largely driven by quasi-government issuers or issuers with some form of credit
guarantees. Since the mid-2000s, however, the depth and breadth of the Asian bond market
have improved greatly, due partly to the priority focus of Asian policymakers to develop
local bond markets and partly to the positive spillover between the bond market and the
1Du¢ e (2009) documents that compression trades, in which several dealers that hold redundant circlesof CDS positions choose to legally cancel their o¤setting obligations to each other, are responsible for thetermination of approximately $30 trillion in notional amounts of CDS positions in 2008 alone.
1

derivatives market (Gyntelberg et al (2005), BIS (2009)).
For policymakers, an issue of interest is the impact of the development of the CDS market
on the corporate bond market. There are two approaches in the literature. One is to examine
both the bond and CDS markets and draw comparisons about their roles in price discovery.
The general results suggest that CDSs play a leading role in price discovery (see Blanco et
al (2005), BIS (2003), Hull et al (2004), Ki¤ et al (2002) and Zhu (2006)), although there is
a no-arbitrage relationship between the two markets in the long run.2 The other approach
focuses on the bond market and examines whether bond market development, eg the cost
of issuing and trading bonds, is a¤ected by the introduction of CDS markets (see Ashcraft
and Santos (2009)). In this paper, we adopt the second approach and leave the �rst issue
untouched.
The limited number of studies on the impact of CDS trading on the bond market have
so far focused on the US market. However, their �ndings do not necessarily apply to the
Asian market. One reason for this is the di¤erent stages of development between the Asian
and US bond markets when CDSs were introduced. Given that the bond markets in many
Asian economies were underdeveloped from the beginning, it is more likely that CDS trading
will have a jump-start e¤ect on bond market developments. Moreover, investors in Asian
bond markets, especially in local currency bond markets, are predominantly domestic in-
vestors, while those in Asian CDS markets are mostly foreign investors. The di¤erent pool
of investors is likely to be an important channel to enhance information transparency and
improve e¢ ciency in the credit market.
This paper attempts to investigate the empirical linkages between the bond and CDS
markets in Asia during the period from January 2003 to June 2009. In particular, we
address the following three questions. First, what is the impact of CDS trading on the Asian
bond market in terms of issuance cost and liquidity? Second, which subset of bond issuers is
most likely to bene�t from the trading in the CDS markets? Third, did the impact of CDS
trading on the bond market exhibit new characteristics during the recent global �nancial
2There are a number of reasons for the leading role of CDSs in price discovery, such as funding andshort-sale restrictions that exist in the bond market.
2

crisis?
The main �ndings are as follows. First, we �nd strong evidence that CDS trading is
associated with lower cost and higher liquidity for new bond issuance in Asia. This is
consistent with the hypothesis that CDS trading helps create new hedging opportunities and
improve information transparency for investors. Noticeably, this result is contrary to similar
studies based on US data. This contrast provides supporting evidence for our conjecture on
the jump-start e¤ect in Asia.
Second, we �nd that the positive impact of CDS trading on the bond market tends to
be more remarkable for smaller �rms and non-�nancial �rms. In addition, those �rms with
higher liquidity in the CDS market bene�t more in the primary bond market in terms of
cost and liquidity.
Last, we also �nd that the impact of CDS trading on the bond market is di¤erent during
the crisis period. The global �nancial crisis that occurred during the sample period o¤ers
a good case study to examine the behaviour of the CDS and bond markets under distress
and their linkages. Our analysis shows that, at the peak of the global �nancial crisis, those
�rms included in CDS indices had to face higher spreads than those not included in CDS
indices, above and beyond the general increase in credit spreads observed in the bond market
during this period. This suggests that CDS trading could be a double-edged sword: it also
introduces new sources of shocks to the bond market.
The rest of the paper is organised as follows. Section 2 reviews the literature and high-
lights the contributions of this study. Section 3 documents the empirical methodology.
Section 4 describes data, and Section 5 reports empirical results related to the above three
questions. Finally, Section 6 concludes with discussion of policy implications.
2 Literature review and our contributions
From a theoretical perspective, CDS trading has both bene�ts and costs to the bond market.
The typical framework of such analysis assumes that the bond market is ine¢ cient for various
reasons, including asymmetric information between borrowers and lenders, restrictions on
3
short-sales and low liquidity. The introduction of the CDS market can mitigate or aggravate
some aspects of market ine¢ ciencies in the bond market.
In terms of bene�ts, CDS trading can lower the cost of bond issuance and improve
the liquidity in the bond market by completing the credit market and by revealing new
information about �rms. Du¢ e (2008) suggests that CDSs increase the liquidity of credit
markets, lower credit risk premia and o¤er investors a broader menu of assets and hedging
opportunities. Ashcraft and Santos (2009) summarise two channels through which trading
in the CDS market can lead to a reduction in the credit spreads. The �rst, called the
diversi�cation or hedging channel, refers to the situation in which �rms that have traded
CDSs give their creditors added opportunities to hedge their risk exposures, so that they can
issue bonds at lower spreads. The second channel, called the information channel, focuses on
the possibility that CDSs could reveal new information about �rms and thus reduce the cost
of debt. Du¤ee and Zhou (2001) show that CDSs make it easier for banks to circumvent the
�lemons�problem caused by banks�superior information about the credit quality of their
loans, because CDSs are more �exible at transferring risks than loan sales.3
In terms of costs, CDS trading can adversely a¤ect the cost of debt �nancing due to
agency problems associated with asymmetric information. Banks typically have informa-
tional advantages on a borrower�s credit quality. There have been concerns that banks can
use CDSs to exploit sellers of credit protection, or that their incentive to monitor and mit-
igate the default risk of bank loans is smaller when they are able to pass on the risk to
other investors via credit risk transfer instruments (Ashcraft and Santos (2009)). In addi-
tion, Allen and Carletti (2006) show that credit risk transfer can be detrimental to welfare
because, under certain circumstances, it can lead to contagion between the banking and
insurance sectors and increase the risk of crises.
Empirical papers have tried to investigate the di¤erent channels through which the CDS
market a¤ects the bond or loan market. Regarding the diversi�cation channel in loan orig-
ination, Hirtle (2008) shows that the use of credit derivatives is associated with improved
3It should be noted here that the impact of credit risk transfer instruments on asymmetric informationproblems between borrowers and lenders applies more to the loan market than to the bond market, asinformation in the latter is more of a public nature (see Santos and Winton (2008)).
4

credit supply, in terms of longer loan maturity and lower spreads. Large corporate borrow-
ers, which are likely to be �named credits� in the credit derivatives market, are the main
bene�ciaries. By contrast, Minton et al (2009) claim that the use of credit derivatives by
US bank holding companies to hedge loans is limited because of adverse selection and moral
hazard problems and because of the inability of banks to use hedge accounting when hedging
with credit derivatives.
Regarding the information channel for bank loans, many papers provide evidence that the
CDS market is a source of information on �rms. Acharya and Johnson (2007) �nd signi�cant
incremental information revelation in the CDS market under circumstances consistent with
the use of non-public information by informed banks, though they �nd no evidence that the
degree of asymmetric information adversely a¤ects prices or liquidity in either the equity or
CDS markets. Norden and Wagner (2008) �nd that changes in CDS spreads explain about
25% of subsequent monthly changes in aggregate loan spreads for syndicated loans to US
corporates during the period of 2000 to 2005.
The study most related to our analysis is Ashcraft and Santos (2009), which evaluates
the impact of CDS trading on the credit spreads at bond issuance and loan origination in the
United States. These authors �nd that an average non-�nancial �rm has not bene�ted from
CDS trading in terms of the cost of bond or loan funding, which contradicts the prediction
from the diversi�cation or information channel. They also �nd that risky and informationally
opaque �rms actually have been adversely a¤ected by the CDS market in terms of the cost of
corporate debt. Their explanation for this result is that syndicate participants may demand
higher compensation to extend loans to these �rms because banks will rely on CDSs and do
less monitoring of these �rms. As they point out, this channel in the loan market is likely to
a¤ect the bond market as well because bondholders appear to free-ride on bank monitoring.
Our study extends the existing literature in the following directions. First, this is the
�rst such analysis of the Asian market. The Asian credit market has gained more and more
attention from investors, in part re�ecting the increasing importance of Asian economies as
a driving force for the global economy. More importantly, the Asian bond market was at
a relative infancy stage when CDSs were introduced, so that the balance between bene�ts
5

and costs related to CDS trading might be di¤erent from the case in advanced economies.
In particular, the marginal bene�ts may be larger due to a jump-start e¤ect and therefore
outweigh the potential costs.
Our empirical analysis also overcomes an important caveat in the existing literature,
ie endogeneity in bond issuance decisions. A �rm can choose when to issue a bond. For
instance, it may decide to do so only when credit market conditions are favourable, or if it
observes that credit spreads in the CDS markets are at low levels or have been decreasing
over time. Given that the data only include issued bonds, ignoring this endogeneity issue
can cause selection bias in the empirical analysis. In this paper we use Heckman�s two-
step approach to control for this selection bias, and �nd that the results are robust to this
adjustment.
Second, this paper examines not only the impact of CDS trading on the cost of debt
�nancing but also its impact on the liquidity in the bond market. The answer to this
question is interesting for researchers as well as policymakers in the region, because cost and
liquidity represent two important aspects of bond market development.
Third, this paper also examines the time variation of the impact of CDS trading, partic-
ularly for those �rms included in CDS indices. One would expect that such impact would
be di¤erent in various stages of the credit cycle. In particular, the relative magnitude of
bene�ts and costs associated with CDS trading or inclusion in CDS indices tends to exhibit
distinctive features during a crisis period compared to normal times. Our data cover the
global �nancial crisis that started in mid-2007, which o¤ers a natural experiment to look
into the inter-linkages between the CDS and bond markets at di¤erent phases of the credit
cycle.
3 Methodology
To address the three questions as outlined in the introduction, we �rst conduct a cross-
sectional analysis to examine the impact of CDS trading on the cost of bond issuance and
the liquidity in the primary bond market in Asia, and to �nd out which subset of bond
6
issuers bene�t more from CDS trading. We then adopt a panel data analysis to examine
the time-varying e¤ect of CDS trading on the bond market. Here we explain in detail the
empirical methods.
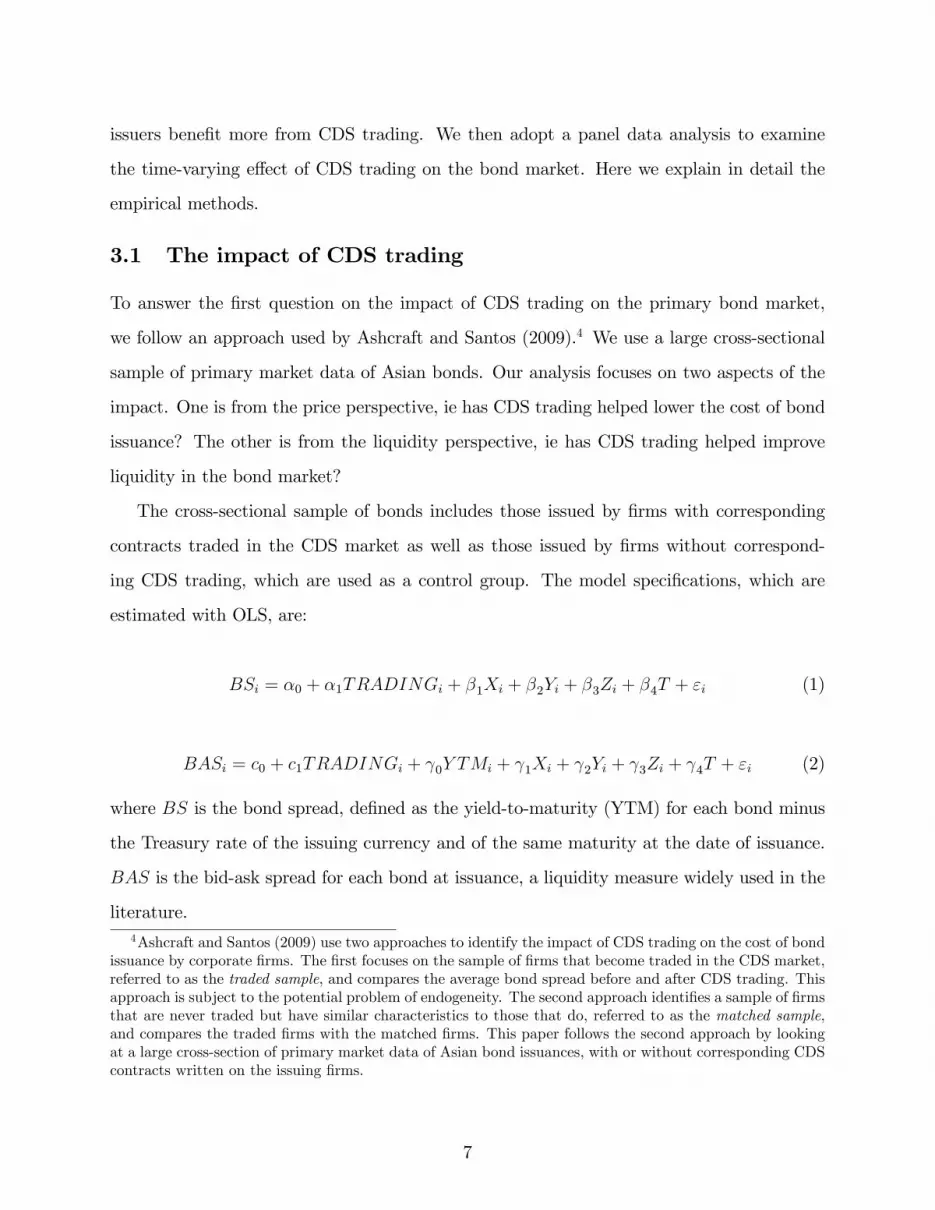
3.1 The impact of CDS trading
To answer the �rst question on the impact of CDS trading on the primary bond market,
we follow an approach used by Ashcraft and Santos (2009).4 We use a large cross-sectional
sample of primary market data of Asian bonds. Our analysis focuses on two aspects of the
impact. One is from the price perspective, ie has CDS trading helped lower the cost of bond
issuance? The other is from the liquidity perspective, ie has CDS trading helped improve
liquidity in the bond market?
The cross-sectional sample of bonds includes those issued by �rms with corresponding
contracts traded in the CDS market as well as those issued by �rms without correspond-
ing CDS trading, which are used as a control group. The model speci�cations, which are
estimated with OLS, are:
BSi = �0 + �1TRADINGi + �1Xi + �2Yi + �3Zi + �4T + "i (1)
BASi = c0 + c1TRADINGi + 0Y TMi + 1Xi + 2Yi + 3Zi + 4T + "i (2)
where BS is the bond spread, de�ned as the yield-to-maturity (YTM) for each bond minus
the Treasury rate of the issuing currency and of the same maturity at the date of issuance.
BAS is the bid-ask spread for each bond at issuance, a liquidity measure widely used in the
literature.4Ashcraft and Santos (2009) use two approaches to identify the impact of CDS trading on the cost of bond
issuance by corporate �rms. The �rst focuses on the sample of �rms that become traded in the CDS market,referred to as the traded sample, and compares the average bond spread before and after CDS trading. Thisapproach is subject to the potential problem of endogeneity. The second approach identi�es a sample of �rmsthat are never traded but have similar characteristics to those that do, referred to as the matched sample,and compares the traded �rms with the matched �rms. This paper follows the second approach by lookingat a large cross-section of primary market data of Asian bond issuances, with or without corresponding CDScontracts written on the issuing �rms.
7

The explanatory variables are similar in the two equations, except that the yield-to-
maturity is included as an explanatory variable in the liquidity equation. The bid-ask spread
is expected to be higher for high-cost (high YTM) bonds, hence the coe¢ cient is expected
to be positive. Other explanatory variables include the following.5
TRADING is a dummy variable that takes the value one for bonds that a �rm issues after
its CDS contract starts to be traded in the derivatives market. If CDS trading helps complete
the market by allowing for credit risk transfer and improving information transparency, we
expect the coe¢ cient to be negative in both equations.
X is a set of bond-speci�c variables that include issue amount, bond maturity, a dummy
variable to identify bonds with collateral and a set of dummy variables for bond ratings.
High-rating bonds are associated with lower credit risk and hence lower spreads. The e¤ects
of other bond-speci�c variables, however, are ambiguous. For instance, the larger issue
amount or longer maturity of a bond may represent more credit risk, but at the same time
it is likely to be issued by a safer �rm. Similarly, the use of collateral may help reduce credit
risk, but at the same time there might be selection bias in that bonds issued by low-quality
�rms are more likely to be required to set aside collateral (Berger and Udell (1990)).
Y is a set of �rm-speci�c variables that include �rm size and �rm leverage ratio. Larger
�rms are typically associated with easier access to the bond market and lower cost of bond
issuance. By contrast, high-leverage �rms are viewed as riskier, hence the coe¢ cient for the
leverage ratio is expected to be positive.
Z is a set of macro-�nancial variables of the issuing �rm�s home country, which include the
output gap, represented by the deviation of real GDP from its trend, and the term structure
of interest rates. We expect the output gap to have a negative e¤ect on the pricing of bonds,
because default risk tends to be lower during the high-growth period (positive output gap).
The e¤ects of interest rates, however, are more likely to be ambiguous. A higher spot rate
can be associated with a higher return in the �rm value process and by extension reduces
the default rate and the cost of debt �nancing. Nevertheless, it may also re�ect a tightened
5The choice of explanatory variables, other than the CDS trading dummy, follows previous studies suchas Elton et al (2001), Chen et al (2007) and Ashcraft and Santos (2009).
8

monetary policy stance and therefore is associated with a higher probability of default of
issuing �rms.
In addition, our sample period covers the recent global �nancial crisis, during which the
bond market has been severely a¤ected. Hence we also introduce two dummy variables
(T ) that de�ne two phases of the crisis: one de�nes the period between July 2007 and 14
September 2008, the initial period of the subprime crisis; the other de�nes the period after
the failure of Lehman Brothers on 15 September 2008, when the global crisis intensi�ed and
spilled over to Asia (see BIS (2009) and Huang et al (2010)).
3.2 Controlling for selection bias
A potential problem in existing literature, including the above analysis, is the selection
bias problem. The empirical analysis focuses on bonds issued during the period of interest.
However, bond issuance decision by itself is endogenous. In particular, a �rm may choose to
issue a bond when its �nancing need is high, when general �nancial conditions are favourable
or when it expects to pay low cost on bonds (say, by observing its own credit spreads in the
CDS market).
We use Heckman�s (1979) approach to control for selection bias, which consists of two
steps.
In the �rst step, we run a probit regression to examine �rms�bond issuance decision.
For all individual �rms included in our sample, we construct a monthly dummy variable
that indicates whether a �rm issued new bonds in each month, from January 2003 to June
2009. The list of explanatory variables include some variables used in the baseline analysis
(Equations 1 and 2) as well as several additional variables (the credit market and global
�nancial market variables described below), so as to ensure that the probit analysis provides
additional information.
(1) Firm-speci�c variables, including �rm size, leverage and rating. These variables may
re�ect �rms��nancing need and their ability to raise new funds in the bond market.
(2) Credit market variables, including the level and changes in credit spreads in national
credit markets. We construct �hypothetical�national CDS indices by calculating the average
9

CDS spreads of �rms from each economy that are included in the iTraxx Japan or iTraxx
Asia ex-Japan indices. The time series of these hypothetical national CDS indices go back
earlier than the o¢ cial introduction of these two CDS indices on the market. The hypothesis
is that �rms may choose to issue bonds when credit market conditions are favourable, either
at low levels or when credit spreads have been declining.
(3) Country-speci�c macro and �nancial market variables, including stock market returns,
GDP gap and interest rates in each economy.
(4) Global �nancial market variables, including the implied volatility of the S&P 500
(VIX) and the Baa-Aaa spreads in the US market. A higher VIX indicates higher volatility
and higher risk aversion in the �nancial market, and the Baa-Aaa spread is associated with
the size of the risk premium.
(5) The dummy variable that indicates CDS trading reported on each �rm in the current
and past months.
We calculate the inverse Mills ratio based on the probit analysis. In the second step, we
re-examine the impact of CDS trading on the cost and liquidity of bond issuance (Equations
1 and 2) by including the inverse Mills ratio as an additional explanatory variable.
3.3 The di¤erential impact of CDS trading across �rms
To answer the second question regarding which subset of bond issuers bene�t more from
CDS trading, we run a number of extended regressions by adding an interactive term:6
BSi = �0+�1TRADINGi+�2TRADINGi �Di+�3Di+�1Xi+�2Yi+�3Zi+�4T +"i (3)
BASi = c0+c1TRADINGi+c2TRADINGi�Di+c3Di+ 0Y TMi+ 1Xi+ 2Yi+ 3Zi+ 4T+"i
(4)
6The Heckman adjustment is also adopted here to correct for selection bias.
10

in which D is one of the following �rm- or bond-speci�c variables that de�ne a subset of the
sample bonds.7
(1) Firm size. A possible hypothesis is that smaller �rms, which probably face more
constraints in credit risk transfer and information transparency, may bene�t more from the
introduction into the derivatives market. If that is the case, the coe¢ cient for the interactive
term is expected to be positive.
(2) Firm leverage. Firms with higher leverages are riskier. One may expect that riskier
�rms may bene�t more from CDS trading by allowing for credit risk transfer. Therefore, the
coe¢ cient is expected to have a negative sign.
(3) A dummy for unrated bonds. Unrated bonds arguably receive less attention from
rating agencies and analysts, and are more likely to have opaque information. Trading in
the CDS market, in this sense, tends to reduce the information transparency problem and
thus has a bigger impact on this group of bonds. Hence, we expect the coe¢ cient for the
interactive term to be negative.
(4) A dummy for �nancial �rms (vs corporate �rms). Financial �rms typically behave
quite di¤erently from corporate �rms. They know each other well, even without CDS trading;
thus, CDS trading does not add much more information. Hence, we expect the coe¢ cient
for the interactive term to be positive.
(5) A dummy for history of bond issuance, ie whether the same �rm has issued other
bonds within a given time window (eg two years) before the new bond is issued. One would
expect that the market would have better information on �rms that have recent issuing
experience. As a result, the bene�t of CDS trading tends to be smaller for these �rms than
for those without any recent bond issuance. In other words, we expect the coe¢ cient to be
positive.
(6) A dummy variable that indicates the inclusion of a �rm in the CDS indices. An
index works as a performance or pricing benchmark in the equity and credit markets. There
7In order to see what types of borrowers are more a¤ected by the CDS market, Ashcraft and Santos(2009) use three measures of �rm risk: leverage, implied stock volatility and a dummy for investment gradeor not. They also use three proxies for �rm transparency: the number of stock analysts, the volatility oftheir earnings forecast errors and the bid-ask spread on the �rm�s stock prices.
11

has been evidence that, once a name enters an equity index, it is demanded more by many
institutional investors (Denis et al (2003)). Hedge and McDermott (2003) show that the
liquidity of a stock improves signi�cantly in the three months after the stock is included in
the S&P 500 index, due to an increase in trading volume that lowers the inventory costs
of market makers. Similarly, Hacibedel (2008) �nds supporting evidence of the investor
recognition hypothesis proposed by Merton (1987), who claims that the index inclusion is
associated with increases in investor awareness and decreases in shadow cost. As a result, it
will cause a permanent increase in the stock price. Motivated by these �ndings, we examine
whether the impact of CDS trading tends to be stronger for those �rms included in one of the
two most popular CDS indices in Asia, iTraxx Japan and iTraxx Asia ex-Japan. Importantly,
the inclusion of a name in one of the two indices is based on its trading volume over the
past 12 months (Markit Group Limited (2007a, 2007b)),8 which does not necessarily mean
that the company is sound, large or reliable. However, some investors want to buy bonds
issued by CDS index names as well as the CDS indices to enjoy arbitrage pro�ts or achieve
complete hedging. The increasing demand can generate more liquidity and reduce credit
spreads in the bond market.9
(7) Liquidity in the CDS markets. For each bond issuance that has corresponding CDS
contracts traded in the CDS market, we include a liquidity measure in the CDS market
(which is de�ned in the data section). The e¤ect of this interactive term can be ambiguous.
On the one hand, high liquidity in the CDS market can imply that the positive spillover e¤ect
from the derivatives market to the bond market is more remarkable. On the other hand,
CDS contracts may be more liquid if the underlying bonds are more liquid, and therefore the
net information gain from the derivatives market to the bond market may not necessarily be
larger for highly liquid CDS names.
8By contrast, the criterion for including a name in an equity index is typically based not on tradingvolume, but on market capitalisation, size and other factors.
9Moreover, CDS index inclusion can make more investors aware of a �rm and thus require lower spreadson the bonds issued by the �rm.
12

3.4 The time-varying impact of CDS trading
To answer the third question on the time-varying impact of CDS trading on the bond market,
we use a di¤erent dataset. Our analysis focuses on the same set of bonds but includes price
and liquidity information from the primary market (ie price and liquidity at issuance) as
well as from the secondary market. That is, for each bond we retrieve monthly time series
of bond spreads and bond liquidity measures after the date of issuance. In addition, we
rely on another dummy variable that de�nes a name being included in the CDS indices. An
important reason for focusing on the index inclusion dummy rather than the CDS trading
dummy is that index inclusion is determined by an objective criterion that is independent
of the coverage and quality of a speci�c database.
The analysis based on the panel data examines the time-varying impact of index inclusion
on the cost and liquidity in the bond market. The model speci�cation is:
Yit = d0+d1TRADINGit+d2INDEXit �TDUMMYt+�1Xit+�2Yit+�3Zit+�4T +"it (5)
In the panel analysis, the dependent variables (Yit) are bond spreads or bid-ask spreads,
which are monthly series for all sample bonds. The right-hand variables include the same set
of explanatory variables in the cross-sectional analysis, plus country �xed e¤ects and a list
of interactive terms between the monthly index inclusion dummy and time dummies (one
for each quarter). Our focus is the coe¢ cients for the interactive terms. For the regression
itself, we use an OLS regression but calculate clustered standard errors by �rms, following
the recommendation of Petersen (2009).
4 Data
Our sample starts in January 2003 and ends in June 2009, and covers 10 Asian economies:
China, Hong Kong SAR, India, Indonesia, Japan, Korea, Malaysia, the Philippines, Singa-
pore and Thailand.10 The data consist of three levels of information: bond level, �rm level
10Due to data availability, the �nal sample does not include bond issuance from China, Indonesia andThailand.
13

and country level, which are merged together for the purpose of this study.
Bond data. The �rst part of our data includes information on bonds issued by Asian
entities, which are retrieved from Bloomberg. The starting point of our sample is the universe
of bonds issued after 1 January 2003 by entities headquartered in one of the above-mentioned
Asian economies. Markit (our source of CDS data) coverage started in 2001, but our sample
starts from 2003, when Markit started to have a comfortable coverage of the CDS market
in Asia. Therefore, we will be more con�dent of the accuracy of a key variable used in this
study, ie a dummy variable that indicates whether a CDS contract on the bond issuer has
been traded in the derivatives market when a particular bond is issued.
When retrieving bonds, we impose the following �ltering criteria. The �rst, and most
binding, is that we only include senior bonds. A particular reason for including only senior
bonds is because it is consistent with the de�nition used in the CDS contract. The CDS
contracts considered in this study (see below) are associated with senior, unsecured bonds
issued by the underlying entity. Second, we only include bonds with relatively simple struc-
ture. In particular, we exclude bonds with third-party guarantees, because the prices of those
bonds largely depend on the guarantors, for which no information is available. In addition,
we exclude bonds with callable options or puttable options as well as foreign bonds, which
represent only a small portion of the population but for which the pricing mechanism is less
clear. Third, we exclude bonds issued by sovereign or government-sponsored entities; that
is, only bonds issued by corporate or �nancial �rms are included. Fourth, a bond must be
denominated in either US dollars, Japanese yen or the home country currency of the bond
issuer. Last, we remove bonds with obvious input errors in the price information (eg with
negative bond spreads).
Following Elton et al (2001), we use the following information on bond characteristics.
� Descriptive information of bond issuance, which includes the bond identi�er, issuer,
issue amount, date of issuance and maturity date, issuing currency, home country of
the issuer, use of collateral and rating information.11
11We use the rating of bonds at issuance. For those without bond-speci�c ratings, we use ratings of theissuing �rms instead. In order to check the accuracy of using the �rm rating instead of the bond rating, we
14

� Bond price information, which includes bond spreads at issuance (Equations 1 to 4)
and monthly time series of bond spreads for each bond (Equation 5).12 Bond spreads
are de�ned as the yield-to-maturity (YTM) minus the issuing currency�s Treasury rate
of the same maturity.13
� Bond liquidity information, which is de�ned as the bid-ask spread of each bond (at
issuance and monthly time series). The bid-ask spread is a popular measure for liquidity
in the bond market (Chen et al (2007)). The smaller the bid-ask spread, the more liquid
a bond is.
Firms�balance sheet data. The second data source is issuers�balance sheet information,
which is also from Bloomberg. We include two �rm-speci�c variables in the analysis: �rm
size and �rm leverage. Firm size, which is in US dollars, is transformed using its log term.
Firm leverage is de�ned as the debt/asset ratio. For each period, we use the last observed
balance sheet information (ie in the previous calendar year) as the relevant �rm-speci�c
information for each bond.
Combining bond-speci�c and �rms�balance sheet information, we have 1091 bonds issued
by 236 �rms. Table 1 summarises the characteristics of the sample bonds. The majority of
bonds have investment-grade ratings (BBB and above). Almost 70% of the bonds are issued
by corporate �rms, with the rest issued by �nancial �rms. 234 (21%) bonds are collateralised.
In terms of the maturity structure, almost half of the sample bonds have a maturity shorter
than �ve years, around 30% have a maturity between �ve and 10 years and the rest (20%)
have a maturity longer than 10 years.
In terms of the distribution of sample bonds by the issuer�s home country and the is-
suing currency, the majority (about 97%) of sample bonds are local currency bonds issued
by Japanese and Korean �rms. This is consistent with the fact that Japan and Korea
have the two largest corporate bond markets in Asia, while in many other Asian economies
looked at bond issuances in our sample with both bond and �rm ratings. About 20% of such bond issuanceshad discrepancies between bond and �rm ratings, most of which by one or two notches.12We use end-of-month observations in the monthly series of bond yields and bid-ask spreads.13We use linear interpolation to derive the Treasury rate of the same maturity.
15

(such as China), sovereign bonds or bonds issued by government-sponsored entities are the
predominant part of the bond markets.
CDS data. The other type of �rm-level information is CDS data, which are provided
by Markit. Markit is one of the leading providers of the pricing information in the CDS
market. It supplies daily quotes of CDS spreads for a wide range of CDS contracts, along
di¤erent dimensions including the underlying entity, maturity, currency and restructuring
clause. Each daily quote (called a composite quote) is calculated based on contribution quotes
reported by a number of participating institutions who contribute the price information.
For this study, we examine CDS contracts written on Asian entities since January 2003.
We restrict ourselves to the most popular types of CDS contracts, ie �ve-year maturity,
denominated in either US dollars or Japanese yen, written on senior bonds and without
restrictions on restructuring clause (see Packer and Zhu (2005)). In total, 683 non-sovereign
entities from the aforementioned 10 Asian economies have been included in the Markit data
since 2003. Figure 2 plots the monthly time series of the number of Asian entities included
in the Markit data, and the number of contribution quotes written on these entities in each
month. It is obvious that, based on the Markit coverage, the CDS market in Asia expanded
rapidly in the period of 2003 to 2007. The market has shrunk dramatically since the inception
of the global �nancial crisis, which is consistent with the survey results in Figure 1.
We match each sample bond to the CDS data and create a dummy variable to indicate
whether a CDS contract on the bond-issuing company was quoted in the Markit database
within a time window of 30 business days before the bond was issued.14 We treat this as
equivalent to whether the CDS contract on the issuing company was traded in the CDS
market. Out of the 1091 bonds, 643 bonds had corresponding CDS trading when the bonds
were issued, representing 116 out of the 236 �rms.
The information on the underlying contribution quotes that are used to calculate daily
composite quotes allows us to create a liquidity measure for each CDS name at any particular
time. In this study, we calculate the standard deviation of all contribution quotes on each
14As a robustness check, we also set di¤erent time windows of 20 or 60 business days, and another dummyvariable indicating that there was at least one CDS quote before the bond was issued. The results remainalmost the same.
16

day for each CDS name, and use its average over a given time horizon (eg one month) to
represent the liquidity of a CDS contract during that period.15 If the value of this liquidity
measure is greater, it implies a higher degree of disagreement among market participants
regarding the credit risk of the underlying entities, and, by extension, lower market liquidity
as it tends to be more costly or time-consuming to �nd the right counterparties to trade on
the credit risk instrument.
Figure 3 plots the daily (cross-sectional) averages of the liquidity measure for the 116
CDS names. There was an obvious trend of increasing liquidity between 2003 and 2007.
Entering 2008, the liquidity in the CDS market generally dried up, as shown in the spike of
the liquidity measure.
The CDS market has also traded a family of CDS index products, which are constructed
based on a set of rules with the overriding criterion being that liquidity of the underlying
CDS contract. In Asia, the most widely traded CDS indices are the iTraxx Japan (which
consists of Japanese entities only) and iTraxx Asia ex-Japan indices. The �rst series of both
groups of indices were introduced in July 2004; since then, the constituents of the indices
have been updated every September and March, a process known as �rolling the index�. The
latest series in our sample period was released in March 2009 (Series 11).16
We create a dummy variable indicating the inclusion of an entity in one of the two iTraxx
Asia indices at each point of time (every month). The index inclusion dummy can be a useful
substitute for the CDS trading dummy, because the indices are updated on a regular basis
and are publicly observable. In other words, the accuracy of time variation of this dummy is
independent of the quality of coverage of any particular database. Therefore, we include the
15Alternatively, we also tried two other liquidity measures in the CDS market: one is the total number ofcontribution quotes for a CDS contract during a given time horizon (as used in Ashcraft and Santos (2009));the other is similar to the benchmark liquidity measure except that the range (maximum minus minimumquotes), rather than the standard deviation, is calculated on each day for each CDS contract. The resultsremain robust by using either of the two alternative liquidity measures. In a recent study, Tang and Yan(2008) also proposed other liquidity measures in the CDS market, such as the ratio of spread volatility tothe number of quotes and trades, the number of contracts outstanding, the ratio of quotes over trades andthe bid-ask spread. Unfortunately, it is not possible to construct similar measures based on the Markit data.16The number of constituent entities in each of the two indices has changed over time. For the iTraxx
Japan indices, the number of constituent entites varied between 50 (Series 1, 10 and 11) and 87 (Series 7).For the iTraxx Asia ex-Japan indices, the number of constituent entities was 30 for the �rst three series, 50for Series 4 to 7, and 70 for Series 8 to 11.
17
index inclusion dummy variables in the panel data analysis. Out of the total of 236 �rms,
71 have been included in the CDS indices, or 326 of the 1091 sample bonds.
Macro-�nancial data. The �nal part of the data is macro-�nancial variables of the issuers�
home country, which include the output gap (measured as the deviation of real GDP from
its trend using the HP �lter) and the term structure of interest rates (one-year swap rate
and the term spread between 10- and one-year swap rates).
5 Empirical results
5.1 The impact of CDS trading on the cost and liquidity of bondissuance
We �rst examine the impact of CDS trading on the cost and liquidity of bonds in the primary
market, using the cross-sectional data at issuance and the models as speci�ed in Equations
1 and 2. The estimation results are reported in Table 2.
The most interesting result is the impact of CDS trading. We �nd a negative impact of
CDS trading on the bond spread as well as the bid-ask spread. The impact is statistically
and economically signi�cant. In particular, if a �rm is traded in the CDS market, its cost of
issuing new bonds will be lower by 18 basis points on average. This amount is economically
signi�cant considering the average bond spread of 151 basis points. The new bonds also tend
to be more liquid, in that the average bid-ask spread of the bonds issued by CDS names is
2.1 basis points lower than that of the bonds issued by non-CDS names. The di¤erence is
non-trivial relative to the average bid-ask spread of 14.5 basis points. These results suggest
that, for Asian entities, CDS trading has a sizeable bene�t for the issuers in the bond market.
Our result is in sharp contrast to that of Ashcraft and Santos (2009), who �nd no sig-
ni�cant impact of CDS trading based on US data. A possible explanation is the di¤erent
degree of �nancial market development in Asia and the United States. In particular, the
bond market is relatively less developed in Asia (Gyntelberg et al (2005) and BIS (2006)).
Therefore, the introduction of the credit derivatives market is more likely to have a jump-
start e¤ect. Firms traded in the CDS market are likely to receive more attention from bond
18

market participants, including analysts, rating agencies and institutional investors; hence,
new information might become available. In addition, by allowing for credit risk transfer,
the demand for the bonds issued by �rms whose CDS contracts are traded might have in-
creased, therefore bond liquidity improving. Of course, we cannot exclude the possibility
of a signalling e¤ect, in that the market may view those �rms traded in the CDS market
as more creditworthy. Moreover, once CDS spreads become available, bond issuers have an
incentive to pick the �right�timing to issue new bonds, ie when the CDS spread of the issuer
stays low or has been going down for some time. This endogenous timing of bond issuance
can a¤ect the relationship between CDS trading and lower bond spreads in our �ndings.
The impact of other explanatory variables is largely consistent with economic intuitions.
For �rm-speci�c variables, larger �rms have better access to the primary bond market by
paying relatively lower cost. High-leverage (debt to asset ratio) �rms are riskier and thus
are priced higher and less liquid.
For bond-speci�c variables, the yield-to-maturity has a signi�cant positive e¤ect on the
bid-ask spread, suggesting that high-risk bonds are more likely to be less liquid. The larger
amount of bond issuance seems to be associated with higher risk, and thus higher prices
and larger bid-ask spreads. Longer maturity is associated with improved liquidity in the
primary market, but has no impact on bond spreads. The use of collateral appears to favour
the hypothesis of lowering credit risk rather than the screening hypothesis under which the
issuers of higher-risk bonds are more likely to be required to put aside collateral. This is
consistent with the observation in Table 1 that the use of collateral is highly concentrated
in the highest rating group.
Bond (�rm) rating is important in determining the cost of raising debt. In general,
highly rated �rms pay lower issuance cost on the primary bond market. Surprisingly, the
yield spreads of speculative-grade bonds are lower than those of BBB-rated bonds. This is
probably due to the fact that speculative-grade issuers were shut o¤ in the bond market after
the peak of the global �nancial crisis (the failure of Lehman Brothers). In other words, they
issued bonds only when the credit market conditions were favourable.
The impact of interest rates, both the short-term swap rates and the term spread, is
19

statistically signi�cant and positive. This seems to suggest that an increase in interest rates,
or expected increases in future interest rates, are viewed as a signal of tightened monetary
policy. Borrowers will face a higher cost of �nancing and their default risk will increase. As
a result, the cost of bond issuance will be higher.
The coe¢ cients of the two time dummy variables are also interesting. During the �rst
phase of the global �nancial crisis (from July 2007 to September 2008), Asian bond markets
appeared to be less a¤ected. Indeed, the cost of bond issuance was lower and the liquidity
higher during this period than in normal times, after controlling for other e¤ects. By contrast,
in the second phase of the global �nancial crisis (after the failure of Lehman Brothers), the
bond market in Asia was severely a¤ected. Bond spreads in the primary market increased
on average by 121 basis points relative to normal times. Liquidity also dried up quickly:
average bid-ask spreads increased by 5.7 basis points. Recent studies such as BIS (2009)
suggest that the Asian markets were a¤ected via two channels during this period. On the
�nancial side, the failure of Lehman Brothers triggered a loss of con�dence in the �nancial
market, causing a hike in risk aversion and a drying-up of market liquidity. On the real side,
since the fourth quarter of 2008 the economic prospects of Asian economies have deteriorated
signi�cantly due to the large drop in global demand and exports by Asian economies.
The baseline analysis, however, is subject to the selection bias critique. A Heckman
two-step approach, as described in the methodology section, can correct for selection bias.
The �rst-step probit analysis examines the bond issuance decision. The results are reported
in Table 3. Most coe¢ cients are quite intuitive. Highly rated �rms are more likely to issue
bonds than low-rated ones. Firms are more likely to issue new bonds when the average cost
in the local credit market goes down, when the economy is in the expansion phase, and when
global �nancial market conditions improve. Also, interestingly, the fact that a �rm is traded
in the CDS market tends to increase the likelihood of new bond issuance by that �rm.
The second-step regression including the inverse Mills ratio, which is calculated from the
probit analysis, adjusts for the selection bias problem. The results are reported in Table 4.
The Heckman adjustment does not change the baseline results. Trading in the CDS market
continues to play a signi�cant role in lowering the cost of bond issuance and improving the
20

liquidity in the primary bond market. Indeed, its economic signi�cance even increases. In
addition, the statistical and economic signi�cance of other explanatory variables is relatively
robust. It is worth noting that the inverse Mills ratio has a signi�cantly negative impact in
both equations. This validates the selection bias: when a �rm chooses to issue new bonds,
it appears that the timing of issuance is deliberately chosen so as to enjoy lower costs and
higher liquidity in the bond market.
Overall, the Heckman correction analysis suggests that there are direct and indirect
impacts of CDS trading and other explanatory variables on the cost and liquidity of bonds
in the primary markets. The indirect impact comes through the decision of bond issuance,
and the direct impact a¤ects the cost and liquidity after controlling for this selection bias.
5.2 Which borrowers are more a¤ected?
Our evidence supports the view that the CDS market provides a new way for investors to
trade on credit risk and to improve information transparency of underlying entities. The
magnitude of such impact, however, can be di¤erent across �rms. In this section, we extend
the baseline study in the previous section and investigate which subset of bond issuers bene�t
the most from the positive spillover from the derivatives market to the bond market.
We run extended regressions as speci�ed in Equations 3 and 4, with an additional inter-
active term that re�ects the di¤erential impact of CDS trading. To control for selection bias
we also apply the Heckman adjustment as in Tables 3 and 4. The results are reported in
Tables 5 and 6.
We �rst examine whether the e¤ect of CDS trading di¤ers between large and small �rms.
The results suggest that larger �rms bene�t less from CDS trading, in that the reduction
in bond spreads is smaller and the improvement in bond liquidity is also less remarkable.
This seems to be consistent with the view that larger �rms have better access to the bond
market from the beginning, and therefore the jump-start e¤ect associated with CDS trading
is smaller.
We also examine whether the e¤ect of CDS trading di¤ers between high- and low-leverage
�rms. Ashcraft and Santos (2009) �nd that following the onset of CDS trading there is an
21

increase in bond spreads of high-leverage �rms. Our analysis of the Asian market shows the
opposite, although both coe¢ cients are statistically insigni�cant.
The third regression includes an interactive term with a dummy variable that distin-
guishes between rated and unrated �rms. Unrated �rms tend to be associated with opaque
information. Therefore, the introduction of CDS contracts should have a larger impact by
improving information transparency. However, we do not �nd strong supportive evidence
for this hypothesis: the coe¢ cient for the interactive term has the right sign but is only
borderline statistically signi�cant in the cost equation, and is insigni�cant in the liquidity
equation.
The fourth regression examines the di¤erential impact of CDS trading on �nancial �rms
and corporate �rms. The result shows that the CDS trading e¤ect on bond spreads is much
smaller for �nancial �rms and the di¤erences are statistically signi�cant, although the same
e¤ect on bond liquidity is not statistically signi�cant. A possible explanation is that �nancial
�rms know each other well, so CDS trading does not add much more new information.
The �fth regression investigates the di¤erential impact of CDS trading on �rms with
and without recent bond issuances. When bonds are issued, ample information about the
issuer is provided to market participants. Therefore, the additional bene�t of CDS trading
should be smaller for �rms with recent issuing experience. The hypothesis, however, is not
supported by the regression results in that the coe¢ cients for the interactive terms in both
equations are statistically insigni�cant.
The sixth regression examines the impact of CDS index inclusion in addition to CDS
trading. Note here that those �rms included in the CDS indices represent a subset of �rms
with corresponding CDS contracts and therefore the coe¢ cient for the index inclusion dummy
is equivalent to the coe¢ cients for the interactive terms in the other equations. We �nd that
the �rms included in the CDS indices enjoy higher liquidity but face higher yield spreads in
the bond market. Because the inclusion of an entity in a CDS index mainly depends on its
trading volume in the previous year, it is intuitive that it is likely to command lower bid-ask
spreads in the bond market. It is not so easy to understand why those �rms in the CDS
indices are subject to higher bond yields. A possible explanation is the following: many
22
bonds issued during the crisis period are attached to CDS index names and, as we show
in the next section, they were charged higher bond spreads when the credit market was in
distress.
Last, we examine whether CDS trading had di¤erent impacts on relatively liquid and
illiquid CDS names. This regression includes only bonds associated with CDS trading and
hence has a smaller number of observations. The hypothesis is that the more liquid a
CDS contract is, the easier it is to trade on its credit risk and the higher the informational
gains. Hence, the coe¢ cients for the interactive terms in both equations should be positive.17
Indeed, we �nd strongly supportive evidence of this hypothesis. Within the subset of bonds
that have corresponding CDS trading, those �rms that are highly liquid in the CDS market
have lower costs and higher liquidity in the primary bond market.
In sum, our analysis suggests that the impact of CDS trading on the bond market is
more remarkable for smaller �rms, non-�nancial �rms and those �rms with high liquidity in
the CDS market.
5.3 The impact of CDS trading during the crisis
Another question of interest is whether the impact of CDS trading varies over time, partic-
ularly during the crisis period. The introduction of the CDS market is an important step to
complete the credit market by allowing for trading on credit risk, and it leads to the integra-
tion of various segments of the credit market. One possible side e¤ect of such integration is
that it may introduce a new source of market volatility. Disruptive events in the derivatives
market may spill over to the bond market and cause the malfunctioning of the whole credit
market, as many have argued in the current global �nancial crisis of which the CDS market
has been at the epicentre.
Figure 4 plots the monthly time series of average bond spreads in our panel data that
includes information from both the primary and secondary markets. The sample bonds are
divided into three rating groups (AAA and AA, single-A and triple-B) and also into two
17Notice that our liquidity measure has the property that a value of the higher measure implies lowerliquidity.
23

groups depending on whether there are CDS contracts written on the issuing �rms or not.
There are a few general observations. First, across the rating groups, low-rated bonds have
higher bond spreads. Second, bond spreads increased substantially during the crisis period.
Third, those bonds with traded CDS contracts have lower spreads for most of the period
under review, with the important exception of the �rst half of 2009, when they have higher
spreads.
To address this issue, we run panel regressions (with country �xed e¤ects) as described
in Equation 5. We use OLS and calculate the t-statistics using clustered standard errors
by �rms as suggested by Petersen (2009). A major extension in the panel regressions is the
inclusion of a list of interactive terms between index inclusion and a series of time dummy
variables (one for each quarter). The coe¢ cients for these interactive terms provide helpful
insights on the time variation in the impact of index inclusion on the bond market. As in
the previous regressions, we also include a dummy variable for CDS trading.18
Figure 5 plots the coe¢ cients for the interactive terms, as well as their con�dence intervals
(95%).19 Before discussing the results from the two panel regressions, it is important to note
that, in both regressions, the two dummy variables that indicate the two phases of the global
�nancial crisis have positive and signi�cant e¤ects on bond spreads and bid-ask spreads. In
addition, the magnitude of the coe¢ cient for the second phase of the crisis is much larger
than that for the �rst phase of the crisis. Therefore, the coe¢ cients for the interactive terms
indicate any additional time e¤ects associated with those �rms that are included in the CDS
indices.
The upper panel of Figure 5 shows a signi�cant spillover impact from the CDS to the
bond market at the peak of the crisis. In the fourth quarter of 2008, those �rms included
in the CDS indices faced an extra cost of approximately 100 basis points on average in the
bond market, after adjusting for other e¤ects (including the crisis dummy variables). This
is consistent with the view that the loss of con�dence was particularly remarkable for those
18We did not use interactive terms between the CDS trading dummy and time dummies, mainly because itis crucial to have the correct information on when a CDS contract was �rst traded in the market. However,the accuracy of such information is questionable in the commercial database. By contrast, inclusion in CDSindices is subject to more objective criteria.19The results of the panel regressions are not reported here but are available upon request.
24

names attached to the derivatives market. Market investors were highly risk averse to those
entities, and additional cost was charged for bearing the risk. Another possible explanation
is that, during the crisis period, there was a surge in demand for CDS index products for
hedging or risk management purposes, which increased CDS spreads of the index names and
in turn caused the corresponding bond spreads to widen.
The lower panel of Figure 5, however, shows that there is no signi�cant time variation
in the impact of the CDS market on bond market liquidity. Importantly, this does not
contradict the liquidity dry-up phenomenon, which is supported by the signi�cantly positive
coe¢ cients of the two time dummies of the crisis. What it suggests is that the drying-up of
liquidity seems to be a general phenomenon in the bond market, irrespective of the degree
of involvement of the underlying entity in the CDS market.
6 Conclusion
This paper shows that in Asia, CDS trading has had positive impacts on bond market
development in terms of lowering average spreads and enhancing the market liquidity before
and in the early stage of the recent international �nancial crisis. This �nding supports the
diversi�cation and information hypotheses, and justi�es continued development of active
CDS markets in the region.
For �nancial regulators, the sequencing problem, ie the order in which various �nancial
markets should be developed, is an important issue (Chami et al (2010)). Historically,
derivatives markets have been introduced well after the development of the market for the
underlying securities. Once derivatives become available, dealers and bond holders can hedge
their exposures much more easily and e¢ ciently. In addition, derivatives facilitate the pricing
of instruments by making it easier to repackage risks and exploit arbitrage opportunities.
This makes the holding of bonds more attractive and contributes to the development of
secondary markets in the underlying bonds. Also, as the experience of derivatives on US
government bonds shows, the existence of derivatives can signi�cantly increase the liquidity
of the market for the underlying bonds and encourage their development. Regulators might
25

consider promoting development of the CDS market, so that the CDS market continues to
lower the costs and increase liquidity in the bond market.
However, we also found that at the peak of the �nancial crisis the CDSmarket contributed
to higher spreads in the bond market. Given that the CDS market played the role of shock
ampli�er during the crisis, it is important to make sure that policymakers introduce measures
to mitigate the negative spillover e¤ect from the CDS market to the bond market.
Rapid growth and lax supervision of the CDS market up to 2007 have raised a number of
policy concerns. The current regulatory reform initiatives on the CDSmarket aim at reducing
systemic risk and providing additional transparency in the credit derivatives market. Most
discussions have focused on how to reduce systemic risk stemming from the widespread use
of CDS contracts traded in the over-the-counter (OTC) market. The Financial Stability
Board and the Group of Twenty have picked up this issue, and agreed to require that all
standardised CDS contracts trade in principle through central counterparties (CCPs) or
exchanges. The US Treasury Department decided to require all standard credit default
swaps to be traded through a CCP, and a similar undertaking is being contemplated in
Europe. The current discussion seems to focus on �nancial stability bene�ts.
Trading through CCPs has certain advantages over trading in OTC markets. Counter-
party risk and settlement risk are important considerations in OTC markets, whereas CCPs
can limit delivery failures by requiring accounts to be marked-to-market and by enforcing
margin or collateral requirements. Nevertheless, as Stulz (2010) suggests, the use of clear-
ing houses is not a panacea for eliminating systemic risk associated with OTC trading of
derivatives. Also, clearing houses are ine¢ cient at dealing with most new �nancial products
and customised derivatives. The OTC market is better at enabling innovation, at addressing
speci�c derivatives requirements from end-users, and at �nding counterparties when liquidity
for a derivative on an exchange is low. By contrast, exchanges are more e¢ cient when there
is a large volume of trading for standardised contracts.
In this sense, as emphasised by Du¢ e (2009), it is important to improve price trans-
parency and e¢ ciency in the credit derivatives market. Trading through CCPs could be
helpful in achieving this objective. However, given that the credit market, including the
26

CDS market, is relatively less developed in Asia, the optimal strategy for setting up CCPs
remains an open issue. To this end, a continued discussion is warranted to strike the right
balance between maintaining the stability of the CDS markets and promoting e¢ cient and
liquid CDS markets in Asia.
27

References[1] Acharya, Viral and Timothy Johnson (2007): �Insider trading in credit derivatives�,
Journal of Financial Economics, vol 84, p 110-141.
[2] Allen, Franklin and Elena Carletti (2006): �Credit risk transfer and contagion�, Journalof Monetary Economics, vol 53, p 89-111.
[3] Ashcraft, Adam and João Santos (2009): �Has the CDS market lowered the cost ofcorporate debt?�, Journal of Monetary Economics, vol 56, p 514-623.
[4] Berger, Allen and Gregory Udell (1990): �Collateral, loan quality, and bank risk�,Journal of Monetary Economics, vol 25, p 21-42.
[5] BIS (2003): �Credit risk transfer�, Committee on the Global Financial System Report,Bank for International Settlements, January.
[6] BIS (2006): �Developing corporate bond markets in Asia�, BIS Papers no 26, Bank forInternational Settlements, February.
[7] BIS (2009): �The international �nancial crisis: Timeline, impact and policy responsesin Asia and the Paci�c�, prepared for the wrap-up conference of the Asian ResearchProgramme in Shanghai, August.
[8] Blanco, Roberto, Simon Brennan and Ian March (2005): �An empirical analysis ofthe dynamic relationship between investment-grade bonds and credit default swaps�,Journal of Finance, vol 60, p 2255-2281.
[9] Chami, Ralph, Connel Fullekamp and Sunil Sharma (2010): �A framework for �nancialmarket development�, Journal of Economic Policy Reform, forthcoming.
[10] Chen, Long, David Lesmond and Jason Wei (2007): �Corporate yield spreads and bondliquidity�, Journal of Finance, vol 62, p 119-149.
[11] Denis, Diane K., John J McConnell, Alexei V Ovtchinnikov and Yun Yu (2003): �S&P500 Index additions and earnings expectations�, Journal of Finance, vol 58, p 1821-1840.
[12] Du¤ee, Gregory and Chunsheng Zhou (2001): �Credit derivatives in banking: Usefultools for managing risk?�, Journal of Monetary Economics, vol 48, p 25-54.
[13] Du¢ e, Darrell (2008): �Innovations in credit risk transfer: implications for �nancialstability�, BIS Working Papers no 255.
[14] Du¢ e, Darrell (2009): �Policy issues facing the market for credit derivatives�, in JohnCiorciari and John Taylor (eds), The Road Ahead for the Fed, Hoover Institution Press.
[15] Elton, Edwin, Martin Gruber, Deepak Agrawal and Christopher Mann (2001): �Ex-plaining the rate spread on corporate bonds�, Journal of Finance, vol 56, p 247-277.
[16] Gyntelberg, Jacob, Guonan Ma and Eli Remolona (2005): �Corporate bond markets inAsia�, BIS Quarterly Review, December, p 83-93.
28

[17] Hacibedel, Burcu (2008): "Does investor awareness matter for asset pricing?", workingpaper, Swedish Institute for Financial Research.
[18] Heckman, James (1979): �Sample selection bias as a speci�cation error�, Econometrica,vol 47, p 153-161.
[19] Hedge, Shantaram P. and John B. McDermott (2003): �The liquidity e¤ects of revisionsto the S&P 500 index: an empirical analysis�, Journal of Financial Markets, vol 6, p413-459.
[20] Hirtle, Beverly (2008): �Credit derivatives and bank credit supply�, Federal ReserveBank of New York Sta¤ Report no 276.
[21] Huang, Xin, Hao Zhou and Haibin Zhu (2010): �Assessing the systemic risk of a het-erogeneous portfolio of banks during the recent �nancial crisis�, BIS Working Papersno 296.
[22] Hull, John, Mirela Predescu and Alan White (2004): �The relationship between creditdefault swap spreads, bond yields, and credit rating announcements�, Journal of Bank-ing and Finance, vol 28, p 2789-2811.
[23] Ki¤, John, François-Louis Michaud and Janet Mitchell (2002): �Instruments of creditrisk transfer: E¤ects on �nancial contracting and �nancial stability�, working paper.
[24] Markit Group Limited (2007a): �Markit iTraxx Asia ex-Japan Index Rules�, November,available at www.markit.com.
[25] Markit Group Limited (2007b): �Markit iTraxx Japan Index Rules�, November, avail-able at www.markit.com.
[26] Merton, Robert C. (1987): �A simple model of capital market equilibrium with incom-plete information�, Journal of Finance, vol 42, p 483-510.
[27] Minton, Bernadette, René M. Stulz and Rohan Williamson (2009): �How much dobanks use credit derivatives to hedge loans?�, Journal of Financial Services Research,vol 35, p 1-31.
[28] Norden, Lars and Wolf Wagner (2008): �Credit derivatives and loan pricing�, Journalof Banking and Finance, vol 32, p 2560-2569.
[29] Packer, Frank and Haibin Zhu (2005): �Contractual terms and CDS pricing�, BISQuarterly Review, March, p 89-100.
[30] Petersen, Mitchell (2009): �Estimating standard errors in �nancial panel data sets:Comparing approaches", Review of Financial Studies, 22(1), p 435-480.
[31] Remolona, Eli and Ilhyock Shim (2008): �Credit derivatives and structured credit: howhave the markets in Asia and the Paci�c fared?�, BIS Quarterly Review, June, p 57-66.
[32] Santos, João and Andrew Winton (2008): �Bank loans, bonds, and information monop-olies across the business cycle�, Journal of Finance, vol 63, p 1315-1359.
29

[33] Stulz, René M. (2010): �Credit default swaps and the credit crisis�, Journal of EconomicPerspectives, vol 24, p 73-92.
[34] Tang, Dragon and Hong Yan (2008): �Liquidity and credit default swap spreads�,working paper.
[35] Zhu, Haibin (2006): �An empirical comparison of credit spreads between the bondmarket and the credit default swap market�, Journal of Financial Services Research,vol 29, p 211-235.
30

Figure 1: Global CDS markets: notional amounts outstanding
Dec 04 Jun 05 Dec 05 Jun 06 Dec 06 Jun 07 Dec 07 Jun 08 Dec 08 Jun 09 Dec 090
10
20
30
40
50
60
Trilli
on U
SD
Singlename CDSsMultiname CDSs
Source: BIS.
31

Figure 2: Quotations of CDS contracts in Asia
Jan04 Jan05 Jan06 Jan07 Jan08 Jan090
100
200
300
400
500
600
Date
Number of traded entities
Jan04 Jan05 Jan06 Jan07 Jan08 Jan090
20
40
60
80
100
Date
Thou
sand
s
Number of contributed quotes
Sources: Markit; authors�calculations.Note: The �gure summarises the coverage of the Markit database on CDS quotes of non-sovereign
Asian entities (including China, Hong Kong SAR, India, Indonesia, Japan, Korea, Malaysia, the Philippines,Singapore and Thailand), which totals 683 entities in the sample. The upper panel plots the number ofentities that have valid CDS quotes in each month. The lower panel shows the total number of contributionquotes on Asian entities provided by market participants in each month.
32

Figure 3: Liquidity in the CDS market
Jan04 Jan05 Jan06 Jan07 Jan08 Jan090
5
10
15
20
25
30
35
40
Date
Basi
s po
ints
Sources: Markit; authors�calculations.Note: The �gure reports a liquidity measure in the CDS market. In total, 116 Asian entities are included
in the sample. The liquidity measure is the standard deviation of contributed quotes on each entity on eachday. The �gure plots the time series of the average of the liquidity measure for the 116 sample entities.
33

Figure 4: Average bond spreads by rating, with and without CDS trading
Jan03 Jan04 Jan05 Jan06 Jan07 Jan08 Jan09 Jan100
50
100
150
200
250
300
350
400
450
500
Date
Basi
s po
ints
AAA/AA: CDS tradingAAA/AA: no CDSA: CDS tradingA: no CDSBBB: CDS tradingBBB: no CDS
Note: The �gure plots the time series of average bond spreads by rating groups, for �rms with andwithout CDS trading in each month. We impose a requirement that there be a minimum of 10 bonds in eachsubgroup when calculating the averages, so as to minimise the impact of outlier errors in a small sample.This requirement explains the missing observations in some of the time series.
34

Figure 5: Time-varying index inclusion e¤ect on the bond market
2005Q1 2006Q1 2007Q1 2008Q1 2009Q1200
100
0
100
200Index inclusion effect on bond spreads
2005Q1 2006Q1 2007Q1 2008Q1 2009Q14
2
0
2
4Index inclusion effect on bond l iquidi ty
Note: We run a panel regression that uses monthly data for the list of sample bonds. The dependentvariable is the bond spread in the upper panel and the bid-ask spread in the lower panel. The explanatoryvariables include: (1) bond characteristics, including remaining maturity, issuance amount, a dummy forbond with collateral and bond ratings; in the bond liquidity equation, the bond�s YTM is also included asan explanatory variable; (2) issuing �rms�balance sheet information, including �rm size and the debt/assetratio; (3) macro-�nancial variables, including the output gap, one-year swap rate and term spread (10-yearminus one-year swap rates) of the home country; (4) two time dummies indicating the two phases of theglobal �nancial crisis; (5) a dummy variable for CDS trading; (6) country �xed e¤ects; and (7) interactiveterms between quarterly time dummies and a dummy variable indicating inclusion in the iTraxx CDS indices.The �gure plots the coe¢ cients of interactive terms between time dummies and index inclusion dummies.In both panels, the dotted lines plot the 95% con�dence interval of the coe¢ cients, using clustered standarderrors by �rms as suggested in Petersen (2009).
35

Table 1: Summary statistics: bond characteristics
AAA A BBB BB and Unrated Total/AA below
Bonds 287 377 351 40 36 1091Corporate 283 239 179 26 36 763Financial 4 138 172 14 0 328CDS trade 249 223 118 37 17 643iTraxx inclusion 118 114 65 25 4 326Collateral 226 0 0 0 8 234Maturity structure(0, 5) 45 236 264 3 6 554[5, 7) 34 69 38 13 8 162[7, 10) 68 40 22 14 9 153[10,30 ] 140 32 27 10 13 222
36

Table 2: E¤ects of CDS trading on the cost and liquidity of bonds: benchmark
Bond spread Bid-ask spreadcoef t-stat coef t-stat
Constant 248.46 4.3 -19.70 7.4Dummy (CDS trading) -17.96 2.4 -2.12 6.4Bond yield-to-maturity (%) 1.35 10.5Maturity 0.60 0.6 -0.86 18.8Log(bond amount) 4.64 1.8 0.74 6.5Collateral -27.63 2.2 -1.56 3.0AAA/AA 36.24 2.0 -0.17 0.2A 22.09 1.3 -0.09 0.1BBB 75.13 4.4 -0.70 1.0BB and below 52.21 2.4 -1.13 1.3Log(�rm size) -43.83 16.9 0.51 3.9Debt/asset ratio 120.82 7.9 3.92 5.7GDP gap (%) 27.34 5.0 1.01 4.21-year swap rate (%) 29.00 9.0 2.46 10.2Term spread (%) 28.75 3.7 4.75 12.7Time dummy (July 2007 to Lehman) -44.69 4.1 -1.35 2.7Time dummy (Post Lehman) 120.64 12.5 5.73 12.2Adjusted R2 0.70 0.91No of observations 1091 1005
Notes: This table examines the impact of CDS trading on the cost and liquidity of bonds at the date
of issuance. It reports OLS regression results, and t-statistics are included in parentheses. Dependent
variables are bond spreads (yields-to-maturity minus Treasury rates of the same maturity) and bid-ask
spreads, respectively, both in unit of basis points. Explanatory variables include: (1) a dummy variable
that indicates the trading of the issuing company at the CDS market when the bond is issued; (2) bond
characteristics, including bond maturity, issuance amount (in US dollars) and a dummy variable indicating
the use of collateral; (3) the rating of bonds at issuance; (4) balance sheet information, including �rm size
(in US dollars) and debt/asset ratio; (5) macro-�nancial variables; including the output gap, one-year swap
rate and term spread (de�ned as 10-year minus one-year swap rates) at date of issuance; and (6) two dummy
variables indicating two phases of the recent global �nancial crisis.
37
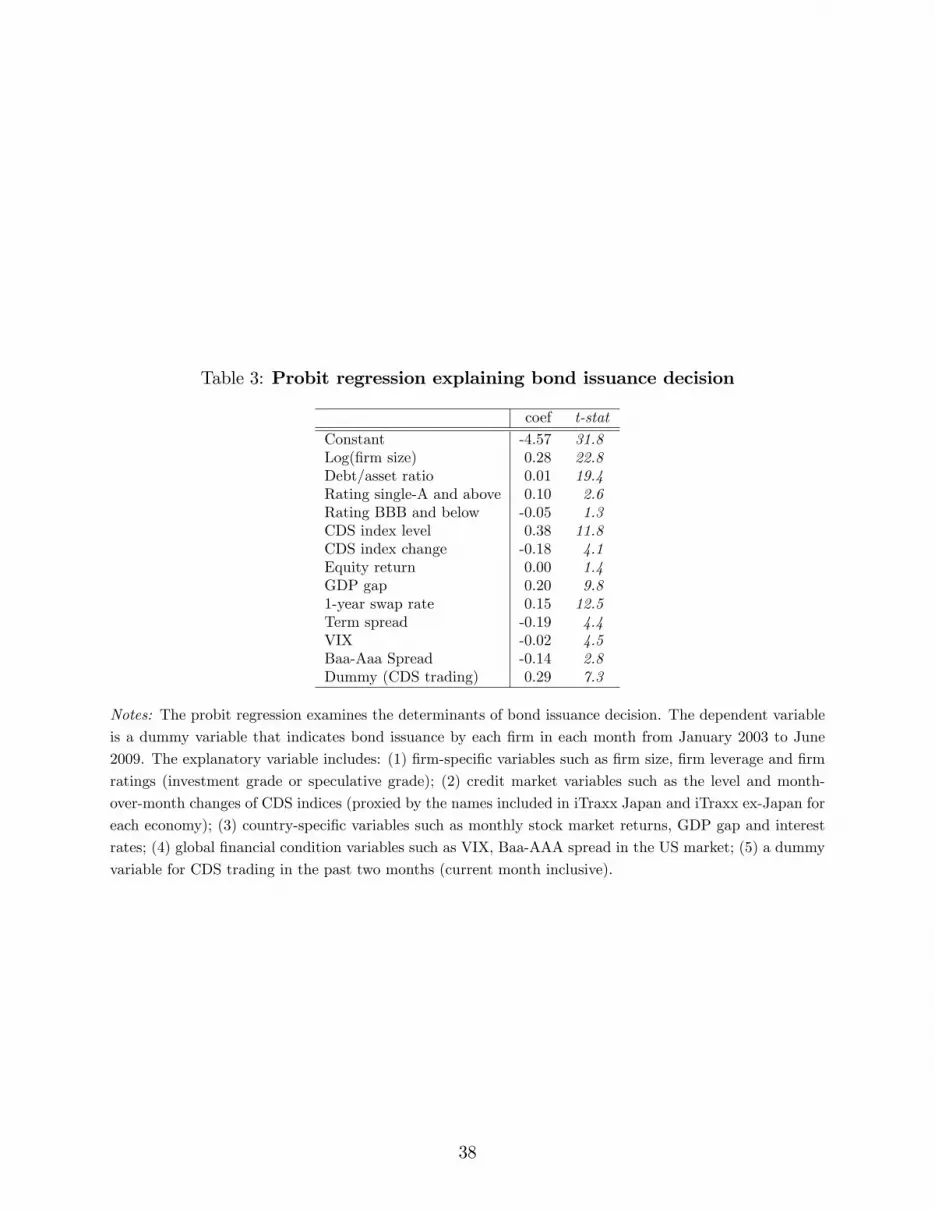
Table 3: Probit regression explaining bond issuance decision
coef t-stat
Constant -4.57 31.8Log(�rm size) 0.28 22.8Debt/asset ratio 0.01 19.4Rating single-A and above 0.10 2.6Rating BBB and below -0.05 1.3CDS index level 0.38 11.8CDS index change -0.18 4.1Equity return 0.00 1.4GDP gap 0.20 9.81-year swap rate 0.15 12.5Term spread -0.19 4.4VIX -0.02 4.5Baa-Aaa Spread -0.14 2.8Dummy (CDS trading) 0.29 7.3
Notes: The probit regression examines the determinants of bond issuance decision. The dependent variable
is a dummy variable that indicates bond issuance by each �rm in each month from January 2003 to June
2009. The explanatory variable includes: (1) �rm-speci�c variables such as �rm size, �rm leverage and �rm
ratings (investment grade or speculative grade); (2) credit market variables such as the level and month-
over-month changes of CDS indices (proxied by the names included in iTraxx Japan and iTraxx ex-Japan for
each economy); (3) country-speci�c variables such as monthly stock market returns, GDP gap and interest
rates; (4) global �nancial condition variables such as VIX, Baa-AAA spread in the US market; (5) a dummy
variable for CDS trading in the past two months (current month inclusive).
38

Table 4: E¤ects of CDS trading on the bond market: Heckman correction
Bond spread Bid-ask spreadcoef t-stat coef t-stat
Constant 883.64 8.8 23.14 5.0Dummy (CDS trading) -31.23 4.0 -2.84 8.1Bond yield-to-maturity (%) 0.98 7.4Maturity 1.57 1.6 -0.76 19.2Log(bond amount) 0.68 0.3 0.47 4.4Collateral -18.69 1.6 -0.99 2.3AAA/AA 13.26 0.8 -0.71 1.1A 1.37 0.1 -0.28 0.4BBB 58.51 3.8 -0.43 0.6BB and below 42.99 2.2 -0.57 0.7Log(�rm size) -68.22 16.0 -1.31 5.9Debt/asset ratio -12.49 0.5 -4.28 4.1GDP gap (%) 23.74 4.2 0.89 3.61-year swap rate (%) 10.56 2.6 1.60 6.1Term spread (%) 27.62 3.4 4.95 11.8Time dummy (July 2007 to Lehman) -57.78 5.2 -2.26 4.7Time dummy (Post Lehman) 80.15 7.3 3.77 7.8Inverse Mills ratio -112.55 7.5 -7.59 10.4Adjusted R2 0.72 0.92No of observations 1080 993
Notes: This table examines the impact of CDS trading on the cost and liquidity of bonds at the date of
issuance. The models used are similar to those in Table 2 but correct for selection bias using the Heckman
correction method. The additional explanatory variable is the inverse Mills ratio from a probit regression
that explains the bond issuance decision, as shown in Table 3. t-statistics are calculated based on the
asymptotic covariance matrix of the coe¢ cients.
39

Table 5: Who is a¤ected? Impact of CDS trading on bond spreads
Variables 1 2 3 4 5 6 7SIZE LEV UNRATED FIN BONDHIST
TRADING -320.91 -24.97 -28.85 -57.31 -40.01 -35.39( 6.5 ) ( 1.7 ) ( 3.6 ) ( 6.6 ) ( 2.9 ) ( 4.4 )
TRADING � D 29.38 -14.14 -49.23 53.72 10.52( 5.9 ) ( 0.5 ) ( 1.8 ) ( 4.2 ) ( 0.8 )
D -76.79 -6.53 917.53 -62.11 -8.48( 17.3 ) ( 0.3 ) ( 8.9 ) ( 5.6 ) ( 0.8 )
Index inclusion dummy 14.88( 2.2 )
CDS LIQUIDITY 1.30( 2.5 )
Adjusted R2 0.73 0.72 0.72 0.73 0.72 0.72 0.58No of observations 1080 1080 1080 1080 1080 1080 640
Notes: The dependent variable is bond spreads at date of issuance (in basis points). The model is estimated
using OLS with t-statistics reported in the parentheses. Explanatory variables are the same as those used in
Table 4 (with Heckman correction), except with an additional interactive term between the dummy variable
of CDS trading (TRADING) and �rm- or bond-speci�c variables D. By columns the D variable refers to
�rm size (SIZE ), �rm leverage (LEV ), a dummy for unrated bonds (UNRATED) a dummy for �nancial
�rms (FIN ), a dummy of BONDHIST that indicates bond issuance history of the the same issuer in the past
two years and a dummy variable that indicates �rm inclusion in the iTraxx Japan or iTraxx Asia ex-Japan
indices. In regression 7, TRADING and the interactive term are replaced by a liquidity measure in the CDS
market, which is de�ned as the average standard deviation of all dealer quotes on a CDS contract during
the 30-business-day window before the bond issuance. The table only reports coe¢ cients on TRADING, the
variable of interest and the interactive term.
Table 6: Who is a¤ected? Impact of CDS trading on bond liquidity
Variables 1 2 3 4 5 6 7SIZE LEV UNRATED FIN BONDHIST
TRADING -8.17 -2.43 -2.86 -2.80 -2.06 -2.32( 3.7 ) ( 3.9 ) ( 7.9 ) ( 8.1 ) ( 3.9 ) ( 6.6 )
TRADING � D 0.54 -0.88 0.34 0.73 -0.93( 2.4 ) ( 0.7 ) ( 0.3 ) ( 1.4 ) ( 1.7 )
D -1.52 -3.89 22.89 2.73 0.99( 6.5 ) ( 3.4 ) ( 4.9 ) ( 6.1 ) ( 2.3 )
Index inclusion dummy -1.53( 5.5 )
CDS LIQUIDITY 0.16( 5.5 )
Adjusted R2 0.92 0.92 0.92 0.93 0.92 0.92 0.89No of observations 993 993 993 993 993 993 586
Notes: See Table 5. The dependent variable is a liquidity measure of bonds at issuance, de�ned as the
bid-ask spreads (in basis points).
40


