Embed Size (px)
Citation preview

Deep sequencing reveals differential expressionof microRNAs in favorable versus unfavorableneuroblastomaJohannes H. Schulte1,*, Tobias Marschall2, Marcel Martin2, Philipp Rosenstiel3,
Pieter Mestdagh4, Stefanie Schlierf1, Theresa Thor1, Jo Vandesompele4,
Angelika Eggert1, Stefan Schreiber3, Sven Rahmann2 and Alexander Schramm1
1University Children’s Hospital Essen, Hufelandstr. 55, 45122 Essen, Germany, 2Bioinformatics forHigh-Throughput Technologies, Algorithm Engineering (LS XI), Informatik, TU Dortmund, 44221 Dortmund,Germany, 3Institute of Clinical Molecular Biology, University Hospital Schleswig-Holstein, Campus Kiel,Schittenhelmstr. 12, 24105 Kiel, Germany and 4Center for Medical Genetics Ghent (CMGG), Ghent UniversityHospital, De Pintelaan 185, 9000 Ghent, Belgium
Received January 18, 2010; Revised April 15, 2010; Accepted April 19, 2010
ABSTRACT
Small non-coding RNAs, in particularmicroRNAs(miRNAs), regulate fine-tuning of geneexpression and can act as oncogenes or tumor sup-pressor genes. Differential miRNA expression hasbeen reported to be of functional relevance fortumor biology. Using next-generation sequencing,the unbiased and absolute quantification of thesmall RNA transcriptome is now feasible.Neuroblastoma(NB) is an embryonal tumor withhighly variable clinical course. We analyzed thesmall RNA transcriptomes of five favorable andfive unfavorable NBs using SOLiD next-generationsequencing, generating a total of >188 000 000reads. MiRNA expression profiles obtained bydeep sequencing correlated well with real-timePCR data. Cluster analysis differentiated betweenfavorable and unfavorable NBs, and the miRNA tran-scriptomes of these two groups were significantlydifferent. Oncogenic miRNAs of the miR17-92cluster and the miR-181 family were overexpressedin unfavorable NBs. In contrast, the putative tumorsuppressive microRNAs, miR-542-5p and miR-628,were expressed in favorable NBs and virtuallyabsent in unfavorable NBs. In-depth sequenceanalysis revealed extensive post-transcriptionalmiRNA editing. Of 13 identified novel miRNAs,three were further analyzed, and expression couldbe confirmed in a cohort of 70 NBs.
INTRODUCTION
Small non-coding RNAs, in particular microRNAs(miRNAs), have been identified to regulate global geneexpression patterns. MiRNAs are transcribed as long pre-cursors and then cleaved to pre-miRNAs of characteristichairpin structure. Pre-miRNAs are further processed togenerate mature miRNAs. For several pre-miRNAs,both strands are processed and give rise to a functionalmiRNA. If either one is known to be expressed at <15%of the other form, it is designated as miRNA* (star form).If the expression ratio is not known, a mature miRNA isdesignated with suffix ‘-3p’ or ‘-5p’, depending on theoriginating strand.Functional miRNAs regulate the translation and
cleavage of mRNAs by sequence-specific interaction withthe 30-UTR [reviewed in (1)]. MiRNAs are involved in theregulation of most physiological processes, including dif-ferentiation, development and apoptosis (2). In cancer,miRNAs may exert oncogenic function by inhibitingtumor suppressor genes or may act as tumor suppressorsby inhibiting oncogenes (3,4).Neuroblastoma (NB) is the most common extracranial,
solid tumor of childhood, comprising 15% of childhoodcancer deaths [reviewed in (5–7)]. NB is characterized by abroad clinical and biological heterogeneity. Patients withfavorable NB have a very good prognosis as tumor regres-sion or differentiation is often observed even in theabsence of specific treatment. In contrast, most patientswith highly aggressive NB, often characterized by ampli-fication of the MYCN oncogene, die despite intensivetherapy. Most recently, attempts were made to analyze
*To whom correspondence should be addressed. Tel: +49 201 723 85185; Fax: +49 201 723 5750; Email: [email protected]
Published online 13 May 2010 Nucleic Acids Research, 2010, Vol. 38, No. 17 5919–5928doi:10.1093/nar/gkq342
� The Author(s) 2010. Published by Oxford University Press.This is an Open Access article distributed under the terms of the Creative Commons Attribution Non-Commercial License (http://creativecommons.org/licenses/by-nc/2.5), which permits unrestricted non-commercial use, distribution, and reproduction in any medium, provided the original work is properly cited.

the contribution of miRNAs to NB tumor biology (8–21),reviewed in (22,23).Several groups analyzed miRNA expression in primary
NBs using miRNA microarrays or high-throughputRT-qPCR. They reported broad deregulation of miRNApatterns correlated with MYCN amplification, 11qdeletion and prognosis (9,15,16,19). Further functionalanalysis identified miRNAs of the MYCN-regulatedmiR-17-92 cluster to be important for proliferation andmigration as well as invasive growth of NB cells (12, 17).Furthermore, miR-34a, located in a region of frequentchromosomal loss, appears to directly downregulate ex-pression of the MYCN oncogene (10,18,19). The onlyattempt to clone NB-specific miRNAs from primarytumors was compromised by the low coverage of thegenerated libraries (8).With the availability of high-throughput next-
generation sequencing (NGS) (24–28), the technical draw-backs of probe-based methodologies, especially restrictionto detection of only previously known sequences, can beovercome. As miRNAs are sequenced directly, informa-tion about SNPs as well as post-transcriptional RNAediting, 30-terminal addition of single nucleotides and vari-ation in miRNA length becomes available for furtheranalysis (13,26,29). It has become evident thatpost-transcriptional modifications of miRNAs producemultiple mature variants, which are referred to asisomiRs (26). NGS of the small RNA transcriptome alsoprovides data on the expression of other small RNAs,such as piRNAs, snoRNAs and other less wellcharacterized short, regulatory RNAs that do not meetthe criteria of miRNAs (30).We compared the small RNA transcriptomes of five
favorable and five unfavorable, MYCN-amplified NBsby means of ultra-deep NGS using the SOLiD system(Applied Biosystems). NGS results were compared withmiRNA expression patterns generated for the samesamples by high-throughput RT-qPCR to correlateresults from both systems and validate miRNA expressionpatterns (14). Favorable and unfavorable NBs were dis-tinguishable by hierarchical clustering of miRNApatterns. Expression of single miRNAs also differed sig-nificantly between the two groups. We subsequentlyanalyzed RNA editing as well as occurrence and frequencyof isomiR expression, and identified 13 candidates fornovel miRNAs of which three were further validated in70 primary NBs using RT-qPCR. To our knowledge, thisis the first comprehensive presentation of the compositionof the small RNA transcriptome of a primary tumor,using NB as a model system. By comparing tumors ofdivergent biology and clinical outcome, we also provideinsights into the heterogeneity of the small RNA tran-scriptomes in cancer.
MATERIALS AND METHODS
Sample preparation and RNA isolation
Written informed consent was obtained from all patients’representatives, and the study was approved by the insti-tutional review board. Serial cryosections were obtained
from all tumors. The first and last cryosections of eachseries were used to verify tumor cell content. Sampleswere only included in this study if the tumor cell contentwas >70 %. No systematic difference in tumor cell contentwas observed between samples from unfavorable and fa-vorable NBs included in this study. Cryosections not usedfor histological analysis were transferred to TRIzol(Qiagen, Hilden, Germany), and total RNA was extractedusing the miRNEASY kit (Qiagen) according to themanufacturer’s recommendations.
Small RNA library generation and sequencing
Libraries for deep sequencing were prepared from totalRNA according to the manufacturer’s protocol [SREK(small RNA expression Kit), Applied Biosystems, FosterCity, CA, USA]. Library integrity was controlled using aDNA 1000 Lab Chip on a Bioanalyzer (Agilent, SantaClara, CA, USA). Template bead preparation, emulsionPCR and deposition was performed according to thestandard protocol, and slides were analyzed on a SOLiDsystem V3 (Applied Biosystems).
Sequence processing and mapping
Mapping of SOLiD reads was performed using MAQ0.7.1-10 (Subversion revision 687). We allowed twomismatches for read lengths between 12 and 14 andthree mismatches for longer reads. Raw expressionvalues (read counts) were obtained by summing thenumber of reads that mapped uniquely to one of the ref-erence databases, Human Genome RefSeq Hg18,miRBase release 13.0, fRNAdb v3.1, RepBase 14.06,human UniGene sequences (July 2009) and Escherichiacoli (NCBI Nucleotides accession no. NC_000913). Theconfidence in a correct assignment of reads to maturemiRNAs was substantially increased by discarding readsnot uniquely mappable and by the error-correctingproperties of SOLiD sequencing. See SupplementaryFigure S1 for more details.
Normalization of read counts
To quantify and compare miRNA expression acrossdatasets, raw read counts were normalized using lineartransformations of each dataset. One dataset was chosenarbitrarily as a reference, and quantile–quantile (qq) plotsof the distribution of absolute count values >5 against allremaining datasets were compared in logarithmic space.The median of differences of corresponding quantilevalues of a dataset and the reference were computed.This corresponds to a pure scaling normalization, and de-termines the scaling factor in a robust manner from theqq-plot (S1,S4).
MiRNA RT-qPCR
Total RNA (20 ng) was reverse transcribed using theMegaplex RT stem–loop primer pool (AppliedBiosystems), enabling miRNA-specific cDNA synthesisfor 430 different human miRNAs and 18 small RNAcontrols. Subsequently, Megaplex RT products were
5920 Nucleic Acids Research, 2010, Vol. 38, No. 17
amplified using a two-step strategy described previously(14). All reactions were performed on the 7900 HT(Applied Biosystems) using the gene maximizationstrategy (14). MiRNA RT-qPCR data were normalizedas previously described (15). In contrast to the knownmiRNAs, PCR reactions for Seq 2, 6 and 12 were per-formed in a singleplex format. All RT-qPCR assayswere performed according to the MIQE guidelines (31),and respective information is provided in the supportingmaterial (Supplementary Figure S12). In singleplex andmultiplex assays, miRNAs with Ct (cycle threshold)values >40 or >35, respectively, were considered absent.Normalized expression values are reported inSupplementary Figure S13 (‘NaN’ if the miRNA wasabsent).
Statistical testing and cluster analysis
R 2.9.1 (http://www.r-project.org) was used for statisticaland clustering analysis. The rawp2adjp (raw P-value toadjusted P-value) function of the R library multtest wasused for Benjamini–Hochberg multiple testing correction(32,33). To assess the amount of 30-editing in maturemiRNAs, the nucleotide distribution (categories: A, C,G, T, missing) at each position in each miRNA in everydataset was obtained. To test for differential 30-editing, thenucleotide distributions were computed for each positionin each miRNA in each class, and the numbers wereaggregated over the five patients in each class. Tocompare nucleotide distributions in the Death ofdisease(DoD) and event-free survival(EFS) patientgroups (for fixed miRNA and fixed position), a chisquare statistic was computed as a difference measurefor miRNAs displaying >50 counts in each of bothgroups. Class labels were permuted in all 252 possiblecombinations, and the rank of the test statistic of thetrue class labels was converted into an empiricalP-value. Hierarchical clustering was performed based onCanberra distances, which allows to compare sequencingdata of different orders of magnitude withoutlog-transformation.
RESULTS
Sequencing of the non-coding RNA transcriptomesof 10 NBs
Small RNA transcriptomes from five NBs with favorablebiology and five MYCN-amplified NBs with unfavorablebiology [(patients had maximum divergent clinicalcourses: EFS or DoD, Table 1) were analyzed by NGSusing the SOLiD sequencer (Applied Biosystems)]. A totalof 188 821 076 sequencing reads were obtained. Of allreads analyzed, 57% contained no adapter sequence,indicating that a fragment of at least 35 nt was sequenced.Read length distribution after adapter removal revealedfour peaks at 12, 17, 21–23 and 35 nt (Figure 1A andSupplementary Figure S2). This peak distribution wasconsistent with results from other ncRNA deepsequencing runs with the same system. The peak at21–23 nt indicates that mature miRNAs were enriched inthe sequenced samples.
Library composition and mapping results
Library composition was determined by mapping all readslonger than 12 nt to the human genome. Annotation wasbased on annotation tracks included in the UCSC genomebrowser, the functional RNA database, fRNAdb (34) andmiRBase (35). MiRNAs were identified and quantified bysimultaneously mapping reads against the human genome,pre-miRNAs in miRBase and mature miRNAs inmiRBase. About 40 % of the sequences were mappableusing this approach. Unmappable sequences were neitherrepetitive, nor represented unknown transcripts, nor weredue to contamination, as they rarely mapped againstRepBase (36), UniGene transcript clusters (37) or theE. coli genome. The vast majority of these unmappedreads of unknown origin were 35 nt long, which was themaximum detectable length in this experimental setting.Absence of the adapter sequence indicated that theoriginal sequence probably exceeded 35 bp.The average ratio of mRNA/ncRNA was about 1:5
among mappable reads (Figure 1B). The proportion ofmiRNAs among the non-coding RNA ranged from30 to >80%, with tRNA being the other major ncRNAspecies (Figure 1C). On average, 5% of all sequences(range 2.6–12.1%) were identified as mature miRNAsand 6.1% as pre-miRNAs. The absolute number ofreads and the fraction mapped to mature miRNAsvaried across the datasets (Supplementary Figure S3). Atrend toward a higher proportion of mature miRNAs intumors from EFS patients was detected (65% versus55%), but was not significant due to the low number ofcases analyzed. In summary, most of the mappable se-quences were non-coding RNAs, with miRNAs beingthe major constituent.Among those reads successfully mapped to mature
miRNAs, 6.3% of all positions in SOLiD color spacedid not match the reference sequence. After conversionof data from color to nucleotide space, 2.6% mismatchesremained. This fraction includes sequencing errors as wellas SNPs and post-transcriptional editing events. Technicalsequencing errors were equally distributed over all pos-itions analyzed and were well below the rate of
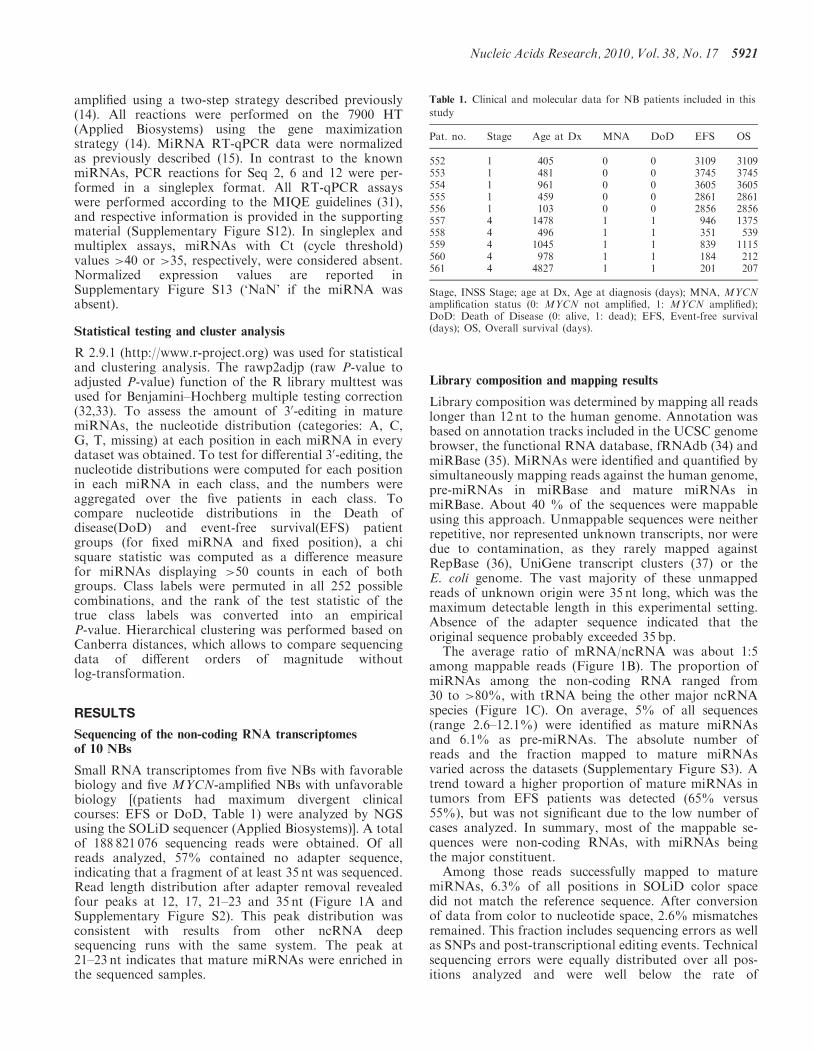
Table 1. Clinical and molecular data for NB patients included in this
study
Pat. no. Stage Age at Dx MNA DoD EFS OS
552 1 405 0 0 3109 3109553 1 481 0 0 3745 3745554 1 961 0 0 3605 3605555 1 459 0 0 2861 2861556 1 103 0 0 2856 2856557 4 1478 1 1 946 1375558 4 496 1 1 351 539559 4 1045 1 1 839 1115560 4 978 1 1 184 212561 4 4827 1 1 201 207
Stage, INSS Stage; age at Dx, Age at diagnosis (days); MNA, MYCNamplification status (0: MYCN not amplified, 1: MYCN amplified);DoD: Death of Disease (0: alive, 1: dead); EFS, Event-free survival(days); OS, Overall survival (days).
Nucleic Acids Research, 2010, Vol. 38, No. 17 5921

mismatches caused by SNPs and post-transcriptionalediting events (Figure 3D and Supplementary Figure S1).
Correlation of miRNA sequencing counts toRT-qPCR results
Sequencing counts were normalized (SupplementaryFigure S1 and S4) between datasets to account for rawcounts of different magnitudes. To independentlyvalidate miRNA deep sequencing data, we examined thecorrelation between normalized sequencing counts and ex-pression determined by RT-qPCR. The Pearson’s correl-ation coefficient between sequencing and RT-qPCR datawas calculated for 204 miRNAs across the 10 patients.Expression of most miRNAs was highly correlatedbetween the technical platforms (Figure 1D). This wasalso confirmed on the level of individual datasets(Supplementary Figure S5), with Pearson’s correlation co-efficients ranging from 0.57 to 0.67 for each tumor. Weconclude that normalized expression values obtained frommiRNA deep sequencing are valid and comparable toRT-qPCR data.
Analysis of known NB-related miRNAs
We first analyzed miRNAs previously reported to be dif-ferentially expressed in NB, comprising all miRNAs of themiR-17-92 cluster (9,15–17), miRNAs of the miR-181family (9), miR-542-5p [(20) and Schulte et al, submittedfor publication] and miR-628-5p (21). Differential expres-sion of these miRNAs between favorable and unfavorableNBs were consistent with published results (Figure 2A).
Absolute quantification using NGS revealed that theoncogenic miRNAs of the miR17-92 cluster and themiR-181 family, which were previously shown to beupregulated in unfavorable NB (9), were also readily de-tectable in favorable NBs. The putative tumor-suppressivemiR-542-5p and miR-628-5p were moderately expressedin favorable NBs, and nearly absent in unfavorable NBs.MiR-34a, which has been described to have tumor-suppressive functions, was not differentially expressed infavorable versus unfavorable NBs in this study. Takentogether, all miRNAs previously linked to NB biologywere also identified in this study.
Unbiased analysis of mature miRNAs discriminatingfavorable from unfavorable NB
We aimed to identify other miRNAs differentially ex-pressed in favorable versus unfavorable NB using anunbiased approach. Only mature miRNAs representedby more than five raw counts in at least five datasetswere considered. These criteria were met by 465miRNAs, including 105 miRNA* and 45 miRNA-3p se-quences. A total of 76 miRNAs were differentially ex-pressed based on a t-test (uncorrected P< 0.05). SeeFigure 2B for the top 40 miRNAs. In an unsupervisedcluster analysis, these 76 miRNAs separated the EFSand DoD classes (Figure 2C). Classes were still separatedwhen all 465 expressed miRNAs were used(Supplementary Figure S6).
Due to the small sample size, only miR-181a-2*remained statistically significant when Bonferroni
02
46
8Histogram of read lengths
Ave
rage
per
cent
age
Fre
quen
cy
010
2030
40Coding mRNA vs.non−coding RNA
Per
cent
age
of R
NA
−an
nota
ted
read
s0
2040
6080
100
552
553
554
555
556
557
558
559
560
561
Identified non−codingRNA species
Per
cent
age
of n
cRN
A−
anno
tate
d re
ads
misc. RNAMt. tRNAsnRNAscRNAsnoRNArRNAtRNAmiRNA
mRNAncRNA
020
4060
8010
0
552
553
554
555
556
557
558
559
560
561
32292623201714118642 35
Correlations between measured miRNAexpression in rtPCR and sequencing
1.00.50.0−0.5−1.0
Pearson’s product−moment correlation
A
D
B C
unfavorableneuroblastoma
favorableneuroblastoma
unfavorableneuroblastoma
favorableneuroblastoma
Figure 1. NGS of the small RNA transcriptome. (A) Read length distribution (nt) after adapter removal. The y-axis depicts the percentage of readlengths relative to the total number of reads in each dataset, averaged over all datasets. The peak at length 35 is off scale, its actual height is 57%.Read lengths too short for mapping are shown in gray. (B) Proportion of non-coding (green) versus coding (yellow) RNA for each sample.The proportion of ncRNA is >80% in all but two samples analyzed. (C) Distribution of ncRNA species in the samples analyzed. (D) Histogramof Pearson’s correlation coefficients between logarithmic normalized miRNA expression values derived from sequencing versus negative normalizedRT-qCt values (15) (displayed for 204 miRNAs available for comparison).
5922 Nucleic Acids Research, 2010, Vol. 38, No. 17

correction for multiple testing was applied. However, thefrequency of low P-values for differential expression washigher than expected assuming a random distribution(Figure 2D). This P-value distribution indicates differen-tial miRNA expression patterns in favorable versus un-favorable NBs.
Expression of miRNAs from the 50 and 30 arms ofpre-miRNAs
We analyzed the ratios of expressions of miRNAs from50 and 30 arms of pre-miRNAs. First, we examined
miRNAs previously linked to NB biology (Figure 3A)and observed that all miR*/miR pairs (3–9 inFigure 3A) were found, as expected, at ratios below15%. We furthermore noted a linear correlation of loga-rithmic expressions (r=0.75). For the two miR-5p/miR-3p pairs, no clear bias toward one form wasobserved (1–2 in Figure 3A). When analyzing all miR*/miR pairs, 60.6% of all pairs show a ratio of <15%.(Figure 3B). For miRNAs with high abundance (�100counts for at least one sibling), this is true for 79%.Expression values of all mir-5p/miR-3p pairs are shown
in Figure 3C. Here, for 37.3% of all pairs, the expression
miR−27amiR−199b−5pmiR−99amiR−181amiR−95miR−766miR−197miR−485−5pmiR−411*miR−539miR−1249miR−331−3pmiR−25miR−194miR−1248miR−641miR−1290miR−181a*miR−550*miR−18a*miR−7−2*miR−1308miR−325miR−323−5pmiR−431*miR−340miR−628−5pmiR−542−3pmiR−196amiR−383miR−224*miR−34a*miR−2110miR−190miR−566miR−34bmiR−105*miR−1179
miR−27bmiR−193bmiR−214miR−199a−5pmiR−296−5pmiR−137miR−744miR−340*miR−504miR−324−5pmiR−432miR−129−5pmiR−149miR−17miR−192*miR−103−2*miR−665miR−1miR−105miR−378miR−550miR−15b*
miR−135a*miR−379*miR−654−5pmiR−339−3pmiR−488*miR−542−5pmiR−935miR−1287miR−195*miR−628−3pmiR−450alet−7a−2*miR−575miR−627miR−1259
miR−181a−2*
A
B
p−value
Histogram of p−values
Fre
quen
cy
000.05
0.2
Clustering based on significant miRNAsC
D55
2
553
554
555
556
557
558
559
560
561
unfavorableneuroblastoma
favorableneuroblastoma
0.00010.00030.00200.00330.00370.00510.00590.00610.00710.00720.00820.00990.01000.01140.01140.01170.01180.01290.01510.01550.01680.01680.01910.01920.01920.01970.02100.02100.02130.02200.02300.02330.02420.02500.02510.02520.02590.02710.02780.0279
181a−2*1249411*197431*14925654−5p181a744575542−5p432105*3786417661308324−5p95196a542−3p27a488*34a*628−5p105331−3p383199a−5p323−5p55034b190485−5p325137628−3p7−2*504
000,010011
Normalized counts
miRNAs separating classes bestp−value
0.02920.75630.29610.28170.16630.05570.00710.05180.00990.0197
1718a19a20a19b92a181a181b542−5p628−5p
000,010011
Normalized counts
miRNAs previously associated with neuroblastomamiR
0.02660.06550.27550.27550.27550.27550.27550.27550.27550.27550.27550.27550.27550.27550.27550.27550.27550.27550.27550.27550.27550.27550.27550.27550.27550.27550.27550.27550.27550.27550.27550.27550.27550.27550.27550.27550.27550.27550.27550.2755
p−valuemiRadjustedraw
0.07300.75630.32900.32900.2375
0.04930.09290.04930.0656
0.0929
p−value p−valueadj.raw
0.4 0.6 0.8 1.0
20
10
Figure 2. Differential miRNA expression between favorable and unfavorable NB is presented as strip chart of normalized read counts. (A,B) Valuesfor absent miRNAs were set to 0.5 to be visible on the logarithmic axis. MiRNA designations as well as raw P-values of t-tests on class means foreach miRNA using the logarithmic normalized counts are shown. Additionally, FDR-adjusted P-values are shown. Those were calculated to correctfor the number of hypothesis tested, i.e. 10 miRNAs in A and all 465 expressed miRNAs in B. Blue crosses depict EFS datasets and red circles referto DoD datasets. (A) Expression data (normalized counts) for known NB-associated miRNAs. (B) Expression data (normalized counts) for the 40best class-separating miRNAs. Rows are sorted according to raw p-values. These data indicate that previously NB-associated miRNAs (e.g. miR-17and miR542-5p) as well as newly identified miRNAs are differentially expressed between favorable and unfavorable NB. (C) Heat map and clusterdendrogram of the most significant 76 miRNAs (uncorrected P-value <0.05). The EFS (552–556) and DoD (557–561) classes are clearly separated.Clustering was based on Canberra distance and single-linkage clustering. Blue: low expression, yellow: high expression. (D) Histogram of uncorrectedp-values after testing equality of expression count means between EFS versus DoD classes for each miRNA. When testing data with equal means, thedistribution of P-values is expected to be uniformly distributed across the unit interval (blue line). Here, P-values <0.05 (red line) are enriched.
Nucleic Acids Research, 2010, Vol. 38, No. 17 5923

ratio is either <0.15/1 or >1/0.15 suggesting that thosecould rather represent miR/miR* pairs. Further studiesare warranted to investigate whether these results arecommonly found or if they are specific for cancer oreven for NB. In some instances, the -3p form was predom-inant; e.g. hsa-miR-324-3p had on average >200-foldhigher expression counts than hsa-miR-324-5p.In Figure 3, no global difference between DoD and EFS
classes with respect to use of the different miRNA forms isobvious. To identify possible differences on the level ofindividual pairs, we performed t-tests for all 117 pairs(comprising 38 miR-5p/miR-3p and 79 miR/miR* pairs).After correction for multiple testing using theBenjamini–Hochberg method, no significant resultsremained (Supplementary Figure S10).
Analysis of editing of mature miRNAs
Editing of miRNAs has been reported to occur frequently(27). In our dataset, mismatches with regard to the refer-ence sequence were highly biased toward the 30-end ofsequenced miRNAs, in line with previous reports ofmiRNA editing (13). Additionally, missing nucleotidesat the 30-end of mature miRNAs were also observed, aswell as terminal additions of nucleotides (Figure 3D,Supplementary Figure S11C).The technical sequencing error rate is well below the
rate of mismatches and remains approximately constantacross miRNA positions (Supplementary Figure S1). Wealso ruled out that mismatches can be explained byspurious editing sites due to homology to other miRNAsor tRNAs (38), . Most of the sequencing errors are cor-rected during conversion from SOLiD color space to nu-cleotide space and our mapping algorithm excludesambigous reads instead of allocating them randomly.We also observed a substantial number of ‘A to I’
editing events (0.7%). However, further substantial
amounts of editing events were observed for G!A(1.5% of all uniquely mapped reads), U!C (1.2%) andU!A (1.1%). Among the miRNAs undergoing A to Iediting were miR-376a and miR-376c, miRNAs with pre-viously described editing sites (Supplementary FigureS11B) (38,39). Individual miRNAs were differentially30-edited in favorable and unfavorable NBs, includinghsa-miR-337-3p (P=0.008 at position �1, P=0.004 atposition �2), hsa-miR-17*, and hsa-miR-301a (P=0.008at positions �1 and �2 for both miRNAs). However, nosignificant global difference in miRNA editing wasdetected between the two groups as histograms of empir-ical P-values for each nucleotide position resembled auniform distribution (Supplementary Figure S7).
Terminal additions were found in 29.1% of all uniquelymapped miRNAs and the majority of these additions(63.1%) were non-template additions. Of those, single nu-cleotide terminal additions were predominant (67.2%).Addition of two or three bases was observed in 27.3%and 5.5%, respectively. In summary, most of these add-itions were single-nucleotide non-template adenosine oruracil additions (Supplementary Figure S11C), in accord-ance with published datasets (13,24,40,41).
In addition to the first description of miRNA terminaladditions in NB, our study confirmed that editing ofmiRNAs was mainly restricted to the 30 end, and thatdifferential editing between favorable and unfavorableNBs was detectable for single miRNAs, but not as aglobal phenomenon.
Prediction of putative new miRNAs
To discover hitherto unknown miRNAs, a customized,efficiency-improved version of the miRDeep softwarepackage (42) was developed to analyze all reads mappedto the human genome. Since miRDeep utilizes no infor-mation on known miRNAs, de novo discovery of miRNAs
B
Expression of miRex
pres
sion
of m
iR*
xo EFSDoD
1 100 10,0001
100
10,0
00
xx
x
x
x
x
x
x
x
xx
x
x
xx
x
x
x
x
x
xx x
x
x
x
x
x
x
x x
x
xx
xx
x
xxx
x
x
xxx
x
x
x
x
x
x
x
x
x
xx
x
x
x x
x
x
xx x
x x
x
x
oo
o oo
oo
o
oooo
o
oo
oo
o
o
o
o
o
o
o
o
o
oo
o
o
oo
o
oo
o
oo
o
o
ooo o
o
o
o o
o
o
oo
o
o
o
o
ooo
o
oo
o
ooo
oo
ooo
A
1 100 10,000
110
010
,000
Expression of miR/miR−5p
Exp
ress
ion
of m
iR*/
miR
−3p
123456789
miR−628−5p vs. −628−3pmiR−542−5p vs. −542−3pmiR−181a vs. −181a*miR−181a vs. −181a−2*miR−92a vs. −92a−1*miR−19b vs. −19b−1*miR−20a vs. −20a*miR−18a vs. −18a*miR−17 vs. −17*
1
2
3456
782 3
4 567
8
9
D
0%
10%
20%
30%
40%
50%
−15 −13 −11 −9 −7 −5 −3 −1
Position in mature miRNA
missing bases
3' miRNA variation averagedover all datasets
mismatches
Expression of miR−5p
C
1 100 10,000
110
010
,000
Exp
ress
ion
of m
iR−
3p
x
x
x
x
xx
x
xxx x
x
xx
x
xx
x
x
x
xx
x
xxx
x
x
x x
x
x
x
x
xx
x
x
o
o
oo
o
o
oo
o
oo
o
o ooo
o
o
o
oo
o
o
o
o
o
o o
o
oo
o
oo
o
o
xo EFSDoD
++++++++++++++
Figure 3. Analysis of expressions of miR/miR* pairs, miR-5p/miR-3p pairs and isomiRs. (A, B, C) Scatter plots are shown, in which each data point(cross, circle, digit) represents expression of a miRNA pair (x-axis: standard or -5p form; y-axis: star or -3p form) in a patient class (blue: EFS, red:DoD). Values for each miRNA pair are presented as log 10 of the geometric average of the five individual patient expression values. The black lineindicates the main diagonal x= y. Dotted lines indicate ratios 1:0.15 and 0.15:1. (A) Expression correlation between miRNA-5p and miRNA-3pforms (labeled as 3–9) and standard and star forms (labeled as 1 and 2) for miRNAs known to be involved in NB. (B) Expression correlationbetween standard and star forms of all expressed miRNAs. (C) Expression correlation between miRNA-5p and miRNA-3p forms of all expressedmiRNAs. (D) Global 30-editing in mature miRNAs. The x-axis indicates the position in each miRNA (�1 corresponds to the most 30 position). Thedata are aggregated over all tumors and all miRNAs analyzed and provide a global picture of 30-editing. Position �6 has the highest overall chanceof being different from its reference. The blue curve shows the estimated position-specific sequencing error probability (Supplementary Figure S1).Each blue cross represents one position in SOLiD color space. The sequencing error probability in nucleotide space is considerably lower, as manyerrors are corrected during conversion from color to nucleotide space.
5924 Nucleic Acids Research, 2010, Vol. 38, No. 17

is performed. MiRDeep provides a score integrating dif-ferent measures of prediction quality, with a score of >1.0being a good indicator for a true pre-miRNA(Supplementary Figure S8). In total, 64% of predictedmiRNAs exactly matched an entry in miRBase. Ofnon-perfect matches, 24 sequences contained no knownmiRNA motifs, and were represented in at least threedifferent datasets. A BLAST search revealed little or nohomology to described miRNA sequences (E-value> 0.1)for 13 of these 24 sequences, which represent strong can-didates for new miRNAs (Supplementary Figure S9,Figure 4A). Of these potential novel miRNAs, threemiRNAs were selected for validation based on differentialexpression levels (Seq 6 and Seq 12) or high expressionlevels (Seq 2). Prediction of RNA secondary structuresrevealed a stem–loop configuration for all three sequences(Figure 4B). RT-qPCR confirmed detectable expressionof Seq 2 in 69 out of 70 primary NBs (SupplementaryFigure S13). Furthermore, expression of Seq 6 or high
expression of Seq 12 were associated with adverseoutcome in Kaplan–Meier analysis (Figure 4C). Thesefindings underscore the power of sequencing approachesin discovering novel transcriptional units.
DISCUSSION AND CONCLUSION
NGS is an ideal method to identify transcripts in anunbiased and unselected fashion. It does not require apriori knowledge of the sequence of the RNA species tobe detected, but provides exact sequence information. Inaddition, NGS allows for absolute and exact quantifica-tion. Reports on deep sequencing of the RNAome andsome of the technical difficulties encountered have beenpublished (24–28). It was recently shown that miRNAsequencing using the SREK protocol differs fromsequencing of libraries that rely on ligation of ‘modban’adapters (25,43). In contrast to library generation,sequencing alone appears to introduce only a minor biasinto the process of NGS. Therefore, different strategies ofRNA species pre-selection and adapter ligation should beevaluated using independent validation methods, e.g.RT-qPCR.To the best of our knowledge, this is the first study to
compare the small RNA transcriptomes in biologicalgroups on a statistical basis. For this purpose, we used10 primary NBs with very heterogeneous clinical coursesand compared patients cured of their disease to patientswho died from the tumor. We detected significant andspecific differential miRNA expression in these twogroups. Cluster analyses were able to separate thegroups exactly. This finding supports the notion thattumor aggressiveness is reflected in the miRNAtranscriptome.We further focused on the analysis of miRNAs that
were previously proposed to be differentially expressedbetween favorable and unfavorable NBs. The miRNAsof the miR-17-92 cluster are expressed as a longprimary, polycistronic transcript, and are prototypic ofoncogenic miRNAs [reviewed in (16)]. The miR-17-92cluster is sufficient to transform hematopoetic cells (44),and is regulated by transcription factors of the MYCfamily (15,45). In NB, miR-17-92 expression correlateswith MYCN amplification and adverse outcome (9,16),which was also confirmed in the data presented here.Our study is also the first to report absolute expressiondata of the miR-17-92 cluster in malignant tumors.Interestingly, the tumor-suppressive miRNAs, miR-542-5p and miR-628, are moderately expressed in favor-able NBs and nearly absent in unfavorable NBs. The roleof known players of the small RNAome in NB was con-firmed in this study, and these miRNAs were absolutelyquantified for the first time.We also used an unbiased approach to analyze other
miRNAs differentially expressed between the two diver-gent clinical groups in our study. Comparing the distribu-tion of raw P-values to the uniform distribution expectedfor random data revealed an enrichment of small P-values(Figure 2D), indicating a principle difference betweenthe small miRNA transcriptomes of favorable and
1.0
0.8
0.6
0.4
0.2
0
1.0
0.8
0.6
0.4
0.2
0
Cum
ulat
ive
surv
ival
0 1,0002,000
3,0004,000
5,0000 1,000
2,0003,000
4,0005,000
)syad(SFE)syad(SFE
Seq. no. p−value
1 10 100 1,000 10,000Normalized counts
510.0=p330.0=p
Seq. 6 Seq. 12 Seq. 2
21.qeS6.qeS
0.01410.07580.08260.19210.20780.21510.25050.29680.36740.39400.60010.84540.9214
6125
13194
1127
1038
A
B
C
Figure 4. (A) Expression levels of putative new miRNA in favorable(blue) and unfavorable (red) NB, as measured by sequencing. (B) RNAsecondary structure of RT-qPCR-validated novel miRNAs as predictedby RNAfold. (C) Kaplan–Meier survival curves for patients with(green) and without (red) Seq 6 expression and low (green) and high(red) Seq 12 expression. For the latter analysis, the 40th percentile waschoosen as a cutoff.
Nucleic Acids Research, 2010, Vol. 38, No. 17 5925

unfavorable NB. This observation was further supportedby the fact that clustering based on all miRNAs resulted ina robust separation of both groups (SupplementaryFigure S6). However, identification of single differentiallyexpressed miRNAs were complicated by the small numberof cases analyzed. After correction for multiple testing,only one miRNA, miR-181a-2*, remained significant.We therefore report the 40 most differentially expressedmiRNAs ranked according to their raw P-values(Figure 2B). A substantial number of miRNAs amongthe 40 most differentially expressed miRNAs show expres-sion patterns in accordance with published results. ThesemiRNAs include miR-25 (20), miR-181a (9), miR-542-5p(20), miR-324-5p (9), miR-628-3p (21), miR-323-5p (9,20),miR-654 (20), miR-190 (20) and miR-149 (20). In contrastto Loven et al. (46), we here report miR-199 to beupregulated in unfavorable NB. However, while Lovenet al. solely refer to an in vitro system, we previouslyreported miR-199 to be upregulated in an independentcohort of MYCN-amplified unfavorable primary tumors(16), supporting our current results. Most surprisingly,several miR* forms were identified among thesemiRNAs, including miR-181a-2*, which was also ex-pressed at very high absolute levels. The high numberand abundance of miR* forms is consistent with recentreports (24,26,47), and motivated us to further analyzethe expression of miR-5p/-3p pairs in our dataset.Interestingly, there was a high correlation of the expres-
sion ratios of miR and respective miR* forms in miRNAspreviously reported to be differentially expressed in NB(Figure 2A). Expression of these miRNA pairs reflectedthe expected expression ratio of miR*/miR pairs below0.15. When all miRNAs were considered (Figure 3B), wefound that some star forms are expressed at higher levelsthan their non-star counterparts, but we note that this ismainly restricted to miRNAs with overall low expression.Therefore, the observed results are in agreement with thenaming convention. One could have hypothesized that thismight be different in tumors, but our data provide noevidence for this in NB. Finally, we focus on miR-3pversus miR-5p expression (Figure 3C), as in NB neitherthe expression of most miR-3p forms nor the ratiobetween miR-5p and -3p has been analyzed before. Ingeneral, we observe higher expression of miR-3p thanmiR* as compared to their respective siblings, which isagain consistent with the naming convention. Althoughthe presence and in very few instances high abundanceof miR-3p has been described before, we here confirmthis finding in NB and report some miRNAs with remark-ably high miR-3p/-5p ratios in NB (e.g. miR-324). On theother hand, some miR-3p/-5p ratios are very low, and ourfindings might hint at the fact that these miRNAs have tobe reclassified. Most interestingly, no systematic differ-ences were found in miR-5p/-3p ratios observed betweenthe clinically defined EFS and DoD groups analyzed here.Nevertheless, differences for single miRNAs with regardto the corresponding sibling were identified between thesetwo groups, but did not remain significant after multipletesting correction (Supplementary Figure S10). Weconclude that the relative stability of both miRNAforms is either not regulated differentially in NB of
divergent clinical course or that differences are subtleand can only be detected in a larger cohort.
Sequencing-based approaches can also give insight intofine tuning of miRNA expression by editing. We confirmprevious findings that editing of miRNAs is most prom-inent at the 30-end (27). Although a substantial proportionof editing events detected in this study can be explained bythe previously described A to I editing, other editingevents (e.g. G to A) detected here have not yet beendescribed, and the mechanisms involved remain elusive.The most frequently edited positions are �1 and �6 (pos-itions with regard to the 30-end found in miRBase).Surprisingly, base changes at position�6 were consistentlyobserved more often than base changes at position �1. Itremains to be elucidated whether this is a biological phe-nomenon or reflects an inherent breakpoint. The latterhypothesis is supported by the observation that a majormiRNA-like fraction of size 17 bp was detected(Figure 1A). Regarding inconsistencies with referencemiRNA sequences, we also detected missing bases at pos-itions �1 and �2 as well as terminal additions, mainly ofthe nucleotides A and U (Supplementary Figure S11 fordetails). The latter phenomenon is consistent withprevious reports (13,24,40,41) and might be involved instabilization of the respective miRNAs. Of note, no dif-ference was observed between favorable and unfavorableNB. It has to be emphasized that the conservativemapping approach used in this study also preventedthe detection of spurious editing sites due to homologyof miRNAs and tRNAs (detailed description of editingevents are included as Supplementary Figure S11).
In addition to the analysis of known miRNAs, we alsosought to identify new miRNAs. For this purpose, weused the miRDeep algorithm to identify miRNAswithout prior information (42). Application of miRDeepto our sequenced RNA data produced a significant pro-portion of predicted miRNAs (>60%) that were knownand validated. Clustering and additional filtering methodsresulted in the identification of 13 putative novel miRNAsin this study, three of which were the subject of furtherconfirmatory analysis. Indeed, expression of thesemiRNAs was confirmed in a larger NB-cohort (n=70)using RT-qPCR, with two of the three miRNAs beingassociated with clinical course. However, the functionalimplication of these novel putative miRNAs in NBtumor biology remains to be explored.
We detected expression differences of miRNAs betweenfavorable and unfavorable NB, including differential ex-pression of previously known oncogenic and tumor-suppressive miRNAs. Based on our results, it can beexpected that miRNA profiling will also be of generalvalue for assessment of aggressiveness in other tumorentities. Our data provide absolute miRNA expressioncounts and novel insights into the correlation of miR/miR* expression as well as addressing the phenomenonof miRNA editing in a variety of isomiRs. The functionalimplication of miRNA editing in tumor biology warrantsfurther analysis. We conclude that NGS is a valid tool toexplore the quantitative and qualitative differences in thesmall RNA transcriptomes of primary tumors.
5926 Nucleic Acids Research, 2010, Vol. 38, No. 17

ACCESSION NUMBER
Sequencing data is available at the NCBI Sequence ReadArchive (SRA) (http://www.ncbi.nlm.nih.gov/Traces/sra/,accession no. SRA009986).
SUPPLEMENTARY DATA
Supplementary Data are available at NAR Online.
ACKNOWLEDGEMENTS
We thank Frank Berthold and Barbara Hero from theGerman Neuroblastoma Study Trial Office for providingclinical data and tumor material. The authors would liketo acknowledge the valuable technical help and expertiseof Markus Schilhabel and Lena Bossen.
FUNDING
National Genome Research Network (NGFNplus grantno. PKN-01GS0894-5b to J.H.S., A.E. and A.S.) GermanMinistry for Education and Research (BMBF); EuropeanUnion (Framework 6, EET-Pipeline, contract 15 no.037260 to J.H.S., A.E. and A.S.). Funding for openaccess charge: Institution (University Children’sHospital); German Clusters of Excellence ‘‘Inflammationat Interfaces’’ and ‘‘The Future Ocean’’ as well as theNGFNplus Network ‘‘Environmental Disorders’’ (toP.R. and S.S.).
Conflict of interest statement. None declared.
REFERENCES
1. Winter,J., Jung,S., Keller,S., Gregory,R.I. and Diederichs,S.(2009) Many roads to maturity: microRNA biogenesis pathwaysand their regulation. Nat. Cell Biol., 11, 228–234.
2. Bartel,D.P. (2004) MicroRNAs: genomics, biogenesis, mechanism,and function. Cell, 116, 281–297.
3. Esquela-Kerscher,A. and Slack,F.J. (2006) Oncomirs—microRNAswith a role in cancer. Nat. Rev. Cancer, 6, 259–269.
4. Garzon,R., Calin,G.A. and Croce,C.M. (2009) MicroRNAs incancer. Annu. Rev. Med., 60, 167–179.
5. Brodeur,G.M. (2003) Neuroblastoma: biological insights into aclinical enigma. Nat. Rev. Cancer, 3, 203–216.
6. Maris,J.M., Hogarty,M.D., Bagatell,R. and Cohn,S.L. (2007)Neuroblastoma. Lancet, 369, 2106–2120.
7. Schwab,M., Westermann,F., Hero,B. and Berthold,F. (2003)Neuroblastoma: biology and molecular and chromosomalpathology. Lancet Oncol., 4, 472–480.
8. Afanasyeva,E.A., Hotz-Wagenblatt,A., Glatting,K. andWestermann,F. (2008) New miRNAs cloned from neuroblastoma.BMC Genomics, 9, 52.
9. Chen,Y. and Stallings,R.L. (2007) Differential patterns ofmicroRNA expression in neuroblastoma are correlated withprognosis, differentiation, and apoptosis. Cancer Res., 67,976–983.
10. Cole,K.A., Attiyeh,E.F., Mosse,Y.P., Laquaglia,M.J., Diskin,S.J.,Brodeur,G.M. and Maris,J.M. (2008) A functional screenidentifies miR-34a as a candidate neuroblastoma tumorsuppressor gene. Mol. Cancer Res., 6, 735–742.
11. Evangelisti,C., Florian,M.C., Massimi,I., Dominici,C.,Giannini,G., Galardi,S., Bue,M.C., Massalini,S., McDowell,H.P.,Messi,E. et al. (2009) MiR-128 up-regulation inhibits reelin and
DCX expression and reduces neuroblastoma cell motility andinvasiveness. FASEB J., 23, 4276–4287.
12. Fontana,L., Fiori,M.E., Albini,S., Cifaldi,L., Giovinazzi,S.,Forloni,M., Boldrini,R., Donfrancesco,A., Federici,V.,Giacomini,P. et al. (2008) Antagomir-17-5p abolishes the growthof therapy-resistant neuroblastoma through p21 and BIM.PLoS ONE, 3, e2236.
13. Landgraf,P., Rusu,M., Sheridan,R., Sewer,A., Iovino,N.,Aravin,A., Pfeffer,S., Rice,A., Kamphorst,A.O., Landthaler,M.et al. (2007) A mammalian microRNA expression atlas based onsmall RNA library sequencing. Cell, 129, 1401–1414.
14. Mestdagh,P., Feys,T., Bernard,N., Guenther,S., Chen,C.,Speleman,F. and Vandesompele,J. (2008) High-throughputstem-loop RT-qPCR miRNA expression profiling using minuteamounts of input RNA. Nucleic Acids Res., 36, e143.
15. Mestdagh,P., Vlierberghe,P.V., Weer,A.D., Muth,D.,Westermann,F., Speleman,F. and Vandesompele,J. (2009) A noveland universal method for microRNA RT-qPCR datanormalization. Genome Biol., 10, R64.
16. Schulte,J.H., Horn,S., Otto,T., Samans,B., Heukamp,L.C.,Eilers,U., Krause,M., Astrahantseff,K., Klein-Hitpass,L.,Buettner,R. et al. (2008) MYCN regulates oncogenic MicroRNAsin neuroblastoma. Int. J. Cancer, 122, 699–704.
17. Wei,J.S., Johansson,P., Chen,Q., Song,Y.K., Durinck,S., Wen,X.,Cheuk,A.T.C., Smith,M.A., Houghton,P., Morton,C. et al. (2009)microRNA profiling identifies cancer-specific and prognosticsignatures in pediatric malignancies. Clin. Cancer Res., 15,5560–5568.
18. Wei,J.S., Song,Y.K., Durinck,S., Chen,Q., Cheuk,A.T.C.,Tsang,P., Zhang,Q., Thiele,C.J., Slack,A., Shohet,J. et al. (2008)The MYCN oncogene is a direct target of miR-34a. Oncogene,27, 5204–5213.
19. Welch,C., Chen,Y. and Stallings,R.L. (2007) MicroRNA-34afunctions as a potential tumor suppressor by inducing apoptosisin neuroblastoma cells. Oncogene, 26, 5017–5022.
20. Bray,I., Bryan,K., Prenter,S., Buckley,P.G., Foley,N.H.,Murphy,D.M., Alcock,L., Mestdagh,P., Vandesompele,J.,Speleman,F. et al. (2009) Widespread dysregulation of MiRNAsby MYCN amplification and chromosomal imbalances inneuroblastoma: association of miRNA expression with survival.PLoS ONE, 4, e7850.
21. Mestdagh,P., Fredlund,E., Pattyn,F., Schulte,J.H., Muth,D.,Vermeulen,J., Kumps,C., Schlierf,S., Preter,K.D., Roy,N.V. et al.(2010) MYCN/c-MYC-induced microRNAs repress coding genenetworks associated with poor outcome in MYCN/c-MYC-activated tumors. Oncogene, 29, 1394–1404.
22. Schulte,J.H., Horn,S., Schlierf,S., Schramm,A., Heukamp,L.C.,Christiansen,H., Buettner,R., Berwanger,B. and Eggert,A. (2009)MicroRNAs in the pathogenesis of neuroblastoma. Cancer Lett.,274, 10–15.
23. Stallings,R.L. (2009) MicroRNA involvement in the pathogenesisof neuroblastoma: potential for microRNA mediated therapeutics.Curr. Pharm. Des., 15, 456–462.
24. Kuchenbauer,F., Morin,R.D., Argiropoulos,B., Petriv,O.I.,Griffith,M., Heuser,M., Yung,E., Piper,J., Delaney,A., Prabhu,A.et al. (2008) In-depth characterization of the microRNAtranscriptome in a leukemia progression model. Genome Res., 18,1787–1797.
25. Linsen,S.E.V., deWit,E., Janssens,G., Heater,S., Chapman,L.,Parkin,R.K., Fritz,B., Wyman,S.K., deBruijn,E., Voest,E.E. et al.(2009) Limitations and possibilities of small RNA digital geneexpression profiling. Nat. Methods, 6, 474–476.
26. Morin,R.D., O’Connor,M.D., Griffith,M., Kuchenbauer,F.,Delaney,A., Prabhu,A., Zhao,Y., McDonald,H., Zeng,T., Hirst,M.et al. (2008) Application of massively parallel sequencing tomicroRNA profiling and discovery in human embryonic stemcells. Genome Res., 18, 610–621.
27. Nygaard,S., Jacobsen,A., Lindow,M., Eriksen,J., Balslev,E.,Flyger,H., Tolstrup,N., Møller,S., Krogh,A. and Litman,T. (2009)Identification and analysis of miRNAs in human breast cancerand teratoma samples using deep sequencing. BMC Med.Genomics, 2, 35.
28. Wyman,S.K., Parkin,R.K., Mitchell,P.S., Fritz,B.R.,O’Briant,K., Godwin,A.K., Urban,N., Drescher,C.W.,
Nucleic Acids Research, 2010, Vol. 38, No. 17 5927

Knudsen,B.S. and Tewari,M. (2009) Repertoire ofmicroRNAs in epithelial ovarian cancer as determined bynext generation sequencing of small RNA cDNA libraries.PLoS ONE, 4, e5311.
29. Kawahara,Y., Zinshteyn,B., Chendrimada,T.P., Shiekhattar,R.and Nishikura,K. (2007) RNA editing of the microRNA-151precursor blocks cleavage by the Dicer-TRBP complex.EMBO Rep., 8, 763–769.
30. Kuwabara,T., Hsieh,J., Nakashima,K., Taira,K. and Gage,F.H.(2004) A small modulatory dsRNA specifies the fate of adultneural stem cells. Cell, 116, 779–793.
31. Bustin,S.A., Benes,V., Garson,J.A., Hellemans,J., Huggett,J.,Kubista,M., Mueller,R., Nolan,T., Pfaffl,M.W., Shipley,G.L. et al.(2009) The MIQE guidelines: minimum information forpublication of quantitative real-time PCR experiments.Clin. Chem., 55, 611–622.
32. Benjamini,Y. and Hochberg,Y. (1995) Controlling the falsediscovery rate: a practical and powerful approach to multipletesting. J. R. Stat. Soc. B, 57, 289–300.
33. Storey,J.D. (2002) A direct approach to false discovery rates.J. Roy. Stat. Soc. B, 64, 479–498.
34. Mituyama,T., Yamada,K., Hattori,E., Okida,H., Ono,Y.,Terai,G., Yoshizawa,A., Komori,T. and Asai,K. (2009) Thefunctional RNA database 3.0: databases to support mining andannotation of functional RNAs. Nucleic Acids Res., 37, D89–D92.
35. Griffiths-Jones,S., Saini,H.K., vanDongen,S. and Enright,A.J.(2008) miRBase: tools for microRNA genomics. Nucleic AcidsRes., 36, D154–D158.
36. Jurka,J., Kapitonov,V.V., Pavlicek,A., Klonowski,P., Kohany,O.and Walichiewicz,J. (2005) Repbase update, a database ofeukaryotic repetitive elements. Cytogenet. Genome Res., 110,462–467.
37. Pontius,J.U., Wagner,L. and Schuler,G.D. (2003) UniGene: aunified view of the transcriptome information. In The NCBIHandbook. NCfB, Bethesda, http://www.ncbi.nlm.nih.gov/bookshelf/br.fcgi?book=handbook&part=ch21 (16 December,2009, date last accessed).
38. deHoon,M.J.L., Taft,R.J., Hashimoto,T., Kanamori-Katayama,M., Kawaji,H., Kawano,M., Kishima,M., Lassmann,T.,
Faulkner,G.J., Mattick,J.S. et al. (2010) Cross-mapping and theidentification of editing sites in mature microRNAs inhigh-throughput sequencing libraries. Genome Res., 20, 257–264.
39. Kawahara,Y., Zinshteyn,B., Sethupathy,P., Iizasa,H.,Hatzigeorgiou,A.G. and Nishikura,K. (2007) Redirection ofsilencing targets by adenosine-to-inosine editing of miRNAs.Science, 315, 1137–1140.
40. Jones,M.R., Quinton,L.J., Blahna,M.T., Neilson,J.R., Fu,S.,Ivanov,A.R., Wolf,D.A. and Mizgerd,J.P. (2009)Zcchc11-dependent uridylation of microRNA directs cytokineexpression. Nat. Cell Biol., 11, 1157–1163.
41. Katoh,T., Sakaguchi,Y., Miyauchi,K., Suzuki,T., Kashiwabara,S.,Baba,T., and Suzuki,T. (2009) Selective stabilization ofmammalian microRNAs by 30 adenylation mediated by thecytoplasmic poly(A) polymerase GLD-2. Genes Dev., 23, 433–438.
42. Friedlander,M.R., Chen,W., Adamidi,C., Maaskola,J.,Einspanier,R., Knespel,S. and Rajewsky,N. (2008) DiscoveringmicroRNAs from deep sequencing data using miRDeep. Nat.Biotechnol., 26, 407–415.
43. Lau,N.C., Lim,L.P., Weinstein,E.G. and Bartel,D.P. (2001) Anabundant class of tiny RNAs with probable regulatory roles inCaenorhabditis elegans. Science, 294, 858–862.
44. He,L., Thomson,J.M., Hemann,M.T., Hernando-Monge,E.,Mu,D., Goodson,S., Powers,S., Cordon-Cardo,C., Lowe,S.W.,Hannon,G.J. et al. (2005) A microRNA polycistron as a potentialhuman oncogene. Nature, 435, 828–833.
45. O’Donnell,K.A., Wentzel,E.A., Zeller,K.I., Dang,C.V. andMendell,J.T. (2005) c-Myc-regulated microRNAs modulate E2F1expression. Nature, 435, 839–843.
46. Loven,J., Zinin,N., Wahlstrom,T., Muller,I., Brodin,P.,Fredlund,E., Ribacke,U., Pivarcsi,A., Pahlman,S. andHenriksson,M. (2010) MYCN-regulated microRNAs repressestrogen receptor-a (ESR1) expression and neuronaldifferentiation in human neuroblastoma. Proc. Natl Acad. Sci.USA, 107, 1553–1558.
47. Cummins,J.M., He,Y., Leary,R.J., Pagliarini,R., Diaz,L.A.,Sjoblom,T., Barad,O., Bentwich,Z., Szafranska,A.E., Labourier,E.et al. (2006) The colorectal microRNAome. Proc. Natl Acad. Sci.USA, 103, 3687–3692.
5928 Nucleic Acids Research, 2010, Vol. 38, No. 17