Embed Size (px)
Citation preview

I M F S T A F F P O S I T I O N N O T E
September 1, 2010 SPN/10/12
Default in Today's Advanced Economies: Unnecessary, Undesirable, and Unlikely
Carlo Cottarelli, Lorenzo Forni, Jan Gottschalk, and Paolo Mauro
I N T E R N A T I O N A L M O N E T A R Y F U N D

2
INTERNATIONAL MONETARY FUND
Fiscal Affairs Department
Default in Today’s Advanced Economies: Unnecessary, Undesirable, and Unlikely
Prepared by Carlo Cottarelli, Lorenzo Forni, Jan Gottschalk, and Paolo Mauro
September 1, 2010
JEL Classification Numbers: F34, H60
Keywords: Fiscal adjustment, public debt
Authors’ E-mail Addresses: [email protected]; [email protected]; [email protected]; [email protected]
DISCLAIMER: The views expressed herein are those of the author(s) and should not be attributed to the IMF, its Executive Board, or its management.

3
CONTENTS PAGE
Introduction ................................................................................................................................4
Arguments and Rebuttals ...........................................................................................................5
Conclusion ...............................................................................................................................11
References ................................................................................................................................26 TABLES 1. Advanced Economies: The State of Public Finances and Debt-Stabilizing Primary Balances ...............................................................................................................................16 2. Decomposition of Debt Dynamics, Advanced Economies and Default Episodes...............17 3. Advanced Economies' Gross Financing Needs, 2010–2011 ...............................................18 4. Nominal, Real Interest Rate, and Growth Differential ........................................................19 5. Episodes When Sovereign Bond Spreads Rose above 1,000 Basis Points, Emerging Economies ............................................................................................................................20 6. Debt Structure, Advanced Economies and Emerging Markets ...........................................21 FIGURES 1. Primary Balance for Defaulting Countries ..........................................................................23 2. Primary Fiscal Balance for High-Debt Advanced Economies Where a Primary Deficit Was Brought to Zero ............................................................................................................24 3. EMBI Spreads, 1994–2010 ..................................................................................................25 APPENDICES 1. How Often Are High Sovereign Bond Spreads Episodes Followed by Defaults? The Experience of Emerging Markets ........................................................................................12 2. Derivation of Real Interest Bill ............................................................................................13 3. Government Debt Structures—Advanced versus Emerging Economies.............................15

4
INTRODUCTION The state of the public finances has worsened substantially in the main advanced economies as a result of the 2008–09 global financial and economic crisis. For some “peripheral” European countries, market participants and some commentators occasionally seem to believe that default (here intended as some form of debt restructuring) will sooner or later inevitably occur. Concerns about fiscal solvency in those countries have been reflected in financial market pressures, large default risk premiums on sovereign bonds, and downgrades by rating agencies. At the time of writing (late August 2010), credit default swap spreads are about 900 basis points in Greece and 300 basis points in Ireland and Portugal. In general, volatility remains high and every auction of government paper—especially in Europe, including in the largest countries—is closely monitored to discern possible triggers of abrupt market reactions. In our view, the risk of debt restructuring is currently significantly overestimated. Although it is generally wise to assume that market developments reflect economic fundamentals, market overreaction does occur from time to time, with adverse implications for countries’ borrowing costs and debt dynamics. For example, considering data on sovereign bond spreads over the past decades, markets sounded false alarms in the vast majority of episodes—see Appendix 1. To place recent sovereign bond market developments in context, the present note reviews macro-fiscal factors underlying government debt dynamics in the top ten advanced economies ranked by needed fiscal adjustment in the illustrative scenario presented in the May 2010 Fiscal Monitor (IMF, 2010): France, Greece, Ireland, Italy, Japan, Netherlands, Portugal, Spain, United Kingdom, and United States.1
This note summarizes the main arguments put forward by some market commentators who argue that default is inevitable, and presents a rebuttal for each argument in turn. Their main arguments focus on the size of the adjustment and continued market concerns reflected in government bond spreads. The essence of our reasoning is that the challenge stems mainly from the advanced economies’ large primary deficits, not from a high average interest rate on debt. Thus, default would not significantly reduce the need for major fiscal adjustment. In contrast, the economies that defaulted in recent decades did so primarily as a result of high debt servicing costs, often in the context of major external shocks. We conclude that default would not be in the interest of the citizens of the countries in question. Fiscal adjustment supported by reforms that enhance economic growth is a more effective response.
1 See Fiscal Monitor, Figure 13.II (using country-specific interest rates–growth differentials). The list is almost identical on the basis of Ostry and others’ (2010) analysis of “fiscal space” (defined as the difference between current and estimated maximum sustainable level of debt).

5
ARGUMENTS AND REBUTTALS Argument 1: “Default cannot be avoided because the needed fiscal adjustment is just too large.” The needed fiscal adjustment in advanced economies is indeed very large. Fiscal solvency requires at least stabilizing the debt-to-GDP ratio. Such stabilization would involve improving the average cyclically adjusted primary balance from a deficit equivalent to 5.3 percent of GDP in 2010 to a surplus of 1.0 percent of GDP.2 The required adjustment to stabilize the debt-to-GDP ratio for the ten advanced economies in our sample is summarized in Table 1.3
However, fiscal adjustment on the requisite scale is historically not unprecedented. During the past three decades, there were 14 episodes in advanced economies and 26 in emerging economies when individual countries adjusted their structural primary balance by more than 7 percentage points of GDP.
4
More significantly, when the starting position is a primary fiscal deficit, default often triggers major fiscal adjustment, as countries are forced to move abruptly into a primary surplus in the aftermath of a default. When a country defaults, it is often shut out from borrowing—especially on international markets. (Estimated periods of exclusion range widely, from one to several years—see, for example, Gelos, Sahay, and Sandleris, 2004; and Sturzenegger and
Several economies were also able to sustain large primary surpluses for five or more years afterwards, though the record is more mixed in this regard (Abbas and others, 2010). Admittedly, this will be the first time that most advanced economies have to adjust simultaneously by such large amounts, implying a nontrivial drag on global economic growth (an issue analyzed in the forthcoming World Economic Outlook, October 2010). This said, large fiscal adjustments occurred simultaneously in more than half of the advanced European economies in the mid-1990s, especially in the run-up to the European Monetary Union. The bottom line: judging from past experience, such a major adjustment will no doubt be difficult, but is possible.
2 The projected output gap series and thus the cyclical adjustment are premised on a permanent loss of output as a result of the crisis. Should this assumption turn out to be too pessimistic, the adjustment need would be lower. In addition, in a few countries, government spending on items such as civil service wages rose rapidly in recent years; to the extent that such increases can be reversed, fiscal adjustment would be easier.
3 More ambitious, medium-term fiscal adjustment targeting a gradual decline in the debt-to-GDP ratio would bring greater economic benefits over the long run in most advanced economies in our sample—see the May 2010 Fiscal Monitor (IMF, 2010).
4 The list includes (end date of the episode in parentheses): Belgium (1998), Canada (1999), Cyprus (2007), Denmark (1986), Finland (2000), Greece (1995), Ireland (1989), Israel (1983), Italy (1993), Japan (1990), Portugal (1985), Sweden (1987; 2000), United Kingdom (2000).

6
Zettelmeyer, 2006). As defaults are usually partial, a defaulting country needs to run a primary surplus in order to finance the payment on the interest bill of the restructured debt (and any debt not affected by the restructuring). Indeed, the median primary surplus during the three years after default was about 2 percent of GDP in the sample consisting of all economies that defaulted since 1976, subject to data availability (Figure 1).5
In today’s advanced economies, the main issue is the primary deficit rather than the interest bill. The median primary deficit amounts to 7.4 percent of GDP in 2009–10 in our sample, compared with a median real interest bill of 2.3 percent of GDP (Table 2). In contrast, for the countries that defaulted over the past two decades, the median primary deficit amounted to 0.4 percent of GDP, compared with a real interest bill of 3.2 percent of GDP in the two years that preceded default.
6
As a result, the needed adjustment in today’s advanced economies would not be much affected by debt restructuring, even with a sizable haircut. To be concrete, let us consider by how much the primary adjustment needed to stabilize the debt-to-GDP ratio could be reduced by applying a 50 percent haircut—exceptionally large by historical standards. The haircut would make a limited difference for the required primary fiscal balance adjustment: 0.5 percentage point of GDP on average, and 2.7 percentage points for Greece (Table 1).
Thus, the problem of defaulters is typically a high interest burden, which is not the case for advanced economies today.
7
5 The list of defaults is drawn from Sturzenegger and Zettelmeyer (2006), who include debt restructurings and rescheduling in distressed circumstances, involving external creditors, and exclude payment delays and technical defaults that were eventually resolved with full repayment.
In percent of the adjustment in the absence of haircut, the reduction in the needed adjustment would be less than one-tenth on average and less than one-fifth in the case of Greece. Of course, it could be argued that debt restructuring not only allows a decline in the primary surplus needed to stabilize public debt, but also makes it easier to stabilize debt at a lower
6 As is well known, the nominal interest bill can be converted into the real interest bill through two adjustments (see Appendix 2): (i) the addition of a “capital loss” term reflecting the increased domestic currency value of the foreign currency-denominated debt; and (ii) the subtraction of an “inflation correction” term reflecting the inflation erosion of the value of the debt in real terms. These adjustments are important for the emerging economy defaulters, which had sizable inflation and nominal depreciation, whereas they are largely irrelevant for the advanced economies today (with inflation almost nil, and essentially no foreign currency debt in the advanced economies). As shown in the table, the nominal interest bill in the advanced economies is also lower than in the emerging defaulters sample, though the difference is somewhat less pronounced.
7 The debt-stabilizing primary balance approximately equals the interest–growth differential times the debt ratio. For many countries in the sample, the differential is close to zero, implying that a small primary surplus would be sufficient to stabilize the debt ratio, and consequently the impact of a potential haircut is limited. The somewhat more significant impact of a hypothetical haircut in the case of Greece reflects the combination of a large interest–growth differential and high debt ratio. Approximately, multiplying a post-haircut debt-to-GDP ratio of 74 percent by an interest–growth differential of 3.8 percent gives a reduction in needed adjustment of 2.7 percentage points of GDP.

7
level. However, debt tolerance is likely to be much lower after a country has defaulted than it was prior to its repayment difficulties.8 In other words, living with a lower debt ratio as a result of default may not be very attractive, as default makes it much more difficult for a country to persuade investors to hold its liabilities.9
In our view, an alternative approach often referred to by market commentators as “investor-friendly” restructuring would not fundamentally alter this balance of costs and benefits. A nonconfrontational (or “preemptive,” or “voluntary”) restructuring would probably carry lower reputational costs for the borrower, but would also involve a smaller haircut (in a context where market concerns are focused on solvency, rather than liquidity), thus providing limited relief in terms of debt sustainability and, therefore, less relief in fiscal adjustment need. To the extent that this approach were hypothetically combined with official support, including from international institutions, it would not be necessary to move abruptly to a primary surplus; but the “smoothing” role of official support is already at play, for example, in Greece, in the absence of default.
Argument 2. “Default cannot be avoided because high interest rates make the burden of debt unsustainable.”
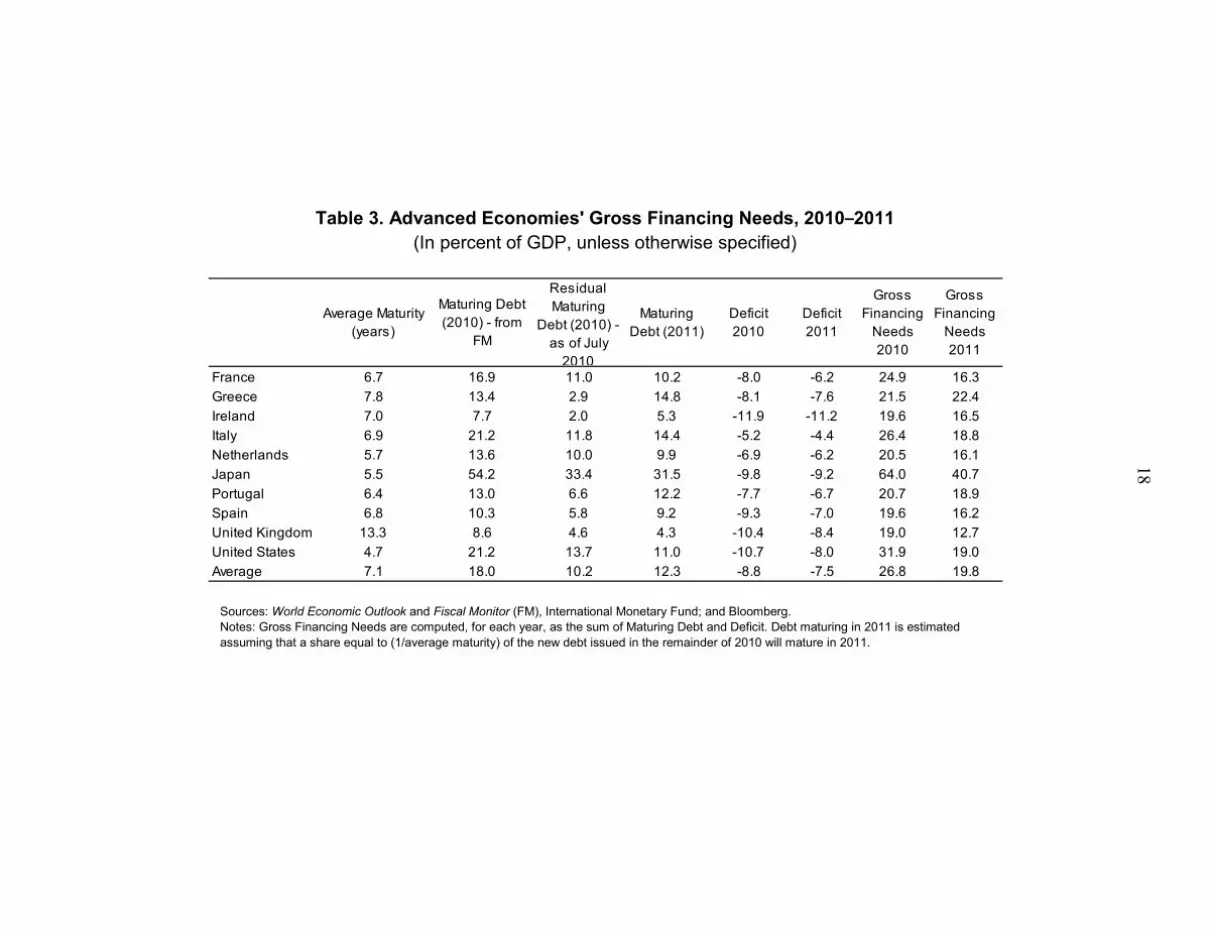
For countries currently experiencing market pressures, marginal rates of interest are high, but average interest rates on the stock of government debt remain relatively low (as already implicit in the discussion above). The reason for this is that maturity of government debt for the advanced economies in our sample is relatively long (seven years on average—Table 3) and debt structures are generally more resilient to abrupt changes in market perceptions than was the case for emerging economy defaulters of the past. In particular, the share of long term, nonindexed, domestic currency debt is higher in the advanced economies (see Appendix 3). Thus, even the countries with high spreads still have considerable time to convince the markets before their total government interest bill becomes too high. And, as shown in Table 3, refinancing needs are not significantly greater in small European peripherals than in the large advanced economies. Moreover, in the case of Greece, there is essentially no need to go back to the markets for the duration of the program supported by
8 Empirical evidence suggests that a country’s ability to sustain a given level of indebtedness is adversely affected by a history of failing to meet its debt obligations. This “debt intolerance” is evident in the extreme duress many emerging economies experience at government debt levels that would seem quite manageable by the standards of the advanced economies (Reinhart and others, 2003).
9 Borrowing costs are higher by an estimated 50–100 basis points for countries after they default, with the effect persisting for several years (Sturzenegger and Zettelmeyer, 2006). A seldom emphasized corollary is that defaulters pay higher interest rates even after their debt levels have been reduced. To avoid further increases in interest rates, these countries thus need to stabilize their debt-to-GDP ratio at a lower level than they experienced prior to default.

8
the IMF and the European Union. The European Financial Stability Facility could also be activated for other countries in the event this proved necessary.
Real interest rates in today’s advanced economies are lower than for the economies that defaulted over the past two decades. The median real interest rates (implied by the overall interest bill) projected over the next two years amount to 2.5 percent for the advanced economies in the sample, with a maximum of 4.0 percent for Greece (Table 4). This is lower than for most of the emerging economies in our sample during the two years prior to default (the median for these countries is 5.4 percent).10
Moreover, the projected interest–growth differential is substantially lower for the advanced economies today than it was for the economies that defaulted over the past two decades. Under current WEO projections, the median interest–growth differential for the ten advanced economies in our sample is forecast at 0.8 percent over 2011–12, with a maximum of 4.4 percent for Greece (in that case, largely on account of weak growth prospects—see below).
In drawing the comparison, it is important to take into account that, for some past defaulters, the bulk of the external debt was owed to official creditors, largely on concessional terms (e.g., Moldova and Pakistan are IDA-eligible).
11
Even for Greece, the projected differential is lower than for most defaulters in the two years prior to default (a median of 7.3 percent).
Argument 3. “Once primary balance has been attained, it makes sense to default.” A variant of the “fiscal adjustment is too large” argument posits that highly indebted countries will default as soon as they have attained primary balance. The purported rationale usually goes as follows: when the starting point is a large primary deficit, default may be too difficult because it would force an abrupt adjustment to primary balance (or, more accurately, a reasonably sized primary surplus—see below); but when primary balance has been attained, default looks appealing because it eliminates the interest bill with no need for further adjustment. As noted, short of a full default, countries will have to continue to run primary surpluses, even after a debt restructuring. In any case, the historical record shows that countries will usually make great efforts to avoid defaulting, casting doubt on the notion that, having achieved primary balance, they would choose to default in the absence of refinancing crises. Considering the universe of advanced economies with government debts above 60 percent (indeed well above this threshold in most cases) that reduced their primary
10 Of course, there is substantial variation within the emerging economies sample with respect to real interest rate levels and the factors underlying them. For example, in countries such as Indonesia and Uruguay, a major contributing factor to the real interest rate was the capital loss on the external debt stock due to nominal depreciation (prior to default), only partially compensated by the correction for inflation. Indeed, in those cases the default was largely triggered by the devaluation which in turn reflected external factors (including debt crises in Russia and Argentina, respectively).

9
deficits to zero at some point during the past twenty years (eight countries—Austria, 1997; Belgium, 1984; Greece, 1994; Ireland, 1984; Italy, 1991; Japan, 1981; Portugal, 1986; Sweden, 1996) finds no instance of default. Indeed, all advanced countries in this group improved the primary balance further to considerable surpluses (Figure 2). Casting the net wider to capture the emerging markets, too, it turns out that practically all defaults occur against the background of debt sustainability issues (to varying degrees) but are triggered by refinancing problems, often accompanied by large external shocks. Argument 4. “Default cannot be avoided in the countries with an overvalued exchange rate because the needed real depreciation would further raise the public debt ratio, making it even less sustainable”
Real exchange rate overvaluation is especially relevant for a few euro member countries. Recent IMF staff reports noted some overvaluation for Greece (20–30 percent), Portugal and, to a lesser extent, Spain. Although structural reforms underway seek to improve not only wage flexibility but also non-cost competitiveness, the overvaluation remains nontrivial.
However, for members of currency areas the reversal of overvaluation—which requires internal deflation—has different implications for the debt-to-GDP ratio than for other countries where the adjustment typically occurs through nominal exchange rate depreciation. Emerging economy defaulters were hit by major increases in the debt ratio as a result of their currencies’ nominal depreciations associated with their crises. In euro area countries, a real depreciation would have to be attained through internal deflation and, through that channel, would also imply an increase in the debt-to-GDP ratio. However, the real depreciation would not be as abrupt as in emerging economy crises, nor would it be as large, because the process would not involve the overshooting that is often associated with nominal exchange rate depreciations.12
11 While there is still considerable uncertainty regarding the future path of economic growth and interest rates, WEO forecasts for the countries in our sample are very close to Consensus Forecasts.
Of course, a hypothetical exit from the euro area—a scenario that we see as extremely unlikely—would result in an abrupt devaluation and a consequent jump in the debt-to-GDP ratio. Even under that scenario, which would bring massive disruption and costs of its own, a default would not obviate the need for major fiscal adjustment, for the same reasons as presented above.
12 Although internal devaluation could be a more difficult process, reforms of factor, product, and service markets can contribute to downward flexibility of prices and wages, to assist real exchange rate adjustment. These are policy objectives in several European peripherals. Spain has made significant progress in this regard in recent years. And Ireland’s recent experience suggests that it is possible to restore competitiveness and economic growth relatively quickly. Ireland faced a significant competitiveness disadvantage in 2009, but its real effective exchange rate is currently viewed broadly in line with medium-term fundamentals (IMF Country Reports 09/195 and 10/209). This improvement was associated with a deep recession, but Ireland has recently returned to relatively rapid growth.

10
Argument 5. “Politically it is easier to default than to adjust, because it is easier to ‘soak’ the rich and the foreigners than to face demonstrations by the lower and middle classes.”
The share of government debt held by domestic residents is typically higher in advanced economies, especially large ones, than in emerging economies. Nevertheless, there is significant variation across advanced economies in this respect. For some smaller European peripherals, the share of government debt held by nonresidents has risen significantly in recent years. In the case of Greece, for example, a sizable share is now held by banks from other euro area countries. This underlies arguments favoring “burden-sharing” with foreign creditors, which some suggest would render fiscal adjustment politically more palatable at home. Nevertheless, in all these countries (including Greece) debt holdings are also widespread among the middle and lower-middle class, and domestic banks. Moreover, in light of the high degree of financial integration, particularly within the euro area, default affecting foreign banks would eventually reverberate back to the domestic banking system and the domestic economy as a whole. Altogether, the domestic political and economic costs of a default could well be greater than those stemming from fiscal adjustment. This said, in designing fiscal adjustment, it is crucial to protect the vulnerable not only because it is the right thing to do but also because it preserves the political sustainability of the process.
Argument 6. “Default cannot be avoided because fiscal adjustment will depress growth.”
The required fiscal consolidation for many countries may well impose a drag on growth, but default won’t make the pain less severe because the size of the needed adjustment won’t be substantially smaller (see above). IMF staff has argued that, consistent with projections in the IMF World Economic Outlook (WEO), a fiscal adjustment of about 1 percentage point per year on average for the advanced economies balances the need for adjustment with concerns that too rapid fiscal consolidation would undermine the recovery, and that it would be crucial to support such adjustment by appropriate structural reforms (Blanchard and Cottarelli, 2010). In highly indebted countries experiencing large risk premiums, the speed and extent of fiscal adjustment is greater and, partly as a result, growth prospects are weaker, often leading to concerns about the possibility of vicious spirals of deflation and negative growth. However, a potential debt restructuring now would not undo the large and rapid fiscal contraction that has already been undertaken in some of these countries (notably, Greece). Furthermore, (a given amount of) fiscal adjustment in countries facing a higher perceived risk of sovereign default tends to be less contractionary (though still contractionary).13
13 It does not seem likely, at the current juncture, that the highly indebted European peripherals would experience “expansionary fiscal contractions.” (See Giavazzi and Pagano, 1990, for the seminal paper on this topic.) See forthcoming World Economic Outlook, October 2010, for evidence that the impact of fiscal adjustment on economic growth, while negative, is smaller for highly indebted countries.
In fact, fiscal consolidation reduces the likelihood of crisis scenarios; moreover, with diminished

11
uncertainty and lower risk premiums on private borrowing, there would be fewer incentives for economic agents to postpone investment and consumption.
Restructuring debt in today’s advanced economies would also be detrimental to economic growth, and would not address the fundamental causes of weak growth. In the near term, the effects of a hypothetical debt restructuring on some sectors of the economy (in particular the banking system) would have severe consequences for growth. More important, a restructuring would be no substitute for, and would probably end up as a distraction from, the fiscal and structural reforms that are truly necessary for a durable increase in economic growth.
CONCLUSION Although the fiscal fundamentals look challenging, current market indicators of default risk seem to reflect some market overreaction. The key considerations are the following:
The needed fiscal adjustment is difficult, but has been attained before. Default would not reduce the need for adjustment by much, because primary deficits,
not the interest bill, are the problem in advanced economies today. Although marginal interest rates are now high for Greece and, to a lesser extent, other
European peripherals, average interest rates remain relatively low, giving time for fiscal adjustment to convince markets.
Countries do not strategically decide to default but do so in the midst of refinancing
crises: in the past, advanced economies that reduced primary deficits and reached primary balance or a small primary surplus subsequently persevered with the adjustment.
The political and economic costs stemming from a hypothetical default would not be
lower than those incurred under a strategy based solely on fiscal adjustment. Reforms are needed to improve potential growth and external competitiveness,
thereby easing the fiscal adjustment process.

12
Appendix 1: How Often Are High Sovereign Bond Spreads Episodes Followed by Defaults? The Experience of Emerging Markets
This appendix reviews developments in sovereign bond spreads for emerging economies since the early 1990s. It asks how many episodes in which spreads rose above 1,000 basis points were followed by defaults, and how many turned out to be “false alarms,” with the situation stabilizing and the spreads eventually returning to low levels. Based on all available data on EMBIG sovereign bond spreads (31 emerging markets, from various dates for different countries beginning with the first Brady deals in 1991–92), there are 36 instances in which a country’s spreads rose above 1,000 basis points (if the threshold is crossed repeatedly during a two year period, only the first instance is recorded) (Table 5).14 Several of those instances are associated with widespread “contagion” from the Mexican (1994–95), Asian (1997–98), Russian (1998), and (for fewer countries) Argentine (2002) and Lehman (2008) crises (Figure 3). Of those instances, seven eventually resulted in default; in the remaining 29 cases, however, the spreads stayed high for a few months and eventually fell back well below 1,000 basis points, with no default.15
Of course, absence of default does not always mean smooth sailing: many of the countries experiencing high spreads required support from the international community, including large-scale IMF-supported programs. But the point here is that default was avoided in the majority of instances initially identified by markets as warranting bond spreads in excess of 1,000 basis points.
The list of prominent averted defaults includes, for example, Mexico (1994–95), Korea (1997), Brazil (1998–99 and 2002) and Turkey (2000–01). Brazil in 2002 provides the clearest illustration of default fighting. With high and growing debt ratios, political uncertainty, and a difficult international environment, sovereign bond spreads surpassed 2,000 basis points in the summer and fall of 2002. Yet, with fiscal effort, help from the international financial institutions, and the gradual establishment of a new policy track record, the spreads eventually fell below 500 basis points by late 2003 and declined further in later years.
14 Many studies have documented the extent to which sovereign bond spreads in the modern era move together across countries to a greater extent than expected on the basis of fundamentals (for example, Mauro and others, 2006).
15 Interestingly, no single country defaulted with EMBI spreads being below the 1,000 threshold (though EMBI data are available for only five countries in our sample before the default date—Argentina, 2002; Cote d’Ivoire, 2001; Ecuador, 1999; Russia, 1998; Uruguay, 2003).

13
Appendix 2. Derivation of Real Interest Bill
This technical appendix recalls two ways of accounting for the change in the debt-to-GDP ratio, the first in nominal terms and the second in real terms, to show how the nominal interest bill was converted into a real interest bill for the calculations reported in the text and Tables 2 and 4.
Definitions: 𝑆𝑡 ≡ 𝑈𝑛𝑖𝑡𝑠 𝑜𝑓 𝑙𝑜𝑐𝑎𝑙 𝑐𝑢𝑟𝑟𝑒𝑛𝑐𝑦
𝑝𝑒𝑟 1 𝑈𝑆$ (spot exchange rate at end of period)
𝑆𝑡𝑆𝑡−1
≡ 1 + 𝑠𝑡 therefore, 𝑠𝑡 is rate of nominal depreciation
𝐷𝑡 ≡ 𝐷𝑡𝑑 + 𝑆𝑡 𝐷𝑡𝑓 (sum of domestic and foreign currency debt, all expressed in
local currency terms together)
𝑃𝑡: primary balance 𝐿𝑡: (nominal) interest bill
𝑑𝑡 ≡ 𝐷𝑡𝑌𝑡
𝑝𝑡 ≡𝑃𝑡𝑌𝑡
𝑑𝑡𝑓 ≡ 𝐷𝑡
𝑓𝑆𝑡𝑌𝑡
𝑑𝑡𝑑 ≡ 𝐷𝑡𝑑
𝑌𝑡 𝑙𝑡 ≡ 𝐿𝑡
𝑌𝑡
𝑌𝑡 = 𝑌𝑡−1 (1 + 𝜋𝑡)(1 + 𝑔𝑡) 𝜋𝑡: domestic inflation 𝑔𝑡: real growth (domestic currency terms)
1 + 𝛿𝑡 ≡ (1 + 𝜋𝑡)(1 + 𝑔𝑡) 𝛿𝑡 is nominal growth in domestic currency 1 + 𝑖𝑡𝑑 ≡ (1 + 𝜋𝑡)(1 + 𝑟𝑡𝑑) 𝑖𝑡𝑑 is nominal, 𝑟𝑡𝑑 real interest rate on domestic currency
debt
1 + 𝑖𝑡𝑓 = �1 + 𝜋𝑡$�(1 + 𝑟𝑡
𝑓) 𝑖𝑡𝑓 is nominal, 𝑟𝑡
𝑓 real interest rate on foreign currency debt.
Set α as share of foreign currency debt in total debt: 𝑑𝑡𝑑 = (1 − 𝛼)𝑑𝑡
𝑑𝑡𝑓 = 𝛼 𝑑𝑡
𝐷𝑡 = −𝑃𝑡 + 𝐷𝑡−1𝑑 + 𝐷𝑡−1𝑓 ∗ 𝑆𝑡 + 𝐿𝑡
𝐿𝑡 = 𝑖𝑡𝑑 𝐷𝑡−1𝑑 + 𝑖𝑡𝑓 ∗ 𝐷𝑡−1
𝑓 ∗ 𝑆𝑡 From this setup, the evolution of debt/GDP ratio can be decomposed in various ways:

14
Nominal Decomposition (closest to how the data are reported in standard accounts):
𝑑𝑡 − 𝑑𝑡−1 = −𝑝𝑡 −𝛿𝑡
1 + 𝛿𝑡∗ 𝑑𝑡−1 + 𝑙𝑡 + 𝛼 𝑑𝑡−1
𝑠𝑡1 + 𝛿𝑡
where: 𝑙𝑡 ≡ � 𝑖𝑡𝑑
1+ 𝛿𝑡∗ (1 − 𝛼) + 𝑖𝑡
𝑓(1+𝑠𝑡)1+𝛿𝑡
∗ 𝛼� 𝑑𝑡−1
Recalling that, 𝛿𝑡
1+𝛿𝑡= 𝑔𝑡
1+𝑔𝑡+ 𝜋𝑡
1+𝛿𝑡 , the real decomposition is as follows:
𝑑𝑡 − 𝑑𝑡−1 = −𝑝𝑡 −
𝑔𝑡1+𝑔𝑡
∗ 𝑑𝑡−1 − 𝜋𝑡1+𝛿𝑡
∗ 𝑑𝑡−1 + 𝛼 𝑑𝑡−1 𝑠𝑡1+𝛿𝑡
+ 𝑙𝑡
In Table 2, we report the following terms (expressed as a share of GDP):
(1) The primary balance: 𝑝𝑡
(2) The nominal interest bill: 𝑙𝑡
(3) The capital loss from the nominal depreciation: �𝛼 𝑑𝑡−1 𝑠𝑡
1+𝛿𝑡�
(4) The inflation correction: � 𝜋𝑡
1+𝛿𝑡∗ 𝑑𝑡−1�
(5) The real interest bill: (2)+(3)-(4)
(6) The real growth contribution: � 𝑔𝑡
1+𝑔𝑡∗ 𝑑𝑡−1�
In Table 4 we report the following terms (expressed in percentage points):
(1) The nominal interest rate: � 𝑖𝑡𝑑
1+ 𝛿𝑡∗ (1 − 𝛼) + 𝑖𝑡
𝑓(1+𝑠𝑡)1+𝛿𝑡
∗ 𝛼�
(2) The capital loss rate: �𝛼 𝑠𝑡
1+𝛿𝑡�
(3) The inflation correction rate: � 𝜋𝑡
1+𝛿𝑡�
(4) The real interest rate: (1)+(2)-(3)
(5) The real interest rate minus the real growth rate: (1)+(2)-(3)-� 𝑔𝑡
1+𝑔𝑡�
Real Interest Bill

15
Appendix 3. Government Debt Structures—Advanced versus Emerging Economies Differences in government debt structures make the advanced economies in the sample less crisis-prone than the emerging economies that defaulted in the past, and imply a slower transmission of worsening market perceptions into a higher debt servicing burden. This can be seen by considering jointly various aspects of debt structure (Table 6): Currency composition. Advanced economies’ debt is almost entirely denominated in
domestic currency, whereas the share of government debt denominated in or indexed to foreign currency stands at 42 percent in the emerging economies and amounted to 63 percent the year prior to default in the emerging economies that defaulted over the past couple of decades.
Floating rate and indexed debt. Within domestic currency debt, advanced economies
have a lower share of floating rate or indexed debt than do emerging economies. Other things equal, this tends to slow down the transmission of increases in marginal rates to average borrowing costs.
Maturity structure. Emerging economies have fairly long average maturity on their
foreign currency-denominated debt (some of which is from official creditors, often on concessional terms) and even their maturity structure on fixed-rate, domestic currency-denominated debt is only slightly shorter than for advanced economies. But vulnerabilities result from the combination of these maturity structures with high weights of foreign currency, floating rate, and indexed debt.
To sum up, the share of domestic currency, long-term, nonindexed, fixed-rate debt is larger in advanced economies than in emerging economies, implying that it takes longer for increases in marginal interest rates to feed through to average borrowing costs, and that risks from changes in the exchange rate and rollover risks are also lower for advanced economies than emerging economies.

16
Table 1. Advanced Economies: The State of Public Finances and Debt-Stabilizing Primary Balances (In percent of GDP)
Source: IMF desk economists’ projections, and authors’ estimates. Notes: The data refer to the general government. Cyclically adjusted primary balances (CAPB) are reported in percent of nominal GDP. The debt-stabilizing primary balance is set to stabilize a country’s 2012 gross debt ratio. Illustrative scenarios for Japan are based on its net debt. Data for Greece in the first three columns are with respect to 2009. For Portugal and Spain, the figures do not reflect additional deficit reduction plans announced May 10. For the United States, the CAPB excludes losses from financial sector support. Country-specific interest–growth differentials for 2011–15 are based on WEO projections. For the “haircut” scenario, the 2012 debt ratio is reduced by 50 percent and stabilized at this level.
Gross Debt
Primary Balance
Cyclically Adjusted PB
France 84.2 -6.0 -4.6 -0.1 -0.1 0.0Greece 115.1 -8.6 -10.0 3.8 5.5 2.8Ireland 78.8 -10.0 -6.0 0.5 0.4 0.2Italy 118.6 -0.8 0.9 1.4 1.7 0.8Japan 227.1 -8.3 -6.5 -0.1 -0.1 -0.1Netherlands 64.2 -4.1 -3.4 1.1 0.8 0.4Portugal 86.6 -5.6 -4.1 1.8 1.7 0.8Spain 66.9 -8.7 -5.8 1.7 1.3 0.7United Kingdom 78.2 -8.8 -5.4 -0.9 -0.7 -0.4United States 92.6 -9.2 -7.6 0.0 0.0 0.0Average 101.2 -7.0 -5.3 0.9 1.0 0.5
IMF Staff Projections, 2010 Country-Specific i-g, 2011–2015
Average
Debt-Stabilizing
PB
Debt-Stabilizing
PB after 50% haircut

17
Table 2. Decomposition of Debt Dynamics, Advanced Economies and Default Episodes (In percent of GDP)
Sources: Estimates using data from IMF World Economic Outlook, April 2010, and Sturzenegger and Zettelmeyer (2006). Notes: The default episodes (the year of default is reported in parenthesis next to the country name in the first column) include all emerging economies that defaulted after 1976 for which there is available data to compute the decomposition. See Appendix 2 for derivation of the decomposition of debt dynamics.
Primary Balance (1)
Nominal Interest Bill
(2)
Capital Loss due to Nominal Devaluation
(3)
Inflation Correction
(4)
Total (Real Interest Bill)
(5)=(2)+(3)+(4)
Real Growth Contribution
(6) Debt/GDP
France -5.9 2.5 … -0.4 2.1 0.2 80.8Greece -5.5 5.3 … -2.1 3.3 2.2 106.9Ireland -10.0 2.4 … 1.3 3.8 2.2 71.7Italy -0.8 4.6 … -2.0 2.7 2.3 117.2Japan -8.7 2.9 … 2.8 5.7 3.3 222.4Netherlands -3.6 2.4 … -0.3 2.1 0.8 61.9Portugal -6.1 3.1 … -0.7 2.4 0.8 81.9Spain -9.4 2.1 … 0.0 2.1 0.9 61.1United Kingdom -9.0 2.6 … -1.2 1.3 0.9 73.2United States -10.0 2.7 … -0.7 2.0 -0.4 87.9Median -7.4 2.6 … -0.6 2.3 0.9 81.3
Argentina (2002) -0.5 4.4 0.0 0.0 4.4 1.2 44.0Ecuador (1999) 0.6 4.3 0.0 -1.3 3.0 -1.6 65.1Indonesia (1999) 0.3 2.0 31.6 -10.5 23.1 1.9 35.0Jamaica (2010) 0.9 9.4 7.6 -10.4 6.6 2.0 104.5Mexico (1982) -4.5 3.8 0.1 -4.1 -0.2 -1.7 21.4Moldova (2002) 4.5 5.3 6.8 -14.6 -2.6 -3.7 93.9Pakistan (1999) -0.2 5.7 4.6 -6.9 3.4 -1.3 74.4Russia (1998) -9.9 5.0 3.7 -10.1 -1.4 0.5 44.2Ukraine (1998) -2.1 2.1 2.9 -4.0 1.0 0.8 30.6Uruguay (2003) -1.3 3.0 15.4 -4.0 14.3 2.9 49.7Median -0.4 4.3 4.1 -5.5 3.2 0.7 46.9
Real Interest Bill
Advanced Economies (Averages for 2009–10)
Emerging Economies (Averages for the two years prior to default)
18
Table 3. Advanced Economies' Gross Financing Needs, 2010–2011 (In percent of GDP, unless otherwise specified)
Sources: World Economic Outlook and Fiscal Monitor (FM), International Monetary Fund; and Bloomberg. Notes: Gross Financing Needs are computed, for each year, as the sum of Maturing Debt and Deficit. Debt maturing in 2011 is estimated assuming that a share equal to (1/average maturity) of the new debt issued in the remainder of 2010 will mature in 2011.
Average Maturity (years)
Maturing Debt (2010) - from
FM
Residual Maturing
Debt (2010) - as of July
2010
Maturing Debt (2011)
Deficit 2010
Deficit 2011
Gross Financing
Needs 2010
Gross Financing
Needs 2011
France 6.7 16.9 11.0 10.2 -8.0 -6.2 24.9 16.3Greece 7.8 13.4 2.9 14.8 -8.1 -7.6 21.5 22.4Ireland 7.0 7.7 2.0 5.3 -11.9 -11.2 19.6 16.5Italy 6.9 21.2 11.8 14.4 -5.2 -4.4 26.4 18.8Netherlands 5.7 13.6 10.0 9.9 -6.9 -6.2 20.5 16.1Japan 5.5 54.2 33.4 31.5 -9.8 -9.2 64.0 40.7Portugal 6.4 13.0 6.6 12.2 -7.7 -6.7 20.7 18.9Spain 6.8 10.3 5.8 9.2 -9.3 -7.0 19.6 16.2United Kingdom 13.3 8.6 4.6 4.3 -10.4 -8.4 19.0 12.7United States 4.7 21.2 13.7 11.0 -10.7 -8.0 31.9 19.0Average 7.1 18.0 10.2 12.3 -8.8 -7.5 26.8 19.8

19
Table 4. Nominal, Real Interest Rate, and Growth Differential (In percentage points)
Sources: Estimates using data from IMF World Economic Outlook, April 2010. For the foreign currency-denominated debt as a share of total, see FAD database on external debt and Sturzenegger and Zettelmeyer (2006). Notes: The default episodes (the year of default is reported in parenthesis next to the country name in the first column) include all emerging economies that defaulted after 1976, subject to data availability. See Appendix 2 for derivation of the decomposition of debt dynamics.
Nominal Interest Rate
Capital Loss Rate
Inflation Correction Rate
Real Interest Rate
Real Interest minus Real Growth
(1) (2) (3) (4)=(1)+(2)+(3) (5)
France 3.6 … -1.6 2.0 0.1Greece 4.9 … -0.9 4.0 4.4Ireland 4.3 … -1.9 2.5 0.4Italy 4.4 … -1.8 2.5 1.2Japan 1.4 … 1.0 2.4 0.4Netherlands 3.9 … -0.7 3.2 1.6Portugal 4.4 … -1.3 3.1 2.4Spain 4.2 … -1.0 3.2 2.1United Kingdom 4.3 … -2.1 2.2 -0.4United States 3.6 … -1.7 1.9 -0.5Median 4.2 … -1.4 2.5 0.8
Argentina (2002) 10.0 0.0 0.1 10.0 7.3Ecuador (1999) 6.5 0.0 -1.8 4.8 7.2Indonesia (1999) 5.7 90.3 -30.1 66.0 60.7Jamaica (2010) 9.0 7.1 -10.1 6.1 4.2Mexico (1982) 20.8 0.5 -19.2 2.0 9.9Moldova (2002) 5.6 7.2 -15.6 -2.7 1.2Pakistan (1999) 7.6 6.1 -9.3 4.5 6.3Russia (1998) 13.2 7.3 -12.9 7.5 8.9Ukraine (1998) 6.8 8.9 -13.4 2.3 -0.3Uruguay (2003) 5.9 29.4 -7.9 27.4 21.8Median 7.2 7.2 -11.5 5.4 7.3
Advanced Economies (Averages for 2011–12)
Emerging Economies (Averages for the two years prior to default)

20
Table 5. Episodes When Sovereign Bond Spreads Rose above 1,000 Basis Points, Emerging Economies
Notes: This table reports instances in which the EMBI spreads for the country listed rose above 1,000 basis points (the year is given in brackets) and tracks what happened afterwards. For cases in which the 1,000 basis points threshold is crossed (from below and above) repeatedly within a two year period, only the first instance is noted.
Instances in Which Sovereign Bond Spreads Crossed 1,000 Basis Points
Evolution of Spreads During the Following
2 YearsWhat Happened Next? Defaulted?
Algeria (2000) Declined Went down below 300 in 2003.
Argentina (1995) Remained High Declined and stabilized around 400, but crossed again 1000 after the Russian default.
Argentina (1998) Remained High Declined slowly until it crossed again 1000 in March 2001.Argentina(2001) Remained High Defaulted in 2002. YBrazil (1995) Declined Crossed again 1000 during the Russian default.Brazil (2002) Remained High Spreads remained high during Argentine default and started to go
down in mid-2003.
Bulgaria (1994) Remained High EMBI data started in 1994 above 1000 and remained high during Mexican peso crisis.
Bulgaria (1999) Declined Stabilized around 200 after 2002.Colombia (1998) Declined Stabilized at about 700 by mid 1999. Crossed again 1000 during the
Argentine default.
Colombia (2002) Declined Stabilized around 250 from the summer of 2006 until the Lehman default.
Cote d'Ivoire (1999) Remained High Defaulted in 2001. YCroatia (1998) Declined Stabilized around 150.Dominican Rep (2004) Remained High Defaulted in 2005. YEcuador (1995) Declined EMBI data started in 1995 above 1000. Remained High during
Mexican crisis. Declined until Russian default.Ecuador (1998) Remained High Defaulted in 1999. YEcuador (2004) Declined Crossed again 1000 after Lehman.Lebanon (2002) Declined Crossed again 1000 after Lehman.Malaysia (1998) Declined Stabilized around 200.Mexico (1996) Declined Up again during Russian default.Mexico (1998) Declined Stabilized around 200.Morocco (1998) Declined Stabilized below 100 until EMBI discontinued (11/2006).Nigeria (1994) Remained High Remained due to Mexican peso crisis.Nigeria (1996) Declined Up again during Russian default.Nigeria (2003) Declined Went down below 100 until EMBI was discontinued (4/2007).Pakistan (2001) Declined Crossed again 1000 in August 2008.Peru (1998) Declined Stabilized around 300.Poland (1995) Declined Stabilized around 200.Russia (1998) Remained High Defaulted in 1998. YRussia (2001) Declined Stabilized around 300.Turkey (1998) Declined But went up again in February 2001.Turkey (2003) Declined Stabilized around 300.Ukraine (2000) Remained High Defaulted in 2000. YUkraine (2001) Declined Crossed again 1000 after Lehman.Uruguay (2003) Remained High Defaulted in 2003. YVenezuela (1996) Declined Up again during Russian default.Venezuela (2003) Declined Crossed again 1000 after Lehman.

21
Table 6. Debt Structure, Advanced Economies and Emerging Markets (in percent)
Sources and notes: For advanced economies, data is from the OECD Central Government Debt Yearbook (1980–2009) and relates to the total marketable debt. For emerging economies, data on local currency government debt is from the Guscina and Jeanne (2006) database; foreign currency government debt combines two series: (a) public and publicly guaranteed external debt as defined in the Global Development Finance database and (b) domestic government debt denominated in foreign currency from the Guscina and Jeanne (2006) database. The maturity structure of the foreign currency government debt assumes the same structure as the total foreign currency debt. For advanced economies, short-term fixed rate local currency debt includes money market instruments. For emerging markets, data on the composition of local currency debt is from the Guscina and Jeanne (2006) database. Average maturity for selected economies is from the OECD Central Government Debt Yearbook (1980–2009). Short-term refers to a maturity of less than 1 year; medium-term (1–5 years); and long-term (>5 years). Japan: 2008 values. Chile: 2003 values, includes central bank domestic debt. Turkey: 2009 values, debt/GDP defined by EU standards, and debt maturity corresponding to original maturity (Source: Undersecretariat of Treasury).
Advanced Economies (2009)Central Government
Debt (% of GDP)
Local Currency share of Cent.
Gov. Debt
Average Maturity of Debt in Local
Currency
Variable Rate, Indexed and
OthersFixed Rate
Short Term
of which: Medium
TermLong Term
Foreign Currency share of Cent.
Gov. DebtShort Term
Long Term
Japan 158.2 100 6.1 7 93 31 35 34 0 n.a. n.a.Greece 116.6 100 7.9 24 76 5 26 69 0 n.a. n.a.United States 48.5 100 4.4 8 92 41 34 24 0 n.a. n.a.Ireland 47.3 100 6.0 1 99 20 29 52 0 n.a. n.a.Spain 42.6 99 6.4 1 99 18 20 62 1 n.a. n.a.United Kingdom 55.5 100 14.1 21 79 10 27 64 0 n.a. n.a.France 57.0 100 6.7 12 88 21 21 58 0 n.a. n.a.Portugal 65.9 98 6.0 0 100 17 5 78 2 n.a. n.a.Netherlands 44.8 98 6.6 0 100 31 31 38 2 n.a. n.a.Italy 90.3 100 7.0 28 72 13 25 62 0 n.a. n.a.Average 72.7 99 7.1 10 90 21 25 54 1 n.a. n.a.
Emerging Economies (2005)Argentina 51.8 28 n.a. 99 1 0 0 100 72 28 72Brazil 67.9 81 n.a. 68 32 60 40 0 19 11 89Chile 48.9 38 7.7 63 37 58 42 0 62 6 94China 18.9 80 n.a. 0 100 5 43 52 20 52 48Colombia 43.6 64 n.a. 40 60 9 40 51 36 16 84Hungary … … 4.6 8 92 24 54 22 … … …India 46.1 85 n.a. 9 91 3 49 48 15 7 93Indonesia 47.3 47 n.a. 69 31 0 0 100 53 17 83Israel … … n.a. 83 17 0 30 70 … … …Korea … … 3.9 0 100 0 72 28 … … …Malaysia 54.3 70 n.a. 0 100 2 45 53 30 25 75Mexico 26.2 51 6.4 36 64 36 43 21 49 4 96Poland 43.6 74 4.9 12 88 9 86 5 26 25 75Russia 17.0 23 n.a. 0 100 0 24 76 77 10 90Thailand 31.3 73 n.a. 3 97 25 23 52 27 30 70The Czech Republic … … n.a. 0 100 16 84 0 … … …The Philippines 75.5 52 n.a. 2 98 30 42 28 48 11 89Turkey 49.0 71 2.0 54 46 6 83 11 29 0 99Venezuela 32.5 33 n.a. 89 11 88 0 12 67 22 78Average 43.6 58 4.9 33 67 20 42 38 42 18 82
Default Cases (year prior to default)Argentina (1981) 10.6 36 n.a. 3 97 94 0 6 64 39 61Argentina (2001) 43.1 1 n.a. 100 0 0 0 100 99 14 86Brazil (1982) 17.5 35 n.a. 0 100 19 81 0 65 19 81Chile (1982) 26.2 14 n.a. 69 31 71 0 29 86 15 85Indonesia (1998) 63.9 13 n.a. 100 0 … … … 87 19 81Mexico (1981) 24.2 57 n.a. 6 94 9 0 91 43 32 68Russia (1997) 44.2 41 n.a. 13 87 65 0 35 59 14 86The Philippines (1982) 30.2 32 n.a. 16 84 22 23 55 68 50 50Venezuela (1981) 15.0 100 n.a. 98 2 100 0 0 0 53 47Average 30.5 37 n.a. 45 55 47 13 40 63 28 72
Debt in Local Currency Debt in Foreign Currnency

23
Figure 1. Primary Balance for Defaulting Countries
Notes: The sample consists of all default episodes since 1976, subject to data availability. The year t indicates the time of default.
-4
-3
-2
-1
0
1
2
3
4
5
t-2 t-1 t t+1 t+2 t+3 t+4 t+5
Primary Balance (in percent of GDP)
Median
75th percentile
25th Percentile

24
-6
-4
-2
0
2
4
6
-5 -4 -3 -2 -1 0 1 2 3 4 5
Primary Balance (Advanced Countries; in percent of GDP)
75th percentile
Median
25th percentile
0
20
40
60
80
100
120
-5 -4 -3 -2 -1 0 1 2 3 4 5
Debt-to-GDP Ratio (Advanced Countries)
75th percentile
Median
25th percentile
Figure 2. Primary Fiscal Balance for High-Debt Advanced Economies Where a Primary Deficit Was Brought to Zero
Notes: Eight countries with government debt of at least 60 percent of GDP reduced their primary deficits to attain primary balance during the sample period since 1980: Austria (1997), Belgium (1984), Greece (1994), Ireland (1984), Italy (1991), Japan (1981), Portugal (1986), Sweden (1996). Numbers in parentheses indicate the date when the primary balance is attained. On the horizontal axis, zero indicates the year when primary balance is reached.

25
Figure 3. EMBI Spreads, 1994–2010
Countries that did not default
Countries that defaulted
0
500
1000
1500
2000
2500
3000
3500
1/1/1994 9/27/1996 6/24/1999 3/20/2002 12/14/2004 9/10/2007 6/6/2010
INDONESIA
PAKISTAN
South AFRICA
PANAMA
HUNGARY
TURKEY
POLAND
MEXICO
PHILIPPINES
CHINA
BULGARIA
THAILAND
MALAYSIA
LITHUANIA
VENEZUELA
BRAZIL
CHILE
NIGERIA
PERU
STH. KOREA
VIETNAM
COLOMBIA
ALGERIA
CROATIA
EL SALVADOR
EGYPT
Mexican peso crisis
Russian default
Argentine default
Lehman bankruptcy
0
1000
2000
3000
4000
5000
6000
7000
8000
1/1/1994 9/27/1996 6/24/1999 3/20/2002 12/14/2004 9/10/2007 6/6/2010
ARGENTINA COTE D'IVOIRE DOMINICAN REP. RUSSIA ECUADOR UKRAINE URUGUAY
Mexican peso crisis
Russian default
Argentine default
Lehman bankruptcy

26
REFERENCES
Abbas, S.M. Ali, Olivier Basdevant, Stephanie Eble, Greetje Everaert, Jan Gottschalk, Fuad Hasanov, Junhyung Park, Cemile Sancak, Ricardo Velloso, and Mauricio Villafuerte, 2010, Strategies for Fiscal Consolidation in the Post-Crisis World, IMF Departmental Paper (Washington, International Monetary Fund). Blanchard, Olivier, and Carlo Cottarelli, “Ten Commandments for Fiscal Adjustment in Advanced Economies,” blog post on IMF Direct, June 24, http://blog-imfdirect.imf.org/2010/06/24/ten-commandments-for-fiscal-adjustment-in-advanced-economies/. Gelos, Gaston R., Ratna Sahay, and Guido Sandleris, 2004, “Sovereign Borrowing by Developing Countries: What Determines Market Access?” IMF Working Paper No. 04/221 (Washington: International Monetary Fund). Giavazzi, Francesco, and Marco Pagano, 1990, “Can Severe Fiscal Contractions Be Expansionary? Tales of Two Small European Countries,” in NBER Macroeconomics Annual, Vol. 5, pp. 75–122 (Cambridge, Massachusetts: National Bureau of Economic Research). IMF, 2010, Fiscal Monitor: Navigating the Fiscal Challenges Ahead (Washington: International Monetary Fund), May. Mauro, Paolo, Nathan Sussman, and Yishay Yafeh, 2006, Emerging Markets and Financial Globalization—Sovereign Bond Spreads in 1870–1913 and Today (Cambridge: Oxford University Press). Ostry, Jonathan D., Atish R. Ghosh, Jun Il Kim, and Mahvash S. Qureshi, 2010, “Fiscal Space,” IMF Staff Position Note 10/11 (Washington: International Monetary Fund). Reinhart, Carmen M., Kenneth S. Rogoff, and Miguel A. Savastano, 2003, “Debt Intolerance,” Brookings Papers on Economic Activity, Vol. 1, Spring, pp. 1–74. Sturzenegger, Federico, and Jeromin Zettelmeyer, 2006, Debt Defaults and Lessons from a Decade of Crises (Cambridge, Massachusetts: MIT Press).


