Embed Size (px)
Citation preview

ORIGINAL RESEARCHpublished: 07 June 2016
doi: 10.3389/fpsyg.2016.00780
Frontiers in Psychology | www.frontiersin.org 1 June 2016 | Volume 7 | Article 780
Edited by:
Marie-Helene Grosbras,
University of Glasgow, UK
Reviewed by:
Stephen V. Shepherd,
The Rockefeller University, USA
Sebastian Korb,
International School for Advanced
Studies, Italy
*Correspondence:
Steven R. Livingstone
Specialty section:
This article was submitted to
Emotion Science,
a section of the journal
Frontiers in Psychology
Received: 10 February 2016
Accepted: 09 May 2016
Published: 07 June 2016
Citation:
Livingstone SR, Vezer E, McGarry LM,
Lang AE and Russo FA (2016) Deficits
in the Mimicry of Facial Expressions in
Parkinson’s Disease.
Front. Psychol. 7:780.
doi: 10.3389/fpsyg.2016.00780
Deficits in the Mimicry of FacialExpressions in Parkinson’s DiseaseSteven R. Livingstone 1, 2, 3*, Esztella Vezer 1, Lucy M. McGarry 1, Anthony E. Lang 4, 5 and
Frank A. Russo 1, 3
1Department of Psychology, Ryerson University, Toronto, ON, Canada, 2Department of Computer Science and Information
Systems, University of Wisconsin-River Falls, Wisconsin, WI, USA, 3 Toronto Rehabilitation Institute, Toronto, ON, Canada,4Division of Neurology, Department of Medicine, University of Toronto, Toronto, ON, Canada, 5Morton and Gloria Shulman
Movement Disorder Centre at The Toronto Western Hospital, Toronto, ON, Canada
Background: Humans spontaneously mimic the facial expressions of others, facilitating
social interaction. This mimicking behavior may be impaired in individuals with Parkinson’s
disease, for whom the loss of facial movements is a clinical feature.
Objective: To assess the presence of facial mimicry in patients with Parkinson’s disease.
Method: Twenty-seven non-depressed patients with idiopathic Parkinson’s disease and
28 age-matched controls had their facial muscles recorded with electromyography while
they observed presentations of calm, happy, sad, angry, and fearful emotions.
Results: Patients exhibited reduced amplitude and delayed onset in the zygomaticus
major muscle region (smiling response) following happy presentations (patients M =
0.02, 95% confidence interval [CI] −0.15 to 0.18, controls M = 0.26, CI 0.14 to 0.37,
ANOVA, effect size [ES] = 0.18, p < 0.001). Although patients exhibited activation of the
corrugator supercilii and medial frontalis (frowning response) following sad and fearful
presentations, the frontalis response to sad presentations was attenuated relative to
controls (patients M = 0.05, CI −0.08 to 0.18, controls M = 0.21, CI 0.09 to 0.34,
ANOVA, ES = 0.07, p = 0.017). The amplitude of patients’ zygomaticus activity in
response to positive emotions was found to be negatively correlated with response times
for ratings of emotional identification, suggesting a motor-behavioral link (r = –0.45, p =
0.02, two-tailed).
Conclusions: Patients showed decreased mimicry overall, mimicking other peoples’
frowns to some extent, but presenting with profoundly weakened and delayed smiles.
These findings open a new avenue of inquiry into the “masked face” syndrome of PD.
Keywords: facial mimicry, Parkinson’s disease, facial expression, emotion, facial masking, facial bradykinesia,
hypomimia, rhythm
INTRODUCTION
Parkinson’s disease (PD) is the second most common neurodegenerative disorder, affecting 1% ofpeople aged over 60 and rising to 4% of the population over 80 (de Lau and Breteler, 2006). Thepathology of PD is defined by the degeneration of dopaminergic neurons in the substantia nigra(Olanow et al., 2009). One of the four cardinal symptoms of PD is akinesia, a loss of movementaffecting the body and face (Berardelli et al., 2001; Davie, 2008; Jankovic, 2008). Patients with PDoften present with a reduction or loss in the formation of spontaneous emotional facial expressions

Livingstone et al. Facial Mimicry in Parkinson’s Disease
(Buck and Duffy, 1980; Katsikitis and Pilowsky, 1988, 1991; Sakuand Ellgring, 1992; Brozgold et al., 1998) and voluntarily-posedfacial expressions (Borod et al., 1990; Bowers et al., 2006; Marsiliet al., 2014). Patients smile less frequently and less intensely, andalso produce more “false smiles,” leading to an impression ofbeing cold and withdrawn (Pentland et al., 1987; Pitcairn et al.,1990). This loss of facial movements is one of the most distinctiveclinical features of PD, and has been termed the “masked face”syndrome (Rinn, 1984; Bologna et al., 2013).
When healthy individuals are exposed to emotional facialexpressions, even unconsciously, they spontaneously react withbrief automatic facial movements that mimic the presented faces(Dimberg et al., 2000). These movements have been interpretedas a form of mimicking behavior, and are referred to as “facialmimicry” (Lundqvist and Dimberg, 1995; Hess and Blairy,2001). The presence of these movements have been suggested toimprove observers’ accuracy and response time during emotionalidentification, and are thought to play an important role in socialcommunication (Chartrand and Bargh, 1999; Niedenthal et al.,2001; Sonnby-Borgström et al., 2003; Niedenthal, 2007; Obermanet al., 2007; Stel and van Knippenberg, 2008; Wood et al., 2016).
Mimicry is typified by distinct facial muscle patterningfollowing the presentation of emotional facial expressions andvoices (Lang et al., 1993; Hietanen et al., 1998; Bradley andLang, 2000; Hess and Fischer, 2013). Positive expressions ofemotion, such as happiness, typically elicit strong activity inthe zygomaticus major muscle region, indicative of a smilingresponse (Dimberg, 1982; Lang et al., 1993; Lundqvist andDimberg, 1995; Hess and Blairy, 2001; Sato and Yoshikawa,2007). Negative expressions of emotion, such as sadness, anger,and fear, typically elicit activity in the corrugator superciliiregion (Lundqvist and Dimberg, 1995; Dimberg and Thunberg,1998; Dimberg et al., 2000; Hess and Blairy, 2001; Magnéeet al., 2007; Sato and Yoshikawa, 2007; Chan et al., 2014), andto a lesser extent, medial frontalis muscle region (Lundqvist,1995; Moody et al., 2007), suggestive of a frowning response.In this study we examine the presence of facial mimicryusing two positive expressions of emotion, happiness and calm,and three negative expressions of emotion, sadness, anger,and fear.
To our knowledge, there has been no investigation of facialmimicry in patients with PD. Three symptoms of movementdysfunction in PD—bradykinesia, akinesia, and hypokinsea—may affect the presentation of facial mimicry movements.Bradykinesia describes slowness of movement; akinesia denotespaucity of voluntary movement; while hypokinesia refers todecreases in movement amplitude (Berardelli et al., 2001;Jankovic, 2008; Ling et al., 2012). Given the presence of akinesiaand hypokinesia in PD (Péron et al., 2012), patients may exhibitan attenuation or absence of facial mimicry movements. Ifmovements are present, their muscle response times may bedelayed due to bradykinesia. In healthy individuals, experimentalmanipulations that block facial mimicry lead to increasedresponse times for the identification of emotion (Niedenthalet al., 2001, see also Oberman et al., 2007). Patients with unilateralfacial paralysis have also shown differential effects of emotionrecognition and response times in a facial mimicry context (Korb
et al., 2016). Thus, an attenuated or absent mimicry response inPD patients may also lead to slower response times of emotionalidentification.
A tendency in facial mimicry research has been to focus onstatic photographs, showing only the apex of an expression.However, faces in the real world are rarely static, and thereis compelling evidence that the presence of dynamic facialinformation improves observers’ performance on emotionaland non-emotional tasks (Bassili, 1979; Atkinson et al., 2004;Cunningham and Wallraven, 2009; Krumhuber et al., 2013).Dynamic facial expressions have been shown to elicit strongerfacial mimicry responses than static images (Sato and Yoshikawa,2007). Pairings of congruent facial and vocal expressions—where the emotion expressed through the face is the sameas that of the voice—have also been shown to elicit strongermimicry responses than incongruent pairings (Magnée et al.,2007). This research suggests that dynamic presentations ofcongruent face and voice expressions will elicit strong facialmimicry responses in observers. In this study we use dynamic,audio-visual presentations of emotional speech and song toelicit facial mimicry in observers (see also Chan et al., 2014).An advantage of using vocal communication is that it pairsemotionally-congruent faces with voices in an ecologically validcontext.
A growing body of research has shown that rhythmic auditorystimulation in a therapeutic context may enhance gross motormovement in PD patients (Thaut et al., 1996; Hackney et al.,2007; Ledger et al., 2008; de Bruin et al., 2010). As the internalclock is thought to be impaired in Parkinson’s disease (Artiedaet al., 1992; O’Boyle et al., 1996), the provision of an externalpulse may act as a replacement by which to synchronizemimicry movement. In this study we examine the effect ofrhythmic auditory support across three types of vocal stimuli:speech, singing without a metronome, and singing with ametronome pulse. We expected that patients would show thestrongest mimicry response to presentations of singing with ametronome pulse, and weakest responses to presentations ofspeech.
The aim of the present study was to assess the presence offacial mimicry movements in patients with PD. Facial muscleresponses were recorded with electromyography followingaudio-visual presentations of emotion, in non-depressed patientswith idiopathic PD and age-matched controls. We hypothesizedthat patients would exhibit attenuated facial muscle activityrelative to controls. Specifically, that patients’ would showreduced activity in the zygomaticus major muscle regionfollowing positive expressions (happy, calm) relative to controls,and reduced corrugator supercilii and medial frontalis activityfollowing negative expressions (sad, angry, fearful) relativeto controls. We also expected that patients would exhibita delay in facial muscle activation and behavioral responsesrelative to controls. Finally, we expected that patients wouldshow increased activity in the zygomaticus major to sungpositive expressions relative to spoken positive expressions, andincreased activity in the corrugator supercilii andmedial frontalisregions to sung negative expressions relative to spoken negativeexpressions.
Frontiers in Psychology | www.frontiersin.org 2 June 2016 | Volume 7 | Article 780

Livingstone et al. Facial Mimicry in Parkinson’s Disease
METHODS
ParticipantsThe process of recruitment and participation are illustrated inFigure 1. Participant demographics and clinical variables aresummarized in Table 1. Twenty-seven patients with idiopathicPD were recruited from the Movement Disorders Clinic atToronto Western Hospital, and from support groups in theToronto area. Informed consent was given. Ethical approval forthe study was obtained from the University Health Networkand Ryerson University, and all patients gave written informedconsent. Exclusion criteria included depression (defined as BeckDepression Inventory > 19) (Beck et al., 1961; Schrag et al.,2007), dementia (defined as Montreal Cognitive Assessment< 21) (Nasreddine et al., 2005; Dalrymple-Alford et al.,2010), secondary or acquired parkinsonian disorders (e.g.,parkinsonism plus syndromes) (Rao et al., 2003; Brigo et al.,2014), advanced stage PD (defined as Hoehn and Yahr stage >
4) (Goetz et al., 2004), and language unfamiliarity (defined as <8years of English speaking experience). General well-being wasassessed with the 39-item PD Questionnaire (Peto et al., 1995),and general motor function was assessed with the motor-subscaleof the Unified PD Rating Scale (Fahn et al., 1987). Twenty-eight control participants were recruited from the Toronto areathrough the Ryerson Senior Participant Pool, and were matchedaccording to age and sex.
The sample size of our study was determined using a prioristatistical power analysis. We were not aware of any prior studythat had examined facial muscle mimicry in PD patients. Onthe basis of literature concerning facial masking, we predicted alarge between-subjects effect size in our mixed design ANOVA
TABLE 1 | Characteristics of study populationa.
Group Test statistics
Parkinson’s Healthy Control t or χ2 (df); p-value
(n = 27) (n = 28)
Male/Female 18/9 19/9 χ2 (1) = 0.01; 0.93
Age, y 68.07± 7.54 67.04±7.33 t(53) = 0.53; 0.6
Educationb, y 15.74± 2.98 16.18±3.1 t(53) = −0.55; 0.7
Years since diagnosis, y 5.59± 4.42 N/A
MoCA 26.11± 2.52 26.0±2.47 t(53) = −0.56; 0.58
BDI 8.19± 5.11 5.0±3.44 t(53) = 2.41; 0.02
Hoehn and Yahr 2.3± 0.50 N/A
PDQ39 28.96± 15.56 N/A
UPDRS-MSc 27.07± 12.36 N/A
UPDRS-MS Faciald 1.07± 0.86 N/A
t, Independent-samples t-test; χ2, Pearson Chi-Square; MoCA, Montreal Cognitive
Assessment; BDI, Beck Depression Inventory; PDQ39, PD Questionnaire; UPDRS-MS,
Unified PD Rating Scale—Motor Scale.aValues are mean ± SD. Tests with significant results highlighted in boldface.bRefers to years of formal education starting from the first year of elementary education
through to and including tertiary education.cMaximum score of UPDRS-MSwas 47, as the pull test was not conducted due to patient
safety concerns.dFacial expression sub-score of UPDRS-MS (3.2). Scores range from 0 (normal) to 4
(severe).
f = 0.4 (Cohen, 1992). A power analysis using G-Power (Faulet al., 2007) indicated that a total sample size of 44 (22 per group)would be needed, with 95% power (1-β), an alpha of 0.05, anda correlation of 0.5 among the 120 repeated measurements. Wewere also interested in determining the required sample sizes forour within subjects factors, and between-within interaction tests.For these tests we predicted medium-sized effects in our ANOVA(f = 0.25), as the levels of each factor had fewer measurements.The test was coded for two groups, with 95% power (1-β), alphaof 0.05, and a correlation of 0.5 among measures. For the maineffect of Emotion (five measurements: calm, happy, sad, angry,fearful), a total sample size of 32 would be needed. For themain effect of vocal Channel (three measurements: speech, song,song-metronome), a total sample size of 44 would be needed.For the interactions Group × Emotion, Group × Channel, andGroup × Emotion × Channel, samples sizes of 20, 28, and12 respectively would be needed. These analyses suggest thatour recruited sample of 55 participants (27 Patient, 28 Control)would be sufficient to detect the primary EMG effects of interest.
Stimuli and ApparatusStimuli from the Ryerson Audio-Visual Database of EmotionalSpeech and Song were used (Livingstone and Russo,under review). Recordings consisted of four professionalactors (2 male, 2 female) with a high level of acting experience(M = 13.25 y, SD = 4.71). Two emotionally neutral statementswere used (“Kids are talking by the door,” “Dogs are sitting bythe door”). Statements were seven syllables in length and werematched in word frequency and familiarity using the MRCpsycholinguistic database (Coltheart, 1981). Statements werespoken and sung using five different emotions: calm, happy,sad, angry, and fearful. Two additional emotions, surprise anddisgust, were presented in the speech condition only. Theseemotions were not the focus of the current study and wereexcluded prior to analysis. An additional set of four trialsshowing no emotion for each channel was included as a controltask. Half of the song trials were overlaid with a metronomethat was locked to the timing of each stimulus. Analyzedstimuli consisted of 60 unique recordings, composed of 20speech utterances, 20 song utterances, and 20 song-metronomeutterances. The duration of song utterances (M = 4.25 s, SD =
0.54 s, range = 4.0 to 6.0 s) differed to that of spoken utterances(M = 3.25 s, SD = 0.43, range = 3.0–4.0 s), as vocalists weresinging to a musical rhythm. Examples of these stimuli arepresented in Supplemental Video 1. Perceptual validation datafor these stimuli (proportion correct, unbiased hit rates, intensityratings, response times) are presented in Supplemental Table 1
(taken from Livingstone and Russo, under review).Stimuli were delivered with Presentation R© software
(NeuroBehavioral Systems, 2014), on a windows PC connectedto a 19-in. flat-screen LCD monitor, at a distance of 0.5mfrom the participant. Each trial consisted of five epochs.Trials began with a fixation cross that varied randomly from4000 to 7000 ms. After the fixation cross, the stimulus waspresented to participants. A blank screen was then shown, whichvaried randomly from 2300 to 3400 ms, to reduce expectancymovements. A forced-choice categorical response screen was
Frontiers in Psychology | www.frontiersin.org 3 June 2016 | Volume 7 | Article 780

Livingstone et al. Facial Mimicry in Parkinson’s Disease
FIGURE 1 | Flow chart of recruitment, allocation, and participation of study participants.
then presented, on which participants were required to identifythe category of the expressed emotion (Speech options: calm,happy, sad, angry, fearful, surprise, disgust, no emotion. Songoptions: calm happy, sad, angry fearful, no emotion). After aresponse was selected, a unidimensional Likert response screenwas immediately presented, on which participants rated theintensity of the expressed emotion (1 = not at all intense to 9 =very intense).
Facial muscle activity was recorded with a Biopac MP150system. Silver-silver chloride (Ag/AgCl) electrodes spaced 25mmapart were applied over the zygomaticus major and corrugatorsupercilii muscle regions on the left side of the face, and overthe medial frontalis muscle region on the right side of theface (Tassinary et al., 2007). Impedance levels were tested, andelectrodes that exceeded 25 kOhm were re-adjusted.
Design and ProcedureThe experiment was a 2 × 5 mixed design. Group (two levels:Patient, Control) was the between-subjects factor. Channel (threelevels: speech, song, song-metronome) × Emotion (five levels:calm, happy, sad, angry, fearful)× Sex of Actor (2)×Token (2)×Repetition (2) were the within-subjects factors, with 120 trials perparticipant. Trials were blocked by channel and counterbalanced,with remaining factors presented in random order within each
block. The term Channel refers to the type of vocal contentproduced by the actor in the presented stimulus. The termToken refers to different stimulus recordings that have thesame channel-emotion-sex factors. Tokens were used to increasethe variability of the stimulus, while controlling the factorsof interest. Repetition refers to the presentation of the samestimulus video.
Participants were seated in an immobile chair and told thatthey would be presented with short videos of people speakingand singing with different emotions. Participants were told thatafter each video they would be asked to identify the emotion theythought the vocalist was expressing, and to rate the intensity ofthe expressed emotion. The concepts of emotional category andintensity were explained to participants, and the response scaleswere shown to participants. Participants used their dominanthand to provide feedback on a numeric keypad. Participantsplaced their palm on the desktop, with their fingers resting on thekeys. The numeric keypad was used to minimize handmovementrequired for responding. To allow participants to keep their armcomfortably immobile throughout the session, cushions wereused to raise the participants’ forearms to the height of thedesk.
Participants were instructed to respond at a comfortable pace,and not to linger on any one question. While response time
Frontiers in Psychology | www.frontiersin.org 4 June 2016 | Volume 7 | Article 780

Livingstone et al. Facial Mimicry in Parkinson’s Disease
tasks typically instruct participants tomove as quickly as possible,our instruction was designed to reduce task-related anxiety inpatients. Anxiety disorders are comorbid with PD (Shiba et al.,2000), and the presence of anxiety may have affected the EMGrecording. PD patients administered their levodopa medication∼1 h prior to testing, and were required to have been in their“on time,” as was verbally confirmed by patients (Pahwa et al.,2006).
EMG ProcessingEMG data were bandpass filtered to reduce gross-motor artifactsand high-frequency noise (Butterworth, 6th order, 20 and 400Hzcorner frequencies) (van Boxtel, 2001; De Luca et al., 2010). Anotch filter (Butterworth, 4th order, 60 Hz) was used to attenuateAC electrical noise. Data were full-wave rectified and smoothedusing a Root Mean Square filter with a 50 ms sliding window andoverlap of 49 ms. Time-series data were natural log transformed,and standardized as z-scores within participants and electrodesites to allow for comparisons across muscle sites (Tassinaryet al., 2007; Oberman et al., 2009). Data were corrected using abaseline subtraction procedure, where mean EMG activity from−2000 to 0 ms prior to stimulus onset were subtracted fromthe target window, defined as 0 to +3000 ms after stimulusonset. This procedure produced data where values greater thanzero represented an increase in muscle activation relative tothe prestimulus baseline. A target window of 3000 ms wasselected so that no stimulus was shorter than the target windowlength.
For muscle latency analyses, data were downsampled to 10Hz,by averaging values for each 100 ms interval from 0 to+3000 ms,producing a time series of 30 distinct 100 ms intervals pertrial. To reduce the number of statistical tests, muscle responseswere binned within participant to produce mean EMG responsesfor positive and negative expressions. For positive expressions,calm and happy trials were averaged to produce a single meanEMG response in the zygomaticus major muscle region. Fornegative expressions, sad and fearful trials were averaged toproduce mean EMG responses, for both the corrugator superciliiand medial frontalis muscle regions. Angry trials were excludedfrom the latency analysis as these trials did not exhibit astrong mimicry response in the primary EMG analysis. Thisdata reduction process yielded three distinct EMG timeseriesfor muscle latency analysis: zygomaticus major responsesto positive expressions, corrugator supercilii responses tonegative expressions, and medial frontalis responses to negativeexpressions.
AnalysesWe expected specific patterns of muscle activation in responseto different emotional presentations. We predicted that happyexpressions would elicit large contractions of the zygomaticusmajor muscle region (Dimberg, 1982; Dimberg et al., 2000;Chan et al., 2014). To our knowledge, calm expressionshave not been examined in the context of facial mimicry.Calm is a mild positive expression, involving weak activationof the zygomaticus major muscle region (Tottenham et al.,2009). We expected that calm expressions would elicit a
small activation of the zygomaticus muscle region. We furtherpredicted that the negative emotions sad, angry, and fearfulwould elicit activation of the corrugator supercilii and medialfrontalis muscle regions (Ekman and Friesen, 1978; Lundqvist,1995; Wolf et al., 2005; Oberman et al., 2009; Chan et al.,2014).
Two measures were derived from the EMG data. For ourprimary EMG analysis we calculated the EMG amplitude overspecific muscle regions, which we quantified as the mean activityoccurring during the target window (0 and +3000 ms afterstimulus onset). For our secondary EMG analysis, we calculatedthe latency of muscle activity onset using a monotonic function,which we defined as the first time interval after which threesuccessive increases in EMG activity occurred.
Behavioral response times were calculated for emotionalidentification and emotional intensity perceptual measures,defined as the duration of time from feedback screen display toparticipant input. As patients were expected to show attenuatedmimicry responses, we predicted that patients would showan inverse relationship between facial muscle amplitudes andbehavioral response times, for specific emotion-muscle pairs.Specifically, that smaller zygomaticus responses for calm andhappy trials would exhibit longer response times, and thatattenuated corrugator supercilii and medial frontalis responsesfor sad, angry, and fearful trials would also show longer responsetimes. These hypotheses were examined with separate two-tailedPearson correlations. Mean response time values across all calmand happy trials for each participant were correlated with meanzygomaticus values for those trials, while mean response timesacross all sad, angry, and fearful trials for each participant wereeach correlated with mean EMG corrugator and mean EMGfrontalis values for those trials. Participant response measuresfor emotional identification accuracy and ratings of emotionalintensity were also analyzed (see Supplemental Data 1).
One control participant spoke quietly to themselvesthroughout the EMG recording session, despite instruction,and was excluded from the data prior to analysis. One patientexhibited dyskinesia in the forehead region. As the dyskinesiamovements were restricted to the forehead region, and were notpresent in any other body region, the corrugator supercilii andmedial frontalis data obtained from this patient were excludedprior to analysis.
Demographic and questionnaire measures were analyzed withindependent samples t-tests. EMG activity and response timeswere analyzed with mixed-design analyses of variance (ANOVA)and paired samples t-tests. Behavioral response times wereanalyzed with mixed-design ANOVA. For all ANOVAs a custommodel was specified, wherein incidental factors not implicatedin our predictions were excluded (i.e., sex of actor, token,repetition). Sphericity was assessed withMauchly’s test (Mauchly,1940)1. When the test was significant, Greenhouse–Geisser’scorrection was applied in cases where ε < 0.75, and Huynh-Feldt correction where ε > 0.75 (as proposed by Girden, 1992;
1The assumption of sphericity—that variances of the differences between levels ofthe independent variables are equal—is an important requirement ANOVA, as thepresence of sphericity may result in an inflated F-ratio (Hinton et al., 2014).
Frontiers in Psychology | www.frontiersin.org 5 June 2016 | Volume 7 | Article 780
Livingstone et al. Facial Mimicry in Parkinson’s Disease
Field, 2009). All effect sizes report partial eta-squared values.Means are accompanied by 95% confidence intervals in squarebrackets. Pairwise comparisons were adjusted using Bonferonnicorrection. Statistical tests were conducted in MATLAB 2014aand SPSS 22.0.1.
RESULTS
Demographic MeasuresParticipant demographics, cognitive function, and depressionwere assessed, as summarized in Table 1. No significantdifferences between groups were found in participantdemographics or on cognitive function. A significant differencein BDI scores was found, t(53) = 2.41, p= 0.019, 95% confidenceinterval [0.43, 4.7], d= 0.65. As expected, patients (M = 7.81, SD= 4.3, range 1–15) scored higher than controls (M = 5.25, SD =
3.57, range 1–17). Importantly, all participants were below thethreshold for moderate depression (BDI < 20), with a majorityof patients (25 of 27) and controls (27 of 28) falling within therange of minimal depression (BDI = 0 to 13). UPDRS facialexpression sub-scores (M = 1.07, SD = 0.86) indicated thatpatients exhibited only minimal facial masking.
Primary Measures: EMGSeparate two-way mixed-design ANOVAs with the between-subjects factor of Group (2), and within-subjects factors ofChannel (3 levels: speech, song-metronome, song) and Emotion(5 levels: calm, happy, sad, angry, fearful) were conducted onparticipants’ mean amplitude for zygomaticus major, corrugatorsupercilii, and medial frontalis muscle regions, as summarizedin Table 2. Significant main effects of Emotion were found onall three muscles, confirming that different presentations ofemotion produced distinct patterns of muscle activation thatwere characteristic of facial mimicry.
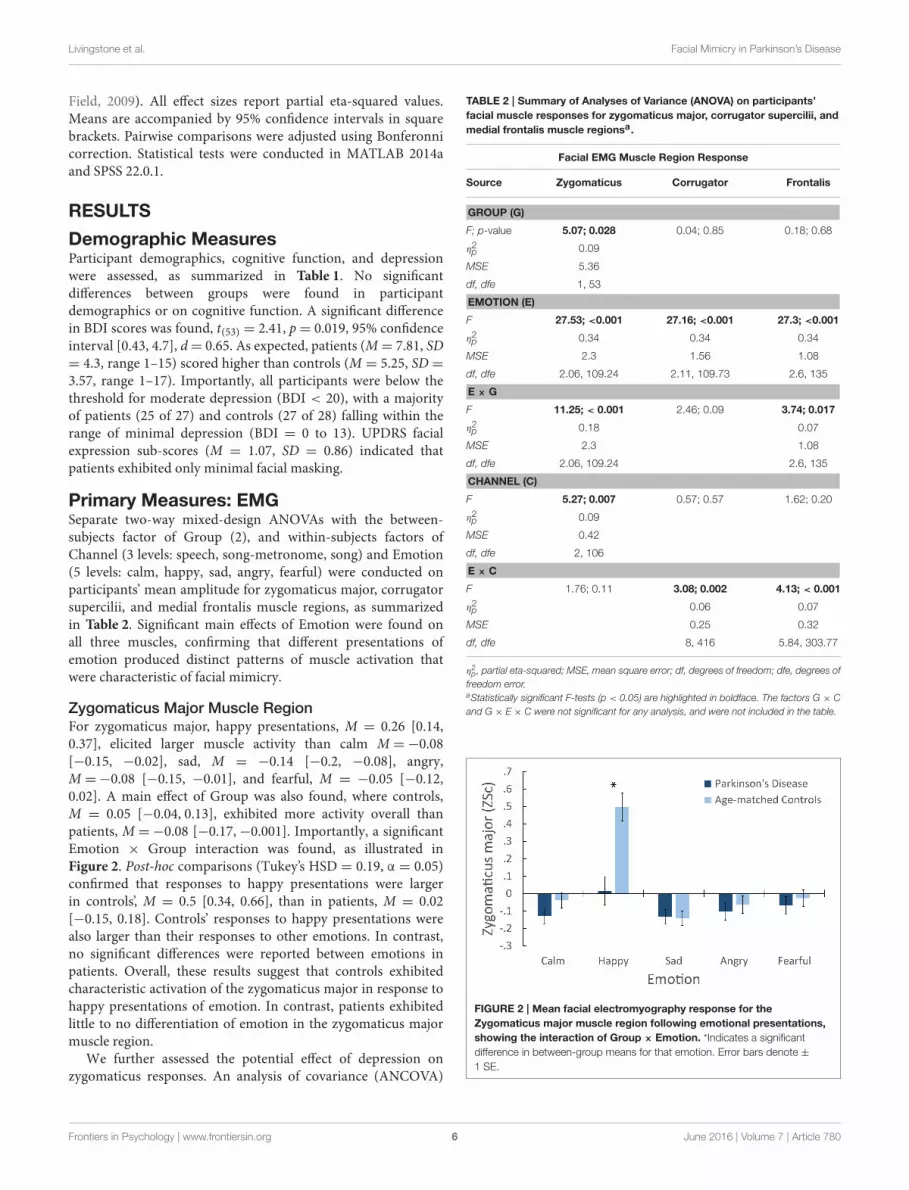
Zygomaticus Major Muscle RegionFor zygomaticus major, happy presentations, M = 0.26 [0.14,0.37], elicited larger muscle activity than calm M =−0.08[−0.15, −0.02], sad, M = −0.14 [−0.2, −0.08], angry,M =−0.08 [−0.15, −0.01], and fearful, M = −0.05 [−0.12,0.02]. A main effect of Group was also found, where controls,M = 0.05 [−0.04, 0.13], exhibited more activity overall thanpatients, M =−0.08 [−0.17,−0.001]. Importantly, a significantEmotion × Group interaction was found, as illustrated inFigure 2. Post-hoc comparisons (Tukey’s HSD = 0.19, α = 0.05)confirmed that responses to happy presentations were largerin controls’, M = 0.5 [0.34, 0.66], than in patients, M = 0.02[−0.15, 0.18]. Controls’ responses to happy presentations werealso larger than their responses to other emotions. In contrast,no significant differences were reported between emotions inpatients. Overall, these results suggest that controls exhibitedcharacteristic activation of the zygomaticus major in response tohappy presentations of emotion. In contrast, patients exhibitedlittle to no differentiation of emotion in the zygomaticus majormuscle region.
We further assessed the potential effect of depression onzygomaticus responses. An analysis of covariance (ANCOVA)
TABLE 2 | Summary of Analyses of Variance (ANOVA) on participants’
facial muscle responses for zygomaticus major, corrugator supercilii, and
medial frontalis muscle regionsa.
Facial EMG Muscle Region Response
Source Zygomaticus Corrugator Frontalis
GROUP (G)
F; p-value 5.07; 0.028 0.04; 0.85 0.18; 0.68
η2p 0.09
MSE 5.36
df, dfe 1, 53
EMOTION (E)
F 27.53; <0.001 27.16; <0.001 27.3; <0.001
η2p 0.34 0.34 0.34
MSE 2.3 1.56 1.08
df, dfe 2.06, 109.24 2.11, 109.73 2.6, 135
E × G
F 11.25; < 0.001 2.46; 0.09 3.74; 0.017
η2p 0.18 0.07
MSE 2.3 1.08
df, dfe 2.06, 109.24 2.6, 135
CHANNEL (C)
F 5.27; 0.007 0.57; 0.57 1.62; 0.20
η2p 0.09
MSE 0.42
df, dfe 2, 106
E × C
F 1.76; 0.11 3.08; 0.002 4.13; < 0.001
η2p 0.06 0.07
MSE 0.25 0.32
df, dfe 8, 416 5.84, 303.77
η2p , partial eta-squared; MSE, mean square error; df, degrees of freedom; dfe, degrees of
freedom error.aStatistically significant F-tests (p < 0.05) are highlighted in boldface. The factors G × C
and G × E × C were not significant for any analysis, and were not included in the table.
FIGURE 2 | Mean facial electromyography response for the
Zygomaticus major muscle region following emotional presentations,
showing the interaction of Group × Emotion. *Indicates a significant
difference in between-group means for that emotion. Error bars denote ±
1 SE.
Frontiers in Psychology | www.frontiersin.org 6 June 2016 | Volume 7 | Article 780

Livingstone et al. Facial Mimicry in Parkinson’s Disease
was conducted on zygomaticus responses, with BDI scoresentered as a covariate. BDI was not significant, F(1, 52) = 0.35,p = 0.56, nor were any interactions involving BDI. The effect ofGroup was marginally significant, F(1, 52) = 3.76, p= 0.058, η2p =0.07. Importantly, the interaction of Emotion×Group remainedsignificant after controlling for BDI scores, F(2.1, 109.15) = 7.98,p < 0.001, η2p = 0.13.
Medial Frontalis Muscle RegionFor medial frontalis, sad presentations, M = 0.13 [0.04, 0.22],and fearful, M = 0.12 [0.03, 0.21], elicited larger activation thancalm, M = 0.001 [−0.08, 0.08], happy, M = −0.15 [−0.26,−0.04], and angry,M =−0.08 [−0.14,−0.02]. No main effect ofGroup was found. Importantly, a significant Emotion × Groupinteraction was found, as illustrated in Figure 3A. Post-hoccomparisons (Tukey’s, HSD = 0.13, α = 0.05) confirmed thatsad presentations elicited larger medial frontalis responsesin controls, M = 0.21 [0.09, 0.34], than patients, M = 0.05[−0.08, 0.18]. Controls’ responses to sad were larger than theirresponses to calm, M = −0.02 [−0.13, 0.1], happy, M = −0.14[−0.29, 0.01], and angry,M = −0.11 [−0.19, −0.03], while theirresponses to fear, M = 0.15 [0.03, 0.28] were larger than theirresponses to calm and happy. Patients’ responses to calm, M =
0.02 [−0.1, 0.14], sad, and fearful, M = 0.08 [−0.05, 0.21] wereall larger than their responses to happy, M = −0.16 [−0.32,−0.01], while their responses to fearful were also larger thantheir responses to angry, M = −0.05 [−0.13, 0.04]. A significantinteraction of Channel × Emotion was also found. Post-hoccomparisons (Tukey’s HSD = 0.09, α = 0.05) confirmed thatresponses to calm Song-Metronome, M = 0.015 [−0.07, 0.1],were larger than calm Speech, M = −0.09 [−0.2, 0.02], whileno other emotion varied between channels, suggesting a role inthe interaction. Overall, these results suggest that both groupsexhibited characteristic activation of the medial frontalis muscleregion, with the largest activity occurring in response to thenegative emotions sad and fearful, with controls exhibiting agreater response to sad than patients.
Corrugator Supercilii Muscle RegionFor corrugator supercilii, sad presentations, M = 0.10 [0.03,0.17], and fearful, M = 0.10 [0.01, 0.19], elicited larger muscleactivity than calm, M = −0.05 [−0.12, 0.03], happy, M =−0.22[−0.33,−0.11], and angry, M = −0.06 [−0.12, 0.002].Importantly, no main effect of Group was found, nor were anyinteractions involving Group. Figure 3B illustrates participants’corrugator supercilii responses. While no interaction of Emotionand Group was found, both groups are plotted to aid comparisonwith other muscles. A significant interaction of Channel ×
Emotion was found. Post-hoc comparisons (Tukey’s HSD= 0.08,α = 0.05) confirmed that responses to calm Song-Metronome,M = −0.01 [−0.09, 0.07], were larger than calm Speech,M =−0.13 [−0.22,−0.04], while no other emotion variedbetween channels, suggesting a role in the interaction. Overall,these results suggest that both groups exhibited comparableactivation of the corrugator supercilii muscle region, with thelargest activation occurring in response to the negative emotionssad and fearful. As expected, these patterns are similar to those
FIGURE 3 | Mean facial electromyography response following
emotional presentations. Two panes illustrate responses of the (A) Medial
frontalis region, showing a significant interaction of Group × Emotion.
*Indicates a significant difference in between-group means for that emotion.
(B) Corrugator supercilii muscle region. No interaction of Emotion and Group
was found for corrugator responses, however both groups are shown for ease
of visual comparison.
obtained for the medial frontalis muscle region, as seen inFigure 3A.
Secondary Measures: BehavioralResponses and Muscle LatencyResponse Time MeasuresA two-way mixed-design ANOVA was conducted onparticipants’ emotion identification response times. A maineffect of Channel was found, F(1.73, 91.84) = 27.5, p < 0.001,η2p = 0.34, where song, M = 3130 ms [2746, 3514], had the
fastest response times, followed by song-metronome, M =
3589 ms [3255, 3924], with speech, M = 4170ms [3749, 4592],exhibiting the slowest response times. A marginally significantmain effect of Emotion was also found, F(2.56, 135.41) = 2.8, p =
0.051, η2p = 0.05. Importantly, a significant main effect of Group
was found, F(1, 53) = 6.35, p = 0.015, η2p = 0.11, where patients,M = 4064 ms [3571, 4556], had slower response times thancontrols,M = 3196 ms [2712, 3680].
A two-way mixed-design ANOVA was conducted onparticipants’ emotional intensity response times. A significant
Frontiers in Psychology | www.frontiersin.org 7 June 2016 | Volume 7 | Article 780

Livingstone et al. Facial Mimicry in Parkinson’s Disease
main effect of Channel was found, F(1.47, 78.1) = 9.51, p = 0.001,η2p = 0.15, where song, M = 2039 ms [1654, 2423], had faster
response times than song-metronome, M = 2374 ms [2073,2675], and speech, M = 2410 ms [2004, 2815]. A main effect ofEmotion was found, F(3.4, 180.23) = 6.38, p < 0.001, η
2p = 0.11.
Shortest responses times were found for angry, M = 2078 ms[1738, 2418], and fear,M = 2149 ms [1849, 2449], then happy,M= 2302 ms [1936, 2669], with longest response times for sad, M= 2416 ms [2023, 2809], and calm, M = 2426 ms [2001, 2850].Interestingly, no effect of Group was found, F(1, 53) = 0.95, p= 0.33, with patients, M = 2444 ms [1945, 2944], and controls,M = 2104 ms [1614, 2595]. These results suggest that whilepatients were slower than controls at identifying the category ofthe emotion, they were equivalent to controls in their responsetimes for ratings of emotional intensity.
Muscle Latency MeasuresNext we examined the onset latency of participants’ facial musclesfollowing presentations of emotional stimuli. Based on ourhypotheses, we examined latency for positive emotions (calmand happy) in the zygomaticus major, and for negative emotions(sad and fearful) in the corrugator supercilii and medial frontalisregions. Zygomaticus muscle onset times in patients (M = 1142ms, SD = 719 ms) were significantly delayed relative to controls(M = 790 ms, SD = 694 ms), t(45) = −1.69, p < 0.05, d = 0.5,as illustrated in Figure 42. Onset latency was not significantlydifferent for corrugator supercilii (p= 0.47) and medial frontalis(p= 0.3) muscle regions.
Correlating EMG and Response Time MeasuresIn our final analysis we examined the relationship betweenpatients’ emotional identification response times and theamplitude of their facial muscle responses. Patients’ meanzygomaticus activity across all positive emotion trials (calm andhappy) was correlated with their mean emotion identificationresponse times for those trials. The correlation was statisticallysignificant, r(26) = –0.45, p = 0.02, two-tailed3. Patients meancorrugator supercilii and medial frontalis activity across allnegative emotion trials (sad, angry, and fearful) were correlatedwith their mean emotion identification response times for thosetrials. The correlation between emotion identification responsetimes and corrugator activity was not significant (p = 0.27), norwas the correlation for medial frontalis activity (p= 0.16). Theseresults indicate that patients were quicker at identifying positiveemotions (calm and happy) when those trials exhibited largeractivity in the zygomaticus major muscle region.
DISCUSSION
Using facial electromyography in the context of an emotionidentification task, we provide converging evidence that patients2In the calculation of zygomaticus latency responses, two healthy controls and ninepatients did not satisfy the condition for three consecutive increases, and were notincluded in the calculation.3The analysis was repeated for controls, though no differences were expecteddue to a priori predictions of healthy mimicry function. No correlation reachedsignificant across the three muscle regions: zygomaticus (p = 0.58), corrugator (p= 0.81), and medial frontalis (p= 0.19).
FIGURE 4 | Mean facial electromyography response for the
Zygomaticus major muscle region, in patients and controls, plotted in
intervals of 100 ms during the first 3 s of exposure following calm and
happy presentations. Error bars are indicated by shaded regions around
trajectory lines, and represent one standard error of the mean.
with Parkinson’s disease exhibit deficits in facial mimicry.Patients showed little to no reaction in the zygomaticusmajor muscle region following happy presentations of emotion,while controls exhibited a robust muscle response that wascharacteristic of facial mimicry (Dimberg, 1982). Zygomaticusresponses following happy presentations were also significantlydelayed in patients relative to controls, beginning 350 ms later onaverage. Importantly, these results were unrelated to depressionscores (Schwartz et al., 1976). In contrast, both groups exhibitedcomparable patterns of activity in the corrugator superciliimuscle region, with strong responses to the negative emotionssad and fearful (Lundqvist, 1995; Dimberg et al., 2000). Bothgroups exhibited differentiable patterns of activation in themedial frontalis region, however patients exhibited a weakerresponse to sad presentations relative to controls. Collectively,these results suggest that patients exhibited a deficit in their facialmimicry responses to emotional displays, with patients showingweakened and delayed mimicry to smiles but not frowns.
A deficit in the smiling mimicry response may contributeto the observation of individuals with PD as being cold andwithdrawn (Pentland et al., 1987; Pitcairn et al., 1990). Frominfancy, smiling and other facial expressions play a central rolein human communication (Tronick et al., 1978). An absence ofsmiling mimicry may also impact patients’ emotional well-being(Davie, 2008), as previous research has found that the frequency,intensity, and duration of zygomaticus major muscle activationpredicts self-reported measures of happiness (Ekman et al., 1980;Cacioppo et al., 1986).
A deficit in the zygomaticus muscle region accords with othercharacterizations of facial movement in PD, where bradykinesiaand hypokinesia have been reported in the lower face ofpatients during smiling (Marsili et al., 2014). Similarly, patientscommonly report oro-buccal symptoms—those affecting regionsin and around the mouth—including dysphagia, dysarthria, and
Frontiers in Psychology | www.frontiersin.org 8 June 2016 | Volume 7 | Article 780

Livingstone et al. Facial Mimicry in Parkinson’s Disease
sialorrhea (Perez-Lloret et al., 2012). These findings supportresearch suggesting that patients exhibit deficits in spontaneousfacial expressions (Rinn, 1984; Smith et al., 1996; Simons et al.,2003; Bowers et al., 2006; Assogna et al., 2008).
Our results suggest an overall deficit in mimicry, but with aprofoundly weakened and delayed response in the zygomaticusmuscle following happy expressions (smiling response). Thisimpairment may be due to the effects of PD on the basal ganglianetwork and associated motor areas of the brain. The ventralstriatal region within the basal ganglia has been linked to theprocessing and regulation of positive emotions (Hamann andMao, 2002; Kim and Hamann, 2007), while negative emotionsare primarily processed in the medial prefrontal and anteriorcingulate cortices (Etkin et al., 2011). Relative differences inresponses to happy expressions vs. negative expressions (sad,fearful), may be due in part to the varied state of degenerationin these brain areas.
A facial mimicry deficit in PD patients is likely a consequenceof broader motor symptoms including bradykinesia, akinesia,and hypokinsea. However, our results suggest that these motorsymptoms have behavioral consequences. Patients were slowerat identifying the category of the expressed emotion, taking868 ms longer on average than controls. One explanation isthat patients were slower than controls at providing manualkeyboard feedback due to bradykinesia (slowness of movement).However, response times for ratings of emotional intensitywere comparable across both groups. Intensity ratings were alsoprovided more quickly than category responses (2274 vs. 3630ms respectively), suggesting that patients’ response times foremotional category do not reflect a “floor” effect of requiredhand movement time. While these results should be interpretedwith caution, they suggest that varying aspects of emotionaljudgements may be differentially impaired in PD patients.
Behavioral response times were negatively correlated with theamplitude of facial muscle activation in patients, but not controls.In particular, patients were slower at identifying the emotionfor calm and happy trials when their zygomaticus responsesto those trials were attenuated. A similar relationship has beenreported in healthy individuals, where purposeful blocking offacial mimicry leads to increased response times for emotionalidentification (Niedenthal et al., 2001). Consequently, a motor-behavioral link may exist where impaired mimicry activity in PDpatients may contribute to slower response times of emotionalprocessing. However, future studies are needed to properly assessthis relationship.
Patients exhibited comparable facial mimicry activity acrossspeech and song presentations. Previous studies have revealedthat an auditory rhythm can facilitate motor activities in PDpatients. It is unclear why the singing conditions did not facilitatemimicry activity in patients. One explanation is that an externalmetronome only facilitates periodic motor activities, such aswalking, dancing, or tapping. Another explanation is that thebenefits of an auditory rhythm are only realizable following asustained therapeutic intervention (Thaut et al., 1996; Hackneyet al., 2007; Ledger et al., 2008; de Bruin et al., 2010).
The present study had several limitations. First, angry stimulidid not elicit characteristic activation of the corrugator supercilii
muscle region in healthy participants (Hess and Fischer,2013). This absense was unexpected, as angry expressionswere the second most accurately identified expression byparticipants (M = 79%), and were rated as the most emotionallyintense (M = 6.62 out of 9) by participants, as described inSupplemental Data 1. A review of angry stimuli indicatedthat while actors contracted the corrugator supercilii duringvocalization, the contractions were relatively brief in duration.The absense of an angry-corrugator response in participantsmay therefore be due to the lack of sustained corrugator musclecontractions in the angry stimuli. A second limitation of thestudy is the degree to which participants’ facial muscle responsescan be interpreted as facial mimicry, rather than emotionalmimicry, due to the use of stimuli that presented both facialand vocal expressions of emotion. Facial mimicry, also referredto as the matched motor hypothesis, contends that observersmimic the same facial muscle movements they are presentedwith (e.g., anger mimics anger). In contrast, emotional mimicryproposes that observers’ responses are an interpretation ofthe presented signal (e.g., anger elicts fear) (Hess and Fischer,2013). Importantly though, this theoretical distinction doesnot affect the main results that PD patients show significantlyweakened and delayed facial muscle reactions to presentations ofemotional faces and voices. Future studies will ideally examinemimicry responses in PD patients to face-only and voice-onlyexpressions. The third limitation of the study was the use ofstimuli that varied in duration, and the effect this may have hadon participants’ behavioral response times. Spoken stimuli wereshorter in duration than sung stimuli. This difference may partlyexplain why participants were slower at identifying emotion inspeech.
CONCLUSION
When healthy individuals are exposed to emotional facialexpressions, even below the threshold of consciousness, theyspontaneously react with muscle activations that mimic thepresented faces. The presence of these movements facilitates arange of social and emotional tasks. In the present study, weshowed that patients with idiopathic PD exhibited deficits in themimicry of others’ expressions. Patients mimicked other people’sfrowns to some extent, but mimicked their happy faces with faintsmiles that were delayed in onset. These outcomes may haveimplications for the social well-being of patients, and open a newline of inquiry into the “masked face” syndrome of PD.
AUTHOR CONTRIBUTIONS
SL was involved in all stages of the research project, statisticalanalyses, and the preparation and review of the manuscript.EV was involved in the execution of the project, review ofstatistical analyses, and writing and review of the manuscript.LM was involved in the conception and organization of theproject, review of the statistical analyses and manuscript. AL wasinvolved in the conception of the project, review of the statisticalanalyses and manuscript. FR was involved in the conception and
Frontiers in Psychology | www.frontiersin.org 9 June 2016 | Volume 7 | Article 780

Livingstone et al. Facial Mimicry in Parkinson’s Disease
organization of the project, review of the statistical analyses, andwriting and review of the manuscript.
FUNDING
This research was supported by grants from the ParkinsonSociety of Canada (2012-22 to FR and SL), and the NaturalSciences and Engineering Research Council of Canada (341583-2012 to FR). All authors ensure that no conflict of interest,financial or otherwise, exists that may be seen as havinginfluenced the research.
ACKNOWLEDGMENTS
The authors thank members of the SMART Lab at RyersonUniversity for their comments, and the members of the Mortonand Gloria Shulman Movement Disorder Centre for assistingwith patient recruitment.
SUPPLEMENTARY MATERIAL
The Supplementary Material for this article can be foundonline at: http://journal.frontiersin.org/article/10.3389/fpsyg.2016.00780
Supplemental Data 1 | Supplemental results for patients’ and controls’
measures of emotional identification accuracy and ratings of emotional
intensity.
Supplemental Figure 1 | Supplemental figure accompanying Supplemental
Data 1.
Supplemental Table 1 | Supplemental table containing perceptual
validation results for stimuli used in the present study (taken from
Livingstone and Russo, under review). Validation data includes proportion
correct scores, unbiased hit rates, intensity ratings, and responses times for these
measures.
Supplemental Video 1 | Supplemental movie containing examples of
stimuli used in the present study showing calm, happy, sad, angry, and
fearful speech.
REFERENCES
Artieda, J., Pastor, M. A., Lacruz, F., and Obeso, J. A. (1992). Temporaldiscrimination is abnormal in Parkinson’s disease. Brain 115, 199–210. doi:10.1093/brain/115.1.199
Assogna, F., Pontieri, F. E., Caltagirone, C., and Spalletta, G. (2008). Therecognition of facial emotion expressions in Parkinson’s disease. Eur.
Neuropsychopharmacol. 18, 835–848. doi: 10.1016/j.euroneuro.2008.07.004Atkinson, A. P., Dittrich, W. H., Gemmell, A. J., and Young, A. W. (2004).
Emotion perception from dynamic and static body expressions in point-lightand full-light displays. Perception 33, 717–746. doi: 10.1068/p5096
Bassili, J. N. (1979). Emotion recognition: the role of facial movement and therelative importance of upper and lower areas of the face. J. Pers. Soc. Psychol.37, 2049–2058. doi: 10.1037/0022-3514.37.11.2049
Beck, A. T., Ward, C. H., Mendelson, M., Mock, J., and Erbaugh, J. K. (1961).An inventory for measuring depression. Arch. Gen. Psychiatry 4, 561–571. doi:10.1001/archpsyc.1961.01710120031004
Berardelli, A., Rothwell, J. C., Thompson, P. D., and Hallett, M. (2001).Pathophysiology of bradykinesia in Parkinson’s disease. Brain 124, 2131–2146.doi: 10.1093/brain/124.11.2131
Bologna, M., Fabbrini, G., Marsili, L., Defazio, G., Thompson, P. D., and Berardelli,A. (2013). Facial bradykinesia. J. Neurol. Neurosur. Psychiatry 84, 681–685. doi:10.1136/jnnp-2012-303993
Borod, J. C., Welkowitz, J., Alpert, M., Brozgold, A. Z., Martin, C., Peselow, E.,et al. (1990). Parameters of emotional processing in neuropsychiatric disorders:conceptual issues and a battery of tests. J. Commun. Disord. 23, 247–271. doi:10.1016/0021-9924(90)90003-H
Bowers, D., Miller, K., Bosch, W., Gokcay, D., Pedraza, O., Springer, U.,et al. (2006). Faces of emotion in Parkinsons disease: micro-expressivity andbradykinesia during voluntary facial expressions. J. Int. Neuropsychol. Soc. 12,765–773. doi: 10.1017/S135561770606111X
Bradley, M. M., and Lang, P. J. (2000). Affective reactions to acoustic stimuli.Psychophysiology 37, 204–215. doi: 10.1111/1469-8986.3720204
Brigo, F., Erro, R., Marangi, A., Bhatia, K., and Tinazzi, M. (2014). Differentiatingdrug-induced parkinsonism from Parkinson’s disease: an update on non-motorsymptoms and investigations. Parkinsonism Relat. Disord. 20, 808–814. doi:10.1016/j.parkreldis.2014.05.011
Brozgold, A. Z., Borod, J. C., Martin, C. C., Pick, L. H., Alpert, M., andWelkowitz, J. (1998). Social functioning and facial emotional expression inneurological and psychiatric disorders. Appl. Neuropsychol. 5, 15–23. doi:10.1207/s15324826an0501_2
Buck, R., and Duffy, R. J. (1980). Nonverbal communication of affect in brain-damaged patients. Cortex 16, 351–362. doi: 10.1016/S0010-9452(80)80037-2
Cacioppo, J. T., Petty, R. E., Losch,M. E., and Kim,H. S. (1986). Electromyographicactivity over facial muscle regions can differentiate the valence and intensity ofaffective reactions. J. Pers. Soc. Psychol. 50, 260. doi: 10.1037/0022-3514.50.2.260
Chan, L. P., Livingstone, S. R., and Russo, F. A. (2014). Facial mimicry in responseto song.Music Percept. 30, 361–367. doi: 10.1525/mp.2013.30.4.361
Chartrand, T. L., and Bargh, J. A. (1999). The chameleon effect: the perception–behavior link and social interaction. J. Pers. Soc. Psychol. 76:893. doi:10.1037/0022-3514.76.6.893
Cohen, J. (1992). A power primer. Psychol. Bull. 112, 155–159. doi: 10.1037/0033-2909.112.1.155
Coltheart, M. (1981). The MRC psycholinguistic database. Q. J. Exp. Psychol. 33A,497–505. doi: 10.1080/14640748108400805
Cunningham, D. W., and Wallraven, C. (2009). Dynamic information for therecognition of conversational expressions. J. Vis. 9, 1–17. doi: 10.1167/9.13.7
Dalrymple-Alford, J. C., MacAskill, M. R., Nakas, C. T., Livingston, L.,Graham, C., Crucian, G. P., et al. (2010). The MoCA well-suited screen forcognitive impairment in Parkinson disease. Neurology 75, 1717–1725. doi:10.1212/WNL.0b013e3181fc29c9
Davie, C. A. (2008). A review of Parkinson’s disease. Br. Med. Bull. 86, 109–127.doi: 10.1093/bmb/ldn013
de Bruin, N., Doan, J. B., Turnbull, G., Suchowersky, O., Bonfield, S., Hu,B., et al. (2010). Walking with music is a safe and viable tool for gaittraining in Parkinson’s disease: the effect of a 13-week feasibility study onsingle and dual task walking. Parkinsons Dis. 2010:483530. doi: 10.4061/2010/483530
de Lau, L. M, and Breteler, M, M. (2006). Epidemiology of Parkinson’s disease.Lancet Neurol. 5, 525–535. doi: 10.1016/S1474-4422(06)70471-9
De Luca, C. J., Gilmore, L. D., Kuznetsov, M., and Roy, S. H. (2010).Filtering the surface EMG signal: Movement artifact and baseline noisecontamination. J. Biomech. 43, 1573–1579. doi: 10.1016/j.jbiomech.2010.01.027
Dimberg, U. (1982). Facial reactions to facial expressions. Psychophysiology 19,643–647. doi: 10.1111/j.1469-8986.1982.tb02516.x
Dimberg, U., and Thunberg, M. (1998). Rapid facial reactions to emotional facialexpressions. Scand. J. Psychol. 39, 39–45. doi: 10.1111/1467-9450.00054
Dimberg, U., Thunberg, M., and Elmehed, K. (2000). Unconscious facial reactionsto emotional facial expressions. Psychol. Sci. 11, 86–89. doi: 10.1111/1467-9280.00221
Ekman, P., and Friesen,W. V. (1978). Facial Action Coding System: A Technique for
theMeasurement of Facial Movement. Paolo Alto, CA: Consulting PsychologistsPress.
Ekman, P., Freisen, W. V., and Ancoli, S. (1980). Facial signs of emotionalexperience. J. Pers. Soc. Psychol. 39, 1125–1134. doi: 10.1037/h0077722
Frontiers in Psychology | www.frontiersin.org 10 June 2016 | Volume 7 | Article 780

Livingstone et al. Facial Mimicry in Parkinson’s Disease
Etkin, A., Egner, T., and Kalisch, R. (2011). Emotional processing in anteriorcingulate and medial prefrontal cortex. Trends Cogn. Sci. 15, 85–93. doi:10.1016/j.tics.2010.11.004
Fahn, S., Elton, R. L., and Members of the UPDRS Development Committee(1987). “Unified Parkinson’s disease rating scale,” in Recent Developments in
Parkinson’s Disease, eds S. Fahn, C. D. Marsden, and M. Goldstein (New York,NJ: Macmillan Health Care Information), 153–163.
Faul, F., Erdfelder, E., Lang, A. G., and Buchner, A. (2007). G∗ Power 3: A flexiblestatistical power analysis program for the social, behavioral, and biomedicalsciences. Behav. Res. Methods 39, 175–191. doi: 10.3758/BF03193146
Field, A. (2009). Discovering Statistics using SPSS. London: Sage publications.Girden, E. R. (1992). ANOVA: Repeated Measures. Newbury Park, CA: Sage.Goetz, C. G., Poewe,W., Rascol, O., Sampaio, C., Stebbins, G. T., Counsell, C., et al.
(2004). Movement disorder society task force report on the Hoehn and Yahrstaging scale: status and recommendations the movement disorder society taskforce on rating scales for Parkinson’s disease.Mov. Disord. 19, 1020–1028. doi:10.1002/mds.20213
Hackney, M. E., Kantorovich, S., Levin, R., and Earhart, G. M. (2007). Effects oftango on functional mobility in Parkinson’s disease: a preliminary study. J.Neurol. Phys. Ther. 31, 173–179. doi: 10.1097/NPT.0b013e31815ce78b
Hamann, S., and Mao, H. (2002). Positive and negative emotional verbalstimuli elicit activity in the left amygdala. Neuroreport 13, 15–19. doi:10.1097/00001756-200201210-00008
Hess, U., and Blairy, S. (2001). Facial mimicry and emotional contagion to dynamicemotional facial expressions and their influence on decoding accuracy. Int. J.Psychophysiol. 40, 129–141. doi: 10.1016/S0167-8760(00)00161-6
Hess, U., and Fischer, A. (2013). Emotional mimicry as social regulation. Pers. Soc.Psychol. Rev. 17, 142–157. doi: 10.1177/1088868312472607
Hietanen, J. K., Surakka, V., and Linnankoski, I. (1998). Facial electromyographicresponses to vocal affect expressions. Psychophysiology 35, 530–536. doi:10.1017/S0048577298970445
Hinton, P. R., McMurray, I., and Brownlow, C. (2014). SPSS Explained. Hove:Routledge.
Jankovic, J. (2008). Parkinson’s disease: clinical features and diagnosis. J. Neurol.Neurosurg. Psychiatry 79, 368–376. doi: 10.1136/jnnp.2007.131045
Katsikitis, M., and Pilowsky, I. (1988). A study of facial expression in Parkinson’sdisease using a novel microcomputer-based method. J. Neurol. Neurosurg.Psychiatry 51, 362–366. doi: 10.1136/jnnp.51.3.362
Katsikitis, M., and Pilowsky, I. (1991). A controlled quantitative study of facialexpression in Parkinson’s disease and depression. J. Nerv. Ment. Dis. 179,683–688. doi: 10.1097/00005053-199111000-00006
Kim, S. H., and Hamann, S. (2007). Neural correlates of positive andnegative emotion regulation. J. Cogn. Neurosci. 19, 776–798. doi:10.1162/jocn.2007.19.5.776
Korb, S., Wood, A., Banks, C. A., Agoulnik, D., Hadlock, T. A., and Niedenthal, P.M. (2016). Asymmetry of facial mimicry and emotion perception in patientswith unilateral facial paralysis. JAMA Facial Plast. Surg. 18, 222–227. doi:10.1001/jamafacial.2015.2347
Krumhuber, E. G., Kappas, A., and Manstead, A. S. R. (2013). Effects ofdynamic aspects of facial expressions: a review. Emot. Rev. 5, 41–46. doi:10.1177/1754073912451349
Lang, P. J., Greenwald, M. K., Bradley, M. M., and Hamm, A. O. (1993). Lookingat pictures: affective, facial, visceral, and behavioral reactions. Psychophysiology30, 261–273. doi: 10.1111/j.1469-8986.1993.tb03352.x
Ledger, S., Galvin, R., Lynch, D., and Stokes, E. K. (2008). A randomised controlledtrial evaluating the effect of an individual auditory cueing device on freezingand gait speed in people with Parkinson’s disease. BMC Neurol. 8:46. doi:10.1186/1471-2377-8-46
Ling, H., Massey, L. A., Lees, A. J., Brown, P., and Day, B. L. (2012).Hypokinesia without decrement distinguishes progressive supranuclear palsyfrom Parkinson’s disease. Brain 135, 1141–1153. doi: 10.1093/brain/aws038
Lundqvist, L. O. (1995). Facial EMG reactions to facial expressions: a case offacial emotional contagion? Scand. J. Psychol. 36, 130–141. doi: 10.1111/j.1467-9450.1995.tb00974.x
Lundqvist, L. O., and Dimberg, U. (1995). Facial expressions are contagious. J.Psychophysiol. 9, 203–211.
Magnée, M. J., Stekelenburg, J. J., Kemner, C., and de Gelder, B. (2007).Similar facial electromyographic responses to faces, voices, and body
expressions. Neuroreport 18, 369–372. doi: 10.1097/WNR.0b013e32801776e6
Marsili, L., Agostino, R., Bologna, M., Belvisi, D., Palma, A., Fabbrini, G., et al.(2014). Bradykinesia of posed smiling and voluntary movement of the lowerface in Parkinson’s disease. Parkinsonism Relat. Disord. 20, 370–375. doi:10.1016/j.parkreldis.2014.01.013
Mauchly, J. W. (1940). Significance test for sphericity of a normal n-variatedistribution. Ann. Math. Stat. 11, 204–209. doi: 10.1214/aoms/1177731915
Moody, E. J., McIntosh, D. N., Mann, L. J., and Weisser, K. R. (2007). More thanmere mimicry? The influence of emotion on rapid facial reactions to faces.Emotion 7:447. doi: 10.1037/1528-3542.7.2.447
Nasreddine, Z. S., Phillips, N. A., Bédirian, V., Charbonneau, S., Whitehead, V.,Collin, I., et al. (2005). The Montreal Cognitive Assessment, MoCA: a briefscreening tool for mild cognitive impairment. J. Am. Geriatr. Soc. 53, 695–699.doi: 10.1111/j.1532-5415.2005.53221.x
NeuroBehavioral Systems (2014). Presentation 16.3 Build 10.07.12. Albany, CA.Niedenthal, P. M. (2007). Embodying emotion. Science 316, 1002–1005. doi:
10.1126/science.1136930Niedenthal, P.M., Brauer,M., Halberstadt, J. B., and Innes-Ker, Å. H. (2001).When
did her smile drop? Facial mimicry and the influences of emotional state onthe detection of change in emotional expression. Cogn. Emot. 15, 853–864. doi:10.1080/02699930143000194
Oberman, L. M., Winkielman, P., and Ramachandran, V. S. (2007). Face toface: blocking facial mimicry can selectively impair recognition of emotionalexpressions. Soc. Neurosci. 2, 167–178. doi: 10.1080/17470910701391943
Oberman, L. M., Winkielman, P., and Ramachandran, V. S. (2009). Slow echo:facial EMG evidence for the delay of spontaneous, but not voluntary, emotionalmimicry in children with autism spectrum disorders.Dev. Sci. 12, 510–520. doi:10.1111/j.1467-7687.2008.00796.x
O’Boyle, D. J., Freeman, J. S., and Cody, F. W. (1996). The accuracy and precisionof timing of self-paced, repetitive movements in subjects with Parkinson’sdisease. Brain 119, 51–70. doi: 10.1093/brain/119.1.51
Olanow, C. W., Stern, M. B., and Sethi, K. (2009). The scientific and clinical basisfor the treatment of Parkinson disease.Neurology 72(21 Suppl. 4), S1–S136. doi:10.1212/WNL.0b013e3181a1d44c
Pahwa, R., Factor, S. A., Lyons, S. A., Ondo, W. G., Gronseth, G., Bronte-Stewart,H., et al. (2006). Practice parameter: treatment of Parkinson disease with motorfluctuations and dyskinesia (an evidence-based review) Report of the QualityStandards Subcommittee of the American Academy of Neurology. Neurology66, 983–995. doi: 10.1212/01.wnl.0000215250.82576.87
Pentland, B., Pitcairn, T. K., Gray, J. M., and Riddle, W. (1987). The effectsof reduced expression in Parkinson’s disease on impression formation byhealth professionals. Clin. Rehabil. 1, 307–312. doi: 10.1177/026921558700100410
Perez-Lloret, S., Nègre-Pagès, L., Ojero-Senard, A., Damier, P., Destée, A.,Tison, F., et al. (2012). Oro-buccal symptoms (dysphagia, dysarthria, andsialorrhea) in patients with Parkinson’s disease: preliminary analysis fromthe French COPARK cohort. Eur. J. Neurol. 19, 28–37. doi: 10.1111/j.1468-1331.2011.03402.x
Péron, J., Dondaine, T., Le Jeune, F., Grandjean, D., and Vérin, M. (2012).Emotional processing in Parkinson’s disease: a systematic review.Mov. Disord.
27, 186–199. doi: 10.1002/mds.24025Peto, V., Jenkinson, C., Fitzpatrick, R., and Greenhall, R. (1995). The development
and validation of a short measure of functioning and well being forindividuals with Parkinson’s disease.Q. Life Res. 4, 241–248. doi: 10.1007/BF02260863
Pitcairn, T. K., Clemie, S., Gray, J. M., and Pentland, B. (1990). Non-verbal cues inthe self-presentation of Parkinsonian patients. Br. J. Clin. Psychol. 29, 177–184.doi: 10.1111/j.2044-8260.1990.tb00867.x
Rao, G., Fisch, L., Srinivasan, S., D’Amico, F., Okada, T., Eaton, C., et al.(2003). Does this patient have Parkinson disease? JAMA 289, 347–353. doi:10.1001/jama.289.3.347
Rinn, W. E. (1984). The neuropsychology of facial expression: a review of theneurological and psychological mechanisms for producing facial expressions.Psychol. Bull. 95, 52. doi: 10.1037/0033-2909.95.1.52
Saku, M., and Ellgring, H. (1992). Emotional reactions to odours in Parkinson’sdisease A clinical application of ethological methods. J. Ethol. 10, 47–52. doi:10.1007/BF02350186
Frontiers in Psychology | www.frontiersin.org 11 June 2016 | Volume 7 | Article 780

Livingstone et al. Facial Mimicry in Parkinson’s Disease
Sato, W., and Yoshikawa, S. (2007). Spontaneous facial mimicry in responseto dynamic facial expressions. Cognition 104, 1–18. doi: 10.1016/j.cognition.2006.05.001
Schrag, A., Barone, P., Brown, R. G., Leentjens, A. F. G., McDonald, W.M., Starkstein, S., et al. (2007). Depression rating scales in Parkinson’sdisease: critique and recommendations. Mov. Disord. 22, 1077–1092. doi:10.1002/mds.21333
Schwartz, G. E., Fair, P. L., Salt, P., Mandel, M. R., and Klerman, G. L. (1976). Facialmuscle patterning to affective imagery in depressed and nondepressed subjects.Science 192, 489–491. doi: 10.1126/science.1257786
Shiba, M., Bower, J. H., Maraganore, D. M., McDonnell, S. K., Peterson, B.J., Ahlskog, E. J., et al. (2000). Anxiety disorders and depressive disorderspreceding Parkinson’s disease: a case-control study. Mov. Disord. 15, 669–677.doi: 10.1002/1531-8257(200007)15:4<669::AID-MDS1011>3.0.CO;2-5
Simons, G., Heiner, E., and Pasqualini, M. S. (2003). Disturbance of spontaneousand posed facial expressions in Parkinson’s disease. Cogn. Emot. 17, 759–778.doi: 10.1080/02699930302280
Smith, M. C., Smith, M. K., and Ellgring, H. (1996). Spontaneous and posed facialexpression in Parkinson’s disease. J. Int. Neuropsychol. Soc. 2, 383–391. doi:10.1017/S1355617700001454
Sonnby-Borgström, M., Jönsson, P., and Svensson, O. (2003). Emotional empathyas related to mimicry reactions at different levels of information processing. J.Nonverbal Behav. 27, 3–23. doi: 10.1023/A:1023608506243
Stel, M., and van Knippenberg, A. (2008). The role of facial mimicryin the recognition of affect. Psychol. Sci. 19, 984. doi: 10.1111/j.1467-9280.2008.02188.x
Tassinary, L. G., Cacioppo, J. T., and Vanman, E. J. (2007). “The skeletomotorsystem: surface electromyography,” in Handbook of Psychophysiology, eds J. T.Cacioppo, L. G. Tassinary, and G. G. Berntson (New York, NY: CambridgeUniversity Press), 267–299. doi: 10.1017/cbo9780511546396.012
Thaut, M. H., McIntosh, G. C., Rice, R. R., Miller, R. A., Rathbun, J., andBrault, J. M. (1996). Rhythmic auditory stimulation in gait training for
Parkinson’s disease patients. Mov. Disord. 11, 193–200. doi: 10.1002/mds.870110213
Tottenham, N., Tanaka, J. W., Leon, A. C., McCarry, T., Nurse, M., Hare,T. A., et al. (2009). The NimStim set of facial expressions: judgmentsfrom untrained research participants. Psychiatry Res. 168, 242–249. doi:10.1016/j.psychres.2008.05.006
Tronick, E., Als, H., Adamson, L., Wise, S., and Brazelton, T. B. (1978). TheInfant’s response to entrapment between contradictory messages in face-to-face interaction. J. Am. Acad. Child Psychiatry 17, 1–13. doi: 10.1016/S0002-7138(09)62273-1
van Boxtel, A. (2001). Optimal signal bandwidth for the recording of surface EMGactivity of facial, jaw, oral, and neck muscles. Psychophysiology 38, 22–34. doi:10.1111/1469-8986.3810022
Wolf, K., Mass, R., Ingenbleek, T., Kiefer, F., Naber, D., and Wiedemann, K.(2005). The facial pattern of disgust, appetence, excited joy and relaxed joy: animproved facial EMG study. Scand. J. Psychol. 46, 403–409. doi: 10.1111/j.1467-9450.2005.00471.x
Wood, A., Rychlowska, M., Korb, S., and Niedenthal, P. (2016). Fashioning theface: sensorimotor simulation contributes to facial expression recognition.Trends Cogn. Sci. 20, 227–240. doi: 10.1016/j.tics.2015.12.010
Conflict of Interest Statement: The authors declare that the research wasconducted in the absence of any commercial or financial relationships that couldbe construed as a potential conflict of interest.
Copyright © 2016 Livingstone, Vezer, McGarry, Lang and Russo. This is an open-
access article distributed under the terms of the Creative Commons Attribution
License (CC BY). The use, distribution or reproduction in other forums is permitted,
provided the original author(s) or licensor are credited and that the original
publication in this journal is cited, in accordance with accepted academic practice.
No use, distribution or reproduction is permitted which does not comply with these
terms.
Frontiers in Psychology | www.frontiersin.org 12 June 2016 | Volume 7 | Article 780


