Embed Size (px)
Citation preview

Materials Science and Engineering C 33 (2013) 1882–1893
Contents lists available at SciVerse ScienceDirect
Materials Science and Engineering C
j ourna l homepage: www.e lsev ie r .com/ locate /msec
Degradation performance of biodegradable Fe\Mn\C(\Pd) alloys
Michael Schinhammer ⁎, Patrick Steiger, Frank Moszner, Jörg F. Löffler, Peter J. UggowitzerLaboratory of Metal Physics and Technology, Department of Materials, ETH Zurich, 8093 Zurich, Switzerland
⁎ Corresponding author. Tel.: +41 44 633 63 62; fax:E-mail address: [email protected] (M. Sch
0928-4931/$ – see front matter © 2012 Elsevier B.V. Allhttp://dx.doi.org/10.1016/j.msec.2012.10.013
a b s t r a c t
a r t i c l e i n f oArticle history:Received 13 July 2012Accepted 26 October 2012Available online 2 November 2012
Keywords:Biodegradable metalsIronImmersion testsElectrochemical impedance spectroscopySimulated body fluidDegradation products
Biodegradable metals offer great potential in circumventing the long-term risks and side effects of medicalimplants. Austenitic Fe\Mn\C\Pd alloys feature a well-balanced combination of high strength and consider-able ductility which make them attractive for use as degradable implant material. The focus of this study is theevaluation of the degradation performance of these alloys by means of immersion testing and electrochemicalimpedance spectroscopy in simulated body fluid. The Fe\Mn\C\Pd alloys are characterized by an increaseddegradation rate compared to pure Fe, as revealed by both techniques. Electrochemical measurements turnedout to be a sensitive tool for investigating the degradation behavior. They not only show that the polarizationresistance is a measure of corrosion tendency, but also provide information on the evolution of the degradationproduct layers. The mass loss data from immersion tests indicate a decreasing degradation rate for longer timesdue to the formation of degradation products on the sample surfaces. The results are discussed in detail in termsof the degradation mechanism of Fe-based alloys in physiological media.
© 2012 Elsevier B.V. All rights reserved.
1. Introduction
The development of biodegradablemetals for temporarymedical im-plants has been the subject of intense research in recent years [1–3]. Thepotential applications of these metals include not only osteosynthesisand coronary stents, but also others, such as degradable wound closingdevices [4]. Degradable implants require only one intervention and elim-inate the need to remove the implant in a second operation. Moreover,they potentially reduce long-term risks and side effects, e.g. chronic in-flammation, in-stent restenosis or the inability to adapt to the growingblood vessel (in the case of stents) [5–7]. The suitability of iron as degrad-able implant material has been shown by in vivo studies, where stentsmade of pure iron were investigated [5,7,8]. No indications of local orsystemic toxicity, no local inflammations, and no early restenosis dueto thrombotic processes were detected. However, the degradation rateof pure iron in vivo was found to be too low, approaching the behaviorof permanent implant materials [5,7]. In addition, the mechanical prop-erties of pure iron are not well suited for use as implant material.
In the following, Hermawan et al. [9,10] presented Fe\Mn alloyswhich feature increased degradation rates and mechanical propertiessimilar to those of stainless steel 316L. To further explore the possibilitiesof biodegradable Fe-based alloys, we developed a design strategy toachieve both higher degradation rates and superior mechanical perfor-mance [11]. It consists of a controlled modification of the chemical com-position and themicrostructure, and relies on two factors: (i) addingMnlowers the standard electrode potential of thematrix; and (ii) the forma-tion of noble Pd-rich precipitates is expected to induce microgalvanic
+41 44 633 14 21.inhammer).
rights reserved.
corrosion, which greatly enhances the degradation rate [11]. Addition-ally, the controlled precipitation reaction can be used to specificallyinfluence the microstructure and mechanical properties, as shown formartensitic Fe\Mn\Pd [12] and austenitic Fe\Mn\C–Pd alloys [13].The latter alloys, which are investigated in the present study, combinethe high strength of Co\Cr\Mo alloys with the ductility of stainlesssteel 316L, and thus offer better performance than these commonlyused materials [13].
Apart from microstructure and mechanical properties, degradationbehavior is of great importance for intended use of pure Fe and biode-gradable Fe-based alloys as degradable implant material. The majorityof the studies on these alloys have been performed in simulated physio-logical fluids, using either simulated body fluid (SBF) [11,14] or Hank'sbalanced salt solution [9,10,15–18] to reproduce in vivo conditions.Different testing setups were also used, which included static immersiontests [10,17–19], dynamic immersion tests in a laminar flow test bench[14–16,19], (static) electrochemical measurements [9,10,17–20], anddetermination of the ion concentrations in solution [15–17,19,20]. Itwas previously shown for Mg-based alloys that the composition of thesolution (ion and protein concentrations) and in particular the type ofbuffering agent strongly influence degradation behavior [21–28]. Conse-quently, it was suggested to use gaseous CO2 to maintain the testingsolutions at constant pH [26]. Active regulation was also recentlysuggested for an even tighter regulation of the pH value [21]. It wasshown that the degradation rates obtained using this approach correlaterather well with results from in vivo studies onwell-vascularized tissues[21]. Based on these results, we used this setup to assess the degradationbehavior of newly developed Fe\Mn\C\Pd alloys, which we investi-gated by means of immersion tests and electrochemical impedancespectroscopy (EIS). We then analyzed the degradation products and

1883M. Schinhammer et al. / Materials Science and Engineering C 33 (2013) 1882–1893
measured the elemental distribution. The implications of our findingsfor the potential use of Fe\Mn\C\Pd alloys as degradable implantmaterials are also discussed in detail in this work.
2. Materials and methods
2.1. Materials
Pure Fe (Armco quality) and two austenitic Fe-based alloys ofnominal composition Fe\21Mn\0.7C (designated as TWIP) andFe\21Mn\0.7C\1Pd (in wt.%, designated as TWIP-1Pd) were investi-gated in this study. Production and characterization in terms of micro-structure and mechanical performance of the TWIP(\1Pd) alloys isgiven in Ref. [13]. The TWIP alloy was used in a recrystallized (rexx)condition (cold-working of 30%, annealing for 30 min at 900 °C),whereas the TWIP-1Pd alloy was used in various heat treatment condi-tions. The recrystallized condition (cold-working of 56%, annealing for10 min at 1150 °C) was used as a reference state. In addition, somesamples were subsequently cold-worked (swaged) to a cold-workingdegree of either 12 % or 23 % and annealed for 30 min at either 700 °Cor 900 °C. Their designation is composed of the degree of cold-workingand the annealing temperature, e.g. TWIP-1Pd CW12-700C. During theannealing, strain-induced heterogeneous precipitation of Pd-rich parti-cles and recovery occurred. The heat treatment states designated asTWIP-1Pd CW12-700C and TWIP-1Pd CW23-700C were chosen inparticular because of their advantageous combination of strength andductility [13]. The heat treatment state designated as TWIP-1Pd CW23-900C was also investigated. Here partial recrystallization was observed;however, the main difference that arises from annealing at the highertemperature is the size of the Pd-rich precipitates formed [13]. Thesesamples were investigated to evaluate the influence of the precipitates'size on the degradation rate.
2.2. Methods
2.2.1. Microstructure characterizationLight optical microscopy on corroded samples was performed using a
stereo microscope (Leica MZ 12.5) and an optical microscope (Reichert-Jung Polyvar met).
Cross-sections of samples immersed for 14 d in SBFwere prepared asfollows: after immersion, the samples were dried at 40 °C in air for 72 h.Theywere then embedded in electrically conductive coldmounting resin(Demotec 70, Demotec). Subsequent preparation consisted of grinding(up to P1200 grit SiC paper) and polishing (up to 1 μm diamond polish)with careful cleaning between each preparation step using cotton wooland ethanol. Final polishing was done using a 0.05 μmAl2O3 suspension(MasterPrep, Buehler). Elemental distribution maps of the degradationproducts were recorded using a Hitachi SU-70 scanning electron micro-scope (SEM, Schottky-type field emission gun, operating at 20 kV accel-eration voltage) equippedwith an X-max energy dispersive X-ray (EDX)detector (Oxford instruments).
Additional microstructure characterization was performed by elec-tron backscattered diffraction (EBSD) in the SEM, which was furtherequipped with a Nordlys EBSD camera (Oxford Instruments). The EBSDscans were recorded using 20 kV acceleration voltage and a probecurrent of approximately 2 nA at 17 mmworking distance. The sampleswere embedded in bakelite and ground as well as polished down to0.25 μm diamond size, and the final polishing step was carried outusing colloidal silica suspension (Buehler MasterMet 2). The indexingrate for the plots shown was generally above 95%.
Transmission electron microscopy (TEM) was performed on a FEITecnai F30 machine operated at 300 kV. The atomic-number-sensitivehigh-angle-annular dark-field (HAADF) imaging mode of the scanningTEM (STEM) was deployed to show the compositional contrast. Theelemental distribution was determined using an energy dispersiveX-ray (EDX) detector in the STEM mode. The TEM specimens were
prepared by mechanically grinding the Fe-based samples to a thicknessof approximately 100 μm. Disks of 3 mm in diameter were punched outfrom these specimens. These disks were then dimpled on one or bothsides using a Gatan dimple grinder with 1 μm diamond suspension(Metadi oil-based). Electron transparency was obtained by twin-jetelectro polishing (Tenu-Pol 5, Struers) using 24 V DC at a temperatureof −30 °C, using a solution of 5 vol.% perchloric acid in methanol aselectrolyte.
Atom probe tomography (APT) measurements were performed on aLeap 4000X HR (Cameca) in the voltage pulse mode (pulse fraction of15%) under ultra-high vacuum (b10−10 mbar) conditions and a sampletemperature of 80 K. Data reconstruction and statistical evaluation wasconducted using the IVAS 3.4.1 software package (Cameca). Squarebars of 0.3×0.3×20 mm3 were cut from the rods by spark erosion andthen etched to sharp needle-like specimens by a standard two-stepelectropolishing procedure [29]. The first solution consisted of 10 vol.%perchloric acid in methanol, followed by polishing in 2 vol.% perchloricacid in butoxyethanol.
2.2.2. Immersion testingFor immersion tests, 3.5 mm-thick disks of 8 mm (TWIP, TWIP-1Pd
rexx), and 7 mm (pure Fe, TWIP-1Pd cold-worked and annealed) indiameter were prepared. The entire surface was ground up to P1200grit SiC paper, cleaned in ethanol in an ultrasonic bath and dried inhot air.
Immersion testing was performed in two different environments: inSBF at 37±1 °C, and in 0.5 M H2SO4 at room temperature. The immer-sion testing under near-physiological conditions in SBF was carried outas described previously [21]: the samples were immersed in SBF fordifferent times of up to one month. The pH value was regulated usinggaseous CO2, which was fed into the testing solution. By this means thepH was kept more or less constant in the interval between 7.35 and7.45 and it was not necessary to add an additional pH-buffer. A sufficientamount of SBF (composition given in Table 1 of Ref. [30]) was deployedto ensure a high solution-volume-to-sample-surface ratio [31], which inthis study was 160 ml cm−2. After immersion the samples were me-chanically cleaned; the remaining degradation productswere chemicallyremoved; and the mass loss per surface area was determined. Conse-quently each measurement point was established independently usingfreshly prepared samples, because a re-immersion of the cleaned sam-ples would have biased the results.
Immersion in H2SO4 was performed in order to investigate thepossible influence of the size of the precipitates on degradation rate.In the acidic environment, hardly any degradation products which areformed on the sample surface are able to limit the diffusion of thereacting species. In addition, hydrogen evolution is the dominant ca-thodic reaction, allowing the degradation rate to be measured via theamount of evolved hydrogen, as previously described in the context ofMg-alloys [32]. The experimental setup outlined in Ref. [33] was used:the sampleswere placed in a beaker containingH2SO4, and ameasuringcylinder (also filled with H2SO4) was placed over the samples to collectthe hydrogen gas which formed during the experiment. The amount ofhydrogen collected in themeasuring cylindermakes it possible to mea-sure the corrosion rate over time.
2.2.3. Electrochemical measurementsEISmeasurements were recordedwith the NOVA 1.8 software pack-
age using an Autolab PGSTAT302 device with an additional frequencyresponse analysis module (FRA2, Eco Chemie B.V.). The measured fre-quencies ranged between 105 and 7·10−2 Hz in the single sine acqui-sition mode with an applied amplitude of 10 mV. The measurementswere recorded at the open circuit potential (OCP), which was initiallyallowed to equilibrate for 1 h. Thereafter, EIS spectra were recorded inregular intervals.
The samples were measured with a rotating disc electrode (RDE)setup (Pine Research Instruments), where the sample was the rotating

1884 M. Schinhammer et al. / Materials Science and Engineering C 33 (2013) 1882–1893
working electrode (rotation rate of 500 min−1). A saturated calomelelectrode (KCl/Hg2Cl2) served as a reference electrode, and a flat, rectan-gular platinum sheet as a counter electrode. Cylindrical samples of 5 mmin diameter and 4 mm in length were inserted into a sample holdermade frompolytetrafluoroethylene (PTFE). The outer edge of the samplewas sealedwith silicone (DowCorning 732) to prevent crevice corrosionbetween the sample and the holder. The effective surface (approximate-ly 0.13 cm2) exposed to the electrolyte was determined for each sampleindividually. The experimental setup is shown schematically in Fig. 1. Aselectrolyte, 250 ml of SBF heated to 37±1 °C was used. Generally, thepH value was controlled as described above, using gaseous CO2. Toinvestigate the possible influence of a pH buffer on the degradation be-havior, additional experiments were conducted in SBF containing100 mmol l−1 Hepes (Carl Roth GmbH). This solution is referred to asSBF(Hepes).
3. Results
3.1. Microstructure characterization
In the reference states (i.e. the recrystallized state) both the TWIP andTWIP-1Pd alloys possess a regular microstructure consisting of equiaxedgrains which contain some annealing twins [13]. The correspondinggrain sizes are approximately 40 μm and 150 μm for TWIP and TWIP-1Pd, respectively. The samples differ in their grain size due to the higher
Fig. 1. Schematic illustration of the testing setup used for electrochemical measurements. Thprogrammable threshold switch that opens a solenoid valve if the pH value exceeds the pthreshold is reached. The sample is rotated to generate the flow of the SBF. A magnetic stir
annealing temperature employed for TWIP-1Pd [13]. For the TWIP-1Pdsamples it is also important to note that no Pd-rich precipitates arepresent in the matrix [13].
The microstructures of the TWIP-1Pd samples in the heat treatmentstates CW23-700C and CW23-900C are presented in Fig. 2. A detailed de-scription of the microstructural features and mechanical performance ofthe same alloy in the different heat treatment states is given in Ref. [13].The microstructures in both CW23-700C (Fig. 2a) and CW23-900C(Fig. 2d) states appear similar from the EBSD maps. The grains containa large number of deformation twins. However, these two heat treat-ment states differ in the size of the Pd-rich precipitates present in thealloys in particular. During annealing at 700 °C, relatively small precipi-tates form of approximately 4 nm in size. The atomic positions of Fe,Mn, C and Pd are shown in the three-dimensional (3D) reconstructionof the APT data (Fig. 2b). Pd-enriched regions are already visible fromthe corresponding atom maps. In order to better visualize the precipi-tates, isoconcentration surfaces of Pd (at 5 at.%) and Mn (at 26 at.%)are plotted in Fig. 2c. They are used to show regions of different compo-sition and reveal that the precipitates are enriched not only in Pd but alsoin Mn. Based on the here-used reconstruction parameters the precipi-tates seem plate-shaped. A proximity histogram (Fig. 2c) based on thePd-isoconcentration surface was calculated to obtain information onthe precipitate composition. Increasing distance values correspond tothe inside of the isoconcentration surfaces and consequently also theprecipitates. Clearly the Mn and Pd concentrations are increased in the
e RDE setup is combined with pH regulation using CO2: The pH value is monitored by aredefined upper threshold value. Gaseous CO2 is then fed into the SBF until the lowerrer is used to control SBF temperature.

Fig. 2. Microstructure characterization of TWIP-1Pd CW23-700C (a–c) and TWIP-1Pd CW23-900C (d–f): (a) EBSD map (IPF out-of-plane color coding) showing an overview of themicrostructure. High-angle grain boundaries are indicated by solid black lines, and solid red lines correspond to 60° b111>−twin boundaries. (b) 3D reconstruction showing atommaps of Fe (blue), Mn (red), C (purple), and Pd (green). (c) Both Pd (5 at.%) and Mn (26 at.%) isoconcentration surfaces and the proximity histogram reveal the enrichment of pre-cipitates with Pd and Mn. (d) EBSD map (IPF out-of-plane color coding) of the microstructure. (e) The HAADF-STEM image ([0 1 1] zone-axis orientation) shows that the precip-itates and the lattice defects are enriched in Pd (heaviest alloy constituent). The area of the EDX mapping is also indicated. (f) Pd Lα1 and Fe K α1 elemental distribution maps, andline profile data over two precipitates (1) and over a dislocation line (2). These show that the precipitates and lattice defects are Pd-enriched.
1885M. Schinhammer et al. / Materials Science and Engineering C 33 (2013) 1882–1893
precipitate, while the Fe concentration is significantly lower. The C con-centration also decreases within the precipitates, although this is difficultto see from the picture.
Annealing at 900 °C generates elongated Pd-rich precipitates ap-proximately 20–50 nm in size, as shown in the STEM image (acquired in[0 1 1] zone-axis orientation) in Fig. 2e. The Pd-rich precipitates appearwith a bright contrast in the atomic-number-sensitive HAADF signal.Lines with bright contrast also indicate the decoration of lattice defectswith Pd. EDX mapping was performed on the area indicated in Fig. 2e,and the Pd Lα1 and Fe Kα1 elemental distribution maps are shown inFig. 2f. The intensities of the EDX signal along the lines indicated in thePdmap are given in the plots in Fig. 2f below. The line profile 1 confirmsthe visual impression from the elemental maps that the precipitates areenriched in Pd (and Mn) and depleted in Fe. The line profile 2 across adislocation indicates an enrichment of Pd in the dislocation core runningperpendicular to the line profile.
3.2. Immersion testing in SBF
Immersion testing revealed distinct differences in the degradationperformance of the alloys. Fig. 3a shows the mass loss of Fe, TWIP, andtwo TWIP-1Pd alloys as a function of immersion time in SBF. The samplescontaining Pd feature the highest mass loss, irrespective of their heattreatment state. The degradation of the TWIP samples proceeds moreslowly and the slowest degradation was found for pure Fe. The corre-sponding mass loss rates are plotted in Fig. 3b. Common to all samplesis that the degradation rate decreases significantly with prolongedimmersion time. From an application point of view, the steady state deg-radation rate (i.e. the degradation rate>14 d) is of particular interest.
The photographs in Fig. 3c–e show an example degradation processinvolving TWIP samples over 14 d. Even after just one day the sample ispartially covered with brownish-white degradation products. It isworth noting that the edges of the samples were often attacked first.

1886 M. Schinhammer et al. / Materials Science and Engineering C 33 (2013) 1882–1893
With prolonged immersion time degradation proceeds and spreadsover the entire sample surface; from the photographs it is evident thatit coincides with the appearance of voluminous degradation products.
3.3. Cross-sections of immersed samples
The images in Fig. 4 show the morphology and composition of cross-sections after immersion in SBF for 14 d. In both samples, TWIP rexx(Fig. 4a) andTWIP-1Pd CW23-700C (Fig. 4b), a layered degradation prod-uct structure is already apparent from the backscattered electron (BSE)contrast (left images). The EDX maps (right-hand images) also indicatecompositional differences between the layers.
In the case of TWIP rexx (Fig. 4a), the degradation products on top ofthemetalmatrix are structured into three layers. Thefirst layer (directlyon top of the metal) appears porous from the BSE contrast. EDXmeasurements show that it is mainly composed of Fe oxide and con-tains only small amounts of Mn. Some regions, however, contain signif-icant amounts of Cl, as indicated in the corresponding EDX map. Thesecond layer appears to be denser and is composed of a mixture of Feand Mn oxides with additional minor amounts of Ca and P (P distribu-tion not shown). The third layer again has a more porous structureand is characterized by a significant amount of Ca and P. Becausethese elements are only present in the SBF, it may be assumed thatthe third layer comprisesmainly precipitates from the SBF, even thoughsome Fe and Mn were still detected.
The structure of the degradation products on the TWIP-1Pd sample(Fig. 4b) is in principal similar to that on TWIP. The different layerscan be distinguished even in the BSE contrast. The first layer is mainlycomposed of Fe oxides and Fe chlorides, plus relatively low amountsof Mn. The Pd distribution is of particular interest, as the corresponding
Fig. 3. Results from immersion testing in SBF. (a) Mass loss as a function of immersion time. Th(a). The TWIP-1Pd samples feature the highest mass loss rates. Characteristic of all samples isTWIP rexx after (c) 1 d; (d) 7 d; and (e) 14 d of immersion.
EDX map shows Pd enrichment. In fact, according to EDX measure-ments the Pd content in this layer (of approximately 2.4 wt.%) is evenhigher than the bulk concentration (approx. 1.3 wt.%). The consecutivelayer of degradation products consists of Fe and Mn oxides with minoramounts of Pd. The third layer features a distinctly different morpholo-gy than the first two layers. Because it contains significant concentra-tions of Ca, P and Na (P and Na distributions not shown) besides Fe,Mn and O, it was concluded that this layer was formed by depositionswhich originate from SBF.
The corrosion attack generally appears to proceed homogeneously.However, for TWIP-1Pd a comparison with the microstructure revealsthe twin boundaries to be preferred degradation sites.
3.4. Electrochemical impedance spectroscopy in SBF
The data in Fig. 5a show a representative series of EIS spectra from anFe sample. The Bode representation depicts the impedance (Z modulus)and negative phase angle (φ) as a function of the applied frequency overa period of 16 h. From the phase angle it is apparent that only one timeconstant (maximum phase angle at approximately 4 Hz) is present inthe frequency range investigated. Hence the curves were fitted usingan equivalent circuit consisting of a resistor (Rs) connected in serieswith a parallel combination of a resistor (Rp) and a constant phaseelement (Qdl), as schematically shown in Fig. 5c. The quality of the fitswas generally good, and for reasons of clarity the fitted curves are notshown in Fig. 5a and b. At high frequencies (≈3·104 Hz) the electro-chemical double layer is not charged and the system resistance is givenby the solution resistance (Rs) only. The increase of the phase angleat 105 Hz is an artifact arising from the electrodes [34]. The low-frequency end of the graph is mainly determined by the polarization
e TWIP-1Pd samples show the highest mass loss. (b) Mass loss rate for the data shown inthe continuous decrease in the mass loss rate for prolonged immersion time. Images of
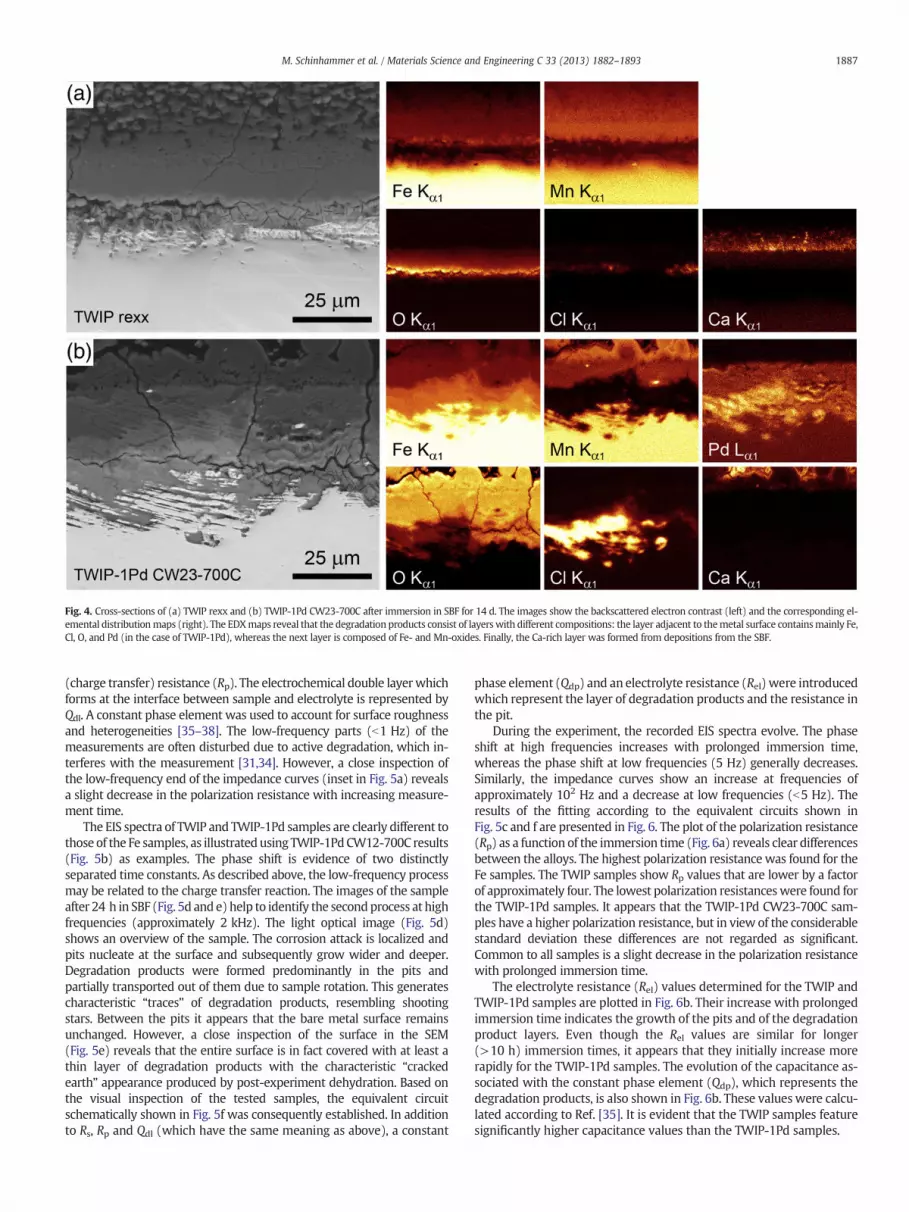
Fig. 4. Cross-sections of (a) TWIP rexx and (b) TWIP-1Pd CW23-700C after immersion in SBF for 14 d. The images show the backscattered electron contrast (left) and the corresponding el-emental distributionmaps (right). The EDXmaps reveal that the degradation products consist of layerswith different compositions: the layer adjacent to themetal surface containsmainly Fe,Cl, O, and Pd (in the case of TWIP-1Pd), whereas the next layer is composed of Fe- and Mn-oxides. Finally, the Ca-rich layer was formed from depositions from the SBF.
1887M. Schinhammer et al. / Materials Science and Engineering C 33 (2013) 1882–1893
(charge transfer) resistance (Rp). The electrochemical double layerwhichforms at the interface between sample and electrolyte is represented byQdl. A constant phase element was used to account for surface roughnessand heterogeneities [35–38]. The low-frequency parts (b1 Hz) of themeasurements are often disturbed due to active degradation, which in-terferes with the measurement [31,34]. However, a close inspection ofthe low-frequency end of the impedance curves (inset in Fig. 5a) revealsa slight decrease in the polarization resistance with increasing measure-ment time.
The EIS spectra of TWIP and TWIP-1Pd samples are clearly different tothose of the Fe samples, as illustratedusing TWIP-1PdCW12-700C results(Fig. 5b) as examples. The phase shift is evidence of two distinctlyseparated time constants. As described above, the low-frequency processmay be related to the charge transfer reaction. The images of the sampleafter 24 h in SBF (Fig. 5d and e) help to identify the secondprocess at highfrequencies (approximately 2 kHz). The light optical image (Fig. 5d)shows an overview of the sample. The corrosion attack is localized andpits nucleate at the surface and subsequently grow wider and deeper.Degradation products were formed predominantly in the pits andpartially transported out of them due to sample rotation. This generatescharacteristic “traces” of degradation products, resembling shootingstars. Between the pits it appears that the bare metal surface remainsunchanged. However, a close inspection of the surface in the SEM(Fig. 5e) reveals that the entire surface is in fact covered with at least athin layer of degradation products with the characteristic “crackedearth” appearance produced by post-experiment dehydration. Based onthe visual inspection of the tested samples, the equivalent circuitschematically shown in Fig. 5f was consequently established. In additionto Rs, Rp and Qdl (which have the same meaning as above), a constant
phase element (Qdp) and an electrolyte resistance (Rel) were introducedwhich represent the layer of degradation products and the resistance inthe pit.
During the experiment, the recorded EIS spectra evolve. The phaseshift at high frequencies increases with prolonged immersion time,whereas the phase shift at low frequencies (5 Hz) generally decreases.Similarly, the impedance curves show an increase at frequencies ofapproximately 102 Hz and a decrease at low frequencies (b5 Hz). Theresults of the fitting according to the equivalent circuits shown inFig. 5c and f are presented in Fig. 6. The plot of the polarization resistance(Rp) as a function of the immersion time (Fig. 6a) reveals clear differencesbetween the alloys. The highest polarization resistance was found for theFe samples. The TWIP samples show Rp values that are lower by a factorof approximately four. The lowest polarization resistanceswere found forthe TWIP-1Pd samples. It appears that the TWIP-1Pd CW23-700C sam-ples have a higher polarization resistance, but in view of the considerablestandard deviation these differences are not regarded as significant.Common to all samples is a slight decrease in the polarization resistancewith prolonged immersion time.
The electrolyte resistance (Rel) values determined for the TWIP andTWIP-1Pd samples are plotted in Fig. 6b. Their increase with prolongedimmersion time indicates the growth of the pits and of the degradationproduct layers. Even though the Rel values are similar for longer(>10 h) immersion times, it appears that they initially increase morerapidly for the TWIP-1Pd samples. The evolution of the capacitance as-sociated with the constant phase element (Qdp), which represents thedegradation products, is also shown in Fig. 6b. These values were calcu-lated according to Ref. [35]. It is evident that the TWIP samples featuresignificantly higher capacitance values than the TWIP-1Pd samples.

Fig. 5. EIS spectra of (a) Fe and (b) TWIP-1Pd CW12-700C. The Bode representations show the impedance and the phase angle as a function of the frequency for different measure-ment times up to 20 h. The inset in (a) shows the low-frequency ends of the Fe spectra. (c) The EIS spectra of Fe contain only one time constant, which was taken into account in theequivalent circuit. (d) Light optical microscopy image of TWIP-1Pd CW12-700C after 24 h in SBF. The surface features localized attacks and degradation products. (e) The SEMimage of the surface reveals that the entire sample is covered with a layer of degradation products. (f) Corresponding equivalent circuit for interpreting the results of theTWIP(\1Pd) samples.
1888 M. Schinhammer et al. / Materials Science and Engineering C 33 (2013) 1882–1893
The EIS spectra recorded for TWIP-1Pd CW12-700C in SBF(Hepes)(Fig. 7) show distinct differences compared to the CO2-buffered SBF.During the initial 5 h only one time constant is present in the spectra(c.f. the phase angle curves), as previously noted for the Fe samples.The phase angle, however, decreases with prolonged immersion time.In the particular case presented in Fig. 7, from 7 h onwards a secondtime constant is present in the spectra. They are then similar to thosefound previously for the TWIP-1Pd samples (c.f. Fig. 5b) in SBF (withCO2 buffering).
Fig. 6. Evolution of (a) the polarization resistance, and (b) the electrolyte resistance and thsamples feature the highest polarization resistance, which is lower for TWIP and lowest forsamples with increasing immersion times, representing the evolution of the localized corrvalues indicates the growth of the degradation product layer on the samples.
3.5. Immersion testing in H2SO4
The results from immersion testing inH2SO4 (Fig. 8)first and foremostreveal the large amount of hydrogen evolution in the TWIP-1Pd samples.In comparison, the hydrogen evolutions of TWIP and Fe are considerablyless. This is also apparent from the inset in Fig. 8, which shows the hydro-gen evolution rate (from a linear fit of the hydrogen evolution) for thedifferent samples. It is particularly interesting to compare the hydrogenevolution rates of the TWIP-1Pd samples at different heat treatment
e capacitance of the degradation products as a function of the immersion time. The Fethe TWIP-1Pd samples. The electrolyte resistance values increase for all TWIP(\1Pd)osion attacks. Correspondingly, the decrease in the degradation products capacitance

Fig. 7. Bode representation (impedance and phase angle as a function of frequency) forTWIP-1Pd CW12-700C in Hepes-buffered SBF. Initially, the spectra contain only onetime constant. After 7 h of immersion, a second time constant is visible in the spectra,evidence of the pH buffer's influence on the degradation mechanism.
Fig. 8. Hydrogen evolution data from immersion tests in H2SO4. The high degradationrate of the TWIP-1Pd samples is striking. However, there is no clear correlation be-tween microstructure (i.e. precipitate size) and degradation rate (see inset).
1889M. Schinhammer et al. / Materials Science and Engineering C 33 (2013) 1882–1893
states. Even though there are differences between the individual heattreatment states, a clear trend is hard to identify. It seems that a higherheat treatment temperature causes an increase in the hydrogen evolutionrate. However, no clear trend is visible if we compare the samples in therexx state with those in cold-worked and annealed states. The initialpH-value was determined to be 1.4 and remained constant for the Feand TWIP samples. For the TWIP-1Pd samples the pH-value increasedto 1.5 during the immersion period.
4. Discussion
In the following, we discuss the results of the immersion testing andEIS experiments, and suggest a degradation mechanism in SBF that alsotakes into account oxygen reduction as cathodic process. The influenceof the precipitates' size and distribution is discussed separately, consid-ering the results of the immersion tests in H2SO4.
4.1. Degradation behavior in SBF
4.1.1. Immersion testing in SBFBoth the EIS results and the immersion tests indicate that the
degradation rate can be adjusted according to the principles of thepreviously described design strategy [11]. The mass loss data fromthe immersion tests directly reveal the amount of material that de-graded during the tests. Strictly speaking, the mass loss per areadisplayed in Fig. 3 requires a uniform corrosion process [31], whichis not a given for all samples. Nevertheless, it is still a useful indicatorfor establishing a ranking of the different alloys. As previously reported[21], the degradation rate of pure iron (≈0.22 mg cm−2 d−1, corre-sponding to ≈0.10 mm year−1, determined in the interval from 14 dto 28 d) using the present setup is slightly lower than most literaturevalues (ranging from 0.14 mm year−1 [15] to 0.23 mm year−1 [14],measured in Hank's solution and SBF, respectively). This discrepancyhas been attributed to the accelerating effect of pH buffers (such asTris or Hepes) on degradation. For Mg alloys it has been shown thatby using CO2 to control the pH value of the testing solution the resultsof in vitro experiments correspond much more to the outcomes of invivo studies [21].
Alloying with Mn and C (TWIP samples) generates a slightlyhigher degradation rate of≈0.13 mm year−1. The accelerating influenceofMnondegradation rate has also beenobservedbyHermawanet al. [16]for Fe\25Mn (0.52 mm year−1) and Fe\35Mn (0.44 mm year−1) al-loys, and by Liu et al. [17] for Fe\30Mn\6Si (0.30 mm year−1). Even
though the Mn concentrations are roughly in the same range as for theTWIP alloy, the differences are more pronounced in the solutions withpH buffers compared to this study. For Fe\25Mn, the increase in the deg-radation rate compared to Fe is by a factor of almost 4, whereas in thepresent study a factor of 1.3 was determined (Fe vs. TWIP). This meansthat using testing solutions that contain pH buffers may cause theoverestimation of in vivo degradation rates. However, this cannot beproven at themoment as there is no in vivo data available for comparison.
The highest degradation rates of ≈0.21 mm year−1 and≈0.20 mm year−1 were measured for the TWIP-1Pd CW12-700and CW23-700 samples, respectively. The increase in the degrada-tion rate compared to the TWIP samples is by a factor of 1.6, whichindicates that the addition of only 1 wt.% of Pd is highly effective inincreasing the degradation rate.
4.1.2. EIS in SBFThe same degradation rates ranking emerged in the EIS results.
Polarization resistance decreases with increased alloying content(Rp,Fe>Rp,TWIP>Rp,TWIP-1Pd). Because the corrosion current (and there-fore also the degradation rate) is inversely proportional to the polariza-tion resistance (Stern–Geary relation [38,39]), the TWIP-1Pd alloysfeature the highest degradation rates. In terms of absolute values, thedifferences in the Rp values are higher than in the immersion testingresults. Impedance spectroscopy is hence a sensitive tool for assessingthe degradation properties of degradable implant materials. However,EIS use is not free from pitfalls [31,40]. Equivalent circuits are necessaryto interpret the spectra and to relate the frequency response to electro-chemical reactions and processes on the sample and interface. Multipleequivalent circuits often represent an impedance spectrum equallywell,then generating different possible values for the individual elements[31]. Information on the degradation mechanism therefore has to beconsidered when establishing the equivalent circuit used. Diffusionimpedance is normally used to reflect the cathodic reactionwhen inves-tigating Fe corrosion in aerated solutions [34,38,40,41]. However, in thepresent case it was impossible to accurately fit the impedance spectravia diffusion impedances. This was in part because the time constantsof the two processes were close, obscuring the characteristic frequencyrange in which diffusion behavior is observed, and in part because thehigh degradation rates interfered with measurements.
The impedance spectra of the Fe samples contain only one time con-stant and are hence relatively simple. This is not so for the TWIP andTWIP-1Pd samples. Their spectra contain two time constants whichhave to be appropriately reflected in the corresponding equivalent

1890 M. Schinhammer et al. / Materials Science and Engineering C 33 (2013) 1882–1893
circuit. As pointed out above, the occurrence of localized corrosion isresponsible for the second time constant at high frequencies (approxi-mately 2 kHz) [42]. A similar equivalent circuit was used to model thecorrosion mechanism of steel moulds in the pH range between 8 and11 in contact with a chloride-containing solution [43]. The exact sameequivalent circuit as employed in the present study is usually taken torepresent the impedance of an electrode coated with an inert porouslayer [44]. It was previously reported that (whenmeasuring at the corro-sion potential) pits caused by localized corrosion are indistinguishablefrompores in an inert porous layer [43,45,46].While the actual geometryof the pores influences the constant phase element Cdl [47], Rel can beconsidered as a measure of the length (depth) of the pores/pits [40].The increasing Rel values shown in Fig. 6b hence indicate the growth ofthe pits with prolonged immersion time. The rapid initial increase ofRel for the TWIP-1Pd samples indicates a higher initial growth rate forthe localized attacks than for the TWIP samples. The dielectric capaci-tance associated with the degradation products (Cdp) can be expressedas:
Cdp ¼ ε ⋅ε0δ
ð1Þ
where δ represents the film (degradation product) thickness, ε the di-electric constant of the material, and ε0 the permittivity of the vacuum[44]. Assuming that ε is equal for all samples and constant over the im-mersion time, δ is inversely proportional to Cdp. The data shown inFig. 6b indicate first of all thicker degradation products on theTWIP-1Pd samples compared to TWIP (higher Cdp values of the TWIPsamples), right from the beginning of the measurements. The Cdp valuesgenerally decrease with increasing immersion time, indicating thegrowth of the layer of degradation products.
4.2. Degradation mechanism in SBF
In the following, the degradation mechanism of iron in aerated(O2-containing) neutral solutions is established. It is then taken intoaccount to discuss the findings that the TWIP-1Pd samples have thehighest degradation rate and Fe the lowest.
4.2.1. Degradation mechanism of Fe-based alloysThe anodic partial reaction (metal dissolution) of Fe and Mn are
given in Eqs. (2) and (3):
Fe→Fe2þ þ 2e− ð2Þ
Mn→Mn2þ þ 2e− ð3Þ
These reactions proceed rapidly in most media, and when ironcorrodes, the rate is usually controlled by the cathodic reaction [48],which is oxygen reduction, Eq. (4):
H2Oþ 12O2 þ 2e−→2HO− ð4Þ
Because Fe is the alloys' main constituent, the following gives equa-tions for Fe only. The anodic and cathodic partial reactions need notnecessarily take place at the same spot on the surface. Fig. 9 showsschematically the process of the degradation (Fig. 9a) and formation ofdegradation products (Fig. 9b). The released metal ions react with thehydroxyl-ions to form hydrous ferrous oxide (FeO ∙nH2O) or ferroushydroxide (Fe(OH)2). Eq. (5) [16,48] provides an example:
Fe2þ þ 2HO−→FeðOHÞ2 ð5ÞBecause the corrosion reaction proceeds at the metal interface, the
layer next to it always consists of FeO ∙nH2O or Fe(OH)2. At the outer
surface of the hydroxide layer, dissolved oxygen causes the ferrous(Fe2+) oxides to be further converted to hydrous ferric (Fe3+) oxideor ferric hydroxide [48], according to Eq. (6):
Fe OHð Þ2 þ12H2Oþ 1
4O2→Fe OHð Þ3 ð6Þ
Hydrous ferric oxide is normally orange or brownish (Fe2O3) and isthe most visible corrosion product [48]. Degradation products usuallyhave a layered structure, consisting of hydrous Fe2O3∙ nH2O on thetop, a black intermediate layer of Fe3O4∙ nH2O, and FeO ∙ nH2O at the bot-tom, i.e. at the metal interface [16,48].
The photographs in Fig. 3c–e support the above degradation mecha-nism. The degradation products appear as red–brownwith an underlyingblack layer which was observed during degradation product removal.Orange–white degradation products are also present on the samples.They correspond to the Ca-rich layers visible in the EDX maps of thecross-sections (c.f. Fig. 4). Upon oxidation Fe2+ and Mn2+ are also ableto react with CO3
2− from SBF to form FeCO3 or MnCO3, which havevery low solubility constants of log Ksp=−11.0 (FeCO3) [49] and logKsp=− 11.4 (MnCO3) [50], respectively. However, their precipitationkinetics is reported to be rather slow [50]. On the other hand, the gener-ation of HO− ions from the cathodic reaction (Eq. (4)) generates a localpH value increase in the vicinity of the sample surface. Thismay addition-ally promote the precipitation of carbonates (e.g. MgCO3, particularlyinfluenced by a high HCO3
− concentration) and phosphates from theSBF [51,52]. The above compounds eventually generate a decrease inthe degradation rate due to mass transport limitations through theprecipitates [23,33,48,53,54]. This study confirms this via the decreasingmass loss rate determined in the immersion tests. Fig. 9 also illustratesthe precipitation of compounds from the SBF and the layered structureof degradation products that eventually develops (Fig. 9c).
TheMn distributionwithin the degradation products is different thanthat of Fe (cf. especially Fig. 4b). While the highest Fe concentration wasfound in the layer directly adjacent to the metal surface, Mn concentra-tion was higher in the second and third layers of the degradation prod-ucts. This may indicate that the Mn ions initially diffuse away from themetal interface and react with the dissolved oxygen at some distancefrom it to form degradation products.
A high concentration of Cl− ions was found in the vicinity of themetal surface, indicating that they play an active role in the degrada-tion mechanism. Because the degradation products are porous and donot cover the surface homogenously, Cl− ions appear to diffuse to themetal surface to compensate the increased cation (Fe2+, Mn2+) con-centration (c.f. also Fig. 9b). Due to the spatial separation of the anod-ic and cathodic partial reactions, some metal ions are able to reactwith Cl− to form FeCl2, according to Eq. (7) [16,55]:
Fe2þ þ 2Cl−→FeCl2 ð7ÞThe metal (Fe, Mn) chloride formed is subsequently hydrolyzed by
water, generating free acid (Eq. (8)) [16] and causing localized corro-sion attacks:
FeCl2 þ H2O→FeðOHÞ2 þ HCl ð8Þ
4.2.2. On the important role of oxygen the degradation mechanismAsmentioned above (Eq. (4)), the cathodic partial reaction is oxygen
reduction, which is diffusion-controlled, i.e. the oxidation reaction pro-ceeds as rapidly as oxygen reaches themetal surface [48]. In the absenceof a diffusion-barrier film on the surface (i.e. degradation products), thetheoretical current density is can be calculated according to Eq. (9) [48]:
is ¼D⋅n⋅F
d
� �⋅ cO2
ð9Þ

1891M. Schinhammer et al. / Materials Science and Engineering C 33 (2013) 1882–1893
where D is the diffusion coefficient for dissolved oxygen in water, n=4 eq mole−1 is the number of electrons transferred, F=96,500 C eq−1
is the Faraday constant, d is the thickness of the stagnant layer, and co2is the oxygen concentration in the solution.
For the RDE, the corresponding diffusion current density depends onthe square root of the rotation rate, as indicated in Eq. (10) [46,56]:
ir ¼ 0:620⋅n⋅F⋅D2=3 ⋅v−
1=6 ⋅co2 ⋅ω1=3 ð10Þ
where ν is the kinematic viscosity and ω is the rotation rate.
Fig. 9. Schematic illustration of the degradation process and the formation of degradationproducts for TWIP-1Pd alloys. (a) Initiation of the corrosion reaction: the anodic partial re-actions are themetal oxidation,whereas the cathodic partial reaction is oxygen reduction.(b) Formation of hydroxides/oxides, and precipitation of carbonates and phosphates thatcomprise the degradation products. Cl− ions diffuse to the surface, causing localized at-tacks. (c) Further build-up of degradation products. The Pd remains in the layer close tothe sample surface and acts as a macrogalvanic element to increase degradation.
Consequently, it may be expected that under limitedmass-transportconditions (i.e. oxygen reduction) the particular composition of an Fealloy will have little or no influence on the degradation rate [48]. It istherefore at first glance surprising to note the increases in the degrada-tion rates for TWIP and TWIP-1Pd. However, the above equations(Eqs. (9) and (10)) are only valid for the beginning of the experiments,where the entire metal surface is directly accessible. Thereafter, the for-mation of degradation products on the samples hinders the oxygen dif-fusion [46,48], which generates a decrease in the degradation rate. It isreasonable to assume that the composition and structure of these layersvary for the different alloys. Hence the surfaces are not equally accessi-ble to incoming oxygen.
The EIS results indicate that the polarization resistances, which infact measure corrosion resistance, decrease from Fe (the highestvalue) to TWIP-1Pd (the lowest). In addition, they slightly decreaseover time, which actually indicates an increasing tendency to corrode.It has been pointed out that the cathodic process (i.e. oxygen reduction)is not entirely mass-controlled but also involves a finite electron trans-fer [46,56]. In view of their lower polarization resistance values, thismay additionally contribute to the higher degradation rates of TWIPand TWIP-1Pd.
Finally, Pd possesses a high affinity for H2 and is frequently employedas a catalyst [57,58]. Pd also accelerates the oxygen reduction reac-tion [58]; it may be speculated that in the TWIP-1Pd alloys both an addi-tional hydrogen evolution and an increased oxygen reduction rate,catalyzed by the Pd-rich precipitates, contribute to these alloys’ enhanceddegradation.
4.3. Influence of the precipitates on degradation behavior
Pd was deliberately added to the alloys in order to increase theirdegradation rate. In addition, the original intention was not only to en-hance but also to modify the degradation rate by dictating the size anddistribution of the Pd-rich precipitates [11]. It was previously reportedthat precipitates above a critical size cause an increase in the passivecurrent density in Cu-bearing low C steel [59] and an increased tenden-cy for pitting in Al\Cu alloys [60].
Because the differences in the degradation rates are minimal in SBF,immersion tests with the intention to amplify them were performed inH2SO4 (Fig. 8). If the alloys in the different heat treatment states possessdifferent corrosion rates, the relative differences should become morepronounced with increasing overall corrosion rates. Even though theTWIP-1Pd alloys corrode at high rates, it turned out that the size ofthe precipitates has no apparent influence on the corrosion rates (as in-dicated in the inset in Fig. 8). This in turn means that the mechanicalproperties (which are determined mainly by the microstructure andthe size and distribution of the precipitates [13]) can be optimizedwith-out altering the degradation properties.
In view of the Pd distribution in the cross-section of the TWIP-1Pdsample (see Fig. 4b), it is interesting to find a high Pd concentration inthe layer adjacent to themetal surface. Although the color intensity is rel-ative, it appears that the Pd concentration in this layer is even higher thanin the bulk of the material. Significant Pd concentration was also mea-sured in the rest of the degradation products. We therefore concludethat the Pd does not go into solution, but remains incorporated in thedegradation products. Since the size of the precipitates is ofminor impor-tance we explain the accelerating effect of Pd as follows: the Pd which isdeposited on the metal surface acts as a macroscopic, short-circuitedgalvanic element. Because the Pd-containing layer is in the order of mi-crometers, small changes in the precipitate's size (in the nm range) areexpected to be insignificant.
4.4. Influence of degradation products
From the immersion tests (c.f. Fig. 3c–e, Fig. 4) and RDE experimentsit is obvious that degradation product formation actually generates a

1892 M. Schinhammer et al. / Materials Science and Engineering C 33 (2013) 1882–1893
volume increase. A glaring example of the forces arising from suchvolume increase is the corrosion-induced failure of steel reinforcementsin concrete structures [48,61]. Although previously noted, the effect ofincreasing degradation product volumes seems to have been dismissedas unimportant. However, it must be taken into account in assessingthese materials for use in degradable medical implants. Undesiredincreases in degradation product volume may limit the materials' appli-cations, especially in view of the fact that macrophage clearing of degra-dation products is apparently a slow process [5].
4.5. Influence of the testing conditions on degradation behavior
After implantation in a blood vessel, a stent is firstly exposed to bloodflow. The in vitro degradation experiment has to mimic this [62]. In boththe immersion testing and EIS the solution was agitated for this purposein the present study. In the EIS measurements the RDE technique alsoestablishes constant hydrodynamic conditions. It is worth noting thatthe increased flow in the RDE setup apparently favors the occurrence oflocalized attacks. The (TWIP and TWIP-1Pd) samples show pronouncedlocalized corrosion after 24 h in SBF, but this was not observed to thesame extent during the immersion tests (c.f. Figs. 3c–d and 4), evenafter the removal of the degradation products. In the RDE setup thedegradation products formed during the experiment were partiallytransported away from the surface, meaning that they can protect itless. The increased oxygen transport in the RDE setup may also haveaccentuated the differences in the alloys’ degradation properties (hereexpressed by Rp).
It was previously emphasized that using gaseous CO2 to control thepH value of SBF reflects the in vivo situation more accurately than usinga pH buffer [21,24,26]. The EIS results in Fig. 7 indicate that at first degra-dation proceeds homogeneously, i.e. only one time constant is present inthe spectra as previously reported for Fe. The appearance of a second timeconstant after 7 h indicates a change in the degradation mechanism, andlocalized attacks begin. Hence, it is of great importance to realize thatdeploying a pH buffer directly affects the degradation mechanism inFe-based alloys.
5. Conclusions
In this article the in vitro degradation properties of austenitic TWIPalloys were investigated to evaluate their potential as degradable im-plant material. To study the plausibility of deployment in temporarycardiovascular stents, their degradation performance was investigatedvia immersion tests and electrochemical impedance spectroscopyunder flow conditions to approximate the in vivo situation. The newlydeveloped TWIP-1Pd alloys reveal a higher degradation rate than pureFe. This finding can be drawn from both mass loss and electrochemicalmeasurements. EIS proves to be a sensitive tool for investigating thedegradation properties of biodegradable Fe-based alloys. Selecting theappropriate equivalent circuit alsomakes it possible to identify the con-tributions and evolution of the various active corrosion processes.
The degradationmechanism in SBFwas discussed and the decreasingdegradation rate (determined from immersion tests) explained by theformation of a layer of degradation products. These consist of hydroxidesand carbonates that limit the diffusion of species (oxygen and ions) to thesample surface. Despite the fact that oxygen reduction (amass-transport-controlled process) is the cathodic reaction, significant differences inthe degradation rates can be observed. However, other factors – suchas the composition of the degradation products and, possibly electrontransfer – also influence degradation behavior and partly explainthese findings. It is further seen that the experimental conditions havea substantial influence on the outcome of the experiments. Higher SBFflow, as induced by the RDE experiments, generates an increased ten-dency for localized attacks, and using a pH buffer clearly affects the deg-radationmechanism. It is thus of great value to obtain reliable data on invivo degradation of Fe-based materials to establish an experimental
setup capable of predicting their in vivo behavior. As previouslyperformed for Mg-based alloys [63], tests in this context are currentlybeing carried out in a rat model.
Acknowledgements
The authors greatly appreciate financial support receivedwithin theframework of the project “Biocompatible Materials and Applications”initiated by the Austrian Institute of Technology GmbH (AIT), and sup-port from the Staub/Kaiser Foundation, Switzerland. The support of theETH Zurich ElectronMicroscopy Center is also gratefully acknowledged.
References
[1] H. Hermawan, D. Dubé, D. Mantovani, Acta Biomater. 6 (2010) 1693–1697.[2] M. Moravej, D. Mantovani, Int. J. Mol. Sci. 12 (2011) 4250–4270.[3] R. Zeng, W. Dietzel, F. Witte, N. Hort, C. Blawert, Adv. Eng. Mater. 10 (2008) B3–B14.[4] A.C. Hänzi, A. Metlar, M. Schinhammer, H. Aguib, T.C. Lüth, J.F. Löffler, P.J.
Uggowitzer, Mater. Sci. Eng., C 31 (2011) 1098–1103.[5] M. Peuster, C. Hesse, T. Schloo, C. Fink, P. Beerbaum, C. von Schnakenburg, Bioma-
terials 27 (2006) 4955–4962.[6] B. Heublein, R. Rohde, V. Kaese, M. Niemeyer, W. Hartung, A. Haverich, Heart 89
(2003) 651–656.[7] M. Peuster, P. Wohlsein, M. Brugmann, M. Ehlerding, K. Seidler, C. Fink, H. Brauer,
A. Fischer, G. Hausdorf, Heart 86 (2001) 563–569.[8] R. Waksman, R. Pakala, R. Baffour, R. Seabron, D. Hellinga, F.O. Tio, J. Interv.
Cardiol. 21 (2008) 15–20.[9] H. Hermawan, H. Alamdari, D.Mantovani, D. Dube, PowderMetall. 51 (2008) 38–45.
[10] H. Hermawan, D. Dube, D.Mantovani, J. Biomed,Mater. Res. Part A 93A (2010) 1–11.[11] M. Schinhammer, A.C. Hänzi, J.F. Löffler, P.J. Uggowitzer, Acta Biomater. 6 (2010)
1705–1713.[12] F. Moszner, A.S. Sologubenko, M. Schinhammer, C. Lerchbacher, A.C. Hänzi, H.
Leitner, P.J. Uggowitzer, J.F. Löffler, Acta Mater. 59 (2011) 981–991.[13] M. Schinhammer, C.M. Pecnik, F. Rechberger, A.C. Hänzi, J.F. Löffler, P.J.
Uggowitzer, Acta Mater. 60 (2012) 2746–2756.[14] S. Zhu, N. Huang, L. Xu, Y. Zhang, H. Liu, H. Sun, Y. Leng, Mater. Sci. Eng., C 29
(2009) 1589–1592.[15] M. Moravej, A. Purnama, M. Fiset, J. Couet, D. Mantovani, Acta Biomater. 6 (2010)
1843–1851.[16] H. Hermawan, A. Purnama, D. Dube, J. Couet, D. Mantovani, Acta Biomater. 6 (2010)
1852–1860.[17] B. Liu, Y.F. Zheng, L. Ruan, Mater. Lett. 65 (2011) 540–543.[18] E.L. Zhang, H.Y. Chen, F. Shen, J. Mater. Sci. Mater. Med. 21 (2010) 2151–2163.[19] B. Liu, Y.F. Zheng, Acta Biomater. 7 (2011) 1407–1420.[20] F.L. Nie, Y.F. Zheng, S.C. Wei, C. Hu, G. Yang, Biomed. Mater. 5 (2010).[21] M. Schinhammer, J. Hofstetter, C. Wegmann, F. Moszner, J.F. Löffler, P.J.
Uggowitzer, Adv. Eng. Mater. (submitted for publication).[22] R. Willumeit, J. Fischer, F. Feyerabend, N. Hort, U. Bismayer, S. Heidrich, B.
Mihailova, Acta Biomater. 7 (2011) 2704–2715.[23] Y. Xin, T. Hu, P.K. Chu, Acta Biomater. 7 (2011) 1452–1459.[24] N. Kirkland, J. Waterman, N. Birbilis, G. Dias, T. Woodfield, R. Hartshorn, M.
Staiger, J. Mater. Sci. Mater. Med. 23 (2012) 283–291.[25] N.T. Kirkland, N. Birbilis, J. Walker, T. Woodfield, G.J. Dies, M.P. Steiger, J. Biomed.
Mater. Res. B 95B (2010) 91–100.[26] N.I. Zainal Abidin, A.D. Atrens, D. Martin, A. Atrens, Corros. Sci. 53 (2011)
3542–3556.[27] Y. Xin, P.K. Chu, Mater. Chem. Phys. 124 (2010) 33–35.[28] Y. Xin, T. Hu, P.K. Chu, Corros. Sci. 53 (2011) 1522–1528.[29] M.K. Miller, Atom Probe Tomography: Analysis at the Atomic Level, Kluwer
Academic/Plenum Publishers, New York, 2000.[30] L. Müller, F.A. Müller, Acta Biomater. 2 (2006) 181–189.[31] N.T. Kirkland, N. Birbilis, M.P. Staiger, Acta Biomater. 8 (2012) 925–936.[32] G.L. Song, A. Atrens, D. StJohn, in: J.N. Hryn (Ed.), Magnesium Technology 2001,
The Minerals Metals & Materials Society, New Orleans, LA, 2001, pp. 255–262.[33] A.C. Hänzi, P. Gunde, M. Schinhammer, P.J. Uggowitzer, Acta Biomater. 5 (2009)
162–171.[34] I. Frateur, C. Deslouis, M.E. Orazem, B. Tribollet, Electrochim. Acta 44 (1999)
4345–4356.[35] C.H. Hsu, F. Mansfeld, Corrosion 57 (2001) 747–748.[36] V. de Freitas Cunha Lins, G.F. de Andrade Reis, C.R. de Araujo, T. Matencio, Appl.
Surf. Sci. 253 (2006) 2875–2884.[37] E. De Robertis, R.S. Neves, L.M. Abrantes, A.J. Motheo, J. Electroanal. Chem. 581
(2005) 86–92.[38] K. Jüttner, Electrochim. Acta 35 (1990) 1501–1508.[39] J.R. Scully, Corrosion 56 (2000) 199–218.[40] K. Jüttner, W.J. Lorenz, M.W. Kendig, F. Mansfeld, J. Electrochem. Soc. 135 (1988)
332–339.[41] A. Bonnel, F. Dabosi, C. Deslouis, M. Duprat, M. Keddam, B. Tribollet, J. Electrochem.
Soc. 130 (1983) 753–761.[42] N.C. Quach, P.J. Uggowitzer, P. Schmutz, C.R. Chim. 11 (2008) 1043–1054.[43] A. Carnot, I. Frateur, S. Zanna, B. Tribollet, I. Dubois-Brugger, P. Marcus, Corros. Sci.
45 (2003) 2513–2524.

1893M. Schinhammer et al. / Materials Science and Engineering C 33 (2013) 1882–1893
[44] M.E. Orazem, B. Tribollet, Electrochemical Impedance Spectroscopy, John Wiley &Sons, Hoboken, New Jersey, 2008.
[45] V. Jovancicevic, J.O.M. Bockris, J. Electrochem. Soc. 133 (1986) 1797–1807.[46] D. You, N. Pébère, F. Dabosi, Corros. Sci. 34 (1993) 5–15.[47] C. Hitz, A. Lasia, J. Electroanal. Chem. 500 (2001) 213–222.[48] W.R. Revie, H.H. Uhlig, Corrosion and Corrosion Control, fourth ed. John Wiley &
Sons, Hoboken, New Jersey, 2008.[49] P. Bénézeth, J.L. Dandurand, J.C. Harrichoury, Chem. Geol. 265 (2009) 3–12.[50] D.L. Jensen, J.K. Boddum, J.C. Tjell, T.H. Christensen, Appl. Geochem. 17 (2002) 503–511.[51] A. Yamamoto, S. Hiromoto, Mater. Sci. Eng., C 29 (2009) 1559–1568.[52] R.M. Cornell, U. Schertmann, The Iron Oxides, second ed. Wiley-VCH Verlag
GmbH & Co., Weinheim, 2003.[53] R. Lindström, L.-G. Johansson, G.E. Thompson, P. Skeldon, J.-E. Svensson, Corros.
Sci. 46 (2004) 1141–1158.[54] A.C. Hänzi, I. Gerber, M. Schinhammer, J.F. Löffler, P.J. Uggowitzer, Acta Biomater.
6 (2010) 1824–1833.[55] K. Yaya, Y. Khelfaoui, B. Malki, M. Kerkar, Corros. Sci. 53 (2011) 3309–3314.
[56] C. Deslouis, O. Gil, B. Tribollet, G. Vlachos, B. Robertson, J. Appl. Electrochem. 22(1992) 835–842.
[57] B.P. Chaplin, M. Reinhard, W.F. Schneider, C. Schüth, J.R. Shapley, T.J. Strathmann,C.J. Werth, Environ. Sci. Technol. 46 (2012) 3655–3670.
[58] M. Shao, J. Power Sources 196 (2011) 2433–2444.[59] T. Misawa, N. Kobayashi, S. Komazaki, M. Sugiyama, Mater. Trans. 43 (2002)
1348–1351.[60] S. Fujimoto, T. Iwata, N. Tsuji, Y. Minamino, in: R.G. Buchheit, R.G. Kelly, N.A.
Missert, B.A. Shaw (Eds.), Corrosion and Protection of Light Metal Alloys, Electro-chemical Society, Pennington, New Jersey, 2004, pp. 141–147.
[61] J.P. Broomfield, in: R.W. Revie (Ed.), Uhlig's Corrosion Handbook, John Wiley &Sons, Hoboken, New Jersey, 2011.
[62] J. Lévesque, H. Hermawan, D. Dubé, D.Mantovani, Acta Biomater. 4 (2008) 284–295.[63] T. Kraus, S.F. Fischerauer, A.C. Hänzi, P.J. Uggowitzer, J.F. Löffler, A.M. Weinberg,
Acta Biomater. 8 (2012) 1230–1238.


![[PD] Libros - Principios de Economia.pdf](https://img.pdfslide.net/doc/110x75/633491b34e43a4bcd80d4740/pd-libros-principios-de-economiapdf.jpg)