Embed Size (px)
Citation preview
RSC Advances
PAPER
Ope
n A
cces
s A
rtic
le. P
ublis
hed
on 0
9 M
ay 2
017.
Dow
nloa
ded
on 1
2/4/
2018
12:
20:2
0 PM
. T
his
artic
le is
lice
nsed
und
er a
Cre
ativ
e C
omm
ons
Attr
ibut
ion-
Non
Com
mer
cial
3.0
Unp
orte
d L
icen
ce.
View Article OnlineView Journal | View Issue
Biocompatible an
aSchool of Metallurgy and Environment, Cen
410083, China. E-mail: [email protected] of Metallurgical Engineering,
84112, USA. E-mail: [email protected]
Cite this: RSC Adv., 2017, 7, 24856
Received 8th February 2017Accepted 29th April 2017
DOI: 10.1039/c7ra01601h
rsc.li/rsc-advances
24856 | RSC Adv., 2017, 7, 24856–248
d biodegradable solid polymerelectrolytes for high voltage and high temperaturelithium batteries
Yue Lin,a Yun Cheng,a Jie Li,a Jan D. Miller,b Jin Liu *a and Xuming Wang*b
Solid polymer electrolytes (SPEs) have significant potential to improve the energy density of lithium batteries
and exhibit good flexibility, electrochemical stability and increased safety. In this study, a biocompatible and
biodegradable SPE is prepared by using the natural product, wheat flour. The SPE is found to have an ionic
conductivity of 2.62 � 10�5 S cm�1 at 25 �C with a Li+ ionic transference number of 0.51. FTIR and SEM are
used to characterize the chemical and physical structures of the SPE. The results show that the enhanced
ionic conductivity is mainly due to good compatibility of wheat flour with PEO and the decreased
crystallinity of the electrolyte. Using the SPE, both NCM-811 and LiFePO4 batteries can be used in the
temperature range of 25–100 �C. The experimental results demonstrate the potential of nature-derived
solid materials for high energy and high safety green energy storage systems.
1. Introduction
Modern applications of electrical systems require energystorage systems with high temperature, high energy, and highsafety at the same time.1,2 However, most of the presentbatteries based on combustible organic solvents cannot simul-taneously meet these requirements.3 This necessitates thediscovery of solid electrolytes. Among advanced electrolytes,solid polymer electrolytes (SPEs) are fascinating due to theirexible properties, which enable the fabrication of batteries ofvarious shapes.4–9 In this way, the overall battery packaging andcost can be reduced and the energy density enhanced.10 Besides,SPEs also make the use of high energy cathodes safer thanks toSPEs' high thermal and electrochemical stability. Thus, theenergy density of SPE batteries can be increased.
SPE research began with polyethylene oxide (PEO) basedelectrolytes, which are also widely studied today.11–15 Variousmethods have been used to improve the ionic transport perfor-mance of these electrolytes including adding nanoparticles,crosslinking to make a new polymer host, and blending poly-mers.14–20 Recently, nanotube halloysite modied electrolyteswere reported to achieve ionic conductivity of 1.11 � 10�4 Scm�1.17 By using the electrolyte, the all-solid-state lithium–sulfurbattery obtained a capacity of 1350 mA h g�1 initially at 25 �Cand 0.1C. Besides, micro size lithium ionic conductive ceramicLi10GeP2S12 was used in a PEO electrolyte, which exhibited ionicconductivity of 1.18� 10�5 S cm�1 and 1.21� 10�3 S cm�1 at 25
tral South University, Changsha, Hunan,
University of Utah, Salt Lake City, UT
63
and 80 �C, respectively.13 The LiFePO4/Li battery achievedcapacities of 158, 148, 138 and 99 mA h g�1 at current rates of0.1C, 0.2C, 0.5C and 1C at 60 �C, respectively. Our previousresults show that a food grade starch hosted polymer electrolytepresents both high ionic conductivity of 3.39 � 10�4 S cm�1
and high lithium ion transference number of 0.80 at 25 �C.21
Finally, it was reported that a cellulose nonwoven membranesupported PEO:PCA:LiBOB SPE displayed ionic conductivity of1.3 � 10�5 S cm�1 at 20 �C.22 These publications demonstratethe possibility of using natural materials for the design andfabrication of SPEs.
Natural materials are largely composed of carbon andoxygen, which are similar to –C–C–O– units of PEO. Besides,PEO is biocompatible and hence has been widely used inpharmaceutical industries.23 Therefore, it is expected that PEOwill be compatible with natural materials.24 The food gradenatural materials for our daily life such as corn starch, wheatour and protein powder are nano- to micro-sized powders withwell controlled size. Thus, these products hold great potentialas direct ller material in PEO based electrolytes.
Among these natural materials, wheat our has been widelyused to make dumplings because of its excellent lmingproperties.25 In this study, food grade wheat our was directlyused to prepare a PEO electrolyte. The electrochemical andthermal properties of the solid polymer electrolyte werestudied. The chemical and physical structures of the electro-lyte were characterized to investigate the ionic transport. Thewide temperature application potential of the biodegradableand biocompatible electrolyte was demonstrated by assem-bling the SPE into both high voltage Li(Ni0.8Co0.1Mn0.1)O2
(NCM-811) and high safety LiFePO4 batteries working in thetemperature range of 25–100 �C.
This journal is © The Royal Society of Chemistry 2017
Paper RSC Advances
Ope
n A
cces
s A
rtic
le. P
ublis
hed
on 0
9 M
ay 2
017.
Dow
nloa
ded
on 1
2/4/
2018
12:
20:2
0 PM
. T
his
artic
le is
lice
nsed
und
er a
Cre
ativ
e C
omm
ons
Attr
ibut
ion-
Non
Com
mer
cial
3.0
Unp
orte
d L
icen
ce.
View Article Online
2. Experimental2.1 Materials
Polyethylene oxide (PEO, Mw ¼ 4 000 000, 99.9%) and aceto-nitrile (CH3CN, chromatographic grade) were obtained fromAladdin. Jinshahe brand wheat our was bought from thesupermarket. The wheat our is mainly composed of wheatstarch and protein. Lithium bis(triuoro-methanesulfonyl)imide (LiTFSI, +99.5%) was purchased from Sigma-Aldrichand stored in a glove box before use.
2.2 Preparation of PEO + LiTFSI + wheat our electrolyte
The preparation of the exible SPE was carried out as follows.PEO and wheat our were dried at 40 �C in vacuum for 24 h. TheLiTFSI was used directly in an argon lled glove box. With allmaterials in the glove box, the PEO, wheat our, LiTFSI andacetonitrile were stirred in a beaker until the mixture wasuniform. Then the suspension was casted and dried to forma exible PEO + LiTFSI + wheat our electrolyte lm at 80 �C inthe glove box. The ratios of PEO, wheat our and LiTFSI wereadjusted to optimize the performance of the SPE.
2.3 Electrochemical properties of the SPE
Electrochemical impedance was used to measure the ionicconductivity of the SPE in the temperature range from 25 to100 �C. The SPE lms were sandwiched between two stainlesssteel (SS) disks and assembled into a CR2025 cell. The ampli-tude voltage was 10 mV and the frequency range was 100 kHz–1 Hz. The ionic conductivities were calculated as follows:
s ¼ l
SRb
where l is the thickness of the SPE lm, Rb is the resistance ofthe electrolyte, obtained from the intercept of the x-axis of thestraight line, and S is the area of the blocking stainless steelelectrodes.
Lithium ionic transference number was obtained by usingthe polarization method. The SPE was sandwiched between twolithium discs and assembled in a CR2025 cell. The cell waspolarized with a voltage of 10 mV and the current changing withelapsed time was recorded. The impedances of the cell beforeand aer polarization were measured.
Electrochemical stability of the SPE was tested by usingstainless steel as the working electrode, and lithium as refer-ence and counter electrodes. The cell consisting of the elec-trodes and SPE was sealed in CR2025 shells. Testing wasconducted from open circuit voltage (OCV) to 6 V vs. Li/Li+ ata scan rate of 10mV s�1. Cyclic voltammetry of the Li/SPE/SS cellin the voltage route of OCV/�2 V/OCV at 25 �C and of OCV/�0.5 V/ OCV at 100 �C at a scan rate of 10 mV s�1 was usedto investigate the plating/striping performance of Li+/Li.
2.4 Thermal, physical and chemical structuralcharacterization of the SPE
Morphologies of the wheat our particles and solid polymerelectrolyte were observed with a scanning electron microscopy
This journal is © The Royal Society of Chemistry 2017
(SEM, JSM-6360LV) and the elemental distribution of the elec-trolyte sample was examined by energy dispersive spectrometer(EDS, EDX-GENESIS). The thermal behavior of the electrolytewas identied by thermogravimetric analysis (TGA, SDTQ600)under an Ar atmosphere at a heating rate of 10 �C min�1 fromroom temperature to 800 �C. Additionally, combustion test wascarried out to characterize the ame-retardant ability of theelectrolyte. The SPE or Celgard separator used with liquidorganic electrolyte was placed near to the ame and the resultswere recorded by camera. Attenuated total reectance Fouriertransform infrared spectroscopy (ATR-FTIR, Bruker Tensor II)was performed to analyze the chemical structure of the elec-trolyte lm.
2.5 Battery performance
Batteries based on the SPE were assembled and sealed inCR2025 coin cells by contacting in sequence a NCM-811 orLiFePO4 cathode (d ¼ 10 mm), a layer of SPE, and a lithiummetal anode disk (d ¼ 15.6 mm, thickness ¼ 0.3 mm). Theelectrode–electrolyte was housed and sealed in a CR2025 coincell. The cathode was prepared by making NCM-811 or LiFePO4,binder and carbon with weight ratio of 8 : 1 : 1 into NMP slurry.The slurry was coated on aluminum foil and heated at 100 �C toremove the solvent. The cathode was cut into discs. Thebatteries were assembled in the argon lled glove box. The cut-off voltage of the discharge and charge process for LiFePO4
battery was respectively 2.0 and 4.2 V at 25 �C, 2.0 and 3.8 V at100 �C. The cut-off voltage of the discharge and charge processof NCM-811 battery was respectively 2.5 and 4.2 V at both 25 and100 �C. Rate performance of the batteries at 100 �C was con-ducted at 1, 3, 5, 10C and back to 5, 3, 1C. In each rate, thebattery was cycled for 5 times. All the tests were performed ina LAND CT2001A battery test system.
3. Results and discussion3.1 Lithium ionic conductivity, chemical structure andmorphology of the wheat our modied SPE
As a crucial parameter, the ionic conductivity of the PEO +LiTFSI + wheat our SPE was optimized by adjusting the weightratio of PEO, wheat our and LiTFSI, and the results are shownin Fig. 1.
In Fig. 1a, the ionic conductivities of the SPEs at 25 �C withPEO : wheat our weight ratio of 10 : 1, 9 : 1 and 4 : 1 andLiTFSI weight concentration of 20%, 30%, 40% and 50% areshown. Further increase in the weight of wheat our leads torupture of the lm. So the PEO : wheat our weight ratio waskept higher than 4 : 1. It is seen that at the LiTFSI concentra-tions of 30%, 40%, and 50%, the SPEs with PEO : wheat ourratio of 9 : 1 exhibit highest ionic conductivities compared withthose with PEO : wheat our ratio of 10 : 1 and 4 : 1. At lowLiTFSI concentration of 20%, the SPEs with all PEO : wheatour ratios have almost the same ionic conductivity of about2.12 � 10�6 S cm�1.
The ionic conductivity increases with LiTSFI content foreach PEO : wheat our ratio at rst. At 40%, the SPEs present
RSC Adv., 2017, 7, 24856–24863 | 24857
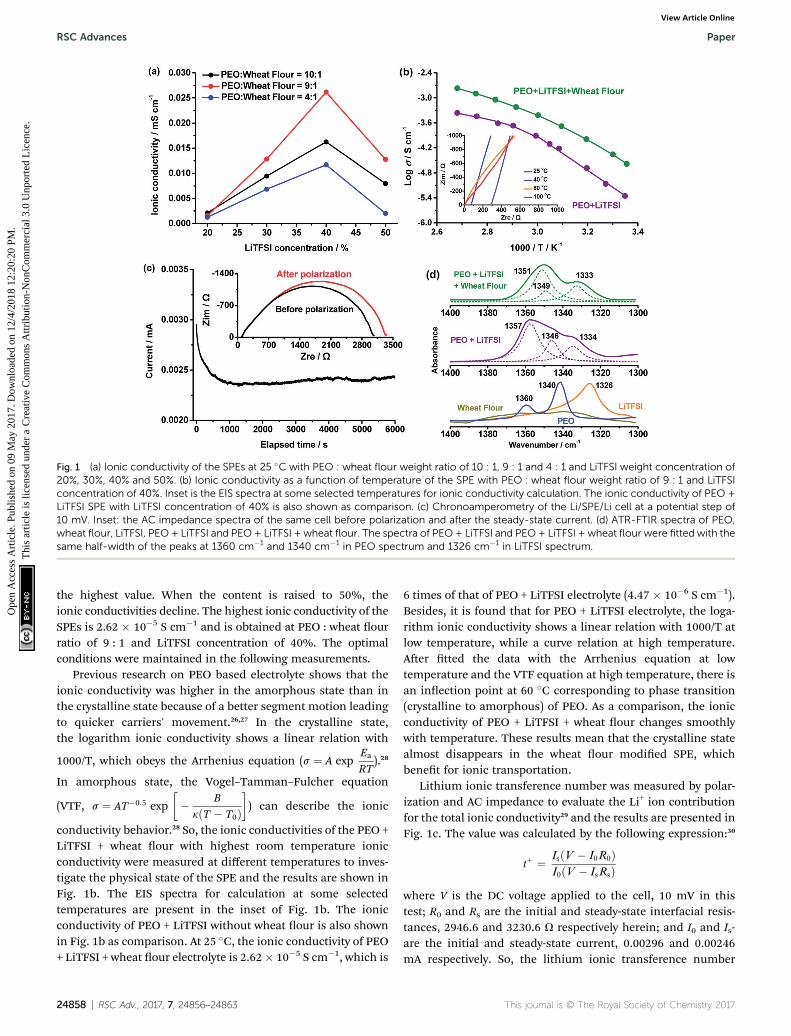
Fig. 1 (a) Ionic conductivity of the SPEs at 25 �C with PEO : wheat flour weight ratio of 10 : 1, 9 : 1 and 4 : 1 and LiTFSI weight concentration of20%, 30%, 40% and 50%. (b) Ionic conductivity as a function of temperature of the SPE with PEO : wheat flour weight ratio of 9 : 1 and LiTFSIconcentration of 40%. Inset is the EIS spectra at some selected temperatures for ionic conductivity calculation. The ionic conductivity of PEO +LiTFSI SPE with LiTFSI concentration of 40% is also shown as comparison. (c) Chronoamperometry of the Li/SPE/Li cell at a potential step of10 mV. Inset: the AC impedance spectra of the same cell before polarization and after the steady-state current. (d) ATR-FTIR spectra of PEO,wheat flour, LiTFSI, PEO + LiTFSI and PEO + LiTFSI + wheat flour. The spectra of PEO + LiTFSI and PEO + LiTFSI + wheat flour were fitted with thesame half-width of the peaks at 1360 cm�1 and 1340 cm�1 in PEO spectrum and 1326 cm�1 in LiTFSI spectrum.
RSC Advances Paper
Ope
n A
cces
s A
rtic
le. P
ublis
hed
on 0
9 M
ay 2
017.
Dow
nloa
ded
on 1
2/4/
2018
12:
20:2
0 PM
. T
his
artic
le is
lice
nsed
und
er a
Cre
ativ
e C
omm
ons
Attr
ibut
ion-
Non
Com
mer
cial
3.0
Unp
orte
d L
icen
ce.
View Article Online
the highest value. When the content is raised to 50%, theionic conductivities decline. The highest ionic conductivity of theSPEs is 2.62 � 10�5 S cm�1 and is obtained at PEO : wheat ourratio of 9 : 1 and LiTFSI concentration of 40%. The optimalconditions were maintained in the following measurements.
Previous research on PEO based electrolyte shows that theionic conductivity was higher in the amorphous state than inthe crystalline state because of a better segment motion leadingto quicker carriers' movement.26,27 In the crystalline state,the logarithm ionic conductivity shows a linear relation with
1000/T, which obeys the Arrhenius equation (s ¼ A expEa
RT).28
In amorphous state, the Vogel–Tamman–Fulcher equation
(VTF, s ¼ AT�0:5 exp�� B
kðT � T0Þ�) can describe the ionic
conductivity behavior.28 So, the ionic conductivities of the PEO +LiTFSI + wheat our with highest room temperature ionicconductivity were measured at different temperatures to inves-tigate the physical state of the SPE and the results are shown inFig. 1b. The EIS spectra for calculation at some selectedtemperatures are present in the inset of Fig. 1b. The ionicconductivity of PEO + LiTFSI without wheat our is also shownin Fig. 1b as comparison. At 25 �C, the ionic conductivity of PEO+ LiTFSI + wheat our electrolyte is 2.62� 10�5 S cm�1, which is
24858 | RSC Adv., 2017, 7, 24856–24863
6 times of that of PEO + LiTFSI electrolyte (4.47 � 10�6 S cm�1).Besides, it is found that for PEO + LiTFSI electrolyte, the loga-rithm ionic conductivity shows a linear relation with 1000/T atlow temperature, while a curve relation at high temperature.Aer tted the data with the Arrhenius equation at lowtemperature and the VTF equation at high temperature, there isan inection point at 60 �C corresponding to phase transition(crystalline to amorphous) of PEO. As a comparison, the ionicconductivity of PEO + LiTFSI + wheat our changes smoothlywith temperature. These results mean that the crystalline statealmost disappears in the wheat our modied SPE, whichbenet for ionic transportation.
Lithium ionic transference number was measured by polar-ization and AC impedance to evaluate the Li+ ion contributionfor the total ionic conductivity29 and the results are presented inFig. 1c. The value was calculated by the following expression:30
tþ ¼ IsðV � I0R0ÞI0ðV � IsRsÞ
where V is the DC voltage applied to the cell, 10 mV in thistest; R0 and Rs are the initial and steady-state interfacial resis-tances, 2946.6 and 3230.6 U respectively herein; and I0 and Is-are the initial and steady-state current, 0.00296 and 0.00246mA respectively. So, the lithium ionic transference number
This journal is © The Royal Society of Chemistry 2017
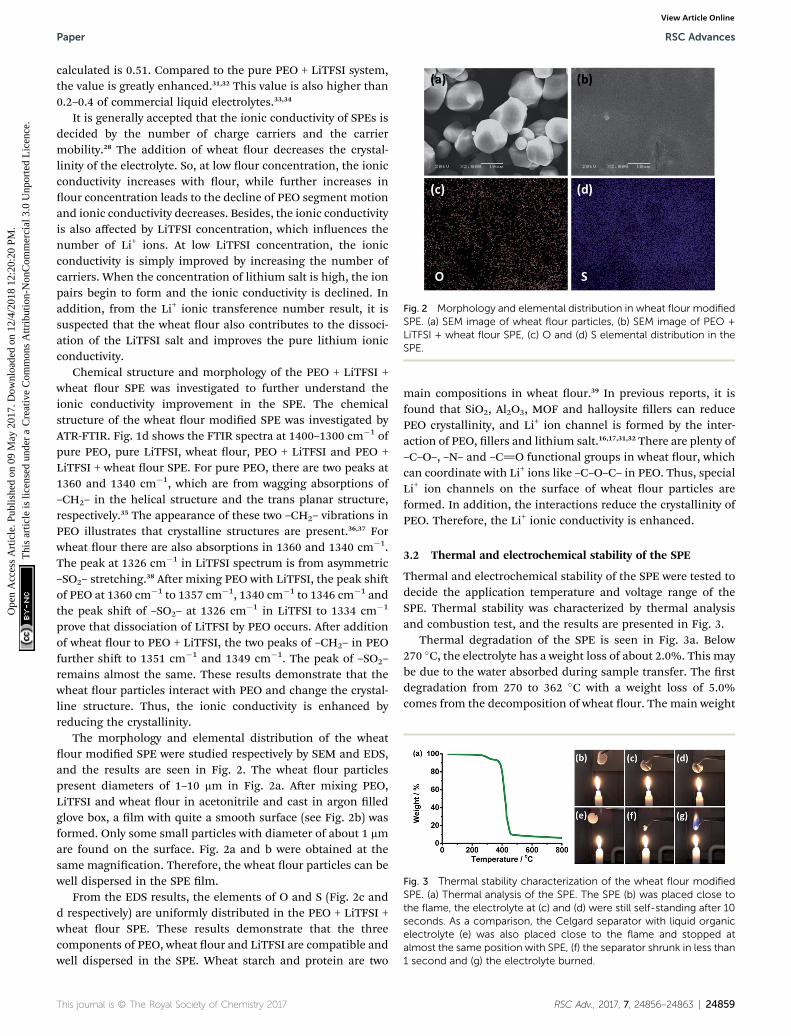
Fig. 2 Morphology and elemental distribution in wheat flour modifiedSPE. (a) SEM image of wheat flour particles, (b) SEM image of PEO +LiTFSI + wheat flour SPE, (c) O and (d) S elemental distribution in theSPE.
Fig. 3 Thermal stability characterization of the wheat flour modifiedSPE. (a) Thermal analysis of the SPE. The SPE (b) was placed close tothe flame, the electrolyte at (c) and (d) were still self-standing after 10seconds. As a comparison, the Celgard separator with liquid organicelectrolyte (e) was also placed close to the flame and stopped atalmost the same position with SPE, (f) the separator shrunk in less than1 second and (g) the electrolyte burned.
Paper RSC Advances
Ope
n A
cces
s A
rtic
le. P
ublis
hed
on 0
9 M
ay 2
017.
Dow
nloa
ded
on 1
2/4/
2018
12:
20:2
0 PM
. T
his
artic
le is
lice
nsed
und
er a
Cre
ativ
e C
omm
ons
Attr
ibut
ion-
Non
Com
mer
cial
3.0
Unp
orte
d L
icen
ce.
View Article Online
calculated is 0.51. Compared to the pure PEO + LiTFSI system,the value is greatly enhanced.31,32 This value is also higher than0.2–0.4 of commercial liquid electrolytes.33,34
It is generally accepted that the ionic conductivity of SPEs isdecided by the number of charge carriers and the carriermobility.28 The addition of wheat our decreases the crystal-linity of the electrolyte. So, at low our concentration, the ionicconductivity increases with our, while further increases inour concentration leads to the decline of PEO segment motionand ionic conductivity decreases. Besides, the ionic conductivityis also affected by LiTFSI concentration, which inuences thenumber of Li+ ions. At low LiTFSI concentration, the ionicconductivity is simply improved by increasing the number ofcarriers. When the concentration of lithium salt is high, the ionpairs begin to form and the ionic conductivity is declined. Inaddition, from the Li+ ionic transference number result, it issuspected that the wheat our also contributes to the dissoci-ation of the LiTFSI salt and improves the pure lithium ionicconductivity.
Chemical structure and morphology of the PEO + LiTFSI +wheat our SPE was investigated to further understand theionic conductivity improvement in the SPE. The chemicalstructure of the wheat our modied SPE was investigated byATR-FTIR. Fig. 1d shows the FTIR spectra at 1400–1300 cm�1 ofpure PEO, pure LiTFSI, wheat our, PEO + LiTFSI and PEO +LiTFSI + wheat our SPE. For pure PEO, there are two peaks at1360 and 1340 cm�1, which are from wagging absorptions of–CH2– in the helical structure and the trans planar structure,respectively.35 The appearance of these two –CH2– vibrations inPEO illustrates that crystalline structures are present.36,37 Forwheat our there are also absorptions in 1360 and 1340 cm�1.The peak at 1326 cm�1 in LiTFSI spectrum is from asymmetric–SO2– stretching.38 Aer mixing PEO with LiTFSI, the peak shiof PEO at 1360 cm�1 to 1357 cm�1, 1340 cm�1 to 1346 cm�1 andthe peak shi of –SO2– at 1326 cm�1 in LiTFSI to 1334 cm�1
prove that dissociation of LiTFSI by PEO occurs. Aer additionof wheat our to PEO + LiTFSI, the two peaks of –CH2– in PEOfurther shi to 1351 cm�1 and 1349 cm�1. The peak of –SO2–
remains almost the same. These results demonstrate that thewheat our particles interact with PEO and change the crystal-line structure. Thus, the ionic conductivity is enhanced byreducing the crystallinity.
The morphology and elemental distribution of the wheatour modied SPE were studied respectively by SEM and EDS,and the results are seen in Fig. 2. The wheat our particlespresent diameters of 1–10 mm in Fig. 2a. Aer mixing PEO,LiTFSI and wheat our in acetonitrile and cast in argon lledglove box, a lm with quite a smooth surface (see Fig. 2b) wasformed. Only some small particles with diameter of about 1 mmare found on the surface. Fig. 2a and b were obtained at thesame magnication. Therefore, the wheat our particles can bewell dispersed in the SPE lm.
From the EDS results, the elements of O and S (Fig. 2c andd respectively) are uniformly distributed in the PEO + LiTFSI +wheat our SPE. These results demonstrate that the threecomponents of PEO, wheat our and LiTFSI are compatible andwell dispersed in the SPE. Wheat starch and protein are two
This journal is © The Royal Society of Chemistry 2017
main compositions in wheat our.39 In previous reports, it isfound that SiO2, Al2O3, MOF and halloysite llers can reducePEO crystallinity, and Li+ ion channel is formed by the inter-action of PEO, llers and lithium salt.16,17,31,32 There are plenty of–C–O–, –N– and –C]O functional groups in wheat our, whichcan coordinate with Li+ ions like –C–O–C– in PEO. Thus, specialLi+ ion channels on the surface of wheat our particles areformed. In addition, the interactions reduce the crystallinity ofPEO. Therefore, the Li+ ionic conductivity is enhanced.
3.2 Thermal and electrochemical stability of the SPE
Thermal and electrochemical stability of the SPE were tested todecide the application temperature and voltage range of theSPE. Thermal stability was characterized by thermal analysisand combustion test, and the results are presented in Fig. 3.
Thermal degradation of the SPE is seen in Fig. 3a. Below270 �C, the electrolyte has a weight loss of about 2.0%. This maybe due to the water absorbed during sample transfer. The rstdegradation from 270 to 362 �C with a weight loss of 5.0%comes from the decomposition of wheat our. The main weight
RSC Adv., 2017, 7, 24856–24863 | 24859
RSC Advances Paper
Ope
n A
cces
s A
rtic
le. P
ublis
hed
on 0
9 M
ay 2
017.
Dow
nloa
ded
on 1
2/4/
2018
12:
20:2
0 PM
. T
his
artic
le is
lice
nsed
und
er a
Cre
ativ
e C
omm
ons
Attr
ibut
ion-
Non
Com
mer
cial
3.0
Unp
orte
d L
icen
ce.
View Article Online
loss of about 83% from 362 to 460 �C corresponds to thedecomposition of PEO and LiTFSI.40,41 The residual of 10% maybe carbon materials.
Combustion test shows a ame retardant ability of the wheatour modied SPE. When the SPE (Fig. 3b) was placed close to
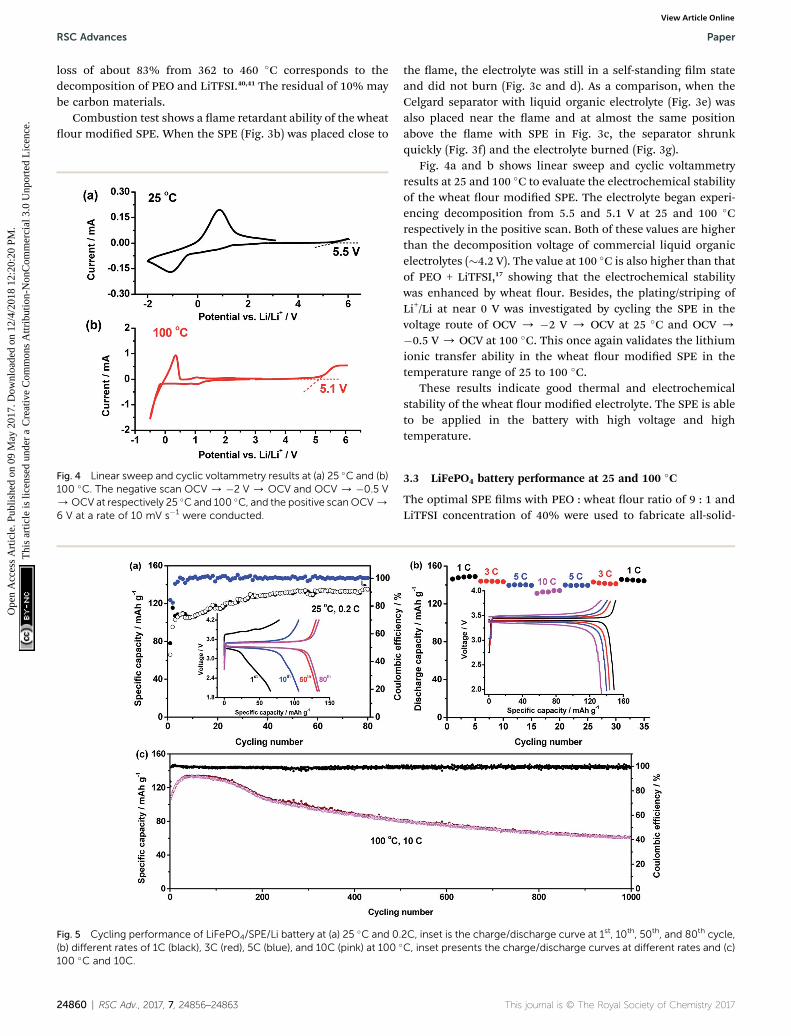
Fig. 4 Linear sweep and cyclic voltammetry results at (a) 25 �C and (b)100 �C. The negative scan OCV / �2 V / OCV and OCV / �0.5 V/OCV at respectively 25 �C and 100 �C, and the positive scanOCV/6 V at a rate of 10 mV s�1 were conducted.
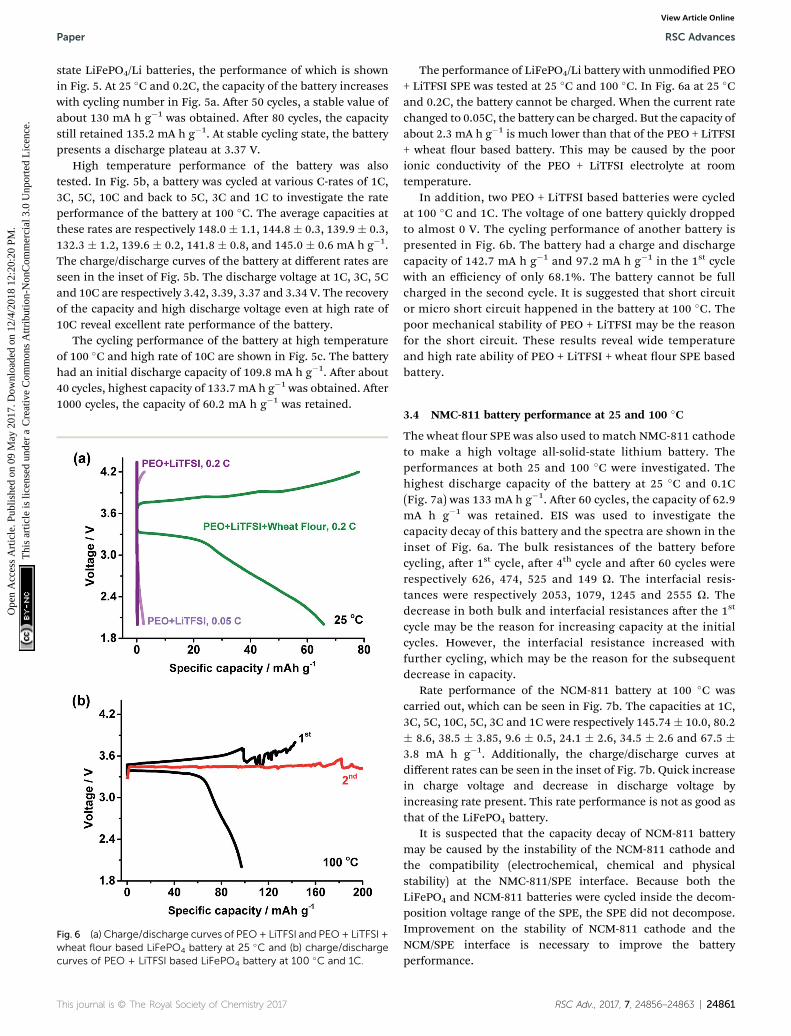
Fig. 5 Cycling performance of LiFePO4/SPE/Li battery at (a) 25 �C and 0.(b) different rates of 1C (black), 3C (red), 5C (blue), and 10C (pink) at 100 �
100 �C and 10C.
24860 | RSC Adv., 2017, 7, 24856–24863
the ame, the electrolyte was still in a self-standing lm stateand did not burn (Fig. 3c and d). As a comparison, when theCelgard separator with liquid organic electrolyte (Fig. 3e) wasalso placed near the ame and at almost the same positionabove the ame with SPE in Fig. 3c, the separator shrunkquickly (Fig. 3f) and the electrolyte burned (Fig. 3g).
Fig. 4a and b shows linear sweep and cyclic voltammetryresults at 25 and 100 �C to evaluate the electrochemical stabilityof the wheat our modied SPE. The electrolyte began experi-encing decomposition from 5.5 and 5.1 V at 25 and 100 �Crespectively in the positive scan. Both of these values are higherthan the decomposition voltage of commercial liquid organicelectrolytes (�4.2 V). The value at 100 �C is also higher than thatof PEO + LiTFSI,17 showing that the electrochemical stabilitywas enhanced by wheat our. Besides, the plating/striping ofLi+/Li at near 0 V was investigated by cycling the SPE in thevoltage route of OCV / �2 V / OCV at 25 �C and OCV /
�0.5 V / OCV at 100 �C. This once again validates the lithiumionic transfer ability in the wheat our modied SPE in thetemperature range of 25 to 100 �C.
These results indicate good thermal and electrochemicalstability of the wheat our modied electrolyte. The SPE is ableto be applied in the battery with high voltage and hightemperature.
3.3 LiFePO4 battery performance at 25 and 100 �C
The optimal SPE lms with PEO : wheat our ratio of 9 : 1 andLiTFSI concentration of 40% were used to fabricate all-solid-
2C, inset is the charge/discharge curve at 1st, 10th, 50th, and 80th cycle,C, inset presents the charge/discharge curves at different rates and (c)
This journal is © The Royal Society of Chemistry 2017
Paper RSC Advances
Ope
n A
cces
s A
rtic
le. P
ublis
hed
on 0
9 M
ay 2
017.
Dow
nloa
ded
on 1
2/4/
2018
12:
20:2
0 PM
. T
his
artic
le is
lice
nsed
und
er a
Cre
ativ
e C
omm
ons
Attr
ibut
ion-
Non
Com
mer
cial
3.0
Unp
orte
d L
icen
ce.
View Article Online
state LiFePO4/Li batteries, the performance of which is shownin Fig. 5. At 25 �C and 0.2C, the capacity of the battery increaseswith cycling number in Fig. 5a. Aer 50 cycles, a stable value ofabout 130 mA h g�1 was obtained. Aer 80 cycles, the capacitystill retained 135.2 mA h g�1. At stable cycling state, the batterypresents a discharge plateau at 3.37 V.
High temperature performance of the battery was alsotested. In Fig. 5b, a battery was cycled at various C-rates of 1C,3C, 5C, 10C and back to 5C, 3C and 1C to investigate the rateperformance of the battery at 100 �C. The average capacities atthese rates are respectively 148.0 � 1.1, 144.8 � 0.3, 139.9� 0.3,132.3 � 1.2, 139.6 � 0.2, 141.8 � 0.8, and 145.0 � 0.6 mA h g�1.The charge/discharge curves of the battery at different rates areseen in the inset of Fig. 5b. The discharge voltage at 1C, 3C, 5Cand 10C are respectively 3.42, 3.39, 3.37 and 3.34 V. The recoveryof the capacity and high discharge voltage even at high rate of10C reveal excellent rate performance of the battery.
The cycling performance of the battery at high temperatureof 100 �C and high rate of 10C are shown in Fig. 5c. The batteryhad an initial discharge capacity of 109.8 mA h g�1. Aer about40 cycles, highest capacity of 133.7 mA h g�1 was obtained. Aer1000 cycles, the capacity of 60.2 mA h g�1 was retained.
Fig. 6 (a) Charge/discharge curves of PEO+ LiTFSI and PEO+ LiTFSI +wheat flour based LiFePO4 battery at 25 �C and (b) charge/dischargecurves of PEO + LiTFSI based LiFePO4 battery at 100 �C and 1C.
This journal is © The Royal Society of Chemistry 2017
The performance of LiFePO4/Li battery with unmodied PEO+ LiTFSI SPE was tested at 25 �C and 100 �C. In Fig. 6a at 25 �Cand 0.2C, the battery cannot be charged. When the current ratechanged to 0.05C, the battery can be charged. But the capacity ofabout 2.3 mA h g�1 is much lower than that of the PEO + LiTFSI+ wheat our based battery. This may be caused by the poorionic conductivity of the PEO + LiTFSI electrolyte at roomtemperature.
In addition, two PEO + LiTFSI based batteries were cycledat 100 �C and 1C. The voltage of one battery quickly droppedto almost 0 V. The cycling performance of another battery ispresented in Fig. 6b. The battery had a charge and dischargecapacity of 142.7 mA h g�1 and 97.2 mA h g�1 in the 1st cyclewith an efficiency of only 68.1%. The battery cannot be fullcharged in the second cycle. It is suggested that short circuitor micro short circuit happened in the battery at 100 �C. Thepoor mechanical stability of PEO + LiTFSI may be the reasonfor the short circuit. These results reveal wide temperatureand high rate ability of PEO + LiTFSI + wheat our SPE basedbattery.
3.4 NMC-811 battery performance at 25 and 100 �C
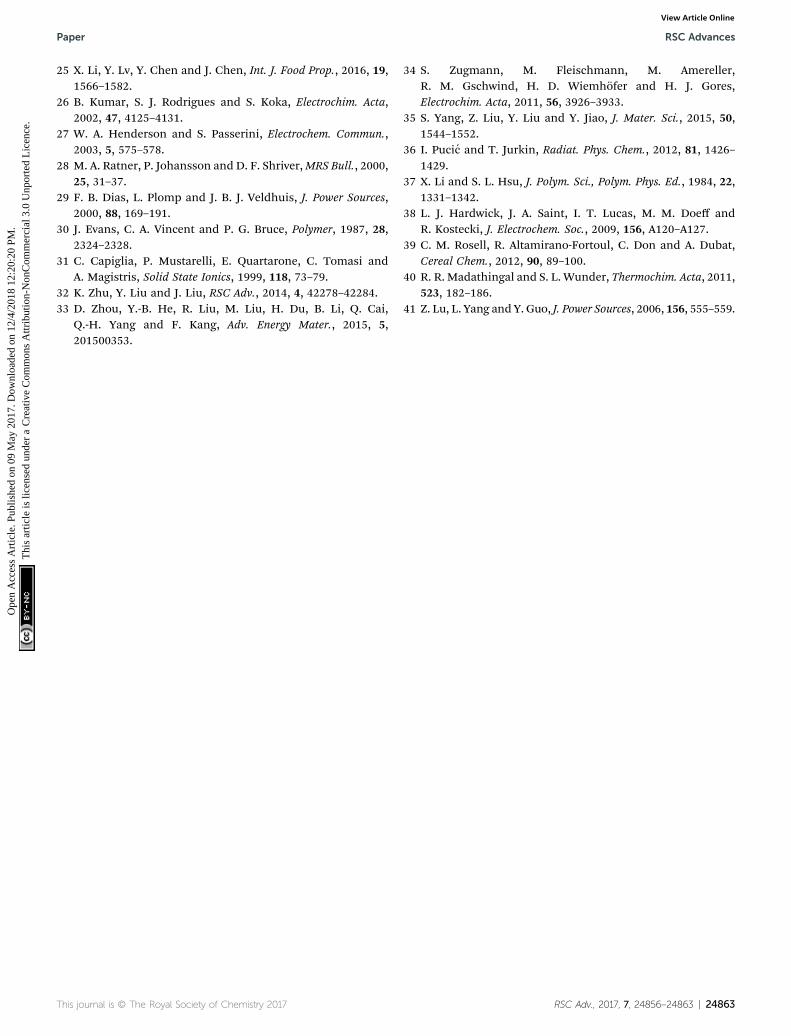
The wheat our SPE was also used to match NMC-811 cathodeto make a high voltage all-solid-state lithium battery. Theperformances at both 25 and 100 �C were investigated. Thehighest discharge capacity of the battery at 25 �C and 0.1C(Fig. 7a) was 133 mA h g�1. Aer 60 cycles, the capacity of 62.9mA h g�1 was retained. EIS was used to investigate thecapacity decay of this battery and the spectra are shown in theinset of Fig. 6a. The bulk resistances of the battery beforecycling, aer 1st cycle, aer 4th cycle and aer 60 cycles wererespectively 626, 474, 525 and 149 U. The interfacial resis-tances were respectively 2053, 1079, 1245 and 2555 U. Thedecrease in both bulk and interfacial resistances aer the 1st
cycle may be the reason for increasing capacity at the initialcycles. However, the interfacial resistance increased withfurther cycling, which may be the reason for the subsequentdecrease in capacity.
Rate performance of the NCM-811 battery at 100 �C wascarried out, which can be seen in Fig. 7b. The capacities at 1C,3C, 5C, 10C, 5C, 3C and 1C were respectively 145.74 � 10.0, 80.2� 8.6, 38.5 � 3.85, 9.6 � 0.5, 24.1 � 2.6, 34.5 � 2.6 and 67.5 �3.8 mA h g�1. Additionally, the charge/discharge curves atdifferent rates can be seen in the inset of Fig. 7b. Quick increasein charge voltage and decrease in discharge voltage byincreasing rate present. This rate performance is not as good asthat of the LiFePO4 battery.
It is suspected that the capacity decay of NCM-811 batterymay be caused by the instability of the NCM-811 cathode andthe compatibility (electrochemical, chemical and physicalstability) at the NMC-811/SPE interface. Because both theLiFePO4 and NCM-811 batteries were cycled inside the decom-position voltage range of the SPE, the SPE did not decompose.Improvement on the stability of NCM-811 cathode and theNCM/SPE interface is necessary to improve the batteryperformance.
RSC Adv., 2017, 7, 24856–24863 | 24861
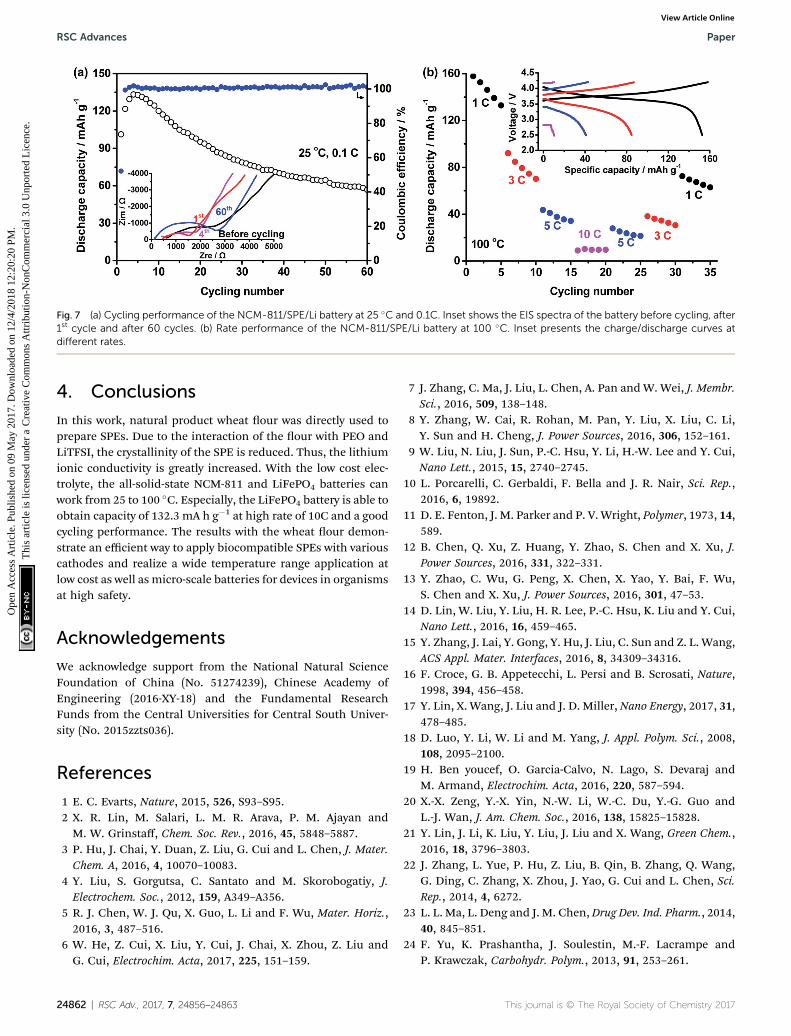
Fig. 7 (a) Cycling performance of the NCM-811/SPE/Li battery at 25 �C and 0.1C. Inset shows the EIS spectra of the battery before cycling, after1st cycle and after 60 cycles. (b) Rate performance of the NCM-811/SPE/Li battery at 100 �C. Inset presents the charge/discharge curves atdifferent rates.
RSC Advances Paper
Ope
n A
cces
s A
rtic
le. P
ublis
hed
on 0
9 M
ay 2
017.
Dow
nloa
ded
on 1
2/4/
2018
12:
20:2
0 PM
. T
his
artic
le is
lice
nsed
und
er a
Cre
ativ
e C
omm
ons
Attr
ibut
ion-
Non
Com
mer
cial
3.0
Unp
orte
d L
icen
ce.
View Article Online
4. Conclusions
In this work, natural product wheat our was directly used toprepare SPEs. Due to the interaction of the our with PEO andLiTFSI, the crystallinity of the SPE is reduced. Thus, the lithiumionic conductivity is greatly increased. With the low cost elec-trolyte, the all-solid-state NCM-811 and LiFePO4 batteries canwork from 25 to 100 �C. Especially, the LiFePO4 battery is able toobtain capacity of 132.3 mA h g�1 at high rate of 10C and a goodcycling performance. The results with the wheat our demon-strate an efficient way to apply biocompatible SPEs with variouscathodes and realize a wide temperature range application atlow cost as well as micro-scale batteries for devices in organismsat high safety.
Acknowledgements
We acknowledge support from the National Natural ScienceFoundation of China (No. 51274239), Chinese Academy ofEngineering (2016-XY-18) and the Fundamental ResearchFunds from the Central Universities for Central South Univer-sity (No. 2015zzts036).
References
1 E. C. Evarts, Nature, 2015, 526, S93–S95.2 X. R. Lin, M. Salari, L. M. R. Arava, P. M. Ajayan andM. W. Grinstaff, Chem. Soc. Rev., 2016, 45, 5848–5887.
3 P. Hu, J. Chai, Y. Duan, Z. Liu, G. Cui and L. Chen, J. Mater.Chem. A, 2016, 4, 10070–10083.
4 Y. Liu, S. Gorgutsa, C. Santato and M. Skorobogatiy, J.Electrochem. Soc., 2012, 159, A349–A356.
5 R. J. Chen, W. J. Qu, X. Guo, L. Li and F. Wu, Mater. Horiz.,2016, 3, 487–516.
6 W. He, Z. Cui, X. Liu, Y. Cui, J. Chai, X. Zhou, Z. Liu andG. Cui, Electrochim. Acta, 2017, 225, 151–159.
24862 | RSC Adv., 2017, 7, 24856–24863
7 J. Zhang, C. Ma, J. Liu, L. Chen, A. Pan andW. Wei, J. Membr.Sci., 2016, 509, 138–148.
8 Y. Zhang, W. Cai, R. Rohan, M. Pan, Y. Liu, X. Liu, C. Li,Y. Sun and H. Cheng, J. Power Sources, 2016, 306, 152–161.
9 W. Liu, N. Liu, J. Sun, P.-C. Hsu, Y. Li, H.-W. Lee and Y. Cui,Nano Lett., 2015, 15, 2740–2745.
10 L. Porcarelli, C. Gerbaldi, F. Bella and J. R. Nair, Sci. Rep.,2016, 6, 19892.
11 D. E. Fenton, J. M. Parker and P. V. Wright, Polymer, 1973, 14,589.
12 B. Chen, Q. Xu, Z. Huang, Y. Zhao, S. Chen and X. Xu, J.Power Sources, 2016, 331, 322–331.
13 Y. Zhao, C. Wu, G. Peng, X. Chen, X. Yao, Y. Bai, F. Wu,S. Chen and X. Xu, J. Power Sources, 2016, 301, 47–53.
14 D. Lin, W. Liu, Y. Liu, H. R. Lee, P.-C. Hsu, K. Liu and Y. Cui,Nano Lett., 2016, 16, 459–465.
15 Y. Zhang, J. Lai, Y. Gong, Y. Hu, J. Liu, C. Sun and Z. L. Wang,ACS Appl. Mater. Interfaces, 2016, 8, 34309–34316.
16 F. Croce, G. B. Appetecchi, L. Persi and B. Scrosati, Nature,1998, 394, 456–458.
17 Y. Lin, X. Wang, J. Liu and J. D. Miller, Nano Energy, 2017, 31,478–485.
18 D. Luo, Y. Li, W. Li and M. Yang, J. Appl. Polym. Sci., 2008,108, 2095–2100.
19 H. Ben youcef, O. Garcia-Calvo, N. Lago, S. Devaraj andM. Armand, Electrochim. Acta, 2016, 220, 587–594.
20 X.-X. Zeng, Y.-X. Yin, N.-W. Li, W.-C. Du, Y.-G. Guo andL.-J. Wan, J. Am. Chem. Soc., 2016, 138, 15825–15828.
21 Y. Lin, J. Li, K. Liu, Y. Liu, J. Liu and X. Wang, Green Chem.,2016, 18, 3796–3803.
22 J. Zhang, L. Yue, P. Hu, Z. Liu, B. Qin, B. Zhang, Q. Wang,G. Ding, C. Zhang, X. Zhou, J. Yao, G. Cui and L. Chen, Sci.Rep., 2014, 4, 6272.
23 L. L. Ma, L. Deng and J. M. Chen, Drug Dev. Ind. Pharm., 2014,40, 845–851.
24 F. Yu, K. Prashantha, J. Soulestin, M.-F. Lacrampe andP. Krawczak, Carbohydr. Polym., 2013, 91, 253–261.
This journal is © The Royal Society of Chemistry 2017
Paper RSC Advances
Ope
n A
cces
s A
rtic
le. P
ublis
hed
on 0
9 M
ay 2
017.
Dow
nloa
ded
on 1
2/4/
2018
12:
20:2
0 PM
. T
his
artic
le is
lice
nsed
und
er a
Cre
ativ
e C
omm
ons
Attr
ibut
ion-
Non
Com
mer
cial
3.0
Unp
orte
d L
icen
ce.
View Article Online
25 X. Li, Y. Lv, Y. Chen and J. Chen, Int. J. Food Prop., 2016, 19,1566–1582.
26 B. Kumar, S. J. Rodrigues and S. Koka, Electrochim. Acta,2002, 47, 4125–4131.
27 W. A. Henderson and S. Passerini, Electrochem. Commun.,2003, 5, 575–578.
28 M. A. Ratner, P. Johansson and D. F. Shriver,MRS Bull., 2000,25, 31–37.
29 F. B. Dias, L. Plomp and J. B. J. Veldhuis, J. Power Sources,2000, 88, 169–191.
30 J. Evans, C. A. Vincent and P. G. Bruce, Polymer, 1987, 28,2324–2328.
31 C. Capiglia, P. Mustarelli, E. Quartarone, C. Tomasi andA. Magistris, Solid State Ionics, 1999, 118, 73–79.
32 K. Zhu, Y. Liu and J. Liu, RSC Adv., 2014, 4, 42278–42284.33 D. Zhou, Y.-B. He, R. Liu, M. Liu, H. Du, B. Li, Q. Cai,
Q.-H. Yang and F. Kang, Adv. Energy Mater., 2015, 5,201500353.
This journal is © The Royal Society of Chemistry 2017
34 S. Zugmann, M. Fleischmann, M. Amereller,R. M. Gschwind, H. D. Wiemhofer and H. J. Gores,Electrochim. Acta, 2011, 56, 3926–3933.
35 S. Yang, Z. Liu, Y. Liu and Y. Jiao, J. Mater. Sci., 2015, 50,1544–1552.
36 I. Pucic and T. Jurkin, Radiat. Phys. Chem., 2012, 81, 1426–1429.
37 X. Li and S. L. Hsu, J. Polym. Sci., Polym. Phys. Ed., 1984, 22,1331–1342.
38 L. J. Hardwick, J. A. Saint, I. T. Lucas, M. M. Doeff andR. Kostecki, J. Electrochem. Soc., 2009, 156, A120–A127.
39 C. M. Rosell, R. Altamirano-Fortoul, C. Don and A. Dubat,Cereal Chem., 2012, 90, 89–100.
40 R. R. Madathingal and S. L. Wunder, Thermochim. Acta, 2011,523, 182–186.
41 Z. Lu, L. Yang and Y. Guo, J. Power Sources, 2006, 156, 555–559.
RSC Adv., 2017, 7, 24856–24863 | 24863


