Embed Size (px)
Citation preview
@watershedLRS @degreed
Data Fluency for Dummies
Tim Dickinson
Director, Learning Analytics Strategy watershedLRS.com @watershedLRS
James Densmore
Director of Data Science Degreed.com @degreed
@watershedLRS @degreed
What is Data Science?
@watershedLRS @degreed
Why is it so confusing in the first place?
• Hype cycle
• VCs and startups!
• A catchall for a fast-growing set of competencies
@watershedLRS @degreed
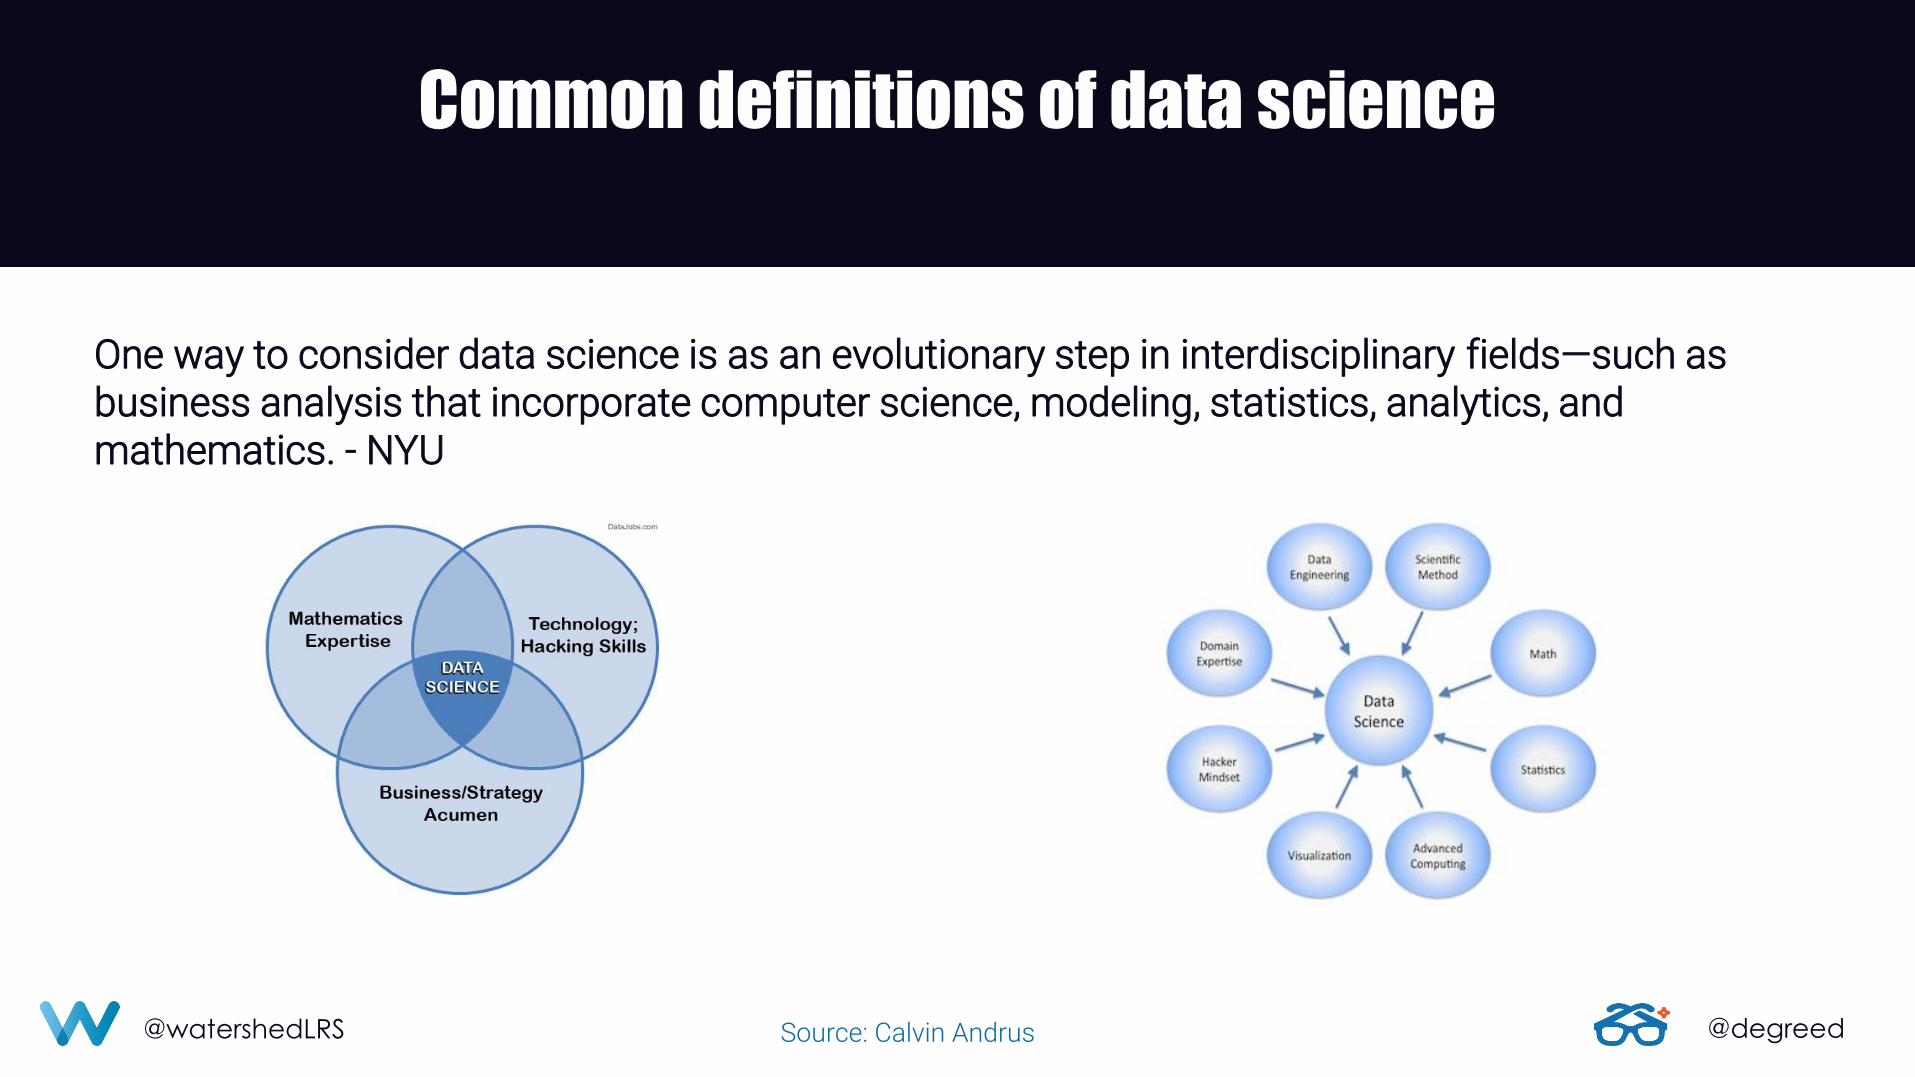
One way to consider data science is as an evolutionary step in interdisciplinary fields—such as business analysis that incorporate computer science, modeling, statistics, analytics, and mathematics. - NYU
Source: Calvin Andrus
Common definitions of data science
@watershedLRS @degreed
@watershedLRS @degreed
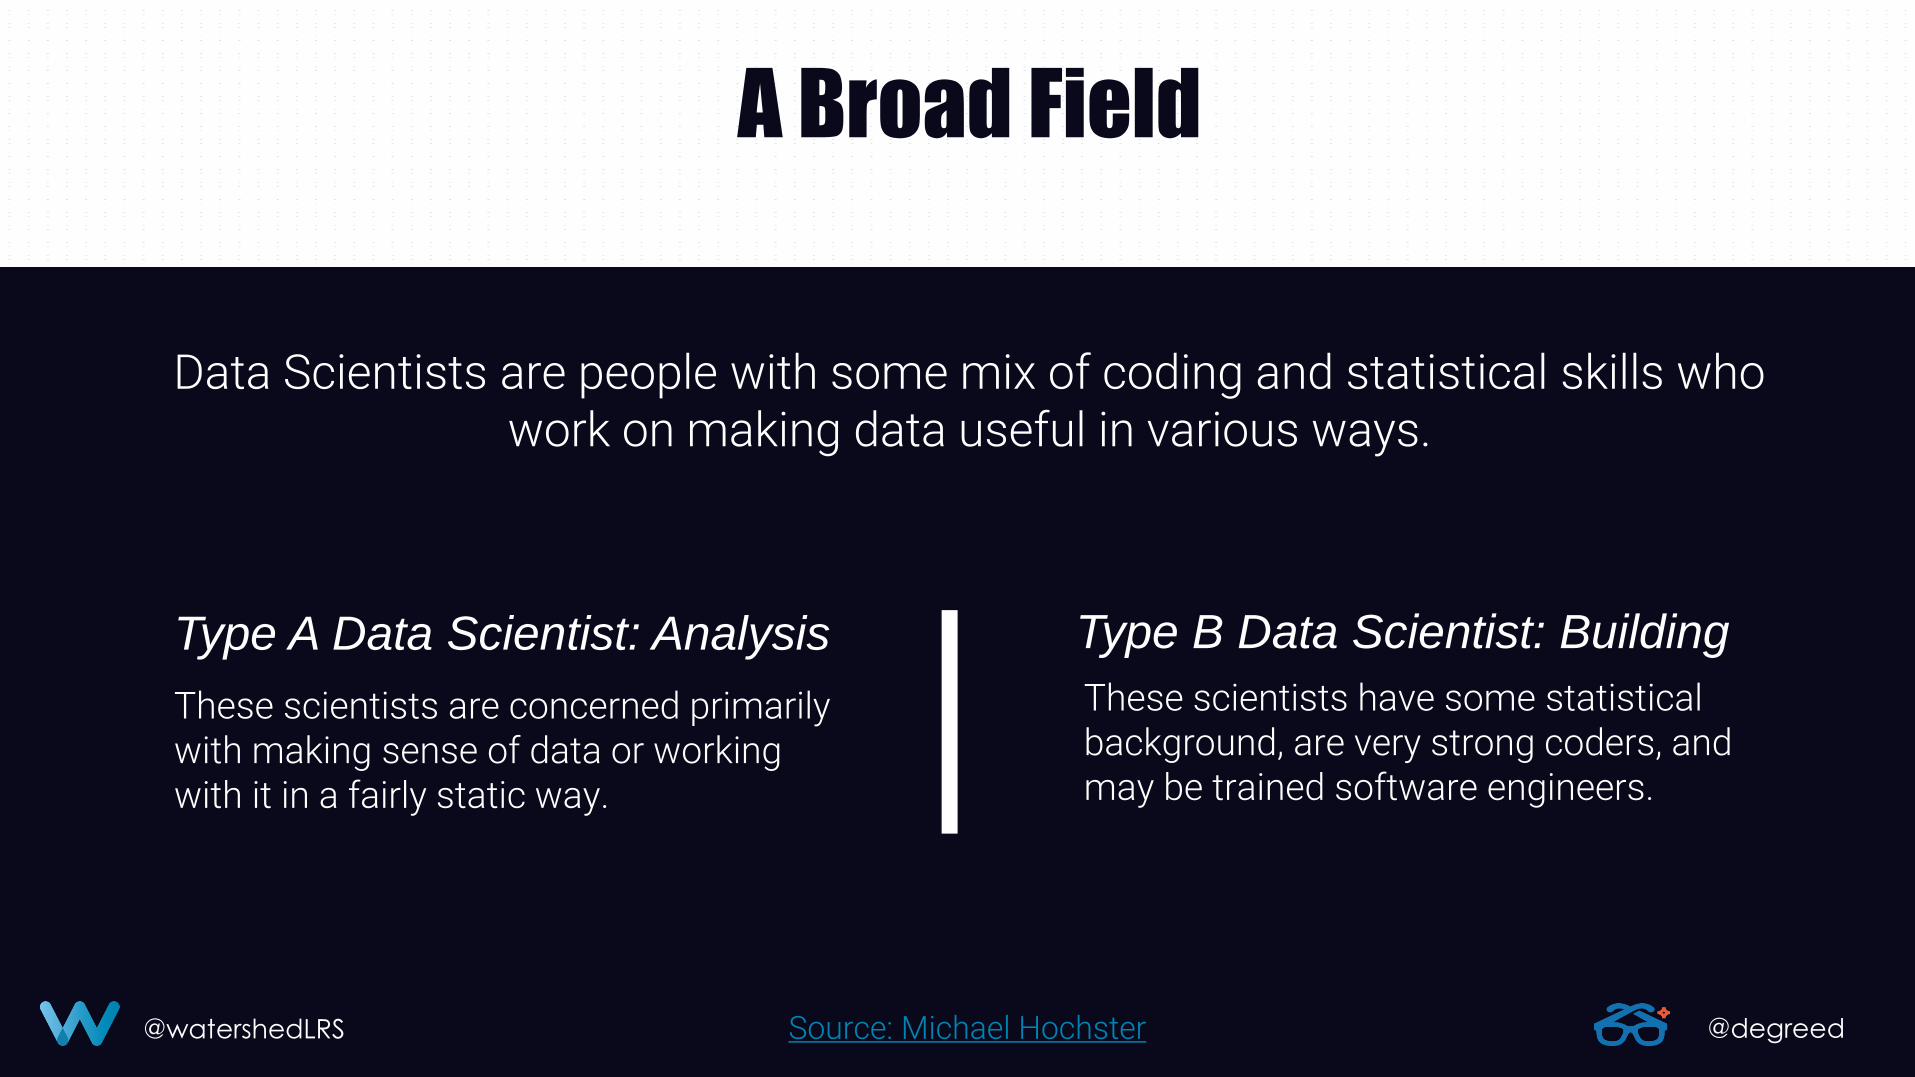
A Broad Field
Data Scientists are people with some mix of coding and statistical skills who work on making data useful in various ways.
Source: Michael Hochster
Type A Data Scientist: Analysis Type B Data Scientist: Building
These scientists have some statistical background, are very strong coders, and may be trained software engineers.
These scientists are concerned primarily with making sense of data or working with it in a fairly static way.
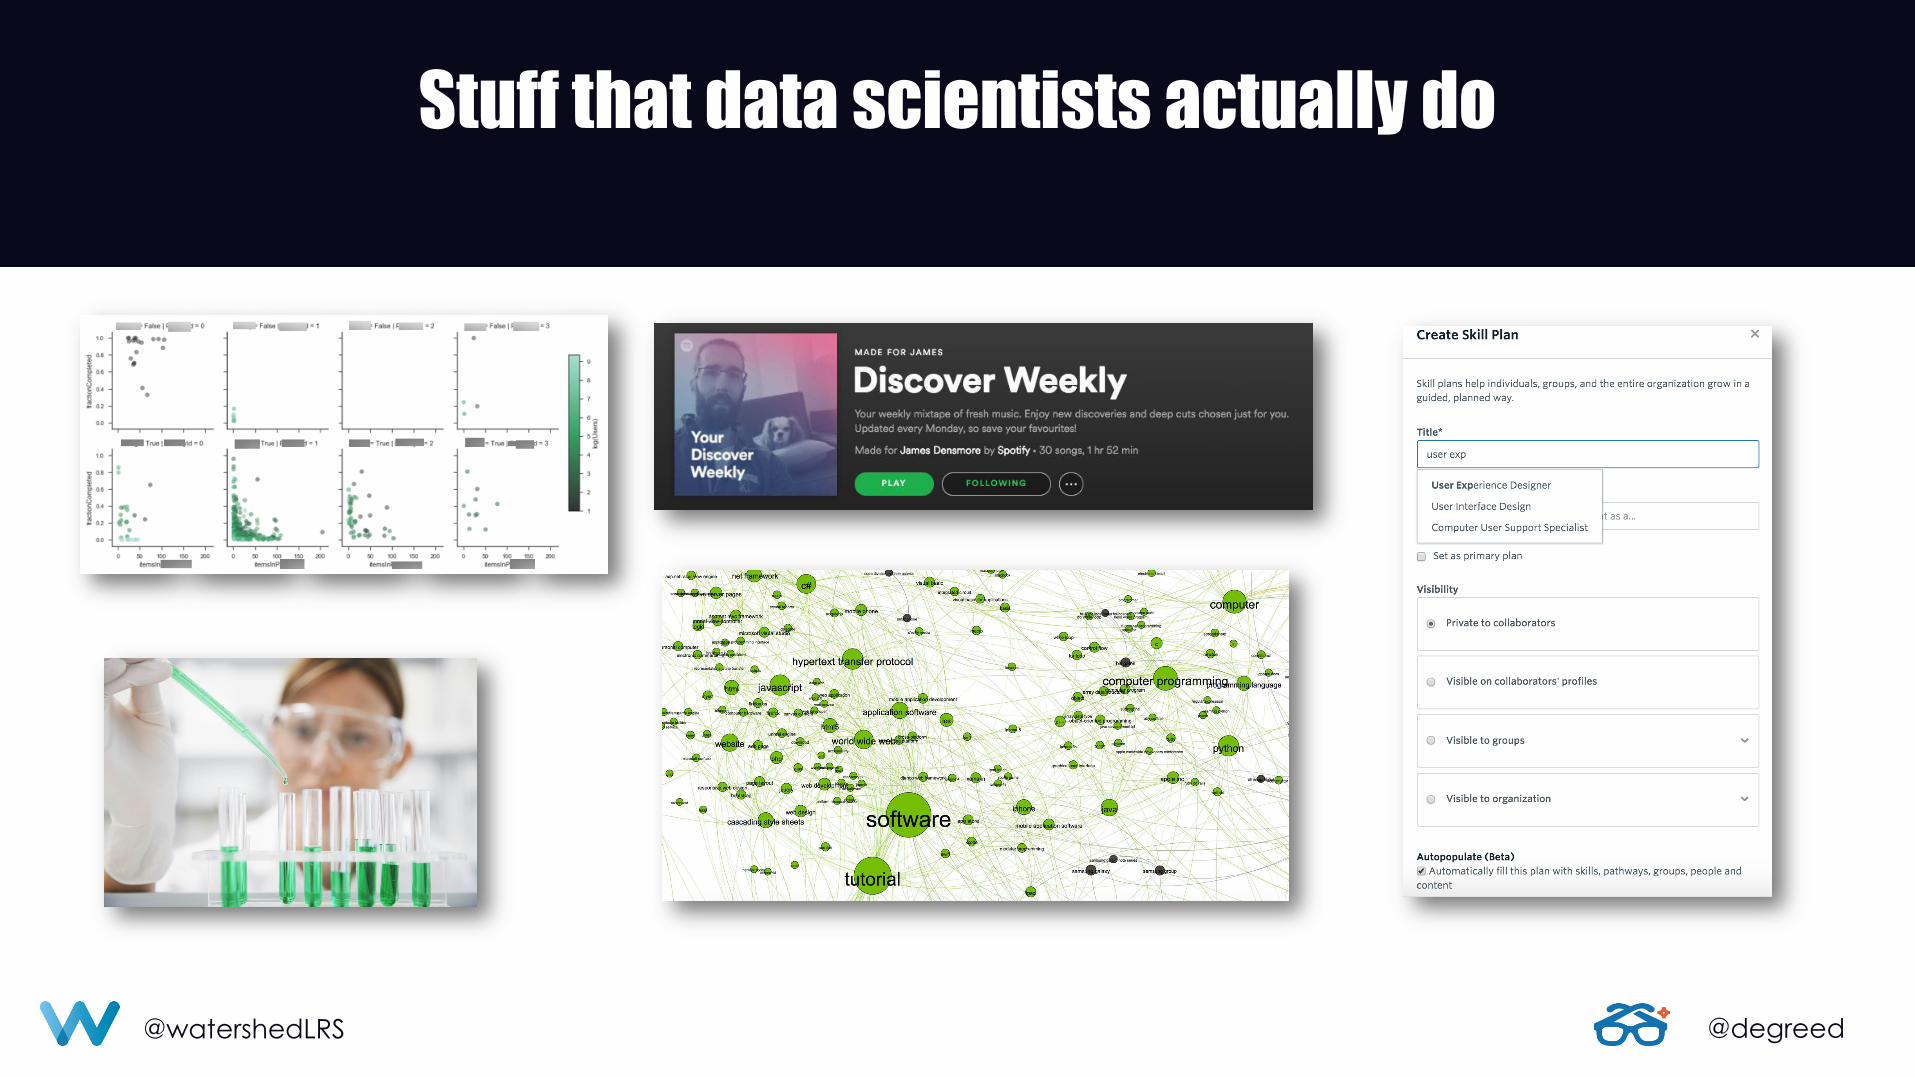
Stuff that data scientists actually do
@watershedLRS @degreed
@watershedLRS @degreed
How does data fit into learning?
@watershedLRS @degreed
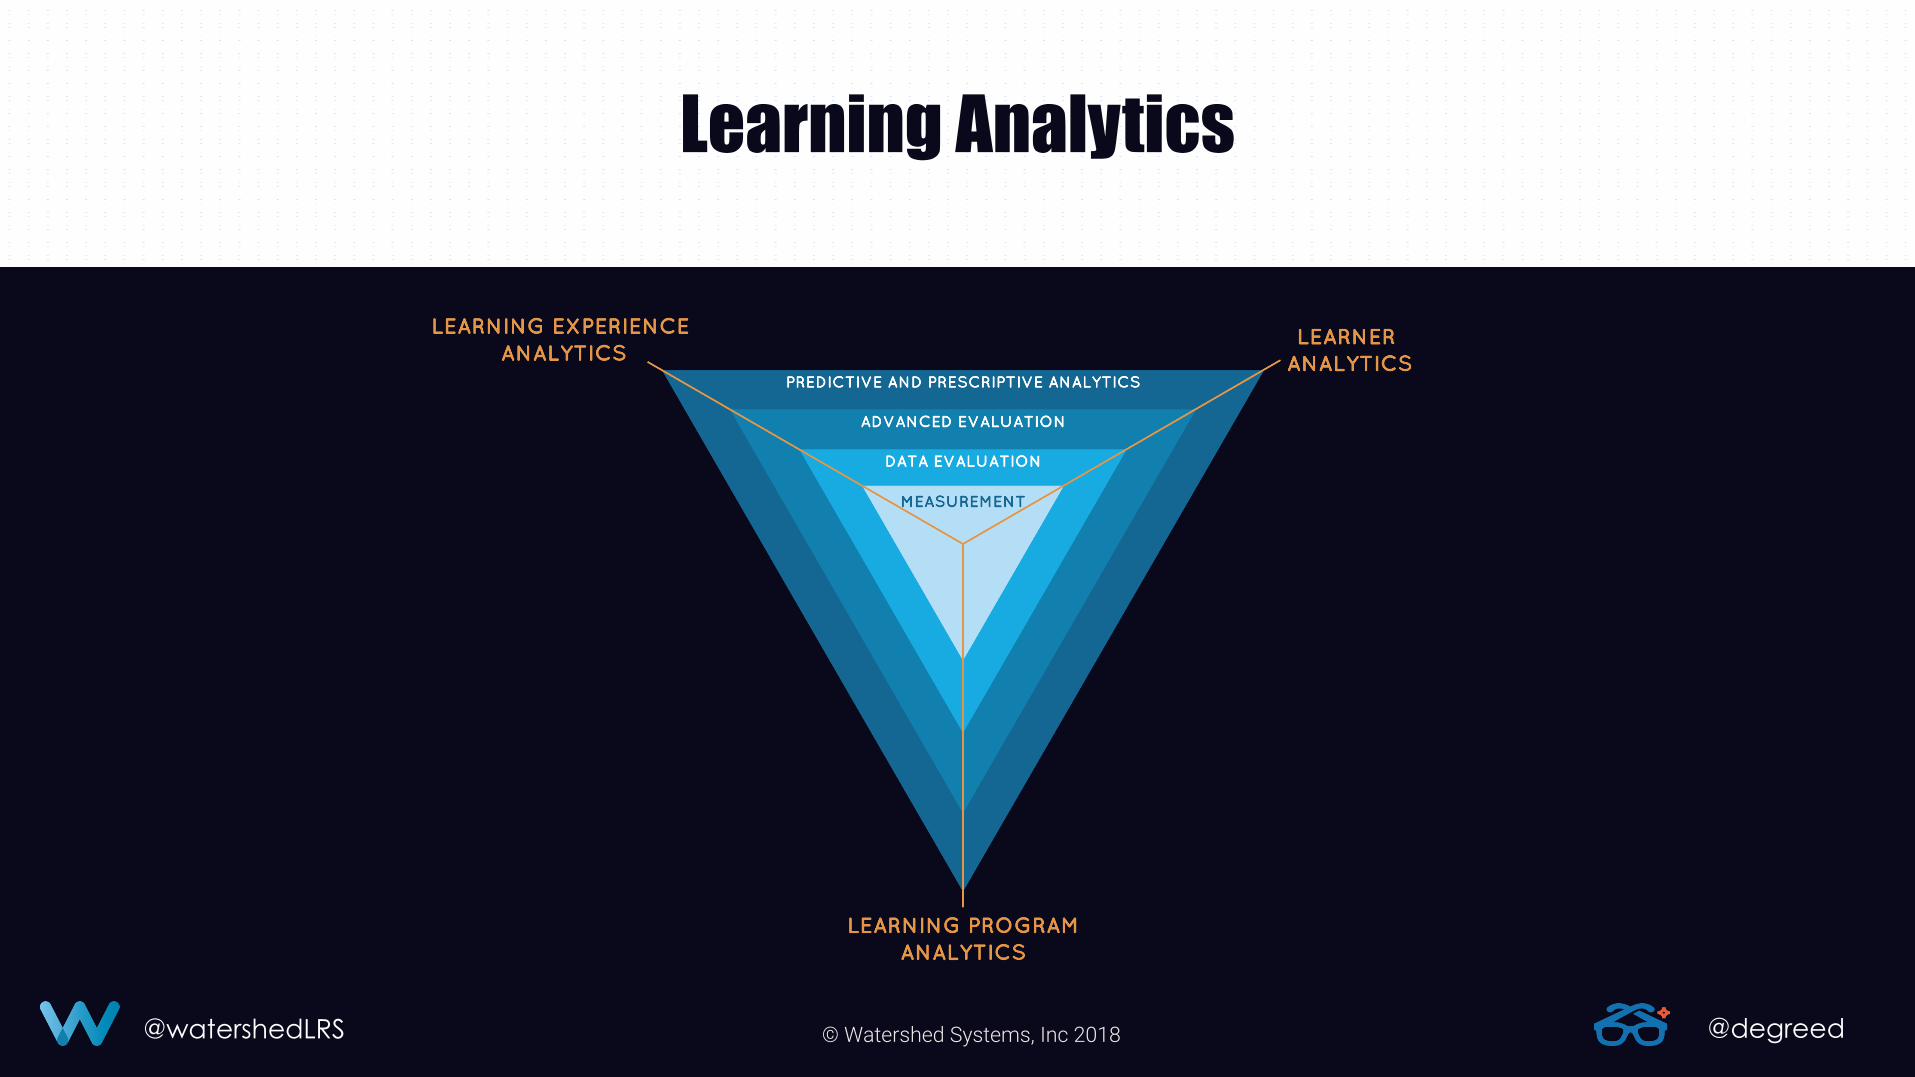
Learning Analytics
© Watershed Systems, Inc 2018
@watershedLRS @degreed
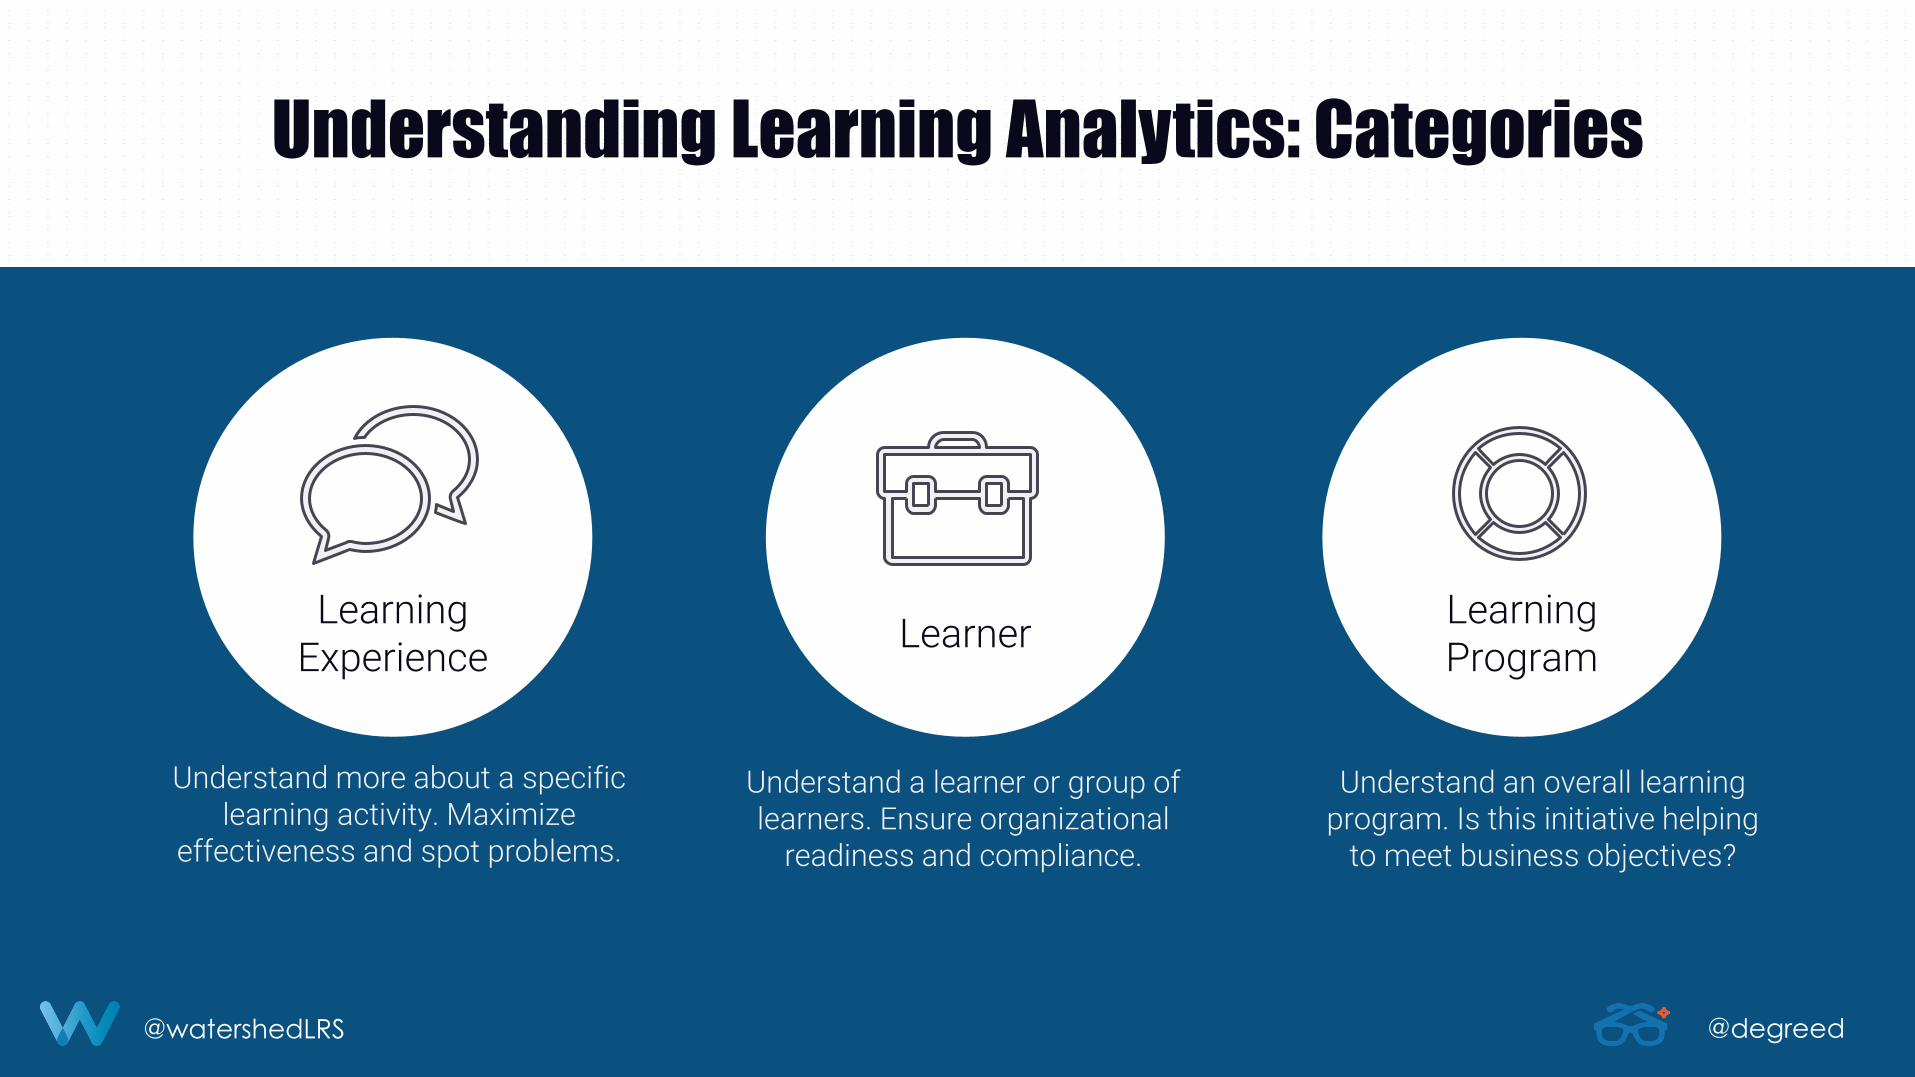
Understanding Learning Analytics: Categories
Understand an overall learning program. Is this initiative helping
to meet business objectives?
Understand a learner or group of learners. Ensure organizational
readiness and compliance.
Understand more about a specific learning activity. Maximize
effectiveness and spot problems.
Learning Experience
Learner
Learning Program
@watershedLRS @degreed
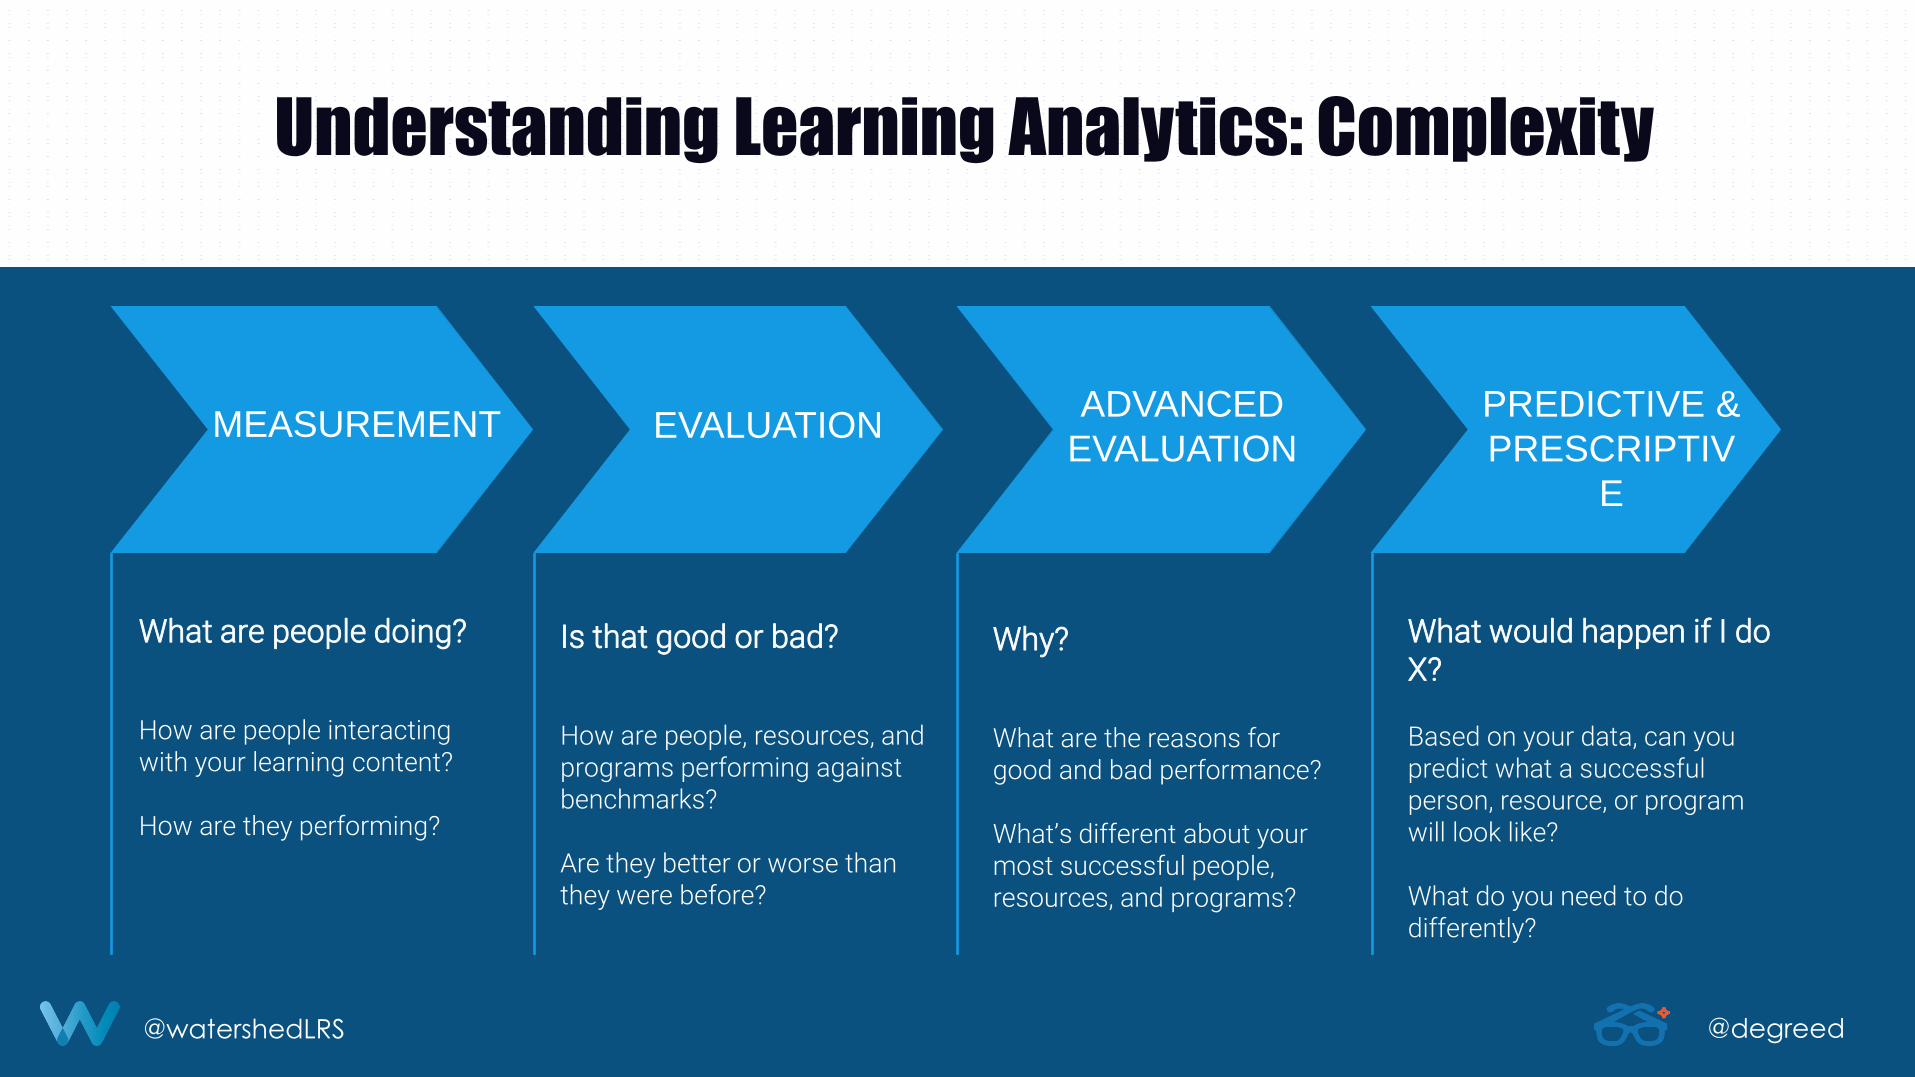
Understanding Learning Analytics: Complexity
MEASUREMENT
What are people doing? How are people interacting with your learning content? How are they performing?
EVALUATION
Is that good or bad? How are people, resources, and programs performing against benchmarks? Are they better or worse than they were before?
ADVANCED
EVALUATION
Why? What are the reasons for good and bad performance? What’s different about your most successful people, resources, and programs?
PREDICTIVE &
PRESCRIPTIV
E
What would happen if I do X? Based on your data, can you predict what a successful person, resource, or program will look like? What do you need to do differently?
@watershedLRS @degreed @watershedLRS @degreed
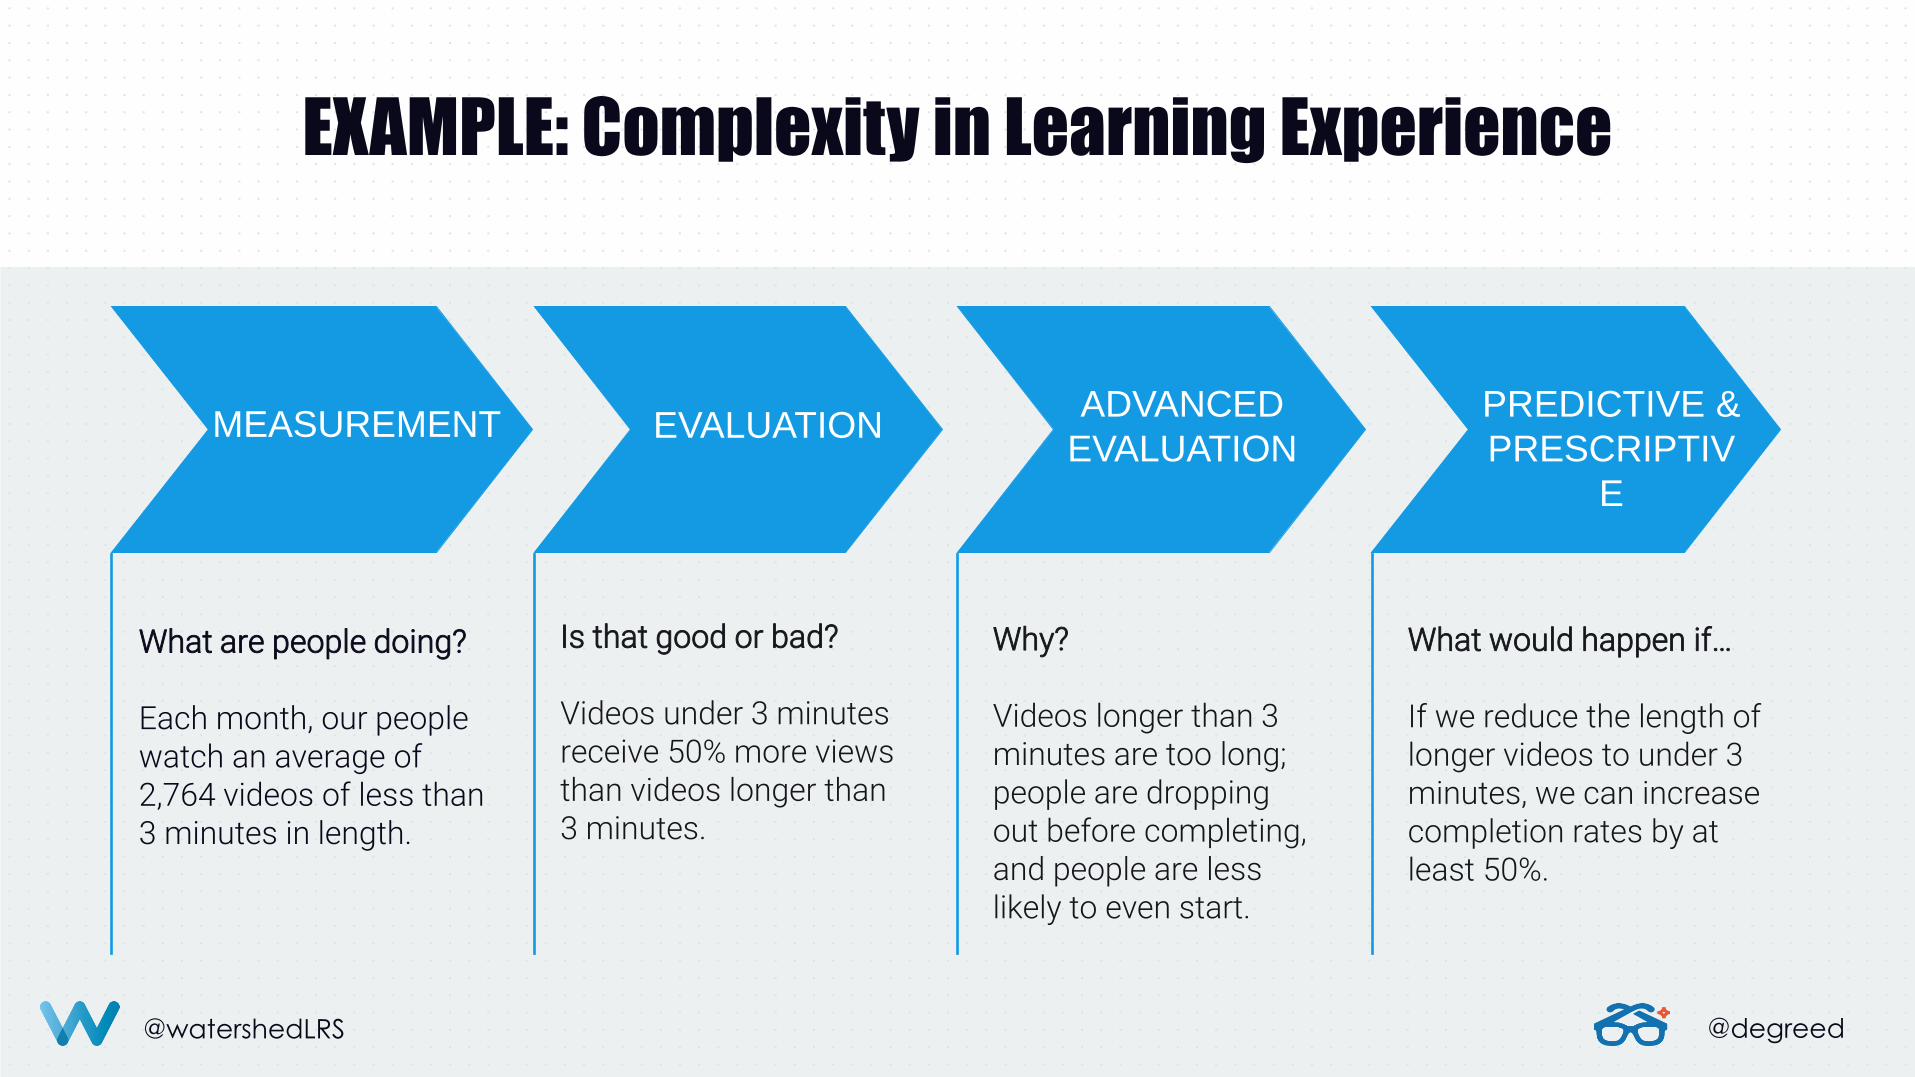
EXAMPLE: Complexity in Learning Experience
MEASUREMENT
What are people doing? Each month, our people watch an average of 2,764 videos of less than 3 minutes in length.
EVALUATION
Is that good or bad? Videos under 3 minutes receive 50% more views than videos longer than 3 minutes.
ADVANCED
EVALUATION
Why? Videos longer than 3 minutes are too long; people are dropping out before completing, and people are less likely to even start.
PREDICTIVE &
PRESCRIPTIV
E
What would happen if… If we reduce the length of longer videos to under 3 minutes, we can increase completion rates by at least 50%.
@watershedLRS @degreed
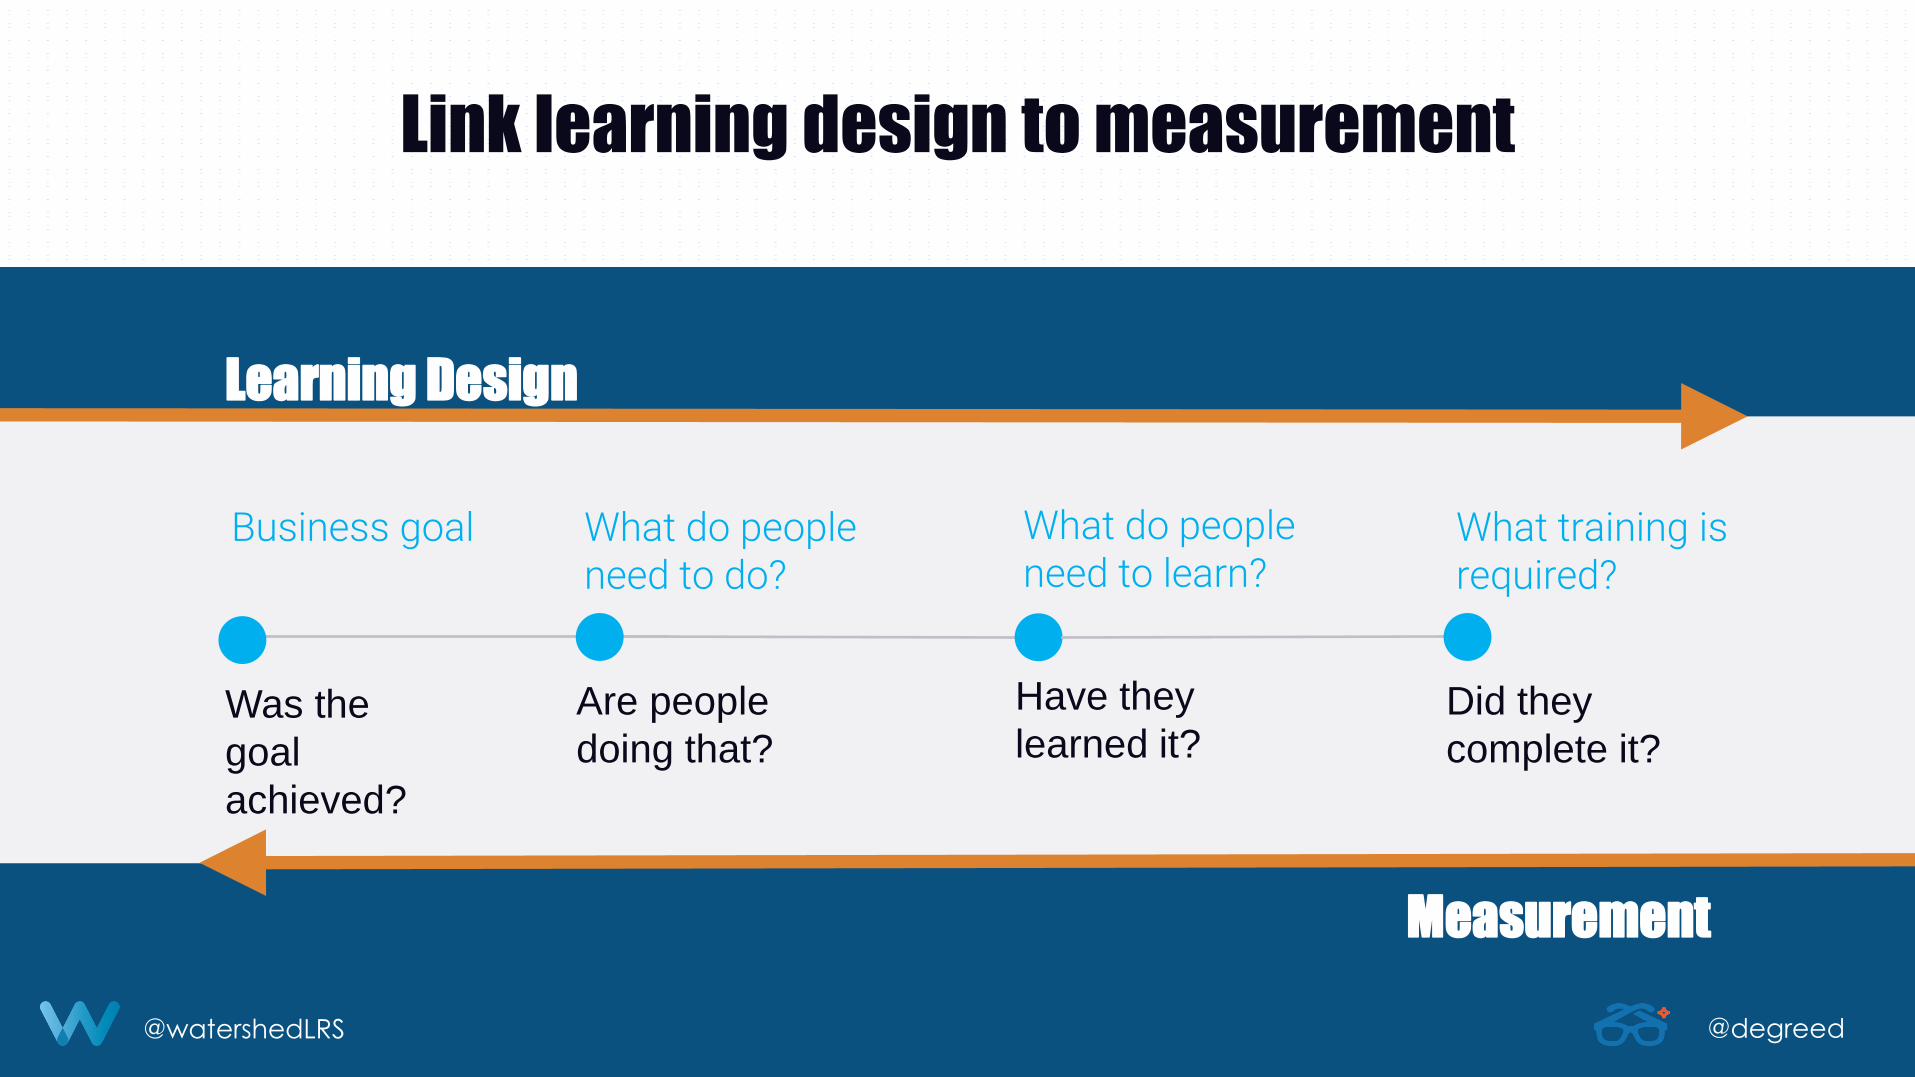
Link learning design to measurement
Have they
learned it?
What do people need to learn?
Are people
doing that?
What do people need to do?
Did they
complete it?
What training is required?
Was the
goal
achieved?
Business goal
Learning Design
Measurement
@watershedLRS @degreed
What’s it look like in the real world?
@watershedLRS @degreed
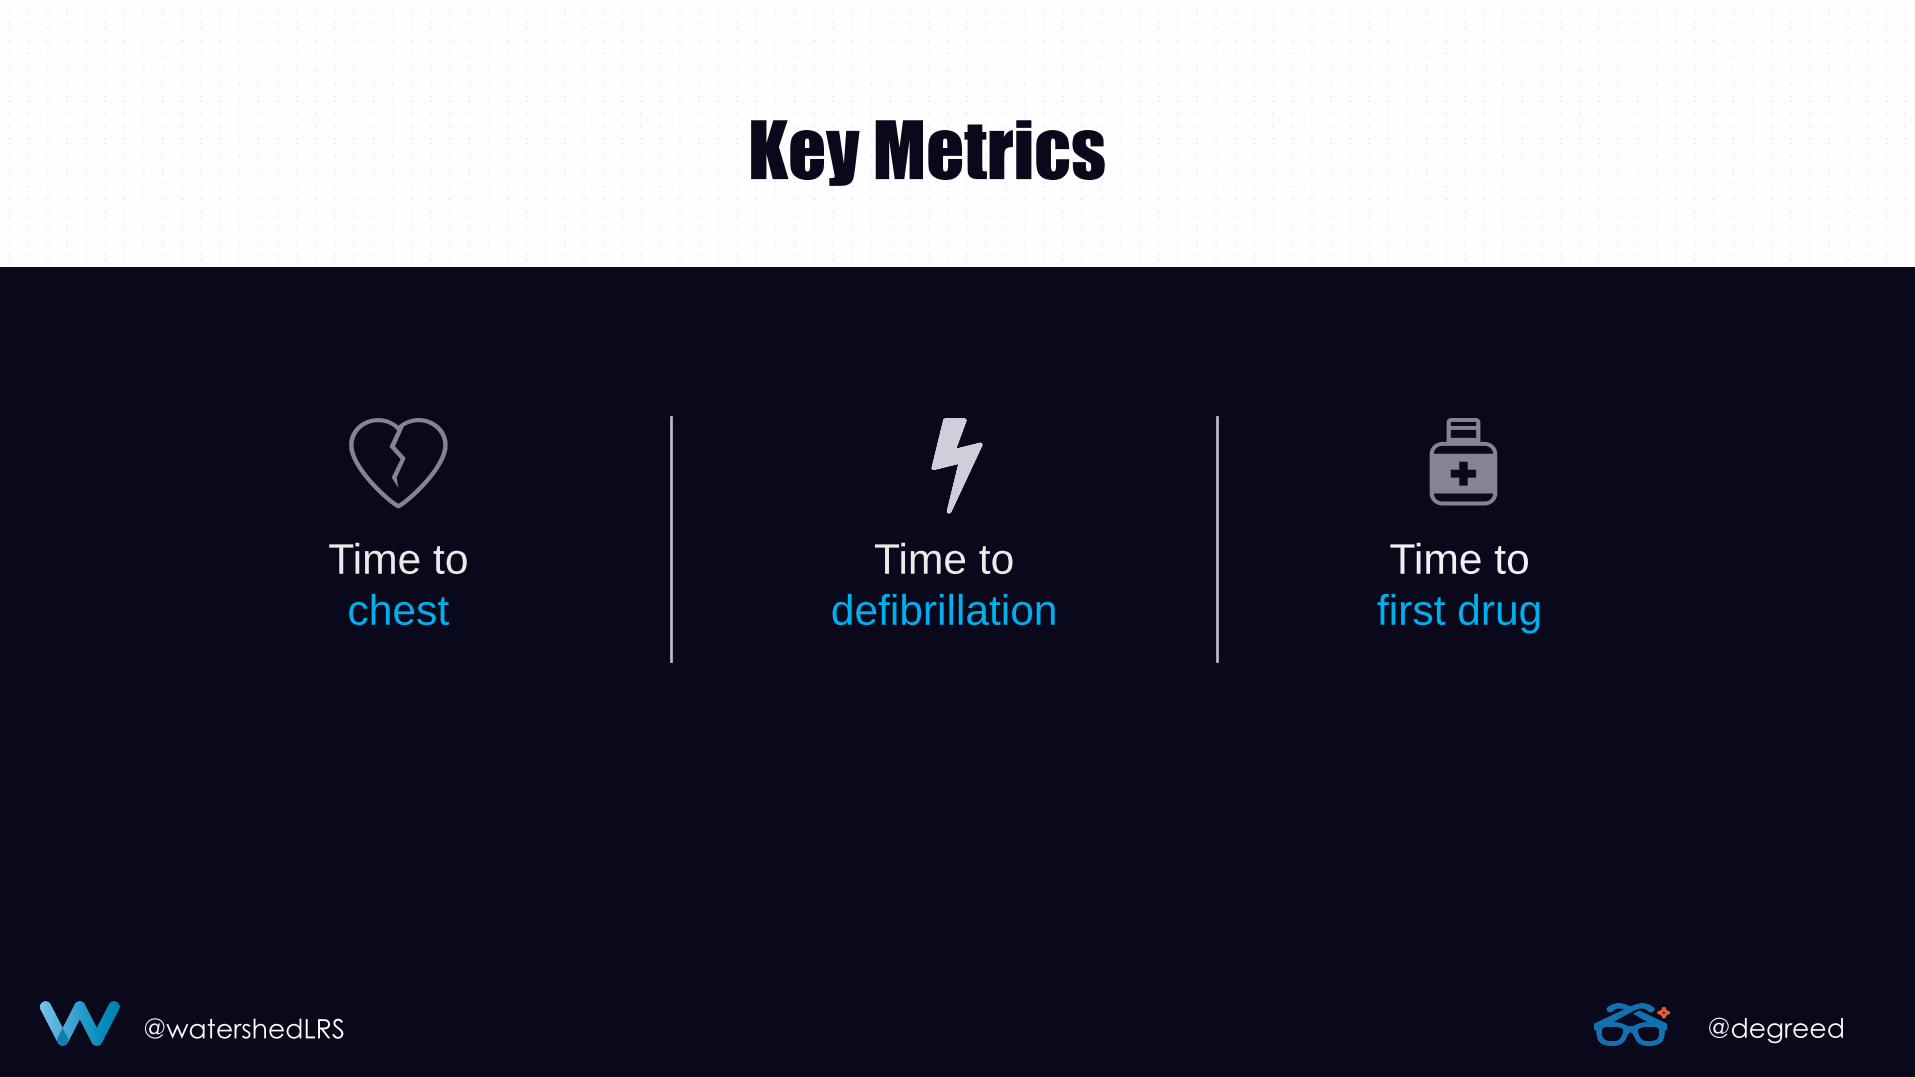
Key Metrics
Time to
first drug
Time to
defibrillation
Time to
chest
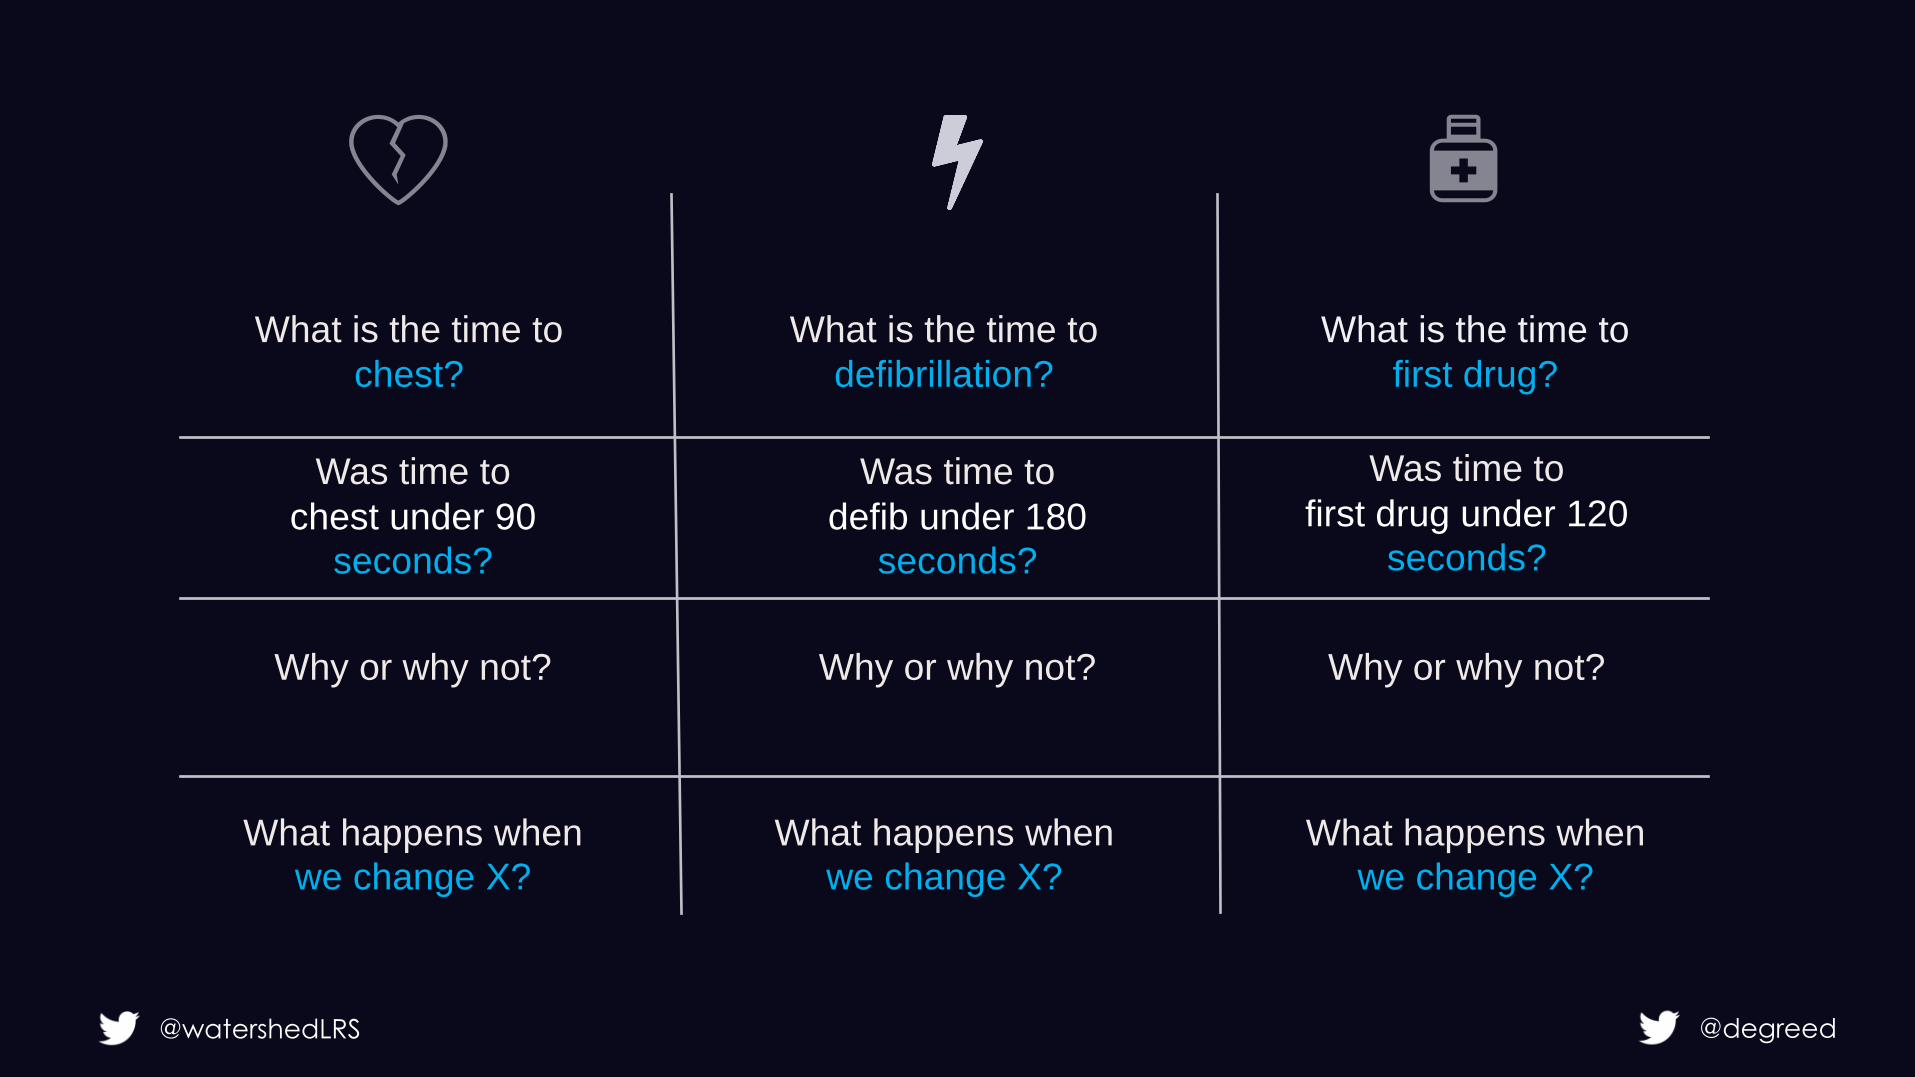
What is the time to first drug?
What is the time to defibrillation?
What is the time to chest?
Was time to chest under 90
seconds?
Why or why not?
What happens when
we change X?
Why or why not? Why or why not?
What happens when
we change X? What happens when
we change X?
Was time to defib under 180
seconds?
Was time to first drug under 120
seconds?
@watershedLRS @degreed
@watershedLRS @degreed
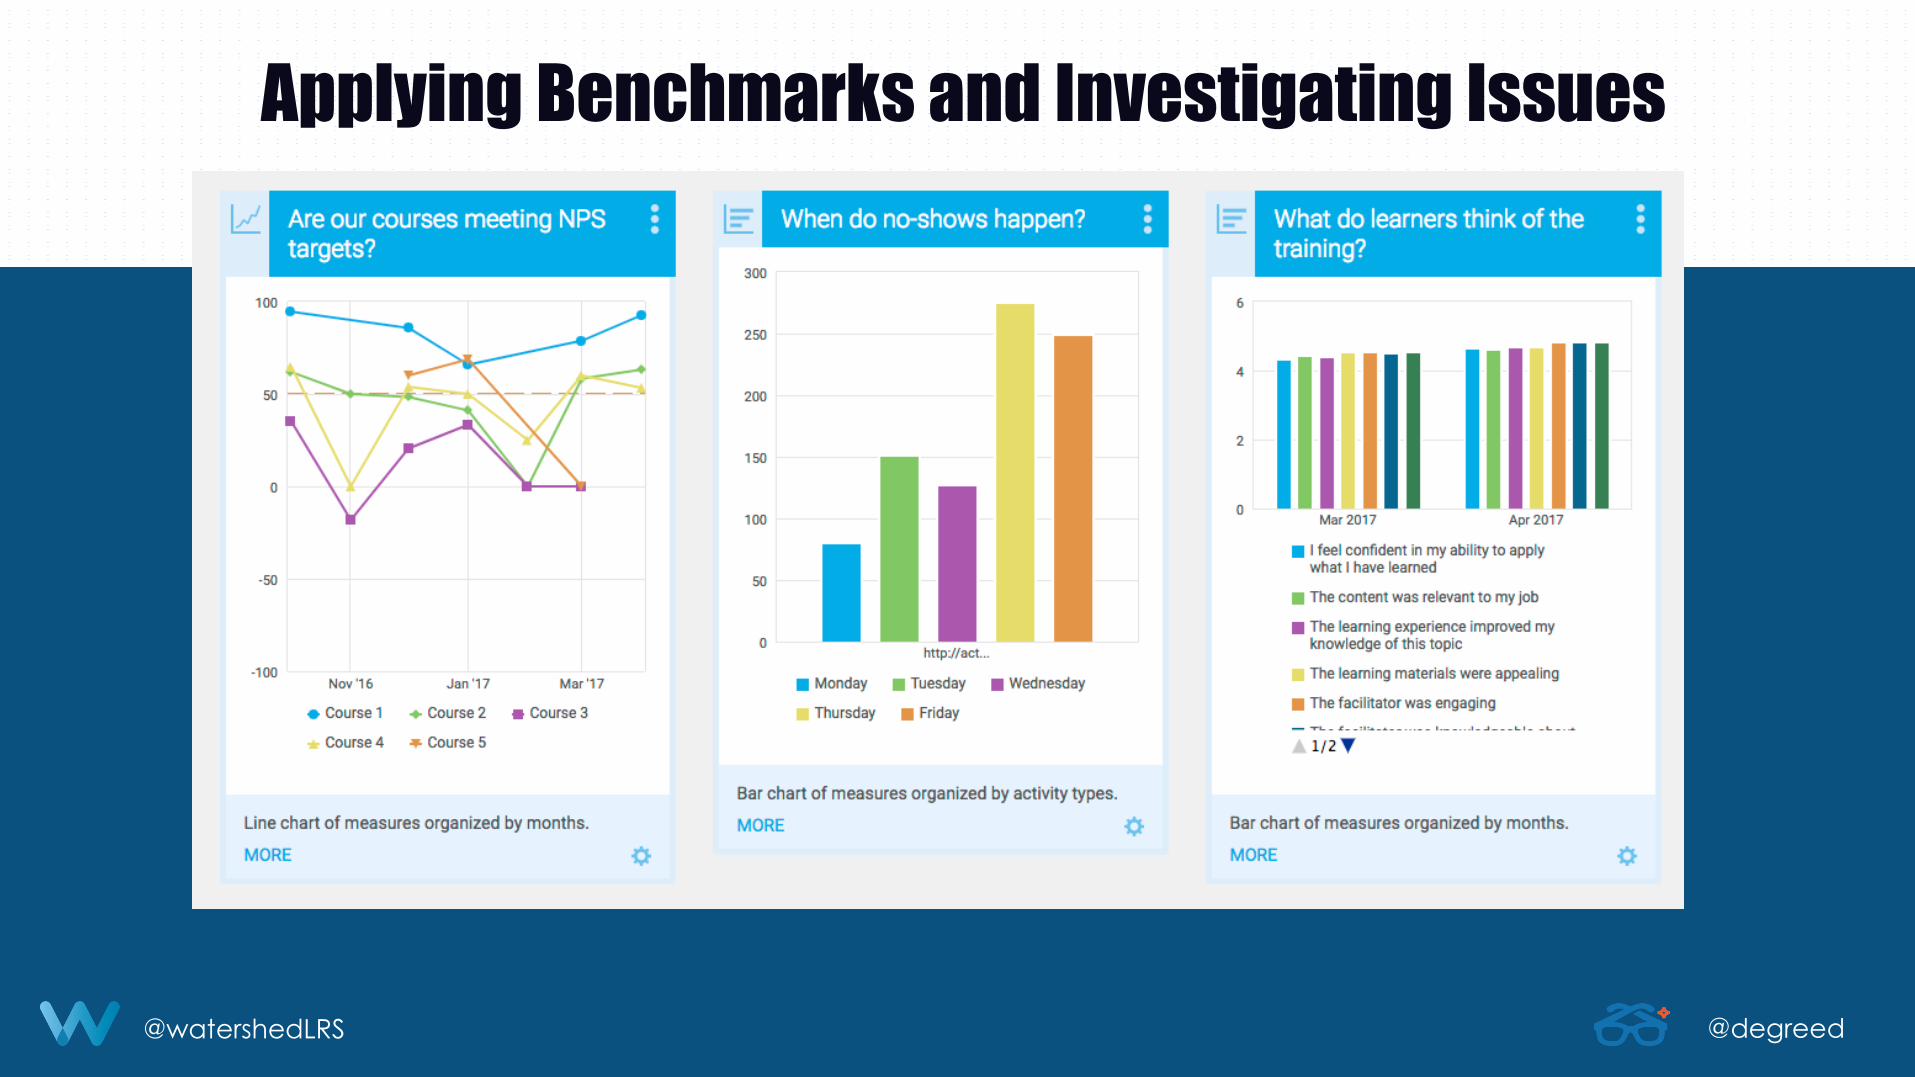
Applying Benchmarks and Investigating Issues
@watershedLRS @degreed @watershedLRS @degreed
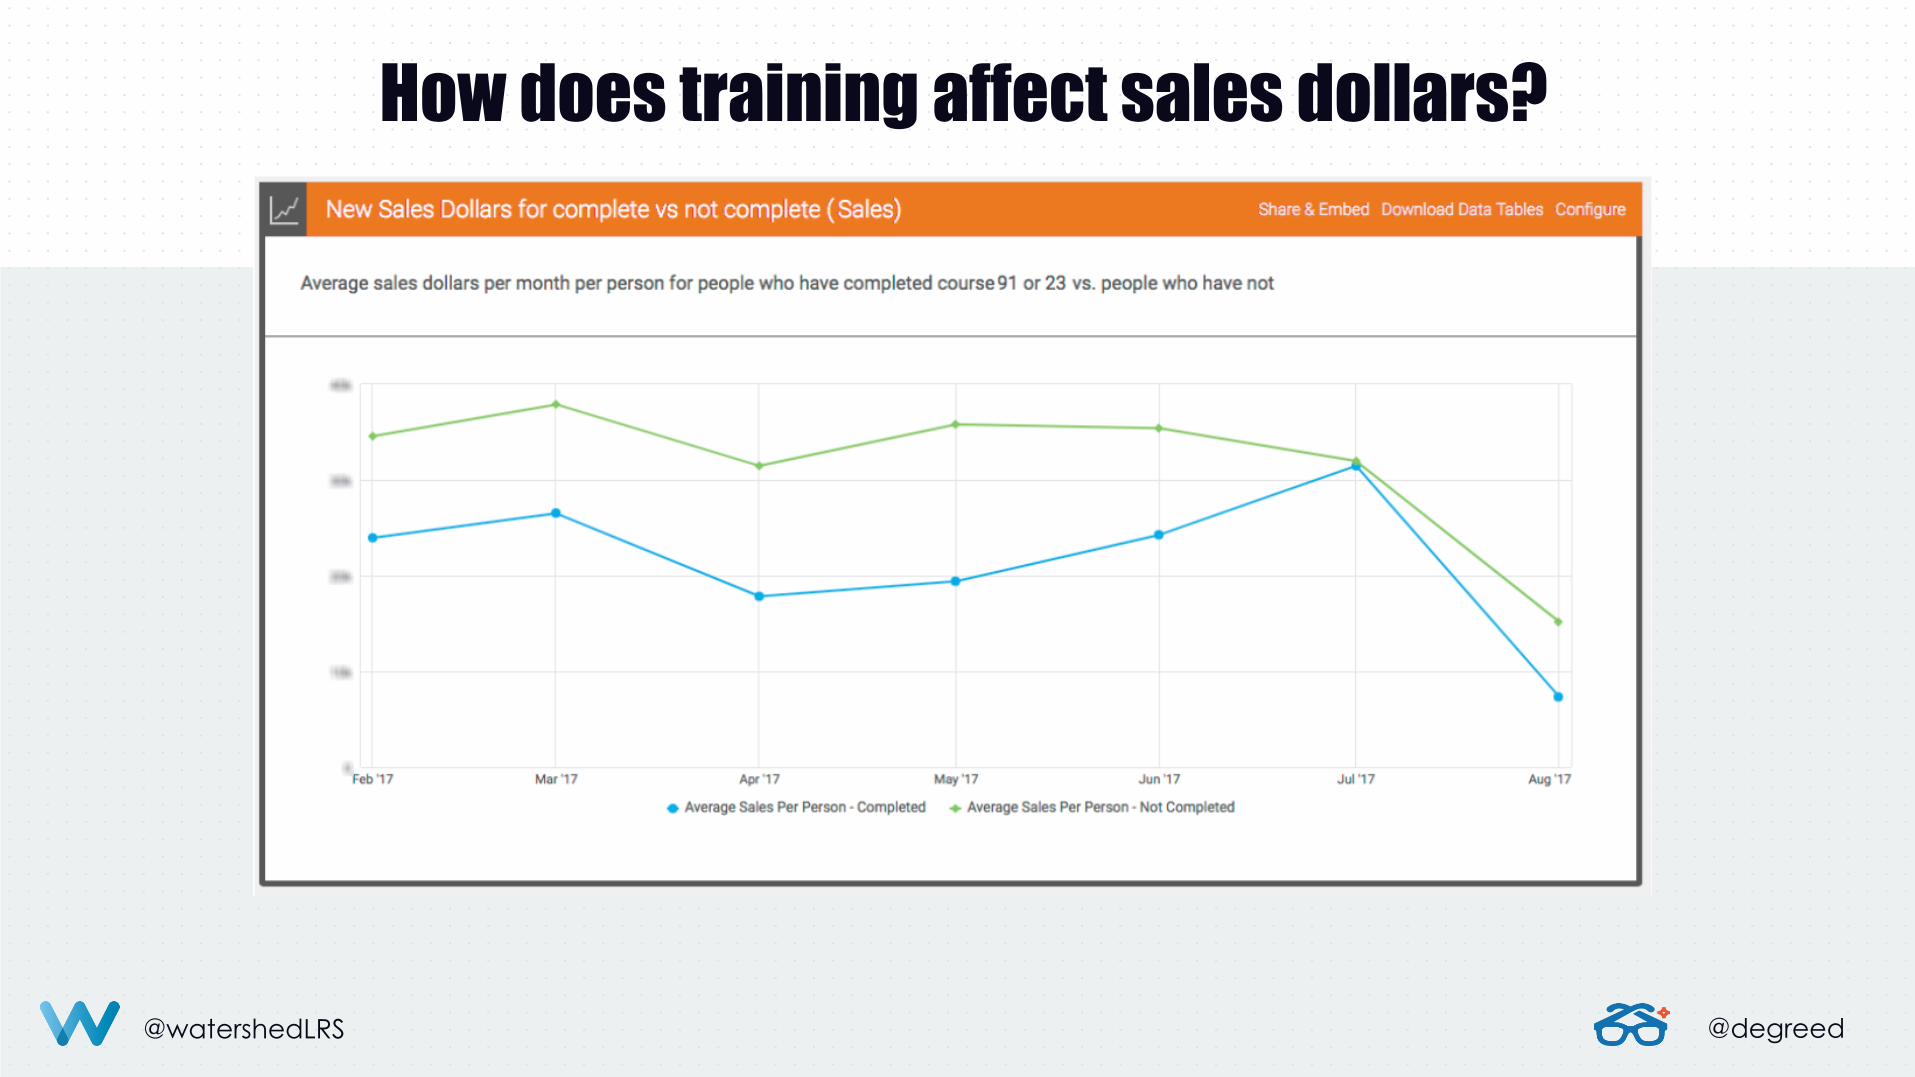
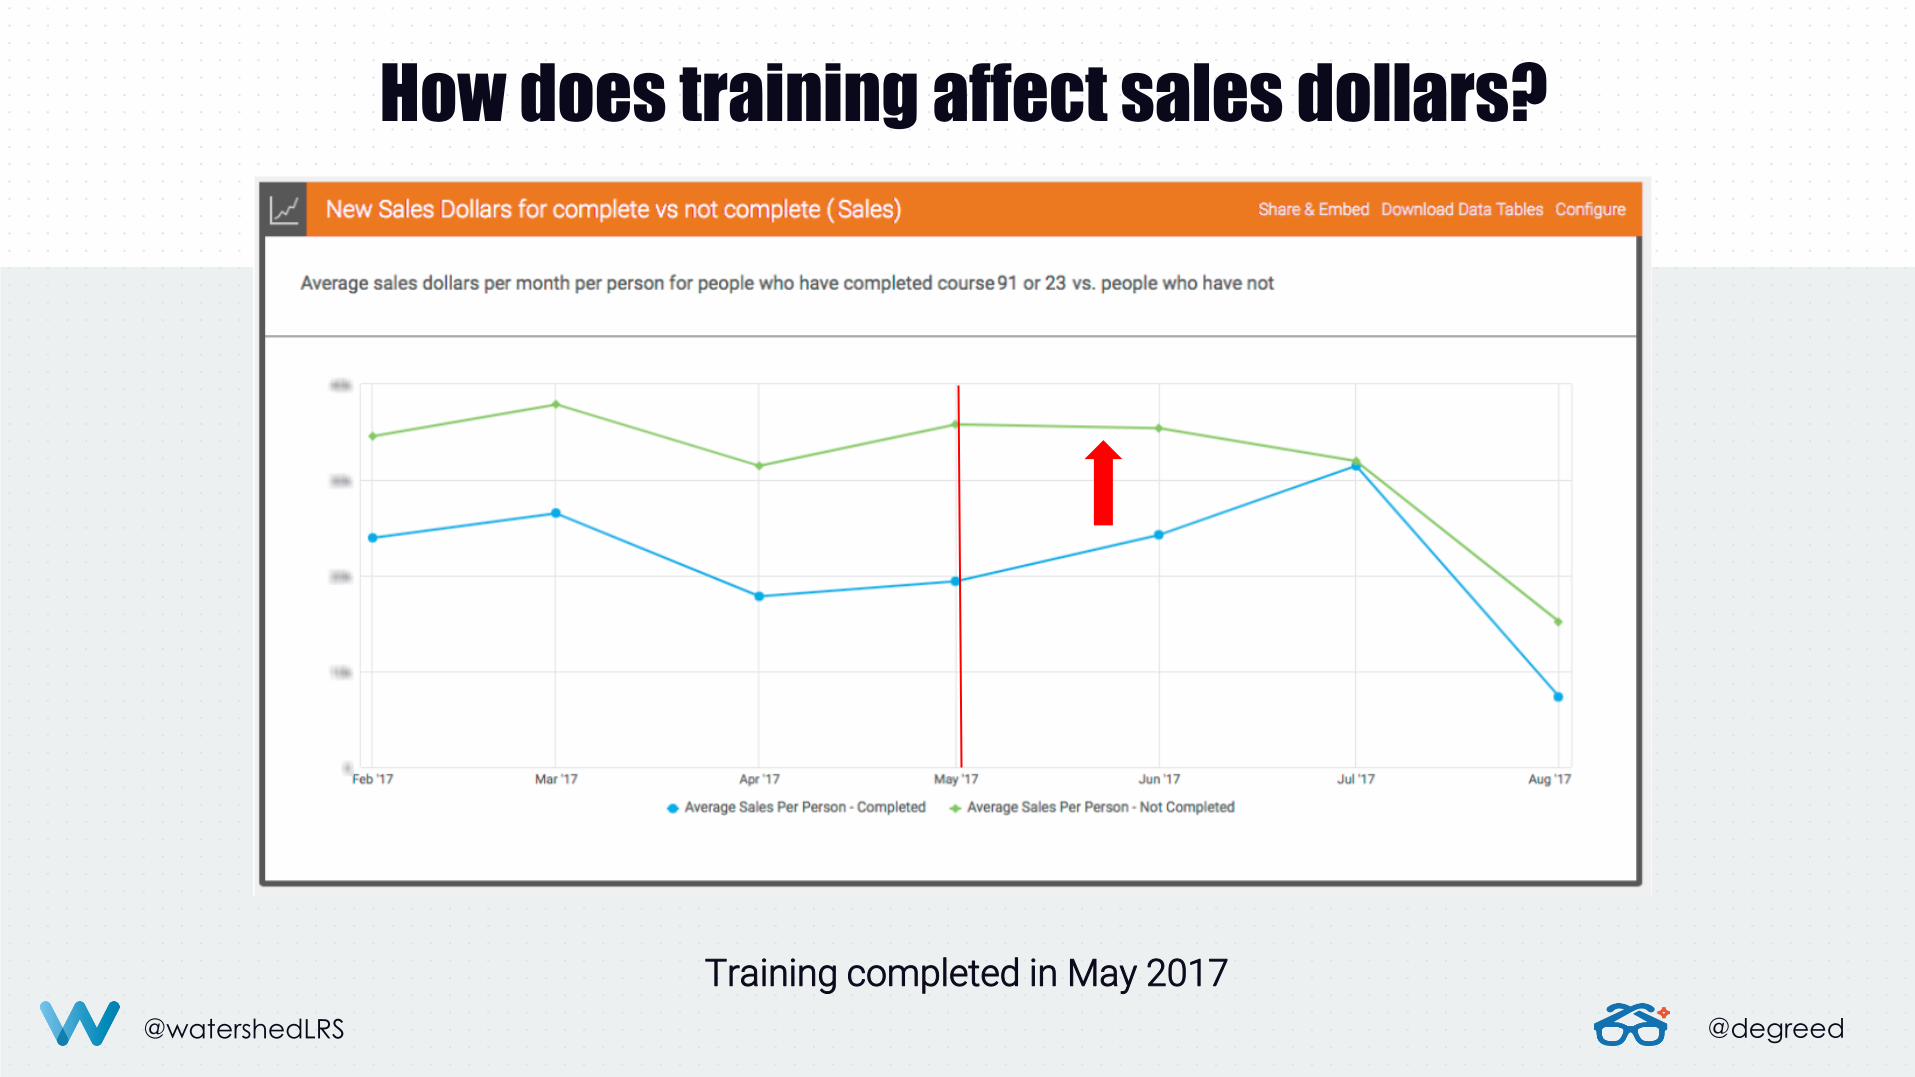
How does training affect sales dollars?
@watershedLRS @degreed @watershedLRS @degreed
Training completed in May 2017
How does training affect sales dollars?
@watershedLRS @degreed
Your turn. Tips and tricks to use data.
@watershedLRS @degreed
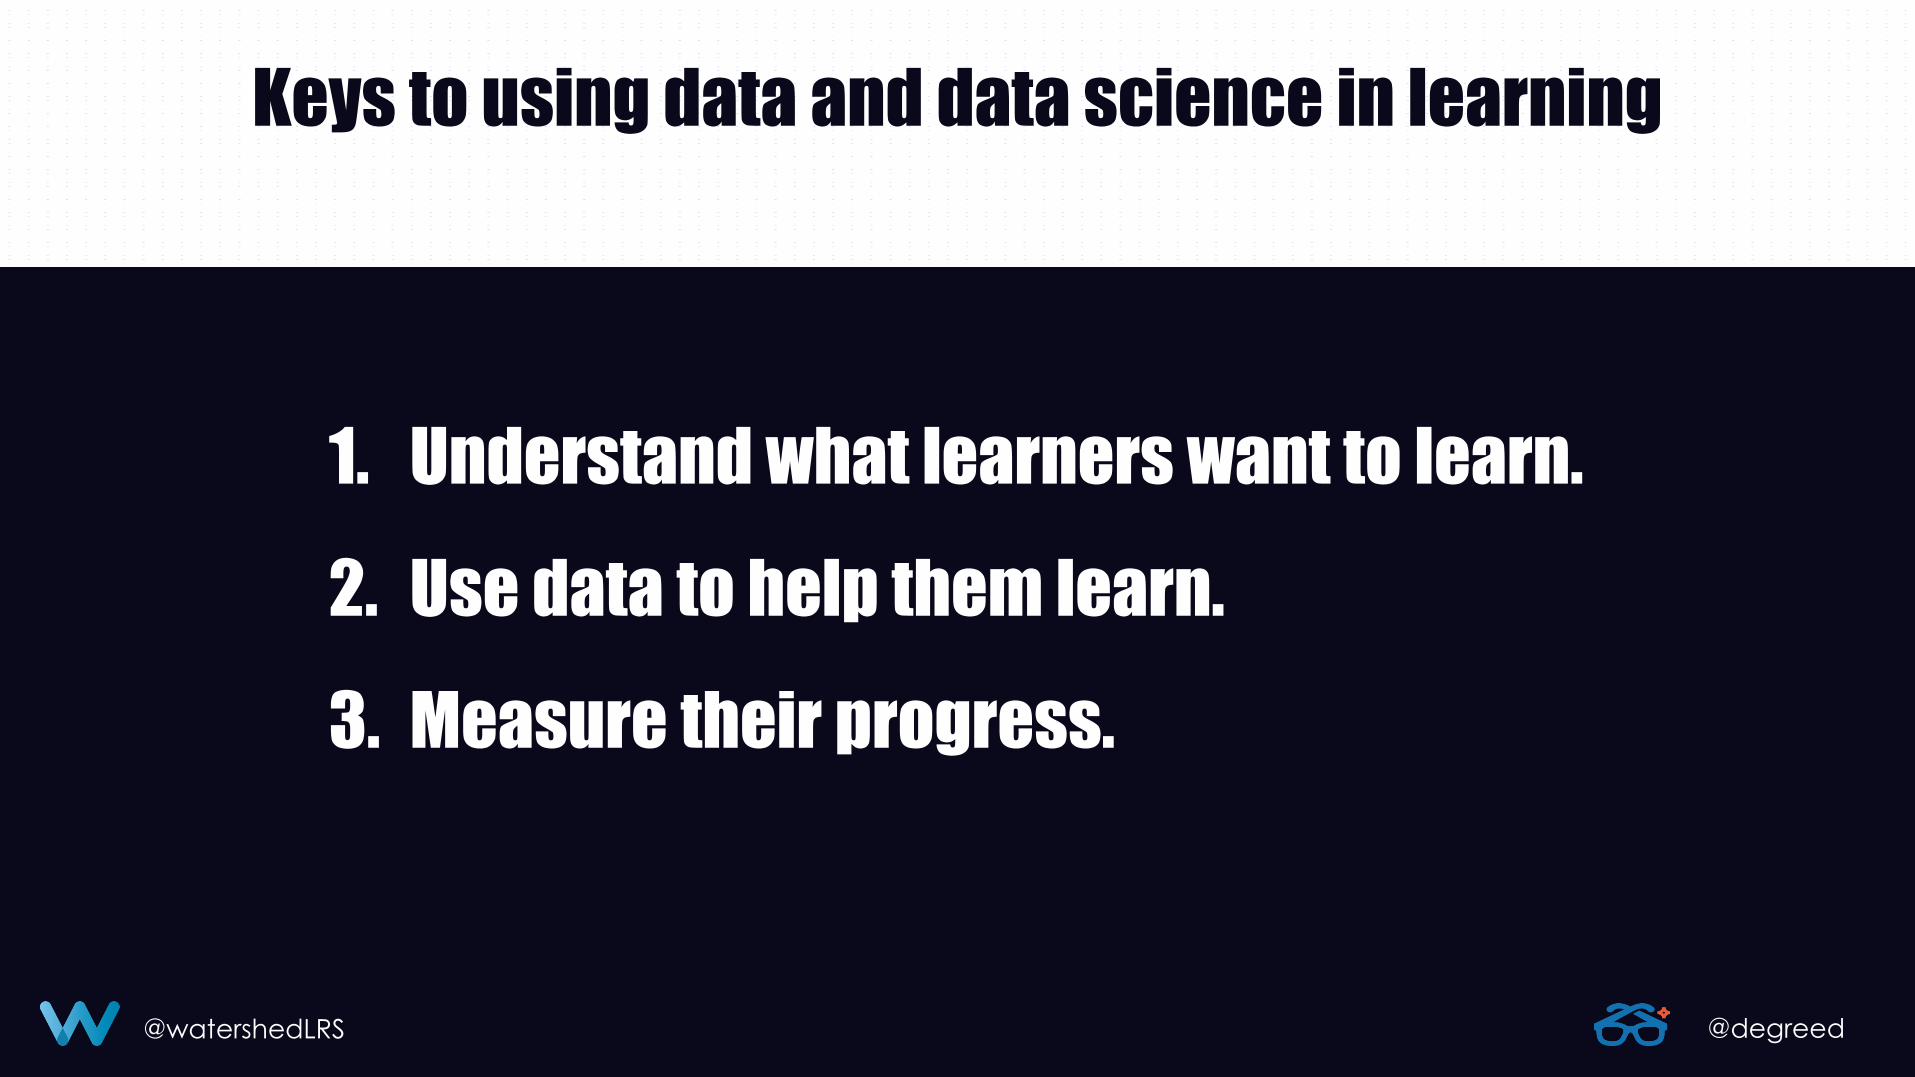
Keys to using data and data science in learning
1. Understand what learners want to learn.
2. Use data to help them learn.
3. Measure their progress.
@watershedLRS @degreed
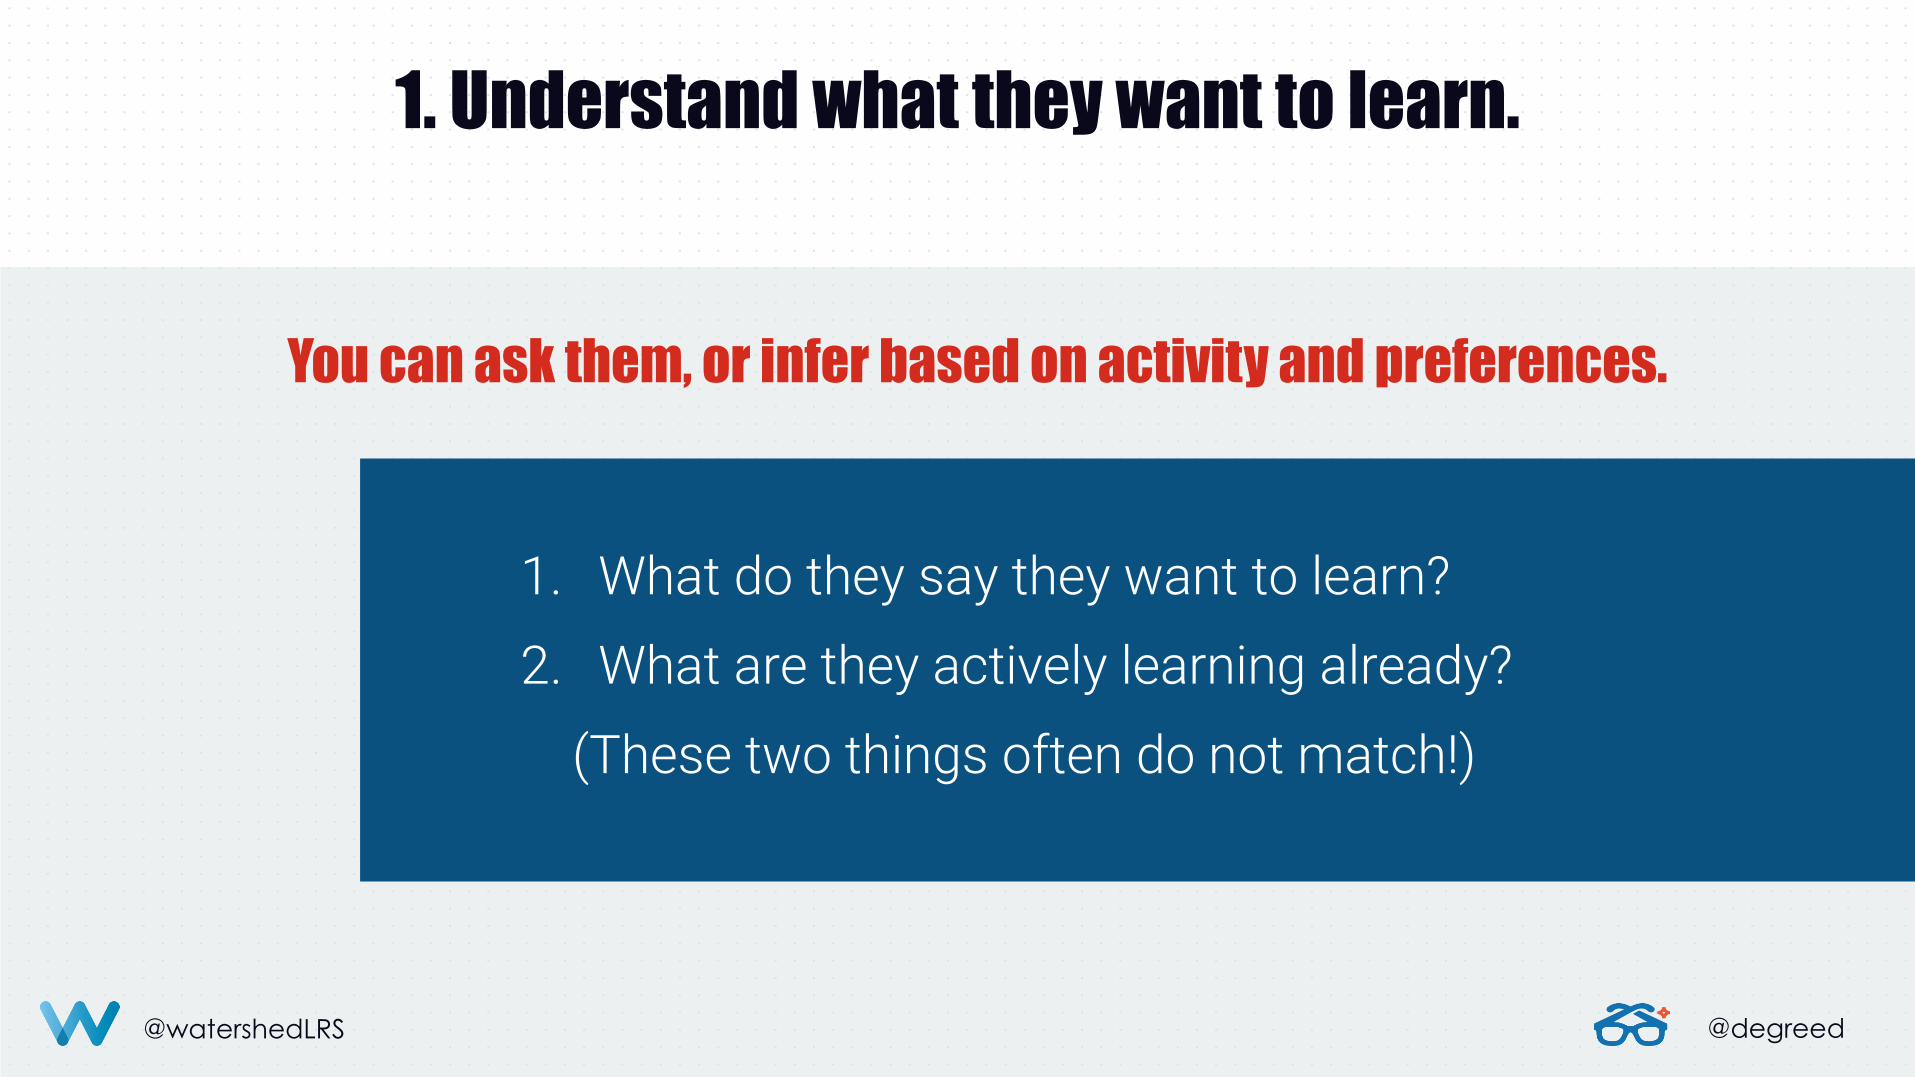
1. Understand what they want to learn.
You can ask them, or infer based on activity and preferences.
1. What do they say they want to learn?
2. What are they actively learning already?
(These two things often do not match!)
@watershedLRS @degreed @watershedLRS @degreed
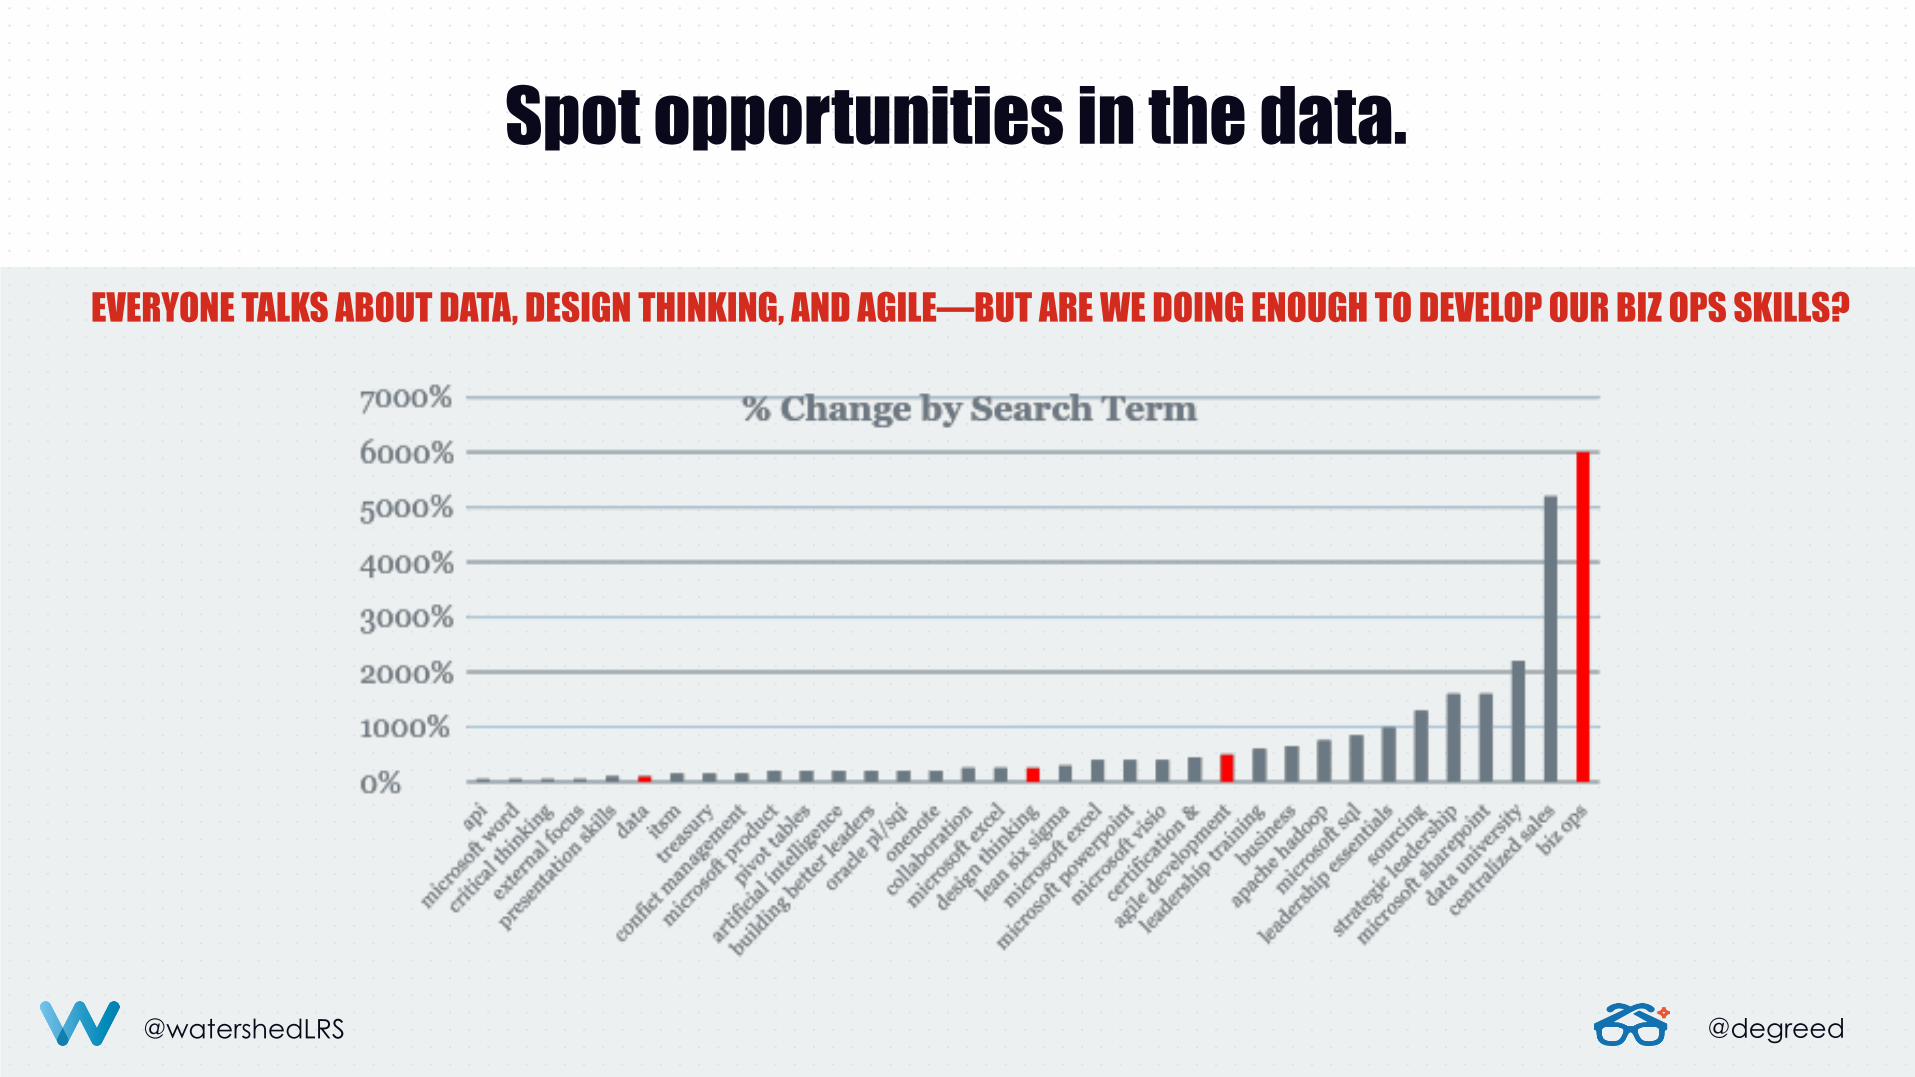
Spot opportunities in the data.
EVERYONE TALKS ABOUT DATA, DESIGN THINKING, AND AGILE—BUT ARE WE DOING ENOUGH TO DEVELOP OUR BIZ OPS SKILLS?
@watershedLRS @degreed
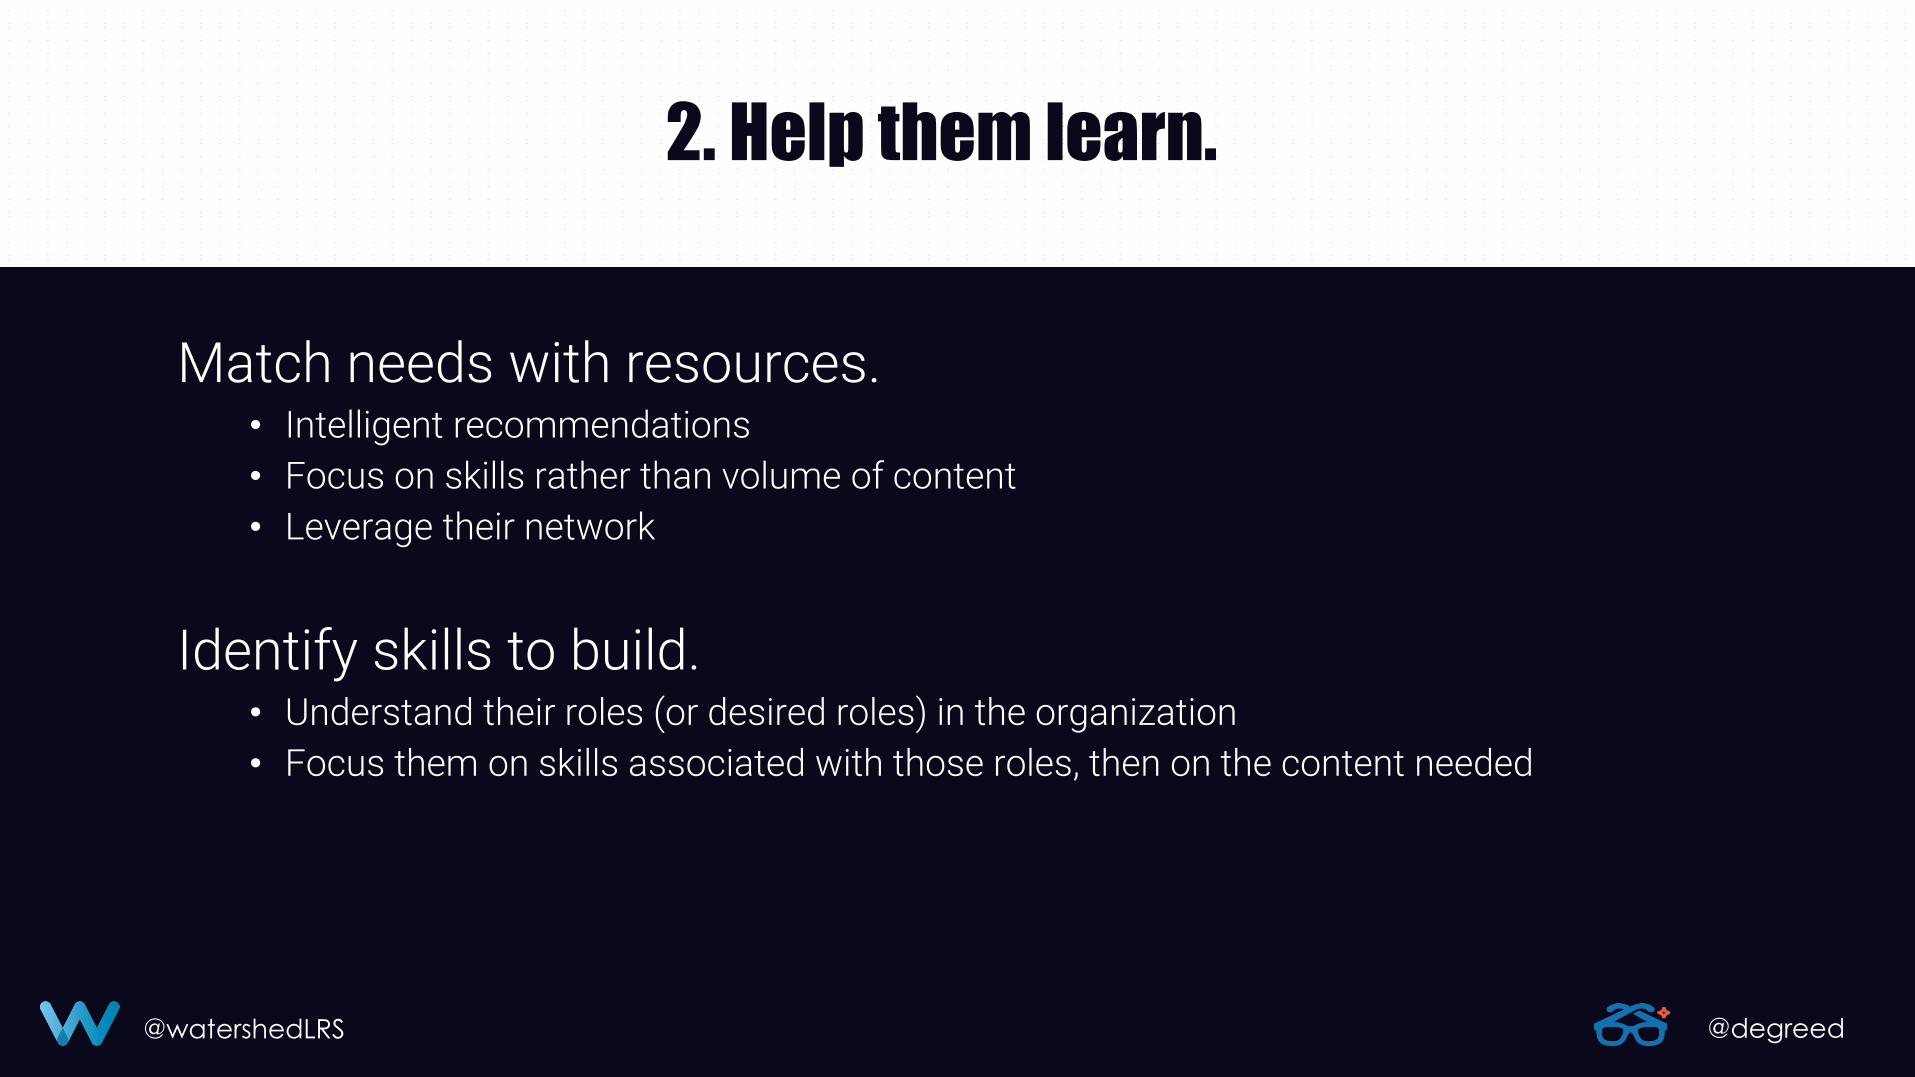
2. Help them learn.
Match needs with resources. • Intelligent recommendations
• Focus on skills rather than volume of content
• Leverage their network
Identify skills to build. • Understand their roles (or desired roles) in the organization
• Focus them on skills associated with those roles, then on the content needed
@watershedLRS @degreed @watershedLRS @degreed
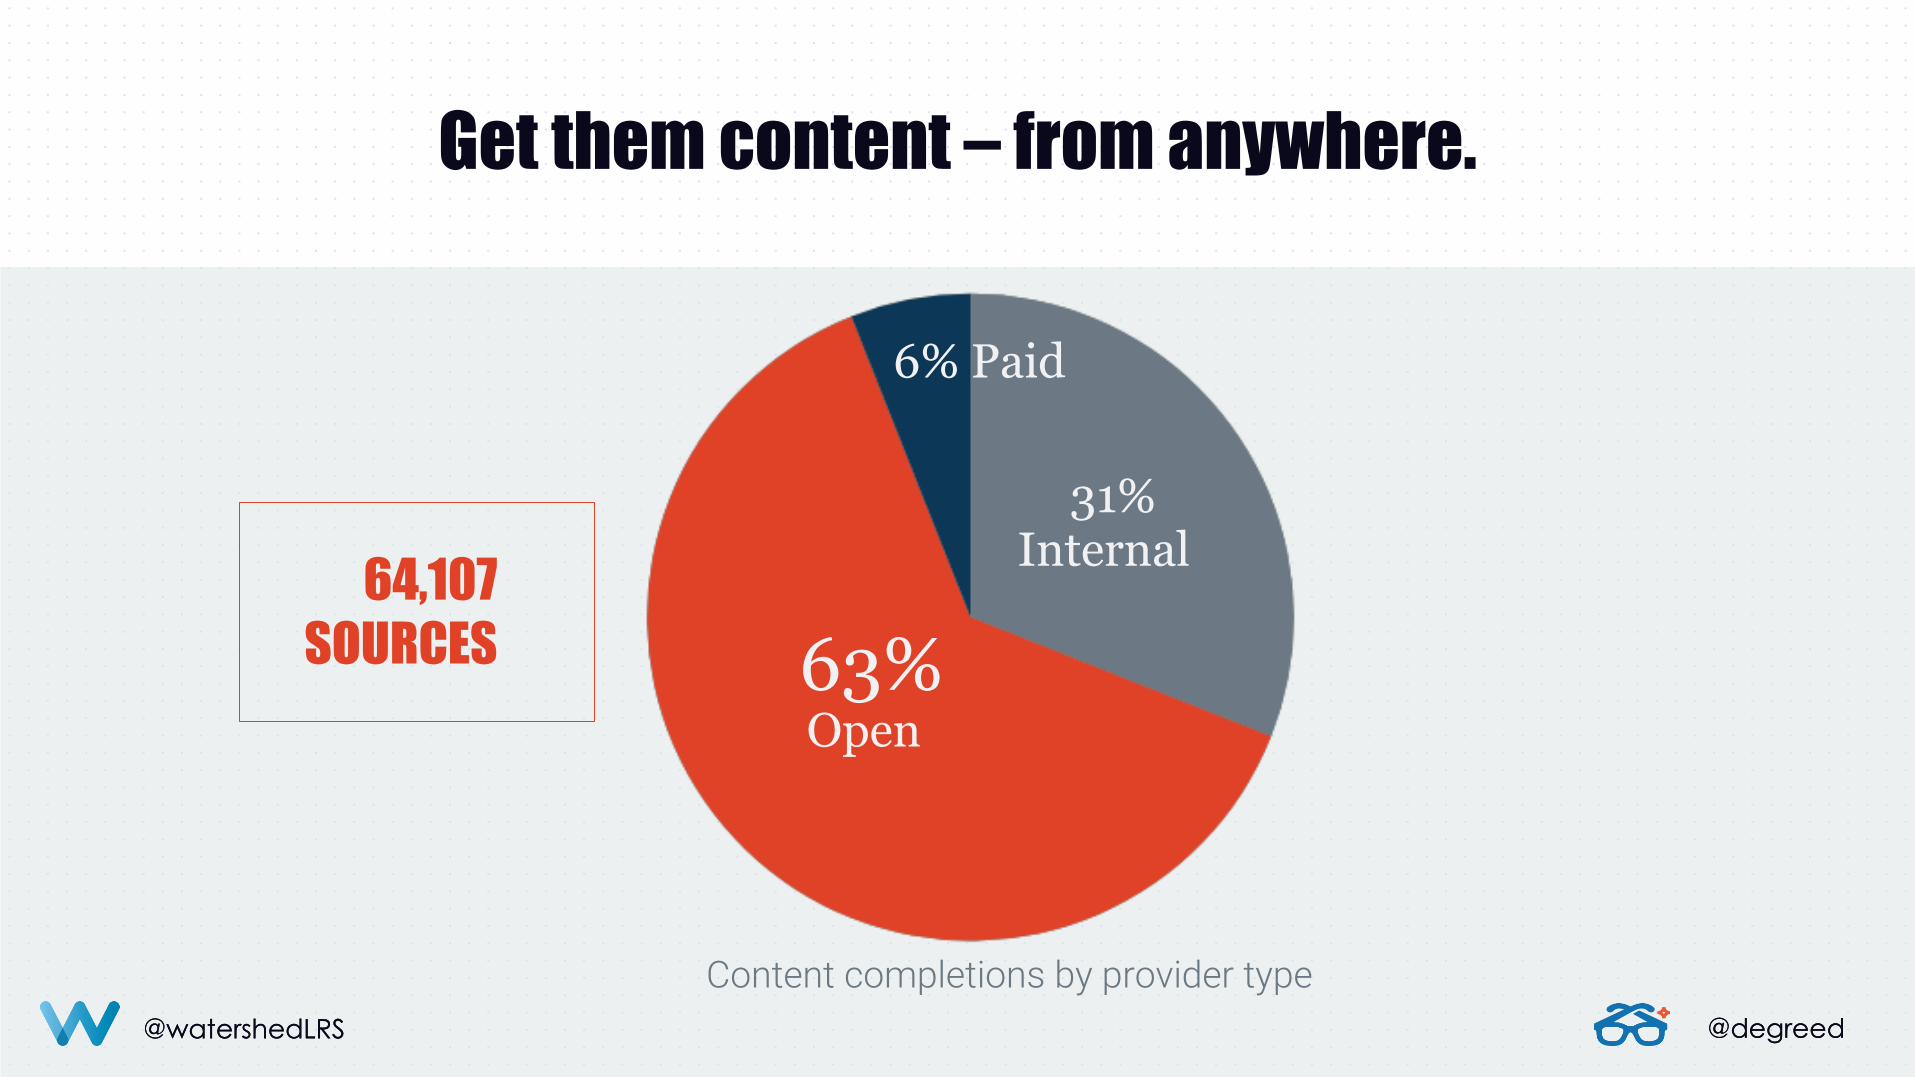
Get them content – from anywhere.
Content completions by provider type
64,107
SOURCES 63%
31%
6% Paid
Internal
Open
@watershedLRS @degreed
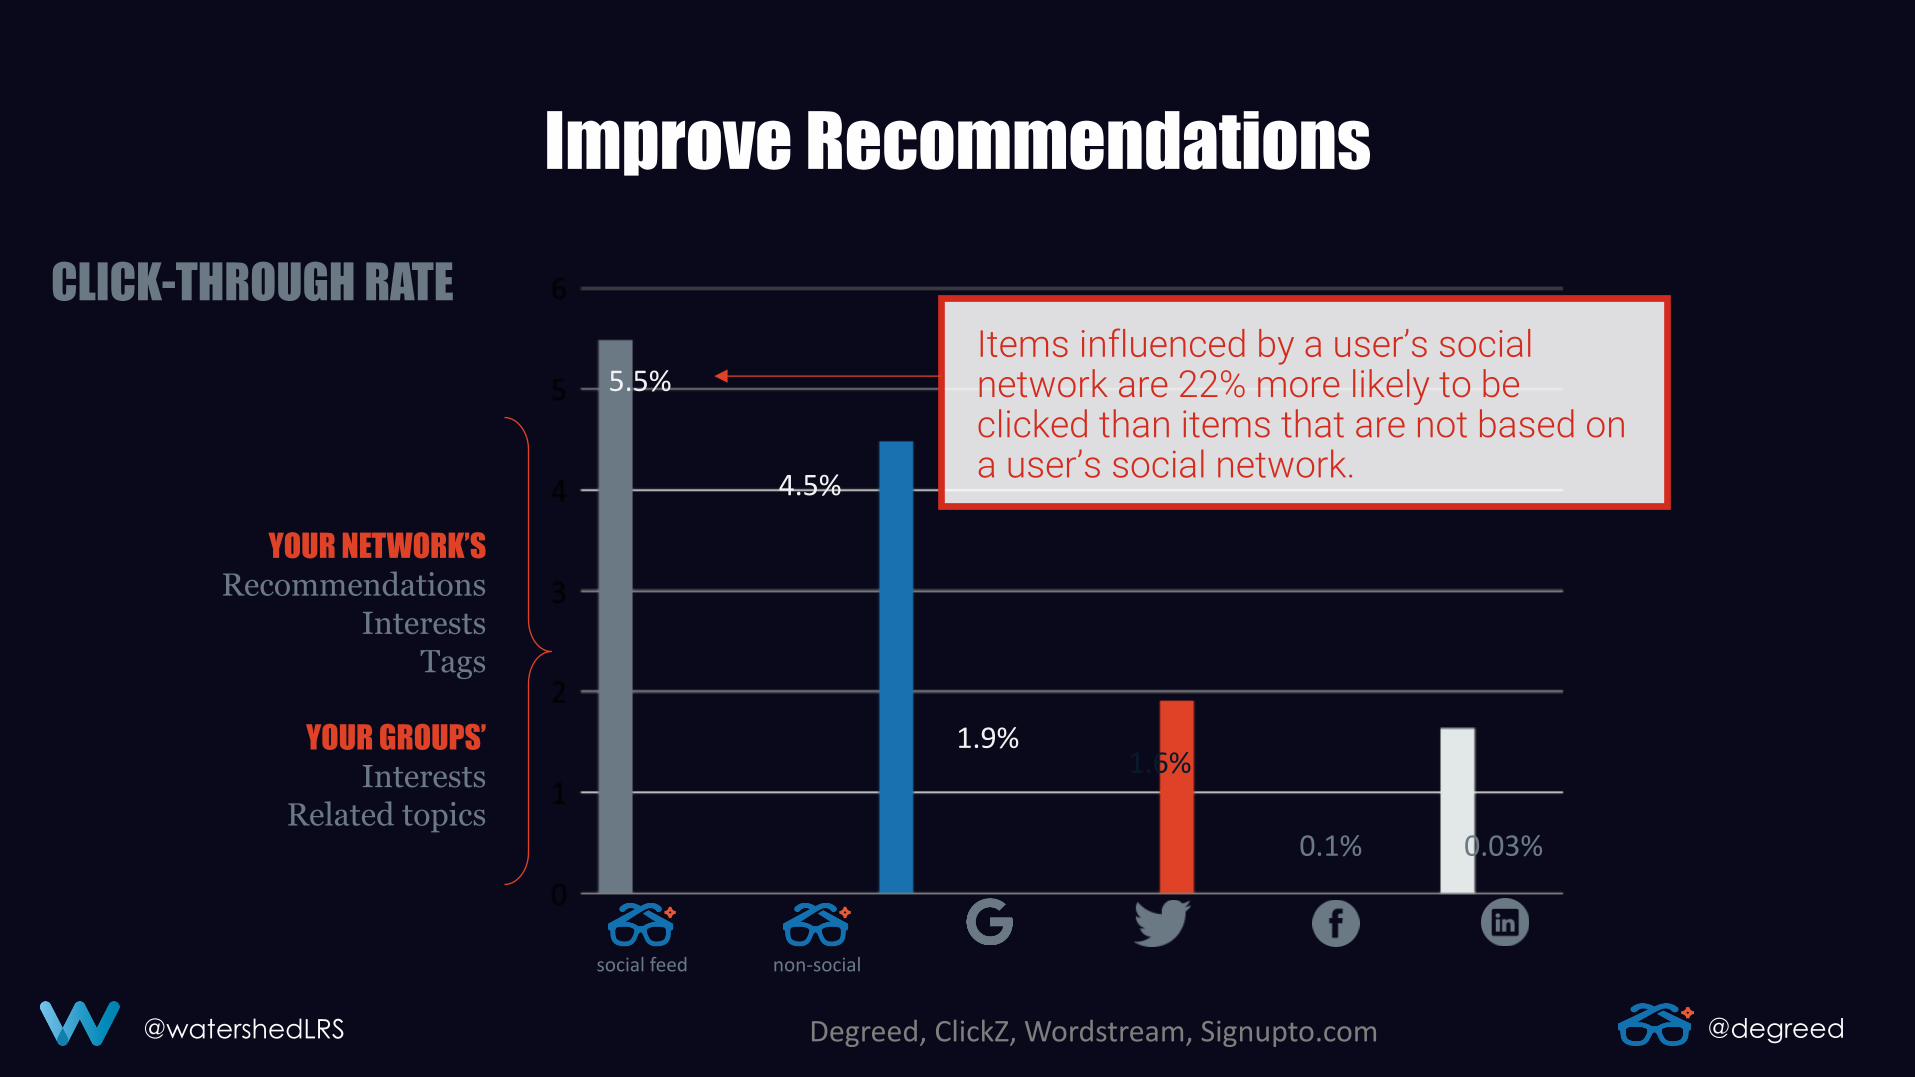
Improve Recommendations
Items influenced by a user’s social network are 22% more likely to be clicked than items that are not based on a user’s social network.
YOUR NETWORK’S
Recommendations Interests
Tags
YOUR GROUPS’
Interests Related topics
Degreed, ClickZ, Wordstream, Signupto.com
social feed non-social
5.5%
4.5%
1.9% 1.6%
0.1% 0.03%
CLICK-THROUGH RATE
@watershedLRS @degreed
@watershedLRS @degreed
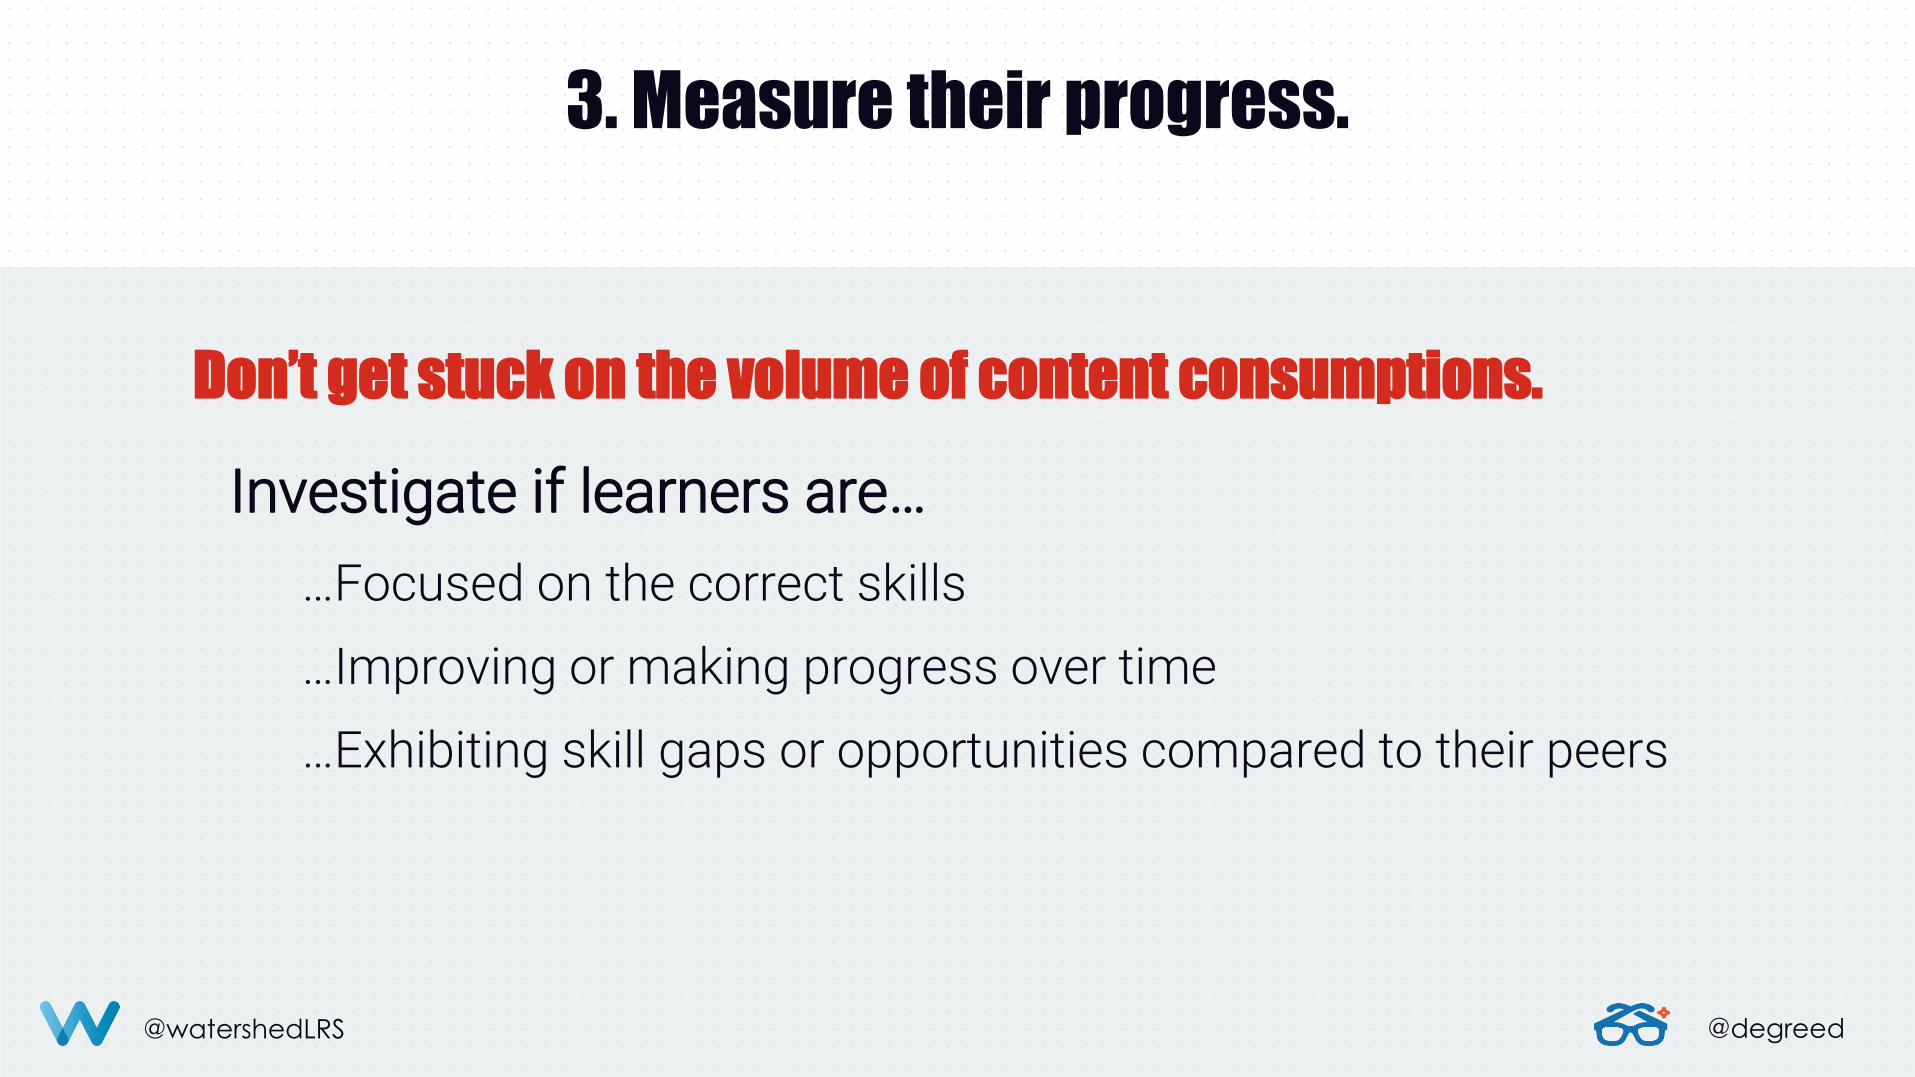
3. Measure their progress.
Investigate if learners are…
…Focused on the correct skills
…Improving or making progress over time
…Exhibiting skill gaps or opportunities compared to their peers
Don’t get stuck on the volume of content consumptions.
@watershedLRS @degreed @watershedLRS @degreed
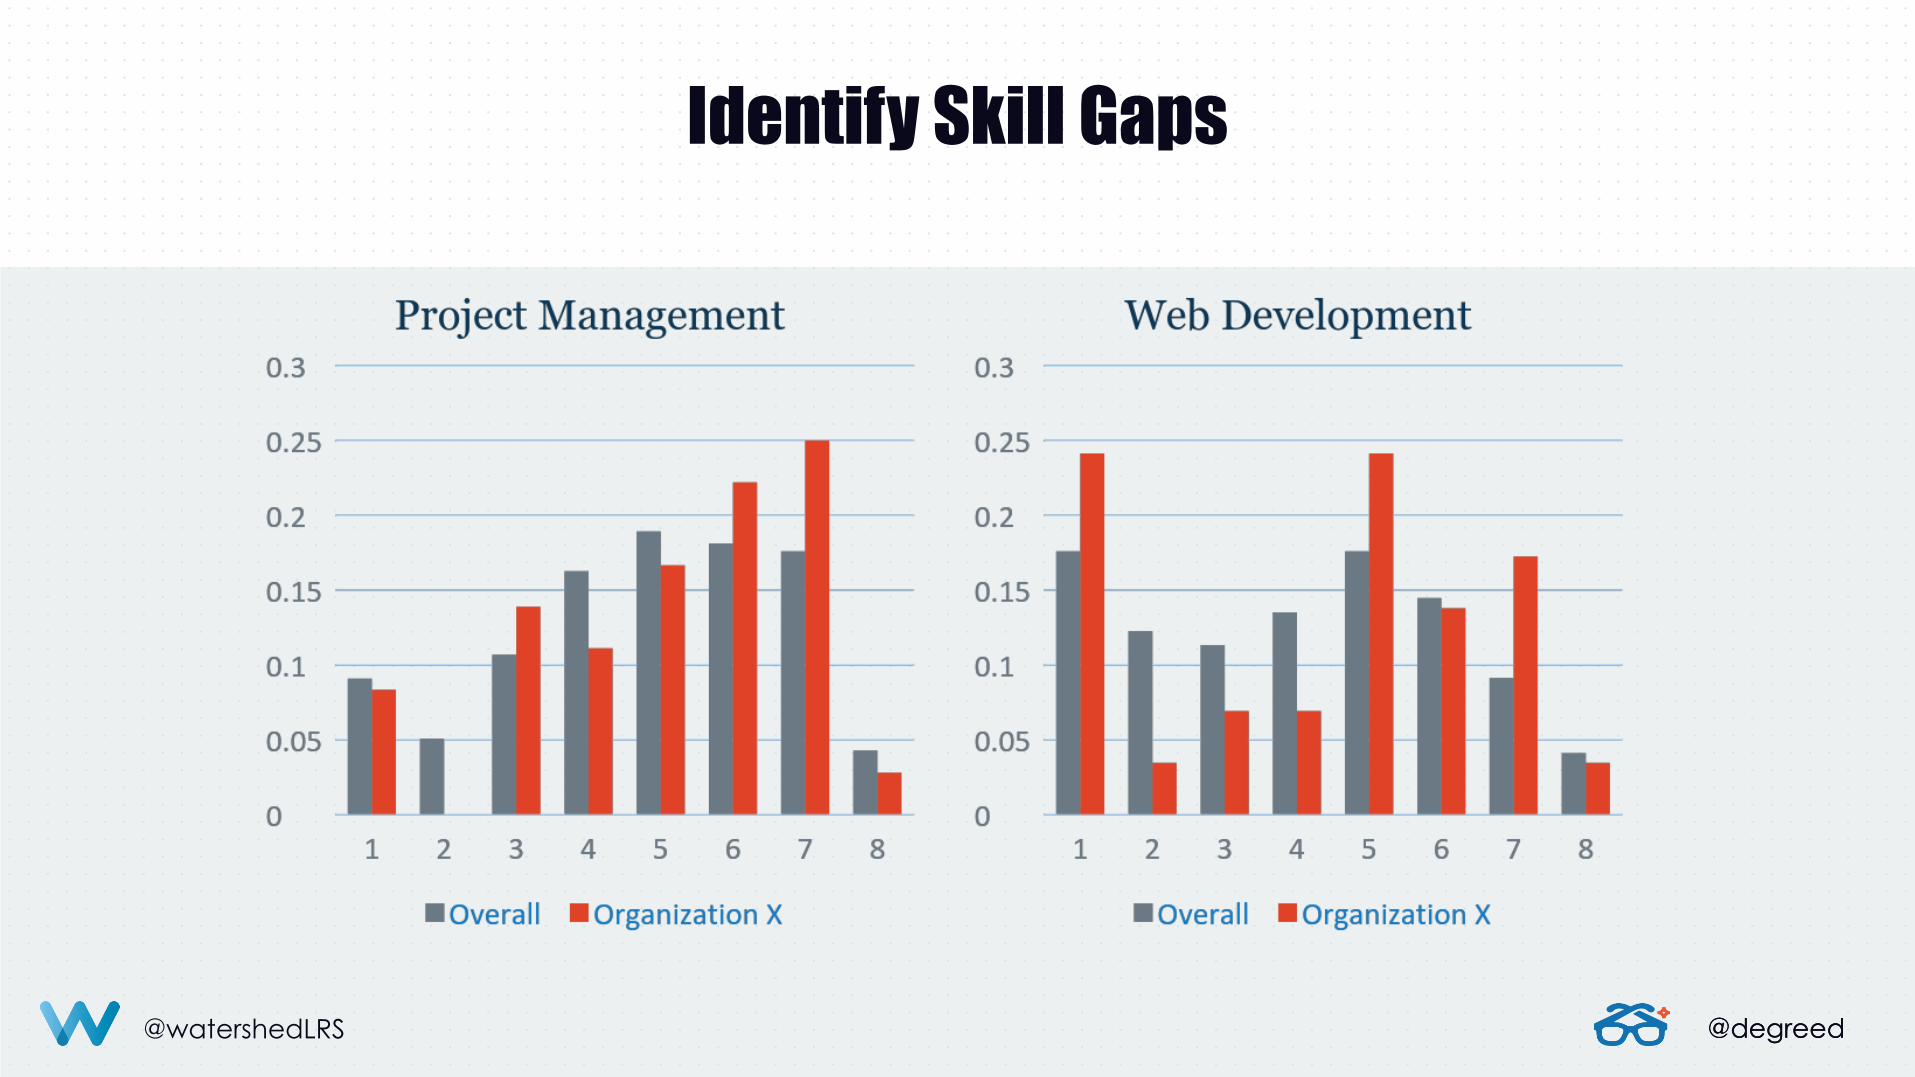
Identify Skill Gaps
@degreed
@watershedLRS @degreed
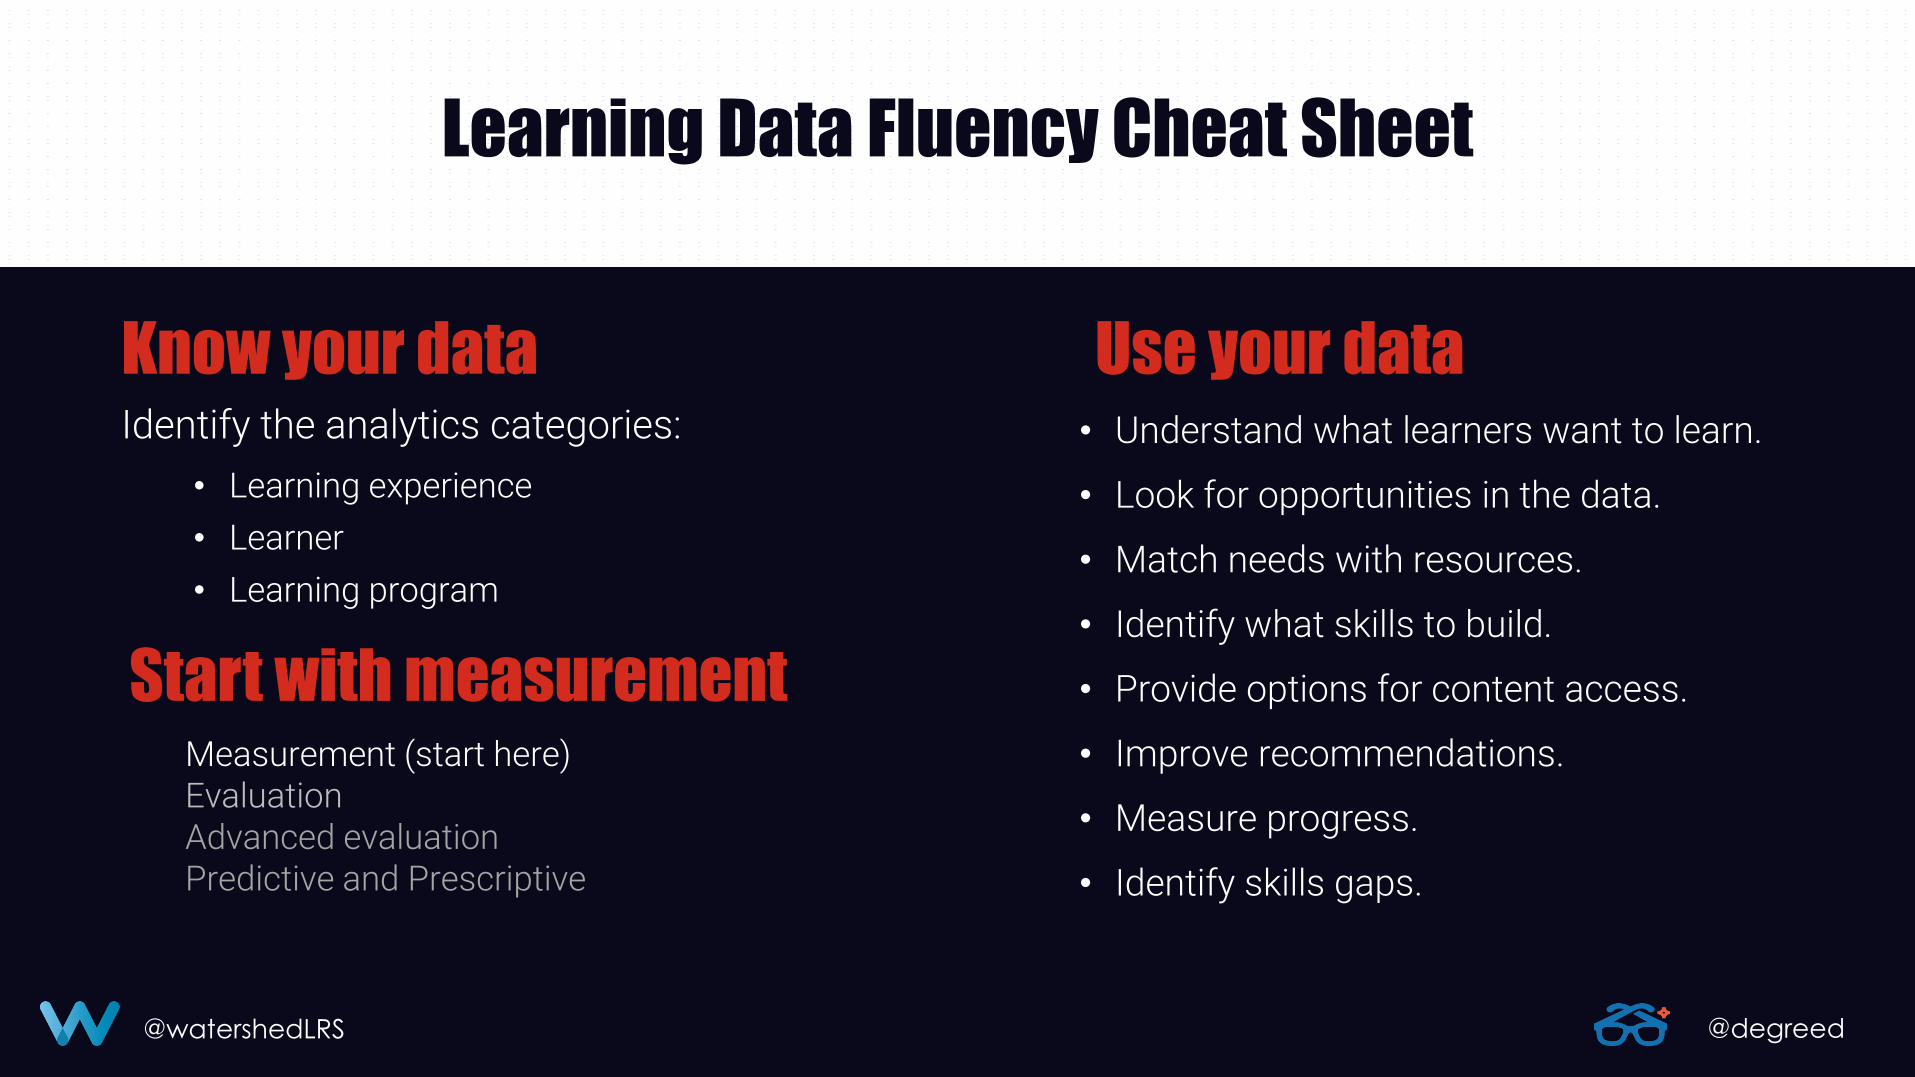
Learning Data Fluency Cheat Sheet
Identify the analytics categories:
• Learning experience
• Learner
• Learning program
• Understand what learners want to learn.
• Look for opportunities in the data.
• Match needs with resources.
• Identify what skills to build.
• Provide options for content access.
• Improve recommendations.
• Measure progress.
• Identify skills gaps.
Know your data Use your data
Measurement (start here) Evaluation Advanced evaluation Predictive and Prescriptive
Start with measurement

@watershedLRS @degreed
Data Fluency for Dummies
Tim Dickinson
Director, Learning Analytics Strategy watershedLRS.com @watershedLRS
James Densmore
Director of Data Science Degreed.com @degreed