Embed Size (px)
Citation preview

Dell EMC Ready Architectures for VDIDesigns for Citrix XenDesktop and XenApp on VxRailand vSAN Ready NodesSeptember 2018
H17344
Validation Guide
Abstract
This validation guide describes the architecture and performance of the integration ofCitrix XenDesktop components for virtual desktop infrastructure (VDI) and XenAppfor hosted shared desktops on Dell EMC VxRail hyper-converged appliances or vSANReady Nodes in a VMware vSphere environment.
Dell EMC Solutions

Copyright © 2018 Dell Inc. or its subsidiaries. All rights reserved.
Published September 2018
Dell believes the information in this publication is accurate as of its publication date. The information is subject to change without notice.
THE INFORMATION IN THIS PUBLICATION IS PROVIDED “AS-IS.“ DELL MAKES NO REPRESENTATIONS OR WARRANTIES OF ANY KIND WITH
RESPECT TO THE INFORMATION IN THIS PUBLICATION, AND SPECIFICALLY DISCLAIMS IMPLIED WARRANTIES OF MERCHANTABILITY OR FITNESS
FOR A PARTICULAR PURPOSE. USE, COPYING, AND DISTRIBUTION OF ANY DELL SOFTWARE DESCRIBED IN THIS PUBLICATION REQUIRES AN
APPLICABLE SOFTWARE LICENSE.
Dell, EMC, and other trademarks are trademarks of Dell Inc. or its subsidiaries. Other trademarks may be the property of their respective owners. Published
in the USA.
Dell EMCHopkinton, Massachusetts 01748-91031-508-435-1000 In North America 1-866-464-7381www.DellEMC.com
2 Dell EMC Ready Architectures for VDI

Executive Summary 5Document purpose....................................................................................... 6Audience...................................................................................................... 6We value your feedback............................................................................... 6
Test Environment Configuration and Best Practices 7Validated hardware resources...................................................................... 8Validated software resources....................................................................... 8Validated system version matrix................................................................... 9Virtual networking configuration.................................................................. 9Management server infrastructure..............................................................10
SQL Server databases....................................................................10DNS............................................................................................... 10
High availability........................................................................................... 10Citrix XenDesktop architecture....................................................................11
Solution Performance and Testing 13Testing process...........................................................................................14
Resource monitoring...................................................................... 14Load generation............................................................................. 15Profiles and workloads................................................................... 15Citrix XenDesktop Machine Creation Services............................... 16Desktop VM test configurations..................................................... 16
Test results and analysis..............................................................................17B5 configuration.............................................................................18
Conclusion 25User density recommendations.................................................................. 26Conclusions................................................................................................ 26
References 27Dell EMC documentation............................................................................ 28VMware documentation............................................................................. 28Citrix resources.......................................................................................... 28
Chapter 1
Chapter 2
Chapter 3
Chapter 4
Chapter 5
CONTENTS
Dell EMC Ready Architectures for VDI 3

CONTENTS
4 Dell EMC Ready Architectures for VDI

CHAPTER 1
Executive Summary
This chapter presents the following topics:
l Document purpose...............................................................................................6l Audience.............................................................................................................. 6l We value your feedback....................................................................................... 6
Executive Summary 5

Document purpose
This validation guide details the architecture, components, testing methods, and testresults for Dell EMC VxRail appliances and vSAN Ready Nodes with Citrix XenDesktopand Citrix XenApp. It includes the test environment configuration and best practicesfor systems that have undergone testing.
Audience
This guide is intended for architects, developers, and technical administrators of ITenvironments. It provides an in-depth explanation of the testing methodology andbasis for VDI densities. It also validates the value of the Dell EMC Ready Architecturesfor VDI that deliver Microsoft Windows virtual desktops to users of Citrix XenDesktopand Citrix XenApp VDI components on VxRail appliances or vSAN Ready Nodes.
We value your feedback
Dell EMC and the authors of this document welcome your feedback on the solutionand the solution documentation. Contact Dell EMC Solutions team with yourcomments.
Authors: Dell EMC Ready Architectures for VDI Engineering Team, Donna Renfro
Executive Summary
6 Dell EMC Ready Architectures for VDI
CHAPTER 2
Test Environment Configuration and BestPractices
This chapter presents the following topics:
l Validated hardware resources.............................................................................. 8l Validated software resources...............................................................................8l Validated system version matrix...........................................................................9l Virtual networking configuration.......................................................................... 9l Management server infrastructure..................................................................... 10l High availability...................................................................................................10l Citrix XenDesktop architecture........................................................................... 11
Test Environment Configuration and Best Practices 7

Validated hardware resourcesDell EMC validated the solutions with the specific hardware resources listed in thissection.
Enterprise platformsWe used the VxRail and vSAN Ready Nodes hardware components listed in thefollowing table. We have designated the configuration as B5, which is referencedthroughout the document.
Table 1 Validated hardware configurations
Config Enterpriseplatform
CPU Memory RAID ctlr BOSS HD config Network
B5 V570FR740XD
5120 Gold (14-core 2.2 GHz)
384 GB@2,400MT/s
HBA 330 2 x 240 GBM.2
2 x 400 GB SSD (Cache)4 x 1.92 TB HDD(Capacity)
4 x IntelX710 rNDC
Network hardwareThe following network hardware was used in our test environment:
l Dell Networking S3048 (1 GbE ToR switch)—A low-latency top-of-rack (ToR)switch that features 48 x 1 GbE and 4 x 10 GbE ports, a dense 1U design and up to260 Gbps performance
l Dell Networking S4048 (10 GbE ToR switch)—A high-density, ultra-low-latencyToR switch that features 48 x 10 GbE SFP+ and 6 x 40 GbE ports and up to 720Gbps performance.
Validated software resources
Dell EMC validated this solution with the software components listed in the followingtable.
Component Description/Version
Hypervisor ESXi 6.5 (VxRail), ESXi 6.7 (VSRN)
Broker technology Citrix XenDesktop and Citrix XenApp version 7.15 LTSR
Broker database Microsoft SQL Server 2016
Management VM OS Microsoft Windows Server 2016 (DCC, StoreFront, anddatabase)
Virtual desktop OS Microsoft Windows 10 Enterprise
Office application suite Microsoft Office Professional 2016
Login VSI test suite Version 4.1
Platform VxRail v 4.5 or VSRN with vSAN v 6.5
Test Environment Configuration and Best Practices
8 Dell EMC Ready Architectures for VDI

Validated system version matrix
Dell EMC validated this solution using the system versions listed in the following table.
Table 2 Version matrix for tested system
ServerConfig
Hyper-visor
Hyper-visorVersion
Hyper-visorBuild
Bios VxRailversion
Win10Version
Nvidia vGPUVersion
B5 ESXi 6.5 U2b 6.5.0-8935087 1.4.8 4.5.215 1803 n/a
Virtual networking configurationThe network configuration for the uses a 10 GbE converged infrastructure model.
All required VLANs traverse two 10 GbE NICs configured in an active/active team.
We used the following VLAN configurations for the compute and management hosts inour validation testing.
l VLAN configuration:
n Management VLAN: Configured for hypervisor infrastructure traffic—L3routed via core switch
n VDI VLAN: Configured for VDI session traffic—L3 routed via core switch
n VMware vSAN VLAN: Configured for VMware vSAN traffic—L2 switched onlyvia ToR switch
n vMotion VLAN: Configured for Live Migration traffic—L2 switched only,trunked from Core (HA only)
n VDI Management VLAN: Configured for VDI infrastructure traffic—L3 routedvia core switch
l A VLAN iDRAC is configured for all hardware management traffic—L3 routed viacore switch
Test Environment Configuration and Best Practices
Validated system version matrix 9
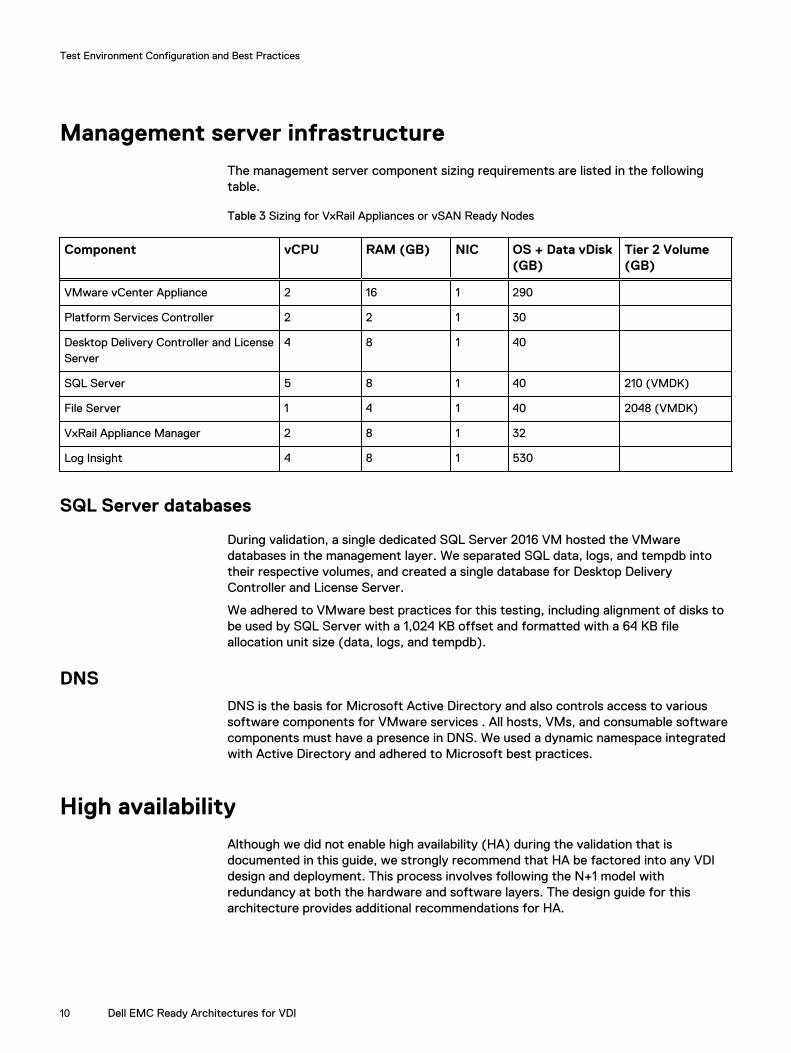
Management server infrastructure
The management server component sizing requirements are listed in the followingtable.
Table 3 Sizing for VxRail Appliances or vSAN Ready Nodes
Component vCPU RAM (GB) NIC OS + Data vDisk(GB)
Tier 2 Volume(GB)
VMware vCenter Appliance 2 16 1 290
Platform Services Controller 2 2 1 30
Desktop Delivery Controller and LicenseServer
4 8 1 40
SQL Server 5 8 1 40 210 (VMDK)
File Server 1 4 1 40 2048 (VMDK)
VxRail Appliance Manager 2 8 1 32
Log Insight 4 8 1 530
SQL Server databases
During validation, a single dedicated SQL Server 2016 VM hosted the VMwaredatabases in the management layer. We separated SQL data, logs, and tempdb intotheir respective volumes, and created a single database for Desktop DeliveryController and License Server.
We adhered to VMware best practices for this testing, including alignment of disks tobe used by SQL Server with a 1,024 KB offset and formatted with a 64 KB fileallocation unit size (data, logs, and tempdb).
DNSDNS is the basis for Microsoft Active Directory and also controls access to varioussoftware components for VMware services . All hosts, VMs, and consumable softwarecomponents must have a presence in DNS. We used a dynamic namespace integratedwith Active Directory and adhered to Microsoft best practices.
High availability
Although we did not enable high availability (HA) during the validation that isdocumented in this guide, we strongly recommend that HA be factored into any VDIdesign and deployment. This process involves following the N+1 model withredundancy at both the hardware and software layers. The design guide for thisarchitecture provides additional recommendations for HA.
Test Environment Configuration and Best Practices
10 Dell EMC Ready Architectures for VDI

Citrix XenDesktop architecture
The following figure shows the Citrix XenDesktop communication flow.
Figure 1 Citrix XenDesktop architecture
Test Environment Configuration and Best Practices
Citrix XenDesktop architecture 11

Test Environment Configuration and Best Practices
12 Dell EMC Ready Architectures for VDI

CHAPTER 3
Solution Performance and Testing
This chapter presents the following topics:
l Testing process.................................................................................................. 14l Test results and analysis..................................................................................... 17
Solution Performance and Testing 13

Testing processTo ensure the optimal combination of end-user experience (EUE) and cost-per-user,we conducted performance analysis and characterization testing on this solution usingthe Login VSI load-generation tool. Login VSI is a carefully designed, holisticmethodology that monitors both hardware resource utilization parameters and EUEduring load-testing.
We tested each user load against four runs: a pilot run to validate that theinfrastructure was functioning and valid data could be captured, and three subsequentruns to enable data correlation.
During testing, while the environment was under load, we logged in to a session andcompleted tasks that correspond to the user workload. While this test is subjective, ithelps to provide a better understanding of the EUE in the desktop sessions,particularly under high load. It also helps to ensure reliable data gathering.
Resource monitoring
To ensure that the user experience was not compromised, we monitored the followingimportant resources:
l Compute host servers—VMware vCenter (for VMware vSphere-based solutions)or Microsoft Performance Monitor (for Hyper-V-based solutions) gathers key data(CPU, memory, disk and network usage) from each of the compute hosts duringeach test run. This data is exported to .csv files for single hosts, and thenconsolidated to show data from all hosts. While the report does not includespecific performance metrics for the management host servers, these servers aremonitored during testing to ensure that they are performing at an expected levelwith no bottlenecks.
l Hardware resources—Resource contention, which occurs when hardwareresources have been exhausted, can cause poor EUE. We monitored the relevantresource utilization parameters and applied relatively conservative thresholds, asshown in the following table. Thresholds are carefully selected to deliver anoptimal combination of good EUE and cost-per-user while also providing burstcapacity for seasonal or intermittent spikes in usage.
Table 4 Parameter pass/fail thresholds
Parameter Pass/fail threshold
Physical host CPU utilization 85% a
Physical host memory utilization 85%
Network throughput 85%
Storage I/O latency 20 ms
a. The Ready Solutions for VDI team recommends that average CPU utilization not exceed85% in a production environment. A 5% margin of error was allocated for this validationeffort. Therefore, you will see CPU utilization that exceeds our recommended percentage.Given the nature of LoginVSI testing, this is a reasonable exception for determining oursizing guidance.
l GPU resources—vSphere Client monitoring collects data about the GPU resourceuse from a script that is run on ESXi 6.5 and later hosts. The script runs for the
Solution Performance and Testing
14 Dell EMC Ready Architectures for VDI
duration of the test and contains NVIDIA System Management Interfacecommands. The commands query each GPU and log the GPU processor,temperature, and memory use to a .csv file.
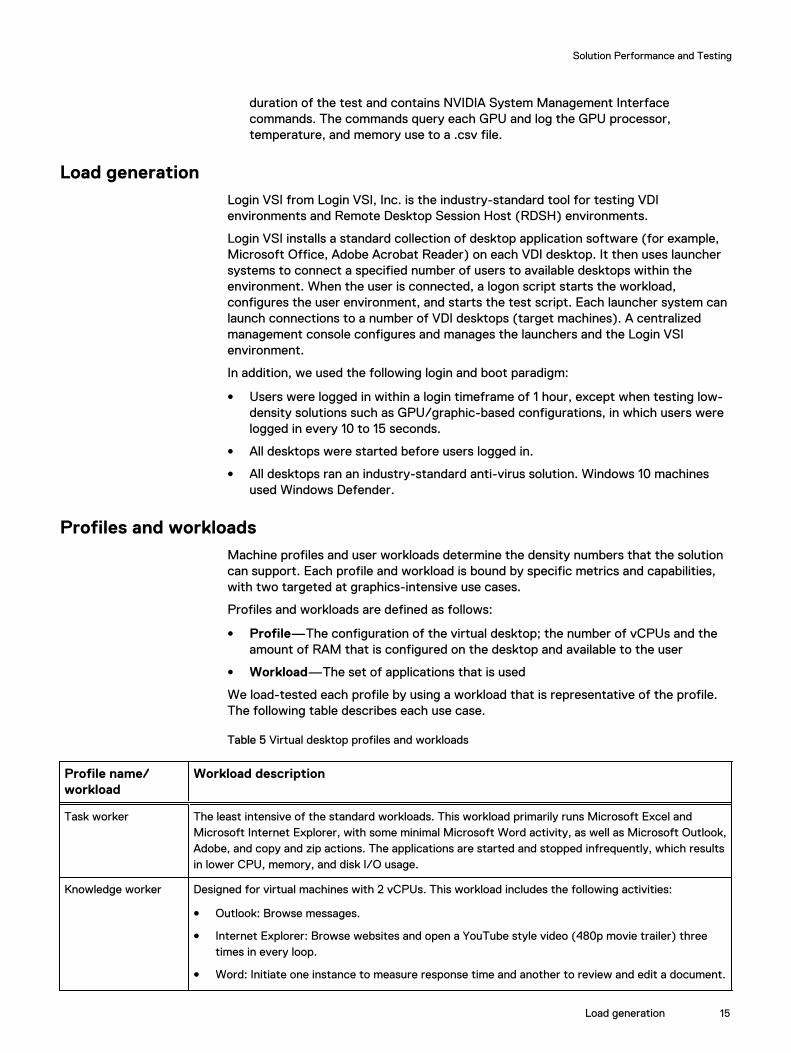
Load generationLogin VSI from Login VSI, Inc. is the industry-standard tool for testing VDIenvironments and Remote Desktop Session Host (RDSH) environments.
Login VSI installs a standard collection of desktop application software (for example,Microsoft Office, Adobe Acrobat Reader) on each VDI desktop. It then uses launchersystems to connect a specified number of users to available desktops within theenvironment. When the user is connected, a logon script starts the workload,configures the user environment, and starts the test script. Each launcher system canlaunch connections to a number of VDI desktops (target machines). A centralizedmanagement console configures and manages the launchers and the Login VSIenvironment.
In addition, we used the following login and boot paradigm:
l Users were logged in within a login timeframe of 1 hour, except when testing low-density solutions such as GPU/graphic-based configurations, in which users werelogged in every 10 to 15 seconds.
l All desktops were started before users logged in.
l All desktops ran an industry-standard anti-virus solution. Windows 10 machinesused Windows Defender.
Profiles and workloadsMachine profiles and user workloads determine the density numbers that the solutioncan support. Each profile and workload is bound by specific metrics and capabilities,with two targeted at graphics-intensive use cases.
Profiles and workloads are defined as follows:
l Profile—The configuration of the virtual desktop; the number of vCPUs and theamount of RAM that is configured on the desktop and available to the user
l Workload—The set of applications that is used
We load-tested each profile by using a workload that is representative of the profile.The following table describes each use case.
Table 5 Virtual desktop profiles and workloads
Profile name/workload
Workload description
Task worker The least intensive of the standard workloads. This workload primarily runs Microsoft Excel andMicrosoft Internet Explorer, with some minimal Microsoft Word activity, as well as Microsoft Outlook,Adobe, and copy and zip actions. The applications are started and stopped infrequently, which resultsin lower CPU, memory, and disk I/O usage.
Knowledge worker Designed for virtual machines with 2 vCPUs. This workload includes the following activities:
l Outlook: Browse messages.
l Internet Explorer: Browse websites and open a YouTube style video (480p movie trailer) threetimes in every loop.
l Word: Initiate one instance to measure response time and another to review and edit a document.
Solution Performance and Testing
Load generation 15
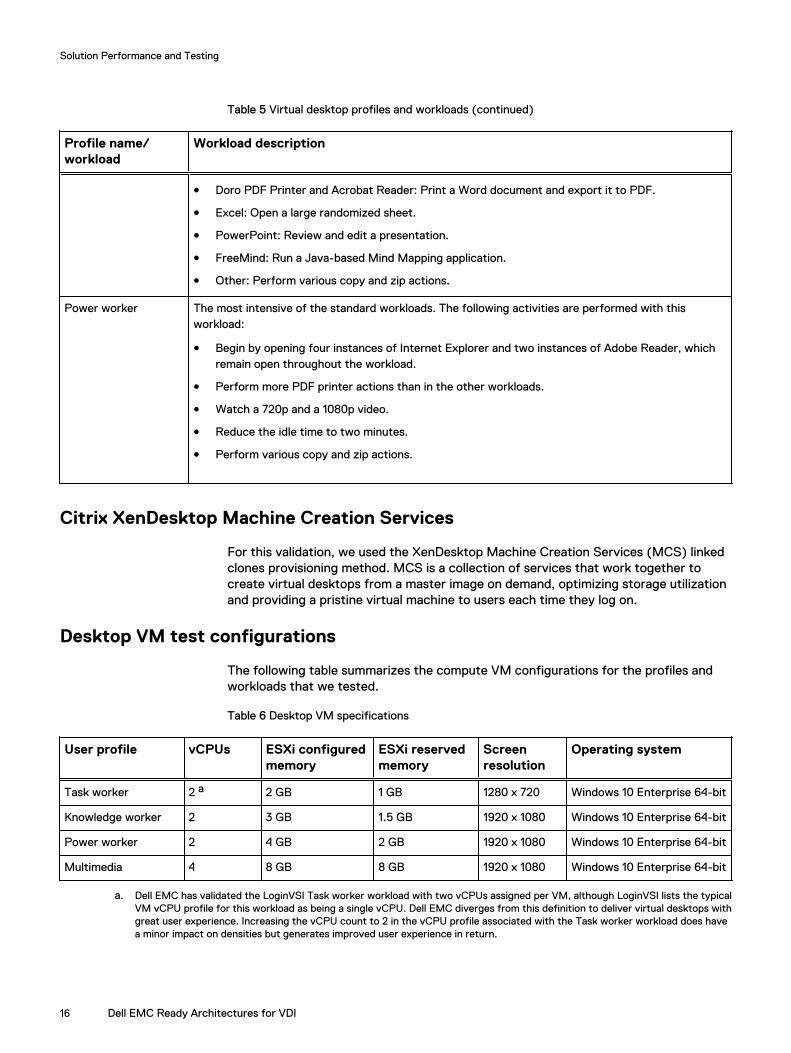
Table 5 Virtual desktop profiles and workloads (continued)
Profile name/workload
Workload description
l Doro PDF Printer and Acrobat Reader: Print a Word document and export it to PDF.
l Excel: Open a large randomized sheet.
l PowerPoint: Review and edit a presentation.
l FreeMind: Run a Java-based Mind Mapping application.
l Other: Perform various copy and zip actions.
Power worker The most intensive of the standard workloads. The following activities are performed with thisworkload:
l Begin by opening four instances of Internet Explorer and two instances of Adobe Reader, whichremain open throughout the workload.
l Perform more PDF printer actions than in the other workloads.
l Watch a 720p and a 1080p video.
l Reduce the idle time to two minutes.
l Perform various copy and zip actions.
Citrix XenDesktop Machine Creation Services
For this validation, we used the XenDesktop Machine Creation Services (MCS) linkedclones provisioning method. MCS is a collection of services that work together tocreate virtual desktops from a master image on demand, optimizing storage utilizationand providing a pristine virtual machine to users each time they log on.
Desktop VM test configurations
The following table summarizes the compute VM configurations for the profiles andworkloads that we tested.
Table 6 Desktop VM specifications
User profile vCPUs ESXi configuredmemory
ESXi reservedmemory
Screenresolution
Operating system
Task worker 2 a 2 GB 1 GB 1280 x 720 Windows 10 Enterprise 64-bit
Knowledge worker 2 3 GB 1.5 GB 1920 x 1080 Windows 10 Enterprise 64-bit
Power worker 2 4 GB 2 GB 1920 x 1080 Windows 10 Enterprise 64-bit
Multimedia 4 8 GB 8 GB 1920 x 1080 Windows 10 Enterprise 64-bit
a. Dell EMC has validated the LoginVSI Task worker workload with two vCPUs assigned per VM, although LoginVSI lists the typicalVM vCPU profile for this workload as being a single vCPU. Dell EMC diverges from this definition to deliver virtual desktops withgreat user experience. Increasing the vCPU count to 2 in the vCPU profile associated with the Task worker workload does havea minor impact on densities but generates improved user experience in return.
Solution Performance and Testing
16 Dell EMC Ready Architectures for VDI

Test results and analysis
We used the Login VSI test suite to simulate the user experience for several profiletypes under the typical workload for that type. The following table summarizes thetest results for the compute hosts using the various workloads and configurations.
Note
Dell EMC is aware of the vulnerabilities, known as Meltdown, Spectre, andForeshadow/L1TF, which affect many modern microprocessors. Ensure that you readthe information in the following links:
l http://www.dell.com/support/article/SLN308588
l http://www.dell.com/support/article/SLN308587
l http://dell.com/support/L1-terminal-fault
Consider this information in combination with the version information in Table 2 onpage 9 to understand the vulnerability mitigation status of the environment we used toderive the test results shown in the following table.
Table 7 Test results summary
Workload Density per host AverageCPU
Averageconsumedmemory
Average activememory
Average IOPSper user
B5 Knowledge worker 105 84% 105 GB 3.8
B5 Power worker 80 85% 115 GB 6.0
The table headings are defined as follows:
l User density—The number of users per compute host that successfullycompleted the workload test within the acceptable resource limits for the host.For clusters, this reflects the average of the density achieved for all computehosts in the cluster.
l Avg CPU—The average CPU usage over the steady-state period. For clusters,this represents the combined average CPU usage of all compute hosts. On thelatest Intel processors, the ESXi host CPU metrics exceed the rated 100 percentfor the host if Turbo Boost is enabled, which is the default setting. An additional35 percent of CPU is available from the Turbo Boost feature, but this additionalCPU headroom is not reflected in the VMware vSphere metrics where theperformance data is gathered. Therefore, CPU usage for ESXi hosts is adjustedand each CPU graph includes a line indicating the potential performance headroomthat is provided by Turbo boost.
l Avg active memory—For ESXi hosts, the amount of memory that is activelyused, as estimated by the VMkernel based on recently touched memory pages. Forclusters, this is the average amount of guest physical memory that is actively usedacross all compute hosts over the steady-state period.
l Avg IOPS per user—IOPS calculated from the average disk IOPS over the steadystate period divided by the number of users.
Solution Performance and Testing
Test results and analysis 17

B5 configuration
The following task worker, knowledge worker, and power worker performance testingwas performed on the vSAN Ready Nodes-R740XD in the B5 configuration describedin Validated hardware resources on page 8. These results also apply to the VxRail B5configuration, as the configurations are the same.
Knowledge Worker, 305 users, ESXi 6.x, XenDesktop 7 v7.15 LTSR
CPU usageWe populated the compute hosts with 105 virtual machines per host and the combinedcompute/management host with 90 user VMs in addition to the management VMs.With all user virtual machines powered on and before starting the test, the CPU usagewas approximately 11 percent on the compute hosts.
The following figure shows the performance data for 105 user sessions per computehost. The CPU reached a steady state average of 84 percent across the two computehosts during the test cycle when 105 users were logged on to each host. Thecombined compute/management host average CPU usage was 81 percent duringsteady state.
MemoryWith regard to active memory usage for the cluster, with a total of 384 GB availablememory per node, no memory issues occurred. The compute hosts reached amaximum active memory usage of 285 GB. No ballooning or memory swappingoccurred at any point during testing.
Solution Performance and Testing
18 Dell EMC Ready Architectures for VDI

Network usageNetwork bandwidth was not an issue on this test run, with a steady state peak ofapproximately 1,077 MBps on the combined compute/management host and a peak of625 Mbps on one of the compute hosts. The busiest period for network traffic wasduring logoff phase after testing was complete. One of the hosts reached a peak of1,999 MBps during logoff.
IOPSThe IOPS graphs clearly display the initial logon of the desktops, the steady state, andfinally the logoff phase. The graph displays the disk IOPS figure for the VSAN cluster.
The cluster reached a maximum (read + write IOPS) of 36,4329 disk IOPS during theboot storm and the average during steady state was 1,579.58 disk IOPS.
Solution Performance and Testing
B5 configuration 19
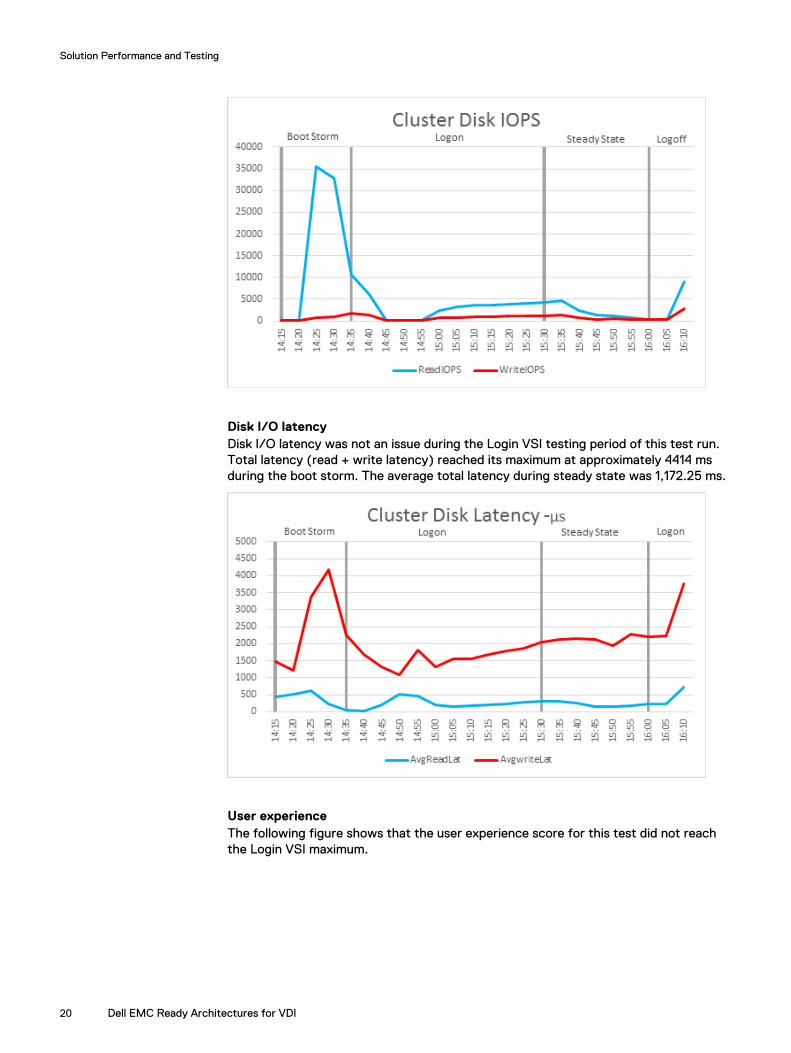
Disk I/O latencyDisk I/O latency was not an issue during the Login VSI testing period of this test run.Total latency (read + write latency) reached its maximum at approximately 4414 msduring the boot storm. The average total latency during steady state was 1,172.25 ms.
User experienceThe following figure shows that the user experience score for this test did not reachthe Login VSI maximum.
Solution Performance and Testing
20 Dell EMC Ready Architectures for VDI
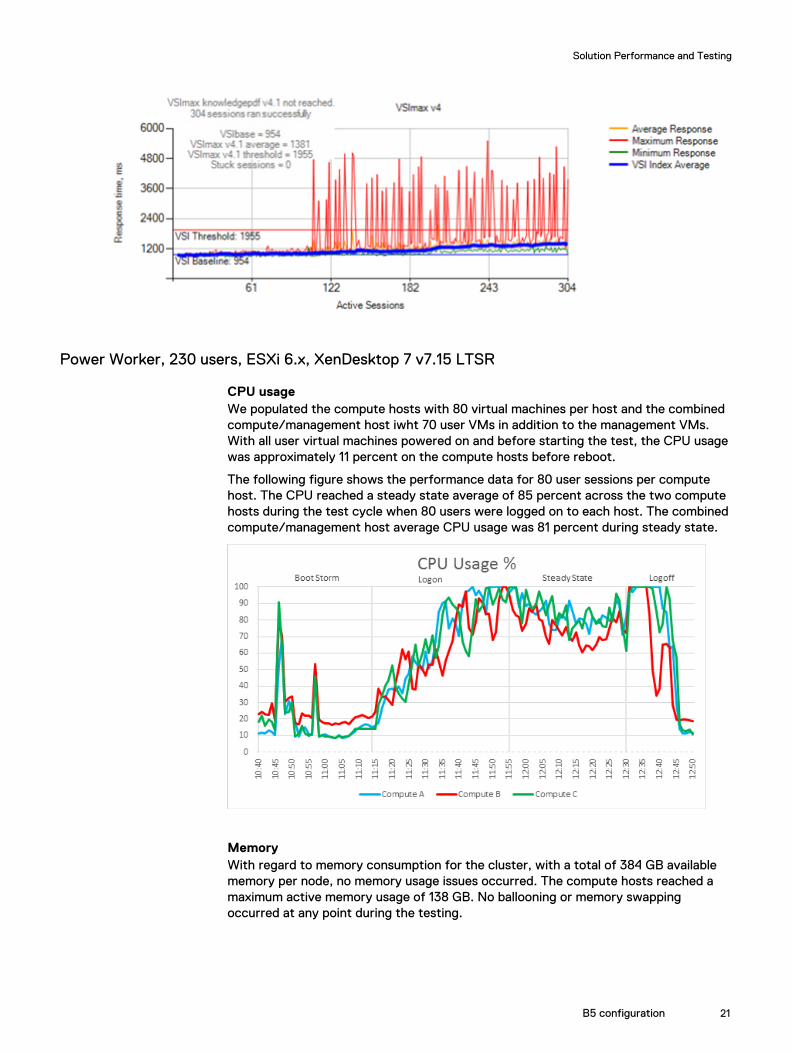
Power Worker, 230 users, ESXi 6.x, XenDesktop 7 v7.15 LTSR
CPU usageWe populated the compute hosts with 80 virtual machines per host and the combinedcompute/management host iwht 70 user VMs in addition to the management VMs.With all user virtual machines powered on and before starting the test, the CPU usagewas approximately 11 percent on the compute hosts before reboot.
The following figure shows the performance data for 80 user sessions per computehost. The CPU reached a steady state average of 85 percent across the two computehosts during the test cycle when 80 users were logged on to each host. The combinedcompute/management host average CPU usage was 81 percent during steady state.
MemoryWith regard to memory consumption for the cluster, with a total of 384 GB availablememory per node, no memory usage issues occurred. The compute hosts reached amaximum active memory usage of 138 GB. No ballooning or memory swappingoccurred at any point during the testing.
Solution Performance and Testing
B5 configuration 21

Network usageNetwork bandwidth was not an issue on this test run with a steady state peak ofapproximately 2,206 MBps on the combined compute/management host and a peak of2,123 Mbps on one of the compute hosts. The busiest period for network traffic wasduring the logoff phase after testing had completed. The combined hosts total usagereached a peak of 6,729 MBps during logoff.
IOPSThe IOPS graphs clearly display the initial logon of the desktops, the steady state, thelogoff phase, and finally the recreation of the desktops after testing was complete.The graph displays the disk IOPS figure for the VSAN cluster.
The cluster reached a maximum (read + write IOPS) of 44,285 disk IOPS during theinstant clone recreation period after testing, and the steady state total average was528 disk IOPS.
Solution Performance and Testing
22 Dell EMC Ready Architectures for VDI

Disk I/O latencyDisk I/O latency was not an issue during the Login VSI testing period of this test run.Total latency (read + write) reached its maximum of approximately 5,596 ms duringthe steady state phase.
User experienceThe following figure shows that the user experience score for this test did not reachthe Login VSI maximum.
Solution Performance and Testing
B5 configuration 23

Solution Performance and Testing
24 Dell EMC Ready Architectures for VDI
CHAPTER 4
Conclusion
l User density recommendations.......................................................................... 26l Conclusions........................................................................................................26
Conclusion 25

User density recommendationsTest results provided recommended user densities.
The user densities in the following table were achieved by following the VMware bestpractices of FTT = 1 and a reserved slack space of 30 percent. All configurations weretested with Microsoft Windows 10 and Microsoft Office 2016.
Table 8 User density recommendations for VMware vSphere ESXi 6.5 or 6.7 with CitrixXenDesktop
Server configuration Workload User density
B5 Knowledge worker 105
B5 Power worker 80
Conclusions
Both vSAN Ready Nodes and VxRail appliances reach similar user densities whenconfigured similarly, as demonstrated during this validation. Remember to use VxRailsizing tools to reserve resources for management tools when designing your VDIinfrastructure.
The configurations for the VxRail appliances and vSAN Ready Nodes have beenoptimized for VDI. We selected the memory and CPU configurations that provideoptimal performance. You can change these configurations to meet your ownrequirements, but keep in mind that changing the memory and CPU configurationsfrom those that have been validated in this document will affect the user density perhost.
With the introduction of the six-channels-per-CPU requirement for Skylake, the C7memory configuration recommendation has increased from the previous guidance of512 GB to 768 GB. This change was necessary to ensure a balanced memoryconfiguration and optimized performance for your VDI solution. The additional memoryis advantageous, considering the resulting increase in operating system resourceutilization and the enhanced experience for users when they have access to additionalmemory allocations.
Conclusion
26 Dell EMC Ready Architectures for VDI

CHAPTER 5
References
This chapter presents the following topics:
l Dell EMC documentation....................................................................................28l VMware documentation..................................................................................... 28l Citrix resources..................................................................................................28
References 27

Dell EMC documentationThe following Dell EMC documentation provides additional and relevant information.Access to these documents depends on your login credentials. If you do not haveaccess to a document, contact your Dell EMC representative.
l Dell EMC VxRail Appliance documentation
l Dell EMC Virtual Desktop Infrastructure
This document is part of the documentation set for this architecture, which includesthe following:
l Dell EMC Ready Architectures for VDI: Designs for Citrix XenDesktop and XenAppon VxRail and vSAN Ready Nodes Design Guide
l Dell EMC Ready Architectures for VDI: Designs for Citrix XenDesktop and XenAppon VxRail and vSAN Ready Nodes Deployment Guide
l Dell EMC Ready Architectures for VDI: Designs for Citrix XenDesktop and XenAppon VxRail and vSAN Ready Nodes Validation Guide
VMware documentationThe following VMware documentation provides additional and relevant information:
l VMware vSphere documentation
l vSAN Ready Node Configurator
l VMware Compatibility Guide
l vSAN Hardware Quick Reference Guide
Citrix resourcesThe following Citrix resources provide additional and relevant information:
l XenDesktop and XenApp 7.15 LTSR: System Requirements
l Citrix VDI Handbook and Best Practices
l Citrix deployment guides
l Citrix StoreFront Proof of Concept Implementation Guide
l Install and Configure
References
28 Dell EMC Ready Architectures for VDI


