Embed Size (px)
Citation preview

Ecological Monographs, 77(4), 2007, pp. 483–502� 2007 by the Ecological Society of America
DENSITY DEPENDENCE AND DENSITY INDEPENDENCE IN THEDEMOGRAPHY AND DISPERSAL OF PIKE OVER FOUR DECADES
THROND O. HAUGEN,1,2 IAN J. WINFIELD,3 L. ASBJØRN VØLLESTAD,1 JANICE M. FLETCHER,3 J. BEN JAMES,3
AND NILS CHR. STENSETH1,4
1Centre for Evolutionary and Ecological Synthesis (CEES), Department of Biology, University of Oslo, P.O. Box 1066 Blindern,N-0316 Oslo, Norway
2Norwegian Institute of Water Resarch, Gaustadalleen 2, N-0349 Oslo, Norway3Centre for Ecology and Hydrology, Lancaster Environment Centre, Library Avenue, Bailrigg, Lancaster,
Lancashire LA1 4AP United Kingdom
Abstract. Quantifying the effects of density-dependent and density-independent factors indemographic and dispersal processes remains a major challenge in population ecology. Basedon unique long-term capture–mark–recapture (CMR) data (1949–2000) on pike (Esox lucius)from Windermere, United Kingdom, we provide estimates of density-dependent and density-independent effects, under the influence of individual size and sex, on natural survival, fishingmortality, and dispersal. Because survival is expected to be related to the individual growthprocess, we also explore the degree of parallelism between the two processes by applying thebest-supported survival model structure to individual growth data. The CMR data wereanalyzed using sex- and age-structured multistate models (two lake basins: north and south)assuming no seasonal variation in survival and dispersal. Total survival and dispersalprobabilities were insensitive to this assumption, and capture probability was shown to berobust to assumptions about intra-annual variation in survival and dispersal. The analysesrevealed that large pike (.55 cm) displayed marked basin-specific differences in survival anddispersal responses to the abundance of conspecifics in which pike from the south basin showhigh density dependence in survival and a low degree of density dependence in dispersal,whereas the opposite was found for those of the north basin. Both large- and small-pikedispersals were found to be dependent upon the between-basin gradient in perch (Percafluviatilis, the main prey) abundance, but most so for north-to-south dispersal. The strengthand pattern of density-dependent mortality in small pike was influenced by temperature in apeculiar way: at low summer temperatures survival was lowest at high small-pike abundancesand low perch abundances; at low temperatures, survival was lowest at high small-pikeabundances and high perch abundances. Analyses of individual small-pike growth trajectoriesshowed a similar modulation of the positive perch abundance effect on growth rate whentemperature increases. The growth analysis also indicated that cannibalism may be biased infavor of rapidly growing individuals or at least increased growth rate for the survivingindividuals. Altogether, this study provides evidence of a complex interplay between density-dependent and density-independent factors affecting survival, dispersal, and individual growthof an aquatic top predator.
Key words: cannibalism; capture–mark–recapture; demography; density dependence; Esox lucius;growth; harvesting; Perca fluviatilis; predator–prey interaction; temperature; Windermere, United Kingdom.
INTRODUCTION
Survival and dispersal are key elements in the
determination of the overall dynamics of animal and
plant populations. The rates of both survival and
dispersal are typically affected by density-dependent
(endogenous) and density-independent (exogenous) fac-
tors (Turchin 1995), and the effects of these ecological
processes are commonly mediated by the size and state
of the individuals involved (Lomnicki 1988). However,
statistical modeling of such vital rates only rarely
simultaneously consider both density-dependent and
density-independent factors under the influence of
individual status (but see Clobert et al. 1988, Leirs et
al. 1997, Milner et al. 1999, Catchpole et al. 2000).
Capture–mark–recapture (CMR) data retrieved from
systems consisting of multiple sites offer a rare
opportunity to study survival and dispersal processes
(Altwegg et al. 2003, Schaub and Pradel 2004). Since
most CMR data typically cover a short time span, the
possibility for drawing general inferences regarding the
role of exogenous and endogenous effects on survival
and dispersal is usually very limited. However, in
situations in which long-term CMR data exist, the
inclusion of individual in addition to period-specific
covariates allows the explicit testing of simultaneous
Manuscript received 31 January 2006; revised 12 January2007; accepted 29 March 2007; final version received 25 April2007. Corresponding Editor: B. E. Kendall.
4 Corresponding author. E-mail: [email protected]
483

effects from these variables on survival and dispersal
(e.g., Franklin et al. 2000, Zabel and Achord 2004).
Using unique long-term (1949–2000) CMR data on
pike (Esox lucius) from Windermere, United Kingdom
(Kipling and Le Cren 1984), we here estimate both
survival and dispersal probabilities under the influence
of density-dependent and density-independent factors as
well as the sex and size of the individual. The study lake
consists of two basins that differ in morphology and
productivity (Fig. 1), within which pike is the top
predator and perch (Perca fluviatilis) is its main prey
(Frost 1954). Over the duration of the data set, both
species experienced marked fluctuations in annual
abundances (Fig. 1), and in 1976 the adult perch
population was almost extirpated by an epizooic
infection that reduced its biomass by ;98% (Bucke et
al. 1979). Owing to the close predator–prey relationship
that exists between perch and pike in Windermere
(Kipling and Frost 1970), it is likely that the fluctuations
in abundance of these populations are related to density-
dependent interaction processes between this prey and
predator. However, in addition to the population
density fluctuations, there have been annual variations
in the local water temperature (Fig. 1) as well as in
harvesting intensity (Kipling and Frost 1970). Previous
work, based on catch data, has been aimed at separating
the effects of density-dependent and density-indepen-
dent factors on population abundance in Windermere
(Kipling 1983b, Le Cren 1987, Mills and Hurley 1990),
but none of these studies has been able to separate
mortality from dispersal responses, nor have they been
able to handle the effects of variation in individual size.
These earlier studies, however, have generated specific
hypotheses on which we base many of our model
assumptions (see Hypotheses emerging from earlier
studies of the Windermere pike).
The amount of data available and the fact that the
system is a closed one facilitate a robust separation of
dispersal and mortality over all capture occasions
without having to take into account the influence of
transient individuals (Pradel et al. 1997). Hence, the
prime objective of this study is to estimate the
simultaneous effects from specific density-dependent
and density-independent factors on sex- and size-specific
natural survival, fishing mortality, dispersal, and growth
of the pike population of Windermere.
HYPOTHESES EMERGING FROM EARLIER STUDIES
OF THE WINDERMERE PIKE
The Windermere pike has been studied since the early
1940s (Kipling 1984). Based on experiences and sugges-
tions from these studies and also from the general pike
literature (Craig 1996a), we have generated a set of
specific hypotheses that will be our main focus.
Males are far more active than females during the
spawning period because they stay at the spawning
grounds for a longer period and they are involved in
extensive territorial fights in which small males are prone
to suffer from biting by the larger males (Fabricius and
Gustafson 1958, Billard 1996). From this we should
expect differential size-related survival between sexes.
We therefore test the following hypothesis.
1) Small males experience a lower size-related survival
than small females. Earlier studies on Windermere pike
(and also elsewhere) suggest that pike survival is largely
determined by individual size (see references in Craig
1996a). From this, one may deduce that growth and
survival processes are determined by the same environ-
mental factors. Kipling (1983a) suggested that growth in
Windermere pike is highly dependent upon the interac-
tion between temperature and perch abundance (i.e.,
food). We therefore test the following hypothesis.
2) Survival (and growth) in small pike (i.e., ,55 cm) is
affected by the interaction between perch abundance
and temperature. The separation of small and large pike
is related to observations of differential growth rates
between these groups (Kipling 1983a), their differential
susceptibility to cannibalism (Craig 1996b, Nilsson and
Bronmark 2000, Persson et al. 2004), their differential
risk of being caught in gill nets (Frost and Kipling 1967),
and finally that small males are at high risk of being
seriously wounded in fights with larger males during the
spawning period (Fabricius and Gustafson 1958, Billard
1996). All of these processes behave differently for
individuals that are larger or smaller than 50–55 cm. We
therefore define small individuals as being smaller than
55 cm and large individuals as those larger than 55 cm.
From this, we expect that abundance of small pike
should have a negative influence on small-pike survival
(competition) and a positive influence on large-pike
survival (cannibalism). However, as both size groups of
pike eat perch, the degree of between- and within-size
group interactions has been suggested to depend upon
perch abundance (Le Cren 1987). We therefore test the
following hypothesis.
3) Survival in small and large pike is differentially
affected by the interaction between small-pike abun-
dance and perch abundance. Despite the fact that pike
individuals may move over several kilometers in a few
hours (Diana et al. 1977, Chapman and Mackay 1984),
many studies demonstrate that most individuals do not,
over extensive periods, move far from their home range
(Grimm and Klinge 1996, references in Craig 1996b).
From the Windermere data we know that ;20% of the
tagged pike are recaptured in the basin opposite to the
one in which they were tagged (Craig 1996b). Very little
is known about the dynamics determining home range
size in pike, but it is reasonable to expect from the
general theory that prey abundance and abundance of
competitors should influence this process (Krebs and
Davies 1997). From this one should expect dispersal
(i.e., search for unoccupied area) to increase with
decreasing food abundance and increased abundance
of conspecifics. As we know that annual abundances of
THROND O. HAUGEN ET AL.484 Ecological MonographsVol. 77, No. 4

both pike and perch vary between the two basins of
Windermere (Fig. 1), we test the following hypothesis.
4) The probability of dispersing from one basin to the
other increases when there is relatively low density of
perch and high density of pike in the basin the individual
currently inhabits. From catch data, we know that the
64-mm mesh size pike nets used in scientific studies on
Windermere since the 1940s in general catch individuals
larger than 55 cm (Frost and Kipling 1967). The
recruitment of small pike into this scientific sampling
(and, hence, the fishing mortality) is therefore expected
to be determined by the same growth processes that are
expected to influence small-pike survival. We therefore
test the following hypothesis.
5) Recruitment of small pike to the gill net sampling is
affected by the interaction between perch abundance
and temperature. In addition to these specific hypoth-
eses, we also explore some more generic ecological
processes, including density dependence in survival (i.e.,
small-pike abundance will have a negative influence on
small-pike survival; large-pike abundance will have a
negative influence on large-pike survival). Finally,
results from previous Windermere pike (and perch)
population dynamics studies have demonstrated basin
effects (e.g., Kipling and Frost 1970). Hence, all
hypotheses have been tested taking this spatial aspect
into account.
MATERIAL AND METHODS
The data
Since the 1940s, the pike, perch, and Arctic charr
(Salvelinus alpinus) populations of Windermere have
been studied in a parallel series of sampling programs
(Mills and Hurley 1990), all of which have contributed
components of CMR data pertinent to the present study
(Fig. 2A). A spring (March–June) sampling program
conducted primarily for perch monitoring purposes has
also produced significant numbers of pike for tagging,
for which all individuals were sexually mature (Kipling
and Frost 1970, Kipling and Le Cren 1984) and has also
facilitated recaptures of previously tagged pike. All such
pike were sexed and weighed, and their total lengths
were measured. The tags used were made of monel metal
with punched individual numbers. Since 1953, all tags
have been attached to the maxilla bone (upper jaw),
whereas pre-1953 tags were attached to the opercular
bone (Kipling and Le Cren 1984). The jaw tags have
been tested and found to have very low loss rates
(Kipling and Le Cren 1984), but it should be noted that,
due to the existence of some tag losses, survival
estimates might be biased low, although dispersal
probabilities (as they are conditional on survival) should
be approximately unbiased. The tagged fish were caught
using four different methods: perch traps, seine nets, gill
FIG. 1. Location of the study system, Windermere in northwest England, United Kingdom, and some characteristics of dataused in this study. The left-most panel shows (from the top) time-series plots of temperature (number of degree-days above 148Cduring May–October) and estimated abundances of perch (Perca fluviatilis, ages 2–7), small pike (Esox lucius, age 2), and large pike(ages 3–9) in the north and south basins from the 1940s to the 1990s.
November 2007 485ECOLOGY OF PIKE DEMOGRAPHY AND DISPERSAL

FIG. 2. (A) The sampling design and definition of capture occasions. Capture probabilities (p) were estimated for capture occasionmidpoints separated by a survival period over which the survival probability (/) could be estimated. (B)Multistate fate diagram of pikemarked in the north basin at occasion k, separated into the Markovian steps describing survival and dispersal processes involved overtwo capture occasions. Following the conditional Arnason-Schwarz parameterization (Arnason 1973), SN
k is the survival probabilityover the k to kþ 1 period for individuals that stayed in basin N at occasion k, wNS
k is the probability of dispersing from N to S basinduring the k to kþ 1 period (wNN
k is the probability of staying), and pNk is the probability of being captured at occasion k. Capture
histories for some example fates are provided in brackets to the right; 0, not caught; N, caught in the north basin; S, caught in the southbasin; –N, caught in north basin and right censored. (C) The tagging age and seasonal structure of the parameters fitted to theWindermere pike capture–mark–recapture (CMR) data. An example of pike marked in the north basin at occasion k is shown. Overtagging ages less than 3 (i.e., a , 3) the ‘‘small-pike’’ parameterization was used; ‘‘large-pike’’ parameterization was used for a � 3.Typically, the individual size covariate was applied for small-pike parameters because size-related processes were hypothesized to bemost pronounced for these individuals. There was no tagging during winter occasions, and all winter occasion recaptures were censored(all were killed); therefore, survival and dispersal parameters were constrained to be similar across spring-to-winter and winter-to-springoccasions (i.e., no seasonal variation). Capture probability parameters were possible to model for all occasions, and here we modeledwith tagging age structure on winter (w) capture probabilities, but not for spring (sp) capture probabilities because the individuals wereassumed to have grown into the ‘‘large-pike’’ group at one year following tagging.
THROND O. HAUGEN ET AL.486 Ecological MonographsVol. 77, No. 4

nets, and by recreational anglers. The anglers’ reports of
tagging sightings were not included in this analysis
because of a need to discretize the data into distinct
sampling occasions (see CMR modeling; Fig. 2A). As
recreational fishing goes on throughout the year this
part of the data did not fit into the discretization criteria.
The seine netting ceased in 1953, but the other capture
methods have been continued to the present with
varying degrees of sampling effort as described most
recently by Paxton et al. (1999) for gill nets and Paxton
et al. (2004) for perch traps. The gill nets were of two
mesh sizes: 46 mm and 64 mm (Kipling and Le Cren
1984). There are no indications of reduced performance
or survival that can be traced back to the sampling
method used for accessing tagging individuals. In fact,
for some batches 87% of the tagged individuals were
subsequently recaptured (Kipling and Le Cren 1984),
which is a very high recapture rate in fish. Gillnetting is
generally considered a rough and so potentially damag-
ing method for sampling of fish, especially for tagging
and release, and small individuals are more likely than
large individuals to be injured by the sampling process
(gill damage). In contrast, the individuals retrieved by
perch trapping and seining are unaffected by such
factors. We therefore tested whether sampling method
influenced length-specific survival over the first year
following tagging by grouping the tagged individuals
according to the sampling method from which they were
retrieved. By fitting a general Cormack-Jolly-Seber
model to a particularly data-rich subset of the CMR
data series (1949–1965), we found a general tendency
that seine- and perch-trap-caught pike had slight, but
nonsignificant higher length-specific survival probabili-
ties than gill net caught individuals (T. O. Haugen, I. J.
Winfield, L. A. Vøllestad, J. M. Fletcher, J. B. James,
and N. C. Stenseth, unpublished data). In addition to the
spring (perch traps, seine nets, and gill nets), annual
winter (October–February) sampling using 64-mm mesh
size gill nets has also been performed throughout the
time series. All pike caught during this winter sampling,
including recaptured tagged pike, were killed, sexed,
measured, and aged by examination of their opercular
bones. Thus, no tagging was performed during the
winter. Owing to reduced sampling effort in recent years,
the number of pike tagged and recaptured after 1990 has
been very low. Consequently, in order to standardize the
data maximally (same tags and high sampling effort)
only data for the 1953–1990 period have been used here,
a restriction that also avoids potential complications
related to a 1990s increase in lake temperature (Winfield
et al. 2004) and expansion in the local roach (Rutilus
rutilus) population (Winfield and Durie 2004). The
utilized data thus relate to a total of 4543 tagged pike
individuals, of which 57.9% have been recaptured at
least once.
Annual age-specific abundances of both perch and
pike (Fig. 1) have been estimated using a set of standard
coupled fisheries population dynamics and catch models
(des Clers et al. 1994) and unpublished estimates (see
Appendix A for details on the estimations). The annual
abundances refer to the population size in May, which
corresponds to the month of recruitment of new cohorts.
These abundance estimates were used as covariates,
along with measurements of water temperature and
fishing effort, in the CMR modeling.
In order to allow for estimation of interactions
between and within size groups, the pike abundance
estimates were split into age-2 and older-than-age-2
abundances. This splitting into age groups of pike is
related to the growth pattern of Windermere pike, which
grow rapidly up to sizes larger than 50–55 cm at ages of
3–4 yr, after which the growth ceases rapidly in males
and slowly in females (Kipling 1983a). The importance
of various sources of mortality changes dramatically as
the pike become larger than 50–55 cm, being exposed to
cannibalism and aggressive interactions (e.g., biting) if
below this size and to the winter gill net sampling if
above it. Daily surface water temperatures were
measured in the junction area between the two basins
and are given as degree-days (i.e., the sum of daily
temperatures) of temperatures above 148C for the April–
October period (Kipling and Roscoe 1977).
CMR MODELING
Data were analyzed using a multistate capture–mark–
recapture modeling approach (Brownie et al. 1993,
Nichols and Kendall 1995; Fig. 2B). As sampling
occasions lasted for three months, we pooled all captures
into a midpoint date within each period, which is
equivalent to saying that two individuals captured less
than three months apart were defined to be captured at
the same date (Fig. 2A). Julliard et al. (2001) used a
similar approach in a study of cod (Gadus morhua)
survival. Based on previously acquired information (see
Hypotheses emerging from earlier studies of the Win-
dermere pike), we have always included basin and sex
effects in the models. Size-related processes were
assumed to be most prominent over the period
immediately following tagging (i.e., for the interval a ¼1 to a¼2: Fig. 2C). There was large heterogeneity in size
at tagging, and 82% of the tagged individuals were in the
30–50 cm interval (mean ¼ 43.7 cm). According to
hypotheses 1 and 4, we expect this size variation at time
of tagging to impose large variability in survival,
dispersal, and capture probability and, therefore, that
this should be modeled explicitly. Consequently, all
models fitted were structured according to tagging age in
which parameters for the first two time intervals
following tagging (a ¼ 1 and a ¼ 2) were constrained
to be size dependent. Virtually all individuals attain sizes
vulnerable to gill net sampling one year following
tagging (i.e., a � 3, mean size at a ¼ 3 was 62.6 cm),
and at this time most pike have grown out of size ranges
vulnerable to cannibalism (Grimm 1981). We therefore
assumed that size-related effects were most prominent
during this rapid-growth stage (i.e., during a¼1 to a¼2)
November 2007 487ECOLOGY OF PIKE DEMOGRAPHY AND DISPERSAL

and that survival, catch probability, and dispersal were
not related to size during later periods (i.e., a � 3).
Hereafter we will refer to the ‘‘a¼ 1 to a¼ 2 models’’ as
small-pike models and ‘‘a � 3 models’’ as large-pike
models (Fig. 2C).
In order to test the density dependence hypotheses
(i.e., hypotheses 2–5), we included age-2 and older-than-
age-2 pike abundances along with perch abundance as
covariates in the CMR models. Here, age-2 pike
abundance was considered the appropriate covariate
for modeling intra-size group interactions for small-pike
parameterization and, likewise, older-than-age-2 pike
abundances were used for modeling intra-large-pike
interaction parameters.
In order to check for goodness of fit (GOF) of the
models, multistate GOF tests were performed for spring
captures only (Pradel et al. 2003). Owing to censoring of
winter captures (Fig. 2B), these individuals could not be
included in the GOF tests as no test has yet been
developed for data including censored individuals. All
GOF tests were performed using the software U-CARE
2.0 (Choquet et al. 2003). Tests of whether all
individuals present at any given time on the same site
behave similarly whatever their past capture history (test
3G) and whether they are currently captured or not (test
M) indicated no deviations from these assumptions (test
3G, v253 ¼ 23.47, P¼ 0.99; test M, v2
27 ¼ 29.89, P¼ 0.32;
see Pradel et al. 2003 for detailed descriptions of the
tests). We tested the general model fit for two different
multistate parameterization approaches, i.e., the Jolly
MoVe (JMV) model (Brownie et al. 1993) and the
conditional Arnason-Schwarz (CAS) model (Arnason
1972, 1973, Schwarz et al. 1993). The JMV model differs
from the CAS model in that it permits the capture
probability for the current capture occasion to depend
on the state at both the current and the previous
occasions. Hence, the CAS model constitutes a special
case of the JMV model as it permits the recapture
probability to depend only upon the current state and
time. Even though the JMV structure seemed to fit the
data slightly better than the CAS structure (goodness-of-
fit statistics, JMV, v272 ¼ 72.3, P¼ 0.47; CAS, v2
39 ¼ 49.3,
P ¼ 0.13), a likelihood ratio (LR) test indicated no
difference in fit between the two (LR test, v234¼ 23.0, P¼
0.92). We therefore decided to use the CAS structure.
However, this decision was also motivated by the fact
that (1) this structure requires fewer parameters to be
estimated and (2) we have no a priori reason for
expecting capture probability to be dependent upon
previous captures (other than what is explicitly modeled
as size-dependent recruitment to winter occasion catch-
es). There was some degree of over-dispersion in the
general time-dependent CAS model (c¼ 49.3/39¼ 1.26).
However, this degree of over-dispersion is estimated
under a situation without influence from covariates. The
c estimate drops slightly to 1.20 6 0.09 (mean 6 SE)
when using the ‘‘median c-hat’’ approach available in
program MARK (White and Burnham 1999: Supple-
ment S) under additive influence of external covariates.
We used this c value when ranking the models.Unfortunately, there is no procedure available for
estimation of c under influence of individual covariates.Hence, the c value used in this study may be biased
upward.
Colinearity among predictor variables involved in thesame analysis may cause correlation between parameter
estimates and hence affect their inferences (Legendreand Legendre 1998). The correlation between abun-
dance estimates and temperatures ranged between 0.05
and 0.59 and might cause colinearity artifacts. However,we have no reason to believe that the results obtained
represent any artifact, as the parameter estimates weregenerally robust to inclusion/exclusion of correlated
predictor variables in the models fitted. Moreover, in
most cases we made inferences on covariate effects in anintegrated fashion among covariates.
Parameterization, model selection, and model inferences
For each individual, a capture history was constructedbased on information on (re)captures at each capture
occasion. A capture history consists of zeroes for non-
captures and N or S letters for captures in the north orsouth basin, respectively. Following Brownie et al.
(1993), the probability of a given capture history, undera multistate setting, may be estimated as a function of
(1) the probability of survival (S) from occasion k to kþ1, given alive at k and staying in or coming from basin j
(Sjk), (2) the probability of being (re)captured ( p) when
staying or entering basin i at occasion k ( pik), and (3) the
probability of dispersing (w) from basin j at occasion k�1 to basin i at occasion k (w ji
k ). As an example, imaginethat we have two individuals, (a) and (b), that have the
following capture histories: (a) NSN. . . and (b) N0S. . . .Individual (a) has been tagged in the north basin at
occasion k¼ 1, recaptured in the south basin at occasion
k ¼ 2, and recaptured in the north basin at occasionk¼ 3. Individual (b) was tagged in the north basin, not
seen at occasion k¼ 2, and recaptured in the south basinat occasion k ¼ 3. The probability of having these
capture histories can be estimated from: Pr(a) ¼SN
1 wNS1 pS
2SS2w
SN2 pN
3 . . . and Pr(b) ¼ SN1 (w
NS1 qS
2SS2 wSS
2 þwNN
1 qN2 SN
2 wNS2 )pS
3 . . . , respectively (where qik ¼ 1 � pi
k).Each of these parameters may be estimated as
functions of external and/or internal covariates. Inorder to constrain the probabilities between 0 and 1,
we used the logit link function to incorporate such
predictor variables into the models. For example, theresponse of survival to a basin (B) effect, a sex (G,
gender) effect, and a continuous covariate x is
SðB;G; xkÞ ¼eðb0þbBþbGþb1xkÞ
1þ eðb0þbBþbGþb1xkÞ
where the bs are estimated coefficients. All covariates werestandardized to mean ¼ 0 and SD ¼ 1 (see Table 1 for
standardization parameters). Parameters were estimatedby numerically maximizing the log-likelihood function
THROND O. HAUGEN ET AL.488 Ecological MonographsVol. 77, No. 4
with respect to the parameters using the software MARK
(White and Burnham 1999). To examine the contribution
of the covariates to model fit, we compared alternative
models comprising various combinations of variables
using QAICc (the corrected quasi Akaike’s Information
Criterion [Burnham and Anderson 1998], QAICc ¼ �2log-likelihood/cþ2Kþ2K(Kþ1)/(neff�K� 1), whereK is
the number of parameters, neff is the effective number of
observations, and c is the variance inflation factor).
When interpreting the relevance of the various models
fitted we used the Akaike model weight (w): wi ¼exp(�0.5DQAICci)/R exp(�0.5DQAICci), where DQAICc
¼QAICci� QAICcmin.
Following Lebreton et al. (1992), we adopted a model-
fitting strategy in which capture probability was
modeled under full temporal variation of survival and
dispersal probability and also including basin 3 sex
effects (fully basin3 sex3 time models did not converge
due to sparseness of data, hence the full model was basin
3 sexþ time). After finding the most supported capture
probability model, we continued by fitting dispersal
probability models under the most supported capture
probability model and with temporal variation in
survival. Similarly, the most supported survival proba-
bility models were found under the most supported
capture and dispersal probability model structures. In
the end, to test for model robustness, we once more
fitted capture probability models under the most
supported survival and dispersal models (J. Clobert,
personal communication). Prior to fitting models testing
for support of specific a priori hypotheses (see Hypoth-
eses emerging from earlier studies of the Windermere
pike), we checked for evidence of temporal variation
compared with constant models. The model selection
procedure was based on fitting related and alternative
hypotheses to the a priori hypotheses (e.g., test of
additivity or interaction effect of covariates). The
proportion of variation in survival and dispersal
explained by the covariates included to test the specific
hypotheses was estimated using two methods. First,
using estimates of variance components (available in
MARK [White et al. 2001]), we could estimate the
proportion of survival variation explained by the
covariates from: r2 ¼ 1 � r2cov/r
2t , where r2
cov and r2t
constitute the process variances (i.e., variances adjusted
for sampling variance) in survival in the presence and in
the absence of covariate influence, respectively (see
Loison et al. 2002). Second, we used analysis of deviance
to estimate the fraction of the total variance in survival
and dispersal explained by the covariates, being defined
as [deviance(constant model) � deviance(covariate
model)]/[deviance(constant model) � deviance(time-de-
pendent model)] (Skalski et al. 1993). We did not
perform statistical tests when exploring the specific
hypotheses presented in Hypotheses emerging from
earlier studies of the Windermere pike. We rather explore
and discuss their degree of support by comparing the
AICc values of the relevant model fitted with alternative
models. We also use information from the relevant
parameter estimates and their confidence intervals when
discussing the strength of the effect of interest.
The occasions k ¼ 2, 4, 6, etc., constitute winter
occasions (Fig. 2C). All individuals caught during winter
occasions were killed and therefore right censored. The
right censoring of all winter catches obstructed estima-
tion of seasonal survival and dispersal rates and also
necessitated some constraints on the estimation of
seasonal capture probabilities. All estimates of survival
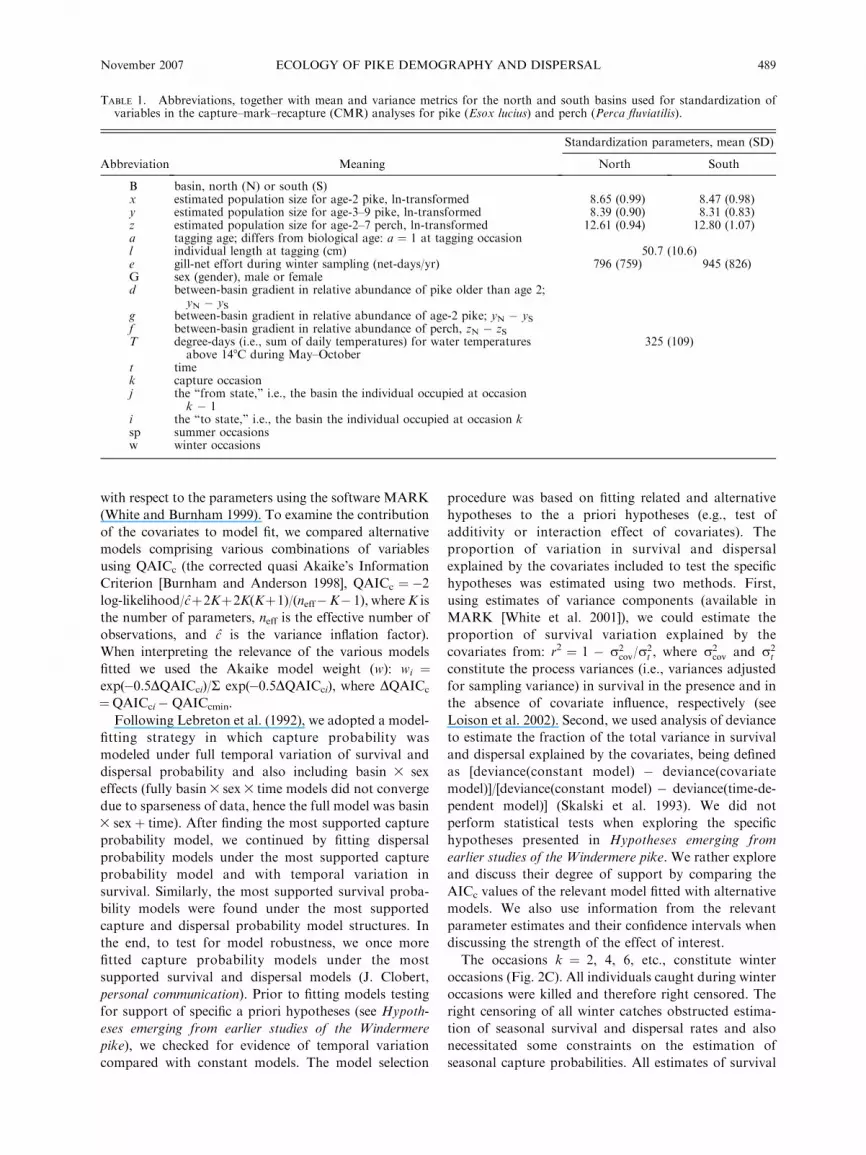
TABLE 1. Abbreviations, together with mean and variance metrics for the north and south basins used for standardization ofvariables in the capture–mark–recapture (CMR) analyses for pike (Esox lucius) and perch (Perca fluviatilis).
Abbreviation Meaning
Standardization parameters, mean (SD)
North South
B basin, north (N) or south (S)x estimated population size for age-2 pike, ln-transformed 8.65 (0.99) 8.47 (0.98)y estimated population size for age-3–9 pike, ln-transformed 8.39 (0.90) 8.31 (0.83)z estimated population size for age-2–7 perch, ln-transformed 12.61 (0.94) 12.80 (1.07)a tagging age; differs from biological age: a ¼ 1 at tagging occasionl individual length at tagging (cm) 50.7 (10.6)e gill-net effort during winter sampling (net-days/yr) 796 (759) 945 (826)G sex (gender), male or femaled between-basin gradient in relative abundance of pike older than age 2;
yN � ySg between-basin gradient in relative abundance of age-2 pike; yN � ySf between-basin gradient in relative abundance of perch, zN � zST degree-days (i.e., sum of daily temperatures) for water temperatures
above 148C during May–October325 (109)
t timek capture occasionj the ‘‘from state,’’ i.e., the basin the individual occupied at occasion
k � 1i the ‘‘to state,’’ i.e., the basin the individual occupied at occasion ksp summer occasionsw winter occasions
November 2007 489ECOLOGY OF PIKE DEMOGRAPHY AND DISPERSAL

and dispersal rates were therefore constrained to be
equal over both seasons from spring to spring (Fig. 2C),
even though the between-season time spans were slightly
different. There are no biological reasons for making
such strong assumptions. However, due to the sampling
scheme being employed, we are forced to make such
assumptions. It should therefore be made clear that all
CAS results presented in this paper are conditional on
these assumptions. We have, however, explored the
consequences for using the current parameterization by
comparing it with an annual model structure (see
Appendix B for details) and found that the two
approaches produce essentially similar results. Hence,
the parameter estimates of the seasonal model structure
used in this paper do indeed seem to provide adequate
annual values of the vital rates under study. In addition
to this, we have also explored to what degree winter
recapture rates are sensitive to variation in intra-annual
survival and dispersal (see details in Appendix B). The
results from this sensitivity analysis showed that pw-
related parameters are surprisingly robust towards
variation in intra-annual survival and dispersal con-
straints as just 5.5% (4 out of 72) of the parameter
estimates had values not confined by the corresponding
parameter estimate confidence interval for the original
model.
Since the spring capture process involved three gear
types, in which effort varied both among gears and
years, capture probabilities during spring could not
successfully be constrained by gear-specific external
covariates such as fishing effort (even though the efforts
are known). These capture probability models were
therefore fitted under maximum temporal variation,
which necessarily required a high number of parameters
to be estimated (basin 3 sex þ time models involved 36
parameters; parameters for 1986–1990 were constrained
to be similar because the number of observations was
low in this period and the same effort and combination
of sampling gear was used). As capture probability
during winter represents the probability of being caught
in gill nets during the winter program, we were
specifically interested in the recruitment process to this
sampling. This special feature of our data was used for
the exploration of hypothesis 3, namely that recruitment
of small pike to the gill net sampling is affected by the
growth conditions prevailing under the growth season
preceding each winter sampling occasion. For the
second winter sampling occasion (i.e., a ¼ 4) and
thereafter, we have assumed that all surviving individ-
uals have grown to harvestable sizes. Hence, for a . 2
the same winter capture parameterization was applied
over all tagging ages (Fig. 2C).
Since all pike caught during the winter gill net
sampling were retained and reported and because this
gillnetting is the only removal fishery occurring in
Windermere for this species, the estimated winter
capture probabilities correspond to the fishing mortality
(F ). The survival estimates could be interpreted there-
fore as natural survival estimates, although unreported
accidental mortalities due to anglers’ activities (which ingeneral is based on catch-and-release) may introduce a
minor bias towards underestimation. We could thereforeestimate components of total annual mortality (Z) from
the sum between fishing mortality (F¼Ssp-wpwSw-sp) andnatural mortality (M ¼ 1� Ssp-wSw-sp).
Factors affecting growth-related processes
Many of the models for the small pike were fitted to
test for effect of size and growth on survival and/orwinter capture probability. Owing to the fact that
individual growth patterns could only be estimated forlive and recaptured individuals, the effect of growth per
se on these parameters could not be tested directly.Based on suggestions from numerous previous studies
(e.g., Kipling 1983a, Diana 1996), we therefore includedrelevant environmental variables and their interactions
as external covariates aiming at estimating the averageeffect of growth conditions on survival and winter
capture probability. In order to test hypothesis 2, wefitted models including (temperature) 3 (perch abun-
dance) and (perch abundance)3 (age-2 pike abundance)interactions both when analyzing the CMR data and
when analyzing individual back-calculated length-at-agedata. The back-calculated lengths were estimated from
the relationship between fish length and the opercularbone radius, using year–zone (so-called annuli) radii toassess estimates of an individual’s length at the end of
each winter (Kipling 1983a). Hence, these data consti-tute estimates of each individual’s growth trajectory for
the period up to capture. Parts of these back-calculatedsize-at-age data have previously been analyzed (Kipling
1983a), but not to the same extent as the currentanalyses covering the entire 1944 to 1990 period, which
in total includes 14 543 individuals. We performed twoseparate growth analyses that covered most of the small-
pike growth intervals, namely, growth between ages 2and 3 and between ages 3 and 4. The analyses were done
by ordinary multiple linear regressions (least sum ofsquares fitting, using the ‘‘lm’’ function in S-plus; S-
PLUS version 6.1 2002; Insightful Corporation, Seattle,Washington, USA).
RESULTS
Constant vs. temporal vs. covariate models
Even though there was evidence for temporal
variation in (re)capture, dispersal, and survival prob-ability (temporal models had QAICc values that were
more than 200 units lower than models with constantbasin and sex effects; see Appendix C) this temporal
variation was more efficiently explained by thecombined effects of external and individual covariates
(covariate models had QAICc values that were 200units lower than temporal models). The individual size
covariate was extremely important. When fitting thebest model (model 1 in Table 2) without including the
individual size covariate in the small-pike parameters,
THROND O. HAUGEN ET AL.490 Ecological MonographsVol. 77, No. 4

QAICc increased by 197.2 units. The best model
explained 81% and 94% of the total and process
variance in survival, respectively. For dispersal, the
best model explained 66% and 87%, respectively. The
dynamics resulting from model 1 are visualized in
Fig. 3.
Survival, dispersal, and fishing mortality
in small pike individuals
For small pike, length at tagging was important for all
three parameter types (p, w, S) in both basins. A
pronounced sex 3 length effect (hypothesis 1) estimated
survival probability in females smaller than 55 cm at
time of tagging to be more than 0.9, whereas males in the
same size range (30–55 cm) were estimated to have
survival probabilities of 0.3–0.8 at average levels of
perch and pike abundances and temperature (i.e., 0; Fig.
4A, Tables 2 and 3). Models including interaction effects
between temperature and perch abundance (hypothesis
2) and between perch abundance and age-2 pike
abundance (hypothesis 3) also obtained high support.
According to these models, small-pike survival was more
sensitive to variation in perch and age-2 pike abundance
under cold conditions than under warm conditions, and
generally the survival probability increased with increas-
ing temperature (Fig. 5A–E). In general, all models
estimated small pike in the north basin to have slightly
lower survival probabilities than small pike in the south
basin. For small pike individuals, dispersal probability
(w) was sensitive to the between-basin difference in
perch abundance, and the highest ranked model
estimated dispersal probability to increase when perch
abundance was lower in the departure basin compared
to the destination basin (hypothesis 4). However,
dispersal in the north-to-south direction was more
sensitive to this gradient than dispersal in the south-to-
north direction. Capture probability during the winter
sampling was estimated to increase with increasing size
at tagging and was generally highest in the north basin
(Fig. 4B). Interestingly, there was no evidence of a sex
effect on small-pike winter sampling capture probability,
but models with a temperature3perch abundance effect
received high support (DAICc ¼ 3.9 compared to a
model without the interaction, but otherwise similar),
predicting that the positive effect of perch abundance is
more profound under warm conditions than cold
conditions (hypothesis 5; Table 3).
Growth analysis
The growth analysis revealed very similar basin and
sex-specific effects from the covariates on both age 2–3
and age 3–4 growth (Table 4). Temperature, perch
abundance, and older-than-age-2 pike abundance all
had a significant positive effect on growth increment,
whereas age-2 pike abundance had a negative effect on
growth increment. Interaction effects between tempera-
ture and perch abundance and between perch abun-
dance and age-2 pike abundance were significant and
had the same signs as in the small-pike survival model
(hypothesis 2; Table 3). The data did not support any
interaction effect between sex and length at age 3 on
length at age 4 (P¼ 0.18), and there was no evidence for
a basin effect on length at age 3 (P ¼ 0.90).
Survival, dispersal, and fishing mortality
in large pike individuals
For large pike, the best survival models (Tables 2 and
3) estimated survival to be higher in the north basin and
highest for males within that basin. Also, models
including an interaction effect between basin and
abundance of older-than-age-2 pike obtained high
rankings and estimated survival to be more density
dependent in the south basin compared to the north
basin (Fig. 6A). Large-pike survival probability was
estimated to be almost unaffected by perch abundance
and to increase with age-2 pike (rapid) abundance in
both basins (hence, supportive of hypothesis 3 when
combining with the results for small pike). North-to-
south dispersal for large-pike individuals was estimated
to be driven much more by between-basin relative
TABLE 2. Model ranking and fit parameters for conditional Arnason-Schwarz (CAS) models withthe change in corrected quasi Akaike’s Information Criterion (DQAICc) � 5.
Model structure for Sa¼1 DQAICc wi np Deviance
1) B þ G þ z þ x þ y þ l þ T þ G 3 l þ x 3 z þ T 3 z 0.00 0.84 74 6954.702) B þ G þ z þ x þ y þ l þ T þ G 3 l þ x 3 z 2.24 0.10 73 6959.013) B þ G þ z þ l þ T þ G 3 l þ T 3 z 2.53 0.05 71 6963.444) B þ G þ z þ x þ y þ l þ G 3 l þ x 3 z 4.41 0.01 72 6963.255) B þ G þ t 17.55 0.00 87 6945.236) B þ G 52.76 0.00 57 7042.54
Notes: All provided models are for small-pike survival modeled under the following remaindermodel structure: fSa.1(BþGþ zþxþ yþB3 yþx3 z)pa¼1,w(Bþ eþ zþ lþTþT3 z)pa.1,w(BþGþ eþB3G)pa.1,sp(B3Gþ t)wa¼1(BþGþB3 f )wa.1(BþGþdþ fþB3dþB3 f )g. Models 5and 6 constitute fully temporal and constant models, respectively. A more detailed model-rankingtable is provided in Appendix C. Abbreviation symbols are available in Table 1. Key toabbreviations: np, number of parameters; wi, the Akaike weight of model i [¼ exp(�0.5DQAICci)/R exp(�0.5DQAICci)]; deviances and DQAICc (¼ QAICci� QAICcmin) have been estimated underan inflation factor of c ¼ 1.20. The number of individuals used in the analyses is 4543, and thenumber of occasions is 74.
November 2007 491ECOLOGY OF PIKE DEMOGRAPHY AND DISPERSAL

abundance differences of both older-than-age-2 pike and
perch than was south-to-north dispersal (hypothesis 4;
Fig. 6B). Hence, for situations with similar perch
abundances (i.e., perch abundance gradient¼ 0) in both
basins a difference in older-than-age-2 pike relative
density of 1 SD unit in favor of the north basin would
produce a north-to-south dispersal probability at 0.47 6
0.12. Similarly, for a situation in which the older-than-
age-2 pike density gradient is 1 SD unit in favor of the
south basin, south-to-north dispersal probability is
estimated to be 0.09 6 0.03. Dispersal probability in
large pike individuals was generally estimated to be
higher in males than females. Winter capture probabil-
ities in large pike individuals were, for a given fishing
effort level, estimated to be significantly higher for north
basin males than for all other sex and basin combina-
tions (north males, pwi ¼ 0.42 6 0.12; remainder, pwi ¼0.30 6 0.07, for effort fixed at 0, i.e., the mean; see Fig.
7A). However, because north basin males have higher
natural survival, the total mortality rate is only slightly
higher for these individuals compared to the other
individuals (Fig. 7A). In small pike individuals, males
from both basins had much higher total mortality rates
than the females when smaller than 55 cm at tagging,
whereas the two sexes had very similar total mortalities
at tagging sizes above 55 cm (Fig. 7B, C). The relative
contribution to total mortality from fishing differed
profoundly between sexes, always increasing with
tagging length in males and remaining fairly stable in
females.
DISCUSSION
Over the last few decades there has been considerable
progress in the quantification of the effects of density-
dependent and density-independent processes on popu-
lation dynamics and demographic processes (see, e.g.,
Turchin 1995, Leirs et al. 1997, Julliard et al. 2001,
Yoccoz et al. 2001). More recently, there has also been
some interest in the quantification of the interaction
between such density-dependent and density-indepen-
dent factors (see, e.g., Coulson et al. 2001, Stenseth et al.
2004). Our study falls directly within these traditions
FIG. 3. Flow diagram of the population dynamics in the conditional Arnason-Schwarz (CAS) model described in Table 3.Arrows illustrate processes between spring sampling occasions and winter sampling occasions. Functions attached to each processarrow show the direction and magnitude (i.e., the coefficients) of the factors affecting these processes. Arrows that cross the dashedvertical line illustrate dispersal. Abbreviations of factors are identified in Table 1. Note that there is no dispersal between north andsouth basins for small pike because the small pike become large pike during the dispersal period (from spring to winter).
THROND O. HAUGEN ET AL.492 Ecological MonographsVol. 77, No. 4

and, by taking advantage of a long-term data series of
CMR data, we have provided evidence of a complex
interplay between density-dependent factors (prey and
competitors) and density-independent factors (tempera-
ture) in determining the survival and dispersal proba-
bility of pike in this large natural lake system.
Long-term CMR data do provide important information
about ecological processes
Long-term capture–mark–recapture data series are
not numerous, but when available they have a tremen-
dous potential for providing information about detailed
ecological and evolutionary processes. Because most of
them, at least for fish data series, have not been
commenced with the purpose of enlightening such
processes the data most likely violate various assump-
tions that are vital for performing CMR statistical
analyses. In the current study, this was the case as there
was no (re)release of tagged individuals during the
winter sampling occasions, a prerequisite for most CMR
models (Lebreton et al. 1992). Even though the
sensitivity analyses undertaken in this study generally
showed that most of our assumptions had little effect on
the parameters under estimation, this was not an
obvious result. For instance, Schaub et al. (2004) shows
that multistate models perform well even in situations
with temporary emigration from the sampling area.
However, this was only true if not all parameters
(survival, capture probability, and dispersal) varied over
time and provided that capture and survival probability
are relatively high. Hence, we want to emphasize that
most of the CAS results presented in this paper are
conditional on the rather strong assumption of no
seasonal variation in survival and dispersal. Even
though the parameter estimates produce estimates on
annual scales that are consistent with similar estimates
from models fitting annual rates directly (Appendix B)
and even though capture probability proved to be robust
for forced intra-annual variation in survival and
dispersal (Appendix B), one must keep this condition
in mind when interpreting the results. These sensitivity
analyses, which we believe to be a fairly unique exercise
in CMR studies, have only shown that some of the
estimates are fairly robust, but we still do not know
whether there is seasonal variation in any of the
parameter types estimated. In the future, we strongly
encourage researchers to construct CMR studies that
enable testing for the presence of seasonal variation in
these vital rates.
The specific hypotheses and relevance for pike ecology
In this study, we formulated a set of hypotheses of
particular interest in pike ecology. Clearly, these
hypotheses are also relevant for other top-predator
species with indeterminate growth, but these general
ecological aspects of our results will be discussed after
having dealt with the more pike-specific features. The
hypotheses were not tested by means of strict statistical
testing, but by exploring the significance of the
coefficients involved in the various hypotheses we will
here discuss to what degree they received support in thedata.
Hypothesis 1 tested whether small males experience alower size-related survival than small females. Sex
differences in survival of pike have been documented(see references in Craig 1996b), and some studies
indicate size-related survival (e.g., Raat 1988). However,this study provides the first quantification of size-specific
mortality in pike. The higher mortality rate of maturemale pike smaller than 55 cm (Fig. 4A) compared to
similarly sized females is supportive of hypothesis 1 and
is in agreement with earlier studies (reviewed in Craig1996a) and in particular with previous findings from
Windermere (Kipling and Frost 1970). However, males
FIG. 4. Length effects on capture and survival probabilityimmediately following the tagging occasion (a ¼ 1). Solid linesare model predictions, and dashed lines correspond to 95% CI.(A) Estimated small-pike capture probability for pike fromnorth and south basins as a function of size at tagging. This plotcan also be considered as the size-dependent recruitment curveto the winter fisheries. (B) The interaction effect of sex and sizeon half-year natural survival probability for the periodfollowing tagging. Predictions apply to pike from the northbasin where age-2 pike, pike older than age 2, and perchabundances all are fixed at 0, i.e., mean ln(abundance).
November 2007 493ECOLOGY OF PIKE DEMOGRAPHY AND DISPERSAL
surviving beyond 55 cm experience higher survival
prospects than do females. It is interesting to note that
individuals that were tagged at lengths larger than 55 cm
(but that were modeled as small pike) were estimated to
have the same sex-specific level of survival as individuals
modeled under the large-pike model (i.e., male survival
is higher than female survival; Figs. 4A and 7A). Most
of the sex differentiation in size effects on survival may
be explained by the reproductive biology of pike (Lucas
1992). During the spawning period, males are far more
active than females, they stay at the spawning grounds
for a longer period, and they are involved in extensive
territorial fights in which small males are prone to suffer
from biting by the larger males (Fabricius and Gustaf-
son 1958, Billard 1996). However, after reaching sizes
beyond about 50 cm, the gape size of other males is too
small to inflict serious bites.
The strong support for size-related variation in
natural survival and fishing mortality found within this
group of mature fish has important population ecology
consequences. Simply distinguishing between mature
and immature survival as such, which is a common
practice in fish population ecology studies, is inadequate
when performing population analyses for pike. As the
length effect was very different between sexes, both
length distribution and sex ratio should be included in
any population analysis of this species.
Hypothesis 2 tested whether survival (and growth) in
small pike is affected by the interaction between perch
abundance and temperature. Indeed the perch 3
temperature interaction coefficients were shown to be
statistically different from zero for both the survival and
growth response (Tables 3 and 4), which is supportive of
the hypothesis. By fitting both a growth and a survival
model, using the same predictor model structure, we
were able to explore the growth- and size-related
processes involved in survival in greater detail than
would have been the case if we had included only the
survival analysis. In the hypothesis 2 context, the
interaction effect between temperature and perch
abundance in both the survival model and the growth
model entails a modulation of the positive effect of
increased perch abundance such that it is less pro-
nounced under cold than warm conditions. However,
the finding that temperature has an overall positive
effect on growth, but not on survival, suggests that
surviving individuals (being involved in our growth
analysis) exhibit a different temperature-related behav-
ior than those dying (being included in the survival
analyses). One possibility would be that the dying
individuals exhibit a more risk-prone behavior than
the surviving individuals under warm conditions than
under cold conditions. This is a testable hypothesis that
should be explored in the future under controlled
conditions. The predicted rise in temperature over all
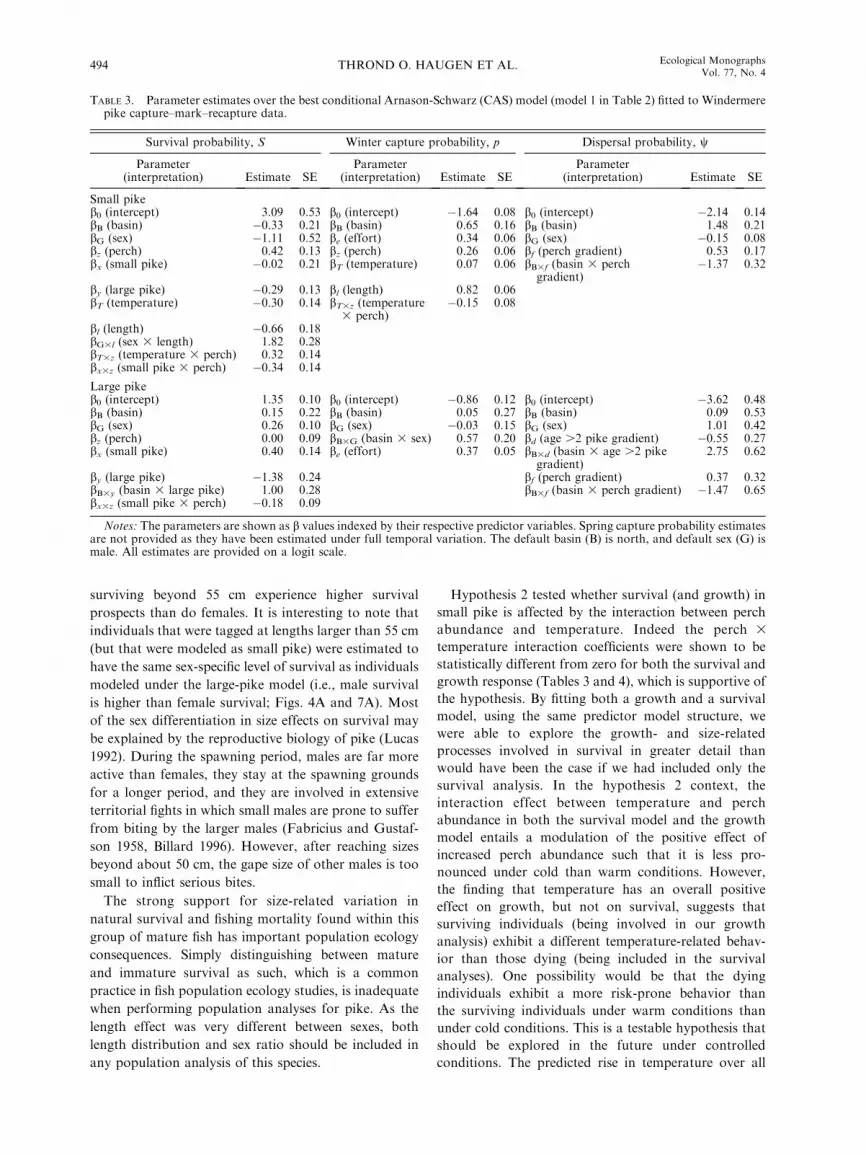
TABLE 3. Parameter estimates over the best conditional Arnason-Schwarz (CAS) model (model 1 in Table 2) fitted to Windermerepike capture–mark–recapture data.
Survival probability, S Winter capture probability, p Dispersal probability, w
Parameter(interpretation) Estimate SE
Parameter(interpretation) Estimate SE
Parameter(interpretation) Estimate SE
Small pikeb0 (intercept) 3.09 0.53 b0 (intercept) �1.64 0.08 b0 (intercept) �2.14 0.14bB (basin) �0.33 0.21 bB (basin) 0.65 0.16 bB (basin) 1.48 0.21bG (sex) �1.11 0.52 be (effort) 0.34 0.06 bG (sex) �0.15 0.08bz (perch) 0.42 0.13 bz (perch) 0.26 0.06 bf (perch gradient) 0.53 0.17bx (small pike) �0.02 0.21 bT (temperature) 0.07 0.06 bB3f (basin 3 perch
gradient)�1.37 0.32
by (large pike) �0.29 0.13 bl (length) 0.82 0.06bT (temperature) �0.30 0.14 bT3z (temperature
3 perch)�0.15 0.08
bl (length) �0.66 0.18bG3l (sex 3 length) 1.82 0.28bT3z (temperature 3 perch) 0.32 0.14bx3z (small pike 3 perch) �0.34 0.14
Large pikeb0 (intercept) 1.35 0.10 b0 (intercept) �0.86 0.12 b0 (intercept) �3.62 0.48bB (basin) 0.15 0.22 bB (basin) 0.05 0.27 bB (basin) 0.09 0.53bG (sex) 0.26 0.10 bG (sex) �0.03 0.15 bG (sex) 1.01 0.42bz (perch) 0.00 0.09 bB3G (basin 3 sex) 0.57 0.20 bd (age .2 pike gradient) �0.55 0.27bx (small pike) 0.40 0.14 be (effort) 0.37 0.05 bB3d (basin 3 age .2 pike
gradient)2.75 0.62
by (large pike) �1.38 0.24 bf (perch gradient) 0.37 0.32bB3y (basin 3 large pike) 1.00 0.28 bB3f (basin 3 perch gradient) �1.47 0.65bx3z (small pike 3 perch) �0.18 0.09
Notes: The parameters are shown as b values indexed by their respective predictor variables. Spring capture probability estimatesare not provided as they have been estimated under full temporal variation. The default basin (B) is north, and default sex (G) ismale. All estimates are provided on a logit scale.
THROND O. HAUGEN ET AL.494 Ecological MonographsVol. 77, No. 4

of the northern pike distribution area in the northern
hemisphere (Johns et al. 2003) makes this test particu-
larly pertinent. Similarly, when comparing the effect
from abundance of pike older than two years and
temperature on survival and growth we also exposed an
interesting feature as both effects were positive on pike
growth, but negative on small-pike survival. Although
this appears to be contradictory, owing to the negative
influence of large pike on small-male pike survival, the
surviving individuals, on whom we could perform the
growth analysis, seem to experience better growth
conditions due to the resulting reduction in competition.
Alternatively, or in addition to this, pike older than two
years may have a more negative impact on slow-growing
individuals (which is very likely under size-biased
cannibalism) than on rapidly growing individuals
(Grimm 1981). The first alternative constitutes a
phenotypic plastic response to increased food availabil-
ity, whereas the second one constitutes natural selection
that may, given that genetic variation is available, result
in local adaptation to a cannibalistic regime. Our data
do not allow for further exploration of these alterna-
FIG. 5. The estimated interaction effect between mean standardized perch abundance and age-2 pike abundance in half-yearsurvival of north-basin male pike for the period following tagging (a¼1) at a temperature of: (A)þ2 SD units (543 degree-days), (B)þ1 SD units (434 degree-days), (C) 0 SD units, i.e., at mean (325 degree-days), (D)�1 SD units (216 degree-days), (E)�2 SD units(117 degree-days). (F) Drop-line plot of the distribution of annual perch and age-2 pike abundances and temperatures. T values arestandardized values of water temperature sums for water temperatures above 148C during May–October. The values are providedin SD units.
November 2007 495ECOLOGY OF PIKE DEMOGRAPHY AND DISPERSAL

tives. Further studies should focus on this, as revealing
the relative role of the two processes will improve our
ability to understand the process of self-structuring in
this species and other top-predator fish species as well.
Before leaving the perch and temperature effects on
survival of small pike, we want to look at the combined
effect from these predictor variables with the effect of
small pike, i.e., how did temperature modify the density-
dependent effects of food availability (perch abundance)
and competition (small-pike abundance) on survival?
We did not formulate any a priori hypothesis for testing
this highly relevant ecological formulation, but the
combined effect of the perch 3 temperature and small
pike 3 perch interactions (Fig. 5) demonstrated that the
combined effect of competition and prey abundance is
highly modulated by temperature. In particular, we find
that if temperatures are high, an increase in perch
abundance will actually decrease small-pike survival and
particularly so if the abundance of competitors is high.
Why should an increase in prey abundance be negative
for small pike? When temperatures get high, metabolic
costs from both swimming and digestion increase
rapidly in a cold-water-adapted species such as northern
pike (Diana 1996). Further, Jones et al. (1974) have
documented that pike are very poor sustained swim-
mers, with critical swimming velocities at 0.5 body
length units per second that can only be maintained over
some two minutes. Such physiological constraints can
become critical at high temperatures as the perch, a
more warm-water-adapted species (Bergman 1987), may
have higher escape success under warmer conditions and
hence impose starvation and decreased survival in the
small pike. This situation will of course become
particularly critical if the number of competitors is high,
as energy expended on agonistic behavior, such as
territory defense, will impose further deficit to the energy
budget and lead to reduced prospect of survival.
Survival of large pike responded differently to the
interaction between perch and age-2 pike abundance
than did survival in small pike. This is in accordance
with hypothesis 3. For large pike, survival increased
with increasing age-2 pike, but not with increasing perch
density (Table 3). As both age-2 pike and perch are
potential prey for large pike the lack of positive perch
effect may seem counterintuitive. However, because
age-2 pike also eat perch and thus may compete with
larger pike, the outcome of the perch vs. age-2 pike
abundance interaction effects on large-pike survival is
not a straightforward prediction. One interpretation of
the results is that intra-size group interactions among
small-pike individuals impose more serious effects on
small-pike survival than inter-size group interactions
between small- and large-pike individuals impose on
large-pike survival. There is indication of an inter-size
group effect on large-pike survival as the increase in
survival probability with increased perch abundance is
estimated to be lower at high age-2 pike abundances
than at low abundances.
Our study demonstrates that between-basin dispersal
is driven by prey abundance gradients (both small and
large pike) and density of conspecifics (large pike only),
which is largely supportive of hypothesis 4. Models
including pike (both age-2 and older-than-age-2) abun-
dance gradient effects in small-pike dispersal consistent-
ly received less support (QAICc was consistently more
than 2.3 units larger; see Appendix C) than those not
including such effects. This finding is not in accordance
with hypothesis 4. Pike has previously been shown to
respond to density gradients by dispersing (Grimm and
Klinge 1996). Hence, we should therefore expect even
small pike to respond to such gradients. One possible
explanation for this result is that small pike disperse
over larger distances in response to decreased prey
density compared to the response to increased pike
density. Consequently, our spatial scale of dispersal (i.e.,
between-basin) would be too coarse to detect conspecific
density dependence of small-pike dispersal. There was a
net migration rate from the north to the south basin,
TABLE 4. Parameter estimates and model fit statistics for linear models fitted to age-specific back-calculated length data.
Effect
Response
ln(age-3 length) ln(age-4 length)
Estimate SE P Estimate SE P
Intercept 1.6462 0.0104 ,0.0001 1.3233 0.0114 ,0.0001Basin 0.0000 0.0004 0.9009 �0.0008 0.0003 0.0044Sex 0.0562 0.0101 ,0.0001 0.0440 0.0108 0.0001ln(age-2 [or age-3] length) 0.6354 0.0028 ,0.0001 0.7081 0.0029 ,0.0001Perch 0.0043 0.0005 ,0.0001 0.0043 0.0004 ,0.0001Age-2 pike �0.0034 0.0004 ,0.0001 �0.0024 0.0004 ,0.0001Older-than-age-2 pike 0.0022 0.0005 ,0.0001 0.0014 0.0004 ,0.0001Temperature 0.0106 0.0005 ,0.0001 0.0058 0.0004 ,0.0001Age-2 pike 3 perch �0.0037 0.0006 ,0.0001 �0.0004 0.0003 0.0813Temperature 3 perch 0.0039 0.0005 ,0.0001 0.0006 0.0003 0.0277Sex 3 ln(age-2 [or age-3] length) �0.0058 0.0027 0.0338 �0.0037 0.0027 0.1752
Notes: The model structure fitted corresponds to the best small-pike survival model (Table 3). For ln(age 3 length) and ln(age 4length), respectively, summary model statistics are: multiple R2¼ 0.86 and 0.92; F¼ 7738 and 11 570; df¼10, 13 764 and 10, 11 277;P , 0.0001 for both ages.
THROND O. HAUGEN ET AL.496 Ecological MonographsVol. 77, No. 4

which is as expected as the south basin is the most
productive basin. The dispersal probability in the north-
to-south direction may be substantial (.0.5 per season)
under conditions with steep perch and pike abundance
gradients. It is important to keep in mind the temporalresolution of the current dispersal results as theydemonstrate that Windermere pike have quite high
levels of between-basin dispersal from one spring to thenext spring (i.e., annual scale). Knowing that pike
individuals may move over several kilometers in a few
FIG. 6. Density-dependent effects on survival and dispersalin pike larger than 55 cm (a . 1). (A) Estimated naturalsurvival probability in a . 1 pike as a function of standardizedolder-than-2-years pike abundance and basin. Values areadjusted to mean standardized ln(abundances) of perch andage-2 pike abundances (i.e., 0). Solid lines are modelpredictions, and dashed lines correspond to 95% CI. (B)Estimated simultaneous effects of between-basin abundancegradients of perch and pike older than age 2 on dispersal oflarge male pike. The abundance gradients have been estimatedas the difference in standardized abundance between north andsouth basins (hence, high values indicate high relativeabundance in the north basin compared to the south basin).Only male predictions are provided because the sex effect wasadditive in favor of higher male dispersal probability (Table 3).Red and blue surfaces are for north-to-south and south-to-north dispersals, respectively.
FIG. 7. Natural, fishing, and total mortality by pike sex andbasin (N, north; S, south). The relative contributions fromnatural mortality (M) and fishing mortality (F ) to the totalmortality (Z) are shown for (A) large pike (mean and 95% CI),(B) female small pike, and (C) male small pike. In (B) and (C)the mortality rates are given as functions of size at tagging. Allrates have been estimated from the best model (Table 3) andconstrained to mean abundance of pike and perch and meanfishing effort.
November 2007 497ECOLOGY OF PIKE DEMOGRAPHY AND DISPERSAL
hours (Diana et al. 1977, Chapman and Mackay 1984)
they may indeed move between basins essentially
instantaneously (the spatial extent of Windermere being
7 km between basin midpoints).
In hypothesis 5, recruitment of small pike to the gill
net sampling was estimated to be significantly affected
by the interaction between perch abundance and
temperature. We expected this to be case because the
fishing gear used during the winter fisheries is highly size
selective (gill nets with mesh size 64 mm) and hence
should capture fish that grow rapidly into sizes at risk
for the gill net captures. Hence, the fishery recruitment
process is hypothesized to be highly related to the
individual growth process. Indeed, that is the case for
the Windermere pike as temperature and prey abun-
dance (perch) have a pronounced positive effect on both
processes. However, the sign of the perch3 temperature
interaction effect differs between the two processes. As a
consequence, high temperatures reduce the positive
effect from high perch abundances for the fishery
recruitment process, whereas the opposite is the case
for individual growth. This discrepancy seems most
likely linked to temperature-related changes in behavior.
As mentioned above, perch is favored under warm
conditions as pike experience higher metabolic costs
from both swimming and digestion and have low critical
swimming velocities that can be sustained for just a few
minutes (Jones et al. 1974, Bergman 1987, Diana 1996).
Consequently, perch may have higher escape success
under warm than under cold conditions. The optimal
feeding behavior for pike under warm conditions is
therefore to reduce swimming activity and wait for the
prey. In particular, this should be the case under high
perch abundances as the frequency of prey encounters
will then be higher due to a higher prey density. Such
reduced swimming activity at high temperatures and
perch abundances will make the pike less susceptible to
gill net captures and thus constitute a candidate
mechanism for explaining the discrepancy in the
temperature 3 perch abundance interaction effect
between the growth and fishery recruitment processes.
The generality of this study
Due to the unique and detailed long-term data
available for the Windermere system, we have been able
to study ecological process in more detail than has been
feasible using other natural systems with other kinds of
data. We believe that many of the results achieved are
also applicable to other aquatic top predators, at least
for aquatic top predators with indeterminate growth and
cannibalistic propensities. We also believe that the
results shed light on important ecological and evolu-
tionary processes.
Survival, growth, and harvest rate for small pike were
all shown to be density-dependent processes that were
modulated by temperature. Since climate change models
now predict that global temperatures will rise by the
order of 0.18–0.68C per decade (IPCC 2001), any
temperature-sensitive demographic process has the
potential to affect future population dynamics and also
evolution. An increasing number of review papers
demonstrate that climate forcing has an important
impact on the dynamics of both terrestrial and aquatic
populations (Stenseth et al. 2002, Crick 2004, Lehodey
et al. 2006, Sutherland 2006). Climate impact on
individuals and populations may operate either directly
through physiology (metabolic and reproductive pro-
cesses) or indirectly through the ecosystem, including
prey, predators, and competitors. According to Stenseth
et al. (2002) there are at least five effects to consider:
(1) Delayed effects of climate may result as climate
conditions experienced during the first year of life may
impose effects that remain throughout life. For cohorts
growing up under harsh conditions individual size may
remain small throughout life, and the cohort that
remains small will produce few recruits. In pike, this
effect may be particularly pertinent due to the influence
of cannibalism. Individuals growing up under cold
conditions with low food availability will, due to their
reduced growth (Table 4), result in a cohort with
prolonged exposure to cannibalism, and hence, impose
additional reduction of this cohort. This is an example
of interaction effects between two density-dependent
factors (food availability and cannibalism) and the
density-independent factor of climate (temperature) that
imposes delayed effects on the population (reduced
abundance for older individuals and reduced recruit-
ment).
(2) Climate factors often have differential effects on
groups within the population such as sex and age
groups. As a consequence, the effect of climate factors
on population dynamics will depend on the age and sex
structure (Coulson et al. 2001). For the pike in Win-
dermere, we found that survival in large (adult)
individuals was insensitive to temperature, but small
(subadult) pike were highly sensitive to temperature.
Hence, owing to this differential response a change in
temperature may impose age structure changes in this
population in the future.
(3) Climate change may lead to a higher frequency of
extreme events, which often are ecologically more
relevant than are fluctuations in the mean climate
(Seastedt and Knapp 1993, Chan et al. 2005). For the
Windermere pike, both extremely low-temperature
summers and extremely warm summers had a negative
impact on small-pike survival, but this effect is highly
dependent upon the food and competition situation.
Hence, in pike extreme events may impose changes in
the population dynamics, depending upon the manner in
which the perch population responds to the same events.
(4) Direct effects of climate may affect the entire
organism as such or other organisms upon which the
focal organism is directly dependent. For instance, direct
negative climatic effect on just one out of two competing
species will encourage expansion of the non-affected
species (e.g., Sætre et al. 1999). In the Windermere pike
THROND O. HAUGEN ET AL.498 Ecological MonographsVol. 77, No. 4

and perch system, differential direct effects of climate
may significantly affect the predator–prey relationship
as perch may be favored by an increase in water
temperature.
(5) The fifth climate effect mechanism described in
Stenseth et al. (2002) notes that the population response
to climate variation may ultimately depend upon levels
of density-related factors, measured as an interaction
effect. The existence of interaction effects between
climate factors and density-dependent factors is little
considered in classical age-structured fisheries assess-
ment models. In fact, until very recently most such
models assumed that the stock recruitment process was
the only population process under the influence of
density-dependent mechanisms (Rothschild 1986, Hil-
born and Walters 1992). More recent studies (e.g.,
Jenkins et al. 1999, Lobon-Cervia 2006) demonstrate
that other demographic processes also are under
density-dependent regulation, even in marine species
(Helser and Almeida 1997, Stenseth et al. 1999). In fact,
density-dependent growth has been proposed to be the
key mechanism in the regulation of fish populations
(Lorenzen and Enberg 2002). In the current study, we do
not show only that both demographic processes and
growth are influenced by density-dependent factors, but
also that the degree of density dependence is modulated
by temperature. Such interactions have received little
attention in fish population biology studies. Examples
from terrestrial systems demonstrate that failing to
detect such interactions may lead to spurious relations
between climate and the process studied (Forchhammer
et al. 1998, Post et al. 1999). We therefore encourage fish
population biologists to address this issue in future work
in order to explore the manner in which such common
interaction effects exist in fish populations and to what
extent they affect population dynamics.
The basin specificity of dispersal (and survival) is an
interesting result that may illuminate both general
evolutionary as well as ecological hypotheses. For
instance, our results support predictions made by the
balanced dispersal hypothesis of McPeek and Holt
(1992). Their analysis showed that when carrying
capacities vary both spatially and temporally, as is
likely to be the case for the two basins comprising
Windermere, natural selection will favor only two
genotypes (a high-dispersal and a no-dispersal geno-
type). They further show that this dimorphism can be
invaded by one genotype with a particular combination
of habitat-specific dispersal propensities in a ratio
inversely proportional to the ratio of the population
sizes. Our results cannot be used for evaluating which
one of the two alternatives is the case in Windermere as
we do not have information on any possible correlation
between spatial variation in dispersal ‘‘willingness’’ and
genetic variation. In order to explore this further,
experiments with pike from the two basins will have to
be performed under common garden conditions (i.e.,
varying density).
The basin-specific dispersal differentiation found in
Windermere pike may also shed light on population
dynamic theories. According to many recent dispersal
studies (reviewed in Hanski 2001), dispersal may not
only impose effects on population growth rate and
density, it might even change the type of population
dynamics, most often by simplifying what would be
complex dynamics if the populations lived in isolation
(Dieckmann et al. 2000). Pascual (1993) demonstrates
that low dispersal values drive otherwise periodic
predator–prey systems into aperiodic behavior (chaos).
The asymmetries found in basin-specific survival and
dispersal may also be related to theories dealing with
distributional processes. For instance, the well-studied
ideal free distribution theory of Fretwell and Lucas
(1970) may be explored in light of our results. By
including information on density-dependent fecundity
for pike in Windermere we were able to estimate basin-
specific density dependence of fitness. This enabled us to
test the real-scale relevance of the ideal free distribution
(IFD) theory by using the Windermere pike results
(Haugen et al. 2006). Indeed, the results indicated the
Windermere pike to be ideally free distributed. This
demonstration of the full-scale relevance of the IFD
theory provides fisheries management with a convenient
and simple tool for predicting distributional responses to
harvesting, and it also highlights the point that
population studies should include the potential for
habitat selection (Morris 2006).
Many predator species are so-called self-regulating, a
phenomenon that is characterized by a constant size/age
structure over time. This phenomenon most often arises
in cannibalistic systems in which the victim : cannibal
size ratios are small. Typically, as in pike (Persson et al.
2006), recruitment of juveniles is controlled by canni-
balism from older/larger individuals (see e.g., Tonn et al.
1994, Frankiewicz et al. 1999, Moksnes 2004, Wise
2006). In the current study of adults only, we found
evidence that males seem more susceptible to lethal
interactions with conspecifics than females. Even though
the mortality rate is high for small males, this is
probably not as important as a population-regulating
force as the cannibalism on juveniles has proven to be in
other pike and top-predator studies. The reason for this
is that recruiting, juvenile pike are vulnerable to
cannibalism from a far larger proportion of the pike
population than adult males simply because they are
smaller than the critical size limited by the gape width of
potential cannibals (Nilsson and Bronmark 2000).
Furthermore, because juvenile and small pike eat the
same prey, smaller and younger individuals will suffer
from both inter-cohort competition for food and inter-
cohort cannibalism. This was evident at the small-pike
and large-pike level in this study in which the observed
negative effect from large pike on small-pike survival
was larger than the influence from abundance of small
pike, as would be expected in any system in which
cannibals and their prey share common resources
November 2007 499ECOLOGY OF PIKE DEMOGRAPHY AND DISPERSAL
(Claessen et al. 2000, Persson et al. 2004). We want to
highlight the finding that even adult, male pike
experience substantial size- and density-dependent mor-
tality that most likely can be attributed to cannibalism,
but it still remains to be explored whether this source of
mortality is as important a self-regulating mechanism as
is juvenile cannibalism.
Altogether, our study provides explicit estimates of
the influences of and interactions between key environ-
mental variables with respect to a number of vital rates
involved in population dynamic processes. To the best
of our knowledge, this is the first study to have
disentangled the simultaneous influences of density-
dependent and density-independent processes on surviv-
al, dispersal, and fishing rates under the influence of
individual size. Thus, incorporating density dependence
and density independence in these vital rates will
certainly add to the literature of density dependence
vs. density independence, which to a large extent refers
to total populations sizes only (see, e.g., Turchin 1995).
Improved understanding of the manner in which the
density-dependent and density-independent processes
are mediated through the vital rates will certainly
improve our ability to manage pike and perch systems
in a sustainable manner. Here we demonstrated that
information encompassed in time-series data for study-
ing ecological and evolutionary processes is invaluable.
We encourage research institutions to continue such
time series as these time-series studies may hold the
information needed for understanding and predicting
effects from climate change and hence the tools for
construction of the proper mitigation actions.
ACKNOWLEDGMENTS
This study received specific support from the ResearchCouncil of Norway (141170/720 and 141170/S30) and alsobenefited from general support to the Centre for Ecological andEvolutionary Synthesis (CEES) of the University of Oslo. In theUnited Kingdom, the work was supported by funding from theNatural Environment Research Council to the Centre forEcology and Hydrology. We are indebted to Sophie des Clersand John Beddington for their kind provision of unpublishedmodel parameter estimates used for estimating population sizesof Windermere pike and perch. Jean Clobert and Jim Nicholsare thanked for their thorough comments on an earlier versionof the paper. We are also grateful for inputs from GiacomoTavecchia and Jean-Dominique Lebreton at an early stage ofthe CMR modeling, and we also thank Tore Schweder forstatistical advice and two anonymous referees for valuablecomments that significantly improved the paper. Similar thanksgo to many colleagues, past and present, at Windermere fortheir help in the field and laboratory. We are also grateful to theFreshwater Biological Association for their joint stewardship ofthese invaluable data.
LITERATURE CITED
Altwegg, R., A. Roulin, M. Kestenholz, and L. Jenni. 2003.Variation and covariation in survival, dispersal, and popu-lation size in barn owls Tyto alba. Journal of Animal Ecology72:391–399.
Arnason, A. N. 1972. Parameter estimates from mark-recaptureexperiments on two populations subjected to migration anddeath. Researches on Population Ecology 13:97–113.
Arnason, A. N. 1973. The estimation of population size,migration rates and survival in a stratified population.Researches on Population Ecology 15:1–8.
Bergman, E. 1987. Temperature-dependent differences inforaging ability of 2 percids, Perca fluviatilis and Gymnoce-phalus cernuus. Environmental Biology of Fishes 19:45–53.
Billard, R. 1996. Reproduction of pike: gametogenesis, gametebiology and early development. Pages 13–44 in J. F. Craig,editor. Pike: biology and exploitation. Chapman and Hall,London, UK.
Brownie, C., J. E. Hines, J. D. Nichols, K. H. Pollock, and J. B.Hestbeck. 1993. Capture–recapture studies for multiple strataincluding non-Markovian transitions. Biometrics 49:1173–1187.
Bucke, D., G. D. Cawley, J. F. Craig, A. D. Pickering, andL. G. Willoughby. 1979. Further studies of an epizooic ofperch, Perca fluviatilis L., of uncertain aetiology. Journal ofFish Diseases 2:297–311.
Burnham, K. P., and D. R. Anderson. 1998. Model selectionand inferences. Springer Verlag, New York, New York,USA.
Catchpole, E. A., B. J. T. Morgan, T. N. Coulson, S. N.Freeman, and S. D. Albon. 2000. Factors influencing Soaysheep survival. Applied Statistics 49:453–472.
Chan, K. S., A. Mysterud, N. A. Oritsland, T. Severinsen, andN. C. Stenseth. 2005. Continuous and discrete extremeclimatic events affecting the dynamics of a high-arcticreindeer population. Oecologia 145:556–563.
Chapman, C. A., and W. C. Mackay. 1984. Versatility inhabitat use by a top aquatic predator, Esox lucius L. Journalof Fish Biology 25:109–115.
Choquet, R., A. M. Reboulet, R. Pradel, O. Gimenez, and J. D.Lebreton. 2003. U-Care user’s guide. Version 2.0. Centred’Ecologie Fonctionnelle et Evolutive/Centre National de laRecherche Scientifique, Montpellier, France.
Claessen, D., A. M. de Roos, and L. Persson. 2000. Dwarfs andgiants: cannibalism and competition in size-structuredpopulations. American Naturalist 155:219–237.
Clobert, J., C. M. Perrins, R. H. McCleery, and A. G. Gosler.1988. Survival rate in the great tit Parus major in relation tosex, age, and immigration status. Journal of Animal Ecology57:287–306.
Coulson, T., E. A. Catchpole, S. D. Albon, B. J. T. Morgan,J. M. Pemberton, T. H. Clutton-Brock, M. J. Crawley, andB. T. Grenfell. 2001. Age, sex, density, winter weather, andpopulation crashes in Soay sheep. Science 292:1528–1531.
Craig, J. F., editor. 1996a. Pike: biology and exploitation.Chapman and Hall, London, UK.
Craig, J. F. 1996b. Population dynamics, predation and role inthe community. Pages 201–217 in J. F. Craig, editor. Pike:biology and exploitation. Chapman and Hall, London, UK.
Crick, H. Q. P. 2004. The impact of climate change on birds.Ibis 146:48–56.
des Clers, S., J. M. Fletcher, I. J. Winfield, G. P. Kirkwood,P. R. Cubby, and J. R. Beddington. 1994. Long-term changesin Windermere perch and pike populations at the basin level.IFE Report WI/T11050d5/4, Institute of Freshwater Ecolo-gy, Lancaster, UK.
Diana, J. S. 1996. Energetics. Pages 103–124 in J. F. Craig,editor. Pike: biology and exploitation. Chapman and Hall,London, UK.
Diana, J. S., W. C. Mackay, and M. Ehrman. 1977. Movementsand habitat preference of northern pike (Esox lucius) in LacSte Anne, Alberta. Transactions of the American FisheriesSociety 106:560–565.
Dieckmann, U., R. Law, and J. A. J. Metz. 2000. The geometryof ecological interactions: simplifying spatial complexity.Cambridge University Press, Cambridge, UK.
Fabricius, E., and K. J. Gustafson. 1958. Some new observa-tions on the spawning behaviour of the pike (Esox lucius L.).
THROND O. HAUGEN ET AL.500 Ecological MonographsVol. 77, No. 4

Report of the Institute of Freshwater Research, Drottning-holm 39:23–54.
Forchhammer, M. C., N. C. Stenseth, E. Post, and R.Langvatn. 1998. Population dynamics of Norwegian reddeer: density-dependence and climatic variation. Proceedingsof the Royal Society B 265:341–350.
Frankiewicz, P., K. Dabrowski, A. Martyniak, and M.Zalewski. 1999. Cannibalism as a regulatory force of pike-perch, Stizostedion lucioperca (L.), population dynamics inthe lowland Sulejow reservoir (Central Poland). Hydro-biologia 409:47–55.
Franklin, A. B., D. R. Anderson, R. J. Gutierrez, and K. P.Burnham. 2000. Climate, habitat quality, and fitness inNorthern Spotted Owl populations in northwestern Califor-nia. Ecological Monographs 70:539–590.
Fretwell, S. D., and H. J. Lucas. 1970. On territorial behaviorand other factors influencing habitat distributions in birds.Acta Biotheoretica 19:16–36.
Frost, W. E. 1954. The food of pike, Esox lucius L, inWindermere. Journal of Animal Ecology 23:339–360.
Frost, W. E., and C. Kipling. 1967. A study of reproduction,early life weight–length relationship and growth of pike Esoxlucius L in Windermere. Journal of Animal Ecology 36:651–693.
Grimm, M. P. 1981. Intraspecific predation as a principal factorcontrolling the biomass of northern pike (Esox lucius L).Fisheries Management 12:77–79.
Grimm, M. P., and M. Klinge. 1996. Pike and some aspects ofits dependence on vegetation. Pages 125–156 in J. F. Craig,editor. Pike: biology and exploitation. Chapman and Hall,London, UK.
Hanski, I. 2001. Population dynamic consequences of dispersalin local populations and in metapopulations. Pages 283–298in J. Clobert, E. Danchin, A. A. Dhondt, and J. D. Nichols,editors. Dispersal. Oxford University Press, New York, NewYork, USA.
Haugen, T. O., I. J. Winfield, L. A. Vøllestad, J. M. Fletcher,J. B. James, and N. C. Stenseth. 2006. The ideal free pike: 50years of fitness-maximizing dispersal in Windermere. Pro-ceedings of the Royal Society B 273:2917–2924.
Helser, T. E., and F. P. Almeida. 1997. Density-dependentgrowth and sexual maturity of silver hake in the north-westAtlantic. Journal of Fish Biology 51:607–623.
Hilborn, R., and C. J. Walters. 1992. Quantitative fisheriesstock assessment: choice, dynamics and uncertainty. Chap-man and Hall, New York, New York, USA.
IPCC [Intergovernmental Panel on Climate Change]. 2001.Climate change 2001. Page 398 in R. T. Watson and T. C. W.Team, editors. Synthesis Report. A Contribution of WorkingGroups I, II, and III to the Third Assessment Report of theIntergovernmental Panel on Climate Change. CambridgeUniversity Press, New York, New York, USA.
Jenkins, T. M., S. Diehl, K. W. Kratz, and S. D. Cooper. 1999.Effects of population density on individual growth of browntrout in streams. Ecology 80:941–956.
Johns, T. C., et al. 2003. Anthropogenic climate change for1860 to 2100 simulated with the HadCM3 model underupdated emissions scenarios. Climate Dynamics 20:583–612.
Jones, D. R., J. W. Kiceniuk, and O. S. Bamford. 1974.Evaluation of swimming performance of several fish speciesfrom Mackenzie River. Journal of the Fisheries ResearchBoard of Canada 31:1641–1647.
Julliard, R., N. C. Stenseth, J. Gjosaeter, K. Lekve, J. M.Fromentin, and D. S. Danielssen. 2001. Natural mortalityand fishing mortality in a coastal cod population: a release–recapture experiment. Ecological Applications 11:540–558.
Kipling, C. 1983a. Changes in the growth of pike (Esox lucius)in Windermere. Journal of Animal Ecology 52:647–657.
Kipling, C. 1983b. Changes in the population of pike (Esoxlucius) in Windermere from 1944 to 1981. Journal of AnimalEcology 52:989–999.
Kipling, C. 1984. A study of perch (Perca fluviatilis L) and pike(Esox lucius L) in Windermere from 1941 to 1982. Journal duConseil 41:259–267.
Kipling, C., and W. E. Frost. 1970. A study of mortality,population numbers, year class strengths, production andfood consumption of pike, Esox lucius L, in Windermerefrom 1944 to 1962. Journal of Animal Ecology 39:115–157.
Kipling, C., and E. D. Le Cren. 1984. Mark–recaptureexperiments on fish in Windermere, 1943–1982. Journal ofFish Biology 24:395–414.
Kipling, C., and M. E. Roscoe. 1977. Surface water tempera-ture of Windermere. Occasional Publication Number 2.Freshwater Biological Association, Cumbria, UK.
Krebs, J. R., and N. B. Davies. 1997. Behavioural ecology: anevolutionary approach. Blackwell Science, Oxford, UK.
Lebreton, J.-D., K. P. Burnham, J. Clobert, and D. R.Anderson. 1992. Modeling survival and testing biologicalhypotheses using marked animals: a unified approach withcase studies. Ecological Monographs 62:67–118.
Le Cren, E. D. 1987. Perch (Perca fluviatilis) and pike (Esoxlucius) in Windermere from 1940 to 1985—studies inpopulation dynamics. Canadian Journal of Fisheries andAquatic Sciences 44:216–228.
Legendre, P., and L. Legendre. 1998. Numerical ecology.Elsevier, Amsterdam, The Netherlands.
Lehodey, P., et al. 2006. Climate variability, fish, and fisheries.Journal of Climate 19:5009–5030.
Leirs, H., N. C. Stenseth, J. D. Nichols, J. E. Hines, R.Verhagen, and W. Verheyen. 1997. Stochastic seasonality andnonlinear density-dependent factors regulate population sizein an African rodent. Nature 389:176–180.
Lobon-Cervia, J. 2006. Density-dependent growth in stream-living brown trout Salmo trutta L. Functional Ecology[doi:10.1111/j.1365-2435.2006.01204.x].
Loison, A., B. E. Saether, K. Jerstad, and O. W. Rostad. 2002.Disentangling the sources of variation in the survival of theEuropean dipper. Journal of Applied Statistics 29:289–304.
Lomnicki, A. 1988. Population ecology of individuals. Prince-ton University Press, Princeton, New Jersey, USA.
Lorenzen, K., and K. Enberg. 2002. Density-dependent growthas a key mechanism in the regulation of fish populations:evidence from among-population comparisons. Proceedingsof the Royal Society B 269:49–54.
Lucas, M. C. 1992. Spawning activity of male and female pike,Esox lucius L., determined by acoustic tracking. CanadianJournal of Zoology 70:191–196.
McPeek, M. A., and R. D. Holt. 1992. The evolution ofdispersal in spatially and temporally varying environments.American Naturalist 140:1010–1027.
Mills, C. A., and M. A. Hurley. 1990. Long-term studies on theWindermere populations of perch (Perca fluviatilis), pike(Esox lucius) and Arctic charr (Salvelinus alpinus). Freshwa-ter Biology 23:119–136.
Milner, J. M., D. A. Elston, and S. D. Albon. 1999. Estimatingthe contributions of population density and climatic fluctu-ations to interannual variation in survival of Soay sheep.Journal of Animal Ecology 68:1235–1247.
Moksnes, P. O. 2004. Self-regulating mechanisms in cannibal-istic populations of juvenile shore crabs Carcinus maenas.Ecology 85:1343–1354.
Morris, D. W. 2006. Ecology—moving to the ideal free home.Nature 443:645–646.
Nichols, J. D., and W. L. Kendall. 1995. The use of multi-statecapture–recapture models to address questions in evolution-ary ecology. Journal of Applied Statistics 22:835–846.
Nilsson, P. A., and C. Bronmark. 2000. Prey vulnerability to agape-size limited predator: behavioural and morphologicalimpacts on northern pike piscivory. Oikos 88:539–546.
Pascual, M. 1993. Diffusion-induced chaos in a spatialpredator–prey system. Proceedings of the Royal Society B251:1–7.
November 2007 501ECOLOGY OF PIKE DEMOGRAPHY AND DISPERSAL

Paxton, C. G. M., J. M. Fletcher, D. P. Hewitt, and I. J.Winfield. 1999. Sex ratio changes in the long-term Win-dermere pike and perch sampling program. Ecology ofFreshwater Fish 8:78–84.
Paxton, C. G. M., I. J. Winfield, J. M. Fletcher, D. G. George,and D. P. Hewitt. 2004. Biotic and abiotic influences on therecruitment of perch (Perca fluviatilis) in Windermere, U.K.Journal of Fish Biology 65:1622–1642.
Persson, L., A. Bertolo, and A. M. De Roos. 2006. Temporalstability in size distributions and growth rates of three Esoxlucius L. populations: A result of cannibalism? Journal ofFish Biology 69:461–472.
Persson, L., A. M. de Roos, and A. Bertolo. 2004. Predictingshifts in dynamics of cannibalistic field populations usingindividual-based models. Proceedings of the Royal Society B271:2489–2493.
Post, E., M. C. Forchhammer, N. C. Stenseth, and R.Langvatn. 1999. Extrinsic modification of vertebrate sexratios by climatic variation. American Naturalist 154:194–204.
Pradel, R., J. E. Hines, J. D. Lebreton, and J. D. Nichols. 1997.Capture–recapture survival models taking account of tran-sients. Biometrics 53:60–72.
Pradel, R., C. M. A. Wintrebert, and O. Gimenez. 2003. Aproposal for a goodness-of-fit test to the Arnason-Schwarzmultisite capture–recapture model. Biometrics 59:43–53.
Raat, A. J. P. 1988. Synopsis of biological data on the northernpike Esox lucius Linnaeus, 1758. Report number 30. Revision2. Food and Agricultural Organization of the UnitedNations, Rome, Italy.
Rothschild, B. J. 1986. Dynamics of marine fish populations.Harvard University Press, Cambridge, Massachusetts, USA.
Sætre, G. P., E. Post, and M. Kral. 1999. Can environmentalfluctuation prevent competitive exclusion in sympatricflycatchers? Proceedings of the Royal Society B 266:1247–1251.
Schaub, M., O. Gimenez, B. R. Schmidt, and R. Pradel. 2004.Estimating survival and temporary emigration in themultistate capture–recapture framework. Ecology 85:2107–2113.
Schaub, M., and R. Pradel. 2004. Assessing the relativeimportance of different sources of mortality from recoveriesof marked animals. Ecology 85:930–938.
Schwarz, C. J., J. F. Schweigert, and A. N. Arnason. 1993.Estimating migration rates using tag-recovery data. Biomet-rics 49:177–193.
Seastedt, T. R., and A. K. Knapp. 1993. Consequences ofnonequilibrium resource availability across multiple timescales—the transient maxima hypothesis. American Natural-ist 141:621–633.
Skalski, J. R., A. Hoffmann, and T. W. Sherry. 1993. Testingthe significance of individual- and cohort-level covariates inanimal survival studies. Pages 9–28 in J. D. Lebreton and
P. M. North, editors. Marked individuals in the study of birdpopulations. Birkhauser Verlag, Basel, Switzerland.
Stenseth, N. C., O. N. Bjornstad, W. Falck, J. M. Fromentin, J.Gjosaeter, and J. S. Gray. 1999. Dynamics of coastal codpopulations: intra- and intercohort density dependence andstochastic processes. Proceedings of the Royal Society B 266:1645–1654.
Stenseth, N. C., K.-S. Chan, G. Tavecchia, T. Coulson, A.Mysterud, T. Clutton-Brock, and B. Grenfell. 2004. Model-ling non-additive and nonlinear signals from climatic noise inecological time series: Soay sheep as an example. Proceedingsof the Royal Society B 271:1985–1993.
Stenseth, N. C., A. Mysterud, G. Ottersen, J. W. Hurrell, K. S.Chan, and M. Lima. 2002. Ecological effects of climatefluctuations. Science 297:1292–1296.
Sutherland, W. J. 2006. Predicting the ecological consequencesof environmental change: a review of the methods. Journal ofApplied Ecology 43:599–616.
Tonn, W. M., I. J. Holopainen, and C. A. Paszkowski. 1994.Density-dependent effects and the regulation of crucian carppopulations in single-species ponds. Ecology 75:824–834.
Turchin, P. 1995. Population regulation: old arguments and anew synthesis. Pages 19–40 in N. Cappuccino and P. W.Price, editors. Population dynamics: new approaches andsynthesis. Academic Press, San Diego, California, USA.
White, G. C., and K. P. Burnham. 1999. Program MARK:survival estimation from populations of marked animals.Bird Study 46:120–139.
White, G. C., K. P. Burnham, and D. R. Anderson. 2001.Advanced features of Program Mark. Pages 368–377 inWildlife, land, and people: priorities for the 21st century.Wildlife Society, Bethesda, Maryland, USA.
Winfield, I. J., and N. C. Durie. 2004. Fish introductions andtheir management in the English Lake District. FisheriesManagement and Ecology 11:195–201.
Winfield, I. J., J. M. Fletcher, D. P. Hewitt, and J. B. James.2004. Long-term trends in the timing of the spawning seasonof Eurasian perch (Perca fluviatilis) in the north basin ofWindermere, U.K. Pages 95–96 in Percids III: The ThirdInternational Percid Fish Symposium. University of Wiscon-sin Sea Grant Institute, Madison, Wisconsin, USA.
Wise, D. H. 2006. Cannibalism, food limitation, intraspecificcompetition and the regulation of spider populations. AnnualReview of Entomology 51:441–465.
Yoccoz, N. G., N. C. Stenseth, H. Henttonen, and A. C.Prevot-Julliard. 2001. Effects of food addition on theseasonal density-dependent structure of bank vole Clethrion-omys glareolus populations. Journal of Animal Ecology 70:713–720.
Zabel, R. W., and S. Achord. 2004. Relating size of juveniles tosurvival within and among populations of chinook salmon.Ecology 85:795–806.
APPENDIX A
Estimation of pike abundances from catch data (Ecological Archives M077-014-A1).
APPENDIX B
Evaluation of the seasonal conditional Arnason-Schwarz model structure (Ecological Archives M077-014-A2).
APPENDIX C
Model ranking tables (Ecological Archives M077-014-A3).
THROND O. HAUGEN ET AL.502 Ecological MonographsVol. 77, No. 4


