Embed Size (px)
Citation preview
Scientific Research and Essays Vol. 7(18), pp. 1813-1829, 16 May, 2012 Available online at http://www.academicjournals.org/SRE DOI: 10.5897/SRE11.1815 ISSN 1992-2248 © 2012 Academic Journals
Full Length Research Paper
Design and development of standalone DSP prototype for QT interval processing and monitoring
Goh Chun Seng*, Sh-Hussain Salleh, J. M. Najeb, I. Kamarulafizam, Mahyar Hamedi and Alias Md Noor
Centre for Biomedical Engineering (CBE), Transportation Research Alliance, Universiti Teknologi Malaysia, 813010
Skudai, Johor, Malaysia.
Accepted 30 March, 2012
This paper describes the development of stand alone DSP hardware for QT interval monitoring and assessment. The QT interval has been known to be an important indicator prior to Myocardial Infarction (MI) and it is important to observe and monitor any changes in the period of the QT interval. The system consists of three units. The first unit includes floating point digital signal processor, TMS320VC33 which is selected for the development of signal processing with memory circuit. The following unit includes the development of signal monitoring displays circuit with universal serial bus (USB) interface. The third unit includes the development of analog front end (AFE) circuit and merged with signal conditioning circuit. This paper discusses the principle of system design and the system has the advantages to maximize utilization by allowing modification, reconfiguration, portable, cost effective and run in stand-alone operation. As well as eligibility of on board pre-program algorithm for QT analysis which existing ECG monitoring equipment are lacking. The system had been successfully tested with algorithm for QT analysis and it is validated with healthy subject’s data files from PTB diagnostic ECG data base. Key words: QT interval, DSP processor, stand alone operation, portable.
INTRODUCTION The invention of ECG in the beginning of 20
th centuries
by Willem Einthoven remains as demanded tool and popular component until today for non-invasive method to evaluate heart condition of patients who have been diagnose with signs and symptoms in clinical environ-ment (Sandham et al., 2007). The interpretation of ECG will allow cardiologist and clinicians to understand and collect more information of electrical activity of the heart.
However, with the integration of embedded technology, the automated interval measurement of P,Q,R,S and T in the ECG recording system has became an ideal instrument for patient monitoring and supervision in clinical practice. Although, the automated measurement are well establish in the ECG recording system but recently (Kligfield et al., 2006) there are studies focuses
*Corresponding author. E-mail: [email protected]. Tel: 07-5535933.
on algorithm variation of automated QT interval measurement on commercial ECG recording system from different manufacturer.
However, the automated methods of the QT interval are already widely available for computerized electro-cardiography system (Christov, 2006), which ranges from manufactured ECG recording system to PC based system with different size and weight. Nevertheless, those commercial systems of automated QT interval measurements from different manufacturers have been utilize in studies to predict heart concern, (Kligfield et al., 2006) but due to different automated QT interval in the system with different automated algorithm from different manufacturers which can affect the identification and quantification of the acquired ECG, which means that different automated of QT measurement algorithm produces variation and error when validated against manually annotated QT database.
The QT interval measurement is crucial and it is used as an informative index to predict sudden death due to
1814 Sci. Res. Essays cardiac arrhythmias (Malarvili et al., 2005). The indication of cardiac arrhythmias is related to the duration of the QT interval and it is important to observe and monitor any changes in the period of the QT interval (Mneimneh et al., 2006).
Traditionally, QT interval measurements of patients are interpreted manually from ECG strip paper printed by ECG recording machines, the measurement are dependent and costly, if require skillful and experienced cardiologist or physician to carry out the manual procedures (Malik, 2004). Therefore the Food and Drug Administration (FDA) has initiated the encouragement to recommend digitizes ECGs and it is highlighted by Badilini (2005) as an efficient way to triggered the interest toward algorithm based ECG analysis.
Given the fact that, commercial automated QT interval measurement with signal analysis capabilities is an expensive customize systems (Oweis and Hijazi, 2006), the reason are, the first; systems development timeline are strictly bounded by procedures from regulator. Second, it is intended to be use in clinical practice for human subject only (Saviola, 2005). Thus, only authorize manufacturer is given the mandate by regulator to make modifications and improvements toward improving speed and efficiency of the commercial system (Kaplan et al., 2004). Therefore, that restriction by regulator will be a financial challenge for researcher’s to acquire various types of instruments with QT interval measurement for just to harvest the raw ECG from patient and do offline QT analysis on computer. It is clearly to shows that, the commercial automated QT interval measurement systems are not subject for any research purposes in term of reprogrammable the QT algorithm on those commercial systems for ECG data analysis.
Therefore, in this paper we introduce the development of an automated standalone system which is focused on portability, standalone operation and low cost QT interval measurement device. This standalone system is using Digital Signal Processor (DSPs) technology to accomplish the real time QT interval measurement from the tapped ECG and it is reprogrammable with simplest to more complex QT algorithms; ranges begin with simple beat to beat detection followed by advanced diagnosis for disorder heart disease. There are various systems applications in ECG parameters analysis have been reported (Mohammad et al., 2003; Gorup et al., 2000; Kara et al., 2006) but none of them describes a real time QT interval measurement regarding standalone ope-ration, portability and low cost device.
The high computational performance of Digital Signal Processor is sufficient to implement a standalone system without any host controller, such as computer. It is also a highly flexible standalone system and can be easily reprogrammed (Soon et al., 2001). Therefore, the advantages of the proposed standalone system, will allow cooperation between the researcher and cardiologist to work on implementation of QT algorithm development
with on board reprogrammable function which is lacking in the existing commercial automated QT interval measurement systems. METHODOLOGY The architecture layout of the system
The main components of the standalone system design will be described in stages according to the logically organization. The description will begin with Analog Front End Unit, follow by Signal Monitoring displays Unit, Signal Processing with Memory Unit and
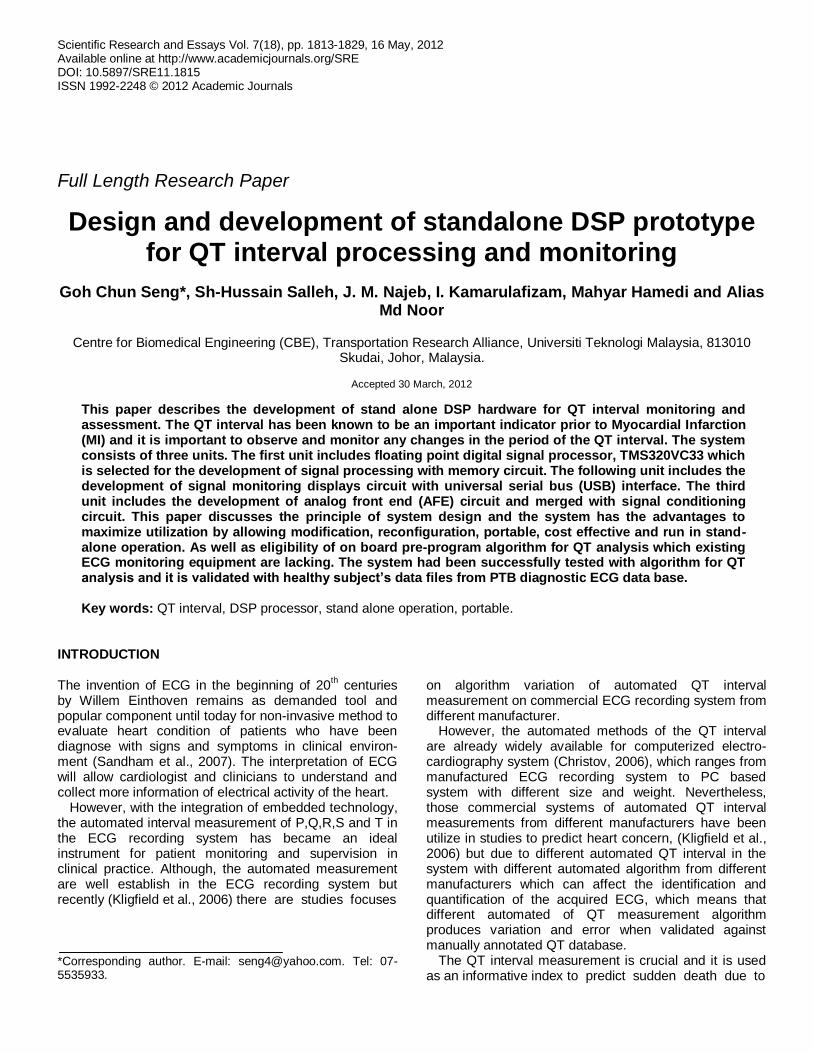
Power Supply Unit. All the stages of the process will be described. Figure 1 is the block diagram of the stand alone system and the way of components are interconnected and interrelated.
Signal processing with memory unit This unit is focuses on incoming ECG from codec chip set for signal
processing. There are few major components are used in the signal processing with memory unit. The mains components are 32 bit floating point DSP processor (TMS320VC33), Electrical Erasable Programmable Read only Memory - EEPROM (CAT28LV64W) and Static Random Access Memory - SRAM (CY7C1041DV33). The origin of DSP processor itself is design to handle mathematical and algorithm application and it is inefficient as a task oriented controller. For the SRAM memory in this unit is to allow for ECG
data storage and the SRAM memory are expandable in both the data bus and address bus width.
Analog Front End (AFE) Unit
This unit provides interaction through peripherals connectivity with the real world environment. The peripherals are remote or pluggable analog front end devices either ready made or
commercial or custom build ones to allow converted input signal to be delivered into the main board. Figure 1 shows that the tap ECG is delivered to the main board through the custom build AFE device. This AFE input consists of: (a) Signal conditioning circuitry (SCC), (b) Codec chip.
The SCC is needed to amplify the tap ECG (0.5 to 5mV peak to peak) to at least the gain of 1000 (Najeb et al., 2005). Noises are common for tap ECG signal from body skin surface. Therefore, this
SCC is build with instrumentation amplifier (INA121P) with low noise differential signal acquisition in order to minimize noise interference. The output from SCC is connected to codec chip set (PCM3003) to interface with TMS320VC33 in the main board.
The codec chip is fully controlled by hardware setting and the data formats are 16 bit. Then the data transmission is only clock in and clock out in sequence from the codec chip set. So, it is need not depending on software setting or external clocking for operation.
Signal monitoring unit
This unit provides display on graphical liquid crystal displays (GLCD) for monitoring ECG as shown in Figure 1. In this unit, the microcontroller, PIC18LF452 is configured to interact with graphical liquid crystal displays (GLCD). The microcontroller is added in this
unit without interrupting the TMS320VC33, because the microcontroller performs best in tasking order, which capable of
Seng et al. 1815
Signal processing with
Memory unit
Main Board
Remote socket
DSP
USB
ROM
RAM
Microcontroller
GLCD
Codec
SCC
ADC
Analog Front End unit
Signal monitoring
displays unit
Figure 1. Block diagram of the stand alone system. The core processor is a floating point, Digital Signal Processor,
TMS320VC33. The capture ECG signal is display on the Graphic LCD (128x64 dot pixel). l.
task orientation and lack of DSP terms. However, the ADC0820 received the input from the tap ECG signal through signal conditioning circuit (SCC) and the converted ADC data is latch to the output port of ADC0820. Then the tap ECG signal from SCC output was capture and converted by 8 bit Analog to Digital Converter chip set (ADC0820) and translated by PIC18LF452 into GLCD code in order to display on the GLCD.
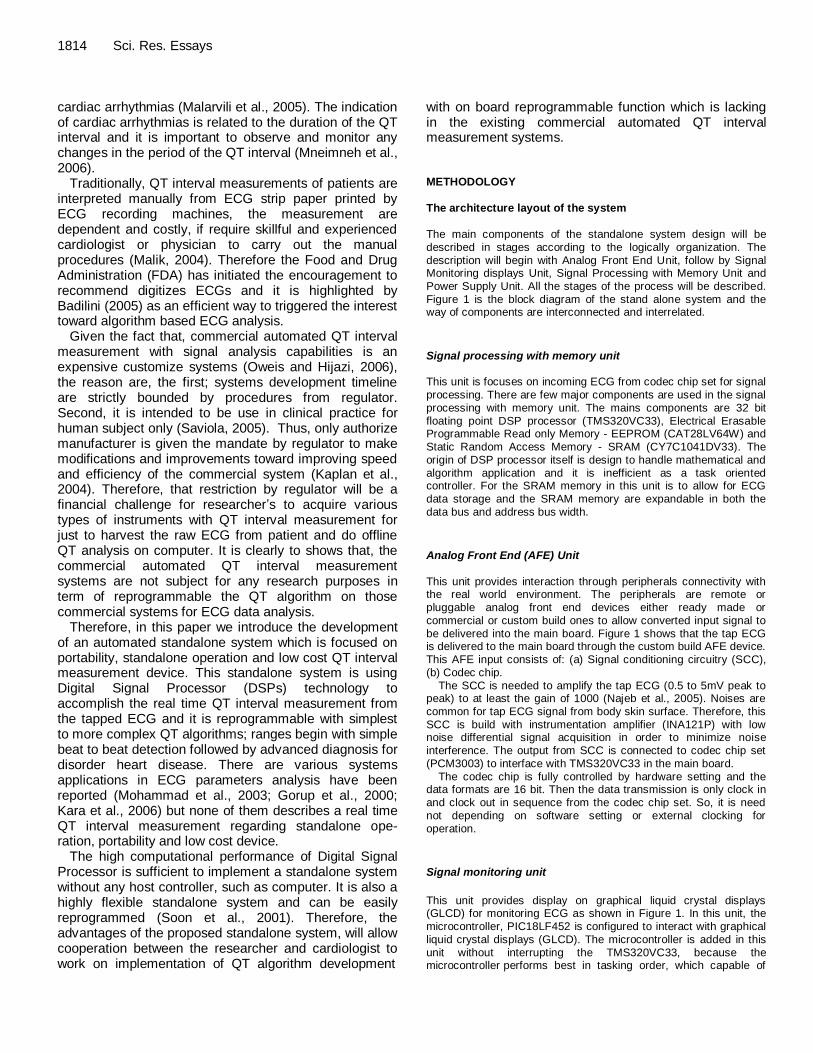
Figure 2, shows that, upon initialization, the microcontroller put to observe the FT245RL chip set to get acknowledge and the observation is done through Port A of PIC18LF452. As the acknowledge signal is detected, and then the firmware will proceed to next step’s label as ‘A’. If there is no feed back for acknowledge signal by the FT245RL, then in this case, the next stage will begin with monitoring the external interrupt and the firmware loops. If the interrupt is detected, PIC18LF452 will initialize the Graphic LCD
panel and begin to read the ADC data from Port C of PIC18LF452. After that, the tap ECG is put on GLCD screen to display as the ECG monitoring signal.
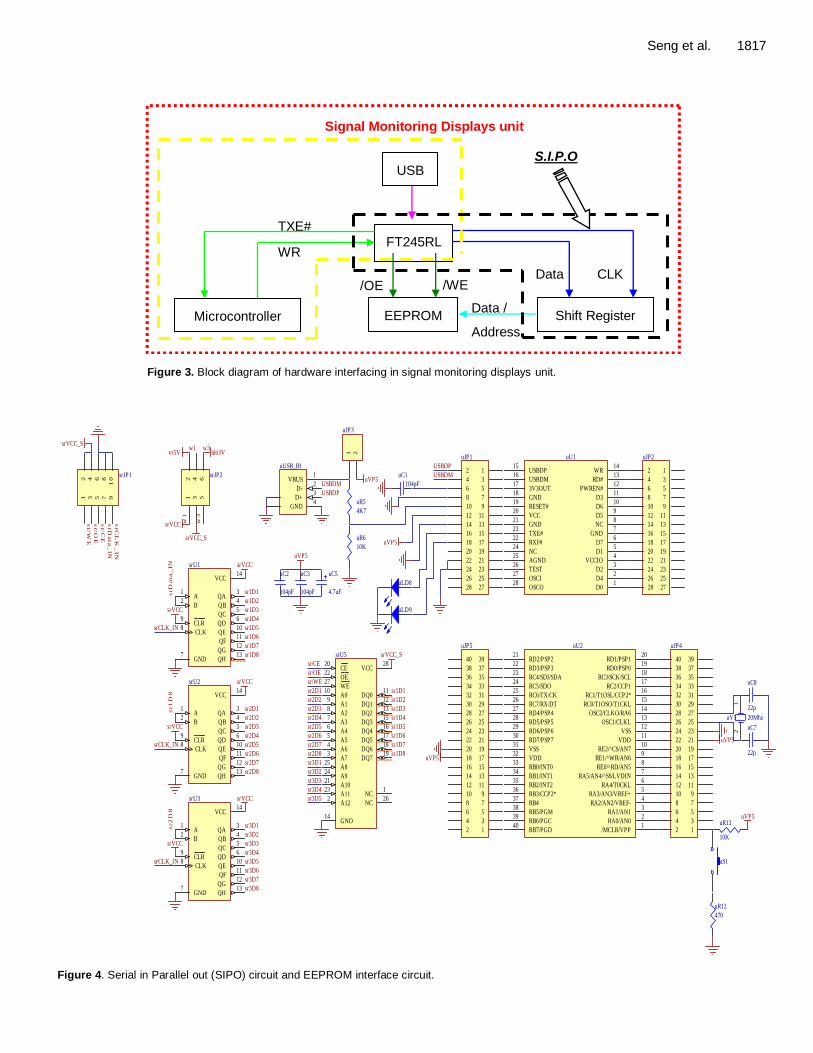
As depicted in Figure 3, there are two categories in the signal monitoring displays unit. The first category is the microcontroller with USB interfacing, colored with yellow dotted line. The FT245RL provides pin WR and pin RD# which are functions as write and read with 128 byte and 256 byte buffers in the FT245RL. The functions of the WR and the RD# pins are associated with pin TXE# and pin
RXF# to indicate the buffer status, either it is empty so that written process is allowed to proceed or whether the buffer is full so that the read process can be executed. However, only pin WR and pin TXE# from FT245RL are utilized and both of these pins are connected to PIC18LF452. When TXE# is in LOW state means that the write buffer is ready and the data is awaiting at the FT245RL buffer. Then, the WR pin is toggled by PIC18LF452 from the HIGH state to LOW state, in order to transfer the data in bulks of 128 bytes into the EEPROM. The EEPROM enable by setting both
CE and WE pins are in LOW state and the OE pin is in HIGH
stage.
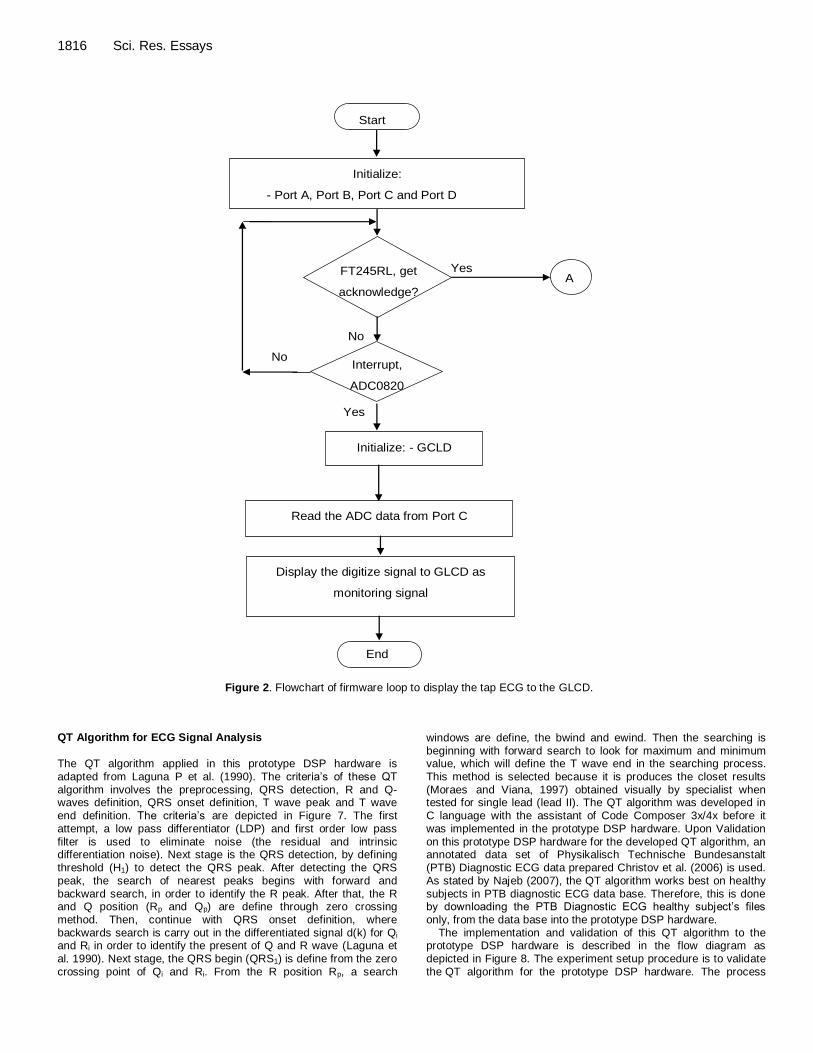
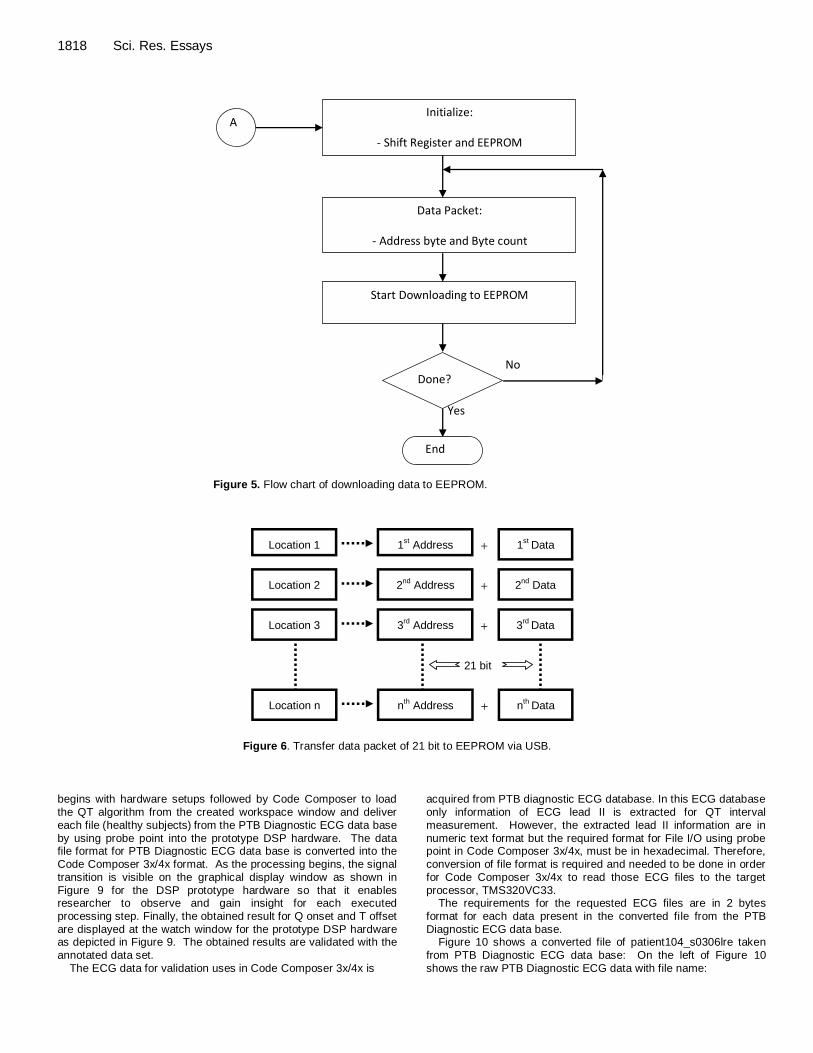
The lengths of the data in bulk mode are 21 bits and the transfer mode is in serial. Therefore, the 74HC164 with 8 parallel output is connected in cascade of 3 units in a row, so that this connection will allow the 21 bits of data to transfer as serial in and parallel out from the 74HC164. Figure 4 shows the circuit for microcontroller with USB interfacing and serial in parallel out circuit in signal monitoring displays unit. In Figure 5 shows the firmware loops and downloading process for pre-program ECG algorithm into the EEPROM in serial packet of address and data via USB connectivity.
The firmware begins with the initialization of EEPROM and the shift register. After that, the download begins with sequence of 21 bit per packet in serial format. Hence, the 21 bit per packet is shifting into the EEPROM by three shift register -74HC164 cascade in serial with each shift a byte of address and data into the EEPROM. The format of 21 bit per packet of address and data is
depicted in Figure 6. The shift register is connected with FT245RL and it is monitored by PIC18LF452 to manage the elapse period of data transfer and will received acknowledge after data transaction is completed.
Power supply unit
This prototype DSP hardware is designed to utilize the USB power. The focus is on low power consumptions. The USB voltage is regulated by TPS77533 and TPS77618 to provide necessary power demand in signal processing with memory unit, signal monitoring displays unit and analog front end (AFE) unit. Both of the voltage regulators are low drop out (LDP) voltage regulator. The ranges of different power supply are group as the following:
i. 1.8V for DSP processor core supply.
ii. 3.3V for DSP processor I/O pins and External Memory chip set. iii. 3.3V for Microcontroller. iv. 5.0V for Voltage regulator.
1816 Sci. Res. Essays
Start
Initialize:
- Port A, Port B, Port C and Port D
FT245RL, get
acknowledge?
Yes
No
A
Interrupt,
ADC0820
?
No
Read the ADC data from Port C
Display the digitize signal to GLCD as
monitoring signal
End
Initialize: - GCLD
Yes
Figure 2. Flowchart of firmware loop to display the tap ECG to the GLCD.
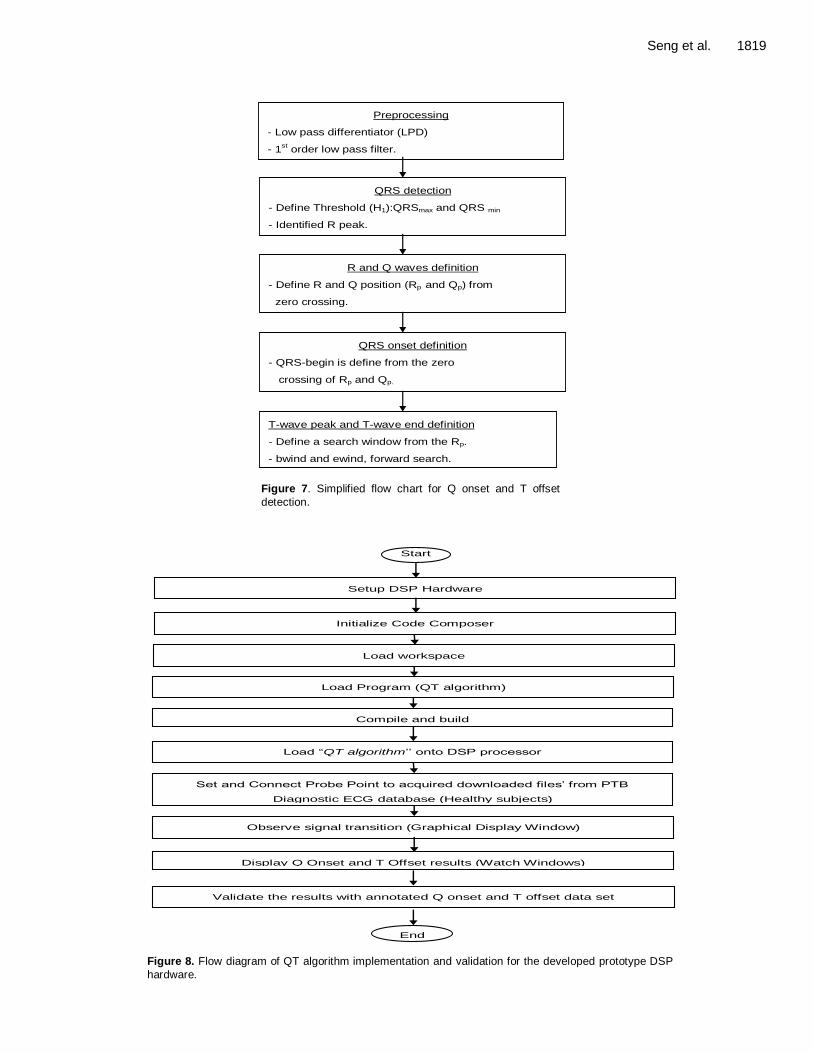
QT Algorithm for ECG Signal Analysis The QT algorithm applied in this prototype DSP hardware is adapted from Laguna P et al. (1990). The criteria’s of these QT algorithm involves the preprocessing, QRS detection, R and Q-waves definition, QRS onset definition, T wave peak and T wave end definition. The criteria’s are depicted in Figure 7. The first attempt, a low pass differentiator (LDP) and first order low pass
filter is used to eliminate noise (the residual and intrinsic differentiation noise). Next stage is the QRS detection, by defining threshold (H1) to detect the QRS peak. After detecting the QRS peak, the search of nearest peaks begins with forward and backward search, in order to identify the R peak. After that, the R and Q position (Rp and Qp) are define through zero crossing method. Then, continue with QRS onset definition, where backwards search is carry out in the differentiated signal d(k) for Qi and Ri in order to identify the present of Q and R wave (Laguna et al. 1990). Next stage, the QRS begin (QRS1) is define from the zero crossing point of Qi and Ri. From the R position Rp, a search
windows are define, the bwind and ewind. Then the searching is beginning with forward search to look for maximum and minimum value, which will define the T wave end in the searching process. This method is selected because it is produces the closet results (Moraes and Viana, 1997) obtained visually by specialist when tested for single lead (lead II). The QT algorithm was developed in C language with the assistant of Code Composer 3x/4x before it was implemented in the prototype DSP hardware. Upon Validation
on this prototype DSP hardware for the developed QT algorithm, an annotated data set of Physikalisch Technische Bundesanstalt (PTB) Diagnostic ECG data prepared Christov et al. (2006) is used. As stated by Najeb (2007), the QT algorithm works best on healthy subjects in PTB diagnostic ECG data base. Therefore, this is done by downloading the PTB Diagnostic ECG healthy subject’s files only, from the data base into the prototype DSP hardware.
The implementation and validation of this QT algorithm to the prototype DSP hardware is described in the flow diagram as depicted in Figure 8. The experiment setup procedure is to validate the QT algorithm for the prototype DSP hardware. The process
Seng et al. 1817
Data /
Address
USB
FT245RL
EEPROM Shift Register Microcontroller
TXE#
WR
CLK Data /WE /OE
S.I.P.O
Signal Monitoring Displays unit
Figure 3. Block diagram of hardware interfacing in signal monitoring displays unit.
CLR9
CLK8
A1
B2
QA3
QB4
QC5
QD6
QE10
QF11
QG12
QH13
VCC14
GND7
srU1
CLR9
CLK8
A1
B2
QA3
QB4
QC5
QD6
QE10
QF11
QG12
QH13
VCC14
GND7
srU3
srVCC
srVCC
srVCC
srVCC
srVCC
srVCC
srCLK_IN
srCLK_IN
srCLK_IN
sr3D8
sr2D8
sr1D8
sr1
D8
sr2
D8
CLR9
CLK8
A1
B2
QA3
QB4
QC5
QD6
QE10
QF11
QG12
QH13
VCC14
GND7
srU2
12
34
56
78
91
0
srJP1
srVCCsrD
ata_
IN
srC
LK
_IN
srD
ata_
IN
sr/W
E
sr/C
E
sr/O
E
A010
A19
A28
A37
A46
A55
A64
A73
A825
A924
A1021
A1123
A122
CE20
OE22
WE27
GND14
VCC28
DQ011
DQ112
DQ213
DQ315
DQ416
DQ517
DQ618
DQ719
NC1
NC26
srU5
sr/WE
sr/CE
sr/OE
srVCC_S
sr1D1
sr1D2
sr1D3
sr1D4
sr1D5
sr1D6
sr1D7
sr1D8
sr1D1
sr1D2
sr1D3
sr1D4
sr1D5
sr1D6
sr1D7
sr2D1
sr2D2
sr2D3
sr2D4
sr2D5
sr2D6
sr2D7
sr3D1
sr3D2
sr3D3
sr3D4
sr3D5
sr3D6
sr3D7
sr2D8
sr2D1
sr2D2
sr2D3
sr2D4
sr2D5
sr2D6
sr2D7
sr3D1
sr3D2
sr3D3
sr3D4
sr3D5
12
34
56
srJP2
srVCC_S
srVCC_S
w1
w1 w3
w3
vr5V ldo3V
12
uY1 20Mhz
uC7
22p
uC8
22p
uS1
10K
uR13uVP5
470
uR12
RC7/RX/DT26
RD4/PSP427
RD5/PSP528
RD6/PSP629
RD7/PSP730
VSS31
VDD32
RB0/INT033
RB1/INT134
RB2/INT235
RB3/CCP2*36
RB437
RB5/PGM38
RB6/PGC39
RB7/PGD40
RC6/TX/CK25
RC5/SDO24
RC4/SDI/SDA23
RD3/PSP322
RD2/PSP221
RE2/^CS/AN710
RD1/PSP120
RD0/PSP019
RC3/SCK/SCL18
RC2/CCP117
RC1/T1OSL/CCP2*16
RC0/T1OSO/T1CKL15
OSC2/CLKO/RA614
OSC1/CLKL13
VSS12
VDD11
RE1/^WR/AN69
RE0/^RD/AN58
RA5/AN4/^SS/LVDIN7
RA4/T0CKL6
RA3/AN3/VREF+5
RA2/AN2/VREF-4
RA1/AN13
RA0/AN02
/MCLR/VPP1
uU2
12
34
56
78
910
1112
1314
1516
1718
1920
2122
2324
2526
2728
2930
3132
3334
3536
3738
3940
uJP5
12
34
56
78
910
1112
1314
1516
1718
1920
2122
2324
2526
2728
2930
3132
3334
3536
3738
3940
uJP4
uVP5
uVP5
VBUS1
D-2
D+3
GND4
uUSB_B1
1 2
uJP3
uVP5USBDM
USBDP
4K7
uR5
10K
uR6
4.7uF
uC5
104pF
uC3
104pF
uC2
uVP5
104pF
uC1
uLD8
uLD9
uVP5
12
34
56
78
910
1112
1314
1516
1718
1920
2122
2324
2526
2728
uJP2
D01
D42
D23
VCCIO4
D15
D76
GND7
NC8
D59
D610
D311
PWREN#12
RD#13
WR14
USBDP15
USBDM16
3V3OUT17
GND18
RESET#19
VCC20
GND21
TXE#23
RXF#22
NC24
AGND25
TEST26
OSCI27
OSCO28
uU1
12
34
56
78
910
1112
1314
1516
1718
1920
2122
2324
2526
2728
uJP1
USBDM
USBDP
Figure 4. Serial in Parallel out (SIPO) circuit and EEPROM interface circuit.
1818 Sci. Res. Essays
Initialize:
- Shift Register and EEPROM
Done? No
Yes
Data Packet:
- Address byte and Byte count
End
Start Downloading to EEPROM
A
Figure 5. Flow chart of downloading data to EEPROM.
Location 1
Location 2
Location 3
1st Address
2nd
Address
3rd
Address
1st
Data
2nd
Data
3rd
Data
+
+
+
Location n nth Address n
th Data +
21 bit
Figure 6. Transfer data packet of 21 bit to EEPROM via USB.
begins with hardware setups followed by Code Composer to load the QT algorithm from the created workspace window and deliver each file (healthy subjects)
from the PTB Diagnostic ECG data base
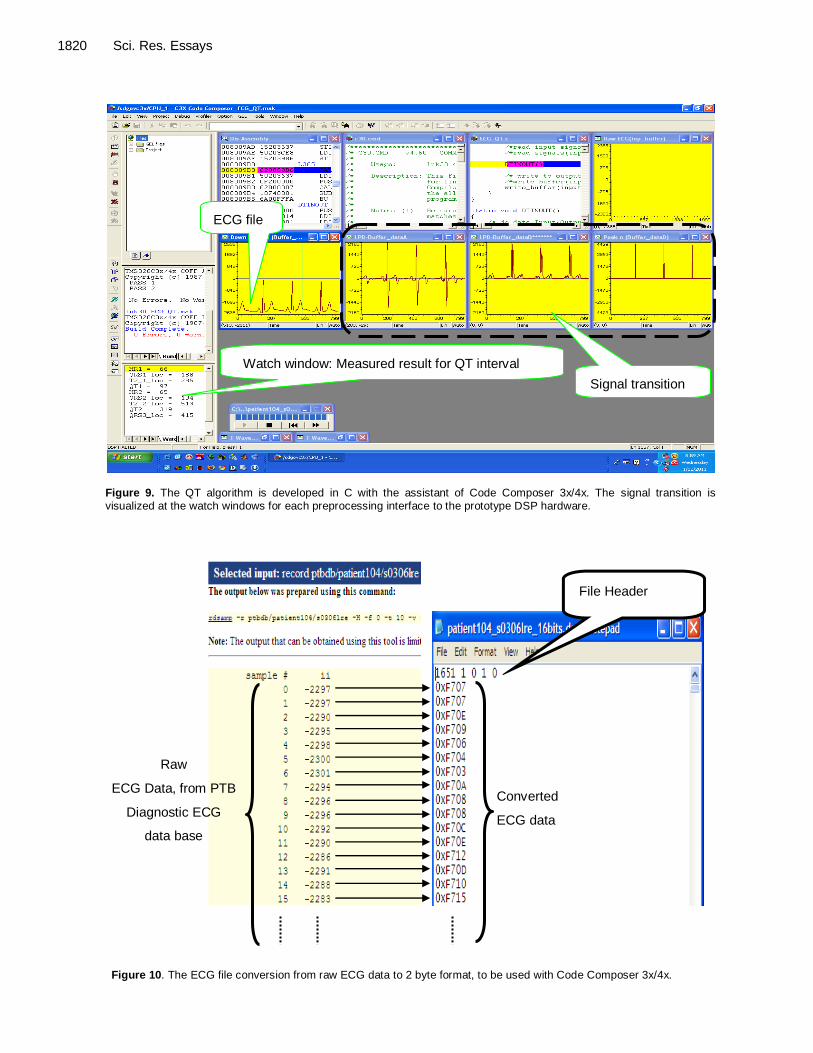
by using probe point into the prototype DSP hardware. The data file format for PTB Diagnostic ECG data base is converted into the Code Composer 3x/4x format. As the processing begins, the signal transition is visible on the graphical display window as shown in Figure 9 for the DSP prototype hardware so that it enables researcher to observe and gain insight for each executed processing step. Finally, the obtained result for Q onset and T offset are displayed at the watch window for the prototype DSP hardware as depicted in Figure 9. The obtained results are validated with the
annotated data set. The ECG data for validation uses in Code Composer 3x/4x is
acquired from PTB diagnostic ECG database. In this ECG database only information of ECG lead II is extracted for QT interval measurement. However, the extracted lead II information are in
numeric text format but the required format for File I/O using probe point in Code Composer 3x/4x, must be in hexadecimal. Therefore, conversion of file format is required and needed to be done in order for Code Composer 3x/4x to read those ECG files to the target processor, TMS320VC33.
The requirements for the requested ECG files are in 2 bytes format for each data present in the converted file from the PTB Diagnostic ECG data base.
Figure 10 shows a converted file of patient104_s0306lre taken
from PTB Diagnostic ECG data base: On the left of Figure 10 shows the raw PTB Diagnostic ECG data with file name:
Seng et al. 1819
Preprocessing
- Low pass differentiator (LPD)
- 1st order low pass filter.
QRS detection
- Define Threshold (H1):QRSmax and QRS min
- Identified R peak.
R and Q waves definition
- Define R and Q position (Rp and Qp) from
zero crossing.
QRS onset definition
- QRS-begin is define from the zero
crossing of Rp and Qp.
T-wave peak and T-wave end definition
- Define a search window from the Rp.
- bwind and ewind, forward search.
Figure 7. Simplified flow chart for Q onset and T offset
detection.
Validate the results with annotated Q onset and T offset data set
Display Q Onset and T Offset results (Watch Windows)
Load workspace
Load Program (QT algorithm)
Start
Initialize Code Composer
Setup DSP Hardware
Compile and build
Load “QT algorithm’’ onto DSP processor
Set and Connect Probe Point to acquired downloaded files’ from PTB
Diagnostic ECG database (Healthy subjects)
Observe signal transition (Graphical Display Window)
End Figure 8. Flow diagram of QT algorithm implementation and validation for the developed prototype DSP
hardware.
1820 Sci. Res. Essays
ECG file
Signal transition
Watch window: Measured result for QT interval
Figure 9. The QT algorithm is developed in C with the assistant of Code Composer 3x/4x. The signal transition is
visualized at the watch windows for each preprocessing interface to the prototype DSP hardware.
File Header
Converted
ECG data
Raw
ECG Data, from PTB
Diagnostic ECG
data base
Figure 10. The ECG file conversion from raw ECG data to 2 byte format, to be used with Code Composer 3x/4x.
Seng et al. 1821
Fix number
Format Starting address Page number
Length
Samples data in the file
Figure 11. File header information, the converted ECG file (patient104_s0306lre) with 2 byte format.
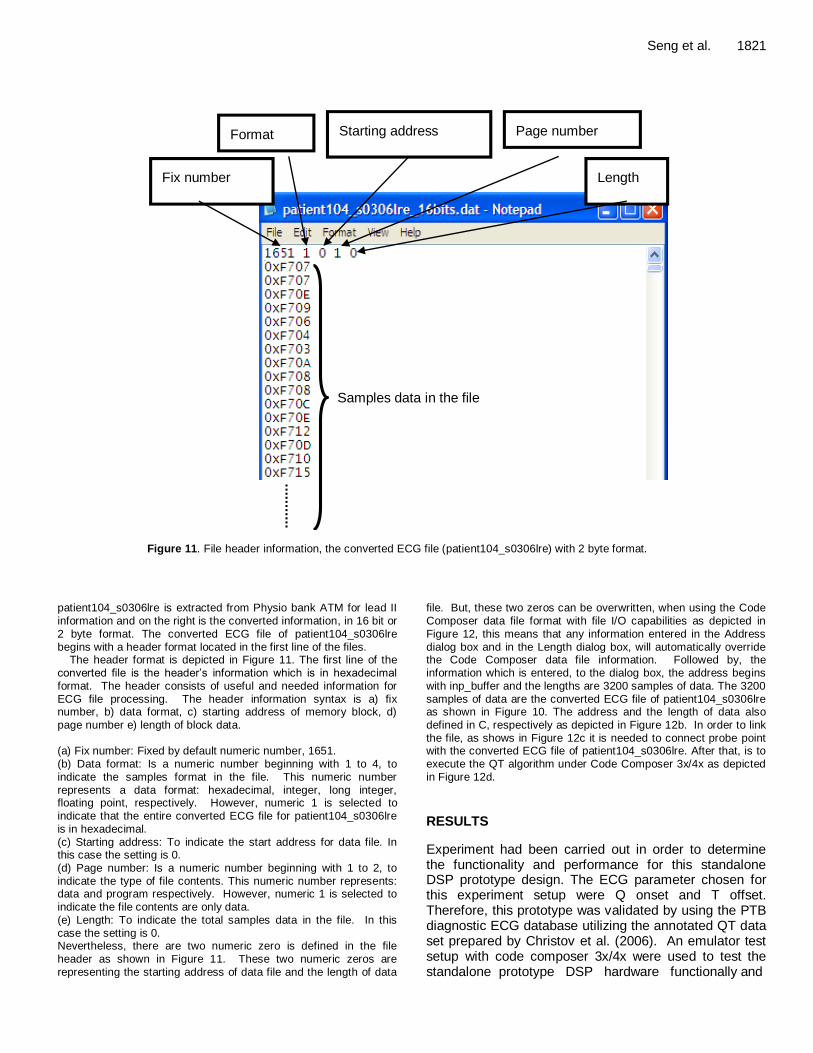
patient104_s0306lre is extracted from Physio bank ATM for lead II
information and on the right is the converted information, in 16 bit or 2 byte format. The converted ECG file of patient104_s0306lre begins with a header format located in the first line of the files.
The header format is depicted in Figure 11. The first line of the converted file is the header’s information which is in hexadecimal format. The header consists of useful and needed information for ECG file processing. The header information syntax is a) fix number, b) data format, c) starting address of memory block, d)
page number e) length of block data. (a) Fix number: Fixed by default numeric number, 1651. (b) Data format: Is a numeric number beginning with 1 to 4, to indicate the samples format in the file. This numeric number represents a data format: hexadecimal, integer, long integer, floating point, respectively. However, numeric 1 is selected to indicate that the entire converted ECG file for patient104_s0306lre is in hexadecimal.
(c) Starting address: To indicate the start address for data file. In this case the setting is 0. (d) Page number: Is a numeric number beginning with 1 to 2, to indicate the type of file contents. This numeric number represents: data and program respectively. However, numeric 1 is selected to indicate the file contents are only data. (e) Length: To indicate the total samples data in the file. In this case the setting is 0. Nevertheless, there are two numeric zero is defined in the file header as shown in Figure 11. These two numeric zeros are representing the starting address of data file and the length of data
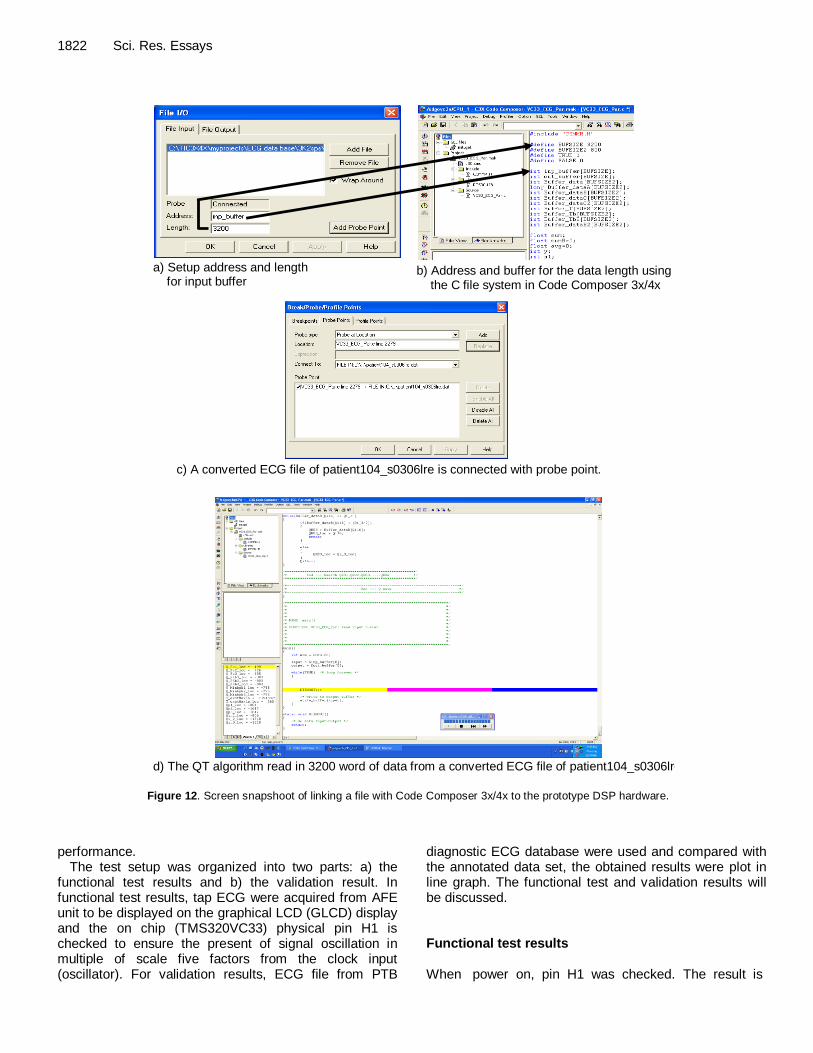
file. But, these two zeros can be overwritten, when using the Code
Composer data file format with file I/O capabilities as depicted in Figure 12, this means that any information entered in the Address dialog box and in the Length dialog box, will automatically override the Code Composer data file information. Followed by, the information which is entered, to the dialog box, the address begins with inp_buffer and the lengths are 3200 samples of data. The 3200 samples of data are the converted ECG file of patient104_s0306lre as shown in Figure 10. The address and the length of data also
defined in C, respectively as depicted in Figure 12b. In order to link the file, as shows in Figure 12c it is needed to connect probe point with the converted ECG file of patient104_s0306lre. After that, is to execute the QT algorithm under Code Composer 3x/4x as depicted in Figure 12d. RESULTS
Experiment had been carried out in order to determine the functionality and performance for this standalone DSP prototype design. The ECG parameter chosen for this experiment setup were Q onset and T offset. Therefore, this prototype was validated by using the PTB diagnostic ECG database utilizing the annotated QT data set prepared by Christov et al. (2006). An emulator test setup with code composer 3x/4x were used to test the standalone prototype DSP hardware functionally and
1822 Sci. Res. Essays
Figure 12: Screen snapshoot of linking a file with Code Composer 3x/4x to the prototype DSP hardware.
b) Address and buffer for the data length using the C file system in Code Composer 3x/4x
a) Setup address and length for input buffer
c) A converted ECG file of patient104_s0306lre is connected with probe point.
d) The QT algorithm read in 3200 word of data from a converted ECG file of patient104_s0306lre.
Correction
Figure 12. Screen snapshoot of linking a file with Code Composer 3x/4x to the prototype DSP hardware.
performance. The test setup was organized into two parts: a) the
functional test results and b) the validation result. In functional test results, tap ECG were acquired from AFE unit to be displayed on the graphical LCD (GLCD) display and the on chip (TMS320VC33) physical pin H1 is checked to ensure the present of signal oscillation in multiple of scale five factors from the clock input (oscillator). For validation results, ECG file from PTB
diagnostic ECG database were used and compared with the annotated data set, the obtained results were plot in line graph. The functional test and validation results will be discussed. Functional test results When power on, pin H1 was checked. The result is
Seng et al. 1823
100MHz
20MHz
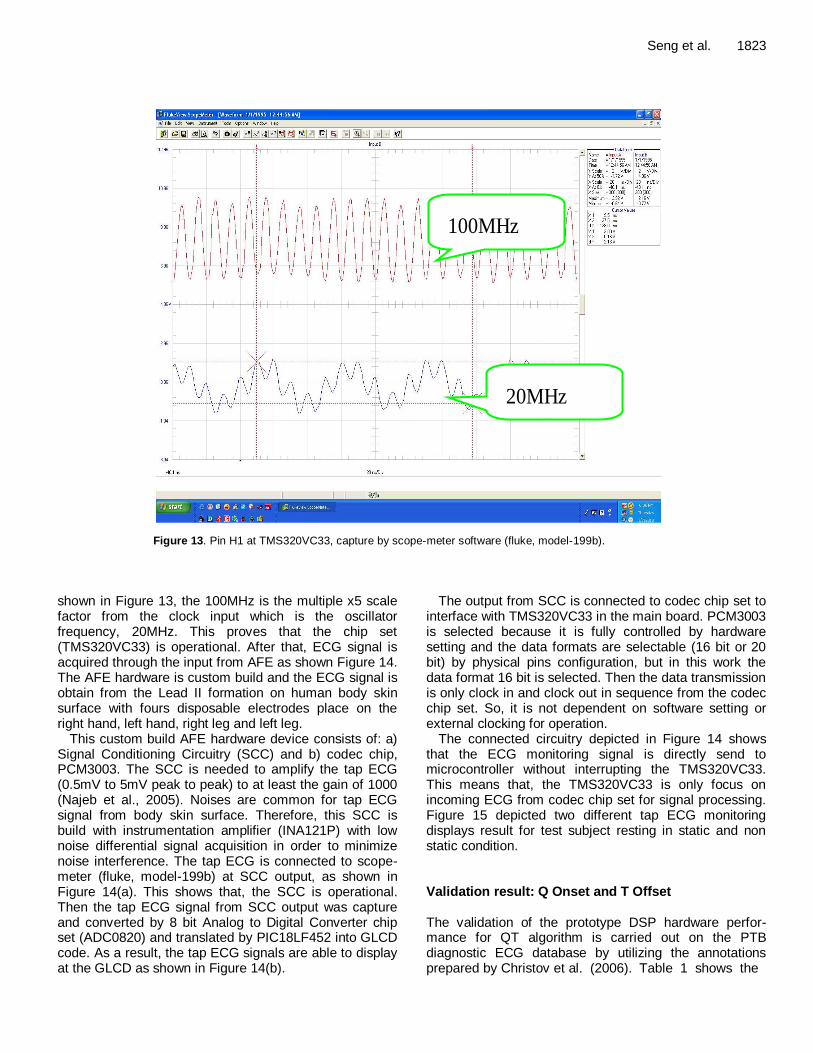
Figure 13. Pin H1 at TMS320VC33, capture by scope-meter software (fluke, model-199b).
shown in Figure 13, the 100MHz is the multiple x5 scale factor from the clock input which is the oscillator frequency, 20MHz. This proves that the chip set (TMS320VC33) is operational. After that, ECG signal is acquired through the input from AFE as shown Figure 14. The AFE hardware is custom build and the ECG signal is obtain from the Lead II formation on human body skin surface with fours disposable electrodes place on the right hand, left hand, right leg and left leg.
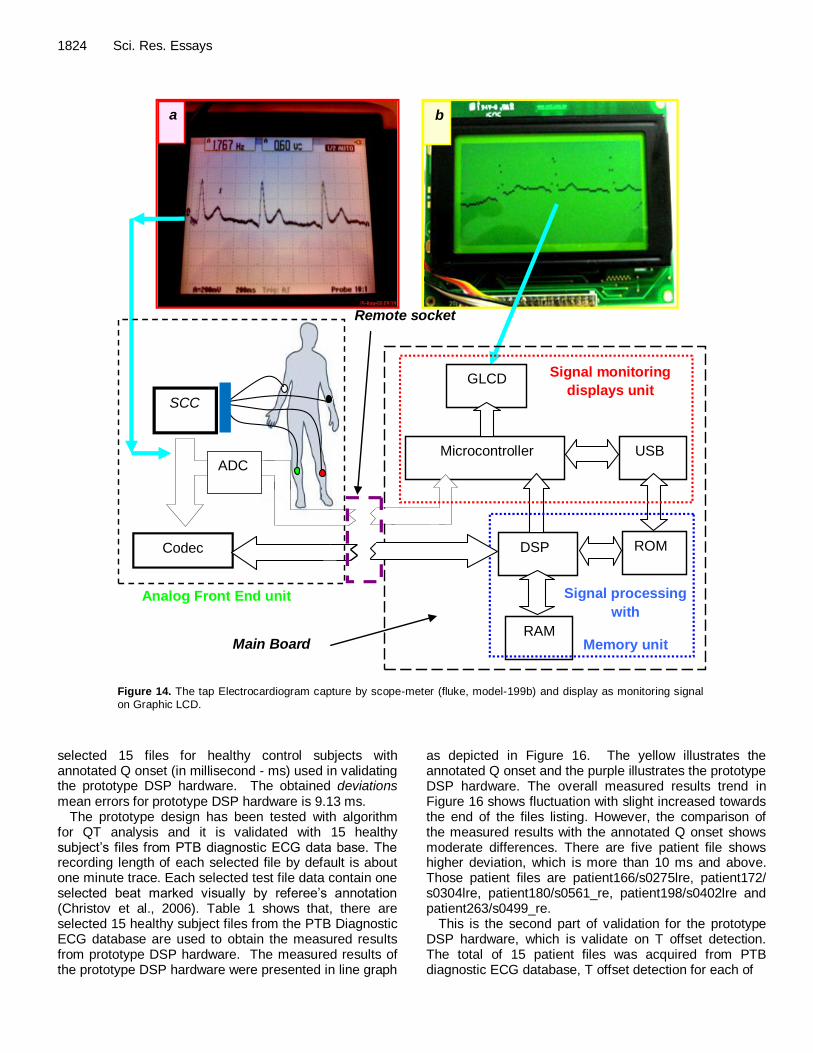
This custom build AFE hardware device consists of: a) Signal Conditioning Circuitry (SCC) and b) codec chip, PCM3003. The SCC is needed to amplify the tap ECG (0.5mV to 5mV peak to peak) to at least the gain of 1000 (Najeb et al., 2005). Noises are common for tap ECG signal from body skin surface. Therefore, this SCC is build with instrumentation amplifier (INA121P) with low noise differential signal acquisition in order to minimize noise interference. The tap ECG is connected to scope-meter (fluke, model-199b) at SCC output, as shown in Figure 14(a). This shows that, the SCC is operational. Then the tap ECG signal from SCC output was capture and converted by 8 bit Analog to Digital Converter chip set (ADC0820) and translated by PIC18LF452 into GLCD code. As a result, the tap ECG signals are able to display at the GLCD as shown in Figure 14(b).
The output from SCC is connected to codec chip set to interface with TMS320VC33 in the main board. PCM3003 is selected because it is fully controlled by hardware setting and the data formats are selectable (16 bit or 20 bit) by physical pins configuration, but in this work the data format 16 bit is selected. Then the data transmission is only clock in and clock out in sequence from the codec chip set. So, it is not dependent on software setting or external clocking for operation.
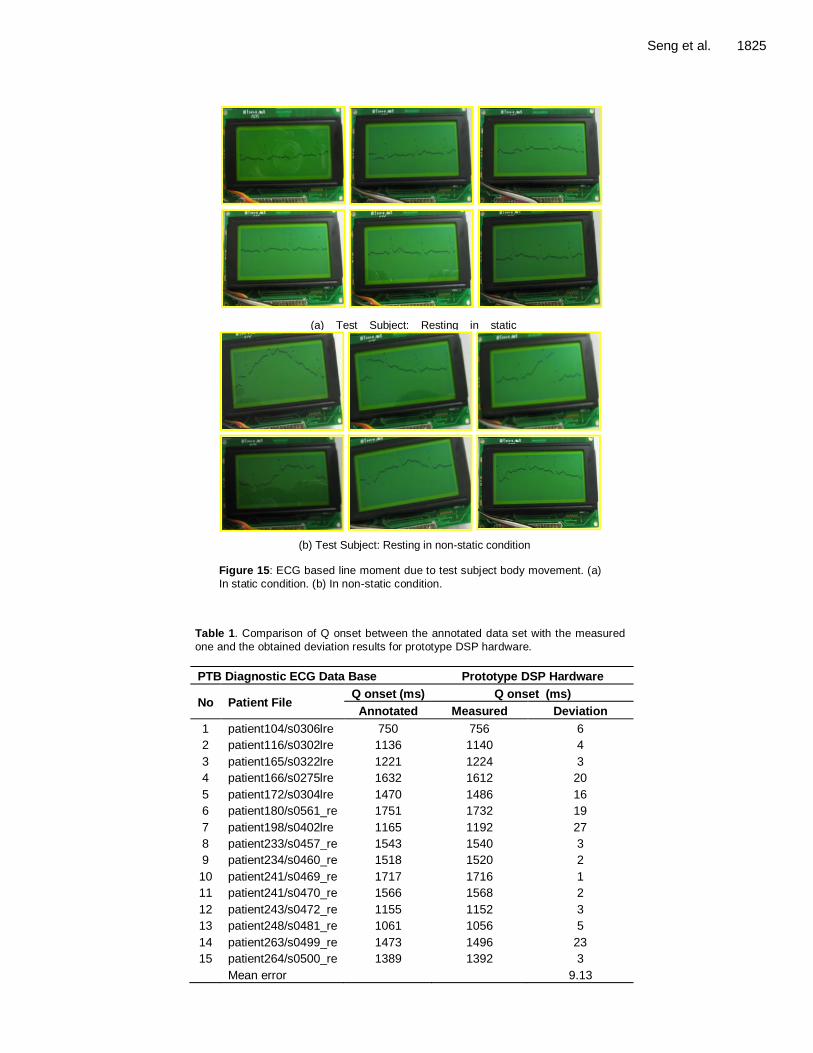
The connected circuitry depicted in Figure 14 shows that the ECG monitoring signal is directly send to microcontroller without interrupting the TMS320VC33. This means that, the TMS320VC33 is only focus on incoming ECG from codec chip set for signal processing. Figure 15 depicted two different tap ECG monitoring displays result for test subject resting in static and non static condition. Validation result: Q Onset and T Offset The validation of the prototype DSP hardware perfor-mance for QT algorithm is carried out on the PTB diagnostic ECG database by utilizing the annotations prepared by Christov et al. (2006). Table 1 shows the
1824 Sci. Res. Essays
a b
Main Board
Remote socket
DSP
USB
ROM
RAM
Microcontroller
GLCD
Codec
SCC
ADC
Analog Front End unit
Signal monitoring
displays unit
Signal processing
with
Memory unit
Figure 14. The tap Electrocardiogram capture by scope-meter (fluke, model-199b) and display as monitoring signal on Graphic LCD.
selected 15 files for healthy control subjects with annotated Q onset (in millisecond - ms) used in validating the prototype DSP hardware. The obtained deviations mean errors for prototype DSP hardware is 9.13 ms.
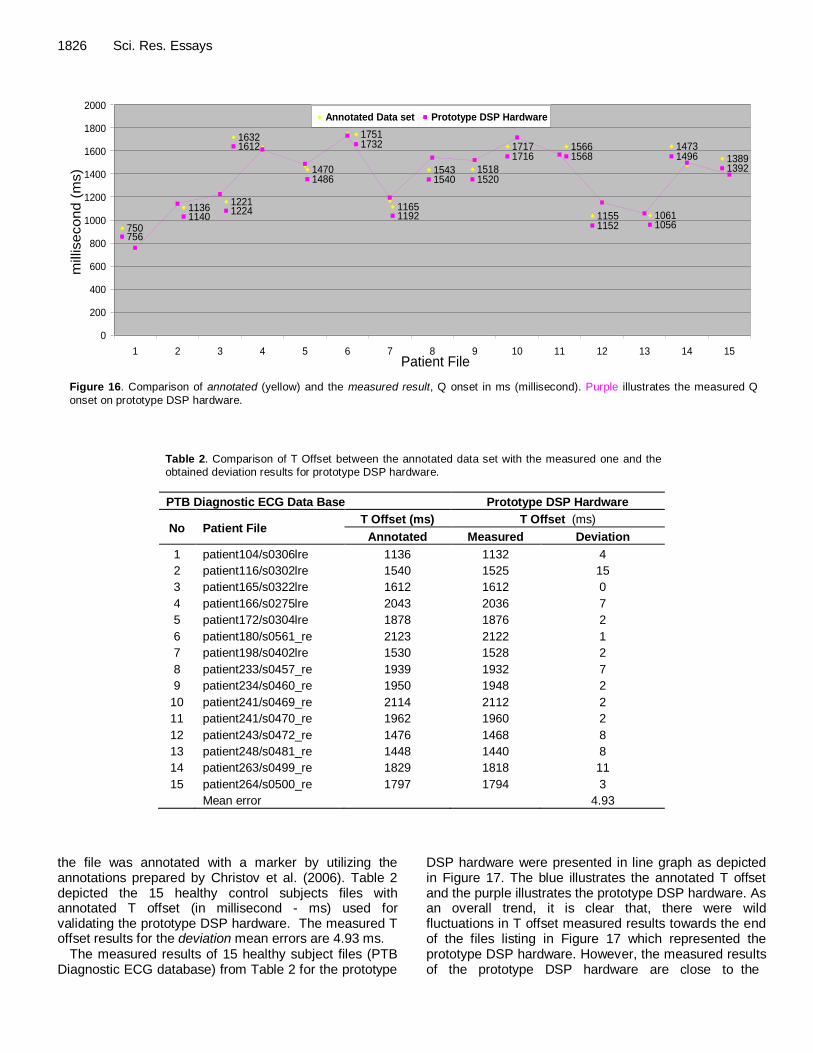
The prototype design has been tested with algorithm for QT analysis and it is validated with 15 healthy subject’s files from PTB diagnostic ECG data base. The recording length of each selected file by default is about one minute trace. Each selected test file data contain one selected beat marked visually by referee’s annotation (Christov et al., 2006). Table 1 shows that, there are selected 15 healthy subject files from the PTB Diagnostic ECG database are used to obtain the measured results from prototype DSP hardware. The measured results of the prototype DSP hardware were presented in line graph
as depicted in Figure 16. The yellow illustrates the annotated Q onset and the purple illustrates the prototype DSP hardware. The overall measured results trend in Figure 16 shows fluctuation with slight increased towards the end of the files listing. However, the comparison of the measured results with the annotated Q onset shows moderate differences. There are five patient file shows higher deviation, which is more than 10 ms and above. Those patient files are patient166/s0275lre, patient172/ s0304lre, patient180/s0561_re, patient198/s0402lre and patient263/s0499_re.
This is the second part of validation for the prototype DSP hardware, which is validate on T offset detection. The total of 15 patient files was acquired from PTB diagnostic ECG database, T offset detection for each of
Seng et al. 1825
(a) Test Subject: Resting in static
condition
(b) Test Subject: Resting in non-static condition Figure 15: ECG based line moment due to test subject body movement. (a)
In static condition. (b) In non-static condition.
Table 1. Comparison of Q onset between the annotated data set with the measured
one and the obtained deviation results for prototype DSP hardware.
PTB Diagnostic ECG Data Base Prototype DSP Hardware
No Patient File Q onset (ms) Q onset (ms)
Annotated Measured Deviation
1 patient104/s0306lre 750 756 6
2 patient116/s0302lre 1136 1140 4
3 patient165/s0322lre 1221 1224 3
4 patient166/s0275lre 1632 1612 20
5 patient172/s0304lre 1470 1486 16
6 patient180/s0561_re 1751 1732 19
7 patient198/s0402lre 1165 1192 27
8 patient233/s0457_re 1543 1540 3
9 patient234/s0460_re 1518 1520 2
10 patient241/s0469_re 1717 1716 1
11 patient241/s0470_re 1566 1568 2
12 patient243/s0472_re 1155 1152 3
13 patient248/s0481_re 1061 1056 5
14 patient263/s0499_re 1473 1496 23
15 patient264/s0500_re 1389 1392 3
Mean error 9.13
1826 Sci. Res. Essays
1717
15181543
1165
1751
1470
1632
12211136
750
1566
1155 1061
1473
1389
756
11401224
1612
1486
1732
1192
1540 1520
1716 1568
1152 1056
13921496
0
200
400
600
800
1000
1200
1400
1600
1800
2000
1 2 3 4 5 6 7 8 9 10 11 12 13 14 15Patient File
millisecon
d (
ms)
Annotated Data set Prototype DSP Hardware
Figure 16. Comparison of annotated (yellow) and the measured result, Q onset in ms (millisecond). Purple illustrates the measured Q
onset on prototype DSP hardware.
Table 2. Comparison of T Offset between the annotated data set with the measured one and the obtained deviation results for prototype DSP hardware.
PTB Diagnostic ECG Data Base Prototype DSP Hardware
No Patient File T Offset (ms) T Offset (ms)
Annotated Measured Deviation
1 patient104/s0306lre 1136 1132 4
2 patient116/s0302lre 1540 1525 15
3 patient165/s0322lre 1612 1612 0
4 patient166/s0275lre 2043 2036 7
5 patient172/s0304lre 1878 1876 2
6 patient180/s0561_re 2123 2122 1
7 patient198/s0402lre 1530 1528 2
8 patient233/s0457_re 1939 1932 7
9 patient234/s0460_re 1950 1948 2
10 patient241/s0469_re 2114 2112 2
11 patient241/s0470_re 1962 1960 2
12 patient243/s0472_re 1476 1468 8
13 patient248/s0481_re 1448 1440 8
14 patient263/s0499_re 1829 1818 11
15 patient264/s0500_re 1797 1794 3
Mean error 4.93
the file was annotated with a marker by utilizing the annotations prepared by Christov et al. (2006). Table 2 depicted the 15 healthy control subjects files with annotated T offset (in millisecond - ms) used for validating the prototype DSP hardware. The measured T offset results for the deviation mean errors are 4.93 ms.
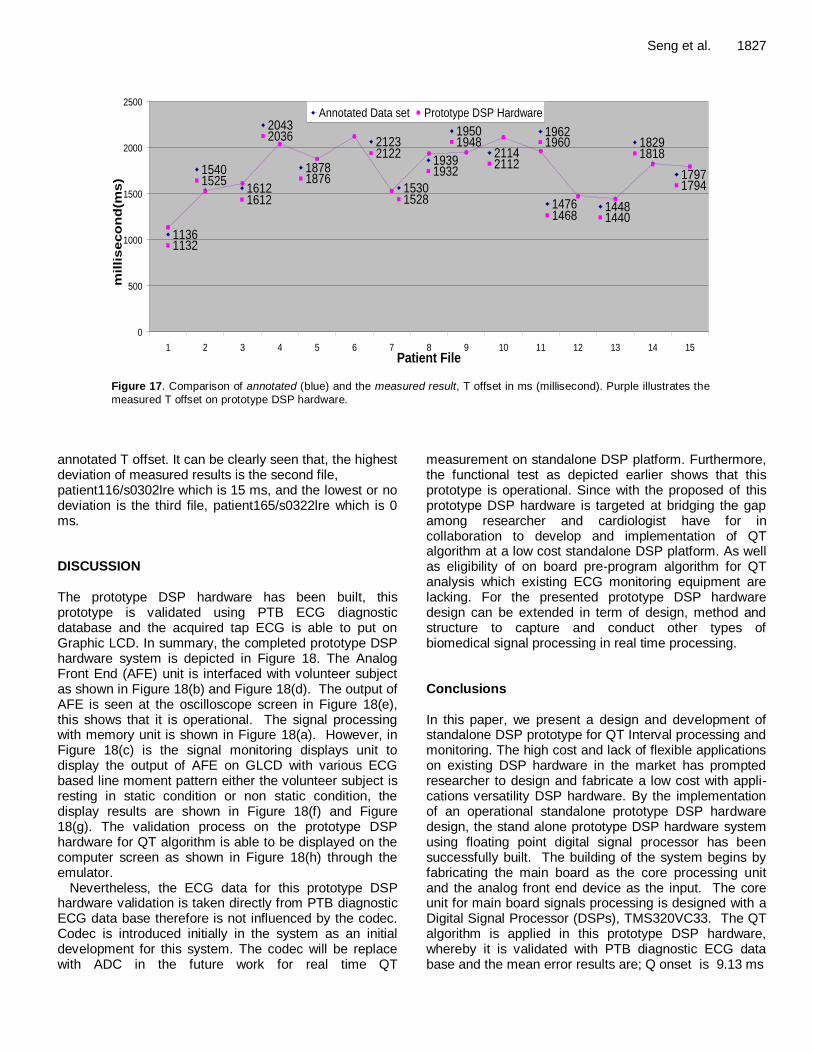
The measured results of 15 healthy subject files (PTB Diagnostic ECG database) from Table 2 for the prototype
DSP hardware were presented in line graph as depicted in Figure 17. The blue illustrates the annotated T offset and the purple illustrates the prototype DSP hardware. As an overall trend, it is clear that, there were wild fluctuations in T offset measured results towards the end of the files listing in Figure 17 which represented the prototype DSP hardware. However, the measured results of the prototype DSP hardware are close to the
Seng et al. 1827
1797
1829
14481476
1962
2114
1950
1939
1530
2123
1878
2043
1612
1540
1136
14401468
1960
2112
1948
1932
1528
2122
1876
2036
1612
1525
1132
1818
1794
0
500
1000
1500
2000
2500
1 2 3 4 5 6 7 8 9 10 11 12 13 14 15Patient File
mil
lis
ec
on
d(m
s)
Annotated Data set Prototype DSP Hardware
Figure 17. Comparison of annotated (blue) and the measured result, T offset in ms (millisecond). Purple illustrates the
measured T offset on prototype DSP hardware.
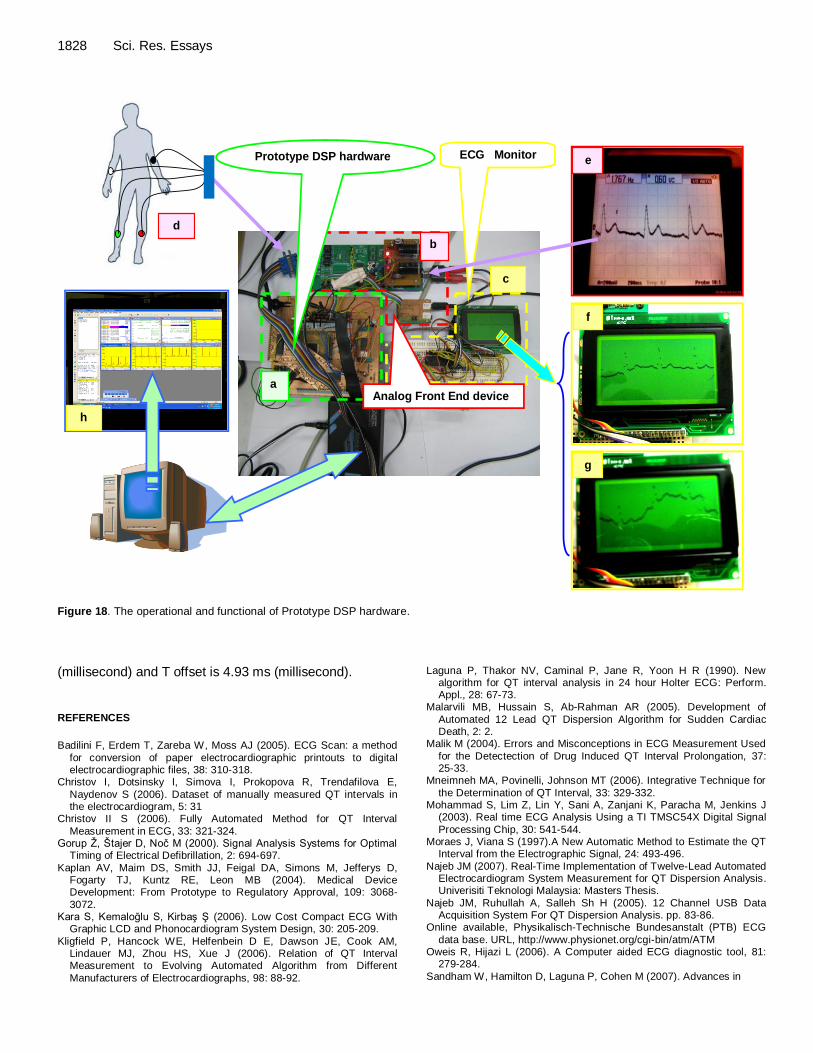
annotated T offset. It can be clearly seen that, the highest deviation of measured results is the second file, patient116/s0302lre which is 15 ms, and the lowest or no deviation is the third file, patient165/s0322lre which is 0 ms. DISCUSSION The prototype DSP hardware has been built, this prototype is validated using PTB ECG diagnostic database and the acquired tap ECG is able to put on Graphic LCD. In summary, the completed prototype DSP hardware system is depicted in Figure 18. The Analog Front End (AFE) unit is interfaced with volunteer subject as shown in Figure 18(b) and Figure 18(d). The output of AFE is seen at the oscilloscope screen in Figure 18(e), this shows that it is operational. The signal processing with memory unit is shown in Figure 18(a). However, in Figure 18(c) is the signal monitoring displays unit to display the output of AFE on GLCD with various ECG based line moment pattern either the volunteer subject is resting in static condition or non static condition, the display results are shown in Figure 18(f) and Figure 18(g). The validation process on the prototype DSP hardware for QT algorithm is able to be displayed on the computer screen as shown in Figure 18(h) through the emulator.
Nevertheless, the ECG data for this prototype DSP hardware validation is taken directly from PTB diagnostic ECG data base therefore is not influenced by the codec. Codec is introduced initially in the system as an initial development for this system. The codec will be replace with ADC in the future work for real time QT
measurement on standalone DSP platform. Furthermore, the functional test as depicted earlier shows that this prototype is operational. Since with the proposed of this prototype DSP hardware is targeted at bridging the gap among researcher and cardiologist have for in collaboration to develop and implementation of QT algorithm at a low cost standalone DSP platform. As well as eligibility of on board pre-program algorithm for QT analysis which existing ECG monitoring equipment are lacking. For the presented prototype DSP hardware design can be extended in term of design, method and structure to capture and conduct other types of biomedical signal processing in real time processing. Conclusions In this paper, we present a design and development of standalone DSP prototype for QT Interval processing and monitoring. The high cost and lack of flexible applications on existing DSP hardware in the market has prompted researcher to design and fabricate a low cost with appli-cations versatility DSP hardware. By the implementation of an operational standalone prototype DSP hardware design, the stand alone prototype DSP hardware system using floating point digital signal processor has been successfully built. The building of the system begins by fabricating the main board as the core processing unit and the analog front end device as the input. The core unit for main board signals processing is designed with a Digital Signal Processor (DSPs), TMS320VC33. The QT algorithm is applied in this prototype DSP hardware, whereby it is validated with PTB diagnostic ECG data base and the mean error results are; Q onset is 9.13 ms
1828 Sci. Res. Essays
Figure 18: The operational and functional of Prototype DSP hardware
Prototype DSP hardware ECG Monitor
b
a
e
f
g
d
Analog Front End device
c
h
Figure 18. The operational and functional of Prototype DSP hardware.
(millisecond) and T offset is 4.93 ms (millisecond).
REFERENCES
Badilini F, Erdem T, Zareba W, Moss AJ (2005). ECG Scan: a method
for conversion of paper electrocardiographic printouts to digital electrocardiographic files, 38: 310-318.
Christov I, Dotsinsky I, Simova I, Prokopova R, Trendafilova E,
Naydenov S (2006). Dataset of manually measured QT intervals in the electrocardiogram, 5: 31
Christov II S (2006). Fully Automated Method for QT Interval
Measurement in ECG, 33: 321-324. Gorup Ž, Štajer D, Noč M (2000). Signal Analysis Systems for Optimal
Timing of Electrical Defibrillation, 2: 694-697.
Kaplan AV, Maim DS, Smith JJ, Feigal DA, Simons M, Jefferys D, Fogarty TJ, Kuntz RE, Leon MB (2004). Medical Device Development: From Prototype to Regulatory Approval, 109: 3068-
3072. Kara S, Kemaloğlu S, Kirbaş Ş (2006). Low Cost Compact ECG With
Graphic LCD and Phonocardiogram System Design, 30: 205-209.
Kligfield P, Hancock WE, Helfenbein D E, Dawson JE, Cook AM, Lindauer MJ, Zhou HS, Xue J (2006). Relation of QT Interval Measurement to Evolving Automated Algorithm from Different
Manufacturers of Electrocardiographs, 98: 88-92.
Laguna P, Thakor NV, Caminal P, Jane R, Yoon H R (1990). New algorithm for QT interval analysis in 24 hour Holter ECG: Perform. Appl., 28: 67-73.
Malarvili MB, Hussain S, Ab-Rahman AR (2005). Development of
Automated 12 Lead QT Dispersion Algorithm for Sudden Cardiac Death, 2: 2.
Malik M (2004). Errors and Misconceptions in ECG Measurement Used
for the Detectection of Drug Induced QT Interval Prolongation, 37: 25-33.
Mneimneh MA, Povinelli, Johnson MT (2006). Integrative Technique for
the Determination of QT Interval, 33: 329-332. Mohammad S, Lim Z, Lin Y, Sani A, Zanjani K, Paracha M, Jenkins J
(2003). Real time ECG Analysis Using a TI TMSC54X Digital Signal
Processing Chip, 30: 541-544. Moraes J, Viana S (1997).A New Automatic Method to Estimate the QT
Interval from the Electrographic Signal, 24: 493-496.
Najeb JM (2007). Real-Time Implementation of Twelve-Lead Automated Electrocardiogram System Measurement for QT Dispersion Analysis. Univerisiti Teknologi Malaysia: Masters Thesis.
Najeb JM, Ruhullah A, Salleh Sh H (2005). 12 Channel USB Data Acquisition System For QT Dispersion Analysis. pp. 83-86.
Online available, Physikalisch-Technische Bundesanstalt (PTB) ECG
data base. URL, http://www.physionet.org/cgi-bin/atm/ATM Oweis R, Hijazi L (2006). A Computer aided ECG diagnostic tool, 81:
279-284.
Sandham W, Hamilton D, Laguna P, Cohen M (2007). Advances in

Electrocardiogram Signal Processing and Analysis. 2007: 1-5. Saviola J (2005). The FDA’s role in medical device clinical studies of
human subjects. S1-S4.
Seng et al. 1829 Soon IY, Yeo CK, Ng HC (2001). An analogue video interface for
general purpose DSP. 25: 33-39.