Embed Size (px)
Citation preview

1 Copyright © 2013 by ASME
Proceedings of the ASME 2013 International Design Engineering Technical Conferences & Computers and Information in Engineering Conference
IDETC/CIE 2013 August 4-7, 2013, Portland, Oregon, USA
DEC2013-12764
DESIGNING A SYSTEM OF PLUG-IN HYBRID ELECTRIC VEHICLE CHARGING STATIONS
Amirhossein Khosrojerdi1, Minting Xiao1, Piampoom Sariprueck2, Janet K. Allen1, and Farrokh Mistree1
1The Systems Realization Laboratory @ OU University of Oklahoma
School of Industrial and Systems Engineering School of Aerospace and Mechanical Engineering
Norman, Oklahoma, USA 73019
2 University of Texas at Arlington Energy Systems Research Center Electrical Engineering Department
Arlington, Texas, USA 76019
ABSTRACT In this paper we present a two-step approach for the design
of a system of Plug-in Hybrid Electric Vehicle (PHEV) charging stations. Our approach consists of a simulation model and a mathematical model. The simulation model formulates the charging station’s service level by using discrete event simulation. The mathematical model formulates charging station’s design decisions, i.e. locations and configurations of charging stations, by applying compromise Decision Support Problem (cDSP). Waiting time, service time, number of slots (chargers) and demand are key inputs for the simulation model. Output of the simulation model, which is the service level of charging stations, is used as an input for the mathematical model. By compromising between maximizing the service level, maximizing the demand coverage, minimizing the installation cost for slots and minimizing distance between charging stations and demand nodes, design decisions are taken in the mathematical model. Our focus in this paper is on the method which is widely applicable. However the approach is presented and evaluated for a data set from Dallas County, Texas.
Keywords: Plug-in Hybrid Electric Vehicles (PHEV), compromise Decision Support Problem (cDSP), discrete event simulation model.
1. FRAME OF REFERENCE
It is important to explore alternative energy resources in order to curb greenhouse gas emissions and forge a more independent energy economy. The United States government
has pledged to reduce greenhouse gas emissions by approximately 17% of 2005 levels by 2020 (Energy Information Administration 2011). According to a report from the Energy Information Administration, the transportation sector alone is responsible for up to 33.1% of all energy-related emissions, and is the largest producer of carbon dioxide emission in the United States (Energy Information Administration 2011). This must be curtailed if the government’s pledge is to be kept. Furthermore, approximately 20 million barrels of oil are consumed by industry and citizens in the United States daily, of which more than half are imported. Not only is the available oil harder and more dangerous to obtain, but the volatility of oil prices is threatening both energy security and the economy. If this trend of heavy reliance on petroleum continues as projected, the gap between oil consumption and production will become even wider. Eventually, the cost of oil dependence to both national security and the economy will be too great (Khosrojerdi and coauthors, 2012). Therefore, decreasing gas emission and security dependency are two goals for the energy sector in the United States.
Plug-in Hybrid Electric Vehicles (PHEVs) can be utilized to reduce greenhouse gas emissions and energy dependence resulting from petroleum-based fuel because they can utilize electricity in addition to gasoline for fuel. However, PHEVs remain unpopular because there are very few places to charge the vehicles, so developing PHEV electric stations is important to the implementation of the technology.
There is a growing field of electric charging station modeling, and various studies are presented in the literature.

2 Copyright © 2013 by ASME
Fred and coauthors publish a maximal covering location model, which maximizes the electric vehicle charging demand served by an acceptable level of service (Frade and coauthors, 2011). The model is solved for Lisbon, Portugal. In addition to the locations, the capacity of charging stations at each location is determined as well. Lin and co-authors (2008) developed a p-median based model. In their model each node is given weight by the consumed fuel and travel time between facility station candidates and demand nodes. In their model vehicle-miles traveled data is used to minimize the total travel time to the nearest station. In this paper, we propose a hybrid maximum covering and p-median modeling approach for the mathematical model.
Our focus in this paper is on the design of electric charging stations for PHEVs. Our approach consists of a simulation model that feeds into a compromise Decision Support Problem (cDSP). A service level model that is based on discrete event simulation is developed for various scenarios for different number of slots for charging stations. The cDSP is developed to find a solution for the location of charging stations and the number of slots, while compromising between four different goals such as maximizing the service level, maximizing the demand coverage, minimizing the installation cost for slots and minimizing distance between charging stations and demand nodes.
In Section 2, the two-step approach which consists of the simulation model and the cDSP is presented. In Section 3, input parameters are listed. In Section 4, we address results of running the simulation for various scenarios and the cDSP mathematical model. Closing remarks are embodied in Section 5.
2. MODELING APPROACH Interest in Plug-in hybrid Electric Vehicles (PHEVs) has
increased significantly as of late. A number of pure and hybrid electric vehicles (EVs) such as Toyota Prius, Chevrolet Volt and Nissan Leaf are currently commercially available this number will increase in the near future. Three generation of EV charging technologies are available. The Level-one uses a standard 120 VAC, 15 amp (12 amp useable) or 20 amp (16 amp useable) branch circuit that is the lowest common voltage level found in both residential and commercial facilities. Level-two is typically described as the “primary” and “preferred” method for a battery electric vehicle charger for both private and public facilities and specifies a 240-VAC, single-phase, 40-Amp branch circuit. Level-three or “Fast Charging” is for commercial and public applications and is intended to perform similar to a commercial gasoline service station. Level-three typically uses an off-board charging system serviced by a 480-VAC, three-phase circuit. In practice, equipment sizes varied from 60 to150 kW, and if battery electric vehicles achieve a 50% charge in 10 to 15 minutes, this is considered to meet the intent of Level 3 charging. Since DC fast charging requires special high-voltage equipment, it is not expected to be deployed in standard residential settings. In this paper, we develop our approach to design a system of electric charging
stations for level-three of PHEVs (PHEVs with DC fast charging technology).
To design a system of PHEV charging stations, three main decisions need to be made: location of charging stations, allocation of demand from charging stations to demand nodes and number of slots (chargers) per charging stations. Our proposed two-step approach is explained in detail in the following two sections.
2.1. Discrete Event Simulation Model One goal in designing a system for electric stations is to
meet the charging demand, in which demand is increasing every year. The number of vehicles that can be successfully charged in a charging station depends on the number of incoming vehicles (PHEV demand), service time, maximum waiting time in a queue and number of slots (chargers). The extent to how much the charging demand is satisfied in a particular period of time is service level of the charging station.
The purpose of the simulation model is to reflect the capability of a charging station in a given setting to reach a high service level. The simulation model needs to be built through simulating the charging operating process and the arrival and leaving pattern of vehicles in the charging station. A queuing model should be used to frame the behavior of the entities. The process that the simulation model simulates is depicted in Figure 1.
The charging process mainly involves arriving and departing of vehicles, charging slots, queuing before charging slots become available. The modeling of each of these elements is explained as follows. The main characteristic of charging vehicles’ arriving pattern is that the intensity of arriving is time dependent, and is modeled by the hourly charging demand which is described in Section 3.1
Waiting space in the charging station is assumed to be unlimited, considering that in reality very few situations will arise where vehicles cannot charge because there is no waiting space. Experimental simulation run implies that the changing of queuing space does not significantly affect the charging station’s service level.
FIFO (First In First Out) is adapted as the serving rule for customers from the queue. Charging duration is determined by charging power of facility installed in the charging station, and by the amount of energy that each vehicle requests to charge.
A leaving condition is assumed in the process to be simulated in addition to a queuing model. We assume that each customer has a maximum waiting time during which they are patient and willing to wait to be charged. They will not wait longer than that and will depart the system without getting charged if they cannot be served after waiting for that amount of time.
In order to explore more possible patterns of charging, discrete-event-simulation is used to model these types of processes instead of modeling it mathematically. The setting of model parameters is discussed in Section 3.1.
Based on the summary of the simulation model above, we conclude that for each charging station, the number of charging

3 Copyright © 2013 by ASME
slots will be the key variable that the designer decides and influences the charging station’s capability to reach certain levels of demand. It also determines the installation cost of the charging stations. Therefore, we set up different simulation scenarios characterized by different number of charging slots to select from in the mathematical model.
When given the vehicle arrival pattern during a day, the total number of charging vehicles in a day determines how much demand can be met by a station in a certain scenario.
In order for the simulation model to be used to explore how much service level can be reached by a charging station in different scenarios, the input of simulation model will be the number of slots and the total daily number of charging vehicles. Output will be the amount of met demand in a day.
2.2. The Compromise Decision Support Problem
2.2.1. An Overview For real-world, practical systems, not all of the information
will be available for modeling systems comprehensively and correctly in the early stages of the project. Therefore, the solution to the problem, even if it is obtained using optimization techniques, cannot be used to support a designer’s quest for a superior solution. In a computer-assisted environment, this support is provided in the form of optimal solutions for decision support problems. Formulation and solution of compromise Decision Support Problem (cDSP) provides a mean for the improvement of a feasible alternative through modification (Mistree and coauthors, 1993). A compromise DSP is a hybrid formulation in that it incorporates concepts from both traditional mathematical programming and goal programming and makes use of some new ones. It is similar to goal programming in that the multiple objectives are formulated as system goals (involve both system and deviation variables) and the deviation function is solely a function of the goal deviation variables. This is in contrast to traditional mathematical programming, where multiple objectives are modeled as a weighted function of the system variables only. The concept of system constraints, however, is retained from the traditional constraints optimization formulation. In effect the traditional formulation is a subset of the compromise DSP – an indication of the generality of the compromise formulation (Mistree and coauthors. 1993). The compromise DSP is stated in four steps such as Given, Find, Satisfy and Minimize, which can be formulated as follows.
Given
An alternative that is to be improved through modification Assumptions used to model the domain of interest The system parameters All other relevant information n number of system variables p+q number of system constraints p equality constraints q inequality constraints m number of system goals
gi(X) system constraint function [gi(X) = Ci(X) - Di(X)]
fk(di) function of deviation variables to be minimized at priority level k for the pre-emptive case
Wi weight for the Archimedean case
Find The values of the interdependent system variables (they describe the physical attributes of an artifact.)
Xj j = 1, …, n The values of the deviation variables (They indicate the extent to which the goals are achieved.)
di- , di
+ i = 1, …, m
Satisfy The system constraints that must be satisfied for the solution to be feasible (There is no restriction placed on linearity or convexity – Eq. 1-2) gi(X)= 0, i = 1, …, p (1) gi(X)>= 0, i = p+1, …, p+q (2)
The system goals that must achieve a specified target value as far as possible (There is no restriction placed on linearity or convexity- Eq. 3)
Ai(X) + di- - di
+ = Gi i = 1, …, m (3) The lower and upper bounds on the system (Eq. 4-5).
Xjmin <= Xj <= Xj
max, j = 1, …, n (4) di
-, di+>=0 and di
- . di+ = 0 (5)
Minimize
The deviation function, which is a measure of the deviation of the system performance from that implied by the set of goals and their associated priority levels or relative weights (Eq. 6-7).
Case a: Pre-emptive (lexicographic minimum) Z = [f1(di
- , di+), …, fk(di
- , di+)] (6)
Case b: Archimedean Z = 𝑊!(𝑑!!!
!!! + 𝑑!!), 𝑊! = 1; 𝑊! ≥ 0 (7) The system descriptors for the compromise DSP are shown in italics in the preceding formulation (Mistree and coauthors, 1993). We present our mathematical model based on the presented compromise DSP construct in the following section.
2.2.2. Mathematical Model To design a system for electric charging stations, a
mathematical model is developed based on the compromise Decision Support Problem, which is explained in the previous section. Three variables of the proposed model are location of charging stations, number of slots per charging station and allocation of demand from charging stations to demand nodes. The proposed model is presented as follows.

4 Copyright © 2013 by ASME
Indices i indices of super power nodes (potential
locations for charging stations) j indices of demand nodes (maximum number
J) t indices by time (hourly intervals) T indices by time (yearly intervals) k indices of goals s indices of scenarios l indices of clusters of super power nodes Given (Parameters) BCi Battery capacity at charging station i Csloti Installation cost of a slot for charging station i
($) DjtT Demand at demand hotspot node j during
period t,T (W/hour) dij Distance between charging station i and
demand hotspot node j (miles) nT Number of charging stations during period T slevelsT Service level at scenario s and time period T frate Output flow rate of electricity from each slot Gk Goal k (Aspiration level k) Wk Weight parameter k for each set of deviation
functions (Range between zero and one) Find (Variables)
Xits = ⎪⎩
⎪⎨
⎧
Otherwise0T periodat
station charging a has i nodepower if1
YijtT Flow of electricity between charging station i and
demand node j in period t, T (W/year)
SiTs= ⎪⎩
⎪⎨
⎧
Otherwise0selected be T period and istation charging
in slots ofnember theas s scenario if1
dk-, dk
+ deviation variable for goal k (deviation variable represents the distance between the aspiration level k (Gk) and the actual attainment.
Satisfy (Constraints) The total number of charging stations in each period of time, T, is fixed (Eq. 8).
Ti
iT nX =∑ 4,..,1=∀T (8)
When a charging station is located at power node i, it cannot be moved or removed in the next period of time (Eq. 9).
)1( −≥ TiiT XX 4,..,2, =∈∀ TIi (9)
The demand at each demand hotspot node may be fulfilled by more than one charging station. There is probability for unmet demand (Eq. 10).
jtTi
ijtT DY ≤∑ 4,..,1,24,..,1, ==∈∀ TtJj (10)
The flow of electricity between power node i and demand hotspot node j is less than the multiplication of the number slots and the flow rate of electricity for each slot – upper bound (Eq. 11). frateSsY iTs
jijtT ⋅⋅≤∑
4,..,1,4,..,1,24,..,1, ===∈∀ sTtIi (11)
At most one charging station can be located in cluster l of super power nodes (Eq. 12).
XiTi∈Cl
∑ <=1
4,..,1, =∈∀ TIi (12)
When a charging station at power node i is open, there can be installed slots at charging station i (Eq. 13).
iTiTs XS ≤ 44,..,1,24,..,1, ==∈∀ StIi (13)
Only one scenario can happen for charging station i (Eq. 14).
1=∑s
iTsS 4,..,1, =∈∀ TIi (14)
The following constraints (Equations 15-20) are non-negativity and binary constraints.
0>=ijtTY 4,..,124,..,1,, ==∈∈∀ TtIiJj (15)
⎩⎨⎧
=01
iTX 4,..,1, =∈∀ TIi (16)
⎩⎨⎧
=01
iTsS 4,..,1,4,..,1, ==∈∀ sTJj (17)
Also 0=⋅ +−
kk dd and 0, ≥+−kk dd k = 1,..,4
(18)
Satisfy (Goals) Distance goal (Reduce total distance between charging stations and demand nodes) (Eq. 19).
+− −+⋅=∑∑∑∑ 111 ddYdG ijtT
i j t Tij
(19)
Installation cost goal (Reduce total installation cost of slots at charging stations) (Eq. 20).

5 Copyright © 2013 by ASME
+− −+⋅⋅=∑∑∑ 222 ddSscslotG iTsi T s
(20)
Service level goal (increases when demand from each demand node is met) (Eq. 21).
+−−+⋅=∑∑∑ 333 ddSslevelGi T s
iTsiTs (21)
Covering goal (decrease the total covered demand) (Eq. 22).
+−−+=∑∑∑∑ 444 ddGi j t T
ijtTy (22)
Minimize Minimize the deviation function, which is a measure of the deviation of the system performance from that implied by the set of goals and their associated priority levels and relative weights. In the deviation function, W1, W2 and W3 are weights for the importance of each goal.
),(
),(),(),(
444
333222111
−+
−+−+−+
+
++
ddW
ddWddWddWMinimize(24)
14321 =+++ WWWW (25)
3. AN EXAMPLE: AREA AND PARAMETERS FOR DALLAS COUNTY
Data from Dallas County in Texas is used. This county is located in the Dallas-Fort Worth area with 908 square miles. Dallas is the second largest city in Texas and its population is approximately 2,368,139. Projecting the PHEV demand in Dallas County is an important step toward designing a system of PHEV charging stations, and it is used in both the demand simulation model (Step One) and cDSP model (Step Two). In this section, first the projection of PHEV demand in Dallas County is explained, and then general parameters of both simulation model and mathematical model are listed.
3.1. PHEV Demand in Dallas County The projected demand for PHEVs is based on a goal
President Obama set in 2008. He pledged to put one million advanced technology electric vehicles (PHEVs) on the road by 2017, which would reduce dependence on foreign oil and curtail oil consumption by approximately 750 million barrels through 2030 (Energy Information Administration 2011). Based on President Obama’s plan for 1 million PHEVs by 2017, the Department of Energy (DOE) and North American Electric Reliability Corporation (NERC) must consider the influence of PHEVs on the reliability of the power grid. In March 2010 and 2011, the ISO/RTO Council (IRC) published a report entitled “Assessment of Plug-in Electric Vehicle Integration with ISO/RTO Systems,” and in this report they forecasted the demand for PHEVs ((IRC) 2010). Based on this report, the target of one million PHEVs will be met by 2017,
but the growth rate of electric vehicles will not be the same in all states. According to the data in the IRC report the demand for PHEVs there will be 10,961 PHEVs in Texas by 2017. The proposed model in this paper uses Dallas County as an example. The population size is considered to be the main factor in determining the distribution of PHEVs in each county, as well as throughout the country. Based on this factor, the number of PHEVs in Dallas County will be approximately 4194 by 2017. The hourly charging demand for PHEVs in Dallas County for a day is presented in Fig. 2. Displayed in Fig. 3 are the hourly percentages of total PHEV charging demand. In both Fig. 2 and Fig. 3, the PHEV charging demand peaks between 2 p.m. and 7 p.m. (hours 14 and 19) is shown. It is assumed that there is 24 hours demand, which is the same every day of the week ((IRC) 2010; Khosrojerdi and coauthors. 2012). This Projected demand is used in demand simulation model and the cDSP.

6 Copyright © 2013 by ASME
Figure 3. The percentage of daily PHEV charging
demand projected for every hour of the day (Khosrojerdi and coauthors., 2012)
Figure 2. The projected 24 hours PHEV demand for Dallas County (Khosrojerdi and coauthors., 2012)
Charging Duration
Charging Station
Vehicle arrives at the station
Charging Spots
Vehicle leaves the station Queue
Vehicles wait here for next available charging spots
If waiting time > customer max waiting time
Figure 1. The process of demand simulation model

7 Copyright © 2013 by ASME
Figure 4. Daily Charging Demand for Clusters
3.2. Simulation Model Parameters The arrival pattern of vehicles to the charging station is
modeled by using a poison distribution to represent time between arrivals of vehicles. Since the arrival rate of vehicles is independent from each other, a poison distribution is considered. The statistical model chosen represents the independence of vehicles arrival. Since the arrival density is time variant over hours, the mean of the distribution changes in every simulated hour based on calculation according to demand data that is presented in Section 3.1. Dallas County based on their population, and is shown in Fig. 4. Given that there are a total of D vehicles coming in daily, and the charging demand in current hour accounts for p% of the daily demand, then the average minutes between arrivals in current hour is calculated as 60/(D×p%).
Charging duration is calculated based on modeling charging amount for each single vehicle and the charging rate of charging slot. The power of charging slots is 75kW. Previous study in typical PHEVs that exist has provided us with a rough estimate of the amount of energy used in each vehicle. A uniform distribution is used as the statistical model for the amount of energy desired by charging vehicles in the work of this paper. If more information about proportion of cars with different battery size is gained in future, this statistical model should be changed accordingly.
3.3. Mathematical Model Parameters In the mathematical model various parameters are
generated based on information from Dallas County. Two important parameters are demand nodes and super power nodes which are indicated by j and i indices in the mathematical model respectively. Connection between demand nodes and super power nodes is illustrated in Figure 4.
Charging Stationi
Charging Stationi
Demand Nodej
Demand Nodej
Figure 5. Connection between demand nodes and supper
power nodes
Considering that the simulation model parameter includes random variable from statistical models, 50 replications are made for each simulation run, to get more general information on performance of the charging station. The mean value of output for different replications is used as an estimate of output for that scenario.
Demand nodes indicate where and how much PHEV demand is. Population distribution is the primary consideration in determining electric charging station placement. To incorporate both factors within a mathematical model, “demand nodes” have been located; each “demand node” corresponds to the geographical coordinates (in latitude and longitude) of a particular zip code, post office, or courthouse. 99 non-P.O. box zip codes have been identified in Dallas County, with 69 of these marked as having post offices and 3 as having courthouses. In total we consider 105 different zip codes in Dallas County as demand nodes that are indicated by j indices in mathematical model. In Figure 6, all zip codes and parts of Dallas County are illustrated. To calculate distance between demand nodes and super power nodes, the center of zip codes is considered as the geographic coordination of demand nodes.
Super power nodes indicate potential locations for PHEV charging stations. Since charging stations should have a trade of electricity with the power grid, we would like to find the point of the power market that is the simplest way to participate in ancillary service with the market (trading the energy with power grid). These super power nodes can serve our needed. In Dallas County there are 9 super power nodes that are categorized as four separate clusters. Since all super power nodes in each cluster are close to each other, our approach locates at most one charging station at each cluster (Equation 6). All four clusters and nine super power nodes at Dallas County are indicated in Figure 7. Geographic coordination of these nodes are presented in Table 1. The rest of parameters are listed in Table 2.
0 200 400 600 800
1000 1200 1400 1600 1800 2000
Year 2014 Year 2015 Year 2016 Year 2017
Cluster 1
Cluster 2
Cluster 3
Cluster 4

8 Copyright © 2013 by ASME
Figure 6. Dallas County zip codes (digital-vectore-
maps.com)
Cluster 1
Cluster 2
Cluster 3
Cluster 4
Figure 7. Dallas County super power nodes and four
clusters (ERCOT website)
Table 1. Geographic coordination of super power nodes (ERCOT website)
Cluster Super node Latitude Longitude 1 1 32.80974835 -96.49590871 1 2 32.82647724 -96.49026152 2 3 32.69798727 -96.87361345 2 4 32.69798727 -96.8735 2 5 32.69798727 -96.8734 3 6 32.36099082 -96.92089221 3 7 32.36099082 -96.9208 3 8 32.36099082 -96.9207 4 9 32.89651688 -96.55632045
Table 2. Parameters of the cDSP
Parameters value Flow rate (frate) 75 Kw/hour Number of charging stations (nt)
For 2014 and 2015 is 4 For 2016 and 2017 is 5
Number of scenarios (s) 4 (1 slot to 4 slots at each charging station)
Number of demand nodes 105 Number of clusters 4 Number of super power nodes 9 Installation cost per slot $15000 Weight of Goal 1 (W1) 0.25 Weight of Goal 2 (W2) 0.25 Weight of Goal 3 (W3) 0.25 Weight of Goal 4 (W4) 0.25
To find the demand at demand nodes, hourly demand data for Dallas County (Section 3.1) is used. Population at each zip code is the criteria used to distribute total hourly demand between demand nodes.
4. NUMERICAL RESULTS In the proposed two-step approach, the first of which is the
simulation model, and then cDSP is run. The demand simulation model is run for four different
clusters in Dallas County, for years 2014 through 2017. For each cluster in each year, the scenarios with different charging slots availability are explored, to see the performance on service level for each scenario. The approximate daily charging demand for each of the four clusters in Dallas County in year 2014 is shown in Figure 8 as an example.
Figure 8. Approximate daily charging demand for various service level scenarios in Dallas County
0 0.1 0.2 0.3 0.4 0.5 0.6 0.7 0.8 0.9 1
1 spot per sta4on
2 spots per sta4on
3 spots per sta4on
4 spots per sta4on
Cluster 1
Cluster 2
Cluster 3
Cluster 4
9 Copyright © 2013 by ASME
From the simulation results of the four clusters for different scenarios, it is seen that different service levels in terms of met demand percentage are reached in different clusters, this is because of different total daily charging demand between clusters, as shown in Section 3.1. The clusters with more total daily demand will reach significantly lower service level. For each cluster, higher service level can be reached by more charging slots.
There is a constraint to meet as much charging demand as possible by installing more charging slots, because of the addition in cost brought by building every extra charging slot. Compromise should be made between reaching higher service levels for all charging stations and less total spending in building the stations. These two objectives are included in the mathematical model as goals, and the compromised design is sought for through running the mathematical model.
The cDSP is run for four scenarios by DSIDES. Each scenario in the cDSP indicates a different number of slots at the charging stations. The model is run for 2014. The selected super power nodes as the location of charging stations and number of slots at each charging station are shown in Table 3.
Table 3. Results of running cDSP model for 2014
Cluster Super power node
Located charging station
Number of slots
Cluster 1
i = 1 X1 = 1 3 i = 2 X1 = 0 0
Cluster 2
i = 3 X1 = 0 0 i = 4 X1 = 0 0 i = 5 X1 = 1 4
Cluster 3
i = 6 X1 = 0 0 i = 7 X1 = 0 0 i = 8 X1 = 1 3
Cluster 4
i = 9 X1 = 1 4
As shown in Table 2 only one charging station can be located in each cluster. The number of slots in charging stations is selected based on compromising between the installation cost (Goal 2 in cDSP model) and the service level (Goal 3 in cDSP model). All four goals in cDSP are normalized to a number between zero and one and are shown in Figure 9.
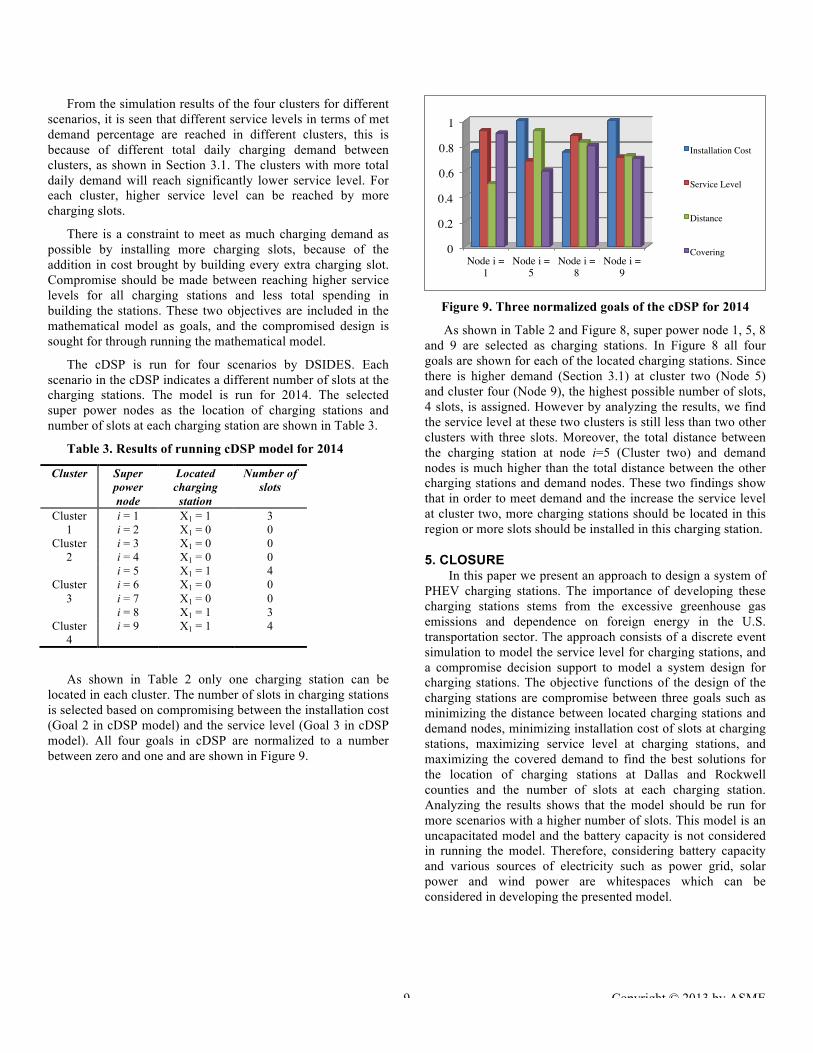
Figure 9. Three normalized goals of the cDSP for 2014
As shown in Table 2 and Figure 8, super power node 1, 5, 8 and 9 are selected as charging stations. In Figure 8 all four goals are shown for each of the located charging stations. Since there is higher demand (Section 3.1) at cluster two (Node 5) and cluster four (Node 9), the highest possible number of slots, 4 slots, is assigned. However by analyzing the results, we find the service level at these two clusters is still less than two other clusters with three slots. Moreover, the total distance between the charging station at node i=5 (Cluster two) and demand nodes is much higher than the total distance between the other charging stations and demand nodes. These two findings show that in order to meet demand and the increase the service level at cluster two, more charging stations should be located in this region or more slots should be installed in this charging station.
5. CLOSURE In this paper we present an approach to design a system of
PHEV charging stations. The importance of developing these charging stations stems from the excessive greenhouse gas emissions and dependence on foreign energy in the U.S. transportation sector. The approach consists of a discrete event simulation to model the service level for charging stations, and a compromise decision support to model a system design for charging stations. The objective functions of the design of the charging stations are compromise between three goals such as minimizing the distance between located charging stations and demand nodes, minimizing installation cost of slots at charging stations, maximizing service level at charging stations, and maximizing the covered demand to find the best solutions for the location of charging stations at Dallas and Rockwell counties and the number of slots at each charging station. Analyzing the results shows that the model should be run for more scenarios with a higher number of slots. This model is an uncapacitated model and the battery capacity is not considered in running the model. Therefore, considering battery capacity and various sources of electricity such as power grid, solar power and wind power are whitespaces which can be considered in developing the presented model.
0
0.2
0.4
0.6
0.8
1
Node i = 1
Node i = 5
Node i = 8
Node i = 9
Installation Cost
Service Level
Distance
Covering

10 Copyright © 2013 by ASME
ACKNOWLEDGEMENTS We gratefully acknowledge support from NSF Grant
1128826. We also gratefully acknowledge Paul Hoang’s careful revisions of the manuscript.
REFERENCES
(IRC), ISO/RTO Council (2010). Assessment of Plug-in Electric Vehicle Integration with ISO/RTO Systems. I. a. I. R. C. KEMA.
U.S. Energy Information Administration., (2011, January 4). "Electric Power Annual 2009." 1. Retrieved November 23, 2010, from http://www.eia.gov/electricity/annual/.
Frade, I., Ribeiro, A., Gonçalves, G., and Antunes, A., (2011). "Optimal Location of Charging Stations for Electric Vehicles in a Neighborhood in Lisbon, Portugal." Transportation Research Record 2252(1): 91.
Kameda, H., and Mukai, N., (2012). Optimization of Charging Station Placement by Using Taxi Probe Data for On-Demand Electrical Bus System, Springer Berlin Heidelberg, Berlin, Heidelberg, 2011: 606.
Khosrojerdi, A., Allen, J, K., Lee, W and Mistree, F., (2012). Designing an Electric Charging Station for Plug-In-Hybrid-Electric-Vehicles in the Face of Uncertain Demand. 12th AIAA Aviation Technology, Integration, and Operations (ATIO) Conference and 14th AIAA/ISSMO Multidisciplinary Analysis and Optimization Conference, American Institute of Aeronautics and Astronautics.
Mistree, F., Hughes, O. F., and Bras, B., (1993). "Compromise Decision Support Problem and the Adaptive Linear Programming Algorithm." PROGRESS IN ASTRONAUTICS AND AERONAUTICS 150: 251.
Sweda, T., and Klabjan, D (2011)., "An agent-based decision support system for electric vehicle charging infrastructure deployment." 2011 IEEE Vehicle Power & Propulsion Conference (VPPC): 1.
Wang, H., Huang, Q., Zhang, C., and Xia, A., (2010). "A novel approach for the layout of electric vehicle charging station." 2010 International Conference on Apperceiving Computing & Intelligence Analysis (ICACIA): 64.


