Embed Size (px)
Citation preview

Biochimica et Biophysica Acta 1828 (2013) 2223–2229
Contents lists available at SciVerse ScienceDirect
Biochimica et Biophysica Acta
j ourna l homepage: www.e lsev ie r .com/ locate /bbamem
Destabilization induced by electropermeabilization analyzed by atomicforce microscopy
Louise Chopinet a,b,c, Charles Roduit d, Marie-Pierre Rols b,c,⁎, Etienne Dague a,c,e,⁎⁎a CNRS, LAAS, 7 avenue du colonel Roche, F-31400 Toulouse, Franceb Centre National de la Recherche Scientifique, Institut de Pharmacologie et de Biologie Structurale (IPBS) UMR 5089, BP64182, 205 route de Narbonne,F-31077 Toulouse Cedex 4, Francec Univ de Toulouse, LAAS, IPBS, ITAV, F-31400 Toulouse, Franced Département de Biologie Cellulaire et de Morphologie, Université de Lausanne, Lausanne, Switzerlande CNRS, ITAV, USR 3505, F-31106 Toulouse, France
Abbreviation: AFM, Atomic Force Microscopy; EP,Young Modulus; CHO, Chinese Hamster Ovary Cell; QI™⁎ Correspondence to:M.-P. Rols, CentreNational de la Re
Pharmacologie et de Biologie Structurale (IPBS) UMRNarbonne, F-31077 Toulouse Cedex 4, France. Tel.: +3⁎⁎ Correspondence to: E. Dague,CNRS, ITAV, USR 3505, FCRoche, F-31400 Toulouse, France. Tel.: +33 561337841.
E-mail addresses: [email protected] (M.-P. Rols), edague@
0005-2736/$ – see front matter © 2013 Published by Elhttp://dx.doi.org/10.1016/j.bbamem.2013.05.035
a b s t r a c t
a r t i c l e i n f oArticle history:Received 15 March 2013Received in revised form 29 May 2013Accepted 31 May 2013Available online 10 June 2013
Keywords:ElectroporationElectropermeabilizationAtomic force microscopeLiving cellsCytoskeletonStiffness
Electropermeabilization is a physical method that uses electric field pulses to deliver molecules into cells andtissues. Despite its increasing interest in clinics, little is known about plasma membrane destabilizationprocess occurring during electropermeabilization. In this work, we took advantage of atomic force microscopyto directly visualize the consequences of electropermeabilization in terms of membrane reorganization and tolocally measure the membrane elasticity. We visualized transient rippling of membrane surface and measureda decrease in membrane elasticity by 40%. Our results obtained both on fixed and living CHO cells give evidenceof an inner effect affecting the entire cell surface that may be related to cytoskeleton destabilization. Thus, AFMappears as a useful tool to investigate basic process of electroporation on living cells in absence of any staining orcell preparation.
© 2013 Published by Elsevier B.V.
1. Introduction
Electropermeabilization (EP) consists in the local application ofelectric field pulses to cells and tissues which renders the plasmamembrane transiently and locally permeable to non-permeant mol-ecules [1]. This physical method is used in clinics to potentiate thecytotoxic effect of anticancer drugs (electrochemotherapy) [2,3]and has great promise for gene transfer (electrogenotherapy andvaccination) [4–6]. In 2012, more than 3000 patients have beentreated by electrochemotherapy, while 8 clinical trials were ongoing.
However the electric field effects are still poorly understood at themolecular level [7]. Indeed, membrane permeabilization had onlybeen indirectly studied by the entry of fluorescent or radioactivemarkers and countable molecules into cell populations during and after
Electropermeabilization; YM,, Quantitative Imaging™cherche Scientifique, Institut de5089, BP64182, 205 route de3 56115811.NRS, LAAS, 7 avenue du colonel
laas.fr (E. Dague).
sevier B.V.
pulse application [8,9], or by transmembrane potential measurements[7]. Permeabilization has been described as localized at the sides of thecell facing the electrodes [10], which is explained by the change inmem-brane polarization at these two polar positions regarding electric field(hyperpolarization facing the anode and depolarization facing the cath-ode) [11]. Furthermore, physical mechanisms at the molecular level de-scribed by numerical simulation have shown water wire in lipid bilayerduring pulse application [12], indicating lipid abilities to change theirtransmembrane orientation, in agreement with both theoretical [13]and experimental studies [14]. Finally, lipid loss inducing several mem-brane alterations (pores, tubules and vesicles formation) has been ob-served on giant unilamellar vesicules submitted to electric pulses [15].All these observations tend to prove the existence of lipid disorganiza-tion due to electric field application and different ways ofmembrane de-stabilization. However, most of these studies used fluorescent dyes thatcan create some artifact as they are most of the time charged, while sim-ulations were undertaken with non-relevant electrical conditions re-garding biological application. Consequently, the need of data recordeddirectly at the single cell level without any staining or preparation wasclearly felt and required further measurements. In this context, our chal-lenge was to visualize the effects of membrane destabilization resultingin permeabilization to small molecules and to perform direct quantita-tive biophysical measurements using atomic force microscopy (AFM).

2224 L. Chopinet et al. / Biochimica et Biophysica Acta 1828 (2013) 2223–2229
During the last decades AFM has emerged as a valuable tool toexplore the cell membrane biophysical properties [16,17]. We havechosen to use its force spectroscopy mode to measure EP effects oncell membrane elasticity at the single cell level. We used the innovativeQuantitative Imaging (QI™) mode from JPK [18], which is a high speedand resolution force volume mode designed for soft and looselyimmobilized samples. Based on the force volume mode measurement,QI™mode allows to record images at a high speedwithout exerting lat-eral pressure on the sample [19]. We worked with Chinese hamsterovary (CHO) cells with electrical conditions which were used for genetransfer [20]. It is a commonly used model for electroporation study[9] that has not been much studied by AFM [21]. We studied bothfixed and living cells to access the different steps of membraneelectropermeabilization. Force measurements allowed quantifying anddescribing along time the effect, and height images of living cells gavefirst assumptions on effect of electric field on membrane shape(Fig. 1.A). Nanomechanics revealed that electric field provokes a de-crease in YM of plasma membrane by 40% and that the effect observedmay be longer than showed by fluorescence imaging after pulse appli-cation. This paper states that AFM can be used to study electroporation
Fig. 1. Experiment outline and permeabilization control. (A) Experiment outline. Cells a(B) Permeabilization and membrane resealing along time. CT is the control representinrelated to the membrane permeabilization and decreases along time. (C) and (D) Phase
phenomenon at the single cell level, and can be a helpful tool to inves-tigate at the basic level of electro-destabilization.
2. Materiel and methods
2.1. Sample preparation
2.1.1. Fixed cells150,000 Chinese hamster ovary cells (wild type ATCC) were grown
during 48 h on a coverslip in minimum Eagle's medium (MEM 0111,Eurobio, France) supplemented with 8% fetal calf serum (Lonza GroupLtd, Switzerland), and incubated at 37 °C in humidified atmospherewith a 5% CO2 incubator. Prior to electrical pulse application, cells werewashed 3 times with phosphate-buffered saline (PBS) 1× (Invitrogen,USA). 1 mL of pulsation buffer (PB) at 4 °C (10 mM K2HPO-4/KH2PO4
−
buffer, 1 mM MgCl2, 250 mM sucrose, pH 7.4) was added, electrodeswere placed in contact with glass surface and pulses delivered.Immediately after pulse application, PB was removed, and 1 mL of4% paraformaldehyde solution (Sigma-Aldrich, Saint-Louis, MO) inPBS 1× was added, and coverslip was placed at 4 °C for 30 min.
re pulsed and then either fixed or kept alive to be imaged and measured by AFM.g cell not subjected to electric pulses. The number of PI positives cells is directlycontrast and fluorescence image of cell 5 min after pulse application with PI.

2225L. Chopinet et al. / Biochimica et Biophysica Acta 1828 (2013) 2223–2229
Before AFM measurements, cells were washed 3 times with PBS 1×.The coverslip was placed on themicroscope stage and PBSwas addedall along the measurement to avoid drying.
2.1.2. Living cells75,000 CHO cells were grown in Petri dish during 24 h in the same
cell culture conditions described in Section 2.1.1. Before measure-ments, classical MEMmedium was replaced by MEM–HEPES medium(CM1MEM46-6U, Eurobio, France) supplemented with 8% fetal calfserum (Lonza Group Ltd, Switzerland) and cells were placed in thePetriDishHeater (JPK) that maintained 30 °C during all the experi-ment. Before pulse application, head of AFM was removed, cellswere washed 3 times with 1 mL PBS 1×, 1 mL PB was added and elec-trodes were placed in contact with the Petri dish bottom. Pulsed weredelivered and AFM head was replaced.
2.2. Electropermeabilization
The generator used for this study was Jouan (Herberlain, France).Electrical parameters for gene transfer were used: 8 square-waveelectric pulses of 5 ms duration at 400 V/cm applied at a frequencyof 1 Hz through stainless steel parallel electrodes directly on theglass slide (fixed cells) or the Petri dish (living cells) in PB [20].
2.3. Resealing
Adherent cells were pulsed in a Petri dish as previously describedthen kept at 37 °C or 30 °C and 0.1 mM propidium iodide (PI,Sigma-Aldrich, Saint-Louis, MO) in PB buffer was added at differenttime after pulse exposure. Fluorescence (Leica DMRIB microscope,filter: BP 515–560, Mirror 590, LP 590, 40× objective) and phase con-trast images of cells were recorded and number of PI positives cellswere counted thanks to ImageJ software, as well as total number ofcell per plan. The ratio between the two numbers minus the numberof dead cells gave the percentage of permeabilized cells.
2.4. AFM measurements
An AFM Nanowizard 3 (JPK Instrument, Berlin, Germany) wasused. We used MLCT cantilevers (Bruker probes, USA) with springconstant ranging from 0.028 to 0.042 N·m−1. QI™ and force mappingsettings used were the following: Z-length 5 μm; applied force 4 nN;speed: 166 μm/s for QI™ imaging on fixed cells, 1000 μm/s for livingcells; 24.98 μm/s for forcemapping. Before each experiment, sensitivityand spring constant (thermal noise method [22]) of cantilever werecalibrated.
2.5. Data analysis
JPK data processing software was used for image processing.Images were flattened (order 1) and a 3D projection was made. TheHertz model gives the force F as a function of the indentation (δ) andof the Young modulus (YM). The opening angle (α) of this sort oftip was 35° and we arbitrary choose a Poisson ratio (ν) of 0.5. F =((2·E·tanα) / (π·(1 − ν2))·δ2. OpenFovea 0.1a152 software was usedfor force curve analysis with the following settings: model: cone; tipsize: 0.62 rad; Poisson ratio: 0,5; method: raw. Frequency distributionswere obtained with OriginPro 8 software, and histograms were plottedwith GraphPad Prism software, that was used for statistical analysis too.
3. Results
To access the membrane destabilization effects, we performedtwo types of measurements on CHO cells, one on cells fixed directlyafter EP in order to capture the first step of destabilization at highresolution (that was time consuming and incompatible with living
cell dynamics), and one on living cell to record dynamic along time.On each cell we explored 4 regions on the cell membrane: 2 regionsin front of the electrodes (wheremembrane permeabilization occurred)and 2 regions perpendicular to the electric field as indicated on Fig. 1.A.Because of the permeabilization pattern around the cell [11], wewantedto make measurement at these places to detect any evidence of prefer-ential effect whether the areas are facing the electrode or not. Forcemeasurement and imaging were recorded on these areas for fixedcells. For living cell, only force measurements were performed onthese areas, and whole cells were imaged along time. Each single forcecurve has been analyzed to extract the tip indentation and fit it withthe Hertz model. OpenFovea software [23] had been used to extractthe Young modulus (YM) values on the first 50 nm of indentation, in-cluding membrane and as few inner cell component as possible [24].The results were analyzed both qualitatively through elasticity mapand quantitatively by pooling all the data in frequency distributionand histograms.
The membrane permeabilization had been ‘classically’ visualizedby propidium iodide (PI) entry into the cells which is possible onlywhen the membrane is permeable [7] (Fig. 1.B–D). Under the electricfield conditions used at 37 °C, around 30% of the cells were perme-abilized and viable just after EP. Adding PI at different times afterEP allowed us to assess the lifetime of the permeabilization process.As shown Fig. 1.B, membrane recovery occurred in less than 10 min.At that time, the number of permeabilized cells were, indeed, not dif-ferent from control condition.
3.1. Experiments on fixed cells
In the first AFM experiment, cells were fixed immediately afterEP. This allowed us to perform AFM measurements on cells that‘froze’ in less than 1 min after EP. Imaging cells with the QI™ modeshowed a bumpy membrane without any indication of specific alter-ation due to electric pulses, even at higher magnification, comparedto control cells (Fig. 2.A–B and supplementary data Figs. 1–2). Wetherefore explored 4 regions on the cell membrane: 2 regions infront of the electrodes (where membrane permeabilization occurred)and 2 regions perpendicular to the electric field as indicated onFig. 2.B (where no permeabilization is induced by the EP accordingto fluorescent images [11]). In each regions of interest (3 × 3 μm2),a force map of 64 × 64 force curves was recorded (4096 curves).As shown by elasticity map, stiff areas are present on control cell(heterogeneous pattern), and pulsed regions are on the whole softand homogeneous (Fig. 2.C and D). This decrease in stiffness is visibleon force-curve profiles (Fig. 2.E), that showsmeasurement of a soft sur-face after pulse application as the force increases slower. Surprisingly,no significant or repeatable differences have been measured betweenregions facing electrodes and the other ones (See Table A and Figs.1–2 of supplementary data). This result indicates a propagation of theeffect on thewholemembrane, the decrease in stiffness beingmeasureduniformly around the cell. When merging the YM data of the 4 regions,this change in elasticity was quantitatively measured: YM of theplasma membrane being significantly decreased from 30.0 ± 2.0 kPafor untreated cells to 20.5 ± 1.0 kPa for electropermeabilized cells(Fig. 2.F). This decrease in the average YM value is paired with a reduc-tion of the standard deviation indicating a rapid homogenization and aglobal change of membrane elasticity (Fig. 2.G). These results giveevidence for global propagation around the cell of the perturbation/reorganization on membrane in the minute following EP.
3.2. Experiments on living cells
In a second set of experiments, EP had been directly performed onthe AFM stage on living cells with the same electrodes and electricalparameters. We took advantage of the AFM ability to work in liquidat controlled temperature to slow down the process working at 30 °C.
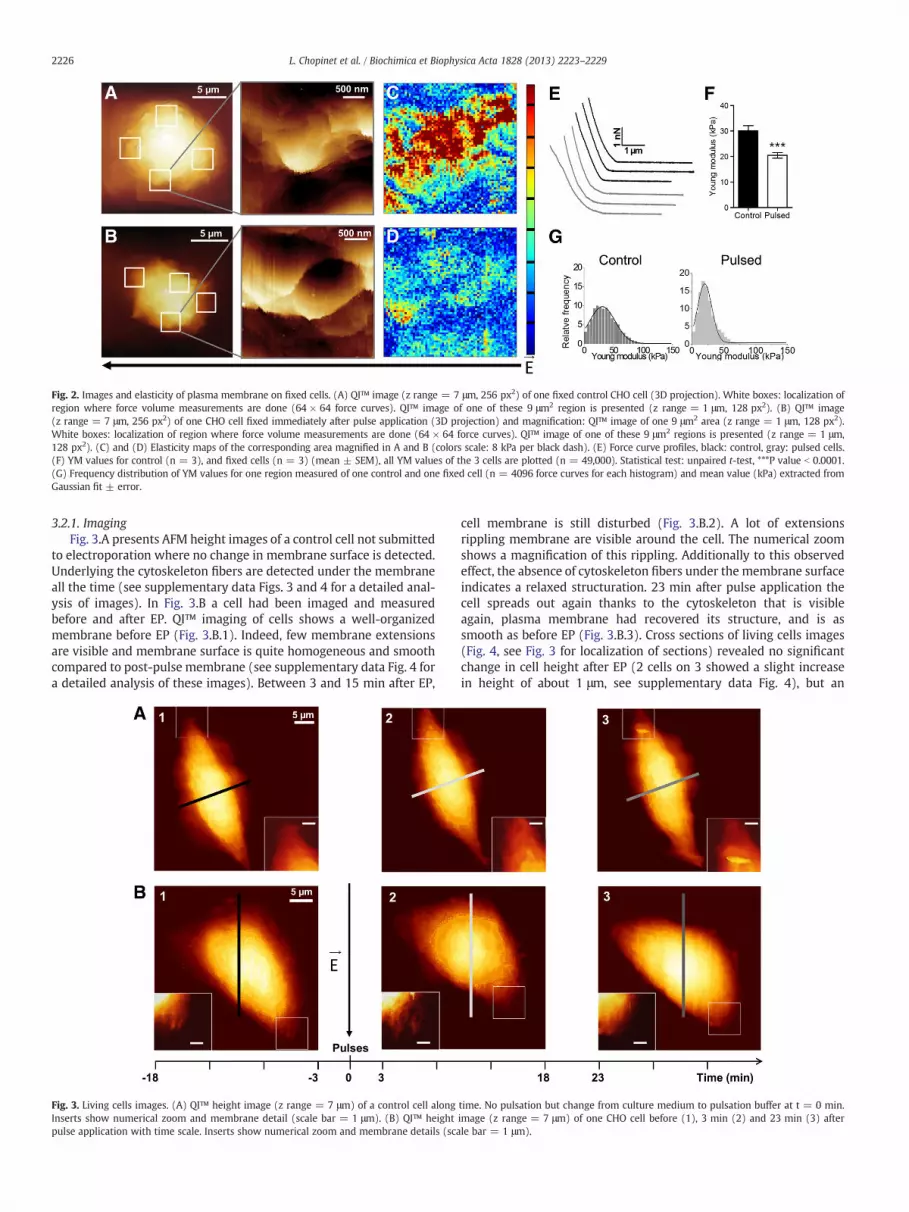
Fig. 2. Images and elasticity of plasma membrane on fixed cells. (A) QI™ image (z range = 7 μm, 256 px2) of one fixed control CHO cell (3D projection). White boxes: localization ofregion where force volume measurements are done (64 × 64 force curves). QI™ image of one of these 9 μm2 region is presented (z range = 1 μm, 128 px2). (B) QI™ image(z range = 7 μm, 256 px2) of one CHO cell fixed immediately after pulse application (3D projection) and magnification: QI™ image of one 9 μm2 area (z range = 1 μm, 128 px2).White boxes: localization of region where force volume measurements are done (64 × 64 force curves). QI™ image of one of these 9 μm2 regions is presented (z range = 1 μm,128 px2). (C) and (D) Elasticity maps of the corresponding area magnified in A and B (colors scale: 8 kPa per black dash). (E) Force curve profiles, black: control, gray: pulsed cells.(F) YM values for control (n = 3), and fixed cells (n = 3) (mean ± SEM), all YM values of the 3 cells are plotted (n = 49,000). Statistical test: unpaired t-test, ***P value b 0.0001.(G) Frequency distribution of YM values for one region measured of one control and one fixed cell (n = 4096 force curves for each histogram) and mean value (kPa) extracted fromGaussian fit ± error.
2226 L. Chopinet et al. / Biochimica et Biophysica Acta 1828 (2013) 2223–2229
3.2.1. ImagingFig. 3.A presents AFM height images of a control cell not submitted
to electroporation where no change in membrane surface is detected.Underlying the cytoskeleton fibers are detected under the membraneall the time (see supplementary data Figs. 3 and 4 for a detailed anal-ysis of images). In Fig. 3.B a cell had been imaged and measuredbefore and after EP. QI™ imaging of cells shows a well-organizedmembrane before EP (Fig. 3.B.1). Indeed, few membrane extensionsare visible and membrane surface is quite homogeneous and smoothcompared to post-pulse membrane (see supplementary data Fig. 4 fora detailed analysis of these images). Between 3 and 15 min after EP,
Fig. 3. Living cells images. (A) QI™ height image (z range = 7 μm) of a control cell alongInserts show numerical zoom and membrane detail (scale bar = 1 μm). (B) QI™ heightpulse application with time scale. Inserts show numerical zoom and membrane details (sca
cell membrane is still disturbed (Fig. 3.B.2). A lot of extensionsrippling membrane are visible around the cell. The numerical zoomshows a magnification of this rippling. Additionally to this observedeffect, the absence of cytoskeleton fibers under the membrane surfaceindicates a relaxed structuration. 23 min after pulse application thecell spreads out again thanks to the cytoskeleton that is visibleagain, plasma membrane had recovered its structure, and is assmooth as before EP (Fig. 3.B.3). Cross sections of living cells images(Fig. 4, see Fig. 3 for localization of sections) revealed no significantchange in cell height after EP (2 cells on 3 showed a slight increasein height of about 1 μm, see supplementary data Fig. 4), but an
time. No pulsation but change from culture medium to pulsation buffer at t = 0 min.image (z range = 7 μm) of one CHO cell before (1), 3 min (2) and 23 min (3) afterle bar = 1 μm).
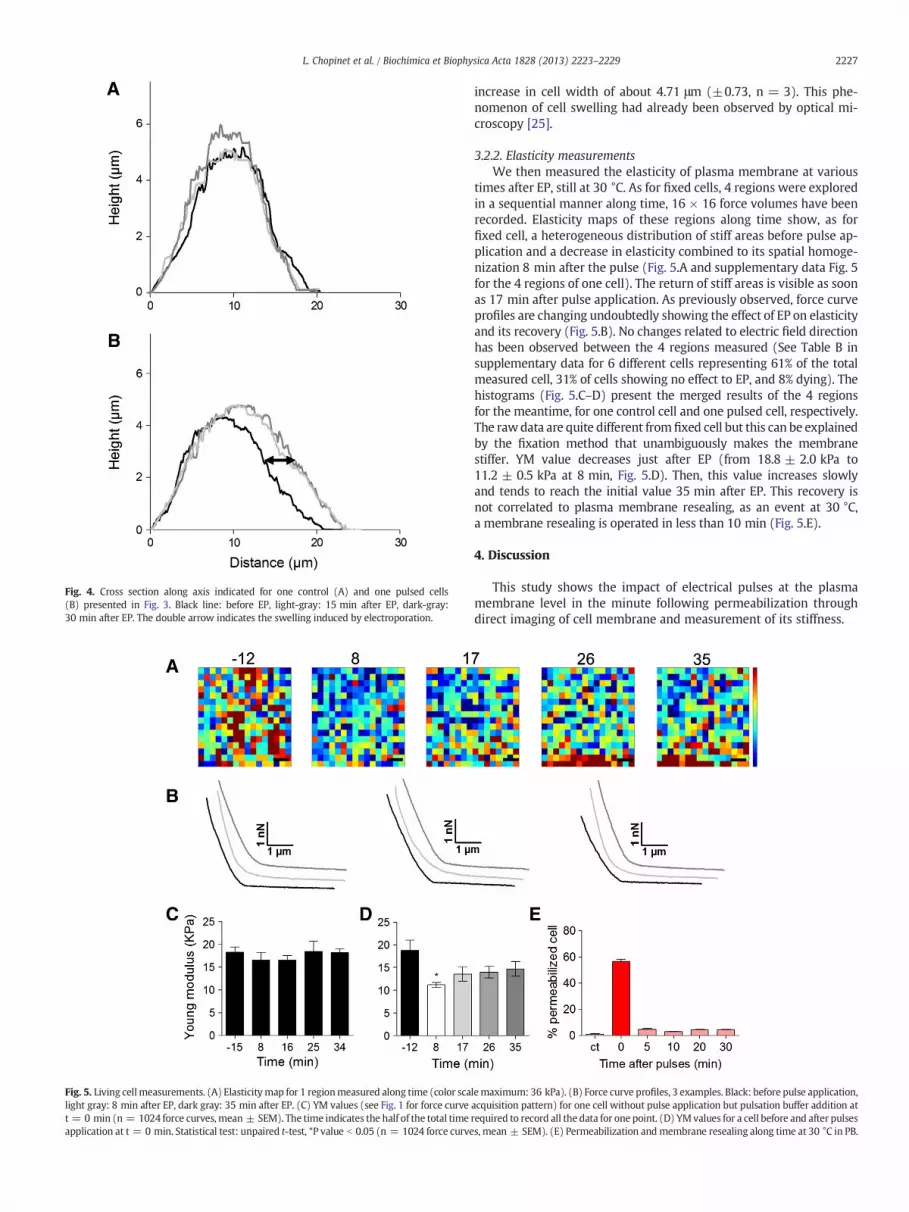
Fig. 4. Cross section along axis indicated for one control (A) and one pulsed cells(B) presented in Fig. 3. Black line: before EP, light-gray: 15 min after EP, dark-gray:30 min after EP. The double arrow indicates the swelling induced by electroporation.
Fig. 5. Living cellmeasurements. (A) Elasticitymap for 1 regionmeasured along time (color scalight gray: 8 min after EP, dark gray: 35 min after EP. (C) YM values (see Fig. 1 for force curvet = 0 min (n = 1024 force curves, mean ± SEM). The time indicates the half of the total timeapplication at t = 0 min. Statistical test: unpaired t-test, *P value b 0.05 (n = 1024 force curve
2227L. Chopinet et al. / Biochimica et Biophysica Acta 1828 (2013) 2223–2229
increase in cell width of about 4.71 μm (±0.73, n = 3). This phe-nomenon of cell swelling had already been observed by optical mi-croscopy [25].
3.2.2. Elasticity measurementsWe then measured the elasticity of plasma membrane at various
times after EP, still at 30 °C. As for fixed cells, 4 regions were exploredin a sequential manner along time, 16 × 16 force volumes have beenrecorded. Elasticity maps of these regions along time show, as forfixed cell, a heterogeneous distribution of stiff areas before pulse ap-plication and a decrease in elasticity combined to its spatial homoge-nization 8 min after the pulse (Fig. 5.A and supplementary data Fig. 5for the 4 regions of one cell). The return of stiff areas is visible as soonas 17 min after pulse application. As previously observed, force curveprofiles are changing undoubtedly showing the effect of EP on elasticityand its recovery (Fig. 5.B). No changes related to electric field directionhas been observed between the 4 regions measured (See Table B insupplementary data for 6 different cells representing 61% of the totalmeasured cell, 31% of cells showing no effect to EP, and 8% dying). Thehistograms (Fig. 5.C–D) present the merged results of the 4 regionsfor the meantime, for one control cell and one pulsed cell, respectively.The rawdata are quite different from fixed cell but this can be explainedby the fixation method that unambiguously makes the membranestiffer. YM value decreases just after EP (from 18.8 ± 2.0 kPa to11.2 ± 0.5 kPa at 8 min, Fig. 5.D). Then, this value increases slowlyand tends to reach the initial value 35 min after EP. This recovery isnot correlated to plasma membrane resealing, as an event at 30 °C,a membrane resealing is operated in less than 10 min (Fig. 5.E).
4. Discussion
This study shows the impact of electrical pulses at the plasmamembrane level in the minute following permeabilization throughdirect imaging of cell membrane and measurement of its stiffness.
lemaximum: 36 kPa). (B) Force curve profiles, 3 examples. Black: before pulse application,acquisition pattern) for one cell without pulse application but pulsation buffer addition atrequired to record all the data for one point. (D) YMvalues for a cell before and after pulsess, mean ± SEM). (E) Permeabilization andmembrane resealing along time at 30 °C in PB.

2228 L. Chopinet et al. / Biochimica et Biophysica Acta 1828 (2013) 2223–2229
Results show that electric field provokes a change in membraneelasticity, namely an increase in softness characterized by a decreasein YM values. We have performed the measurements which are theclosest possible to pulse application by fixing the cells, but still, themeasurements were recorded on the cells that are froze in the minutefollowing EP. The permeabilization and themembrane resealing are oc-curring in themillisecond and second range following pulse application[7]. Thus, the effect measured is not the direct permeabilization ofmembrane, but a longer effect that is still present in theminutes follow-ing EP (Fig. 2). Both theory describing the electropermeabilizationprocess and experiments of fluorescent molecule uptake which wereperformed on the cells, state that electropermeabilization is inducedon the side of the cells facing the electrodes because of the membranepolarization changes. In our conditions no differences in stiffness de-crease have been measured depending on electric field direction(Table A supplementary data). We conclude that AFM allows sensinga different effect of EP than standard fluorescent microscopy using PIdetection uptake does, as it is happening later than permeabilizationand on the whole cell. Experiments on living cell confirm thishypothesis. Indeed, by decreasing the temperature, we managedto record the same decrease in stiffness after pulse application(Fig. 5.A–D). Stiffness measurements along time show a slow recov-ery process that tends to reach initial cell stiffness 35 min after EP.However, at 30 min after pulse application, even at 30 °C, the mem-brane is completely resealed (Fig. 5.E), which confirms that no directlink between permeabilization event and the decrease in stiffnesscan be done. These observations show that the decrease in stiffnessis a dynamic process that is present after membrane permeabilizationand can be slowed down by a decrease in temperature. All together,these measurements lead to the conclusion that even if membranepermeabilization is locally induced in specific regions of the cell andis transient (fluorescence imaging), its consequences on stiffness areglobal and still present when membrane resealing has occurred.
Height images of living cells show post-electroporated membraneand give evidence of real membrane disorganization and a completere-organization for the first time on living cells (Fig. 3 and supple-mentary data Figs. 3–4). These observations of the visible effect ofEP on cell membrane shown by AFM images may not be inducedonly by membrane disorganization but also by cytoskeleton reorgani-zation as stress fibers are not visible from 15 to 23 min after EP(Fig. 3.B.2).
Images give also access to height and width parameter of the cells.Cell swelling has been measured after electroporation (Fig. 4) in agree-ment with previous studies [25]. However, this effect that is due towater entry into cell cytoplasm cannot be considered as the first causeof decrease in elasticity after EP. Indeed, we extracted the Young modu-lus value by fitting the indentation curve by a Hertz model. This Youngmodulus reflects the elasticity of our sample. Changes due to osmoticpressure can be calculated through the spring constant of the sample,but is not reflected by the Youngmodulus [26]. Thus the datawe presentin Fig. 4 do not reflect the change in osmotic pressure shown by swelling.Moreover, an increase in cell size should indicate an increase in stiffnessas more volumemust be contained in the same compartment that is theplasmamembrane. Herewemeasure a decrease in stiffness, so the oppo-site, will confirm that we see the membrane destabilization and not theeffect of cell swelling.
Thanks to OpenFovea software [23] we chose to measure elasticityof the 50 first nanometers in contact with the tip, containing the plas-ma membrane, but also the transmembrane proteins, and the part ofthe cytoskeleton network branched on these proteins or directly onlipids [27–29]. The change in elasticity may thus not be a measurementof lipid bilayer disorganization but may reflect an internal effect of EPwhich affects plasma membrane. All together, the data presented leadto the hypothesis that AFM measures a dynamic effect of EP on theinternal structure of the cell which lasts longer thanmembrane perme-abilization and recovers slowly. As images show the absence of
cytoskeleton fibers after pulse application, we hypothesize that this islinked to cortical actin, as proposed by Fels et al. [30]. Several papersshowed the actin restructuration after EP [20,31] or its role in mem-brane permeabilization [32] and thus support the implication of actinin the measured effect. Cortical actin network being linked to mem-brane, the destabilization of lipids during pulse application may destabi-lize actin interactions, thus reducing membrane resistance to an externalpressure, resulting in a decrease in stiffness. Force measurements givequantitative data about this destabilization by showing a decrease instiffness of the membrane happening later than membrane perme-abilization, and lasting longer, confirming the side effect and not thedirect effect of electric pulses. Changes in membrane shape (rippling)and cell swelling contribute to the assumption that as lipids are disturb,direct interaction between cortical actin network and plasmamembraneis not preserved during pulse application, as it can be interpreted like thedetachment of membrane lipid bilayer from cortical actin grid (swelling)and its movement free of any anchorage (rippling). This detachmentmay explain why no actin fibers were imaged during the 15 min follow-ing pulse application. Even if this interpretation is convenient, the actualobservations do not allow concluding whether membrane detachmenthypothesis is the good one. Indeed, themembrane elasticity may also re-flect the destabilization of the actin fiber structure itself. Moreover, itmust not be forgotten that tubulin fibers can also have a role in thedescribed phenomenon, as microfilament has also been shown to beaffected by electropermeabilization [31,33].
5. Conclusion
For the first time, we succeed to measure changes in living cellmembrane elasticity and membrane shape due to EP process throughphysical measurements by AFM in real time. We demonstrate in thisstudy that AFM can be used for electroporation process investigationand may allow further quantification of the destabilization process interms of elasticity. First, stiffness data gives new insight of the perme-abilization process showing a lasting effect of EP. Measurementsof this process are possible and numerical data are obtained. Dataobtained on fixed cell, although giving YM values modified by fixation,are useful because they can give access to information at a specificmoment of EP phenomenon. Secondly, height images of membraneand living cells at high resolution can be recorded and give direct visualinformation about EP effect. Eventually, we show here that AFM sensesa side effect of EP, linked to membrane permeabilization and that maybe related to cytoskeleton.
This new way of analysis can open the field of characterization ofcell type sensibility to electric field and help in electrical parameteroptimization. Assuming that membrane response to EP is related tocytoskeleton, next measurements will focus on its implication.
Acknowledgements
We thank J-M Escoffre, J. Teissié and René Vezinet (CEA, DAM,GRAMAT, F-46500 Gramat, France) for the stimulating discussions.Direction Générale de l'Armement (L. Chopinet 3 years PhD grantfrom DGA/MRIS) and Agence Nationale de la Recherche (Young ScientistProgram “AFMyst”ANR-11-JSV5-001-01, n°(SD) 30024331) providedfinancial support. This research was conducted in the scope of theEBAM European Associated Laboratory (LEA). ED and MPR are re-searchers at the Centre National de la Recherche Scientifique (CNRS).
Appendix A. Supplementary data
Supplementary data to this article can be found online at http://dx.doi.org/10.1016/j.bbamem.2013.05.035.

2229L. Chopinet et al. / Biochimica et Biophysica Acta 1828 (2013) 2223–2229
References
[1] E. Neumann, K. Rosenheck, Permeability changes induced by electric impulses invesicular membranes, J. Membr. Biol. 10 (1972) 279–290.
[2] L.M. Mir, Bases and rationale of the electrochemotherapy, Eur. J. Cancer Suppl. 4(2006) 38–44.
[3] E. Spugnini, Book review of: “Clinical aspects of electroporation” by Stephen TKee, Julie Gehl, Edward W Lee, Biomed. Eng. Online 10 (2011) 89.
[4] A.I. Daud, R.C. DeConti, S. Andrews, P. Urbas, A.I. Riker, V.K. Sondak, P.N. Munster,D.M. Sullivan, K.E. Ugen, J.L. Messina, R. Heller, Phase I trial of interleukin-12plasmid electroporation in patients with metastatic melanoma, J. Clin. Oncol. 36(2009) 5896–5903.
[5] L. Low, A. Mander, K. McCann, D. Dearnaley, T. Tjelle, I. Mathiesen, F. Stevenson,C.H. Ottensmeier, DNA vaccination with electroporation induces increased an-tibody responses in patients with prostate cancer, Hum. Gene Ther. 20 (2009)1269–1278.
[6] Y. Tamzali, L. Borde, M.P. Rols, M. Golzio, F. Lyazrhi, J. Teissie, Successful treatmentof equine sarcoids with cisplatin electrochemotherapy: a retrospective study of48 cases, Equine Vet. J. 44 (2012) 214–220.
[7] J. Teissie,M. Golzio,M.P. Rols,Mechanisms of cellmembraneelectropermeabilization:a minireview of our present (lack of ?) knowledge, Biochim. Biophys. Acta Gen. Subj.1724 (2005) 270–280.
[8] G. Pucihar, T. Kotnik, D. Miklavcic, J. Teissié, Kinetics of transmembrane trans-port of small molecules into electropermeabilized cells, Biophys. J. 95 (2008)2837–2848.
[9] B. Valic, M. Golzio, M. Pavlin, A. Schatz, C. Faurie, B. Gabriel, J. Teissié, M.-P. Rols, D.Miklavcic, Effect of electric field induced transmembrane potential on spheroidalcells: theory and experiment, Eur. Biophys. J. 32 (2003) 519–528.
[10] J.-M. Escoffre, T. Portet, C. Favard, J. Teissié, D.S. Dean, M.-P. Rols, Electromediatedformation of DNA complexes with cell membranes and its consequences for genedelivery, Biochim. Biophys. Acta 1808 (2011) 1538–1543.
[11] J.-M. Escoffre, T. Portet, L. Wasungu, J. Teissié, D. Dean, M.-P. Rols, What is(still not) known of the mechanism by which electroporation mediates genetransfer and expression in cells and tissues, Mol. Biotechnol. 41 (2009) 286–295.
[12] M. Tarek, Membrane electroporation: a molecular dynamics simulation, Biophys.J. 88 (2005) 4045–4053.
[13] Z.A. Levine, P.T. Vernier, Life cycle of an electropore: field-dependent andfield-independent steps in pore creation and annihilation, J. Membr. Biol. 236(2010) 27–36.
[14] A. Lopez, M.P. Rols, J. Teissie, 31P NMR analysis of membrane phospholipid orga-nization in viable, reversibly electropermeabilized Chinese hamster ovary cells,Biochemistry 27 (1988) 1222–1228.
[15] T. Portet, F. Camps i Febrer, J.-M. Escoffre, C. Favard, M.-P. Rols, D.S. Dean, Visualiza-tion of membrane loss during the shrinkage of giant vesicles under electropulsation,Biophys. J. 96 (2009) 4109–4121.
[16] D.J. Müller, Y.F. Dufrêne, Atomic force microscopy: a nanoscopic window on thecell surface, Trends Cell Biol. 21 (2011) 461–469.
[17] M. Sun, J.S. Graham, B. Hegedüs, F. Marga, Y. Zhang, G. Forgacs, M. Grandbois,Multiple membrane tethers probed by atomic force microscopy, Biophys. J. 89(2005) 4320–4329.
[18] JPK instrument, QI technical report, http://www.jpk.com/jpk-tech-quantitative-imaging.download.809b337b01062d2f968b2354a2270a4b.pdf 2012.
[19] L. Chopinet, C. Formosa, M.P. Rols, R.E. Duval, E. Dague, Imaging living cells sur-face and quantifying its properties at high resolution using AFM in QI™mode, Mi-cron, 2013.
[20] C. Rosazza, J.-M. Escoffre, A. Zumbusch, M.-P. Rols, The actin cytoskeleton has anactive role in the electrotransfer of plasmid DNA in mammalian cells, Mol. Ther.19 (2011) 913–921.
[21] H. Lucius, T. Friedrichson, T.V. Kurzchalia, G.R. Lewin, Identification of caveolae-likestructures on the surface of intact cells using scanning force microscopy, J. Membr.Biol. 194 (2003) 97–108.
[22] J.L. Hutter, J. Bechhoefer, Calibration of atomic-force microscope tips, Rev. Sci.Instrum. 64 (1993) 1868–1873.
[23] C. Roduit, B. Saha, L. Alonso-Sarduy, A. Volterra, G. Dietler, S. Kasas, OpenFovea:open-source AFM data processing software, Nat. Methods 9 (2012) 774–775.
[24] C. Roduit, F.G. van der Goot, P. De Los Rios, A. Yersin, P. Steiner, G. Dietler, S.Catsicas, F. Lafont, S. Kasas, Elastic membrane heterogeneity of living cellsrevealed by stiff nanoscale membrane domains, Biophys. J. 94 (2008) 1521–1532.
[25] M. Golzio, M.P. Mora, C. Raynaud, C. Delteil, J. Teissié, M.P. Rols, Control byosmotic pressure of voltage-induced permeabilization and gene transfer inmammalian cells, Biophys. J. 74 (1998) 3015–3022.
[26] X. Yao, J. Walter, S. Burke, S. Stewart, M.H. Jericho, D. Pink, R. Hunter, T.J.Beveridge, Atomic force microscopy and theoretical considerations of surfaceproperties and turgor pressures of bacteria, Colloids Surf. B: Biointerfaces 23(2002) 213–230.
[27] J. Gilden, M.F. Krummel, Control of cortical rigidity by the cytoskeleton: emergingroles for septins, Cytoskeleton (Hoboken) 67 (2010) 477–486.
[28] J. Saarikangas, H. Zhao, P. Lappalainen, Regulation of the actin cytoskeleton-plasma membrane interplay by phosphoinositides, Physiol. Rev. 90 (2010)259–289.
[29] G.R. Chichili, W. Rodgers, Cytoskeleton-membrane interactions in membrane raftstructure, Cell. Mol. Life Sci. 66 (2009) 2319–2328.
[30] J. Fels, P. Jeggle, K. Kusche-Vihrog, H. Oberleithner, Cortical actin nanodynamicsdetermines nitric oxide release in vascular endothelium, PLoS One 7 (2012)e41520.
[31] C. Kanthou, S. Kranjc, G. Sersa, G. Tozer, A. Zupanic, M. Cemazar, The endothelialcytoskeleton as a target of electroporation-based therapies, Mol. Cancer Ther. 5(2006) 3145–3152.
[32] M.P. Rols, J. Teissié, Experimental evidence for the involvement of the cytoskele-ton in mammalian cell electropermeabilization, Biochim. Biophys. Acta 1111(1992) 45–50.
[33] C. Blangero, M.P. Rols, J. Teissié, Cytoskeletal reorganization during electric-field-induced fusion of Chinese hamster ovary cells grown in monolayers, Biochim.Biophys. Acta 981 (1989) 295–302.


