Embed Size (px)
Citation preview

DETAILED PROJECT REPORT FOR COLLECTION AND TRANSPORTATION OF
MUNICIPAL SOLID WASTE
NAGAR PALIKA PARISHAD AKBARPUR
NO Submitted By: (RAVI UPADHYAY) URBAN INFRASTRUCTURE EXPERT NAGAR PALIKA PARISHAD AKBARPUR
(SURESH KUMAR MAURYA) EXCUTIVE OFFICER
NAGAR PALIKA PARISHAD AKBARPUR

1

DETAILED PROJECT REPORT FOR MUNICIPAL SOLID WASTE
COLLECTION & TRANSPORTATION
2
CONTENTS 1 Project Background ....................................................................................... 8
1.1 Introduction ............................................................................................................................... 9
1.2 Need for the Project .................................................................................................................. 10
1.3 Project Objectives and Scope.................................................................................................. 10
1.4 Project Deliverables .................................................................................................................. 11
1.5 Methodology……………………………………………………………………………………………11
2 Town Profile .................................................................................................................. 16
2.1 Project Area Description .......................................................................................................... 16
2.2 Geographical Location and Regional Linkages ..................................................................... 16
2.3 History/Growth of the Region .................................................................................................. 18
2.4 Hydrology and Topography ................................................................................................... ..18
2.5 Climatic Condition .................................................................................................................. ..19
3 DEMOGRAPHIC & SOCIO-ECONOMIC PROFILEOFTOWN .................................... ..20
3.1 Population Growth rate and Spatial Distribution ................................................................. ..21
3.2 Population Projection ............................................................................................................. ..22
3.3 Migration /Floating Population .............................................................................................. ..23
3.4 Other Population Indicators ................................................................................................... ..24
3.5 Economic Profile ..................................................................................................................... ..25
4 Existing SWM System ................................................................................................ ..27
4.1 Sources of Waste Generation ................................................................................................ ..28
4.2 Primary Collection of Waste .................................................................................................. ..28
4.3 Waste generation as per norms……………………………………………………………………..31
4.4 Photos of primary collection of waste .................................................................................. ..32
4.5 Gap Analysis- Primary System .............................................................................................. ..34
4.6 Secondary Storage System/Secondary Collection Points ................................................. ..32
4.7 Gap Analysis – Existing storage System ............................................................................. ..34
4.8 Waste transportation system………………………………………………………………….........35
4.9 Deficiency Analysis –Waste transportation system ........................................................... ..37
4.10 Treatment & disposal system ................................................................................................ .37
4.11 Gap analysis-waste disposal system ................................................................................... .38
4.12 Land availability ...................................................................................................................... .38
4.13 Rag pickers and kabadiwalas ................................................................................................ .39
4.14 Over all Gap Analysis of the Existing Solid Waste System…………………………………..39
4.15 Finances of ULB……………………………………………………………………………………….45

DETAILED PROJECT REPORT FOR MUNICIPAL SOLID WASTE
COLLECTION & TRANSPORTATION
3
5 Regulatory Framework ......................................................................................................... 49 5.1 Regulatory Framework for Waste Management................................................................... 50
5.2 The Constitution 74th Amendment – Responsibilities for Solid Waste Management ....... 51
5.3 Solid Waste Management Rules, 2016 .................................................................................. 51
5.4 Plastics Waste Management & Handling Rules 2016 .......................................................... 60
5.5 Hazardous and Other Wastes (Management & Trans boundary Movement)Rules,2016..61 5.6 Bio- Medical Waste ManagementRules,2016…………………………………………………....62
5.7 E Waste ManagementRules2016 ........................................................................................... 63
5.8 Environmental Impact Assessment (EIA) Notification,2006 ............................................... 65
6 Existing Studies.......................................................................................................... 66 6.1 SWM improvement Plan for UP prepared by COWI Consultants ....................................... 67
6.2 SWM Planning model prepared by COWI Consultants ....................................................... 68
6.3 SWM Improvement Projects Implemented by GoUP under JnNURM ................................ 68
7 Waste Quantification & characterization-Current & Forecast ......................................... 70 7.1 Introduction ............................................................................................................................. 71
7.2 Methodology for Waste Quantification ................................................................................. 71
7.3 Sources of Waste .................................................................................................................... 76
7.4 Waste Quantifications ............................................................................................................ 76
7.5 Primary Waste Quantification result……………………………………………………………....77
7.6 Waste projection………………………………………………………………………………………79
7.7 Waste characterization………………………………………………………………………………80
8 Technologies or collection and transportation of SWM PLAN……………82 8.1 segregation and sorting technologies………………………………………………………….....83
8.2 waste collection and transportation technologies………………………………………………86
8.3 road map for waste management…………………………………………………………………..92
8.4 waste recovery and reuse technologies…………………………………………………………..93
8.5 strategic action plan………………………………………………………………………………..…96
8.6 involvement of various stakeholders……………………………………………………………...98
8.7 campaign models of action plans………………………………………………………………….99
8.8 system options and evaluation……………………………………………………………………..100
9 System design and infrastructure assessment……………………………….111 9.1 proposed waste management system……………………………………………………………..112
9.2 basic design and transportation system…………………………………………………………..113
10 Capital cost and annual O&M COST……………………………………………115 10.1 Capital cost……………………………………………………………………………………………..116
11 Recommendations from present study…………………………………..……117

DETAILED PROJECT REPORT FOR MUNICIPAL SOLID WASTE
COLLECTION & TRANSPORTATION
4
LIST OF TABLES Table 3-1: Decadal Population Growth Trend ................................................................................. 21
Table 3-2: Ward Wise Demographic Profile of ................................................................................. 23
Table 3-3: Population Density – ......................................................................................................... 24
Table 3-4: Population Projection till theYear2043 ........................................................................... 25
Table 3-5: Projected Population ........................................................................................................ 26
Table 3-6: Sex Ratio, SC, ST and Literacy Rate ............................................................................... 26
Table 3-7: Ward Wise Literacy Rate and Sex Ratio ......................................................................... 27
Table 3-8: Work Force Participation Details ..................................................................................... 27
Table 4-1: list of main roads in ULB………………………………………………………………………..31
Table 4-2: total road length…………………………………………………………………………………..32
Table 4-3: sweeping detail……………………………………………………………………………………32
Table 4-4: Waste Generation in ULB’s .......................................................................................... …34
Table 4-5: Waste Composition ........................................................................................................... 34
Table 4-6: number of 1.1 meter cube bin distribution ward wise……………………………………..37
Table 4-7: Secondary Collection Equipment’s Details .................................................................... 38
Table 4-8: Analysis of the Existing SWM System in Nagar Palika Parishad ................................. 45
Table 4.9:- finances of ULB……………………………………………………………………………….….49
Table 4-13: Availability of Manpower in Nagar Palika Parishad ..................................................... 53
Table 5-1: Specification for Drinking Water Quality ........................................................................ 63
Table 5-2: Compost Quality standards ............................................................................................. 64
Table 5-3: Leachate Quality Standard ............................................................................................... 65
Table 7-1: Summary of Primary Waste Quantification .................................................................... 76
Table 7-2: sources of waste generation……………………………………………………………………78
Table 7-3: quantity of biodegradables in households…………………………………………………..79
Table 7-4: quantity of non-biodegradable waste in households……………………………………...83
Table 7-5: quantity of hazardous waste in households………………………………………………...91
Table 7-6: quantity estimation of waste in 2018………………………………………………………….93
Table 7-7: quantity of biodegradables in commercials………………………………………………....97
Table 7-8: quantity of non-biodegradable in commercials………………………………………….…98
Table 7-9: quantity of hazardous wastes in commercials……………………………………………..98
Table 7-10: average values for three days for biodegradable waste……………………………….102
Table 7-11: average values for three days for non-biodegradable waste……… ………….…..…104
Table 7-12: average values for three days for hazardous waste…………………………………...104
Table 7-13: average of all tables…………………………………………………………………………..104
Table 7-14: average of waste generation per household per day…………………………………..104
Table 7-15: summary of all…………………………………………………………………………………105
Table 7-16: summary of waste generated in town……………………………………………………..106
Table 7-17: future quantification…………………………………………………………………………..106
Table 7-18: physical composition of waste…………………………………………………………..…108

DETAILED PROJECT REPORT FOR MUNICIPAL SOLID WASTE
COLLECTION & TRANSPORTATION
5
Table 8-1: collection pattern………………………………………………………………………………..113
Table 8-2: important recycling material advantages and disadvantages……………………….….122
Table 8-3: collection and transportation plan as per CPHEEO manual………………………….…128
Table 8-4: options for waste segregation………………………………………………………………..129
Table 8-5: comparison of primary collection…………………………………………………………....131
Table 8-6: options for primary collection of waste……………………………………………….…….133
Table 8-7: primary waste collection infrastructure 2018………………………………………….…..135
Table 8-8: options for secondary waste collection system……………………………………….….137
Table 8-9: options for secondary waste collection system……………………………………….….138
Table 8-10: street sweeping norms…………………………………………………………………….…139
Table 9-1 Equipments requirement &secondary collection and transportation in each year………….......144
Table 10-1: abstract cost for proposed system of collection and transportation 2018………...146
Table 10-2: operational cost of salary expense for primary collection and transportation……147
Table 10-3: Annual O &M for primary collection and transportation equipment and vehicle……………..148

DETAILED PROJECT REPORT FOR MUNICIPAL SOLID WASTE
COLLECTION & TRANSPORTATION
6
LIST OF FIGURES Figure 1-1: Cluster Map………………………………………………………………………………………..12
Figure 1-2: regional map of sultanpur………………………………………………………………………12
Figure 2-1: location of sultanpur in INDIA map................................................................................ ..18
Figure 2-2: location of sultanpur in UP map…………………………………………………………….....19
Figure 2-3: regional map of sultanpur district…………………………………………….…………….…19
Figure 2-4: location of sultanpur nagar palika parishad………………………………………………....20
Figure 2-5: climatic condition of sultanpur………………………………………………………….…......21
Figure 3-1: Decadal Population Variation Curve………………………………………………….……....21
Figure 3-2: Ward Wise Population Distribution………………………………………………………..….24
Figure 3-3: Various Methods of Population Projection……………………………………………….....25
Figure 3-4: Distribution of Employment Categories………………………………………………….….28
Figure 3-5: distribution of main workers…………………………………………………………...….…..29
Figure 4-1: location of current dumping site……………………………………………………...……...30
Figure 4-2: Secondary Collection Container sand System…………………………………………..…33
Figure 4-6: Secondary Transportation vehicles……………………………………………………….....41
Figure 4-9: organizational structure of sultanpur………………………………………………….…….54
Figure 7-1: Location Map of the wards of sultanpur ....................................................................... .75
Figure 7-2: Location of Sampling for Quantification……………………………………………….…..77
Figure 7-3: Schematic Diagram of Waste Sampling………………………………………………..….106
Figure 7-4: Physical Assessment of Waste………………………………………………………..……108
Figure 8-1: hazardous waste and dustbin photos……………………………………………………...109
Figure 8-2: proposed scheme for collection and transporatation……………………………….….114
Figure 8-3: safai karmi working with broom………………………………………………………….....115
Figure 8-4: large metal containers …………………………………………………………………..…...115
Figure 8-5: live images of ULB………………………………………………………………………..…...116
Figure 9-1: proposed scheme for collection and transport…………………………………………..142

DETAILED PROJECT REPORT FOR MUNICIPAL SOLID WASTE
COLLECTION & TRANSPORTATION
7
Abbreviation List
CAA Constitution Amendment Act
CAGR Compound Annual Growth Rate
C&DS Construction and Design Services
C&D Waste Construction and Demolition Waste
CBOs Community Base Organizations
CO Carbon Monoxide
CO2 Carbon Dioxide
CH4 Methane
CPHEEO Central Public Health and Environment Engineering Organization
CPCB Central Pollution Control Board
DPR Detailed Project Report
EC Environmental Clearance
EIA Environmental Impact Assessment
EPA Environment (Protection) Act, 1986
GoI Government of India
GoUP Government of Uttar Pradesh
GL Ground Level
HCl Hydrogen Chloride
HDPE High Density Polyethylene
HPEC High Powered Expert Committee
IEC Information, Education and Communication
JNNURM Jawaharlal Nehru National Urban Renewal Mission
Kcal Kilo Calorie
Kg Kilo Gram
Km Kilo Meter
LEL Lower Explosive Limit
M Meter
MSW Municipal Solid Wastes
MS Mild Steel
MSWM Municipal Solid Waste Management
MT Metric Tons

DETAILED PROJECT REPORT FOR MUNICIPAL SOLID WASTE
COLLECTION & TRANSPORTATION
8
MoEF Ministry of Environment and Forests
MoUD Ministry of Urban Development
N Nitrogen
NACO National AIDs Control Organisation
NGOs Non-Governmental Organization
NPP Nagar PalikaParishad
NO2 Nitrous Oxide
NRCP National River Conservation Plan
O2 Oxygen
O&M Operation & Maintenance
P Phosphorus
PIL Public Interest Litigation
PPE Personal Protective Equipment
PPP Public Private Partnership
RDF Refuse Derived Fuel
SCP Secondary Collection Point
SEIAA State Environmental Impact Assessment Authority
SHGs Self Help Groups
SO2 Sulphur Dioxide
SPM Suspended Particulate Matter
TDS Tons Per Day
TPD Total Dissolved Solids
ULBs Urban Local Bodies
UPJL Uttar Pradesh Jal Nigam
UPPCB Uttar Pradesh Pollution Control Board
WHO World Health Organisation
WtE Waste to Energy
DETAILED PROJECT REPORT FOR MUNICIPAL SOLID WASTE
COLLECTION & TRANSPORTATION
9
CHAPTER 1:
PROJECT BACKGROUND

DETAILED PROJECT REPORT FOR MUNICIPAL SOLID WASTE
COLLECTION & TRANSPORTATION
10
1.1 Introduction
Solid waste refers to the range of garbage arising from animal and human activities that are discarded as unwanted and useless. Solid waste is generated from industrial, residential and commercial activities in a given area, and may be handled in a variety of ways. As such, landfills are typically classified as sanitary, municipal, construction and demolition or industrial waste sites.
Waste can be categorized based on material, such as plastic, paper, glass, metal, and organic waste. Categorization may also be based on hazard potential, including radioactive, flammable, infectious, toxic, or non-toxic. Categories may also pertain to the origin of waste, such as industrial, domestic, commercial, institutional or construction and demolition.
Regardless of the origin, content or hazard potential, solid waste must be managed systematically to ensure environmental best practices. As solid waste management is a critical aspect of environmental hygiene, it needs to be incorporated into environmental planning.
Solid Waste Management is defined as the discipline associated with control of generation, storage, collection, transport or transfer, processing and disposal of solid waste materials in a way that best addresses the range of public health, conservation, economics, aesthetic, engineering and other environmental considerations.
In its scope, solid waste management includes planning, administrative, financial, engineering and legal functions. Solutions might include complex inter-disciplinary relations among fields such as public health, city and regional planning, political science, geography, sociology, economics, communication and conservation, demography, engineering and material sciences.
6 Functional Elements of the Waste Management System
There are six functional components of the waste management system as outlined below:
1. Waste generation refers to activities involved in identifying materials which are no longer usable and are either gathered for systematic disposal or thrown away.
2. Onsite handling, storage, and processing are the activities at the point of waste generation which facilitate easier collection. For example, waste bins are placed at the sites which generate sufficient waste.
3. Waste collection, a crucial phase of waste management, includes activities such as placing waste collection bins, collecting waste from those bins and accumulating trash in the location where the collection vehicles are emptied. Although the collection phase involves transportation, this is typically not the main stage of waste transportation.
4 Waste transfer and transport are the activities involved in moving waste from the local waste collection locations to the regional waste disposal site in large waste transport vehicles.
5. Waste processing and recovery refer to the facilities, equipment, and techniques employed both to recover reusable or recyclable materials from the waste stream and to improve the effectiveness of other functional elements of waste management.
6. Disposal is the final stage of waste management. It involves the activities aimed at the systematic disposal of waste materials in locations such as landfills or waste-to-energy facilities.
Initiative taken by Uttar Pradesh Government: The state of UP has taken several initiatives to improve urban governance and urban infrastructure in the state. Priority was given to improve SWM in large urban areas in the state. Now the focus is on all urban areas in the State. There is therefore a need to improve the existing SWM system in Akbarpur Nagar Palika Parishad and to make this city/town Clean and liveable. The purpose of this Detailed Project Report (DPR) part-1 is to study the existing SWM practices in relation to primary collection, secondary storage, street sweeping and transportation of municipal solid waste in Akbarpur Nagar Palika Parishad, identify deficiencies/ gaps in the present system and

DETAILED PROJECT REPORT FOR MUNICIPAL SOLID WASTE
COLLECTION & TRANSPORTATION
11
propose a comprehensive improvement plan for SWM in the city/town in compliance with the SWM Rules,
2016 and SBM (U) guidelines.
.
1.2 Need for the Project
Some of the issues which are applicable to the existing solid waste management system is highlighted
below:
1. Absence of any systematic waste collection and segregation process with complete
coverage
2. There is lack of any waste processing and treatment facility
3. Open disposal of waste near to the roads and in open drains
4. Generation of bulk quantity of waste during festive seasons and uncontrolled disposal of
waste at the source of generation itself
5. Absence of sufficient manpower and suitable infrastructural facilities for waste management
6. No waste management practices for waste
7. Lack of awareness among people towards waste management
1.3 Project Objectives and Scope The project aims at developing a solid waste management facility for Akbarpur (Ambedkarnager) in a scientific manner in pursuance to Swachh Bharat mission and municipal solid waste (management and handling ) rules ,2016. The project activity would be focused on collection of municipal solid waste, segregation of solid waste, storage of solid waste in systematic manner so as prevent any unhygienic and insanitary condition around the storage point, transportation of municipal solid waste , processing and disposal of the same at a scientific landfill site. The specific objective of the project can be listed as; a) Prepare comprehensive Solid waste management (SWM) Action Plan with implementation option
including public private partnership mode, covering all component of Solid Waste Management for the Akbarpur Cluster.
b) Prepare the DPR including financial feasibility for the overall project which could be use for the selection of a private operator and /or developer.
c) Prepare a capacity building program for the UBLs and C&DS as well as including a operational manual for executing the program for C&DS.
In line with objectives, the broad scope of work, to be carried out, as part of this assignment will be in the following phases;
Phase I DPR for primary waste collection, secondary storage and transport to processing plant. The Consultant shall included diagnostic report on UBLs, analyses of alternatives and justification for choice of waste collection, secondary storage & transport to processing plant.
Phase II DPR for waste processing facilities, material recovery facilities, separation and processing biodegradables recovery of recyclables for transfer to the waste trade, and including: a. investment Plan for processing plant including (i) demand study for product from process waste; (ii) conceptual design, costs and technical specifications for processing and /or transfer station facility. b. Financial and economic analysis for DPR phase 1 and phase 2 including (i) cash flow analysis, (ii) payment analysis, (iii) user fee analysis (v) economic analysis.
DETAILED PROJECT REPORT FOR MUNICIPAL SOLID WASTE
COLLECTION & TRANSPORTATION
12
1.4 Project Deliverables The consultant recognizes that quality deliverable shall be the basis for the client to make an informed decision on the subsequent action to be taken for achieving the objective of improved solid waste management for the UBLs. Toward this, the following deliverables will be provided during the period of study.
1: For primary collection, secondary storage and transport to processing plant. 2: for waste processing facilities.
1.5 Methodology: DPR for Primary Collection, Secondary Storage and Transport to Processing Plant
Task1: Review of Documents and Background Material
(i) GoI Solid Waste Management Rules, 2016, and subsequent revisions;
(ii) GoI SWM Toolkit and Guidelines;
(iii) GoI National Manual on SWM;
(iv) GOI Swachch Bharat Mission relating to support for SWM;
(v) SWM improvement Plan for UP prepared by COWI Consultants;
(vi) SWM Planning model prepared by COWI Consultants; and
(vii) SWM improvement projects (27#) implemented by GoUP under JnNURM.
Task 2: Diagnostic of Existing Conditions in ULBs in the Clusters
Profile of Each ULB and Cluster.
Collect following data from primary and secondary sources: Area and population; city map; area;
population; decadal growth of last three decades; ward wise details of population area; ward wise
details of slums and squatter settlements; density of city; and floating population in general and on
special occasions; Main industries, tourist/pilgrim destinations. Provide details of current SWM and
conduct analysis of: waste generation; street sweeping; and accessibility for collection vehicles.
Waste Generation:
Document number and types of waste generators in the city; annual, monthly and daily waste
generation rates of past three years; per capita waste generation; waste generation from various
sources such as households, commercial establishments, vegetable, fruit, meat, fish markets, offices,
hotels and restaurants, from sweeping of streets and drain cleaning, etc.; and waste characterization -
physical and chemical, if available. To the extent possible, primary survey data shall be used, with
some extrapolation across ULBs in the cluster.
Streets Sweeping:
Document arrangements for street sweeping including principal commercial streets lengths; other
important roads including length/width; and other streets, lanes and by lanes including length.
Document the current means of disposal of swept debris and silt.
Waste Collection and Accessibility:
Provide details of waste collection arrangements and percentage of population/households living in

DETAILED PROJECT REPORT FOR MUNICIPAL SOLID WASTE
COLLECTION & TRANSPORTATION
13
inaccessible areas that cannot be served through motorized light commercial vehicle (LCV) for waste
collection and need to be served through handcarts/tricycles or other manual devices.
Role of the Informal Sector:
Survey and document the role of the informal waste pickers, amount of recyclables extracted by them,
and possible mechanisms to expand their role for door-to-door collection.
Secondary Storage of Waste:
Document ward-wise details of number of secondary storage depots, types of depots, open sites,
masonry bins, dhalaos, bottomless containers, covered containers, etc., their size/capacity, and
synchronization between waste collection and secondary storage.
Transportation of Waste:
Document number and type of vehicles used, their capacity, frequency of transportation, number of
trips made and quantity transported by each type of vehicle, extent of manual loading, mechanical
loading, quantity and percentage of waste transported each day, etc.), synchronization between
primary collection, secondary storage and transportation of waste.
Investment Plan:
Documented number and types of vehicles used, their capacity, frequency of transportation, numbers
of trips made and quantity of transported by each type of vehicle, extent of manual loading.
Finances of ULBs:
(i) Collect data from ULB of at least last 4 years, for the following:
1. Own revenue income (both tax and non-tax revenue in different heads) 2. Revenue grants from State or Central Government 3. Own capital income (including sale of properties)
4. Capital grants from State or Central Government (including the heads under which grants are provided)
5. Revenue expenditure (under different heads) 6. Capital expenditure (under different heads) 7. Revenue deficit or surplus 8. Overall deficit or surplus
For these heads, make a comparison of budgeted Vs actual numbers.
For the three highest contributors to own-source revenue, analyses the demand and collection
performance for the last four years
(ii) Identify the budgeting process for solid waste management. (iii) For solid waste management functions, collect data on:
a) Budgeted and actual expenditure under various heads (salary, fuels, electricity, vehicles,
contracted or outsourced costs, etc.)
b) Identify revenue streams, if any, for solid waste management including cess within or in
addition to property tax, user charges, revenues from sale of recyclables or other by products,
State or central government grants (both revenue and capital) earmarked for solid waste
management.

DETAILED PROJECT REPORT FOR MUNICIPAL SOLID WASTE
COLLECTION & TRANSPORTATION
14
c) item-wise expenditure on street sweeping, door to door waste collection, transportation,
processing, disposal of municipal solid waste; and
d) Expenditure on training and capacity building.
(iv) Identify the extent of cost recovery for solid waste management from
(a) User charges and other revenues from sale of recyclables or by-products,
(b) From cess or surcharge on property tax or other municipal revenue sources, and
(c) From State or central Government grants earmarked for solid waste management. Identify
how the costs of solid waste management are financed by solid waste management related
revenues, other municipal revenue sources and State or central Government grants. Identify the
percentage of municipal revenue (own income as well as total revenue income) that is
earmarked for solid waste management.
(v) Solid waste user fees:
Review whether SWM user fees or SWM (city cleaning) tax is levied; and full details of rates
prescribed, billing performance, collection modalities, collection efficiency, mechanism is in place
and measures are taken to recover the user fees from defaulters etc. Document if any charges
are collected by out sourced contractors from households or commercial establishments.
(vi) Private sector participation out sourcing/PPP:
Describe whether outsourcing to private sector is practiced, document the contracting method,
payment mechanism, contractor responsibilities and obligations, performance specifications,
track record of performance and a summary of learnings from the identified private sector
participation/outsourcing.
Task 3: Analysis of Alternatives to Improve Service Levels
Technical Criteria:
Based on document review and site investigations, provide recommendations for population
projections for ULBs; waste generation rates; waste composition; waste characterization, percent of
inert waste disposed in landfills and land requirements for 25 years.
Environmental Standards:
Based on Pollution Control Board requirements, provide details of environmental requirements for
waste processing, including but not limited to, compost making, waste disposal, and treatment of
leachate.
Alternatives Analysis
Based on review of existing conditions, develop various scenarios for SWM improvements, and analysis for adaptability in UP conditions, affordability, least cost and environmental safety. Scenarios described below, but not limited to, need to be analysed: (a) waste separation at source, with separate bins provided by owners or financed under the project;
(b) use of waste pickers for collection or only separation at a storage point, or transfer station or processing plant;
(c) secondary separation to recover more recyclables and improve quality of compost
(d) transfer stations necessary to economize on transportation costs
(e) processing in each ULB rather than in decentralized processing plants;

DETAILED PROJECT REPORT FOR MUNICIPAL SOLID WASTE
COLLECTION & TRANSPORTATION
15
(f) labor intensive composting with some separation is more economical due to small volumes of waste and high transport costs not affordable by small ULBs;
(f) economics of combining processing plants at the same location as the landfills;
(g) separated inert street waste is more economical to transport direct to landfills or conveyed to the
processing plants for separation and then transported to the landfills;
(h) economic justification for individual landfills for ULBs;
(i) revenue generation to meet O&M costs and timely payments to service providers;
(j) Guarantees from GoUP to assure successful operation of SWM.
(k) Institutional responsibilities
(l) Contracting models
Task 4: Investment Plan for Primary Collection, Secondary Storage and Transport (to Processing Plant
This is as per your understanding of the norms:
The intern must provide recommendations for least cost arrangements, and tools, equipmentand
vehicles requirements for waste collection, secondary storage and transport to processing plants,
supported by quantitative evidence of alternative analyses carried out, as describedbelow:
Waste separation at source:
(i) Number of waste categores which may be separated at source; number, type and size of bins to be
used for storage of waste by waste generators; need for providing support, e.g., household bins, and
awareness-raising (IEC), including costs; and (ii) provide a framework for involving informal sector in
waste collection.
Primary collection to storage points:
(i) Method, frequency, and time of collection; (ii) frequency and time of collection; type of vehicles and
equipment required; (iii) requirements of manpower, total vehicles, equipment, including costs; (iii)
options and method for use of informal sector of rag pickers for collection, recycling, waste separation,
and waste processing.
Street sweeping:
(i) Total length of roads swept, and frequency; and (ii) costs of manpower, tools and equipment
required for collection of inert waste, excluding street sweeping which will remain a function of ULBs
outside the project.
Secondary storage:
Based on city area, road length and wards: (i) quantity of waste expected to be deposited at the
depots; (ii) number and type of secondary storage points required to cover the city, including
engineered stands, bin sizes, including costs; (iii) suitable/strategic locations for bins, distance
between two bins; (iii)vehicle outes and bin locations; and frequency of clearance of bins; (iv)costs of
manpower, civil works (for stands), tools and equipment required.

DETAILED PROJECT REPORT FOR MUNICIPAL SOLID WASTE
COLLECTION & TRANSPORTATION
16
Waste Transportation
For the quantity of waste to be transported daily, (a) develop least cost alternatives for different
distance travelled, and factoring road conditions, for transport of wastes from storage area to a
transfer station or processing facility; processing integrated with landfill location; and alternatives for
distance of landfill from collection area/ transfer station/ processing facility; (b) number of trips
required; (c) type, capacity and number of vehicles required, including costs, including the number of
stand by vehicles required for preventive maintenance and during breakdowns. The Consultant will
assess and recommend if there is the need for introduction of transfer/separation facilities to reduce
transport costs.
Investment Plan:
Based on the above, to identify the investment needs for one life cycle of collection and transport. In
particular, the consultant will define the investments needed for equipment including but not limited to:
(i) household waste bins; (ii)secondary storage bins; (iii) collection bins for waste and selective/street
collection; (iii) trucks for collection and transportation; (iv) collection carts; (v) uniforms and personal
protective equipments. The consultant will develop the investment plan including the technical
specifications and estimated costs.
Deliverables:
(i) Proposed investment needs for collection and transport services;
(ii) Investment plan including cost estimates;
(iii) Technical specifications for the initial investments

DETAILED PROJECT REPORT FOR MUNICIPAL SOLID WASTE
COLLECTION & TRANSPORTATION
17
CHAPTER 2
TOWN PROFILE

DETAILED PROJECT REPORT FOR MUNICIPAL SOLID WASTE
COLLECTION & TRANSPORTATION
18
2.1 Project Area Description Akbarpur is a Nagar Palika Parishad in Ambedkarnagar district in the state of Uttar Pradesh hand it is also the administrative headquarters of Tehsil and Ambedkarnagar District. Akbarpur is a class 2 town spread over an area of 61.297 sq.kms with total population f 111447 out of which are 57330 males while 54117 are females, as per report released by Census 2011. The Nagar Palika Parishad is divided into 25 wards, for which elections are held every 5 years. At present: There are 17090 households, 12 hotels, 52 restaurants, 165 Offices & commercial establishments, in the Akbarpur Nagar Palika Parishad.
2.2 Geographical Location and Regional Linkages
Nagar Palika Parishad is well connected by road and rail network to the various parts of the country. The Nagar Palika Parishad is 2 Km away from district head quarter And 185 km from Lucknow, the state capital.
Fig 1.1 Map of India
Source: MapsofIndia.com

DETAILED PROJECT REPORT FOR MUNICIPAL SOLID WASTE
COLLECTION & TRANSPORTATION
19
Fig 1.2 Map of Uttar Pradesh
Source: MapsofIndia.com
Fig 1.1 Map of Akbarpur Source:Akbarpur NPP

DETAILED PROJECT REPORT FOR MUNICIPAL SOLID WASTE
COLLECTION & TRANSPORTATION
20
2.3 History/Growth of the Region
The area of the Akbarpur Nagar Palika Parishad is 61.927 sq. kms. The population of the Akbarpur Nagar Palika Parishad is estimated at 157971 as of 2018.
2.4 Hydrology and Topography
Akbarpur can be divided into following classes of topography & terrain1. The Shivalik foothills and Terai in the North. 2. The Gangetic Plain in the centre - Highly fertile alluvial soils; flat topography broken by numerous ponds, lakes and rivers; slope 2 m/km. The regime has a gentle slope towards south-east with an average gradient of 1 in 5000.
Akbarpur forms a part of Saryu River plain and is underlained by a thick pile of alluvium deposits of quaternary age. This alluvium is a pile of unconsolidated sediments made up of sequence of clay, silt, kankar and different grades of sand. The sands are of varying grade from very coarse to fine occasionally becoming gravelly in nature. Sand mixed with gravel and kankar form the principal aquifers.
2.5 Climatic Condition The climatic conditions of district Akbarpur comes under sub-tropical sub humid climate zone. The district experiences hot and dry summers, humid monsoon season and dry winters with normal annual rainfall being973.23mm. The temperature varies from 8.10C to 24.80C in winters and 24.00C to 39.60C in summers. During cold-waves the temperature may plunge considerably. May is the hottest month of the year and January, the coldest, with mean daily maximum temperature during the former being 39.60C and that in latter, 23.40C. The mean daily minimum temperatures during these months are 24.0 0C and 8.10C, respectively. The southwest monsoon is active from mid-June to September/ early October, with maximum rainfall (~93%) taking place during this period, August being the wettest month. Average humidity remains considerably high from July to September (76% - 87%) and is highest during the month of August. The city/town receives an average annual rainfall 1035 mm.
DETAILED PROJECT REPORT FOR MUNICIPAL SOLID WASTE
COLLECTION & TRANSPORTATION
21
CHAPTER 3:
DEMOGRAPHIC & SOCIO-ECONOMIC PROFILE OF TOWN

DETAILED PROJECT REPORT FOR MUNICIPAL SOLID WASTE
COLLECTION & TRANSPORTATION
22
Akbarpur City is located within Ambedkar Nagar district In Uttar Pradesh. As per 2011 census,Total
population of Akbarpur is 1,11,447. Based on population, Akbarpur is ranked 2nd in Ambedkar
Nagar district and ranked 155th in UttarPradesh. Akbarpur literacy ratio of 64.65% with 72,051 total
people literate. In terms of literacy, Akbarpur ranks at 4th in Ambedkar Nagar district and
ranked 94th in Uttar Pradesh.
3.1 Population Growth rate and Spatial Distribution
As per the data available from Census 2011, total population of the town is 1,11,447 with average
household size more than five persons. A significant growth rate of population over the decades (1971–
2011) can be seen in Table 3-1
Table 3-1: Decadal Population Growth Trend
Census Year
Population
Decadal Population Variation
Absolute Percentage (%)
1971 12516
1981 19469 6953 55.55%
1991 26878 7409 26.15%
2001 33906 7028 26.15%
2011 111447 77541 228.69%
Source: Census of India, 2011
3.1.1 Population Distribution
The ward-wise population distribution of TOWN is shown inTable3-2. In wards with moderately or lowly
populated areas, the development is constrained by land-use or other physical characteristics.
Table 3-2: Ward Wise Demographic Profile
Sr. No. Election Ward Population
1 01 4631
2 02 4216
3 03 4206
4 04 4952
5 05 4045
6 06 4539
7 07 4971
8 08 5032
9 09 4093
10 10 4292
11 11 4052
12 12 4338
13 13 4194
14 14 4998
15 15 5027
16 16 4402
17 17 4793
18 18 4346
19 19 4124
20 20 4326
21 21 4027
22 22 4576
23 23 4400
24 24 4639
25 25 4228

DETAILED PROJECT REPORT FOR MUNICIPAL SOLID WASTE
COLLECTION & TRANSPORTATION
23
Source: Census of India, 2011
Figure 3.2: Ward Wise Population Distribution
3.1.2 Population Density
Town density between the year 1971 and 2011 is provided in Table3-3.
Table 3-3: Population Density –Town
Year
Area in sq. km
Population
Density – persons per
sq. km
1971 - 12516 -
1981 - 19469 -
1991 - 26878 -
2001 - 33906 -
2011 61.927 111447 1800 Person/sq.kms
Source: Census of India, 2011
3.2 Population Projection
The population of town has been projected upto the horizon year 2043 taking into consideration the
decadal population trend of Census of India and provisional figures of census from 1971 to 2011.
There are several standard methods of population projection such as
Arithmetical increase method,
Geometrical increase method,
4631
42164206
4952
4045
4539
49715032
40934292
40524338
4194
49985027
4402
4793
43464124
43264027
45764400
4639
4228
0
1000
2000
3000
4000
5000
6000
1 2 3 4 5 6 7 8 9 10 11 12 13 14 15 16 17 18 19 20 21 22 23 24 25
Series1

DETAILED PROJECT REPORT FOR MUNICIPAL SOLID WASTE
COLLECTION & TRANSPORTATION
24
Incremental increase method and
Graphical method.
All these different methods have different scope of applicability, depending upon the size and
age of the town, current population of the town, population growth pattern for last few
decades and future anticipated growth.
Different methods give d ifferent accuracy levels for population projection and it is difficult to use one
single method as accurate. Table 3-4 given below shows the various population projection methods
for town.
Table 3-4: Population Projection till the Year 2043
Year Population Arithmetical increase method
Incremental increase method
Geometrical increase method
Average increase
Percentage
Increase
1971 12516 12516 12516 12516 - -
1981 19469 19469 19469 19469 6953 55.55%
1991 26878 26878 26878 26878 7409 38.06%
2001 33906 33906 33906 33906 7028 26.15%
2011 111447 111447 111447 111447 77541 228.69%
2018 163484 141047 166405 183002 21671 46.69%
2023 212710 196180 212529 229423 49226 30.11%
2028 276523 255252 276523 297794 63813 30%
2033 359119 331827 359479 37132 82596 29.85%
2038 466853 414424 466853 502764 107734 29.99%
2043 606908 560223 606907 653593 140055 29.99%
Note: The area of Akbarpur NPP is not constant. Area of Akbarpur NNP Increased in 2008. So Forecasting by standard formula is not possible. So I’ve used the thumb rule of Population Forecasting.
Figure 3-4: Various Methods of Population Projection

DETAILED PROJECT REPORT FOR MUNICIPAL SOLID WASTE
COLLECTION & TRANSPORTATION
25
Table 3-5: Projected Population
Year 2018 2023 2028 2033 2038 2043
Projected Population 163484 212710 276523 359119 466853 606908
3.2.1 Gender ratio
The Gender ratio is the ratio of males to females in a population. In most sexually reproducing species, the ratio tends to be 1:1. This tendency is explained by Fisher's principle. For various reasons, however, many species deviate from anything like an even Gender ratio, either periodically or permanently.
3.2.2 Literacy rate
The working definition of literacy in the Indian census since 1991 is as follows: Literacy rate. Also called the "effective literacy rate"; the total percentage of the population of an area at a particular time aged seven years or above who can read and write with understanding.
3.2.3 SC/ST population
Total population of SC/ST in Akbarpur is 15360 in which SC population is 15310 and ST population is 50. According to census of India 2011.
Table 3-6: Akbarpur – Sex Ratio, SC, ST and Literacy Rate
Sl. No.
Name
2011
Total Male Female
1 Population 111447 57330 54117
2 Literates 72049 40633 31416
3 Literacy Rate 74.49% 81.69% 66.87%
4 Gender ratio 944
5 SC Population 15310 7752 7558
6 ST Population 50 28 22
7 Share of SC 13.7%
8 Share of ST 0.044%
Source: Census of India, 2011
Table 3-7: Ward Wise Literacy Rate and Sex Ratio
Ward No.
Literacy Rate
Sex Ratio
Share of SC
Population
Share of ST
Population
1 896 - 799 -
2 1072 - 320 -
3 1047 - 318 -
4 1291 - 168 -
5 1281 - 673 -
6 925 - 149 -
7 1098 - 279 -
8 1554 - 161 -

DETAILED PROJECT REPORT FOR MUNICIPAL SOLID WASTE
COLLECTION & TRANSPORTATION
26
9 1018 - 26 -
10 848 - 22 -
11 833 - 54 -
12 1266 - 63 -
13 1015 - 49 -
14 1416 - 62 -
15 1105 - 50 -
16 1118 - 89 -
17 1115 - 27 -
18 1060 - 114 -
19 1256 - 83 -
20 971 - 16 --
21 948 - 20 -
22 1091 - 18 --
23 1216 - 1 -
24 1039 - 0 -
25 902 - 36 -
Source: Census of India, 2011
3.3 Economic Profile
The economic development of Akbarpur is depends on the farming and some commercial activity. At
present scenario, most class depends on job opportunities in other urban area.
3.3.1 Workforce Participation Rate
As per census of India 2011 the work force participation rate is given below:-
Table 3-8: Work Force Participation Details
Category Number of Person %
Main workers 21172 18.99%
Cultivators 2731 2.45%
Agricultural Labors 3537 3.17%
HH industries 1927 1.72%
Other services 12977 11.64%
Sub Total Main Workers 21172 18.99%
Marginal Workers 13984 12.54%
Total Workers 35156 31.54%
Non-Workers 76291 68.45%
Grand Total Population 111447 100%
Source: Census of India, 2011

DETAILED PROJECT REPORT FOR MUNICIPAL SOLID WASTE
COLLECTION & TRANSPORTATION
27
Figure 3-5: Distribution of Employment Categories

DETAILED PROJECT REPORT FOR MUNICIPAL SOLID WASTE
COLLECTION & TRANSPORTATION
28
CHAPTER 4:
EXISTING SWM SCENARIO IN THE TOWN

DETAILED PROJECT REPORT FOR MUNICIPAL SOLID WASTE
COLLECTION & TRANSPORTATION
29
The SWM Rules 2016, mandate the following seven essential steps
1. Prohibit littering on the streets, water bodies, drains, open spaces etc, not to burn or burry the waste, ensure segregation of recyclable waste at source and storage of waste at source in two bins; one for biodegradable waste and another for recyclable material, store domestic hazardous waste separately as and when generated, store C&D waste and horticulture waste separately as and when generated and dispose of as per the direction of municipal authority, give away recyclables to waste pickers, kabadiwalas, recyclers and promote home composting & biogas generation.
2. Organize Primary collection of segregated biodegradable and non- biodegradable waste from the doorstep, (including slums and squatter areas,) at pre-informed timings on a day-to-day basis using containerized tricycle/handcarts/pick up vans. 3. Organize Street sweeping covering all the residential and commercial areas on all the days of the year irrespective of Sundays and public holidays.
4. Abolish open waste storage depots and make provision of covered containers or closed body waste storage depots or organize direct transportation of waste to processing facilities/disposal site.
5. Organize Transportation of waste in covered vehicles on avoiding multiple and manual handling of waste a day to day basis
6. Set up treatment facilities for biodegradable waste using composting or waste to energy technologies, meeting the standards laid down in the Rules, 2016.
7. Minimize the waste going to the land fill and dispose of only rejects from the treatment plants and inert material at the engineered landfills meeting the standards laid down in SWM Rules, 2016.
4.1 Sources of Waste Generation
Based on outcome of the discussions and incorporation of various viewpoints of the officials, Project
team identified major problematic areas related to waste generation & its management. After detailed
discussion and understanding of the ground realities, the major sources of waste generation has been
identified. This exercise was carried out to get the focus points of waste generation & its
management. The major waste generating sources in ABPNPP are residential, commercial,
institutional, market etc.
4.2 Primary Collection of Waste Primary collection of Domestic, Trade and Institutional Waste: There are 17090 households, 12 hotels, 52 restaurants, 165 Offices & commercial establishments, in the Akbarpur Nagar Palika Parishad. The system of door to door collection from households, shops and offices is not yet introduce in the city/town. The entire city/town continues to throw the waste on the streets, open space, drains, water body etc. adding to the piling up of waste along road sides and clogging of drains. The sanitary workers do not observe safety precautions during collection and subsequent transfer of waste to the disposal site.. It is noted that the waste deposited by the residents on the streets is collected by sanitation workers in early hours of the day and taken to open waste storage depots for onward transportation of waste to disposal site resulting in multiple handling of waste.
Street Sweeping ; The Council has 8 main roads as shown below and has a total road length of 11.700 Km. The details are given in table below.

DETAILED PROJECT REPORT FOR MUNICIPAL SOLID WASTE
COLLECTION & TRANSPORTATION
30
Table4-1: Street Sweeping
Sr. No.
Name of Road Length (K.M.) Width (m.)
1 Sahzadpur road 1.200 Km 6
2 Gaytri Mandir Road 0.350 Km 12
3 Malipur Road 3.000 Km 4
4 Krishna Nagar colony road 1.200 Km 4
5 Mirzapur Road 1.300 km 4
6 Mahmadpur road 1.450 Km 4
7 Edgah Road 0.550 Km 4
8 Railway Station to Sahzadpur Road 0.800 Km 4
Details of main Roads in Municipal council/corporation Table 4-2: Collect Data from Municipal council/corporation
Length of concrete / asphalt roads in km
Length of non-asphalted roads km
Length of roads having dividers. Km
36.265 26.565 0.350
The Density of Roads
The density of roads is shown in the table below. Certain areas are very dense whereas some portions of the city are having very low density .
Table 4-3 Density of Roads
Density Road length
High density 18.849
Medium density 26.565
Low density 10.865
Frequency of cleaning the Streets The Municipal Council has undertaken cleaning of most of the streets on a day to day basis. 70% of the
streets are cleaned daily. The frequency of cleaning of all the streets is shown in the table below.
Street sweeping

DETAILED PROJECT REPORT FOR MUNICIPAL SOLID WASTE
COLLECTION & TRANSPORTATION
31
Table 4-4 Street Cleaning
Frequency of Street Cleaning (in percentage)
Daily Alternate Days Twice in a week Once in a Week Occasionally
70% 30% 0% 0% 0%
-+-
Source: Pictures taken by Author
Fig 4-1: actual site photos
Source: Pictures taken by Auther
Fig 4-2: actual site photos

DETAILED PROJECT REPORT FOR MUNICIPAL SOLID WASTE
COLLECTION & TRANSPORTATION
32
4.3 Waste generation as per norms
The waste estimation is based on Central Public Health and Environmental Engineering Organisation,
2000 (CPHEEO) Manual and India Urban Infrastructure Report, 2011 by High Powered Expert
Committee (HPEC3).As per CPHEEO manual, the per capita waste generation for a population range of
0.1 to 0.5 million is 210 gm/capita/day. Other studies and observations indicate that waste generation
rate is found to be between 200 and 300 gm/ capita /day in small towns / cities with population below
2,00,000. Based on the per capita waste generation of 210gm/capita/day and current projected
population, the solid waste generated in these ULBs is provided below in Table4-1.
India Infrastructure Report 2011
As per the India Infrastructure Report 2006, towns having less than 1 lakh population fall under Class
II,III and IV town and the per capita waste generation is 255gm/capita/day and town shaving population.
Between 1lakh to10lakh fall under Class I C and the per capita waste generation is 304gm/capita/day.
Therefore, with a projected population in the current year i.e. 2017, the waste generated is provided in
Table4-1.
Based on above estimations, the waste generation for the towns are shown in Table 4-1 and
estimations based on HPEC report shall be used for all calculations in this report.
Table 4-4: Waste Generation in ULB’s
Name of the town
CPHEEO Standard
(gm/capita/day)
HPEC Standard
(gm/capita/day)
Population in 2017
Waste Generation as per CPHEEO
(TPD)
Waste Generation
as per HPEC (TPD)
Muradnagar 210 304 114614 24.07 34.84
Modinagar 210 304 144985 30.45 44.08
Niwari 210 255 9630 2.02 2.46
Patala 210 255 9831 2.06 2.51
Fareed Nagar 210 255 13635 2.86 3.48
Dasna 210 255 43073 9.05 10.98
Kithaur 210 255 31226 6.56 7.96
Babugarh 210 255 6065 1.27 1.55
Kharkhoda 210 255 15673 3.29 4.00
Begrasi 210 255 16465 3.46 4.20
Siana 210 255 49669 10.43 12.67
Khurja 210 304 121848 25.59 37.04
Bulandshahar 210 304 255409 53.64 77.64
Sikandrabad 210 255 90065 18.91 22.97
Jhangirabad 210 255 67237 14.12 17.15
Gulaothi 210 255 57352 12.04 14.62
Source: CPHEEO Standard and HPEC Standard

DETAILED PROJECT REPORT FOR MUNICIPAL SOLID WASTE
COLLECTION & TRANSPORTATION
33
4.4 Photos of Primary Collection of Waste
Fig 4-3: Auto tipper
4.5 Gap Analysis- Primary Collection
No any organized system for primary collection of waste.
Mostly the secondary waste collection point are open due to this waste is litter by animals.
Segregation of the collected waste form households at source is not being practiced leading to mixing of waste and entrainment of recyclable waste being dumped without proper and full recovery. Segregated waste collection have not applied here.
Spacing between bins are not as per norms.
Absence of adequate manpower, regulated transportation, narrow streets and financial constrains are some of the reasons that are deterring door to door collection.
4.6 Secondary Storage System/Secondary Collection Points
Municipal Council utilizes 275 sweepers for street sweeping and waste collection. Each sweeper sweeps
500 rmt of road length. The work of street sweeping is carried out in two parts; morning 06.00 am to
10.00 am and afternoon 01.00 pm to 05.00 pm. They are expected to walk about 500 metres for
depositing their waste at waste storage depot.
Tools Used in Street Sweeping (givedetails here)
1. Broom 2. Tasala 3. Farua 4. Farui 5. Kaanta 6. Long boot 7. Mask 8. Gloves

DETAILED PROJECT REPORT FOR MUNICIPAL SOLID WASTE
COLLECTION & TRANSPORTATION
34
Waste storage depots are on an eyesore in the city There are 4 open waste storage depots established in the city, the details of which are given
in the Table below:
Table4-5 Location of Open Dustbins –in Municipal council/corporation
Sr. No.
Ward No.
Place Remark
1 9 Zouhardeeh Muradabad open Stores
2 21 Lorpur Tajan open Stores
3 13 Mirzapur open Stores
4 20 Sijhuli open Stores
5 1 Vijay Ganv Dust bin
6 2 Nasirpur Barwan Dust bin
7 3 Rabipur Bahudeenpur Dust bin
8 4 Ghouspur Dust bin
9 6 Govind Ganeshpur Dust bin
10 7 Rasoolabad Dust bin
11 10 Gandhi Nagar Dust bin
12 11 Shashtri Nagar Dust bin
13 12 Patel Nagar Dust bin
14 15 Indrlok Dust bin
15 16 Shazahpur Dust bin
16 17 Shahzadpur Dust bin
17 18 Abdullapur Dust bin
18 19 Sanghatiya Dust bin
19 23 Sadarpur Dust bin
20 24 Ahariya Dust bin
21 25 Amroula Dust bin
Fig 4-4(a):1.1 m3 Container dry waste Fig4-4(b): 1.1 m.cube container for wet waste

DETAILED PROJECT REPORT FOR MUNICIPAL SOLID WASTE
COLLECTION & TRANSPORTATION
35
Table 4-6: Secondary Collection Equipment’s Details
Ward No.
Dhalao
(20’X10’)
Dhalao
(10’X10’)
Container (4.5
m3)
Container (.66 m3)
Open Area
-
1 - - - - 2 -
2 - - - -
4 -
3 - - - - 3 -
4 - - - -
1 -
5 - - - - -
6 - - - - 4 -
7 - - - - 5 -
8 - - - - -
9 - - - - 4
-
10 -- -- -- -- 9 --
11 - - - -
8 -
12 - - - - -
13 - - - - 2 -
14 - - - - -
15 - - - - 4 -
16 - - - - 1 -
17 - - - - 9 -
18 - - - - 3 -
19 - - - - 2 -
20 - - - -
-
21 - - - -
-
22 - - - - -
23 - - - - 2 -
24 -- -- -- -- 5
--
25 1 -
Source: HH Survey
4.7 Gap Analysis- Existing Storage System
Shortage of collection points of different types of waste from shops, market, institutions etc.
Most of the households, shops and commercial establishment are often found throwing solid waste on the street at random hours and around the secondary collection point and not into it and thus waste found coming on the roads, streets etc.
Many of the collection points located on the road side. The spill over from these collection point are making the whole area filthy. Moreover, the lifting of the waste from these area is also done once in a day, keeping the dirt lying whole day creating nuisance and congestion to the passing traffic.
The spacing of the containers in many places is not satisfying the requirement of CPHEEO norms.

DETAILED PROJECT REPORT FOR MUNICIPAL SOLID WASTE
COLLECTION & TRANSPORTATION
36
4.8 Waste Transportation System
Transportation of Waste The transportation system adopted in the Municipal council/corporation, is Primitive and inefficient. Waste is handled manually and loaded into tractor trolleys, open trucks from open waste storage sites, as could be seen from the photographs below. Availability of Vehicles for Transportation of Waste The number and types of vehicles available with the municipal Council is given in table below
Table4-7: Details of vehicles available with the Council
Vehicle type Number Capacity
Hand-cart 100 30-35 Kg Each
Rikshaw Cart 35 55-60 Kg Each
Tata Ace 6 1500 Kg Each
JCB 1 -
Loader 1 -
Tractor 3 2000 Kg Each
It is reported by the Municipal Council that each vehicle makes 2 trips per day between the assigned wards and the disposal site. These vehicles carry on an average 340.50 tonnes of waste per shift to the disposal site. Waste is transported to the dumping site located at a distance of 3.00 Km from the town/city. 10 drivers are deployed by the Council for transportation of waste. The transportation work is not carried out on all the days of the year. N o work is done on every Sunday and public holidays which gives rise to accumulation of waste on the next working day and consequent backlog. ( correct if required);
Table 4-8: Availability of Vehicles for Transportation of Waste
Sl.
No.
Name of
the Vehicle
Nos.
Purpose
Capacity
Present Condition
1 Loader cum Back hoe
1 To load the waste from secondary collection point to tractor trailer
1
m3bucket
In good condition
2
Handcarts
100
To load the waste from door to door collection and put in the secondary storage.
.35 m3
In good condition
3
Auto tipper
6
To load the waste from market or HH and transport the waste to dump site
15m3
In good condition
4 Tractor trailer
3 To carry the waste from secondary open collection point to dump site
2m3 In good condition
5 Riksha cart
35 To load the waste from door to door collection and put in the secondary storage.
0.6 m3 In good condition
Source: ULB present scenario

DETAILED PROJECT REPORT FOR MUNICIPAL SOLID WASTE
COLLECTION & TRANSPORTATION
37
Figure 4-5: Secondary Transportation vehicles
Tractor Trailer
Back Hoe Loader Tractor hoe loader
Auto Tipper

DETAILED PROJECT REPORT FOR MUNICIPAL SOLID WASTE
COLLECTION & TRANSPORTATION
38
4.9 Deficiency Analysis – Waste Transportation System Transport vehicles are not covered and segregated bins system.
Lack of proper vehicle.
There is no record with on the route followed by collection vehicles and weight carried by vehicle on each trips.
All type of mixed waste are removed by transport vehicles.
The vehicles, especially tractor-trolley are not covered as the result, foul smell is found spreading around and lighter waste materials are found to be flying on the way.
4.10 Treatment & Disposal System
Collected waste from NPP area is currently dumped at Dostpur road disposal site, 3.5 km away from the heart of
the town, there are 5 other disposal site is proposed by Akbarpur NPP their table is give below, the current
disposal site as shown in Figure 4-5. Since no sanitary landfill method is followed, waste is crudely dumped at the
low-lying area, which is posing a high pollution threat from leachate and surface runoff during monsoon.
Other impacts associated with the site are:
1. The site is a breeding ground for vermin and gives rise to foul odor and burning of waste is common.
2. The health of the sanitary workers involved in manual unloading of wastes is affected, and
3. Health of the rag pickers involved in waste segregation is also affected.
4. In the absence of a weigh bridge, the quantity of waste transported to the site is not recorded, as informed by
the NPP officials as well as local residents in thatarea.
Dumping Ground New Proposed Dumping Ground
Fig4-6: Open Dumping at Dumping Site

DETAILED PROJECT REPORT FOR MUNICIPAL SOLID WASTE
COLLECTION & TRANSPORTATION
39
4.11 Gap Analysis -Waste Disposal Practices
No any waste recycle plant.
Lack of proper disposal point.
Figure: 4.5 Location of Waste Dumping Site
4.12 Land Availability
Currently only one Dumping site is available in Akbarpur NPP. Dostpur road near Prathmik Viddhyalaya, which is 3.5kms away from heart of Akbarpur. And some Dumping ground is proposed by the Akbarpur NPP There Details are following;
S.No. Colony Ward No. Area Description
1 Bairampur 06 0.250 km.sqr Ward No.-5 Shivbaba
Ward No.-6 Govind Ganeshpur
Ward No.-7 Rasulabad
Ward No.- 8 Meeranpur
Ward No.-9 Moradabad
Dumping
Ground

DETAILED PROJECT REPORT FOR MUNICIPAL SOLID WASTE
COLLECTION & TRANSPORTATION
40
2 Katariya Yakubpur 01 0.076 km.sqr
0.237 km.sqr
Ward No.-1 Vijaygao
Ward No.-3 Ravipur bahauddinpur
Ward No.-4 Gauspur
3 Sijhhauli 20 0.055 km.spr
0.193 km.spr
Ward No.-20 Sijhauli
Ward No.-23 Sadarpur
Ward No.-24 Ahariya
Ward No.-25 Amaraula
4 Mirzapur 13 0.557 km.sqr Ward No.-13 Mirzapur
Ward No.-14 Krishnanagar
Ward No.-15 Indralok
Ward No.-16 Shahjahapur
5 Lorpur Tazan 21 0.707 km.sqr Ward No.-18 Abdullahpur
Ward No.-19 Sanghtiya
Ward No.-21 Lorpur Tazan
Ward No.22 Neharunagar
6 Jauhradeeh
Moradabaad
11 0.724 km.sqr Ward No. 10 Gandhinar
Ward No. 11 Shatrinagar
Ward No. 12 Patelnagar
Ward No.02 Nasirpur Barwa
4.13 Rag Picker/ Kabadiwalas
As per discussion from ULB there are no any official rag pickers in Akbarpur NPP. Non officials rag pickers comes and directly pick the some recyclables waste like rubbers, plastics, metals etc. and sell to the Kabadi shops.
4.14 Over all Gap Analysis of the Existing Solid Waste System
Handling of specialized wastes
Shortage of vehicles
Shortcomings at landfill sites
Organizational in adequacies
Shortage of equipment and committed supervisory staff
Financial stringency

DETAILED PROJECT REPORT FOR MUNICIPAL SOLID WASTE
COLLECTION & TRANSPORTATION
41
The table contains the options recommended to close the gaps –
Table 4-5: Analysis of the Existing SWM System
Component Existing scenario SWM rules 2016 recommendation
General
Waste from all categories including households, hotels, restaurants, commercial establishments, markets, institutions and street sweeping is mixed
Bulk waste storage collection in some areas only
.
Provisions should be made to collect street sweeping and drain sweeping waste separately.
Segregation at source
Absence of segregation of waste at source of generation
Recyclables including newspapers, plastics and metals are collected by rag pickers
All waste generators shall segregate and store the waste generated by them in three separate streams namely bio‐ degradable, non-bio‐ degradable and
domestic hazardous wastes in suitable bins and handover segregated wastes to authorized rag‐ pickers or
waste collectors;
Usage of separate bins for collection of biodegradable and non-biodegradable waste from households and other waste generating sources like street sweeping/drain silt.
Segregation can be practiced at the secondary collection points/ proposed Transfer Station located in Nagar Palika area
Domestic hazardous waste to be stored in bags/sacks made of plastic/paper/ cloth to be disposed in a notified area for safe disposal
Large containers are provided for Garden waste, Marriage Halls, Community Halls etc. to separate collection
Primary Collection
Door to door collection of waste only limited to wards in sultanpur
Absence of dustbins at some places
Littering of waste along streets
Door to door collection of segregated solid waste from all households including slums and informal settlements, commercial, institutional and other non-residential premises. From multi-storage buildings, large commercial complexes, malls, housing complexes, etc., this may be collected from the entry gate or any other designated location;
The sanitary workers are required to undertake door-to- door and/or door step collection to prevent littering of waste.
Use handcarts/tricycles with detachable containers of 20 to 40 litre capacity with necessary accessories and handles for easy handling
Encouraging and creating awareness among the local people not to throw garbage in the drains and public places
Provide PPE viz. nose mask, gloves, gumboot etc. to sanitary workers on regular basis
Insufficient number of secondary collection point.
Setup material recovery facilities or secondary storage facilities with
Community bins to be provided for storage of waste in the secondary

DETAILED PROJECT REPORT FOR MUNICIPAL SOLID WASTE
COLLECTION & TRANSPORTATION
42
Secondary Collection
Existing containers are in damaged conditions
Absence of provision to dump the waste in separate biodegradable and recyclable containers
Poor maintenance of collection points
Manual lifting of waste from collection points leading to spilling of waste
sufficient space for sorting of recyclable materials to enable informal or authorised waste pickers and waste collectors to separate recyclables from the waste and provide easy access to waste pickers and recyclers for collection of segregated recyclable waste such as paper, plastic, metal, glass, textile from the source of generation or from material recovery facilities; Bins for storage of bio-degradable wastes shall be painted green, those for storage of recyclable wastes shall be printed white and those for storage of other wastes shall
collection points.
Identification of collection points/pick up points for collection of waste to processing/dumpsite
(Source: ULB current scenario, guidelines and recommendation by author)

DETAILED PROJECT REPORT FOR MUNICIPAL SOLID WASTE
COLLECTION & TRANSPORTATION
43
4.15 Finances of ULB
Fig4-1Expenditure of NPP Akbarpur
S.N. Item 2012-13 2013-14 2014-15 2015-16 2016-17 2017-18 2018-19 2019-20 2020-20212021-2022 2022-23 2023-24 2024-25
Establishment
(a) Saleries& wages for employee 208.16 277.32 307.41 404.53 513.88 610.00 671.00 738.10 811.91 893.10 982.41 1080.65 1188.72
(b) Pension etc. for employee 42.41 68.00 60.00 30.00 60.00 70.00 77.00 84.70 93.17 102.49 112.74 124.01 136.41
(c) Any other (Pl,specity) 33.41 39.87 52.00 23.94 13.21 33.00 36.30 39.93 43.92 48.32 53.15 58.46 64.31
2 Maintenance
(i) Water Supply 19.80 27.44 34.45 24.31 31.28 41.50 45.65 50.22 55.24 60.76 66.84 73.52 80.87
(ii) Buildings/Community Assets 0.00 0.00 0.00 0.00 0.00 0.00
(iii) Roads 36.32 118.16 326.43 498.51 918.92 1125.00 1237.50 1361.25 1497.38 1647.11 1811.82 1993.01 2192.31
(iv) Other means of Communciation0.00 0.00 0.00 0.00 0.00 0.00 0.00
(v) Street Lighting 19.15 21.83 48.16 62.56 65.69 80.00 88.00 96.80 106.48 117.13 128.84 141.72 155.90
(vi) Sanitation (incl Storm Water Drainage
and Soled Waste management) 43.70 56.04 68.41 72.57 118.99 153.00 168.30 185.13 203.64 224.01 246.41 271.05 298.15
(vii) Any other maintenance Expenditure
(Pl.specify) 27.24 75.95 59.70 59.51 62.56 196.90 216.59 238.25 262.07 288.28 317.11 348.82 383.70
3 Capital Expenditure
(i) Water Supply 7.80 28.59 22.43 46.87 36.19 60.00 66.00 72.60 79.86 87.85 96.63 106.29 116.92
(ii) Buildings/Community Assets 0.00 0.00 0.00 0.00 0.00 0.00 0.00 0.00 0.00 0.00 0.00
(iii) Roads 84.74 255.72 489.64 925.81 1378.37 1375.00 1512.50 1663.75 1830.13 2013.14 2214.45 2435.90 2679.49
(iv) Other means of Communciation 0.00 0.00 0.00 0.00 0.00 0.00 0.00 0.00 0.00 0.00 0.00 0.00
(v) Any other maintenance Expenditure
(Pl. specify) 44.83 47.93 52.36 93.73 64.46 100.00 110.00 121.00 133.10 146.41 161.05 177.16 194.87
4 Welfare Expenditure for citizens 0.00 0.00 0.00 0.00 0.00 0.00 0.00 0.00 0.00 0.00 0.00 0.00 0.00
a) Education (excliding teachers salery) 0.00 0.00 0.00 0.00 0.00 0.00 0.00 0.00 0.00 0.00 0.00 0.00 0.00
b) Pension etc. for citizens 0.00 0.00 0.00 0.00 0.00 0.00 0.00 0.00 0.00 0.00 0.00 0.00 0.00
c) Health 0.00 0.00 0.00 0.00 0.00 0.00 0.00 0.00 0.00 0.00 0.00 0.00 0.00
d) Any other welfare expenditure for
citizens (pl.specify) 0.00 0.00 0.00 0.00 0.00 0.00 0.00 0.00 0.00 0.00 0.00 0.00 0.00
5 Any other (pl.specify) 0.00 0.00 0.00 0.00 0.00 0.00 0.00 0.00 0.00 0.00 0.00 0.00 0.00
Total 567.56 1016.85 1520.99 2242.34 3263.55 3844.40 4228.84 4651.72 5116.90 5628.59 6191.44 6810.59 7491.65
EXPENDITURE OF ULBs
(Rs. In Lakhs)
Estimated Projections

DETAILED PROJECT REPORT FOR MUNICIPAL SOLID WASTE
COLLECTION & TRANSPORTATION
44
Fig4-2: Revenue of NPP Akbarpur
S.N. Item 2010-11 2011-12 2012-13 2013-14 2014-15 2015-16 2016-17 2017-18 2018-19 2019-20 2020-21 2021-22 2022-23 2023-24 2024-25
A. Tax
1 Property Tax 0.00 0.00 0.00 0.00 0.00 0.00 0.00 0.00 30.00 33.00 36.30 39.93 43.92 48.31 53.15
2 Professional Tax 0.00 0.00 0.00 0.00 0.00 0.00 0.00 0.00 0.00 0.00 0.00 0.00 0.00 0.00 0.00
3 Entertainment Tax 0.00 0.00 0.00 0.00 0.00 0.00 0.00 0.00 4.00 4.40 4.84 5.32 5.86 6.44 7.09
4 Octroi/Entry Tax 0.00 0.00 0.00 0.00 0.00 0.00 0.00 0.00 0.00 0.00 0.00 0.00 0.00 0.00 0.00
5Any Other (2% Stamp
Duty + Advotizem Tax)120.19 121.92 207.74 254.55 112.75 232.13 255.28 262.00 288.20 317.02 348.52 383.37 421.71 463.88 510.26
Total (A) 120.19 121.92 207.74 254.55 112.75 232.13 255.28 262 322.2 354.42 389.66 428.62 471.49 518.63 570.5
B. Non Tax
1 Water Charges 4.63 8.96 6.20 13.50 16.38 13.36 16.82 18.00 19.80 21.78 23.96 26.35 28.99 31.89 35.08
2 Fees/User Charges 0 0 0.00 0.00 0.00 0.00 0.00 0.00 0.00 0.00 0.00 0.00 0.00 0.00 0.00
3 Irrigation Charge 0 0 0.00 0.00 0.00 0.00 0.00 0.00 0.00 0.00 0.00 0.00 0.00 0.00 0.00
4 Any Other (Pl. specify) 42.64 60.34 39.53 69.60 86.03 105.25 121.08 125.00 137.50 151.25 166.38 183.01 201.31 221.45 243.59
Total (B) 47.27 69.3 45.73 83.1 102.41 118.61 137.9 143 157.3 173.03 190.34 209.36 230.3 253.34 278.67
Schedule 5B (MP)
Name of the State Uttar Prdesh Nagar Palika Nagar Palika Parishad Akbarpur-Ambedkar Nagar
Projections(Rs. In Lakhs)
OWN REVENUE (INTERNAL REVENUE MOBILIZATION) OF MUNICALITIES

45
Source: ULB
Figure 4-6: Organization Structure of Akbarpur NPP
46
5 CHAPTER:
REGULATORYFRAMEWORK

47
5.1 Regulatory Framework for Waste Management
Historically, municipal solid waste management received little regulatory attention in India. However, rapid
population growth and an increasing trend towards urbanization over the past forty years led to significant
issues, particularly with in the rapidly growing large urban population. This ultimately led to significant
public concern and acted as the stimulus for regulatory reform.
However, the implementation of legislation has always been a problem either due to lack of resources to
enforce the rules or changes in political priorities. Community pressure has played a significant role by
way of Public Interest Litigations (PILs) 4 and therefore, the judiciary required that the authorities pay
adequate attention to environmental and ecological concerns.
There are a number of regulatory instruments (Acts and Regulations) that establish both the responsibility
and requirements for management of municipal solid waste. Key regulatory requirements that are
pertinent to this study include:
Constitution 74thAmendment – establishes overall responsibilities for MSW management;
Solid Waste Management Rules, 2016: In super session of the Municipal Solid Waste
Management Rules, 2000, the Central Government has issued the revised solid waste
management rules, 2016. This is the primary regulation covering all functional elements of
municipal solid waste management and establishes comprehensive requirements for collection,
storage treatment and disposal of municipal waste;
The Water (Prevention and Control of Pollution) Act, 1974: Under this act there are two aspects
related to municipal solid waste management. Firstly, a consent to establish and operate from the
Uttar Pradesh Pollution Control Board for establishment and operation waste processing and
disposal facility and secondly no water pollution should be caused by the leachate that is emitted
from the municipal waste processing and disposalfacility;
The Water (Prevention and Control of Pollution) Cess Act, 1977 and amendments thereon. The
only aspect under this act related to municipal solid waste management is the provision for levying
and collection of cess on water consumed for waste processing and disposal facility;
The Air (Prevention and Control of Pollution) Act, 1981 and amendments thereon. The aspects to
be considered under this act related to municipal solid waste management is the need for obtaining
consent from Uttar Pradesh Pollution Control Board for establishment of the processing plants and
disposal site and from an environmental aspect would be the air pollution caused by the waste
processing and disposal facility;
Plastic Waste Management (Handling & Handling) Rules, 2016 - provides specific rules for
manufacture and re-use of plastic bags and containers:and
The Environmental (Protection) Act, 1986 and its subsequent notifications. The aspect related to
municipal solid waste management is the Environmental Impact Assessment (EIA) notification,
4 Public Interest Litigation is a judicial instrument initiated to redress public grievance over violation of human rights by the state or to indicate the public policies embodied in the statute ortheconstitutionalprovisionsandhasbeenfosteredbyjudgesoftheSupreme Court. Most environmental actions by the judiciary in India fall within thisclass

48
2006, which provides the requirement for environmental clearance from statutory authority for municipal
solid waste processing and disposal facility.
The following sections provide a summary of the key regulatory instrument related to municipal solid
waste management within the project area
5.2 The Constitution 74th Amendment – Responsibilities for Solid
Waste Management
The Constitution (74th) Amendment Act of 1994 recognized the municipal governments as the third tier of
governance to manage urban growth and development including the management of municipal solid
waste. The 74thAmendment Act transfers significant authority and responsibility from the state
government to the Urban Local Bodies(ULBs).
Under this Act, cities and towns are responsible for the delivery of primary health care, education, and
urban infrastructure services. However, implementation of the act has been very slow and urban local
governments are still not fully empowered or authorized to levy, collect, and appropriate taxes and duties
to augment the revenue/resources by the respective state governments. A consensus among national,
state, and local governments and external donors is emerging on reforms needed to improve the
functioning of local governments
5.3 Solid Waste Management Rules,2016
Solid Waste Management Rules, 2016 (SWM Rules) are the revised set of rules issued by the Central
Government to supersede the Municipal Solid Waste (Management and Handling) Rules, 2000. SWM
Rules 2016 establish consistent regulations governing collection, segregation, transportation, and
disposal of all types of municipal solid wastes throughout India. The Rules are now applicable beyond
Municipal areas and extend to urban agglomerations, census towns, notified industrial townships, areas
under the control of Indian Railways, airports, airbase, Port and harbour, defence establishments, special
economic zones, State and Central government organizations, places of pilgrims, religious & historical
importance. Specific requirements under the SWM Rules are provided in the followingsections.
5.3.1 Administrative Responsibilities
India has a multi-tiered, decentralized system of governance that includes the central (federal)
government, state government and local administration by ULB. The ULBs include urban municipalities/
municipal corporations. All three tiers have specific roles and responsibilities as established under the
constitution and ensuing legislation for waste handling prescribed in the SWM Rules. The Central
Pollution Control Board (CPCB) is responsible to monitor the implementation of the rules, where as
municipal authorities are responsible for implementation. The responsibility for granting authorization for
setting up of waste processing and disposal facilities is with the State Pollution Control Board. The
distribution of jobs and responsibilities of authorities at different levels is described below:
Central Level: Ministry of Environment Forest and Climate Change
The Ministry of Environment, Forest and Climate Change shall be responsible for overall monitoring the
implementation of these rules in the country. The Central Monitoring Committee formulated by the
ministry shall monitor and review the implementation of these rules.

DETAILED PROJECT REPORT FOR MUNICIPAL SOLID WASTE
COLLECTION & TRANSPORTATION
49
Central Pollution Control Board
Co-ordinate with relevant state authority(UPPCB);
Monitor the implementation of guidelines and standards;
Review standards and guidelines;
Compile monitoring data; and
Prepare a consolidated annual review report based on UPPCB reports, for the Central Government.
State Level: Uttar Pradesh State Government
The Secretary, Urban Development Department, Uttar Pradesh through the Commissioner or Director of
Municipal Administration or Director of local bodies is responsible for overall implementation of SWM
Rules, 2016 in the state.
State Level: Pollution Control Board
Authorize waste processing/disposal facilities and landfills and coordinate input from other review
agencies including the Department of Housing & Urban development, Airport or Air Base
Authority, the Ground Water Board or any other affected agency prior to issuing the authorization;
As per the SWM Rules, 2016,UPPCB is the monitoring agency for implementation of SWM Rules,
2016 in UP.
Ensure implementation of SWM Rules, 2016, in terms of issuing consent for establishment and
operation of waste treatment and landfill facility and also scrutinize the annual reports on SWM
submitted by ULBs to ensure their compliance with the SWM Rules,2016
Monitor compliance with standards regarding groundwater, ambient air, leachate quality, compost
quality and incineration standards;
The UPPCB shall issue the authorization to the municipal authority or an operator of a facility
stipulating compliance criteria and standards as specified and including such other conditions, as
may be necessary;
Consider a new authorization after the validity of existing authorization expires;
Coordinate with Central Pollution Control Board; and
Prepare an annual report for Central Pollution Control Board.
Uttar Pradesh Jal Nigam (UPJN)
UPJN is a line department of the Government of Uttar Pradesh, monitoring the responsibility of ULBs to
prepare and execute the SWM projects, due to lack of its capacity, the preparation and execution of
capital works is carried out by UPJN.
Local Level:
Nagar Palika Parishad is responsible for infrastructure development for collection, segregation, storage, transportation, processing and disposal ofMSW;
Apply for Grant of Authorization for setting up waste processing and disposal facilities including
landfills from UPPCB. The application should be in Form-I (SWM Rules). A private operator of the
facility should also apply in a similar manner.

DETAILED PROJECT REPORT FOR MUNICIPAL SOLID WASTE
COLLECTION & TRANSPORTATION
50
Notify the waste collection and segregation schedule to the generators of municipal waste, to
help them comply;
Organize awareness programmes with citizens to promote reuse or recycling of segregated
materials and community participation in waste segregation;and
Prepare and submit annual report as per Form-II (SWM Rules) to the Secretary-in-Charge, Uttar
Pradesh Department of Housing & Urban Development and to theUPPCB.
As noted above, the Secretary of Uttar Pradesh Housing& Urban Development Department has the
overall responsibility for enforcement of the provisions of the SWM Rules within the extended area of
Akbarpur Nagar Palika Parishad Area. The Uttar Pradesh State Pollution Control Board is responsible for
monitoring compliance with the standards specified in the SWM Rules and also issue authorization for
setting up waste processing and disposal facilities, and landfills. Akbarpur Nagar Palika Parishad is
responsible to provide solid waste management services within their jurisdiction. As such, they must
provide appropriate infrastructure and services in accordance with the SWM Rules
5.3.2 Requirements under the SWM Rules
Segregation at Source
The new rules have mandated the source segregation of waste in order to channelize the waste to
recovery, reuse and recycle. Waste generators would now have to now segregate waste into
following streams- Biodegradables, Non-Biodegradable, Sanitary waste and Domestic Hazardous
waste before handing it over to the collector.
Institutional generators, market associations, event organizers and hotels and restaurants have
been directly made responsible for segregation and sorting the waste and manage in partnership
with local bodies.
In case of an event, or gathering of more than 100 persons at any licensed/ unlicensed place, the
organiser will have to ensure segregation of waste at source and handing over of segregated
waste to waste collector or agency, as specified by the local authority.
All hotels and restaurants will also be required to segregate biodegradable waste and setup a
system of collection to ensure that such food waste is utilized for composting / bio-methanation.
The rules mandate that all resident welfare and market associations and gated communities with
an area of above 5,000 sq. m will have to segregate waste at source into material like plastic, tin,
glass, paper and others and hand over recyclable material either to authorized waste-pickers and
recyclers or to the urban local body.
Waste Collection, Storage and Transportation
The SWM Rules establish consistent requirements for the collection, storage and transportation of
municipal waste with the intent of streamlining the technical and administrative methods in which solid
waste is handled in the country. Requirements for collection, segregation, storage and transportation of
municipal waste are as follows:
Collection of Waste: The Municipal Authority is responsible to provide door to door collection of
segregated waste from the households including slums, informal settlements, commercial, institutional
and other non- residential waste generators in compliance with the SWM Rules and notify the waste
collection schedule and likely methods to be adapted to the generators. Littering of municipal solid waste
is prohibited and generators are responsible to utilize the collection systems provided by the municipality
and avoid littering. Municipality must provide the following collection services to facilitate compliance:
Prepare solid waste management plan as per the state policy
Arrange door to door collection of segregated waste from all households including slums and
informal settlements, institutional, commercial and other non-residential premises.
DETAILED PROJECT REPORT FOR MUNICIPAL SOLID WASTE
COLLECTION & TRANSPORTATION
51
Integration of organization of waste picker or informal waste collector to facilitate their participation
in providing SWM services.
Prescription of appropriate user fee from the waste generator on its own or through the authorized
agency.
Ensure that bio-medical wastes and industrial wastes are not mixed with municipal solid wastes
and managed in accordance with the Bio-Medical Waste (Management and Handling) Rules 2016
and the Hazardous Waste (Management and Handling) Rules2016.
Provide separate collection/ disposal services for horticultural, construction and demolition waste in
accordance with local legislation, bylaws or directives issued by concerned authorities;
Prevent the burning of waste consisting of garbage and dry leaves.
Sweeping of streets depending on density of population, commercial activity and local situation and
separate collection of street sweeping waste.
Storage Facilities: The Municipal Authority is required to establish and maintain municipal waste storage
facilities taking into account the following criteria so that unhygienic and unsanitary conditions are not
created around it:
Setup secondary storage facility for temporary storage of streets weeping and silt removed from
the drains.
Setting up material recovery facility or secondary storage facility with sufficient space for sorting of
recyclables.
Establish waste deposition centers for domestic hazardous waste and provide direction to the
waste generators to deposit hazardous waste in the centres and also ensure safe storage and
transportation of hazardous waste.
Transportation: The SWM Rules specifies that vehicles used for transportation of wastes shouldbe
covered and the following compliance criteria should be taken into account to avoid visibility of waste to
the public and exposure to open environment preventing their scattering:
Transportation of segregated biodegradable waste to processing facilities like compost plant, bio-
methanation plant. Preference to on site processing.
Transportation of non-biodegradable waste to processing facility, material recovery facility or
storage facility.
Waste must be covered in transit such that the wastes are not visible to public, nor exposed to the
environment. Transportation vehicles should be designed to minimize handling of wastes, prior to
final disposal.
Treatment and Disposal of Municipal Solid Waste
The SWM Rules seek to minimize the burden on landfills for the disposal of municipal waste by adopting
appropriate waste segregation and treatment technologies. The Municipal Authority has the responsibility
to implement appropriate strategies and systems to minimize disposal volumes based on the following
criteria:
Facilitate construction operation and maintenance of municipal solid processing facilities and
associated infrastructure for optimum utilisation various component of waste adopting suitable
technologies. Preference shall be given to de-centralized processing to minimize transportation
cost and environmental impact.
Technologies proposed included bio-methanation, microbial composting, vermi-composting,
anaerobic digestion or any other appropriate biological processing for stabilization of wasteand

DETAILED PROJECT REPORT FOR MUNICIPAL SOLID WASTE
COLLECTION & TRANSPORTATION
52
waste to energy process including refused derived fuel or combustible fraction of waste or supply as feed
stock to solid waste based power plant or cement kilns.
Phase out use of chemical fertilizer in two years and use compost in all parks, gardens maintained
by localbody.
Alternative, state-of-the-art technologies may also be applied provided that the Municipal Authority
or Private Operator obtains authorization from the Central Pollution ControlBoard.
The SWM Rules restrict landfill disposal to non-biodegradable, inert, and other wastes that are unsuitable
for either recycling or biological processing. Residues of waste processing facilities, as well as pre-
processing rejects, should be land filled. Land filling of mixed waste should only be permitted in situations
where the waste stream is unsuitable for alternative processing or when additional time is required to
establish appropriate waste diversion and treatment programs and technologies.
Specifications for Landfill Sites
Only non-biodegradable and non-recyclable waste should go to a landfill site. Municipal and hazardous
waste should not be mixed by putting them in the same landfill.
Site for Land filling: The selection of a landfill will be based on examination of environmental issues. The
following points are to be considered for landfill site:
Before establishing any landfill site, baseline data of groundwater quality in the area needs to be
collected and kept in record for future reference.
Hydrological attributes of the site as well as the water usage must be taken into consideration.
Proper documentation of various phases of its construction and closure plan. In case a new landfill
facility is being established adjoining an existing landfill site, the closure plan of existing landfill
should form a part of the proposal of such new landfill.
The landfill site shall be selected to make use of nearby waste processing facilities or incorporate
appropriate facilities as an integral part of the development.
It should be large enough to last for twenty to twenty-five years.
Existing landfill sites, which continue to be used for more than five years, shall be improved in
accordance with the specification of the SWM Rules.
The landfill site shall be large enough to last for at least 20-25 years and shall develop ‘landfill cells’
in a phased manner to avoid water logging and misuse.
The landfill should be away from habitation zones, forest areas, water bodies, monuments, national
parks, wet lands and other places of cultural, historical or religious interest. Distance criteria has
been specified in the rules.
The sites for landfill and processing and disposal of solid waste shall be incorporated in the Town
Planning Department’s land-useplans.
A buffer zone of no-development should be maintained around the landfill site and incorporated in
the Town Planning Department’s land use plans. The size of the buffer zone is to be decided on
case to case basis in consultation with State Pollution Control Board.
It should be away from airports including airbase. Necessary approval of airport or airbase
authorities is required when the site is located within 20 km of an airport orairbase.
Temporary storage facility for solid waste should be provided in each landfill site to accommodate
waste in case of non-operation of waste processing or during emergencies or natural calamities.
Landfill Site Facilities and Maintenance: The SWM Rules specifies guidelines for the maintenance of a
landfill site. These are as follows: Proper fencing/ hedging with a gate. Entry of stray animals and
unauthorized persons should be prevented through protective measures.
Approach and other internal roads are required to facilitate movement of vehicles andother
machinery.
Site facilities should include a wastes inspection station, office facility for record-keeping and
shelter for maintaining equipment and machinery, including pollution monitoring equipment.

DETAILED PROJECT REPORT FOR MUNICIPAL SOLID WASTE
COLLECTION & TRANSPORTATION
53
The operator of the facility shall maintain record of waste received, processed and disposed.
Weigh bridge to measure the quantity of waste disposed, Fire protection equipment and other
facilities as may be required at the landfill site,
Utilities such as drinking water and washing facilities for workers. Adequate lighting for night
operation.
Safety provisions (first aid stations) and regular health inspection camps forworkers.
Provisions for parking, cleaning, washing of transport vehicles carrying solid waste shall be provided. The waste water so generated shall be treated to meet the prescribed standards.
Procedures and Specifications for Land filling: The SWM Rules provide specific instructions to be
followed at a landfill site. These are as follows:
Wastes should be pressed (compacted) to achieve high density.
Wastes should be covered immediately or at the end of each working day with a minimum 10 cm of
soil, debris, or construction material until such time as waste processing facilities are established.
Prior to the commencement of monsoon season, an intermediate cover of soil approximately 40-65
cm thick should be placed on the landfill to prevent infiltration.
Proper drainage system should be constructed to divert run-offwater.
After the completion of landfill a final cover should be designed to prevent infiltration and erosion incorporation barrier, drainage and vegetative layers. The final cover shall meet the following specifications, namely:--
The final cover shall have a barrier soil layer comprising of 60 cm of clay or amended soil with
permeability coefficient less than 1 x 10⁻²cm/sec.
On top of the barrier soil layer, there shall be a drainage layer of 15cm.
On top of the drainage layer, there shall be a vegetative layer of 45 cm to support natural plant
growth and to minimize erosion.
Pollution Prevention: The SWM Rules specifies the following measures in order to prevent pollution
problems from landfill operations:
Diversion of storm water drains to minimize leachate generation and prevent pollution of surface
water to avoid flooding and creation of marshy conditions.
Construction of a non-permeable lining system at the base and walls of waste disposal area. For
landfill receiving residues of waste processing facilities or mixed waste or waste having
contamination of hazardous materials (such as aerosols, bleaches, polishes, batteries, waste oils,
paint products and pesticides) minimum liner specifications shall be a composite barrier having 1.5
mm high density polyethylene (HDPE) geo-membrane, or equivalent, overlying 90cm of soil (clay or
amended soil) having permeability coefficient not greater than 1 x 10⁻⁷ cm/sec. The highest level of
water table shall be at least two meters below the base of clay or amended soil barrier layer.
Provisions for management of leachate collection and treatment shall be made. The treated
leachate must meet the standards specified.
Prevention of run-off from landfill area entering any stream, river, lake or pond,etc.
Guidelines are also specified for plantation at the landfillsite.
Water Quality Monitoring: The SWM Rule requires that before establishing any landfill site, baseline data
of ground water quality in the area shall be collected and kept in record for future reference. The Rule
also specifies the following:
The ground water quality monitoring within 50 metres of the periphery of landfill site is required
periodically to ensure compliance with criteria set by the Ground Water Board or the SPCB. Such
monitoring shall be carried out in different seasons i.e.,summer, monsoon and post-monsoon
period.

DETAILED PROJECT REPORT FOR MUNICIPAL SOLID WASTE
COLLECTION & TRANSPORTATION
54
Usage of groundwater in and around landfill sites for any purpose (including drinking and irrigation)
is to be considered after ensuring its quality.Table5-1 provides the specifications for drinking water
quality to be applied for monitoring purpose:
Table 5-1: Specification for Drinking Water Quality
SN
Parameters
IS 10500: 2012 Desirable limit
(mg/L except for pH)
1. Arsenic 0.01
2. Cadmium 0.01
3 Chromium+6 0.05
4. Copper 0.05
5. Cyanide 0.05
6. Lead 0.05
7. Mercury 0.001
8. Nickel -
9. Nitrate as NO3 45.0
10 PH 6.5-8.5
11. Iron 0.3
12. Total hardness (as CaCO3) 300.0
13. Chlorides 250
14. Dissolved solids 500
15. Phenolic compounds (as C6H5OH) 0.001
16. Zinc 5.0
17. Sulphate (as SO4) 200
Source: SWM Rules, 2016
Ambient Air Quality Monitoring:
Landfill gas control system shall be installed at landfill to minimize odour, prevent off site migration
of gases, to protect vegetation planted on rehabilitated landfill surface.
The concentration of methane gas generated at landfill sites hall not exceed 25 percent of the
lower explosive limit (LEL).
The land fill gas should be utilized for either direct thermal applications or power generation, as
viable. Otherwise, it should be combusted (flared). Passive venting should only occur if gas
utilization or flaring is not possible.
The SWM Rules requires regular monitoring of ambient air quality in the landfill and around landfill.
Ambient air quality shall meet the standards prescribed by Central Pollution Control Board for
Industrial area
Landfill Closure and Post-Closure Care: The post-closure care of landfill sites should be conducted for at
least fifteen years and long term monitoring or care plan should consist of the following:
Maintaining the integrity and effectiveness of final cover, making repairs and preventing run-on and
run-off from eroding or otherwise damaging the finalcover.
Monitoring the leachate collection system in accordance with the requirements.
Monitoring of ground water in accordance with requirements and maintaining ground water quality.
Maintaining and operating the landfill gas collection system to meet the standards.
Use of closed landfill sites after fifteen years of post-closure monitoring can be considered for human

DETAILED PROJECT REPORT FOR MUNICIPAL SOLID WASTE
COLLECTION & TRANSPORTATION
55
settlement or otherwise only after ensuring that gaseous and leachate analysis comply with the specified
standards.
Composting and Treated Leachate Quality
In order to prevent pollution problems from compost plant and other processing facilities, the following
should be complied with:
The incoming wastes at site should be stored properly and covered to the extent possible. If, such
storage is done in an open area, an impermeable base and facilities should be provided to allow
collection and proper management of leachate.
Necessary precautions should be taken to minimize nuisance of odour, flies, rodents, bird menace
and fire hazard.
In case of breakdown or maintenance of plant, waste intake shall be stopped, and arrangements
be worked out for diversion of wastes to the landfill site.
Pre-process and post-process rejects should be removed from the processing facility on regular
basis and should not be allowed to pile at the site. Recyclables should be routed through
appropriate vendors. The non-recyclables should be sent for the landfill site
For compost plants, the windrow area should be provided with impermeable base having a
permeability coefficient less than 10–7 cm/sec. The base should be sloped (one to two percent)
and circled by lined drains for collection of leachate or surface run-off.
Ambient air quality monitoring should be conducted downwind of the facility to assess nuisance
odours etc.
In order to ensure the safe application of compost, the SWM Rules specify compost quality standards.
Product that does not achieve the levels set out in the following table should not be used for food crops.
However, it may be utilized for purpose so that than growing food. In addition, specific standards have
been established for leachate quality. The leachate quality standards depend on the disposal method
used with the most stringent criteria specified for disposal to surface water bodies.
Relevant compost quality and leachate quality standards are provided in Table 5-2 and Table 5-3.
Table 5-2: Compost Quality standards
S.no
Parameters
Organic Compost
(FCO 2009)
Potash Rich Organic
Manure (FCO 2013)
1 Arsenic (mg/kg) 10.00 10.00
2 Cadmium (mg/kg) 5.00 5.00
3 Chromium (mg/kg) 50.00 50.00
Source: SWM Rules,2016

DETAILED PROJECT REPORT FOR MUNICIPAL SOLID WASTE
COLLECTION & TRANSPORTATION
56
Source: SWM Rules, 2016
*Compost (final product) exceeding the above stated concentration limits shall not be used for food crops.
However, it may be utilized for purposes other than growing food crops.
Table 5-3: Leachate Quality Standard
SN
Parameter
Standards (Mode of Disposal)
Inland Surface
Water
Public
Sewer
Land
Disposal
1. Suspended solids, mg/L, max 100 600 200
2. Dissolved solids (inorganic) mg/L, max. 2100 2100 2100
3 PH value 5.5 to 9.0 5.5 to 9.0 5.5 to 9.0
4 Ammonical nitrogen (as N), mg/L, max. 50 50 -
5 Total Kjeldahl nitrogen (as N), mg/L, max. 100 - -
6 Biochemical oxygen demand (3 days at 27ºC) max.(mg/L)
30 350 100
Source: SWM Rules, 2016
S.no
Parameters
Organic Compost
(FCO 2009)
Potash Rich Organic
Manure (FCO 2013)
4 Copper (mg/kg) 300.00 300.00
5 Lead (mg/kg) 100.00 100.00
6 Mercury (mg/kg) 0.15 0.15
7 Nickel (mg/kg) 50.00 50.00
8 Zinc (mg/kg) 1000.00 1000.00
9 C/N Ratio Less than 20 Less than 20:1
10 pH 6.5-7.5 (1:5 solution) maximum 6.7
11 Moisture, percentage by weight, Maximum 15.0-25.0 25.0
12 Bulk density (g/cm3) Less than 1.0 Less than 1.6
13 Total Organic Carbon, percentage by weight, minimum
12.0 7.9
14 Total Nitrogen As N, percentage by weight, minimum
0.8 0.4
15 Total Phosphate as (P2O5), percentage by weight, minimum
0.4 10.4
16 Total Potassium as (K2O), percentage by weight, minimum
0.4 -
17 Colour Dark brown to black -
18 Odour Absence of Foul Odour
-
19
Particle size
Minimum 90% of material should pass through 4mm IS sieve
Minimum 90% of material should pass through 4mm IS sieve
20 Conductivity as dsm-1 , not more than 4.0 8.2

DETAILED PROJECT REPORT FOR MUNICIPAL SOLID WASTE
COLLECTION & TRANSPORTATION
57
SN
Parameter
Standards (Mode of Disposal)
Inland Surface
Water
Public
Sewer
Land
Disposal
7 Chemical oxygen demand, mg/L, max. 250 - -
8 Arsenic (as As), mg/L, max 0.2 0.2 0.2
9 Mercury (as Hg), mg/L, max 0.01 0.01 -
10 Lead (as Pb), mg/L, max 0.1 1.0 -
11 Cadmium (as Cd), mg/L, max 2.0 1.0 -
12 Total Chromium (as Cr), mg/L, max. 2.0 2.0 -
13 Copper (as Cu), mg/L, max. 3.0 3.0 -
14 Zinc (as Zn), mg/L, max. 5.0 15 -
15 Nickel (as Ni), mg/L, max 3.0 3.0 -
16 Cyanide (as CN), mg/L, max. 0.2 2.0 0.2
17 Chloride (as Cl), mg/L, max. 1000 1000 600
18 Fluoride (as F), mg/L, max 2.0 1.5 -
19 Phenolic compounds (as C6H5OH) mg/L, max. 1.0 5.0 -
Source: SWM Rules, 2016
5.4 Plastics Waste Management & Handling Rules2016
Plastic waste Management and handling Rule 2016 has been formulated to provide a regulatory frame
work for management of plastic waste generated in the country and to provide thrust on plastic waste
minimization, source segregation, recycling, involving waste pickers, recyclers and waste processors in
collection of plastic waste fraction either from households or any other source of its generation or
intermediate material recovery facility and adopt polluter’s pay principle for the sustainability of the waste
management system. Plastic waste management Rule2016 specifies following responsibilities for the
local bodies.
Every local body shall be responsible for development and setting up of infrastructure for
segregation, collection, storage, transportation, processing and disposal of the plastic waste either
on its own or by engaging agencies or producers.
The local body shall be responsible for setting up, operationalization and co-ordination of the waste
management system and for performing the associated functions,namely:-
– Ensuring segregation, collection, storage, transportation, processing and disposal ofplastic
waste;
– Ensuring that no damage is caused to the environment during thisprocess;
– Ensuring channelization of recyclable plastic waste fraction torecyclers;
– Ensuring processing and disposal on non-recyclable fraction of plastic waste inaccordance
with the guidelines issued by the Central Pollution ControlBoard;
– Creating awareness among all stakeholders about theirresponsibilities;
– Engaging civil societies or groups working with waste pickers;and
– Ensuring that open burning of plastic waste does not takeplace.
The local body for setting up of system for plastic waste management shallseek
The local body to frame bye-laws incorporating the provisions of theserules.
DETAILED PROJECT REPORT FOR MUNICIPAL SOLID WASTE
COLLECTION & TRANSPORTATION
58
5.5 Hazardous and Other Wastes (Management &Transboundary Movement) Rules,2016.
Hazardous and Other Wastes (Management and Transboundary Movement) Rules, 2016 has replaced
the Hazardous waste (Management & Handling) Rules2008.
As per the definition, hazardous waste” means any waste which by reason of characteristics such as
physical, chemical, biological, reactive, toxic, flammable, explosive or corrosive, causes danger or is likely
to cause danger to health or environment, whether alone or in contact with other wastes or substances,
and shall include - (i) waste specified under column (3) of Schedule I; (ii) waste having equal to or more
than the concentration limits specified for the constituents in class A and class B of Schedule II or any of
the characteristics as specified in class C of Schedule II; and (iii) wastes specified in Part A of Schedule
III in respect of import or export of such wastes or the wastes not specified in Part A but exhibit hazardous
characteristics specified in Part C of Schedule III;
Most of the solid waste generated from the residential, commercial and institutional areas cannot be
classified as hazardous. Primarily hazardous waste from Industries fall under this category.
Hazardous and Other Wastes (Management and Transboundary Movement) Rules, 2016 may not
be directly applicable to the municipal waste management from extended area of Uttar Pradesh.
However, the same has been discussed here for general reference.
Responsibility of occupier
For the management of hazardous and other wastes, an occupier shall follow the following steps, namely:-
(a) Prevention; (b) minimization; (c)reuse, (d)recycling; (e)recovery, utilization including co-processing; (f)
safe disposal.
The occupier shall be responsible for safe and environmentally sound management of hazardous and
other wastes.
The occupier shall be responsible for safe and environmentally sound management of hazardous and
other wastes.
The hazardous and other wastes generated in the establishment of an occupier shall be sent or sold to an
authorised actual user or shall be disposed of in an authorised disposal facility.
The hazardous and other wastes shall be transported from an occupier’s establishment to an authorised
actual user or to an authorised disposal facility in accordance with the provisions of these rules
Responsibilities of State Government for environmentally sound management of hazardous and
other wastes.
Unlike Municipal Solid waste management Rules for which the management lies with the ULBs, the
Hazardous waste Management is the responsibility of the state government.
Every State Government may prepare integrated plan for effective implementation of these provisionsand
to submit annual report to the Ministry of Environment, Forest and Climate Change, in the Central
Government.
Grant of Authorization
Every occupier of the facility who is engaged in handling, generation, collection, storage, packaging,
transportation, use, treatment, processing, recycling, recovery, pre-processing, co-processing, utilisation,
offering for sale, transfer or disposal of the hazardous and other wastes shall be required to make an
application to the State Pollution Control Board and obtain an authorization from the State Pollution
Control Board.

DETAILED PROJECT REPORT FOR MUNICIPAL SOLID WASTE
COLLECTION & TRANSPORTATION
59
Storage of hazardous and other wastes
The occupiers of facilities may store the hazardous and other wastes for a period not exceeding ninety
days and shall maintain a record of sale, transfer, storage, recycling, recovery, pre-processing, co-
processing and utilization of such wastes and make these records available for inspection.
Transportation of hazardous and other wastes
The transport of the hazardous and other waste shall be in accordance with the provisions of these rules
and the rules made by the Central Government under the Motor Vehicles Act, 1988 and the guidelines
issued by the Central Pollution Control Board from time to time in this regard.
Packaging and Labelling
Any occupier handling hazardous or other wastes and operator of the treatment, storage and disposal
facility shall ensure that the hazardous and other wastes are packaged in a manner suitable for safe
handling, storage and transport as per the guidelines issued by the Central Pollution Control Board
Treatment, storage and disposal facility for hazardous and other wastes
The State Government, occupier, operator of a facility or any association of occupiers shall individually or
jointly or severally be responsible for identification of sites for establishing the facility for treatment,
storage and disposal of the hazardous and other waste in the State.
5.6 Bio- Medical Waste Management Rules,2016
These rules shall apply to all persons who generate, collect, receive, store, transport, treat, dispose, or
handle bio-medical waste in any form and shall not apply to following waste type
Radioactive wastes,
Wastes covered under the SWM Rules, 2016,
Lead acid batteries,
Hazardous wastes,
E-waste,
Hazardous microorganisms.
These rules also do not apply to the wastes covered under the SWM Rules, 2016. However, the
same has been discussed in the following section for general reference.
Duties of the Health care facilities
All the occupier of health care facilities shall have following responsibilities
Take all necessary steps to ensure that bio-medical waste is handled without any adverse effect to
human health and the environment and in accordance with these rules;
Make a provision within the premises for a safe, ventilated and secured location for storage of
segregated bio medical waste in coloured bags or containers in the manner as specified in
Schedule I, to ensure that there shall be no secondary handling, pilferage of recyclables or
inadvertent scattering or spillage by animals and the bio-medical waste from such place or
premises shall be directly transported in the manner as prescribed in these rules to the common
bio-medical waste treatment facility or for the appropriate treatment and disposal, as the case may
be, in the manner as prescribed in Schedule I;
Pre-treat the laboratory waste, microbiological waste, blood samples and blood bags through
disinfection or sterilization on-site in the manner as prescribed by the World Health Organisation.
DETAILED PROJECT REPORT FOR MUNICIPAL SOLID WASTE
COLLECTION & TRANSPORTATION
60
(WHO) or National AIDs Control Organisation (NACO) guidelines and then sent to the common bio-
medical waste treatment facility for final disposal;
Phase out use of chlorinated plastic bags, gloves and blood bags within two years from the date of
notification of these rules;
Establish a Bar- Code System for bags or containers containing bio-medical waste to be sent out of
the premises or place for any purpose within one year from the date of the notification of these
rules;
Ensure segregation of liquid chemical waste at source and ensure pre-treatment or neutralisation
prior to mixing with other effluent generated from health carefacilities;
Ensure treatment and disposal of liquid waste in accordance with the Water( Prevention and
Control of Pollution) Act,1974;
Duties of the operator of a common bio-medical waste treatment and disposal facility
It shall be the duty of every operator to take all necessary steps to ensure that the bio-medical waste
collected from the occupier is transported, handled, stored, treated and disposed of, without any adverse
effect to the human health and the environment, in accordance with these rules and guidelines issued by
the Central Government or, as the case may be, the central pollution control board.
Treatment and disposal
Bio-medical waste shall be treated and disposed of in accordance with Schedule I, and in compliance with
the standards provided in Schedule-II by the health care facilities and common bio-medical waste
treatment facility.
Occupier shall hand over segregated waste as per the Schedule-I to common bio-medical waste
treatment facility for treatment, processing and final disposal: Provided that the lab and highly infectious
bio-medical waste generated shall be pre-treated by equipment like autoclave or microwave.
No occupier shall establish on-site treatment and disposal facility, if a service of` common biomedical
waste treatment facility is available at a distance of seventy-five kilometers.
Segregation, packaging, transportation and storage
No untreated bio-medical waste shall be mixed with other wastes.
The bio-medical waste shall be segregated into containers or bags at the point of generation in
accordance with Schedule I prior to its storage, transportation, treatment and disposal.
Prescribed authority
The prescribed authority for implementation of the provisions of these rules shall be the State Pollution
Control Boards in respect of States and Pollution Control Committees in respect of Union territories.
5.7 E Waste Management Rules2016
These rules shall apply to every manufacturer, producer, consumer, bulk consumer, collection centres,
dealers, e-retailer, refurbisher, dismantler and recycler involved in manufacture, sale, transfer, purchase,
collection, storage and processing of e-waste or electrical and electronic equipment listed in Schedule I of
the rules, including their components, consumables, parts and spares which make the product
operational.
Responsibilities
Responsibilities for the following stakeholders have been identified in the Rules
Responsibilities of the manufacturer
Manufacturer of e waste is responsible for collection of e-waste generated during the manufacture of any
electrical and electronic equipment and channelize it for recycling or disposal;

DETAILED PROJECT REPORT FOR MUNICIPAL SOLID WASTE
COLLECTION & TRANSPORTATION
61
Responsibilities of the producer
The producer of electrical and electronic equipment listed in Schedule I shall be responsible for
implementing the Extended Producers Responsibility.
Responsibilities of collection centres
Collection centres will collecte-waste on behalf of producer or dismantler or recycler or refurbisher
including those arising from orphaned products; Provided the collection centres established by producer
can also collect e-waste on behalf of dismantler, refurbisher and recycler including those arising from
orphaned products ensure that the facilities are in accordance with the standards or guidelines issued by
Central Pollution Control Board ensure that the e-waste collected by them is stored in a secured manner
till it is sent to authorised dismantler or recycler as the case maybe;
Responsibilities of dealers
In the case the dealer has been given the responsibility of collection on behalf of the producer, the dealer
shall collect the e waste by providing the consumer a box, bin or a demarcated area to deposit e waste,or
through take back system and send the e-waste so collected to collection centre or dismantler or recycler
as designated by producer;
Responsibilities of the re-furbisher
Collect e-waste generated during the process of refurbishing and channelize the waste to authorized
dismantler or recycler through its collection centre;
Responsibilities of consumer or bulk consumer
Consumers or bulk consumers of electrical and electronic equipment listed in Schedule I shall ensure that
e-waste generated by them is channelized through collection centre or dealer of authorized producer or
dismantler or recycler or through the designated take back service provider of the producer to authorized
dismantler or recycler.
Responsibilities of the dismantler
Ensure that the facility and dismantling processes are in accordance with the standards or guidelines
prescribed by Central Pollution Control Board from time to time
Responsibilities of the recycler
The recycler shall ensure that the facility and recycling processes are in accordance with the standards or
guidelines prescribed by the Central Pollution Control Board from time to time
Responsibilities of State Government for environmentally sound management of E-waste
Department of Industry in State or any other government agency authorized in this regard by the State
Government, to ensure earmarking or allocation of industrial space or shed for e-waste dismantling and
recycling in the existing and upcoming industrial park, estate and industrial clusters;
Procedure for seeking and grant of authorization for management of e-waste
Procedures for seeking and grant of authorization for various stakeholders is discussed in the rules which
include
Extended Producer Responsibility - Authorization of Producers.
Authorization of Manufacturer
Procedure for grant of authorization to dismantler or recycler
Procedure for grant of authorization to refurbisher.

DETAILED PROJECT REPORT FOR MUNICIPAL SOLID WASTE
COLLECTION & TRANSPORTATION
62
Procedure for storage of e-waste.
Every manufacturer, producer, bulk consumer, collection centre, dealer, refurbisher, dismantler and
recycler may store thee-waste for a period not exceeding one hundred and eighty days and shall maintain
a record of collection, sale, transfer and storage of wastes and make these records available for
inspection.
5.8 Environmental Impact Assessment (EIA) Notification,2006
The requirement involved in setting up of select development projects (projects with potential to cause
significant environmental impacts) in India is through the Environmental Clearance (EC) Process using
Environmental Impact Assessment study as a decision-making tool. The EC process is mandated by the
new EIA notification dated 14thSeptember 2006 and is administered by the Ministry of Environment and
Forests at the Central Government level involving the role of State level regulatory and Government
bodies (as the State Pollution Control Board and the Environment Departments).
All ‘Common Municipal Solid Waste Management Facilities (CMSWMF)’ listed under project/activity 7(i) of
the EIA Notification have been classified as Category “B” projects. As per the new notification, all
category “B” projects/ activities are required to obtain prior environmental clearances from the concerned
State Environment alI impact Assessment Authority (SEIAA) through submission of prescribed
application. Further environmental studies requiring the preparation of EIA for project appraisal will be
determined by SEIAA depending on the nature and location specificity of the project. Hence, depending
on the requirement of EIA study, category “B” projects have been further classified into “B1” and “B2”. All
“B1” category projects require the preparation of an EIA report. In addition, projects which are required to
get EC are also subjected to mandatory Environmental Public Consultation as part of EIA process.
However, for category “B” projects public consultation will be applicable only for “B1”projects.
The present project has to obtain an Environmental Clearance from the SEIAA. The Form I furnishing
relevant information will have to be submitted to the SEIAA along with the Detailed Project Report. Based
on the environmental sensitivity of the project, the SEIAA will grant EC on the merit of For mI
(categorizing the project as B2) or will issue the Terms of Reference (ToR) for undertaking an EIA Study
(categorizing the project as B1). After completion of the EIA study, based on the scope provided, the EIA
will be submitted to the SEIAA for approval and subsequent grant of the EC. Construction activities can
only commence after obtaining the EC.

DETAILED PROJECT REPORT FOR MUNICIPAL SOLID WASTE
COLLECTION & TRANSPORTATION
63
CHAPTER 6:
EXISTINGSTUDIES
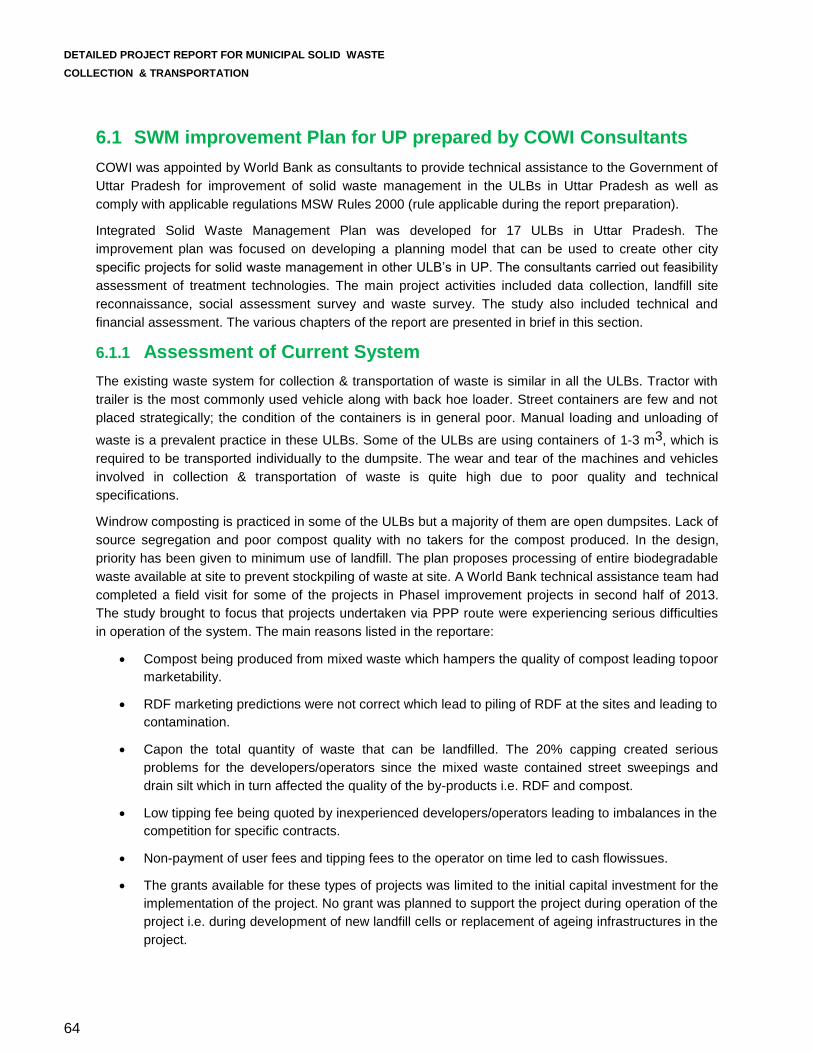
DETAILED PROJECT REPORT FOR MUNICIPAL SOLID WASTE
COLLECTION & TRANSPORTATION
64
6.1 SWM improvement Plan for UP prepared by COWI Consultants
COWI was appointed by World Bank as consultants to provide technical assistance to the Government of
Uttar Pradesh for improvement of solid waste management in the ULBs in Uttar Pradesh as well as
comply with applicable regulations MSW Rules 2000 (rule applicable during the report preparation).
Integrated Solid Waste Management Plan was developed for 17 ULBs in Uttar Pradesh. The
improvement plan was focused on developing a planning model that can be used to create other city
specific projects for solid waste management in other ULB’s in UP. The consultants carried out feasibility
assessment of treatment technologies. The main project activities included data collection, landfill site
reconnaissance, social assessment survey and waste survey. The study also included technical and
financial assessment. The various chapters of the report are presented in brief in this section.
6.1.1 Assessment of Current System
The existing waste system for collection & transportation of waste is similar in all the ULBs. Tractor with
trailer is the most commonly used vehicle along with back hoe loader. Street containers are few and not
placed strategically; the condition of the containers is in general poor. Manual loading and unloading of
waste is a prevalent practice in these ULBs. Some of the ULBs are using containers of 1-3 m3, which is
required to be transported individually to the dumpsite. The wear and tear of the machines and vehicles
involved in collection & transportation of waste is quite high due to poor quality and technical
specifications.
Windrow composting is practiced in some of the ULBs but a majority of them are open dumpsites. Lack of
source segregation and poor compost quality with no takers for the compost produced. In the design,
priority has been given to minimum use of landfill. The plan proposes processing of entire biodegradable
waste available at site to prevent stockpiling of waste at site. A World Bank technical assistance team had
completed a field visit for some of the projects in Phasel improvement projects in second half of 2013.
The study brought to focus that projects undertaken via PPP route were experiencing serious difficulties
in operation of the system. The main reasons listed in the reportare:
Compost being produced from mixed waste which hampers the quality of compost leading topoor
marketability.
RDF marketing predictions were not correct which lead to piling of RDF at the sites and leading to
contamination.
Capon the total quantity of waste that can be landfilled. The 20% capping created serious
problems for the developers/operators since the mixed waste contained street sweepings and
drain silt which in turn affected the quality of the by-products i.e. RDF and compost.
Low tipping fee being quoted by inexperienced developers/operators leading to imbalances in the
competition for specific contracts.
Non-payment of user fees and tipping fees to the operator on time led to cash flowissues.
The grants available for these types of projects was limited to the initial capital investment for the
implementation of the project. No grant was planned to support the project during operation of the
project i.e. during development of new landfill cells or replacement of ageing infrastructures in the
project.
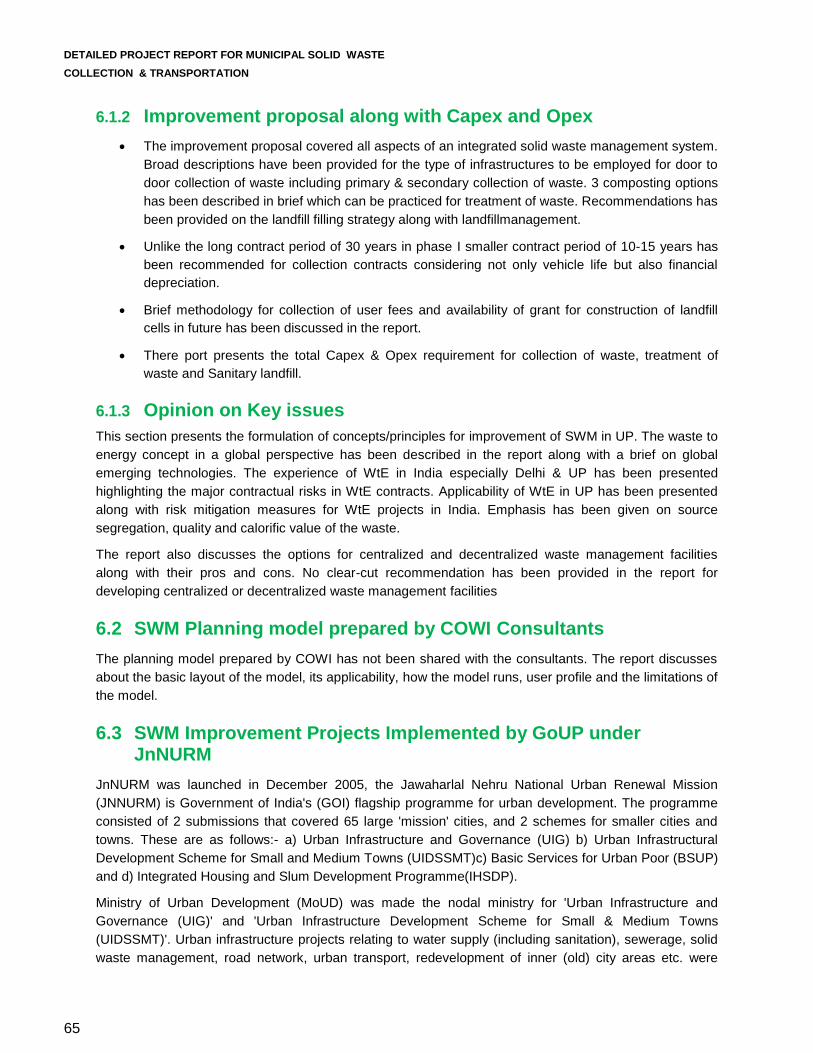
DETAILED PROJECT REPORT FOR MUNICIPAL SOLID WASTE
COLLECTION & TRANSPORTATION
65
6.1.2 Improvement proposal along with Capex and Opex
The improvement proposal covered all aspects of an integrated solid waste management system.
Broad descriptions have been provided for the type of infrastructures to be employed for door to
door collection of waste including primary & secondary collection of waste. 3 composting options
has been described in brief which can be practiced for treatment of waste. Recommendations has
been provided on the landfill filling strategy along with landfillmanagement.
Unlike the long contract period of 30 years in phase I smaller contract period of 10-15 years has
been recommended for collection contracts considering not only vehicle life but also financial
depreciation.
Brief methodology for collection of user fees and availability of grant for construction of landfill
cells in future has been discussed in the report.
There port presents the total Capex & Opex requirement for collection of waste, treatment of
waste and Sanitary landfill.
6.1.3 Opinion on Key issues
This section presents the formulation of concepts/principles for improvement of SWM in UP. The waste to
energy concept in a global perspective has been described in the report along with a brief on global
emerging technologies. The experience of WtE in India especially Delhi & UP has been presented
highlighting the major contractual risks in WtE contracts. Applicability of WtE in UP has been presented
along with risk mitigation measures for WtE projects in India. Emphasis has been given on source
segregation, quality and calorific value of the waste.
The report also discusses the options for centralized and decentralized waste management facilities
along with their pros and cons. No clear-cut recommendation has been provided in the report for
developing centralized or decentralized waste management facilities
6.2 SWM Planning model prepared by COWI Consultants
The planning model prepared by COWI has not been shared with the consultants. The report discusses
about the basic layout of the model, its applicability, how the model runs, user profile and the limitations of
the model.
6.3 SWM Improvement Projects Implemented by GoUP under JnNURM
JnNURM was launched in December 2005, the Jawaharlal Nehru National Urban Renewal Mission
(JNNURM) is Government of India's (GOI) flagship programme for urban development. The programme
consisted of 2 submissions that covered 65 large 'mission' cities, and 2 schemes for smaller cities and
towns. These are as follows:- a) Urban Infrastructure and Governance (UIG) b) Urban Infrastructural
Development Scheme for Small and Medium Towns (UIDSSMT)c) Basic Services for Urban Poor (BSUP)
and d) Integrated Housing and Slum Development Programme(IHSDP).
Ministry of Urban Development (MoUD) was made the nodal ministry for 'Urban Infrastructure and
Governance (UIG)' and 'Urban Infrastructure Development Scheme for Small & Medium Towns
(UIDSSMT)'. Urban infrastructure projects relating to water supply (including sanitation), sewerage, solid
waste management, road network, urban transport, redevelopment of inner (old) city areas etc. were
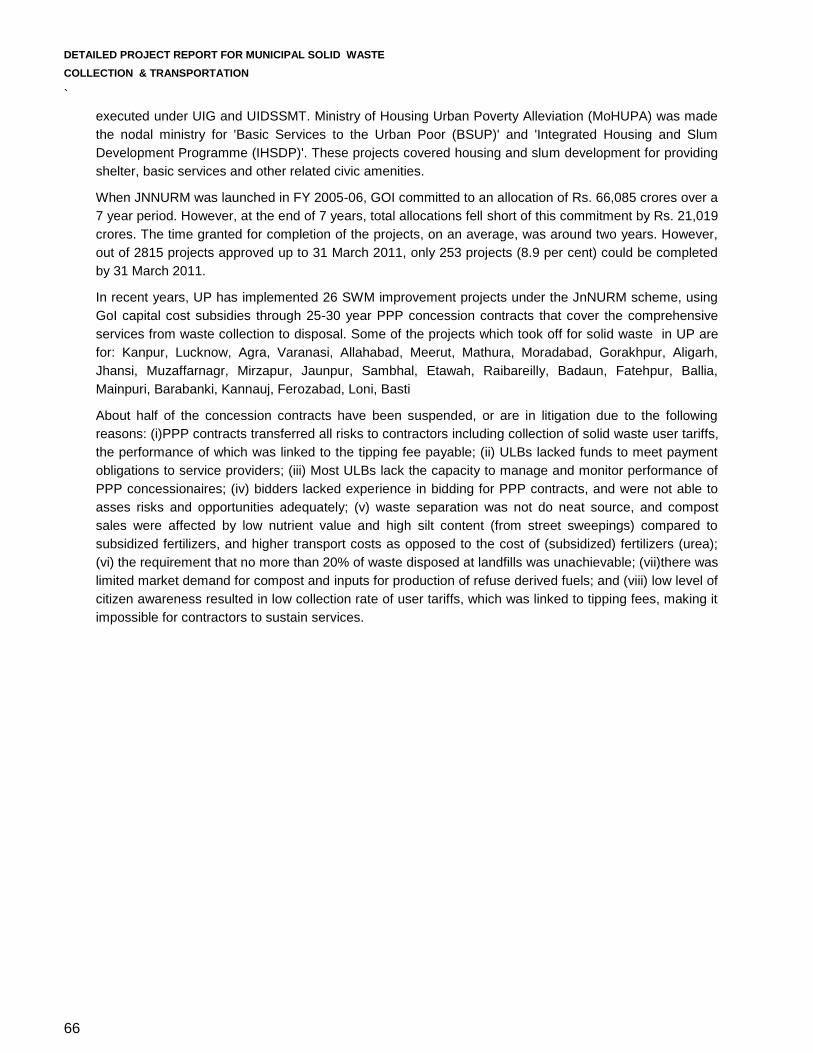
DETAILED PROJECT REPORT FOR MUNICIPAL SOLID WASTE
COLLECTION & TRANSPORTATION
66
`
executed under UIG and UIDSSMT. Ministry of Housing Urban Poverty Alleviation (MoHUPA) was made
the nodal ministry for 'Basic Services to the Urban Poor (BSUP)' and 'Integrated Housing and Slum
Development Programme (IHSDP)'. These projects covered housing and slum development for providing
shelter, basic services and other related civic amenities.
When JNNURM was launched in FY 2005-06, GOI committed to an allocation of Rs. 66,085 crores over a
7 year period. However, at the end of 7 years, total allocations fell short of this commitment by Rs. 21,019
crores. The time granted for completion of the projects, on an average, was around two years. However,
out of 2815 projects approved up to 31 March 2011, only 253 projects (8.9 per cent) could be completed
by 31 March 2011.
In recent years, UP has implemented 26 SWM improvement projects under the JnNURM scheme, using
GoI capital cost subsidies through 25-30 year PPP concession contracts that cover the comprehensive
services from waste collection to disposal. Some of the projects which took off for solid waste in UP are
for: Kanpur, Lucknow, Agra, Varanasi, Allahabad, Meerut, Mathura, Moradabad, Gorakhpur, Aligarh,
Jhansi, Muzaffarnagr, Mirzapur, Jaunpur, Sambhal, Etawah, Raibareilly, Badaun, Fatehpur, Ballia,
Mainpuri, Barabanki, Kannauj, Ferozabad, Loni, Basti
About half of the concession contracts have been suspended, or are in litigation due to the following
reasons: (i)PPP contracts transferred all risks to contractors including collection of solid waste user tariffs,
the performance of which was linked to the tipping fee payable; (ii) ULBs lacked funds to meet payment
obligations to service providers; (iii) Most ULBs lack the capacity to manage and monitor performance of
PPP concessionaires; (iv) bidders lacked experience in bidding for PPP contracts, and were not able to
asses risks and opportunities adequately; (v) waste separation was not do neat source, and compost
sales were affected by low nutrient value and high silt content (from street sweepings) compared to
subsidized fertilizers, and higher transport costs as opposed to the cost of (subsidized) fertilizers (urea);
(vi) the requirement that no more than 20% of waste disposed at landfills was unachievable; (vii)there was
limited market demand for compost and inputs for production of refuse derived fuels; and (viii) low level of
citizen awareness resulted in low collection rate of user tariffs, which was linked to tipping fees, making it
impossible for contractors to sustain services.

DETAILED PROJECT REPORT FOR MUNICIPAL SOLID WASTE
COLLECTION & TRANSPORTATION
67
CHAPTER 7
WASTE QUANTIFICATION &CHARACTERISATION-
CURRENT & FORECAST

DETAILED PROJECT REPORT FOR MUNICIPAL SOLID WASTE
COLLECTION & TRANSPORTATION
68
7.1 Introduction
The quantitative and qualitative assessment of waste in the study area, especially its physical and
chemical properties are essential for determining the future technological options for its treatment and
disposal. The interferences derived from this study shall be use in the process of selection of the
treatment technology for municipal solid waste.
As a methodology, in the absence of any existing information of SWM, primary survey and
investigation is taken up to understand the solid waste characteristics, collection system, treatment
system, disposal methods and other management issues. The primary and secondary information is
collected in consultation with BPN officials and field studies from studies from 5th to 28th of july.
Assessment of waste composition, characteristic and quantities of solid waste is essential for:
Sizeable increase in the floating population. Development of the city has attracted to visitors form
nearby towns. Raise in the numbers of the students in school, colleges and other educational
institutions. It provided the basic data on which the management system is planned, design and
operated. The periodic data wherever available help in identification of changes/trend in composition
and quantity of waste over a period of the time are known which help in future planning. It provided
information for the selection of the equipment and appropriate technology. It indicate the amount and
type of material suitable for the processing, recovery and recycling.
7.2 Methodology for Waste Quantification .
For the household level survey, differentiation of ULBs based on their economic profile (i.e. low income group,
middle income group and high-income group) is possible as the entire study area comprise similar level of
services and infrastructure.
With a view to come to a correct figure of waste generated per day, an exercise was undertaken to estimate the
quantity of waste generated per day. Weighing of entire waste of the city was carried out for three consecutive
days, which revealed that average waste generation rate is 5.313 MT/Day.
To further validate the estimates, there is a study to determine the quantity of waste generated by households and shops etc in the city in three different economical and geographical areas. This was done by collecting 1 0 % / 2 5 s a m p l e s of waste from 100 units from 4 different categories for three consecutive days. The waste generation rates noticed are shown in the table below

DETAILED PROJECT REPORT FOR MUNICIPAL SOLID WASTE
COLLECTION & TRANSPORTATION
69
Akbarpur NPP is the centre of the Ambedkarnagar district. There are 25 wards in Akbarpur NPP. Total population in Akbarpur is 111447. Spread in 61.927 kms.sqr.
For this purpose, survey will be conducted for a period of three (3) to five (5) consecutive days at selected
residential areas representing general households and slum areas of the towns and at bulk waste
generating sources such as all major markets, institutions and at major commercial establishments.
CPHEEO manual 2016 i.e.100 representative samples per 1,00,000 population including
households; commercial establishments; institutional generators, hotels and vegetable markets.
Source: imagery @2018 Digital Globe, map data @ 2018 google inc.
Figure 7-1: Location Map of the ULBs

DETAILED PROJECT REPORT FOR MUNICIPAL SOLID WASTE
COLLECTION & TRANSPORTATION
70
For the household level survey, differentiation of ULBs based on their economic profile (i.e. low income
group, middle income group and high-income group) is possible as the entire study area comprise similar
level of services and infrastructure.
With a view to come to a correct figure of waste generated per day, an exercise was undertaken to
estimate the quantity of waste generated per day. Weighing of entire waste of the city was carried out for
three consecutive days, which revealed that average waste generation rate is 5.313 MT/Day.
To further validate the estimates, there is a study to determine the quantity of waste generated by households and shops etc in the city in three different economical and geographical areas. This was done by collecting 1 0 % / 2 5 s a m p l e s of waste from 100 units from 4 different categories for three consecutive days. The waste generation rates noticed are shown in the table below
Table 7-2: Category wise waste Generation from a clusters of 25 houses/ shops each (in grams)
Category wise waste Generation from a clusters of 25 houses/ shops each (in grams)
GENERAT OR (Sample Size 25 units)
HIGH INCOME GROUP (grams)
DAY
MIDDLE INCOME GROUP (grams)
DAY
LOW INCOME GROUP (grams)
DAY
COMMERICIAL GROUP (grams)
DAY
CATEGORY OF WASTE
1 2 3 1 2 3 1 2 3 1 2 3
ORGANIC 900 718 850 750 800 760 700 750 730 214 215 217
PAPER 50 50 45 45 50 40 40 45 45 75 74 75
PLASTIC 100 120 110 95 100 93 80 110 82 96 95 94
METAL 30 40 35 45 40 50 40 35 43 46 46 45
GLASS 70 75 70 65 80 60 65 70 63 55 56 55
RUBBER - - - - - - - - - 21 22 20
SAND 300 307 320 250 350 270 300 400 310 74 73 75
HAZARDOUS 74 68 70 50 62 55 30 35 29 10 5 7
OTHERS 330 203 270 250 180 247 175 90 287 159 158 160
Total 1854 1554 1770 1550 1662 1582 1530 1535 1589 747 744 748
AVERAGE (3 DAYs)
Grams Grams Grams Grams
1726 1598 1551 7463400
Note:- Per capita waste generation is calculated by (1726+ 1598+ 1551)/3= 1625(Overall Average of waste generation)*25(Average of number of houses)/125(population of 25 house)=325gm/capita

DETAILED PROJECT REPORT FOR MUNICIPAL SOLID WASTE
COLLECTION & TRANSPORTATION
71
Table 7-3: Average quantity of waste generated per household/day categories wise
Category
No. of households Quantity of waste generation per households
per day in grams
Non Biodegradable
Biodegradable
High Income households
25 46600 24100 22500
Middle Income households
25 39950 20700 19250
Low Income households
25 38775 20308 18166
Type of waste generator Waste generation in kg
Commercial 746.34
To assess the overall municipal waste generation of study area, quantity of wastes generated from bulk
waste generating sources such as market areas and commercial establishments is added up with the
residential waste generation to obtain to total MSW generation for the study area for the year 2017. Figure
7-2 shows the location/area, which were considered for waste quantification and characterization.
There are no existing records were available to assist in establishing waste quantities. As a result, there
are no quantitative data that could be used to validate waste quantification numbers from the primary
survey. The approach used in establishing waste quantities for this study is based on sampling of the
waste generating sources in the study area supplemented with a comprehensive review of waste
management practice in the study area. The waste sampling result is presented in Table7-3.
Figure 7-2: Location of Sampling for Quantification

DETAILED PROJECT REPORT FOR MUNICIPAL SOLID WASTE
COLLECTION & TRANSPORTATION
72
7.3 Sources of Waste
Type of waste generators (Municipal Waste)
No of Units Quantity of waste per day (MT)
Households 17090 2.9
Shops , Workshops 325 0.5
offices and institutions 165 0.19
Industries 16 0.24
Vegetable and fruit Markets 2 0.52
Meat and Fish Markets 1 0.053
Number of Hospitals 25 0.26
Number of Nursing Homes 20 0.16
Number of Laboratories 12 0.03
Number of Beds 0 0
Number of Hotels 12 0.22
Number of Restaurants 25 0.31
Others 1 0.084
Total 17720 5.313
Floating Population
Source: NPP Akbarpur
7.4 Waste Quantifications
The information on the quantity of wastes generated are the basic needs for the planning of a solid waste
management system.
The qualitative and quantitative assessment for solid waste is carried out at all the major sources of
generation
The sampling and analysis methodology was adopted as per CPHEEO Manual, 2016.
Detail of sampling and analysis are given in following sections.
For estimate of the municipal solid waste generated in the town area, a 3 days detailed sampling for
different types of waste generators presenting general households and slum population of the town, at
bulk waste generating sources such as all major vegetable markets, institutions and at major commercial
establishments such as hotel and restaurants/ eateries etc. has been conducted.
From the household level survey, waste generation factors (gm/capita/day) for different residents groups
based on their economic profile was done in the study area due to similar level of services and
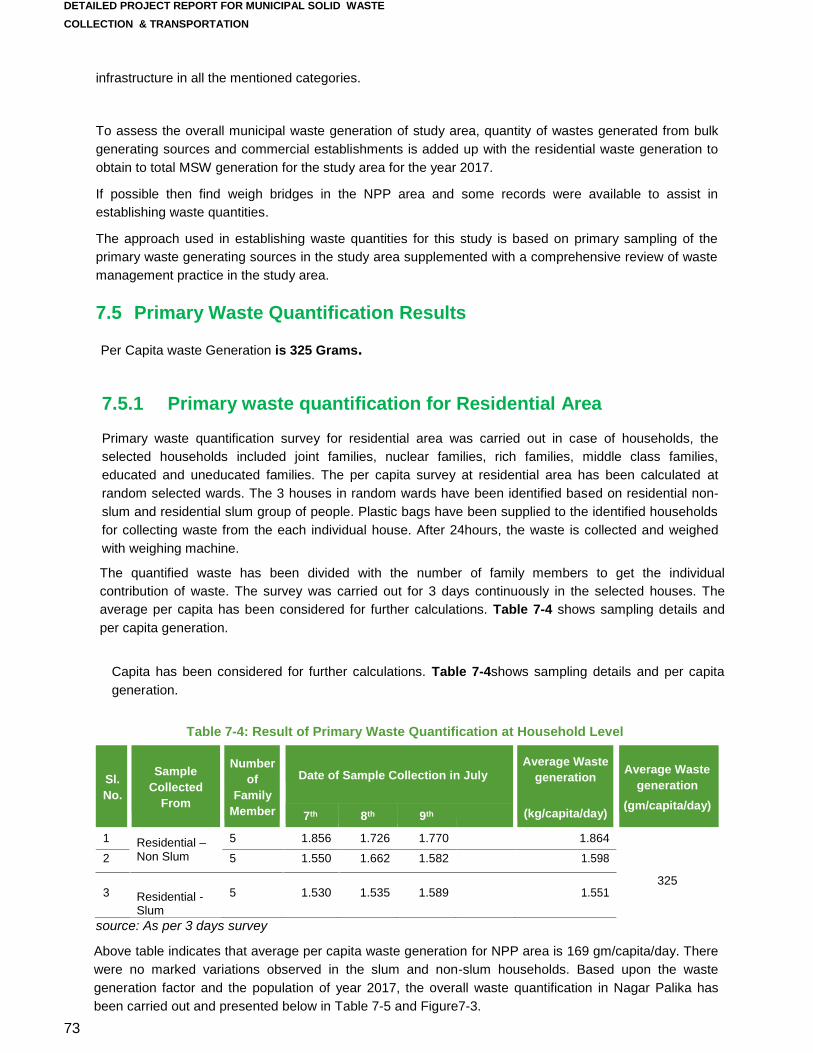
DETAILED PROJECT REPORT FOR MUNICIPAL SOLID WASTE
COLLECTION & TRANSPORTATION
73
infrastructure in all the mentioned categories.
To assess the overall municipal waste generation of study area, quantity of wastes generated from bulk
generating sources and commercial establishments is added up with the residential waste generation to
obtain to total MSW generation for the study area for the year 2017.
If possible then find weigh bridges in the NPP area and some records were available to assist in
establishing waste quantities.
The approach used in establishing waste quantities for this study is based on primary sampling of the
primary waste generating sources in the study area supplemented with a comprehensive review of waste
management practice in the study area.
7.5 Primary Waste Quantification Results
Per Capita waste Generation is 325 Grams.
7.5.1 Primary waste quantification for Residential Area
Primary waste quantification survey for residential area was carried out in case of households, the
selected households included joint families, nuclear families, rich families, middle class families,
educated and uneducated families. The per capita survey at residential area has been calculated at
random selected wards. The 3 houses in random wards have been identified based on residential non-
slum and residential slum group of people. Plastic bags have been supplied to the identified households
for collecting waste from the each individual house. After 24hours, the waste is collected and weighed
with weighing machine.
The quantified waste has been divided with the number of family members to get the individual
contribution of waste. The survey was carried out for 3 days continuously in the selected houses. The
average per capita has been considered for further calculations. Table 7-4 shows sampling details and
per capita generation.
Capita has been considered for further calculations. Table 7-4shows sampling details and per capita
generation.
Table 7-4: Result of Primary Waste Quantification at Household Level
Sl.
No.
Sample
Collected
From
Number
of
Family
Member
Date of Sample Collection in July Average Waste
generation
(kg/capita/day)
Average Waste
generation
(gm/capita/day) 7th 8th 9th
1 Residential – Non Slum
5 1.856 1.726 1.770 1.864
2 5 1.550 1.662 1.582 1.598
325 3 Residential -
Slum
5 1.530 1.535 1.589 1.551
source: As per 3 days survey
Above table indicates that average per capita waste generation for NPP area is 169 gm/capita/day. There
were no marked variations observed in the slum and non-slum households. Based upon the waste
generation factor and the population of year 2017, the overall waste quantification in Nagar Palika has
been carried out and presented below in Table 7-5 and Figure7-3.

DETAILED PROJECT REPORT FOR MUNICIPAL SOLID WASTE
COLLECTION & TRANSPORTATION
74
Table 7-5: Waste Quantification at Household Level
Ward no.
Population in 2018 Waste Generation grams per capita
Estimated Quantity (TPD)
1 6713 325 2.182
2 6298 325 2.047
3 6288 325 2.044
4 7034 325 2.286
5 6127 325 1.991
6 6621 325 2.152
7 7053 325 2.292
8 7114 325 2.312
9 6142 325 1.996
10 6374 325 2.072
11 6134 325 1.994
12 6420 325 2.087
13 6276 325 2.040
14 7080 325 2.301
15 7109 325 2.310
16 6484 325 2.107
17 6875 325 2.234
18 6428 325 2.089
19 6206 325 2.017
20 6408 325 2.083
21 6129 325 1.992
22 6658 325 2.164
23 6482 325 2.107
24 6721 325 2.184
25 6310 325 2.051
Total 163484 325 53.132
Figure 7-3: Comparative Waste Generation by Akbarpur
7.5.2 Primary Waste Quantification at Market area
Primary waste quantification was carried out for the daily market. The primary survey was done based on visual observation, discussion with the market authority and vegetable shop owners to understand waste generation, lifting schedule and their assessment of the waste generation quantity from the
market. The total waste generated from the market was estimated about 13.8 TPD.
7.5.3 Primary Waste quantification at Commercials Establishment
and Hotels The waste from the commercial establishments like shops and offices and retail stores, and general
stores, and hotels/eateries have considered in this category. The number of commercial
establishments are discussed earlier. In order to assess the waste generated by these
establishments, field visits and quantity assessment surveys were carried out in the commercial
areas. Discussions were carried out with the concerned person to understand the establishments
(such as number of seats for hotels, number of people coming each day), waste generation per day
and also the waste collection & disposal systems. The commercial establishments identified depends
on the type of centres like commercial centres and streets containing market yards etc. The averaged
value has been projected for further calculations. The total waste generated from commercial

DETAILED PROJECT REPORT FOR MUNICIPAL SOLID WASTE
COLLECTION & TRANSPORTATION
75
establishments was estimated to be about 13.8 considering the waste generation factor as prescribed
by CPHEEO manual, 2000 as well as Arcadis previous experience such type ULBs. Primary survey
conducted for various types of hotel/eateries, estimates the total waste generated is about 49.7.
7.5.4 Primary Waste Quantification Institutions
Primary survey may be based on visual observation and discussion with the authorities was done to
estimate the quantum of waste from various institutions. Primary survey and field investigations reveal
that for primary, secondary and higher secondary schools in the region, the waste generation factor
varies.
7.5.5 Waste Quantification Summary
The Summary of primary waste quantification results is given in Table 7-6 below.
Table 7-6: OVERALL Summary of Primary Waste Quantification
Sl. No. Description Quantity (TPD)
1 Residential household 29
2 Market area 10.73
3 Commercial establishments including Institutional 14.46
4 Hotels/ Eateries/Restaurant 5.3
Total 53.13
Source: Calculate by per capita waste
Service Standards and Key Assumptions for Solid Waste Management, clearly mentioned average per
capita waste generation by the city as 325 gm/capita/day have taken this value for design purpose for
waste quantification for the study area and the waste generation 53.13 tons/day in 2017. ‘Report on
Indian Urban Infrastructure and Services’, 2011 is a result of over two years’ effort on the part of the High
Powered Expert Committee (HPEC) for estimating the investment requirement for urban infrastructure
services. The HPEC was set up by the Ministry of Urban Development, Govt. of India in May2008.
7.6 Waste Projections
To project the future waste quantity to be generated in the expanded in next 20 years, projected waste
generation factor and projected population have been considered. For calculation of future waste
generation, the current waste generation factor of 325gm/capita/day5 has been projected at the rate of
=1.3% per annum. The population projection for next twenty years and the respective waste generation
are provided in Table7-7
Table 7-7: Summary of Future Waste Quantification in Study Area

DETAILED PROJECT REPORT FOR MUNICIPAL SOLID WASTE
COLLECTION & TRANSPORTATION
76
S.No Year Population Per ca waste generation in
grams/captia
Total waste generation
in TPD
1 2011 111447 - -
2 2018 163484 325 53.13
3 2023 212710 347 73.81
4 2028 276523 370 102.31
5 2033 359119 395 141.85
6 2038 466853 421 196.54
7 2043 606908 449 272.50
Note: 5 Please note that this waste generation factor has been calculated considering all types of MSW generation sources, such as - residential household (slum and non-slum), bulk generators (fruit & vegetable markets, vending zones etc.) and commercial establishments (hotels, restaurants, eateries etc.)
Source: Calculated by per capita
waste generation
Note:
1. Waste Generation in 2018 taken as 325gm/capita/day considering the waste generation from all sources.
2. Taking per capita waste generation in India is increasing at about 1.3%per annum as mentioned in sub-section 11.7.1 of “Guidelines for preparation of Project Report under NRCP and NGRBA, Dec 2010, MoEF, Govt. of India
3. Waste Generation in 2028 taken as 370gm/capita/day considering1.3%increasing per annum
4. Waste Generation in 2038 taken as 420gm/capita/day considering 1.3% increasing per annum
7.7 Waste Characterization
As discussed earlier, the sources of waste generation are residential, commercial, markets, etc. within the
study area. These are further classified based on their composition, characteristics, physical and chemical
characteristics as biodegradable, recyclables, combustibles, etc. For an effective SWM it is important to
look into the properties of waste apart from their origin.
7.7.1 Sample Size and Location of Sampling
The selection of sample size and the sampling locations have been done through professional judgment
and in consultation with Nagar Palika officials. The locations have been selected on the basis of local
consultations to have a comprehensive representation of the entire area of the NPP. A reconnaissance
survey was conducted prior to waste characterization to identify the location of sampling points with the
objective to address different types of waste generation sources such as residential area including slum,
markets, temple, commercial and institutional area.
7.7.2 Sampling and Analysis Method
Municipal Solid Waste (MSW) is collected from residential, commercial, institutional, market, slum of the

DETAILED PROJECT REPORT FOR MUNICIPAL SOLID WASTE
COLLECTION & TRANSPORTATION
77
study area. The total quantity of waste so collected is thoroughly mixed and then reduced by method of
quartering till a sample of such a size is obtained which can be handled personally subjected to physical
analysis.
Figure 7-5: Schematic Diagram of Waste Sampling
The Physical Characteristics like moisture content, density, percentage of different components, such as,
paper, plastic, glass, metal, organic matter, stones etc. were calculated.
The Chemical Characteristics like pH, moisture, density, Nitrogen, Potassium and phosphorus and C/N
ratio were analysed and represented in there port. Calorific value of the municipal solid waste (inKcal)
were also analysed.
All the samples have been analysed as per the standard code of practices. For MSW, crude solid waste
sample as such was not ready for analysis. So, are presentative homogeneous sample has been
processed as per IS: 9234. The steps are as follows:
Drying: Oven has been used for drying the sample. Moisture content of the crude sample has been
determined during drying process at 105º C.
Grinding or Pulverizing before Chemical Analysis: Before grinding, the segregation of various inert
materials like glass, ceramics, metals, stones etc. have been done. The remaining material has been
ground and sieved to form a homogenous powder, which has been used for further chemical analysis.
Mixing: There after the processed sample was mixed thoroughly to generate representative waste
sample for analysis for different parameters. The analysis was done as per the respective code of
practices. The samples were analyzed for physical composition and chemical parameters such as
density, moisture content, organic content, calorific value, and C/N ratio.

DETAILED PROJECT REPORT FOR MUNICIPAL SOLID WASTE
COLLECTION & TRANSPORTATION
78
CHAPTER 8
TECHNOLOGIES FOR COLLECTION AND
TRANSPORTATION OF SWMPLAN

DETAILED PROJECT REPORT FOR MUNICIPAL SOLID WASTE
COLLECTION & TRANSPORTATION
79
8 INTRODUCTION
This chapter on technology used for Solid Waste Management highlights that several shortcomings in the
technologies for collection and transfer of waste used as well as lack of technologies have contributed
greatly to the current solid waste related difficulties faced by the NPP.
Therefore, it is abundantly clear that technologies used for the collection and transfer of solid waste play
an important role in achieving the goals and hence, the ultimate vision of the plan. Collection of wet, dry
and domestic hazardous waste separately ensures maximum recovery of recyclables. It also enhances
the potential of cost-effective treatment of such wastes which can then easily meet the minimum quality
criteria defined for different products, e.g. production of compost from pure organic waste. However, it is
prudent to keep in mind that local authorities in a developing nation such as India are unable to invest in
the latest and the most efficient solid waste management technologies. Therefore, the technologies
selected and presented by the plan need to be not only efficient in solid waste management but also the
most affordable ones.
8.1 Segregation and Sorting Technologies
Waste segregation is an essential component of any Solid Waste Management system as separate waste
streams will have more value and can be easily recovered, recycled or reused. Separation also ensures
that the wastes are clean enough to be reprocessed or reused and thereby minimizes the loss of valuable
resources through final disposal. Therefore, the plan for Akbarpur will focus greatly on introducing waste
segregation especially among residents, schools and commercial establishments where recyclable waste
can be soiled with food wastes, hazardous wastes, oils etc., which in turn will reduce their value.
Essentially segregation at source is considered to be the best and most sound segregation system.
However, segregation can also be carried out at central segregation plants set up at suitable locations.
8.1.1 Source Segregation
Segregation of the three different fractions of waste could be undertaken without mixing them, but directly
depositing into separate bin / bag as and when generated. The colour of the bins should be in accordance
with the SWM Rules, 2016; wet waste is to be placed in a covered green bin and dry waste in a covered
white bin. Urban local bodies (ULBs) should decide on an appropriately coloured bin, because the SWM
2016 rule does not specify the colour of the bins for storage of domestic hazardous waste.
Category 1. Food & Green waste (wet waste) - Cooked / uncooked food, vegetable, fruit, meat, bone,
fish waste, leaves, grass etc.
Category 2. Recyclable & Non-bio-degradable (dry waste) - Paper, Plastics, glass, metal, ceramic,
rubber, leather, rags, used cloths, wood, stone, sand, ash, thermocol, straw & packing materials etc.
Category 3. Domestic hazardous waste – Batteries, used CFLs, tube lights, chemical, paint, and
insecticide containers etc.

DETAILED PROJECT REPORT FOR MUNICIPAL SOLID WASTE
COLLECTION & TRANSPORTATION
80
Plastic bucket with lid for wet
waste
Plastic bucket with lid for dry
waste
Typical plastic garbage bag for
domestic hazardous waste
Segregation measures at households
SUGEESTIONS BY YOU The ULB may take up the following to ensure segregation of waste at households.
To inform, educate and motivate not to litter waste on streets and develop a habit of storing
waste at source.
To educate about risks to human health and environment due to solid waste
Create awareness for segregation and storage of waste in three separate bins for dry waste, wet waste and household bio-medical/hazardous waste as per MSW Guidelines.
Organize awareness campaign for segregation of waste through local NGO’s, schools, local representatives etc. Regular meetings and interactions with representatives of local resident welfare associations, community participants, NGOs, etc.
To direct waste generators, through display boards in public places not to throw waste in their neighborhood, on streets, open areas, drains, etc.
Individual households/ Community may ensure the following:
To keep/store wet waste/biodegradable (kitchen waste/food waste) in a container covered with lid.
To keep/store dry waste/recyclable waste (plastics/paper/bottles etc.) in a separate
container covered with lid.
To keep/store domestic hazardous waste, capacity of bins/bags depending upon the
frequency of collection (daily, alternate day, or on demand) and quantity of waste generated
To follow the norms/regulations made by the local body / ULB regarding management of MSW
To hand over the segregated waste separately to the waste collector during door-to-door
collection to avoid unhygienic conditions.
As and when recyclable waste such as newspapers, books, glass bottles, plastic bottles,
metal / iron containers, etc. are generated, it may be handed over to nearby recyclable
waste dealer in order to reduce the waste quantity to dump-yard.
To store C&D waste separately as and when generated in its own premises and dispose at
the collection centre arranged by the ULB. In case of bulk quantities, the C&D waste
generator may contact nearby authorized processing facility (else ULB) for disposal.
Communities shall try to process segregated bio-degradable waste within their premises in

DETAILED PROJECT REPORT FOR MUNICIPAL SOLID WASTE
COLLECTION & TRANSPORTATION
81
consultation with the ULB.
Segregation at hotels/restaurants/community/function halls
The hotels and restaurants in the ULB shall be advised to:
Avoid throwing of shop cleaning/sweeping waste on roads/streets/open areas Avoid disposal of waste into ULB community bins Use separate containers with lid of adequate capacity for storing dry and wet waste. Hand over the segregated waste to the sanitary worker/waste collection. These waste generators may try to process the segregated bio-degradable waste within their premises in consultation with the ULB.
Short-term approach for segregation of waste
Segregation of waste at various sources described in above sections takes considerable time in
setting up/to falling place. Mean while as an immediate measure, the following are proposed. This
immediate/short- term approach may be limited to period of 5years.
No segregation of waste at source. Collection of mixed waste is collect from waste generators. Segregation can be partly done during collection of waste by sanitary workers/ ragpickers–sorting of recyclable waste.
8.1.2 Waste Picking/Scavenging Segregation and door-to-door collection initiatives as part of an integral solid waste management (SWM) strategy. The CoC initiated a citywide process of source segregation at the ground level as a joint initiative with community representatives, Kudumbashree, RWAs, NGOs, and CREDAI. To achieve source segregation, the following integrated approach was adopted—institutional; managerial; legal; financial; and information, education, and communication (IEC) initiatives or improvements.
Outcome:
Collection of segregated waste (wet and dry) from households was 80%.
The collection system was developed by RWAs, ward-level committees, Kudumbashree, and CREDAI integrated rag pickers on contractual basis as waste collectors.
Door-to-door collection and source segregation ultimately led to a bin-free city and reduced the amount of waste to landfill.
Segregated waste was transported to the processing plant.
Success Factors:
Institutional and managerial models were established.
Intensive interactive meetings on the overall concept of segregation with resident sand citizens of wards were held by the ward council, corporation officials, councillors, and the representatives of NGOs and sanitation committees.
Effective community participation to adapt to the new system was ensured.
Communication tools were developed and disseminated regularly to the communities.
Educational institutions, NGOs, and local celebrities were actively involved in awareness generation activities.
Overall Sustainability:
It is a self sustain able working model with no direct financial involvement in the municipal budget except for provision of physical infrastructure like handcarts and operation and maintenance (O&M) of transportation system. The collection system is completely managed by the RWAs, CREDAI, and Kudumbashree. User charges are collected directly by the door-to-door waste collectors and are used for funding the salary of the workers. The collection and segregation system in Kochi has been self- sustaining since its inception in2007.
Source: MSWM Manual, 2016
8.1.3 De-centralized Sorting Center

DETAILED PROJECT REPORT FOR MUNICIPAL SOLID WASTE
COLLECTION & TRANSPORTATION
82
It provide alternative to source segregation and can be a suitable option to densely populated towns where residents do not have enough space to segregate and store the wastes at homes. The waste collected from residences, commercials establishments and other sources are brought to a central point where the valuable materials are separated out and cleaned and sold for recycling. Through segregation plant can be a single a single large unit or several small-scale units, setting up smaller de-centralize unit may be more practical in for Akbarpur. These plant are equipped with water.
Secondary Segregation and Segregation at Transfer Stations
Unsegregated waste, which has not been sorted at primary level, should be segregated either at an
intermediate stage (e.g. transfer station) or at the processing plant, prior to treatment, in cases where
waste is brought directly to the plant from the waste collection areas. Segregation may be accomplished
through manual or mechanized segregation. Multiple handling of waste should be avoided.
8.2 Waste Collection and Transportation Technologies
Waste collection includes not only the gathering of waste but also hauling this waste to locations where the
waste is either temporarily stored or for final disposal. Mostly, the collection is based on an individual
collector or a group of collectors who move through a collection service area with a collection vehicle and
some hand tools. The vehicles used for collection can range from simple handcarts to complex and fuel
intensive compactor trucks. Therefore, collecting and hauling waste can be a labour intensive and high fuel
consuming activity.
Waste collection services are divided into primary and secondary collection. Primary collection refers to the
process of collecting, lifting and removal of segregated solid waste from source of its generation including
households, shops, offices, markets, hotels, institutions and other residential or non-residential premises
and taking the waste to a storage depot or transfer station or directly to the disposal site, depending on the
size of the town or city and the waste management system prevalent in the town or city. Primary collection
must ensure separate collection of certain waste streams or fractions depending on the separation and
reuse system applied by the respective town or city.
Secondary collection includes picking up waste from community bins, waste storage depots, or transfer
stations and transporting it to waste processing sites or to the final disposal site. At the secondary collection
points, segregated waste must be stored on-site in separate covered bins or containers for further collection
and should be kept separate during all steps of waste collection, transportation, and processing. Further,
ULBs should ensure that at the secondary storage points the waste is should be attended daily or before
container starts overflowing.
As described under the chapter on Regulatory Framework, the responsibility of collecting municipal solid
waste rests solely on the municipal councils. The following table demonstrates various Door to Door
Collection (DTDC) systems.
Area
Activity
System
Vehicles/Equipment’s
Frequency of
Service
Residential DTDC Common Collection bins
Hand carts/Tricycle/Auto tipper
Daily
Slum DTDC Common Collection bins
Hand carts/ Tricycles Daily

DETAILED PROJECT REPORT FOR MUNICIPAL SOLID WASTE
COLLECTION & TRANSPORTATION
83
Area
Activity
System
Vehicles/Equipment’s
Frequency of
Service
Commercial Areas
DTDC
Common Collection bins/Transfer Station
Tricycle/Auto tipper
Daily
Market Area
DTDC
Common Collection bins/Transfer Station
Tricycle/Auto tipper
Daily
All the above Secondary Collection
Transfer Station Regular/ Static Compactor
Daily
The collection of waste from households, commercial and institutional establishments are carried out
manually using hand carts/tricycles, auto tippers, tractors with trailers and compactors. Domestic waste
should be collected in the morning from 6am to 11am and in the afternoon from 3 pm to 5pm. Wastefrom
the commercial areas should be collected between 10 a.m. and 2 p.m. Vegetable market waste should be
collected in non-peak hours (early morning, late afternoon, or at night). The collection of market waste
might also need to be done more than once a day. The collection route and frequency are often adhocin
nature and one of the issues raised by stakeholders during the stakeholder consultations was that the
collection is neither regular or efficient enough to suit the rate at which the waste is generated. In addition
to this the ABPNPP is unable to provide collection services to some of the residents within its Nagar
Palika jurisdiction due to shortfall in vehicles and collectors and unavailability of vehicles which can cover
all the areas. The result of all these factors is that the ABPNPP is unable to collect and properly dispose
all the municipal waste generated within its limits and the uncollected waste is left to decompose and
cause health and environmental impacts.
To improve this situation and deliver a better service to the community, the NPP will need to consider
several changes to its existing technologies and the method of using these technologies. Fleet
management and re-evaluating the collection routes and schedules are essential in optimizing the
collection system. As per your observation
The selection of suitable collection technologies will depend on the type and density of waste, number of
generation points and roadways that need to be travelled in collecting the waste. In addition to this, the
skills of the collection team and the method of discharging the load at an intermediate collection point/final
disposal point will also need to be given due consideration. In the case of developing nations such as
India, NPP often has to use the same vehicle for multiple purposes to cover as much area as possible to
that the work can be completed with the few vehicles available.
The schematic diagram of the proposed scheme for collection and transportation is shown in Figure8-1.

DETAILED PROJECT REPORT FOR MUNICIPAL SOLID WASTE
COLLECTION & TRANSPORTATION
84
Residential Area Commercial Area
Hotel Market Area
Figure 8-1: Proposed Scheme for Collection and Transportation
8.2.1 Waste Collection Hand Tools
One of the most important factors to consider in the case of waste collection is the hand tools which will
be used by the waste collectors. These hand tools ensure that the collectors do not come into direct
contact with the waste and thereby eliminate any adverse health effects caused due to exposure to solid
waste. The main tools used in waste collection are brooms (for sweeping), spade (collecting and
transferring), dust pans and large bamboo/metal baskets (transferring).
In the case of Akbarpur, waste collection is carried out by individual collectors who sweep the road side
garbage into heaps that are later picked up by the collection vehicles. Therefore, hand tools are essential
for the waste collection. Hand tools make collecting waste easier and more efficient and less dangerous
to the collectors.

DETAILED PROJECT REPORT FOR MUNICIPAL SOLID WASTE
COLLECTION & TRANSPORTATION
85
Broom Spade for collection
Shovels for collection and transferring
Dust Pans for collection and transferring
8.2.2 Roadside Waste Collection Bins
Collection systems in most countries depend on set out containers which are placed along the road side
for waste to be disposed into. Several types of roadside waste collection bins/containers can be used to
facilitate the easier collection of solid waste. Road side bins can be stationary or mobile types. Several
such types of bin used in India are given below
Source: pictures are taken by author
8.2.3 Waste Collection and Transportation Vehicles
Small Scale Collection Vehicles / Muscle Powered Vehicles
Muscle powered handcarts, pushed by people as well as tricycles with separate bins are important sound
and low investment options for collecting solid waste from door to door. Such vehicles are inexpensive and
easy to build and maintain. Under the prevailing fuel costs, it would be best if door to door collection can

DETAILED PROJECT REPORT FOR MUNICIPAL SOLID WASTE
COLLECTION & TRANSPORTATION
86
be carried out using muscle powered handcarts or tricycles.
Alternatively, there are small scale vehicles also that run on battery operated tricycles which can service
small areas and areas which are inaccessible to larger collection vehicles.
The advantage of using small vehicles is that they can travel and manoeuvre within small or limited spaces
as well as densely populated areas. They are also suitable to travel in areas that have little or no street
access. Another important advantage is that such vehicles are also suited to areas where relatively small
volumes of waste are generated by a large number of densely settled housing units. The disadvantages
include facts such as limited travel range when compared to fuel powered vehicles and that the person
riding the vehicles may be exposed to adverse weather conditions.
Hand Carts Tricycles
Tractor Trailer Auto Tipper
Non-compaction Trucks
Non-compactor trucks, a suitable alternative to compactors in areas where the waste generated is very
dense and do not require to be compacted. Such vehicles are most suitable to small cities/towns where the
roadways are not broad enough for large compactors.
Non-compactor vehicles need to have a waste dumping mechanism to facilitate the easy discharge of solid
waste. Open trucks or tractors with trailers can lead to other issues such as waste spillage during
transportation as well as rain soaking the waste which can cause aesthetic and health related problems. In
addition to this such vehicles can also be compartmentalized to facilitate the collection of segregated waste
streams from various sources.
Non-compactor trucks are ideal in the case of wet or dense waste which makes it difficult for the waste to
be compacted. Though, the initial capital investment may be high, these vehicles can usually operate with
a few waste collectors. Non-compactor trucks are also ideal for collection on longer routes.
However, there are a few disadvantages in adopting this technology in the case of Bulandshahar. These

DETAILED PROJECT REPORT FOR MUNICIPAL SOLID WASTE
COLLECTION & TRANSPORTATION
87
include factors like the requirement for regular and scheduled maintenance, need for specialized local
maintenance and repair expertise. In addition to this, at least one or two vehicles will have to be on standby
to be used during downtimes.
Tractor Trailers Tipper Trucks
Compactor Trucks
Two main types of compactors are used in the world, the fore-and-aft semi-compaction tipper with press
plate and the rear-loading hydraulic-compactor. These are mostly suited and used by developed countries
where they are considered to be the best waste collection and transportation technology. Compactor trucks
are usually best for wastes which are less dense in nature and require to be compacted. This technology
can be used to reduce waste volumes using hydraulic or mechanical pressure.
A stationary type compactor is capable of being transported from one location to another and placed at any
place for the refuse collection, compaction & transferring. It is to come as integral unit incorporating the
container and the compaction unit. The compactor to be such that can be transported by a specially
designed hook loader unit mounted on a truck chassis.
However, compactors are often ineffective in situations where the waste is already very dense and moist.
This makes compactors inappropriate to developing nations. One major drawback of compactors is that the
initial capital cost of vehicles is very high and that maintenance work needs to be carried out regularly in
order to minimize breakdowns. As seen during the field visits, the BNPP already possesses one compactors
but sometimes this vehicle is often off-road due to breakdowns.
In addition to this compactors are high fuel consuming vehicles raising the operating costs to a great
extent. They also require well paved streets which are wide enough to allow passage and turning.
Regular Compactor Stationery Compactor

DETAILED PROJECT REPORT FOR MUNICIPAL SOLID WASTE
COLLECTION & TRANSPORTATION
88
8.2.4 Waste Collection Route Design and Operation
To design an optimal collection system means going beyond having the latest and the most efficient
collection vehicle/technology. Several factors have to come together and work simultaneously to optimize
waste collection.
These factors include a well-chosen waste collection frequency, a suitable time of collection avoiding
times when the streets are crowded and ensuring that all residents in the area receive the collection
service at least once a week.
The “Just in time” waste collection system is also a good system which allows residents to bring out their
waste at the time the collection vehicle reaches their area. A bell or horn can be used by the collector to
announce his arrival and to indicate that the waste should be brought out. However, for this system to
work best at least one person has to be home during the day or at the time when collection vehicle comes
by.
8.3 Road Map for Waste management

DETAILED PROJECT REPORT FOR MUNICIPAL SOLID WASTE
COLLECTION & TRANSPORTATION
89
8.4 Waste Recovery and Reuse Technologies
Waste recovery can be carried out in several processes including the separation of the solid waste components and the processing of these components and transformation that alter the form of the waste. The materials separated from the solid waste can be use directly as a raw material for manufacturing and reprocessing or as feedback biogas production are discussion later on, this section will focus mainly on technologies that are used to recover and reuse non biodegradables waste streams.
8.4.1 Intermediate Processing Technologies
Recovery of waste can only be carried out if the waste is properly collected, separated, reduced to a
suitable size and cleaned to be free of any contamination. Prior to discussing the actual recycling
technologies, it is best to identify technologies available to process the waste to be suitable for recycling.
8.4.2 Recycling Technologies
Recycling is the process of converting waste materials into new materials and objects. It is an alternative to "conventional" waste disposal that can save material and help lower greenhouse gas emissions. Recycling can prevent the waste of potentially useful materials and reduce the consumption of fresh raw materials, thereby reducing: energy usage, air pollution (from incineration), and water pollution (from land filling).
Recycling is a key component of modern waste reduction and is the third component of the "Reduce, Reuse, and Recycle" waste hierarchy.[1][2] Thus, recycling aims at environmental sustainability by substituting raw material inputs into and redirecting waste outputs out of the economic system.[3]
There are some ISO standards related to recycling such as ISO 15270:2008 for plastics waste and ISO 14001:2004 for environmental management control of recycling practice.
Recyclable materials include many kinds of glass, paper, and cardboard, metal, plastic, tires, textiles, and electronics. The composting or other reuse of biodegradable waste—such as food or garden waste—is also considered recycling.[4] Materials to be recycled are either brought to a collection center or picked up from the curbside, then sorted, cleaned, and reprocessed into new materials destined for manufacturing.
In the strictest sense, recycling of a material would produce a fresh supply of the same material—for example, used office paper would be converted into new office paper or used polystyrene foam into new polystyrene. However, this is often difficult or too expensive (compared with producing the same product from raw materials or other sources), so "recycling" of many products or materials involves their reuse in producing different materials (for example, paperboard) instead. Another form of recycling is the salvage of certain materials from complex products, either due to their intrinsic value (such as lead from car batteries, or gold from circuit boards), or due to their hazardous nature (e.g., removal and reuse of mercury from thermometersand thermostats).
Read from Manual as well as from different web sources.
Benefits from waste recycling –
We stop dumping. Dumps emit 3–10% of human GHGs. They also pollute and waste the rare materials we need to survive. We can also get all the hydrocarbons we need from our wastes, which is the ONLY way we will get off fossils. Hydrocarbons from our wastes is the missing piece of the 100% renewable, fossil free puzzle. Solar, wind and hydrocarbons from our wastes is all the energy humans will need for a billion years. It’s Cheaper, and thousands of times cleaner.
The environmental benefits. Recycling can significantly reduce the emission of greenhouse gases. It can save on non-reusable resources as well as water and landfill space, and most of all it can save energy. So, recycling reduces emissions, conserves energy, and reduces pollution.
Solid waste recycling is very beneficial for the environment and to fight against global warming, They use less amount of energy for making new products, save natural resources, benefit for our economy and they reduce 30% greenhouse gas emissions as much as reducing 25 million cars from the road.

DETAILED PROJECT REPORT FOR MUNICIPAL SOLID WASTE
COLLECTION & TRANSPORTATION
90
Factor to be consider for recycling
Public participation in recycling programs is one of the most important factor deciding the program’s success. A well planned public education and involvement program structure, along with broad with const. education on how to participate and recycle, will lead to public support and participation in a community – based recycling program. The following program option have been shown to increase public participation in recycling program. :-
Mandatory participation.
Collection on individual homes and business instead of having people drop-off their recyclables at a collection bin or centre.
Provision of special containers.
Collection of recyclable on the same as a regular trash pick up.
Comprehensive and integrated public education.
Options for Recycling Recycling is a unique method for managing solid waste because it is very flexible and adaptable to any community’s situation. When considering a recycling program for any community, they must decide the best way for local resident and business to prepare recyclable for collection and best way to collect them. Local condition should be taken into account when considering a recyclable program. If community does not pick up the waste from individual homes, educating and encouraging individuals to take recyclable material to a drop off centre or collection bun will be very important part of the recyclable program. Recycling programs usually involve local residents and businesses separating certain materials(e.g. newspapers, paper, plastics, glass and aluminium, cans etc) from the rest of the garbage and placing each type of the material in a separate bin or bag. In some communities, recyclable materials are not separated by residents and businesses, but by at other drop off site, recycling centre or recovery facility. various type of recycling program that can be considered include-
Drop off centre and bin for recyclables
Buy-back centre.
Individual pickup
Special collection program. Table 8-1: Important Recycling Materials: Advantages and Drawbacks
Material Advantages Drawbacks
Paper
Paper can be easily recycled; however, quality deteriorates with each cycle.
Paper or cardboard from recycled paper requires less energy to produce and protects forests.
Appropriate technologies with circular processes are required to protect the environment.
Glass has a moderate market value.
It can be sorted into colors and melted.
Use of recycled glass saves energy compared with processing raw material.
Glass can be recycled infinitely because it does not deteriorate from reprocessing.
Broken glass can contaminate and eliminate opportunities for recycling.
Glass
Other Metal
Scrap metal has a high market value (especially steel, copper, silver, and platinum).
It can be recycled indefinitely because it does not deteriorate from reprocessing.
High-value metals (such as copper and silver) are incorporated in electronic devices, but extraction can cause severe environmental impacts.

DETAILED PROJECT REPORT FOR MUNICIPAL SOLID WASTE
COLLECTION & TRANSPORTATION
91
Material Advantages Drawbacks
Polyethylene terephthalate
(PET)
It can be recycled if it is in segregated form otherwise it is waste.
Appropriate technologies circular processes to are required to protect the environment.
Other plastic such as polyethylene or polyvinyl chloride, can be recycled but has less value in the market than PET, the value depends on the recycling and manufacturing option within the vicinity.
Recycle required tailor made machinery.
Other Plastic
Aluminium
Aluminium has the high market value.
It can be easily recycled by shredding and melting.
It can be recycled infinite times because it doesn’t deteriorate from processing.
Recycle is possible only at plant.
Not easy to separate from the collection.
Batteries
Recycling recovers valuable market.
Recycling protect the environment from heavy metals such as lead, cadmium AND Mercury.
Large variation in type and size of batteries requires specific recycle processes.
Older batteries have high metals content.
Construction and
Demolition (C&D)
waste
Lower quantities of C&D waste could be used as filling material in low lying area.
Higher quantities of C&D waste can be crushed to gravel & reused in road construction.
Machinery required to for crushing is maintenance.
Recycled waste is valuable only if there is lack availability of other construction material.
Electronic Waste
Electronics waste contained high valued materials.
Electronics items can be dismantled recycle and reused
Metals are often cover with the polyvinyl chloride or resins which are often burned or smelted, cause toxic emission.
Most common recycled by composting or anaerobic digestion.
While composting need to better protection of that area because it’s foul smell and chances to transmission of disease.
Organic waste

DETAILED PROJECT REPORT FOR MUNICIPAL SOLID WASTE
COLLECTION & TRANSPORTATION
92
8.5 Strategic Action Plan (Policy, Voluntary and Technological Measures)
The SWM plan for Akbarpur commences with reduction of waste generation at source. This indicates that the quantity of waste to be disposed will become less and therefore the pressure on the other stages of the waste management cycle becomes less. The reduction at the point of generation focuses on prevention, reduction and reuse of materials ending up as waste. This strategy will bring financial savings to the generators and at the same time reduce the volume to be handles by the ABPNPP. This could be achieved by making suitable policy changes including enacting & enforcing regulations and economic tools, voluntary actions and technological actions. Policy changes and Economic tools
The policy changes should include supplier’s liability for all durable products and products containing
hazardous materials.
Enforcing the existing regulations on plastic thin films.
Subsides for environment friendly purchases.
Revised DPR for investment plan and technical specification for primary collection, secondary storage and transport to processing plant for Akbarpur. Voluntary actions Voluntary actions through awareness, training, communication and capacity building could provide the necessary platform to bring down the generation of waste at household levels as well as at commercial and industrial level. In addition the voluntary measures could be useful for providing the transition to implement policy changes.
Pay back system for all empty cans & bottles and also for other old household capital goods
such as electronic items and furniture by commercial houses.
Take back packaging of consumer goods as well as old household capital items and provide a
discount for the new purchases.
Technological options
Introduction to biodegradable packing materials.
Establishment of recycling stations.
8.5.1 Strategies for Waste Reduction One of the adverse factors in managing municipal solid waste is the mind-set of general public and society at large with respect to segregation of waste and also asserting their rights for a clean, hygienic and safe neighbourhood. Added to this, lack of awareness on waste minimization and benefits of recycling are also contributing factors. To ensure waste minimization and recycling, systematic guidelines need to be evolved an put in place by nagar panchayat. The changes to the current entire solid waste management approach starts from the separation of different waste at the point of generation. Therefore, this stage should be properly addressed with correct and effective policy measures, voluntary actions and technological changes. Policy changes and economic tools
Regulations banning mixing of hazardous waste with other wastes.
Enact regulation to separate different wastes at sources level an fines for not adhering to the practice.
Economic incentive to families who does the source segregation.
Voluntary actions
Establishment of monitoring system by citizen’s committees to ensure source separation.
Awareness raising through NGOs/CBOs for all the waste generators for maintaining clean and healthy
surroundings.
Regulator meetings with religious places, schools and commercial organizations on source
segregation.
Technological options
Free bags for separation of different wastes for households.
Bins/bags at a subsidized rate for commercial institutes.
Container/bin for separation of hazardous wastes.
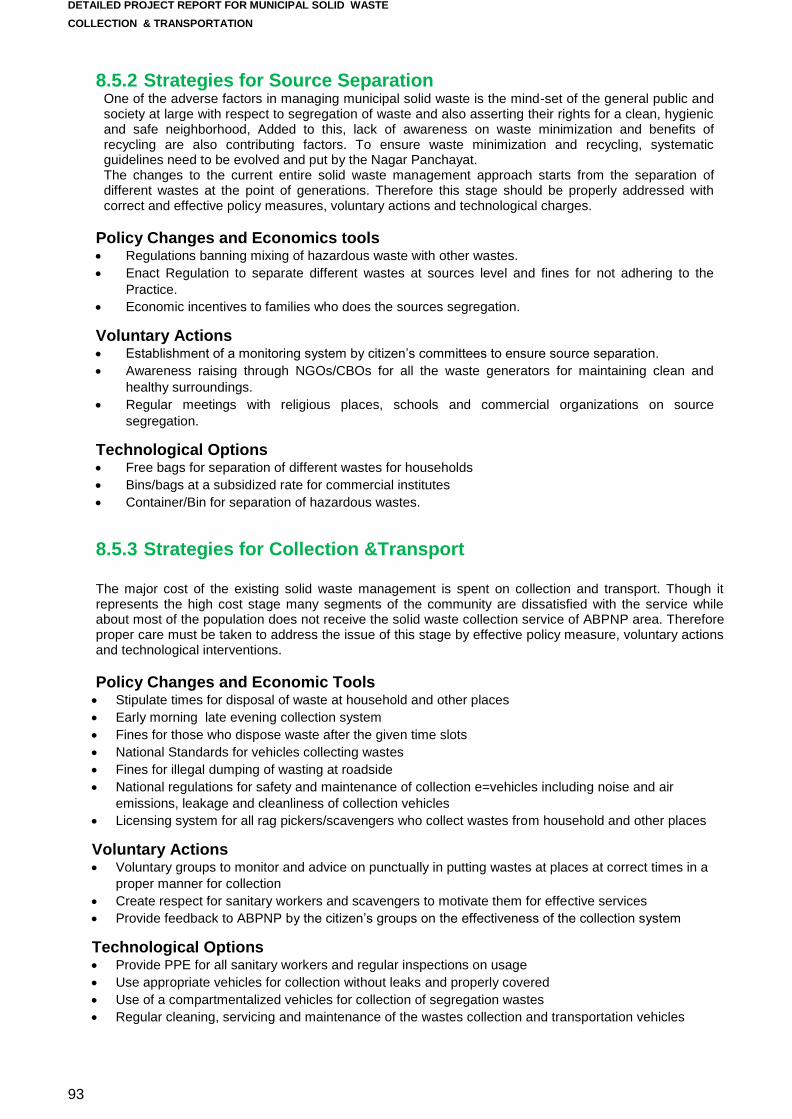
DETAILED PROJECT REPORT FOR MUNICIPAL SOLID WASTE
COLLECTION & TRANSPORTATION
93
8.5.2 Strategies for Source Separation One of the adverse factors in managing municipal solid waste is the mind-set of the general public and society at large with respect to segregation of waste and also asserting their rights for a clean, hygienic and safe neighborhood, Added to this, lack of awareness on waste minimization and benefits of recycling are also contributing factors. To ensure waste minimization and recycling, systematic guidelines need to be evolved and put by the Nagar Panchayat. The changes to the current entire solid waste management approach starts from the separation of different wastes at the point of generations. Therefore this stage should be properly addressed with correct and effective policy measures, voluntary actions and technological charges.
Policy Changes and Economics tools Regulations banning mixing of hazardous waste with other wastes.
Enact Regulation to separate different wastes at sources level and fines for not adhering to the
Practice.
Economic incentives to families who does the sources segregation.
Voluntary Actions Establishment of a monitoring system by citizen’s committees to ensure source separation.
Awareness raising through NGOs/CBOs for all the waste generators for maintaining clean and
healthy surroundings.
Regular meetings with religious places, schools and commercial organizations on source
segregation.
Technological Options Free bags for separation of different wastes for households
Bins/bags at a subsidized rate for commercial institutes
Container/Bin for separation of hazardous wastes.
8.5.3 Strategies for Collection &Transport
The major cost of the existing solid waste management is spent on collection and transport. Though it represents the high cost stage many segments of the community are dissatisfied with the service while about most of the population does not receive the solid waste collection service of ABPNP area. Therefore proper care must be taken to address the issue of this stage by effective policy measure, voluntary actions and technological interventions.
Policy Changes and Economic Tools Stipulate times for disposal of waste at household and other places
Early morning late evening collection system
Fines for those who dispose waste after the given time slots
National Standards for vehicles collecting wastes
Fines for illegal dumping of wasting at roadside
National regulations for safety and maintenance of collection e=vehicles including noise and air
emissions, leakage and cleanliness of collection vehicles
Licensing system for all rag pickers/scavengers who collect wastes from household and other places
Voluntary Actions Voluntary groups to monitor and advice on punctually in putting wastes at places at correct times in a
proper manner for collection
Create respect for sanitary workers and scavengers to motivate them for effective services
Provide feedback to ABPNP by the citizen’s groups on the effectiveness of the collection system
Technological Options Provide PPE for all sanitary workers and regular inspections on usage
Use appropriate vehicles for collection without leaks and properly covered
Use of a compartmentalized vehicles for collection of segregation wastes
Regular cleaning, servicing and maintenance of the wastes collection and transportation vehicles

DETAILED PROJECT REPORT FOR MUNICIPAL SOLID WASTE
COLLECTION & TRANSPORTATION
94
8.5.4 Strategies for Transfer Stations /Sorting Centres
The proposed transfer stations and sorting centers are to facilitate the segregation for wastes by scavengers/other micro industrialists for recovery of useful resources. This will prevent any organic and non-organic wastes ending up in landfill site but these recoverable wastes will be directed to recycling stations or treatment plants.
Policy Changes and Economic Tools Transfer stations/sorting centers to handle only specified wastes
Hazardous wastes should not be allowed at transfer stations/sorting centers
Have separate areas for e-waste, plastics and paper in sorting centers
Dedicated transfer station for meat/fish wastes as well as hazardous wastes before safe disposal
All transfer station/sorting centers to be operated according to national environmental regulations in
force
Voluntary Actions NGOs/CBOs to handle transfer stations/sorting centers with cleaning facilities for workers
Awareness raising and environmental education to communities and special groups such as school
children at these centers
Cleanliness, safety and health to be given highest priority
Technological Options Equipped at transfer station/sorting centers with cleaning facilities for workers
Transfer stations to have proper layout plan
Regular transferring of these wastes to other stations such as exchange centre/recycling
plants/disposal.
8.6 Involvement of stakeholders
Lack of awareness among the waste generators, untrained workers in urban local bodies, etc .are
some of the main hurdles in the waste handling system. Participation of private organizations, self-
help groups, NGOs etc. in waste handling is important for making city clean and green with a healthy
environment. Nagar Palika Parishad authority to drive initiatives for educating and creating
awareness in the community on basics of waste handling at household level, shops and
establishments.
8.6.1 Nagar Palika Parishad
In association with the political team/councillors, the local Nagar Palika Parishad authority to enforce a mandatory resolution on source segregation keeping in view of the prevailing local conditions.
Shall organize periodic awareness programs to encourage source segregation. They shall undertake phased programs to ensure active participation in waste segregation.
To facilitate the waste generators with proper bins and collection system at regular intervals.
To improve the existing waste collection and transportation system in respect of required team, sufficient equipment /vehicles, monitoring mechanisms, etc.
To identify NGOs who show their presence & acumen in the respective locality, who actually extend their support in improving the waste collection and transportation practices and capable of motivating people with their activities.
Regular meetings shall be arranged with different associations and NGO’s representatives headed by Executive Officer and other waste management officers.
Ensure involvement of school & colleges in the awareness campaign.
Spread awareness with the help of print and electronic media.
To educate community and sanitary team including workers about the importance and need

DETAILED PROJECT REPORT FOR MUNICIPAL SOLID WASTE
COLLECTION & TRANSPORTATION
95
for source segregation. Strictly supervise the segregation at source campaign.
Strictly enforce penalty to the waste generator who are giving mixed waste to the sanitary workers
8.6.2 Non-Governmental Organization (NGOs) / Community based
Organization (CBOs) / Private parties
These are generally involved in collection of wastes from different sources of generation.
In consultation with Executive Officer of the ULB, shall carry out and organize awareness
programs for residents and other stakeholders to motivate them for source segregation.
Help in educating people to participate in the source segregation campaign
NGOs to provide a prominent support to informal sector waste workers and enterprises to
organize themselves to improve working conditions and facilities. And also make them
understand about increasing their earnings and access to essential social services such as
health care and schooling for their children.
To promote the welfare of rag pickers. To involve rag pickers in door-to-door collection and
source segregation of waste. Educate and motivate rag pickers to collect recyclables
Organize seminars, workshops at schools and college level to educate and motivate students
about MSW handling and management.
Help ULB authority in preparing and imposing the action plans.
To explore and provide new initiatives and methods for improving the system
8.6.3 Politicians/ Councilors
Ensure full support to the ULB authority in strictly imposing laws and penalties.
Should pass by laws to make segregation mandatory with stringent penal provision.
To motivate local residents and other stakeholders to take healthy participation in campaign.
Should monitor the ground works of MSW management by field visits at regular intervals.
Shall lead the campaign of source segregation.
8.6.4 Residents/Community
Community participation plays a vital role in segregation of waste at source and 100% source
segregation is possible only with the active participation of community generating waste.
Waste generated shall be segregated initially as wet & dry waste and stored in two separate
bins – one for wet/biodegradable waste and second for dry/Non-Biodegradable waste. Major
portions of recyclables and hazardous waste to be handed over separately.
Active participation in segregation at source campaigns and motivating one another.
To educate neighbours about the importance of source segregation & motivate them for
active involvement and participation.
Shall be responsible from segregation of waste till handing over the waste to the collector/
sanitary worker.
8.7 Campaign Models and Enforcement Plans for Awareness among Citizens
Comprehensive training programs and massive campaigns for raising awareness among civic-body
administrators, health team, and municipal team shall be taken up by the ULB in association with
NGOs/CBOs etc.
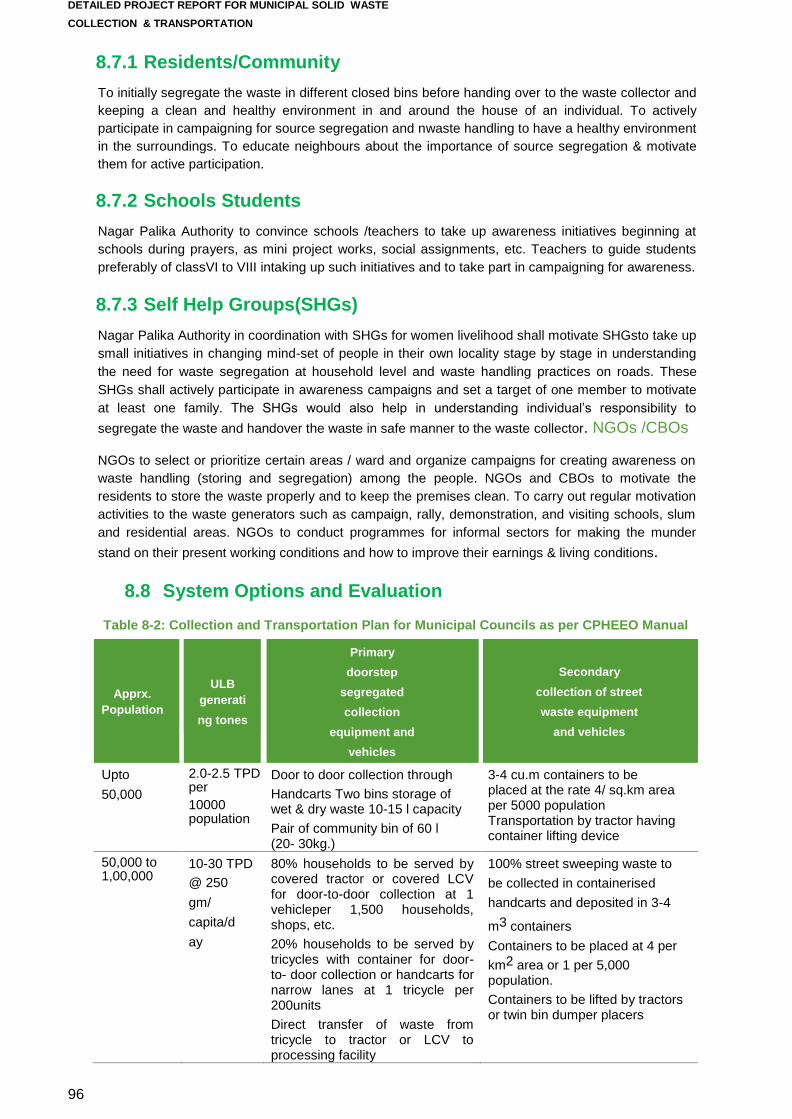
DETAILED PROJECT REPORT FOR MUNICIPAL SOLID WASTE
COLLECTION & TRANSPORTATION
96
8.7.1 Residents/Community
To initially segregate the waste in different closed bins before handing over to the waste collector and
keeping a clean and healthy environment in and around the house of an individual. To actively
participate in campaigning for source segregation and nwaste handling to have a healthy environment
in the surroundings. To educate neighbours about the importance of source segregation & motivate
them for active participation.
8.7.2 Schools Students
Nagar Palika Authority to convince schools /teachers to take up awareness initiatives beginning at
schools during prayers, as mini project works, social assignments, etc. Teachers to guide students
preferably of classVI to VIII intaking up such initiatives and to take part in campaigning for awareness.
8.7.3 Self Help Groups(SHGs)
Nagar Palika Authority in coordination with SHGs for women livelihood shall motivate SHGsto take up
small initiatives in changing mind-set of people in their own locality stage by stage in understanding
the need for waste segregation at household level and waste handling practices on roads. These
SHGs shall actively participate in awareness campaigns and set a target of one member to motivate
at least one family. The SHGs would also help in understanding individual’s responsibility to
segregate the waste and handover the waste in safe manner to the waste collector. NGOs /CBOs
NGOs to select or prioritize certain areas / ward and organize campaigns for creating awareness on
waste handling (storing and segregation) among the people. NGOs and CBOs to motivate the
residents to store the waste properly and to keep the premises clean. To carry out regular motivation
activities to the waste generators such as campaign, rally, demonstration, and visiting schools, slum
and residential areas. NGOs to conduct programmes for informal sectors for making the munder
stand on their present working conditions and how to improve their earnings & living conditions.
8.8 System Options and Evaluation
Table 8-2: Collection and Transportation Plan for Municipal Councils as per CPHEEO Manual
Apprx.
Population
ULB
generati
ng tones
Primary
doorstep
segregated
collection
equipment and
vehicles
Secondary
collection of street
waste equipment
and vehicles
Upto
50,000
2.0-2.5 TPD per
10000 population
Door to door collection through
Handcarts Two bins storage of wet & dry waste 10-15 l capacity
Pair of community bin of 60 l (20- 30kg.)
3-4 cu.m containers to be placed at the rate 4/ sq.km area per 5000 population Transportation by tractor having container lifting device
50,000 to 1,00,000
10-30 TPD
@ 250
gm/
capita/d
ay
80% households to be served by covered tractor or covered LCV for door-to-door collection at 1 vehicleper 1,500 households, shops, etc.
20% households to be served by tricycles with container for door-to- door collection or handcarts for narrow lanes at 1 tricycle per 200units
Direct transfer of waste from tricycle to tractor or LCV to processing facility
100% street sweeping waste to
be collected in containerised
handcarts and deposited in 3-4
m3 containers
Containers to be placed at 4 per
km2 area or 1 per 5,000 population.
Containers to be lifted by tractors or twin bin dumper placers

DETAILED PROJECT REPORT FOR MUNICIPAL SOLID WASTE
COLLECTION & TRANSPORTATION
97
Apprx.
Population
ULB
generating
tonnes
Primary
doorstep
segregated
collection
equipment and
vehicles
Secondary
collection of street
waste equipment
and vehicles
1,00,000 to 5,00,000
25-150 TPD 75% door-to-door collection through covered LCV
25% door-to-door collection through containerised tricycles or handcarts from narrow lanes
Direct transportation of waste to processing facility if distance is under 5 km, or transportation through compactors if distance of processing facility islonger
Compactors to be deployed based on capacity of vehicle and volume or weight ofwaste
Street sweeping and silt from the drains may be collected in containerised handcarts and taken to secondary storage depot having 1.1– 4.0 m3 metal containers.
Containers to be placed at 4 per
km2 area or 1 per 5,000 population.
Containers to be lifted by twin bin dumper placers or refuge collector or compactor machines.
Dumper placers and compactors based on capacity of vehicle and volume or weight of waste
Source: Table 2.4: MSW Management Plan for Municipal Councils and A, B, C class cities14 CPHEEO Manual, Page 183
8.8.1 Waste Segregation
The term segregation in municipal solid waste management system indicates separation and
storage of individual constituents of waste material. The main objectives of segregation are; (i) storing
of recyclables separately for reuse, (ii) storing of organic portion separately for further processing,
and (iii) waste minimization for final disposal to landfill sites. The options for segregation of waste are
discussed as under and further detailed out in Table8-3.
Option 1: Segregation at Source: This option requires waste
generators to segregate waste at source in to biodegradable (wet)
and non-bio degradable (dry) waste and to store waste effectively
in appropriate containers. Also, suitable bins/bags for hazardous
waste.
Option2: Segregation at processing/ disposal facility: In this option waste is not segregated
at source and all wastes are collected through the common waste collection system. The waste is
segregated at the treatment/ disposal facility for pre-sorting of waste for appropriate treatment,
recover recyclable materials and reduce burden on landfill facility.
Table 8-3: Options for Waste Segregation
Options Advantages Disadvantages Recommended Option
Option 1: Segregation at Source
Helps channelizing
different waste stream for reuse, recycling, processing ordisposal
Reduces cross contamination of waste
Increase in manpower and cost for infrastructure
Requires significant community participation/effort
Segregation will require significant education
Awareness campaigns and IEC campaigns are prerequisite for implementation of segregation at source. Therefore, as of now segregation at processing/disposal facility is recommended.

DETAILED PROJECT REPORT FOR MUNICIPAL SOLID WASTE
COLLECTION & TRANSPORTATION
98
Option 2: Segregation at processing/ disposal facility
Reduces manpower and infrastructurecost
Easy toimplement
Increased efficiency through reduced handling & logistical requirement
Recovery of
recyclable material is significantlyless
Ideally, segregation of waste at source must be accorded the highest priority. However, it requires
significant community participation effort and behavioural change in the citizens of Bulandshahar to
successfully implement it. To effective such changes within the society takes long time and it is difficult
to implement segregation of waste at source from day one. It is also observed that recyclable materials
with significant value normally do not reach the wastes treatment and collected separately through the
already existing informal recycling system. It is therefore recommended to adopt Option 2: Segregation
at processing/ disposal facility and subsequently focus on awareness generation and community
participation till a source segregation and collection system is established. Compatibility of types of
storage containers and handling are as follows.
Factors to be
Considered
Manual
Semi-Automated
Automated
Bins
Cost Effectiveness
Most cost
effective.
Minimum cost.
Makes manual
collection easy
Moderate cost for container. Makes collection more difficult for manual labour.
Cost effective under right conditions. Tricycle/handcrafts last 10 years and reduce collection costs.
Cost effective as collection work is minimized. Bins last many years with proper maintenance.
Health and Safety
Risk of injury to collectors from sharps in bags
Potential for back injury if container is overloaded. Repetitive lifting reduces worker longevity.
No lifting or exposure to waste.
Minimal risk of injury to user or service provider.
Potential health and safety risk to uses and collection workers due to high possibility of waste scattering.
Environmental
Appropriateness
Uses more natural resources. Potential source of litter.
Environmentally sound. Container use reduce litter potential. Reusing container saves resources.
Environmentally sound. Handcraft life saves resources.
Proper use eliminates litter.
Can be environmentally sound. High potential for overflow and negative impacts on the environment if not properly covered or serviced.
Effectiveness Effectine. Easy
for user and
collector to
handle
Very effective. Produce the desired positive effect of controlling waste at the source.
Very effective and convenient. Controls waste and reduces environmental impact.
Moderately effective. If properly designed, can be more effective.
Public Acceptance
Very high. Most convenient for public.
Not high acceptance as the public are used to using plastic bags.
No experience, since no application here.
Poor public acceptance as there are negative impacts such as odours, inconvenience, unsightly areas and pests.

DETAILED PROJECT REPORT FOR MUNICIPAL SOLID WASTE
COLLECTION & TRANSPORTATION
99
Efficiency Very efficient for user and collector.
Somewhat efficient. Moderately effective at a reasonable cost.
Highly efficient. Efficient to use and mechanical dumping increases collection productivity
Very efficient. Moderate cost.
8.8.2 Primary Waste Collection System
Primary waste collection refers to the points of generation (typically households, shops, markets and
hotels) in the municipality to secondary waste storage facilities. The key objectives of the primary
collection system are to:
Eliminating littering;
Servicing all generators; and
Keeping wastes contained.
Primary collection may include methods of door-to-door collection, and/or “community bin” systems
where generators who are not provided with door-to-door collection services bring their waste to
conveniently located bins in the neighbourhood.
The purpose of waste collection is to efficiently capture the waste stream and ensure it enters the
formal waste management system. Akbarpur must provide collection services and provide the
necessary support, through public awareness and education programs, to implement an effective
system. The public, as generators, are responsible for delivering their wastes to the system and to
ensure it does not end up as litter. Given these considerations, the options available for primary
collection are discussed as under and further detailed out in following section and Table8-4.
Option 1 - Community bin service: This option requires waste generators to deposit their waste
directly in community bins, strategically located throughout the municipality. The capacity of the bins
would be such to facilitate mechanized secondary collection. Although it does not provide door- to-
door collection, it meets the intent of the SWM Rules. To increase collection efficiencies and minimize
direct handling of waste, a key feature of this system would be the mechanization of the means of
emptying the collection bins. This option requires a significant change in behaviour and would only be
successful with full participation by the citizen.
Option 2 - Door-to-door collection supplemented with community bin service: A door-to- door,
daily collection services provided by the municipality for
most households, as well commercial and institutional premises,
to the extent possible. Community bins would also be positioned
in suitable locations in each ward where door-to-door collection is
not feasible, such as in slum and commercial/market areas, and
also to ensure that generators have convenient access to
disposal facilities at all times. In this case, the community bins
would also serve as temporary waste
storage facilities (secondary collection system) where wastes collected through the door-to-door
service would be deposited by tricycle operators during their daily rounds.
For the door-to-door collection service, a whistle or bell would be used by the waste collector to
indicate the arrival in a designated ‘beat’ or block.
Generators would carry their waste containers to the cart or
handed over them to the collector for disposal in the collection
vehicle. Waste collector, equipped with small collection vehicles
(e.g. handcarts/tricycle vans/auto tipper) outfitted with
containers, would collect wastes daily and transport the waste
to secondary waste storage facilities. Also, if in future, ABPNPP
implements segregation of waste at source system, this primary
collection system can be easily synchronized with the source
segregation system. Compatibility of collection frequency

DETAILED PROJECT REPORT FOR MUNICIPAL SOLID WASTE
COLLECTION & TRANSPORTATION
100
options are as follows.
Factors to be
Considered
Daily
Two Times a Week
Three Times a Week
Cost Effectiveness
Cost is high due to the requirement for increased labour and transportation capacity.
Least labour cost,but greater transport capacity needed depending on use of transfer stations
Labour cost is less, but transport capacity needed
Health and Safety
Minimal health risk Longer storage time at generation location increases public and worker health risks.
No obvious health/safety risks
Environmental
Appropriateness
Greatest use of fuel and other resources
Uses least natural resources.More illegal dumping and litter likely if personal storage capacity is limited.
Less resources use than daily collection.
Effectiveness Most effective as waste can be set out for collection and be removed everyday
May not be effective if residents forget collection days. May result in litter and illegal dumping if personal storage capacity is limited
It is difficult to schedule regular collection, unless staffs work 6 days per week
Public Acceptance
High level of convenience Low. Residents may be reluctant to store waste if there is no outside storage facility
Level of acceptance is medium
Efficiency Not efficient as excessive resources are required to collect small amounts of waste
Efficient for collectors but reduces service level for customers
Somewhat efficient. Moderately effective at a reasonable cost.
Option 3: Bin less collection system–The waste collected by the waste collectors in tricycle
rickshaws or auto tippers can be directly transferred to there fuse compactor in stead of
transferring to the dumper placer bins or bins
Compatible to are fuse compactor.
Bins overflowing with solid waste is an
eye sore in all the municipalities in
India; this option completely
eliminates the bins. In typical
collection & transportation system a
significant cost is involved in the
repair & maintenance of bins; this
option eliminates that cost. A lot of
space is required for placement of
bins on the pavement; a lot of space
is saved in this option.
This option is heavily dependent on the
Time synchronization between the waste collectors and the refuse compactors. This option
requires significant support from the local public. With regular and effective public awareness
campaign, this can be one of the options which can be implemented in the Akbarpur.

DETAILED PROJECT REPORT FOR MUNICIPAL SOLID WASTE
COLLECTION & TRANSPORTATION
101
Table 8-4: Options for Primary Collection of Waste
Options Advantages Disadvantages Recommendation
Option 1 - Community bin service
Lowest operating cost collection system
Provides waste collection to areas presently un-serviced or difficult to access
Meets SWM Rules
Requires significant community participation/effort
Segregation of waste at source will be difficult to implement in future
Unlikely to capture all the waste
Reduces employment opportunities
Resistance from people on bin placement
Littering on streets and around the bins
Low aesthetics
Based on the analysis Option 2 - door-to-door collection supplemented with community bins, is the
most desirable option. This option conforms most readily to the SWM Rules. It would provide the greatest convenience for the waste generator, and the greatest likelihood of compliance and synchronization with respect to source segregation system in future. As a result, it would minimize inappropriate littering and provide a cleaner, healthier and safer community. This system is also presently practiced in around 50% of the wards in Akbarpur.
Option 2 - Door-to- door collection supplemented with community bin service
Meets SWM Rules
Services all areas
Maximizes employment
Enables source-separation in future
Minimizes littering
Promotes clean environment/community
Improves community hygiene and health.
Potential increase in costs
Labour intensive
Dependent on community participation
Reduces vectors
Flexible
Builds on existing system/ collection approaches
Demonstrated locally
Improved collection system
Facilitates the
implementation of user fees
Option 3 – Bin less collection
Direct transfer of waste from the primary collection point to secondary collection vehicles promotes a bin less arrangement.
Successful only when synchronization with primary collection and coordination exist.
Aesthetic look increases for theplace
Requires significant community participation/effort
Potential increase in costs
Labour intensive

DETAILED PROJECT REPORT FOR MUNICIPAL SOLID WASTE
COLLECTION & TRANSPORTATION
102
A comparison of the total estimated capital and operation cost for all the three options is provided
in Table 8-5.
Table 8-5: Options for Primary Collection of Waste – Cost comparison
Options Unit Cost Total (Nos.) Remarks
Option 1 - Community bin service
INR 40000/bins of 1.1 cum and INR 95000/bins of 2.5cum
4 – 2.5 cum
18- 1.1 cum
Assuming some bins shall be lifted by refuse collector and some in dumper placer.
Option 2 - Door-to-door collection supplemented with community bin service
INR 18000 per Hand cart
INR 30000 per Tricycle
IRN 6lacs per Auto tipper
50 Hand cart 25 Tricycle Cart 6 auto tipper
Assuming both auto tipper and BOT Tricycle and hand cart can off load the collected waste into community bins as well as refuse collector.
Option 3 – Bin less collection
INR 6lacs/ auto tipper
INR 2lacs per BOT
INR 7.5lacs per Dumper Placer
IRN 13.5lacs per Refuse collector
7 Auto tipper
7 BOT
2 Dumper
Placer
1 Refuse
collector
Assuming both auto tipper BOT can off loaded collected waste into dumper placer and refuse collector.
Factors to be
Considered
Door to Door
Community bin
service
Bin less collection
Cost Effectiveness Expensive And Accurate.
Moderate in cost. Cheap And Almost inconvenient to service users.
Health and Safety Injuries to service crews as a result of carrying and climbing stairs with load.
Manual labour and injury risk reduce, especially with use of hand carts.
When compare to collection at buildings, waste pooling site can be dangerous to service user and crew, particularly if the sites are not properly designed.
Environmental
Appropriateness
Most environmentally sound. Control over the waste is very high. No waste is litter.
Environmentally sound, but if service is not frequent, some litter may remain around containers.
Potential for waste overflow, littering, insects, birds, rodents and communicable diseases.
Effectiveness Effective if the residents follow the rules i.e. must put waste outside door within restricted hours.
Very effective if hand-carts is used. Waste can be put out at convenient of residents.
Very effective if collection is properly scheduled.
Public Acceptance Very high. Most convenient for public.
Moderate and convenience.
Not very convenient. Residents complain in having to walk to the site, aesthe
Efficiency Not efficient from productivity standpoint.
Required the most labour and equipment and resources.
Very efficient, reduces the labour and vehicle requirements.
Low cost. Moast efficient , Depend on the collection frequency and citizen.

DETAILED PROJECT REPORT FOR MUNICIPAL SOLID WASTE
COLLECTION & TRANSPORTATION
103
Table 8-6: Primary Waste Collection Infrastructure_2018
Waste
Generation
in
2018(T
PD)
Nos. of
Tricycle
Handcarts
Nos. of
Tricycle
Rickshaws
Nos. of
Tricycle
Rickshaw
s (Battery
Operated)
Nos. of
Auto
Tippers
Community Bins (1.1m3 and
2.5 m3 capacity)
120 Kg/trip X
4 trips
150 Kg/trip X
4 trips
250 Kg/trip X 4 trips
750 Kg/trip X 3 trips
1.1m3 2.5m3
53.13 100 35 0 6 35 0
8.8.3 Secondary Waste Collection System
Option 1 – Refuse Compactor Trucks with Hydraulic Lift for Stationary Bins: In this option,
secondary Collection points would consist of medium size, covered bins (1.1m3capacity) placed in
designated locations as required. Some secondary collection points may need to be equipped with
more than one bin to accommodate the volume of waste anticipated at the point. Medium size, rear or
side loading compactor trucks, equipped with hydraulic lift units, would be used to collect waste from
the secondary points and transport it to the treatment and disposal facility.
Option 2 – Dumper Placer with Dumper Placer Containers: In this option, secondary collection
point would be equipped with dumper placer container and these containers are lifted by a hydraulic
mechanism and transported to the treatment and disposal site by specialized vehicles called Dumper
Placer (DP) Carrier. Dumper placer carriers collect the container transport it to waste treatment &
disposal site, empty the container and return it to their original location. The key advantage of the
closed containers is that they are easier to use and transport. This system is good for collecting waste
from bulk generating sources such as markets/ commercial areas and is also used presently by
AbpNPP.
Option 3 – Transfer Station/Static compactor with Hook loader Trucks: In this option, secondary
collection point would consist of large enclosure (typically like a small room) with or bins. Waste from
primary collection are deposited in the transfer station and transferred to the treatment & disposal site
using static compactors. Hook loaders with bins of 8-10 m3 capacity shall be used for transportation
of waste to the processing facility. The waste is required to be loaded on to the bins either manually
or using front end loader.
Option 4 - Underground waste collection system: In this option, the entire secondary collection
system to receive the waste collected in primary collection system is underneath the ground to
provide more space for storage of waste. In this option, waste container is hidden underground and
the surroundings of the waste receptacle stay clean. The waste compactor is lowered hydraulically
underground, away from the sight. For unloading the compactor is lifted above the ground for
emptying.
Based on the analysis above, a combination of Option1 and Option2 is the most desirable option.
Both is options conform most readily to the SWM Rules. It would provide a synchronized system for
secondary storage, collection and transfer of waste to the treatment and disposal facility minimizing
handling and direct contact with waste.
Option 1 – Refuse Compactor Trucks with Hydraulic Lift for Stationary Bins will be used for secondary
storage and transfer of waste generated from residential sources. Stationary bins will be strategically
located within the wards to deposit the waste after primary collection. The bins will also act as primary
collection points mainly in slum areas which are inaccessible under door-to-door collection system.
The stationary bins will by hydraulically emptied into the refuse compactor truck for transfer to the
treatment and disposal site.
Option 2 – Dumper Placer with Dumper Placer Containers will be used for secondary storage and
transfer of waste generated from vegetable/ fruit markets, commercial areas and establishment such

DETAILED PROJECT REPORT FOR MUNICIPAL SOLID WASTE
COLLECTION & TRANSPORTATION
104
as hotels and restaurants. Dumper placer container will be placed in markets and commercial areas
and the generators are required to deposit the waste in this container which will subsequently be lifted
hydraulically and transferred to the treatment and disposal site by Dumper Placer vehicle for emptying
the container. The Dumper Placer vehicle will leave an empty container at the location and take away
the container filled with waste.
Combination of option1 and option2 is suggested for the Akbarpur. The cost option for the feasible
option is provided in Table8-8.
Table 8-8: Options for Secondary Waste Collection System – Cost Comparison
Options
Unit Cost Total (Nos.)
Total (Rs.)
Option 1 – Refuse Compactor/Collector Trucks with Hydraulic Lift for Stationary Bins
13.5lacs 1 13.5lacs
Option 2 – Dumper Placer with Dumper Placer Containers
7lacs 2 7lacs
8.8.4 Street Sweeping
Option 1: Manual Street Sweeping
This option involves manual sweeping of street using equipment’s like shovel, brooms and tricycles.
Option 2: Street Sweeping Using Mechanical Sweepers
This option uses mechanical cleaning & vacuum suction to sweep road, saves time and labour
required for sweeping and also improves the sweeping quality. Mechanical street sweepers utilize
brooms and belt conveyor to move debris from the ground into a hopper and are efficient in picking up
wet leaves, large aggregate particles, small limbs, smashed cans, etc. High capacity sweepers can
even pick up large chunks of debris & remove hard packed dirt. Table 8-9 shows the street sweeping
norms and Table 8-10 shows comparison of the options for street sweeping and recommends the
system.
Table 8-9: Street Sweeping Norms for Small towns or Small Cities or Mega Cities
Component Small Town Medium City Mega City
Equipment’s
Long handled broom
Metal tray and metal plate
Containerized handcart or tricycle
Tractor with covered trolley
Container lifting device
Long handled broom
Metal tray and metal plate
Containerized handcart or tricycle
Secondary storage bin
Dumper placer or compactor
Mechanical street sweeper
Long handled broom
Metal tray and metal plate
Containerised handcart or tricycle
Secondary storage bins
Dumper placer or compactor
Container lifting device

DETAILED PROJECT REPORT FOR MUNICIPAL SOLID WASTE
COLLECTION & TRANSPORTATION
105
Container lifting device
Mechanical street sweeper
Component Small Town Medium City Mega City
Staff
requirement
based on
road density
High density roads: 1 person per 300 – 350 running meters of road length
Medium density roads: 1 person per 500 running meters of road length
Low density roads: 1 person per 750 – 1,000 meters of road length
High density roads: 1 person per 300 – 350 running meters of road length
Medium density roads: 1 person per 500 running meters of road length
Low density roads: 1 person per 750 – 1,000 meters of road length
High density roads: 1 person per 300–350 running meters road length
Medium density roads: 1 person per 500 running meters of road length
Low density roads: 1 person per 750–1,000 meters of roadlength
Source: MSWM Manual 2016
Table 8-10: Option for Street Sweeping
Particulars
Option 1 – Manual Street
sweeping
Option 2 – Mechnical
Street Sweeping
Recommended Option
Advantage
Accuracy of sweeping is high.
It is fast and covers wide area.
For small and narrow street, manual sweeping should be use.
And for wide area mechanical sweeping should be use.
It takes more time.
Accuracy is less as compare to manual sweeping.
Disadvantage
Manual street sweeping shall be undertaken after taking in to consideration the following requirements:
Each sanitary worker shall do the sweeping and the cleaning of the tertiary and road side
drains and transfer the sweepings into the bins of the push cart and subsequently deposit it
into the secondary containers/ bins kept at the intersection of sweeping routes.
Separate sanitary workers equipped with appropriate implements may do de-silting of larger
drains.
Part of the street sweeping can be outsourced to women SHGs or other agencies through a
transparent process

DETAILED PROJECT REPORT FOR MUNICIPAL SOLID WASTE
COLLECTION & TRANSPORTATION
106
Sanitary services should not suffer due to absence of any sanitation worker. Therefore,
adequate manpower should be available for manual street sweeping.
8.8.5 Medical Waste
Few of the hospitals and nursing homes are complying with the provisions of the Biomedical Waste
(Management and Handling) Rules 2016, namely the segregation/collection of waste in color-coded
plastic bags and finally handed over the private agency.
SYSTEM DESIGN AND INFRASTRUCTURE ASSESSMENT
The objective of any MSW treatment initiative should be to minimize the waste quantity delivered to
the processing plant and landfill. Reduce, reuse, recycle and recover concept shall be adopted to
reduce the waste generation. The paper, plastics, glass and metals etc. can be reused and recycled.
This will enable us to save the valuable resources, while saving energy for equivalent quantity of
resources can be extracted from organic portion of waste and used, whereas the inert can be
delivered to landfill.
The report has brought out the key issues of proper technology selection for MSW for identifying and
assessing several treatment technological options available for particular waste composition of the
NPP area. The evaluation with the commercial viability and technical feasibility of different alternatives
and recommendation of the best suitable option(s) for treatment will increase the efficiency of solid
waste disposal system.

DETAILED PROJECT REPORT FOR MUNICIPAL SOLID WASTE
COLLECTION & TRANSPORTATION
107
CHAPTER 9:
Proposed Waste Management System

DETAILED PROJECT REPORT FOR MUNICIPAL SOLID WASTE
COLLECTION & TRANSPORTATION
108
9.1 Proposed Waste Management System
The options analysis has resulted in the identification of are commended system, the high lights of
which are as follows:
Primary Waste Collection
Door-to-door collection service supplemented with community bin services for residential areas;
Tricycles/handcart/battery operated tricycle with containers are used for primary collection
Auto tipper are generally used for hotels, market areas; and
Segregation of waste is done by providing separate bins
Optimise vehicle usage by scheduling waste collection from different sources.
Secondary Waste Collection
Compactor with Hydraulic Lift for stationary bins from residential areas; and
Dumper Placer with Dumper Placer bins for markets and commercial area
Collection of street sweeping waste Auto tipper.
The schematic diagram and route map of the proposed scheme for collection and transportation to
processing plant is shown in Figure 9-1 and Figure 9-2.
Figure 9-1: Proposed Scheme for Collection and Transportation

DETAILED PROJECT REPORT FOR MUNICIPAL SOLID WASTE
COLLECTION & TRANSPORTATION
109
9.2 Basic Design – Waste Collection &Transportation
9.2.1 Primary Collection
The function of primary waste collection is to collect waste from households and market/commercial
areas in a manner that is operationally efficient, convenient for residents and minimizes nuisance and
public health risks through effective waste containment and reduced waste handling. Provision of
primary collection services is necessary to ensure that waste is not disposed of on the streets, in
drains or in the water bodies.
The basic design concept developed for primary collection includes the following elements:
Door to door collection will be performed each morning for residential areas which are
accessible through door-to-door collection, as well as hotels and restaurants -generators.
Two separate household bins will have to be provided for Segregated (wet and dry) waste
collection.
Inaccessible areas specially slum areas, vegetable/ fruit markets and other commercial
generators will deposit the waste in the community bins or secondary collection points.
Residents are alerted to the primary collector’s presence by whistle, and bring their waste to
the collector on the street. Distances that residents travel to reach the collector may vary
based on the road access in a particular area.
Primary Collectors deposit waste received from households in plastic bins contained on a
tricycle rickshaw, handcart and battery-operated tricycles. Each tricycle will be equipped with
a set of six containers of 150 liters capacity each and handcart will be equipped with a set of
six containers of 120 litre capacity each.
Auto tipper will be used for collection of waste from primarily hotels/restaurants and market
areas.
Primary Collectors deposit collected waste in designated containers at secondary collection
points.
A ratio of two workers per tricycle/handcart and two workers per auto battery-operated
tricycles and two workers for auto tipper has been assumed. It is noted that this assumption
does not provide for typical staffing related shortfalls, such as absenteeism, illness and
vacation time.
Average life for handcart, tricycles, battery operated tricycle has been considered 5 years and
auto tipper has been considered as 10years.
9.2.2 Secondary Collection and Transportation
The function of the secondary collection system is to consolidate and store the waste collected by the
primary collection system prior to transport to treatment and disposal site. Additionally, the secondary
collection points provide collection capacity for municipal wastes generated that are not captured by
the primary collection system.
The basic components of the secondary collection system design are as follows:
Primary collectors bring the waste collected from households to secondary collection points
distributed strategically throughout the NPP area. Inaccessible area specially slum
households

DETAILED PROJECT REPORT FOR MUNICIPAL SOLID WASTE
COLLECTION & TRANSPORTATION
110
will deposit waste at community bins/ secondary collection points located within accessible
distance from the slum areas.
Each secondary collection point in residential areas will have one covered 1100 litre capacity
bins with lifting facilities for emptying into the refuse compactor
Refuse compactor of 8 m3 capacity is recommended for collection waste from the 1100 litre
bins daily. Each refuse compactor will make 3 trips per day.
For each secondary collection point in market and commercial areas will have one covered
dumper placer container of 2500 litre capacity. Waste collected from hotels/restaurants using
auto tipper will also deposit the waste in these dumper placer container
Dumper placer containers are removed daily for transfer to treatment and disposal site.
Empty containers are returned to the secondary collection point on another collection trip.
Street sweeping waste will be collected using tractor trailer/ tipper trucks
Average life for bins is considered as 5years; average life for auto tipper and vehicles has
been considered as 10years.
For man power planning, one driver and one helper per vehicle is assumed. Helper should
help the waste collection from the secondary collection points. Supervisory staff has been
assumed as one for each ward.
Sweeping of the roads in the Nagar Palika shall be carried out both by manual as well as
mechanical sweeping.
The estimated primary and secondary collection equipment’s and vehicles required for Akbarpur is
summarized in Table 9-1.
Table 9-1: Total Vehicles or Equipment’s Requirement for Primary & Secondary Collection and
Transportation
Sl.
No.
Item
2018
2023
2028
2033
2038
1 12 L HH Bins 34180 35205 36264 37351 38471
2 Hand cart with bins 50 100 - 150 -
3 Tricycle with bins 25 75 - 100 -
4 Community Bin with capacity 2.5 cum
4 - 6 -
5 Community Bin with capacity
1.1 cum 28 - 30 - 32
6 Battery Operated Tricycles 7 - 10 - 15
7 Auto Tipper 7 - 10 - -
8 Dumper Placer 3 - 3 - -
9 Refuse Compactor 2 - 3 - -
10 Mechanical Street Sweeper 1 - 1 - -
Note:
Source: Table 2.4: MSW Management Plan for Municipal Councils and A, B, C class cities14 CPHEEO Manual, Page 183
Inferences:-
1. 12 L HH Bins: 17090 households * 2 = 34180bin, and then values are increased by 5% for next five
year.
2. Handcarts with bins: 50 carts are recommended (which will work for 5 years),
3. Tricycle with bins: capacity 150 kg. (25*150kg= 3750 kg), these are recommended only for the places where heavy vehicle can’t go.
4. Community bins with capacity 2.5 cubic meter= only for market areas.

DETAILED PROJECT REPORT FOR MUNICIPAL SOLID WASTE
COLLECTION & TRANSPORTATION
111
5. Community bins with capacity 1.1 cubic meter= 1 for each wards + 3 extra
6. Battery operated tricycle: capacity 250 kg * 7= 1750kg, one BOT will make 2 trips and it can help in primary as well as secondary collection
7. Auto Tipper: each for 3 wards
RECOMMENDATION:-
1. There is no 2.5 cubic meter capacity bin in ULB, 4 bins must be bought and 2 bins must be placed in And Jauhrdeeh and Sahzadpur, because waste generated their due to commercials is high,
2. There is no battery operated tricycle in ULB, so on the calculation of 2 trips per day at least 12 battery operated vehicle is required.
3. Akbarpur has no any dumpers, but in bad condition, so to meet the demand 3 dumpers will be needed.
Year wise vehicles and equipment’s calculation based on the above mentioned basic design
Considered 10% extra for standby for both vehicle and equipment’s in2017
Take 5% additional for vehicle and equipment’s in each 5years.
Ward wise equipment’s / vehicle list attached as annexure
32 nos. 1.1 cum community bins taken as collection of drain silt and street sweeping waste.

DETAILED PROJECT REPORT FOR MUNICIPAL SOLID WASTE
COLLECTION & TRANSPORTATION
112
CHAPTER 10 :
CAPITAL COST AND ANNUAL O&M COST

DETAILED PROJECT REPORT FOR MUNICIPAL SOLID WASTE
COLLECTION & TRANSPORTATION
113
10.1 Capital cost
The cost estimates for solid waste management system is worked out based on the detailed study
and is provided in Table 10-2and Table 10-3. Capital Cost of proposed improvements to the existing
assessment of collection and transportation of the MSW management operations at Akbarpur. The
existing infrastructure available with the NPP has been taken into account and costing for up-
gradation of the system is worked out. The additional investments thus required to increase the
efficiency of the system and to meet the norms prescribed by the MSW (Management and
Handling) Rules, 2016. The project cost has been given as investment required for segregation,
collection and transportation to processing facilities. Item wise the capital cost for the proposed project
given in the following tables. The total capital investment requirement at start up for primary and
secondary collection and transportation is provided in Table 10-1and year wise investment plan for
vehicles as well as equipment’s for primary & secondary collection and transportation are given in the
XX. The estimated annual operation and maintenance cost Municipal Solid Waste Management
System has been estimated based on the following:
Design of the proposed improvements based on existing conditions, deficiency analysis and
applicable norms and standards
Market quotes for non-standard items
Operational area based rates for minor items of work
Consultant’s database of information from earlier project reports prepared
Table 10-1: Abstract Cost for Proposed System of Collection and Transportation_2017
Sl.
No.
Item
Unit Rate
in INR
Required
Number
Total Amount
(INR) in Figures
Remarks (Unit Rate)
1 12 L HH Bins 200 34180
6836000 Government E-Marketplace
2
Hand cart with bins 18000 50 900000 Budgetary quotation
taken from manufacturers/suppliers
3
Tricycle with bins 30000 25 750000 Budgetary quotation
taken from manufacturers/suppliers
4 Community Bin with capacity 2.5 cum
95000 4 380000 Budgetary quotation
taken from manufacturers/suppliers
5 Community Bin with capacity 1.1 cum
40000 28 1120000 Budgetary quotation
taken from manufacturers/suppliers
6
Accessories (Shovel, Long handle broom, Metal tray with plate, Apron, Mask, Gloves, Gumboot etc.)
LS LS 500000 Taking lumpsum
7 Battery Operated Tricycles 200000 7
1400000 Government E-Marketplace
8
Auto Tipper 600000 7 4200000 Government E-
Marketplace
9 Dumper Placer 750000 3 2250000 Government E-Marketplace
10 Refuse Compactor 1350000 2 2700000 Government E-Marketplace
11 Mechanical Street Sweeper 550000 1 550000 Government E-Marketplace

DETAILED PROJECT REPORT FOR MUNICIPAL SOLID WASTE
COLLECTION & TRANSPORTATION
114
7
Sub Total 21586000
Contingencies (3%) 647580.00
Total 22233580.00
Note:
Table 10-2: Operational Cost of Salary Expense for Primary Collection and Transportation
Sl. No. Particulars Unit Quantity Rate (INR) Amount (INR)
1 Sanitary Inspector Nos. 1 30000 30000
2 Supervisor Nos. 7 20000 140000
3 Waste Collector Nos. 100 10000 1000000
4 Road Sweeper + Drain Cleaner Nos. 150 10000 1500000
5 Driver / Secondary Transport Nos. 17 12000 2040000
6 Office Management Lump-sum
100000
Salary of O&M Staff Per Month 4710000
Annual Salary of O&M Staff
56520000
Requirement : CPHEEO manual 2016” Secondary waste storage capacities should be designed
to accommodate at least double the expected daily in-flow of waste” – sub section 2.3.9,
pageno.179
Considered 1/6 thtime extra for one day off for waste collector, road sweeper and drain cleaner,driver
Considered for Road Sweeper and Drain Cleaner, 40% of the waste collector
Waste collector/road sweeper daily wages rate as per PWD schedule, Govt. of UP INR 224.00 in2015
Driver daily wages rate as per PWD schedule, Govt. of UP INR 250.00 in2015
Considered salary per month for Sanitary Inspector and Supervisor as lump-sum
Table 10-3: Annual Operation and Maintenance Cost for Primary Collection and Transportation
Equipment’s and Vehicles
Sl.
No.
Item
Required
Nos.
Annual O&M
cost (INR)
Remarks
1 Hand cart 50 90000 Maintenance cost @ 10% of handcart price
2 Tricycle 25 7500 Maintenance cost @ 10% of Tricycle
3 Community Bin with capacity 2.5 cum
4 38000 Maintenance cost @ 10% of cost
4 Community Bin with capacity 1.1 cum
28 112000 Maintenance cost @ 10% of cost
5 Battery Operated Tricycles
7 14000 Maintenance cost @ 10% of cost

DETAILED PROJECT REPORT FOR MUNICIPAL SOLID WASTE
COLLECTION & TRANSPORTATION
115
Sl.
No.
Item
Required
Nos.
Annual O&M
cost (INR)
Remarks
Auto Tipper
7 42000 Maintenance cost @ 10% of total cost
6 164010 Operation cost – mileage of 25kmpl and Fuel @ 71/liter and assumed travel of 25km per day and 330 days of operation
7
Dumper Placer Vehicle
3
225000 Maintenance cost @ 10%
1640100 Operation cost – mileage of 6kmpl and Fuel @ 71/liter and assumed travel of 140km per day and 330 days of operation
8
Refuse Compactor
2 270000 Maintenance cost @ 10%
1093400 Operation cost – mileage of 6kmpl and Fuel @ 71/liter and assumed travel of 140km per day and 330 days of operation
9
Mechanical Street Sweeper
1 55000 Maintenance cost @ 10%
546700 Operation cost – mileage of 6kmpl and Fuel @ 71/liter and assumed travel of 140km per day and 330 days of operation
Total 4297710
CPHEEO manual 2016” Secondary waste storage capacities should be designed to
accommodate at least double the expected daily in-flow of waste” – sub section 2.3.9.
Table 10-4: Total Investment Plan for Vehicles or Equipment’s for Primary & Secondary
Collection and Transportation (in INR Lacs)
Sl.
No.
Item
2018
2023
2028
2033
2038
1 12 L HH Bins 68.36 81.62 94.62 109.69 127.16
2 Hand cart with bins 9 20.86 - 42.06 -
3 Tricycle with bins 7.5 26.08 - 46.73 -
4 Community Bin with capacity 2.5 cum
3.8 - 7.6 - -
5 Community Bin with capacity 1.1 cum
11.2 - 12.98 - 15.05
6 Battery Operated Tricycles 14 - 26.887 - 54.18
7 Auto Tipper 42 - 80.63 - 75.85
8 Dumper Placer 22.5 - 26.083 - 30.23
9 Refuse Compactor 27 - 31.30 - 36.28
10 Mechanical Street Sweeper 5.5 - 7.391 9.934
11
Accessories (Shovel, Long handle broom, Metal tray with plate, Apron, Mask, Gloves, Gumboot etc.)
5 5.79 6.71 7.78 9.03
Total+(3% contingencies)
222.34 138.38 303.03 211.76 368.45
Note:
Considered 3% cost increase per year and should be consider 3% extra for contingencies

DETAILED PROJECT REPORT FOR MUNICIPAL SOLID WASTE
COLLECTION & TRANSPORTATION
116
10 CHAPTER: RECOMMENDATIONS FROM
PRESENT STUDY

DETAILED PROJECT REPORT FOR MUNICIPAL SOLID WASTE
COLLECTION & TRANSPORTATION
117
The Solid Waste Management Plan for primary & secondary collection and transportation, within the
above-mentioned design principles, will aim at detailing out the following recommendation for
implementation.
Papers, cloths can be recycle at household level and metals, glass and plastics recycle at
centralized industries. Hence these should be collected and stored properly and sold to scrap
dealers.
Route of transportation of waste should be design as they can run efficiently.
Recommended to minimize the volume of waste through effective waste minimization
techniques which involves reuse, recycling and recovery. The costs, liabilities and regulatory
burdens can be reduce by the effective waste minimization.
Adoption of effective solid waste collection and transportation system will provide a framework
for the development of a sustainable MSW service, which can take place with active
involvement of the stakeholders.
Source reduction and segregation should be encouraged. Source reduction will reduce the
amount of waste generated, reuse materials will prevent them from entering the wastes
treatment, and recycling will prevent materials from being disposed in landfills.
Proper segregation of waste would lead to better options and opportunities for its treatment
and scientific disposal. The municipal solid waste should be segregated in to organic,
inorganic, and recyclable waste, which has not been observed in current treatment practice of
ABPNPP, but are mandatory as per Municipal Solid Waste (Management and Handling)
Rules, 2016. Proper segregation ensures that one waste stream should not be mixed with
other waste so that it can be taken to for treatment and disposal after segregation only..
ABPNPP needs to select appropriate recycling technologies to comply with mandatory
directions of segregation or segregated dry waste like paper, card board, and plastic materials
at the processing plants. Recycling should be done as apart of processing facility in order to
dispose of the entire quantity of the waste received at processing plant effectively in scientific
manner.
The overall approach to the selection of treatment technologies is to comply with the
mandatory, regulatory provisions of MSW Rules, CPHEEO guidelines and also satisfy the
provisions of Environmental Protection Act, 1986. As a result, the treatment technology option
selected shall be cost effective.

DETAILED PROJECT REPORT FOR MUNICIPAL SOLID WASTE COLLECTION & TRANSPORTATION
118
APPENDIX 1: SPECIFICATION OF SOLIDWASTE MANAGEMENT EQUIPMENT ANDMACHINERY
1. Domestic Bins of 12 Litres Capacity:
The bin shall be one piece moulded, heavy duty of approximately 12 litres capacity made out of virgin grade polyethylene material manufactured from blow moulding process, absolutely smooth, chemical resistant, blended with stabilizers, anticorrosive, anti- acidic, non-toxic and free from joints, welds or rims provided with moulded projections and with moulded lids to prevent spreading of smell, flies, mosquitoes etc. The colour of the bins shall be as per prevalent colour codes or as approved by purchaser. In general, the Green bins shall be meant for storage of segregated biodegradable waste and white or blue bins for non- biodegradable/recyclable waste. The bins shall comply with the critical requirements of MSW Rules, 2016.
Specification of bins-
Specially moulded projection for extra strength High impact strength; Twist type lockable lid; Round in shape without sharp corners or welds; Built-in
bottom grip (2 nos.) for easy lifting of bin and unloading of waste Top diameter: 200 to 250mm Bottom diameter: 180 to 220mm Height: 250 to 320 mm Thickness: 1.5mm Volumetric Capacity: 12litres Lid : Fully openable Colour : Green and white or blue or as specified. Durability: Reusable, washable, smooth and sanitary to satisfy the critical needs of MSW Rules,
2016. Marking: Bin shall be embossed with manufacturer’s logo and shall have capacity and ULBs name
prominently painted/stickered / screen printing over it.

DETAILED PROJECT REPORT FOR MUNICIPAL SOLID WASTE COLLECTION & TRANSPORTATION
119
Typical view of HH bins
2. Hand Carts/ Wheel Barrow
Containerized wheel barrow with 6 Nos waste containers, fabricated out of MS angles and flats to contain minimum of 6 waste containers ideal for solid waste management. to accommodate 6 waste containers and push it by hand for transfers the waste. The wheel barrow and containers should be capable for taking the loads according to use. Type: pushing type wheel barrow with raised handle of the same width of wheel barrow at about 820 mm height from the base at maximum angle 45°. The wheel barrow will contain 6 waste containers of not less than 20 litres capacity each.
Material :
Frame: M.S. Angles 25 X 25 X 5 and flat 25 X 5 Hubs: C.I. Axle : M.S. square bar 25 X 25 Handle : M.S. round bar 8 mm dimension
Bucket : Virgin grade of polyethylene
Wheels : Rear-M.S. flats & M.S. Tee, Front – HMHDPE
Dimension of the wheel barrow to accumulate the 6 containers easy to loading/unloading Design: Two vertical supports welded with cart provided with three wheels, should not be less than 250 mm from base and overall height of the frame from base should not be less than 500 mm.
Wheels: Two Rear wheels sturdy and strong fabricated out of MS flats & angles covered with superior quality 30 mm thick solid rubbers, should be reinforced with 8 numbers of strips connect the outer circumference to the hub capable to load bearing capacity. The hub of wheel should be minimum 70 mm dia. Suitable for 6204z

DETAILED PROJECT REPORT FOR MUNICIPAL SOLID WASTE COLLECTION & TRANSPORTATION
120
bearing. Approximate size 500 mm diameter one front wheel of HMHDPE wheel of 200 mm diameter with hub &shaft.
Handle: Special round rubber grip of about 150 mm length will be provided on the handle for easy handling.
Waste Containers:
Application: For collection and transportation of solid wastes and suitable for being lifted by hand into wheel barrow.
Capacity: Container of 20 litres capacity
Material: Virgin Grade of Polyethylene material confirming to the requirement of IS 10146-1982, non- toxic, free from any contamination, chemical resistant, blended with stabilizers, anti-corrosive and anti- acidic.
Basic Qualities: Moulded from special UV stabilized grades of polyethylene. 100% rust free and maintenance free. Safe in handling as no corrosion, cracking, blistering etc. Colourful and elegant. Light weight and easy to handle. Hygienic and easy to clean, strong and durable.
Design: Rectangular in shape designed to prevent the sticking of wet waste and for easy and faster cleaning. Thickness should not be less than 3 mm. It should have 2 nos. moulded inverted projection or inverted all around projection for comfortable and safe lifting provided at bottom of the container. Each container should be covered with a lid of same material & same process of moulding having a thickness of 3 mm with moulded handle/ knob to lift it easily.
Manufactured from blow/Injection moulding process, Moulded with strengthening projection of not more than 40 mm height on the circumference. Four holes of 10 mm diameter each provided at bottom.
Durability: The container shall be 100% seamless, without any joints or welding hence no possibility of
corrosion or contamination; Moulded in one tough piece, non-toxic, strong and sturdy, absolutely
smooth; Easy & safe to handle, lift by hand to satisfy the critical needs of SWM 2016.
Bucket manufacturing: The Buckets, with 3mm thickness should be made by process of
injection/roto/ blow moulding. Test certificate is to be produce.
Size: 325 X 325 mm top and 290 X 290 mm on bottom approx. rectangular in shape with handle & 4
holes on bottom. Moulded with one piece from virgin grade of HD polyethylene material absolutely
smooth and sanitary, strong and sturdy fabricated & integrated with handle of MS provided with one
lid/ cover to prevent the smell/infection, ideal for storage and handling of solid waste.
Colour of waste containers: 3 bins of green colour and 3 bins of black colour in each hand cart or as
specified by purchaser.
Handle: Strong and durable rec. handle, fabricated out of 8 mm MS rod with MS strips on two sides.
And to be powder coated, should be strong enough to lift the load 25 litres capacity should adequately
handle Solid Waste of at least 18 kg. up to 1 m height.
Name plate: For identification of the wheel barrow, MS plate is to be provided in front for easy
readable and to be welded firmly with the frame as per dimension mention below:
Length should not be more than 310mm. Width should not be more than 205mm approx. 20 letters to
be written/ painted on the name plate, which should be minimum of 38 mm in size as per the colour
shade approved by purchaser.
Accessories: Provision should be made for following additional accessories, quantity one with each
wheel barrow. Long handle broom: length of broom 80 - 85 cm, weight of broom1 kg, binding material
20 gauge MS sheet ring having width of 1.5 - 2 cm, handle of broom bamboo of 135 cm length and 3 -
4 cm dia. Weight of the handle 0.9 kg, Collection plate: length 325 mm, width front 300 mm, width rear
250 mm, 22 gauge of MS sheet.
Metalplate:100 X 250 mm sheet of 20-gauge, Bell: standard metal bell shall be mounted on the frame.

DETAILED PROJECT REPORT FOR MUNICIPAL SOLID WASTE COLLECTION & TRANSPORTATION
121
Typical Sectional View of Handcart

DETAILED PROJECT REPORT FOR MUNICIPAL SOLID WASTE COLLECTION & TRANSPORTATION
122
3. Specification of Containerized Cycle Rickshaw with Six (6) Numbers HDPEC container
Make of tri-cycle (cycle rickshaw): Bidder should specify its brand Make of HDPE Containers: Bidder should specify its brand General: Frame of containerized tricycle shall be fabricated out of Mild Steel (MS). This frame is to be mounted on standard tricycle. It will be suitable to contain 6 waste containers ideal for storage and transfer of solid waste into city areas.
A. Specifications of Containerized Cycle Rickshaw:
Tricycle with sturdy 5 bar frames to contain six (06) waste containers, rectangular in shape of not less than 30 litre capacities; Minimum load bearing capacity of axel to be 400 kg.
Type: Tricycle with sturdy 5 bar frames with the rider to the front; big hubs with sealed bearings, two standard brake sand brake with lever reaching next to the seat to lock vehicle in position; axle capacity of minimum 400 kg; colour shade black.
Construction: 40 mm hollow section, MS tube minimum 2 mm thick or equivalent rectangular section to carry a maximum load of 400 Kg; 170 mm driving sprocket of anticorrosive material, sealed ball bearing, standard heavy-duty chain made of non-corrosive material with chain guard, anti-corrosive paddle with wear resistant rubber cover.
Handcart with Six Nos. of 25 Litre Bins

DETAILED PROJECT REPORT FOR MUNICIPAL SOLID WASTE COLLECTION & TRANSPORTATION
123
Cart: Rear carrier arrangement with support on rear axle of dimensions of about 1260 mm X 750 mm X300mm with tolerance of+/-2% to accommodate 6 bins; made from sturdy tubular/angular frame with 6 mm thick hooks placed at 30 cm c/c on top bar to hang bags; the rear door on hinges, falling downwards with simple pin arrangement for locking; the frame next to the rider raised to a height of 600 mm; a closed hook of 16 mm rod for securing the tricycle.
Brakes: 2 standard brakes and one additional brake with a lever next to seat to lock the vehicle in
position.
Wheels: Total 3 wheels of size 700mmX38mm fin the front and 2 motorcycle type or specified wheels
in rear of size 300 mm X 18 mounted with sealed ball bearing; front rims shall be chromium plated
and all wheels provided with mudguards; minimum 40 spokes of 12 gauge and tyre of 22ply.
Material: All mild steel material used for fabrication of tricycle and accessories should be of
conforming to IS: 2062: 99(Updated).
Specification of Waste Container of HDPE
General Specifications: Moulded in one piece from virgin grade of polyethylene material, absolutely
non-toxic, free from any contamination and chemical reaction, UV stabilized, smooth, strong and
sturdy fabricated & integrated with round handle of mild steel provided with one lid/cover to prevent
the smell/infection, ideal for collection and transportation of solid waste
Capacity: Each container of 30 litres minimum capacity;
Material: Virgin Grade of Polyethylene material confirming to the requirement of IS 10146 - 1982,
nontoxic, free from any contamination, chemical resistant, blended with stabilizers, anti-corrosive and
anti-acidic.
Dimensions: Rectangular
Top size: 350 X 350 mm
Bottom size: 300 x 300 mm
Height: 340 mm (minimum)
Tolerance: +/-5%
Basic Qualities:
Moulded from special UV
stabilized grades of polyethylene. 100% rust free and maintenance free. Safe in handling as no
corrosion, cracking, blistering etc. colorful and elegant. Light weight and easy to handle. Hygienic and
easy to clean, strong and durable.
Design:
Rectangular in shape designed to prevent the sticking of wet waste and for easy and faster cleaning;
thickness of not less than 3 mm; should have 2 no.s moulded inverted projection or inverted all
around projection for comfortable and safe lifting provided at bottom of the container; each container
should be covered with a lid of same material & same process of moulding having a thickness of 3
mm with moulded handle / knob to lift it easily; manufactured from Injection/ blow moulding process.
Moulded with strengthening projection of not more than 40mm height on the circumference; four holes
of 10 mm diameter each provided at bottom.
Colour: Green and Blue/Black as per directions of ULB
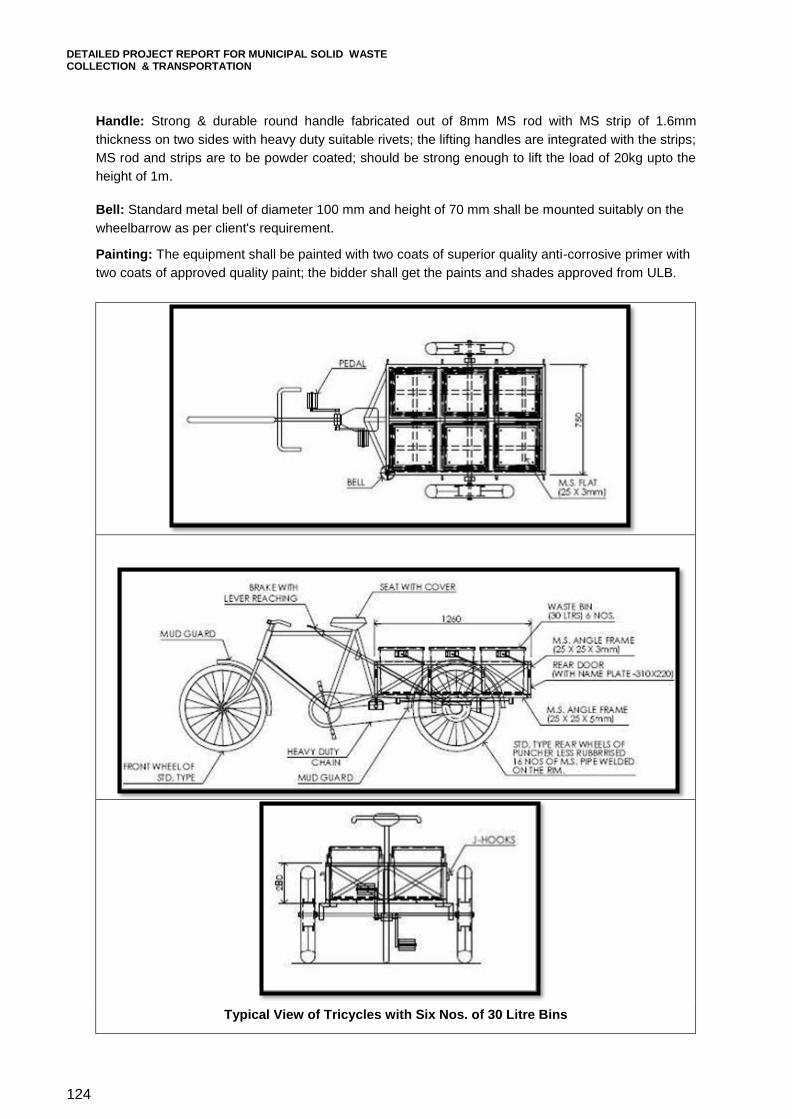
DETAILED PROJECT REPORT FOR MUNICIPAL SOLID WASTE COLLECTION & TRANSPORTATION
124
Handle: Strong & durable round handle fabricated out of 8mm MS rod with MS strip of 1.6mm
thickness on two sides with heavy duty suitable rivets; the lifting handles are integrated with the strips;
MS rod and strips are to be powder coated; should be strong enough to lift the load of 20kg upto the
height of 1m.
Bell: Standard metal bell of diameter 100 mm and height of 70 mm shall be mounted suitably on the
wheelbarrow as per client's requirement.
Painting: The equipment shall be painted with two coats of superior quality anti-corrosive primer with
two coats of approved quality paint; the bidder shall get the paints and shades approved from ULB.
Typical View of Tricycles with Six Nos. of 30 Litre Bins

DETAILED PROJECT REPORT FOR MUNICIPAL SOLID WASTE COLLECTION & TRANSPORTATION
125
4. Secondary storage containers (MS) of 2.5 cubic meter
The container having compatibility with dumper placer carrier vehicle shall be closed type having
minimum capacity of 2.5 cum.
Construction The vertical height of long side of the container (dumping side) should be more than 1.10 meter &
maximum height of top of the container more than 1.50meter. The side of the container shall be fabricated out of 2.5 mm thick M.S sheet Bottom out of 3 mm thick M.S Sheet. Top out of 2 mm thick M.S Sheet.
Minimum 4 side opening door of size 700 mm X 400 mm fabricated out of 1.6 mm thick MS Sheet.
Tail gate out of 1.6 mm thick M.S sheet. All side of container should be reinforced with IMC 75 mm X 40 mm and ISA 40 mm X 40 mm X5
mm & should have continuous welding.
Painting: After fabrication, the garbage container shall be thoroughly cleaned by wire brush to remove any
loose material, mill scale or welding spatter. The container shall then be painted with two (2) coats of red oxide primer,1 coat each of surface
gray and/or silver paint. It should be followed by two (2) coats of finish paint of approved colour inside and bottom of the
container shall be painted with 2 coats of black rubber paint. Name of Municipality: To be written on both side faces.
The overall size of the container shall be as under: Length - 1900 mm - 2200mm Width - 1200 mm - 1250mm Height - 1100 mm - 1150mm
Hooks for container lifting:
The hooks for lifting the bin would be integral to the framework of the bin. It shall be provided with the
necessaryreinforcementtohandlethedesignweightforliftingwithadequatefactorofsafety.Theshape and
size would be as per the design of the lifting tackle. The pin position and other parts of dumper placer
containers shall be compatible to dumper placer units for easy operation.
5. Secondary storage containers of 1.1 cum capacity
Stainless garbage bins for waste collection shall be provided with 4 cast or wheels with blocking
system. The garbage collection bins shall be of 1100 litres. capacity. These shall be closed type
hygienic bins. The bin construction shall be of pressed M.S sheet for ensuring adequate structural
strength required for handling with the compactor bin lifter. Also, bin shall be designed to be
lightweight and with facility to be easily handled by two bin handlers.
Standard container shall have: Base material –steel LID: The metallic bin shall have a cover of plastic Injection moulded High Density Polyethylene
(HDPE) hinged at one end, which shall open freely while unloading. The material shall be resistant to heat and chemicals.
Dead weight: 125 Kg(approx.) Load capacity: 600 Kg(approx.) Adjustable spring supported lid for easy opening and closing Rubber Profile on the lid, which shall protect fingers before closing the lid of sections min. 3 cms
between body and lid Handles on body Handle on the lid Painted Deep Green outside and dull black inside, along with special slogans as decided by the
corporation.
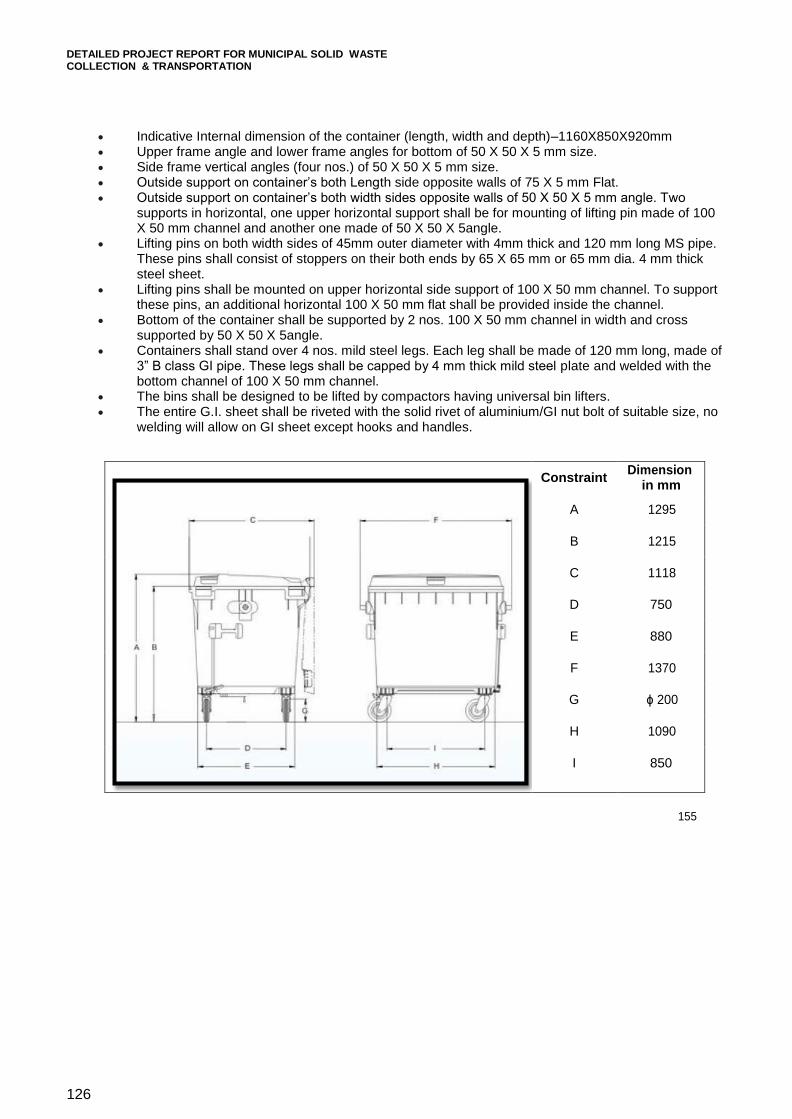
DETAILED PROJECT REPORT FOR MUNICIPAL SOLID WASTE COLLECTION & TRANSPORTATION
126
Indicative Internal dimension of the container (length, width and depth)–1160X850X920mm Upper frame angle and lower frame angles for bottom of 50 X 50 X 5 mm size. Side frame vertical angles (four nos.) of 50 X 50 X 5 mm size. Outside support on container’s both Length side opposite walls of 75 X 5 mm Flat. Outside support on container’s both width sides opposite walls of 50 X 50 X 5 mm angle. Two
supports in horizontal, one upper horizontal support shall be for mounting of lifting pin made of 100 X 50 mm channel and another one made of 50 X 50 X 5angle.
Lifting pins on both width sides of 45mm outer diameter with 4mm thick and 120 mm long MS pipe. These pins shall consist of stoppers on their both ends by 65 X 65 mm or 65 mm dia. 4 mm thick steel sheet.
Lifting pins shall be mounted on upper horizontal side support of 100 X 50 mm channel. To support these pins, an additional horizontal 100 X 50 mm flat shall be provided inside the channel.
Bottom of the container shall be supported by 2 nos. 100 X 50 mm channel in width and cross supported by 50 X 50 X 5angle.
Containers shall stand over 4 nos. mild steel legs. Each leg shall be made of 120 mm long, made of 3” B class GI pipe. These legs shall be capped by 4 mm thick mild steel plate and welded with the bottom channel of 100 X 50 mm channel.
The bins shall be designed to be lifted by compactors having universal bin lifters. The entire G.I. sheet shall be riveted with the solid rivet of aluminium/GI nut bolt of suitable size, no
welding will allow on GI sheet except hooks and handles.
Constraint Dimension
in mm
A 1295
B 1215
C 1118
D 750
E 880
F 1370
G ɸ 200
H 1090
I 850
155

DETAILED PROJECT REPORT FOR MUNICIPAL SOLID WASTE
COLLECTION & TRANSPORTATION
127
6. Technical specifications of 8 cum volume refuse compactor vehicle (RCV) with
universal lifting arrangement & tip cart system
Specification of Refuse Compactor Vehicle (RCV)
The Refuse Compactor Vehicle shall be easy to handle and allow the bin handlers to unload Solid
Waste from the Bins into the Machine Tailgate hopper with minimum physical effort and maximum
safety. Hand lever arrangement for operation of Compaction Cycle shall be provided. The Tailgate
loading height shall not be more than 1.2 meters from the ground level.
The RCV Volume would be 8m3.The Tail gate hopper volume will be minimum 1.1 cubic meter. The
bin lifter should be also able to unload garbage simultaneously from two bins of size upto 240 Liters.
Refuse Collection Body
The refuse collection body shall be of 7 m3
volume and be in torsion-free steel
construction. The
bottom, the side walls and the top must be
dome shaped without any vertical stiffeners
/ ribs.
Roof panel thickness – Minimum 4 mm
Side Panel thickness – Minimum 4 mm
Floor thickness – Minimum 4 mm
The tailgate bearing and automatic tail
gate locking shall be integrated into the
rear frame of the
body.
The Ejection Plate shall run on synthetic guide blocks within the lateral longitudinal guides of the
boat-typebottomgroupoftherefusecollectionbodyandmustbeoperatedbyatelescopichydraulic ram. A
hydraulic control unit will regulate the withdrawal of the ejection panel during the loading process,
so that the compaction is optimized.
It must serve during loading as a resistance for the refuse compaction process.
TAILGATE
The tailgate shall unlock automatically and raise, to permit ejection of refuse from RCV hopper
when hydraulic valve is actuated. There shall be automatic locking arrangement between tailgate
and RCV hopper body. This locking system shall be completely liquid proof between tail gate and
refuse collection body by using double rubber lip seal.
The Tailgate hopper shall have a Volume of minimum 1.1 m3
Slide plate – The Slide Plate shall be actuated by 2 Hydraulic Cylinders and must run on suitable
number of sliding blocks. Material of construction – IS 2062.
Packer Plate – The Packer Plate shall be actuated by 2 Hydraulic Cylinders.
TAILGATE HOPPER
Material of construction – DOMEX / HARDOX Steel
HYDRAULIC SYSTEM
The RCV shall be equipped with following hydraulic system:
Hydraulic Pump/Dual Hydraulic Pump One pump supplying the pressurized hydraulic oil for Telescopic cylinder of Ejection panel, tail gate
lifting & closing and bin lifting & tilting operations. Another pump for operation of compaction cycle i.e. operation of sliding plate and packer plate. All
hydraulic functions are achieved by the below major components: Hand operated mobile control valves supplying controlled hydraulic oil proportionally with its
actuation along with integral load holding check valves to prevent reverse flow through valve when shifting.

DETAILED PROJECT REPORT FOR MUNICIPAL SOLID WASTE
COLLECTION & TRANSPORTATION
128
Remote pilot operated two-way valves along with pressure relief valve for creating a hydraulic resistance during withdrawal of the ejection panel for the refuse compaction process.
Over center valve creating a back pressure to prevent the load from free falling or over-run during lowering.
07 Hydraulic Cylinders shall be installed covering following operation. 1 three-stage telescopic ram, double-acting for the ejection panel. 2 hydraulic rams, double-acting for the slide plate Double acting Slide-cylinders (for compacting) shall be located outside of the sidewalls. The cylinders are mounted in pushing position. 2 hydraulic rams, double-acting for the packer plate 2 hydraulic rams, double-acting for the tailgate (lifting/lowering and automatic locking)
All Cylinders shall be of reputed make:- WIPRO / DANTAL / CANARA.
Working light, Rotating Beacon light, backing light, stop light, direction indicator and number plate
light to be provided in the RCV.
GARBAGE LOADING SYSTEM/DEVICES
The equipment can be provided with following optional attachments for unloading the garbage into
the tailgate hopper.
UNIVERSAL BIN LIFTER
The Universal Bin Lifter is capable of directly lifting and empting the garbage from a DIN Standard
Bin of 1100 Ltrs. / 660 Ltrs. capacity into the tailgate hopper. The Bin Lifter is also capable of lifting
and empting the garbage simultaneously from 2 Nos. DIN Standard Bins of upto 240 Ltrs.
Capacity. The Bin Lifter shall be provided with 4 hydraulic cylinders i.e. 2 cylinders for leveling and
lifting the Bin and 2 cylinders for tipping operations.
TIP CART SYSTEM
The unit is also provided with detachable tip cart/bucket which is capable of receiving garbage
directly from Auto Tippers, Rickshaws, handcarts/wheel barrows etc. and emptying the garbage
into the tail gate hopper of Refuse Compactor.
The total number of hydraulic cylinders in the equipment fitted with Universal Bin Lifter System and
tip cart system shall be 11 Nos.
SAFETY FEATURES
Hose burst valve shall be fitted to the system to prevent the tailgate descending in the event of the
hydraulic failure. There shall be a body prop provided on the tailgate to hold the tailgate in the
open position for safety of workshop personnel when entering the body for maintenance or repair.
PAINTING
The entire unit shall be painted with two coats of superior quality anti-corrosive primer with two
coats of approved quality paint to ensure long lasting, resistance to rust, weathering and breakage.
The color shade shall be purchaser’s choice selected from the standard colors offered by the
supplier.
Truck chassis
The equipment is suitable for mounting on 11 T GVW Truck Chassis, Wheel Base Min. 3400 mm
with Driver’s Cabin and PTO.
7. Twin Bin Dumper Placer for 2.5 cum capacity containers
The dumper placer/carrier vehicle (chassis and cab) shall be rugged and durable, shall incorporate
the latest technological features offered by the manufacturer/supplier. The truck chassis shall support
hydraulically operated hoisting mechanism to load, offload and tip the twin containers of 2.5 cum
capacity. The dumper placer shall comprise of two pairs of lift arms each actuated by double acting
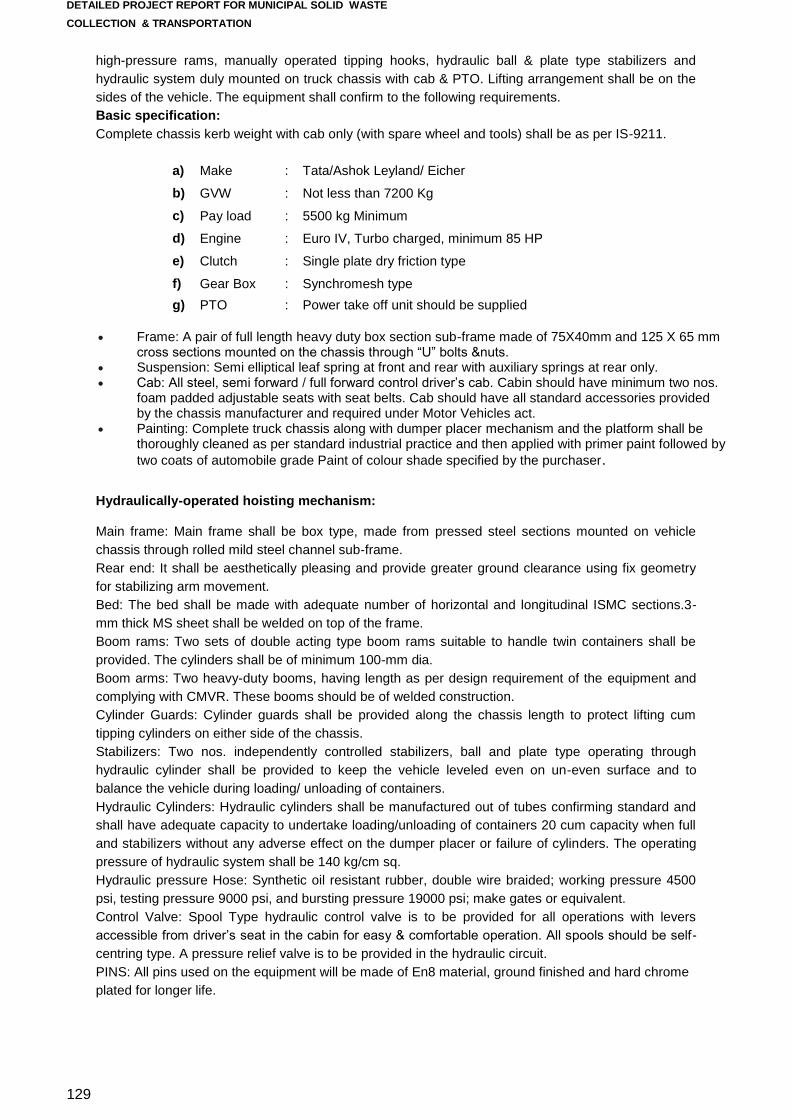
DETAILED PROJECT REPORT FOR MUNICIPAL SOLID WASTE
COLLECTION & TRANSPORTATION
129
high-pressure rams, manually operated tipping hooks, hydraulic ball & plate type stabilizers and
hydraulic system duly mounted on truck chassis with cab & PTO. Lifting arrangement shall be on the
sides of the vehicle. The equipment shall confirm to the following requirements.
Basic specification:
Complete chassis kerb weight with cab only (with spare wheel and tools) shall be as per IS-9211.
a) Make : Tata/Ashok Leyland/ Eicher
b) GVW : Not less than 7200 Kg
c) Pay load : 5500 kg Minimum
d) Engine : Euro IV, Turbo charged, minimum 85 HP
e) Clutch : Single plate dry friction type
f) Gear Box : Synchromesh type
g) PTO : Power take off unit should be supplied
Frame: A pair of full length heavy duty box section sub-frame made of 75X40mm and 125 X 65 mm
cross sections mounted on the chassis through “U” bolts &nuts. Suspension: Semi elliptical leaf spring at front and rear with auxiliary springs at rear only. Cab: All steel, semi forward / full forward control driver’s cab. Cabin should have minimum two nos.
foam padded adjustable seats with seat belts. Cab should have all standard accessories provided by the chassis manufacturer and required under Motor Vehicles act.
Painting: Complete truck chassis along with dumper placer mechanism and the platform shall be thoroughly cleaned as per standard industrial practice and then applied with primer paint followed by
two coats of automobile grade Paint of colour shade specified by the purchaser.
Hydraulically-operated hoisting mechanism:
Main frame: Main frame shall be box type, made from pressed steel sections mounted on vehicle
chassis through rolled mild steel channel sub-frame.
Rear end: It shall be aesthetically pleasing and provide greater ground clearance using fix geometry
for stabilizing arm movement.
Bed: The bed shall be made with adequate number of horizontal and longitudinal ISMC sections.3-
mm thick MS sheet shall be welded on top of the frame.
Boom rams: Two sets of double acting type boom rams suitable to handle twin containers shall be
provided. The cylinders shall be of minimum 100-mm dia.
Boom arms: Two heavy-duty booms, having length as per design requirement of the equipment and
complying with CMVR. These booms should be of welded construction.
Cylinder Guards: Cylinder guards shall be provided along the chassis length to protect lifting cum
tipping cylinders on either side of the chassis.
Stabilizers: Two nos. independently controlled stabilizers, ball and plate type operating through
hydraulic cylinder shall be provided to keep the vehicle leveled even on un-even surface and to
balance the vehicle during loading/ unloading of containers.
Hydraulic Cylinders: Hydraulic cylinders shall be manufactured out of tubes confirming standard and
shall have adequate capacity to undertake loading/unloading of containers 20 cum capacity when full
and stabilizers without any adverse effect on the dumper placer or failure of cylinders. The operating
pressure of hydraulic system shall be 140 kg/cm sq.
Hydraulic pressure Hose: Synthetic oil resistant rubber, double wire braided; working pressure 4500
psi, testing pressure 9000 psi, and bursting pressure 19000 psi; make gates or equivalent.
Control Valve: Spool Type hydraulic control valve is to be provided for all operations with levers
accessible from driver’s seat in the cabin for easy & comfortable operation. All spools should be self-
centring type. A pressure relief valve is to be provided in the hydraulic circuit.
PINS: All pins used on the equipment will be made of En8 material, ground finished and hard chrome
plated for longer life.

DETAILED PROJECT REPORT FOR MUNICIPAL SOLID WASTE
COLLECTION & TRANSPORTATION
130
8. Tractor Trolley
The technical specifications of the equipment required by the purchaser are indicated in preceding
paragraph. The Bidders shall complete the technical specifications for the goods offered in their
entirety so as to demonstrate their compliance with the requirements of the bidding documents.
Tractor, trolley shall be used for day to day multi activities by the ULBs.
Tractor
The tractor should be rugged and durable, and designed for ease of manoeuvrability and proper
distribution of tractor, and axle induced stresses. The frame/chassis should be either fully welded or
rigidly bolted to achieve this, in accordance with the manufacturer’s standard procedures. It should be
suitable for working under adverse site conditions, and the power train should be designed for this
purpose
Basic Specification: Type: tractor complete with trolley attachment provision. Structure: Rugged, fully welded, durable and designed for durability and proper distribution of
induced stresses. Engine: Minimum Euro 2, fuel efficient, Turbo charged, 4 stroke OHV direct injection diesel engine.
Minimum gross horse-power rating : 35 HP (27 KW) at manufacturer’s rated RPM. Cylinder: Minimum three cylinders vertical in line – 3 cylinder DI engine with integral cylinder head Fuel Injection: In line fuel injection pump with variable speed mechanical governor. Fuel System: Gravity and forced feed, fuel tank capacity not less than 30 litres and fuel filtration
should be dual stage. Air Cleaner: should be of oil bath type with cyclone type transparent pre-cleaner. Lubrication: Forced feed and splash type with full flow filter paper element Cooling: Impeller type water pump, fan and radiator, forced feed water circulation. Compression Ratio: More than17:1 Transmission : 8 forward and 2 reverse gears Clutch: Single/Double plate dry friction type Gear: 4 forward and 1reverse Steering: Worm and nut type with re-circulating balls Brakes : Shoe/Disk Type, Emergency brakes: hand brake with parking latch Electric System : Voltage: 12 volts, Battery capacity: 12 volts, 60 Amps/hr @ 5 hr rating, Alternator
capacity: minimum 12 volts 13 Amp, Head lights: 2 nos. 12 V -36 W, Brake light: 2 nos. 12 V-21, Rear light: (plough lamp)-1
Typical View of Dumper placer
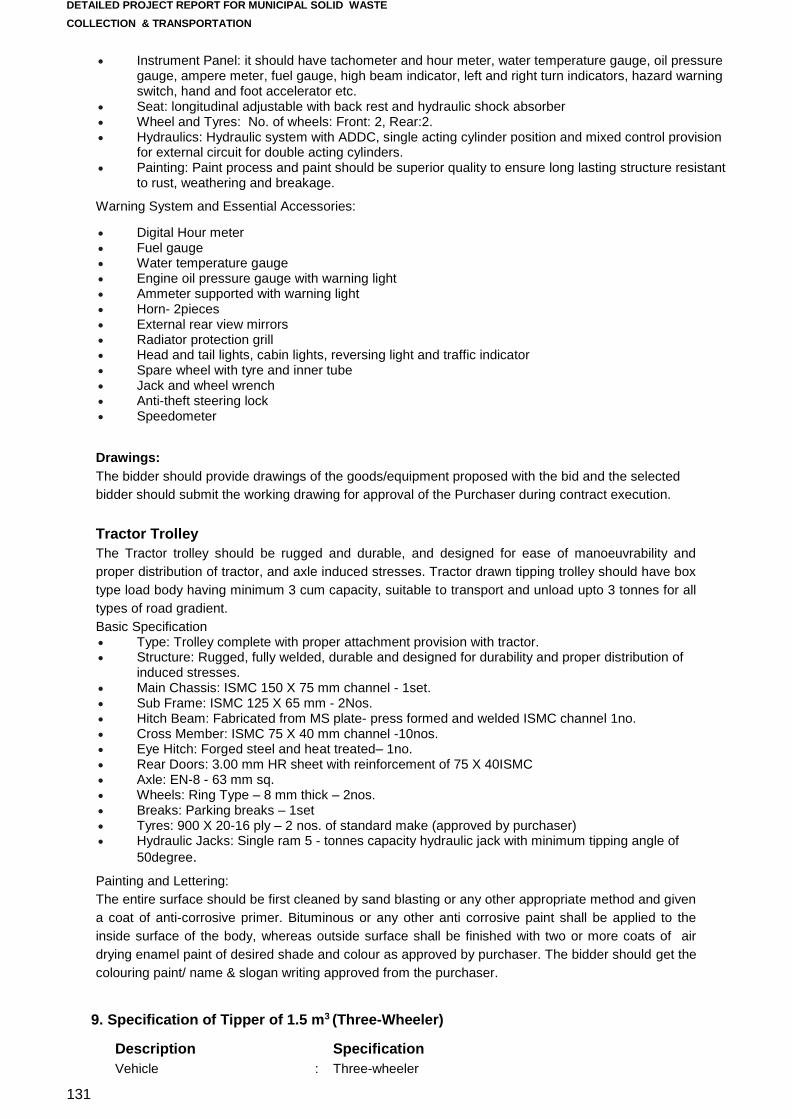
DETAILED PROJECT REPORT FOR MUNICIPAL SOLID WASTE
COLLECTION & TRANSPORTATION
131
Instrument Panel: it should have tachometer and hour meter, water temperature gauge, oil pressure gauge, ampere meter, fuel gauge, high beam indicator, left and right turn indicators, hazard warning switch, hand and foot accelerator etc.
Seat: longitudinal adjustable with back rest and hydraulic shock absorber Wheel and Tyres: No. of wheels: Front: 2, Rear:2. Hydraulics: Hydraulic system with ADDC, single acting cylinder position and mixed control provision
for external circuit for double acting cylinders. Painting: Paint process and paint should be superior quality to ensure long lasting structure resistant
to rust, weathering and breakage.
Warning System and Essential Accessories:
Digital Hour meter Fuel gauge Water temperature gauge Engine oil pressure gauge with warning light Ammeter supported with warning light Horn- 2pieces External rear view mirrors Radiator protection grill Head and tail lights, cabin lights, reversing light and traffic indicator Spare wheel with tyre and inner tube Jack and wheel wrench Anti-theft steering lock Speedometer
Drawings:
The bidder should provide drawings of the goods/equipment proposed with the bid and the selected
bidder should submit the working drawing for approval of the Purchaser during contract execution.
Tractor Trolley
The Tractor trolley should be rugged and durable, and designed for ease of manoeuvrability and
proper distribution of tractor, and axle induced stresses. Tractor drawn tipping trolley should have box
type load body having minimum 3 cum capacity, suitable to transport and unload upto 3 tonnes for all
types of road gradient.
Basic Specification Type: Trolley complete with proper attachment provision with tractor. Structure: Rugged, fully welded, durable and designed for durability and proper distribution of
induced stresses. Main Chassis: ISMC 150 X 75 mm channel - 1set. Sub Frame: ISMC 125 X 65 mm - 2Nos. Hitch Beam: Fabricated from MS plate- press formed and welded ISMC channel 1no. Cross Member: ISMC 75 X 40 mm channel -10nos. Eye Hitch: Forged steel and heat treated– 1no. Rear Doors: 3.00 mm HR sheet with reinforcement of 75 X 40ISMC Axle: EN-8 - 63 mm sq. Wheels: Ring Type – 8 mm thick – 2nos. Breaks: Parking breaks – 1set Tyres: 900 X 20-16 ply – 2 nos. of standard make (approved by purchaser) Hydraulic Jacks: Single ram 5 - tonnes capacity hydraulic jack with minimum tipping angle of
50degree.
Painting and Lettering:
The entire surface should be first cleaned by sand blasting or any other appropriate method and given
a coat of anti-corrosive primer. Bituminous or any other anti corrosive paint shall be applied to the
inside surface of the body, whereas outside surface shall be finished with two or more coats of air
drying enamel paint of desired shade and colour as approved by purchaser. The bidder should get the
colouring paint/ name & slogan writing approved from the purchaser.
9. Specification of Tipper of 1.5 m3 (Three-Wheeler)
Description Specification
Vehicle : Three-wheeler
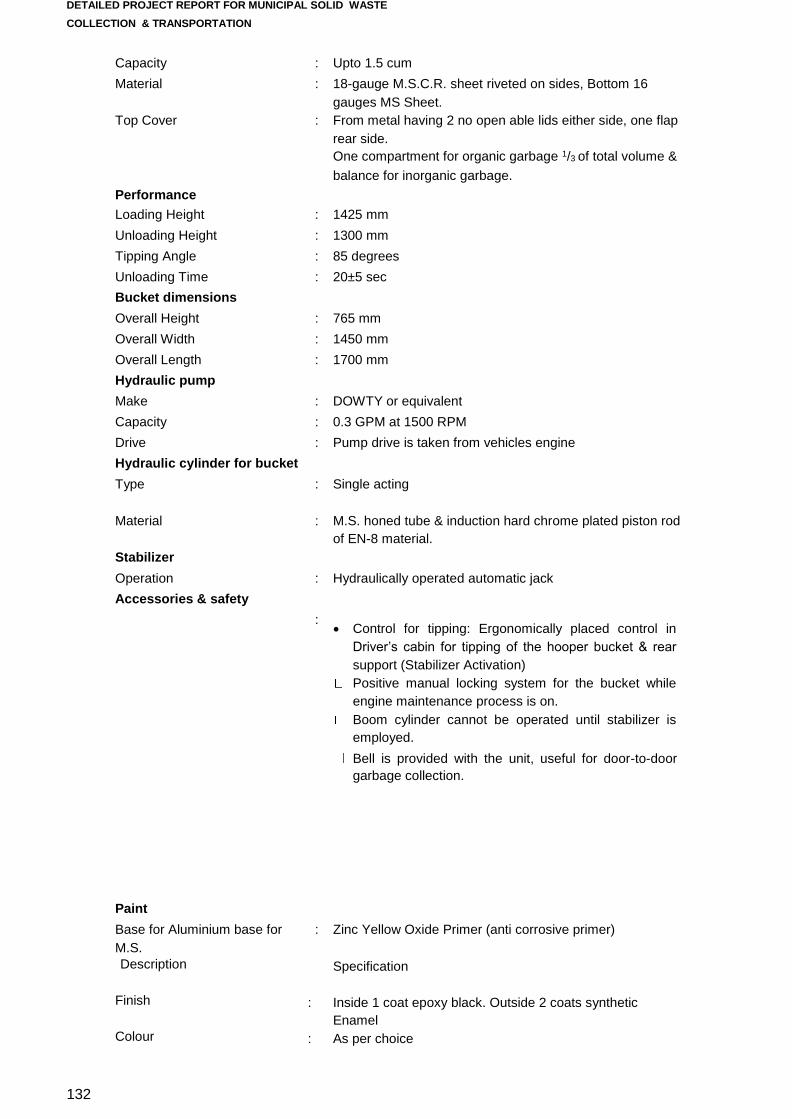
DETAILED PROJECT REPORT FOR MUNICIPAL SOLID WASTE
COLLECTION & TRANSPORTATION
132
Capacity : Upto 1.5 cum
Material : 18-gauge M.S.C.R. sheet riveted on sides, Bottom 16
gauges MS Sheet.
Top Cover : From metal having 2 no open able lids either side, one flap
rear side.
One compartment for organic garbage 1/3 of total volume &
balance for inorganic garbage.
Performance
Loading Height : 1425 mm
Unloading Height : 1300 mm
Tipping Angle : 85 degrees
Unloading Time : 20±5 sec
Bucket dimensions
Overall Height : 765 mm
Overall Width : 1450 mm
Overall Length : 1700 mm
Hydraulic pump
Make : DOWTY or equivalent
Capacity : 0.3 GPM at 1500 RPM
Drive : Pump drive is taken from vehicles engine
Hydraulic cylinder for bucket
Type : Single acting
Material : M.S. honed tube & induction hard chrome plated piston rod
of EN-8 material.
Stabilizer
Operation : Hydraulically operated automatic jack
Accessories & safety
: Control for tipping: Ergonomically placed control in
Driver’s cabin for tipping of the hooper bucket & rear
support (Stabilizer Activation)
Positive manual locking system for the bucket while
engine maintenance process is on.
Boom cylinder cannot be operated until stabilizer is
employed.
Bell is provided with the unit, useful for door-to-door
garbage collection.
Paint
Base for Aluminium base for
M.S.
: Zinc Yellow Oxide Primer (anti corrosive primer)
Description Specification
Finish : Inside 1 coat epoxy black. Outside 2 coats synthetic
Enamel
Colour : As per choice

DETAILED PROJECT REPORT FOR MUNICIPAL SOLID WASTE
COLLECTION & TRANSPORTATION
133
Engine
Type : Four Stroke, single cylinder, IDI, Compression ignition
Cooling Type : Forced air cooled & Oil cooled
Displacement : 416 cc
Max Power : 8.5 bhp (6.25 kW) @ 3600 rpm
Max Torque : 20 Nm @ 2400 rpm
Ignition Type : Electric start
Transmission Type : 4 forward & 1 reverse gear
Clutch Type : Single plate, dry friction type, foot operated Suspended type
Electrical system
System : System 12 V DC
Chassis
Chassis Type : Semi Monocoque
Suspension
Front Suspension : Anti-drive leading link with helical compression spring & shock absorber
Real Suspension : Independent suspension with spring and shock absorber
Tyres
Front Tyre Size : 4.5x10, 8 PR
Rear Tyre Size : 4.5x10, 8 PR
Brakes
Front Brakes : Hydraulic brakes with auto adjuster
Rear Brakes : Hydraulic brakes with auto adjuster
Fuel tank
Fuel Tank Capacity
:
12 litres Dimensions
Overall length : 2960 mm
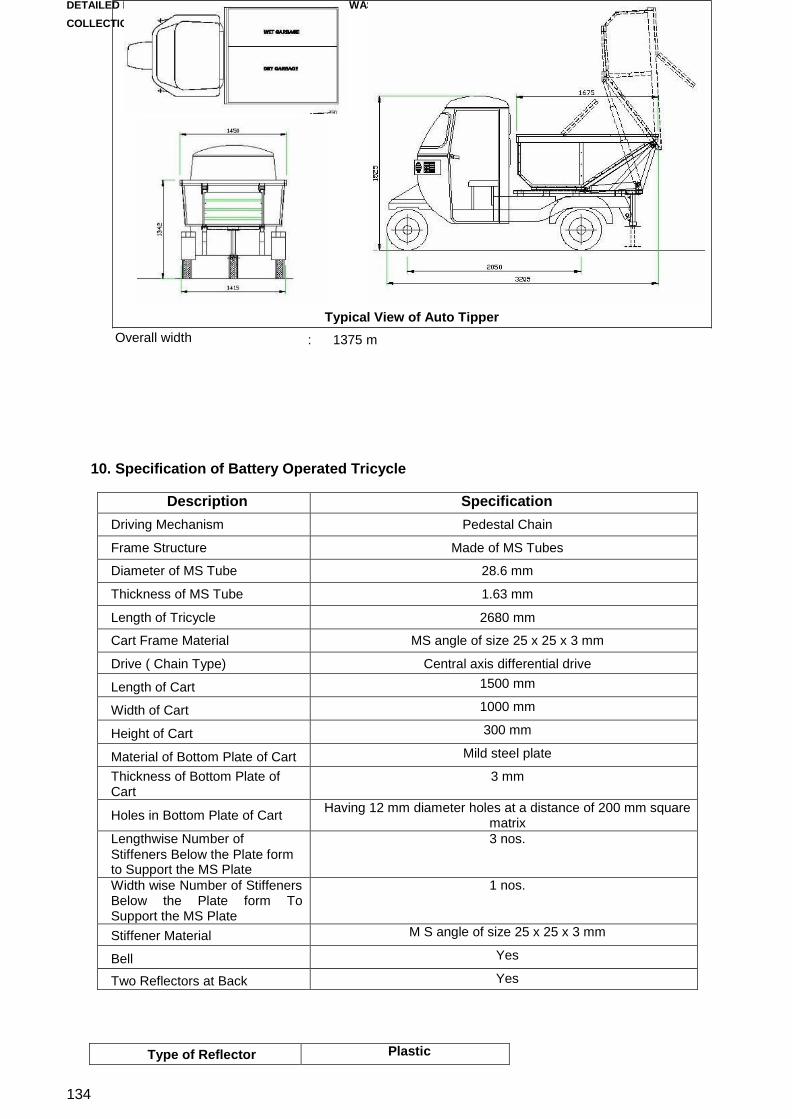
DETAILED PROJECT REPORT FOR MUNICIPAL SOLID WASTE
COLLECTION & TRANSPORTATION
134
Overall width : 1375 m
10. Specification of Battery Operated Tricycle
Description Specification
Driving Mechanism Pedestal Chain
Frame Structure Made of MS Tubes
Diameter of MS Tube 28.6 mm
Thickness of MS Tube 1.63 mm
Length of Tricycle 2680 mm
Cart Frame Material MS angle of size 25 x 25 x 3 mm
Drive ( Chain Type) Central axis differential drive
Length of Cart 1500 mm
Width of Cart 1000 mm
Height of Cart 300 mm
Material of Bottom Plate of Cart Mild steel plate
Thickness of Bottom Plate of Cart
3 mm
Holes in Bottom Plate of Cart Having 12 mm diameter holes at a distance of 200 mm square
matrix
Lengthwise Number of
Stiffeners Below the Plate form to Support the MS Plate
3 nos.
Width wise Number of Stiffeners Below the Plate form To Support the MS Plate
1 nos.
Stiffener Material M S angle of size 25 x 25 x 3 mm
Bell Yes
Two Reflectors at Back Yes
Type of Reflector Plastic
Typical View of Auto Tipper

DETAILED PROJECT REPORT FOR MUNICIPAL SOLID WASTE
COLLECTION & TRANSPORTATION
135
Lock for Locking the Tricycle Yes
Tool Kit Yes
First Aid Box Yes
Tricycle Seat with Cover Yes
Hangers for Broom and Wiper Yes
Finish of Handle Nickel and Chrome Plated
Finish of Chain Wheel Nickel and Chrome Plated
Finish of Crank Nickel and Chrome Plated
Finish of Rim Nickel and Chrome Plated
Number of Front Wheel 1 nos.
Type of Front Wheel Puncher less Rubberised Wheel
Front Rim Diameter 90:90:12 mm
Front Rim Width 2.15J x 12 mm
Front Rim Thickness 2.15J X 12 mm
Number of Spikes in Front Wheel
0 Nos
Diameter of Spike of Front Wheel
NA
Number of Rear Wheels 2 nos.
Type of Rear Wheels Puncher less Rubberised Wheel
Forward & Reverse (Gear Type) Available
Rear Rim Diameter 90:90:12 mm
Rear Rim Width 2.15J X 12 mm
Rear Rim Thickness 2.15J X 12 mm
Number of Spikes in Rear Wheel
0 Nos
Brake System Drum with pedal
Battery Type Lead – Acid Battery
Thickness of Spike of Rear Wheel
NA mm
Daimeter/ Width of Spike in Rear Wheel
0 mm
Support Details of Rear Wheels Axel with brake drums
Number of Plastic Containers with Lid and Handle
8 nos.
Minimum Capacity of the Each Container
40 litres
Material of the Container And Lid
Virgin HDPE
Material of Handle of Container MS Sheet
Minimum Wall Thickness of the Plastic Container And Lid
4 mm

DETAILED PROJECT REPORT FOR MUNICIPAL SOLID WASTE
COLLECTION & TRANSPORTATION
136
Maximum Ash Content of the Container and Lid When Tested as per IS 14887/2014
1 %
Loading Capacity of the Tricycle 400 Kg
Suspension Front ( Heavy Loading Type )
Telescopic Suspension
Suspension Rear ( Heavy Loading Type )
Leaf Spring
Charging Time 6 – 7 Hrs
Colour of the Container nnd Lid Green for wet and Blue for dry or specified by the purchaser
Pre-treatment Two coats of red oxide after phosphating before painting
Paint Powder Coating
Colour of the Frame Yellow or Red or as per requirement or specified by the purchaser
Colour of the Cart 16 viscosity
Manufacturer 's Name Marked on the Tricycle
Yes
Year of Manufacturing Marked on the Tricycle
Yes
Manufacturer Drawing No. NA
11. Truck with hydraulic lift for Transportation of Solid Waste 10 cum. Capacity
Truck chassis shall be TATA/ ASHOK LEYLAND/ EICHER/ FORCE make.
The tipping truck shall be rugged and shall incorporate latest technological features offered by the
manufacturer. The vehicle shall be suitable for use to load around 10 cum garbage/debris/ waste at
transfer station/compost plant, transport to landfill and unload it by tipping or by any other suitable
arrangement. The vehicle should have provision to transport the garbage in covered and packed
condition. Hydraulically operated covers are to be provided in such a manner that the top of load body
remain fully open at the time of loading of garbage, whereas it is fully covered during transportation.
The equipment shall confirm to the following specifications.
Truck Chassis
Gross vehicle weight : Minimum 16000 Kg.
Engine : Min. 120 HP (approx.) at rated RPM BS-IV Model
Gear Box : Synchromesh type
No. of Gears : 5 forward and 1 reverse
Wheel base : Minimum 3600 mm
The truck chassis shall be suitable to handle the specified load provide satisfactory service envisaged
and shall comply with all provisions of Motor Vehicles Act and MSW rules 2016.
Load Body
Loadbodyshallberuggedandsuitabletocarry10cumgarbagewithhydraulicallyoperated toptoload garbage
from top and cover garbage during transportation. It should have provision of hinged tail gate to
unload the garbage by tipping the load body or by any other suitable arrangement. Three stage
tipping cylinders at front end shall be provided with tipping angle 45 degree. The tail gate should have

DETAILED PROJECT REPORT FOR MUNICIPAL SOLID WASTE
COLLECTION & TRANSPORTATION
137
suitable locking mechanism. Body dimensions shall be (approx.) length-3850 mm, width-2315 mm,
height-1125 mm. Floor shall be made with minimum 4 mm MS sheet and side panel with minimum 3
mm MS Sheet.
Cabin
All steel semi/Fully forward control driver's cab. Cabin should have minimum two nos. foam padded
adjustable seats with seat belts. Cab should
have all standard accessories provided by
truck chassis manufacturer and shall
confirm to requirements of Motor Vehicles
Act.
Painting
The body should be sand blasted prior to
coating/painting. The body shall be coated
with one coat of zinc rich primer & then
with two coats of synthetic enamel paint to
ensure long lasting structure suitable for
use under hostile conditions. Colour
shade/make of paint shall be as specified
by
the purchaser. The logo of concerned ULB, capacity of equipment and any other information asked by
the purchaser shall be painted on the body. The paint shall be of good quality and ICI/Asian/Johnson
& Nicholson / Burger make.
APPENDIX: 3 DAYS SURVEY DATA
Estimation of waste generation rates at a household level
House hold
Number Name of Head of Household
Number of family
member
Weight of biodegradable solid waste generated per day
Day 1 Day 2 Day 3 Avg.
High Income
1 Ghanshyam Gupta 4 2.400 2.500 2.600 2.500
2 Kanhaiya Prsad tiwari 5 2.600 2.400 2.500 2.500
3 Ramesh Chand Pathak 4 2.500 2.600 2.400 2.500
4 Ravindr Srivastav 6 2.600 2.400 2.500 2.500
5 Smt. Renu Verma 5 2.700 2.500 2.300 2.500
6 Tarakant Tripathi 4 2.600 2.400 2.500 2.500
7 Prbhat Yadav 6 2.800 2.500 2.200 2.500
8 Ram Chandar Upadhyay 5 2.400 2.700 2.400 2.500
9 Daya Ram Verma 4 2.700 2.400 2.400 2.500
10 Chandr Prkash Verma 6 2.600 2.500 2.400 2.500
11 Ashok Tiwari 5 2.700 2.500 2.300 2.500

DETAILED PROJECT REPORT FOR MUNICIPAL SOLID WASTE
COLLECTION & TRANSPORTATION
138
12 Hajj. Gulam Mustfa 3 2.500 2.700 2.300 2.500
13 Kamrujjama 6 2.300 2.500 2.700 2.500
14 Harishchan Gupta 5 2.500 2.400 2.600 2.500
15 Mo. Salam 6 2.400 2.600 2.500 2.500
16 Ram Nidhi Verma 5 2.600 2.400 2.500 2.500
17 Dr. Fateh Bahdur 6 2.500 2.300 2.700 2.500
18 Daya Sankar Madhesiya 5 2.400 2.500 2.600 2.500
19 Ramesh Seth 4 2.300 2.600 2.600 2.500
20 Dhrmraj Nishad 6 2.800 2.200 2.500 2.500
21 Sri Ram Verma 5 2.700 2.400 2.400 2.500
22 Shitla Prsad Seth 4 2.600 2.500 2.400 2.500
23 Jang Bahadur Singh 4 2.400 2.500 2.600 2.500
24 Ram Siromani Verma 7 2.500 2.800 2.200 2.500
25 JayRam Sanwani 5 2.300 2.600 2.600 2.500
Total 125 63.400 62.400 61.700 62.500

DETAILED PROJECT REPORT FOR MUNICIPAL SOLID WASTE
COLLECTION & TRANSPORTATION
139
Middle Income
1 Dwarika Prsad 5 1.800 2.000 2.200 2.000
2 Rajan Suman 5 2.000 1.900 2.100 2.000
3 Latif Ashraf 6 1.900 2.100 2.000 2.000
4 Hari Narayan Madhysiya 5 1.700 1.900 2.400 2.000
5 Kalam Khan 6 2.000 1.900 2.100 2.000
6 Hari Mohan Pandey 4 2.100 1.900 2.000 2.000
7 Murlidhar Pandey 4 2.000 1.800 2.200 2.000
8 Madhaw Lal Pandey 5 2.100 1.700 2.200 2.000
9 Gyanendr Pandey 6 1.900 1.700 2.400 2.000
10 Bhola Prsad Moury 4 1.700 1.900 2.400 2.000
11 Surendr Nath Yadav 5 1.800 2.000 2.200 2.000
12 Raghvenr Yadav 5 1.900 2.000 2.100 2.000
13 Mumtajul huq 6 2.000 1.800 2.200 2.000
14 Latif Ashrifi 5 2.000 1.900 2.100 2.000
15 Vijay Nath Singh 6 2.000 1.900 2.100 2.000
16 Kanhaiya Lal Verma 6 2.100 1.900 2.000 2.000
17 shiv Nath Gupta 5 2.000 2.100 1.900 2.000
18 Dr. Ram Ji Gupta 4 1.900 1.800 2.300 2.000
19 Adity Narayan 5 1.900 1.700 2.400 2.000
20 Lal Ji Shukla 4 1.800 1.900 2.300 2.000
21 Ram Chandr Agrhari 4 1.600 2.100 2.300 2.000
22 Durga Prsad Singh 4 1.800 2.100 2.100 2.000
23 Archna Mishr 6 1.700 2.200 2.100 2.000
24 Vinod Srivastav 5 1.900 2.000 2.100 2.000
25 Adarsh Pandey 5 1.900 2.000 2.100 2.000
Total 125 47.5 48.2 54.3 50.000

DETAILED PROJECT REPORT FOR MUNICIPAL SOLID WASTE
COLLECTION & TRANSPORTATION
140
Low Income
1 Rakesh Gaur 5 1.600 1.400 1.500 1.500
2 Ram Sagar Verma 6 1.400 1.500 1.600 1.500
3 Mant Ram 6 1.500 1.700 1.300 1.500
4 Sant Ram 5 1.400 1.600 1.500 1.500
5 Ashok Kumar 6 1.600 1.300 1.600 1.500
6 Matai Rajbhar 5 1.500 1.400 1.600 1.500
7 Sampat Rajbhar 6 1.600 1.300 1.600 1.500
8 Jagdish Gupta 4 1.700 1.600 1.300 1.533
9 Khusiram 5 1.800 1.300 1.400 1.500
10 rakcha Ram 4 1.200 1.700 1.600 1.500
11 Bihari Vishwkarma 4 1.300 1.500 1.700 1.500
12 Panchu Gupta 7 1.400 1.500 1.600 1.500
13 Keshav Ram Yadav 4 1.600 1.600 1.300 1.500
14 Mo Shakil 6 1.700 1.400 1.400 1.500
15 Darsu Ram 7 1.600 1.500 1.400 1.500
16 Ram Sabhar 6 1.500 1.400 1.600 1.500
17 Sageer Ahamd 6 1.600 1.300 1.600 1.500
18 Basant Lal Rajbhar 3 1.400 1.600 1.500 1.500
19 Ram Avtar 3 1.300 1.600 1.600 1.500
20 Ram Bahal Rajbhar 6 1.600 1.500 1.400 1.500
21 Avrar 4 1.500 1.600 1.400 1.500
22 Taijub 4 1.400 1.600 1.500 1.500
23 Iliyas 5 1.500 1.300 1.700 1.500
24 Jhinku 4 1.300 1.800 1.400 1.500
25 Mansha Ram 4 1.500 1.400 1.600 1.500
Total 125 37.500 37.400 37.700 37.533

DETAILED PROJECT REPORT FOR MUNICIPAL SOLID WASTE
COLLECTION & TRANSPORTATION
141
Average of three day measurements to get one-day value for each household (Calculating from above table)
Average values for three days for biodegradable waste Category (Take from above table)
Category Total (for all samples)
Average Number of members (N1) per household
Average weight of biodegradable solid waste
generated in selected households daily (kg.)
High Income Households 5 62.500
Middle Income Households 5 50.000
Low Income Households 5 37.533
Estimates of non biodegradable waste and its Components in Sample of Households:
Waste Composition: Dry Non biodegradable Waste collected from group of 10% households from high income, middle income and low income category should be mixed (group wise) and thereafter various
components of waste such as paper, plastic, metal, glass and inerts (ash, dust) may be separated manually and weighed and recorded and the component wise details of waste generated by each category of household may
be given in the proforma 3 below (Day 1)
Category of households (total of 10%
samples each)
Non biodegrad
able Waste (Gram) Total of
day 1
Paper compone
nt in 1 (Gram)
2
Plastic compone
nt in 1 (Gram)
3
Metal compone
nt in 1 (Gram)
4
Glass compone
nt in 1 (Gram)
5
Other non bio degradable
waste component in
1 (Gram) 6
Dust & other inert component in 1 (Gram)
7
High Income Households
900 50 100 30 70 330 300
Middle Income
Households 750 45 95 45 65 250 250
Low Income Households
700 40 80 40 65 175 300
(Day 2)
Category of households (total of 10%
samples each)
Non biodegrad
able Waste (Gram) Total of
day 1
Paper compone
nt in 1 (Gram)
2
Plastic compone
nt in 1 (Gram)
3
Metal compone
nt in 1 (Gram)
4
Glass compone
nt in 1 (Gram)
5
Other non bio degradable
waste component in
1 (Gram) 6
Dust & other inert component in 1 (Gram)
7
High Income Households
950 50 120 40 75 265 400
Middle Income
Households 800 50 100 40 80 180 350
Low Income Households
750 45 110 35 70 90 400

DETAILED PROJECT REPORT FOR MUNICIPAL SOLID WASTE
COLLECTION & TRANSPORTATION
142
(Day 3)
Category of households (total of 10%
samples each)
Non biodegra
dable Waste (Gram) Total of
day 1
Paper compone
nt in 1 (Gram)
2
Plastic compone
nt in 1 (Gram)
3
Metal compone
nt in 1 (Gram)
4
Glass compone
nt in 1 (Gram)
5
Other non bio degradable
waste component in
1 (Gram) 6
Dust & other inert component in 1 (Gram)
7
High Income Households
850 45 110 35 70 270 320
Middle Income
Households 760 40 93 50 60 247 270
Low Income Households
730 45 82 43 63 287 310
Average (Day 1+2+3) data given tables (above) (for group of samples taken in each category) Calculate
the average value for each cell by averaging the values in that cell for day 1, 2 and 3. For example, add the values in the paper column - High income cell for day 1, day 2 and day 3 and divide by 3.
Category Total (for all samples)
Paper (Gram)
Plastic (Gram)
Metal (Gram)
Glass (Gram)
Inerts (street sweepings, dust)
(Gram)
High Income Households 48.33 110.00 35.00 71.66 340.00
Middle Income Households 45.00 96.00 45.00 68.33 303.33
Low Income Households 43.33 90.66 39.33 66.00 336.66
average of waste generation rate per household/day in each category
(Divide the figures given in table for bio degradable waste and table above for non bio degradable waste by the number of samples taken in each category
Category Food Waste (Gram)
Paper (Gram)
Plastic (Gram)
Metal (Gram)
Glass (Gram)
Inserts (street sweepings, dust)
(Gram)
High Income Households 62.50 48.33 110.00 35.00 71.66 340.00
Middle Income Households 50.00 45.00 96.00 45.00 68.33 303.33
Low Income Households 37.53 43.33 90.66 39.33 66.00 336.66
Note: prepare similar details for commercial/institutional waste samples and add the quantities in the quantities
derived from household waste generation assessment.

DETAILED PROJECT REPORT FOR MUNICIPAL SOLID WASTE
COLLECTION & TRANSPORTATION
143
Summary table showing waste generated by total household in each category Put in this table the various components of waste generated per household/day as per table above X by
total households in each category
Category Total Food Waste (Gram)
2
Total Paper waste (Gram)
3
Total Plastic waste (Gram)
4
Total Metal waste (Gram)
5
Total Glass waste (Gram)
6
Other mixed waste
7
Total ash waste
(grams) 8
Total household
waste total of (2to8)
9
High Income
Households 7812.50 1208.25 2750.00 875.00 1791.50 7208.33 42500.00 64145.58
Middle Income
Households 6250.00 1125.00 2400.00 1125.00 1708.25 5641.66 37916.25 56166.16
Low Income
Households 4691.88 1083.25 2266.50 983.25 1650.00 4600.00 42082.50 57357.38
Total 18754.38 2333.25 7416.50 2983.25 5149.75 17449.99 122498.75 177669.12
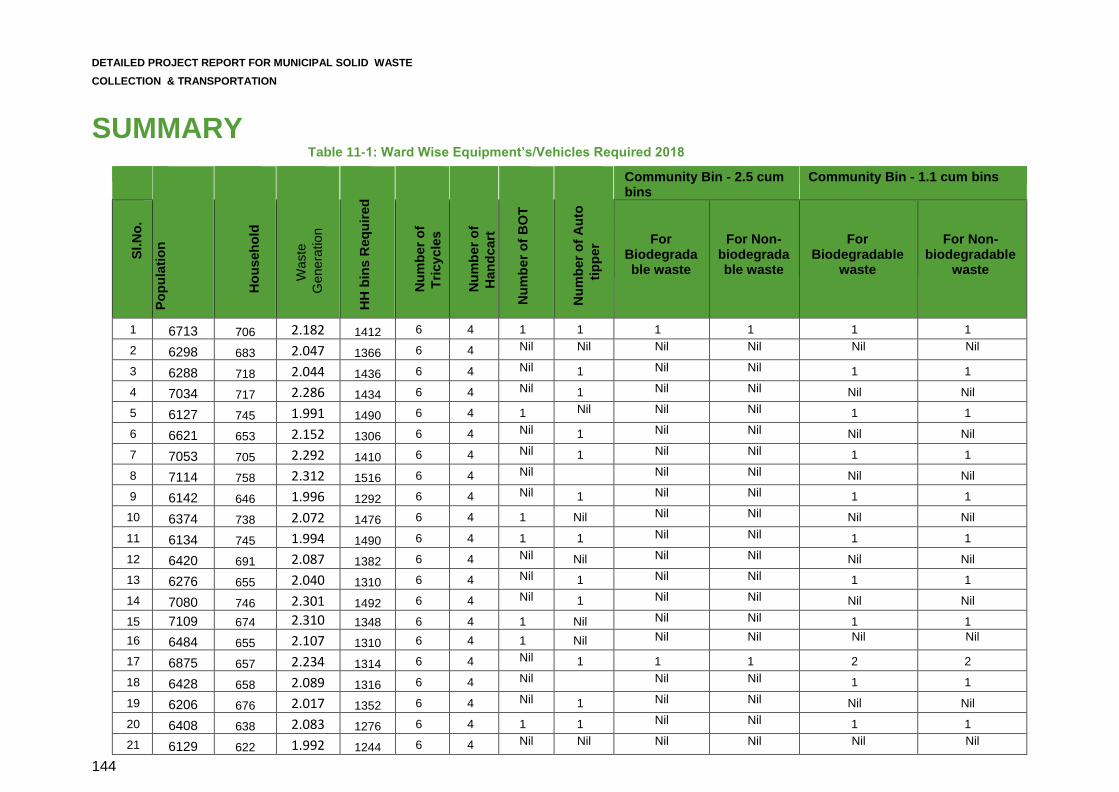
DETAILED PROJECT REPORT FOR MUNICIPAL SOLID WASTE
COLLECTION & TRANSPORTATION
144
SUMMARY Table 11-1: Ward Wise Equipment’s/Vehicles Required 2018
P
op
ula
tio
n
Ho
useh
old
Waste
Genera
tion
HH
bin
s R
eq
uir
ed
Nu
mb
er
of
Tri
cy
cle
s
Nu
mb
er
of
Han
dcart
Nu
mb
er
of
BO
T
Nu
mb
er
of
Au
to
tip
per
Community Bin - 2.5 cum bins
Community Bin - 1.1 cum bins
Sl.N
o.
For
Biodegradable waste
For Non-
biodegradable waste
For
Biodegradable waste
For Non-
biodegradable waste
1 6713 706 2.182 1412 6 4 1 1 1 1 1 1
2 6298 683 2.047 1366 6 4 Nil Nil Nil Nil Nil Nil
3 6288 718 2.044 1436 6 4 Nil 1 Nil Nil 1 1
4 7034 717 2.286 1434 6 4 Nil 1 Nil Nil Nil Nil
5 6127 745 1.991 1490 6 4 1 Nil Nil Nil 1 1
6 6621 653 2.152 1306 6 4 Nil 1 Nil Nil Nil Nil
7 7053 705 2.292 1410 6 4 Nil 1 Nil Nil 1 1
8 7114 758 2.312 1516 6 4 Nil Nil Nil Nil Nil
9 6142 646 1.996 1292 6 4 Nil 1 Nil Nil 1 1
10 6374 738 2.072 1476 6 4 1 Nil Nil Nil Nil Nil
11 6134 745 1.994 1490 6 4 1 1 Nil Nil 1 1
12 6420 691 2.087 1382 6 4 Nil Nil Nil Nil Nil Nil
13 6276 655 2.040 1310 6 4 Nil 1 Nil Nil 1 1
14 7080 746 2.301 1492 6 4 Nil 1 Nil Nil Nil Nil
15 7109 674 2.310 1348 6 4 1 Nil Nil Nil 1 1
16 6484 655 2.107 1310 6 4 1 Nil Nil Nil Nil Nil
17 6875 657 2.234 1314 6 4 Nil 1 1 1 2 2
18 6428 658 2.089 1316 6 4 Nil Nil Nil 1 1
19 6206 676 2.017 1352 6 4 Nil 1 Nil Nil Nil Nil
20 6408 638 2.083 1276 6 4 1 1 Nil Nil 1 1
21 6129 622 1.992 1244 6 4 Nil Nil Nil Nil Nil Nil

DETAILED PROJECT REPORT FOR MUNICIPAL SOLID WASTE
COLLECTION & TRANSPORTATION
145
22 6658 656 2.164 1312 6 4 Nil Nil Nil Nil 1 1
23 6482 687 2.107 1374 6 4 Nil 1 Nil Nil Nil Nil
24 6721 654 2.184 1308 6 4 Nil Nil Nil Nil 1 1
25 6310 607 2.051 1214 6 4 Nil Nil Nil Nil Nil Nil
Total 163484 17090 53.132 34180 150 100 7 13 2 2 14 14
Note: •
REFER CPHEEO manual 2016” Secondary waste storage capacities should be designed to accommodate at least double the expected daily
in-flow of waste” – sub section 2.3.9, pageno.179
Gem portals, E marketing ministry of commerce

146