Embed Size (px)
Citation preview
SEMPO 2016-2040 Metropolitan Transportation Plan
Metropolitan Transportation Plan 2016-2040
In partnership with:
Adopted: Amended: 2/17/2016 None at this time
Amendments and Updates
None at this time.
The preparation of this report was financed in part by the U.S. Department of Transportation, Federal Highway Administration, and Federal Transit Administration in cooperation with the Missouri Department of Transportation and the Illinois Department of Transportation. The opinions, findings, and conclusions expressed in this report are not necessarily those of the Federal Highway Administration, Federal Transit Administration, Missouri Department of Transportation, or Illinois Department of Transportation.
For Information Contact:
Ryan Shrimplin Drew Christian City Planner Director of Planning City of Cape Girardeau SEMO Regional Planning Commission 401 Independence St. 1 W. Saint Joseph St., P.O. Box 366 Cape Girardeau, MO 63703 Perryville, MO 63775 573-339-6327 office 573-547-8357 office 573-339-6303 fax 573-547-7283 fax [email protected] [email protected]
Southeast Metropolitan Planning Organization
Board of Directors
Voting Members: Chairperson – Chauncy Buchheit, Southeast Missouri Regional Planning & Economic Development
Commission Vice-Chairperson – Jim Roach, City of Jackson
Dwain Hahs, City of Jackson Charlie Herbst, Cape Girardeau County Scott Meyer, City of Cape Girardeau Tom Mogelnicki, Cape Girardeau County Transit Authority Harry Rediger, City of Cape Girardeau
Ex-Officio (Non-Voting) Members: Joe Aden, Village of East Cape Girardeau Mark Bechtel, Federal Transit Administration – Region 7 David Blalock, Bootheel Regional Planning Commission Mike Brandon, Missouri Department of Transportation Jamie Burger, Scott County Sheila Clements, Federal Transit Administration - Region 5 Jeffrey Keirn, Illinois Department of Transportation Michael Latuszek, Federal Highway Administration - Missouri Division Kathy Mangels, Southeast Missouri State University Transit Harold McNelly, Alexander County Dan Overbey, Southeast Missouri Regional Port Authority Mark Phillips, Cape Special Road District Matt Seiler, Missouri Department of Transportation Mark Shelton, Missouri Department of Transportation Betsy Tracy, Federal Highway Administration - Illinois Division
Staff: Molly Hood, City of Cape Girardeau – Executive Director Ryan Shrimplin, City of Cape Girardeau – Transportation Planner
Technical Planning Committee (TPC)
Voting Members: Chairperson – Kelley Watson, Cape Girardeau County Transit Authority Vice Chairperson – Larry Payne, Cape Girardeau Area Chamber of Commerce – Transportation
Committee
Joe Aden, Village of East Cape Girardeau David Blalock, Bootheel Regional Planning Commission Rodney Bollinger, City of Jackson Mike Brandon, Missouri Department of Transportation Jamie Burger, Scott County Drew Christian, Southeast Missouri Regional Planning and Economic Development Commission Jeff Denny, Alexander County Highway Department Ron Eskew, City of Scott City Beth Glaus, Southeast Missouri State University Transit Charlie Herbst, Cape Girardeau County Joe Killian, Missouri Department of Transportation Bruce Loy, City of Cape Girardeau John Mehner, Cape Girardeau Area MAGNET Tom Mogelnicki, Cape Girardeau County Transit Authority Carrie Nelson, Illinois Department of Transportation Dan Overbey, Southeast Missouri Regional Port Authority Mark Phillips, Cape Special Road District
Ex-Officio (Non-Voting) Members: Mark Bechtel, Federal Transit Administration – Region 7 Dion Knipp, Missouri Department of Transportation – Multi-Modal/Transit Tom Caldwell, Illinois Department of Transportation Sheila Clements, Federal Transit Administration - Region 5 Michael Latuszek, Federal Highway Administration - Missouri Division Brian Okenfuss, Missouri Department of Transportation Matt Seiler, Missouri Department of Transportation Betsy Tracy, Federal Highway Administration - Illinois Division Eva Voss, Missouri Department of Transportation
Staff: Molly Hood, City of Cape Girardeau – Executive Director Ryan Shrimplin, City of Cape Girardeau – Transportation Planner

Resolution of Adoption
Table of Contents Glossary of Terms...................................................................................................................................... 2
Section 1: Introduction .............................................................................................................................. 3
Southeast Metropolitan Planning Organization ....................................................................................... 3
Geographic Region Covered by the MTP .................................................................................................. 3
MPO Basics ................................................................................................................................................ 5
Section 2: Planning Process ....................................................................................................................... 6
MTP Development .................................................................................................................................... 6
Relationship between the MTP and Other Local Plans............................................................................. 7
Public Participation ................................................................................................................................... 7
Environmental Justice and Non-Discrimination in Transportation Services ............................................. 8
Title VI Nondiscrimination Policies ........................................................................................................... 8
Mobility and Disability .............................................................................................................................. 9
Consultation with Other Officials and Organizations ............................................................................. 10
Section 3: MTP Vision, Goals, and Objectives .......................................................................................... 11
Overview ................................................................................................................................................. 11
Vision ....................................................................................................................................................... 11
Goals and Objectives ............................................................................................................................... 11
Section 4: Existing Conditions .................................................................................................................. 15
Overview ................................................................................................................................................. 15
Roadways ................................................................................................................................................ 15
Bridges .................................................................................................................................................... 20
Transit Services ....................................................................................................................................... 22
Aviation System ...................................................................................................................................... 23
Freight ..................................................................................................................................................... 24
Inter-modal Systems ............................................................................................................................... 26
Bicycle and Pedestrian Systems .............................................................................................................. 27
Transportation System Safety ................................................................................................................. 31
Strategic Highway Safety Plan and Emergency Relief/Disaster Preparedness ....................................... 33
Natural Hazards/Emergency Planning .................................................................................................... 34
Environmental Impact Mitigation ........................................................................................................... 35
Air Quality ............................................................................................................................................... 35
Transportation System Security .............................................................................................................. 36
Section 5: Factors Affecting Transportation ............................................................................................ 37
Overview ................................................................................................................................................. 37
Demographics ......................................................................................................................................... 37
Employment ............................................................................................................................................ 40
Housing and Commercial Building Starts ................................................................................................ 41
Existing Zoning ........................................................................................................................................ 41
Future Land Use ...................................................................................................................................... 44
Transportation Corridor Development ................................................................................................... 44
Section 6: Future Transportation Needs .................................................................................................. 49
Overview ................................................................................................................................................. 49
Section 7: Alternatives Analysis ............................................................................................................... 53
Overview ................................................................................................................................................. 53
Sustained Growth Scenario Roadway Alternatives ................................................................................ 53
Enhanced Growth Scenario Roadway Alternatives ................................................................................ 54
Section 8: Recommended Plan ................................................................................................................ 57
Overview ................................................................................................................................................. 57
Funding Future Transportation Investments .......................................................................................... 57
Fiscally Constrained Investment Plan 2016-2040 ................................................................................... 57
Illustrative Projects ................................................................................................................................. 68
Implementation and Supporting Policies................................................................................................ 71
Section 9: Performance Measures ........................................................................................................... 73
Overview ................................................................................................................................................. 73
SEMPO Performance Measures .............................................................................................................. 73
Section 10: Appendix ............................................................................................................................. 75
Federal Requirements ............................................................................................................................. 75
Potential Funding Sources ...................................................................................................................... 78
Supporting Policies .................................................................................................................................. 86
Table of Tables Table 2-1: 2014 HHS Poverty Guidelines ...................................................................................................... 9 Table 4-2: Obsolete and Deficient Bridges Table ........................................................................................ 21 Table 5-1: Population Change: 2000-2010.................................................................................................. 37 Table 5-2: Population Projections – Sustained Growth Scenario ............................................................... 39 Table 5-3: Population Projections – Enhanced Growth Scenario ............................................................... 39 Table 5-4: Employment Projections – Sustained Growth ........................................................................... 40 Table 5-5: Employment Projections – Enhanced Growth ........................................................................... 40 Table 8-1: MPO Financial Summary ............................................................................................................ 58 Table 8-2: City of Cape Girardeau Anticipated Revenues ........................................................................... 59 Table 8-3: City of Jackson Anticipated Revenues ........................................................................................ 59 Table 8-4: Cape Girardeau County Transit Authority Anticipated Revenues ............................................. 60 Table 8-5: Cape Special Road District Anticipated Revenues ..................................................................... 60 Table 8-6: SEMO Regional Port Authority Anticipated Revenues ............................................................... 61 Table 8-7: Southeast Missouri State University Anticipated Revenues ...................................................... 61 Table 8-8: City of Cape Girardeau Anticipated Expenditures ..................................................................... 62 Table 8-9: City of Jackson Anticipated Expenditures .................................................................................. 62 Table 8-10: Cape Girardeau County Transit Authority Anticipated Expenditures ...................................... 63 Table 8-11: Cape Special Road District Anticipated Expenditures .............................................................. 63 Table 8-12: SEMO Regional Port Authority Anticipated Expenditures ....................................................... 63 Table 8-13: Southeast Missouri State University Anticipated Expenditures .............................................. 64 Table 9-1: MoDOT MAP-21 Performance Measures .................................................................................. 74
Table of Figures Figure 1-1: SEMPO MPA ................................................................................................................................ 4 Figure 4-1: Functional Classification Map ................................................................................................... 16 Figure 4-2: Congressional High Priority Corridors ....................................................................................... 18 Figure 4-3: Roadway Capacity ..................................................................................................................... 19 Figure 4-5: Rail Ownership & Trackrights ................................................................................................... 25 Figure 4-6: City of Cape Girardeau Existing Trails ....................................................................................... 29 Figure 4-7: Jackson Trials Plan .................................................................................................................... 30 Figure 4-8: Accidents Map .......................................................................................................................... 32 Figure 5-1: Population Change: 1990-2010 ................................................................................................ 38 Figure 5-2: Combined Cities of Cape Girardeau and Jackson Building Starts ............................................. 41 Figure 5-3: City of Cape Girardeau Zoning Map .......................................................................................... 42 Figure 5-4: Jackson Zoning Map .................................................................................................................. 43 Figure 5-5: Cape Girardeau Future Land Use Plan ...................................................................................... 46 Figure 5-6: Jackson Future Land Use Plan ................................................................................................... 47 Figure 5-7: Priority Transportation Corridors ............................................................................................. 48 Figure 6-1: Sustained Growth Development Forecast ................................................................................ 51 Figure 6-2: Enhanced Growth Development Forecast ................................................................................ 52 Figure 7-1: Sustained Growth Roadway Alternatives ................................................................................. 55 Figure 7-2: Enhanced Growth Roadway Alternatives ................................................................................. 56
2 Introduction | SEMPO 2016-2040 Metropolitan Transportation Plan
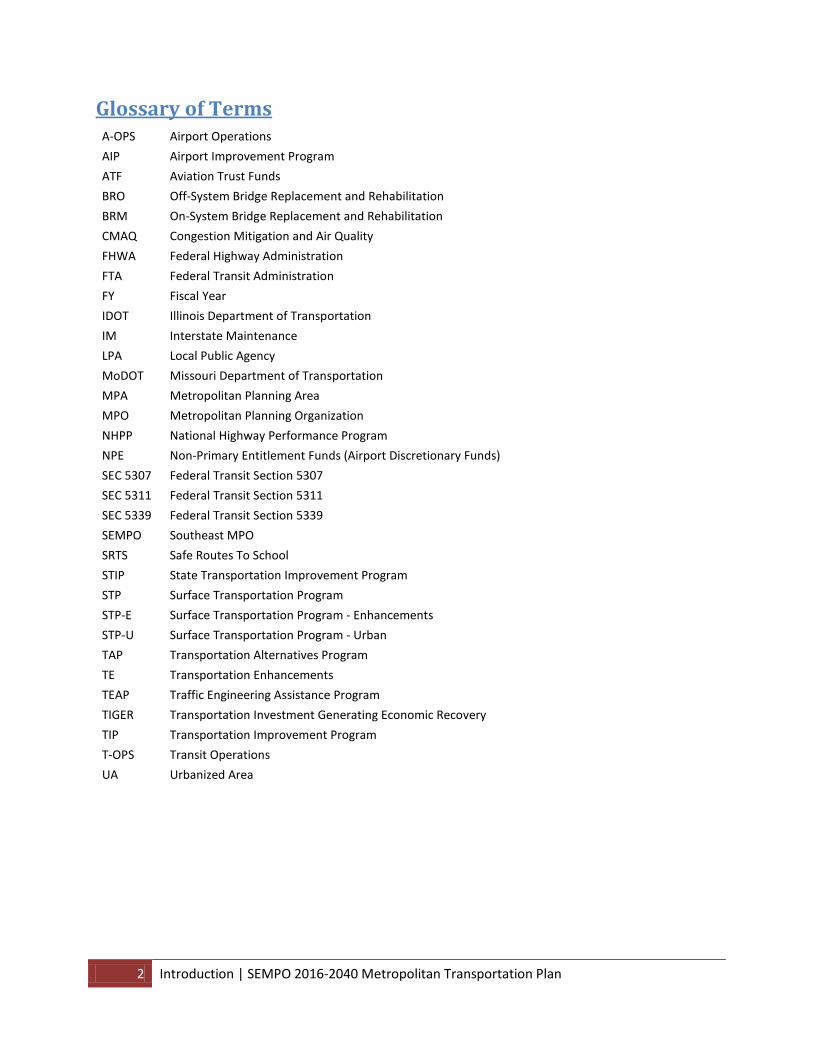
Glossary of Terms A-OPS Airport Operations AIP Airport Improvement Program ATF Aviation Trust Funds BRO Off-System Bridge Replacement and Rehabilitation BRM On-System Bridge Replacement and Rehabilitation CMAQ Congestion Mitigation and Air Quality FHWA Federal Highway Administration FTA Federal Transit Administration FY Fiscal Year IDOT Illinois Department of Transportation IM Interstate Maintenance LPA Local Public Agency MoDOT Missouri Department of Transportation MPA Metropolitan Planning Area MPO Metropolitan Planning Organization NHPP National Highway Performance Program NPE Non-Primary Entitlement Funds (Airport Discretionary Funds) SEC 5307 Federal Transit Section 5307 SEC 5311 Federal Transit Section 5311 SEC 5339 Federal Transit Section 5339 SEMPO Southeast MPO SRTS Safe Routes To School STIP State Transportation Improvement Program STP Surface Transportation Program STP-E Surface Transportation Program - Enhancements STP-U Surface Transportation Program - Urban TAP Transportation Alternatives Program TE Transportation Enhancements TEAP Traffic Engineering Assistance Program TIGER Transportation Investment Generating Economic Recovery TIP Transportation Improvement Program T-OPS Transit Operations UA Urbanized Area
3 Introduction | SEMPO 2016-2040 Metropolitan Transportation Plan
Section 1: Introduction
Southeast Metropolitan Planning Organization The Southeast Metropolitan Planning Organization (SEMPO) is the designated Metropolitan Planning Organization (MPO) for the Cape Girardeau-Jackson-East Cape Girardeau urbanized area and consists of a Board of Directors, a Technical Planning Committee (TPC), and the planning and administrative staff.
The Board of Directors consists of appointed representatives of the City of Cape Girardeau, City of Jackson, Cape Girardeau County, Cape Girardeau County Transit Authority (CTA), Southeast Missouri State University, Cape Special Road District, and the Southeast Missouri Regional Planning Commission (SEMO RPC) as voting members and the Village of East Cape Girardeau, Alexander County, Scott County, SEMO Regional Port Authority, Bootheel RPC, Missouri Department of Transportation (MoDOT), Illinois Department of Transportation (IDOT), Federal Highway Administration-Missouri Division (FHWA-MO), Federal Highway Administration-Illinois Division (FHWA-IL), and Federal Transit Administration (FTA) Regions 5 and 7 as ex-officio members. The TPC consists of staff representatives from these agencies and acts in an advisory capacity to the Board of Directors.
SEMPO was formally established with the development of membership, bylaws, and the completion of a Memorandum of Understanding (MOU) in February of 2013. The MOU was drafted with cooperation of the organizations comprising the Board of Directors and was approved by the Governors of Missouri and Illinois on March 12, 2013 and February 7, 2013, respectively.
This Metropolitan Transportation Plan (MTP) is the first such plan for SEMPO and uses population, land use, socio-economic data, traffic data, accident data, and other information that affects the transportation system in an effort to plan for a twenty year timeframe.
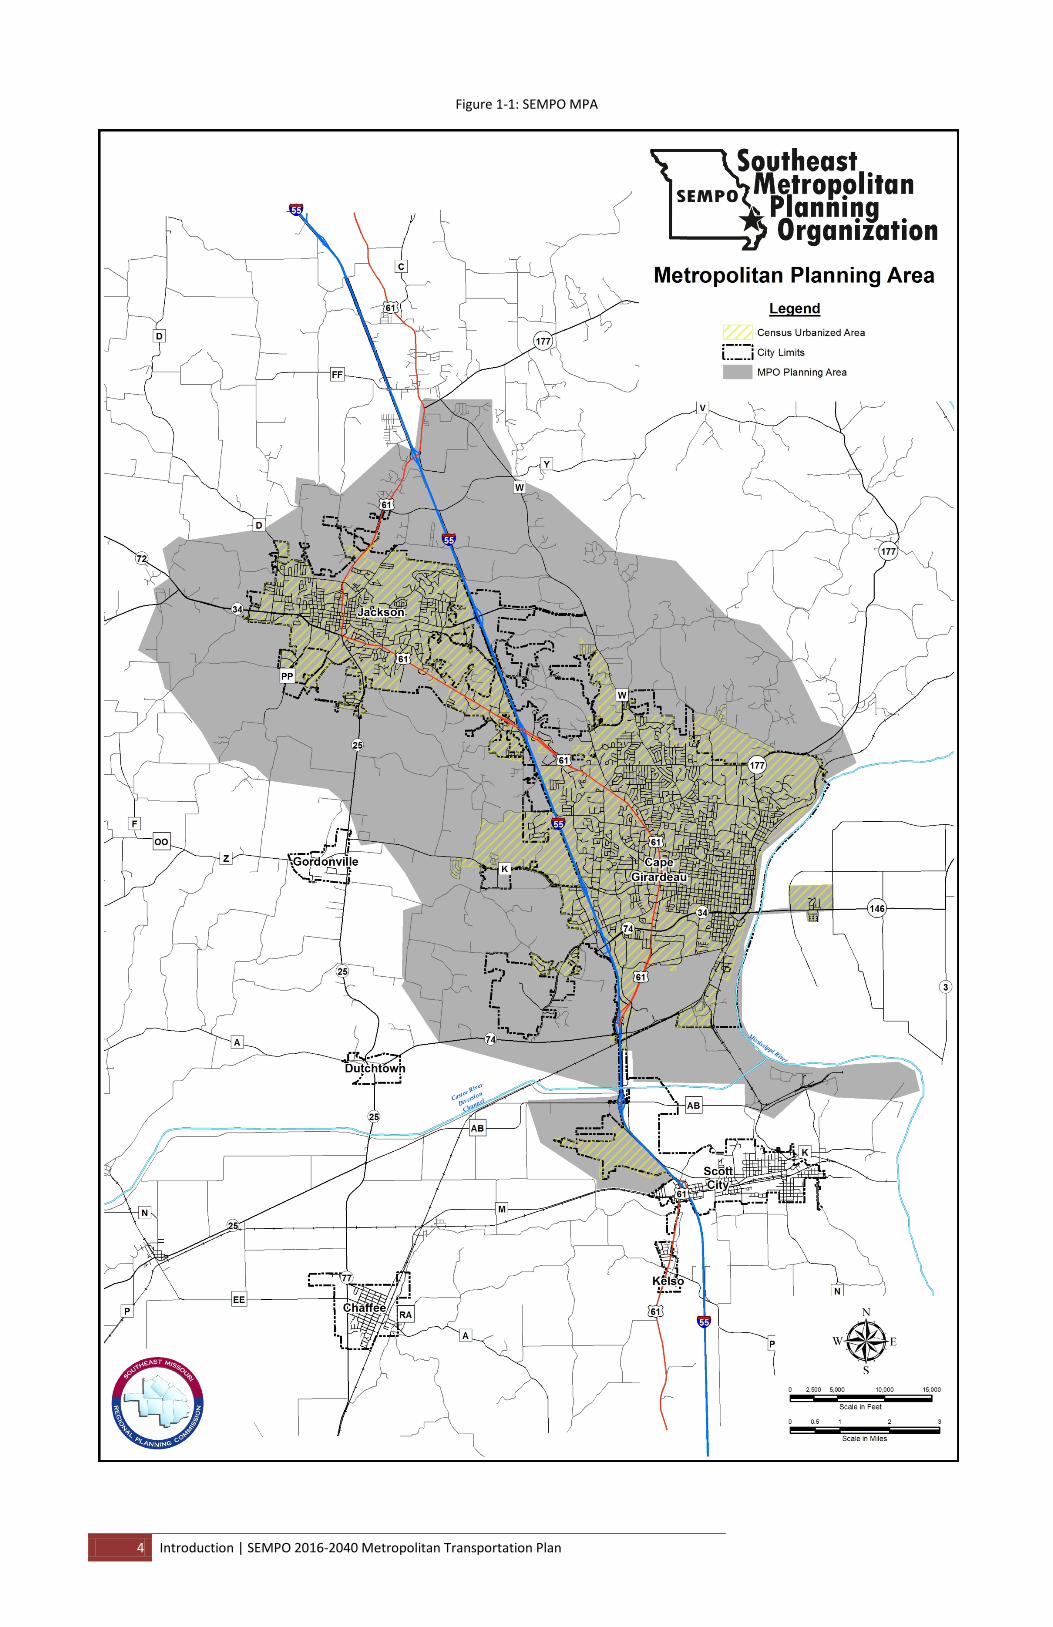
Geographic Region Covered by the MTP The MTP covers the entire planning area of the MPO, known as the Metropolitan Planning Area (MPA). The SEMPO MPA, as delineated by the SEMPO Board of Directors and approved by the Governors of Missouri and Illinois, contains the urbanized area and portions of unincorporated, non-urbanized areas within Cape Girardeau and Scott Counties in Missouri and Alexander County in Illinois, with an approximate population of 53,079 according to the 2012 American Communities Survey (ACS) 5-year estimate. The planning area covers approximately 117 square miles, with 111.7 square miles in Cape Girardeau County, 4.7 in Alexander County, and 0.6 in Scott County. Figure 1-1 contains a map of the SEMPO MPA.
4 Introduction | SEMPO 2016-2040 Metropolitan Transportation Plan
Figure 1-1: SEMPO MPA
5 Introduction | SEMPO 2016-2040 Metropolitan Transportation Plan
MPO Basics When an area has been identified as an urbanized area1 (UA) by the US Department of Commerce Census Bureau, and designated as such by the Office of Management and Budget, a transportation planning organization such as a Metropolitan Planning Organization must be formed by agreement of the Governor of the state and “units of general purpose local governments representing 75% of the affected metropolitan population” to coordinate metropolitan transportation planning and transportation related investments2.
A Metropolitan Planning Organization is a transportation policy-making body consisting of representatives from local government and transportation agencies with authority and responsibility in metropolitan planning areas. Federal legislation passed in the early 1970s required the formation of an MPO for any urbanized area (UA).
An MPO has five “core” functions3:
1. To establish and manage a fair and impartial setting for effective regional decision-making in the metropolitan area.
2. Evaluate transportation alternatives, scaled to the size and complexity of the region, to the nature of its transportation issues, and to the realistically available options.
3. Develop and update a long-range transportation plan for the metropolitan area covering a planning horizon for at least 20 years that fosters (1) mobility and access for people and goods, (2) efficient system performance and preservation, and (3) quality of life.
4. Develop a Transportation Improvement Program based on the long-range transportation plan and designed to serve the area’s goals, using spending, regulating, operating, management, and financial tools.
5. Involve the general public and all the significantly affected sub-groups in the four essential functions listed above.
An MPA is defined in the Code of Federal Regulations4 as the geographic area in which the metropolitan planning process must be carried out5. “The MPA boundary shall, as a minimum, cover the Urbanized Area and the contiguous area(s) likely to become urbanized within the twenty- year forecast period covered by the transportation plan. The MPA boundary may encompass the entire Metropolitan Statistical Area or Consolidated Metropolitan Statistical Area, as defined by the Census Bureau.”
By law, the MTP must be updated at least every 5 years and have at least a twenty-year planning horizon (meaning that the plan tries to anticipate the needs and required resources twenty years into the future).
1 http://www.trbcensus.com/urbanized.html 2 Federal Surface Transportation Assistance Act of 1973 3 The Metropolitan Transportation Planning Process: Key Issues. A Publication of the Metropolitan Capacity Building Program. http://www.planning.dot.gov/documents/BriefingBook/BBook.htm 4 23 CFR 450.308 5 Detailed in 23 CFR 450.308
6 Planning Process | SEMPO 2016-2040 Metropolitan Transportation Plan
Section 2: Planning Process
MTP Development Development of the SEMPO MTP was a cooperative process that included planning, technical, and engineering staffs of SEMPO members, the Missouri and Illinois Departments of Transportation, natural resource agencies, local elected officials, non-profit organizations, private agencies, and community residents.
Public participation in the development and future updates of this plan was a priority for SEMPO. Open meetings and opportunities to address the TPC and Board of Directors occurred during the Public Comment period of every TPC and Board meeting. Participation in focus groups and ad hoc committees occurred on an “as needed” basis, with information about the meetings provided at SEMPO offices, on SEMPO’s website, through documentation made available at public venues, and availability of formal policy documents such as the Public Participation Plan.
For SEMPO, the MTP development process began with an inventory of the current transportation system as an inter-related, multi-modal system, followed by street and roadway traffic counts for average annual daily traffic (AADT).
Next, the population from the 2010 Census was used as a base population and an estimate of future population growth was forecast out to 2040. 2010-2040 growth rates were based on the Missouri State Demographer forecasts and US Census Bureau data and were developed by SEMO RPC. SEMPO staff also inventoried the current land uses within the MPA in preparation for forecasting land uses for the MTP planning horizon out to 2040 through the use of data from Cape Girardeau, Scott, and Alexander Counties.
Based on population growth forecasts, an estimate of future development and housing growth for the SEMPO area was developed. Housing was evaluated using 2010 Census data and building permits, to help determine a level of existing housing stock, and then using an average household size to estimate the number of additional housing units needed, staff used undeveloped parcels to identify potential residential building sites. Undeveloped parcels suitable for residential development were allocated to remaining estimated unmet housing needs to meet the total number of housing units required for 2040.
Known and probable future commercial development locations were identified and located throughout the MPA. For this, studies of development plans and existing land use and transportation plans for the region were used, in addition to consultation with city, county, and state agencies and local business leaders.
Using estimates of future land use needs allowed for the forecasting of estimated future travel demand. To accomplish this, SEMPO and SEMO RPC staff analyzed the projected growth of population, households, developed land, and vehicle trips in the MPA.
7 Planning Process | SEMPO 2016-2040 Metropolitan Transportation Plan
Determining the future demand for travel and strategies for accommodating this demand allowed the planning staff to determine the general level and type of infrastructure that will be necessary over the next 20 years and to develop estimates for the cost of new transportation infrastructure.
Relationship between the MTP and Other Local Plans The MTP takes into consideration the local comprehensive and special purpose plans such as special districts, zoning and land use, transit and roadway plans, airport and aviation plans, water and rail transport, air quality and congestion plans if available.
In addition, the MTP strives to be consistent with local growth and economic development plans; all of which have public involvement components to their development. Local and regional plans used in the development of this plan include, along with the year of adoption:
• Cape Girardeau County Hazard Mitigation Plan - 2011 • Cape Girardeau County Emergency Management Plan - 2013 • City of Cape Girardeau Comprehensive Plan - 2008 • City of Jackson Comprehensive Plan - 2009 • Public Transit-Human Services Transportation Coordination Plan - 2013 • SEMO RPC Long Range Transportation Plan - 2015 • Missouri River Freight Corridor Assessment & Development Plan - 2011 • Missouri Statewide Transportation Improvement Program - 2016 • Missouri State Rail Plan - 2012 • Missouri State Highway Safety & Performance Plan - 2013 • Illinois Statewide Transportation Improvement Program - 2016
Public Participation As an MPO, SEMPO has the responsibility of coordinating the metropolitan transportation planning process for the metropolitan area. This responsibility requires that SEMPO actively involve all affected parties in an open, cooperative, and collaborative process, and provide meaningful opportunities to influence transportation decisions6.
FHWA and FTA have identified several performance standards for effective public participation, and these standards are supported by SEMPO7. These standards include:
1. Early and continuous involvement 2. Reasonable public availability of technical and other information 3. Collaborative input on alternatives, evaluation criteria, and mitigation needs 4. Open public meetings where matters related to transportation policies, programs, and projects
are being considered, and
6 Participation section from requirements for MTP content 23 CFR November 15, 2012 7 The Metropolitan Tranportation Planning Process: Key Issues. A Publication of the Metropolitan Capacity Building Program – http://www.planning.dot.gov/documents/BriefingBook/BBook.htm
8 Planning Process | SEMPO 2016-2040 Metropolitan Transportation Plan
5. Open access to decision making process prior to closure
SEMPO has adopted a Public Participation Plan, which is available for viewing online at http://www.southeastmpo.org/planning-documents/.
Environmental Justice and Non-Discrimination in Transportation Services The Environmental Protection Agency defines environmental justice as “the fair treatment and meaningful involvement of all people regardless of race, color, national origin, or income with respect to the development, implementation, and enforcement of environmental laws, regulations, and policies.”
Executive Order 12898 and FHWA Order 6640.23A require FHWA, to the greatest extent allowed by law, administer and implement its programs, policies, and activities that affect human health or the environment so as to identify and avoid “disproportionately high and adverse” effects on minority and low-income populations. The orders are also intended to promote nondiscrimination in federal programs that affect human health and the environment. They aim to provide minority and low-income persons access to public information and public participation in matters relating to human health and the environment8.
According to Federal publication, Environmental Justice has three fundamental principles:
1. To avoid, minimize, or mitigate disproportionately high and adverse human health and environmental effects, including social and economic effects, on minority populations and low-income populations.
2. To ensure the full and fair participation by all potentially affected communities in the transportation decision-making process.
3. To prevent the denial of, reduction in, or significant delay in the receipt of benefits by minority and low-income populations.
When transportation projects and investments are considered, SEMPO is required to ensure that environmental justice requirements and principles are integrated into the processes and plans, taking into consideration positive and negative impacts of projects and programs on areas of high minority and/or low-income populations so that disproportionate negative impacts are not placed on the populations of these areas.
Title VI Nondiscrimination Policies It is the policy of SEMPO that no person shall be excluded from participation in, denied the benefit of, or subjected to discrimination under any program or activity receiving Federal financial assistance on the basis of race, color, or national origin under Title VI and related nondiscrimination statutes.
To certify compliance with environmental justice, SEMPO incorporates the following activities into the planning process: 8 http://www.epa.gov/environmentaljustice/basics/ejbackground.html
9 Planning Process | SEMPO 2016-2040 Metropolitan Transportation Plan
1. Enhancement of analytical capabilities to ensure that the MTP and the Transportation Improvement Program (TIP) comply with Title VI.
2. Identify residential, employment, and transportation patterns of low-income and minority populations so that their needs can be identified and addressed, and the benefits and burdens of transportation investments will be fairly distributed.
3. Evaluate and, where necessary, improve public involvement processes to eliminate participation barriers and engage minority and low-income population in transportation decision-making.
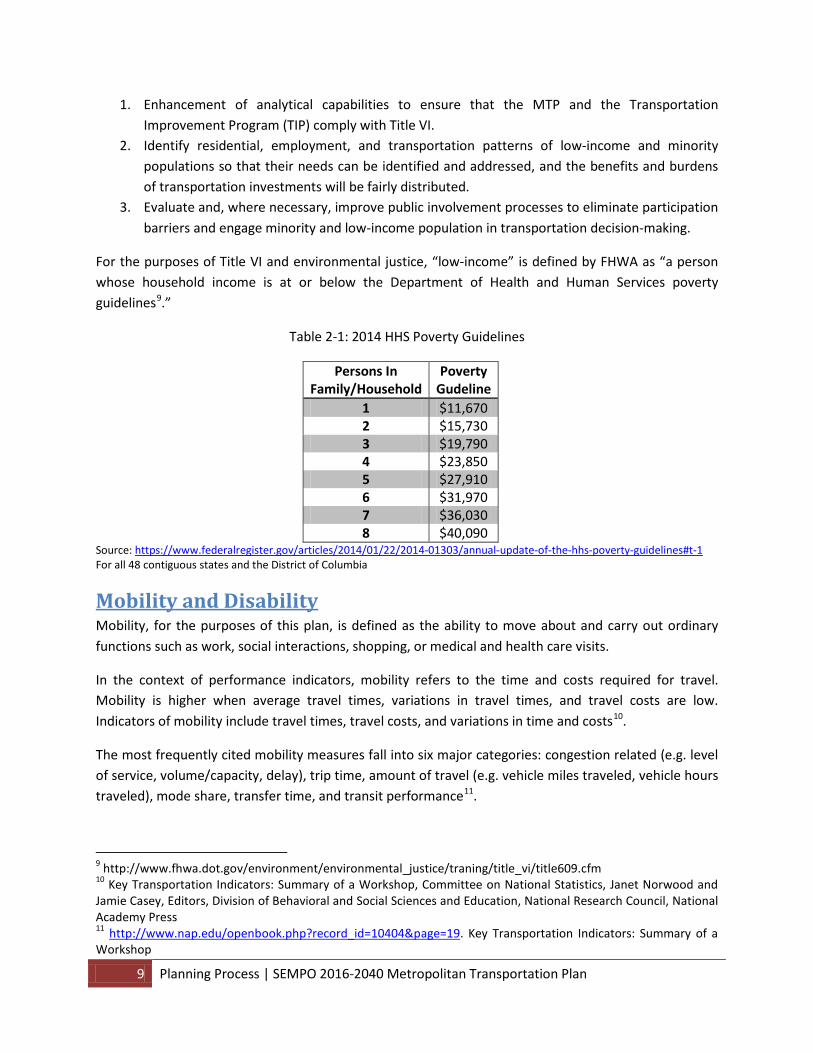
For the purposes of Title VI and environmental justice, “low-income” is defined by FHWA as “a person whose household income is at or below the Department of Health and Human Services poverty guidelines9.”
Table 2-1: 2014 HHS Poverty Guidelines
Persons In Family/Household
Poverty Gudeline
1 $11,670 2 $15,730 3 $19,790 4 $23,850 5 $27,910 6 $31,970 7 $36,030 8 $40,090
Source: https://www.federalregister.gov/articles/2014/01/22/2014-01303/annual-update-of-the-hhs-poverty-guidelines#t-1 For all 48 contiguous states and the District of Columbia
Mobility and Disability Mobility, for the purposes of this plan, is defined as the ability to move about and carry out ordinary functions such as work, social interactions, shopping, or medical and health care visits.
In the context of performance indicators, mobility refers to the time and costs required for travel. Mobility is higher when average travel times, variations in travel times, and travel costs are low. Indicators of mobility include travel times, travel costs, and variations in time and costs10.
The most frequently cited mobility measures fall into six major categories: congestion related (e.g. level of service, volume/capacity, delay), trip time, amount of travel (e.g. vehicle miles traveled, vehicle hours traveled), mode share, transfer time, and transit performance11.
9 http://www.fhwa.dot.gov/environment/environmental_justice/traning/title_vi/title609.cfm 10 Key Transportation Indicators: Summary of a Workshop, Committee on National Statistics, Janet Norwood and Jamie Casey, Editors, Division of Behavioral and Social Sciences and Education, National Research Council, National Academy Press 11 http://www.nap.edu/openbook.php?record_id=10404&page=19. Key Transportation Indicators: Summary of a Workshop
10 Planning Process | SEMPO 2016-2040 Metropolitan Transportation Plan
Disability is defined by the Americans with Disabilities Act of 1990 (ADA) as any individual who has a physical or mental impairment which substantially limits one or more of such person’s major life activities, has a record of such impairment, or is regarded as having such an impairment.
The 2010 Census data in the Demographics Section of this plan presents the extent of the disabled and elderly populations within the MPA, taken from the best available information.
Consultation with Other Officials and Organizations Metropolitan Planning Organizations are encouraged to “consult with officials responsible for other types of planning activities that are affected by transportation in the area (including State and local planned growth, economic development, environmental protection, airport operations, and freight movements) or to coordinate its planning process, to the maximum extent practicable, with such planning activities12.”
SEMPO consults with representatives of municipalities and counties within the MPA, as well as MoDOT, IDOT, FHWA, and FTA on a regular basis, and other agencies such as human service transportation providers, environmental, natural resource, and freight interests on an as needed basis.
12 H.R.3-Section 5303. Metropolitan transportation planning
11 MTP Vision, Goals, and Objectives | SEMPO 2016-2040 Metropolitan Transportation Plan
Section 3: MTP Vision, Goals, and Objectives
Overview The following vision, goals, and objectives of the MTP where developed by the TPC and approved by the Board of Directors and represent what this plan is trying to achieve and how it will do so.
Vision To provide and maintain a safe and efficient transportation network for all users that facilitates the responsible physical and economic development of the metropolitan area.
Goals and Objectives The following goals and objectives, presented alphabetically, have been established to ensure the MTP achieves the vision. They will serve as the core criteria for evaluating progress in implementing the plan.
Accessibility Promote alternative transportation options for area residents and employees that are reliable and accessible to all users.
• Enhance transit services by providing more reliable service, improved passenger information and additional routes to communities outside the metropolitan area
• Establish regional transit services by providing intra-regional service to metropolitan area communities and inter-regional service to areas outside the metropolitan area
• Encourage the development of complete streets that accommodate the transportation needs of all users including vehicular traffic, transit, bikes, and pedestrians
• Strengthen bicycle and pedestrian access to roadways and transit facilities • Promote transit service to major activity and employment centers • Place a high priority on serving the needs of transportation disadvantaged including the elderly
and low-income residents
Possible actions to achieve this goal:
• Transit Passenger Surveys • Transit Regional Study • Transit Targeted Marketing • Bicycle/Pedestrian Plan • Increasing Transit Options to Underserved Populations • Sidewalk Inventories/ADA Gaps
12 MTP Vision, Goals, and Objectives | SEMPO 2016-2040 Metropolitan Transportation Plan
Economic Development Promote the economic growth of the metropolitan area by providing a safe, secure, reliable, and efficient transportation system.
• Improve the operating efficiency of the existing network • Reduce travel time, delays, and hazards • Reduce vehicle miles traveled on congested roadways • Foster strategies that reduce the growth in peak period travel • Encourage the “Complete Streets” approach to roadway design • Develop transportation system improvements that prevent accidents and minimize losses • Promote the efficient movement of people and goods by linking the various modes of
transportation • Promote connections between transportation modes that support the effective shipment of
freight • Focus transportation system improvements to support and promote tourism
Possible actions to achieve this goal:
• Freight Movement Study • Multi-modal Coordination Assessment
Environmental Protection Protect the environment while promoting energy conservation and improving the quality of life.
• Avoid disproportionate adverse impacts on low income and minority communities • Support alternative transportation modes to improve air quality • Encourage use of alternative fuels and technologies in motor vehicle, fleet, and transit
applications • Preserve and enhance scenic views of an access to historic, cultural and other attractive features • Minimize impacts to the environment by avoiding sensitive environmental features or by
identifying relevant mitigation measure when possible and feasible
Possible actions to achieve this goal:
• Alternate Fueling Infrastructure Study
Funding Develop innovative funding sources and strategies for transportation improvements.
• Ensure adequate funding to preserve and maintain the integrity of the existing transportation infrastructure
• Develop transportation investment decisions that maximize the full benefits of the system while considering the full costs
13 MTP Vision, Goals, and Objectives | SEMPO 2016-2040 Metropolitan Transportation Plan
• Give funding priority to those transportation needs identified in state, regional, and local transportation system plans
• Consider the funding implications of federal and state actions on the regional transportation system and services
• Promote public-private partnerships in addressing transportation needs
Possible actions to achieve this goal:
• Highway Safety Improvement Program Applications
Land Use Coordination Improve the coordination between the development of the transportation network and land use planning.
• Encourage the concentration of employment and activity sites within primary transportation and transit corridors to maximize transportation efficiency
• Encourage local and regional land use planning to promote smart growth • Emphasize the importance of access management in preserving corridor capacity and enhancing
travel safety • Focus transportation system improvements to support and promote tourism
Possible actions to achieve this goal:
• Transit Oriented Development Study/Guideline Development • Parking Studies • Complete Streets Policy Development
Public Involvement Support community involvement in the transportation planning process.
• Inform the public about transportation issues in a clear and concise manner • Involve the public to encourage their participation in the planning process • Conduct the plan in an inclusive manner to ensure the process is fair and open to all individuals • Ensure that plans respond to the diversity of community needs • Encourage local government agencies to formally adopt the MTP recommendation
Possible actions to achieve this goal:
• Public Planning Charrettes • Ad Hoc Stakeholder Committees
Regionalism Support local and regional transportation and land use planning needs.
14 MTP Vision, Goals, and Objectives | SEMPO 2016-2040 Metropolitan Transportation Plan
• Promote the efficient movement of people and goods by linking the various modes of transportation
• Promote connections between transportation modes that support the effective shipment of freight
• Preserve and develop corridors for future transportation systems • Ensure compatibility with the transportation facilities of adjacent municipalities and counties • Support statewide transportation initiatives that affect transportation in the metropolitan area • Utilize mutual aid agreements to help address transportation needs
Possible actions to achieve this goal:
• Project Prioritization Procedures
Safety Ensure the safety of all travelers regardless of modal choice.
• Identify problematic areas with high accident rates • Reduce modal conflicts • Reduce vehicles miles traveled on congested, problematic roadways • Develop transportation system improvements that prevent accidents and minimize losses
Possible actions to achieve this goal:
• Identification of Severe Crash Locations • Safe Routes to School gap analysis • Highway lighting studies
System Management Preserve and maintain the existing transportation system.
• Encourage new programs designed to better preserve and maintain the regional infrastructure • Utilize Intelligent Transportation System (ITS) measures to maximize existing transportation
system resources • Utilize transportation system management (TSM) improvements when more cost effective than
facility expansion • Manage access along corridors to preserve corridor capacity and travel safety
Possible actions to achieve this goal:
• Access Management Best Practices for member consideration • Congestion – Analysis of Poor Level of Service for potential improvement
15 Existing Conditions | SEMPO 2016-2040 Metropolitan Transportation Plan
Section 4: Existing Conditions
Overview This section identifies existing major roadways, transit, multimodal and intermodal facilities, pedestrian walkways, bicycle facilities, and intermodal connectors, and identifies proposed additions to the system.
Roadways Roadways making up the SEMPO road and bridge network are composed of:
1. Interstates 2. US Highways 3. State Highways 4. County Roads 5. Municipal Roads/Streets
Private roads are not included in the SEMPO network, nor are tribal lands roadways or Federal lands roadways that may be included in other MPO areas.
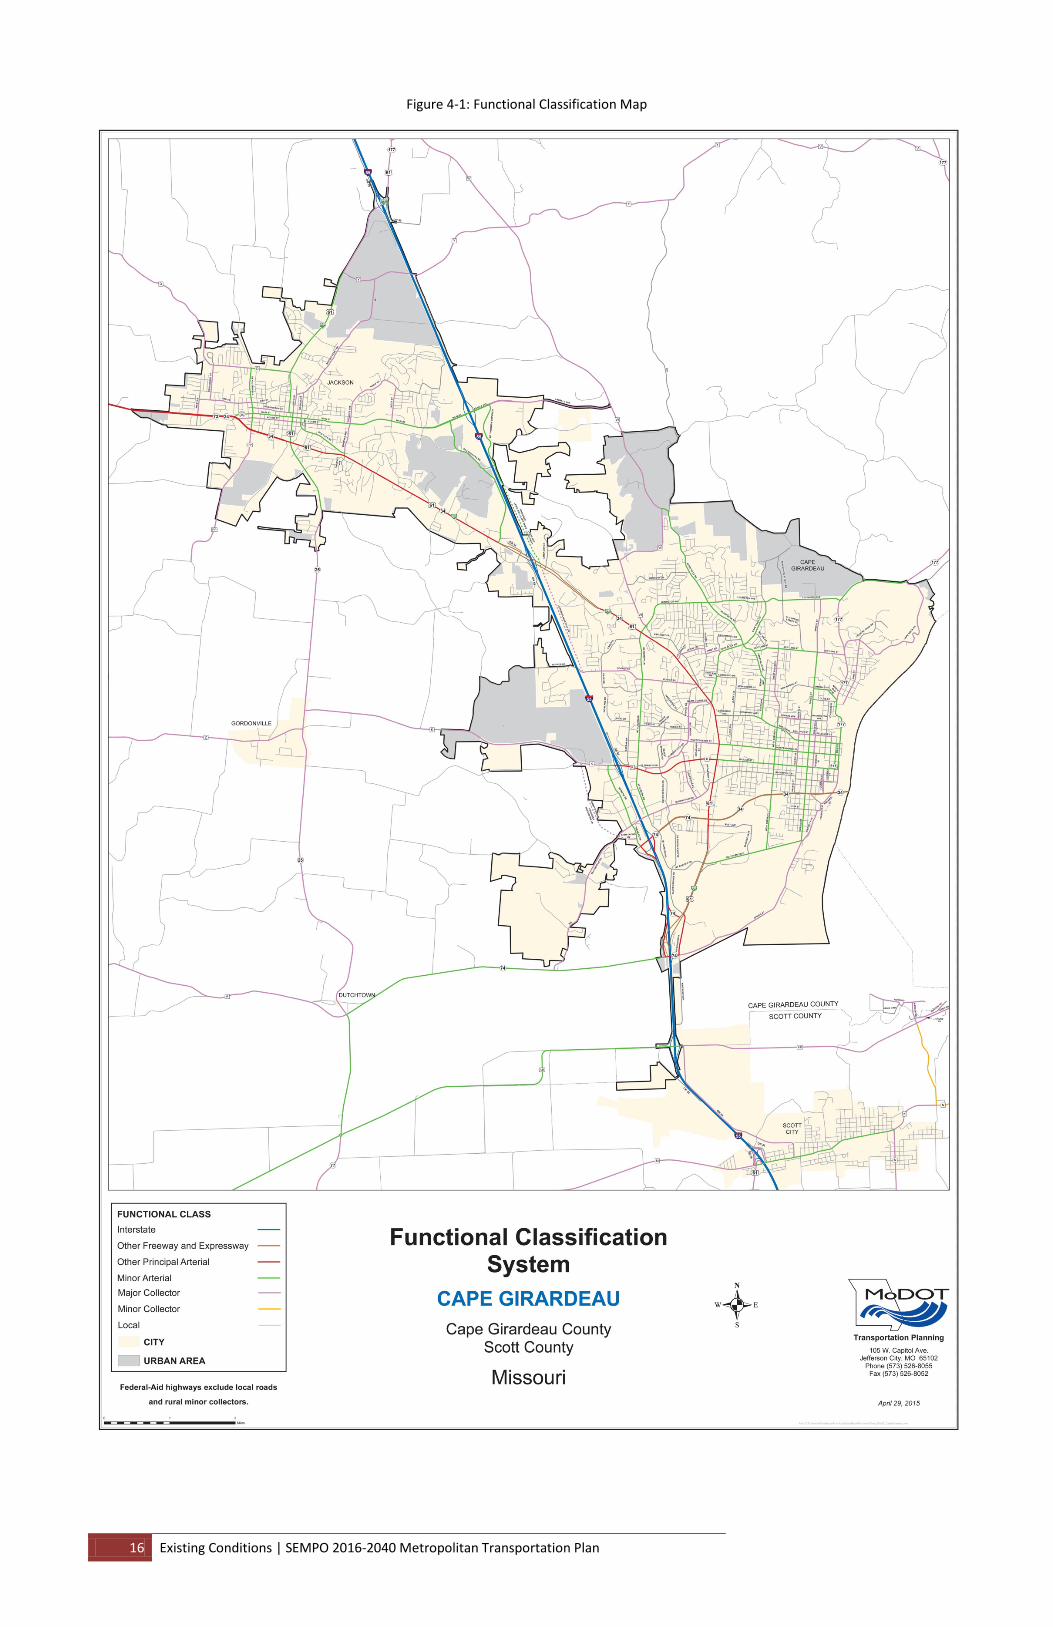
Functional Classification Roadways are usually defined by one of two methods, either design or function. MPOs and municipalities in Missouri generally use functional classification to describe or define a roadway. These roadway functional classifications are reviewed periodically by both MoDOT and local representatives. These roadways are divided into urban and rural, and are further classified as:
1. Interstate 2. Freeway/Expressway 3. Principal Arterial 4. Minor Arterial 5. Major Collector 6. Minor Collector, and 7. Local Road
Figure 4-1 illustrates the highway network by Functional Classification, according to MoDOT13.
13 http://www.modot.org/newsandinfo/functionalclassificationmaps/southeast.htm
16 Existing Conditions | SEMPO 2016-2040 Metropolitan Transportation Plan
Figure 4-1: Functional Classification Map
17 Existing Conditions | SEMPO 2016-2040 Metropolitan Transportation Plan
The National Highway System Under MAP 21 In general, for the purposes of 23 USC, the Federal-aid system is the National Highway System, which includes the Interstate System14.
The National Highway System consists of roadways important to the nation's economy, defense, and mobility. All principal arterial routes that are not currently on the NHS before October 1, 2012, will automatically be added to the NHS provided the principal arterials connect to the NHS in a one-time addition.15 There will be no restrictions on maximum NHS mileage.
The National Highway System (NHS) includes the following subsystems of roadways (note that a specific highway route may be on more than one subsystem):
1. Interstate: The Eisenhower Interstate System of highways retains its separate identity within the NHS.
2. Other Principal Arterials: Highways in rural and urban areas that provide access between an arterial and a major port, airport, public transportation facility, or other intermodal transportation facility.
3. Strategic Highway Network (STRAHNET): A highway network important to the United States’ strategic defense policy, providing defense access, continuity, and emergency capabilities for defense purposes.
4. Major Strategic Highway Network Connectors: Highways that provide access between major military installations and highways that are part of the Strategic Highway Network.
5. Intermodal Connectors: These highways provide access between major intermodal facilities and the other four subsystems making up the National Highway System.
For the SEMPO MPA, NHS Routes consist of I-55, US-61 and MO-34/72 in Jackson, and Route K, US-61, and MO-34 in Cape Girardeau. For additional information, see MoDOT’s NHS maps16.
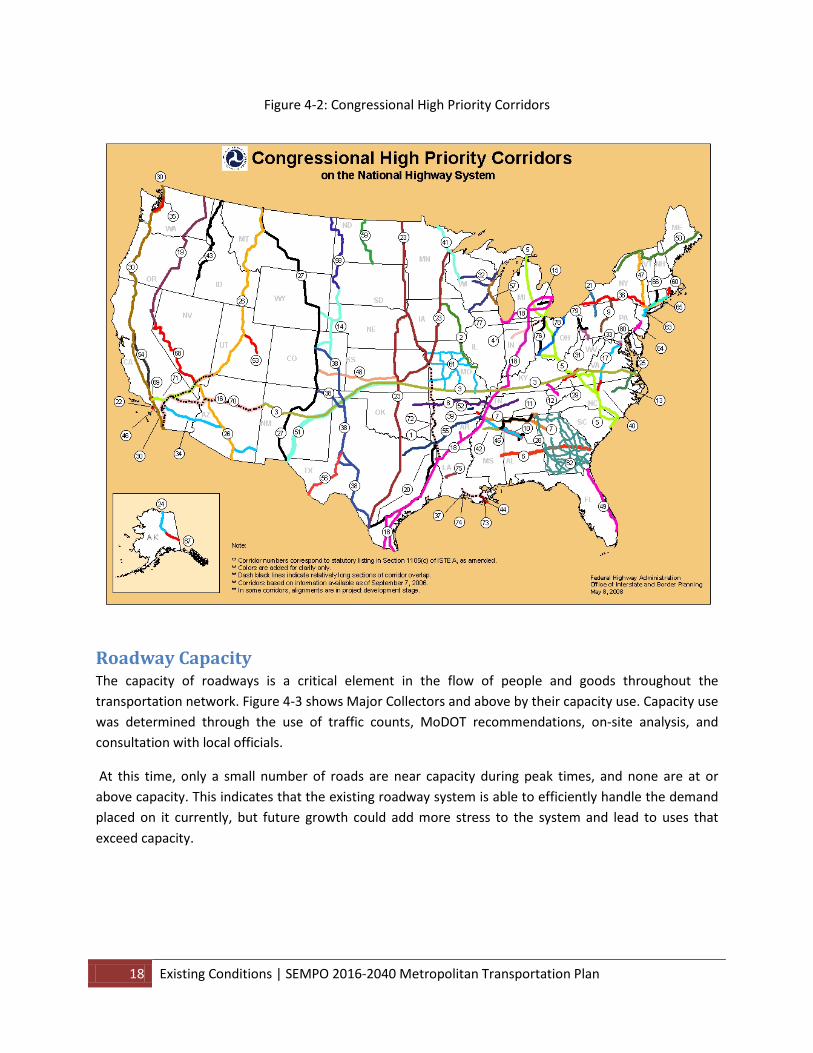
Congressional High Priority Corridors There is one Congressional High Priority Corridor that could pass through the SEMPO area, the East-West Transamerica Corridor, also referred to as the I-66 corridor (Number 3 in Figure 4-2), intended to link the East and West coasts nationally and Southeast Missouri, Southern Illinois, and Western Kentucky at the local level.
14 23 USC Section 103 as of Dec. 27, 2012 15 23 USC 103(b) (2)(1)(B) as amended by Section 1104 16 http://www.modot.org/newsandinfo/NHSM/index.html
18 Existing Conditions | SEMPO 2016-2040 Metropolitan Transportation Plan
Figure 4-2: Congressional High Priority Corridors
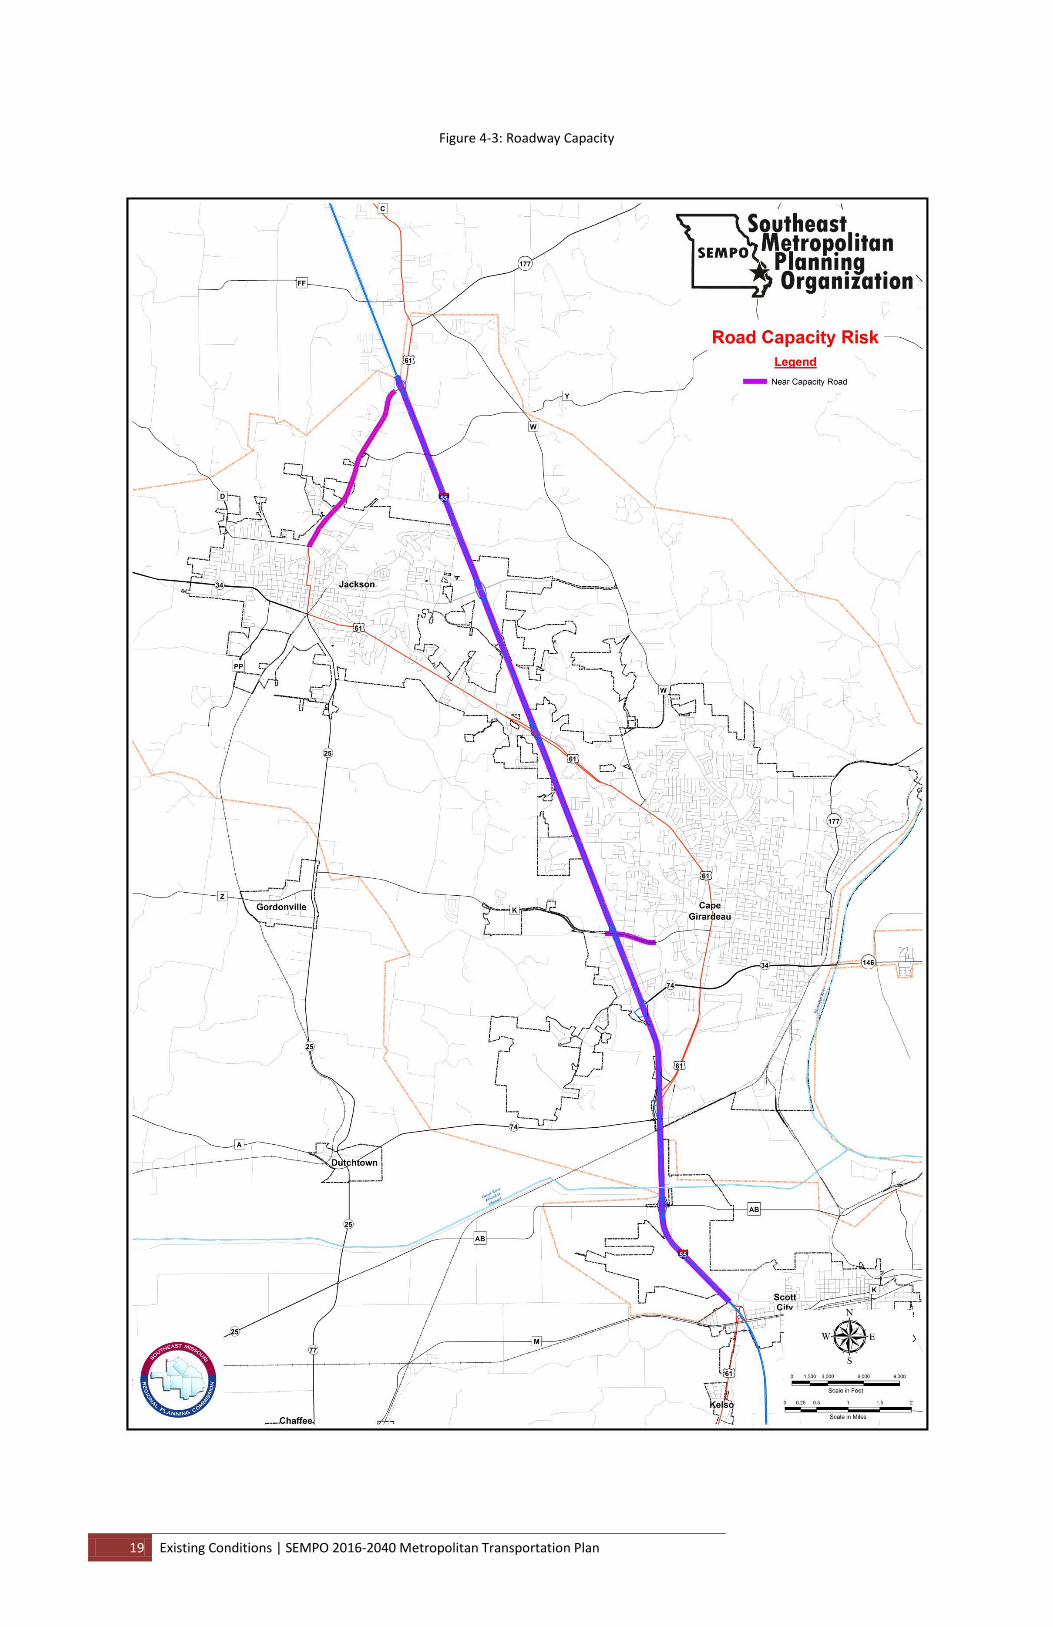
Roadway Capacity The capacity of roadways is a critical element in the flow of people and goods throughout the transportation network. Figure 4-3 shows Major Collectors and above by their capacity use. Capacity use was determined through the use of traffic counts, MoDOT recommendations, on-site analysis, and consultation with local officials.
At this time, only a small number of roads are near capacity during peak times, and none are at or above capacity. This indicates that the existing roadway system is able to efficiently handle the demand placed on it currently, but future growth could add more stress to the system and lead to uses that exceed capacity.
19 Existing Conditions | SEMPO 2016-2040 Metropolitan Transportation Plan
Figure 4-3: Roadway Capacity
20 Existing Conditions | SEMPO 2016-2040 Metropolitan Transportation Plan
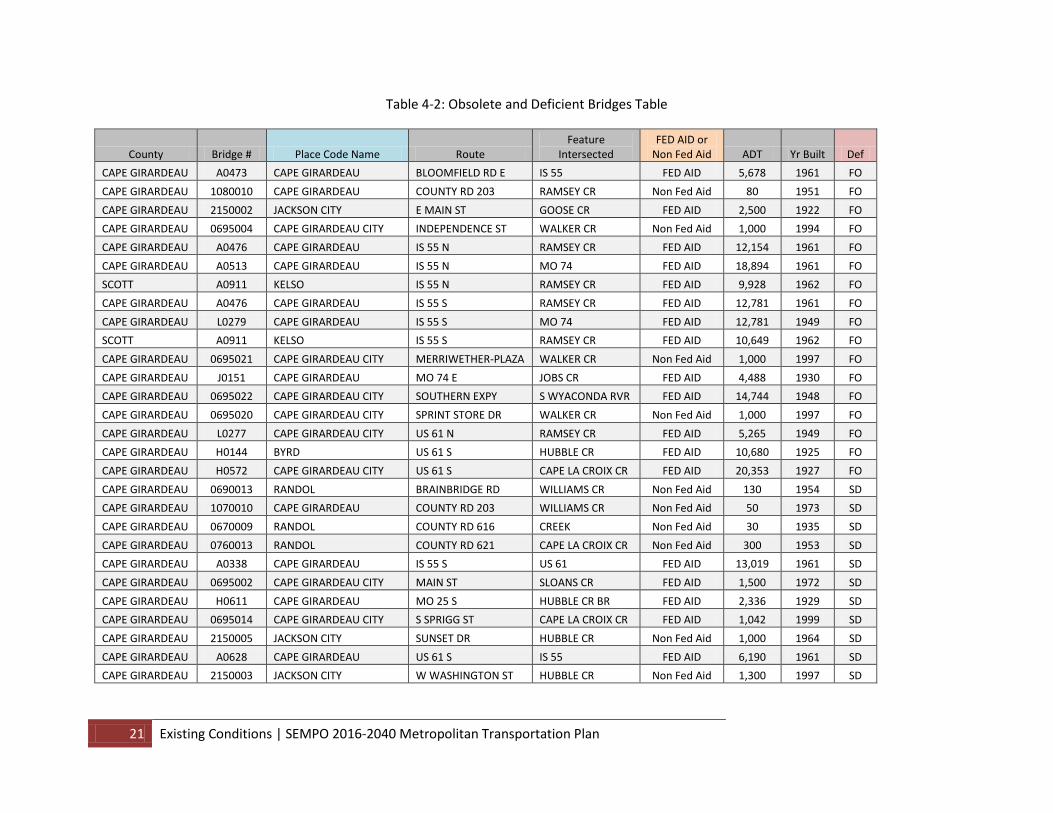
Bridges According to the National Bridge Inventory at the Federal Highway Administration, there are 364 bridges in Cape Girardeau County as of 2013. Major bridges in the SEMPO MPA include the Bill Emerson Memorial Bridge over the Mississippi River and two bridges on I-55 over the Diversion Channel.
Structurally Deficient and Functionally Obsolete Bridges Bridges are inspected and maintained on a regular basis, but two terms identify bridges that require attention, “structurally deficient” and “functionally obsolete”. MoDOT generally defines each term as follows:
Structurally Deficient (SD): A bridge is generally considered to be structurally deficient if it is in relatively poor condition, or has insufficient load carrying capacity for modern design loadings. The insufficient load capacity may be the result of the loads used in the original design or degradation of structural properties due to deterioration.
Functionally Obsolete (FO): A bridge is generally considered functionally obsolete if it is unable to properly accommodate traffic due to poor roadway alignment, insufficient width, waterway, low structural evaluation, or inadequate clearances.
Structurally Deficient bridges are not necessarily facing imminent collapse; however, a significant load-carrying element is in poor condition because of deterioration or damage and needs to be addressed. Meanwhile, Functionally Obsolete bridges are structurally sound but to some degree unable to accommodate current traffic patterns.
City, County and State transportation agencies actively monitor the condition of bridges in the MPA. SEMPO identifies bridge safety and efficiency as an extremely high priority in planning and programming for municipalities, Counties and State facilities. SEMPO is seeking a higher level of funding and programming for replacement and maintenance of structurally deficient or functionally obsolete bridge structures. The Structurally Deficient and Functionally Obsolete bridges are listed in the following table:
21 Existing Conditions | SEMPO 2016-2040 Metropolitan Transportation Plan
Table 4-2: Obsolete and Deficient Bridges Table
County Bridge # Place Code Name Route Feature
Intersected FED AID or
Non Fed Aid ADT Yr Built Def CAPE GIRARDEAU A0473 CAPE GIRARDEAU BLOOMFIELD RD E IS 55 FED AID 5,678 1961 FO CAPE GIRARDEAU 1080010 CAPE GIRARDEAU COUNTY RD 203 RAMSEY CR Non Fed Aid 80 1951 FO CAPE GIRARDEAU 2150002 JACKSON CITY E MAIN ST GOOSE CR FED AID 2,500 1922 FO CAPE GIRARDEAU 0695004 CAPE GIRARDEAU CITY INDEPENDENCE ST WALKER CR Non Fed Aid 1,000 1994 FO CAPE GIRARDEAU A0476 CAPE GIRARDEAU IS 55 N RAMSEY CR FED AID 12,154 1961 FO CAPE GIRARDEAU A0513 CAPE GIRARDEAU IS 55 N MO 74 FED AID 18,894 1961 FO SCOTT A0911 KELSO IS 55 N RAMSEY CR FED AID 9,928 1962 FO CAPE GIRARDEAU A0476 CAPE GIRARDEAU IS 55 S RAMSEY CR FED AID 12,781 1961 FO CAPE GIRARDEAU L0279 CAPE GIRARDEAU IS 55 S MO 74 FED AID 12,781 1949 FO SCOTT A0911 KELSO IS 55 S RAMSEY CR FED AID 10,649 1962 FO CAPE GIRARDEAU 0695021 CAPE GIRARDEAU CITY MERRIWETHER-PLAZA WALKER CR Non Fed Aid 1,000 1997 FO CAPE GIRARDEAU J0151 CAPE GIRARDEAU MO 74 E JOBS CR FED AID 4,488 1930 FO CAPE GIRARDEAU 0695022 CAPE GIRARDEAU CITY SOUTHERN EXPY S WYACONDA RVR FED AID 14,744 1948 FO CAPE GIRARDEAU 0695020 CAPE GIRARDEAU CITY SPRINT STORE DR WALKER CR Non Fed Aid 1,000 1997 FO CAPE GIRARDEAU L0277 CAPE GIRARDEAU CITY US 61 N RAMSEY CR FED AID 5,265 1949 FO CAPE GIRARDEAU H0144 BYRD US 61 S HUBBLE CR FED AID 10,680 1925 FO CAPE GIRARDEAU H0572 CAPE GIRARDEAU CITY US 61 S CAPE LA CROIX CR FED AID 20,353 1927 FO CAPE GIRARDEAU 0690013 RANDOL BRAINBRIDGE RD WILLIAMS CR Non Fed Aid 130 1954 SD CAPE GIRARDEAU 1070010 CAPE GIRARDEAU COUNTY RD 203 WILLIAMS CR Non Fed Aid 50 1973 SD CAPE GIRARDEAU 0670009 RANDOL COUNTY RD 616 CREEK Non Fed Aid 30 1935 SD CAPE GIRARDEAU 0760013 RANDOL COUNTY RD 621 CAPE LA CROIX CR Non Fed Aid 300 1953 SD CAPE GIRARDEAU A0338 CAPE GIRARDEAU IS 55 S US 61 FED AID 13,019 1961 SD CAPE GIRARDEAU 0695002 CAPE GIRARDEAU CITY MAIN ST SLOANS CR FED AID 1,500 1972 SD CAPE GIRARDEAU H0611 CAPE GIRARDEAU MO 25 S HUBBLE CR BR FED AID 2,336 1929 SD CAPE GIRARDEAU 0695014 CAPE GIRARDEAU CITY S SPRIGG ST CAPE LA CROIX CR FED AID 1,042 1999 SD CAPE GIRARDEAU 2150005 JACKSON CITY SUNSET DR HUBBLE CR Non Fed Aid 1,000 1964 SD CAPE GIRARDEAU A0628 CAPE GIRARDEAU US 61 S IS 55 FED AID 6,190 1961 SD CAPE GIRARDEAU 2150003 JACKSON CITY W WASHINGTON ST HUBBLE CR Non Fed Aid 1,300 1997 SD
22 Existing Conditions | SEMPO 2016-2040 Metropolitan Transportation Plan
Transit Services Transit providers fill a vital service to many of the residents in the MPO. The two primary providers are the Cape Transit Authority and Southeast Missouri State University. These providers assist riders in completing hundreds of thousands of trips for a wide range of reasons including healthcare, shopping, employment, and recreation.
Cape Transit Authority The Cape Transit Authority serves the entirety of Cape Girardeau County by offering many types of transportation services. The transit authority receives approximately 70% of its funding directly from FTA for use serving the urban area while the remaining 30% comes from grants administered by MoDOT for serving the rural area of the county.
Services provided by CTA include: demand response service 24 hours a day, 6 ½ days per week; fixed bus routes in the city of Cape Girardeau with service available 12 hours per day Monday through Friday and 8 hours on Saturday; Medicaid transportation; and work force transportation between Cape Girardeau and Perryville with four trips per day seven days a week.
CTA operates two fixed bus routes – a North Route and a South Route, both serving the City of Cape Girardeau. The South Route, having a higher demand and usage, is served by two buses. The North Route is served by one bus. Our existing routes consist of over 60 stops. At this time there are 4 covered bus shelters among these stops. Future planning includes adding more covered bus shelters to our stops.
Should funding become available in the future, there is a need for a route between the cities of Cape Girardeau and Jackson. With the development of the Cape Industrial Park, we anticipate there will also be a need for workforce transportation to that area as well.
CTA currently operates from a leased facility located at 937 Broadway Street, Cape Girardeau, Missouri. In 2009 we commissioned a new facility feasibility study. At that time it was estimated the cost for a new facility would be approximately $3 million and this was beyond the funding means of CTA. The cost to build this facility by 2025 is estimated to be $4.72 million.
CTA offers demand response service to the entire county. This service is available around the clock except from 2 p.m. on Sunday to 5 a.m. on Monday. Paratransit services are available upon request to qualifying individuals.
Ridership for 2015 exceeded 200,000 trips. Using a 3% annual increase, it is projected that total ridership by 2040 will surpass 422,000 trips. The transit authority currently employs 61 drivers and operates a fleet of 41 vehicles with an operating budget for FY 2015 of $2.5 million.
Southeast Missouri State University The department of Public Safety operates a shuttle service to provide transportation from parking lots to the interior of campus and between the main campus and River Campus. The service is funded by the Federal Transit Administration, the Missouri Department of Transportation and Southeast Missouri State
23 Existing Conditions | SEMPO 2016-2040 Metropolitan Transportation Plan
University. Weekday service to the main campus consists of seven routes beginning at 7:00 a.m. The River Campus Route includes three stops along the Cape Girardeau County Transit route in the downtown and mid-town areas, providing students transportation off campus. Evening service is provided from 5:00 p.m. until 2:00 a.m. daily, and makes stops at residence halls and campus parking lots. Weekend shuttle service operates from 1:00 p.m. to midnight.
Southeast Missouri State University operates three routes providing repetitive, fixed scheduled service along a specific route, during which passengers are picked up and delivered to specific locations. Of the three routes, two operate on the main campus while the third operates between the main campus and the River Campus, approximately 2 miles to the south. This route also makes connect stops with existing stops with Cape Girardeau County Transit.
Building on the commitment to promote public transportation and to increase intermodal connectivity, Southeast Missouri State University Transit maintains a Transportation Nexus which provides a single access point from which motorists can board every fixed route shuttle from a 1,100 space commuter parking facility. Additionally, the University maintains a 10 bay general maintenance facility at 610 Washington Street in Cape Girardeau, Mo.
All Southeast Missouri State University Transit vehicles are accessible vehicles; however, for people who cannot use the fixed-route services because of a disability, routes can be adjusted, or deviated, to accommodate users. Southeast Missouri State University Transit has averaged 299,669 one way trips in the last 11 years. It is expected that ridership will remain steady or increase, due in part to enrollment trends and academic programs offered and increasing ‘off campus’ properties. Ridership for 2013 totaled 335,685 one way trips.
Aviation System The Cape Girardeau Regional Airport is owned and operated by the City of Cape Girardeau. Located adjacent to I-55 in Scott County south of Nash Road, the airport is a full service facility that offers a wide range of services for all aviation types. Commercial flights to Lambert International Airport (STL) are provided daily by Cape Air. With four (4) daily round-trip flights Monday through Friday, and two (2) round-trip flights Saturday and Sunday, Cape Air provides scheduled, American and United Airlines code share air service for the community and region. Cape Air enplaned 6,275 passengers out of Cape Girardeau in 2015 and saw 11,457 total enplaned and deplaned passengers. Cape Air maintains a two-year Essential Air Service contract with the United States Department of Transportation to provide scheduled air service in Cape Girardeau through 2018, when the contract will be up for renewal.
On-site services include air charter service, flying lessons, car rentals, a restaurant and a full service fixed base operator (FBO), Cape Aviation. Cape Girardeau currently has 75 aircraft based at the airport with an aircraft mix of 54 single engine, 9 twin engine, 9 helicopters, and 3 twin engine jets. The past year, the Cape Girardeau Regional Airport saw 27,700 aircraft operations, a number that has remained steady, yet grown slowly from just over 24,000 in 2011. With a new, thriving Robinson Helicopter
24 Existing Conditions | SEMPO 2016-2040 Metropolitan Transportation Plan
business on airport and continually increasing flight training opportunities in Rotor, Fixed Wing, and the new Light Sport Aircraft category, traffic at Cape Girardeau is expected to increase substantially in the upcoming years. Fuel sales at the airport have increased 12.7% over the past five (5) years, from 289,689 gallons in 2011 to 326,528 gallons in 2015, and are expected to see continued growth.
The airport has two runways. The longest runway, Runway 10/28, is 6,500 long x 150ft wide. Runway 10/28 maintains an Instrument Landing System with a Global Positioning System (GPS) for full instrument approaches and departures. The crosswind runway, Runway 02/20, is 4,000 ft. long x 100 ft. wide. The airport maintains an Air Traffic Control Tower, which is open daily, from 7am – 5pm.
Freight Freight movement in the SEMPO MPA consists of truck transport, river transport of bulk commodities, rail transport of bulk commodities, and aviation transport.
River Transportation The SEMO Regional Port Authority (SEMO Port) is the primary waterway intermodal facility in the MPO and the region and is a critical component of the MPO’s transportation network. The port is used primarily to ship bulk goods such as minerals, ore, and agricultural products.
In 2013, 1,098,167 net tons of goods moved through the port and as of November, 2014 1,085,825 net tons moved through the port for the year. Since 2010 the port has moved over 1 million net tons of goods each year. As of November, 2014 the port had moved 521 barges for the year and more than 2,600 barges since 2010. In 2011, the Corps reported traffic on the St. Louis to Cairo segment of the river at 106,630,156 tons. This is equivalent to 108,000 barges or 927,000 railcars or 4.2 million truckloads.
The port is also a significant source of jobs in the MPO, having over 100 individuals employed at the port each year since 2009. In 2014 142 people were employed at the port either by the Port Authority or the businesses located there. Barge lines frequently serving the area for dry bulk and general cargo include AEP, American Commercial, Canal, Excell, Ingram, Marquette, and SCF as well as others. Liquid bulk carriers include Blessey, Cenac, Enterprise, Florida Marine Transporters, Genesis, Higman, Kirby, Magnolia, Settoon, and Southern Towing. Barge lines handling their own products include American Rivers Transportation (ADM) and Luhr Bros Inc.
Since 2006 over $54,122,725 has been invested into the port from various sources including federal, state, and local public funding as well as private funding. Of this total investment, over $44,000,000 has come from private sources. The port continues to plan expansions in infrastructure and services including improvements to the harbor and additional rail-car capacity.
Railroad Transportation SEMPO has two Class I rail lines in the planning area and one switching railroad. Burlington Northern Santa Fe (BNSF) has a north-south line along the Mississippi River, going through downtown Cape Girardeau while Union Pacific (UP) has a line running along the southern area of the planning area. The SEMO Port Railroad, Inc. (SE) is a switching railroad which links customers to both the BNSF and UP lines.
25 Existing Conditions | SEMPO 2016-2040 Metropolitan Transportation Plan
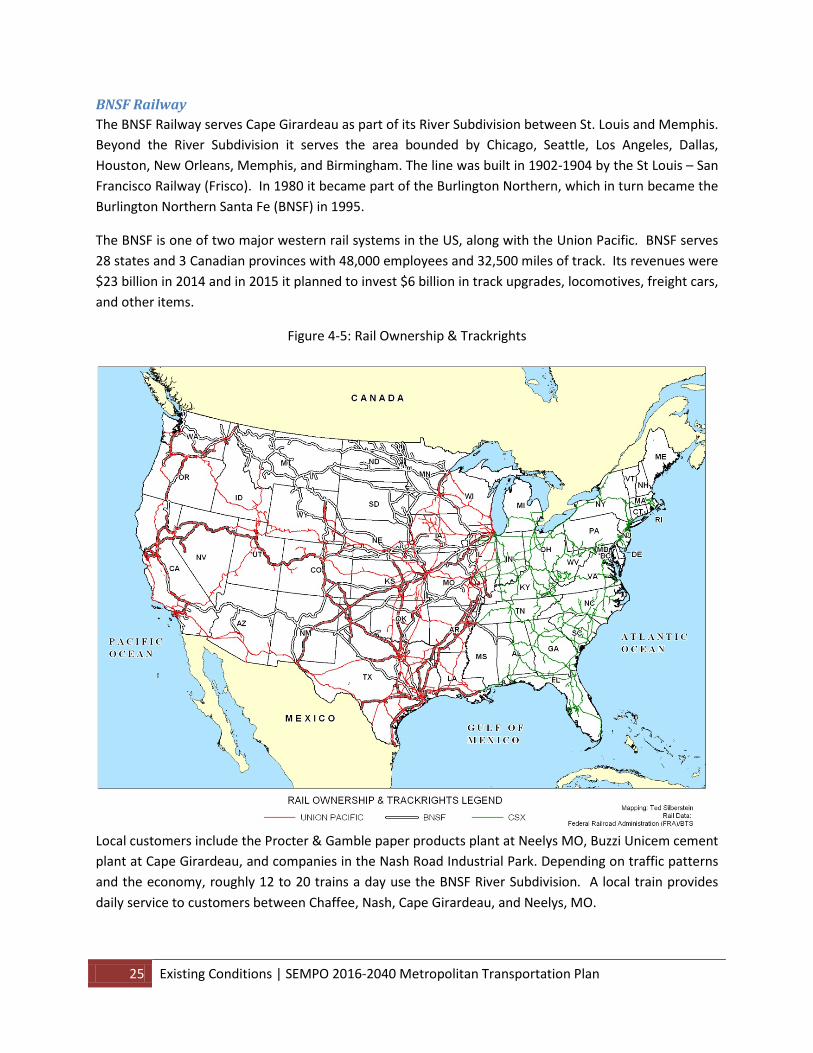
BNSF Railway The BNSF Railway serves Cape Girardeau as part of its River Subdivision between St. Louis and Memphis. Beyond the River Subdivision it serves the area bounded by Chicago, Seattle, Los Angeles, Dallas, Houston, New Orleans, Memphis, and Birmingham. The line was built in 1902-1904 by the St Louis – San Francisco Railway (Frisco). In 1980 it became part of the Burlington Northern, which in turn became the Burlington Northern Santa Fe (BNSF) in 1995.
The BNSF is one of two major western rail systems in the US, along with the Union Pacific. BNSF serves 28 states and 3 Canadian provinces with 48,000 employees and 32,500 miles of track. Its revenues were $23 billion in 2014 and in 2015 it planned to invest $6 billion in track upgrades, locomotives, freight cars, and other items.
Figure 4-5: Rail Ownership & Trackrights
Local customers include the Procter & Gamble paper products plant at Neelys MO, Buzzi Unicem cement plant at Cape Girardeau, and companies in the Nash Road Industrial Park. Depending on traffic patterns and the economy, roughly 12 to 20 trains a day use the BNSF River Subdivision. A local train provides daily service to customers between Chaffee, Nash, Cape Girardeau, and Neelys, MO.
26 Existing Conditions | SEMPO 2016-2040 Metropolitan Transportation Plan
UP Railway The UP Railroad serves Scott City as part of its Chester Subdivision between East St. Louis, IL and Pine Bluff, AR/North Little Rock, AR. The Thebes Bridge, a double track railroad bridge linking Thebes, IL and Scott City, MO, was built in 1903-1905. The UP rail line from Chicago joins the East St Louis line at Gorham, IL. South of Scott City, the line splits with southbound traffic going to the rail yard at Pine Bluff, AR and northbound traffic coming from the North Little Rock yard. Points served include Memphis, New Orleans, Houston, Laredo, Dallas, Los Angeles, Seattle, and Chicago.
Predecessor railroads included the St Louis Southwestern Railway (Cotton Belt), Missouri Pacific, and Iron Mountain. The Missouri Pacific became part of the Union Pacific in 1983, as did the Southern Pacific (Cotton Belt) in 1996.
The UP is one of two major western rail systems in the US, along with the BNSF. UP serves 23 states with 47,000 employees and 32,000 miles of track. Its revenues were $24 billion in 2014 and in 2015 it planned to invest $4 billion in track upgrades, locomotives, freight cars, and other items.
Local customers include several companies in Scott City. Depending on traffic patterns and the economy, roughly 35 to 50 trains a day use the UP Chester Subdivision. A local train provides service to customers between Scott City and Chester, IL (to East St Louis) and between Scott City and New Madrid, MO.
SE Railroad The SE, an eight-mile switching railroad owned by SEMO Port, connects the Port with the UP east of Scott City (Cape Girardeau Junction) and the BNSF in Cape Girardeau.
Built in 1929-1930, the Missouri Pacific’s Cape Girardeau Branch during the 1970’s and 1980’s handled trains of coal from southern Illinois mines which came across the Thebes Bridge and up the branch to the Frisco Railway at Cape Girardeau. The Frisco handled them to the Ameren power plant at Rush Island (near Crystal City, MO) and returned empties via reverse route to Illinois. When air regulations changed around 1990, the power plant changed to western coal and the movements via the Cape Girardeau Branch ceased.
In 1994, SE purchased the Cape Girardeau Branch and in 1996 built a lead track into the Port’s harbor industrial area. Rail traffic has grown from 12 cars during 1995 to several thousand cars a year today. Several local industries ship via the SE. The Port has a number of tracks used by local companies for rail-truck and truck-rail transfers, as well as transloading to/from barge. The SE provides daily service to its customers and connections.
Inter-modal Systems Inter-modal refers to the connections between modes and usually refers to facilities that provide transfer of passengers or freight between transportation modes such as seaports, airports, truck/rail terminals, pipeline/truck terminals and other inter-modal freight transportation facilities.
27 Existing Conditions | SEMPO 2016-2040 Metropolitan Transportation Plan
SEMPO has two inter-modal facilities in its MPA: (1) the Cape Girardeau Regional Airport with general aviation passenger services, small freight transfers, and car rental services, and (2) the SEMO Regional Port with highway, rail, and river connections for bulk commodities.
See MoDOT’s maps of the Inter-modal system for additional information17.
Bicycle and Pedestrian Systems Non-motorized transportation in the form of bicycle and pedestrian travel are common, but limited range transportation options.
The State of Missouri Department of Transportation has a bicycle/pedestrian program that works with local governments and regional planning agencies to improve access for bicycle and pedestrian transportation modes, while at the same time improving safety.
SEMPO, MoDOT and local municipalities participate in expanding opportunities for bicycle and pedestrian facilities through the Transportation Alternatives Program along with state and local funding, and development of bicycle and pedestrian plans.
Member jurisdictions have taken advantage of federal and state funding for sidewalks, trails and greenways through the federal Safe Routes to School Program, Transportation Enhancement Program, Recreational Trails Program, and State coordinating programs. SEMPO will continue to advocate and assist jurisdictions in plan development, funding and programming.
Sidewalks Both the cities of Cape Girardeau and Jackson have an extensive network of sidewalks connecting residential areas to recreational, institutional, and economic activities. Both cities are continually upgrading and/or expanding their sidewalk network and have recently begun exploring multiple potential inter-city connections.
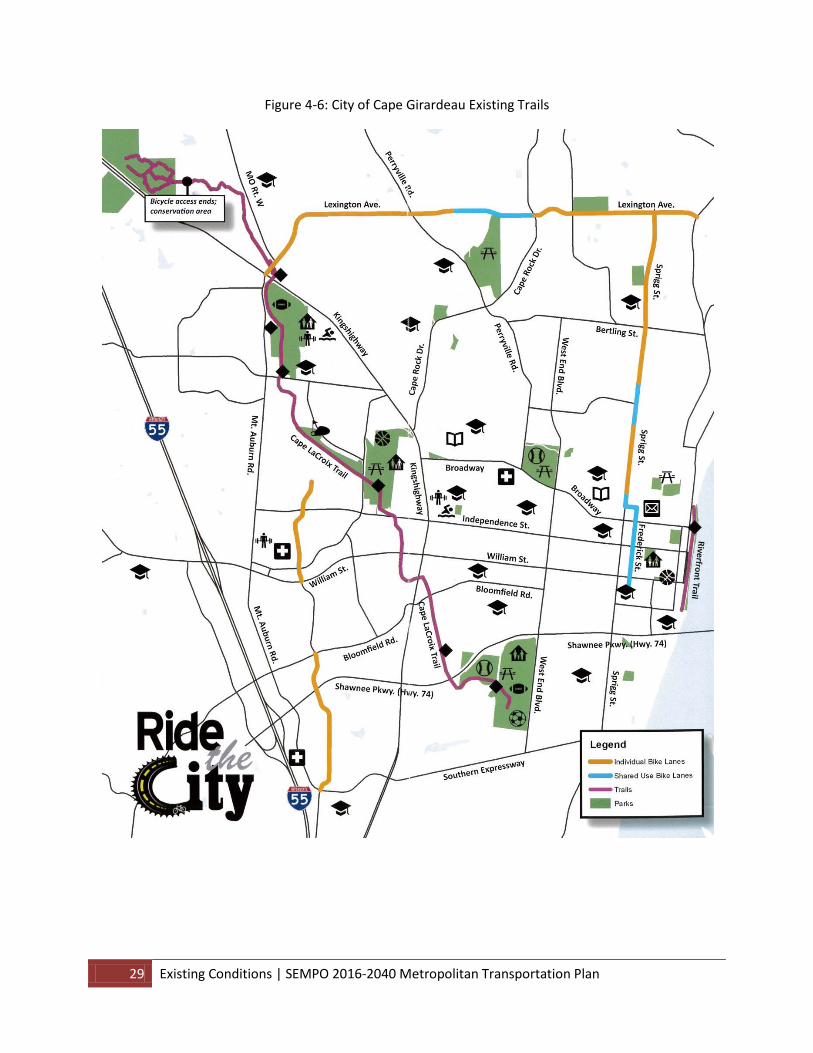
Greenways and Trails As with sidewalks, both cities have a well developed system of greenways and trails providing recreational opportunities. In Cape Girardeau, the Cape La Croix Trail runs for over 4 miles from the Kingshighway/Mnt. Auburn intersection along Cape La Croix Creek to Shawnee Park near the West End/Hwy 74 intersection. This trail includes multiple grade-separated crossings to provide maximum safety for pedestrians and bikers. The city of Cape Girardeau also has a mile long Riverfront Trail along the Mississippi River on the river side of the flood wall in downtown Cape Girardeau which provides scenic views of the Mississippi River and recreational activity all year long.
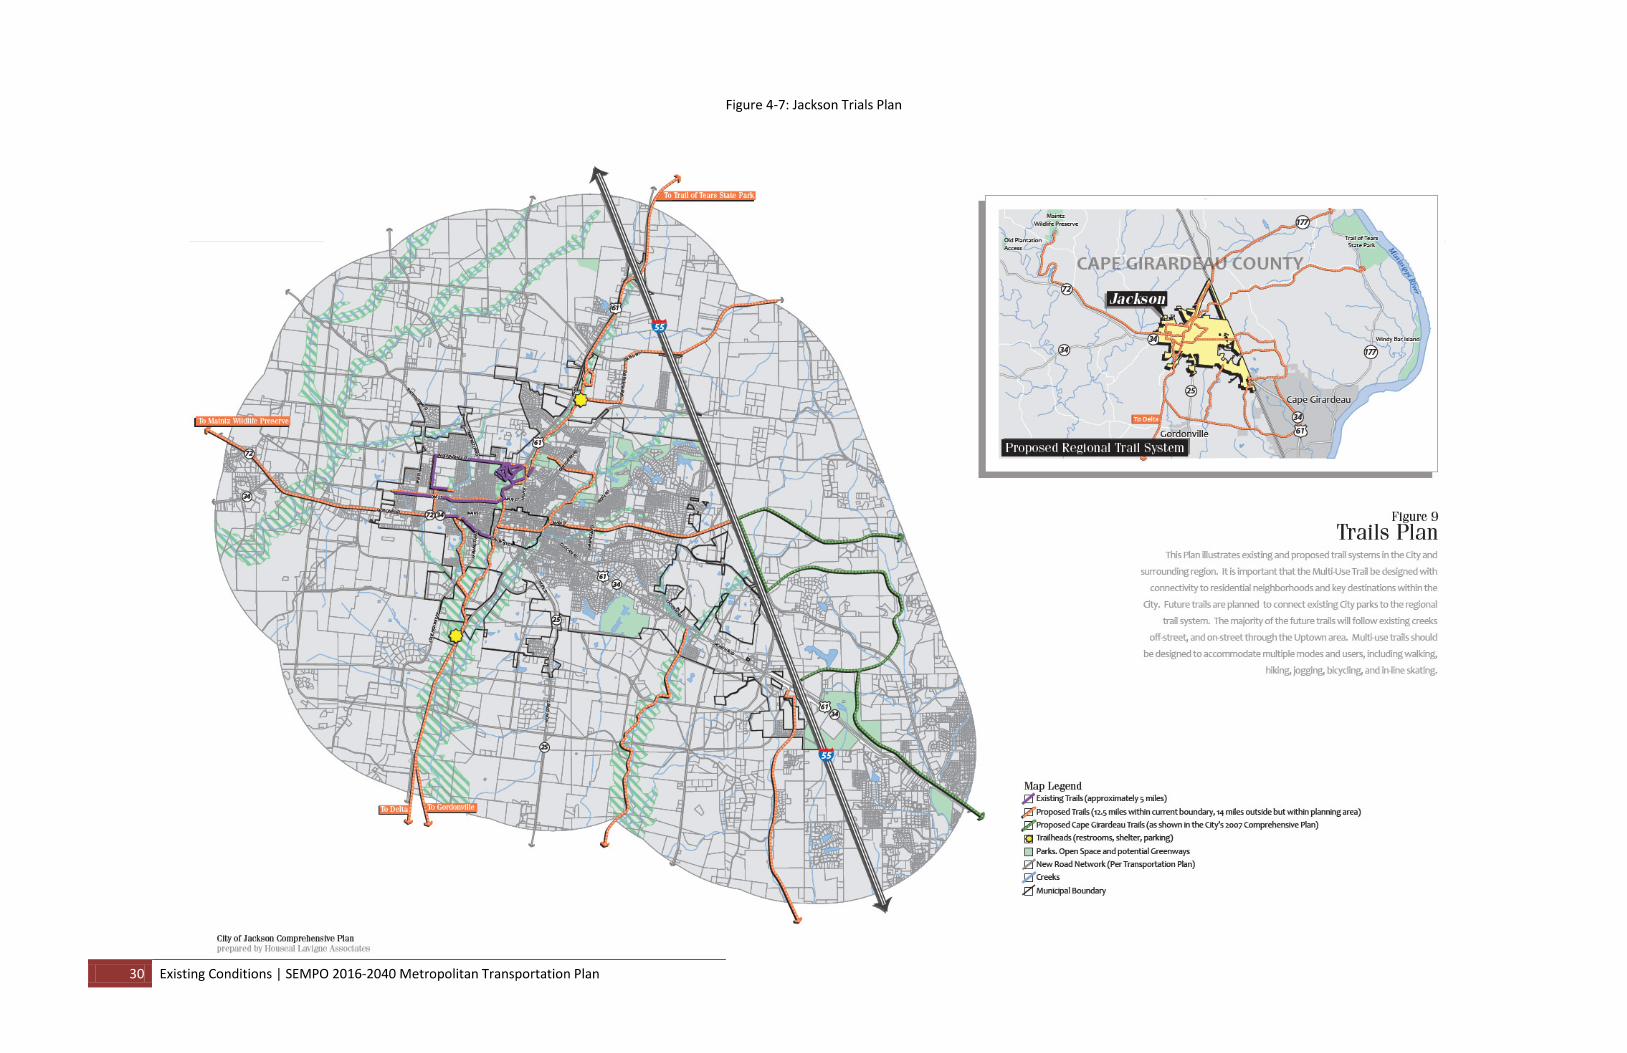
The city of Jackson also has over 5 miles of greenways and trails, much of which is located in and around the City Park, with trails also along Main St, Jackson Blvd, Independence, and Oak St. These trails connect parks, schools, commercial, and residential areas to one another, allowing for multiple uses of the trails.
17 http://www.modot.org/newsandinfo/NHSM/index.html
28 Existing Conditions | SEMPO 2016-2040 Metropolitan Transportation Plan
Both cities also have plans for the expansion of their systems into new areas of each city as well as the eventual connection of the two cities via multi-purpose trails. Once complete, these trails will provide recreational, greenway corridors throughout the urbanized area while also attracting new visitors to the area.
29 Existing Conditions | SEMPO 2016-2040 Metropolitan Transportation Plan
Figure 4-6: City of Cape Girardeau Existing Trails
30 Existing Conditions | SEMPO 2016-2040 Metropolitan Transportation Plan
Figure 4-7: Jackson Trials Plan
31 Existing Conditions | SEMPO 2016-2040 Metropolitan Transportation Plan
Transportation System Safety MAP 21 introduced new safety measures, funding, regulatory authority, and programs for the Federal Transit Administration (FTA)18. Transportation providers will be expected to participate in new safety performance criteria, vehicle safety performance standards, Safety Certification Training Program, Transit Agency Safety Plans, a bus testing program and a State Safety Oversight Program. FTA is given increasing authority for enforcement, reporting and oversight. This will also likely increase costs and regulatory overhead.
As recommended in federal legislation19, the Metropolitan Transportation Plan is incorporating the 2013 Highway Safety Plan & Performance Plan into the MTP by reference, summarizing the plan’s priorities, goals and countermeasures, or projects for the metropolitan planning area.
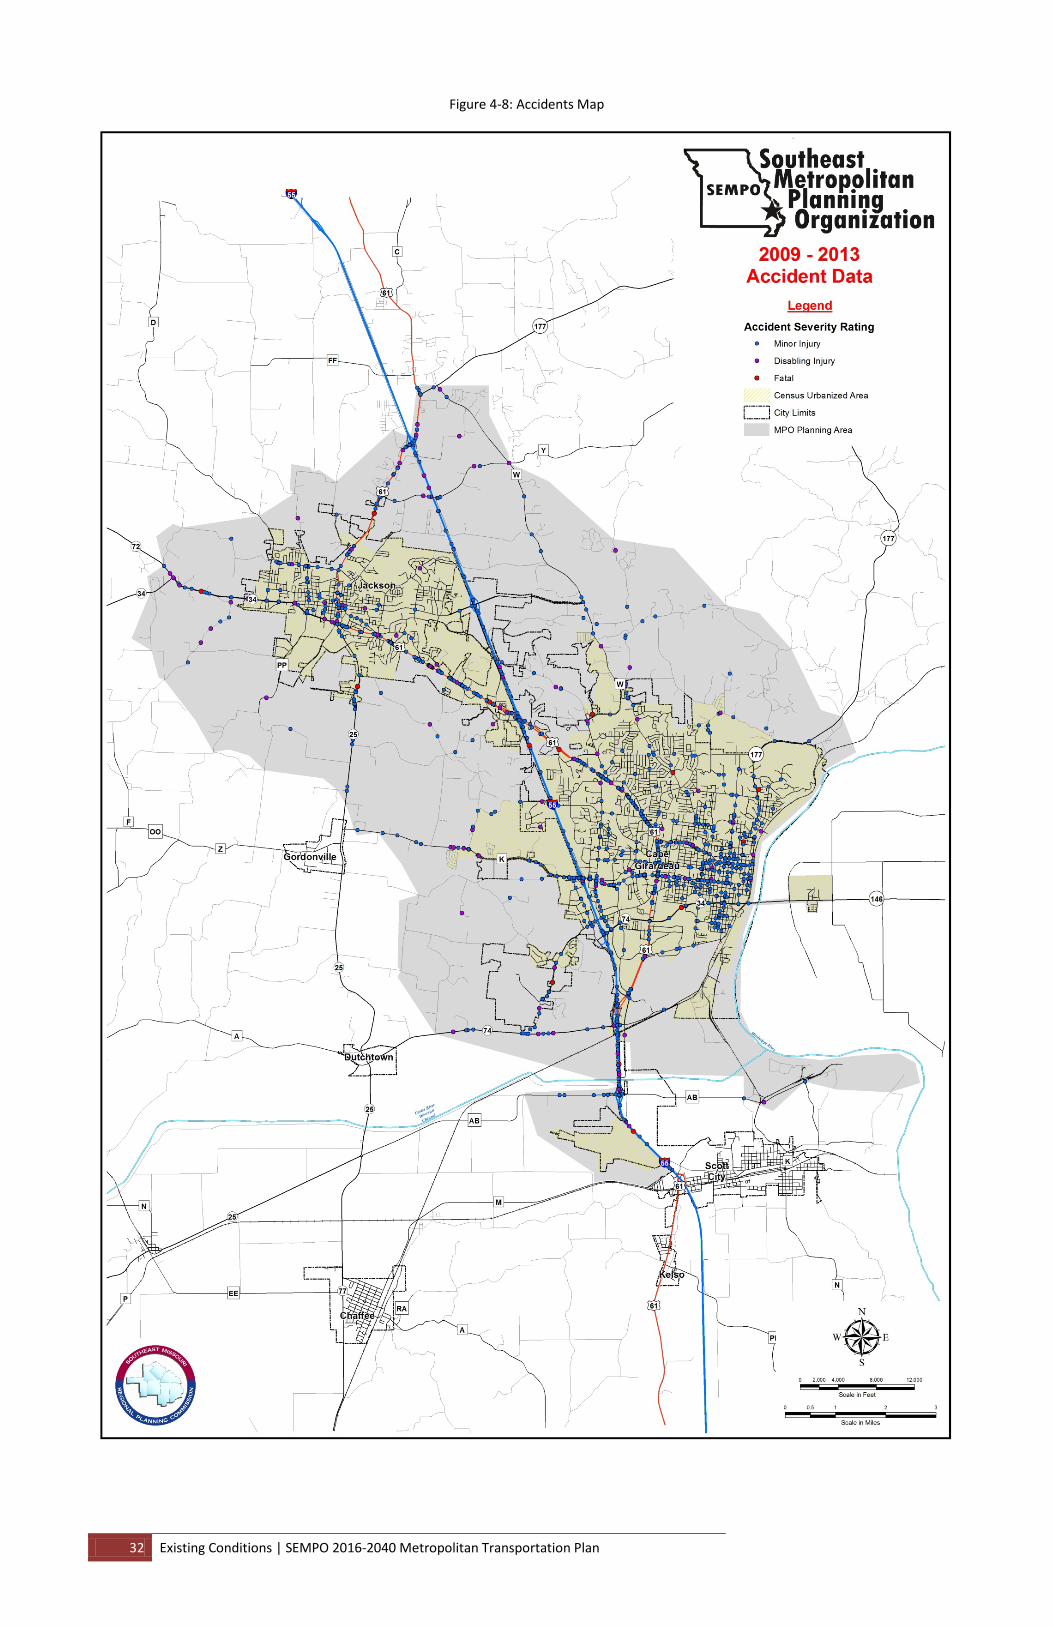
Roadway Accident Statistics Accidents in the MPA are given a severity description by the Missouri Highway Patrol as follows:
• Property Damage Only • Minor Injury • Disabling Injury, and • Fatal
In the five years span from 2009 to 2013 (the most recent available data from MoDOT) there were 10,529 reported accidents in the MPA. Of these, 1,563 (14.8%) were described as Minor Injury or worse, 170 (1.6%) were described as Disabling Injury or worse, and 18 (0.2%) were described as fatal. This equals an average of approximately 2,106 accidents per year, 313 Minor Injury or worse per year, 34 Disabling Injury or worse per year, and 4 Fatal accidents per year.
Figure 2-6 shows all accidents in the MPA between 2009 and 2013 that resulted in physical injuries (i.e. Minor Injury or worse). As is expected, the vast majority of accidents occurred on the most heavily traveled, non-interstate highways. Of the 1,563 Minor Injury or worse accidents in the MPA only 119 (8%) occurred on I-55 while 402 (26%) occurred on Highway 61 throughout the MPA.
18 49 USC Section 5329/MAP Section 20021 19 23 CFR Section 450.322(h)
32 Existing Conditions | SEMPO 2016-2040 Metropolitan Transportation Plan
Figure 4-8: Accidents Map
33 Existing Conditions | SEMPO 2016-2040 Metropolitan Transportation Plan
Strategic Highway Safety Plan and Emergency Relief/Disaster Preparedness The Highway Safety Act of 1966, 23 USC, Section 4(a) requires that “Each State shall have a highway safety program approved by the Secretary, designed to reduce traffic accidents and deaths, injuries, and property damage resulting therefrom.” This results in what is called Section 402 Highway Safety Plans.
In accordance with 23 U.S.C 148, Missouri developed and certified a 203 page 2013 Highway Safety Plan & Performance Plan in August of 2013. The strategies outlined within the HSP and performance plan will be implemented by MoDOT in an attempt to reach the overarching statewide Blueprint goal of 700 or fewer fatalities by 2016.
SEMPO supports MoDOT’s Missouri Highway Safety Plan and the intent of the plan to reduce injuries, fatalities and property damage. Specifically, the MoDOT goal #1 is to reduce fatalities and the MoDOT Goal #2 is to reduce serious injuries.
SEMPO does not legislate, enforce, nor design safety projects or programs. It is a multi-jurisdictional planning organization, promoting safety through the identification and analysis of hazardous locations through accident data. SEMPO plans for multi-modal projects through SEMPO membership, State agencies and Federal agencies. These members and agencies are included, when appropriate, in the development of plans and studies, including the MTP and TIP, to provide important information and help guide the development of multi-modal systems throughout the MPA.
Best Practices Countermeasures According to MoDOT literature, the highway safety division at MoDOT attempts to ensure that effective countermeasure efforts are incorporated into the strategies of the Plan by employing the following methods:
• Utilizing proven countermeasures identified within the latest update of Countermeasures That Work: A Highway Safety Countermeasure Guide for State Highway Safety Offices, USDOT, NHTSA;
• Evaluating traffic crash data to determine crash types, target populations and geographic locations in order to most effectively implement countermeasure efforts;
• Participating in national law enforcement mobilizations that combine blanketed enforcement and saturated media during established timeframes and in targeted traffic corridors; and
• Participating in state, regional, and national training opportunities in order to gain insight into proven programs that can be replicated in Missouri.
State Emergency Relief and Disaster Preparedness Plans and Strategies The State Emergency Management Agency’s (SEMA) mission is to protect the lives and property of all Missourians when major disasters threaten public safety in any city, county or region of Missouri. SEMA responds to two types of disasters - natural and those caused by man. Natural disasters are major snow and/or ice storms, floods, tornadoes/severe weather, and earthquakes. Man-made disasters, also
34 Existing Conditions | SEMPO 2016-2040 Metropolitan Transportation Plan
known as technological emergencies, may include hazardous material incidents, nuclear power plant accidents and other radiological hazards20. SEMA is also responsible for developing a State Emergency Operations Plan which coordinates the actions of Missouri state government departments and agencies in the event of any emergency requiring the use of state resources and personnel. SEMA also serves as the statewide coordinator for activities associated with the National Flood Insurance Program.
Emergency Preparedness Grants The Emergency Management Performance Grant (EMPG) Program provides resources to the State Emergency Management Agency and local government emergency management agencies for the sustainment and enhancement of all-hazard emergency management capabilities. An all-hazards approach to emergency response, including the development of a comprehensive program of planning, training, and exercises, means there can be an effective and consistent response to disasters and emergencies, regardless of the cause. It involves building long-term strategic relationships within the emergency management community to ensure that the program meets the needs of Missourians during disasters21.
Natural Hazards/Emergency Planning The SEMPO MPA is subject to natural hazards such as flooding, tornados, winter storms, hail, high winds, fire, drought, heat, sinkholes and earthquakes.
Occasional severe floods are problematic within the MPA, especially major flooding on the Mississippi River and the Diversion Channel. Periodic floods disrupt transportation, damage transportation infrastructure and pose a threat to people’s safety.
The MPA is also located in a serious earthquake impact region, the New Madrid Seismic Zone. The area is in FEMA’s D1 Seismic Design Category which indicates that very strong shaking could occur, causing light damage in specially designed structures, considerable damage in ordinary substantial buildings with partial collapse, and great damage in poorly built structures. A strong earthquake would likely cause substantial damage to the transportation system, especially older bridges. Transportation planning for natural disasters is an activity that includes participants at the most immediately responsive level of government, the local level, supplemented by State government and eventually, Federal government.
Natural Hazard Mitigation Natural hazard mitigation refers to reducing risk associated with floods, tornadoes, severe winter storms, earthquakes, drought, wildfires, dam failure, sinkholes, and heat wave. The term mitigation in this usage refers to planning and modeling for potential hazards. Mitigation activities for areas of the SEMPO MPA are contained in the Cape Girardeau County and Scott County Hazard Mitigation Plans.
SEMPO advocates improved coordination and planning of emergency and natural hazard mitigation activities between agencies, related to transportation, and supports the goals of the Cape Girardeau
20 http://sema.dps.mo.gov/about/ 21 http://sema.dps.mo.gov/programs/empg.asp
35 Existing Conditions | SEMPO 2016-2040 Metropolitan Transportation Plan
County and Scott County Hazard Mitigation Plans and also advocates and supports continued coordination and planning activities related to the Cape Girardeau County Emergency Operations Plans for transportation safety and emergency response.
Environmental Impact Mitigation The MPO’s policy for environmental impact mitigation consists of avoiding negative environmental impacts when possible and feasible and, when not possible or feasible, minimizing the negative impacts. If environmental resources are impacted by transportation projects it is usually as a result of construction, increased traffic, and/or storm water runoff. Examples of areas where mitigation efforts could be focused include:
• Neighborhoods, • Cultural Resources, • Parks and recreation areas, • Wetlands and water resources, • Air quality, • Forested and other natural areas, and • Agricultural areas.
The process of environmental impact mitigation can include activities such as:
• Avoiding impacts entirely when possible and feasible, • Minimizing proposed activities/project size, • Restoring temporarily impacted areas, • Precautionary and/or abatement measures to reduce construction impacts, and • Providing suitable replacement resources when possible and feasible.
Air Quality The SEMPO area is fortunate to have good air quality, and the Cape Girardeau/Jackson urban area currently meets State and Federal air quality standards. Given expected adjustments to the EPA “Ozone” and “Particulate Matter 2.5” standards it is possible that most metropolitan areas with ozone monitors and many rural areas with such monitors will not be in compliance with Federal regulations.
Cape Girardeau County currently does not have an ozone monitor; however, rural Perry County, on Cape Girardeau County’s northern border, does have an ozone monitor and could be non-compliant with the expected new ozone standards. If this rural area directly north of the MPO is determined to be non-compliant, such a designation could eventually extend to Cape Girardeau County and the MPA. Such a designation brings with it a complex set of air quality issues that add extensive regulatory costs. At this time, however, Cape Girardeau County and all jurisdictions are considered compliant/not-monitored.
36 Existing Conditions | SEMPO 2016-2040 Metropolitan Transportation Plan
Transportation System Security Security is defined as protection of persons or property from intentional damage or destruction caused by vandalism, criminal activity, or terrorist events. SEMPO can participate in improving security by identifying possible emergency routes, identifying alternate routes, encouraging accessibility by emergency vehicles in neighborhood and street design and through supporting interagency cooperation. Hazardous materials and truck routing information and data may be an activity SEMPO will explore. SEMPO can also assist state and local planning efforts through collection and analysis of accident and infrastructure condition data, and improvements in project selection and investment.
Recommendations of FHWA for the role of security in MPO planning is that consideration of security in the planning process should be documented in key planning documents such as the UPWP, the State Planning and Research Program, the long-range transportation plan, STIP or TIP or may be part of a standalone study. Federally funded or regionally significant transportation security should be included in the metropolitan long-range plan, STIP, or TIP. Other activities may include documenting conversations and coordination with groups focused on security or including transportation security as a project selection criterion22.
Possible activities for the MPO include:
• Establish collaborative decision-making opportunities with emergency response stakeholders; • Collaborate with other state and local agency efforts and/or private sector to enhance security
planning for the transportation system; • Reduce injuries, fatalities, and property damage for all modes of transportation; • Minimize security risks on roadways and bikeways, at Cape Girardeau Regional Airport, and on
public transportation facilities throughout the MPA; • Improve disaster, emergency, and incident response preparedness and recovery; • Assess security vulnerabilities while minimizing redundancies through agency coordination; • Participate in regional planning for safety and security initiatives, such as evacuation measures
and homeland security; • Assess existing resources while periodically re-evaluating emergency preparedness procedures; • Improve protection of critical, security-related infrastructure key facilities.
22 http://www.planning.dot.gov/documents/briefingbook/bbook.htm#13BB
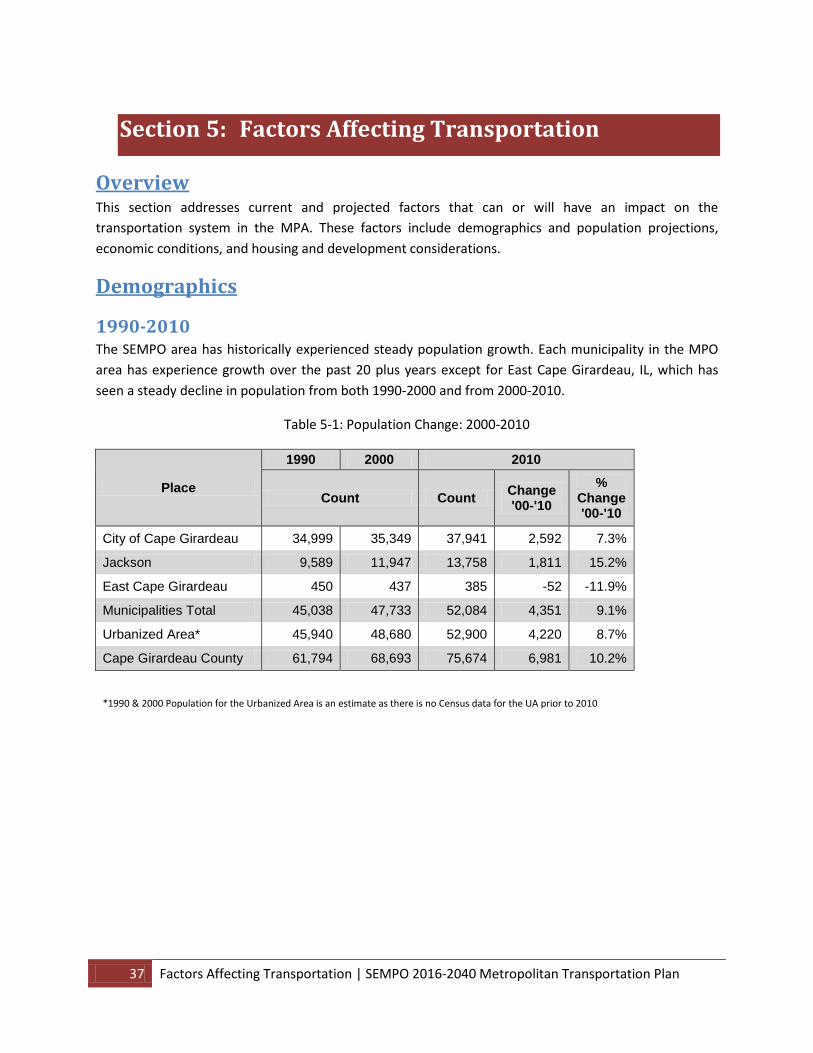
37 Factors Affecting Transportation | SEMPO 2016-2040 Metropolitan Transportation Plan
Section 5: Factors Affecting Transportation
Overview This section addresses current and projected factors that can or will have an impact on the transportation system in the MPA. These factors include demographics and population projections, economic conditions, and housing and development considerations.
Demographics
1990-2010 The SEMPO area has historically experienced steady population growth. Each municipality in the MPO area has experience growth over the past 20 plus years except for East Cape Girardeau, IL, which has seen a steady decline in population from both 1990-2000 and from 2000-2010.
Table 5-1: Population Change: 2000-2010
Place
1990 2000 2010
Count Count Change '00-'10
% Change '00-'10
City of Cape Girardeau 34,999 35,349 37,941 2,592 7.3%
Jackson 9,589 11,947 13,758 1,811 15.2%
East Cape Girardeau 450 437 385 -52 -11.9%
Municipalities Total 45,038 47,733 52,084 4,351 9.1%
Urbanized Area* 45,940 48,680 52,900 4,220 8.7%
Cape Girardeau County 61,794 68,693 75,674 6,981 10.2%
*1990 & 2000 Population for the Urbanized Area is an estimate as there is no Census data for the UA prior to 2010
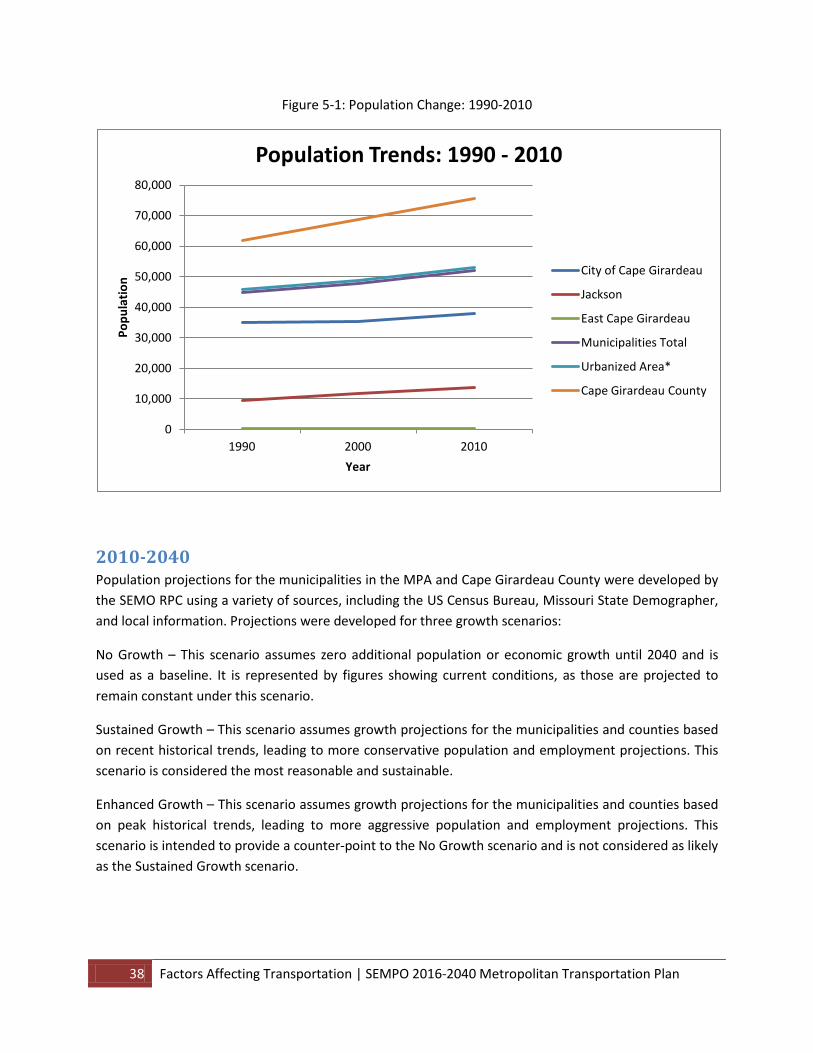
38 Factors Affecting Transportation | SEMPO 2016-2040 Metropolitan Transportation Plan
Figure 5-1: Population Change: 1990-2010
2010-2040 Population projections for the municipalities in the MPA and Cape Girardeau County were developed by the SEMO RPC using a variety of sources, including the US Census Bureau, Missouri State Demographer, and local information. Projections were developed for three growth scenarios:
No Growth – This scenario assumes zero additional population or economic growth until 2040 and is used as a baseline. It is represented by figures showing current conditions, as those are projected to remain constant under this scenario.
Sustained Growth – This scenario assumes growth projections for the municipalities and counties based on recent historical trends, leading to more conservative population and employment projections. This scenario is considered the most reasonable and sustainable.
Enhanced Growth – This scenario assumes growth projections for the municipalities and counties based on peak historical trends, leading to more aggressive population and employment projections. This scenario is intended to provide a counter-point to the No Growth scenario and is not considered as likely as the Sustained Growth scenario.
0
10,000
20,000
30,000
40,000
50,000
60,000
70,000
80,000
1990 2000 2010
Popu
latio
n
Year
Population Trends: 1990 - 2010
City of Cape Girardeau
Jackson
East Cape Girardeau
Municipalities Total
Urbanized Area*
Cape Girardeau County
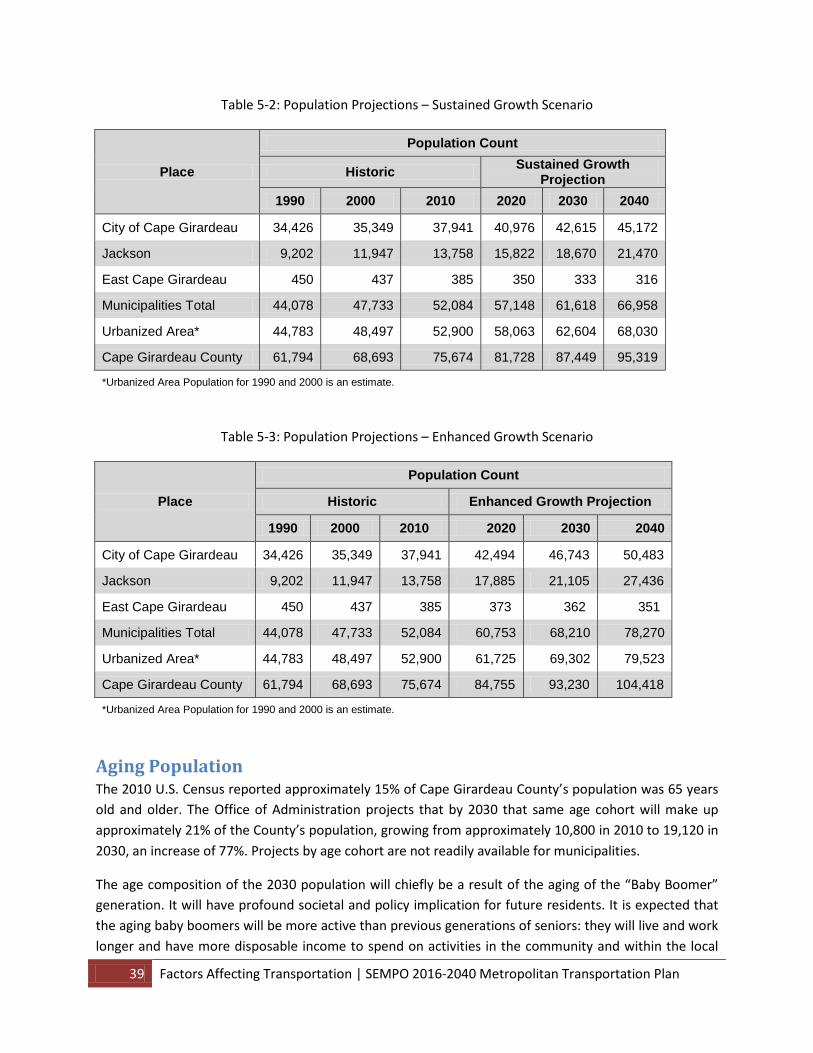
39 Factors Affecting Transportation | SEMPO 2016-2040 Metropolitan Transportation Plan
Table 5-2: Population Projections – Sustained Growth Scenario
Place
Population Count
Historic Sustained Growth Projection
1990 2000 2010 2020 2030 2040
City of Cape Girardeau 34,426 35,349 37,941 40,976 42,615 45,172
Jackson 9,202 11,947 13,758 15,822 18,670 21,470
East Cape Girardeau 450 437 385 350 333 316
Municipalities Total 44,078 47,733 52,084 57,148 61,618 66,958
Urbanized Area* 44,783 48,497 52,900 58,063 62,604 68,030
Cape Girardeau County 61,794 68,693 75,674 81,728 87,449 95,319
*Urbanized Area Population for 1990 and 2000 is an estimate.
Table 5-3: Population Projections – Enhanced Growth Scenario
Place
Population Count
Historic Enhanced Growth Projection
1990 2000 2010 2020 2030 2040
City of Cape Girardeau 34,426 35,349 37,941 42,494 46,743 50,483
Jackson 9,202 11,947 13,758 17,885 21,105 27,436
East Cape Girardeau 450 437 385 373 362 351
Municipalities Total 44,078 47,733 52,084 60,753 68,210 78,270
Urbanized Area* 44,783 48,497 52,900 61,725 69,302 79,523
Cape Girardeau County 61,794 68,693 75,674 84,755 93,230 104,418
*Urbanized Area Population for 1990 and 2000 is an estimate.
Aging Population The 2010 U.S. Census reported approximately 15% of Cape Girardeau County’s population was 65 years old and older. The Office of Administration projects that by 2030 that same age cohort will make up approximately 21% of the County’s population, growing from approximately 10,800 in 2010 to 19,120 in 2030, an increase of 77%. Projects by age cohort are not readily available for municipalities.
The age composition of the 2030 population will chiefly be a result of the aging of the “Baby Boomer” generation. It will have profound societal and policy implication for future residents. It is expected that the aging baby boomers will be more active than previous generations of seniors: they will live and work longer and have more disposable income to spend on activities in the community and within the local
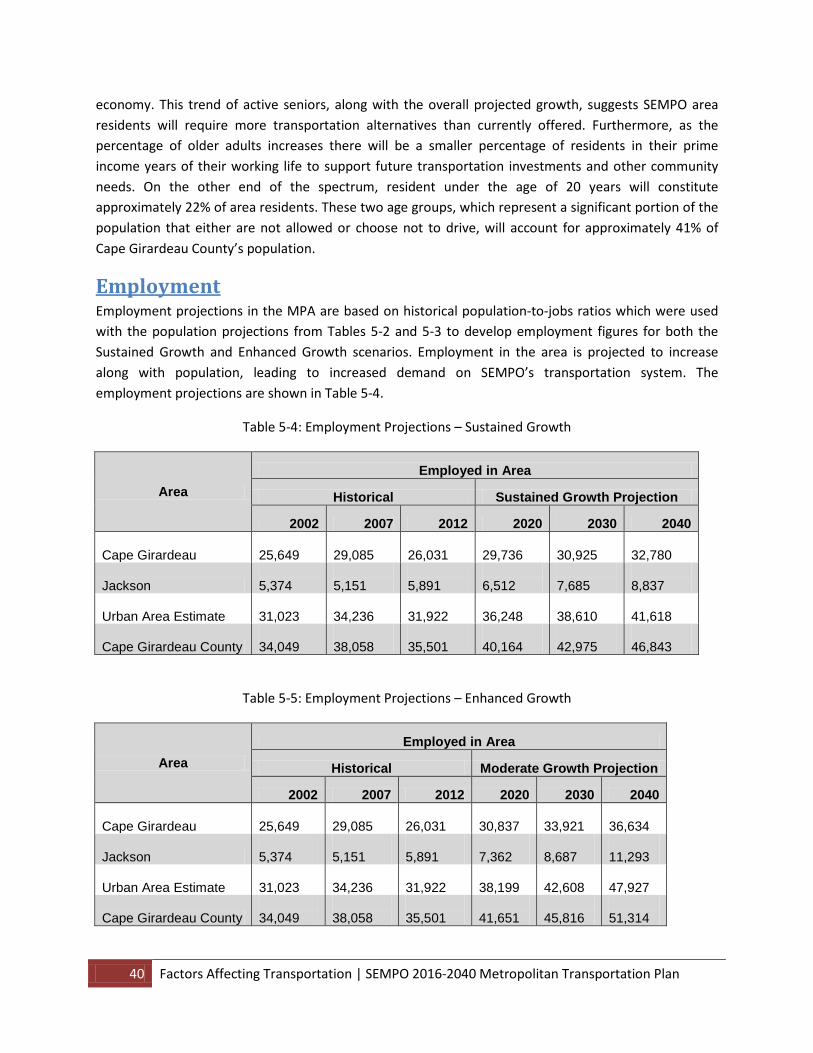
40 Factors Affecting Transportation | SEMPO 2016-2040 Metropolitan Transportation Plan
economy. This trend of active seniors, along with the overall projected growth, suggests SEMPO area residents will require more transportation alternatives than currently offered. Furthermore, as the percentage of older adults increases there will be a smaller percentage of residents in their prime income years of their working life to support future transportation investments and other community needs. On the other end of the spectrum, resident under the age of 20 years will constitute approximately 22% of area residents. These two age groups, which represent a significant portion of the population that either are not allowed or choose not to drive, will account for approximately 41% of Cape Girardeau County’s population.
Employment Employment projections in the MPA are based on historical population-to-jobs ratios which were used with the population projections from Tables 5-2 and 5-3 to develop employment figures for both the Sustained Growth and Enhanced Growth scenarios. Employment in the area is projected to increase along with population, leading to increased demand on SEMPO’s transportation system. The employment projections are shown in Table 5-4.
Table 5-4: Employment Projections – Sustained Growth
Area Employed in Area
Historical Sustained Growth Projection
2002 2007 2012 2020 2030 2040
Cape Girardeau 25,649
29,085
26,031
29,736
30,925
32,780
Jackson 5,374
5,151
5,891
6,512
7,685
8,837
Urban Area Estimate 31,023
34,236
31,922
36,248
38,610
41,618
Cape Girardeau County 34,049
38,058
35,501
40,164
42,975
46,843
Table 5-5: Employment Projections – Enhanced Growth
Area Employed in Area
Historical Moderate Growth Projection
2002 2007 2012 2020 2030 2040
Cape Girardeau 25,649
29,085
26,031
30,837
33,921
36,634
Jackson 5,374
5,151
5,891
7,362
8,687
11,293
Urban Area Estimate 31,023
34,236
31,922
38,199
42,608
47,927
Cape Girardeau County 34,049
38,058
35,501
41,651
45,816
51,314
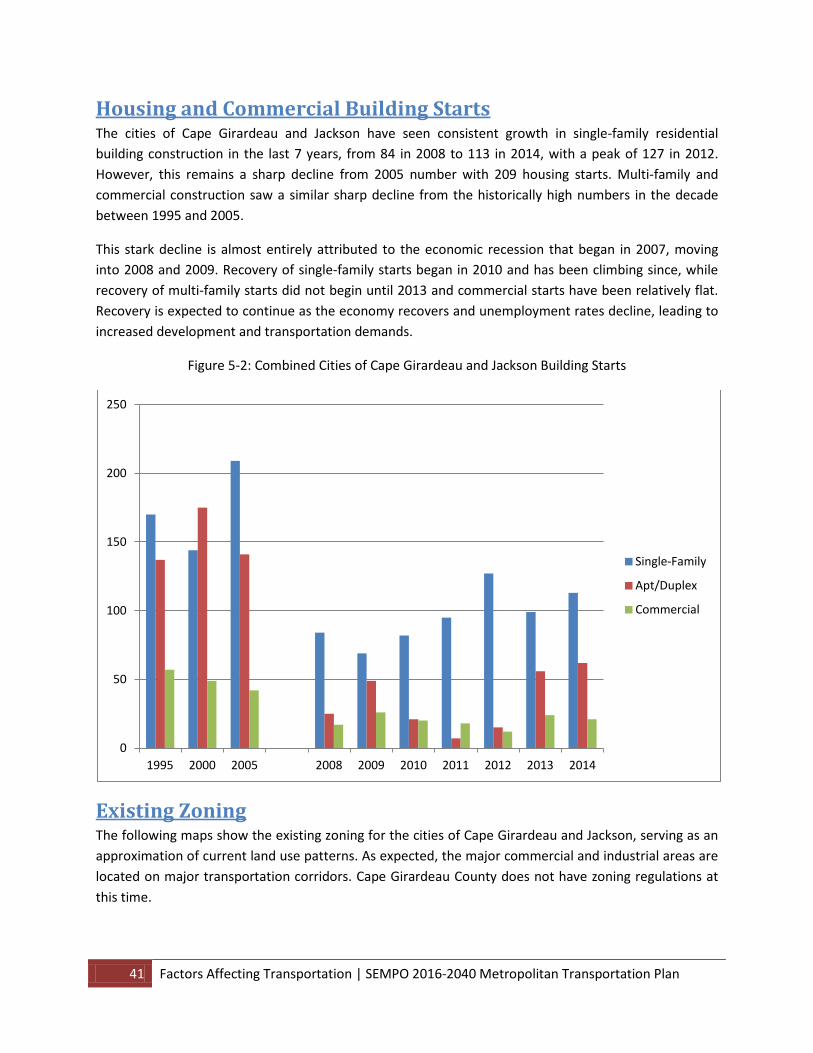
41 Factors Affecting Transportation | SEMPO 2016-2040 Metropolitan Transportation Plan
Housing and Commercial Building Starts The cities of Cape Girardeau and Jackson have seen consistent growth in single-family residential building construction in the last 7 years, from 84 in 2008 to 113 in 2014, with a peak of 127 in 2012. However, this remains a sharp decline from 2005 number with 209 housing starts. Multi-family and commercial construction saw a similar sharp decline from the historically high numbers in the decade between 1995 and 2005.
This stark decline is almost entirely attributed to the economic recession that began in 2007, moving into 2008 and 2009. Recovery of single-family starts began in 2010 and has been climbing since, while recovery of multi-family starts did not begin until 2013 and commercial starts have been relatively flat. Recovery is expected to continue as the economy recovers and unemployment rates decline, leading to increased development and transportation demands.
Figure 5-2: Combined Cities of Cape Girardeau and Jackson Building Starts
Existing Zoning The following maps show the existing zoning for the cities of Cape Girardeau and Jackson, serving as an approximation of current land use patterns. As expected, the major commercial and industrial areas are located on major transportation corridors. Cape Girardeau County does not have zoning regulations at this time.
0
50
100
150
200
250
1995 2000 2005 2008 2009 2010 2011 2012 2013 2014
Single-Family
Apt/Duplex
Commercial
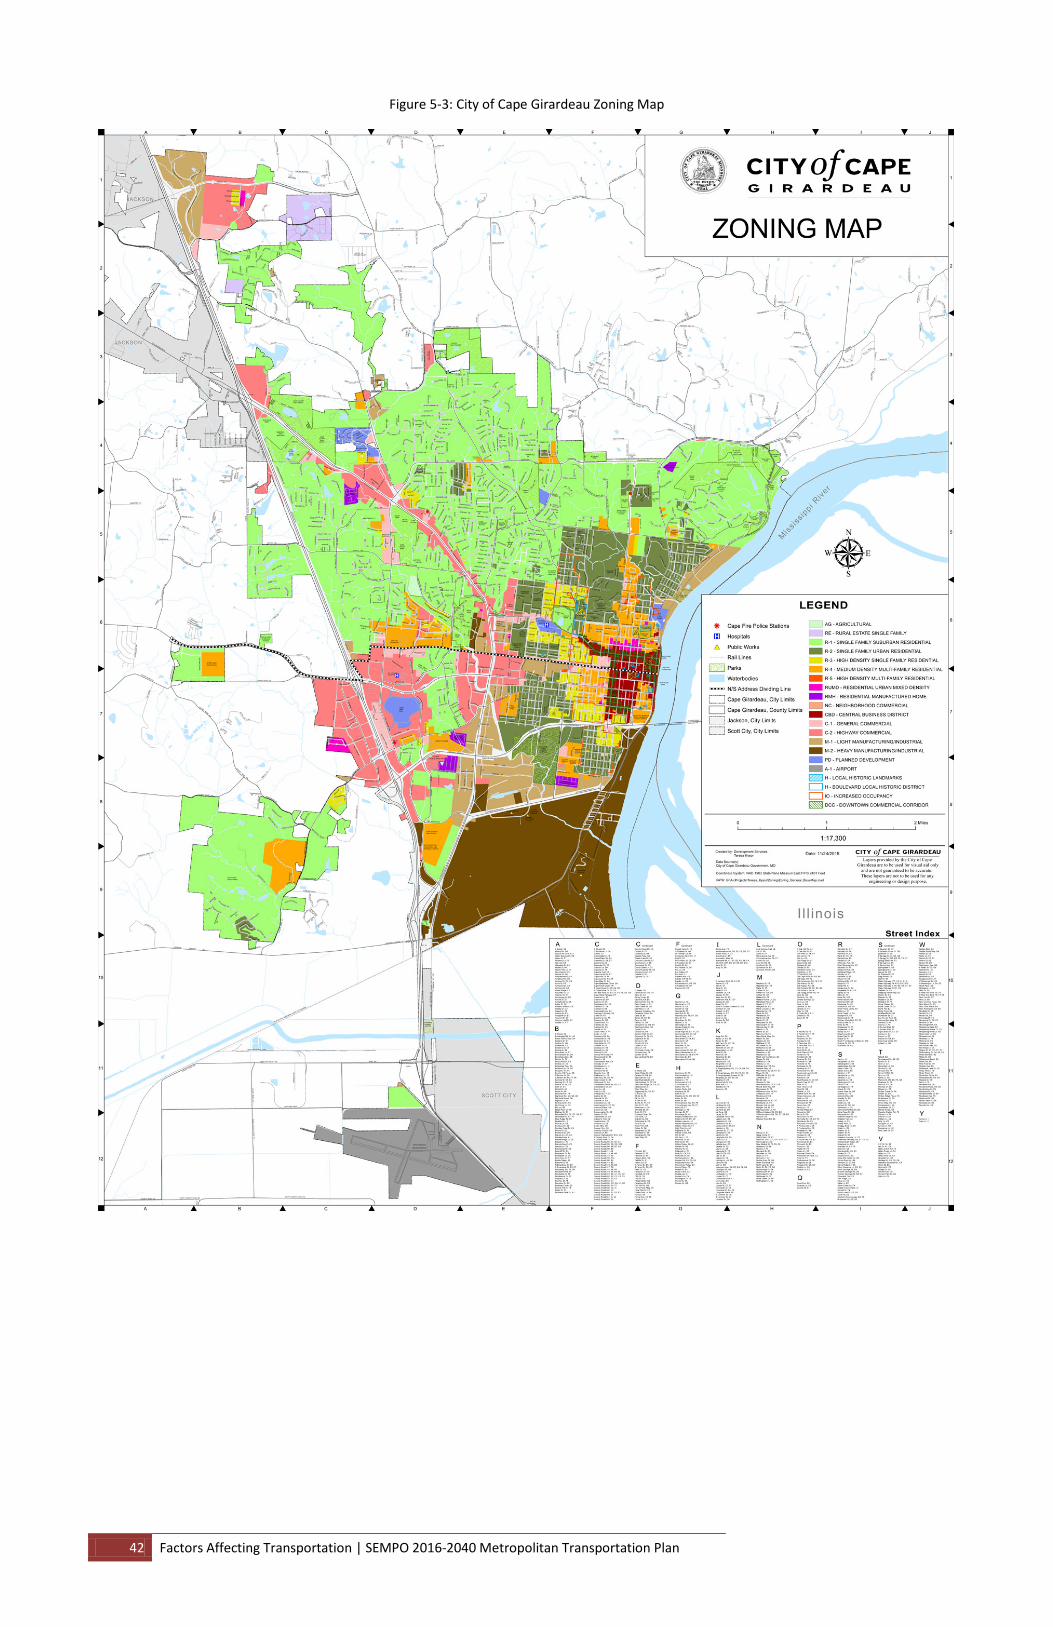
42 Factors Affecting Transportation | SEMPO 2016-2040 Metropolitan Transportation Plan
Figure 5-3: City of Cape Girardeau Zoning Map
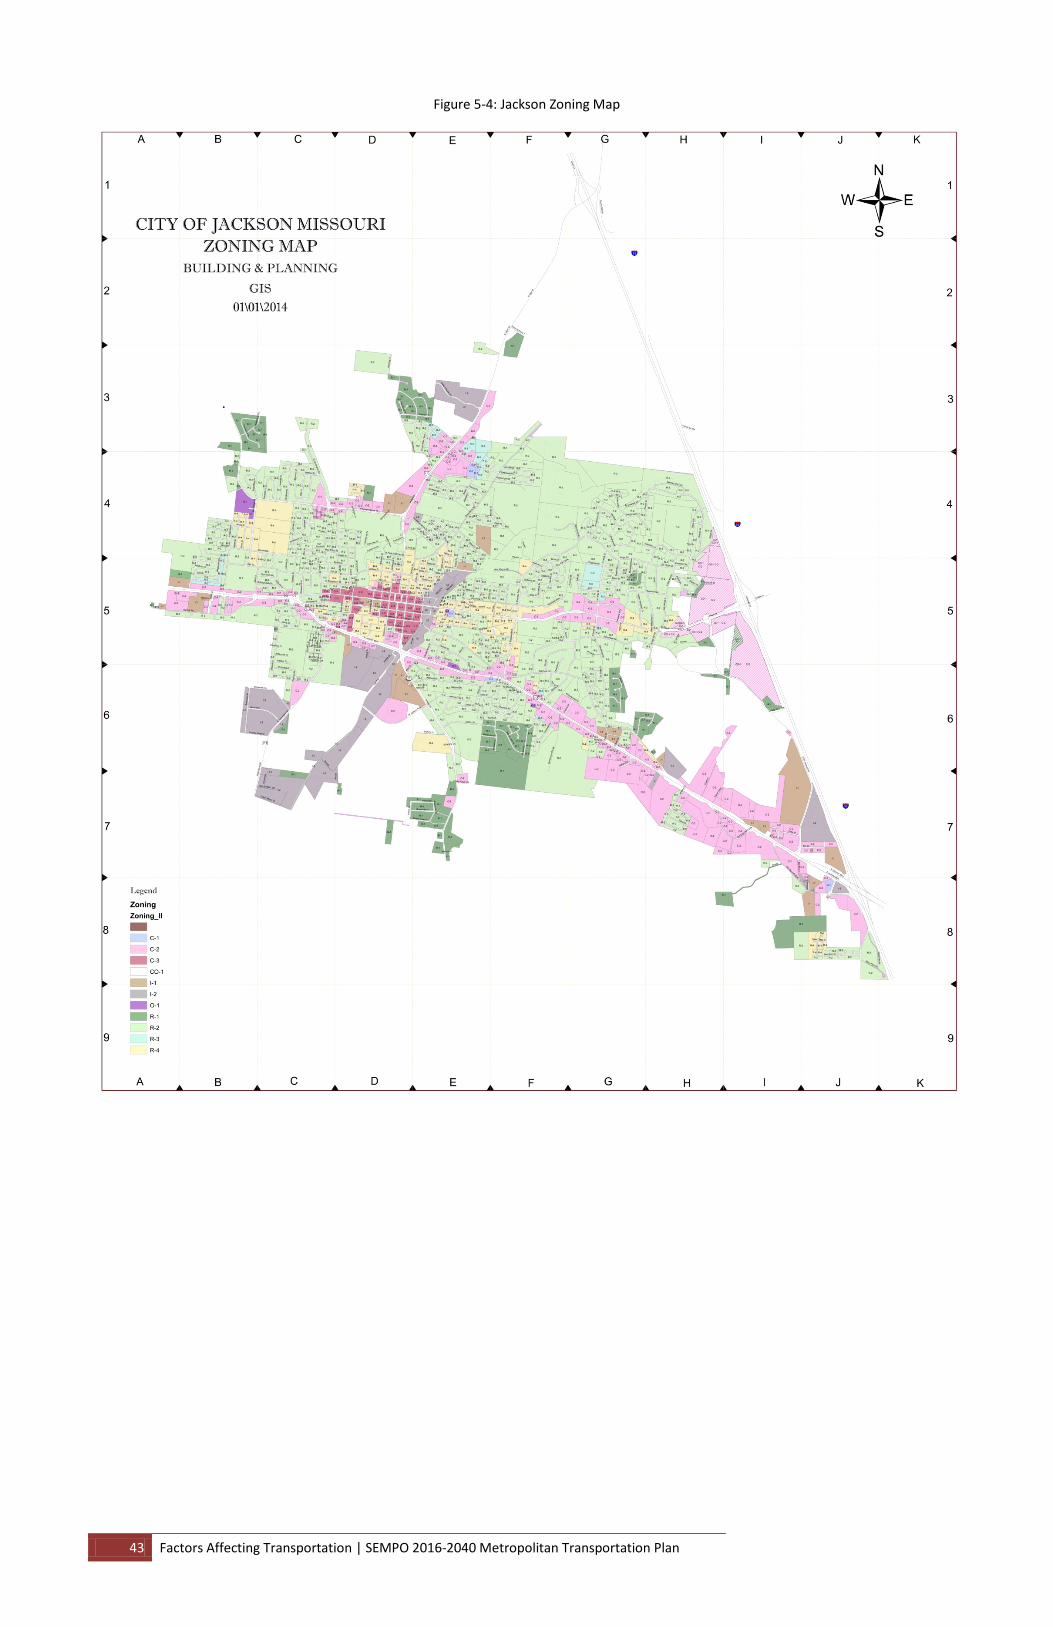
43 Factors Affecting Transportation | SEMPO 2016-2040 Metropolitan Transportation Plan
Figure 5-4: Jackson Zoning Map
44 Factors Affecting Transportation | SEMPO 2016-2040 Metropolitan Transportation Plan
Future Land Use
Development The heaviest development in the MPO is expected to occur within close proximity to Cape Girardeau and Jackson due to existing services and population density, especially in the area bound by and around 25/61/I-55/K and the area bound by and around I-55/Y/W/61. Much of the land surrounding the cities is developable and growth is also expected along PP South of Jackson and 34/72 West of Jackson, between I-55 and Route D North of Jackson, areas close to existing infrastructure North of Cape Girardeau, and the area between K and 74 West of Cape Girardeau.
This anticipated growth will eventually require the development of additional Collectors and Arterials, especially on the Northwest and Southern sides of Jackson and on the Northern and Western sides of Cape Girardeau. Some of these concepts are already present in the Major Street Plans of both Cape Girardeau and Jackson.
Redevelopment and Infill There are areas in each city that present redevelopment opportunities or that remain undeveloped even as the areas around them grow. Most of these areas are not so large as to expect their development or redevelopment to have significant impacts on the transportation network. In most cases, areas that are prime for redevelopment or infill are already surrounded by adequate infrastructure, barring a significant change in land use from the previous or surrounding uses.
There are a number of areas in Cape Girardeau and Jackson that are large enough that development of them would be expected to have an impact on the transportation network. In Jackson there are large areas of land along Main St. between Shawnee Blvd and Lacey St. and between Oakhill Rd and I-55 which are currently undeveloped, but the extension of E. Main out to I-55 is expected to spur development in this area. Also in Jackson, the area between 61, I-55, and E. Main St. is largely undeveloped and is a targeted area for growth by the city. In Cape Girardeau, the area bound by Oakhills Dr./Cape Rock Dr, Bertling St, 643, and the Mississippi River is undeveloped or only lightly developed.
Transportation Corridor Development There are two priority transportation corridors in the MPO, shown in Figure 5-7, the Jackson Priority Corridor and the I-55 Priority Corridor. Both corridors have sections that are largely built-out and will see little additional development; however, each corridor also has large areas that are prime development areas and each is currently experiencing significant growth, especially in industrial uses. Jackson’s current comprehensive plan has the majority of the primary and secondary growth targets located within one of these two corridors, and development is underway within the new industrial park in Cape Girardeau at the intersection of I-55/La Salle, Main St.
The La Salle/Main St. (Cape Girardeau/Jackson respectively) is another corridor that is likely to see development in the next 20 years in both cities with development likely to be focused on residential and
45 Factors Affecting Transportation | SEMPO 2016-2040 Metropolitan Transportation Plan
industrial development, with some commercial mixed in. The Kingshighway/Jackson Blvd corridor is another critical corridor, though it is largely built-out. There are, however, some opportunities for development along this corridor on both the East and West ends of Jackson.
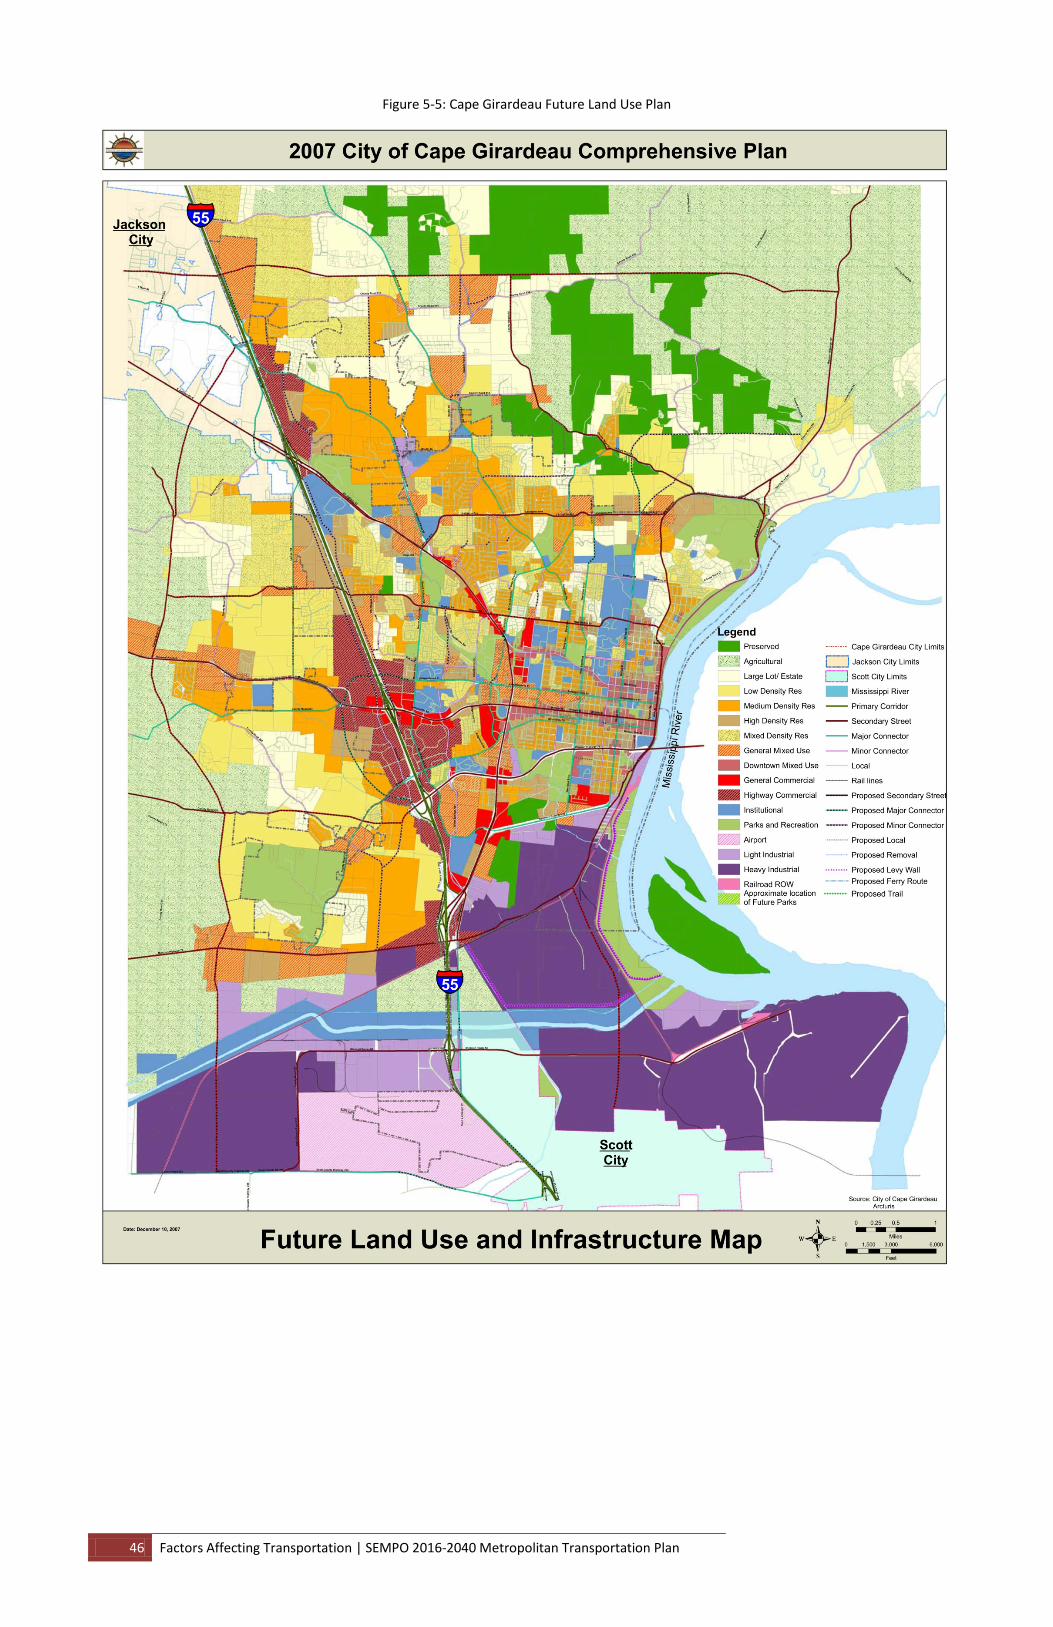
46 Factors Affecting Transportation | SEMPO 2016-2040 Metropolitan Transportation Plan
Figure 5-5: Cape Girardeau Future Land Use Plan
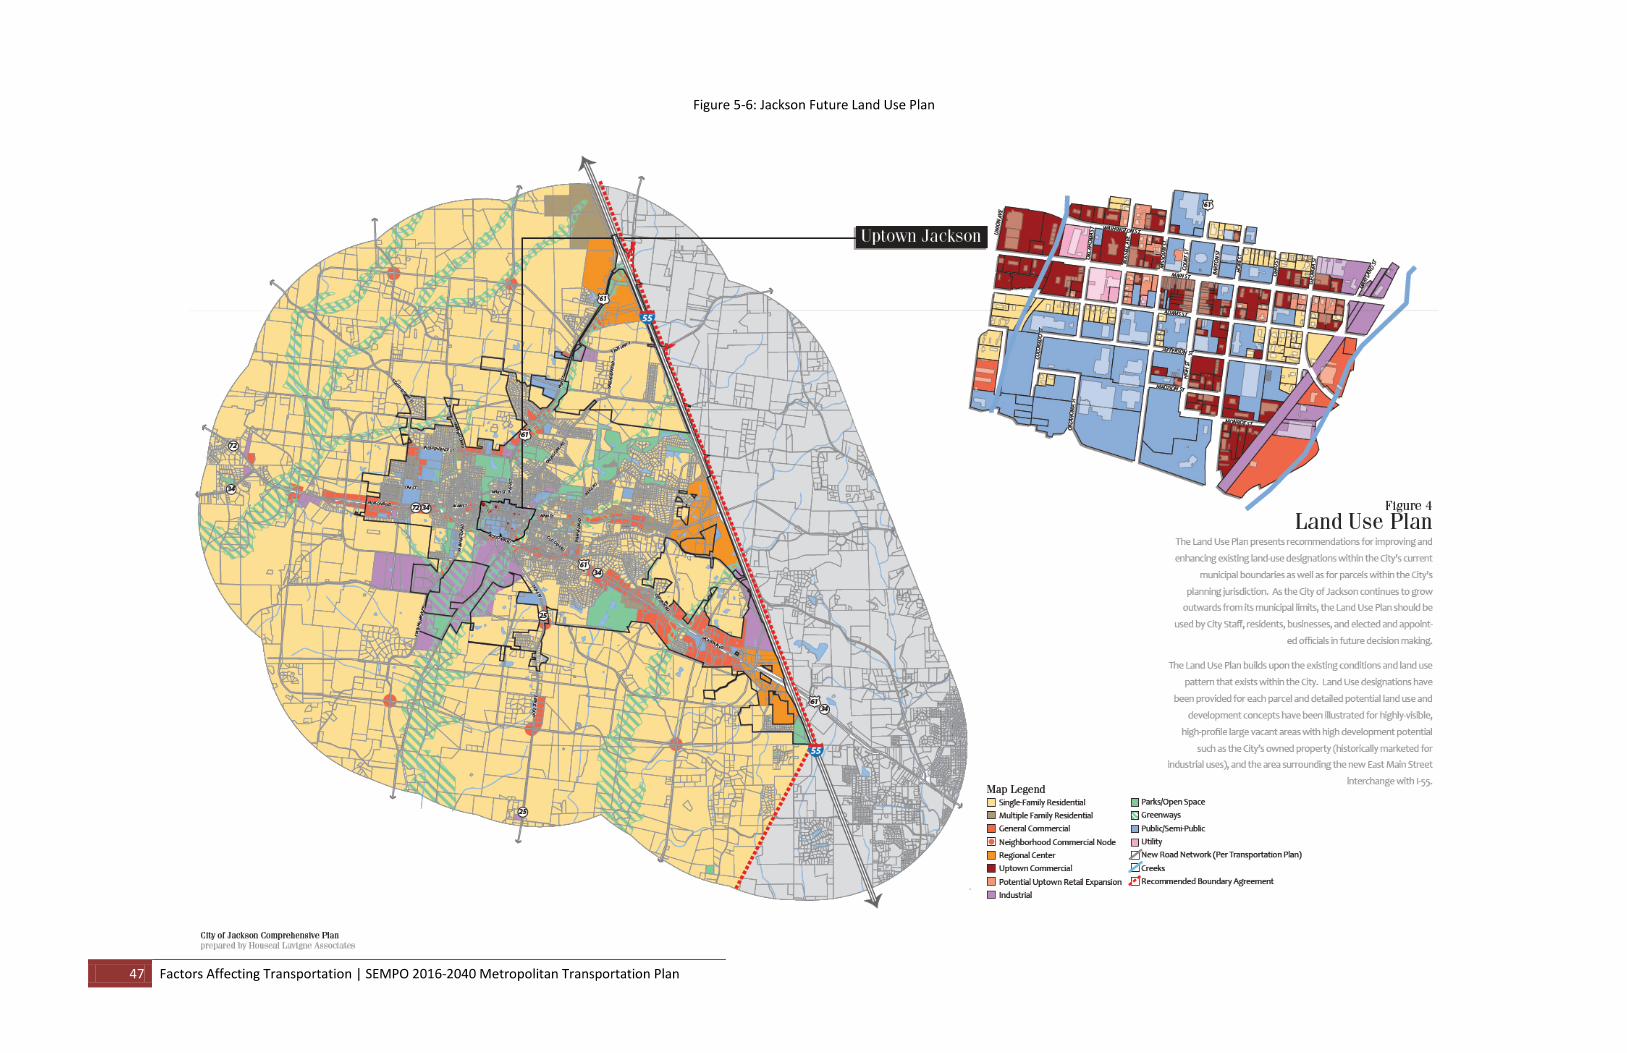
47 Factors Affecting Transportation | SEMPO 2016-2040 Metropolitan Transportation Plan
Figure 5-6: Jackson Future Land Use Plan
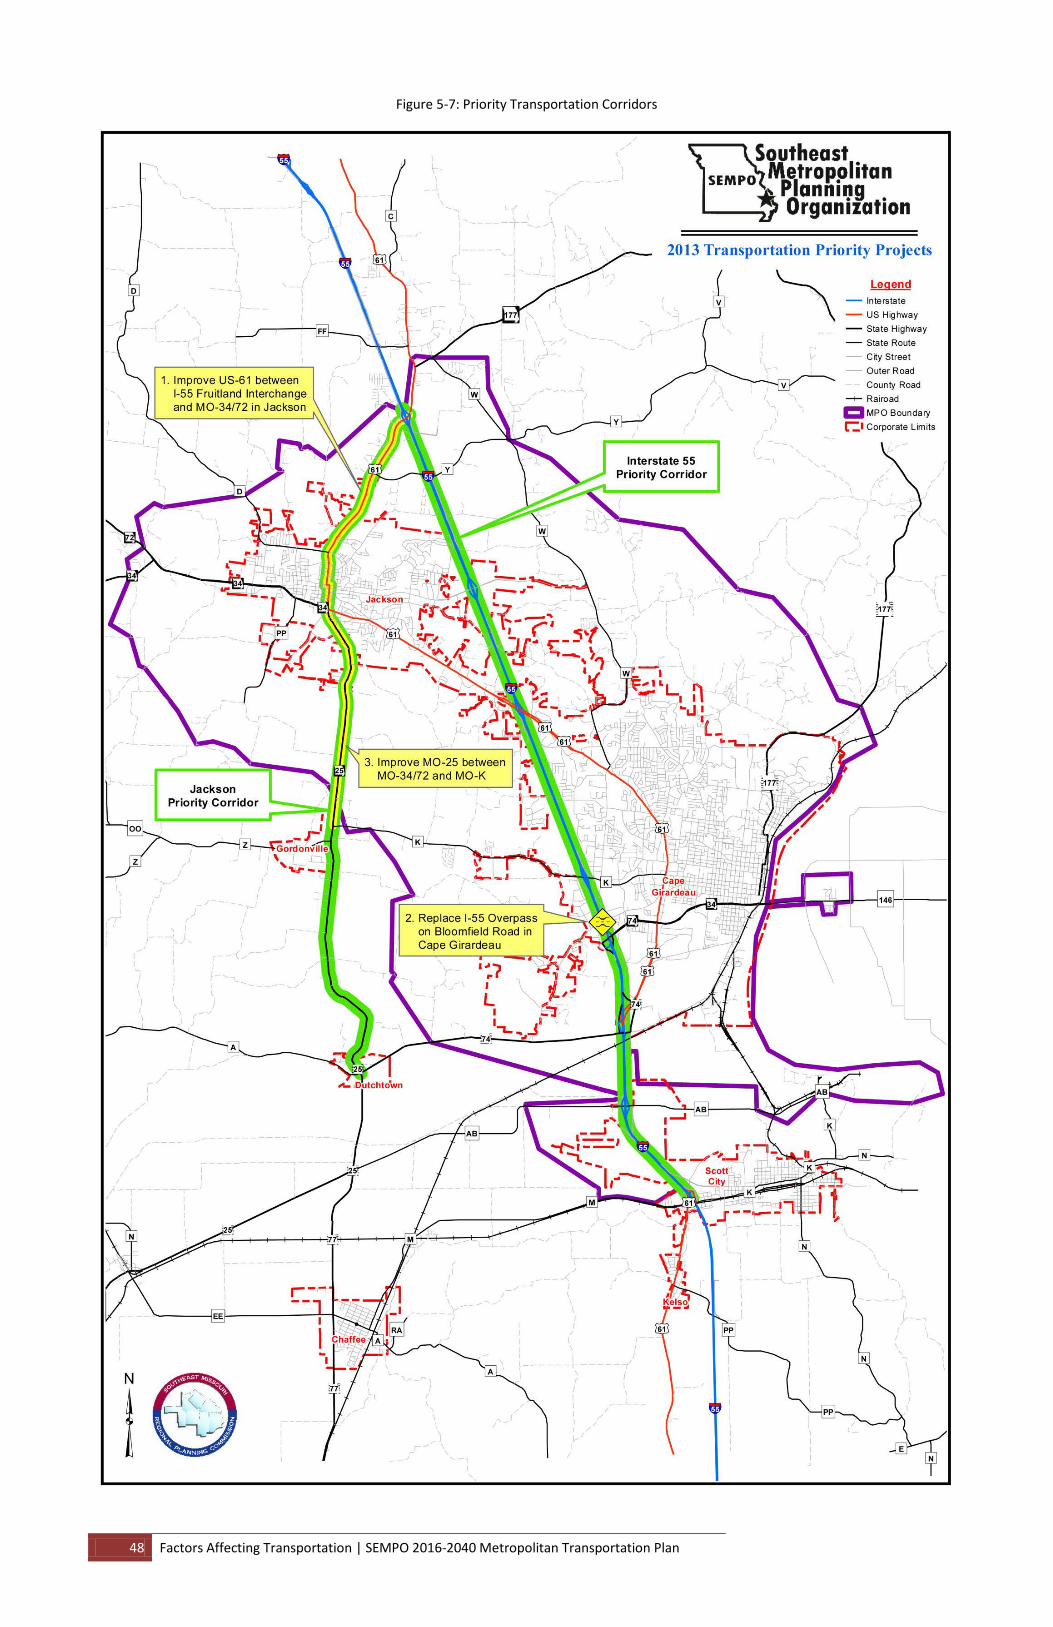
48 Factors Affecting Transportation | SEMPO 2016-2040 Metropolitan Transportation Plan
Figure 5-7: Priority Transportation Corridors
49 Future Transportation Needs | SEMPO 2016-2040 Metropolitan Transportation Plan
Section 6: Future Transportation Needs
Overview An important step in developing the 2040 MTP involves identifying future transportation needs for the SEMPO region. These future needs may ultimately lead to specific transportation improvements, the further study of transportation corridors to identify local and regional travel needs, or the identification of transportation and/or growth related policies to support on-going maintenance and future infrastructure decisions. The following summarizes the process of identifying future transportation needs and highlights issues that should be addressed in the MTP process over the next 20 years. The SEMPO travel demand forecast is the primary tool used to analyze the transportation impacts associated with the 2040 growth scenarios for all areas in the MPA.
Sustained Growth vs. Enhanced Growth As detailed in Chapter 5, tables 5-2 and 5-3, the population of the Urbanized Area in 2040 is projected to be 68,030 in the sustained growth scenario versus 79,523 in the enhanced growth scenario, a difference of nearly 11,500 people. Likewise, the 2040 population for all of Cape Girardeau County is projected to be 95,319 under the assumptions of the sustained growth scenario, and 104,418 under the enhanced growth scenario, a difference of almost 9,100 people.
Employment projections, being based on a percentage of projected population, correspond proportionally to the population projections and can be found in detail in Chapter 5, tables 5-4 and 5-5. The number of people employed in the Urbanized Area is projected to be 41,618 in the sustained growth scenario, and 47,927 in the enhanced growth scenario, while employment in the County is projected to be 46,843 in the sustained growth scenario and 51,314 in the enhanced growth scenario.
When comparing the 2010 population estimate for the Urbanized Area of 52,900 to the population projections of the sustained and enhanced growth scenarios, the UA is expected to grow by 15,130 and 26,623 respectively. Similarly, when looking at the differences in employment in the UA between the 2012 figure of 31,922 and the projected growth scenarios, an increase of 9,696 employees is projected for the sustained growth model, and 16,005 employees for the enhanced growth model.
Based on local averages of people per household and housing density, national averages for trips per household and trips per square foot of commercial space, the comprehensive plans of the cities of Cape Girardeau and Jackson, and with assistance from the planning staff of both cities, these population and employment growth scenarios were assigned to general areas of the UA and calculations for the number of trips generated were run. Figures 6-1 and 6-2 show the assignment of housing, commercial, and industrial development in the area, with the enhanced growth scenario generally building upon the sustained growth assignments. Of primary note is the concentration of development in both scenarios around the three road segments already identified as being near capacity: I-55 throughout the entire MPA, Highway 61 in Jackson North of Route D, and William St. in Cape Girardeau mainly East of the Interstate. This growth is expected to put an increased strain on these roadways as they are primary
50 Future Transportation Needs | SEMPO 2016-2040 Metropolitan Transportation Plan
corridors in the area. A significant amount of growth is also anticipated at the I-55/La Salle/E. Main St. intersection, putting increased traffic on E. Main in Jackson and La Salle in Cape Girardeau, in addition to I-55.
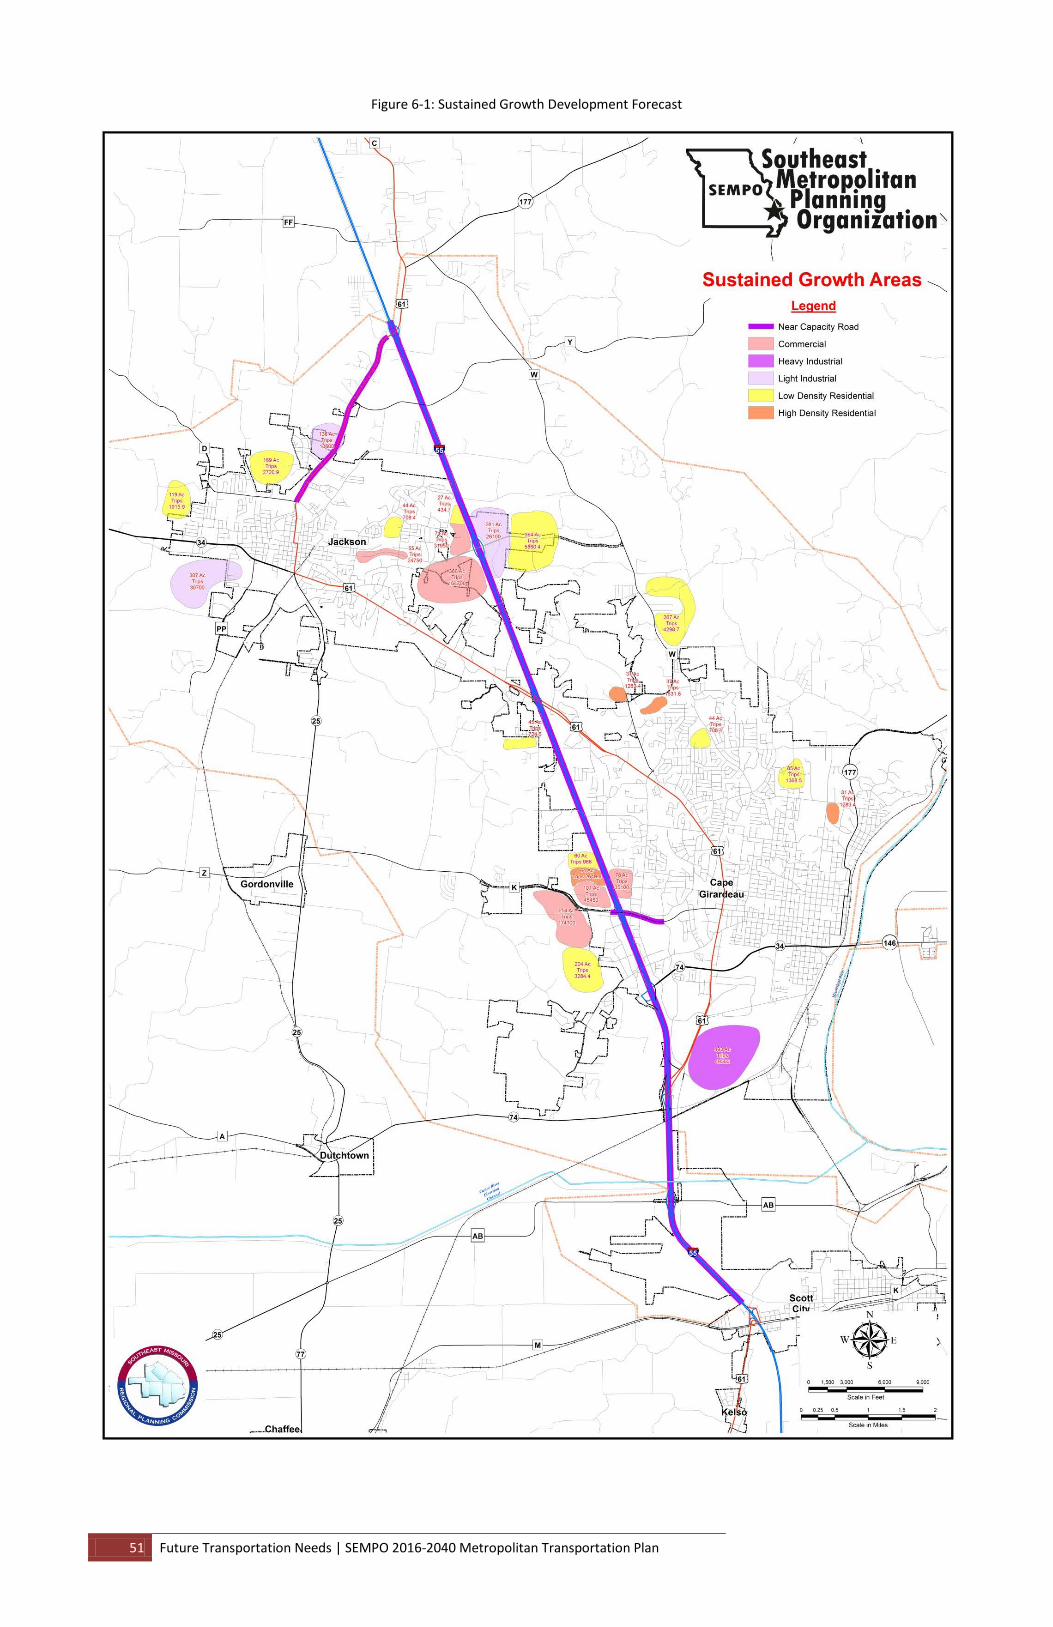
51 Future Transportation Needs | SEMPO 2016-2040 Metropolitan Transportation Plan
Figure 6-1: Sustained Growth Development Forecast
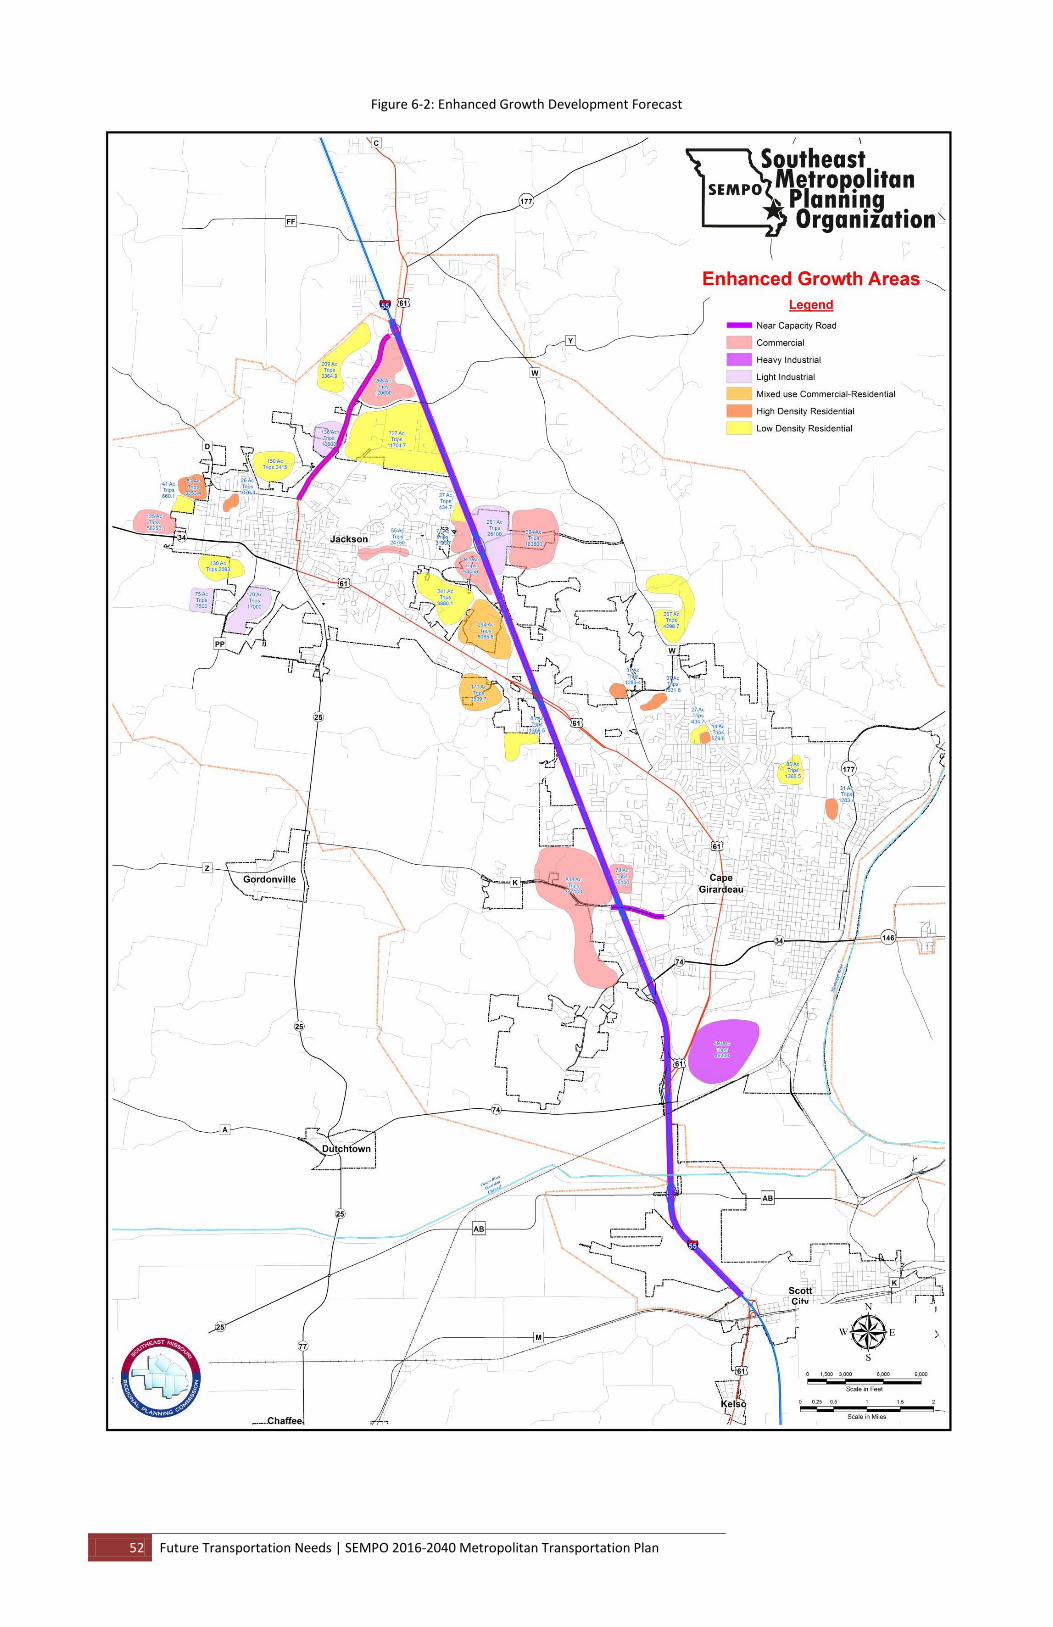
52 Future Transportation Needs | SEMPO 2016-2040 Metropolitan Transportation Plan
Figure 6-2: Enhanced Growth Development Forecast
53 Alternatives Analysis | SEMPO 2016-2040 Metropolitan Transportation Plan
Section 7: Alternatives Analysis
Overview Potential roadway developments were identified for each growth scenario based on the projected growth of both residents and employees in the area and the possible locations of development to accommodate said growth. These alternatives can be seen in Figure 7-1 for the sustained growth scenario and Figure 7-2 for the enhanced growth scenario.
Sustained Growth Scenario Roadway Alternatives The primary roadway projects in the sustained growth scenario include an outer Northwest loop around Jackson and additional frontage roads for I-55, the Bloomfield Rd overpass improvement, the Armstrong Dr. extension to the West of Siemers Dr., and the Exit 93 improvements in Cape Girardeau. Additional projects include mostly roadway extensions or upgrades within the cities to complete connections and relieve expected traffic on the existing major routes.
The Northwest outer loop around Jackson will be needed to relieve pressure off of the already taxed stretch of Highway 61, as well as Jackson Blvd West of 61/25 and Route D/Independence St. Additionally, the extension of West Ln. both North to Independence St. and South to Dogwood Ave. and S. Farmington Rd will also help alleviate traffic on 61 and Jackson Blvd. With so much development expected to occur at the La Salle/East Main interchange, the connection from Shawnee Blvd. to 61 that an extended and upgraded Vera Wagner Dr. will offer will be critical in avoiding excessive traffic on Main St. through much of Jackson. Finally, the extension of Old Orchard Rd. North of East Main St. and a North-South connection between E. Main St. and Jackson Blvd between Shawnee Blvd. and I-55 will be important to provide an alternative to I-55 and relieve pressure on E. Main St., Highway 61, and Jackson Blvd.
In Cape Girardeau, the extension of Veterans Memorial Drive both North and South of Kingshighway/Hwy 61, will be critical to providing alternatives to a congested I-55 and in easing traffic on Kingshighway and Mount Auburn Rd., both of which will see increased traffic in the future. The extension of Armstrong Dr. to the West of Siemers Dr. will be needed to provide alternative routes of access to this heavily trafficked commercial area that is expected to continue to develop over the next 30 years. Additionally, the Bloomfield overpass is already in need of replacement and will likely not be able to support the amount of traffic expected in 2040. Similarly, the design of the Exit 93 interchange is highly inefficient and stymies growth and development in the Southern part of the city. Finally, a North-South connection West of I-55 and South of Route K will be needed to alleviate traffic on Armstrong Dr., Siemers Dr., and Route K/William St.
54 Alternatives Analysis | SEMPO 2016-2040 Metropolitan Transportation Plan
Enhanced Growth Scenario Roadway Alternatives The enhanced growth scenario projects all build on the projects proposed in the sustained growth scenario. In fact, the City of Cape Girardeau’s projects remain unchanged, largely thanks to a generally efficient existing roadway network and development patterns that allow for the efficient use of existing infrastucture.
Even the City of Jackson’s projects change very little, for many of the same reasons. Under the enhanced growth model, Jackson is expected to need only a more robust Northwest loop, an additional Southwest loop, and an additional North-South connection between East Main St. and Jackson Blvd between I-55 and Shawnee Blvd. All of these additional projects are intended to alleviate traffic on Highway 61, Jackson Blvd., East Main St., or I-55 and to provide additional access routes to anticipated development.
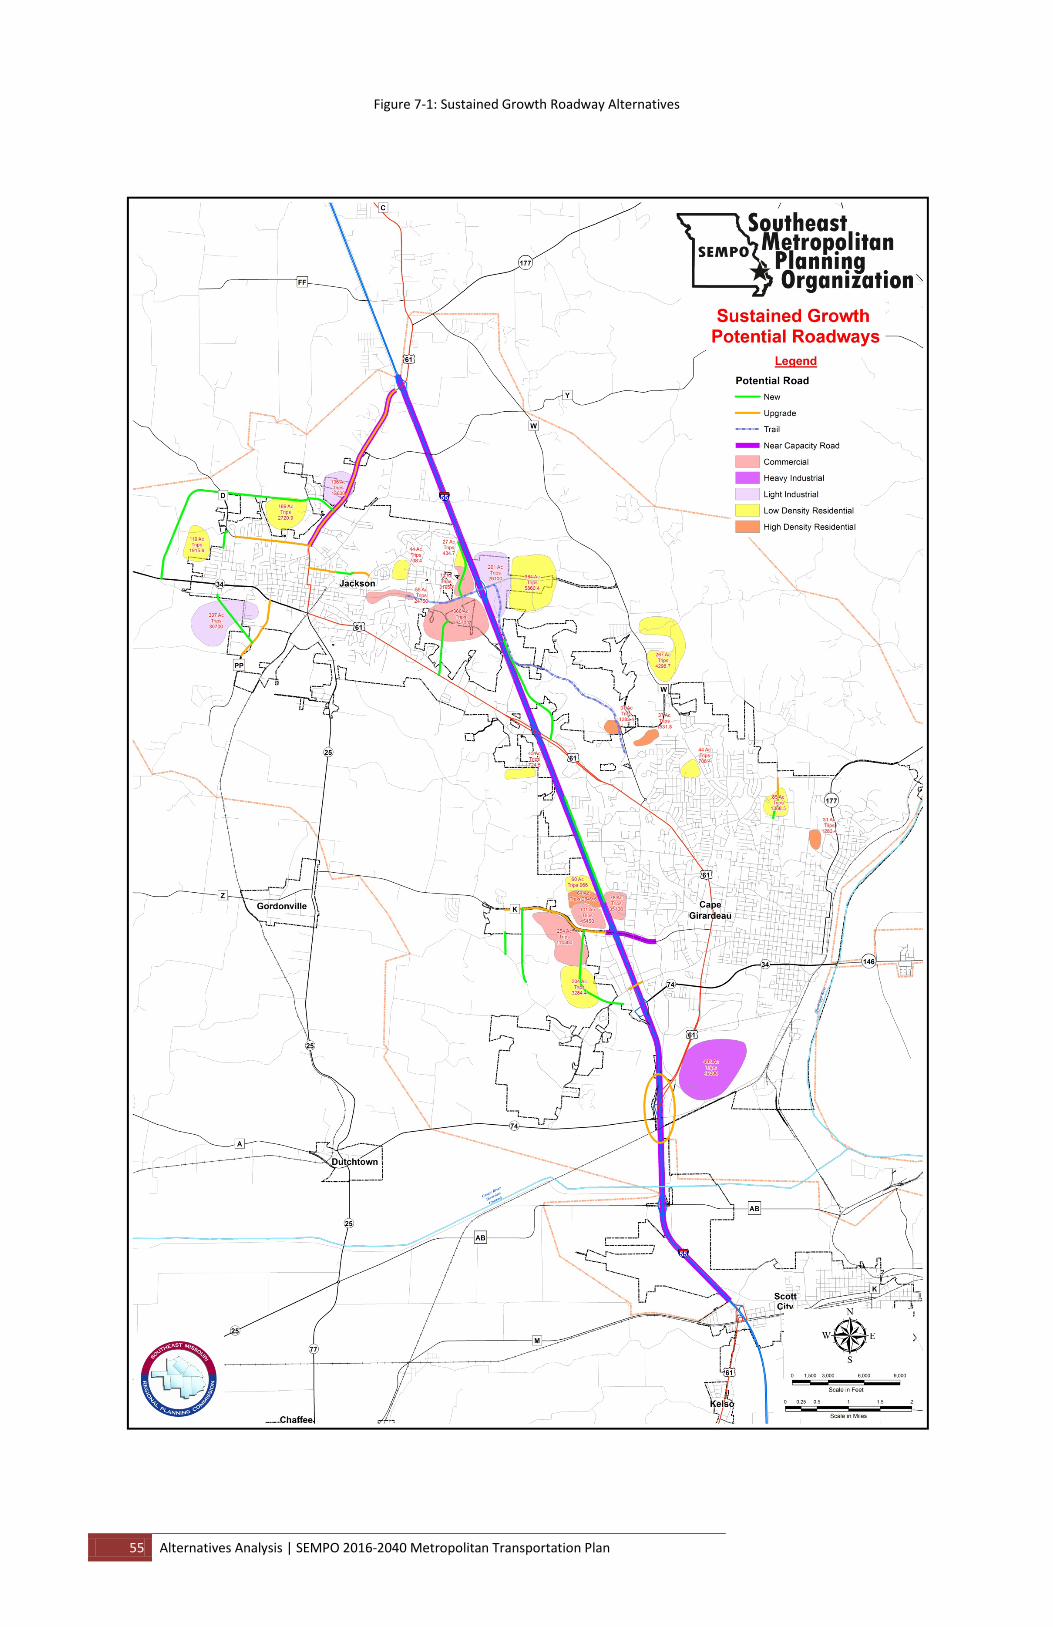
55 Alternatives Analysis | SEMPO 2016-2040 Metropolitan Transportation Plan
Figure 7-1: Sustained Growth Roadway Alternatives
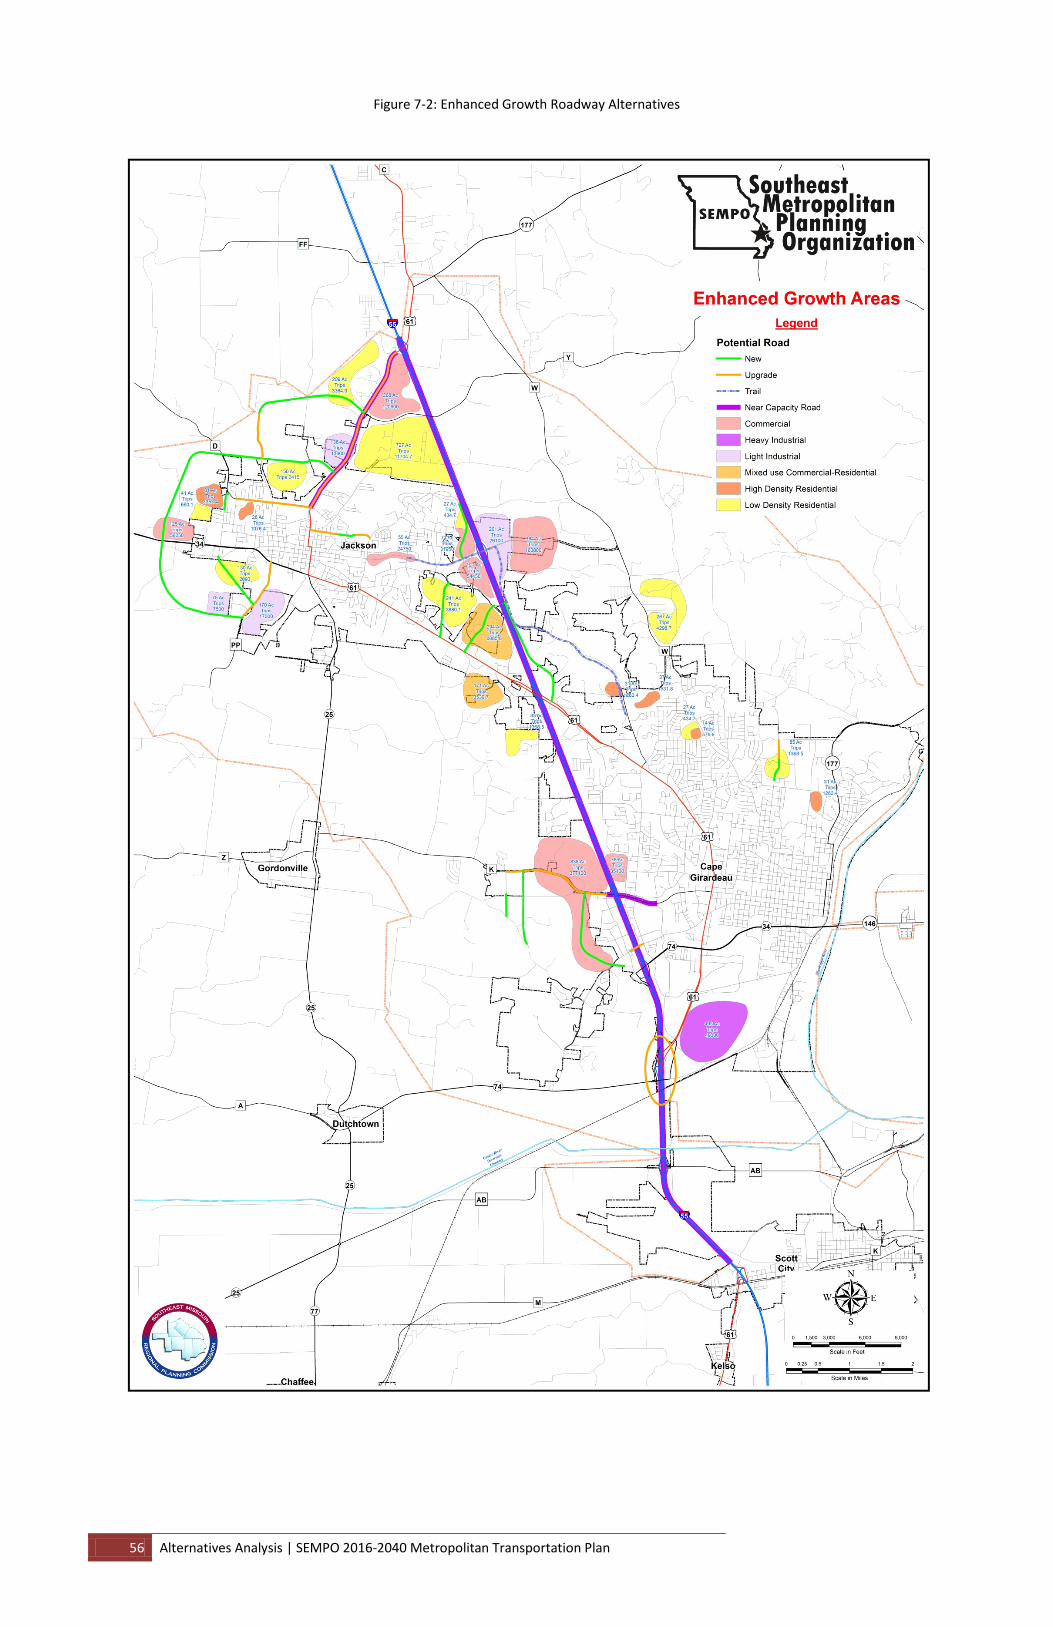
56 Alternatives Analysis | SEMPO 2016-2040 Metropolitan Transportation Plan
Figure 7-2: Enhanced Growth Roadway Alternatives
57 Recommended Plan | SEMPO 2016-2040 Metropolitan Transportation Plan
Section 8: Recommended Plan
Overview The 2040 MTP Recommended Plan identifies the need to strengthen the existing transportation infrastructure by implementing future transportation improvements to enhance overall regional mobility. The MTP includes a fiscally constrained list of transportation improvements and an illustrative (fiscally unconstrained) vision for the SEMPO area.
Funding Future Transportation Investments
Federal At the time of writing, the future of surface transportation funding is uncertain. MAP-21 is set to expire on July 31st, 2015 unless congress passes either another short-term extension or a full transportation bill. The most recent short-term extension of two months, from May 31st, 2015 to July 31st, 2015, marked the 33rd time in the last 6 years that Congress has passed only a short-term extension or bill.
Additionally, insolvency of the Highway Trust Fund is also expected to occur by the end of Fiscal Year 2015, barring Congressional action. In such a case, the Department of Transportation may consider implementing cash management procedures to manage the flow of federal dollars. If the Department implements cash management procedures, reimbursements to states for infrastructure work will be limited to the available cash in the Trust Fund. Additionally, the Department would distribute incoming funds in proportion to each state’s federal formula apportionment in the fiscal year. Given these two critical elements of Federal transportation management and funding are in an ongoing state of flux, projecting funding from federal sources for any project is difficult at best.
State The state of Missouri generates its transportation revenue primarily from vehicle registration fees and motor vehicle fuel and sales taxes. The largest source of non-federal transportation revenue is the state motor fuel tax. Set at a rate of 17-cents per gallon, the tax generated $489 million in 2014, accounting for 40% of MoDOT’s non-federal revenue. Motor vehicle sales and use taxes generated $314 million for MoDOT in 2014 and represented approximately 26% of funding, while vehicle and driver licensing, and multimodal fees generated $273 million dollars in state revenue, approximately 22% of MoDOT’s total non-federal revenue. Other funding sources account for $139 million in revenue, or 11% of funding. This totals $1.2 billion dollars in revenue for MoDOT for all operations, maintenance, and construction.
Fiscally Constrained Investment Plan 2016-2040 The fiscal constraint requirement is intended to ensure that the MTP reflects realistic assumptions about future revenues. Compliance with the requirement entails that estimated revenues (Federal, State, local, and private) cover both the estimated construction costs and the estimated operation and maintenance costs.
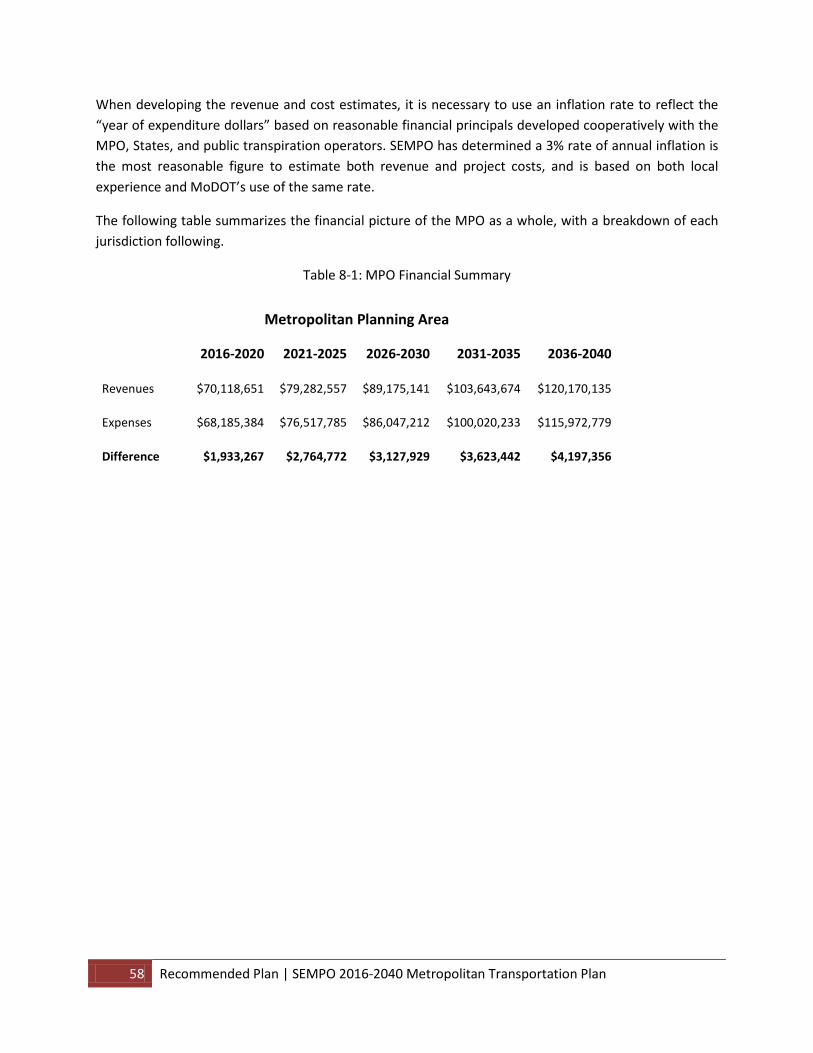
58 Recommended Plan | SEMPO 2016-2040 Metropolitan Transportation Plan
When developing the revenue and cost estimates, it is necessary to use an inflation rate to reflect the “year of expenditure dollars” based on reasonable financial principals developed cooperatively with the MPO, States, and public transpiration operators. SEMPO has determined a 3% rate of annual inflation is the most reasonable figure to estimate both revenue and project costs, and is based on both local experience and MoDOT’s use of the same rate.
The following table summarizes the financial picture of the MPO as a whole, with a breakdown of each jurisdiction following.
Table 8-1: MPO Financial Summary
Metropolitan Planning Area
2016-2020 2021-2025 2026-2030 2031-2035 2036-2040
Revenues $70,118,651 $79,282,557 $89,175,141 $103,643,674 $120,170,135
Expenses $68,185,384 $76,517,785 $86,047,212 $100,020,233 $115,972,779
Difference $1,933,267 $2,764,772 $3,127,929 $3,623,442 $4,197,356
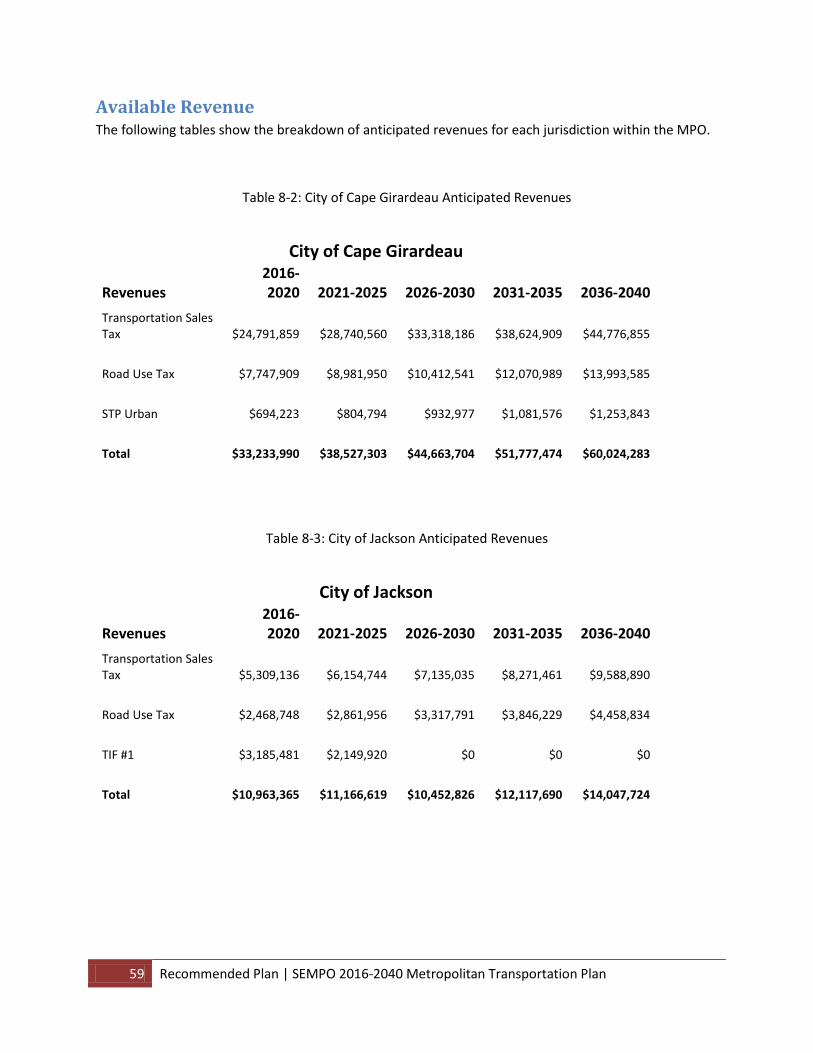
59 Recommended Plan | SEMPO 2016-2040 Metropolitan Transportation Plan
Available Revenue The following tables show the breakdown of anticipated revenues for each jurisdiction within the MPO.
Table 8-2: City of Cape Girardeau Anticipated Revenues
City of Cape Girardeau
Revenues 2016-2020 2021-2025 2026-2030 2031-2035 2036-2040
Transportation Sales Tax $24,791,859 $28,740,560 $33,318,186 $38,624,909 $44,776,855
Road Use Tax $7,747,909 $8,981,950 $10,412,541 $12,070,989 $13,993,585
STP Urban $694,223 $804,794 $932,977 $1,081,576 $1,253,843
Total $33,233,990 $38,527,303 $44,663,704 $51,777,474 $60,024,283
Table 8-3: City of Jackson Anticipated Revenues
City of Jackson
Revenues 2016-2020 2021-2025 2026-2030 2031-2035 2036-2040
Transportation Sales Tax $5,309,136 $6,154,744 $7,135,035 $8,271,461 $9,588,890
Road Use Tax $2,468,748 $2,861,956 $3,317,791 $3,846,229 $4,458,834
TIF #1 $3,185,481 $2,149,920 $0 $0 $0
Total $10,963,365 $11,166,619 $10,452,826 $12,117,690 $14,047,724
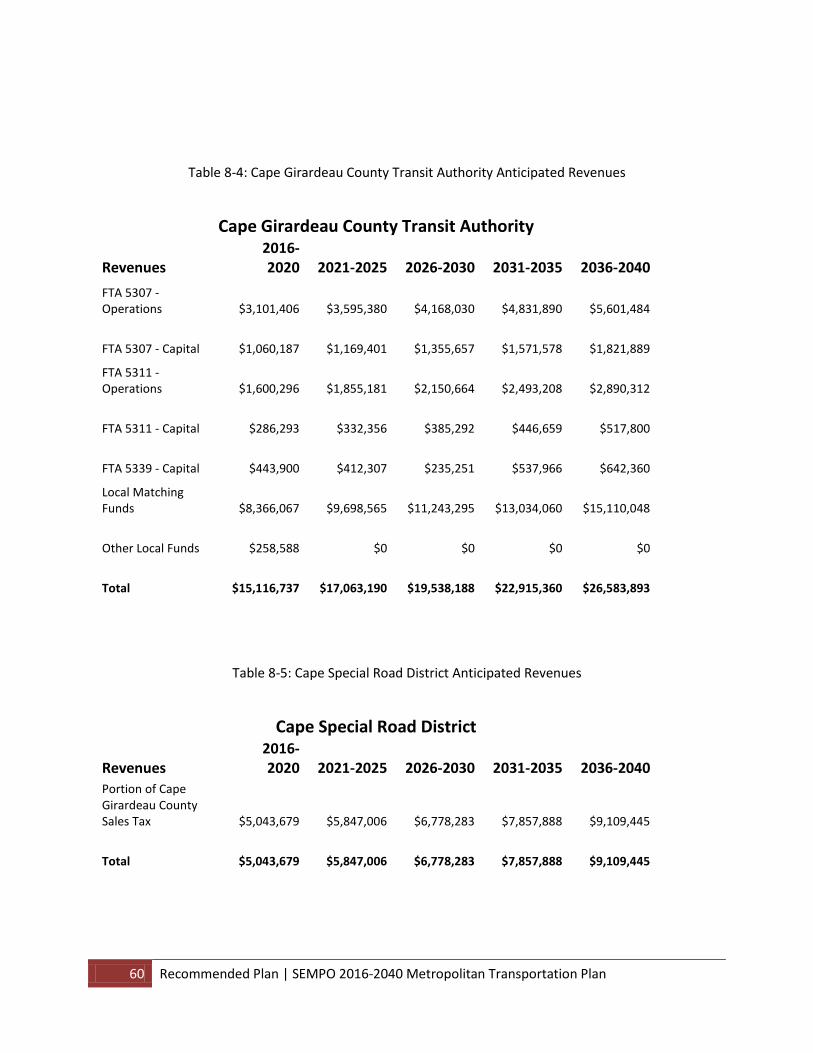
60 Recommended Plan | SEMPO 2016-2040 Metropolitan Transportation Plan
Table 8-4: Cape Girardeau County Transit Authority Anticipated Revenues
Cape Girardeau County Transit Authority
Revenues 2016-2020 2021-2025 2026-2030 2031-2035 2036-2040
FTA 5307 - Operations $3,101,406 $3,595,380 $4,168,030 $4,831,890 $5,601,484
FTA 5307 - Capital $1,060,187 $1,169,401 $1,355,657 $1,571,578 $1,821,889
FTA 5311 - Operations $1,600,296 $1,855,181 $2,150,664 $2,493,208 $2,890,312
FTA 5311 - Capital $286,293 $332,356 $385,292 $446,659 $517,800
FTA 5339 - Capital $443,900 $412,307 $235,251 $537,966 $642,360
Local Matching Funds $8,366,067 $9,698,565 $11,243,295 $13,034,060 $15,110,048
Other Local Funds $258,588 $0 $0 $0 $0
Total $15,116,737 $17,063,190 $19,538,188 $22,915,360 $26,583,893
Table 8-5: Cape Special Road District Anticipated Revenues
Cape Special Road District
Revenues 2016-2020 2021-2025 2026-2030 2031-2035 2036-2040
Portion of Cape Girardeau County Sales Tax $5,043,679 $5,847,006 $6,778,283 $7,857,888 $9,109,445
Total $5,043,679 $5,847,006 $6,778,283 $7,857,888 $9,109,445
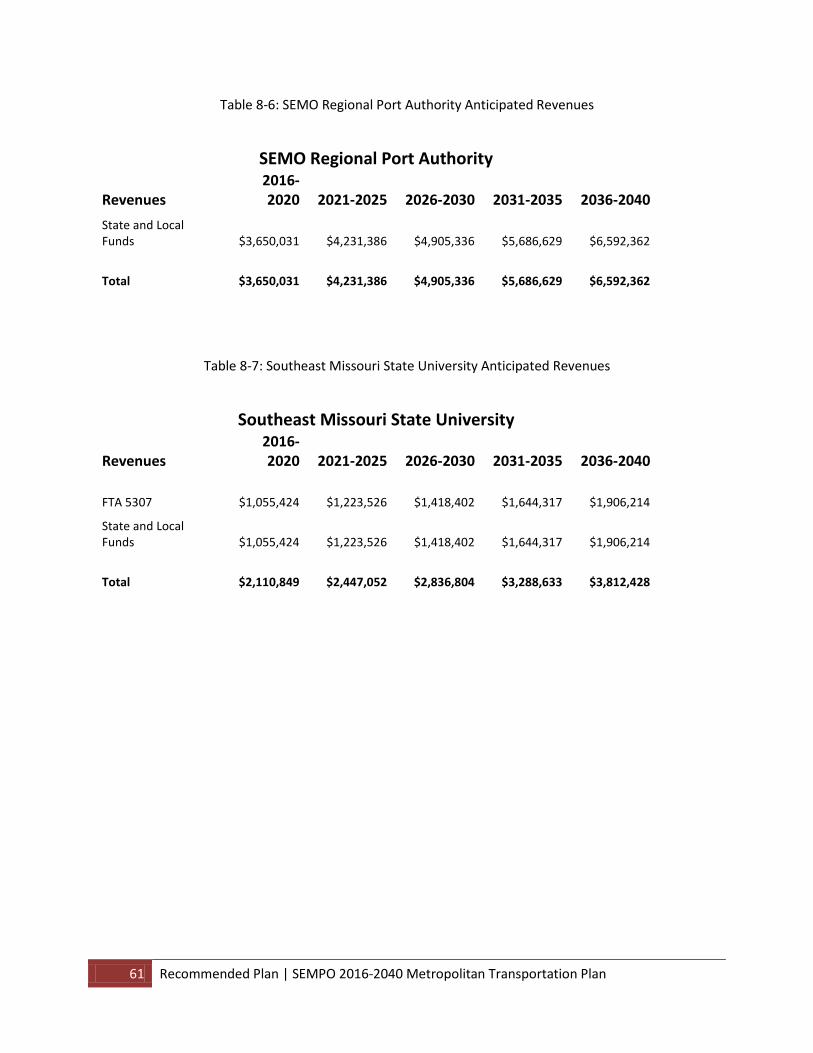
61 Recommended Plan | SEMPO 2016-2040 Metropolitan Transportation Plan
Table 8-6: SEMO Regional Port Authority Anticipated Revenues
SEMO Regional Port Authority
Revenues 2016-2020 2021-2025 2026-2030 2031-2035 2036-2040
State and Local Funds $3,650,031 $4,231,386 $4,905,336 $5,686,629 $6,592,362
Total $3,650,031 $4,231,386 $4,905,336 $5,686,629 $6,592,362
Table 8-7: Southeast Missouri State University Anticipated Revenues
Southeast Missouri State University
Revenues 2016-2020 2021-2025 2026-2030 2031-2035 2036-2040
FTA 5307 $1,055,424 $1,223,526 $1,418,402 $1,644,317 $1,906,214
State and Local Funds $1,055,424 $1,223,526 $1,418,402 $1,644,317 $1,906,214
Total $2,110,849 $2,447,052 $2,836,804 $3,288,633 $3,812,428
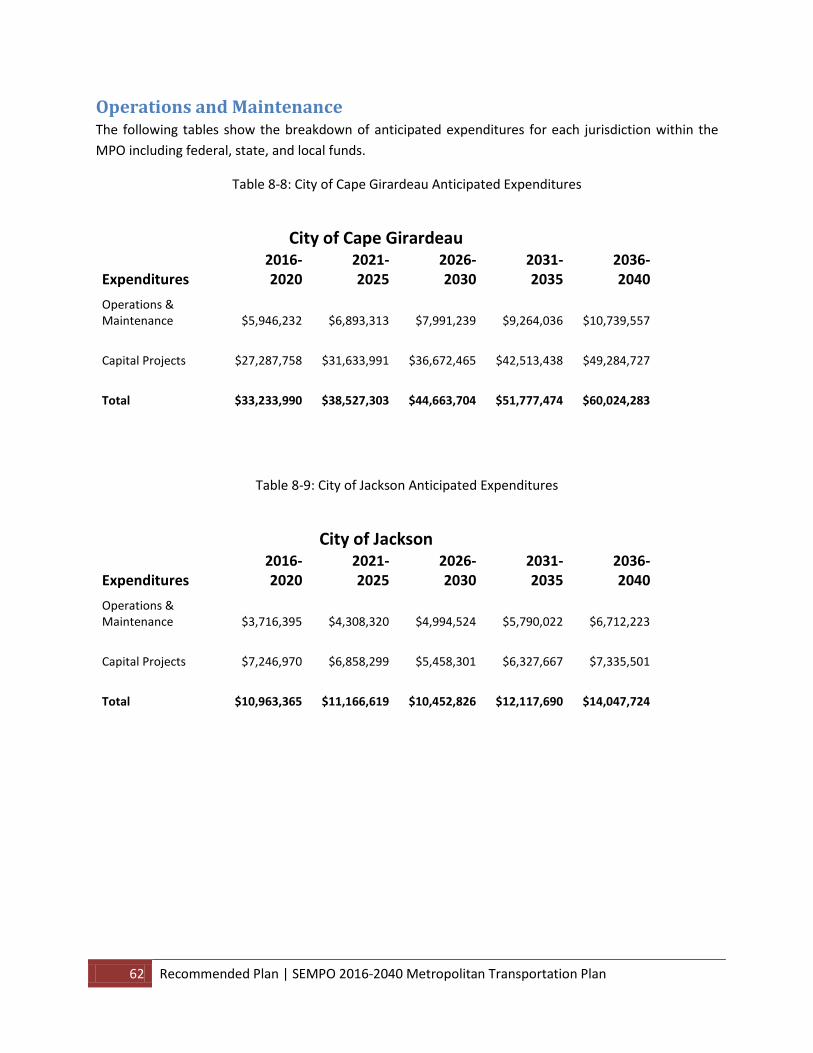
62 Recommended Plan | SEMPO 2016-2040 Metropolitan Transportation Plan
Operations and Maintenance The following tables show the breakdown of anticipated expenditures for each jurisdiction within the MPO including federal, state, and local funds.
Table 8-8: City of Cape Girardeau Anticipated Expenditures
City of Cape Girardeau
Expenditures 2016-
2020 2021-
2025 2026-
2030 2031-
2035 2036-
2040 Operations & Maintenance $5,946,232 $6,893,313 $7,991,239 $9,264,036 $10,739,557
Capital Projects $27,287,758 $31,633,991 $36,672,465 $42,513,438 $49,284,727
Total $33,233,990 $38,527,303 $44,663,704 $51,777,474 $60,024,283
Table 8-9: City of Jackson Anticipated Expenditures
City of Jackson
Expenditures 2016-
2020 2021-
2025 2026-
2030 2031-
2035 2036-
2040 Operations & Maintenance $3,716,395 $4,308,320 $4,994,524 $5,790,022 $6,712,223
Capital Projects $7,246,970 $6,858,299 $5,458,301 $6,327,667 $7,335,501
Total $10,963,365 $11,166,619 $10,452,826 $12,117,690 $14,047,724
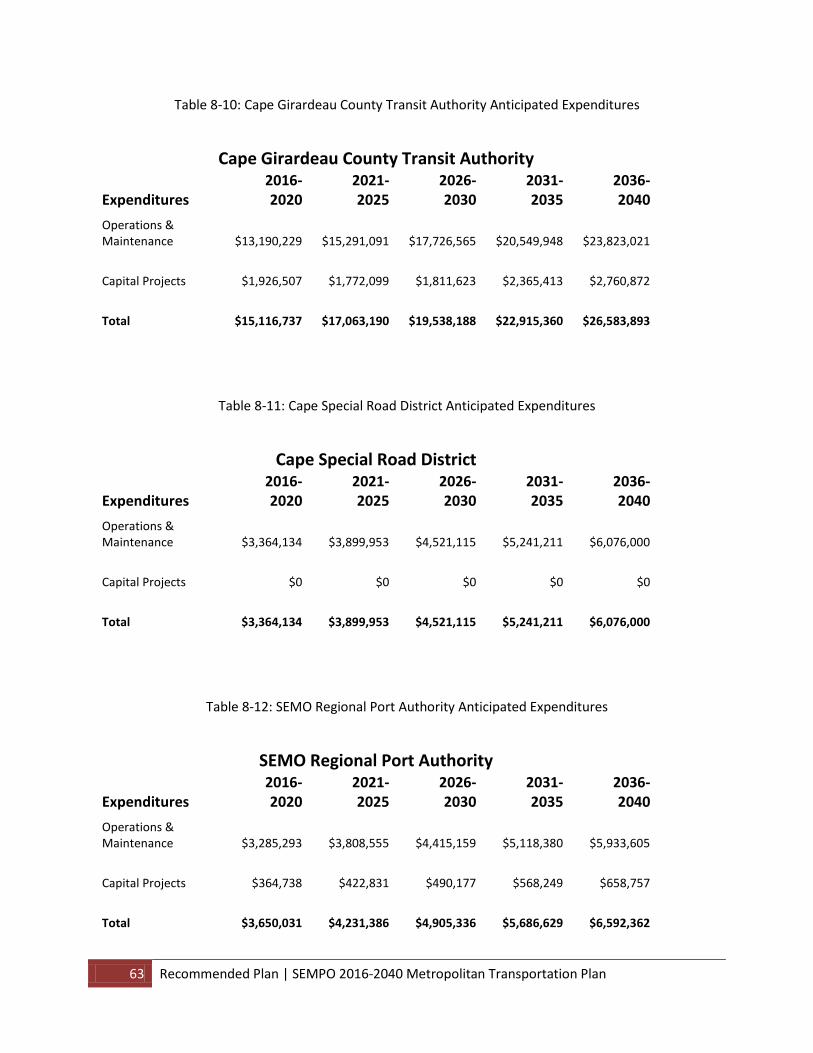
63 Recommended Plan | SEMPO 2016-2040 Metropolitan Transportation Plan
Table 8-10: Cape Girardeau County Transit Authority Anticipated Expenditures
Cape Girardeau County Transit Authority
Expenditures 2016-
2020 2021-
2025 2026-
2030 2031-
2035 2036-
2040 Operations & Maintenance $13,190,229 $15,291,091 $17,726,565 $20,549,948 $23,823,021
Capital Projects $1,926,507 $1,772,099 $1,811,623 $2,365,413 $2,760,872
Total $15,116,737 $17,063,190 $19,538,188 $22,915,360 $26,583,893
Table 8-11: Cape Special Road District Anticipated Expenditures
Cape Special Road District
Expenditures 2016-
2020 2021-
2025 2026-
2030 2031-
2035 2036-
2040 Operations & Maintenance $3,364,134 $3,899,953 $4,521,115 $5,241,211 $6,076,000
Capital Projects $0 $0 $0 $0 $0
Total $3,364,134 $3,899,953 $4,521,115 $5,241,211 $6,076,000
Table 8-12: SEMO Regional Port Authority Anticipated Expenditures
SEMO Regional Port Authority
Expenditures 2016-
2020 2021-
2025 2026-
2030 2031-
2035 2036-
2040 Operations & Maintenance $3,285,293 $3,808,555 $4,415,159 $5,118,380 $5,933,605
Capital Projects $364,738 $422,831 $490,177 $568,249 $658,757
Total $3,650,031 $4,231,386 $4,905,336 $5,686,629 $6,592,362
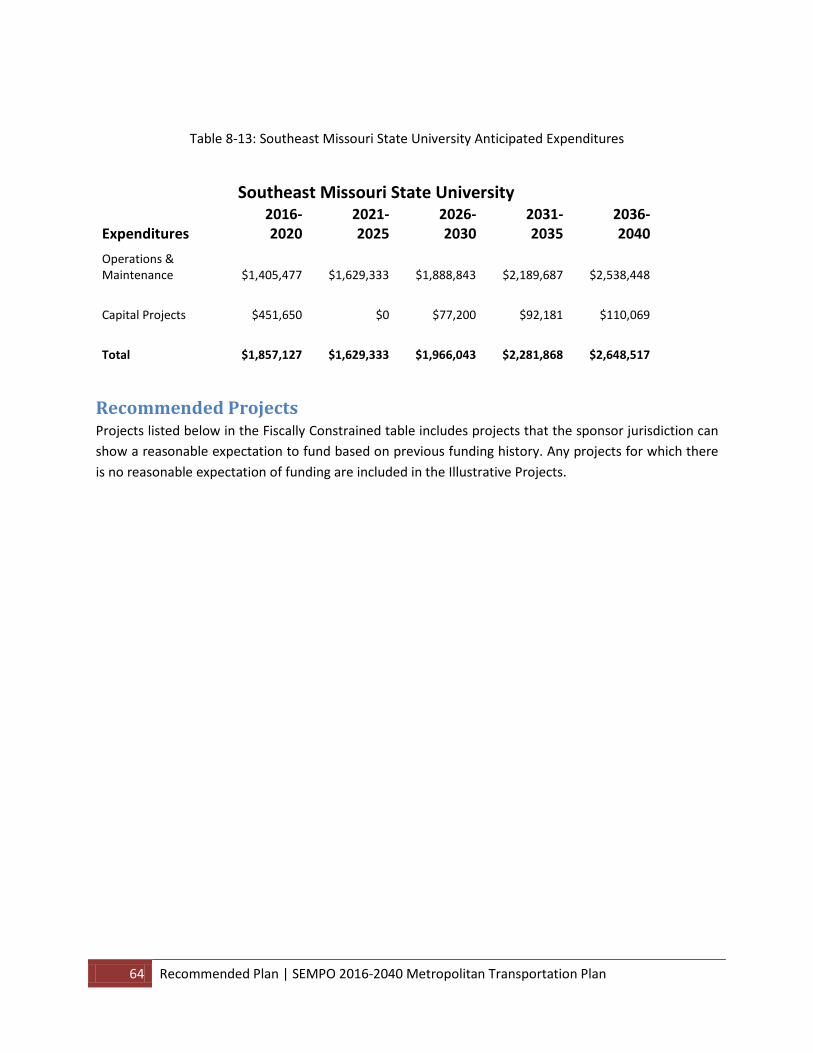
64 Recommended Plan | SEMPO 2016-2040 Metropolitan Transportation Plan
Table 8-13: Southeast Missouri State University Anticipated Expenditures
Southeast Missouri State University
Expenditures 2016-
2020 2021-
2025 2026-
2030 2031-
2035 2036-
2040 Operations & Maintenance $1,405,477 $1,629,333 $1,888,843 $2,189,687 $2,538,448
Capital Projects $451,650 $0 $77,200 $92,181 $110,069
Total $1,857,127 $1,629,333 $1,966,043 $2,281,868 $2,648,517
Recommended Projects Projects listed below in the Fiscally Constrained table includes projects that the sponsor jurisdiction can show a reasonable expectation to fund based on previous funding history. Any projects for which there is no reasonable expectation of funding are included in the Illustrative Projects.
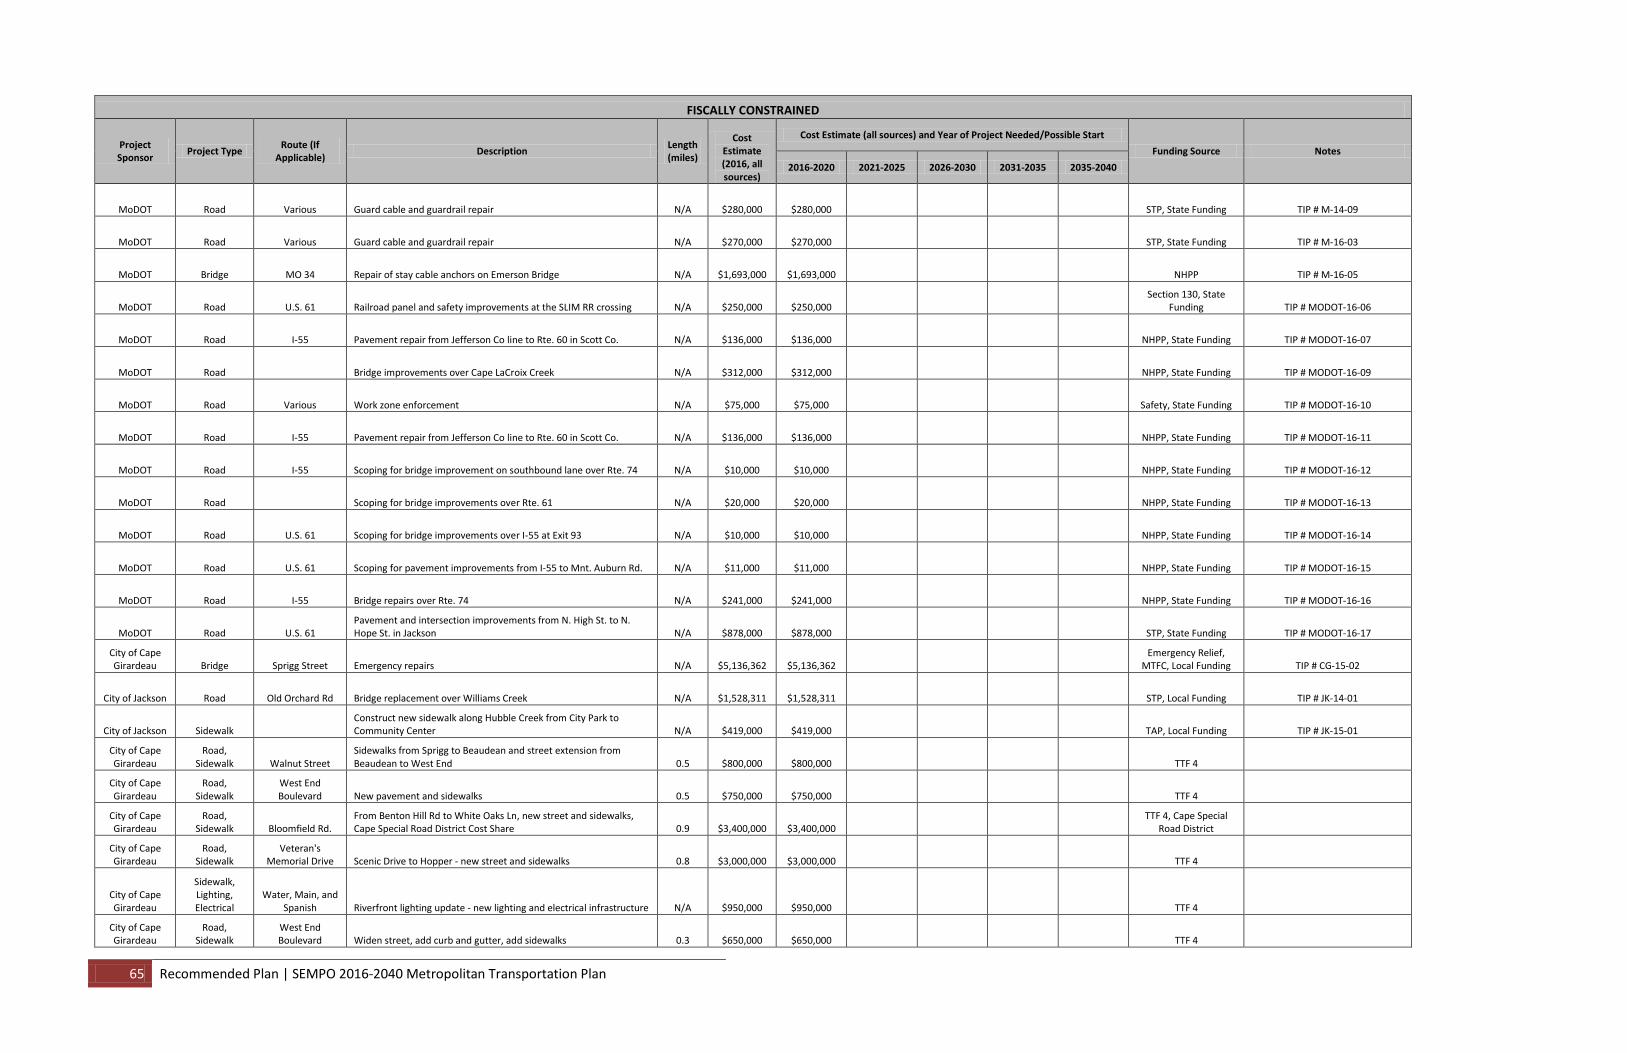
65 Recommended Plan | SEMPO 2016-2040 Metropolitan Transportation Plan
FISCALLY CONSTRAINED
Project Sponsor Project Type Route (If
Applicable) Description Length (miles)
Cost Estimate (2016, all sources)
Cost Estimate (all sources) and Year of Project Needed/Possible Start Funding Source Notes
2016-2020 2021-2025 2026-2030 2031-2035 2035-2040
MoDOT Road Various Guard cable and guardrail repair N/A $280,000 $280,000 STP, State Funding TIP # M-14-09
MoDOT Road Various Guard cable and guardrail repair N/A $270,000 $270,000 STP, State Funding TIP # M-16-03
MoDOT Bridge MO 34 Repair of stay cable anchors on Emerson Bridge N/A $1,693,000 $1,693,000 NHPP TIP # M-16-05
MoDOT Road U.S. 61 Railroad panel and safety improvements at the SLIM RR crossing N/A $250,000 $250,000 Section 130, State
Funding TIP # MODOT-16-06
MoDOT Road I-55 Pavement repair from Jefferson Co line to Rte. 60 in Scott Co. N/A $136,000 $136,000 NHPP, State Funding TIP # MODOT-16-07
MoDOT Road Bridge improvements over Cape LaCroix Creek N/A $312,000 $312,000 NHPP, State Funding TIP # MODOT-16-09
MoDOT Road Various Work zone enforcement N/A $75,000 $75,000 Safety, State Funding TIP # MODOT-16-10
MoDOT Road I-55 Pavement repair from Jefferson Co line to Rte. 60 in Scott Co. N/A $136,000 $136,000 NHPP, State Funding TIP # MODOT-16-11
MoDOT Road I-55 Scoping for bridge improvement on southbound lane over Rte. 74 N/A $10,000 $10,000 NHPP, State Funding TIP # MODOT-16-12
MoDOT Road Scoping for bridge improvements over Rte. 61 N/A $20,000 $20,000 NHPP, State Funding TIP # MODOT-16-13
MoDOT Road U.S. 61 Scoping for bridge improvements over I-55 at Exit 93 N/A $10,000 $10,000 NHPP, State Funding TIP # MODOT-16-14
MoDOT Road U.S. 61 Scoping for pavement improvements from I-55 to Mnt. Auburn Rd. N/A $11,000 $11,000 NHPP, State Funding TIP # MODOT-16-15
MoDOT Road I-55 Bridge repairs over Rte. 74 N/A $241,000 $241,000 NHPP, State Funding TIP # MODOT-16-16
MoDOT Road U.S. 61 Pavement and intersection improvements from N. High St. to N. Hope St. in Jackson N/A $878,000 $878,000 STP, State Funding TIP # MODOT-16-17
City of Cape Girardeau Bridge Sprigg Street Emergency repairs N/A $5,136,362 $5,136,362
Emergency Relief, MTFC, Local Funding TIP # CG-15-02
City of Jackson Road Old Orchard Rd Bridge replacement over Williams Creek N/A $1,528,311 $1,528,311 STP, Local Funding TIP # JK-14-01
City of Jackson Sidewalk Construct new sidewalk along Hubble Creek from City Park to Community Center N/A $419,000 $419,000 TAP, Local Funding TIP # JK-15-01
City of Cape Girardeau
Road, Sidewalk Walnut Street
Sidewalks from Sprigg to Beaudean and street extension from Beaudean to West End 0.5 $800,000 $800,000 TTF 4
City of Cape Girardeau
Road, Sidewalk
West End Boulevard New pavement and sidewalks 0.5 $750,000 $750,000 TTF 4
City of Cape Girardeau
Road, Sidewalk Bloomfield Rd.
From Benton Hill Rd to White Oaks Ln, new street and sidewalks, Cape Special Road District Cost Share 0.9 $3,400,000 $3,400,000
TTF 4, Cape Special Road District
City of Cape Girardeau
Road, Sidewalk
Veteran's Memorial Drive Scenic Drive to Hopper - new street and sidewalks 0.8 $3,000,000 $3,000,000 TTF 4
City of Cape Girardeau
Sidewalk, Lighting, Electrical
Water, Main, and Spanish Riverfront lighting update - new lighting and electrical infrastructure N/A $950,000 $950,000 TTF 4
City of Cape Girardeau
Road, Sidewalk
West End Boulevard Widen street, add curb and gutter, add sidewalks 0.3 $650,000 $650,000 TTF 4
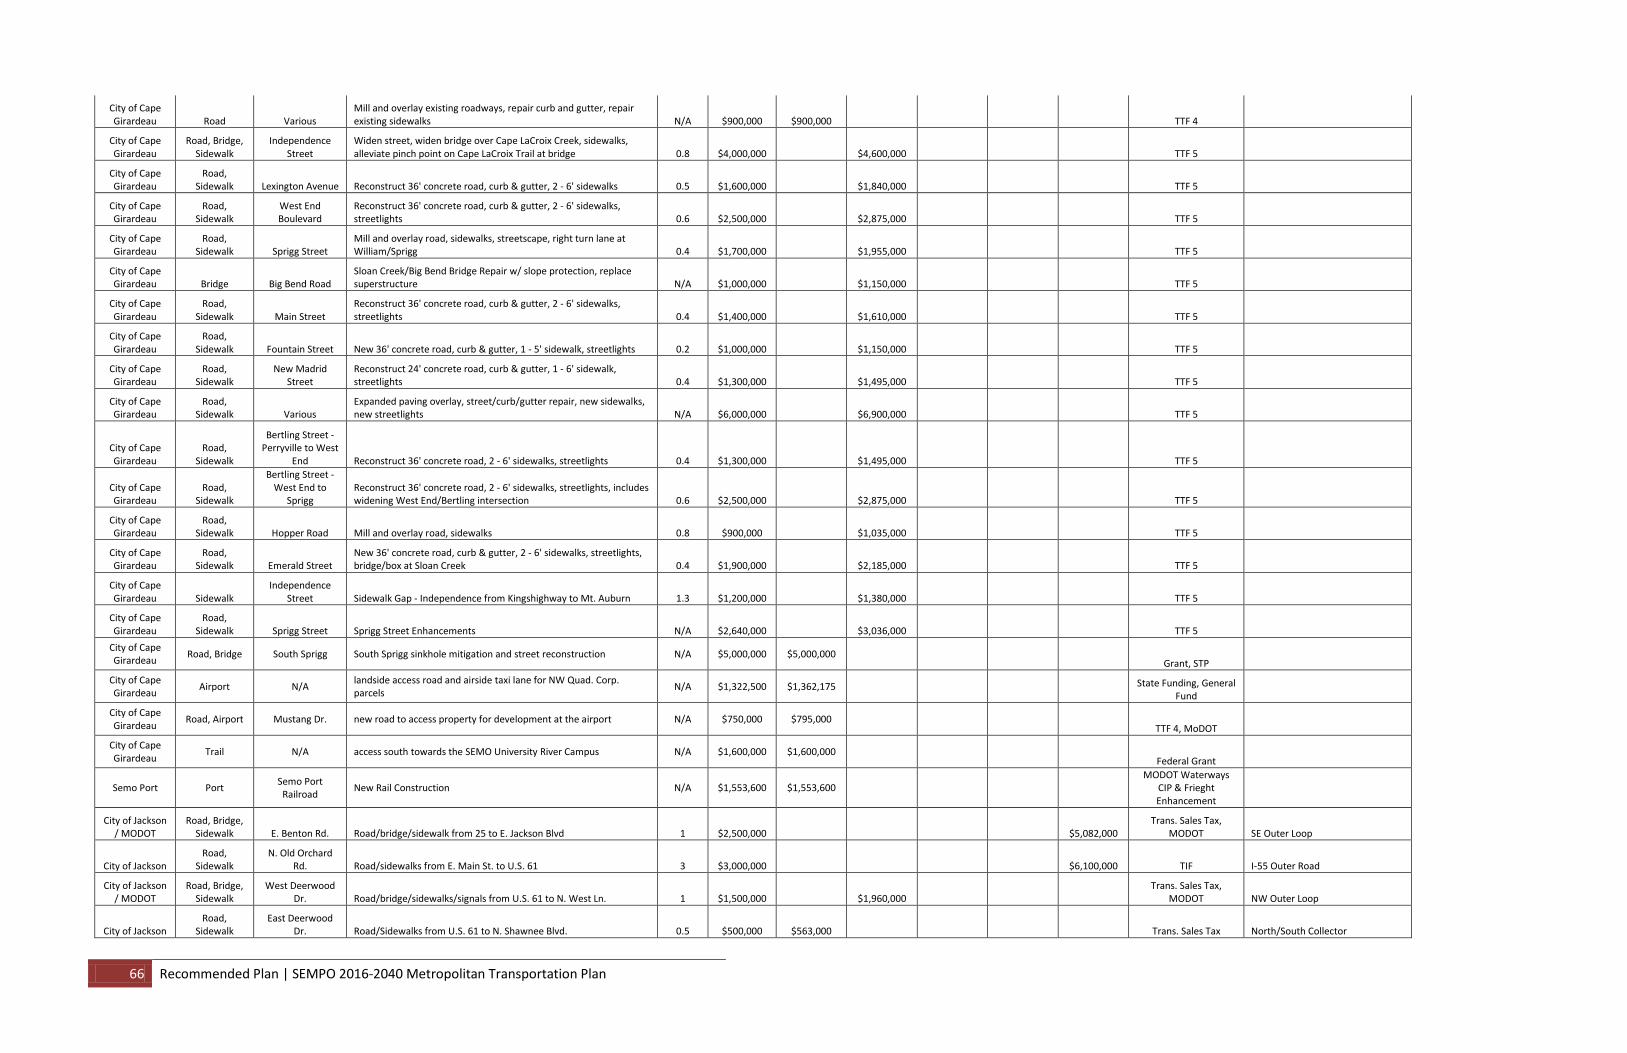
66 Recommended Plan | SEMPO 2016-2040 Metropolitan Transportation Plan
City of Cape Girardeau Road Various
Mill and overlay existing roadways, repair curb and gutter, repair existing sidewalks N/A $900,000 $900,000 TTF 4
City of Cape Girardeau
Road, Bridge, Sidewalk
Independence Street
Widen street, widen bridge over Cape LaCroix Creek, sidewalks, alleviate pinch point on Cape LaCroix Trail at bridge 0.8 $4,000,000 $4,600,000 TTF 5
City of Cape Girardeau
Road, Sidewalk Lexington Avenue Reconstruct 36' concrete road, curb & gutter, 2 - 6' sidewalks 0.5 $1,600,000 $1,840,000 TTF 5
City of Cape Girardeau
Road, Sidewalk
West End Boulevard
Reconstruct 36' concrete road, curb & gutter, 2 - 6' sidewalks, streetlights 0.6 $2,500,000 $2,875,000 TTF 5
City of Cape Girardeau
Road, Sidewalk Sprigg Street
Mill and overlay road, sidewalks, streetscape, right turn lane at William/Sprigg 0.4 $1,700,000 $1,955,000 TTF 5
City of Cape Girardeau Bridge Big Bend Road
Sloan Creek/Big Bend Bridge Repair w/ slope protection, replace superstructure N/A $1,000,000 $1,150,000 TTF 5
City of Cape Girardeau
Road, Sidewalk Main Street
Reconstruct 36' concrete road, curb & gutter, 2 - 6' sidewalks, streetlights 0.4 $1,400,000 $1,610,000 TTF 5
City of Cape Girardeau
Road, Sidewalk Fountain Street New 36' concrete road, curb & gutter, 1 - 5' sidewalk, streetlights 0.2 $1,000,000 $1,150,000 TTF 5
City of Cape Girardeau
Road, Sidewalk
New Madrid Street
Reconstruct 24' concrete road, curb & gutter, 1 - 6' sidewalk, streetlights 0.4 $1,300,000 $1,495,000 TTF 5
City of Cape Girardeau
Road, Sidewalk Various
Expanded paving overlay, street/curb/gutter repair, new sidewalks, new streetlights N/A $6,000,000 $6,900,000 TTF 5
City of Cape Girardeau
Road, Sidewalk
Bertling Street - Perryville to West
End Reconstruct 36' concrete road, 2 - 6' sidewalks, streetlights 0.4 $1,300,000 $1,495,000 TTF 5
City of Cape Girardeau
Road, Sidewalk
Bertling Street - West End to
Sprigg Reconstruct 36' concrete road, 2 - 6' sidewalks, streetlights, includes widening West End/Bertling intersection 0.6 $2,500,000 $2,875,000 TTF 5
City of Cape Girardeau
Road, Sidewalk Hopper Road Mill and overlay road, sidewalks 0.8 $900,000 $1,035,000 TTF 5
City of Cape Girardeau
Road, Sidewalk Emerald Street
New 36' concrete road, curb & gutter, 2 - 6' sidewalks, streetlights, bridge/box at Sloan Creek 0.4 $1,900,000 $2,185,000 TTF 5
City of Cape Girardeau Sidewalk
Independence Street Sidewalk Gap - Independence from Kingshighway to Mt. Auburn 1.3 $1,200,000 $1,380,000 TTF 5
City of Cape Girardeau
Road, Sidewalk Sprigg Street Sprigg Street Enhancements N/A $2,640,000 $3,036,000 TTF 5
City of Cape Girardeau Road, Bridge South Sprigg South Sprigg sinkhole mitigation and street reconstruction N/A $5,000,000 $5,000,000
Grant, STP City of Cape Girardeau Airport N/A landside access road and airside taxi lane for NW Quad. Corp.
parcels N/A $1,322,500 $1,362,175 State Funding, General Fund
City of Cape Girardeau Road, Airport Mustang Dr. new road to access property for development at the airport N/A $750,000 $795,000
TTF 4, MoDOT City of Cape Girardeau Trail N/A access south towards the SEMO University River Campus N/A $1,600,000 $1,600,000
Federal Grant
Semo Port Port Semo Port Railroad New Rail Construction N/A $1,553,600 $1,553,600
MODOT Waterways CIP & Frieght Enhancement
City of Jackson / MODOT
Road, Bridge, Sidewalk E. Benton Rd. Road/bridge/sidewalk from 25 to E. Jackson Blvd 1 $2,500,000 $5,082,000
Trans. Sales Tax, MODOT SE Outer Loop
City of Jackson Road,
Sidewalk N. Old Orchard
Rd. Road/sidewalks from E. Main St. to U.S. 61 3 $3,000,000 $6,100,000 TIF I-55 Outer Road
City of Jackson / MODOT
Road, Bridge, Sidewalk
West Deerwood Dr. Road/bridge/sidewalks/signals from U.S. 61 to N. West Ln. 1 $1,500,000 $1,960,000
Trans. Sales Tax, MODOT NW Outer Loop
City of Jackson Road,
Sidewalk East Deerwood
Dr. Road/Sidewalks from U.S. 61 to N. Shawnee Blvd. 0.5 $500,000 $563,000 Trans. Sales Tax North/South Collector
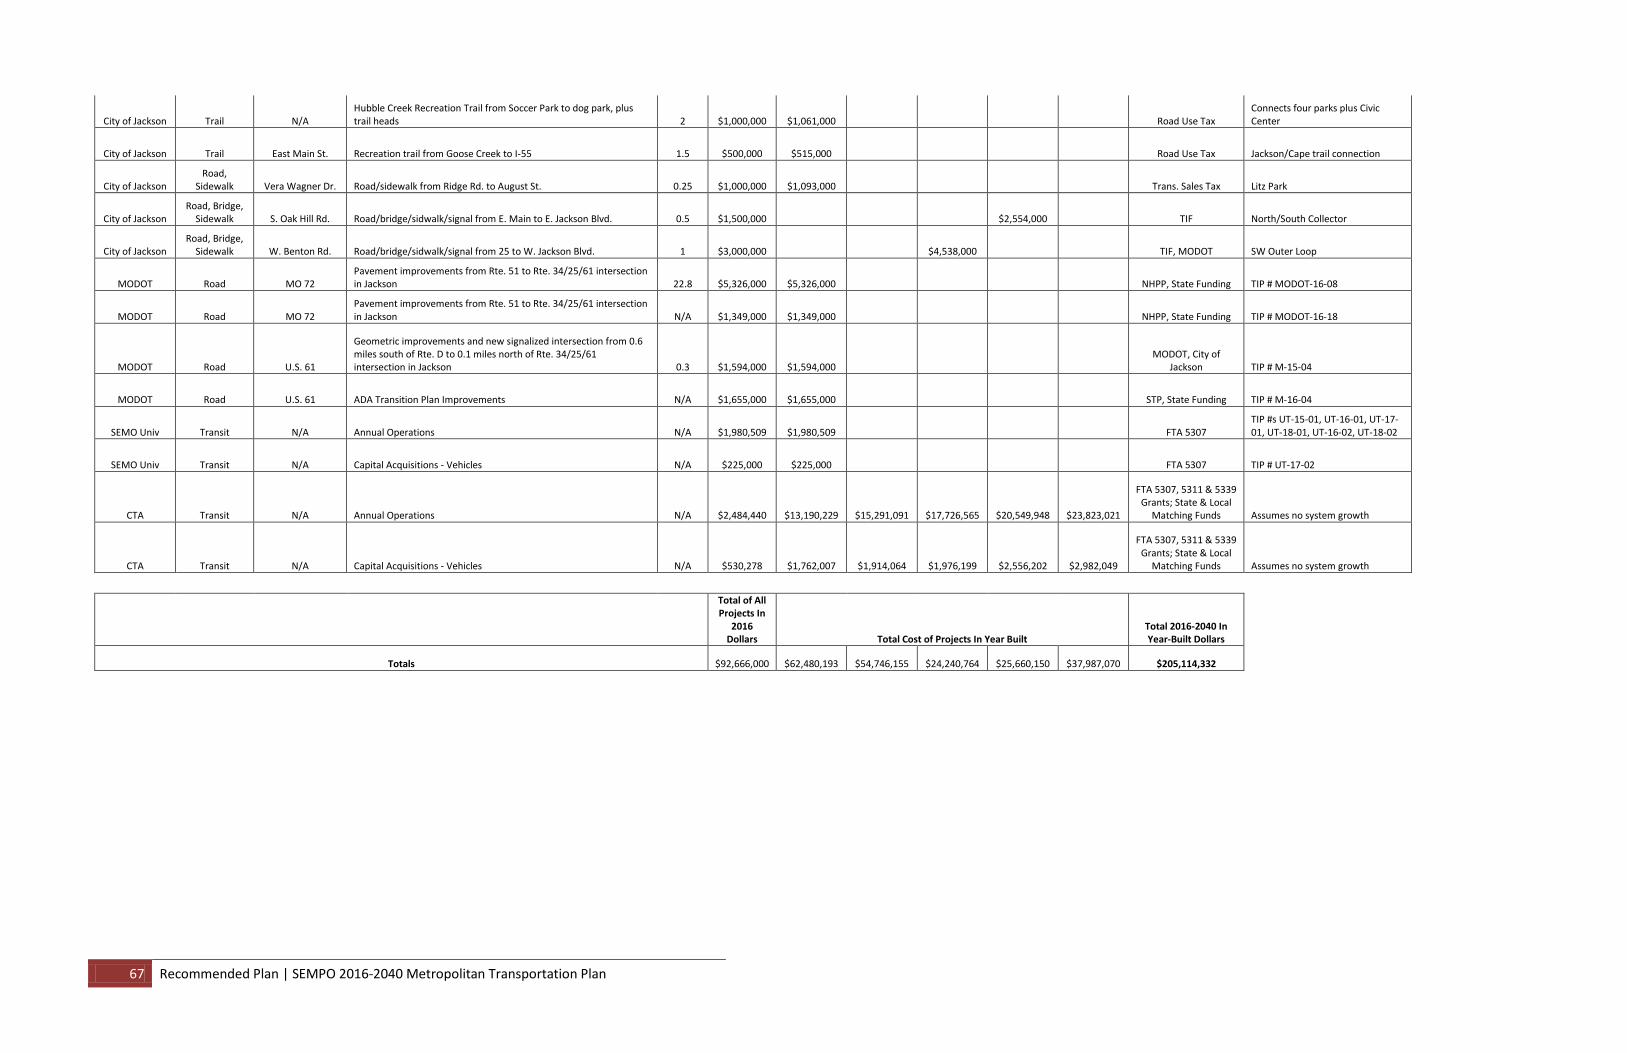
67 Recommended Plan | SEMPO 2016-2040 Metropolitan Transportation Plan
City of Jackson Trail N/A Hubble Creek Recreation Trail from Soccer Park to dog park, plus trail heads 2 $1,000,000 $1,061,000 Road Use Tax
Connects four parks plus Civic Center
City of Jackson Trail East Main St. Recreation trail from Goose Creek to I-55 1.5 $500,000 $515,000 Road Use Tax Jackson/Cape trail connection
City of Jackson Road,
Sidewalk Vera Wagner Dr. Road/sidewalk from Ridge Rd. to August St. 0.25 $1,000,000 $1,093,000 Trans. Sales Tax Litz Park
City of Jackson Road, Bridge,
Sidewalk S. Oak Hill Rd. Road/bridge/sidwalk/signal from E. Main to E. Jackson Blvd. 0.5 $1,500,000 $2,554,000 TIF North/South Collector
City of Jackson Road, Bridge,
Sidewalk W. Benton Rd. Road/bridge/sidwalk/signal from 25 to W. Jackson Blvd. 1 $3,000,000 $4,538,000 TIF, MODOT SW Outer Loop
MODOT Road MO 72 Pavement improvements from Rte. 51 to Rte. 34/25/61 intersection in Jackson 22.8 $5,326,000 $5,326,000 NHPP, State Funding TIP # MODOT-16-08
MODOT Road MO 72 Pavement improvements from Rte. 51 to Rte. 34/25/61 intersection in Jackson N/A $1,349,000 $1,349,000 NHPP, State Funding TIP # MODOT-16-18
MODOT Road U.S. 61
Geometric improvements and new signalized intersection from 0.6 miles south of Rte. D to 0.1 miles north of Rte. 34/25/61 intersection in Jackson 0.3 $1,594,000 $1,594,000
MODOT, City of Jackson TIP # M-15-04
MODOT Road U.S. 61 ADA Transition Plan Improvements N/A $1,655,000 $1,655,000 STP, State Funding TIP # M-16-04
SEMO Univ Transit N/A Annual Operations N/A $1,980,509 $1,980,509 FTA 5307 TIP #s UT-15-01, UT-16-01, UT-17-01, UT-18-01, UT-16-02, UT-18-02
SEMO Univ Transit N/A Capital Acquisitions - Vehicles N/A $225,000 $225,000 FTA 5307 TIP # UT-17-02
CTA Transit N/A Annual Operations N/A $2,484,440 $13,190,229 $15,291,091 $17,726,565 $20,549,948 $23,823,021
FTA 5307, 5311 & 5339 Grants; State & Local
Matching Funds Assumes no system growth
CTA Transit N/A Capital Acquisitions - Vehicles N/A $530,278 $1,762,007 $1,914,064 $1,976,199 $2,556,202 $2,982,049
FTA 5307, 5311 & 5339 Grants; State & Local
Matching Funds Assumes no system growth
Total of All Projects In
2016 Dollars Total Cost of Projects In Year Built
Total 2016-2040 In Year-Built Dollars
Totals $92,666,000 $62,480,193 $54,746,155 $24,240,764 $25,660,150 $37,987,070 $205,114,332
68 Recommended Plan | SEMPO 2016-2040 Metropolitan Transportation Plan
Illustrative Projects The future transportation needs of SEMPO far exceed the projected revenue as forecast to the year 2040. Increasing construction, maintenance, and operating costs have significantly limited the ability of SEMPO and local agencies to implement large transportation infrastructure projects. While it is not possible to construct all the transportation projects evaluated in this plan, the Illustrative Projects list is still a critical part of the vision of the MTP. The Illustrative Projects list is important because it:
• Defines the long-term vision for future transportation investments; • Allows for better land use planning, informed development decisions, and better policy making;
and, • Positions SEMPO to have “shovel ready” projects should additional funding become available.
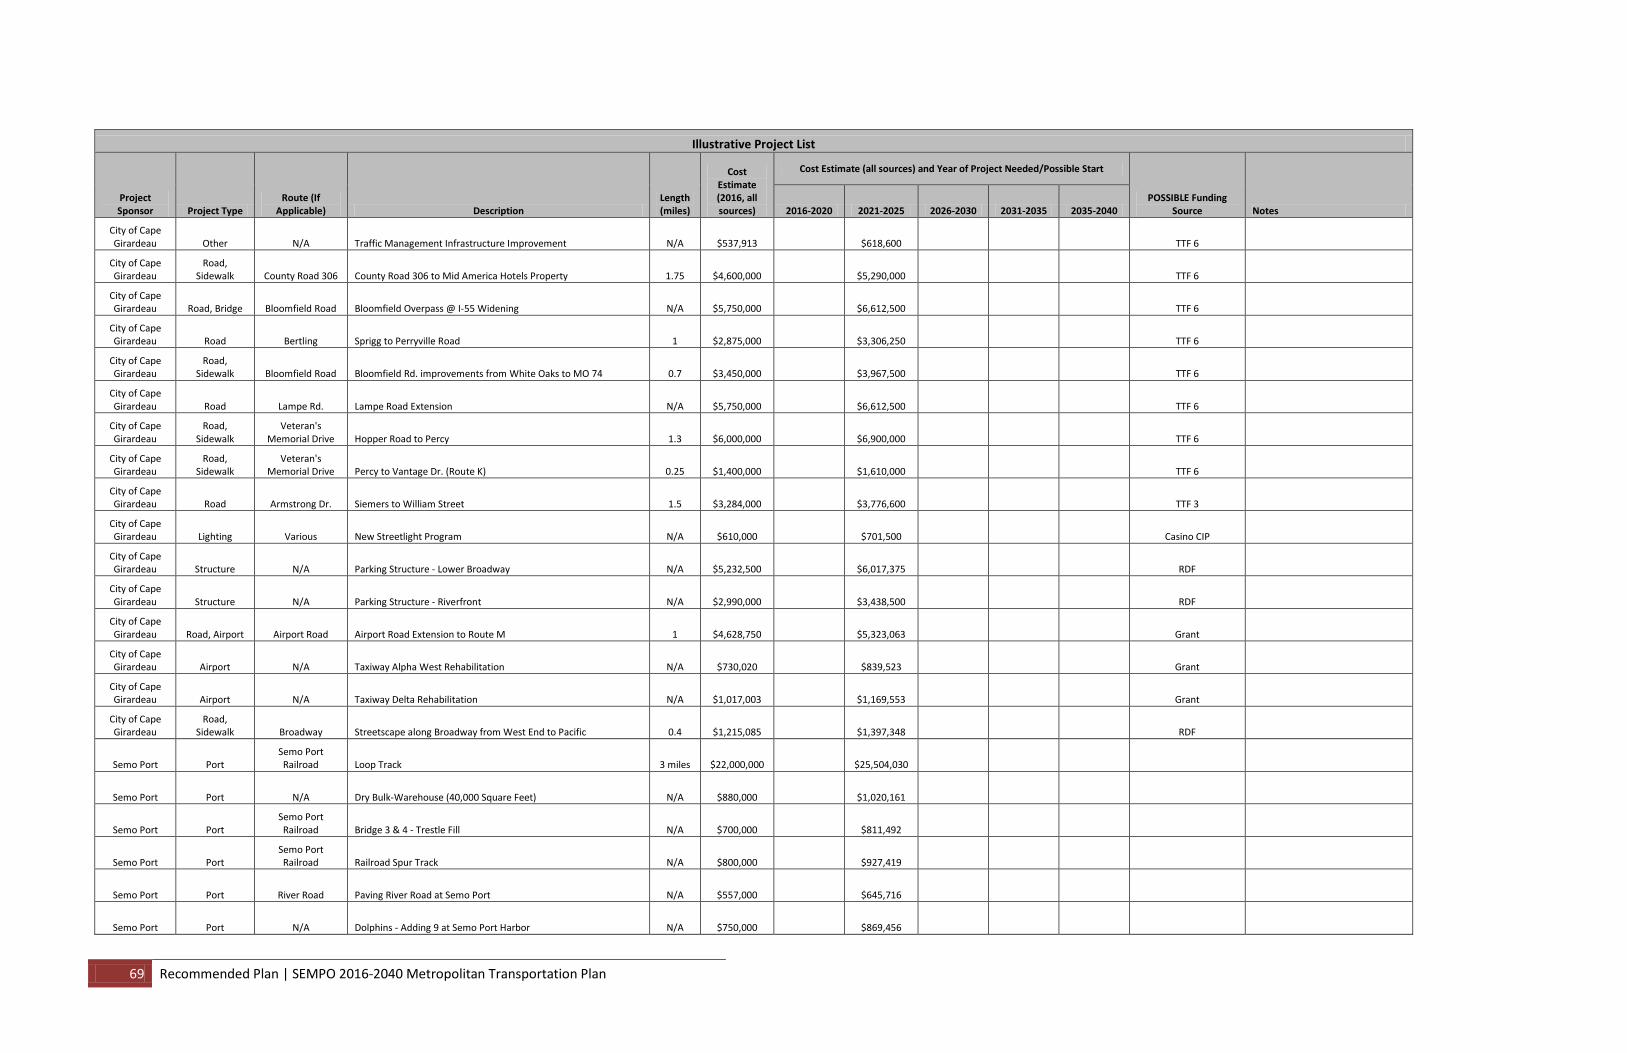
69 Recommended Plan | SEMPO 2016-2040 Metropolitan Transportation Plan
Illustrative Project List
Project Sponsor Project Type
Route (If Applicable) Description
Length (miles)
Cost Estimate (2016, all sources)
Cost Estimate (all sources) and Year of Project Needed/Possible Start
POSSIBLE Funding Source Notes 2016-2020 2021-2025 2026-2030 2031-2035 2035-2040
City of Cape Girardeau Other N/A Traffic Management Infrastructure Improvement N/A $537,913 $618,600 TTF 6
City of Cape Girardeau
Road, Sidewalk County Road 306 County Road 306 to Mid America Hotels Property 1.75 $4,600,000 $5,290,000 TTF 6
City of Cape Girardeau Road, Bridge Bloomfield Road Bloomfield Overpass @ I-55 Widening N/A $5,750,000 $6,612,500 TTF 6
City of Cape Girardeau Road Bertling Sprigg to Perryville Road 1 $2,875,000 $3,306,250 TTF 6
City of Cape Girardeau
Road, Sidewalk Bloomfield Road Bloomfield Rd. improvements from White Oaks to MO 74 0.7 $3,450,000 $3,967,500 TTF 6
City of Cape Girardeau Road Lampe Rd. Lampe Road Extension N/A $5,750,000 $6,612,500 TTF 6
City of Cape Girardeau
Road, Sidewalk
Veteran's Memorial Drive Hopper Road to Percy 1.3 $6,000,000 $6,900,000 TTF 6
City of Cape Girardeau
Road, Sidewalk
Veteran's Memorial Drive Percy to Vantage Dr. (Route K) 0.25 $1,400,000 $1,610,000 TTF 6
City of Cape Girardeau Road Armstrong Dr. Siemers to William Street 1.5 $3,284,000 $3,776,600 TTF 3
City of Cape Girardeau Lighting Various New Streetlight Program N/A $610,000 $701,500 Casino CIP
City of Cape Girardeau Structure N/A Parking Structure - Lower Broadway N/A $5,232,500 $6,017,375 RDF
City of Cape Girardeau Structure N/A Parking Structure - Riverfront N/A $2,990,000 $3,438,500 RDF
City of Cape Girardeau Road, Airport Airport Road Airport Road Extension to Route M 1 $4,628,750 $5,323,063 Grant
City of Cape Girardeau Airport N/A Taxiway Alpha West Rehabilitation N/A $730,020 $839,523 Grant
City of Cape Girardeau Airport N/A Taxiway Delta Rehabilitation N/A $1,017,003 $1,169,553 Grant
City of Cape Girardeau
Road, Sidewalk Broadway Streetscape along Broadway from West End to Pacific 0.4 $1,215,085 $1,397,348 RDF
Semo Port Port Semo Port Railroad Loop Track 3 miles $22,000,000 $25,504,030
Semo Port Port N/A Dry Bulk-Warehouse (40,000 Square Feet) N/A $880,000 $1,020,161
Semo Port Port Semo Port Railroad Bridge 3 & 4 - Trestle Fill N/A $700,000 $811,492
Semo Port Port Semo Port Railroad Railroad Spur Track N/A $800,000 $927,419
Semo Port Port River Road Paving River Road at Semo Port N/A $557,000 $645,716
Semo Port Port N/A Dolphins - Adding 9 at Semo Port Harbor N/A $750,000 $869,456
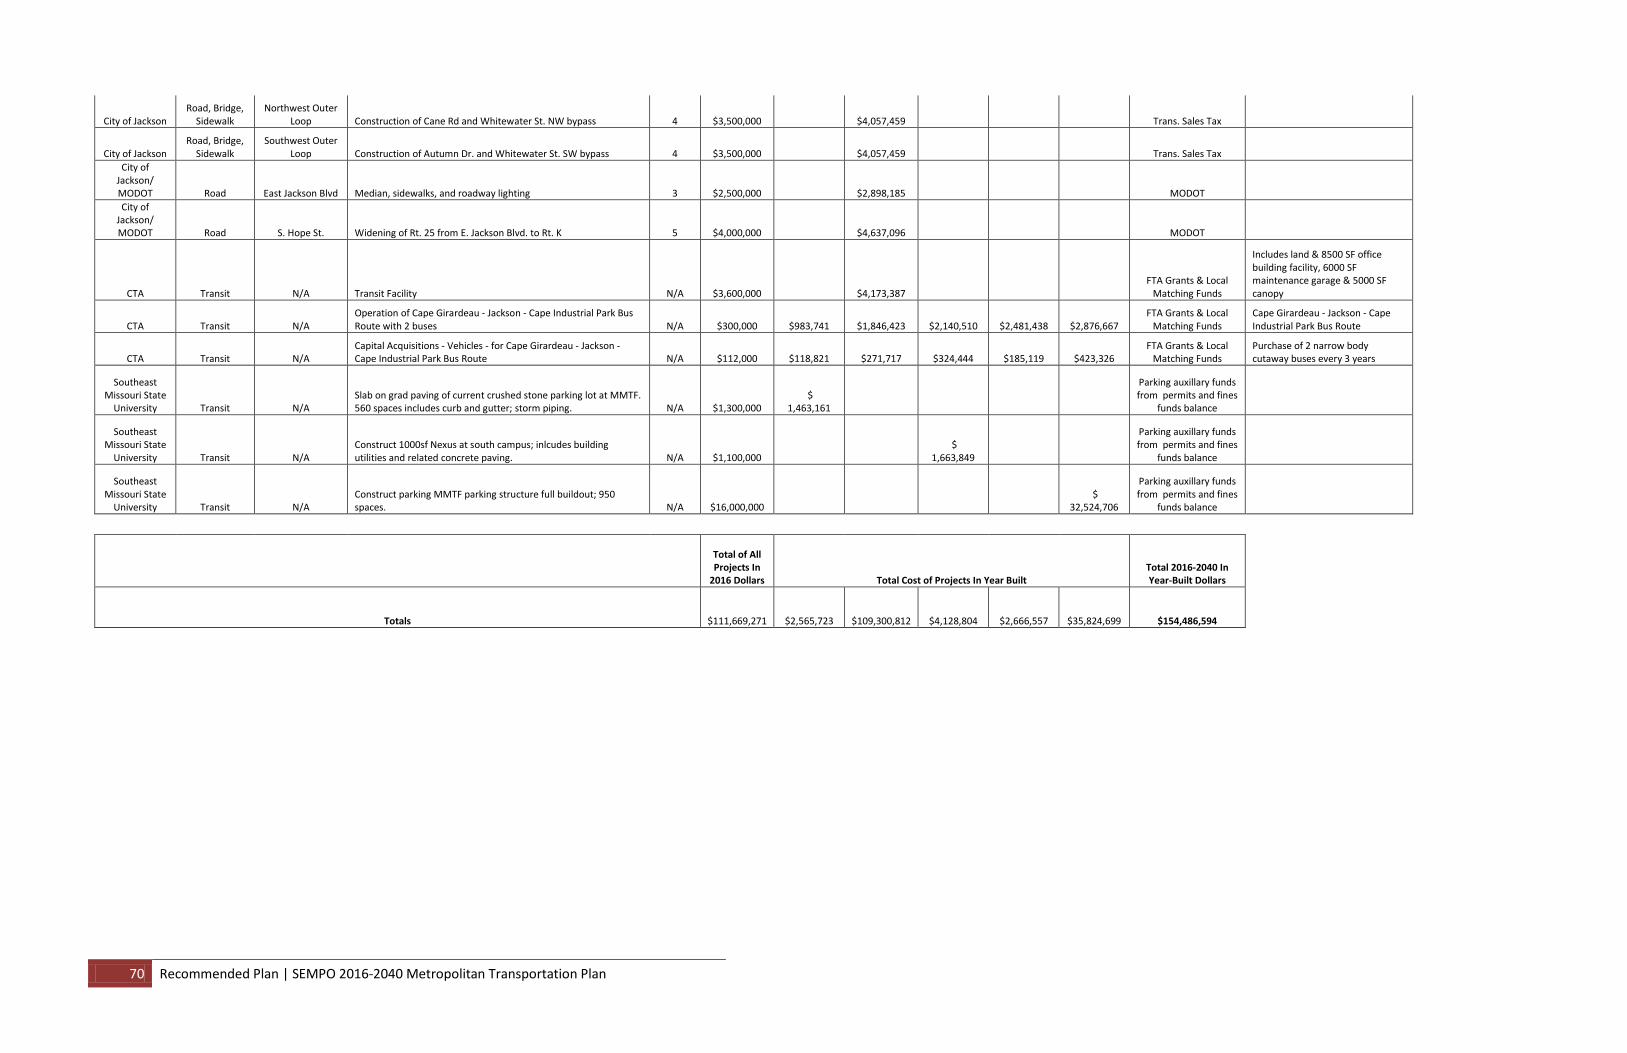
70 Recommended Plan | SEMPO 2016-2040 Metropolitan Transportation Plan
City of Jackson Road, Bridge,
Sidewalk Northwest Outer
Loop Construction of Cane Rd and Whitewater St. NW bypass 4 $3,500,000 $4,057,459 Trans. Sales Tax
City of Jackson Road, Bridge,
Sidewalk Southwest Outer
Loop Construction of Autumn Dr. and Whitewater St. SW bypass 4 $3,500,000 $4,057,459 Trans. Sales Tax City of
Jackson/ MODOT Road East Jackson Blvd Median, sidewalks, and roadway lighting 3 $2,500,000 $2,898,185 MODOT City of
Jackson/ MODOT Road S. Hope St. Widening of Rt. 25 from E. Jackson Blvd. to Rt. K 5 $4,000,000 $4,637,096 MODOT
CTA Transit N/A Transit Facility N/A $3,600,000 $4,173,387 FTA Grants & Local
Matching Funds
Includes land & 8500 SF office building facility, 6000 SF maintenance garage & 5000 SF canopy
CTA Transit N/A Operation of Cape Girardeau - Jackson - Cape Industrial Park Bus Route with 2 buses N/A $300,000 $983,741 $1,846,423 $2,140,510 $2,481,438 $2,876,667
FTA Grants & Local Matching Funds
Cape Girardeau - Jackson - Cape Industrial Park Bus Route
CTA Transit N/A Capital Acquisitions - Vehicles - for Cape Girardeau - Jackson - Cape Industrial Park Bus Route N/A $112,000 $118,821 $271,717 $324,444 $185,119 $423,326
FTA Grants & Local Matching Funds
Purchase of 2 narrow body cutaway buses every 3 years
Southeast Missouri State
University Transit N/A Slab on grad paving of current crushed stone parking lot at MMTF. 560 spaces includes curb and gutter; storm piping. N/A $1,300,000
$ 1,463,161
Parking auxillary funds from permits and fines
funds balance
Southeast Missouri State
University Transit N/A Construct 1000sf Nexus at south campus; inlcudes building utilities and related concrete paving. N/A $1,100,000
$ 1,663,849
Parking auxillary funds from permits and fines
funds balance
Southeast Missouri State
University Transit N/A Construct parking MMTF parking structure full buildout; 950 spaces. N/A $16,000,000
$ 32,524,706
Parking auxillary funds from permits and fines
funds balance
Total of All Projects In
2016 Dollars Total Cost of Projects In Year Built Total 2016-2040 In Year-Built Dollars
Totals $111,669,271 $2,565,723 $109,300,812 $4,128,804 $2,666,557 $35,824,699 $154,486,594
71 Recommended Plan | SEMPO 2016-2040 Metropolitan Transportation Plan
Implementation and Supporting Policies For many years, the traditional transportation planning approach focused on moving vehicles as quickly and efficiently as possible. Today, it is understood that a transportation system should focus on moving people and goods as opposed to simply moving vehicles. The following summarizes policies, or actions, that have been implemented in some parts of the United States. These policies are provided as examples of potential actions that could be adopted or incorporated into future transportation planning efforts within the SEMPO planning area. See the Appendix for additional information.
Complete Streets In the last decade transportation planners have made a significant shift in their approach to the design and intended function of streets. This paradigm shift encourages transportation planners to coordinate with land-use planners, urban designers, and engineers and has been termed “Complete Streets.”
Transit Oriented Development Transit Oriented Development (TOD) is high-density, multi-family housing and mixed-use development designed to encourage accessible, active, pedestrian oriented areas within walking distance of transit. The purpose of implementing TOD is to encourage the use of public transit and reduce trips on freeways, expressways, major collectors and arterials. TOD includes many of the same principles as Complete Streets in that the policy is intended to strengthen alternative transportation modes. As a result, a corridor is able to move more people with fewer vehicles.
Non-motorized Guidelines Potential guidelines for accommodating non-motorized travel within an urban environment often address the following issues:
1. Based on the context of the roadway, what are the proper dimensions for a typical street section, and what non-motorized facilities should be included?
2. How are the non-motorized transportation systems linked together to form a network? 3. Can sidewalks suffice to serve all non-motorized transportation modes? 4. How can pedestrian facilities be safely introduced into intersections? 5. What is the impact of trip purpose and land use on facility design? 6. What design best fits the application? 7. What is the proper placement and type of street furniture?
The non-motorized guidelines are most useful when used in the context of the other planning documents, such as this MTP.
Transportation Alternatives Program Transportation Alternative Program activities are federally funded community-based projects that expand travel choices and enhance the transportation experience by improving the cultural, historic, aesthetic and environmental aspects of transportation infrastructure. Transportation Enhancement projects must be one of 12 potentially eligible activities (final eligible activities and other program
72 Recommended Plan | SEMPO 2016-2040 Metropolitan Transportation Plan
specifics are decided each cycle by a regional committee) and must relate to surface transportation. The eligible activities may include:
1. Pedestrian and bicycle facilities 2. Pedestrian and bicycle safety and educational activities 3. Acquisition of scenic or historic easements and sites 4. Scenic or historic highway programs including tourist and welcome centers 5. Landscaping and scenic beautification 6. Historic preservation 7. Rehabilitation and operation of historic transportation buildings, structures or facilities 8. Conversion of abandoned railway corridors to trails 9. Inventory, control, and removal of outdoor advertising 10. Archaeological planning & research 11. Environmental mitigation of runoff pollution and provision of wildlife connectivity 12. Establishment of transportation museums
Safe Routes to School Safe Routes to School programs, now a part of the Transportation Alternatives Program, enable community leaders, schools, and parents to improve safety and encourage more children to safely walk and bicycle to school. In the process, these programs are working to reduce traffic congestion and improve health and the environment, making communities more livable for everyone. Furthermore, encouraging young students to walk as their primary transportation mode will hopefully promote an active life style.
Access Management Access management is the process of managing the connections between public highways and roadways and adjoining land. Transportation officials must balance the need for land development with the need for safe and efficient travel. MoDOT's and IDOT’s existing access management regulations require an application process for all new access points for new developments on roadways in their respective jurisdictions.
73 Performance Measures | SEMPO 2016-2040 Metropolitan Transportation Plan
Section 9: Performance Measures
Overview A key feature of MAP-21 is the establishment of a performance- and outcome-based program. The objective of this performance- and outcome-based program is for States to invest resources in projects that collectively will make progress toward the achievement of the national goals23. The national goals identified in MAP-21 are:
• Safety - To achieve a significant reduction in traffic fatalities and serious injuries on all public roads.
• Infrastructure condition - To maintain the highway infrastructure asset system in a state of good repair.
• Congestion reduction - To achieve a significant reduction in congestion on the National Highway System.
• System reliability -To improve the efficiency of the surface transportation system. • Freight movement and economic vitality - To improve the national freight network, strengthen
the ability of rural communities to access national and international trade markets, and support regional economic development.
• Environmental sustainability - To enhance the performance of the transportation system while protecting and enhancing the natural environment.
• Reduced project delivery delays - To reduce project costs, promote jobs and the economy, and expedite the movement of people and goods by accelerating project completion through eliminating delays in the project development and delivery process, including reducing regulatory burdens and improving agencies’ work practices.
SEMPO Performance Measures While MAP-21 does not require MPOs to develop their own Asset Management plans, SEMPO will, to the best of its ability, attempt to monitor the performance of the area’s transportation system, when reasonable, using MoDOT’s proposed system, as shown below. Much of the data needed for measurement of SEMPO’s system will come from MoDOT and IDOT, as SEMPO does not currently have the capabilities or funds necessary to collect or analyze such data.
23 http://www.fhwa.dot.gov/map21/factsheets/pm.cfm
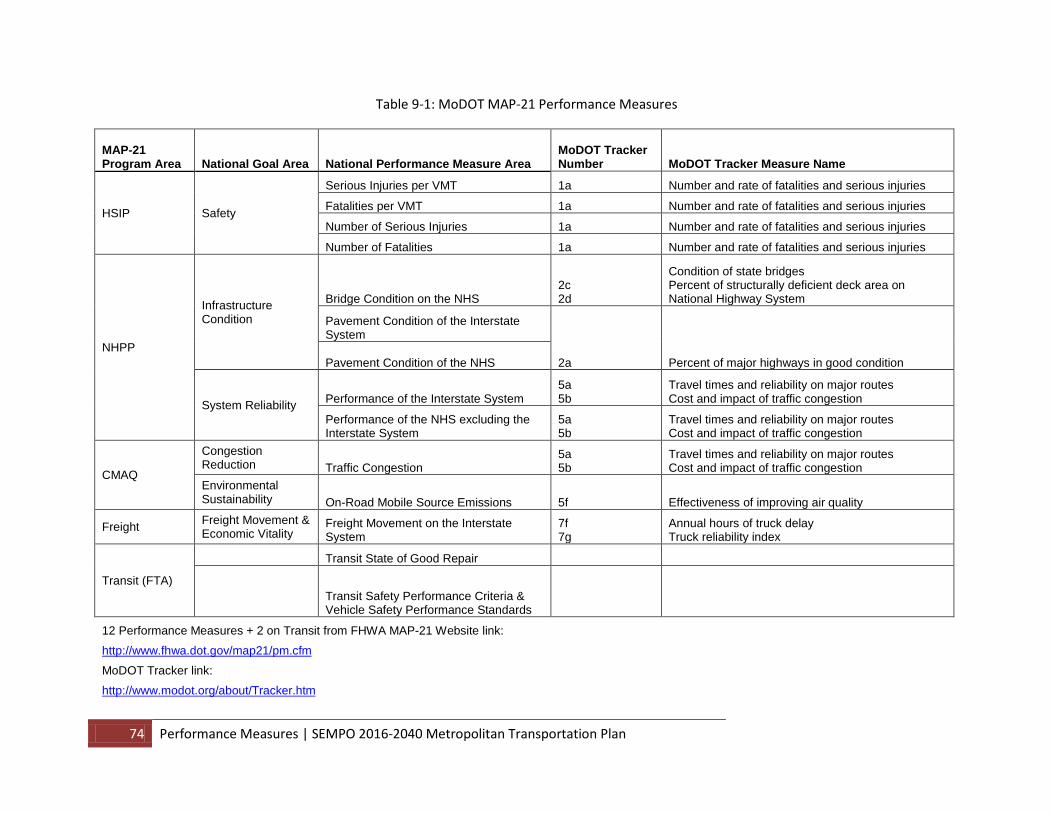
74 Performance Measures | SEMPO 2016-2040 Metropolitan Transportation Plan
Table 9-1: MoDOT MAP-21 Performance Measures
MAP-21 Program Area National Goal Area National Performance Measure Area
MoDOT Tracker Number MoDOT Tracker Measure Name
HSIP Safety
Serious Injuries per VMT 1a Number and rate of fatalities and serious injuries
Fatalities per VMT 1a Number and rate of fatalities and serious injuries
Number of Serious Injuries 1a Number and rate of fatalities and serious injuries
Number of Fatalities 1a Number and rate of fatalities and serious injuries
NHPP
Infrastructure Condition
Bridge Condition on the NHS 2c 2d
Condition of state bridges Percent of structurally deficient deck area on National Highway System
Pavement Condition of the Interstate System
2a Percent of major highways in good condition Pavement Condition of the NHS
System Reliability Performance of the Interstate System 5a 5b
Travel times and reliability on major routes Cost and impact of traffic congestion
Performance of the NHS excluding the Interstate System
5a 5b
Travel times and reliability on major routes Cost and impact of traffic congestion
CMAQ
Congestion Reduction Traffic Congestion
5a 5b
Travel times and reliability on major routes Cost and impact of traffic congestion
Environmental Sustainability On-Road Mobile Source Emissions 5f Effectiveness of improving air quality
Freight Freight Movement & Economic Vitality
Freight Movement on the Interstate System
7f 7g
Annual hours of truck delay Truck reliability index
Transit (FTA)
Transit State of Good Repair
Transit Safety Performance Criteria & Vehicle Safety Performance Standards
12 Performance Measures + 2 on Transit from FHWA MAP-21 Website link: http://www.fhwa.dot.gov/map21/pm.cfm
MoDOT Tracker link: http://www.modot.org/about/Tracker.htm
75 Appendix | SEMPO 2016-2040 Metropolitan Transportation Plan
Section 10: Appendix
Federal Requirements The Long Range Transportation Plan, or Metropolitan Transportation Plan (MTP), is mandated by the federal government through a series of federal statutes accompanied by a host of regulations. This first section identifies the national objectives of metropolitan transportation planning, and directs the reader to additional reading in the Appendix to review the Federal purposes of the Public Transportation Program.
National Policy Statement of MAP-21, Metropolitan Transportation Planning Section a. Policy – It is in the national interest:
1. To encourage and promote the safe and efficient management, operation, and development of surface transportation systems that will serve the mobility needs of people and freight and foster economic growth and development within and between States and urbanized areas, while minimizing transportation-related fuel consumption and air pollution through metropolitan and statewide transportation planning processes identified in this Section; and
2. To encourage the continued improvement and evolution of the metropolitan and statewide transportation planning processes by metropolitan planning organizations, State departments of transportation, and public transit operators as guided by the planning factors identified in subsection (h) and section 135(d) of 23 U.S.C.
National Objectives – Metropolitan Transportation Planning MAP-21 continues the requirement to develop an MTP (and a Transportation Improvement Program (TIP)) in order to accomplish these national objectives:24 Specifically, “to accomplish the objectives in 1-4, metropolitan planning organizations, in cooperation with the State and public transportation operators, shall develop long-range transportation plans (also referred to as the MTP) and transportation improvement programs through a performance-driven, outcome-based approach to planning for metropolitan areas of the State,” as per MAP-21:
The contents of the MTP and also the TIP “…for each metropolitan area shall provide for the development and integrated management and operation of transportation systems and facilities (including accessible pedestrian walkways and bicycle transportation facilities) that will function as an intermodal transportation system for the metropolitan planning area and as an integral part of an intermodal transportation system for the State and the United States.”
The current transportation act, MAP-21 contains the “National Objectives” that the legislation expects to be accomplished in part through the statewide and metropolitan transportation planning process.
24 SEC. 1201. METROPOLITAN TRANSPORTATION PLANNING of MAP-21 amending 23 U.S.C. Section 134
76 Appendix | SEMPO 2016-2040 Metropolitan Transportation Plan
The Metropolitan Transportation Planning National Objectives contained in MAP-21 are:
1. Encourage and promote the safe and efficient management, operation, and development of surface transportation systems that will serve the mobility needs of people and freight,
2. Foster economic growth and development within and between States and urbanized areas, 3. Minimize transportation-related fuel consumption and air pollution through metropolitan and
statewide transportation planning processes, and 4. Encourage the continued improvement and evolution of the metropolitan and statewide
transportation planning processes by metropolitan planning organizations, State departments of transportation, and public transit operators as guided by the eight planning factors.
Also included in this same federal legislation is a section stating that this “scope of the planning process should be based on the scale and complexity of many issues, including transportation system development, land use, employment, economic development, human and natural environment, and housing and community development.” This is an important statement since there are significant resources dedicated to do metropolitan planning and MPOs are not the same, SEMPO is one of many small MPOs and has extremely limited resources.
Factors and Requirements Considered in the Metropolitan Transportation Planning Process Federal legislation identifies several factors that must be considered to fulfill the MAP-21 planning process requirements25. The following section describes the newest regulatory items that SEMPO must consider in the development of the Metropolitan Transportation Plan.
The Scope of the Planning Process: The Eight Planning Factors The eight planning factors are identified as the process to achieve one of four national objectives detailed in the Metropolitan Transportation Planning National Objectives section included in the plan.
(h)(1) The metropolitan planning process for a metropolitan planning area under this section is carried over from the previous federal transportation legislation and shall provide for consideration of projects and strategies that will:
(A) support the economic vitality of the metropolitan area, especially by enabling global competitiveness, productivity, and efficiency;
(B) increase the safety of the transportation system for motorized and non-motorized users;
(C) increase the security of the transportation system for motorized and non-motorized users;
(D) increase the accessibility and mobility of people and freight;
25 Section 134, 23 U.S.C., subsection h1 and h2 for national performance goals
77 Appendix | SEMPO 2016-2040 Metropolitan Transportation Plan
(E) protect and enhance the environment, promote energy conservation, improve the quality of life, and promote consistency between transportation improvements and State and local planned growth and economic development patterns;
(F) enhance the integration and connectivity of the transportation system, across and between modes, for people and freight;
(G) promote efficient system management and operation; and
(H) emphasize the preservation of the existing transportation system.26
Subsection h2 describes the continued linkage from the initial Metropolitan Transportation Planning Objectives and the planning factors above, to the performance based approach intended to produce a performance based outcome to federal transportation planning:
(h)(2) Performance-based approach:
(A) In general, the metropolitan transportation planning process shall provide for the establishment and use of a performance-based approach to transportation decision making to support the national goals described in section 150(b) of this title and in section 5301(c) of title 49.
23 U.S.C. Sec. 150. National Goals and Performance Management Measures27 a. Declaration of Policy – Performance management will transform the Federal-aid highway program
and provide a means to the most efficient investment of Federal transportation funds by refocusing on national transportation goals, increasing the accountability and transparency of the Federal-aid highway program, and improving project decision-making through performance-based planning and programming.
b. National Goals – It is in the interest of the United States to focus the Federal-aid highway program on the following national goals28: 1. Safety – To achieve a significant reduction in traffic fatalities and serious injuries on all public
roads. 2. Infrastructure condition – To maintain the highway infrastructure asset system in a state of good
repair. 3. Congestion reduction – To achieve a significant reduction in congestion on the National Highway
System. 4. System reliability – To improve the efficiency of the surface transportation system.
26 Or, comparable 23 U.S.C. Section 135(d) 27 Section 150 of Title 23 28 Appropriated out of the Highway Trust Fund (other than the Mass Transit Account)
78 Appendix | SEMPO 2016-2040 Metropolitan Transportation Plan
5. Freight movement and economic vitality – To improve the national freight network, strengthen the ability of rural communities to access national and international trade markets, and support regional economic development.
6. Environmental sustainability – To enhance the performance of the transportation system while protecting and enhancing the natural environment.
7. Reduced project delivery delays – To reduce project costs, promote jobs and the economy, and expedite the movement of people and goods by accelerating project completion through eliminating delays in the project development and delivery process, including reducing regulatory burdens and improving agencies’ work practices.
SEMPO is addressing these national goals by anticipating the future integration into the metropolitan transportation planning process, by reference, the goals, objectives, performance measures, and targets described in MoDOT’s state transportation plans and transportation processes, when developed, as well as any plans developed under Chapter 53 of Title 49 by providers of public transportation, required as part of a performance-based program.
Rulemaking by the FHWA regarding the establishment of performance measures and standards shall be completed no later than 1 year after rulemaking to establish performance targets that reflect these measures and standards. Upon the establishment of these targets and measures by MoDOT and FHWA, SEMPO will either adopt MoDOT’s targets or establish alternative measures.
General Federal Requirements of the Metropolitan Transportation Plan a. General Requirements:
1. Development of long-range plans and TIPs: To accomplish the objectives in subsection (a), metropolitan planning organizations designated under subsection (d), in cooperation with the State and public transportation operators, shall develop long-range transportation plans and transportation improvement programs through a performance-driven, outcome based approach to planning for metropolitan areas of the State.
2. Contents: The plans and TIPs for each metropolitan area shall provide for the development and integrated management and operation of transportation systems and facilities (including accessible pedestrian walkways and bicycle transportation facilities) that will function as an intermodal transportation system for the metropolitan planning area and as an integral part of an intermodal transportation system for the State and the United States.
3. Process of development: The process for developing the plans and TIPs shall provide for consideration of all modes of transportation and shall be continuing, cooperative, and comprehensive to the degree appropriate, based on the complexity of the transportation problems to be addressed.
Potential Funding Sources
Local City of Cape Girardeau Transportation Trust Fund V
79 Appendix | SEMPO 2016-2040 Metropolitan Transportation Plan
Federal Federal funding comes primarily from the MAP-21, the current Federal transportation act. These are the main source of funding that will be used in future project and program funding through FY 2015.
1) National Highway Performance Program (NHPP) - The purposes of the National Highway Performance Program (NHPP) are: a) to provide support for the condition and performance of the National Highway System (NHS); b) to provide support for the construction of new facilities on the NHS; and c) to ensure that investments of Federal-aid funds in highway construction are directed to support
progress toward the achievement of performance targets established in a State's asset management plan for the NHS.
Projects must be on an “eligible facility" which includes only those facilities located on the NHS, be identified in the STIP/TIP and be consistent with the Long-Range Statewide Transportation Plan and the Metropolitan Transportation Plan(s).
2) Surface Transportation Program (STP) - STP may be used by States and localities for projects to preserve or improve conditions and performance on any Federal-aid highway, bridge projects on any public road, facilities for non-motorized transportation, transit capital projects and public bus terminals and facilities.
Fifty percent of a State’s STP funds are to be distributed to areas based on population (sub-allocated), with the remainder to be used in any area of the State. Consultation with rural planning organizations, if any, is required. Also, a portion of its STP funds (equal to 15 percent of the State’s Highway Bridge Program apportionment) is to be set aside for bridges not on Federal-aid highways (off-system bridges), unless the Secretary determines the State has insufficient needs to justify this
amount. A special rule is provided to allow a portion of funds reserved for rural areas to be spent on rural minor collectors, unless the Secretary determines this authority is being used excessively.
3) Congestion Mitigation and Air Quality Improvement Program (CMAQ) - SEMPO receives no CMAQ funding since the area meets the National Ambient Air Quality Standards for ozone, carbon monoxide, or particulate matter (nonattainment areas) as well as former nonattainment areas that are now in compliance (maintenance areas).
4) Highway Safety Improvement Program (HSIP) - Safety throughout all transportation programs remains ONEDOT’s number one priority. MAP-21 continues the successful HSIP, with average annual funding of $2.4 billion, including $220 million per year for the Rail-Highway Crossings program.
Every State is required to develop a Strategic Highway Safety Plan (SHSP) that lays out strategies to address these key safety problems. The SHSP remains a statewide coordinated plan developed in cooperation with a broad range of multidisciplinary stakeholders and includes the following targets and actions:
80 Appendix | SEMPO 2016-2040 Metropolitan Transportation Plan
a) States will set targets for the number of serious injuries and fatalities and the number per vehicle mile of travel. If a State fails to make progress toward its safety targets, it will have to devote a certain portion of its formula obligation limitation to the safety program and submit an annual implementation plan on how the State will make progress to meet performance targets.
b) High Risk Rural Roads - a State is required to obligate funds for this purpose if the fatality rate on such roads increases.
c) The Secretary is required to carry out a study of High Risk Rural Road “best practices.” d) States are required to incorporate strategies focused on older drivers and pedestrians if
fatalities and injuries per capita for those groups increase. e) Railway-Highway Crossings (set-aside from HSIP) f) Metropolitan Planning
5) Transportation Alternatives (TA) - TA is a new program, with funding derived from the NHPP, STP, HSIP, CMAQ and Metropolitan Planning programs, encompassing most activities funded under the Transportation Enhancements, Recreational Trails, and Safe Routes to School programs under SAFETEA-LU.
Fifty percent of TA funds are distributed to areas based on population (sub-allocated), similar to the STP. States and MPOs for urbanized areas with more than 200,000 people will conduct a competitive application process for use of the sub-allocated funds; eligible applicants include tribal governments, local governments, transit agencies, and school districts. Options are included to allow States flexibility in use of these funds.
This program is funded at a level equal to two percent of the total of all MAP-21 authorized Federal-aid highway and highway research funds, with the amount for each State set aside from the State’s formula apportionments. Unless a State opts out, it must use a specified portion of its TA funds for recreational trails projects. Eligible activities include:
a) Transportation alternatives (new definition incorporates many transportation enhancement activities and several new activities)
b) Recreational trails program (program remains unchanged) c) Safe routes to schools program d) Planning, designing, or constructing roadways within the right-of way of former Interstate
routes or other divided highways. 6) Metropolitan Planning – Continued funding from FHWA and FTA at an 80/20 formula.
New formula programs:
1. Construction of Ferry Boats and Ferry Terminal Facilities – replaces a similar discretionary program. 2. Federal Lands and Tribal Transportation Programs - creates a unified program for Federal lands
transportation facilities, Federal lands access transportation facilities, and tribal transportation facilities.
81 Appendix | SEMPO 2016-2040 Metropolitan Transportation Plan
3. Federal Lands Transportation Program - for projects that improve access within the Federal estate, such as national forests and national recreation areas, on infrastructure owned by the Federal government.
4. Federal Lands Access Program - for projects that improve access to the Federal estate on infrastructure owned by States and local governments.
5. Tribal Transportation Program - for projects that improve access to and within Tribal lands.
Continuing discretionary programs:
1. Projects of National and Regional Significance (PNRS) 2. On-the-Job Training Supportive Services 3. Disadvantaged Business Enterprise (DBE) Supportive Services 4. Highway Use Tax Evasion (Intergovernmental enforcement projects) 5. Work Zone Safety Grants
New Discretionary Program:
Tribal High Priority Projects (THPP) - a discretionary program modeled on an earlier program that was funded by set aside from the Indian Reservation Roads Program.
Set Asides under MAP 21:
Once each State’s total Federal-aid apportionment is calculated, amounts are set aside for Metropolitan Planning and CMAQ via a calculation based on the relative size of the State’s FY 2009 apportionment of those programs. The remainder is then divided among the rest of the formula programs as follows: NHPP (63.7%), STP (29.3%), and HSIP (7%). An amount is set aside from HSIP to fund the Rail-Highway Crossings program, and amounts are set aside proportionally from each State’s NHPP, STP, HSIP, CMAQ, and Metropolitan Planning apportionments to fund the State’s Transportation Alternatives program.
To enhance flexibility, a State may transfer up to 50% of any apportionment to another formula program, except no transfers are permitted of Metropolitan Planning funds or funds sub-allocated to areas based on population (STP and TA). [1509]
Generally Federal funds provide 80% of a capital improvement while the local entity provides the 20% local match.
Some Federal programs provide full funding, and other, competitive programs may prompt local project sponsors to provide more than 20%.
TIFIA:
The Transportation Infrastructure Financing and Innovation Act (TIFIA) program provides Federal credit assistance to eligible surface transportation projects. MAP-21 dramatically increases funding available for TIFIA, authorizing $750 million in FY 2013 and $1 billion in FY 2014 to pay the subsidy cost (similar to a commercial bank’s loan reserve requirement) of supporting Federal credit. A $1 billion TIFIA
82 Appendix | SEMPO 2016-2040 Metropolitan Transportation Plan
authorization will support about $10 billion in actual lending capacity. MAP-21 also calls for a number of significant program reforms, to include: a 10 percent set-aside for rural projects; an increase in the share of eligible project costs that TIFIA may support; and a rolling application process.
The Transportation Infrastructure Finance and Innovation Act of 1998 provides Federal credit assistance to major transportation investments of critical national importance, such as: intermodal facilities; border crossing infrastructure; highway trade corridors; and transit and passenger rail facilities with regional and national benefits. The TIFIA credit program is designed to fill market gaps and leverage substantial private co-investment by providing supplemental and subordinate capital29.
The TIFIA credit program offers three distinct types of financial assistance, designed to address projects’ varying requirements throughout their life cycles:
• Direct Federal loans to project sponsors offer flexible repayment terms and provide combined construction and permanent financing of capital costs.
• Loan guarantees provide full-faith-and-credit guarantees by the Federal government to institutional investors such as pension funds which make loans for projects.
• Standby lines of credit represent secondary sources of funding in the form of contingent Federal loans that may be drawn upon to supplement project revenues, if needed, during the first 10 years of project operations.
Note: The amount of Federal credit assistance may not exceed 33 percent of total project costs.
Urbanized Area Formula Grants (Section 5307 & Section 5340)30
This program provides grants to Urbanized Areas for public transportation capital, planning, job access and reverse commute projects, and operating expenses in certain circumstances. These funds constitute a core investment in the enhancement and revitalization of public transportation systems in the nation’s urbanized areas, which depend on public transportation to improve mobility and reduce congestion31.
Eligible Recipients - FTA apportions funds to designated recipients, which then sub-allocate funds to state and local governmental authorities, including public transportation providers.
Enhanced Mobility of Seniors and Individuals With Disabilities (Section 5310)32
This program is intended to enhance mobility for seniors and persons with disabilities by providing funds for programs to serve the special needs of transit-dependent populations beyond traditional public transportation services and Americans with Disabilities Act (ADA) complementary paratransit services33.
29 http://fhwa.dot.gov/map21/factsheets/tifia.cfm 30 http://www.fta.dot.gov/documents/MAP-21_Fact_Sheet_-_Urbanized_Area_Formula_Grants.pdf 31 Statutory References – 49 USC Sections 5307, 5336, and 5340 / MAP-21 Sections 20007, 20026 32 http://www.fta.dot.gov/documents/MAP-21_Fact_Sheet_-_Enhanced_Mobility_of_Seniors_and_Individuals_with_Disabilities.pdf 33 Statutory References - 49 U.S.C. Section 5310 / MAP-21 Section 20009
83 Appendix | SEMPO 2016-2040 Metropolitan Transportation Plan
Eligible Recipients - States (for all areas under 200,000 in population) and designated recipients. Sub-recipients: states or local government authorities, private non-profit organizations, or operators of public transportation that receive a grant indirectly through a recipient.
Transit Asset Management (Section 5326)34
This regulation establishes new requirements for transit asset management by FTA’s grantees as well as new reporting requirements to promote accountability. The goal of improved transit asset management is to implement a strategic approach for assessing needs and prioritizing investments for bringing the nation’s public transit systems into a state of good repair.
Eligible Recipients & Activities - Not applicable; no grants are established under this section. This section establishes cross-cutting requirements across FTA’s grant programs.
State Partnership Funding Programs: Programs that bring money to the project and does not have to be repaid.
Missouri Transportation Finance Corporation (MTFC) – A non-profit lending corporation established to assist local transportation projects, and to administer the Statewide Transportation Assistance Revolving Fund (STAR Fund).
State Transportation Assistance Revolving Fund (STAR Fund) – State Transportation Assistance Revolving Fund created to assist in the planning, acquisition, development and construction of transportation facilities other than highways in the state.
State Infrastructure Bank - A state infrastructure bank (SIB) is an investment fund at the state level with the ability to make loans and provide other forms of credit assistance to public and private entities to carry out transportation projects.
Partnership Debt-Financing Programs: Programs that bring money to the project and must be repaid.
Cost Sharing Program – Projects where MoDOT commits a portion of project costs for projects not on the department's right-of way and construction program, but that will benefit the state highway system.
Economic Development Program – A method of funding projects that will significantly impact the economic development in a given area.
Transportation Corporations – Specialized, temporary, private, not-for-profit corporations that can be organized to plan, develop, and finance a particular transportation project.
Transportation Development Districts – A temporary, local, political subdivision that can be authorized by a vote of the public or all owners of real property affected by the district to plan, develop, finance, and levy taxes for a particular transportation project.
34 Statutory References - 49 U.S.C. Section 5326 / MAP-21 Section 20019
84 Appendix | SEMPO 2016-2040 Metropolitan Transportation Plan
Other innovative finance techniques identified by MoDOT include:
• Congestion Pricing
• Private Activity Bonds
• Transportation Infrastructure Finance and Innovation Act (TIFIA) loan
• Grant Anticipation Revenue Vehicle (GARVEE)
• Grant Anticipation Notes GANS
• State Infrastructure Banks, and
• Toll Credits
Congestion Pricing - High performance highways involve the application of variable tolls on all lanes of existing toll ways and toll-free limited-access facilities to manage traffic flow. Tolls vary by level of demand, either on a fixed schedule by time of day or in real time to reflect changes in congestion levels, and are charged on congested highway segments to manage traffic flow. The concept also involves promotion of carpools and vanpools, park-and-ride facilities, and provision of express bus services, to provide travel alternatives to transportation system users.
Private Activity Bonds (PABs) - PABs allow the bonds to retain tax-exempt status despite a greater level of private involvement than is ordinarily allowed for these types of bonds. This allows public-private partnerships (PPPs) to obtain lower financing rates, eliminating one barrier to private sector participation in transportation finance35.
Grant Anticipation Revenue Vehicle (GARVEE) Bonds - A GARVEE is a designation applied to a debt financing instrument that has a pledge of future Federal aid for debt service and is authorized for Federal reimbursement of debt service and related financing costs. This financing mechanism generates up-front capital for major highway projects that the state may be unable to construct in the near term using traditional pay-as-you-go funding approaches. The issuer may be a state, political subdivision, or a public authority36. GARVEE bond issues are used in conjunction with advance construction to enable using Federal-aid funds for future debt service payments.
Grant Anticipation Notes (GANS) - Transit agencies also use similar mechanisms to borrow against future Federal-aid funds (Federal Transit Administration Title 49 grants) that are allocated by formula (Section 5307) or by project (Section 5309). These transit debt mechanisms are known as Grant Anticipation
35 http://www.fhwa.dot.gov/ipd/finance/tools_programs/federal_debt_financing/private_activity_bonds/
36 http://www.fhwa.dot.gov/ipd/finance/resources/federal_debt/garvee_guidance_2014.aspx
85 Appendix | SEMPO 2016-2040 Metropolitan Transportation Plan
Notes (GANs), but are not officially termed GARVEEs because they utilize Federal-aid funding under Title 49, not Title 23, and do not include debt-related financing costs such as interest and issuance costs.
State Infrastructure Banks - Missouri Transportation Finance Corporation is the State Infrastructure Bank (SIB) for Missouri. AN SIB does the following:
• Loans (primary and subordinated)
• Standby lines of credit
• Debt service reserve financing
• Bond security
• Limited financial planning assistance
• Grant Anticipation Notes
• Gap financing
• Credit enhancements
Toll Credits - To the extent toll credits are available, a state may use up to 100% Federal funds to construct some projects, while using the state or local funds that would have been required to match Federal funds to construct other projects with 100% state or local funds. In effect, by using toll credits to substitute for the required non-Federal share on a Federal-aid project, up to 100% Federal funding may be used on a project.
MAP-21 makes changes to the statutory provisions governing tolling on highways that are constructed or improved with Federal funds (23 USC 129). One significant change is the removal of the requirement for an agreement to be executed with the U.S. DOT prior to tolling under the mainstream tolling programs (though such agreements will continue to be required under the toll pilot programs).
Other changes include the mainstreaming of tolling new Interstates and added lanes on existing Interstates, which was previously allowed only under the Interstate System Construction Toll Pilot Program and the Express Lanes Demonstration Program. The Value Pricing Pilot Program, which allows congestion pricing, is continued (but without discretionary grants), as is the Interstate System Reconstruction and Rehabilitation Pilot Program, which allows tolling of all lanes on an existing Interstate highway when required for reconstruction or rehabilitation. MAP-21 also requires that all Federal-aid highway toll facilities implement technologies or business practices that provide for the interoperability of electronic toll collection by October 1, 2016 (four years after the enactment of MAP-21’s new tolling requirements).
86 Appendix | SEMPO 2016-2040 Metropolitan Transportation Plan
Supporting Policies
Complete Streets Policy A Complete Streets policy has the potential to end the project-by-project struggle to design better facilities by requiring all road construction and transportation improvement projects to begin with evaluating how the street serves all users – pedestrians, bicyclists, public transportation vehicles and passengers, trucks and automobiles. Implementing a Complete Streets policy may require changing existing policies and practices of local communities and/or transportation agencies. In some cases it may be difficult to adopt a new procedure or to modify design guidelines. Furthermore, implementing a Complete Streets policy may require additional training for planning and engineering staff which will take time and cost money but will result in a more comprehensive regional transportation system with additional capacity and flexibility to accommodate the travel needs of all users.
Ultimately, the desired outcome of a Complete Streets policy is one in which a multi-modal street becomes the default design and only after a formal exception process is a noncompliant design allowed. The following are general exceptions where roadways can lack non-motorized facilities:
• Roads where bicyclists and pedestrians are prohibited. • A clear absence of need. • Roadway or corridor is clearly not part of, or in close proximity to, the existing or planned non-
motorized network.
Some additional challenges for implementing a Complete Streets policy may include:
• Lack of right-of-way in cramped thoroughfares may make multi-modal improvements difficult, costly, or impossible.
• Overcoming the misconception that Complete Streets cost more to build than traditional streets when in fact Complete Streets often cost less to construct. By fully considering the needs of all non-motorized travelers (pedestrians, bicyclists, and persons with disabilities) early in the life of a project, the costs associated with including non-motorized facilities are minimized.
• Ensuring accurate transportation analysis as current methodologies for studying traffic may result in misleading results. For example, some current traffic methodologies may fail to consider how the presence of transit in a mixed-use corridor could potentially lower trip generation rates and thus reduce traffic volumes and congestion.
• Coordination of current transportation projects with planned transportation improvements. It is important that current transportation projects consider the impacts on planned or future improvements. For example, the reconstruction of a bridge commonly takes place before future roadway improvements (within the same corridor). The bridge improvements should be coordinated with future roadway designs to ensure that non-motorized accommodations are included in the bridge reconstruction and provide a safe and convenient transition with future roadway improvements.
87 Appendix | SEMPO 2016-2040 Metropolitan Transportation Plan
An Ideal Complete Streets Policy A Complete Streets policy should include the following:
• A vision for how and why the community wants to build and re-build its streets. • Specifies that ‘all users’ includes pedestrians, bicyclists, and public transportation passengers of
all ages and abilities, as well as trucks, buses, and automobiles. • Encourages street connectivity and aims to create a comprehensive, integrated, connected
network for all modes. • Provides for transit accommodations including sidewalks, shelters, and bus turnouts. • Is adoptable by all agencies to cover all roads. • Applies to both new and retrofit projects, including design, planning, maintenance, and
operations, for the entire right of way. • Makes any exceptions specific and sets a clear procedure that requires high-level approval of
exceptions. • Directs the use of the latest and best design standards while recognizing the need for flexibility
in balancing user needs. • Directs that complete streets solutions compliment the context of the community. • Establishes performance standards with measurable outcomes. • Specific next steps for implementation of the plan.
Transit Oriented Design (TOD) TOD design focuses on the following:
• Locating housing near transit; • Locating neighborhood-serving retail and office uses near transit and housing; • Connecting streets and paths for pedestrians and cyclists to and through the TOD; and, • Creating viable retail spaces for various tenants.
In order for TOD to be successful, a strong relationship between development and transit and an understanding of how transit works in tandem with surrounding development is necessary. This understanding begins with:
• Defining locations and sites with land use designation where TOD should occur; • Describing a conceptual framework in which existing and prospective development and transit
can relate and complement each other; • Understanding the challenges to implementing those concepts; and, • Defining the components of TOD.
TOD Benefits to SEMPO As documented in earlier chapters, transit is an important element of the comprehensive transportation system. While transit currently represents a relatively small percentage of trips within the SEMPO planning area, it is possible that this transportation mode may become more important as the area approaches the 2040 planning horizon. As the area population ages it will likely see increased reliance
88 Appendix | SEMPO 2016-2040 Metropolitan Transportation Plan
on public transportation as a primary transportation mode for many individuals. TOD emphasizes transit in the planning and design process, thus making it easier for individuals to access public transportation. Furthermore, TOD creates a pedestrian friendly environment that encourages individuals to walk and remain active which can be a benefit for the entire community.