Embed Size (px)
Citation preview
九州大学学術情報リポジトリKyushu University Institutional Repository
Detection of Cavities Using Pole-DipoleResistivity Technique
Elawadi, EslamDepartment of Earth Resources Engineering : Graduate Student of Doctor Course
El-Qady, GadNational Institute of Astronomy and Geophysics : Egypt : Lecturer
Salem, AhmedDepartment of Earth Resources Engineering : Graduate Student of Doctor Course
Ushijima, KeisukeDepartment of Earth Resources Engineering : Professor
http://hdl.handle.net/2324/1104
出版情報:九州大学工学紀要. 61 (4), pp.101-112, 2001-12-20. 九州大学大学院工学研究院バージョン:権利関係:
Memoirs of the Faculty of Engineering, Kyushu University, Vol. 61, No. 4, December 2001
Detection of Cavities Using Pole-Dipole Resistivity Technique
Eslam
by
ELAWADI*, Gad El-QADy"*, Ahmed SALEM* and KeisukeUSHIJIMA***
(Received September 19, 2001)
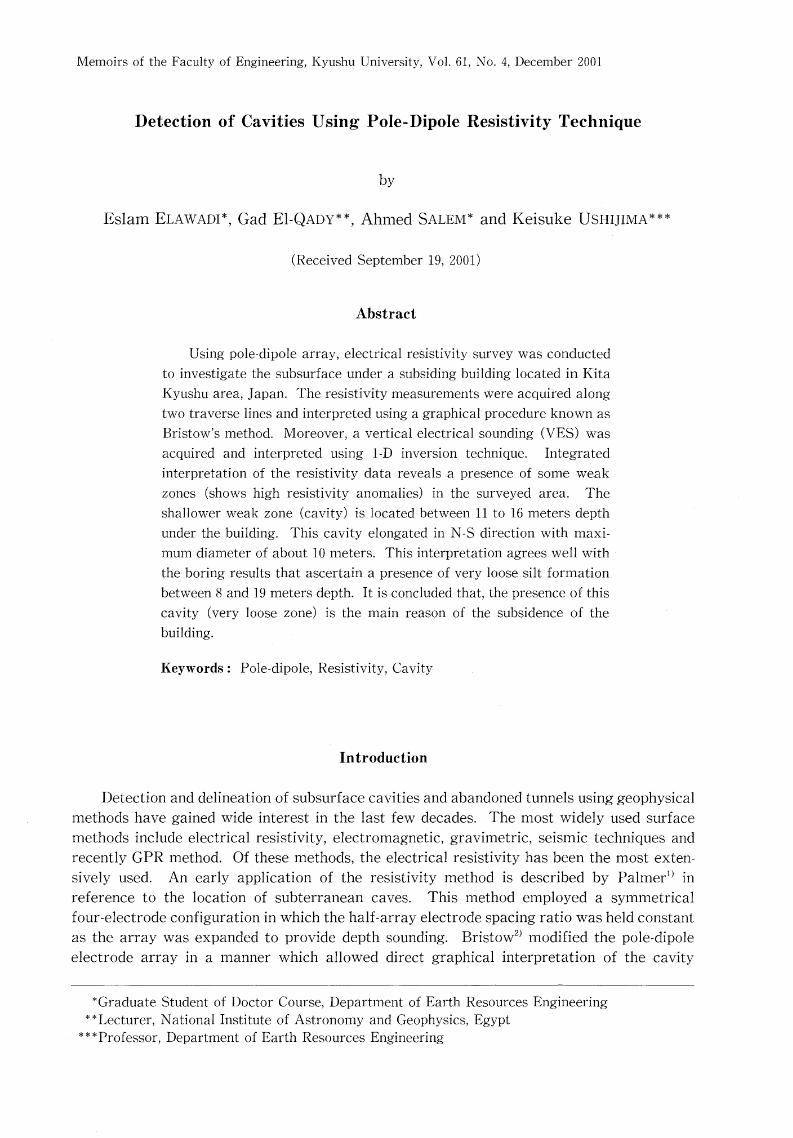
Abstract
Using pole-dipole array, electrical resistivity survey was conducted
to investigate the subsurface under a subsiding building located in Kita
Kyushu area, Japan. The resistivity measurements were acquired along
two traverse lines and interpreted using a graphical procedure known as
Bristow's method. Moreover, a vertical electrical sounding (VES) was
acquired and interpreted using 1-D inversion technique. Integrated
interpretation of the resistivity data reveals a presence of some weak
zones (shows high resistivity anomalies) in the surveyed area. The
shallower weak zone (cavity) is located between 11 to 16 meters depth
under the building. This cavity elongated in N-S direction with maxi-
mum diameter of about 10 meters. This interpretation agrees well with
the boring results that ascertain a presence of very loose silt formation
between 8 and 19 meters depth. It is concluded that, the presence of this
cavity (very loose zone) is the main reason of the subsidence of the
building.
Keywords: Pole-dipole, Resistivity, Cavity
Introduction
Detection and delineation of subsurface cavities and abandoned tunnels using geophysical
methods have gained wide interest in the last few decades. The most widely used surfacemethods include electrical resistivity, electromagnetic, gravimetric, seismic techniques and
recently GPR method. Of these methods, the electrical resistivity has been the most exten-sively used. An early application of the resistivity method is described by Palmer') in
reference to the location of subterranean caves. This method employed a symmetricalfour-electrode configuration in which the half-array electrode spacing ratio was held constant
as the array was expanded to provide depth sounding. Bristow2) modified the pole-dipole
electrode array in a manner which allowed direct graphical interpretation of the cavity
*Graduate ""Lecturer,*** Professor,
Student of Doctor Course, Department of Earth Resources EngineeringNational Institute of Astronomy and Geophysics, EgyptDepartment of Earth Resources Engineering
102 E. ELAWADI, G. El-QADY, A. SALEM and K. USHIJIMA
targets in approximate depth, position and size. Using this method in field studies, Bristow
was able to describe the approximate position of se, veral known passages over karst terrains.
Moreover, he discovered two cavities and verified their existence through boring and
excavatlon. Bates3) has applied Bristow's method to delineate a number of known cavities. Aftermaking some slight modifications, he was also able to locate a relatively small target cavity.
Several field examinations of Bristow's method have been conducted with various degrees ofsuccess. Fountain et al.`) Were able to detect both air-filled and mud-filled cavities, Smith5)
located a solution-filled cavity, and Ushijima et al.6) Successfully delineated air-filled cavities,
all of which are confirmed by drilling.
Kirk and Werner7) claim a success rate for the method ofjust over 50 percent, based on
their own experiences and published accounts of other investigations. The method ofintersecting arcs used to interpret the data, however, has drawn criticism from someresearchers8•9), who argue that it is based on faulty assumptions and that many of the positive
results reported using Bristow's method may well be serendipitous. UshijimaiO) has evaluated
the accuracy of graphical interpretation of the pole-dipole measurements based on numericalsimulation for various cavities by Finite Element method. Lowry and Shivei') evaluated
Bristow method in comparison with various electrode arrays using numerically modeledresistivity traverse over spherical and cylindrical cayities. They concluded that, the Bristow
method is a legitimate tool not just for detection, but also for delineation of cavities and it
is probably the most sensitive electrical resistivity technique advanced for those purposes to
date.
This paper describes the data acquisition and interpretation of the resistivity measure-
,,ili"#'#veww"swacM>.wwl,'tti\/IS,l'.i•'2•D ,'/kg'i..iwwl'i,iii--i,i'lllil-i"ll'lg'li•ftrin-msi.w-"'me/f.•g./g•i,fi
awama g.$g.mewa,,,i.1emA
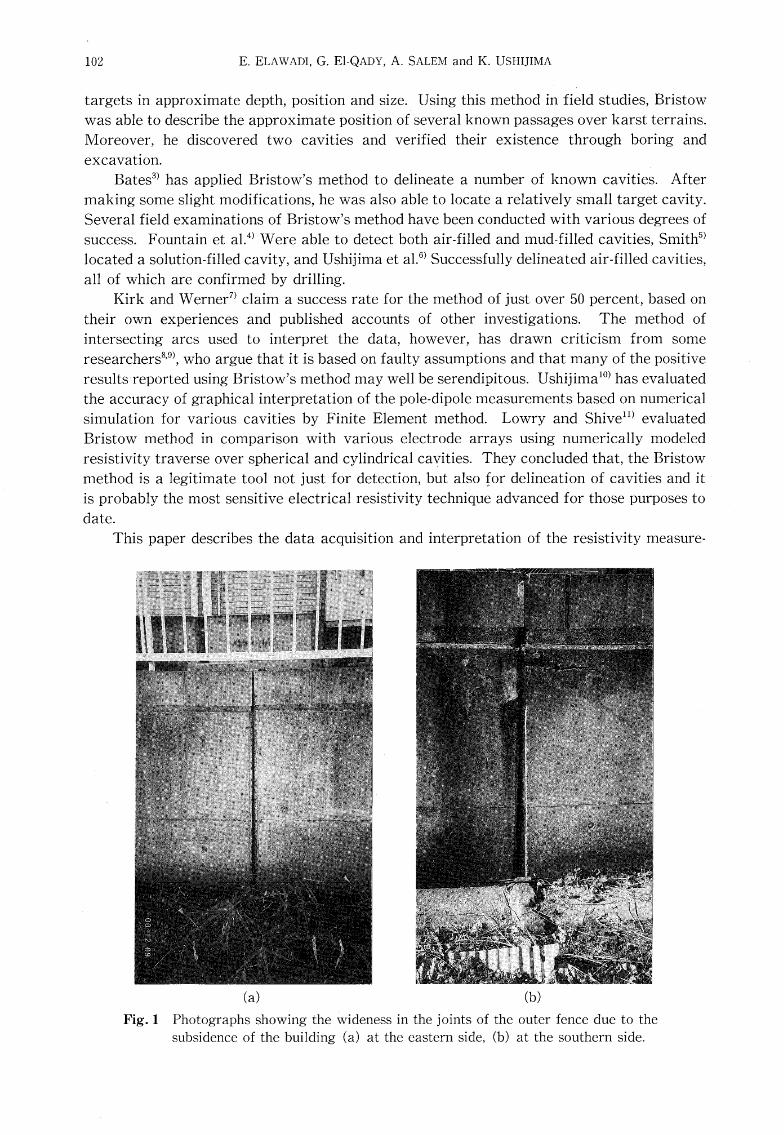
(a) (b)Fig.1 Photographs showing the wideness in thejoints of the outer fence due to the subsidence of the building (a) at the eastern side, (b) at the southern side.
Detection of Cavities Using Pole-Dipole Resistivity Technique
Borehole Number 2
4:
:
:
25m.
BoreholeNumber1 ca!l;!
H-ti
BoreholeNumber3
'
s.
!-.--l
dz
'
oa' =hot >uttt 5
ua
t/tt
' t
'
lt
g(kg
103
Survey line No.2
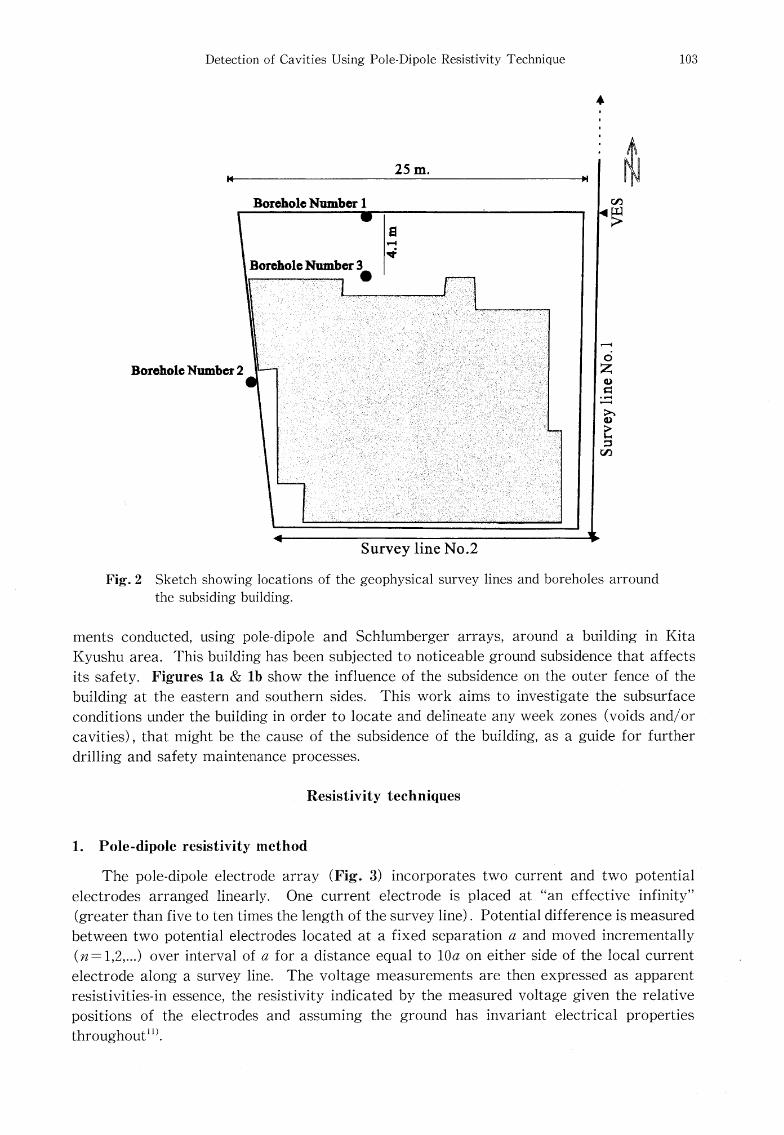
Fig.2 Sketch showing locations of the geophysical survey lines and boreholes arround the subsiding building.
ments conducted, using pole-dipole and Schlumberger arrays, around a building in KitaKyushu area. This building has been subjected to noticeable ground subsidence that affects
its safety. Figures la & lb show the influence of the subsidence on the outer fence of the
building at the eastern and southern sides. This work aims to investigate the subsurfaceconditions under the building in order to locate and delineate any week zones (voids and/or
cavities), that might be the cause of the subsidence of the building, as a guide for further
drilling and safety maintenance processes.
Resistivity techniques
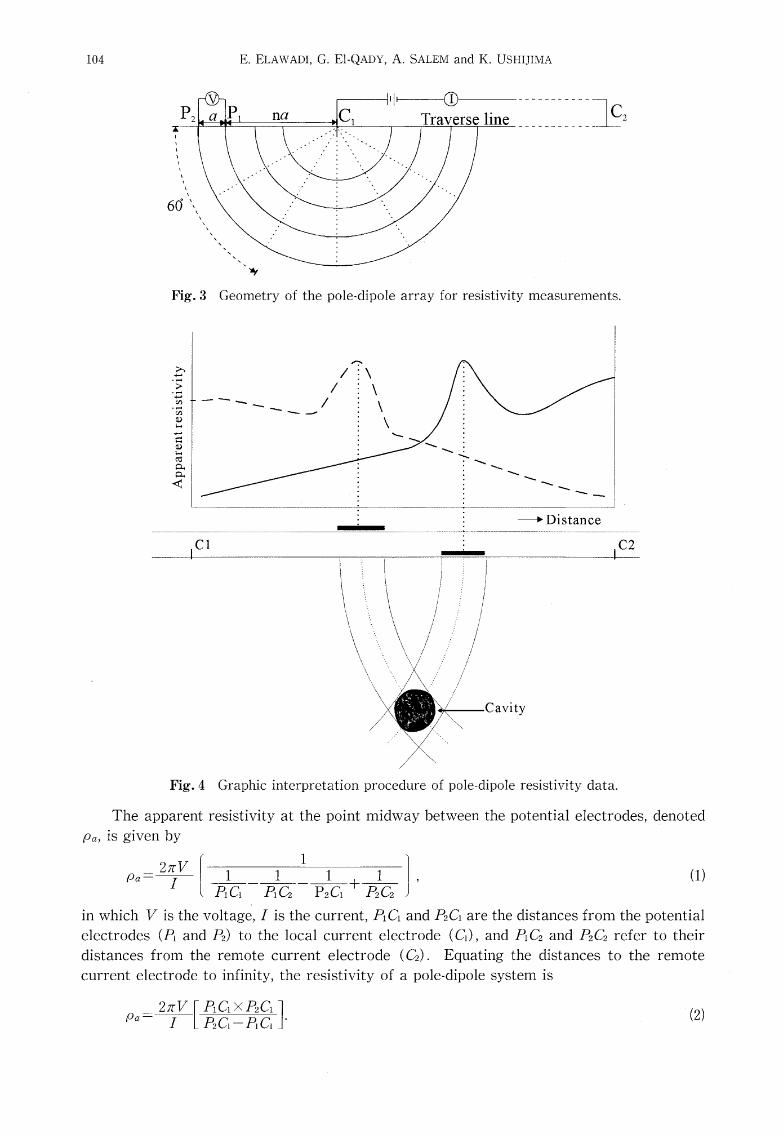
1. Pole-dipole resistivity method
The pole-dipole electrode array. (Fig. 3) incorporates two current and two potentialelectrodes arranged linearly. One current electrode is placed at "an effective infinity"(greater than five to ten times the length of the survey line). Potential difference is measured
between two potential electrodes located at a fixed separation a and moved incrementally(n=1,2,...) over interval of a for a distance equal to 10a on either side of the local current
electrode along a survey line. The voltage measurements are then expressed as apparentresistivities-in essence, the resistivity indicated by the measured voltage given the relative
positions of the electrodes and assuming the ground has invariant electrical propertiesthroughoutii).
104
P, a
E. ELAwADI, G. El-QADY, A. SALEM and K. USHIJIMA
Pi na=tk
il
x SN ON60 , IN XNN
Fig. 3
.b-
't'
U1 M--•es
o -- q o - ed cu n<
C,ilre --"--.. Traverse line
N
-c,
N tt s
N'"y)r 4Geometry of the pole-dipole array for resistivity measurements.
t'N . /iX, I /i•x l's--• -....
IN : :NS : • N. - "N. 'x . •x . 'x - :x . .N ' .x '.N .. s.
- Distan ce
/
f
i Cavity / ny
/ Fig.4 Graphic interpretation procedure of pole-dipole resistivity data.
The apparent resistivity at the point midway between the potential electrodes, denotedpa, is given by
iLp,c, p,C, P,C,1-P,C2 Jin which V is the voltag6, I is the current, Pi Ci and P2Ci are the distances from the potential
electrodes (Pi and P2) to the local current electrode (Ci), and PiC2 and P2C2 refer to their
distances from the remote current electrode (C2). Equating the distances to the remotecurrent electrode to infinity, the resistivity of a pole-dipole system is
Detection of Cavities Using Pole-Dipole Resistivity Technique 105
In terms of array parameters, this equation can be written as;
where R is the measured resistance, a is the potential electrode separation, and n is the dipole
separation factor.
By moving the current source location along the traverse at incremental distances, themeasured resistivity profiles will overlap. The apparent resistivity values are plotted against
the potential electrodes mid-point position (Fig. 4). On a scale drawing of the vertical
section along the survey line, intersection of two or more equipotential hemispherical shells
having radii corresponding to the current-to-potential electrode separation distance at which
resistivity anomalies are observed will locate the subsurface cavity. When this method isapplied with sufficient overlap of the resistivity profiles, the subsurface zone of intersection
can provide reasonably good indication of cavity target cross-sectional size and depthi2).
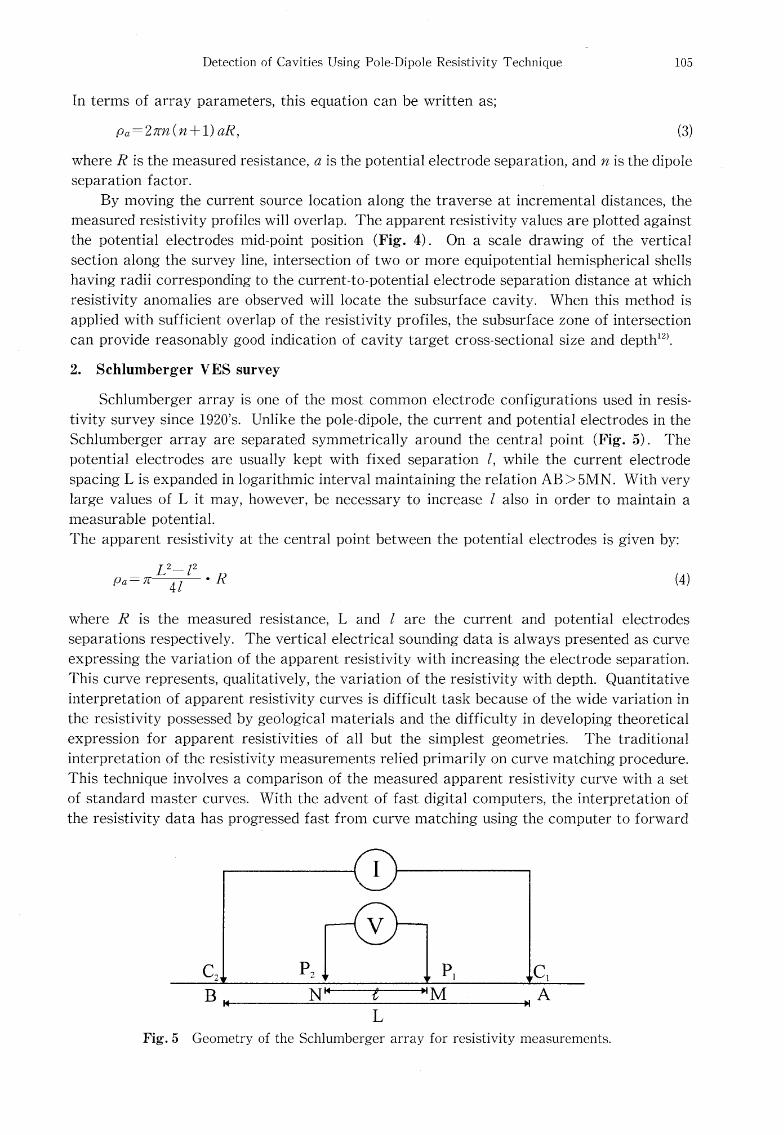
2. Schlumberger VES survey
Schlumberger array is one of the most common electrode configurations used in resis-tivity survey since 1920's. Unlike the pole-dipole, the current and potential electrodes in the
Schlumberger array are separated symmetrically around the central point (Fig. 5). Thepotential electrodes are usually kept with fixed separation l, while the current electrode
spacing L is expanded in logarithmic interval maintaining the relation AB >5MN. With very
large values of L it may, however, be necessary to increase l also in order to maintain ameasurable potential.
The apparent resistivity at the central point between the potential electrodes is given by:
L2- l2
where R is the measured resistance, L and l are the current and potential electrodesseparations respectively. The vertical electrical sounding data is always presented as curve
expressing the variation of the apparent resistivity with increasing the electrode separation.
This curve represents, qualitatively, the variation of the resistivity with depth. Quantitative
interpretation of apparent resistivity curves is difficult task because of the wide variation in
the resistivity possessed by geological materials and the difficulty in developing theoretical
expression for apparent resistivities of all but the simplest geometries. The traditionalinterpretation of the resistivity measurements relied primarily on curve matching procedure.
This technique involves a comparison of the measured apparent resistivity curve with a set
of standard master curves. With the advent of fast digital computers, the interpretation of
the resistivity data has progressed fast from curve matching using the computer to forward
Iv
C, P, P, C,
B NK----t--MM A LFig.5 Geometry of the Schlumberger array for resistivity measurements.
106 E. ELAWADI, G. El-QADY, A. SALEM and K. USHIJIMA
and inverse modeling in one, two and three dimensions. However, these modeling techniquesare suffering of inherent ambiguous and non-unique solution.
Field measurements
Using the pole-dipole array, resistivity measurements have been acquired along twotraverse lines directed NS and EW, parallel to the eastern and southern sides of the building,
respectively (Fig. 2). Current electrodes were planted along the survey line No.1 with 20
meter separation and the potential differences were measured with two meter intervalpotential electrodes, moving incrementally over intervals of 2 meters. On the survey line No.
2, the multiple current electrode separations are reduced to be 5 meters, with potentialelectrode separation of 2 meters and horizontal shift of 1' meter. Current electrodes were laid
out along the survey line and the potential differences at a given location corresponding to
each current electrode are measured. Moreover, vertical electrical sounding (VES) measure-
ments were acquired using Schlumberger array, in a selected location according to thepreliminary interpretation of the pole-dipole measurements (Fig. 2). Schlumberger arraywas selected, because of its high vertical sounding ability, to provide the resistivity structure
underneath the observed area in integration with the pole-dipole measurements. The halfcurrent electrode spacing AB/2 starts from O.5 up to 90 meters in successive steps. For both
measurements arrays, we used the (McOHM) electrical resistivity meter for data acquisition
with manual switching system to select the excited current electrode in the pole-dipole
survey.
Interpretation
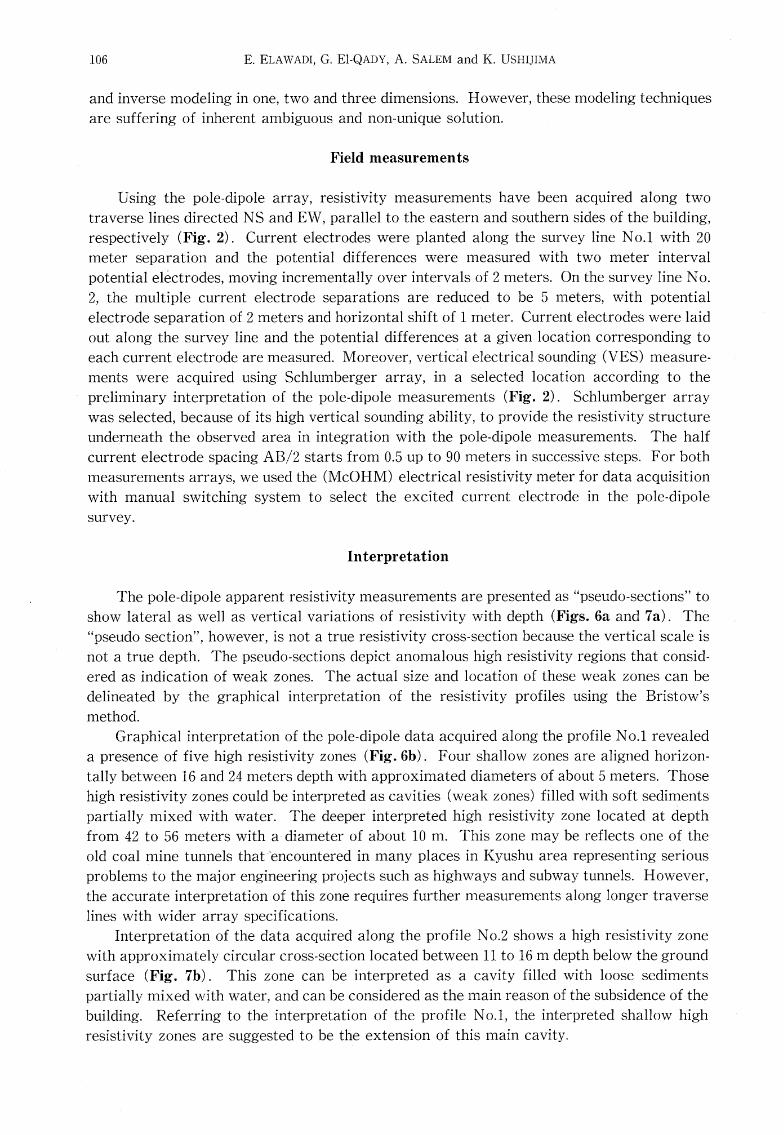
The pole-dipole apparent resistivity measurements are presented as "pseudo-sections" toshow lateral as well as vertical variations of resistivity with depth (Figs. 6a and 7a). The
"pseudo section", however, is not a true resistivity cross-section because the vertical scale is
not a true depth. The pseudo-sections depict anomalous high resistivity regions that consid-
ered as indication of weak zones. The actual size and location of these weak zones can bedelineated by the graphical interpretation of the resistivity profiles using the Bristow's
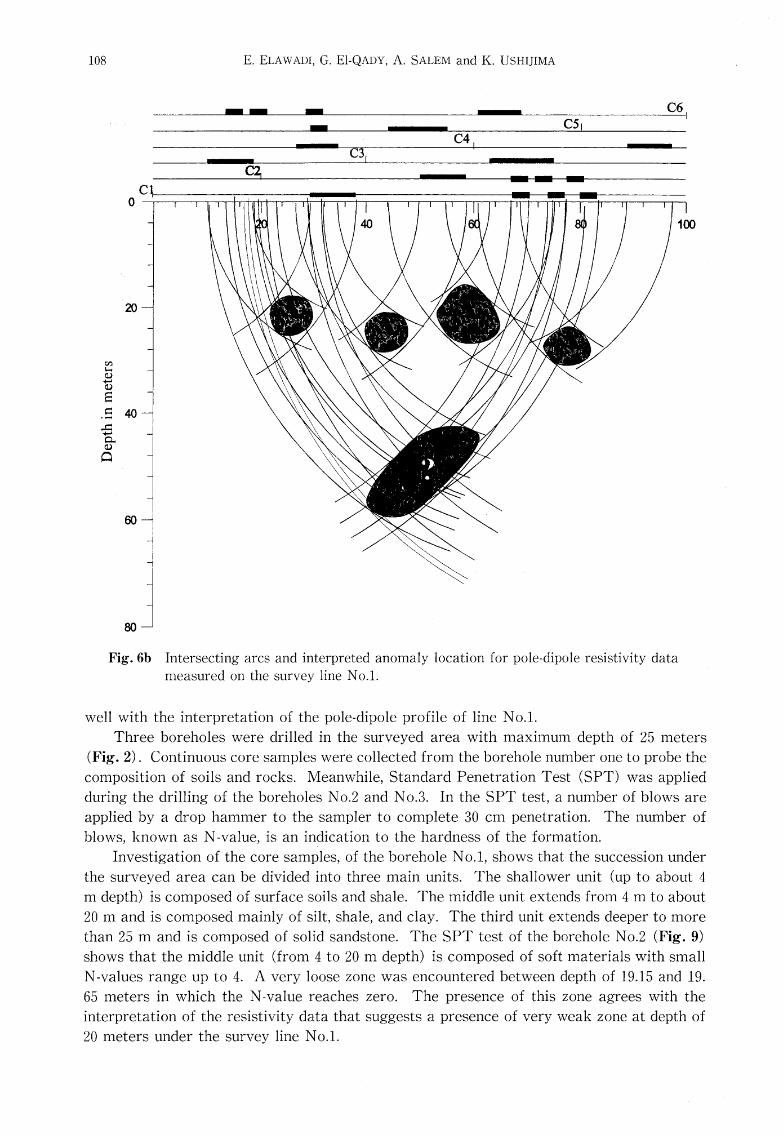
method. Graphical interpretation of the pole-dipole data acquired along the profile No.1 revealed
a presence of five high resistivity zones (Fig.6b). Four shallow zones are aligned horizon-
tally between 16 and 24 meters depth with approximated diameters of about 5 meters. Thosehigh resistivity zones could be interpreted as cavities (weak zones) filled with soft sediments
partially mixed with water. The deeper interpreted high resistivity zone located at depthfrom 42 to 56 meters with a diameter of about 10 m. This zone may be reflects one of theold coal mine tunnels that'iencountered in many places in Kyushu area representing serious
problems to the major engineering pro.iects such as highways and subway tunnels. However,the accurate interpretation of this zone requires further measurements along longer traverse
lines with wider array specifications.
Interpretation of the data acquired along the profile No.2 shows a high resistivity zone
with approximately circular cross-section located between 11 to 16 m depth below the ground
surface (Fig. 7b). This zone can be interpreted as a cavity filled with loose sedimentspartially mixed with water, and can be considered as the main reason of the subsidence of the
building. Referring to the interpretation of the profile No.1, the interpreted shallow high
resistivity zones are suggested to be the extension of this main cavity.
Detection of Cavities Using Pole-Dipole Resistivity Technique 107
Fig. 6a Apparent resistivity pseudosection under the survey line No.1.
19ooe18ooe17oo{}
16eeg1soeet4(}OO
13ooei20{}C)
11eoe1eeee90co8(}oo
7eoo6eeosooe4ooe3eoo2e{}o
1am
(st• ra)
8-j
10--•i
2 4
Fig. 7a
6 8 10 12 14 16 l8 20 22Apparent resistivity pseudosection under the survey line No.2.
9000 •sseo seoe 7500 7eoo -6500 6000 ssee seee 4500 •4000 3seo •3000 •2soe 2oge lsoe ieoo soe e(st. m)
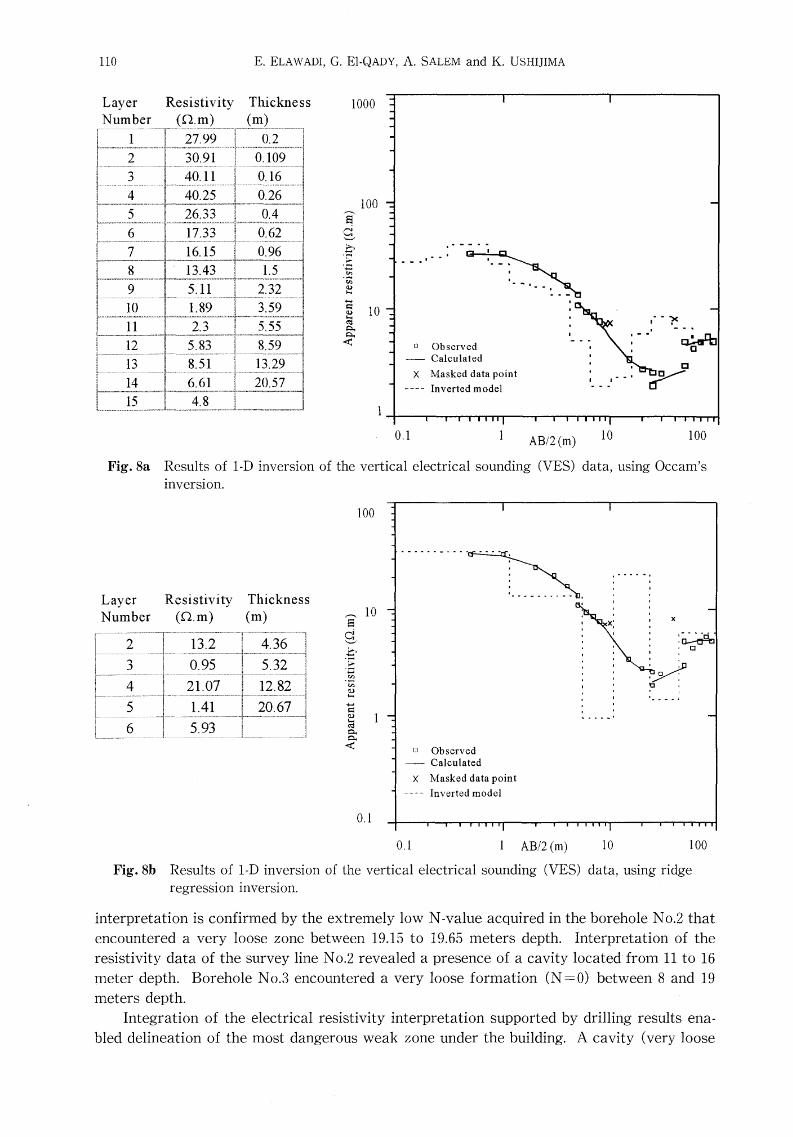
The VES data are plotted and inverted using the RESIX software that creates 1-D modelfor the sounding data by two inversion techniques (Figs. 8a and 8b).1) Occam's inversion that enables automatic interpretation of the resistivity data in terms
of smooth model. In this method, the depths to the bottom of each layer are logarith- mically spaced between thpv minimum and maximum depth; an-d then the resistjvitjes are initialized to the average value and adapted using Occam's inversion tb produce the
smoothest model that fits the data.2) Standard inversion method facilitates obtaining interpreted model in a least square sense. In this method, the initial model parameters (provided by the author) are adjusted iteratively using a ridge regression'3) to a best fitted model.
The inverted smooth model (Fig. 8a) reveals the presence of high resistivity zone deeper
than 10 meter. The model obtained using ridge regression technique emphasizes the presence
of this zone, with resistivity 21 n.m, between 10 and 22 m depth. This interpretation agrees
108 E. ELAWADI, G. El-QADY, A. SALEM and K. USHIJIMA
C51C6 1
C4
o
20
C
caIis
6-=
.g co
eoa
A
oo
eo
INX
co 1oo
R
Fig.6b Intersecting arcs and interpreted anomaly location for pole-dipole resistivity data
measured on the survey line No.1.
well with the interpretation of the pole-dipole profile of line No.1.
Three boreholes were drilled in the surveyed area with maximum depth of 25 meters(Fig. 2). Continuous core samples were collected from the borehole number one to probe the
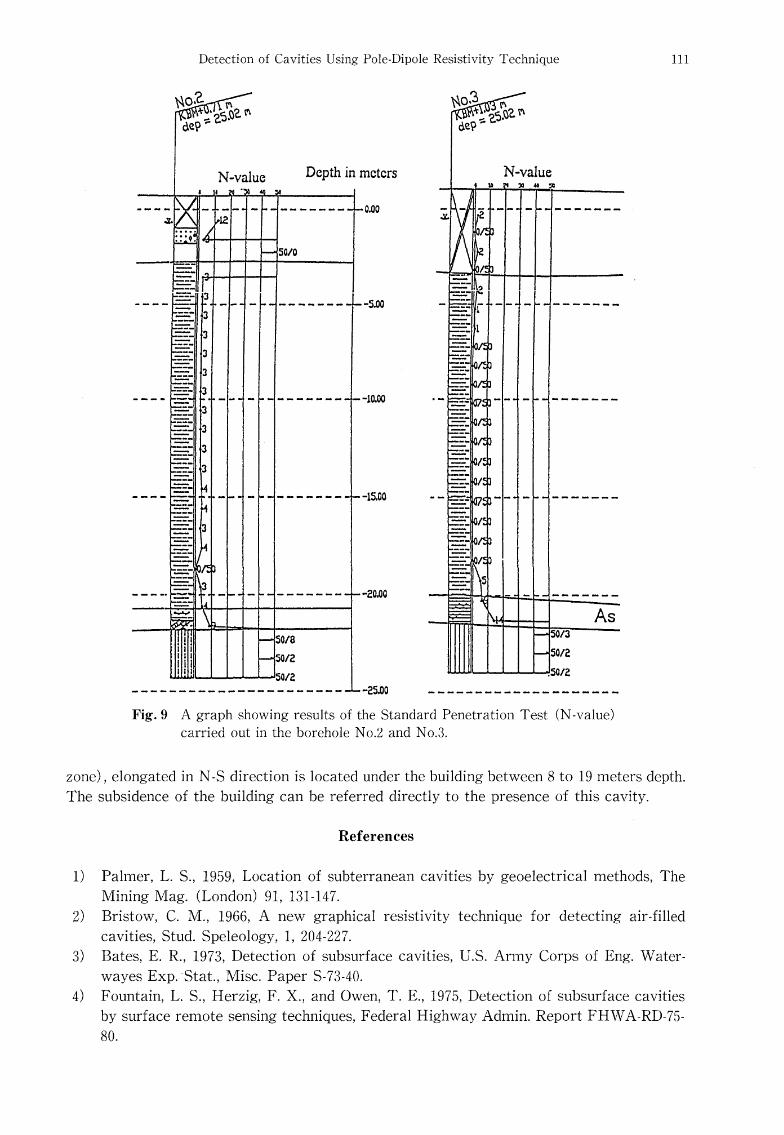
composition of soils and rocks. Meanwhile, Standard Penetration Test (SPT) was appliedduring the drilling of the boreholes No.2 and No.3. In the SPT test, a number of blows are
applied by a drop hammer to the sampler to complete 30 cm penetration. The number ofblows, known as N-value, is an indication to the hardness of the formation.
Investigation of the core samples, of the borehole No.1, shows that the succession under
the surveyed area can be divided into three main units. The shallower unit (up to about 4
m depth) is composed of surface soils and shale. The middle unit extends from 4 m to about
20 m and is composed mainly of silt, shale, and clay. The third unit extends deeper to morethan 25 m and is composed of solid sandstone. The SPT test of the borehole No.2 (Fig. 9)
shows that the middle unit (from 4 to 20 m depth) is composed of soft materials with small
N-values range up to 4. A very loose zone was encountered between depth of 19.15 and 19.65 meters in which the N-value reaches zero. The presence of this zone agrees with theinterpretation of the resistivity data that suggests a presence of very weak zone at depth of
20 meters under the survey line No.1.

Detection of Cavities Using Pole-Dipole Resistivity Technique 109
IC6
o
5
ca5
-IS
8.fi 10
'-` ,..,,,
g-
a
15
x
sk •
N
Å~
xixx)x)SlX
10 15
''
i
f
/
lli !/l/
/
as
,1
oo
Fig.7b Intersecting arcs and interpreted anomaly location for pole-dipole resistivity data
measured on the survey line No.2.
The SPT measurements acquired in the borehole No.3, reveals a very Ioose zone(N-value =O) at depth of 8 to 19 meters (Fig. 9). This result harmonizes with the interpreta-
tion of the resistivity data of the traverse No.2 that delineate a weak zone between 11 to 16
meters depth. Integration of the resistivity interpretation and the drilling informationsuggests that the subsidence of the building is due to shallow cavity (void) located at depth
from 8 to 19 meters. This void is elongated in N-S direction under the building withapproximated width of about 10 meters. The positive resistivity response of this voidsupports the idea that the void is filled with very loose sediments partially saturated by
water.
Conclu,gion
The pole-dipole electrical resistivity and Schlumberger VES surveys have been appliedto investigate the subsurface structure on a subsidence area located in Kita Kyushu city. This
investigation aimed to delineate any weak zones (cavities or voids), that might be respon-
sible for the ground subsidence occurred under the building, as a guide for further safety
malntenance processes. Interpretation of the pole-dipole and VES resistivity data of the survey line No.1 revealed
a presence of high resistivity anomalous zones between 16 and 24 meters depth. This
110 E. ELAWADI, G. El-QADY, A. SALEM and K. USHIJIMA
!
l-
i
LayerN.-u..m""b..g.r.
i
Resistivity (Q•m. ).. ...ITiI'2•2--:l•9••9• '''
30,9i
Thickness (m)11 '"'"' ,QLI,.'2I'"I"'ll
O.10940.11
40.25
l.". p.,i.-6..
1000
.3..
4
5
" l- l' '
i
O.26 :-..L..fi 1 l
I/F=htt.al--,de.
26.33 i O.4
i6lr-'--7
l'- '
l'''
2
17.33
16.15 l't
O.62
O.96
..i
..
1l
l'''
l•-•-
8'l
i 13.43't'
1.5
-s
lgl------
l- 105.11 l
'' fr"'
2.32 Eg 1.89
'i
i/''-' "D'i'i'L
3.59 l2.3 5'55 ,..,,
,z
li' ''13' ''
li 14l
5.83
8.51
8.59.B. ,.2gi...l
'i
i'
e 20.57
i------ )...H
p--"-
6.61 1
100Gg-g'
IS
k
g iog.A
l/-••--•--•----!-5'•' -.-.-n••-•-•1i-.-......-,.,4'8,...=,= .,=l,,..,, .,,um, E1
m
Å~
1- ---;
'
-
---
ObservedCalculated
Masked data point
Inverted model
:- : : i
-" "t
1 i. . .l''
!- - .?(
" qW.ln agy
Fig. 8a
LayerNumber
Results of 1-D inversion of th
mverslon.
Resistivity Thickness
(9.m) (m)
O,1 1 AB12(m)
e vertical electrical sounding (VES)
10 100data, using Occam's
aÅëY/
.tL:t'l"
•=.se
8k
illl
R"ptA<
1OO
10
1L-
2 13.2 li 4.36
II.. 3 ii o.gs l s.32 '' i
I
1Lr..1
[1
4 21.07 l, 12.82ttttttt't't l7"''t'Lttttttt'ttttttrttttt.tttt....
I 20,67
1
-:----
.tL.
i'
1;. .g..
1.41
L[
"l
5.93il
O.1
1
m
Å~
ObservedCalculated
Masked data point
Inverted model
ll -i1 x' 1x -el i i !.di.....
,' ' ,m tt 41il irf1' Ui l-t S e.--.J '
O,1 IAB12(m) 10 100 Fig.8b Results of 1-D inversion of the vertical electrical sounding (VES) data, using ridge
regresslon lnverslon.
interpretation is confirmed by the extremely low N-value acquired in the borehole No.2 that
encountered a very loose zone between 19.15 to 19.65 meters depth. Interpretation of theresistivity data of the survey line No.2 revealed a presence of a cavity located from 11 to 16
meter depth. Borehole No.3 encountered a very loose formation (N=O) between 8 and 19meters depth. Integration of the electrical resistivity interpretation supported by drilling results ena-
bled delineation of the most dangerous weak zone under the building. A cavity (very loose
Detection of Cavities Using Pole-Dipole Resistivity Technique
t , .
N,O,'2,k.• ,""zpt
N-valueDepthinmetcrM
---t----
&- -2 " -
ii:6i
-----------ti
so!o
==---=.=-:==--
--"---
------i
-------
--b-h--
==--==--
=.=r.-==--==-=r."==-==--=-:==.-=:r-
==.=.-==-=r-=-==-=--=r..=r"="=="--
m.-==.-==-=-=-:=---••-•---••
=r-"=-==--:=:==--
pt
pt
--
-- ---- "---"----""-
---------
--------------"
---------""
o,oo
-s.oe
-laoo
-1500
-aona
-2S,OO
"vA..-
.
,lllIl
5018
sola
so!a
------------------pt""---------"-"----
No,3.
deP
ptt.'e5."Zpt
N-valuew ee " pt
ISE, - - -- " - --------------
l
=-==. o
=-" :=- r - - - ------i--==-==- 1=-:=.
=.==.==-=.=.==.
------ =. - - t-- t-----------
=.==-=.=.==-=-==- /==-==. !=--"-- =. . - -- ----{-d---{-}-
=-=- /==-==-==-="-.
= 1==-=-=- 5
---- - ---------"
AsSO13
sola
sc!2.
111
-t-e--------"---------th-------------- Fig.9 A graph showing results of the Standard Penetration Test (N-value) carried out in the borehole No.2 and No.3.
zone), elongated in N-S direction is located under the building between 8 to 19 meters depth.
The subsidence of the building can be referred directly to the presence of this cavity.
References
1) Palmer, L. S., 1959, Location of subterranean cavities by geoelectrical methods, The
Mining Mag. (London) 91, 131-147. 2) Bristow, C. M., 1966, A new graphical resistivity technique for detecting air-filled
cavities, Stud. Speleology, 1, 204-227.
3) Bates, E. R., 1973, Detection of subsurface cavities, U.S. Army Corps of Eng. Water-
wayes Exp.'Stat., Misc. Paper S-73-40.4) Fountain, L. S., Herzig, F. X., and Owen, T. E., 1975, Detection of subsurface cavities
by surface remote sensing techniques, Federal Highway Admin. Report FHWA-RD-75- 80.
112 E. ELAWADI, G. El-QADY, A. SALEM and K USHIJIMA
5) Smith, D. L., 1986, Application of the pole-dipole resistivity technique in the detection
of solution cavities beneath highways, Geophysics, 51, 833-837. 6) Ushijima, K., and Mizunaga, H., 1989, Detection of cavities by the misa-a-la-masse and
pole-dipole resistivity surveys, Proc. MMIJ/IMM Symposium, 125-128. 7) Kirk, K. G., and Werner, E., 1981, Handbook of geophysical cavity-locating techniques
with emphasis on electrical resistivity, Federal Highway Admin, Publication FHWA-IP-
81-3. 8) 'Myers, J. O., 1975, Cave location by electrical resistivity measurements, some miscon-
ceptions and practical limits of detection, Trans., British Cave Research Association, 2,
167-172. 9) Creedy, D. P., 1975, Resistivity over caves: Bull. British Cave Research Assn., 9, 5-6.
10) Ushijima, K., Mizunaga, H. and Nagahama, S., 1989, Detection of cavities by the pole-dipole resistivity method:, Butsuri-tansa, "Geophysical Exploration", 40, 324-334.
11) Lowry, T., and Shive, P. N., 1990, An evaluation of Bristow's method for the detection
of subsurface cavities, Geophysics, 55, 514-520.
12) Owen, T. E., 1983, Detection and mapping of tunnels and caves: Developments, in Geophysical Exploration Methods: A. A. Fitch (ed.), Vol.5, 161-258 Applied Science Publishers Ltd.13) Inman, J. R., 1975, Resistivity inversion with ridge regression, Geophysics, 40, 798-817.


