Embed Size (px)
Citation preview
Journal of Tethys, Vol. 1, No. 1, 59-74
Gharieb et al., 2013 59 jtethys.org
Detection of gold bearing rocks using aster data at Gabel Gharib, northeastern
Desert, Egypt
Gharieb, Abd El Mohsen1; Sharaky, Abass2; Abdel Maksoud Kholoud Mohamed2
1- Nuclear Materials Authority, Cairo, Egypt.
2- Institute of African Research and Studies, Cairo University, Egypt.
* Corresponding Author: [email protected]
Abstract
The Gharib area is sited between latitudes 28º 10' 12" - 28º 01' 37" N and Longitudes 32º
55' 02" - 32º 38' 29" E, in the Eastern Desert- Egypt, covers an area 500 Km2, this area is
covered mainly by younger granites; The younger granite is considered as one of the most
important basement rock due to its economic value, where it used in different purposes
metallic purpose, and as raw material which are used for ornamental stones. Remote
sensing is an important and useful tool for mapping and detection of alteration zones,
which properly important for identifying ore deposits. ASTER imagery are reliable,
accurate and of good ability to assist geologists in mineral exploration stages. Using image
processing technique such as band rationing method (bands ratio 4/8, 4/2 and 8/9 used for
hydrothermal alteration zones to detect gold occurrence, band ratios 4/5, 4/6 and 4/7 in
RGB Show the discrimination of hydrothermal alteration and band ratios 5/7, 3/1 and 4/3
show the iron gossan an iron- bearing sulphide ore bodies where gold are enriched in this
oxidation zone area). The hydrothermal alteration zones are detected in the South western
side of the study area Gabel Gharib which located in the northern part in the Pan African
Belt, and by using Classification methods such as SAM and MLC are used to make an up-
to-date geologic map with scale 1:50,000. These methods Results in detecting gold
mineralization in the study are also verified that the methods are fruitful and could be
applicable elsewhere.
Keywords: ASTER, Gold, Pan-African, Gharib Mountain.
1- Introduction
Remote sensing technology displayed a
great role in mineral investigation and
prospecting of ores. The ASTER (the
Advanced Space borne thermal Emission
and Reflection Radiometer) imagery used
provides accurate information.
Reconnaissance of hydrothermal ore
deposits exploration is linked to
distinctive spectral properties of the
image (Mars and Rowan, 2006; Di
Tommaso and Rubinsten, 2007; Zhang et
al., 2007; Kargi, 2007; Gabr et al., 2010).
Geologists have an incredible opportunity
to be a target potential for hydrothermal
ore deposits with remote sensing data
which has been enhanced after launching
of ASTER.
ASTER is multispectral imaging sensor
that measures reflected and emitted
electromagnetic radiation from Earth's
surface and atmosphere in 14 bands.
These bands are divided into three groups;
three visible and near infrared (VNIR)
bands ranging in wavelength between
0.52 and 0.86 µm with spatial resolution
Journal of Tethys, Vol. 1, No. 1, 59-74
Gharieb et al., 2013 60 jtethys.org
of 15m; six bands of short wavelength
infrared radiation (SWIR) ranging from
1.6 to 2.43 µm with spatial resolution of
30m; 5 thermal infrared radiation bands
(TIR) range from 8.125- 11.65 µm in
wavelength with spatial resolution 90m
(Yamaguchi et al., 1999; Abrams, 2000).
Chart 1 show the research method taken
in to achieve the geologic map and band
ratio maps .
Precambrian rocks occupy about one
tenth of the land surface of Egypt. They
form mountains terrains in southern Sinai
and the Eastern Desert as well as small,
low lying in lines in the southern parts of
western Desert.
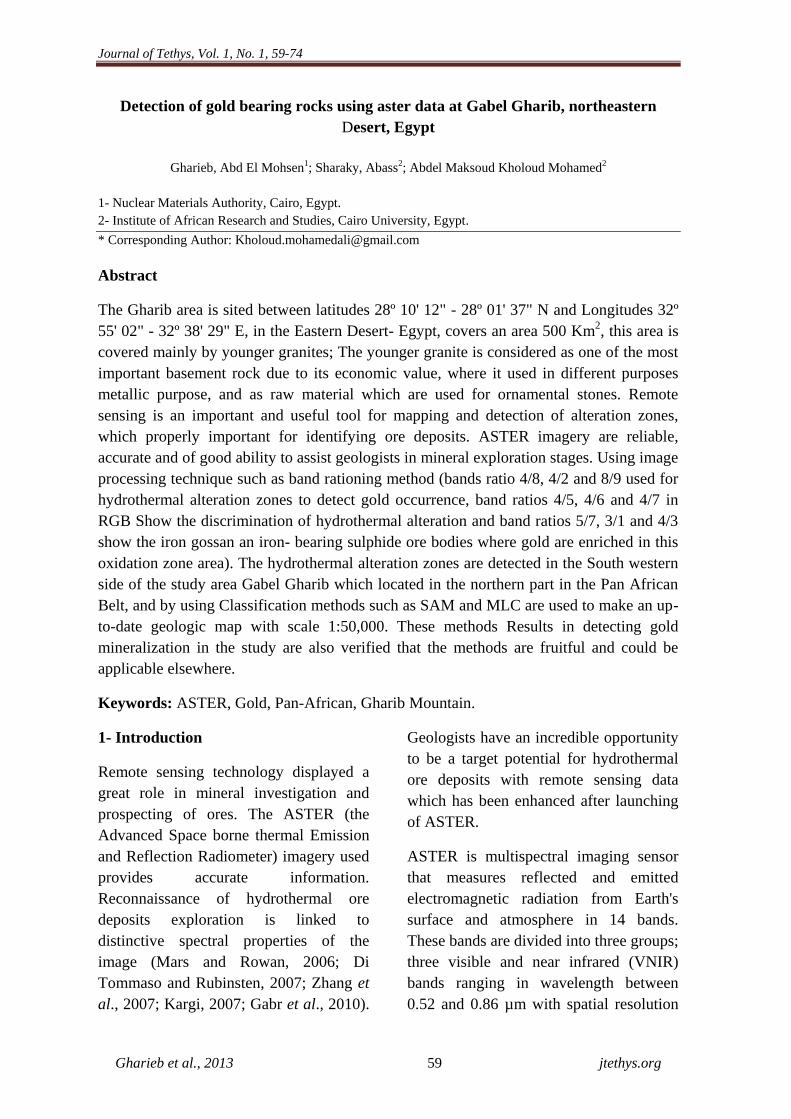
Figure 1) location map for the study area
located in red spot.
The Eastern Desert is divided into three
sectors: Northern Eastern Desert (NED),
Central eastern Desert (CED) and the
Southern eastern Desert (SED), the study
area is located in the NED (Fig. 1), it
could be reached by an asphaltic road
(Shiekh Fadel- Ras Gharib road) 45 km to
the west of Ras- Gharib city.
Harraz and El- Sharkwy, (1997) studied
the Ras Gharib granitoid rocks and
observed a remarkable trend of Mn
enrichment in ilmenite, which indicate
that the magmatic process is controlling
Mn distribution in limonite. Mohamed et
al. (1999) stated that the province of Ras
Gharib district includes wide surface
areas of granitoid rocks that occur in the
form of separate plutons and large
batholiths, the granitoid rocks can be
divided mainly into a calc-alkaline suite
of granodiorite, monzogranite and
syenogranite, a trondhjemite suite, and an
alkali granite suite. They also mentioned
that granodiorite- monzogrnaite –
syenogranite are widely distributed with
moderate enrichment in the LREE and
LILE, the trondhjemtic rocks are more
silicic and occur as small irregular bodies
into the granodiorite-monzogranite
association. Mostafa and Bishta (2005)
used Landsat ETM+, data for Gabel
Gharib- Dara area in the northern part of
the eastern desert of Egypt and applied
the Geo- Analyst PCI EASI/PACE
software to extract the lineaments
digitally and correlating lineaments
density maps (LDM) with aeroadiometry
total count countor maps. They also
mentioned that the studied granitic rocks
are of high density in both lineament and
lineament intersection. They also showed
that younger granitic is the only rock unit
which has been classified into four sub-
lithologic units- G1, G2, G3 and G4.
Bishta, (2006) studied Esh- ElMellaha
area in the Northern part of the Eastern
Desert by using the color raster aero-
radiometric total count map with the
interpreted lithologic and structural maps,
Journal of Tethys, Vol. 1, No. 1, 59-74
Gharieb et al., 2013 61 jtethys.org
he observed a radioactive anomalous in
the studied area which are controlled by
intersections of structural lineaments
trending along N-S, NE- SW and WNW-
ESE direction. It is clear that the previous
authors have worked on the whole
province in addition of rare remote
sensing work have done on the selected
area which make this work is worthy to
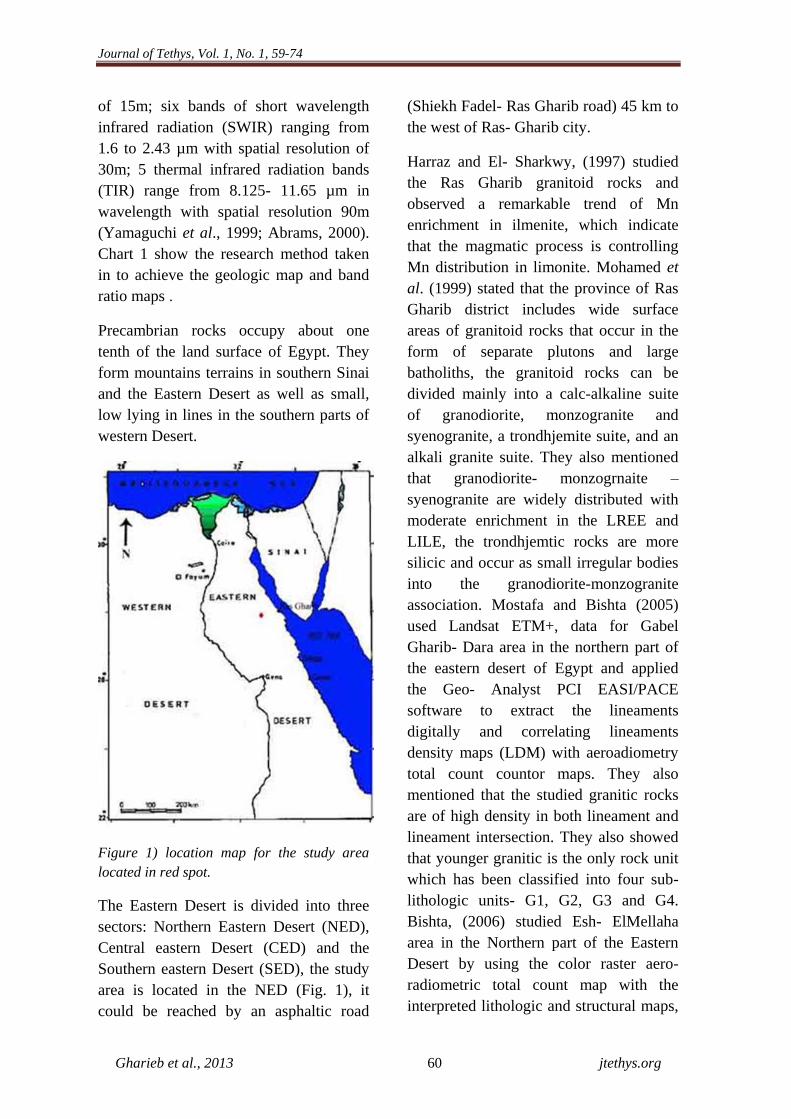
do. The study area is known for quarrying
purpose, and nothing mentioned about
metallic mineralization, quarrying sites
are present in the extreme south (Fig. 2)
or above the area while metallic
mineralization is out of sight, so this work
is worthwihle in studying.
Figure 2) geologic map of study area (after geologic survey of Egypt. 1984).
2- Geology of the study area
Pan-African granitoids occupy a
significant portion of the Egyptian
basement complex north of latitude 26º N.
In 1979, Dixon mentioned that syn- to late
tectonic granites cover 34.6% of the
Northern Eastern Desert (NED) and
26.7% of the whole Eastern Desert (ED),
while the younger post- tectonic granites
occupy about 35% and 16.2%
respectively. The region of interest is
located in NED, where granitoid plutons
cover a wide area of the surface exposure.
Most geological studies were mainly
concentrated on the central and southern
parts of the Eastern Desert and little is
known about the north part. The study
area is part of the northern extension of
the late Proterozoic basement in the
Eastern Desert of Egypt. (Mohamed et al.,
Journal of Tethys, Vol. 1, No. 1, 59-74
Gharieb et al., 2013 62 jtethys.org
1999; Abdel Rahman, 1990, 1995; Abdel
Rahman and Martin, 1990) proposed that
the regional geological setting of this part
of the Eastern Desert has changed from
primitive oceanic island arc to continental
margin setting during the Pan-African
event; where The Pan-African orogenic
cycle has long been recognized as a
period of major crustal accretion, where
continental, island, and oceanic terranes
were brought together to form the
crystalline basement of the Africa
continent as part of late Neoproterozoic
supercontinent (Urug, 1997), where some
parts of the Pan-African orogeny are
characterized by continental collisional
tectonics (Burke and Sengor, 1987; Stern,
1994). Others are typical of accretionary
orogens (Kroner et al., 1987 and Windley,
1992). This was followed by continental
extension and rifting around the late
Proterozoic- Paleozoic boundary.
Accordingly, the alkaline granite (Gabel
Gharib pluton) is considered as A-type
granite formed in a rift environment after
Pan-African orogeny (Abdel-Rahman and
Martin, 1990).
The study area is considered as the
beginning of the Pan-African belt,
covered by Basement Complex. The area
is occupied by different types of Calc-
alkaline granites with metagabbro- diorite
association, the calc-alkaline granites are
intruded by numerous small felsic
alkaline granitic intrusions. (Hegazy and
El-Shazly, 2000). The selected area has
rarely been investigated by previous
authors especially in the field of geology
and remote sensing.
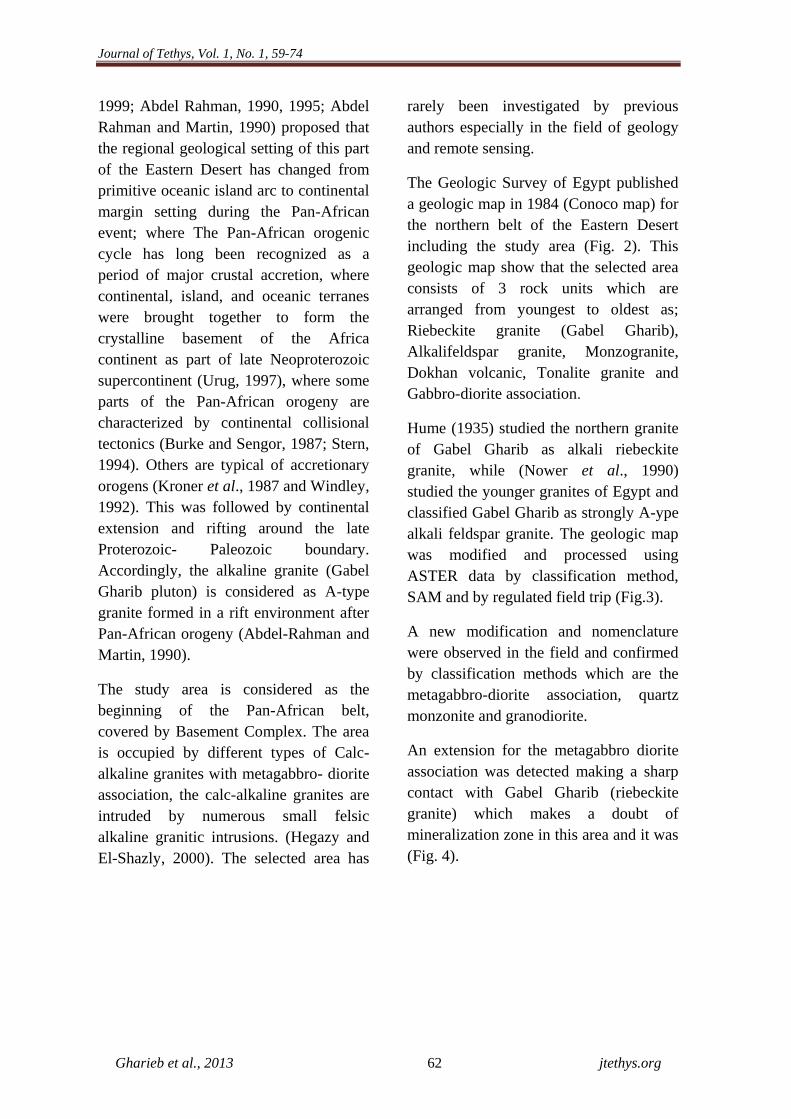
The Geologic Survey of Egypt published
a geologic map in 1984 (Conoco map) for
the northern belt of the Eastern Desert
including the study area (Fig. 2). This
geologic map show that the selected area
consists of 3 rock units which are
arranged from youngest to oldest as;
Riebeckite granite (Gabel Gharib),
Alkalifeldspar granite, Monzogranite,
Dokhan volcanic, Tonalite granite and
Gabbro-diorite association.
Hume (1935) studied the northern granite
of Gabel Gharib as alkali riebeckite
granite, while (Nower et al., 1990)
studied the younger granites of Egypt and
classified Gabel Gharib as strongly A-ype
alkali feldspar granite. The geologic map
was modified and processed using
ASTER data by classification method,
SAM and by regulated field trip (Fig.3).
A new modification and nomenclature
were observed in the field and confirmed
by classification methods which are the
metagabbro-diorite association, quartz
monzonite and granodiorite.
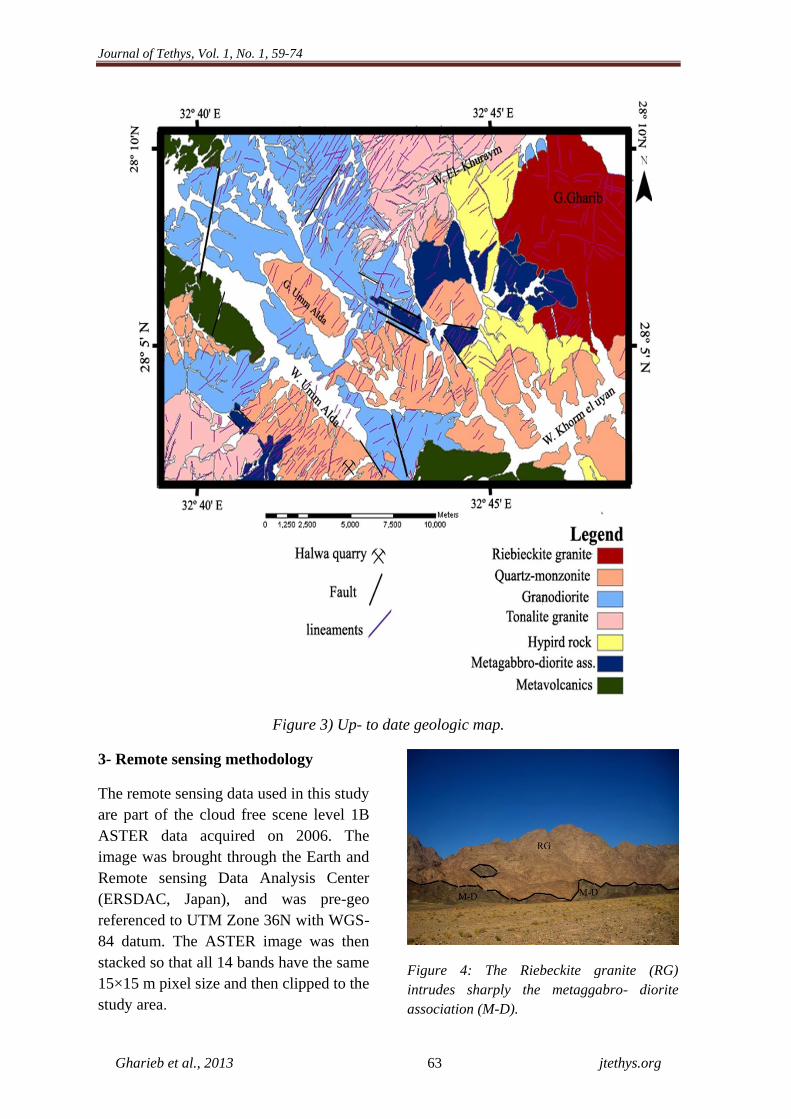
An extension for the metagabbro diorite
association was detected making a sharp
contact with Gabel Gharib (riebeckite
granite) which makes a doubt of
mineralization zone in this area and it was
(Fig. 4).
Journal of Tethys, Vol. 1, No. 1, 59-74
Gharieb et al., 2013 63 jtethys.org
Figure 3) Up- to date geologic map.
3- Remote sensing methodology
The remote sensing data used in this study
are part of the cloud free scene level 1B
ASTER data acquired on 2006. The
image was brought through the Earth and
Remote sensing Data Analysis Center
(ERSDAC, Japan), and was pre-geo
referenced to UTM Zone 36N with WGS-
84 datum. The ASTER image was then
stacked so that all 14 bands have the same
15×15 m pixel size and then clipped to the
study area.
Figure 4: The Riebeckite granite (RG)
intrudes sharply the metaggabro- diorite
association (M-D).
Journal of Tethys, Vol. 1, No. 1, 59-74
Gharieb et al., 2013 64 jtethys.org
Later on after processing, the image was
resampled. Nearest neighbor resample
method was applied in order to prevent
interpolation of the pixel values by using
the nearest pixel values (Amer et al, 2010;
Xianfeng, et al., 2007) show that the
ASTER data were capable of mapping
flood basalt, quartz-biotite gneiss,
muscovite schist, granitic, volcanic, and
metasedimentary rock units, also it shows
excellent correlation with those on the
reference geologic map, Four alteration
minerals: alunite, kaolinite, muscovite and
montmorillonite can be detected by
subpixel unmixing analysis of the ASTER
reflectance data. (Gulam and Kusky,
2010) used CEM technique in gold
exploration and they found that The CEM
technique, did not perform well in
conditions because of the background
signature is not easily detected, so it fails
to indentify rare minerals (e.g. secondary
iron-rich parts of the alteration), using
CEM when there is no apparent difference
between the target and background
spectral signatures. (Amin et al., 2011)
work on ASTER imagery to locate and
enhance alteration zones associated with
ore deposits and found that PCA, MNF
and band rationing results in absolute
correspond with previous workers.
Alteration is commonly forms a halo
around the mineralization which probably
is larger than the deposit itself. This halo
is considered as the exploration target, the
characterization of hydrothermal
alteration is a key to locate the main flow
zones of hydrothermal system which may
lead to the recognition of mineral deposits
(Rajesh, 2004).
3.1- Image Processing
The geologic map was modified after the
following Image processes were made
and these processes are:
Minimum Noise Fraction transformation
(MNF)
Noise is common on multispectral
images. Because it causes interference
with the identification of materials and
with the calculation of their abundance, it
is necessary to eliminate it in order to
obtain good spectra, (Gharieb, 2010). The
MNF technique is used to reduce noise in
multispectral images.Boardman and
Kruse (1994) used MNF to determine the
inherent dimensionality of image data, to
segregate noise in the data and to reduce
the computational requirements for
subsequent processing. The MNF
procedure is derived from PCA (principal
component analysis) but it is like ordering
of components according to image
quality, (Gharieb, 2010).
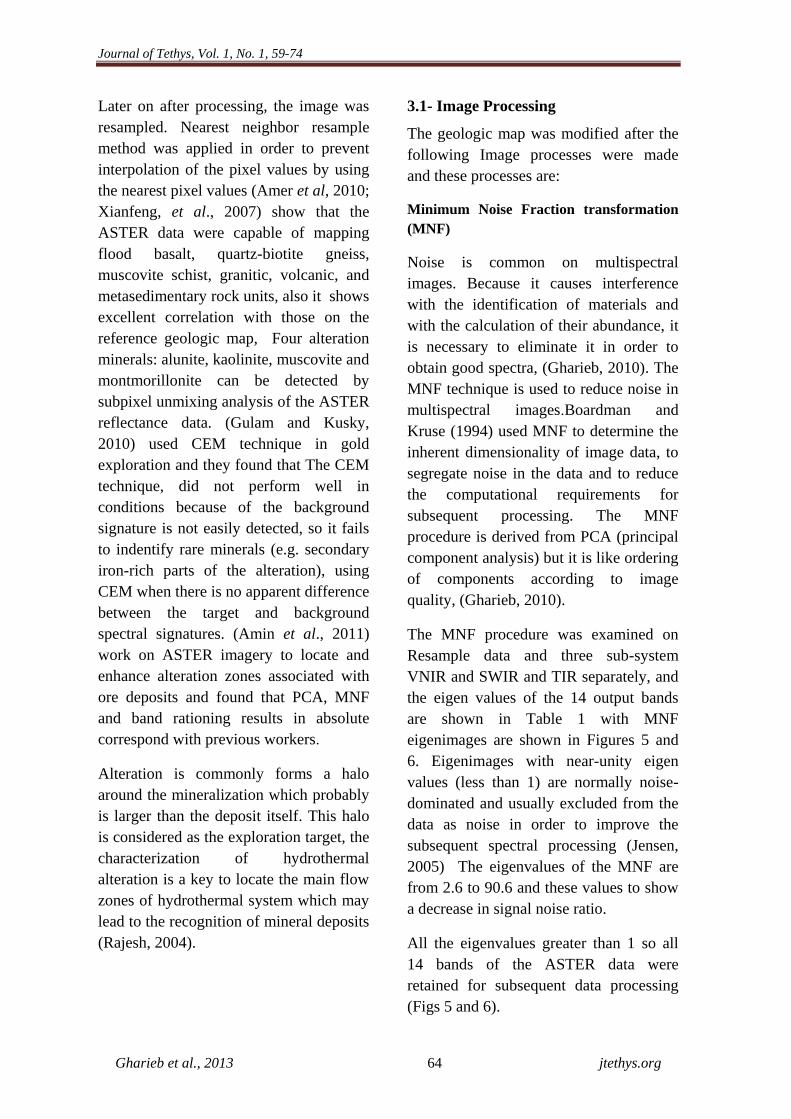
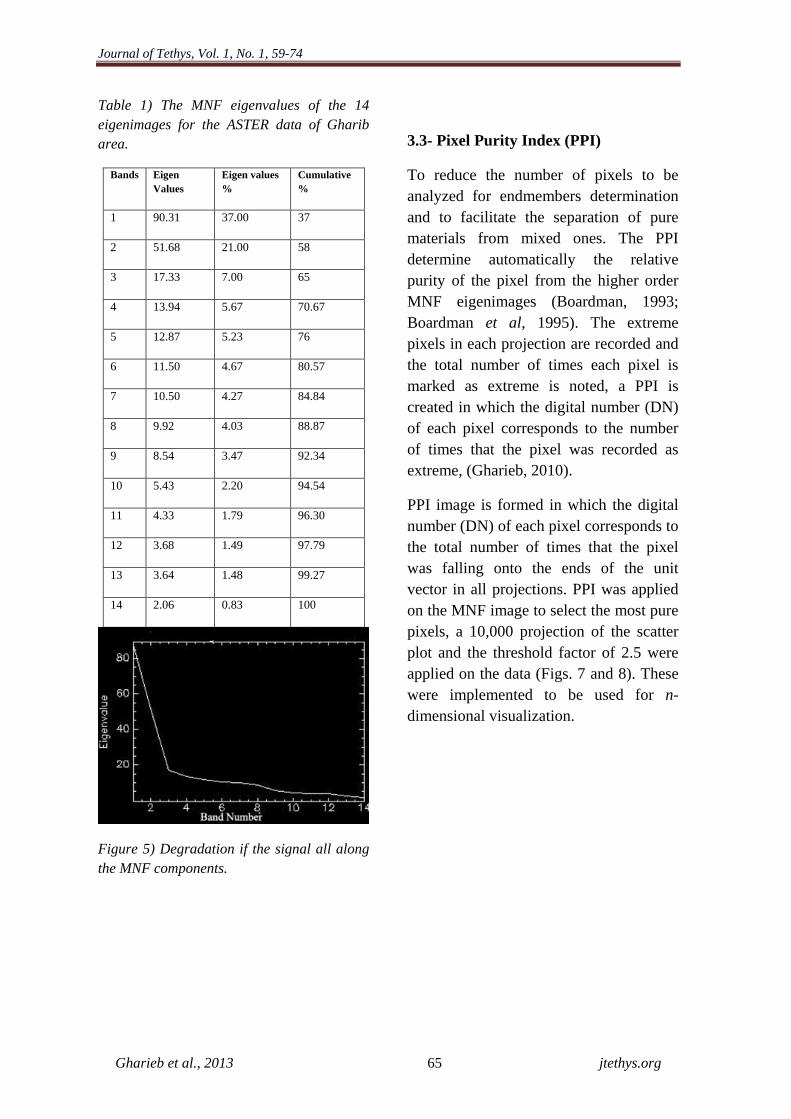
The MNF procedure was examined on
Resample data and three sub-system
VNIR and SWIR and TIR separately, and
the eigen values of the 14 output bands
are shown in Table 1 with MNF
eigenimages are shown in Figures 5 and
6. Eigenimages with near-unity eigen
values (less than 1) are normally noise-
dominated and usually excluded from the
data as noise in order to improve the
subsequent spectral processing (Jensen,
2005) The eigenvalues of the MNF are
from 2.6 to 90.6 and these values to show
a decrease in signal noise ratio.
All the eigenvalues greater than 1 so all
14 bands of the ASTER data were
retained for subsequent data processing
(Figs 5 and 6).
Journal of Tethys, Vol. 1, No. 1, 59-74
Gharieb et al., 2013 65 jtethys.org
Table 1) The MNF eigenvalues of the 14
eigenimages for the ASTER data of Gharib
area.
Bands Eigen
Values
Eigen values
%
Cumulative
%
1 90.31 37.00 37
2 51.68 21.00 58
3 17.33 7.00 65
4 13.94 5.67 70.67
5 12.87 5.23 76
6 11.50 4.67 80.57
7 10.50 4.27 84.84
8 9.92 4.03 88.87
9 8.54 3.47 92.34
10 5.43 2.20 94.54
11 4.33 1.79 96.30
12 3.68 1.49 97.79
13 3.64 1.48 99.27
14 2.06 0.83 100
Figure 5) Degradation if the signal all along
the MNF components.
3.3- Pixel Purity Index (PPI)
To reduce the number of pixels to be
analyzed for endmembers determination
and to facilitate the separation of pure
materials from mixed ones. The PPI
determine automatically the relative
purity of the pixel from the higher order
MNF eigenimages (Boardman, 1993;
Boardman et al, 1995). The extreme
pixels in each projection are recorded and
the total number of times each pixel is
marked as extreme is noted, a PPI is
created in which the digital number (DN)
of each pixel corresponds to the number
of times that the pixel was recorded as
extreme, (Gharieb, 2010).
PPI image is formed in which the digital
number (DN) of each pixel corresponds to
the total number of times that the pixel
was falling onto the ends of the unit
vector in all projections. PPI was applied
on the MNF image to select the most pure
pixels, a 10,000 projection of the scatter
plot and the threshold factor of 2.5 were
applied on the data (Figs. 7 and 8). These
were implemented to be used for n-
dimensional visualization.
Journal of Tethys, Vol. 1, No. 1, 59-74
Gharieb et al., 2013 66 jtethys.org
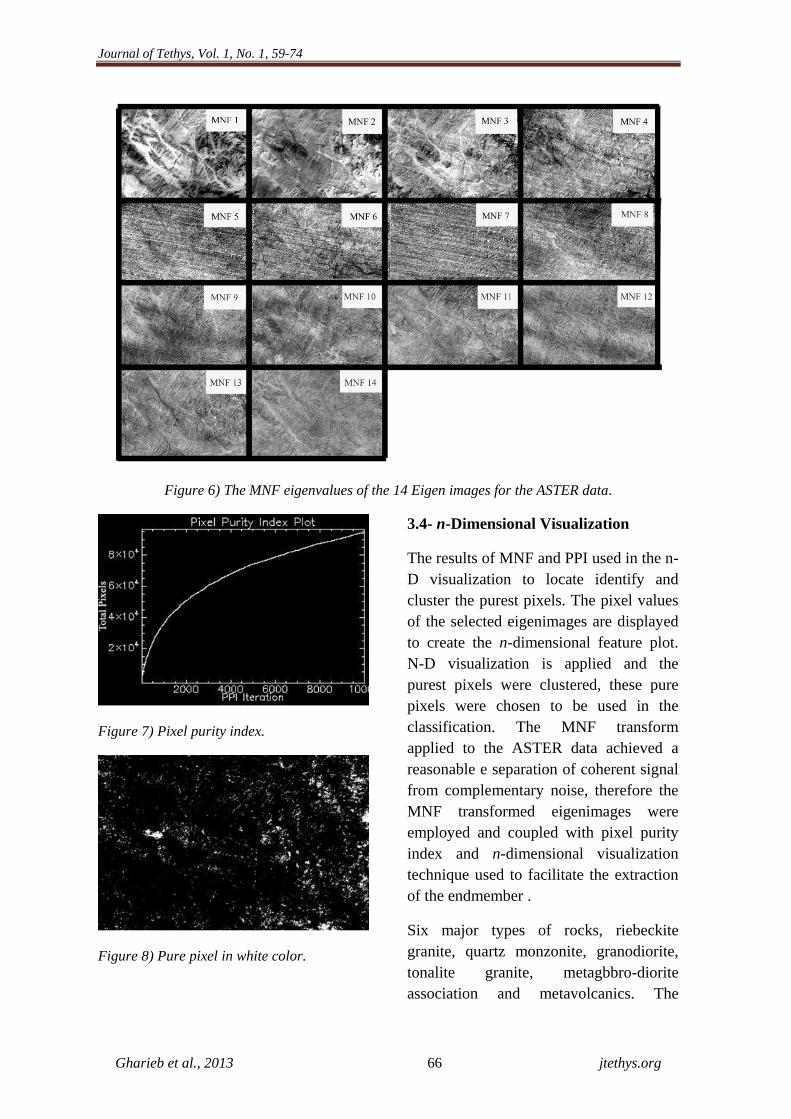
Figure 6) The MNF eigenvalues of the 14 Eigen images for the ASTER data.
Figure 7) Pixel purity index.
Figure 8) Pure pixel in white color.
3.4- n-Dimensional Visualization
The results of MNF and PPI used in the n-
D visualization to locate identify and
cluster the purest pixels. The pixel values
of the selected eigenimages are displayed
to create the n-dimensional feature plot.
N-D visualization is applied and the
purest pixels were clustered, these pure
pixels were chosen to be used in the
classification. The MNF transform
applied to the ASTER data achieved a
reasonable e separation of coherent signal
from complementary noise, therefore the
MNF transformed eigenimages were
employed and coupled with pixel purity
index and n-dimensional visualization
technique used to facilitate the extraction
of the endmember .
Six major types of rocks, riebeckite
granite, quartz monzonite, granodiorite,
tonalite granite, metagbbro-diorite
association and metavolcanics. The
Journal of Tethys, Vol. 1, No. 1, 59-74
Gharieb et al., 2013 67 jtethys.org
profile of the spectral characterisation of
these rocks are presented relative to the
band numbers in Figure 9, the four image
spectra derived from the n-dimensional
endmember visualization procedure,
depend on the field recogniation for rock
units, so identification could be based on
the adsorption value appear between
wavelenght 2 to 4 for the mentioned rock
units.
Figure 9) The spectral profile for the
investigated rocks relative to the ASTER
bands.
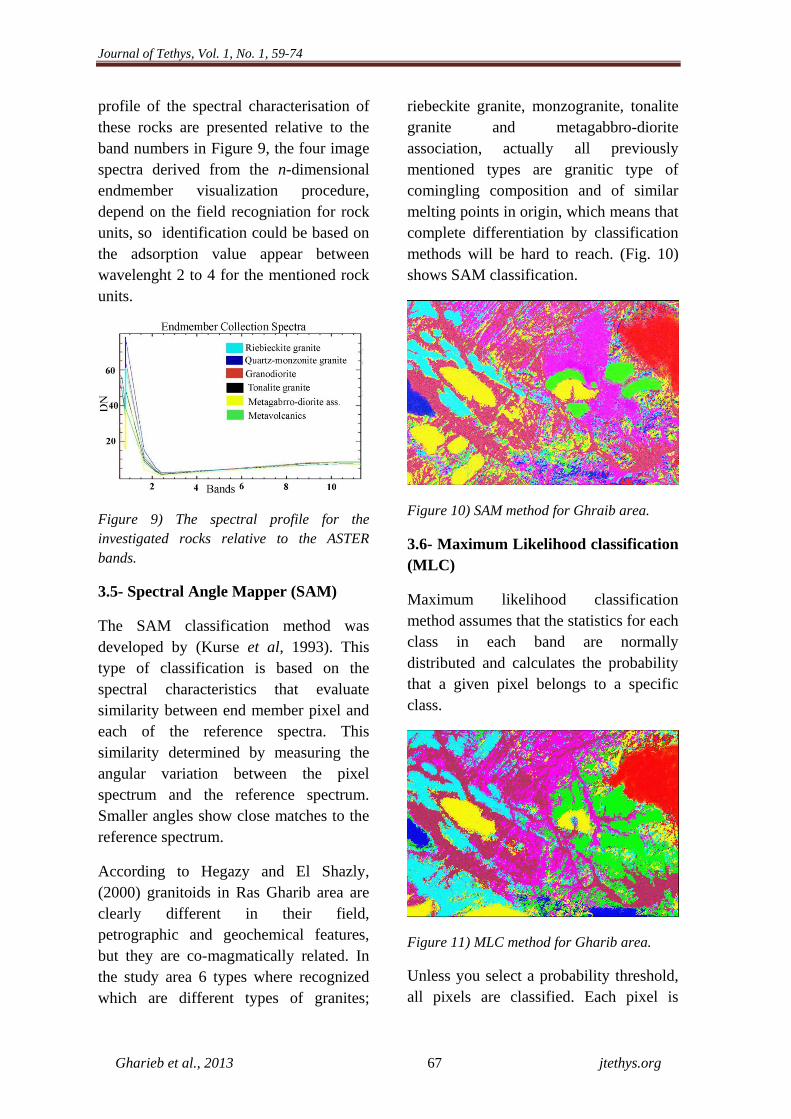
3.5- Spectral Angle Mapper (SAM)
The SAM classification method was
developed by (Kurse et al, 1993). This
type of classification is based on the
spectral characteristics that evaluate
similarity between end member pixel and
each of the reference spectra. This
similarity determined by measuring the
angular variation between the pixel
spectrum and the reference spectrum.
Smaller angles show close matches to the
reference spectrum.
According to Hegazy and El Shazly,
(2000) granitoids in Ras Gharib area are
clearly different in their field,
petrographic and geochemical features,
but they are co-magmatically related. In
the study area 6 types where recognized
which are different types of granites;
riebeckite granite, monzogranite, tonalite
granite and metagabbro-diorite
association, actually all previously
mentioned types are granitic type of
comingling composition and of similar
melting points in origin, which means that
complete differentiation by classification
methods will be hard to reach. (Fig. 10)
shows SAM classification.
Figure 10) SAM method for Ghraib area.
3.6- Maximum Likelihood classification
(MLC)
Maximum likelihood classification
method assumes that the statistics for each
class in each band are normally
distributed and calculates the probability
that a given pixel belongs to a specific
class.
Figure 11) MLC method for Gharib area.
Unless you select a probability threshold,
all pixels are classified. Each pixel is
Journal of Tethys, Vol. 1, No. 1, 59-74
Gharieb et al., 2013 68 jtethys.org
assigned to the class that has the highest
probability. If the highest probability is
smaller than a threshold you specify, the
pixel remains unclassified. (Richards,
1999) Figure 11 shows the MLC method.
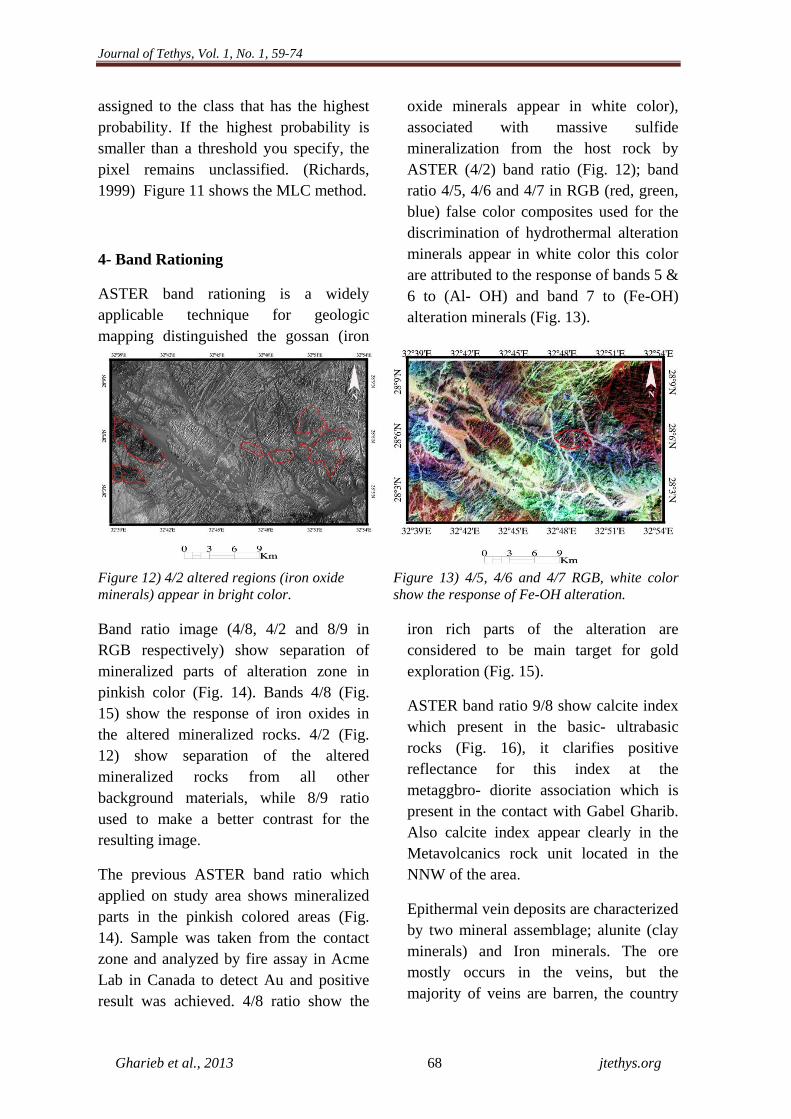
4- Band Rationing
ASTER band rationing is a widely
applicable technique for geologic
mapping distinguished the gossan (iron
oxide minerals appear in white color),
associated with massive sulfide
mineralization from the host rock by
ASTER (4/2) band ratio (Fig. 12); band
ratio 4/5, 4/6 and 4/7 in RGB (red, green,
blue) false color composites used for the
discrimination of hydrothermal alteration
minerals appear in white color this color
are attributed to the response of bands 5 &
6 to (Al- OH) and band 7 to (Fe-OH)
alteration minerals (Fig. 13).
Figure 12) 4/2 altered regions (iron oxide
minerals) appear in bright color.
Figure 13) 4/5, 4/6 and 4/7 RGB, white color
show the response of Fe-OH alteration.
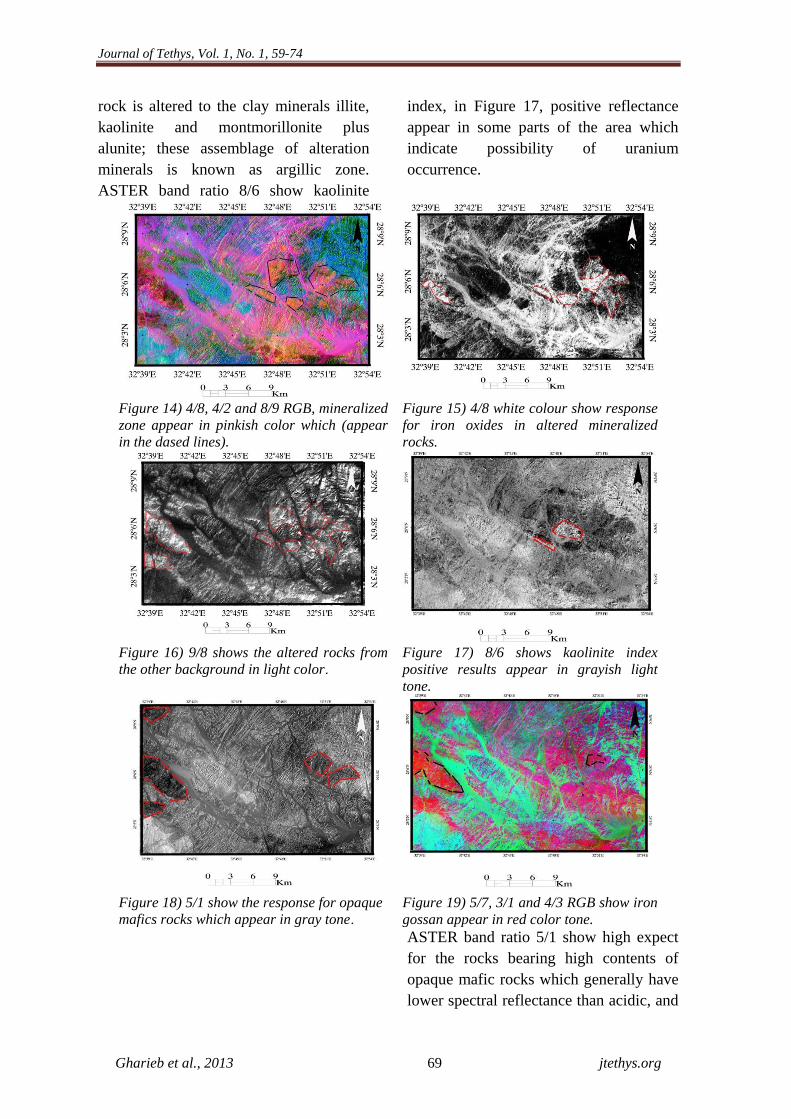
Band ratio image (4/8, 4/2 and 8/9 in
RGB respectively) show separation of
mineralized parts of alteration zone in
pinkish color (Fig. 14). Bands 4/8 (Fig.
15) show the response of iron oxides in
the altered mineralized rocks. 4/2 (Fig.
12) show separation of the altered
mineralized rocks from all other
background materials, while 8/9 ratio
used to make a better contrast for the
resulting image.
The previous ASTER band ratio which
applied on study area shows mineralized
parts in the pinkish colored areas (Fig.
14). Sample was taken from the contact
zone and analyzed by fire assay in Acme
Lab in Canada to detect Au and positive
result was achieved. 4/8 ratio show the
iron rich parts of the alteration are
considered to be main target for gold
exploration (Fig. 15).
ASTER band ratio 9/8 show calcite index
which present in the basic- ultrabasic
rocks (Fig. 16), it clarifies positive
reflectance for this index at the
metaggbro- diorite association which is
present in the contact with Gabel Gharib.
Also calcite index appear clearly in the
Metavolcanics rock unit located in the
NNW of the area.
Epithermal vein deposits are characterized
by two mineral assemblage; alunite (clay
minerals) and Iron minerals. The ore
mostly occurs in the veins, but the
majority of veins are barren, the country
Journal of Tethys, Vol. 1, No. 1, 59-74
Gharieb et al., 2013 69 jtethys.org
rock is altered to the clay minerals illite,
kaolinite and montmorillonite plus
alunite; these assemblage of alteration
minerals is known as argillic zone.
ASTER band ratio 8/6 show kaolinite
index, in Figure 17, positive reflectance
appear in some parts of the area which
indicate possibility of uranium
occurrence.
Figure 14) 4/8, 4/2 and 8/9 RGB, mineralized
zone appear in pinkish color which (appear
in the dased lines).
Figure 15) 4/8 white colour show response
for iron oxides in altered mineralized
rocks.
Figure 16) 9/8 shows the altered rocks from
the other background in light color. Figure 17) 8/6 shows kaolinite index
positive results appear in grayish light
tone.
Figure 18) 5/1 show the response for opaque
mafics rocks which appear in gray tone. Figure 19) 5/7, 3/1 and 4/3 RGB show iron
gossan appear in red color tone.
ASTER band ratio 5/1 show high expect
for the rocks bearing high contents of
opaque mafic rocks which generally have
lower spectral reflectance than acidic, and
Journal of Tethys, Vol. 1, No. 1, 59-74
Gharieb et al., 2013 70 jtethys.org
intermediate rocks due to the high
abundance of opaque phases, so we can
notice that metavolcanics, gray granite
and mettagabbro-diorite association
which are enriched in hydroxyl- bearing
phases exhibit gray color while hydroxyl
free (younger granites) will exhibit light
white tone (Fig. 18).
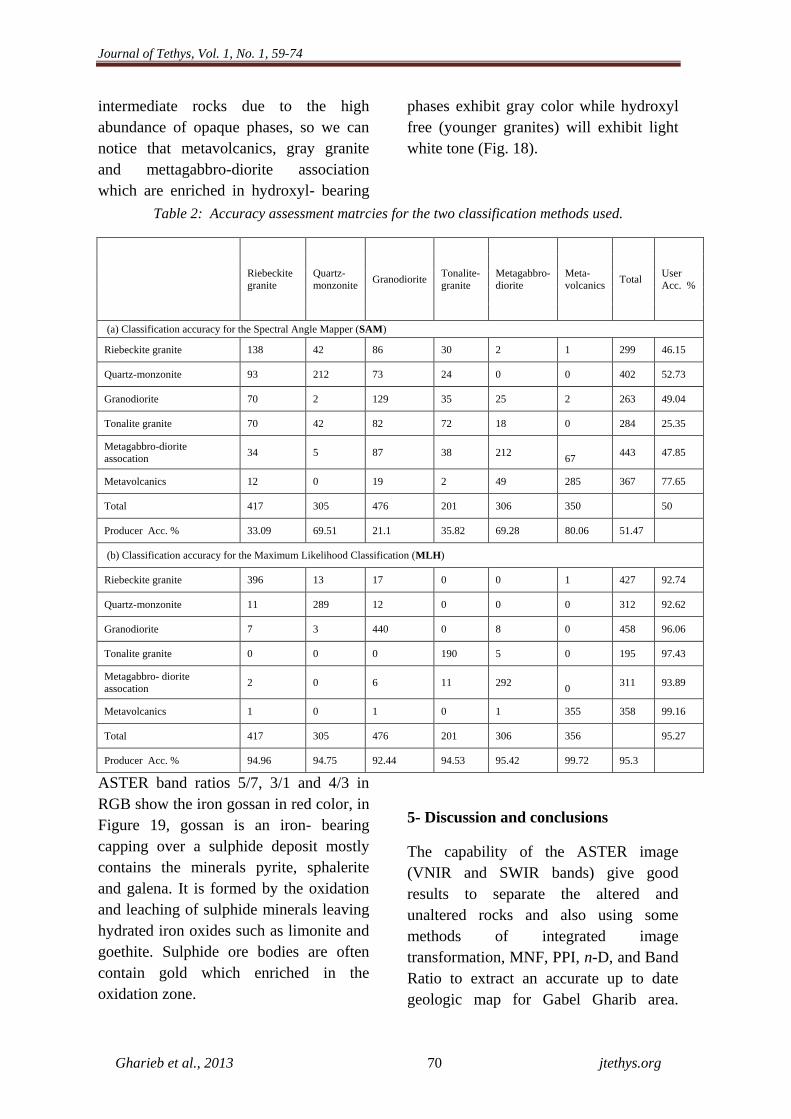
Table 2: Accuracy assessment matrcies for the two classification methods used.
Riebeckite
granite
Quartz-
monzonite Granodiorite
Tonalite-
granite
Metagabbro-
diorite
Meta-
volcanics Total
User
Acc. %
(a) Classification accuracy for the Spectral Angle Mapper (SAM)
Riebeckite granite 138 42 86 30 2 1 299 46.15
Quartz-monzonite 93 212 73 24 0 0 402 52.73
Granodiorite 70 2 129 35 25 2 263 49.04
Tonalite granite 70 42 82 72 18 0 284 25.35
Metagabbro-diorite
assocation 34 5 87 38 212
67 443 47.85
Metavolcanics 12 0 19 2 49 285 367 77.65
Total 417 305 476 201 306 350 50
Producer Acc. % 33.09 69.51 21.1 35.82 69.28 80.06 51.47
(b) Classification accuracy for the Maximum Likelihood Classification (MLH)
Riebeckite granite 396 13 17 0 0 1 427 92.74
Quartz-monzonite 11 289 12 0 0 0 312 92.62
Granodiorite 7 3 440 0 8 0 458 96.06
Tonalite granite 0 0 0 190 5 0 195 97.43
Metagabbro- diorite
assocation 2 0 6 11 292
0 311 93.89
Metavolcanics 1 0 1 0 1 355 358 99.16
Total 417 305 476 201 306 356 95.27
Producer Acc. % 94.96 94.75 92.44 94.53 95.42 99.72 95.3
ASTER band ratios 5/7, 3/1 and 4/3 in
RGB show the iron gossan in red color, in
Figure 19, gossan is an iron- bearing
capping over a sulphide deposit mostly
contains the minerals pyrite, sphalerite
and galena. It is formed by the oxidation
and leaching of sulphide minerals leaving
hydrated iron oxides such as limonite and
goethite. Sulphide ore bodies are often
contain gold which enriched in the
oxidation zone.
5- Discussion and conclusions
The capability of the ASTER image
(VNIR and SWIR bands) give good
results to separate the altered and
unaltered rocks and also using some
methods of integrated image
transformation, MNF, PPI, n-D, and Band
Ratio to extract an accurate up to date
geologic map for Gabel Gharib area.
Journal of Tethys, Vol. 1, No. 1, 59-74
Gharieb et al., 2013 71 jtethys.org
Choosing SAM and MLC in the
methodology is because they are the most
durable and common methods in remote
sensing classification, the rock units
present in the study area shown that the
total of user accuracy in SAM
classification are 50% while the total
producer accuracy are 51.01%, in MLC
total of user accuracy are 95.27%, and
total of producer accuracy are 95.30%, it
seems that MLC are more accurate than
SAM method, but SAM method are based
on spectral characteristics which give
more reality results than MLC method
which based on the probability, table 2;
show the accuracy assessment matrices
for the selected two classification
methods, which show the accuracy
variation between user and producer
accuracy.
In user accuracy; riebeckite granite (SAM
66.84% vs 90.46% MLC), monzogranite
(SAM 58.19% vs 82.29% MLC), tonalite
granite ( SAM 75.80% vs 78.20% MLC)
and Metagabbro–diorite assocation (SAM
87.27 vs 86.04), while in producer
accuracy; riebeckite granite (SAM 80.09
vs 88.16), monzogranite (SAM 68.43% vs
80.72% MLC), tonalite granite (SAM
77.38% vs 96.07% MLC) and
metagabbro–diorite assocation (SAM
64.74% vs 88.09).
It is clear from the band rationing maps
that the area is worthy in mineralization
either in gold mineralization or uranium
mineralization, the two kinds of
mineralization were confirmed by
geochemical analyses; from the granitic
phases obtained from the area, Gharib
area are called of fertile granite type, and
from the band rationing maps Granitoids
have been strong hydrothermally altered.
Further investigation could be
recommended for knowing factors
affecting mineralization in the area either
stratigraphic or structure factors.
Finally, it is worthy to mention that there
are no mining processes found in the area
even anciently, which makes this study is
highly recommended for further
investigation which could be a promising
area.
Acknowledgments
The authors would like to thank Mr. S.G.
Mehr and an anonymous reviewer for
their comments that help improve the
manuscript.
References
Abdel Rahman, A.M. 1990. Petrogensis
of early orogenic diorites, tonalities
and post orogenic trondhjemites in the
Nubian Shield. Journal of petrology:
32, 1285–1312.
Abdel Rahman, A.M. 1995. Tectonic-
magmatic stages of Shield evolution:
the Pan-African belt of northeastern
Egypt. Tectonophysics: 242, 223–240.
Abdel Rahman, A.M., Martin, R.F. 1990.
The Mount Gharib A-type granite.
Nubian shield: petrogenesis and role of
metasomatisms at the source.
Contributions to Mineralogy and
Petrology: 104, 173–183.
Aboelkhair, H., Yoshiki, N., Yasushi, W.,
Isao, S. 2010. Processing and
interpretation of ASTER TIR data for
mapping of rare- metal- enriched albite
Journal of Tethys, Vol. 1, No. 1, 59-74
Gharieb et al., 2013 72 jtethys.org
granitoids in the Central Eastern Desert
of Egypt. Journal of African Earth
Sciences: 58, 141–151.
Beiranvand-Pour, A., Hashim, H. 2011.
Application of advanced spaceborne
thermal emission and reflection
radiometer (ASTER) data in geologic
mapping. International Journal of the
Physical Sciences: 6, 7657–7668.
Boardman, J.W. 1993. Automating
spectral unmixing of AVIRIS data
using convex geometry concepts. In:
summaries of the 4th
Annual JPL
Airborne Geoscience workshop,
Pasadena, 11–14.
Boardman, J.W., Kruse, F.A. 1994.
Automatic spectral analysis: a
geological example using AVIRIS
data, North Grapevine mountain,
Nevada. In: 10th
thematic conference
on geologic remote sensing, Ann.
Arbor, pp. 407-418.
Boardman, J.W., Kruse, F.A., Green, R.O.
1995. Mapping target signatures via
partial un mixing of AVIRIS data: in
summaries, Fifth JPL Airborne Earth
Science workshop, JPL publication 95-
1, 23–26.
Burke, K., Sengor, C. 1986. Tectonic
escape in the evolution of the
continental crust. AGU Geodynamic
Series: 14, 41–53.
Di Tommaso, I., Rubinstein, N. 2007.
Hudrothermal alteration mapping
using ASTER data in the linfiernillo
porphyry deposit, Argentina. Ore
Geology Reviews: 32, 275–290.
El-Sayed Zeinelabdein, K.A. 2009. Sudan
experience in using remote sensing for
minerla prospecting, Fac. of Petroleum
and minerals, Alneelain Univ.,
Khartoum, Sudan, pp. 636-646.
Gharieb, A.G.N. 2010. Rock
discrimination using spectral analysis
techniques of remote sensing data,
Egypt: A case study. Fifth
International Conference on the
Geology of the Tethys Realm, South
Valley University, January 2010, P.
297-306.
Gulam, A., Kusky, T.M. 2010. Mineral
exploration and altration zone mapping
in eastern Desert of Egyp using
ASTER data. ASPRS 2010 annual
Conference.
Harasanyi, J.C. 1993. Detection and
classification of subpixel spectral
signatures in hyperspectral image
sequences. Unpublished Ph.D. thesis,
university of Maryland, 116pp.
Hegazy, H.A., El-Shazly, S.M. 2000.
West Ras Gharib granitoids, Eastern
Desert, Egypt an example for
Neoproterozoic magmatic arc. Bulletin
of Faculty of Sciences, Assuit
University: 29, 29–50.
Hume, M.E. 1937. Geology of Egypt,
Volume II, part II. Geologic survey of
Egypt.
Jensen, J.R., 2005: Introduction digital
image processing. Prentice Hall, upper
saddle river, 256p.
Kroner, A., Greiling, R.O., Reischmann,
F., Hussien, I.M., Stern, R.J., Durr, S.,
Druger, J., Zimmer, M. 1987. Pan-
African crustal evolution in the Nubian
segment of northeast Africa. In Kroner,
A. (ed): Proterozoic lithospheric
Journal of Tethys, Vol. 1, No. 1, 59-74
Gharieb et al., 2013 73 jtethys.org
evolution. American Geophysical
Unioin, Washington D.C, pp. 235–257.
Mars, J.C., Rowan, L.C. 2006. Regional
mapping pf phyllic- and argillic altered
rocks in the Zagros magmatic arc. Iran,
using advanced spaceborne thermal
emission and reflection radiometer
(ASTER) data and logical operator
algorithms. Geoshpere: 2, 161–186.
Massironi, M.L., Bertoldi, P., Calafa, D.,
Visona, B. 2008. Interpretation and
processing of ASTER data for geologic
mapping and granitoids detection in
the saghro massif (eastern Anti- Atlas,
Morocco). Geoshpere: 4, 736–759.
Mohamed, F.H., Moghazy, A.M.,
Hassanen, M.A. 1999. Petrogenesis of
late Proterozoic granitiods in the Ras
Gharib magmatic province, northern
Eastern Desert, Egypt: petrological and
geochemical constraints. Neues
Jahrbuch Fur Mineralogie-
Abhandlungen: 174, 319–353.
Ninomiya, Y., 2003: A stabilized
vegetation index and several
mineralogic indices defined for
ASTER VNIR and SWIR data. Proc.
IEEE 2003 International Geoscience
and Remote Sensing Symposium
(IGARSS'03) v.3, Toulouse, France,
21–25 July 2003, pp. 1552–1554.
Noweir, A.M., Sewifi, B.M., Abu El Ela,
M. 1990. Geology, petrography,
Geochemistry and petrogensis of the
Egyptian younger granites. Qatar
University Science Bulletin: 10, 363–
393.
Rajesh, H.M. 2004. Application of remote
sensing and GIS in mineral resource
mapping- An overview, Journal of
Mineralogical and Petrological
Science: 99, 83–103.
Richards, J.A., 1999. Remote Sensing
Digital Image Analysis, Springer-
Verlag, Berlin, pp. 240.
Rowan, L.C., Robert, G.S., John, C. 2006.
Distribution of hydrothermally altered
rocks in the Reko Diq, Pakistan
mineralized area based on spectral
analysis of ASTER data. Remote
Sensing of Environment: 104, 74–87.
Rowan, L.C., Mars, J.C. 2003. Lithologic
mapping in the Mountain Pass,
California area using Advanced
Spaceborne Thermal Emission and
Reflection Radiometer (ASTER) data.
Remote Sensing of Environment: 84,
350–366.
Sanjeevi, S. 2008. Targeting limestone
and bauxite deposits in Southern India
by spectral unmixing of hyperspectral
image data. The International Archives
of the Photogrammetry, Remote
Sensing and Spatial Information
Sciences: 37, B8. Beijing 2008.
Stern, R.J. 1994. Arc assembly and
continental collision in the
Neoproterozoic east Africa Orogen:
implications for the consolidation of
Gondwanaland. Annual review of
Earth and Planetry Sciences: 22, 319–
351.
Urug, R. 1997. Rodinia to Gondwana the
Geodynamic map of Gondwana
supercontinent assembly. GSA Today:
7, 1–6.
Windely, B. 1992. Proterozoic collisional
and accretinary orogens. In Condie,
Journal of Tethys, Vol. 1, No. 1, 59-74
Gharieb et al., 2013 74 jtethys.org
K.C. (ed.): Proterozoic crustal
evolution, Elsevier, Amsterdam, pp.
419-446.
Yamaguchi, Y.I., Fujisada, H., Kudoh,
M., Kawakami, T., Tsu, H., Kahle,
A.B., Pniel, M., 1999. ASTER
instrument characterization and
operation scenario. Advances in Space
Research: 23, 1415–1424 .
Zhang, X., Pazner, M., Duke, N. 2007.
Lithologic and mineral information
extraction for gold exploration using
ASTER data in the south chocolate
mountains (California).
photogrammetry and remote sensing:
63, 271–282.
Received: 11 April 2013 / Accepted: 31 May
2013 / Published online: 3 June 2013
EDITOR-IN-CHIEF:
Dr. Vahid Ahadnejad:
Payame Noor University, Department of Geology.
PO BOX 13395-3697, Tehran, Iran.
E-Mail: [email protected]
EDITORIAL BOARD:
Dr. Jessica Kind:
ETH Zürich Institut für Geophysik, NO H11.3,
Sonneggstrasse 5, 8092 Zürich, Switzerland
E-Mail: [email protected]
Prof. David Lentz
University of New Brunswick, Department of
Earth Sciences, Box 4400, 2 Bailey Drive
Fredericton, NB E3B 5A3, Canada
E-Mail: [email protected]
Dr. Anita Parbhakar-Fox
School of Earth Sciences, University of Tasmania,
Private Bag 126, Hobart 7001, Australia
E-Mail: [email protected]
Prof. Roberto Barbieri
Dipartimento di Scienze della Terra e
Geoambientali, Università di Bologna, Via
Zamboni 67 - 40126, Bologna, Italy
E-Mail: [email protected]
Dr. Anne-Sophie Bouvier
Faculty of Geosciences and Environment, Institut
des science de la Terre, Université de Lausanne,
Office: 4145.4, CH-1015 Lausann, Switzerland
E-Mail: [email protected]
Dr. Matthieu Angeli
The Faculty of Mathematics and Natural Sciences,
Department of Geosciences, University of Oslo
Postboks 1047 Blindern, 0316 OSLO, Norway
E-Mail: [email protected]
Dr. Miloš Gregor
Geological Institute of Dionys Stur, Mlynska
Dolina, Podjavorinskej 597/15 Dubnica nad
Vahom, 01841, Slovak Republic
E-Mail: [email protected]
Dr. Alexander K. Stewart
Department of Geology, St. Lawrence University,
Canton, NY, USA
E-mail: [email protected]
Dr. Cristina C. Bicalho
Environmental Geochemistry, Universidade
Federal Fluminense – UFF, Niteroi-RJ, Brazil
E-mail: [email protected]
Dr. Lenka Findoráková
Institute of Geotechnics, Slovak Academy of
Sciences, Watsonova 45, 043 53 Košice, Slovak
Republic
E-Mail: [email protected]
Dr. Mohamed Omran M. Khalifa
Geology Department, Faculty of Science, South
Valley, Qena, 83523, Egypt
E-Mail: [email protected]
Prof. A. K. Sinha
D.Sc. (Moscow), FGS (London). B 602,
VigyanVihar, Sector 56, GURGAON 122011,
NCR DELHI, Haryana
E-Mail: [email protected]